Cool to be Smart or Smart to be Cool? Understanding Peer Pressure in Education * Leonardo Bursztyn † Georgy Egorov ‡ Robert Jensen § January 2018 Abstract We model and test two school-based peer cultures: one that stigmatizes effort and one that rewards ability. The model shows that either may reduce participation in educational activities when peers can observe participation and performance. We design a field experiment that allows us to test for, and differentiate between, these two concerns. We find that peer pressure reduces takeup of an SAT prep package virtually identically across two very different high school settings. However, the effects arise from very distinct mechanisms: a desire to hide effort in one setting and a desire to hide low ability in the other. Keywords: peer pressure, education, field experiment, signaling. JEL Classification: I21, I24, D83, C93. * We would like to thank the editor, Nicola Gennaioli, and four anonymous referees for valuable comments. We would also like to thank Alex Frankel, Roland Fryer, Emir Kamenica, John List, Gautam Rao, Dmitry Taubinsky, Noam Yuchtman, and seminar participants at the Advances with Field Experiments conference, Columbia, Harvard, MIT, NBER Summer Institute (Children/Labor Studies and Political Economy), Northwestern, Stanford GSB, UC Berkeley, UC Davis, UCSD, the University of Chicago, the University of Zurich, WashU, and the World Bank for feedback and suggestions. Ahmed Ali-Bob, Natalia Baclini, Cameron Burch, Diego De La Peza, Stefano Fiorin, Misha Galashin, Vasily Korovkin, Shelby McNabb, Matthew Miller, Aakaash Rao, and Benjamin Smith provided excellent research assistance. Our study was approved by the UCLA Institutional Review Board and the Los Angeles Unified School District Committee on External Research Review. The experiment reported in this study can be found in the AEA RCT Registry (#0000975). † University of Chicago and NBER, [email protected] ‡ Kellogg School of Management, Northwestern University and NBER, [email protected] § Wharton School, University of Pennsylvania and NBER, [email protected]

Welcome message from author
This document is posted to help you gain knowledge. Please leave a comment to let me know what you think about it! Share it to your friends and learn new things together.
Transcript
Cool to be Smart or Smart to be Cool?
Understanding Peer Pressure in Education∗
Leonardo Bursztyn† Georgy Egorov‡ Robert Jensen§
January 2018
Abstract
We model and test two school-based peer cultures: one that stigmatizes effort and one that rewardsability. The model shows that either may reduce participation in educational activities when peerscan observe participation and performance. We design a field experiment that allows us to testfor, and differentiate between, these two concerns. We find that peer pressure reduces takeup ofan SAT prep package virtually identically across two very different high school settings. However,the effects arise from very distinct mechanisms: a desire to hide effort in one setting and a desireto hide low ability in the other.
Keywords: peer pressure, education, field experiment, signaling.JEL Classification: I21, I24, D83, C93.
∗We would like to thank the editor, Nicola Gennaioli, and four anonymous referees for valuable comments. Wewould also like to thank Alex Frankel, Roland Fryer, Emir Kamenica, John List, Gautam Rao, Dmitry Taubinsky,Noam Yuchtman, and seminar participants at the Advances with Field Experiments conference, Columbia, Harvard,MIT, NBER Summer Institute (Children/Labor Studies and Political Economy), Northwestern, Stanford GSB, UCBerkeley, UC Davis, UCSD, the University of Chicago, the University of Zurich, WashU, and the World Bank forfeedback and suggestions. Ahmed Ali-Bob, Natalia Baclini, Cameron Burch, Diego De La Peza, Stefano Fiorin, MishaGalashin, Vasily Korovkin, Shelby McNabb, Matthew Miller, Aakaash Rao, and Benjamin Smith provided excellentresearch assistance. Our study was approved by the UCLA Institutional Review Board and the Los Angeles UnifiedSchool District Committee on External Research Review. The experiment reported in this study can be found in theAEA RCT Registry (#0000975).†University of Chicago and NBER, [email protected]‡Kellogg School of Management, Northwestern University and NBER, [email protected]§Wharton School, University of Pennsylvania and NBER, [email protected]
1 Introduction
Most people care, to at least some degree, about their social image or what others think about
them.1 Such concerns are often highly pronounced among adolescents, who may care deeply about
establishing an image or identity, and whose behavior may accordingly be heavily influenced by
a desire to shape how they are viewed by their peers.2 Yet behavior during this period of life,
such as in relation to schooling, can also have significant, long-lasting and potentially irreversible
consequences. It is therefore important to understand whether, and why, schooling choices are
influenced by concerns over social image. For example, Coleman (1961) argued that some peer
“societies” in which teens find themselves may adversely influence educational investments. More
recently, Bursztyn and Jensen (2015) find that schooling investments, including both takeup of a
free SAT prep course and effort exerted in practicing for a high-stakes high school exit exam, are
greatly, and negatively, affected when those behaviors are observable to peers.3
Despite these suggestions of potentially powerful negative effects of image concerns, little is
known about exactly what image students are concerned with in relation to schooling decisions. In
other words, when students make educational choices that may appear to harm their long-run op-
portunities, what in particular are they trying to signal to their peers? Bursztyn and Jensen (2015)
for example simply document that observability affects behavior; they are unable to provide any
insights into the underlying mechanism(s). Yet understanding this underlying motivation is likely
to yield important insights both for understanding the root causes of educational underachievement
and for designing corrective policy strategies. In this paper, we model two underlying mechanisms
for negative peer pressure effects and provide a field test that allows us to us to differentiate them.
Negative peer pressure in education is often explained by the presence of a social stigma associ-
ated with the takeup of educational activities. A prominent rationalization of this stigma is given by
the “Acting White” framework by Austen-Smith and Fryer (2005).4 In their model, students have
both a social type and an economic type. In choosing how much educational effort to exert, they
face the problem of simultaneously signaling to two audiences: peers and firms. Peers like students
1The idea that a desire to shape one’s social image or signal one’s type may affect behavior is at the core of theconcepts of signaling in economics (Spence 1973), impression management or self-presentation in sociology (Goffman1959) and the role of “situation” in social psychology (Lewin 1936, Ross and Nisbett 1991). Concerns about image orsocial pressure also appear in the literature on norms (Benabou and Tirole 2011, Acemoglu and Jackson 2017), statusgoods (Veblen 1899, Frank 1985, Leibenstein 1950, Bagwell and Bernheim 1996), identity (Akerlof and Kranton 2000,2010), conformity (Bernheim 1994), and pro-social behavior (Benabou and Tirole 2006).
2Lavecchia, Liu and Oreopoulos (2015) discuss the neuroscience and psychology literature on development inchildren and adolescents.
3The exception is honors classes, where students taking both honors and non-honors classes are more likely tosign up for the SAT course when their honors peers will observe the decision.
4Despite the name “Acting White” and motivation that is often drawn from the experiences of minority students,their framework could apply to any setting where individuals wish to be popular among peers. For the purposes ofthis paper, we follow Austen-Smith and Fryer (2005) and use the term “Acting White” to refer to any mechanismwhere participation in educational activities is stigmatized, while remaining agnostic on whether considerations ofrace or ethnicity play a role in our experiment.
1
who are high social types, while firms want to hire high economic types. As in the classic signaling
model of Spence (1973), the psychic cost of studying is assumed to be lower for high economic types.
However, if studying is also costlier for high social types (e.g., the opportunity cost is greater), in
the “Acting White” equilibrium students reduce their educational effort to avoid sending the signal
to peers that they are a low social type. More broadly, the “Acting White” hypothesis suggests
that minority students may face punishment from peers for exerting effort because it signals that
they are weakly attached to the group (Fordham and Ogbu 1986, Austen-Smith and Fryer 2005,
Fryer 2007, Fryer and Torelli 2010). Thus for example, when the returns in the labor market are
low relative to the returns to group membership, students over some range of underlying ability
may decide that signaling group loyalty is more important when choosing educational effort, i.e., it
is “smart to be cool.” And beyond this specific model, it is certainly possible, and in fact popular
perceptions would even suggest it is likely, that many students may be motivated more broadly by
a desire to signal a favorable social type to their peers.
But what if there is also stigma associated with performance (or, rather, underperformance) in
educational activities? In other words, what if peers also like high economic types?5 Being thought
of as smart, or at least, not being thought of as unintelligent, may be directly important for utility,
or it may be that in some settings, signaling a high economic type to peers has present or future
returns. Building on this observation, we consider an alternative form of peer social concern in
education, namely a concern with revealing low ability when high ability is rewarded by peers,
i.e., when it is “cool to be smart.” Many actions that students can undertake may reveal their
ability or economic type to their peers, such as participating in a class discussion, raising a hand
to answer a question posed by the teacher or to ask a question to clarify material, working on a
group project, or joining a study group. Some students, such as those with lower ability, may then
choose not to undertake such actions for fear of revealing their ability.6 More generally, reducing
educational effort allows such students to portray themselves to peers as high social types rather
than low economic types. Thus, this social image concern results in negative peer pressure effects
that on the surface may look exactly like the “Acting White” hypothesis.
We present a model that incorporates both of these concerns, where students may value either
attribute: social type or economic type. The model generates predictions about how both mecha-
nisms may influence educational investment behavior, as well as how the two can be differentiated
empirically (or at least, how we can infer which of the two is dominant if both are present). In doing
so, we build on a much simplified version of Austen-Smith and Fryer (2005), where students have
a two-dimensional type (social and economic) and want to signal their social type to their peers.
5In Austen-Smith and Fryer (2005), peers are assumed not to care about the individual’s economic type (as firmsare assumed not to care about their social type).
6Alternatively, as we show below, students may seek opportunities that allow them to signal high ability withoutthe risk of actually revealing their true ability. For example, a student may raise their hand in class when the teacherasks a question, but only when many others have also raised their hands, so the likelihood of being called on is low.
2
We show that the motive to signal either of the two components (social or economic) is sufficient
to result in negative peer pressure, and thus both stories are potentially consistent with the empir-
ically observed phenomenon, namely that some students may not undertake important educational
efforts or investments when they are observable to peers.7 We further show that augmenting the
model with a particularly designed lottery yields differing predictions based on whether concerns
for signaling social type or concerns for signaling economic type prevail in a particular setting.
We test the model using a field experiment in Los Angeles public high schools. We offer students
free access to a commercially available SAT prep package that includes an online app, a diagnostic
test, and one-on-one tutoring. The core of our test builds on Bursztyn and Jensen (2015) in varying
at the individual level whether students believe the decision to sign up (and here, the diagnostic test
score) will potentially be revealed to classmates. If students behave differently when they believe
their decision will be revealed to peers, it indicates the presence of peer social concerns.
To distinguish between the two proposed mechanisms, we add a lottery and vary the likelihood
that students who sign up will win the free SAT package. Assume that with probability p, a student
who signs up for the lottery will win the package and get the benefit associated with it. When
the decision is public, others will also learn that the student signed up. And if they win, their
diagnostic test will also be public, which will reveal their ability to others. If effort is stigmatized,
signup rates should increase in p when the decision is public.8 In effect, if students face a large
social cost just for signing up, they will be more likely to sign up and incur this cost when they have
a greater chance of winning the lottery and receiving the benefit of the package. By contrast, if
fear of revealing ability is present, then signup rates should decrease in p when the signup decision
is public. The intuition is that students with low ability can sign up for the package, which allows
them to pool with the high ability types, with very little risk of being revealed to be a low ability
type (since the diagnostic test score is only revealed if the student wins the package). Thus when
the decision to sign up is public, the differential response to p, whether signup increases or decreases
in p, allows us to distinguish which of the two motives is present (or, which of the two dominates,
since both may apply).
We implement this experiment in three Los Angeles high schools. The choice of schools was
guided by the theory, field work and previous literature, and then pre-registered. We chose one
smart-to-be-cool school where we expected effort stigmatization was likely to be more important
(a lower achieving school with a high share of minority students) and two cool-to-be-smart schools
where we expected signaling high ability was more likely to be important (higher achieving schools
with lower minority shares). We also provide subsequent survey evidence confirming that these
two types of schools do indeed differ in ways that our model and tests are intended to highlight.
7In Austen-Smith and Fryer (2005), students care about signaling only their social type to their peers, and thus,only one mechanism of peer pressure is present in their model.
8The model predicts that p will have no effect on signup when decisions are private, since there are no costsassociated with signing up or winning when everything is private.
3
Students in cool-to-be smart schools are much more likely to agree that being seen as smart is
important for being popular in their school. The difference is large, about 40% of the standard
deviation in responses, and statistically significant. Students in cool-to-be-smart schools are also
more likely to say that if classmates become more popular because they are studying hard, it is
because other students admire hard workers or smart people. Thus, although we view our choice-
based test as the ideal approach for identifying peer school culture, additional survey validation
supports our inference.
Overall, we find that signup rates are lower in all schools when the decision (and potentially the
diagnostic test score) will be revealed to classmates. In fact, the effects are virtually identical in the
two types of schools. On their own, these results could be been taken as evidence of the “Acting
White” hypothesis, and we might then conclude that this phenomenon was more widespread than
we might have believed, even occurring in schools that have a much lower share of minority students.
Alternatively, we may have been tempted to conclude that the “Acting White” hypothesis was not
in fact about “Acting White,” but something different altogether. However, our experimental
design allows us to differentiate the two different underlying motivations driving this negative peer
pressure. In the school we pre-registered as a likely smart-to-be-cool school, when decisions are
public, signup rates are indeed higher when p is greater, consistent with a greater concern over
revealing effort (signup rates are unaffected by p when the decision is private). By contrast, signup
rates are lower when p is greater in the schools we pre-registered as likely cool-to-be-smart schools
when the decision is public, consistent with a greater concern over revealing ability (again, private
signup rates are unaffected by p).9 And strikingly, in the cool-to-be-smart schools, when the decision
is public the likelihood of signup declines primarily for students with lower grades when the chance
of winning the package is high rather than low;10 this result is further evidence of the proposed
mechanism, since such students are most likely to have low scores revealed through the diagnostic
test.11 Further consistent with these effects being driven by peer social concerns, in both types of
schools we see the biggest effects among students who say it is important to be popular (these are
the students who will have the highest concern about how others perceive them). Thus, we find
strong support for the model, and evidence of both types of concerns.
Although our primary goal is to uncover the mechanisms behind peer pressure, we also find
that students in the public treatment in both types of schools, having been less likely to sign up
for the SAT prep package, are significantly less likely to have taken the SAT as of our last follow
9Even cutting across schools, if we examine classrooms where students report a greater concern over whetherothers think they are smart, we see similar patterns.
10Although grades are an outcome variable, not an innate attribute, they are likely to be correlated with ability.Further, grades will play an important role in college admissions, which will affect future earnings, and thus they area reasonable proxy for a student’s economic type.
11The same pattern does not hold when the signup decision is private, nor in the smart-to-be-cool school where wepredicted that this mechanism is less likely to be present.
4
up survey.12 These results suggest that peer pressure concerns may be strong, since students were
willing to give up a lot in order to not reveal effort or ability (the SAT package we offered normally
costs a little over $100 dollars (which is particularly large for these lower income households) and
the median reported expected score gain among all students offered the package was about 100-120
points). They also suggest the potential consequences of peer pressure may be significant.
Although, as noted, Bursztyn and Jensen (2015) also documented peer pressure using the choice
of whether to accept an SAT prep package, the present paper differs in several important ways,
including a model and a new mechanism, a theory-based test for the two mechanisms, a modified
experimental design, and a broader study setting. These differences lead to several significant
contributions. The first contribution is empirical. We provide new results on peer social pressure
that notably differ from the previous literature. For example, motivated by the “Acting White”
hypothesis, most previous work on this topic, including Bursztyn and Jensen (2015), focused almost
exclusively on low-income and minority settings. We show that negative peer pressure in important
educational choices is more common and widespread than previously considered by documenting
its existence in middle-income schools with lower minority shares. Additionally, we document that
two very distinct mechanisms are at play in these two settings. Although the results in Bursztyn
and Jensen (2015) are potentially consistent with an “Acting White” mechanism, that paper could
not, and indeed did not, take a stand on the underlying mechanism. Here, we find that while in
the low income school the phenomenon is something akin to the “Acting White” mechanism, in
the higher income schools it is our other mechanism, fear of revealing low ability.
We contribute to theory by modeling (and later empirically verifying) a new channel of peer
pressure, where peers reward ability or economic type.13 We believe that this mechanism may be
an important and widespread phenomenon that adversely affects learning and achievement, with
the additional implication that negative peer pressure effects in education may be found outside
of just those contexts where we expect the “Acting White” mechanism to be present.14 And
the number of activities that may reveal ability, and which thus may be influenced through this
mechanism, is large.15 It is then possible that students may regularly forgo or avoid potentially
12However, these are only self-reports. Further, our last follow up was near the end of the academic year, andmany students will take the SAT in their senior year. Thus, we may only be capturing that students take it sooner,or perhaps more times, rather than whether they will ever take it. However, both of these outcomes may still bepotentially valuable for the student. Separately, we verify that access to the course has effects on test-taking behaviorby comparing these outcomes among students randomly assigned to the low and high probability of winning thepackage, as well by comparing lottery winners and losers.
13Note also in particular the contrast to Spence’s (1973) model of signaling, where the desire to signal ability (toemployers) leads to greater human capital investments. Our model suggests the desire to signal ability (to peers) leadssome individuals to reduce human capital investments. Related, in the context of social learning, Chandrasekhar etal. (2016) consider whether some agents may be reluctant to ask questions or otherwise seek information from othersbecause doing so may signal low skill.
14In fact, the desire to be considered smart may be a more prevalent norm, and it is the unfortunate and uniquecircumstances of the “Acting White” phenomenon that represent the exception, with a particularly strong, counter-vailing concern with signaling a high social type overcoming this desire.
15Beyond those examples already given (asking or answering questions in class; joining in class discussions; par-
5
valuable educational efforts due to this image concern.16 This in turn could have big impacts on
performance and ultimate educational attainment. For example, choosing not to ask a question
in class when one doesn’t understand the material (or not speaking up when the teacher asks if
everyone understood the material) can cause students to fall far behind, particularly when lessons
are cumulative and there are few outside opportunities or resources for additional help.17
The third major contribution is methodological. We demonstrate the importance of considering
possible heterogeneity of mechanisms ex ante when designing an experiment. Our approach uses
theory to guide experimental design in a way that allows different mechanisms to be tested within
the same experimental set up, differentiating between the two based solely on the sign of a single
statistic (here, differentiating between effort stigmatization and ability rewarding based on the
differential effect of p in the public treatment). This approach yields three important advantages.
First, using the same experiment for both mechanisms, rather than variations in the experiment
or altogether different experiments for each, reduces or eliminates the possibility that differences
in the experimental design itself may be driving any observed differences across settings. Second,
this approach is also more economical, in that it doesn’t require us to run different experiments in
each setting to test for the two mechanisms.18 Finally, by simultaneously testing both mechanisms
with a common treatment, we are able to tell which mechanism dominates in a particular setting
(running different experiments for each mechanism may just indicate that both are present but
not which dominates), which may be the most relevant factor for policy design. Related, for
studies interested in understanding different cultural settings, whether school-based or otherwise,
this choice-based approach offers a strategy for identifying or revealing underlying cultural factors
without the need for subjective appraisals or direct elicitation from respondents. More generally,
there are many behaviors that may be driven by multiple, differing signaling cultures, for which a
ticipating in group or team assignments; joining a study group), others include: making a presentation in front ofthe class; attending extra help or review sessions; or joining an academic club (e.g., physics, debate or Model U.N.).When class participation is mandatory or “cold calling” is practiced, just attending class risks exposing one’s ability.
16And the lower ability students who would perhaps benefit the most from activities such as asking questions orjoining study groups will precisely be the ones that are least likely to do so. Though the range of students affectedcould be even greater. If students care about relative ability within a class or group of peers, even high ability studentsmight be influenced if they are in honors classes with even higher ability classmates. Finally, even the highest abilitystudents who don’t understand a particular concept or missed an explanation may for example also not ask theteacher for additional clarification because they too worry about maintaining their high ability reputation.
17This mechanism can also been seen to be related to the concept of fixed vs. growth mindsets in psychology (e.g.,Blackwell, Trzesniewski and Dweck 2007 and Dweck 2007). When students believe that ability is fixed, they mayview difficult or challenging tasks (such as SAT prep tests) as threats when those tasks may reveal to others thatthey are low ability. By contrast, students who believe that ability grows through engaging in difficult or challengingtasks may feel less threatened in similar situations, since poor performance may be perceived by others as just havingnot yet achieved higher ability in that task.
18Suppose that we have two mechanisms M1 and M2 and two statistics σ1 and σ2, such that σi > 0 if and only ifmechanism Mi is at work, for i ∈ {1, 2}. To check if one of the mechanisms is present, one would have to computeboth σ1 and σ2, which would be expensive if obtaining the two statistics requires different treatments. In addition,this would also be wasteful, because the two tests are one-directional and would ignore information if σi < 0 for eitheri. In these terms, our tests satisfy σ2 = −σ1, which allows us to perform a two-directional test and make use of allinformation retrieved.
6
similar methodological approach could prove valuable.
In this way, our paper also relates to a number of recent studies using field experiments to
separate the role of different potential mechanisms behind economic phenomenon (e.g., Karlan
and Zinman 2009, DellaVigna et al. 2012, and Bursztyn et al., 2014). Unlike previous studies,
however, our experiment explicitly departs from different settings where the dominant mechanism
is expected to be different: it is precisely our goal to show that similar results can be explained
by very different channels in different settings. Again, considering the potential heterogeneity
of environments when designing mechanism experiments linked to theory could have important
implications when considering generalizing a set of findings. For example, consider our basic finding
of nearly identical effects of public signup (pooling the signup rates across levels of p) in the two
types of schools. In the absence of a more precisely constructed test, including the one in Bursztyn
and Jensen (2015), one might have erroneously inferred that the same mechanism applied in both
settings (or, again, that perhaps the ‘Acting White” mechanism was incorrect).
As a final contribution, the present paper can add to policy debates. For example, we show
that there is a need to focus on the effects of negative peer social pressure on school behaviors even
in higher income or low minority share settings. And beyond just providing a way to diagnose
the underlying problem, documenting the existence of two different mechanisms and showing that
they apply in different settings is important because the two mechanisms suggest very different
implications for a wide range of school policies and practices, such as information and marketing
campaigns, grade privacy, honors recognition and programs, paying students for inputs or good
grades and whether certain school activities should be mandatory. We discuss these implications
further in Section 5. The mechanism at play should be part of the policy debate, which again
highlights the importance of designing experiments to understand heterogeneity of mechanisms.
Our paper contributes to several related literatures. First, we contribute to the literature
attempting to understand the barriers to educational achievement. Under both mechanisms we
model, and empirically in both types of schools we examine, students are willing to pass up on
potentially valuable opportunities just because of concerns about how their peers will perceive
them. Our paper also contributes to the literature on peer effects in education by identifying two
underlying mechanisms behind such effects (Sacerdote 2001, Zimmerman 2003, Carrell, Fullerton,
and West 2009, Duflo, Dupas, and Kremer 2011, and Carrel, Sacerdote, and West 2013). A related
literature focuses more broadly on the role of schools and neighborhoods in influencing educational
performance and attainment (Oreopoulos 2003, Jacob 2004, Kling, Liebman, and Katz 2007, Dobbie
and Fryer 2011, Fryer and Katz 2013). Our two student peer cultures provide potential underlying
mechanisms for such effects.
Outside of the educational context, our paper contributes to other literatures as well. Since the
seminal work by Spence (1973), there has been a large theoretical literature on social signaling.
Recently, a number of empirical studies have provided evidence of the importance of social signaling
7
in a variety of settings, such as effort and performance in the workplace, social learning, voting, po-
litical campaign contributions, prosocial behavior, financial decisions and conspicuous consumption
(e.g., Ashraf, Bandiera and Jack 2014, Ashraf, Bandiera and Lee 2014, Ariely et al. 2009, Bursztyn
et al. 2014, Chandrasekhar et al. 2016, Charles et al. 2009, DellaVigna, List and Malmendier 2012,
DellaVigna et al. 2017, Mas and Moretti 2009 and Perez-Truglia and Cruces 2017; see Bursztyn
and Jensen 2017 for a review). We contribute to this literature by experimentally disentangling
different underlying social signaling motivations.
The remainder of this paper proceeds as follows. In the next section, we present the theoretical
framework that incorporates the two types of peer concerns and generates predictions on how
they will influence educational investments, and how the two mechanisms can be distinguished
from each other. Section 3 discusses the experimental design and the connection to the theory.
Section 4 presents the results and considers alternative explanations. Section 5 discusses the policy
implications of these results and concludes.
2 Theoretical Framework
The model below is a simplified and modified version of Austen-Smith and Fryer (2005), adapted for
the purposes of describing the two mechanisms (as opposed to a single “Acting White” mechanism)
and for designing a test to differentiate the two. One notable difference is the payoffs from education.
In Austen-Smith and Fryer (2005), ability is not observed, and firms pay wages based on both
education and inferred ability, the latter of which is assumed to be greater for those choosing higher
levels of education because effort (in our setting, described as the takeup of educational activities)
is increasing in ability (as in Spence, 1973). Thus, higher takeup of educational activities is a signal
of higher ability, and if takeup is not stigmatized (students are not treated differently depending on
peers’ inference of their social type), all students would study more. By contrast, we treat economic
ability as also being judged by peers just like social type, and takeup of educational activities is
assumed to help reveal true ability (to peers).19 We show that this alone can make students reduce
educational effort in order to avoid revealing that they are low economic types.
In what follows, we first present a simple model of signaling social skills, then augment it to get
a model of signaling economic skills. We then introduce a general model that includes a parameter
p that can be used to differentiate the two cases.
2.1 Simple model of “signaling social skills”
There is a continuum of students. They have an opportunity to participate in a certain educational
activity that delivers benefit b > 0, but requires time. The opportunity cost of time is student’s
19Thus, our model of education is not a pure ‘signaling’ model. For this reason, we will not need to address multipleequilibria and refinements, which are common in signaling models.
8
private information, and we denote it by ci. We follow Austen-Smith and Fryer (2005) in assuming
that this opportunity cost of time reflects the student’s ‘social type’. Specifically, there are two
social types, low and high, so that ci = l for low social types and ci = h for high social types with
l < h; in this way, we save on notation by having ci denote the social type, ci ∈ {l, h}. We denote
the share of low social types by q: Pr (ci = l) = q. In what follows, we assume that l < b < h, so
low social types have a positive net benefit b− l > 0 from the educational activity, and high social
types have a negative net benefit b − h < 0 from this activity. To save on notation, we normalize
l = 0, so the net benefit of low social types equals b.
Students care about their peers’ perception of their social type; we use λs to denote the in-
cremental benefit of being seen as a high social type as opposed to low one. The students thus
get additional utility λsPr−i (ci = h | Info), where the latter factor reflects the probability that
the peers put on student i being high social type conditional on Info, which denotes the history
of the student’s actions that are common knowledge (public history). If we let si ∈ {0, 1} be the
student’s decision to sign up for the educational activity (si = 1 if the student signs up and si = 0
otherwise), then a student i solves
maxsi∈{0,1}
(b− ci) si + λsPr−i (ci = h | Info) . (1)
In what follows, we distinguish between two settings: private and public. In the private setting,
a student’s decision is not observed by peers, so Info = {∅} (empty public history) regardless of
the student’s choice. In the public setting, the decision is observed by the peers, and thus Info = si.
This model is easy to analyze. In the private setting, the second term in (1) is a constant
unaffected by si, and student i maximizes (b− ci) si. The student therefore chooses si = 1 if and
only if b− ci > 0, i.e., only if ci = l. Consequently, the share of students who sign up is q, and all
those that do sign up are low social types, whereas high social types do not sign up.
In the public setting, high social types (students with ci = h) do not sign up either (the proof
of the proposition below fills in the details). Suppose that share r of students with ci = l sign
up. If so, the payoff of an individual student from signing up is b − ci (in this case, peers know
that the student is a low social type); the payoff from not signing up equals, by Bayes’ formula,
λs1−q
q(1−r)+1−q = λs1−q1−qr . Solving for r, we obtain the following proposition.
Proposition 1. (Signaling social type) In the private setting, only students with positive net
benefit (low opportunity cost ci = l) sign up, so the share of students who sign up equals q. In the
public setting, the share of students who sign up equals q if λs ≤ b; equals 1− λsb (1− q) ∈ (0, q) if
λs ∈(b, b
1−q
), and equals zero if λs ≥ b
1−q .
In other words, signup in the public setting is weakly lower than signup in the private setting,
and strictly lower if λs is high enough (λs > b).20
20Notice that while we assumed that the reputation cost of signing up does not depend on the probability p, in
9
2.2 Simple model of “signaling economic skills”
Consider the same model, but assume now that each student also has ability ai (‘economic type’).
Suppose that ability is uniformly distributed on [0, 1] for students with either value of ci.21 Suppose
that students do not get stigmatized or rewarded for being high or low social type, so λs = 0; how-
ever, they get rewarded for their perceived ability, with coefficient λe that reflects the incremental
benefit of being seen as the best economic type relative to being seen as the worst one. In addition,
assume that in the public setting, signing up reveals not only the fact of signing up si, but also
the student’s ability ai (again, peers learn about a student’s ability when they answer or ask a
question in class, during participation in study group or similar activities). The student’s problem
is therefore
maxsi∈{0,1}
(b− ci) si + λeEi (E−i (a | Info) | ai) ; (2)
here, Info = {∅} in the private setting and Info = (si, ai) in the public setting. In what follows, we
assume that h� 0, specifically, that h > b+ λe; this ensures that students with high opportunity
costs do not sign up just to reveal their high ability, which would lead to positive peer effects,
whereas our focus is on negative peer effects.
In this version of the model, the private setting is unchanged: a student signs up if and only
if ci = l. In the public setting, among students with ci = l, smarter students sign up, as they are
more interested in revealing their economic type. More precisely, students with ai close to 1 always
sign up. If λe ≤ 2b, then even a student with ci = l and ai = 0 prefers to sign up: indeed, in such
an equilibrium, by signing up this student reveals his low economic type but gets the benefit b; if
he does not sign up, he pools with high social types, who on average have ability 12 . For λe > 2b,
the equilibrium takes the form of a cutoff: students with ai ≥ t sign up and students with ai < t
do not. The cutoff t may be found from the following indifference condition:
b+ λet = h
(1− q
1− q + qt
1
2+
qt
1− q + qt
t
2
).
equilibrium, it is endogenously higher if p is high. Indeed, for a high p, many low social types (ci = l) sign up(Proposition 1), which means that signing up signals that one has ci = l for sure, while not signing up is a strongsignal that ci = h, which leads to a high reputational gap. In contrast, if p is low, then only a few low social typessign up, and not signing up provides little information, and the posterior is close to the prior, which implies that thereputational gap is smaller. We believe that this (less reputational consequences for a less consequential decision) isa realistic feature that, interestingly, arises in our model endogenously.
21We follow Austen-Smith and Fryer (2005), who also adopt this assumption for simplicity. In general, there is noreason to believe that the distributions are the same or, more generally, that ability and social skills are uncorrelated.Furthermore, the correlation may have either sign. Students with a high opportunity cost (i.e., high social type) mayalso have low ability because they have never invested in this ability, which would imply negative correlation betweenability and social type. Alternatively, high ability students may be already very well prepared for the SAT, andtheir opportunity cost of studying further to obtain the same benefit is high; this would imply positive correlationbetween ability and social type. We prefer to remain agnostic about the true correlation and adopt the independenceassumption for convenience. We note, however, that the results would remain unchanged for low or moderate levelsof correlation, because the baseline results are not knife-edge.
10
Solving for t, we obtain the following proposition.
Proposition 2. (Signaling economic type) Suppose h is sufficiently high, specifically h > b+λe.
In the private setting, the share of students who sign up equals q. In the public setting, the share
of students who sign up equals q if λe ≤ 2b; and it equals
1 +bq
λe−
√1− q +
b2q2
λ2e< q
for λe > 2b.
In other words, the share of students who sign up in the private and public settings is identical
for low λe, while the share is lower in the public setting for λe above a certain threshold.
2.3 Introducing a lottery to separate the two mechanisms
We now consider a joint model of signaling social and economic skills. As before, we use λs and λe to
denote the intensities of student’s concerns over their peers’ perceptions of their social and economic
types, respectively. In this Section, they both may be positive. Furthermore, we now assume that a
student who chose si = 1 (signed up) gets to participate in the educational activity with probability
p ∈ (0, 1) (formally, there is a random variable wi ∈ {0, 1} that is drawn independently of (ai, ci)
and such that Pr (wi = 1) = p). Technically, this means that with probability p, the student gets
the benefit b and pays the opportunity cost ci (and reveals his ability ai in the public setting); with
complementary probability 1 − p, he neither gets the benefit nor pays the cost, and in the public
setting only si is revealed, but not ai.
The student of type (ai, ci) therefore solves
maxsi∈{0,1}
p (b− ci) si + λsPr−i (ci = h | Info) + λeEi (E−i (a | Info) | ai) . (3)
Here, Info = {∅} in the private setting. In the public setting, Info is a vector (si = 0,∅,∅) if the
student did not sign up, a vector (si = 1, wi = 0,∅) if the student signed up but lost the lottery, or
a vector (si = 1, wi = 1, ai) if the student signed up and won the lottery, in which case his ability
ai is also revealed.
The result in the private setting is identical to the previous cases: the share of students who
sign up is q. In the public setting, high social types (ci = h) do not sign up, and the strategies of
low social types satisfy a single-crossing condition: if a student i with ability ai (and ci = l) signs
up, then so does a student j with ability aj > ai. Thus, there is a threshold t such that students
with ai > t sign up and those with ai < t do not. For a student with type (ai, ci = l), the expected
11
utility if he signs up equals22
Usi=1 (ai, ci) = pb+ λe
(pai + (1− p) 1 + t
2
),
and the expected utility if he does not equals
Usi=0 (ai, ci) = λs1− q
1− q + qt+ λe
(t
2
qt
1− q + qt+
1
2
1− q1− q + qt
);
notice that the latter does not depend on the student’s type. An interior threshold t ∈ (0, 1)
corresponds to an equilibrium if and only if Usi=1 (ai, ci) = Usi=1 (ai, ci) for ai = t.
We thus have the following proposition.
Proposition 3. (Characterization of equilibrium) Suppose h > b+ λs + λe. Then there is a
unique23 equilibrium that satisfies the D1 criterion.24 In the private setting, the share of students
who sign up equals q. In the public setting, the share of students who sign up equals q if and only if
pb ≥ λs+pλe2 . If pb ≤ (1− q)λs−λe2 , then nobody signs up, and for pb ∈
((1− q)λs − λe
2 , λs + pλe2),
the share of students who sign up is given by
1 + p
2p+qb
λe−
√(1 + p
2p+qb
λe
)2
− q(
1
p+
2b
λe+
2λs (1− q)λe
)∈ (0, q) .
Thus, the share of students in the public setting is the same as in the private setting if both
λs and λe are small, and is smaller than in the private setting if either λs or λe are large. The
conditions are intuitive: all students with ci = l sign up if and only if the marginal student (one
with ai = 0) is willing to do so. For this student, signing up yields benefit b, which he gets with
probability p, and imposes social cost λs and economic cost λe2 with probability p (indeed, if he
does not win, his economic type is perceived as 12 , and if he wins it is revealed to be 0). Similarly,
no student signs up if and only if the student with (ai = 0, ci = l) prefers not do so. For such a
student, again, the expected benefit from signing up consists of the instrumental benefit b that he
gets with probability p and the economic benefit λe2 that he gets in this case with certainty, because
he reveals himself to be of economic type 1 rather than 12 merely by the act of signing up. His
social cost in this case is lower: while he reveals himself to be a low social type by signing up, he
22In a putative equilibrium where nobody signs up, this is only true for properly chosen out-of-equilibrium beliefs.Proposition 3 shows that this holds in any equilibrium that satisfies the D1 criterion (Cho and Kreps, 1987).
23Up to behavior of marginal types that may be indifferent; these types have measure zero.24Without this requirement, there may be additional equilibria, such as one where nobody signs up, and a student
who signs up would be believed to have ci = l and, unless proven otherwise, ai = 0. This equilibrium fails the D1criterion because the student that gains the most from deviation has ai = 1, as there is a positive probability that thishigh ai will be revealed. In this signaling game, the receiver is nonstrategic, but one can easily adapt Cho and Kreps(1987) to this case by assuming that it is strategic and has a unique best response that gives the sender (student)the assumed payoff.
12
would otherwise be thought to have a probability q of being a low social type, so the incremental
social cost is only (1− q)λs.We now turn to comparative statics.
Proposition 4. (Comparative statics) The share of students who sign up in the public setting is
(weakly) decreasing in λs. It is also (weakly) decreasing in λe if λs is low enough,25 and is increasing
in λe otherwise. Furthermore, as p increases, more students sign up if b > λe2 −(1− q)λs and fewer
students sign up otherwise.
These comparative statics results are summarized in Figure 1. To get an intuition for the last
condition, suppose first that the marginal type that is just indifferent between signing up and not
has ai = 0. For this type, an incremental increase in p proportionately increases the chance of
getting the benefit b and also the chance of incurring the economic cost λe2 by reducing the peers’
perception of his economic type from an average of 12 down to 0. Notice that the effect of an
increase in p is not directly affected by the social cost λs, because this social cost is paid regardless
of the outcome of the lottery. However, a higher λs makes fewer students willing to sign up, thus
increasing the ability of the marginal type and thereby reducing the negative impact of a higher
p on the perception of his economic type. This explains why a higher λe makes it less likely that
a higher p increases sign-up, while a higher λs makes it more likely. Quite interestingly, the last
term (1− q)λs can be interpreted as the change in social stigma that a student gets if he reveals
himself to be of low social type rather than the average, while λe2 is the corresponding value for the
economic type. This means that the effect of p depends on the relative impact of signaling of one’s
social type and economic type to peers.26
3 Experimental Design and Connection with Theory
3.1 Experimental Design
We conducted our experiment in three public high schools in two areas of Los Angeles, between De-
cember 2015 and February 2016. We focused on 11th grade classrooms, since this is when students
typically begin preparing for the SAT. In the first school, 97% of students are Hispanic/Latino,
74% are eligible for free or reduced-price meals and the median income in the school’s ZIP code
is about $44,000. Approximately 59% of seniors take the SAT, with an average score of around
1,200. Our sample contains 257 students from this school. By contrast, averaging across the second
25More precisely, if λs <b
2(1−q)
(√(1− p)2 + 4p (1− q)− (1− p)
).
26We also considered an alternative setting where educational effort is stigmatized directly, instead of merely beinga signal of low social type. This would lead to a very similar model, with only si = 1 replacing ci = h in the secondterm of Equation (3). The results are qualitatively similar and are available upon request. We note, however, thatthe setting presented in the paper is both more in line with Austen-Smith and Fryer (2005), as well as our surveyresults discussed in Subsection 4.4.
13
and third schools, 33% of students are Hispanic/Latino, 41% are white, 41% are eligible for free
or reduced-price meals and the median income is about $66,000. Approximately 69% of seniors in
these schools take the SAT, and the average score is around 1,500. We have 254 students from
these two schools in our sample. In a sample of 138 LAUSD high schools, the first school is just
above the 50th percentile in the distribution of schools by the share of students eligible for free
or reduced-price meals, while the second and third schools are both below the 5th percentile. In
terms of the share of non-white students, the first school stands around the 70th percentile of the
distribution, while the second and third schools are both below the 5th percentile.
Within each school, we coordinated the day and periods of our visits with principals and school
counselors. On the selected dates and times, we chose a selection of classes, across a range of
subjects, restricting to non-honors classes. Within each school, the chosen classes were from the
same period or from adjacent periods with no overlap of students. Neither students nor teachers
were informed about the purpose of our visit. For the three schools together, our sample includes
511 students, across 17 classrooms.
Based on our priors and field work, we chose, and pre-registered, these particular schools for
testing our model because we expected effort stigmatization to dominate in the first school (the
smart-to-be-cool school) and ability rewarding to dominate in the other two (the cool-to-be-smart
schools).27 Though ultimately our experiment is specifically designed to test whether this is the
case, we can provide some preliminary evidence that supports our priors. After our experiment
was complete, we asked students to fill out a survey (this, and all other survey forms, are provided
in the Supplemental Appendix) that included the following item: “To be popular in my school it
is important that people think I am smart.” (1: strongly disagree ... 5: strongly agree). In the
smart-to-be-cool school, the mean response was a 2.39. By contrast, the mean was 2.90 in the
cool-to-be-smart schools. This mean difference is statistically significant at the 1 percent level.
Further, we can reject the null that the two distributions are equal at the 1 percent level using a
discrete bootstrapped version of the Kolmogorov-Smirnov test with 10,000 repetitions. Finally, we
also note that this difference is quite large in magnitude; the 0.5 mean difference is equal to about
27It is beyond the scope of the present paper to model or test the origin or evolution of peer cultures and why theymay differ across schools. However, we can offer some intuition, beyond reference to the Acting White literature, thatguided the field work. When students have more limited mobility and fewer labor market opportunities with higherhuman capital requirements, it might be more important to signal social type, since one is likely to keep the samegroup of friends after high school and derive value from maintaining membership in a network with them. Moreover,group loyalty might be particularly important among groups formed by ethnic minorities (Berman 2000, Gans 1962,Lee and Warren 1991, and Ausubel 1977). By contrast, in settings where students are more likely to go to collegeor have higher mobility, concerns about maintaining membership in a network of high school friends may be lesssignificant. Alternatively, signaling a higher economic type might be more valuable for future opportunities withina network when most peers will go on to high paying jobs with high human capital requirements. Finally, differentschool cultures may arise due to historical patterns of access and opportunity. In higher achieving schools with betterfunding and wealthier and more educated parents, a higher share of students may have traditionally gone to college,so doing well in school and preparing for college is the norm. By contrast, in lower achieving or lower income schools,students may have historically faced many barriers to accessing college, so students working hard to do well andplanning for college may be in a small minority.
14
40% of the standard deviation for the pooled sample of students.
As in Bursztyn and Jensen (2015), the core of our experiment involved offering students the
opportunity to sign up for complimentary access to an SAT preparation package. Students were
handed a form at their desks that included the following:
“[Company Name] is offering a chance to win an SAT prep package intended to improve
your chances of being accepted and receiving financial aid at a college you like. The
package includes:
• Premium access to the popular [App Name] test prep app for one year;
• Diagnostic test and personalized assessment of your performance and areas of strength and
weakness;
• One hour session with a professional SAT prep tutor, tailored to your diagnostic test.
This package is valued at over $100, but will be provided completely free.”
Thus, students were told the value of the SAT preparatory package was over $100 and they
appear to have highly valued it. Beyond the very high signup rates, as shown below, students
appeared to believe the package could have a big impact on their test scores. Though the form did
not mention any specific expected impact on test scores, when asked on the second survey form,
the median expected point gain reported by all students in school 1 (not just those who signed up)
was 100 (with an average of 426). In schools 2 and 3, the median was 123 (with an average of 338).
Thus, forgoing signup, just due to peer social image concerns, represents a real perceived cost to
students.28
Within this offer, we used a 2x2 design, cross-randomizing: (i) the probability of winning the
package conditional on signing up during the experiment, and (ii) whether students were told
that the other students in the room would observe their signup decision and diagnostic test score.
Accordingly, the signup form continued as follows:
“If you choose to sign up, your name will be entered into a lottery where you have a
25% [75%] chance of winning the package.
Both your decision to sign up and your diagnostic test score will be kept completely
private from everyone, including [except] the other students in the room.
Would you like to sign up for a chance to win the SAT prep package?”
28Unfortunately, we cannot determine how accurate these estimates are. We are unaware of any convincing causalevidence for how much this, or any other SAT prep service, can raise scores. However, in field work we found that 100points appears to be a commonly held belief about the effect of test prep services. And a report from the NationalAssociation for College Admissions Counseling (Briggs 2009) notes that most prep companies typically claim gainsof 100 points (or above). So the expected gains among our sample of students seems to be in line with conventionalwisdom (whether correct or not).
15
We refer to the forms containing the 25% chance of winning the lottery as the Low probability
condition, and those with the 75% chance as the High probability condition. Forms with the word
“including” are the Private condition, and those with the word “except” are the Public condition.
The forms, shown in the Supplemental Appendix, were otherwise completely identical for the
various treatment groups.
Forms with the differing treatments were pre-sorted in an alternating pattern and handed out
to students consecutively in their seats.29 By varying treatment status among students within
classrooms, our design ensures that students in the various groups otherwise experience the very
same classroom, teacher and overall experimental environment.
Students were instructed to hold their questions and refrain from communicating with anyone
until after all of the forms had been collected by our team. Thus, students could not coordinate
on their signup decisions or observe what other students were choosing. Further, because students
could not communicate with each other, and because the forms looked nearly identical at a glance,
they would not have been aware that others were being given different privacy assurances or a
different likelihood of winning the lottery.
After the first form was collected, we distributed a second form containing additional questions,
discussed in more detail below, followed by assent and consent forms.30
Though we have four different conditions, the forms were extremely similar, varying only in
a single word, “except” or “including,” and/or a single digit, 2 or 7. As with varying treatment
among students within classrooms, a big advantage to this approach is that the different treatment
arms are therefore treated identically in every other way, with nothing else differing that might
drive different responses, other than the single word relating to privacy or the single digit relating
to the likelihood of receiving the package. One disadvantage is that if students don’t read carefully
or pay close attention, they might overlook these critical details. However, to the extent that this
happens, it would weaken our test, suggesting the effects are even stronger than what we measure.
As noted in the introduction, another strength of our design is that the two mechanisms generate
predictions of changes in take-up as a response to varying p that go in different directions.
It is worth highlighting some distinctions between the experimental design applied here and
the one used in Bursztyn and Jensen (2015). First, we include a lottery with varying probabilities
29The nature of our experiment, which required handing out forms with varying treatment assignments in theclassroom, precluded us from assigning treatment to each student based on a pure random draw. However, what ismost important for our analysis is that the assignment procedure used should result in treatment groups that aresimilar in expectation, which we verify below. The fact that students may be sitting near friends (in classroomswhere students are free to choose where to sit), or those with the same last name and thus potentially related or of asimilar ethnicity (when seats are assigned alphabetically) should not in itself affect our test, since students filled outthe forms without communicating with each other.
30As originally distributed, the second form in the first school did not include a small number of questions that wereadded before visits to the second and third schools. The research team therefore revisited the first school again inFebruary 2016 and collected answers to these additional questions. We were able to survey over 86% of the studentsfrom the original sample in that school. Treatments are still balanced for the sample that was surveyed during thesecond visit (see Appendix Table A.1).
16
of winning the package, rather than giving it to all students who sign up. Second, the SAT prep
package in the current design includes a diagnostic test, the results of which will be revealed in
the public condition for students who win the package. Finally, in the public condition, there is a
difference in the likelihood that it is revealed that you signed up for the course (this happens with
certainty) and whether others learn your diagnostic score (which only occurs if you win the lottery).
These variations are critical for testing and differentiating why students change their educational
choices when others observe those choices, rather than just whether they change their choices, as
in the previous paper.
Table 1 presents tests of covariate balance. As expected, the four groups are very well balanced
on the measured dimensions: sex, age, and ethnicity.
3.2 Linking the Experiment to the Theoretical Framework
The key model predictions that we can test with our experiment are:
(i) Under both mechanisms, the signup rate with the public condition is lower than with the
private condition;
(ii) Under both mechanisms, p should not affect signup rates in the private condition.31
(iii) In a setting where effort is stigmatized, the signup rate in public with p = 0.75 is higher than
with p = 0.25. The intuition is that conditional on publicly signing up (and thus paying the
stigma cost), the marginal student would prefer to get the package.
(iv) In a setting where ability is rewarded, the signup rate in public with p = 0.75 is lower than
with p = 0.25. The intuition is that conditional on publicly signing up (and thus signaling
that one is high ability), the marginal student would prefer not to get the package.
Thus, it is precisely the differential response to p in the public condition (along with, as we will
show, a lack of any effect of p in the private condition) that allows us to isolate and test two very
different underlying mechanisms with our single experiment.
As noted in the introduction, we consider it a strength of our design, and a potentially valuable
methodological insight for other field experiments, that the same exact treatment can yield a test
for both mechanisms. Other approaches, such as designing different experiments or treatments to
test for the two mechanisms separately, raise the possibility that differences in outcomes are not
just due to different mechanisms, but other differences between the two experiments. Further, this
31Outside of the behavior or motives that we are trying to model and test, one could construct theories for whyeven private signup rates could be affected by p. For example, students may dislike losing so much that they are lesslikely to sign up for a lottery when they have a small chance of winning, even when the cost of signing up is otherwisezero and the outcome is purely random. Finding no effect of p in the private treatment, as we do, rules out suchpossibilities (or indicates that different effects cancel each other out perfectly)
17
approach is more efficient and cost-effective, using all of the available information. In addition,
using the same experiment in all settings enables a choice based revelation of which motive is
dominant in a particular setting. And knowing which mechanism dominates in a particular setting
is also likely to be important for policy design.32
4 Results
4.1 Main Results
Figure 2 provides visual evidence of the main results on peer pressure.33 In both types of schools,
making the signup decision public rather than private results in a striking decline in signup rates.
Further, despite the large socioeconomic differences between the two types of schools, the results
(both in baseline levels and treatment effects) are nearly identical, with private signup rates around
80 percent, and a decline to 53 percent when the decision is believed to be public. The results are
large and statistically significant, and consistent with Bursztyn and Jensen (2015).34 However,
despite their similarity, these effects could be driven by very different underlying mechanisms in
the two types of schools.
Turning to the effects of the lottery, the top panel of Figure 3 provides data on the smart-to-be-
cool school. The left-hand side of this panel shows that signup rates are unaffected by the likelihood
of winning the lottery when the signup decision is private. This accords with the predictions of
the model, since unobserved actions do not cause updating about a student’s social type. And
although one might expect that students should be more likely to sign up when there is a greater
chance of winning, since the costs of signing up are zero (just checking a box on the form), students
32We chose not to implement an alternate treatment arm with a public signup decision but private diagnosticscore. Holding p constant, this could in principle allow for separate tests of effort stigmatization (by comparingthe fully private condition to this mixed privacy condition) and the ability rewarding mechanism (by comparing themixed privacy condition to where both are revealed). However, we would lose several advantages of our approach. Forexample, we would be unable to test which mechanism dominates in a given setting. Further, emphasizing differentialprivacy conditions might create confusion or make the issue of privacy too salient. Additionally, our approach allowsus to conduct a placebo test for any direct effects of p, by using the private condition. Finally, this alternativeapproach could bias against either mechanism. For example, if the form promises privacy for one outcome but notthe other, worried students may assume that neither are truly guaranteed to be private. Thus the test for effortstigmatization (signup public, test score private vs. both private) will be seen as a fully public condition, so theresponse will include both the effort stigma and ability rewarding mechanisms. By contrast, the test for the abilityrewarding mechanism (the difference between signup public, test score private and both public) will be biased againstfinding any effect. The same would hold if students are inattentive, only reading the first half of the privacy guaranteein the mixed privacy treatment and concluding that both the signup decision and the diagnostic score are public.
33In this figure and all others below, p-values are from the corresponding regressions that follow them, using robuststandard errors.
34The effects are somewhat larger than those found in Bursztyn and Jensen (2015), particularly in the smart-to-be-cool school, which is more comparable to the sample of schools examined in that paper. However, the effects wereport here pool the impact of public signup for the two levels of p (0.75 and 0.25), whereas in Bursztyn and Jensen(2015) the effects are for p = 1. As we predict theoretically and find experimentally, a lower level of p increases thenegative effect of public signup, so it is perhaps not surprising that we find larger effects in our current setting.
18
who perceive any positive value to the prep package should sign up regardless of the likelihood of
winning. When decisions are public (right-hand side of the top panel), however, signup rates are
dramatically lower when the likelihood of winning the lottery is 25% rather than 75%. The 18
percentage point difference is statistically significant at the 5 percent level. This result is consistent
with a fear of revealing a low social type, or effort stigmatization.
The bottom panel of Figure 3 examines the cool-to-be-smart schools. As before, there is no
effect of p on signup rates when the signup decision is private.35 However, when the decision is
public, the likelihood of winning the lottery has a dramatic effect on signup rates. As predicted
when fear of signaling economic type is the operative (or dominant) motive, students are more
likely to sign up when the chances of winning are 25% rather than 75%, again consistent with
students attempting to pool with the high economic types when there is less of a risk that their
own economic skill will be revealed. The 26 percentage point decline is very large, and statistically
significant at the 1 percent level.
Together, Figures 2 and 3 paint a compelling picture. Based on Figure 2, we find that making
decisions public lowers signup in both types of school. However, the complete opposite response
to p in the public condition in the two types of schools in Figure 3 shows that the underlying
mechanisms in the two are very different.
We can confirm this visual evidence with regressions. To replicate Figure 2, we regress an
indicator for whether individual i in school s chose to sign up for the prep package (Signup) on an
indicator for whether they were offered the public or private treatment (Public), separately for the
two types of schools:36
Signupi,j = β0 + β1Publici,j + εi,j , j ∈ {smart to be cool, cool to be smart}, (4)
where β1 is the coefficient of interest, namely the estimated effect of making the signup decision
public. In additional specifications, we add other covariates (age and dummies for sex and Hispanic)
as well as surveyor and classroom fixed effects; the latter further isolate the within-classroom
variation in the public vs. private condition across students. These results, shown in Table 2,
capture the overall effects of making signup public rather than private in the two types of schools.
In this table and all tables below, in addition to p-values from robust standard errors, for relevant
coefficients and tests we also present p-values from wild cluster bootstrap standard errors (where
we cluster at the classroom level) and permutation tests.37 Ultimately, the three methods yield
35The fact that we find no such effect overall or in either school type suggests that self-signaling is unlikely to playa role in explaining our results.
36For ease of interpretation and readability, we present separate regressions. Pooling both school types and usinginteractions yields similar conclusions (similarly for other regressions below where we split the sample).
37 We use wild cluster bootstrap standard errors because of the small number of clusters (Cameron, Gelbach andMiller 2008). We use permutation tests due to small sample sizes, particularly in analyses that split the sample intosubgroups.
19
similar conclusions in almost all cases (though we point out the few cases where they do not).
To replicate Figure 3, we add to the previous equation a dummy for whether the individual faced
a 0.25 (i.e., low) probability of winning the lottery to get the SAT prep package (Low probability)
and the interaction of the public treatment with the dummy on facing a low probability (Public×Low probability), also separately for the two types of schools:
Signupi,j = β0 + β1Publici,j + β2Low probabilityi,j + β3Public× Low probabilityi,j + εi,j ,
j ∈ {smart to be cool, cool to be smart}, (5)
where β2 + β3 measures the difference in signups under the public treatment in the low vs. high
probability lottery conditions. In additional specifications, we again add other covariates, as well
as surveyor and classroom fixed effects. These results are presented in Table 3.
The regression results are very much consistent with what was revealed in the figures. Table 2
shows that making the decision public reduces signup in both types of schools, with point estimates
of about 0.25 – 0.27. All of the results are significant at the one percent level, and are robust to
including individual covariates and classroom and surveyor fixed effects.38 Table 3 shows that when
the decision to sign up is public, the lottery with the lower likelihood of winning the SAT package
decreases signup in the smart-to-be-cool school (first three columns), but increases it in the cool-to-
be-smart schools (last three columns). And again, the results are all significant and robust to the
inclusion of individual covariates or the classroom and surveyor fixed effects (though in a handful
of cases, the p-values approach or reach 0.10)
4.2 Further Evidence of the Cool to be Smart Mechanism: Heterogeneity by
Grades
The model in Section 2 also makes a direct prediction about how student ability, ai, should affect
signup under our proposed cool-to-be-smart mechanism (the smart-to-be-cool mechanism does not
depend on ai). If indeed students are trying to signal that they are high ability in the cool-to-
be-smart schools, then a higher probability of revealing the diagnostic test score should be more
likely to dissuade low-performing students from signing up for the package in comparison to high-
performing students. The intuition is simple: if students know their own ability, those with lower
grades will be more afraid of disclosing information about their ability, which will happen if they
win the package and their diagnostic test score is revealed. This fear is less likely to affect students
with higher grades.
We can test this prediction directly. In the form following the signup decision, we collected
38The one exception is the coefficient for the smart-to-be-cool school when individual covariates are added and thewild cluster bootstrap standard errors are used, where the p-value is 0.017.
20
self-reported information about students’ grades, which are a good proxy for ai. Students were
asked: “In general, how are your grades?” and were given five options to choose one from: “a)
Mostly A’s; b) Mostly A’s and B’s; c) Mostly B’s and C’s; d) Mostly C’s and D’s; e) Mostly D’s
and F’s.” In the cool-to-be-smart schools, 49% of students picked options a) or b). We therefore
split the sample between those who picked one of these two options and those who picked one of
the remaining three options, thus getting as close as possible to a median split.
In the top panel of Figure 4, we restrict the sample to the public condition in the cool-to-be-
smart schools. The figure displays the effect of changing the probability of winning the lottery on
the signup rates, splitting the sample between students below (left-hand side) and above (right-
hand side) the median in terms of their grades. As expected by the theory, for students with grades
below the median, there is a substantial drop in the signup rate when the probability of getting the
package – and thus revealing the diagnostic test score – goes up. The signup rate under p = 0.25 is
67% and the signup rate under p = 0.75 is 22% (the p-value of the difference is 0.000). For students
with grades above the median, we observe a considerably smaller decrease in signup rates when
the probability is higher: from 66% to 51% (p=0.243). The drop in signup for students below the
median is significantly larger than for those above the median (p=0.074). The difference in the
responses of the two groups is large and striking, and consistent with our proposed mechanism.
Under the proposed mechanism, p is not expected in the private condition to have a differential
effect on the signup rate by the ability level of the student. The bottom panel of Figure 4 confirms
this prediction. We find no effect of p for either students above or below the median in terms of
grades: signup rates are all around 80%. Table 4 reproduces the results of Figure 4 in regression
form and confirms the conclusions from the visual evidence.39
Figure 5 shows that the same pattern does not hold in the smart-to-be-cool school.40 Comparing
low vs. high grade students, we cannot reject that p has the same effect on signup in both the
private and public conditions.41 Table 5 again confirms the visual evidence with corresponding
regressions.
39We regress Signupi,j = β0+β1High probabilityi,j+β2High probabilityi,j×Low Gradesi,j+β3Low probabilityi,j×Low Gradesi,j + εi,j , j ∈ {public, private}. In this regression, β3 − β2 − β1 is the difference in singup rates betweenhigh and low probability for students with grades below the median, and β3 − β2 is the same difference minus thecorresponding difference for students with above median grades.
40It is more difficult to attain a median split in the smart-to-be-cool school, (we come closest using the samecriterion as in the cool-to-be-smart schools, with 28% of students reporting either mostly A’s or mostly A’s and B’s).
41A higher p is associated with a statistically significant increase in signup in the public treatment for students withbelow median grades. However, we cannot reject that the effect is the same for students with above median grades.And note that in both cases, a higher p is associated with an increase in signup, the opposite of our cool-to-be-smartmechanism. Again, when signup is public, students in smart-to-be-cool schools are only willing to incur the stigmacosts of signing up when the expected payoff is greater, and this effect appears to be independent of grades.
21
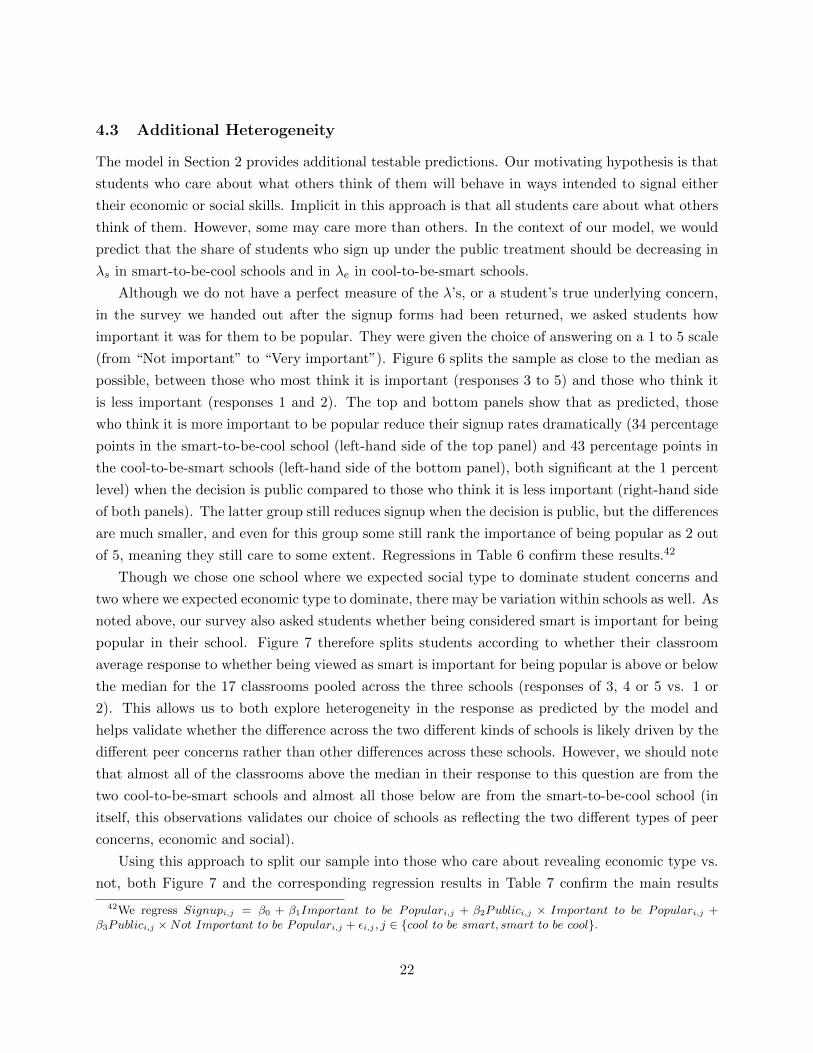
4.3 Additional Heterogeneity
The model in Section 2 provides additional testable predictions. Our motivating hypothesis is that
students who care about what others think of them will behave in ways intended to signal either
their economic or social skills. Implicit in this approach is that all students care about what others
think of them. However, some may care more than others. In the context of our model, we would
predict that the share of students who sign up under the public treatment should be decreasing in
λs in smart-to-be-cool schools and in λe in cool-to-be-smart schools.
Although we do not have a perfect measure of the λ’s, or a student’s true underlying concern,
in the survey we handed out after the signup forms had been returned, we asked students how
important it was for them to be popular. They were given the choice of answering on a 1 to 5 scale
(from “Not important” to “Very important”). Figure 6 splits the sample as close to the median as
possible, between those who most think it is important (responses 3 to 5) and those who think it
is less important (responses 1 and 2). The top and bottom panels show that as predicted, those
who think it is more important to be popular reduce their signup rates dramatically (34 percentage
points in the smart-to-be-cool school (left-hand side of the top panel) and 43 percentage points in
the cool-to-be-smart schools (left-hand side of the bottom panel), both significant at the 1 percent
level) when the decision is public compared to those who think it is less important (right-hand side
of both panels). The latter group still reduces signup when the decision is public, but the differences
are much smaller, and even for this group some still rank the importance of being popular as 2 out
of 5, meaning they still care to some extent. Regressions in Table 6 confirm these results.42
Though we chose one school where we expected social type to dominate student concerns and
two where we expected economic type to dominate, there may be variation within schools as well. As
noted above, our survey also asked students whether being considered smart is important for being
popular in their school. Figure 7 therefore splits students according to whether their classroom
average response to whether being viewed as smart is important for being popular is above or below
the median for the 17 classrooms pooled across the three schools (responses of 3, 4 or 5 vs. 1 or
2). This allows us to both explore heterogeneity in the response as predicted by the model and
helps validate whether the difference across the two different kinds of schools is likely driven by the
different peer concerns rather than other differences across these schools. However, we should note
that almost all of the classrooms above the median in their response to this question are from the
two cool-to-be-smart schools and almost all those below are from the smart-to-be-cool school (in
itself, this observations validates our choice of schools as reflecting the two different types of peer
concerns, economic and social).
Using this approach to split our sample into those who care about revealing economic type vs.
not, both Figure 7 and the corresponding regression results in Table 7 confirm the main results
42We regress Signupi,j = β0 + β1Important to be Populari,j + β2Publici,j × Important to be Populari,j +β3Publici,j ×Not Important to be Populari,j + εi,j , j ∈ {cool to be smart, smart to be cool}.
22
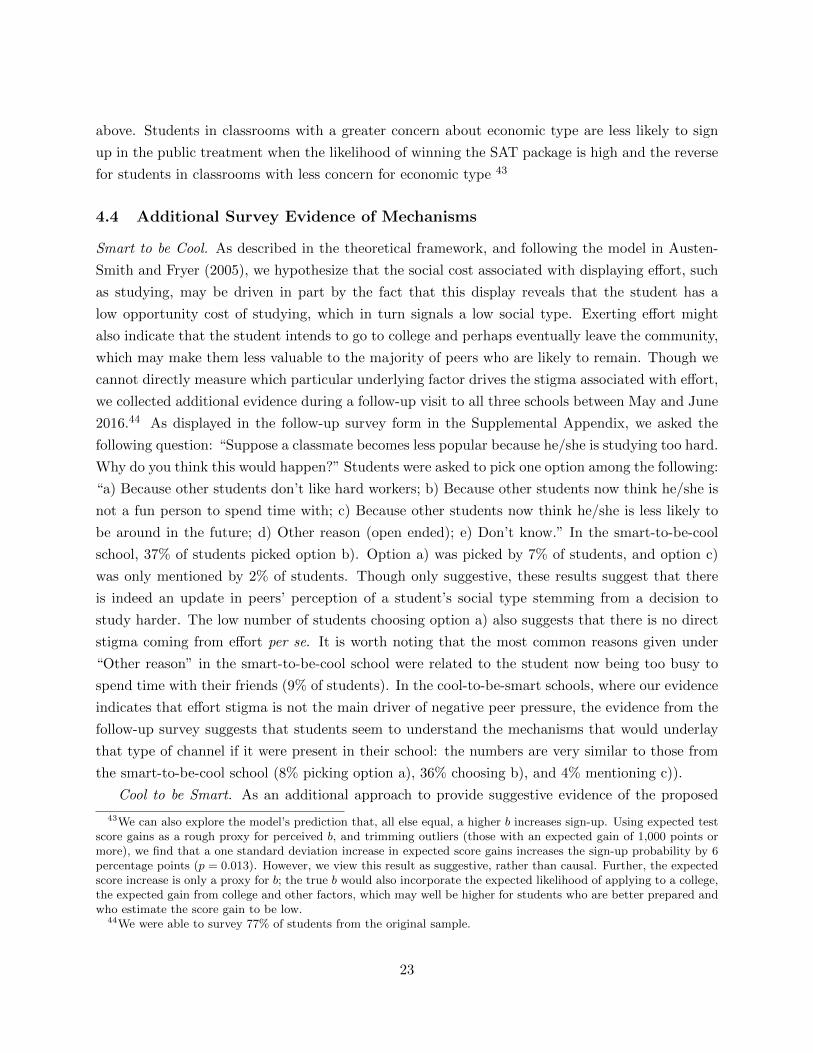
above. Students in classrooms with a greater concern about economic type are less likely to sign
up in the public treatment when the likelihood of winning the SAT package is high and the reverse
for students in classrooms with less concern for economic type 43
4.4 Additional Survey Evidence of Mechanisms
Smart to be Cool. As described in the theoretical framework, and following the model in Austen-
Smith and Fryer (2005), we hypothesize that the social cost associated with displaying effort, such
as studying, may be driven in part by the fact that this display reveals that the student has a
low opportunity cost of studying, which in turn signals a low social type. Exerting effort might
also indicate that the student intends to go to college and perhaps eventually leave the community,
which may make them less valuable to the majority of peers who are likely to remain. Though we
cannot directly measure which particular underlying factor drives the stigma associated with effort,
we collected additional evidence during a follow-up visit to all three schools between May and June
2016.44 As displayed in the follow-up survey form in the Supplemental Appendix, we asked the
following question: “Suppose a classmate becomes less popular because he/she is studying too hard.
Why do you think this would happen?” Students were asked to pick one option among the following:
“a) Because other students don’t like hard workers; b) Because other students now think he/she is
not a fun person to spend time with; c) Because other students now think he/she is less likely to
be around in the future; d) Other reason (open ended); e) Don’t know.” In the smart-to-be-cool
school, 37% of students picked option b). Option a) was picked by 7% of students, and option c)
was only mentioned by 2% of students. Though only suggestive, these results suggest that there
is indeed an update in peers’ perception of a student’s social type stemming from a decision to
study harder. The low number of students choosing option a) also suggests that there is no direct
stigma coming from effort per se. It is worth noting that the most common reasons given under
“Other reason” in the smart-to-be-cool school were related to the student now being too busy to
spend time with their friends (9% of students). In the cool-to-be-smart schools, where our evidence
indicates that effort stigma is not the main driver of negative peer pressure, the evidence from the
follow-up survey suggests that students seem to understand the mechanisms that would underlay
that type of channel if it were present in their school: the numbers are very similar to those from
the smart-to-be-cool school (8% picking option a), 36% choosing b), and 4% mentioning c)).
Cool to be Smart. As an additional approach to provide suggestive evidence of the proposed
43We can also explore the model’s prediction that, all else equal, a higher b increases sign-up. Using expected testscore gains as a rough proxy for perceived b, and trimming outliers (those with an expected gain of 1,000 points ormore), we find that a one standard deviation increase in expected score gains increases the sign-up probability by 6percentage points (p = 0.013). However, we view this result as suggestive, rather than causal. Further, the expectedscore increase is only a proxy for b; the true b would also incorporate the expected likelihood of applying to a college,the expected gain from college and other factors, which may well be higher for students who are better prepared andwho estimate the score gain to be low.
44We were able to survey 77% of students from the original sample.
23
mechanism, in the follow up survey we asked the following question: “Now suppose a classmate
becomes more popular because he/she is studying too hard. Why do you think this would happen?”
Students were asked to pick one option from among the following: “a) Because other students
admire hard workers; b) Because other students now think he/she is a smart person and they
admire smart people; c) Because other students now think they can get help in their studying from
him/her; d) Other reason: (open ended); e) Don’t know.” In the cool-to-be-smart schools, 58%
of students picked either options a) or b) (29% for each option), and 21% picked option c). In
the smart-to-be-cool school, 17% picked option a), 20% chose b), and 30% chose option c. These
numbers are again merely suggestive, but they are consistent with the hypothesis of a culture that
supports hard work and being smart in the cool-to-be-smart schools.
4.5 Further Evaluating the Stakes: Impact on the Likelihood of Taking the SAT
The main objective of our paper is to test for mechanisms underlying negative peer pressure. For
this purpose, the signup decision is the appropriate outcome to examine. However, as an additional
way to evaluate the stakes of that decision, we revisited the three schools between late May and
early June 2016, right before the end of the academic year. Students were asked to report whether
they had already taken the SAT (or the ACT, though the vast majority choose the SAT), their
score (if they already had one), whether they were planning to take one of the exams, and if so,
when. Our goal is to assess whether the SAT prep package we offered had an impact on actual
or anticipated college entrance exam taking. It is important to note however that in analyzing
these outcomes, the effective assignment to different treatments is likely to be weakened due to
contamination of the treatment groups, since students in the different treatments are likely to have
discussed the offer with each other after our team left the classroom.45 Additionally, once students
can communicate, other types of peer effects could be triggered, such as social learning.
In Table 8, we present the effects on longer-term outcomes. In panel A, we restrict our sample
to students in the private condition, across all schools. As discussed earlier, we observe similar
signup rates in the private condition across the two levels of p. In fact, we also observe a similar
selection of students that sign up in the private condition across the two levels of p. Individual
characteristics are balanced for students who sign up in the private condition for p = 0.75 and
p = 0.25 (results available upon request). We can therefore examine the reduced-form impact of
p (the probability of winning the SAT package) in the private condition on longer-term outcomes.
In the first three columns of Panel A, we analyze the effect of a higher p on the probability that a
student reported to have already taken the SAT (or ACT) by the time of our follow-up visit. We
find evidence of a marginally significant, positive effect of over 10 percentage points. This amounts
to a 40–50% increase in the probability of signup in the low probability group. A sizable share
45This contamination would bias estimates towards zero, suggesting if anything that our results are an underesti-mate of the true effect.
24
of students take the SAT on the first June test date, which was a few days after our visit. We
therefore create another dummy variable for whether the student has already taken the SAT or
plans to take it on that date, which is the last SAT exam date during the academic year. Here we
also find significant increases in that likelihood for students assigned to the higher probability of
getting the prep package.46
In Panel B, we examine the same outcomes, but focus instead of the effect of the private
condition compared to the public: by how much are these outcomes changed when the effects
of peer pressure are turned off during the signup stage? This comparison would be relevant for
evaluating the reduced-form effects of a policy that made signup private. For the outcomes in
columns 1–3, we observe an increase of about 8 percentage points (or a 30% increase) in the
probability of reporting to have already taken a college admissions test by the time of the visit.
For the second outcome (columns 4–6), we also observe a large and significant increase.
Finally, in Panel C, we restrict our sample to those students who signed up for the lottery in
the private condition, and compare the SAT-taking behavior of lottery winners and losers. Here
again we find very large and statistically significant effects. Lottery winners are 15 to 17 percentage
points more likely to have taken the SAT by the time of our return visit, a gain of 60–70% relative
to lottery losers. The point estimates are slightly smaller, though still fairly large (13 percentage
points) when we also include students who report planning to take the SAT instead of just those
who report having already taken it (the percent gains are also now smaller relative to the (increased)
mean for lottery losers, though they are still over 30%).
These results suggest that our intervention may have had longer-term effects, and again, that
peer pressure may have significant impacts on important investment behaviors or outcomes. How-
ever, in addition to the caveats mentioned above regarding loss of experimental control, we interpret
our findings with extra caution. Students can still take the SAT at a later date, so our measured
effect might just have been an increased likelihood of taking the test earlier (or, perhaps an indi-
cator of taking it more times rather than ever taking it). Further, the outcome is self-reported and
there may be a greater social-desirability bias in reporting for students who chose to take the prep
package or for those who won the lottery and gained access to it.
4.6 Empirical Challenges and Alternative Explanations
The evidence presented above suggests that in all three schools, social image concerns discourage
students from engaging in educational effort, at least in the form of preparing for the SAT (and,
possibly, taking it). Further, we argue that the differential effects of p in the smart-to-be-cool and
46Unfortunately, we can’t use test scores as an outcome. First, several students who had already taken a collegeadmissions test did not report their scores, either because they had not received them yet or because they chose notto report them. As a result, we end up with too few observations. Moreover, regressions using test scores would eitherbe conditional on the student having already taken the test (thus implying differential selection across treatments)or would bundle the intensive and extensive margins, making it difficult to isolate the intensive margin effect.
25
cool-to-be-smart schools allows us to identify the effort stigmatization mechanism in the former,
and the ability rewarding mechanism in the latter. We also show that other results support the
conclusion of our two mechanisms. In this section, we consider several empirical challenges and
alternative explanations for our results.
A. Prior information about ability and social type Our tests of these two mechanisms is pred-
icated on the assumption that students continue to take actions, even into the 11th grade, that
attempt to hide or signal something about their ability or social type. While one might argue that
if that were not the case, we should not expect the results we observe, an alternative interpretation
is that some other factor may be responsible for our results.
However, we find it quite reasonable that students still have only a very noisy signal of each
other’s abilities or social types. First, there is considerable student turnover in schools.47 Thus,
many students regularly start over with a blank slate and must newly establish their social and
economic type to their new peers. Even those students who do not move may face a considerable
influx of new classroom peers every year, for whom they have to newly establish their reputation.
And beyond mobility across schools, there may be turnover in classmates within the school. In
many high schools, students take different classes with different groups of students (for example,
because the same course may be offered during different periods of the day, plus students have some
choice of what courses to take, and because from year-to-year and sometimes even within years,
students move back and forth between remedial, regular and honors sections for different subjects).
Thus, students may regularly find themselves in a classroom with students they have not been with
before and therefore feel a need to regularly re-establish their reputation.
Second, even with a fixed set of peers, there may be secular, group-level changes that necessitate
renewed or ongoing signaling. For example, as students get older, the range and scale of social
opportunities generally increases. Accordingly, norms about social type may change or become
more salient, as may the average level of student concern about social type. Alternatively, as
students get closer to graduation and/or college, norms regarding economic type may change or at
least become more salient.
Beyond that, individual students may change over time. Student performance, used by peers
to infer ability, may fluctuate over time for reasons such as material becoming more difficult with
school progression (e.g, algebra in 9th grade vs. calculus in 11th), mean reversion, or difficulties in a
student’s home or personal life.48 Similarly, adolescence is a period in which personality, priorities,
47Most states do not track turnover, but the available evidence suggests that the rates are high. A GAO reportfound that over 90% of students switched schools (for reasons other than grade promotion) at least once betweenkindergarten and 8th grade, with nearly 2/3 having switched two or more times (GAO 2010). For Rhode Island,which does collect data on turnover, in several school districts (including Providence, the largest), over 25% of highschool students changed schools during the 2014-15 academic year alone (Providence Journal 2016). Annual turnoverrates like these repeated over many years could lead to considerable changes in one’s classmates. For example, areport for Washington D.C. finds that of 123 students graduating from one high school, only 27 (22%) were in thatschool at any point during their freshman year (Washington Post 2015).
48Related, people may just forget over time; a signal of high ability revealed in 9th grade may not be sufficient to
26
interests and behavior can change quite dramatically. A student’s true social type, or the social
type they want to be perceived as, may vary over time, requiring renewed signaling.
Finally, regarding ability specifically, the grouping of students into remedial, regular and honors
classes provides some rough information on ability, but more fine grained detail may not be known
within these classes (and it may be relative ability within a class type that is rewarded). For
example, a student in a regular class could possibly be a borderline remedial student or a borderline
honors student. Plus, when grades are kept private, as they are in U.S. high schools, and where
students are able to avoid situations in which ability may be revealed and can in fact potentially
deceive others (e.g., lying about their grades or saying that they found a difficult exam to be easy),
students may only have a noisy signal of each other’s ability.
Thus overall, between changes in peer group composition, group level changes, changes in
individual students, and the possibility that people forget over time, there may always be a need
for constant signaling to reinforce or re-establish one’s image or reputation. In fact, we believe that
the very importance and broader relevance of the mechanisms we consider is precisely the possibility
that, given how many behaviors may reveal ability or social type, students may regularly alter their
behavior with respect to important decisions that may influence learning or educational outcomes.
B. Signing up signals low income. An alternative explanation for the finding that signup is
lower when the decision is public is that signup may signal coming from a poor household, which
may itself be stigmatized. For example, wealthier students may not need the free course we offered
because they have other, more expensive prep options available to them.
However, for the smart-to-be-cool school, the median annual income is only $44,000, which is
quite low. Further, nearly three-quarters of students are eligible for free or reduced-price meals.
In a setting where the vast majority of students are low income, it seems unlikely that a norm of
stigmatizing others who are low income would take hold.49
Even in the cool-to-be-smart schools, the median income is only $66,000, which is still not very
high. But more importantly, if this alternative motive held in these schools, we would expect that
in the public condition, where signup is always revealed, the likelihood of signup should be greater
when the probability of winning the lottery is higher (students would be labeled as poor, and thus
incur the stigma cost, just for signing up; they should be more willing to incur this cost when the
expected benefit is greater). However, this is the opposite of what we observe in these schools.
C. Preference for privacy. A general preference for privacy could also cause students to be less
likely to sign up when the decision to do so is public. However, our test is driven by the response of
signup to varying the likelihood of winning the lottery (where signup itself is revealed in the public
sustain a reputation of high ability without additional reinforcement.49In addition, students may have more of a signal of each other’s income levels, which tend to be more visible
(clothing, laptop, phone, book bag, home, etc.; though of course, conspicuous consumption may be used as a wayto try to hide low income). And in some cases, students on free or reduced-cost lunch receive special tickets to payfor their meals and can also show up at school early for free breakfast (sometimes, free breakfast is even delivered tostudents in classrooms), which would be visible to others.
27
treatment regardless of whether the student wins), which would be harder for a general preference
for privacy to explain.50 Further, using a similar experiment, Bursztyn and Jensen (2015) find
that making signup public can increase or decrease signup, depending on which peers a student is
with at the time of signup and thus to whom their decision will be revealed; this suggests less of a
general concern over privacy and more a concern over differing directions of social pressures created
by different peer groups. Finally, to explain our results, the concern over privacy would also have
to vary with the forms of heterogeneity explored above, such as the importance of being popular.
D. Signup itself signals something about ability. The pattern of lower signup under the public
condition could arise if wanting the SAT prep package is seen as a sign of low ability (higher ability
students don’t need it), and low ability is stigmatized. However, we believe this is unlikely to
explain our key results. It is extremely common, if not nearly universal, to use some form of SAT
prep, even for high performing students. Further, Bursztyn and Jensen (2015) find that signup for
an SAT prep course is over 90 percent among students in honors classes, and does not vary with
whether the decision is public or private; the fact that so many high ability students sign up for
a course like this, and are just as willing to do so if their classmates will know, suggests that it is
unlikely that doing so would be interpreted as a sign of low ability.
The possibility that signup is instead a signal of high ability (only smart students would take
the SAT because they are the only ones who can get into college), and high ability is rewarded is
our proposed ability-rewarding mechanism. What remains is the possibility that signup is a signal
of high ability, which is stigmatized. This could help account for the result in the smart-to-be-cool
school that students are more willing to incur the stigma costs if the likelihood of winning the
course is high. In our data, there is no difference in the distribution of grades in the smart-to-be-
cool school between those who sign up and those who don’t in the public setting (in either lottery
case), which suggests that just signing up, without additional information, may not be taken as a
signal of high ability.51 However, we cannot rule out this possibility. Empirically, this hypothesis
would look similar to the “Acting White” hypothesis. With our setup, we cannot distinguish
whether SAT signup in smart-to-be-cool schools is lower when it is public, and increases with a
greater chance of winning the lottery, because peers punish effort (trying to get ahead or do well
in school), performance (actually doing well in school) or ability (just being smart), since all three
could be signaled by SAT taking. However, there is perhaps a unifying interpretation among the
three, namely that some factor that signals a low social type or a high likelihood of leaving the
community is stigmatized by peers.
E. Privacy with respect to parents, teachers or others. Although the signup form specifically
50Concern for privacy could be consistent with the results in the smart-to-be-cool schools (students are morewilling incur the loss of privacy when the chance of winning, and thus expected benefit, is greater), but not thecool-to-be-smart schools.
51Further, in principle a student could also sign up for the SAT prep course and deliberately do poorly on thediagnostic exam as a way to counter-signal against being high ability. However, this would perhaps require a lot offorethought by students at the moment of signup.
28
referenced privacy only with respect to classmates, it is possible that students may have also
mistakenly believed that the same guarantee applied to parents or teachers.52 We believe that
this is unlikely as a general phenomenon, since in both types of schools, signup was lower when
the decision was public, and it seems unlikely that parents, teachers or other school officials would
stigmatize or punish students for signing up for a free SAT prep package; if anything, they would
likely be disappointed if they learned that students did not sign up.53 However, it is possible that
believing that decisions will also be revealed to parents or teachers could negatively affect signup.
For example, students with poor grades may worry that teachers or parents will ridicule them for
imagining that they might be able to get into college. Or some parents may not want their child
to attend college (perhaps hoping they will join the family business or some career that does not
require college) or don’t want their children to get their hopes up because they can’t afford college.
We have no data on such cases, but believe they are not likely to be very widespread. Further,
Bursztyn and Jensen (2015) find that students taking both honors and non-honors classes respond
very differently to the decision being public when they are with their honors peers vs. their non-
honors peers. It is unlikely that they would make different inferences about whether their parents,
teachers or others would know about their signup just based on the peers they were sitting with at
the time they were asked. In addition, it seems unlikely that any perceived pressure from parents
or teachers would vary with the likelihood of winning the lottery, or the reported importance of
being popular.54
F. Ability to announce signup, winning the lottery and the diagnostic test score even in the
private setting. We cannot rule out that in the private setting, students could plan to reveal their
signup decision to their peers. This, however, should not invalidate the comparison between private
and public settings in either of the school types. In the private setting, all students who have a net
positive benefit from the prep package (i.e., those who are supposed to sign up in private setting)
would still sign up; some of them might disclose their grades and some would not, but in either
case signing up and not disclosing anything is better than not signing up and not disclosing. Thus,
on the margin, the decision to sign up would not be affected – even though the peers’ beliefs about
the students who eventually disclose and those who do not may be different.
Related, our model does not explicitly give the agents a choice not to take the test. However, if
this were an option, they would always take it. The reason is that the high social type would never
sign up anyway, and then within the low social type there would be unraveling: whoever wins but
does not take it is believed to be the worst economic type (among those who sign up). Given that
the test also has positive benefit, all agents would take the test if they sign up and win the lottery.
52If students believe that parents or teachers would be informed no matter what would be revealed to classmates, ornot informed no matter what, these effects would be differenced out when comparing the public vs. private regimes.
53Lower signup rates in the public condition would also then suggest that peer social pressure is even stronger thanour results indicate, since students overcome the possible costs they face from disappointing a parent or teacher bynot signing up.
54Though students who care more about being pleasing friends may also care more about pleasing others.
29
Thus, our model would predict the same relationship between the probability of winning and the
signup rate for each of the two mechanisms even if we allow for the possibility of not taking the
test. As such, our predictions do not hinge on any assumption about whether this is possible. This
implies that even if in real-life students can refuse to take the test, our experiment still tests the
predictions of our model.
5 Policy Implications and Conclusion
In this paper, we find strong evidence consistent with peer pressure. High school students are willing
to forgo educational investment opportunities due to concerns about how they will be perceived by
their classmates. We also show that such behavior can arise from two very different motives.
Although both mechanisms lead to underinvestment or lower effort, it is important for school
policy to understand which motive is operative. We consider a range of programs intended to
improve student achievement and how they may be affected by the prevailing peer culture.
Privacy of grades. In schools where the dominant peer culture is the fear of revealing a low
economic type, keeping grades and performance private is likely to be worthwhile. Otherwise, low
ability students may reduce effort in order to signal that they are cool rather than low ability.
However, in schools where the main worry is signaling a high social type, keeping grades private
could in fact be detrimental to performance. In general, not all educational effort or investments
students can make can be kept private. For example, students must raise their hand in class to
ask questions if they want to understand material better. Participation in academic clubs will also
be public. If students are going to face stigma costs for engaging in effort or investments, it would
in fact be preferable for these students to have their grades revealed, so they can at least get the
benefit of revealing a higher economic type. This also suggests that the emphasis on the privacy
of grades, common in the U.S. but less so elsewhere, which may have been a policy designed to
enhance performance at good schools, may in fact have a detrimental effect on performance in
worse schools.
Privacy of inputs or effort. By contrast to the recommendations regarding privacy of grades,
the exact opposite may apply when it comes to revealing inputs or effort in the two types of schools.
In schools where students care about signaling high ability, it might be desirable to make inputs
or effort as visible as possible. For example, students might be offered the opportunity to sign up
for optional or more advanced assignments, books or other materials in class by raising a hand
or putting their name on a sign up sheet. Classes might also post lists or create leaderboards
for those who read more books (either self-reported or verified by the teacher) or complete more
supplemental, extra assignments. Doing so would give low ability students more opportunities to
pool with the high ability students, rather than having to portray themselves as high social types.
But in schools where visible effort is stigmatized, making inputs as private as possible may induce
30
greater effort.
Incentives for effort or inputs. A number of recent policy experiments have provided financial
incentives for inputs such as reading books (see Fryer 2017 for discussion), and many schools have
begun implementing such policies. Although the success of such programs is mixed, the prevailing
peer culture may have implications for their effectiveness. For example, in smart-to-be-cool schools,
incentives may help students avoid the stigma of exerting effort. Students who are observed reading
a book or doing extra credit can claim that they are only doing so for the money, or they can use
the money to participate in something social, and thus maintain a high perceived social type even
while visibly exerting effort. By contrast, these programs may not be as effective in cool-to-be-
smart schools, or may even be counterproductive. For example, in the absence of such incentives,
reading extra books may be a way that low ability students try to signal high ability or pool with
high ability types, without the risk of actually revealing ability. Financial incentives may weaken
the signaling value of those actions, since others might think a student is just reading extra books
for the money, thereby possibly reducing effort.
Participation Mandates. Where effort is stigmatized, mandating participation in some activities
may be effective. For example, students will not be singled out for social stigma if they raise their
hand in class, attend a review session or take an SAT prep course if all students are required to
do so. On the other hand, where ability is stigmatized, mandatory participation in some activities
may have adverse affects for low ability students. Policies such as cold calling, group work or class
presentations may lead to worse outcomes for such students, who may be stigmatized, engage in
behaviors to avoid revealing low ability or otherwise go out of their way to signal a high social type.
Tracking. Although it is often thought that one negative aspect of sorting that affects low
ability students is that they lose out on the positive effects of having high ability peers, our results
for cool-to-be-smart schools suggest that high ability peers also have a negative effect on low ability
students because the latter will want to avoid revealing their low ability. Greater sorting by ability
may reduce the stigma of being the lowest ability person within a class; the more homogeneous the
ability and achievement levels are for students within a class, presumably the less stigma associated
with poor performance there will be. The implications for tracking in smart-to-be-cool schools is
more ambiguous. On the one hand, tracking may encourage effort by putting high performing
students together with other high performing students (and away from low performing students)
who may be less likely to stigmatize each other’s effort. On the other hand, being placed in a higher
performing track is likely to be visible to one’s peers and may itself be stigmatized.
Information or marketing campaigns to change peer cultures or attitudes. Schools often try to
deliver messages to students to encourage greater effort and performance. Understanding which
peer concern prevails in a particular school can help in the design of such campaigns or messaging,
by tailoring it to the specific peer concern that may be holding students back. This is particularly
important because targeting the wrong message could actually be counterproductive. For example,
31
trying to change attitudes so that doing well in school is rewarded rather than stigmatized (to
counter the “smart to be cool” norm) by emphasizing all of the positive things associated with
doing well, may actually increase the stigma associated with not doing well (creating or worsening
the “cool to be smart” norm). In fact, this presents a sobering possibility; attempts to counter one
form of negative peer social pressure may just lead to another form, without improving outcomes.
Labeling. Some programs may be labeled or marketed differently in the presence of these two
peer cultures. For example, teachers often make themselves available to students after class. When
such programs are labeled as extra help, attending will be perceived as a sign of low ability. Calling
such programs advanced material or enrichment might reverse some of that stigma in cool-to-be-
smart schools. But in schools where effort is stigmatized, the exact opposite may hold. Calling
them advanced might make them more stigmatized (there may be less stigma associated with efforts
to make sure a student isn’t failing vs. optional efforts to go beyond what is required for class).
Thus, although policy should of course not be guided by one principle alone, understanding the
underlying peer culture would suggest the following recommendations. In cool-to-be-smart schools,
preferred policies might include: marketing campaigns that destigmatize poor performance; labeling
extra help programs as advanced material or enrichment; keeping grades and honors rolls private;
making effort visible; not providing financial incentives for student effort or inputs; and using fewer
mandates. In smart-to-be-cool schools, preferred policies might include: marketing programs that
try to destigmatize effort and doing well in school (or emphasizing the future benefits of schooling);
avoiding labeling programs as advanced material or enrichment; providing incentives for effort, but
otherwise making effort less visible; using participation mandates; and tracking.
Even when the same recommendations would hold for both types of school cultures, it is still
valuable just to recognize when observability affects effort. For example, as noted, teachers often
offer extra help or tutoring to some students after school. Attending such a meeting, even when it is
just one-on-one with the teacher, may be visible to peers. In cool-to-be-smart schools, such sessions
might be taken as a signal of low ability, reducing students’ willingness to attend. In smart-to-be-
cool schools, willingness to attend maybe be low because it is seen as exerting effort or revealing
a low social type. In both settings, students may be more likely to attend if teachers are able to
offer sessions to students privately or remotely, such as through phones, tablets or desktop-based
video chat services.
As a final point, beyond these policy implications, we wish to note that although we focus on
SAT test prep, our model and results may have implications for understanding a wider range of
student behaviors. For example, in light of our finding that students in cool-to-be smart schools
attempt to avoid revealing low ability, one might imagine that students could act out, engage in
self-handicapping behavior (for example, visibly undertaking social activities in order to have an
excuse for not doing well), skip classes (to avoid being called on, or when one has to make a
presentation in front of the class) or even potentially drop out, due to such motives. Similarly, in
32
smart-to-be-cool schools, students who are making effort or performing well may engage in other
risky activities (skipping class, using alcohol, tobacco or drugs, being disruptive in class) as a way of
counter-signaling their social type. While this is not to suggest that all of these behaviors are driven
by peer social motives, our empirical support for these motives suggests that additional study of
the role they may play in these other behaviors is warranted. And as above, understanding the
underlying mechanism is likely to be important for designing policies to address these behaviors.
33
References
[1] Acemoglu, Daron and Matthew O. Jackson (2017). “Social Norms and the Enforcement of
Laws,” Journal of the European Economic Association, 15(2), p. 245-295.
[2] Akerlof, George A and Rachel E Kranton (2000). “Economics and Identity,” Quarterly Journal
of Economics, 115 (3), p. 715-753.
[3] Akerlof, George A and Rachel E Kranton (2010). Identity Economics: How Our Identities
Shape Our Work, Wages, and Well-Being, Princeton University Press.
[4] Ariely, Dan, Anat Bracha, and Stephan Meier (2009). “Doing Good or Doing Well? Image
Motivation and Monetary Incentives in Behaving Prosocially,” American Economic Review,
99(1), p. 544-555.
[5] Ashraf, Nava, Oriana Bandiera, and Kelsey Jack (2014). “No Margin, No Mission? A Field
Experiment on Incentives for Public Services Delivery.” Journal of Public Economics, 120, p.
1-17.
[6] Ashraf, Nava, Oriana Bandiera, and Scott S. Lee (2014). “Awards Unbundled: Evidence from
a Natural Field Experiment.” Journal of Economic Behavior & Organization, 100, p. 44-63.
[7] Austen-Smith, David and Roland Fryer (2005). “An Economic Analysis of Acting White,’”
Quarterly Journal of Economics, 120(2), p. 551-583.
[8] Ausubel, David (1977). Maori Youth: A Psychoethnological Study of Cultural Deprivation.
Massachusetts: The Christopher Publishing House.
[9] Bagwell, Laurie Simon and B. Douglas Bernheim (1996). “Veblen Effects in a Theory of Con-
spicuous Consumption,” American Economic Review, 86 (3), p. 349-73.
[10] Benabou, Roland and Jean Tirole (2006). “Incentives and Prosocial Behavior,” American
Economic Review, 96 (5), p. 1652-1678.
[11] Benabou, Roland and Jean Tirole (2011). “Laws and Norms,” NBER Working Paper No.
17579.
[12] Berman, Eli (2000). “Sect, Subsidy, and Sacrifice: An Economist’s View of Ultra-Orthodox
Jews,” Quarterly Journal of Economics, 115(3), p. 905-953.
[13] Bernheim, B Douglas (1994). “A Theory of Conformity,” Journal of Political Economy, 102
(5), p. 841-77.
34
[14] Blackwell, Lisa S., Kali H. Trzesniewski and Carol S. Dweck (2007). “Implicit Theories of
Intelligence Predict Achievement Across an Adolescent Transition: A Longitudinal Study and
an Intervention,” Child Development, 78(1), p. 246-263.
[15] Briggs, Derek C. (2009). Preparation for College Admission Exams, National Association for
College Admissions Counseling Discussion Paper.
[16] Bursztyn, Leonardo, Florian Ederer, Bruno Ferman, and Noam Yuchtman (2014). “Under-
standing Mechanisms Underlying Peer Effects,” Econometrica, 82(4), p. 1273-1301.
[17] Bursztyn, Leonardo and Robert Jensen (2015). “How Does Peer Pressure Affect Educational
Investments?,” Quarterly Journal of Economics, 130(3), p. 1329-1367.
[18] Bursztyn, Leonardo and Robert Jensen (2017). “Social Image and Economic Behavior in the
Field: Identifying, Understanding and Shaping Social Pressure,” Annual Review of Economics,
Vol. 9, p. 131-153.
[19] Carrell, Scott E., Richard L. Fullerton, and James E. West (2009). “Does Your Cohort Matter?
Measuring Peer Effects in College Achievement,” Journal of Labor Economics, 27, p. 439-464.
[20] Carrell, Scott E., Bruce I. Sacerdote, and James E. West (2013). “From Natural Variation to
Optimal Policy? The Lucas Critique Meets Peer Effects,” Econometrica, 81, p. 855-882.
[21] Chandrasekhar, Arun G., Benjamin Golub and He Yang (2016). “Signaling, Stigma, and Si-
lence in Social Learning,” manuscript.
[22] Charles, Kerwin K., Erik Hurst, and Nikolai Roussanov (2009). “Conspicuous Consumption
and Race,” Quarterly Journal of Economics, 124(2), p. 425-467.
[23] Cho, In-Koo, and David M. Kreps (1987). “Signaling Games and Stable Equilibria,” Quarterly
Journal of Economics, 102(2), p.79-221.
[24] Coleman, James (1961). The Adolescent Society: The Social Life of the Teenager and Its
Impact on Education. Glencoe, IL: Free Press.
[25] DellaVigna, Stefano, John A. List and Ulrike Malmendier (2012). “Testing for Altruism and
Social Pressure in Charitable Giving,” Quarterly Journal of Economics, 127(1), p. 1-56.
[26] DellaVigna, Stefano, John A. List, Ulrike Malmendier, and Gautam Rao (2017). “Voting to
Tell Others,” Review of Economic Studies, 84(1), p. 143-181.
[27] Dobbie, Will, and Roland G. Fryer, Jr. (2011). “Are High-Quality Schools Enough to In-
crease Achievement among the Poor? Evidence from the Harlem Children?s Zone,” American
Economic Journal: Applied Economics, 3, p. 158-187.
35
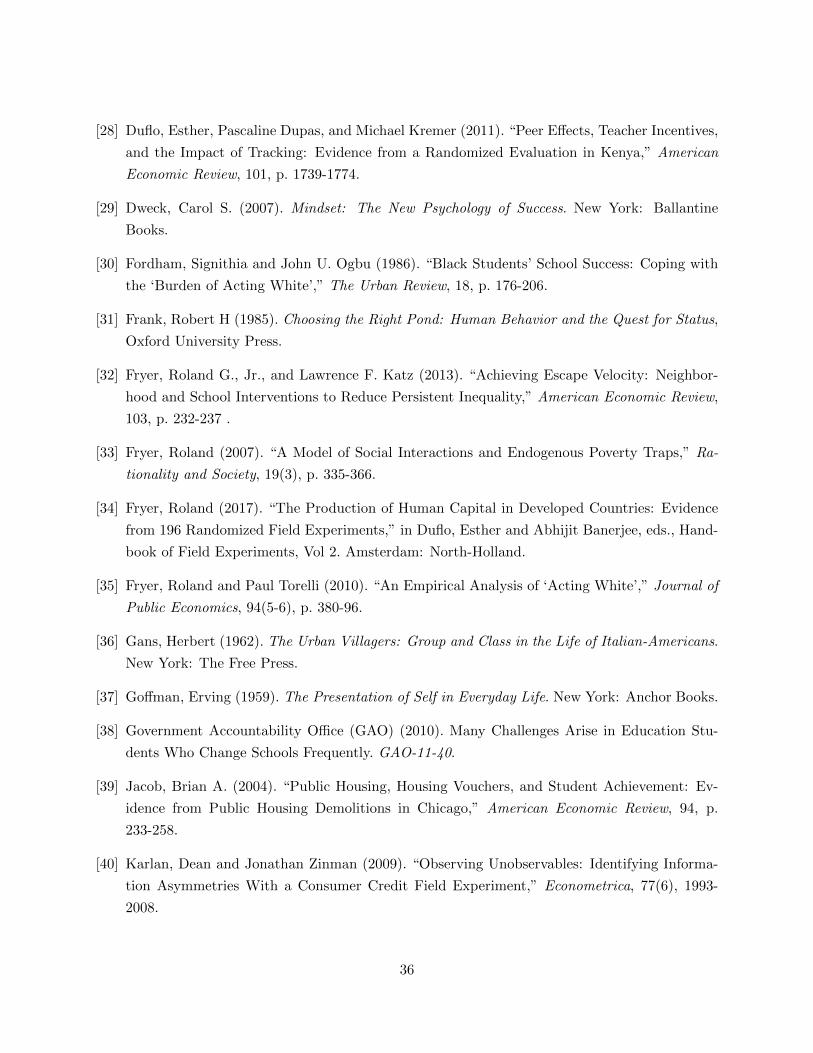
[28] Duflo, Esther, Pascaline Dupas, and Michael Kremer (2011). “Peer Effects, Teacher Incentives,
and the Impact of Tracking: Evidence from a Randomized Evaluation in Kenya,” American
Economic Review, 101, p. 1739-1774.
[29] Dweck, Carol S. (2007). Mindset: The New Psychology of Success. New York: Ballantine
Books.
[30] Fordham, Signithia and John U. Ogbu (1986). “Black Students’ School Success: Coping with
the ‘Burden of Acting White’,” The Urban Review, 18, p. 176-206.
[31] Frank, Robert H (1985). Choosing the Right Pond: Human Behavior and the Quest for Status,
Oxford University Press.
[32] Fryer, Roland G., Jr., and Lawrence F. Katz (2013). “Achieving Escape Velocity: Neighbor-
hood and School Interventions to Reduce Persistent Inequality,” American Economic Review,
103, p. 232-237 .
[33] Fryer, Roland (2007). “A Model of Social Interactions and Endogenous Poverty Traps,” Ra-
tionality and Society, 19(3), p. 335-366.
[34] Fryer, Roland (2017). “The Production of Human Capital in Developed Countries: Evidence
from 196 Randomized Field Experiments,” in Duflo, Esther and Abhijit Banerjee, eds., Hand-
book of Field Experiments, Vol 2. Amsterdam: North-Holland.
[35] Fryer, Roland and Paul Torelli (2010). “An Empirical Analysis of ‘Acting White’,” Journal of
Public Economics, 94(5-6), p. 380-96.
[36] Gans, Herbert (1962). The Urban Villagers: Group and Class in the Life of Italian-Americans.
New York: The Free Press.
[37] Goffman, Erving (1959). The Presentation of Self in Everyday Life. New York: Anchor Books.
[38] Government Accountability Office (GAO) (2010). Many Challenges Arise in Education Stu-
dents Who Change Schools Frequently. GAO-11-40.
[39] Jacob, Brian A. (2004). “Public Housing, Housing Vouchers, and Student Achievement: Ev-
idence from Public Housing Demolitions in Chicago,” American Economic Review, 94, p.
233-258.
[40] Karlan, Dean and Jonathan Zinman (2009). “Observing Unobservables: Identifying Informa-
tion Asymmetries With a Consumer Credit Field Experiment,” Econometrica, 77(6), 1993-
2008.
36
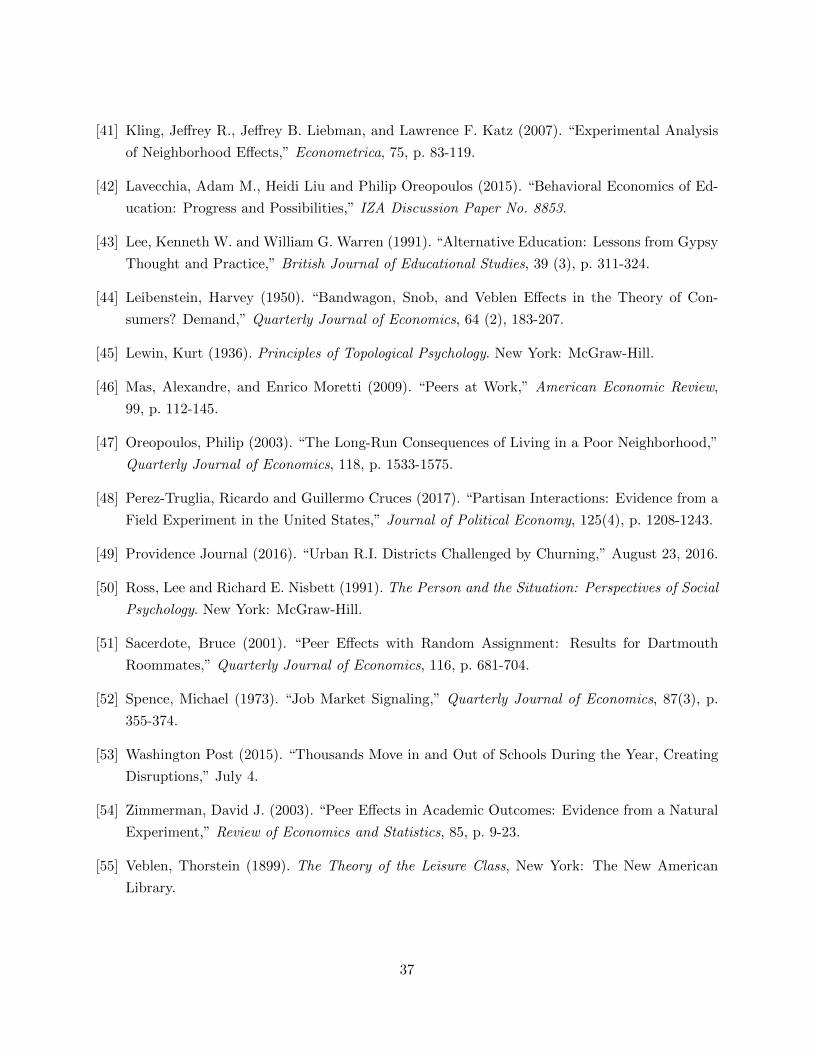
[41] Kling, Jeffrey R., Jeffrey B. Liebman, and Lawrence F. Katz (2007). “Experimental Analysis
of Neighborhood Effects,” Econometrica, 75, p. 83-119.
[42] Lavecchia, Adam M., Heidi Liu and Philip Oreopoulos (2015). “Behavioral Economics of Ed-
ucation: Progress and Possibilities,” IZA Discussion Paper No. 8853.
[43] Lee, Kenneth W. and William G. Warren (1991). “Alternative Education: Lessons from Gypsy
Thought and Practice,” British Journal of Educational Studies, 39 (3), p. 311-324.
[44] Leibenstein, Harvey (1950). “Bandwagon, Snob, and Veblen Effects in the Theory of Con-
sumers? Demand,” Quarterly Journal of Economics, 64 (2), 183-207.
[45] Lewin, Kurt (1936). Principles of Topological Psychology. New York: McGraw-Hill.
[46] Mas, Alexandre, and Enrico Moretti (2009). “Peers at Work,” American Economic Review,
99, p. 112-145.
[47] Oreopoulos, Philip (2003). “The Long-Run Consequences of Living in a Poor Neighborhood,”
Quarterly Journal of Economics, 118, p. 1533-1575.
[48] Perez-Truglia, Ricardo and Guillermo Cruces (2017). “Partisan Interactions: Evidence from a
Field Experiment in the United States,” Journal of Political Economy, 125(4), p. 1208-1243.
[49] Providence Journal (2016). “Urban R.I. Districts Challenged by Churning,” August 23, 2016.
[50] Ross, Lee and Richard E. Nisbett (1991). The Person and the Situation: Perspectives of Social
Psychology. New York: McGraw-Hill.
[51] Sacerdote, Bruce (2001). “Peer Effects with Random Assignment: Results for Dartmouth
Roommates,” Quarterly Journal of Economics, 116, p. 681-704.
[52] Spence, Michael (1973). “Job Market Signaling,” Quarterly Journal of Economics, 87(3), p.
355-374.
[53] Washington Post (2015). “Thousands Move in and Out of Schools During the Year, Creating
Disruptions,” July 4.
[54] Zimmerman, David J. (2003). “Peer Effects in Academic Outcomes: Evidence from a Natural
Experiment,” Review of Economics and Statistics, 85, p. 9-23.
[55] Veblen, Thorstein (1899). The Theory of the Leisure Class, New York: The New American
Library.
37
Figures and Tables
Figure 1: Comparative Statics of the Model
38
Figure 2: Effect of Public Treatment on Signup Decision
79% 53% 80% 53%
p-value=0.000 p-value=0.000
Smart-to-be-Cool School Cool-to-be-Smart Schools0
.1.2
.3.4
.5.6
.7.8
.91
Sign
-up
rate
Private Public Private PublicGroup
Notes: This figure presents the means and 95% confidence intervals of the signup rates for studentsin the private and public conditions, across all schools. There are 511 observations in total, 257 inthe smart-to-be-cool school and 254 in the cool-to-be-smart schools. The p-value in the left panelis drawn from the specification in column 1 of Table 2 with robust standard errors. The p-value inthe right panel is drawn from the specification in column 4 of Table 2 with robust standard errors.
39
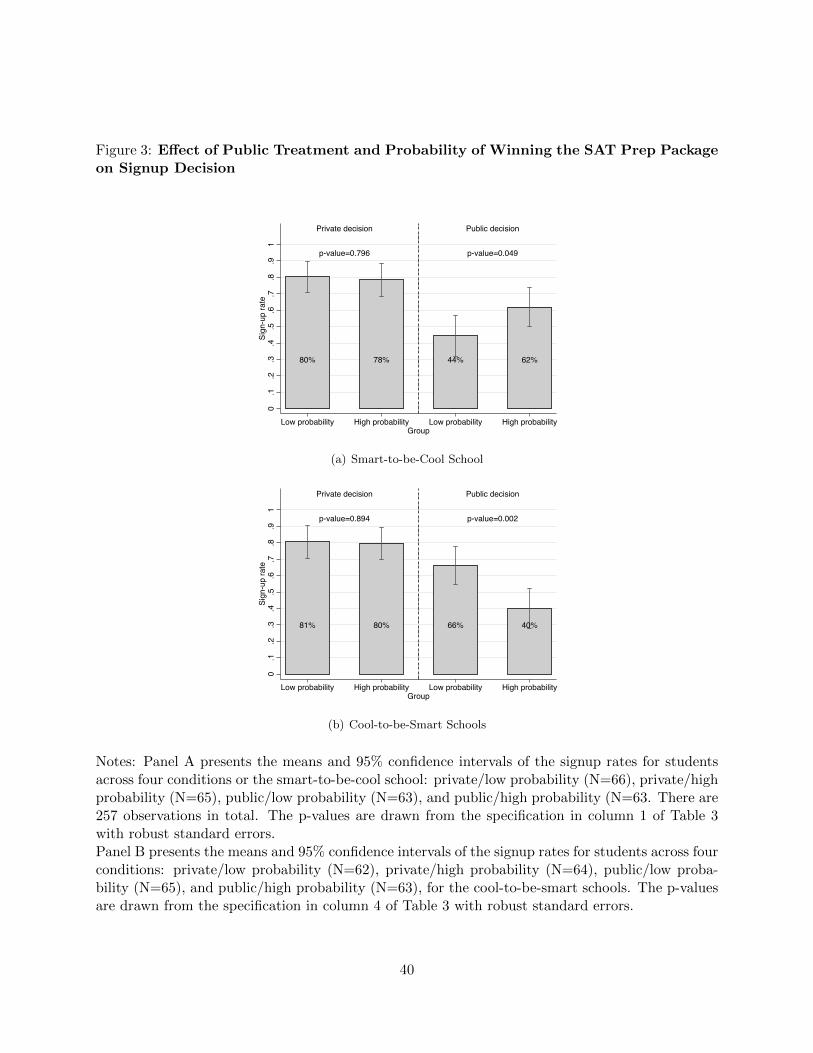
Figure 3: Effect of Public Treatment and Probability of Winning the SAT Prep Packageon Signup Decision
80% 78% 44% 62%
p-value=0.796 p-value=0.049
Private decision Public decision
0.1
.2.3
.4.5
.6.7
.8.9
1Si
gn-u
p ra
te
Low probability High probability Low probability High probabilityGroup
(a) Smart-to-be-Cool School
81% 80% 66% 40%
p-value=0.894 p-value=0.002
Private decision Public decision
0.1
.2.3
.4.5
.6.7
.8.9
1Si
gn-u
p ra
te
Low probability High probability Low probability High probabilityGroup
(b) Cool-to-be-Smart Schools
Notes: Panel A presents the means and 95% confidence intervals of the signup rates for studentsacross four conditions or the smart-to-be-cool school: private/low probability (N=66), private/highprobability (N=65), public/low probability (N=63), and public/high probability (N=63. There are257 observations in total. The p-values are drawn from the specification in column 1 of Table 3with robust standard errors.Panel B presents the means and 95% confidence intervals of the signup rates for students across fourconditions: private/low probability (N=62), private/high probability (N=64), public/low proba-bility (N=65), and public/high probability (N=63), for the cool-to-be-smart schools. The p-valuesare drawn from the specification in column 4 of Table 3 with robust standard errors.
40
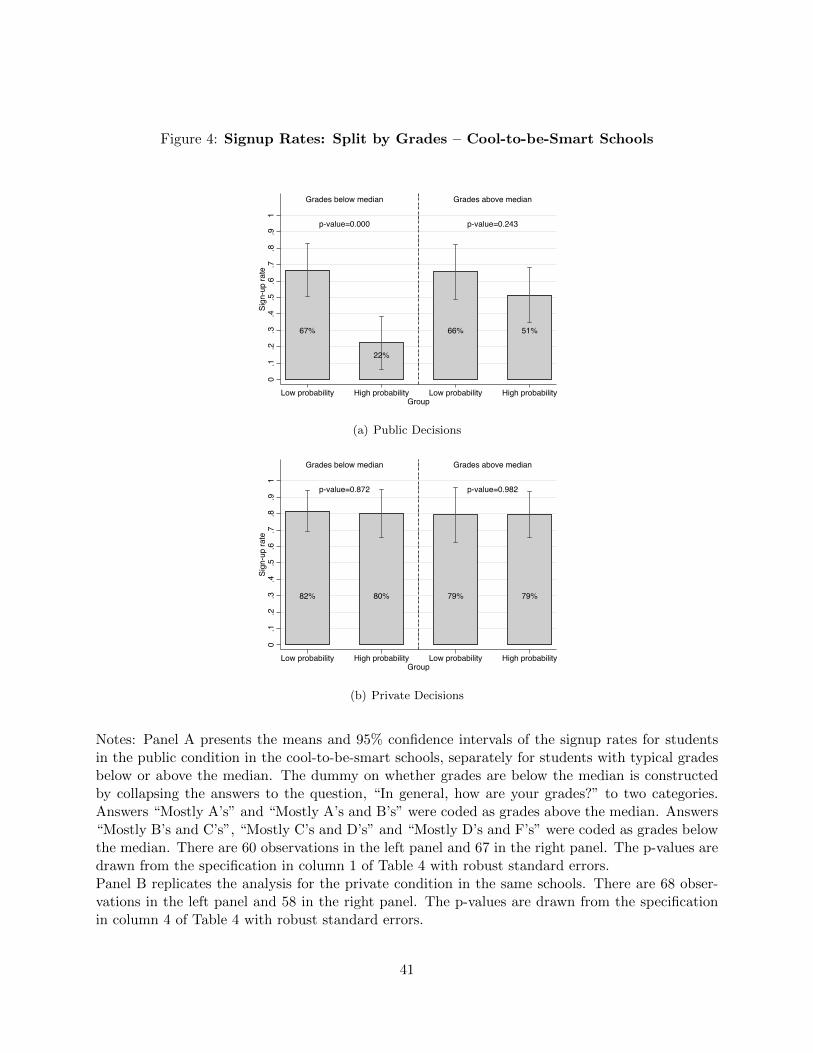
Figure 4: Signup Rates: Split by Grades – Cool-to-be-Smart Schools
67%
22%
66% 51%
p-value=0.000 p-value=0.243
Grades below median Grades above median
0.1
.2.3
.4.5
.6.7
.8.9
1Si
gn-u
p ra
te
Low probability High probability Low probability High probabilityGroup
(a) Public Decisions
82% 80% 79% 79%
p-value=0.872 p-value=0.982
Grades below median Grades above median
0.1
.2.3
.4.5
.6.7
.8.9
1Si
gn-u
p ra
te
Low probability High probability Low probability High probabilityGroup
(b) Private Decisions
Notes: Panel A presents the means and 95% confidence intervals of the signup rates for studentsin the public condition in the cool-to-be-smart schools, separately for students with typical gradesbelow or above the median. The dummy on whether grades are below the median is constructedby collapsing the answers to the question, “In general, how are your grades?” to two categories.Answers “Mostly A’s” and “Mostly A’s and B’s” were coded as grades above the median. Answers“Mostly B’s and C’s”, “Mostly C’s and D’s” and “Mostly D’s and F’s” were coded as grades belowthe median. There are 60 observations in the left panel and 67 in the right panel. The p-values aredrawn from the specification in column 1 of Table 4 with robust standard errors.Panel B replicates the analysis for the private condition in the same schools. There are 68 obser-vations in the left panel and 58 in the right panel. The p-values are drawn from the specificationin column 4 of Table 4 with robust standard errors.
41
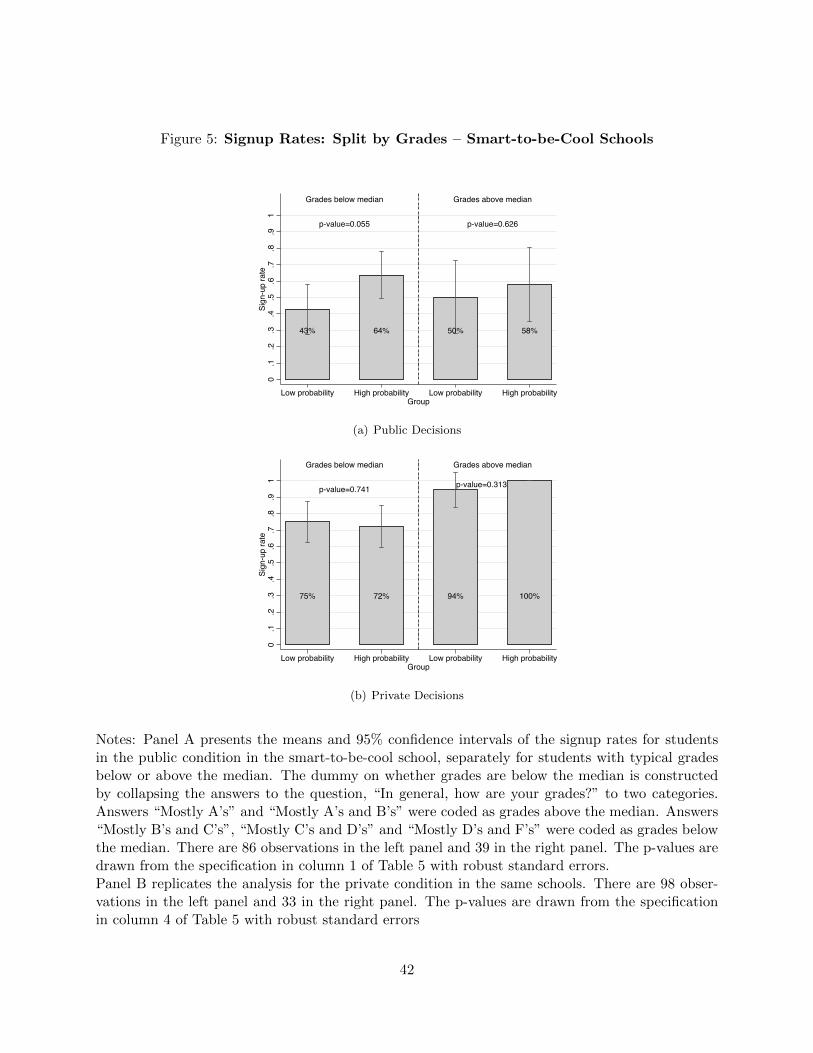
Figure 5: Signup Rates: Split by Grades – Smart-to-be-Cool Schools
43% 64% 50% 58%
p-value=0.055 p-value=0.626
Grades below median Grades above median
0.1
.2.3
.4.5
.6.7
.8.9
1Si
gn-u
p ra
te
Low probability High probability Low probability High probabilityGroup
(a) Public Decisions
75% 72% 94% 100%
p-value=0.741 p-value=0.313
Grades below median Grades above median
0.1
.2.3
.4.5
.6.7
.8.9
1Si
gn-u
p ra
te
Low probability High probability Low probability High probabilityGroup
(b) Private Decisions
Notes: Panel A presents the means and 95% confidence intervals of the signup rates for studentsin the public condition in the smart-to-be-cool school, separately for students with typical gradesbelow or above the median. The dummy on whether grades are below the median is constructedby collapsing the answers to the question, “In general, how are your grades?” to two categories.Answers “Mostly A’s” and “Mostly A’s and B’s” were coded as grades above the median. Answers“Mostly B’s and C’s”, “Mostly C’s and D’s” and “Mostly D’s and F’s” were coded as grades belowthe median. There are 86 observations in the left panel and 39 in the right panel. The p-values aredrawn from the specification in column 1 of Table 5 with robust standard errors.Panel B replicates the analysis for the private condition in the same schools. There are 98 obser-vations in the left panel and 33 in the right panel. The p-values are drawn from the specificationin column 4 of Table 5 with robust standard errors
42
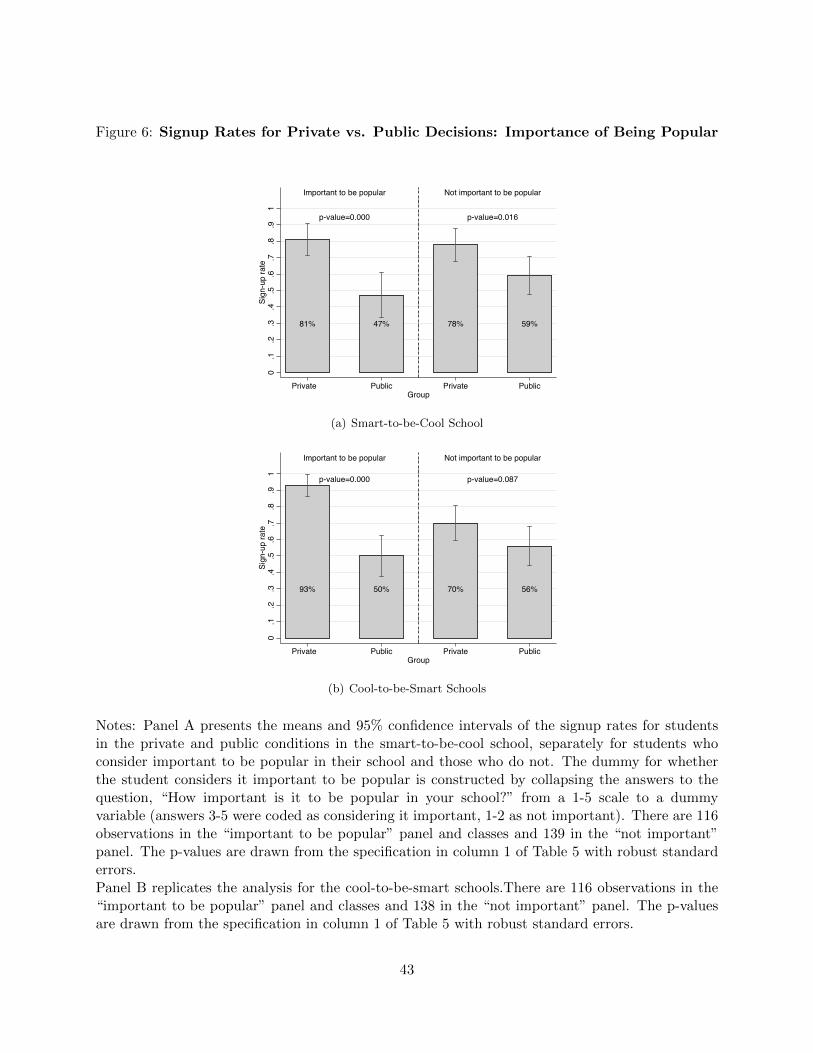
Figure 6: Signup Rates for Private vs. Public Decisions: Importance of Being Popular
81% 47% 78% 59%
p-value=0.000 p-value=0.016
Important to be popular Not important to be popular
0.1
.2.3
.4.5
.6.7
.8.9
1Si
gn-u
p ra
te
Private Public Private PublicGroup
(a) Smart-to-be-Cool School
p-value=0.000 p-value=0.087
93% 50% 70% 56%
Important to be popular Not important to be popular
0.1
.2.3
.4.5
.6.7
.8.9
1Si
gn-u
p ra
te
Private Public Private PublicGroup
(b) Cool-to-be-Smart Schools
Notes: Panel A presents the means and 95% confidence intervals of the signup rates for studentsin the private and public conditions in the smart-to-be-cool school, separately for students whoconsider important to be popular in their school and those who do not. The dummy for whetherthe student considers it important to be popular is constructed by collapsing the answers to thequestion, “How important is it to be popular in your school?” from a 1-5 scale to a dummyvariable (answers 3-5 were coded as considering it important, 1-2 as not important). There are 116observations in the “important to be popular” panel and classes and 139 in the “not important”panel. The p-values are drawn from the specification in column 1 of Table 5 with robust standarderrors.Panel B replicates the analysis for the cool-to-be-smart schools.There are 116 observations in the“important to be popular” panel and classes and 138 in the “not important” panel. The p-valuesare drawn from the specification in column 1 of Table 5 with robust standard errors.
43
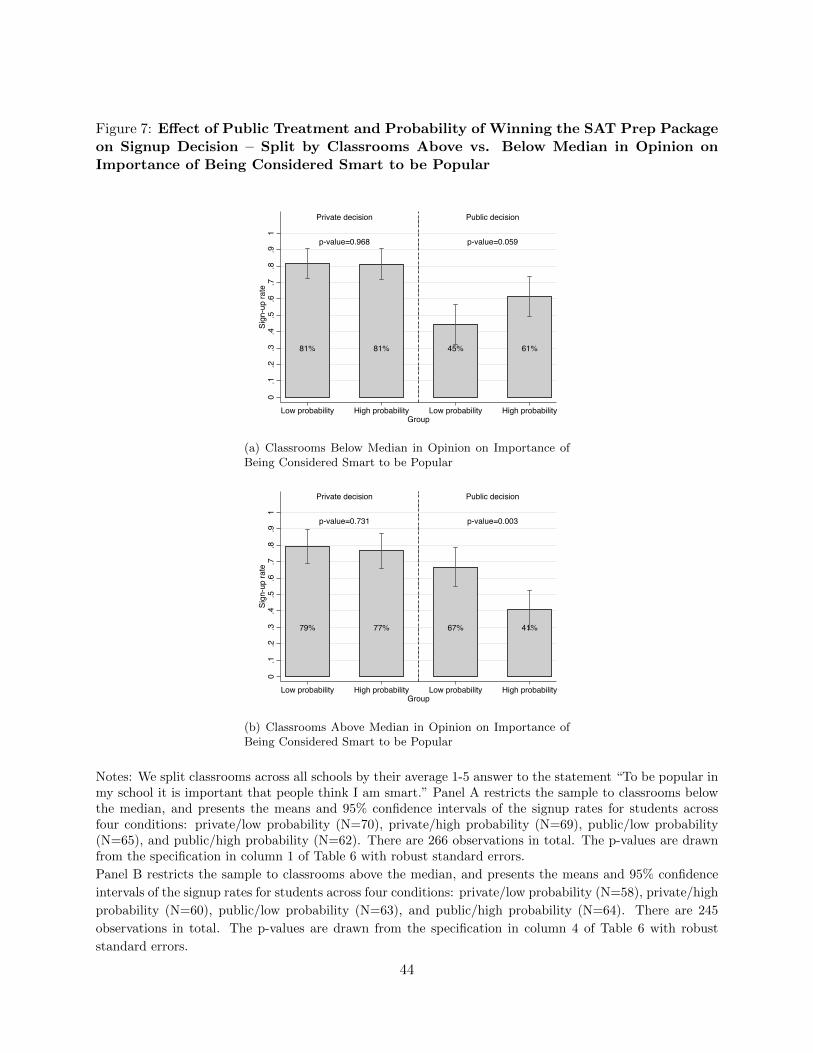
Figure 7: Effect of Public Treatment and Probability of Winning the SAT Prep Packageon Signup Decision – Split by Classrooms Above vs. Below Median in Opinion onImportance of Being Considered Smart to be Popular
81% 81% 45% 61%
p-value=0.968 p-value=0.059
Private decision Public decision
0.1
.2.3
.4.5
.6.7
.8.9
1Si
gn-u
p ra
te
Low probability High probability Low probability High probabilityGroup
(a) Classrooms Below Median in Opinion on Importance ofBeing Considered Smart to be Popular
79% 77% 67% 41%
p-value=0.731 p-value=0.003
Private decision Public decision
0.1
.2.3
.4.5
.6.7
.8.9
1Si
gn-u
p ra
te
Low probability High probability Low probability High probabilityGroup
(b) Classrooms Above Median in Opinion on Importance ofBeing Considered Smart to be Popular
Notes: We split classrooms across all schools by their average 1-5 answer to the statement “To be popular inmy school it is important that people think I am smart.” Panel A restricts the sample to classrooms belowthe median, and presents the means and 95% confidence intervals of the signup rates for students acrossfour conditions: private/low probability (N=70), private/high probability (N=69), public/low probability(N=65), and public/high probability (N=62). There are 266 observations in total. The p-values are drawnfrom the specification in column 1 of Table 6 with robust standard errors.
Panel B restricts the sample to classrooms above the median, and presents the means and 95% confidence
intervals of the signup rates for students across four conditions: private/low probability (N=58), private/high
probability (N=60), public/low probability (N=63), and public/high probability (N=64). There are 245
observations in total. The p-values are drawn from the specification in column 4 of Table 6 with robust
standard errors.
44
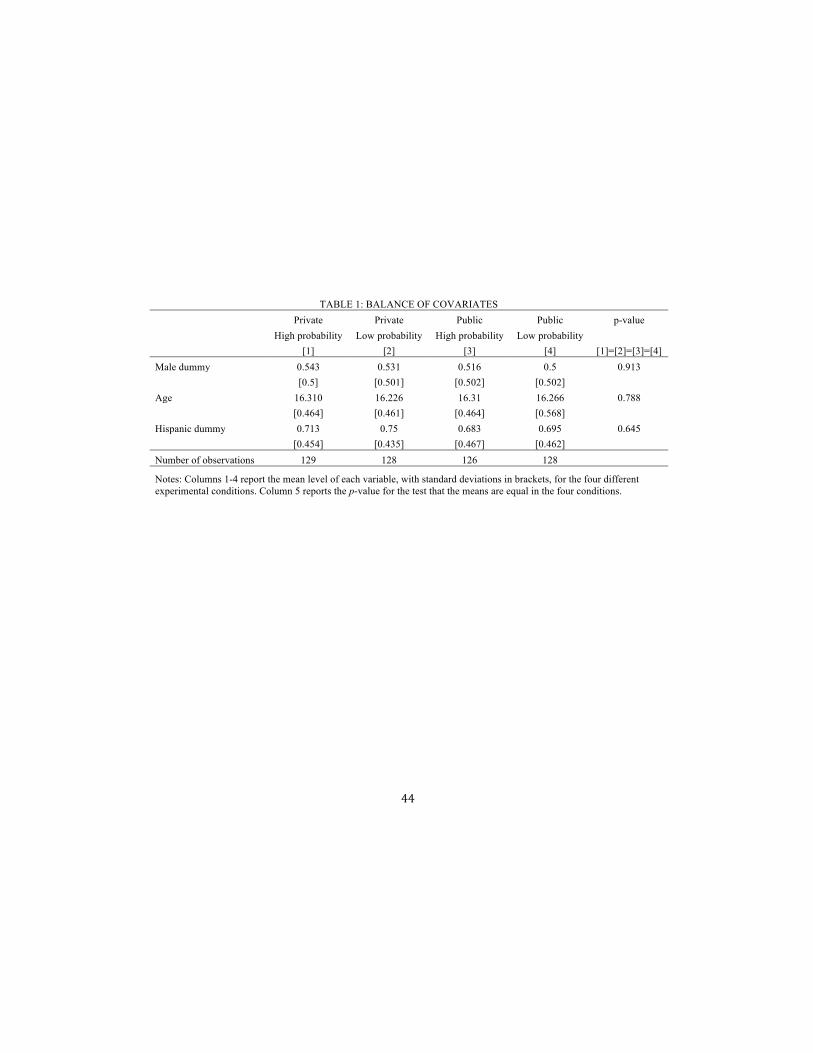
44
TABLE 1: BALANCE OF COVARIATES Private Private Public Public p-value High probability Low probability High probability Low probability [1] [2] [3] [4] [1]=[2]=[3]=[4] Male dummy 0.543 0.531 0.516 0.5 0.913 [0.5] [0.501] [0.502] [0.502] Age 16.310 16.226 16.31 16.266 0.788 [0.464] [0.461] [0.464] [0.568] Hispanic dummy 0.713 0.75 0.683 0.695 0.645 [0.454] [0.435] [0.467] [0.462] Number of observations 129 128 126 128
Notes: Columns 1-4 report the mean level of each variable, with standard deviations in brackets, for the four different experimental conditions. Column 5 reports the p-value for the test that the means are equal in the four conditions.
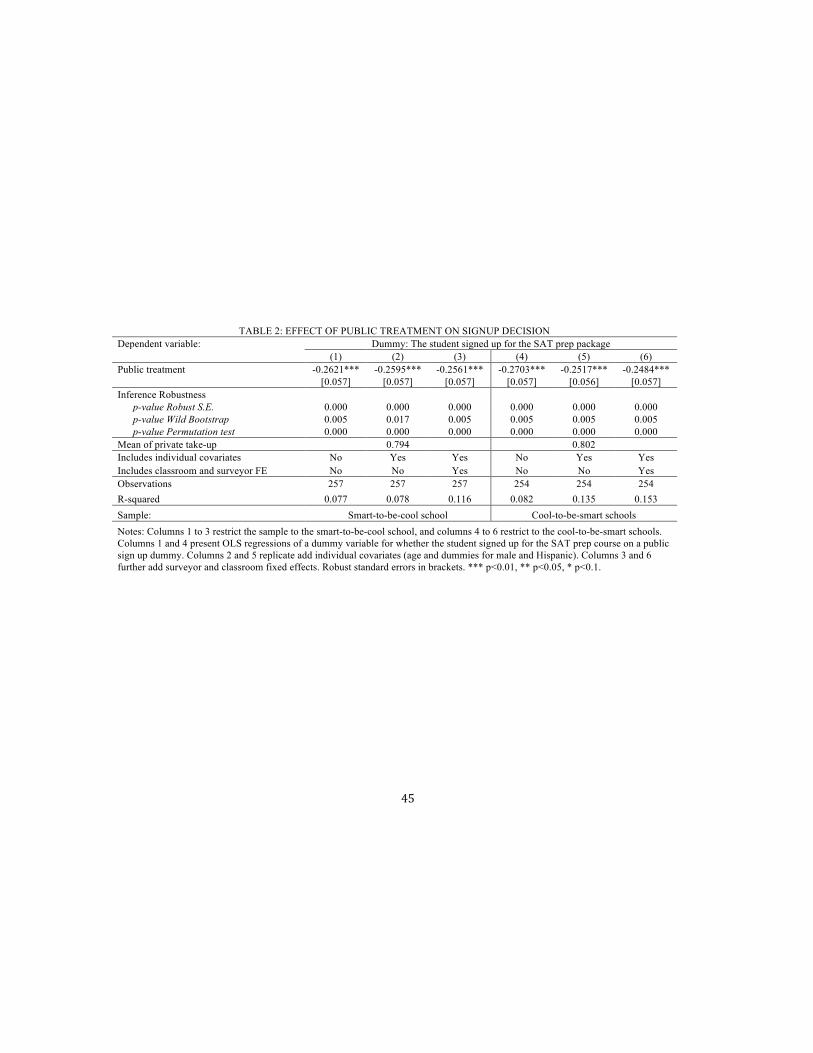
45
TABLE 2: EFFECT OF PUBLIC TREATMENT ON SIGNUP DECISION Dependent variable: Dummy: The student signed up for the SAT prep package (1) (2) (3) (4) (5) (6) Public treatment -0.2621*** -0.2595*** -0.2561*** -0.2703*** -0.2517*** -0.2484*** [0.057] [0.057] [0.057] [0.057] [0.056] [0.057] Inference Robustness p-value Robust S.E. 0.000 0.000 0.000 0.000 0.000 0.000 p-value Wild Bootstrap 0.005 0.017 0.005 0.005 0.005 0.005 p-value Permutation test 0.000 0.000 0.000 0.000 0.000 0.000 Mean of private take-up 0.794 0.802 Includes individual covariates No Yes Yes No Yes Yes Includes classroom and surveyor FE No No Yes No No Yes Observations 257 257 257 254 254 254 R-squared 0.077 0.078 0.116 0.082 0.135 0.153 Sample: Smart-to-be-cool school Cool-to-be-smart schools Notes: Columns 1 to 3 restrict the sample to the smart-to-be-cool school, and columns 4 to 6 restrict to the cool-to-be-smart schools. Columns 1 and 4 present OLS regressions of a dummy variable for whether the student signed up for the SAT prep course on a public sign up dummy. Columns 2 and 5 replicate add individual covariates (age and dummies for male and Hispanic). Columns 3 and 6 further add surveyor and classroom fixed effects. Robust standard errors in brackets. *** p<0.01, ** p<0.05, * p<0.1.
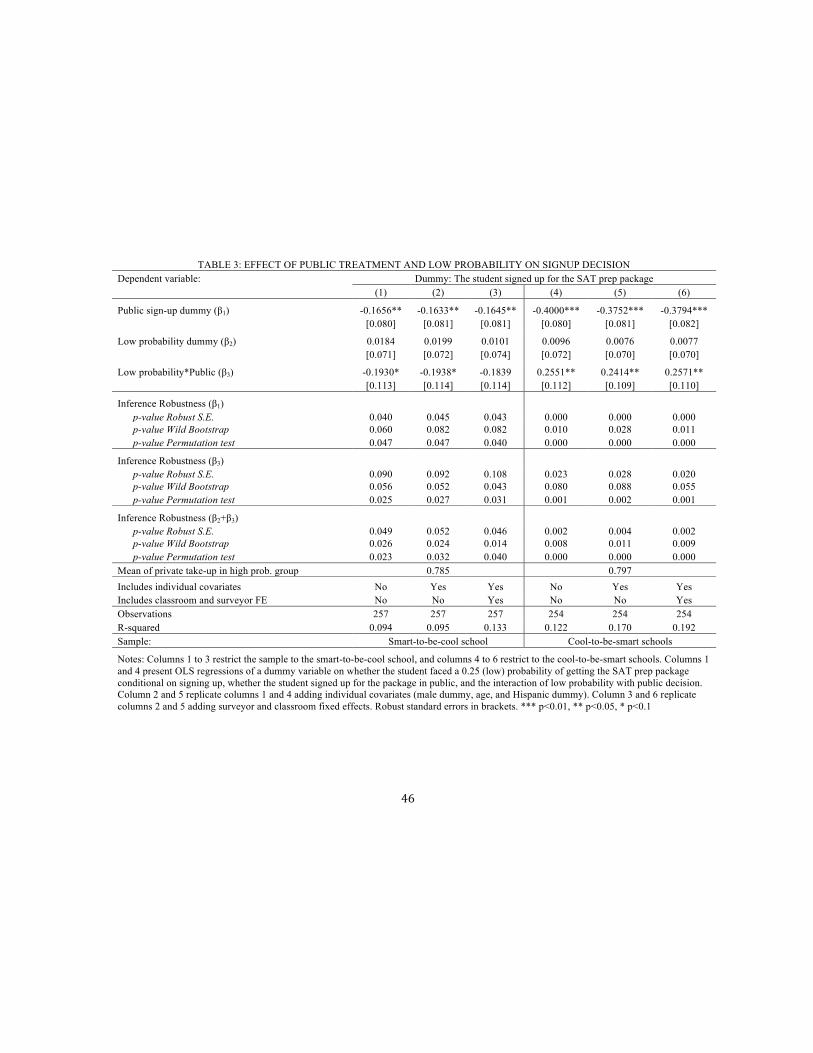
46
TABLE 3: EFFECT OF PUBLIC TREATMENT AND LOW PROBABILITY ON SIGNUP DECISION Dependent variable: Dummy: The student signed up for the SAT prep package (1) (2) (3) (4) (5) (6)
Public sign-up dummy (β1) -0.1656** -0.1633** -0.1645** -0.4000*** -0.3752*** -0.3794*** [0.080] [0.081] [0.081] [0.080] [0.081] [0.082]
Low probability dummy (β2) 0.0184 0.0199 0.0101 0.0096 0.0076 0.0077 [0.071] [0.072] [0.074] [0.072] [0.070] [0.070]
Low probability*Public (β3) -0.1930* -0.1938* -0.1839 0.2551** 0.2414** 0.2571** [0.113] [0.114] [0.114] [0.112] [0.109] [0.110]
Inference Robustness (β1) p-value Robust S.E. 0.040 0.045 0.043 0.000 0.000 0.000 p-value Wild Bootstrap 0.060 0.082 0.082 0.010 0.028 0.011 p-value Permutation test 0.047 0.047 0.040 0.000 0.000 0.000
Inference Robustness (β3) p-value Robust S.E. 0.090 0.092 0.108 0.023 0.028 0.020 p-value Wild Bootstrap 0.056 0.052 0.043 0.080 0.088 0.055 p-value Permutation test 0.025 0.027 0.031 0.001 0.002 0.001
Inference Robustness (β2+β3) p-value Robust S.E. 0.049 0.052 0.046 0.002 0.004 0.002 p-value Wild Bootstrap 0.026 0.024 0.014 0.008 0.011 0.009 p-value Permutation test 0.023 0.032 0.040 0.000 0.000 0.000 Mean of private take-up in high prob. group 0.785 0.797 Includes individual covariates No Yes Yes No Yes Yes Includes classroom and surveyor FE No No Yes No No Yes Observations 257 257 257 254 254 254 R-squared 0.094 0.095 0.133 0.122 0.170 0.192 Sample: Smart-to-be-cool school Cool-to-be-smart schools
Notes: Columns 1 to 3 restrict the sample to the smart-to-be-cool school, and columns 4 to 6 restrict to the cool-to-be-smart schools. Columns 1 and 4 present OLS regressions of a dummy variable on whether the student faced a 0.25 (low) probability of getting the SAT prep package conditional on signing up, whether the student signed up for the package in public, and the interaction of low probability with public decision. Column 2 and 5 replicate columns 1 and 4 adding individual covariates (male dummy, age, and Hispanic dummy). Column 3 and 6 replicate columns 2 and 5 adding surveyor and classroom fixed effects. Robust standard errors in brackets. *** p<0.01, ** p<0.05, * p<0.1
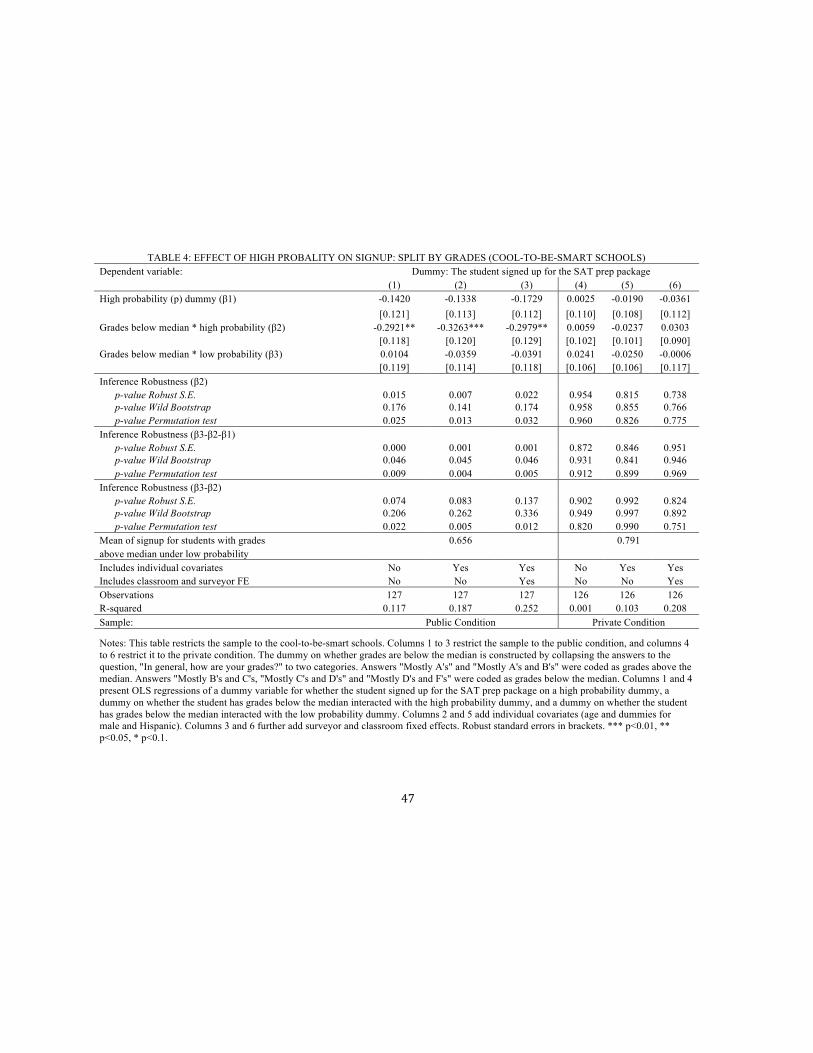
47
TABLE 4: EFFECT OF HIGH PROBALITY ON SIGNUP: SPLIT BY GRADES (COOL-TO-BE-SMART SCHOOLS)
Dependent variable: Dummy: The student signed up for the SAT prep package (1) (2) (3) (4) (5) (6) High probability (p) dummy (β1) -0.1420 -0.1338 -0.1729 0.0025 -0.0190 -0.0361
[0.121] [0.113] [0.112] [0.110] [0.108] [0.112] Grades below median * high probability (β2) -0.2921** -0.3263*** -0.2979** 0.0059 -0.0237 0.0303
[0.118] [0.120] [0.129] [0.102] [0.101] [0.090] Grades below median * low probability (β3) 0.0104 -0.0359 -0.0391 0.0241 -0.0250 -0.0006
[0.119] [0.114] [0.118] [0.106] [0.106] [0.117] Inference Robustness (β2) p-value Robust S.E. 0.015 0.007 0.022 0.954 0.815 0.738 p-value Wild Bootstrap 0.176 0.141 0.174 0.958 0.855 0.766 p-value Permutation test 0.025 0.013 0.032 0.960 0.826 0.775 Inference Robustness (β3-β2-β1) p-value Robust S.E. 0.000 0.001 0.001 0.872 0.846 0.951 p-value Wild Bootstrap 0.046 0.045 0.046 0.931 0.841 0.946 p-value Permutation test 0.009 0.004 0.005 0.912 0.899 0.969 Inference Robustness (β3-β2) p-value Robust S.E. 0.074 0.083 0.137 0.902 0.992 0.824 p-value Wild Bootstrap 0.206 0.262 0.336 0.949 0.997 0.892 p-value Permutation test 0.022 0.005 0.012 0.820 0.990 0.751 Mean of signup for students with grades 0.656 0.791 above median under low probability Includes individual covariates No Yes Yes No Yes Yes Includes classroom and surveyor FE No No Yes No No Yes Observations 127 127 127 126 126 126 R-squared 0.117 0.187 0.252 0.001 0.103 0.208 Sample: Public Condition Private Condition
Notes: This table restricts the sample to the cool-to-be-smart schools. Columns 1 to 3 restrict the sample to the public condition, and columns 4 to 6 restrict it to the private condition. The dummy on whether grades are below the median is constructed by collapsing the answers to the question, "In general, how are your grades?" to two categories. Answers "Mostly A's" and "Mostly A's and B's" were coded as grades above the median. Answers "Mostly B's and C's, "Mostly C's and D's" and "Mostly D's and F's" were coded as grades below the median. Columns 1 and 4 present OLS regressions of a dummy variable for whether the student signed up for the SAT prep package on a high probability dummy, a dummy on whether the student has grades below the median interacted with the high probability dummy, and a dummy on whether the student has grades below the median interacted with the low probability dummy. Columns 2 and 5 add individual covariates (age and dummies for male and Hispanic). Columns 3 and 6 further add surveyor and classroom fixed effects. Robust standard errors in brackets. *** p<0.01, ** p<0.05, * p<0.1.
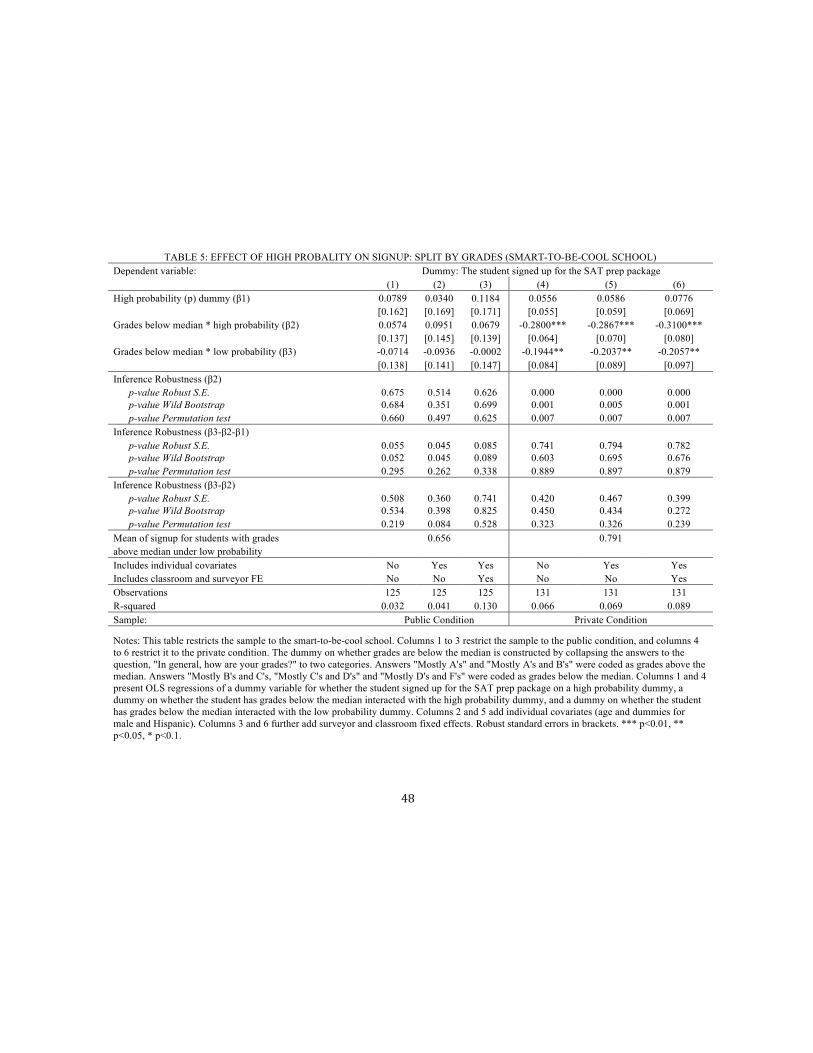
48
TABLE 5: EFFECT OF HIGH PROBALITY ON SIGNUP: SPLIT BY GRADES (SMART-TO-BE-COOL SCHOOL)
Dependent variable: Dummy: The student signed up for the SAT prep package (1) (2) (3) (4) (5) (6) High probability (p) dummy (β1) 0.0789 0.0340 0.1184 0.0556 0.0586 0.0776
[0.162] [0.169] [0.171] [0.055] [0.059] [0.069] Grades below median * high probability (β2) 0.0574 0.0951 0.0679 -0.2800*** -0.2867*** -0.3100***
[0.137] [0.145] [0.139] [0.064] [0.070] [0.080] Grades below median * low probability (β3) -0.0714 -0.0936 -0.0002 -0.1944** -0.2037** -0.2057**
[0.138] [0.141] [0.147] [0.084] [0.089] [0.097] Inference Robustness (β2) p-value Robust S.E. 0.675 0.514 0.626 0.000 0.000 0.000 p-value Wild Bootstrap 0.684 0.351 0.699 0.001 0.005 0.001 p-value Permutation test 0.660 0.497 0.625 0.007 0.007 0.007 Inference Robustness (β3-β2-β1) p-value Robust S.E. 0.055 0.045 0.085 0.741 0.794 0.782 p-value Wild Bootstrap 0.052 0.045 0.089 0.603 0.695 0.676 p-value Permutation test 0.295 0.262 0.338 0.889 0.897 0.879 Inference Robustness (β3-β2) p-value Robust S.E. 0.508 0.360 0.741 0.420 0.467 0.399 p-value Wild Bootstrap 0.534 0.398 0.825 0.450 0.434 0.272 p-value Permutation test 0.219 0.084 0.528 0.323 0.326 0.239 Mean of signup for students with grades 0.656 0.791 above median under low probability Includes individual covariates No Yes Yes No Yes Yes Includes classroom and surveyor FE No No Yes No No Yes Observations 125 125 125 131 131 131 R-squared 0.032 0.041 0.130 0.066 0.069 0.089 Sample: Public Condition Private Condition
Notes: This table restricts the sample to the smart-to-be-cool school. Columns 1 to 3 restrict the sample to the public condition, and columns 4 to 6 restrict it to the private condition. The dummy on whether grades are below the median is constructed by collapsing the answers to the question, "In general, how are your grades?" to two categories. Answers "Mostly A's" and "Mostly A's and B's" were coded as grades above the median. Answers "Mostly B's and C's, "Mostly C's and D's" and "Mostly D's and F's" were coded as grades below the median. Columns 1 and 4 present OLS regressions of a dummy variable for whether the student signed up for the SAT prep package on a high probability dummy, a dummy on whether the student has grades below the median interacted with the high probability dummy, and a dummy on whether the student has grades below the median interacted with the low probability dummy. Columns 2 and 5 add individual covariates (age and dummies for male and Hispanic). Columns 3 and 6 further add surveyor and classroom fixed effects. Robust standard errors in brackets. *** p<0.01, ** p<0.05, * p<0.1.
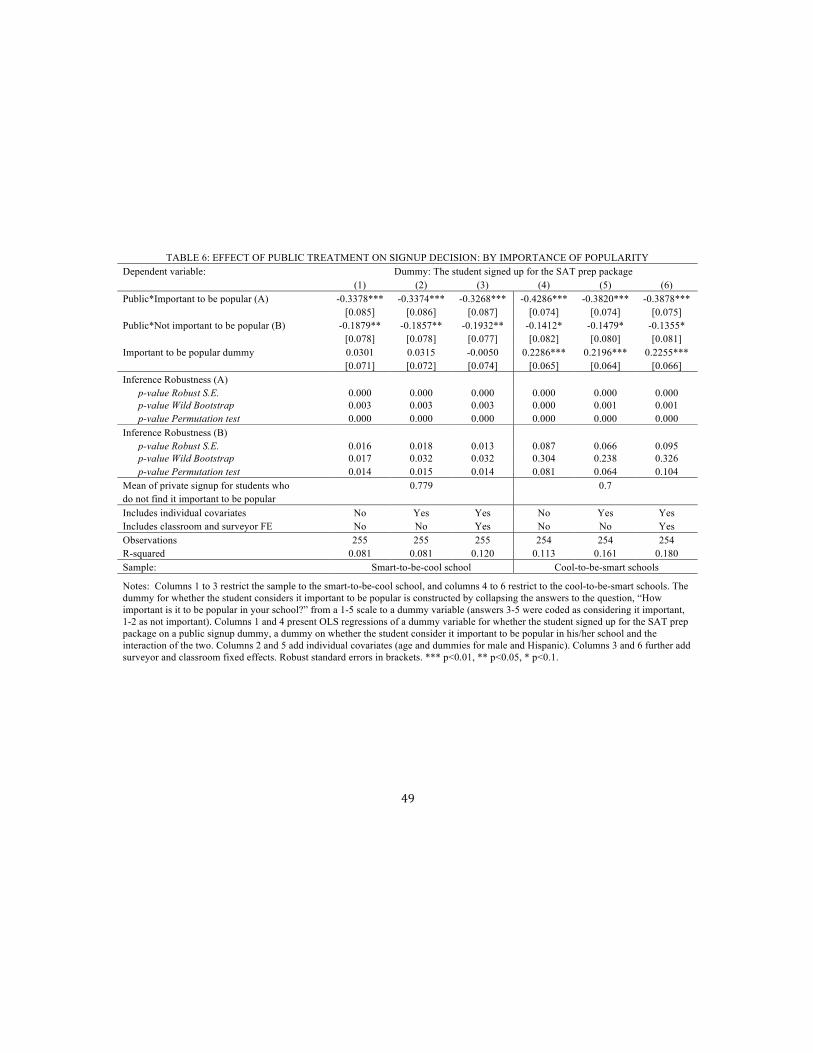
49
TABLE 6: EFFECT OF PUBLIC TREATMENT ON SIGNUP DECISION: BY IMPORTANCE OF POPULARITY
Dependent variable: Dummy: The student signed up for the SAT prep package (1) (2) (3) (4) (5) (6) Public*Important to be popular (A) -0.3378*** -0.3374*** -0.3268*** -0.4286*** -0.3820*** -0.3878***
[0.085] [0.086] [0.087] [0.074] [0.074] [0.075] Public*Not important to be popular (B) -0.1879** -0.1857** -0.1932** -0.1412* -0.1479* -0.1355*
[0.078] [0.078] [0.077] [0.082] [0.080] [0.081] Important to be popular dummy 0.0301 0.0315 -0.0050 0.2286*** 0.2196*** 0.2255***
[0.071] [0.072] [0.074] [0.065] [0.064] [0.066] Inference Robustness (A) p-value Robust S.E. 0.000 0.000 0.000 0.000 0.000 0.000 p-value Wild Bootstrap 0.003 0.003 0.003 0.000 0.001 0.001 p-value Permutation test 0.000 0.000 0.000 0.000 0.000 0.000 Inference Robustness (B) p-value Robust S.E. 0.016 0.018 0.013 0.087 0.066 0.095 p-value Wild Bootstrap 0.017 0.032 0.032 0.304 0.238 0.326 p-value Permutation test 0.014 0.015 0.014 0.081 0.064 0.104 Mean of private signup for students who 0.779 0.7 do not find it important to be popular Includes individual covariates No Yes Yes No Yes Yes Includes classroom and surveyor FE No No Yes No No Yes Observations 255 255 255 254 254 254 R-squared 0.081 0.081 0.120 0.113 0.161 0.180 Sample: Smart-to-be-cool school Cool-to-be-smart schools
Notes: Columns 1 to 3 restrict the sample to the smart-to-be-cool school, and columns 4 to 6 restrict to the cool-to-be-smart schools. The dummy for whether the student considers it important to be popular is constructed by collapsing the answers to the question, “How important is it to be popular in your school?” from a 1-5 scale to a dummy variable (answers 3-5 were coded as considering it important, 1-2 as not important). Columns 1 and 4 present OLS regressions of a dummy variable for whether the student signed up for the SAT prep package on a public signup dummy, a dummy on whether the student consider it important to be popular in his/her school and the interaction of the two. Columns 2 and 5 add individual covariates (age and dummies for male and Hispanic). Columns 3 and 6 further add surveyor and classroom fixed effects. Robust standard errors in brackets. *** p<0.01, ** p<0.05, * p<0.1.
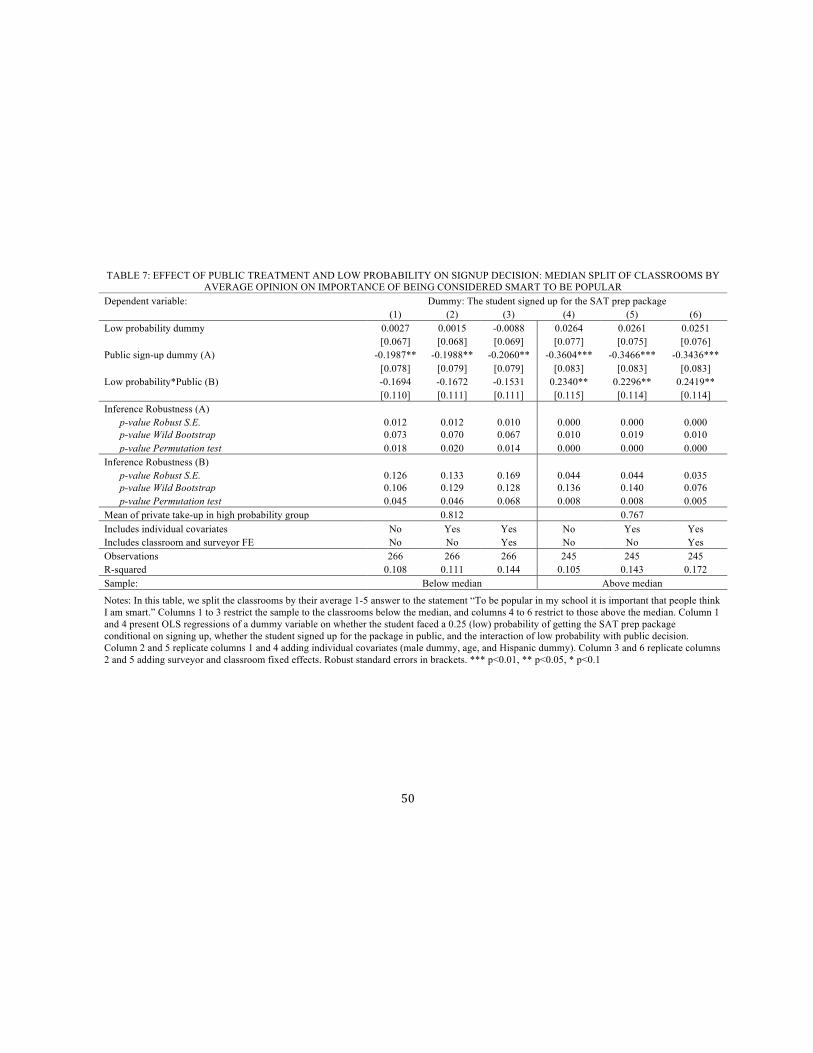
50
TABLE 7: EFFECT OF PUBLIC TREATMENT AND LOW PROBABILITY ON SIGNUP DECISION: MEDIAN SPLIT OF CLASSROOMS BY AVERAGE OPINION ON IMPORTANCE OF BEING CONSIDERED SMART TO BE POPULAR
Dependent variable: Dummy: The student signed up for the SAT prep package (1) (2) (3) (4) (5) (6) Low probability dummy 0.0027 0.0015 -0.0088 0.0264 0.0261 0.0251
[0.067] [0.068] [0.069] [0.077] [0.075] [0.076] Public sign-up dummy (A) -0.1987** -0.1988** -0.2060** -0.3604*** -0.3466*** -0.3436***
[0.078] [0.079] [0.079] [0.083] [0.083] [0.083] Low probability*Public (B) -0.1694 -0.1672 -0.1531 0.2340** 0.2296** 0.2419**
[0.110] [0.111] [0.111] [0.115] [0.114] [0.114] Inference Robustness (A) p-value Robust S.E. 0.012 0.012 0.010 0.000 0.000 0.000 p-value Wild Bootstrap 0.073 0.070 0.067 0.010 0.019 0.010 p-value Permutation test 0.018 0.020 0.014 0.000 0.000 0.000 Inference Robustness (B) p-value Robust S.E. 0.126 0.133 0.169 0.044 0.044 0.035 p-value Wild Bootstrap 0.106 0.129 0.128 0.136 0.140 0.076 p-value Permutation test 0.045 0.046 0.068 0.008 0.008 0.005 Mean of private take-up in high probability group 0.812 0.767 Includes individual covariates No Yes Yes No Yes Yes Includes classroom and surveyor FE No No Yes No No Yes Observations 266 266 266 245 245 245 R-squared 0.108 0.111 0.144 0.105 0.143 0.172 Sample: Below median Above median
Notes: In this table, we split the classrooms by their average 1-5 answer to the statement “To be popular in my school it is important that people think I am smart.” Columns 1 to 3 restrict the sample to the classrooms below the median, and columns 4 to 6 restrict to those above the median. Column 1 and 4 present OLS regressions of a dummy variable on whether the student faced a 0.25 (low) probability of getting the SAT prep package conditional on signing up, whether the student signed up for the package in public, and the interaction of low probability with public decision. Column 2 and 5 replicate columns 1 and 4 adding individual covariates (male dummy, age, and Hispanic dummy). Column 3 and 6 replicate columns 2 and 5 adding surveyor and classroom fixed effects. Robust standard errors in brackets. *** p<0.01, ** p<0.05, * p<0.1
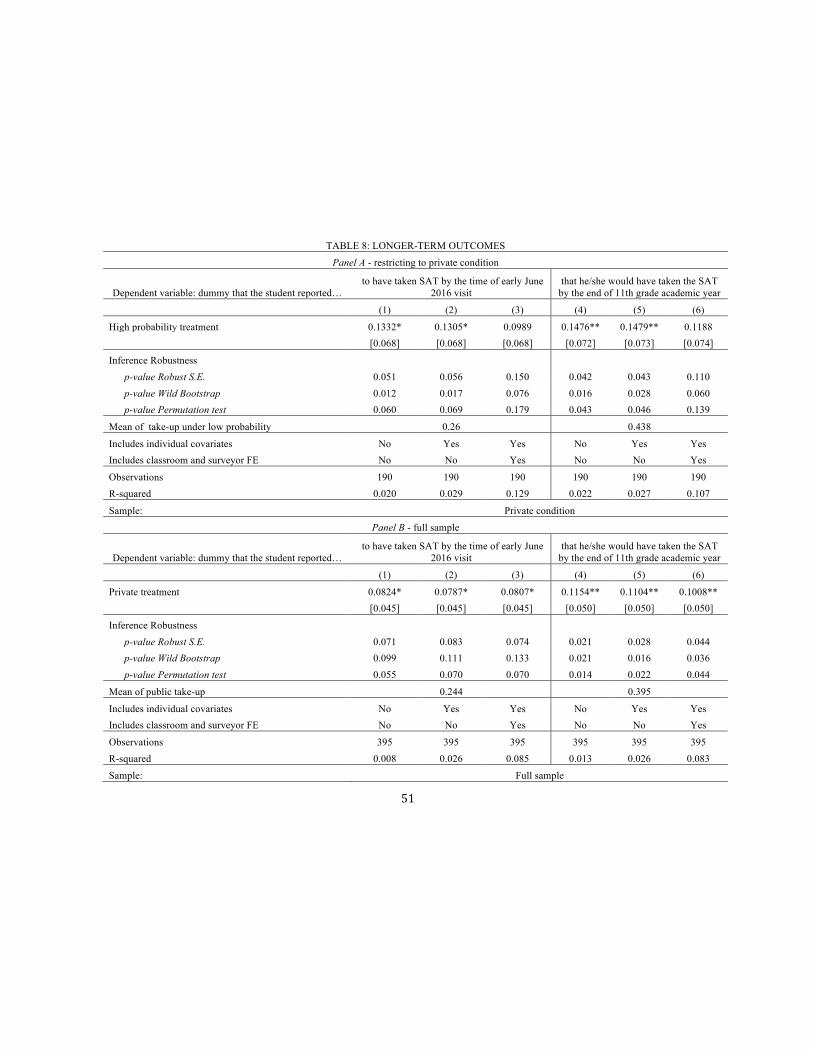
51
TABLE 8: LONGER-TERM OUTCOMES
Panel A - restricting to private condition
Dependent variable: dummy that the student reported… to have taken SAT by the time of early June
2016 visit that he/she would have taken the SAT
by the end of 11th grade academic year
(1) (2) (3) (4) (5) (6)
High probability treatment 0.1332* 0.1305* 0.0989 0.1476** 0.1479** 0.1188 [0.068] [0.068] [0.068] [0.072] [0.073] [0.074]
Inference Robustness p-value Robust S.E. 0.051 0.056 0.150 0.042 0.043 0.110 p-value Wild Bootstrap 0.012 0.017 0.076 0.016 0.028 0.060 p-value Permutation test 0.060 0.069 0.179 0.043 0.046 0.139
Mean of take-up under low probability 0.26 0.438
Includes individual covariates No Yes Yes No Yes Yes Includes classroom and surveyor FE No No Yes No No Yes
Observations 190 190 190 190 190 190 R-squared 0.020 0.029 0.129 0.022 0.027 0.107
Sample: Private condition
Panel B - full sample
Dependent variable: dummy that the student reported… to have taken SAT by the time of early June
2016 visit that he/she would have taken the SAT
by the end of 11th grade academic year
(1) (2) (3) (4) (5) (6)
Private treatment 0.0824* 0.0787* 0.0807* 0.1154** 0.1104** 0.1008** [0.045] [0.045] [0.045] [0.050] [0.050] [0.050]
Inference Robustness p-value Robust S.E. 0.071 0.083 0.074 0.021 0.028 0.044 p-value Wild Bootstrap 0.099 0.111 0.133 0.021 0.016 0.036 p-value Permutation test 0.055 0.070 0.070 0.014 0.022 0.044
Mean of public take-up 0.244 0.395
Includes individual covariates No Yes Yes No Yes Yes Includes classroom and surveyor FE No No Yes No No Yes
Observations 395 395 395 395 395 395 R-squared 0.008 0.026 0.085 0.013 0.026 0.083
Sample: Full sample
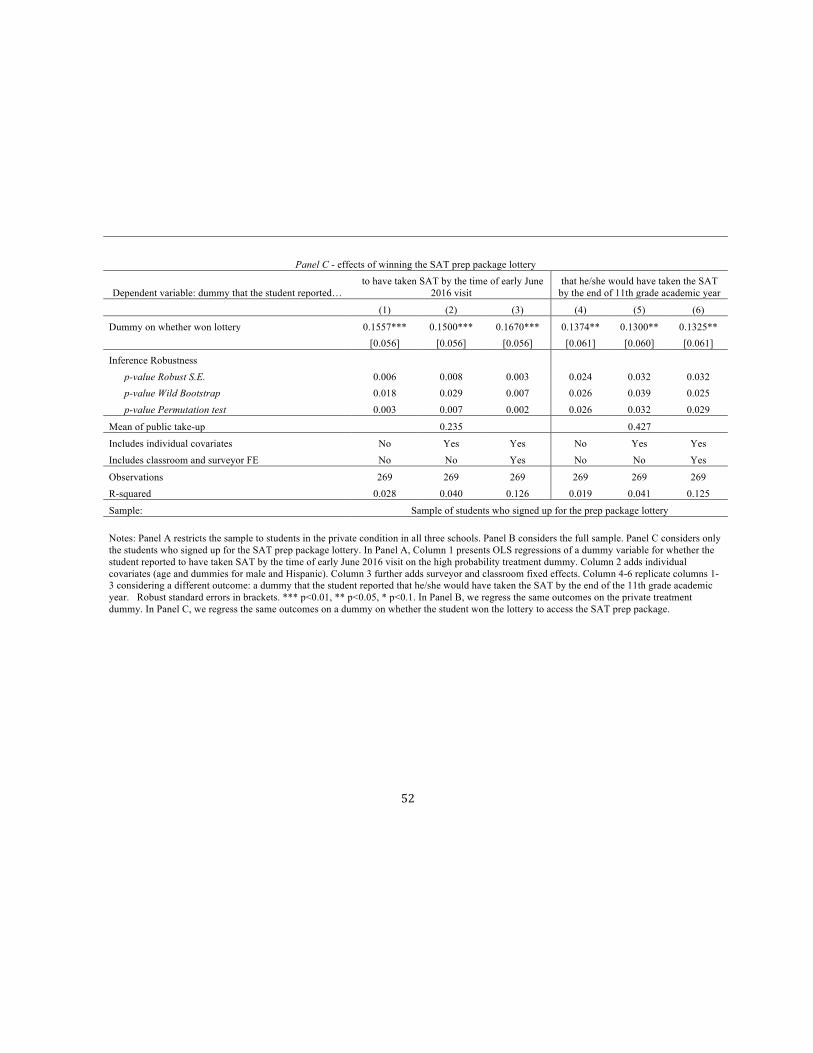
52
Panel C - effects of winning the SAT prep package lottery
Dependent variable: dummy that the student reported… to have taken SAT by the time of early June
2016 visit that he/she would have taken the SAT
by the end of 11th grade academic year
(1) (2) (3) (4) (5) (6)
Dummy on whether won lottery 0.1557*** 0.1500*** 0.1670*** 0.1374** 0.1300** 0.1325** [0.056] [0.056] [0.056] [0.061] [0.060] [0.061]
Inference Robustness p-value Robust S.E. 0.006 0.008 0.003 0.024 0.032 0.032 p-value Wild Bootstrap 0.018 0.029 0.007 0.026 0.039 0.025 p-value Permutation test 0.003 0.007 0.002 0.026 0.032 0.029
Mean of public take-up 0.235 0.427
Includes individual covariates No Yes Yes No Yes Yes Includes classroom and surveyor FE No No Yes No No Yes
Observations 269 269 269 269 269 269 R-squared 0.028 0.040 0.126 0.019 0.041 0.125
Sample: Sample of students who signed up for the prep package lottery
Notes: Panel A restricts the sample to students in the private condition in all three schools. Panel B considers the full sample. Panel C considers only the students who signed up for the SAT prep package lottery. In Panel A, Column 1 presents OLS regressions of a dummy variable for whether the student reported to have taken SAT by the time of early June 2016 visit on the high probability treatment dummy. Column 2 adds individual covariates (age and dummies for male and Hispanic). Column 3 further adds surveyor and classroom fixed effects. Column 4-6 replicate columns 1-3 considering a different outcome: a dummy that the student reported that he/she would have taken the SAT by the end of the 11th grade academic year. Robust standard errors in brackets. *** p<0.01, ** p<0.05, * p<0.1. In Panel B, we regress the same outcomes on the private treatment dummy. In Panel C, we regress the same outcomes on a dummy on whether the student won the lottery to access the SAT prep package.
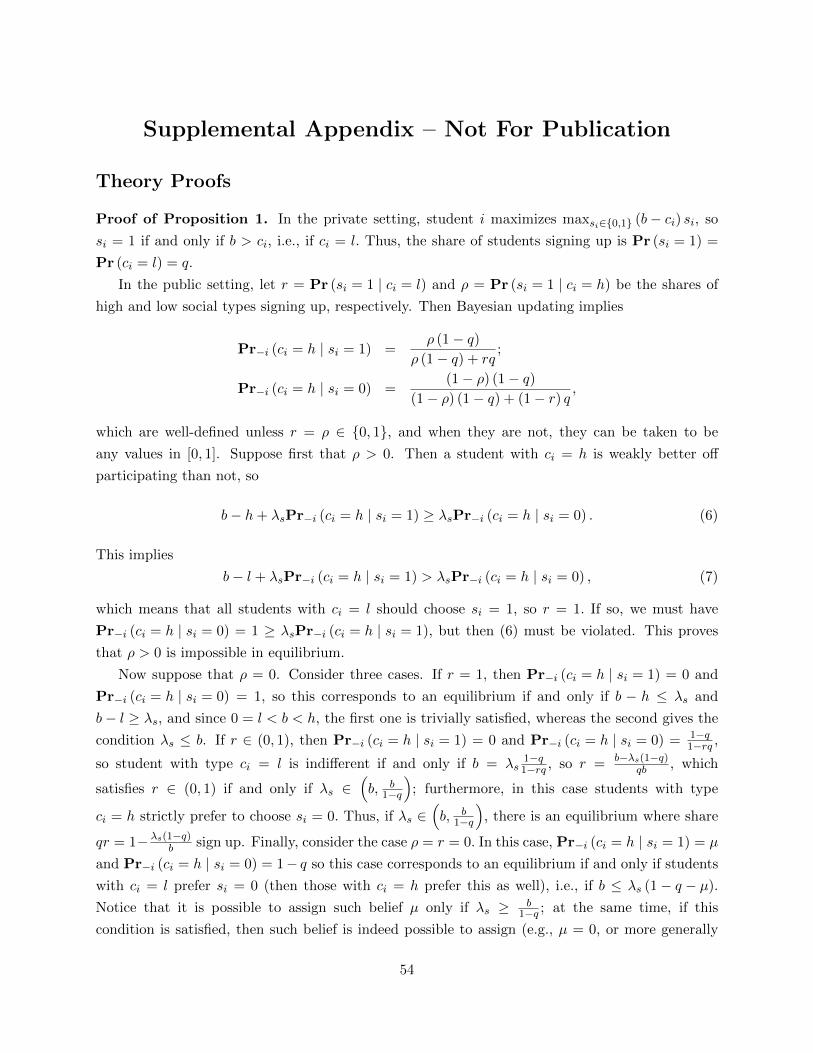
Supplemental Appendix – Not For Publication
Theory Proofs
Proof of Proposition 1. In the private setting, student i maximizes maxsi∈{0,1} (b− ci) si, so
si = 1 if and only if b > ci, i.e., if ci = l. Thus, the share of students signing up is Pr (si = 1) =
Pr (ci = l) = q.
In the public setting, let r = Pr (si = 1 | ci = l) and ρ = Pr (si = 1 | ci = h) be the shares of
high and low social types signing up, respectively. Then Bayesian updating implies
Pr−i (ci = h | si = 1) =ρ (1− q)
ρ (1− q) + rq;
Pr−i (ci = h | si = 0) =(1− ρ) (1− q)
(1− ρ) (1− q) + (1− r) q,
which are well-defined unless r = ρ ∈ {0, 1}, and when they are not, they can be taken to be
any values in [0, 1]. Suppose first that ρ > 0. Then a student with ci = h is weakly better off
participating than not, so
b− h+ λsPr−i (ci = h | si = 1) ≥ λsPr−i (ci = h | si = 0) . (6)
This implies
b− l + λsPr−i (ci = h | si = 1) > λsPr−i (ci = h | si = 0) , (7)
which means that all students with ci = l should choose si = 1, so r = 1. If so, we must have
Pr−i (ci = h | si = 0) = 1 ≥ λsPr−i (ci = h | si = 1), but then (6) must be violated. This proves
that ρ > 0 is impossible in equilibrium.
Now suppose that ρ = 0. Consider three cases. If r = 1, then Pr−i (ci = h | si = 1) = 0 and
Pr−i (ci = h | si = 0) = 1, so this corresponds to an equilibrium if and only if b − h ≤ λs and
b− l ≥ λs, and since 0 = l < b < h, the first one is trivially satisfied, whereas the second gives the
condition λs ≤ b. If r ∈ (0, 1), then Pr−i (ci = h | si = 1) = 0 and Pr−i (ci = h | si = 0) = 1−q1−rq ,
so student with type ci = l is indifferent if and only if b = λs1−q1−rq , so r = b−λs(1−q)
qb , which
satisfies r ∈ (0, 1) if and only if λs ∈(b, b
1−q
); furthermore, in this case students with type
ci = h strictly prefer to choose si = 0. Thus, if λs ∈(b, b
1−q
), there is an equilibrium where share
qr = 1− λs(1−q)b sign up. Finally, consider the case ρ = r = 0. In this case, Pr−i (ci = h | si = 1) = µ
and Pr−i (ci = h | si = 0) = 1− q so this case corresponds to an equilibrium if and only if students
with ci = l prefer si = 0 (then those with ci = h prefer this as well), i.e., if b ≤ λs (1− q − µ).
Notice that it is possible to assign such belief µ only if λs ≥ b1−q ; at the same time, if this
condition is satisfied, then such belief is indeed possible to assign (e.g., µ = 0, or more generally
54
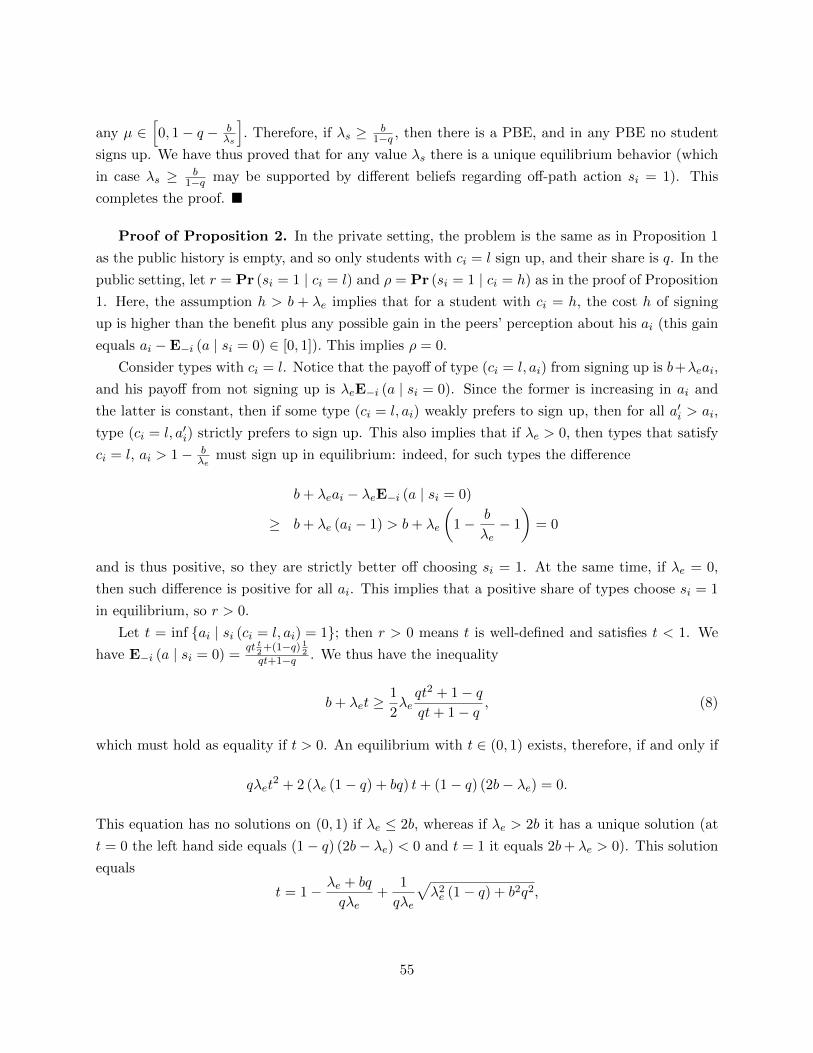
any µ ∈[0, 1− q − b
λs
]. Therefore, if λs ≥ b
1−q , then there is a PBE, and in any PBE no student
signs up. We have thus proved that for any value λs there is a unique equilibrium behavior (which
in case λs ≥ b1−q may be supported by different beliefs regarding off-path action si = 1). This
completes the proof. �
Proof of Proposition 2. In the private setting, the problem is the same as in Proposition 1
as the public history is empty, and so only students with ci = l sign up, and their share is q. In the
public setting, let r = Pr (si = 1 | ci = l) and ρ = Pr (si = 1 | ci = h) as in the proof of Proposition
1. Here, the assumption h > b + λe implies that for a student with ci = h, the cost h of signing
up is higher than the benefit plus any possible gain in the peers’ perception about his ai (this gain
equals ai −E−i (a | si = 0) ∈ [0, 1]). This implies ρ = 0.
Consider types with ci = l. Notice that the payoff of type (ci = l, ai) from signing up is b+λeai,
and his payoff from not signing up is λeE−i (a | si = 0). Since the former is increasing in ai and
the latter is constant, then if some type (ci = l, ai) weakly prefers to sign up, then for all a′i > ai,
type (ci = l, a′i) strictly prefers to sign up. This also implies that if λe > 0, then types that satisfy
ci = l, ai > 1− bλe
must sign up in equilibrium: indeed, for such types the difference
b+ λeai − λeE−i (a | si = 0)
≥ b+ λe (ai − 1) > b+ λe
(1− b
λe− 1
)= 0
and is thus positive, so they are strictly better off choosing si = 1. At the same time, if λe = 0,
then such difference is positive for all ai. This implies that a positive share of types choose si = 1
in equilibrium, so r > 0.
Let t = inf {ai | si (ci = l, ai) = 1}; then r > 0 means t is well-defined and satisfies t < 1. We
have E−i (a | si = 0) =qt t
2+(1−q) 1
2qt+1−q . We thus have the inequality
b+ λet ≥1
2λeqt2 + 1− qqt+ 1− q
, (8)
which must hold as equality if t > 0. An equilibrium with t ∈ (0, 1) exists, therefore, if and only if
qλet2 + 2 (λe (1− q) + bq) t+ (1− q) (2b− λe) = 0.
This equation has no solutions on (0, 1) if λe ≤ 2b, whereas if λe > 2b it has a unique solution (at
t = 0 the left hand side equals (1− q) (2b− λe) < 0 and t = 1 it equals 2b+ λe > 0). This solution
equals
t = 1− λe + bq
qλe+
1
qλe
√λ2e (1− q) + b2q2,
55
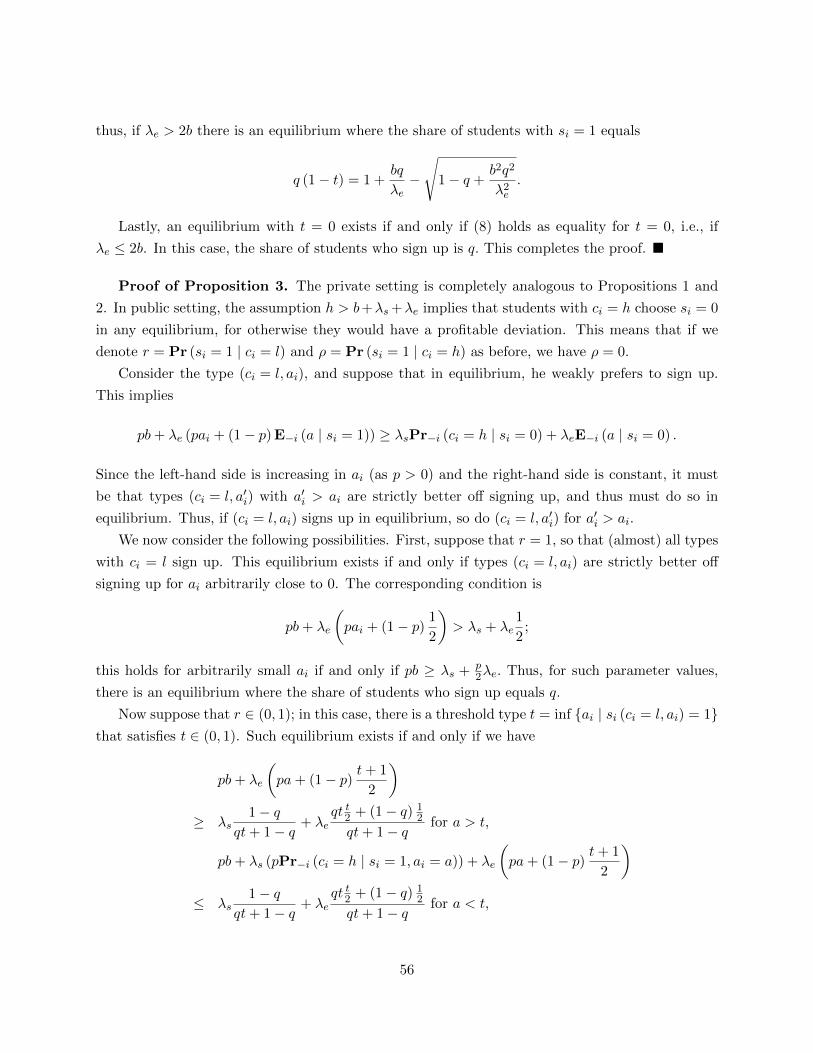
thus, if λe > 2b there is an equilibrium where the share of students with si = 1 equals
q (1− t) = 1 +bq
λe−
√1− q +
b2q2
λ2e.
Lastly, an equilibrium with t = 0 exists if and only if (8) holds as equality for t = 0, i.e., if
λe ≤ 2b. In this case, the share of students who sign up is q. This completes the proof. �
Proof of Proposition 3. The private setting is completely analogous to Propositions 1 and
2. In public setting, the assumption h > b+λs+λe implies that students with ci = h choose si = 0
in any equilibrium, for otherwise they would have a profitable deviation. This means that if we
denote r = Pr (si = 1 | ci = l) and ρ = Pr (si = 1 | ci = h) as before, we have ρ = 0.
Consider the type (ci = l, ai), and suppose that in equilibrium, he weakly prefers to sign up.
This implies
pb+ λe (pai + (1− p) E−i (a | si = 1)) ≥ λsPr−i (ci = h | si = 0) + λeE−i (a | si = 0) .
Since the left-hand side is increasing in ai (as p > 0) and the right-hand side is constant, it must
be that types (ci = l, a′i) with a′i > ai are strictly better off signing up, and thus must do so in
equilibrium. Thus, if (ci = l, ai) signs up in equilibrium, so do (ci = l, a′i) for a′i > ai.
We now consider the following possibilities. First, suppose that r = 1, so that (almost) all types
with ci = l sign up. This equilibrium exists if and only if types (ci = l, ai) are strictly better off
signing up for ai arbitrarily close to 0. The corresponding condition is
pb+ λe
(pai + (1− p) 1
2
)> λs + λe
1
2;
this holds for arbitrarily small ai if and only if pb ≥ λs + p2λe. Thus, for such parameter values,
there is an equilibrium where the share of students who sign up equals q.
Now suppose that r ∈ (0, 1); in this case, there is a threshold type t = inf {ai | si (ci = l, ai) = 1}that satisfies t ∈ (0, 1). Such equilibrium exists if and only if we have
pb+ λe
(pa+ (1− p) t+ 1
2
)≥ λs
1− qqt+ 1− q
+ λeqt t2 + (1− q) 1
2
qt+ 1− qfor a > t,
pb+ λs (pPr−i (ci = h | si = 1, ai = a)) + λe
(pa+ (1− p) t+ 1
2
)≤ λs
1− qqt+ 1− q
+ λeqt t2 + (1− q) 1
2
qt+ 1− qfor a < t,
56
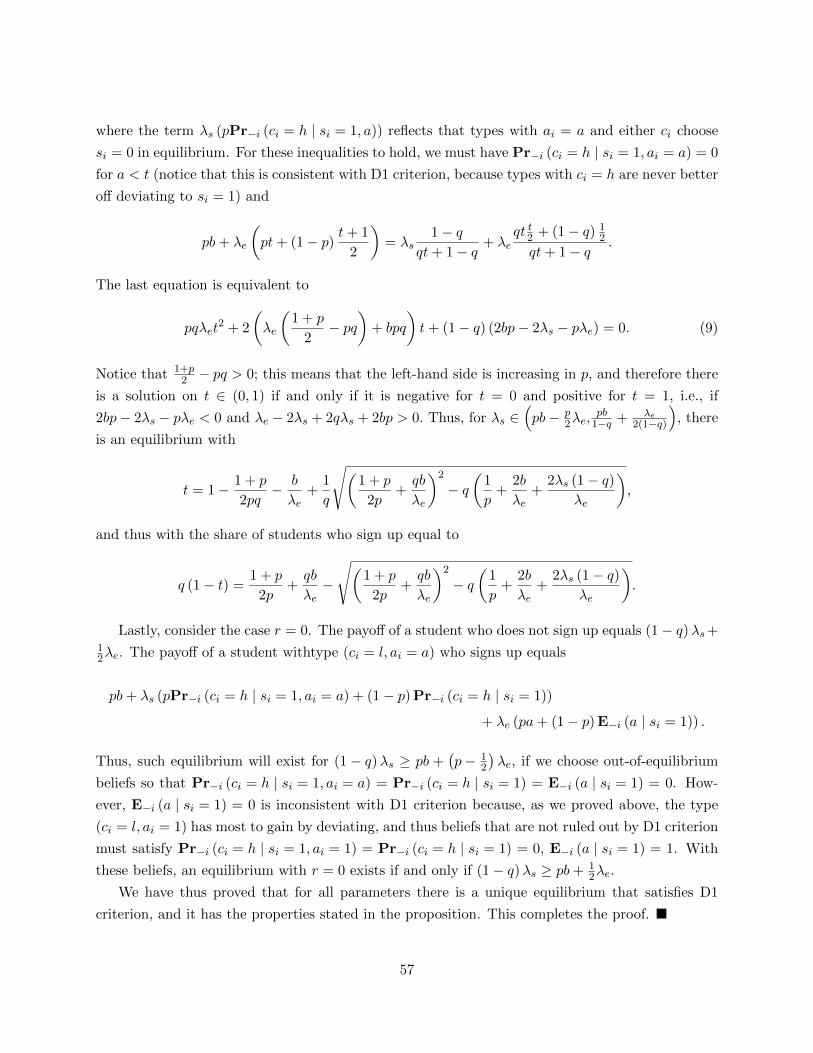
where the term λs (pPr−i (ci = h | si = 1, a)) reflects that types with ai = a and either ci choose
si = 0 in equilibrium. For these inequalities to hold, we must have Pr−i (ci = h | si = 1, ai = a) = 0
for a < t (notice that this is consistent with D1 criterion, because types with ci = h are never better
off deviating to si = 1) and
pb+ λe
(pt+ (1− p) t+ 1
2
)= λs
1− qqt+ 1− q
+ λeqt t2 + (1− q) 1
2
qt+ 1− q.
The last equation is equivalent to
pqλet2 + 2
(λe
(1 + p
2− pq
)+ bpq
)t+ (1− q) (2bp− 2λs − pλe) = 0. (9)
Notice that 1+p2 − pq > 0; this means that the left-hand side is increasing in p, and therefore there
is a solution on t ∈ (0, 1) if and only if it is negative for t = 0 and positive for t = 1, i.e., if
2bp− 2λs − pλe < 0 and λe − 2λs + 2qλs + 2bp > 0. Thus, for λs ∈(pb− p
2λe,pb1−q + λe
2(1−q)
), there
is an equilibrium with
t = 1− 1 + p
2pq− b
λe+
1
q
√(1 + p
2p+qb
λe
)2
− q(
1
p+
2b
λe+
2λs (1− q)λe
),
and thus with the share of students who sign up equal to
q (1− t) =1 + p
2p+qb
λe−
√(1 + p
2p+qb
λe
)2
− q(
1
p+
2b
λe+
2λs (1− q)λe
).
Lastly, consider the case r = 0. The payoff of a student who does not sign up equals (1− q)λs+12λe. The payoff of a student withtype (ci = l, ai = a) who signs up equals
pb+ λs (pPr−i (ci = h | si = 1, ai = a) + (1− p) Pr−i (ci = h | si = 1))
+ λe (pa+ (1− p) E−i (a | si = 1)) .
Thus, such equilibrium will exist for (1− q)λs ≥ pb +(p− 1
2
)λe, if we choose out-of-equilibrium
beliefs so that Pr−i (ci = h | si = 1, ai = a) = Pr−i (ci = h | si = 1) = E−i (a | si = 1) = 0. How-
ever, E−i (a | si = 1) = 0 is inconsistent with D1 criterion because, as we proved above, the type
(ci = l, ai = 1) has most to gain by deviating, and thus beliefs that are not ruled out by D1 criterion
must satisfy Pr−i (ci = h | si = 1, ai = 1) = Pr−i (ci = h | si = 1) = 0, E−i (a | si = 1) = 1. With
these beliefs, an equilibrium with r = 0 exists if and only if (1− q)λs ≥ pb+ 12λe.
We have thus proved that for all parameters there is a unique equilibrium that satisfies D1
criterion, and it has the properties stated in the proposition. This completes the proof. �
57
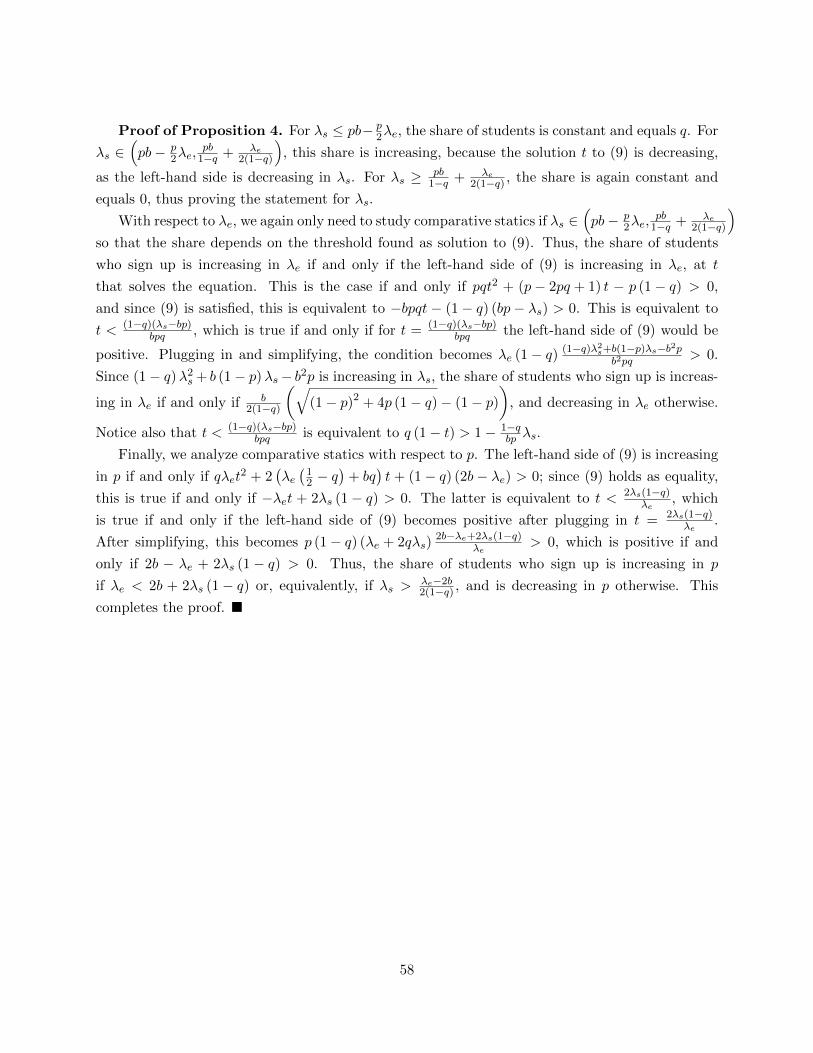
Proof of Proposition 4. For λs ≤ pb− p2λe, the share of students is constant and equals q. For
λs ∈(pb− p
2λe,pb1−q + λe
2(1−q)
), this share is increasing, because the solution t to (9) is decreasing,
as the left-hand side is decreasing in λs. For λs ≥ pb1−q + λe
2(1−q) , the share is again constant and
equals 0, thus proving the statement for λs.
With respect to λe, we again only need to study comparative statics if λs ∈(pb− p
2λe,pb1−q + λe
2(1−q)
)so that the share depends on the threshold found as solution to (9). Thus, the share of students
who sign up is increasing in λe if and only if the left-hand side of (9) is increasing in λe, at t
that solves the equation. This is the case if and only if pqt2 + (p− 2pq + 1) t − p (1− q) > 0,
and since (9) is satisfied, this is equivalent to −bpqt − (1− q) (bp− λs) > 0. This is equivalent to
t < (1−q)(λs−bp)bpq , which is true if and only if for t = (1−q)(λs−bp)
bpq the left-hand side of (9) would be
positive. Plugging in and simplifying, the condition becomes λe (1− q) (1−q)λ2s+b(1−p)λs−b2pb2pq
> 0.
Since (1− q)λ2s + b (1− p)λs− b2p is increasing in λs, the share of students who sign up is increas-
ing in λe if and only if b2(1−q)
(√(1− p)2 + 4p (1− q)− (1− p)
), and decreasing in λe otherwise.
Notice also that t < (1−q)(λs−bp)bpq is equivalent to q (1− t) > 1− 1−q
bp λs.
Finally, we analyze comparative statics with respect to p. The left-hand side of (9) is increasing
in p if and only if qλet2 + 2
(λe(12 − q
)+ bq
)t + (1− q) (2b− λe) > 0; since (9) holds as equality,
this is true if and only if −λet + 2λs (1− q) > 0. The latter is equivalent to t < 2λs(1−q)λe
, which
is true if and only if the left-hand side of (9) becomes positive after plugging in t = 2λs(1−q)λe
.
After simplifying, this becomes p (1− q) (λe + 2qλs)2b−λe+2λs(1−q)
λe> 0, which is positive if and
only if 2b − λe + 2λs (1− q) > 0. Thus, the share of students who sign up is increasing in p
if λe < 2b + 2λs (1− q) or, equivalently, if λs >λe−2b2(1−q) , and is decreasing in p otherwise. This
completes the proof. �
58
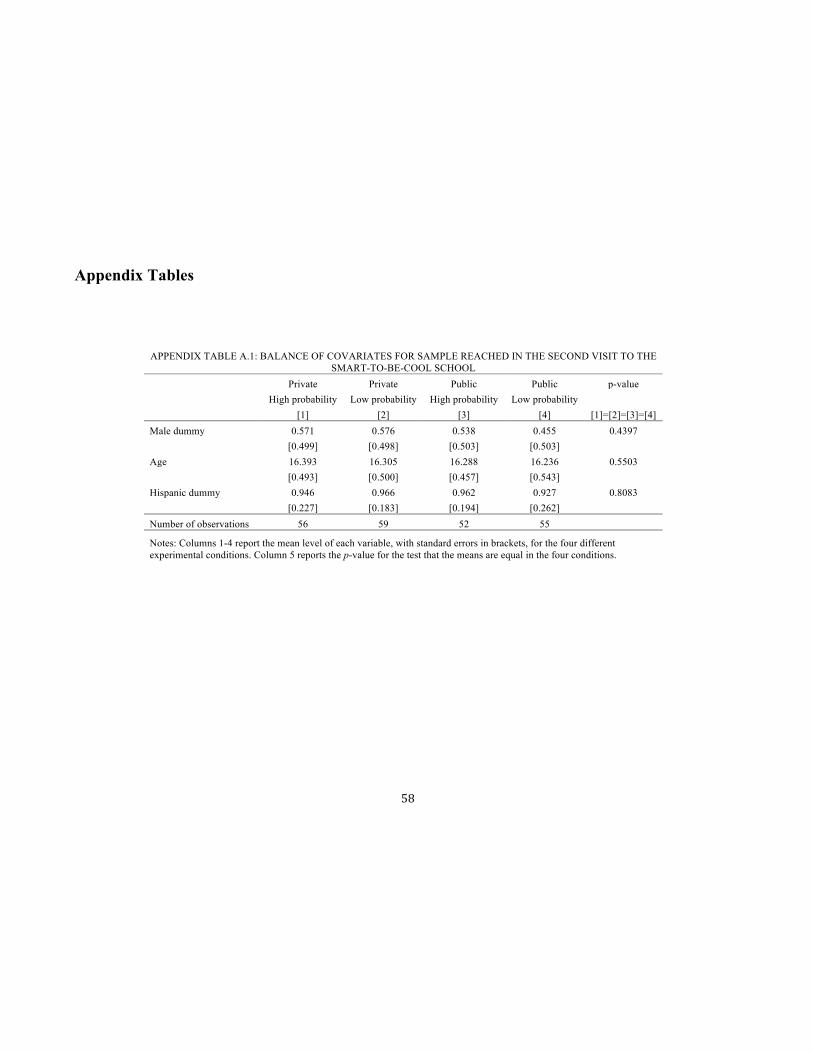
58
Appendix Tables
APPENDIX TABLE A.1: BALANCE OF COVARIATES FOR SAMPLE REACHED IN THE SECOND VISIT TO THE
SMART-TO-BE-COOL SCHOOL Private Private Public Public p-value
High probability Low probability High probability Low probability
[1] [2] [3] [4] [1]=[2]=[3]=[4] Male dummy 0.571 0.576 0.538 0.455 0.4397
[0.499] [0.498] [0.503] [0.503]
Age 16.393 16.305 16.288 16.236 0.5503
[0.493] [0.500] [0.457] [0.543]
Hispanic dummy 0.946 0.966 0.962 0.927 0.8083
[0.227] [0.183] [0.194] [0.262]
Number of observations 56 59 52 55
Notes: Columns 1-4 report the mean level of each variable, with standard errors in brackets, for the four different experimental conditions. Column 5 reports the p-value for the test that the means are equal in the four conditions.
Experimental Forms
First Form – Four Treatment Groups (See Next Page)
60

Student Questionnaire First name:______________________________ Last name:______________________________ Gender (please circle one): Female / Male What is your favorite subject in school? (Please circle one)
a. Math b. English Language Arts c. History/Social Studies d. PE/Elective
[Company Name] is offering a chance to win an SAT prep package intended to improve your chances of being accepted and receiving financial aid at a college you like. The package includes: · Premium access to the popular [App Name] test prep app for one year; · Diagnostic test and personalized assessment of your performance and areas of strength and weakness; · One hour session with a professional SAT prep tutor, tailored to your diagnostic test.
This package is valued at over $100, but will be provided completely free. If you choose to sign up, your name will be entered into a lottery where you have a 25% chance of winning the package. Both your decision to sign up and your diagnostic test score will be kept completely private from everyone, including the other students in the room. Would you like to sign up for a chance to win the SAT prep package? (Please pick one option)
Yes / No
If yes, please provide the following contact information: Email address: _________________________________________ Phone number: (______)______________________
TURN OVER FORM AND WAIT PATIENTLY
Form A337
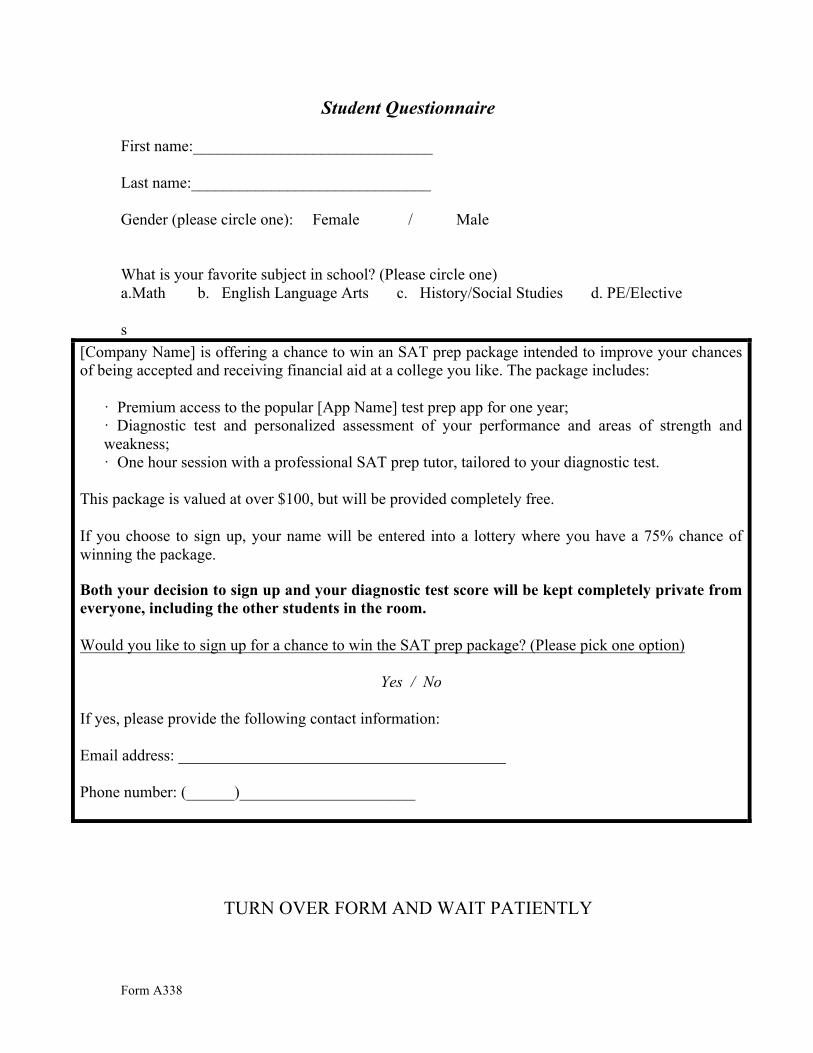
Student Questionnaire First name:______________________________ Last name:______________________________ Gender (please circle one): Female / Male What is your favorite subject in school? (Please circle one) a.Math b. English Language Arts c. History/Social Studies d. PE/Elective
s
[Company Name] is offering a chance to win an SAT prep package intended to improve your chances of being accepted and receiving financial aid at a college you like. The package includes: · Premium access to the popular [App Name] test prep app for one year; · Diagnostic test and personalized assessment of your performance and areas of strength and weakness; · One hour session with a professional SAT prep tutor, tailored to your diagnostic test.
This package is valued at over $100, but will be provided completely free. If you choose to sign up, your name will be entered into a lottery where you have a 75% chance of winning the package. Both your decision to sign up and your diagnostic test score will be kept completely private from everyone, including the other students in the room. Would you like to sign up for a chance to win the SAT prep package? (Please pick one option)
Yes / No
If yes, please provide the following contact information: Email address: _________________________________________ Phone number: (______)______________________
TURN OVER FORM AND WAIT PATIENTLY
Form A338

Student Questionnaire First name:______________________________ Last name:______________________________ Gender (please circle one): Female / Male What is your favorite subject in school? (Please circle one) a. Math b. English Language Arts c. History/Social Studies d. PE/Elective
[Company Name] is offering a chance to win an SAT prep package intended to improve your chances of being accepted and receiving financial aid at a college you like. The package includes: · Premium access to the popular [App Name] test prep app for one year; · Diagnostic test and personalized assessment of your performance and areas of strength and weakness; · One hour session with a professional SAT prep tutor, tailored to your diagnostic test.
This package is valued at over $100, but will be provided completely free. If you choose to sign up, your name will be entered into a lottery where you have a 25% chance of winning the package. Both your decision to sign up and your diagnostic test score will be kept completely private from everyone, except the other students in the room. Would you like to sign up for a chance to win the SAT prep package? (Please pick one option)
Yes / No
If yes, please provide the following contact information: Email address: _________________________________________ Phone number: (______)______________________
TURN OVER FORM AND WAIT PATIENTLY
Form A347

Student Questionnaire First name:______________________________ Last name:______________________________ Gender (please circle one): Female / Male What is your favorite subject in school? (Please circle one) a. Math b. English Language Arts c. History/Social Studies d. PE/Elective
[Company Name] is offering a chance to win an SAT prep package intended to improve your chances of being accepted and receiving financial aid at a college you like. The package includes: · Premium access to the popular [App Name] test prep app for one year; · Diagnostic test and personalized assessment of your performance and areas of strength and weakness; · One hour session with a professional SAT prep tutor, tailored to your diagnostic test.
This package is valued at over $100, but will be provided completely free. If you choose to sign up, your name will be entered into a lottery where you have a 75% chance of winning the package. Both your decision to sign up and your diagnostic test score will be kept completely private from everyone, except the other students in the room. Would you like to sign up for a chance to win the SAT prep package? (Please pick one option)
Yes / No
If yes, please provide the following contact information: Email address: _________________________________________ Phone number: (______)______________________
TURN OVER FORM AND WAIT PATIENTLY
Form A348
Second Form (See Next Page)
65
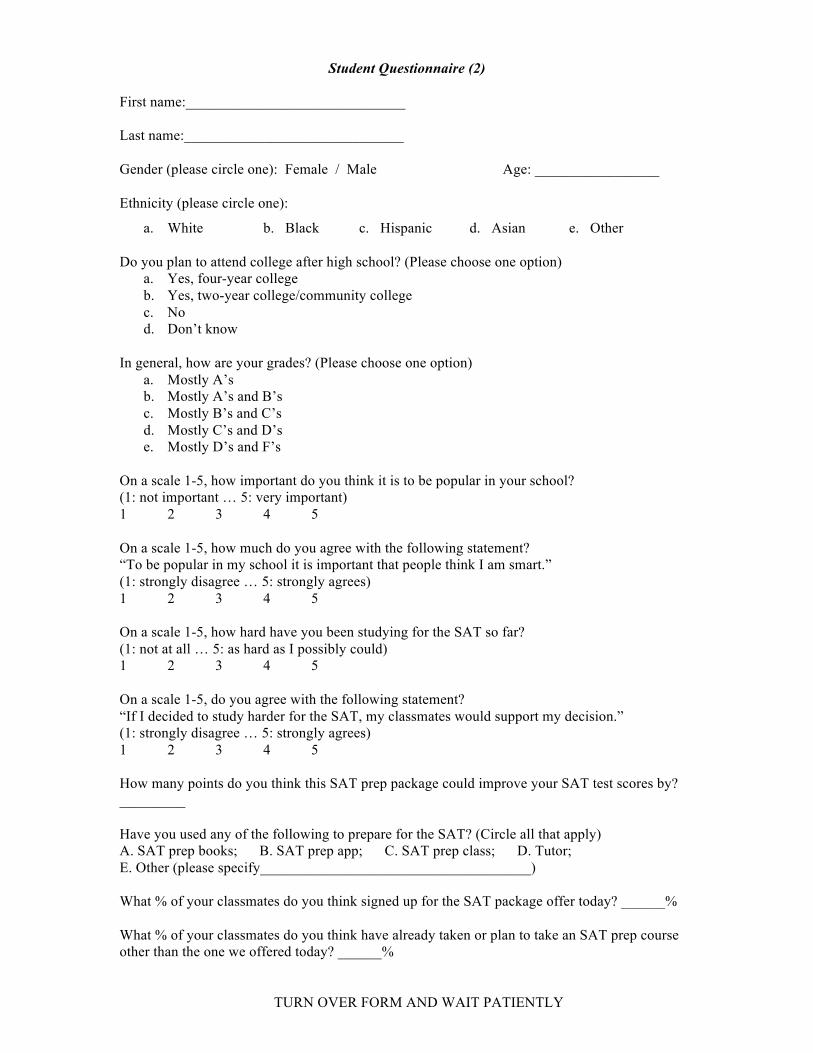
Student Questionnaire (2) First name:______________________________ Last name:______________________________ Gender (please circle one): Female / Male Age: _________________ Ethnicity (please circle one):
a. White b. Black c. Hispanic d. Asian e. Other Do you plan to attend college after high school? (Please choose one option)
a. Yes, four-year college b. Yes, two-year college/community college c. No d. Don’t know
In general, how are your grades? (Please choose one option)
a. Mostly A’s b. Mostly A’s and B’s c. Mostly B’s and C’s d. Mostly C’s and D’s e. Mostly D’s and F’s
On a scale 1-5, how important do you think it is to be popular in your school? (1: not important … 5: very important) 1 2 3 4 5 On a scale 1-5, how much do you agree with the following statement? “To be popular in my school it is important that people think I am smart.” (1: strongly disagree … 5: strongly agrees) 1 2 3 4 5 On a scale 1-5, how hard have you been studying for the SAT so far? (1: not at all … 5: as hard as I possibly could) 1 2 3 4 5 On a scale 1-5, do you agree with the following statement? “If I decided to study harder for the SAT, my classmates would support my decision.” (1: strongly disagree … 5: strongly agrees) 1 2 3 4 5 How many points do you think this SAT prep package could improve your SAT test scores by? _________ Have you used any of the following to prepare for the SAT? (Circle all that apply) A. SAT prep books; B. SAT prep app; C. SAT prep class; D. Tutor; E. Other (please specify_____________________________________) What % of your classmates do you think signed up for the SAT package offer today? ______% What % of your classmates do you think have already taken or plan to take an SAT prep course other than the one we offered today? ______%
TURN OVER FORM AND WAIT PATIENTLY
Final Follow Up Form (See Next Page)
67
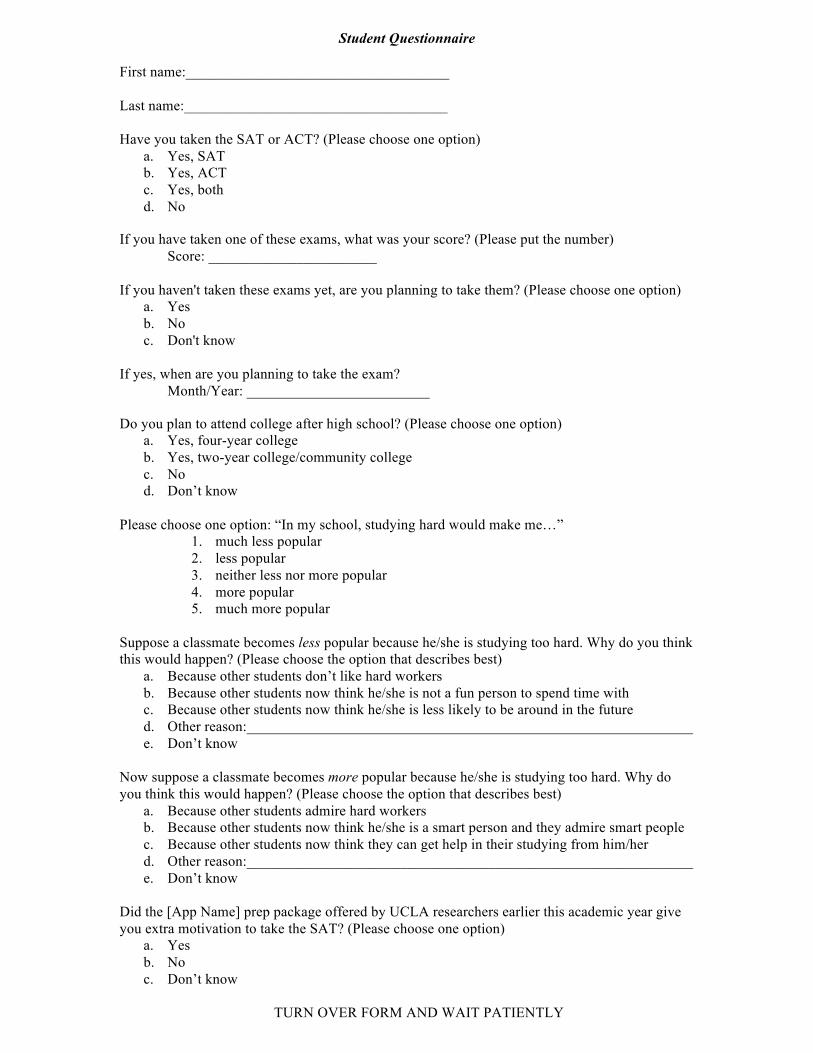
Student Questionnaire
First name:____________________________________ Last name:____________________________________ Have you taken the SAT or ACT? (Please choose one option)
a. Yes, SAT b. Yes, ACT c. Yes, both d. No
If you have taken one of these exams, what was your score? (Please put the number) Score: _______________________
If you haven't taken these exams yet, are you planning to take them? (Please choose one option) a. Yes b. No c. Don't know
If yes, when are you planning to take the exam?
Month/Year: _________________________
Do you plan to attend college after high school? (Please choose one option) a. Yes, four-year college b. Yes, two-year college/community college c. No d. Don’t know
Please choose one option: “In my school, studying hard would make me…”
1. much less popular 2. less popular 3. neither less nor more popular 4. more popular 5. much more popular
Suppose a classmate becomes less popular because he/she is studying too hard. Why do you think this would happen? (Please choose the option that describes best)
a. Because other students don’t like hard workers b. Because other students now think he/she is not a fun person to spend time with c. Because other students now think he/she is less likely to be around in the future d. Other reason:_____________________________________________________________ e. Don’t know
Now suppose a classmate becomes more popular because he/she is studying too hard. Why do you think this would happen? (Please choose the option that describes best)
a. Because other students admire hard workers b. Because other students now think he/she is a smart person and they admire smart people c. Because other students now think they can get help in their studying from him/her d. Other reason:_____________________________________________________________ e. Don’t know
Did the [App Name] prep package offered by UCLA researchers earlier this academic year give you extra motivation to take the SAT? (Please choose one option)
a. Yes b. No c. Don’t know
TURN OVER FORM AND WAIT PATIENTLY
Related Documents