I

Welcome message from author
This document is posted to help you gain knowledge. Please leave a comment to let me know what you think about it! Share it to your friends and learn new things together.
Transcript
I
i
COOK ISLANDS:
MANAGING CLIMATE CHANGE RISKS IN VULNERABLE
COMMUNITIES
Final Report
for
Protecting Island Biodiversity and Traditional Culture in Cook Islands
Through Community-based Climate Risk Management
A project under
RETA 6420
Promoting Climate Change Adaptation in Asia and the Pacific
Asian Development Bank
Small Grants Activity
December, 2010
WWF-Cook Islands/Te Rito Enua
Report Prepared By:
Mona Matepi
George de Romilly
John Waugh

iii
Table of Contents
Executive Summary............................................................................................................ 1
1. Introduction..................................................................................................................... 4
2 Climate, Climate Change and Vulnerability in the Cook Islands .................................. 5
2.1 Climate Change and Vulnerability ............................................................................... 8
2.2 Impacts for Cook Island Communities ........................................................................ 9
2.3 Environmental Impacts............................................................................................... 10
2.4 Social Impacts............................................................................................................. 11
2.5 Economic, financial and socio-cultural impacts....................................................... 13
3 Vulnerability, Exposure and Adaptive Capacity of Vulnerable Cook Island
Communities ..................................................................................................................... 13
4 Managing the Risks: The Community-Based Adaptation Planning ........................... 15
4.1 Methods and activities undertaken to implement the SGA project ......................... 15
5 Community Frameworks for Climate Adaptation ........................................................ 24
5.1 Matavera ...................................................................................................................... 25
5.2 Rua'au.......................................................................................................................... 37
5.3 Aitutaki: Arutanga—Ureia........................................................................................... 48
6 Results............................................................................................................................ 62
6.1 Project outputs............................................................................................................ 62
6.2 Conclusions ................................................................................................................ 63
7. Project Replicability...................................................................................................... 65
7.1 Measures to Support Replication .............................................................................. 66
7.2 General lessons for replication.................................................................................. 66
8 Observations.................................................................................................................. 67
Photo and Illustration Credits.......................................................................................... 68
References ........................................................................................................................ 69
Annex 1: Summary of selected results from household surveys ................................. 71
Annex 2. Household Survey Form................................................................................... 75
Annex 3: Observations & Recommendations Concerning Invasive Vines................... 84
Executive Summary
This report describes a project under the Asian Development Bank's Small Grants Activity
for Climate Change, which field-tested a risk-management process involving a participatory
approach to climate vulnerability assessment and adaptation planning by communities (referred to hereafter as the SGA Project). Information that can inform decision-making must
be consistent with the spatial and temporal scales at which decision-making processes
operate and the nature of the climate risks (Street 2011). The objective was to empower selected communities to develop their own climate adaptation strategies, with a view
towards reducing their risk. The need for community empowerment in planning for climate
adaptation was borne out in the project, and a map-based approach to community
participation succeeded in bringing climate impacts into sharp focus for the communities.
One objective of the project was to develop a scalable approach that would be broadly
applicable within the Pacific Islands. The approach developed is readily replicable at
national, subregional and regional levels, with technical support to remove barriers to implementation identified in the project. Those barriers include a regional shortage of skilled
experts in geographic information systems (GIS), the high costs of GIS software, technical
and financial challenges in accessing georeferenced data and GIS products where they do exist, and in some cases the absence of GIS data, and lack of experience in the
participatory use of maps and mapping tools. With adequate support, these barriers are
easily overcome. Pacific Developing Member Countries (DMCs) and other Small Island
Developing States (SIDS) should consider this approach as a measure to use in the formulation of their respective National Adaptation Plans, Strategies, and policies.
In addition to the development of a replicable model, the project had four concrete outputs:
• Participatory adaptation plans and vulnerability atlases
• Integration of vulnerability atlases and adaptation plans into infrastructure design by
communities and government.
• Information and education campaign formulated to promote the use of micro-adaptation strategies in target communities, Island Councils, and national agencies
• Climate proofing of selected infrastructure project
The first three of these were completed; the latter was continent upon timing with an ADB
technical assistance project for climate proofing infrastructure, with which it was to cooperate; due to unforeseen delays in the ADB project approval process the opportunity for
this activity was lost.
To achieve these outputs, the project introduced participatory mapping techniques and planning in four communities on two islands of the Cook Islands. The project undertook
participatory mapping, involving the use of existing GIS data augmented where necessary
with ground mapping and climate models to present climate risk in ways directly relevant to
community needs and local frames of reference. The resulting maps were used in planning meetings that in turn produced community action plans for climate adaptation. In particular,
through the consultative process:
• The specific localities and buildings vulnerable to impacts from sea-level rise and storm surge were identified;
2
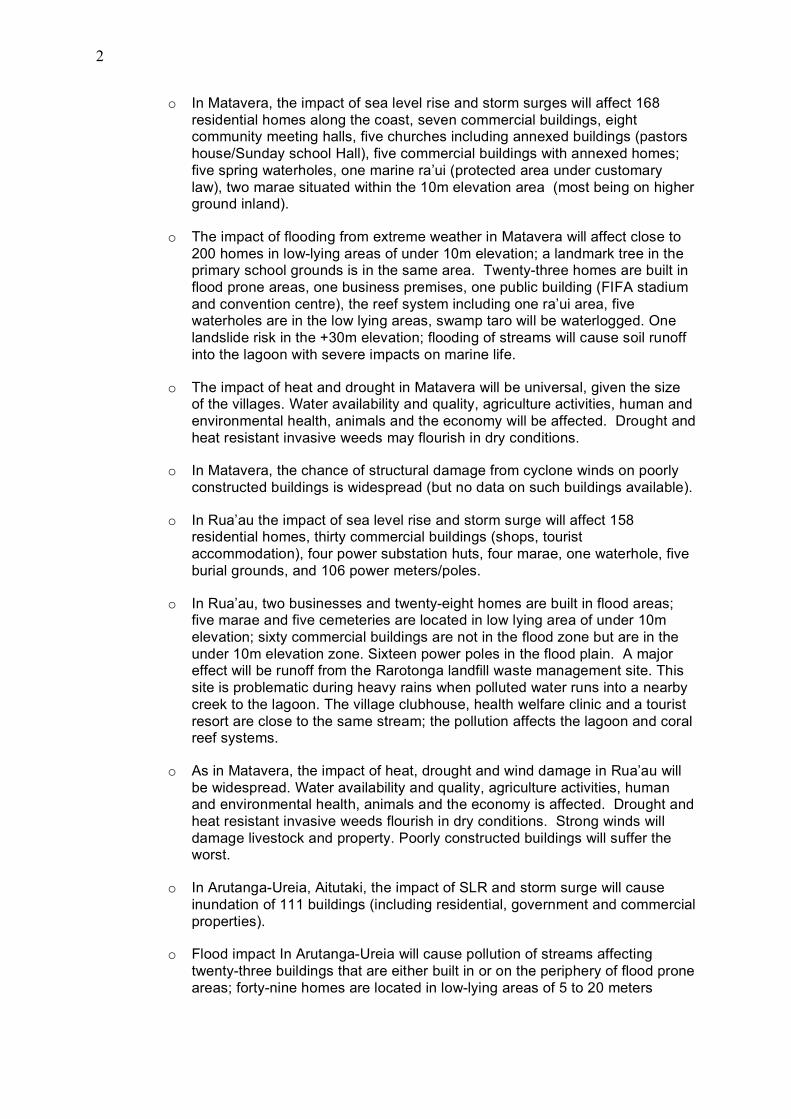
o In Matavera, the impact of sea level rise and storm surges will affect 168
residential homes along the coast, seven commercial buildings, eight community meeting halls, five churches including annexed buildings (pastors
house/Sunday school Hall), five commercial buildings with annexed homes;
five spring waterholes, one marine ra’ui (protected area under customary
law), two marae situated within the 10m elevation area (most being on higher ground inland).
o The impact of flooding from extreme weather in Matavera will affect close to
200 homes in low-lying areas of under 10m elevation; a landmark tree in the primary school grounds is in the same area. Twenty-three homes are built in
flood prone areas, one business premises, one public building (FIFA stadium
and convention centre), the reef system including one ra’ui area, five waterholes are in the low lying areas, swamp taro will be waterlogged. One
landslide risk in the +30m elevation; flooding of streams will cause soil runoff
into the lagoon with severe impacts on marine life.
o The impact of heat and drought in Matavera will be universal, given the size of the villages. Water availability and quality, agriculture activities, human and
environmental health, animals and the economy will be affected. Drought and
heat resistant invasive weeds may flourish in dry conditions.
o In Matavera, the chance of structural damage from cyclone winds on poorly
constructed buildings is widespread (but no data on such buildings available).
o In Rua’au the impact of sea level rise and storm surge will affect 158 residential homes, thirty commercial buildings (shops, tourist
accommodation), four power substation huts, four marae, one waterhole, five
burial grounds, and 106 power meters/poles.
o In Rua’au, two businesses and twenty-eight homes are built in flood areas; five marae and five cemeteries are located in low lying area of under 10m
elevation; sixty commercial buildings are not in the flood zone but are in the
under 10m elevation zone. Sixteen power poles in the flood plain. A major effect will be runoff from the Rarotonga landfill waste management site. This
site is problematic during heavy rains when polluted water runs into a nearby
creek to the lagoon. The village clubhouse, health welfare clinic and a tourist
resort are close to the same stream; the pollution affects the lagoon and coral reef systems.
o As in Matavera, the impact of heat, drought and wind damage in Rua’au will
be widespread. Water availability and quality, agriculture activities, human and environmental health, animals and the economy is affected. Drought and
heat resistant invasive weeds flourish in dry conditions. Strong winds will
damage livestock and property. Poorly constructed buildings will suffer the worst.
o In Arutanga-Ureia, Aitutaki, the impact of SLR and storm surge will cause
inundation of 111 buildings (including residential, government and commercial
properties).
o Flood impact In Arutanga-Ureia will cause pollution of streams affecting
twenty-three buildings that are either built in or on the periphery of flood prone
areas; forty-nine homes are located in low-lying areas of 5 to 20 meters
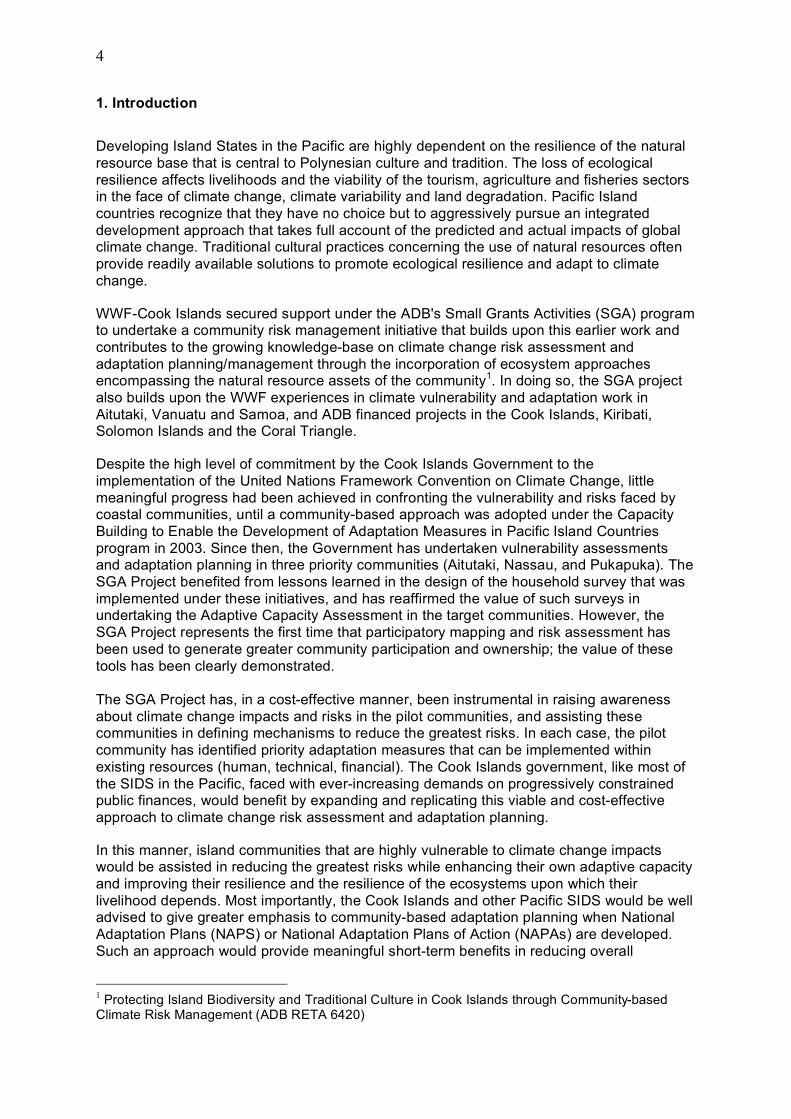
3
elevation. The lagoon systems will be affected by storm runoffs, septic
overflow and debris.
o The Impact of heat and prolonged drought in Arutanga-Ureia will affect water
quality and availability, affect agriculture activities and livestock, the
populations health will be affected, there will be terrestrial biodiversity loss as
invasive plant species resistant to heat and drought will spread; the economy will suffer due to an anticipated decline in visitor numbers.
o Wind damage in Arutanga-Ureia will affect all buildings and utilities, the health
sector, food and water security, social welfare, and tourism. Fifty-four of the buildings are in highly exposed areas (40+ meters elevation), and thirty-two
are moderately exposed in the 30-40 meter elevation range.
o In Arutanga-Ureia, areas vulnerable to flooding, water and vector-borne disease, and pollution from excess precipitation were identified. Specific
households that have inadequate rainwater harvesting and storage facilities
were identified in some communities.
The project found that the participatory processes generated local knowledge unavailable to high-level planners. The process also generated a strong sense of ownership of the
outcomes by communities, and increased the knowledge and awareness of participants
about climate change risks and the implications for their families and communities. Finally, it increased the skills needed to develop more resilient communities.
The project sought to create a role for both contemporary and traditional governance at the
community level through the awareness raised and knowledge gained in the process, but the responsibility for implementation of these community-produced adaptation plans was not
covered within the terms of reference of the project. It is recommended that future
participatory processes building upon this work incorporate support for initial implementation,
either through linking the project to other on-going technical assistance, or through a small-grants facility to support initial work on the highest priority and most innovative activities.
The project found that the approach provides communities with tangible evidence of the
risks associated with climate change, and highlights behavioral and development issues that affect the vulnerability of individual households and the community at large. There was a
discernable sense of empowerment by participating communities in developing vulnerability
maps and planning on the basis of the spatially organized information. All the pilot
communities requested printed copies of the vulnerability atlases for display in public places to engender support for change and implementation of their proposed action plans.
4
1. Introduction
Developing Island States in the Pacific are highly dependent on the resilience of the natural
resource base that is central to Polynesian culture and tradition. The loss of ecological
resilience affects livelihoods and the viability of the tourism, agriculture and fisheries sectors in the face of climate change, climate variability and land degradation. Pacific Island
countries recognize that they have no choice but to aggressively pursue an integrated
development approach that takes full account of the predicted and actual impacts of global climate change. Traditional cultural practices concerning the use of natural resources often
provide readily available solutions to promote ecological resilience and adapt to climate
change.
WWF-Cook Islands secured support under the ADB's Small Grants Activities (SGA) program to undertake a community risk management initiative that builds upon this earlier work and
contributes to the growing knowledge-base on climate change risk assessment and
adaptation planning/management through the incorporation of ecosystem approaches encompassing the natural resource assets of the community1. In doing so, the SGA project
also builds upon the WWF experiences in climate vulnerability and adaptation work in
Aitutaki, Vanuatu and Samoa, and ADB financed projects in the Cook Islands, Kiribati, Solomon Islands and the Coral Triangle.
Despite the high level of commitment by the Cook Islands Government to the
implementation of the United Nations Framework Convention on Climate Change, little
meaningful progress had been achieved in confronting the vulnerability and risks faced by coastal communities, until a community-based approach was adopted under the Capacity
Building to Enable the Development of Adaptation Measures in Pacific Island Countries
program in 2003. Since then, the Government has undertaken vulnerability assessments and adaptation planning in three priority communities (Aitutaki, Nassau, and Pukapuka). The
SGA Project benefited from lessons learned in the design of the household survey that was
implemented under these initiatives, and has reaffirmed the value of such surveys in undertaking the Adaptive Capacity Assessment in the target communities. However, the
SGA Project represents the first time that participatory mapping and risk assessment has
been used to generate greater community participation and ownership; the value of these
tools has been clearly demonstrated.
The SGA Project has, in a cost-effective manner, been instrumental in raising awareness
about climate change impacts and risks in the pilot communities, and assisting these communities in defining mechanisms to reduce the greatest risks. In each case, the pilot
community has identified priority adaptation measures that can be implemented within
existing resources (human, technical, financial). The Cook Islands government, like most of
the SIDS in the Pacific, faced with ever-increasing demands on progressively constrained public finances, would benefit by expanding and replicating this viable and cost-effective
approach to climate change risk assessment and adaptation planning.
In this manner, island communities that are highly vulnerable to climate change impacts would be assisted in reducing the greatest risks while enhancing their own adaptive capacity
and improving their resilience and the resilience of the ecosystems upon which their
livelihood depends. Most importantly, the Cook Islands and other Pacific SIDS would be well advised to give greater emphasis to community-based adaptation planning when National
Adaptation Plans (NAPS) or National Adaptation Plans of Action (NAPAs) are developed.
Such an approach would provide meaningful short-term benefits in reducing overall
1 Protecting Island Biodiversity and Traditional Culture in Cook Islands through Community-based Climate Risk Management (ADB RETA 6420)
5
vulnerability while enhancing adaptive capacity, and should be considered when
implementing measures outlined in Section 4 of the UNFCCC.
The SGA project assisted four vulnerable Cook Island communities with the development of
practical tools and capacity necessary to develop their own community-specific climate risk
analysis including risks and impacts to marine and terrestrial biodiversity and ecosystems
associated with climate change impacts. Consequently, individuals, families, and communities have been empowered to develop their own fine-scale adaptation strategy
including measures to improve the resilience of the natural resource base. This community-
specific risk analysis has been accomplished by creating unique community and site-specific climate risk atlases building upon community vulnerability assessments undertaken by the
National Environmental Services (NES) of the Cook Islands and Red Cross.
Community-based adaptation planning is an integral component of this phased approach. It systematically builds national capacity through strategic interventions, thereby ensuring
country ownership and long-term sustainability. The role of community adaptation planning
and its importance within the context of this phased approach is highlighted below:
The SGA project demonstrated that climate change adaptation planning in the Pacific should not assume that communities within the Pacific DMCs are homogenous, and share common
values, interests and perceptions. Within the four pilot communities that participated in the
project, there are noticeable differences in community value/practices, administrative structures, and perceptions about climate change risks/ priorities. Environmental conditions
vary, as does the value communities place on environmental goods and services. Most
noticeably, levels of development, education and consumerism vary across households even within relatively close-knit communities. Even the sense of "community" varies with
villages on Rarotonga being more cosmopolitan, and placing greater reliance upon
government to assume the leading role when decisions affecting the community are to be
made, whereas in Aitutaki there exists a greater awareness of the need for self-reliance, and emphasis on the use of community structures to meet pressing development challenges.
2 Climate, Climate Change and Vulnerability in the Cook Islands
The Cook Islands have been affected by 143 cyclones between 1820 and 2006, with 119
affecting the Southern Group and 42 the Northern Group, with an average frequency of 0.8
cyclones per season (NIWAR 2009). The occurrence of tropical cyclones tend to be more
frequent during ENSO when warmer than normal sea surface temperatures occur between latitudes 10-15oS, and the eastward migration of the SPCZ occurs in the vicinity of the Cook
Islands and French Polynesia. During ENSO the southern Cook Islands experience a
reduction (up to 60%) of rainfall while in the northern Cook Islands the rainfall increases (up to 200%).
Models indicate that, for the future warmer climate, tropical cyclones will show increased
peak wind speed and increased mean and peak precipitation intensities. The number of intense cyclones is likely to increase. It is likely that maximum tropical cyclone wind
intensities could increase, by 5%-10% by around 2050. Under this scenario, peak
precipitation rates are likely to increase by 25% as a result of increases in maximum tropical
cyclone wind intensities, which in turn cause higher storm surges. When combined with anticipated rise in sea level, this increase in the height of storm surges provides
6
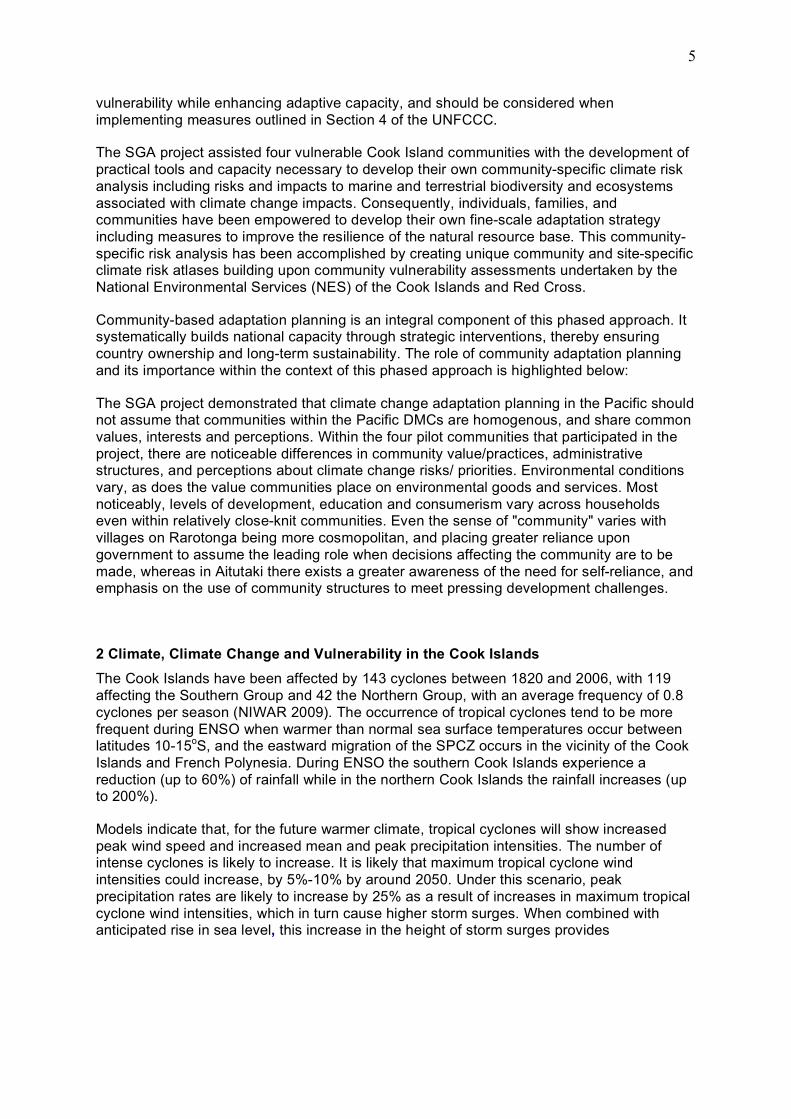
considerable concern for South Pacific Small Island developing States where most development occurs in low-lying coastal areas2 (IPCC 2007b).
Figure 1: Oceania
Tropical cyclones pose significant risks, in that they bring both intense rainfall and high winds, resulting in flooding, landslides and considerable damage in coastal areas from storm surge and high waves. The Cook Islands has encountered a significant increase in the number of tropical cyclones over recent decades. One death is attributed to tropical cyclone Peni in 1990 and eight to tropical cyclone Martin in 1997. Social, economic and environmental loss was extensive and severe after each cyclone. Economic loss after Cyclone Sally in 1987 was estimated at 66% of Cook Islands GDP and Cyclone Peni losses were considered to be over $NZ2 million at a time when the Cook Islands was still recovering from Sally. Six cyclones (Olaf, Meena, Nancy, Percy, Rae, Sheila) struck the Cook Islands in the 2004-2005 season, causing extensive damage, which has cumulatively been calculated to exceed 10% of the Cook Islands total GDP. Four of the tropical cyclones that struck were rated at the maximum Category 5, while cyclones Rae and Sheila were Category 1 events. Cyclone Pat caused extensive damage to Aitutaki in 2010, resulting in an estimated 78% of the houses on the island being destroyed or damaged, requiring an estimated $7,300,000 to repair. There was severe damage and destruction of the local food supply and food security will be affected for the next 3 to 36 months (Office of the Prime Minister, 2010).
2 According to the Fourth Assessment Report of the IPCC, projected globally averaged sea-level rise
at the end of the 21st century, relative to 1980 to 1999 for the six SRES scenarios, ranges from 0.19 to 0.58 m.
7
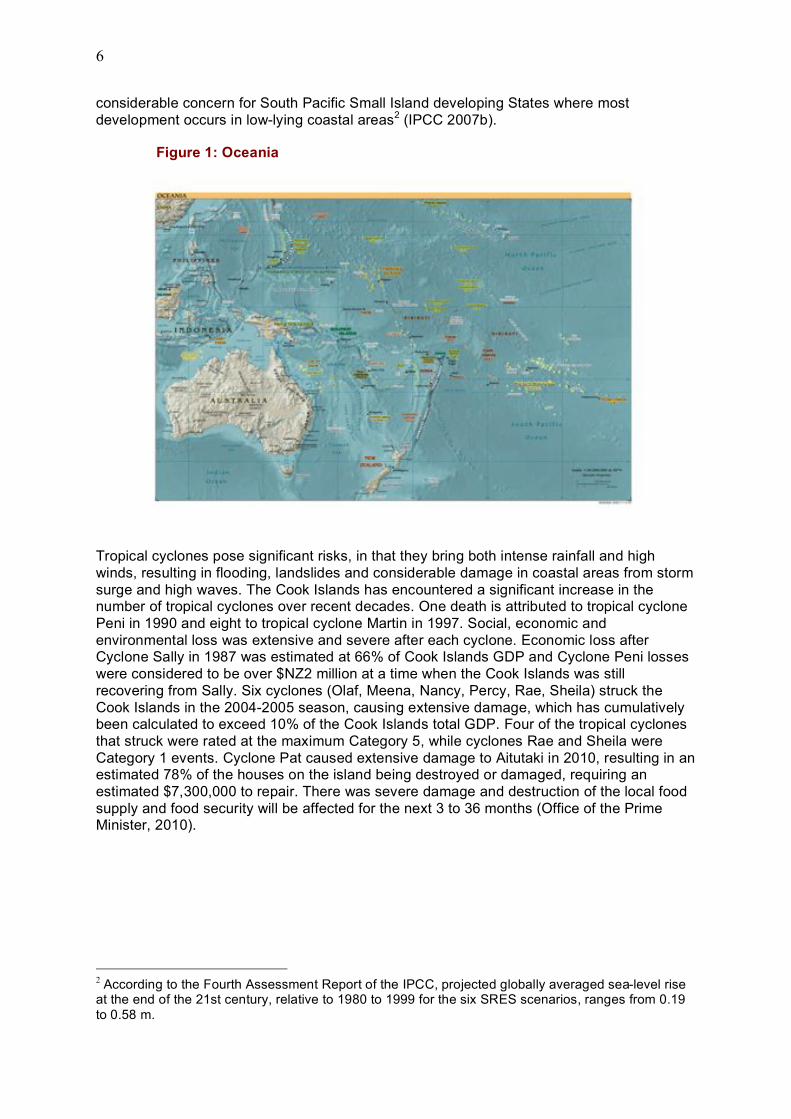
Figure 2: The Cook Islands
8
2.1 Climate Change and Vulnerability
With limited long-term meteorological data available, it is difficult to undertake a trend analysis or make accurate projections of the impacts in the Cook Islands as a consequence
of climate change. However, there is consensus that the Cook Islands is likely to experience
more frequent extreme events, (floods, droughts, extreme heat episodes), an increase in
cyclone intensity, increased climate variability, and sea-level rise. Observations by Pacific Island communities indicate that predicted climate change impacts are being experienced,
and are causing considerable social, economic and environmental pressures.
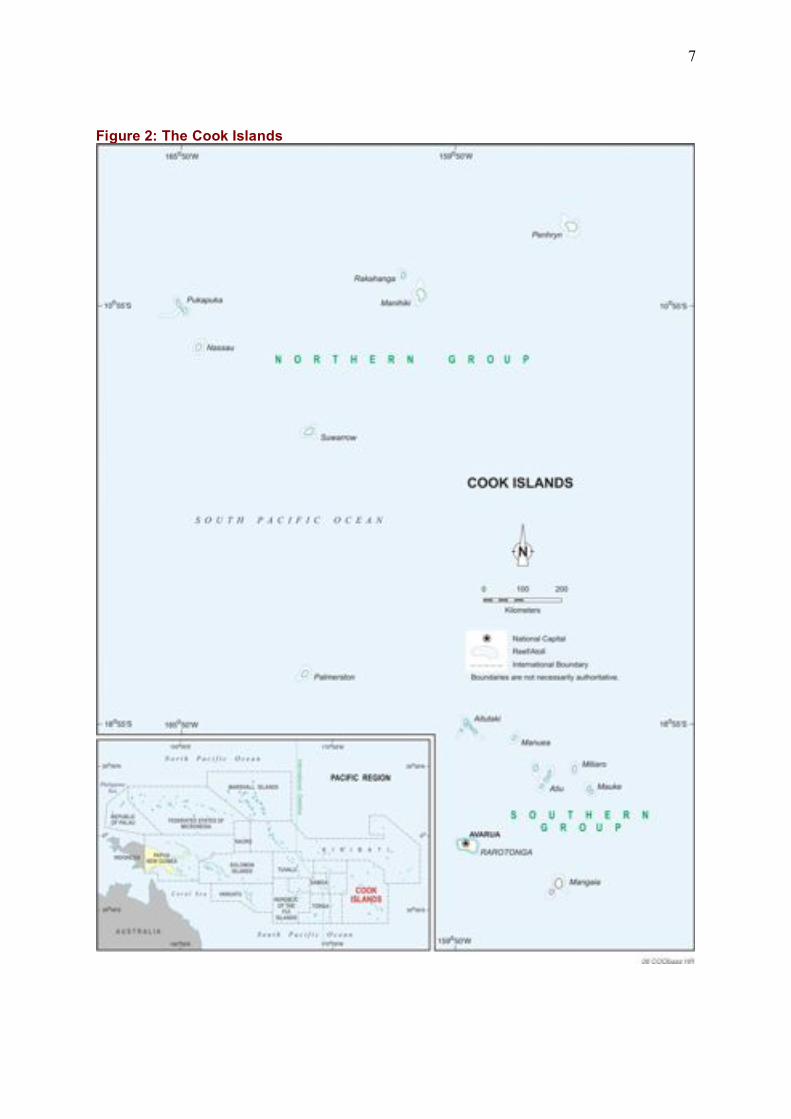
Figure 3: Map of Aitutaki showing area affected by Cyclone Pat (shaded brown)
For the project communities, the magnitude of climate change impacts has far reaching
consequences that threaten future prospects of sustaining traditional community life. Easy
access to New Zealand and Australia makes the Cook Islands a very mobile population, a trend that is exacerbated by natural disasters as was the case after Cyclone Martin
(Manihiki, 1998) when entire families who had lost their homes and all material possessions
migrated overseas. Depopulation due to cyclones therefore remains a threat to the socio-economic survival of communities. The severity of the impacts on their future sustainability is
such that adaptation measures as a matter of priority need to be integrated in everyday
community life, including a return to their former settlements inland, which would require some assistance from national government.
As a result of the preparatory work promoted through the project’s planning workshops,
community consciousness of the urgency to review their own lifestyle and adapt accordingly in the face of persistent or irreversible conditions like near-permanent drought conditions
and other extreme events.
9
The Cook Islands, like many small islands, are highly vulnerable to the impacts of climate
change and sea-level rise. They comprise small landmasses surrounded by ocean, and are located in a region prone to natural disasters, often of a hydrometeorological and/or
geological nature. Many of the small islands have poorly developed infrastructure and limited
natural, human and economic resources, and often, the small island populations are
dependent on marine resources to meet their protein needs. Most of their economies are reliant on a limited resource base and are subject to external forces, such as changing terms
of trade, economic liberalization, and migration flows.
Adaptive capacity to climate change is generally low, due to lack of information and
awareness of climate impacts, although traditional natural resource management, still
practiced in some parts of the Cook Islands, provides important tools for resilience in the face of environmental change. Adaptive capacity in the Cook Islands, like many SIDS, are
affected by external pressures such as terms of trade, impacts of globalization (both positive
and negative), financial crises, international conflicts, rising external debt, and internal local
conditions such as rapid population growth, rising incidence of poverty, political instability, unemployment, reduced social cohesion, and a widening gap between poor and rich,
together with the interactions between them (ADB 2004).
Most settlements are located in coastal locations, with the prime town also hosting the main port, airport and centre of government activities. Heavy dependence on coastal resources
for subsistence is also a major feature of the Cook Islands. Rapid and unplanned
movements of rural and outer-island residents to the major centers is occurring throughout the Outer Islands, resulting in deteriorating urban conditions, with pressure on access to
urban services required to meet basic needs. High concentrations of people in the larger
urban centers is creating social, economic and political stresses, and make people in the
Cook Islands more vulnerable to short-term physical and biological hazards such as tropical cyclones and diseases. It also increases their vulnerability to the impacts of climate change
and sea-level rise (IPCC 2007b, Small Islands, pp 687-716).
Although emitting insignificant amounts of greenhouse gases, the Cook Islands, like many SIDS, has already perceived a need to reallocate scarce resources away from economic
development and poverty alleviation, and towards the implementation of strategies to adapt
to the growing threats posed by global warming (NES 2009).
2.2 Impacts for Cook Island Communities
The people of the Cook Islands have long developed and maintained unique lifestyles
adapted to their natural environment. Traditional knowledge, practices and cultures, where
they are still practiced (particularly in the more remote islands), are strongly based on community support networks; in many islands, a subsistence economy is still predominant.
On many of the islands a strong reliance on the natural resource base (water, marine
resources, soil suitable for agricultural production) to sustain their populations and economic development persists. These natural resources are vulnerable to the impacts of global
climate change, thereby affecting the resilience and adaptive capacity of island communities
in the Cook Islands.
The ADB Climate Change Adaptation Program in the Pacific (CLIMAP, TA-6064-REG) undertook climate risk assessment associated with existing development projects to specify
and act upon the incremental costs of climate adaptation. In the Cook Islands, CLIMAP
reviewed the national development strategy, and developed a climate risk profile for the Cook Islands. It identified the following potential sources of risk:
• Extreme rainfall events (daily total precipitation greater than 200 mm with a total hourly
precipitation above 50mm)
10
• Drought (areas where more than 4 months in the year are likely to be without precipitation
or experience less than 20% of average monthly precipitation recorded for the 1960-1991 period)
• High sea levels and extreme wave heights
• Strong winds (in excess of 47.8m/sec during cyclones)
• Extreme high air temperatures
2.3 Environmental Impacts
Water
Owing to factors of limited size, availability, and geology and topography, water resources are extremely vulnerable to anticipated changes and variations in precipitation, affecting
water quality and availability. The scarcity of fresh water is often a limiting factor for social
and economic development in small islands. With the rapid growth of tourism and service industries in many small islands, there is a need both for augmentation of water resources
and for more efficient planning and management of those resources. Measures to reduce
water demand and promote conservation are also especially important on small islands,
where infrastructure deterioration resulting in major leakage is common, and water pollution from soil erosion, herbicide and pesticide runoff, livestock waste, and liquid and solid waste
disposal results in high costs, crudely estimated at around 3% of GDP in Rarotonga, Cook
Islands. This dependency on rainfall significantly increases the vulnerability of communities in the Cook Islands to future changes in distribution of rainfall.
Coastal systems and resources
The coastlines of the Cook Islands are long relative to island area. They are also diverse and resource-rich, providing a range of goods and services, many of which are threatened
by a combination of human pressures and climate change and variability arising especially
from sea-level rise, increases in sea surface temperature, and possible increases in extreme
weather events.
Significant impacts will almost certainly include accelerated coastal erosion, saline intrusion
into freshwater lenses, and increased flooding from the sea. An extreme example of the
ultimate impact of sea-level rise on small islands is island abandonment, which has already been documented in some regions. On topographically higher and geologically more
complex islands, beach erosion presents a particular hazard to coastal tourism facilities,
which provide the economic thrust for many of the islands. Global change is also creating a
number of other stress factors that are very likely to influence the health of coral reefs around islands, as a result of increasing sea surface temperature leading to coral bleaching,
sea level, damage from tropical cyclones, and possible decreases in growth rates due to the
effects of higher CO2 concentrations on ocean chemistry.
Agriculture, fisheries and food security
The Cook Islands have traditionally depended upon subsistence and cash crops for survival
and economic development, with subsistence agriculture providing local food security. However, in recent years, the larger islands have become increasingly dependant upon
imported foods. Extreme weather events such as tropical cyclones and long periods of
drought, sea level rise and higher temperatures lead to loss of soil fertility and land
degradation thus impacting negatively on food security in communities. The intensity of tropical cyclones produces a concomitant rise in damage to crops and infrastructure. These
impacts have already been witnessed in Aitutaki after Cyclone Pat.
11
Fisheries contribute significantly to GDP on many islands; consequently the socio-economic
implications of the impact of climate change on fisheries are likely to be important and would exacerbate other anthropogenic stresses such as over-fishing. Studies have indicated that
changes in migration patterns and depth affecting the distribution and availability of fishery
resources are to be expected as a result of global climate change. The decline of coral reefs
and other coastal ecosystems that may be severely affected by climate change will also have an impact on fisheries.
Biodiversity
The Cook Islands, like many Oceanic islands, exhibits a unique biodiversity through high endemism (i.e., geographically restricted distribution) caused by ecological isolation.
Moreover, human well being on most small islands is heavily reliant on ecosystem services
such as fresh water and fisheries.
Historically, isolation—by its very nature—normally implies immunity from many threats to
biodiversity, such as invasive species. However, increased climate variability and greater
human mobility is likely to create conditions for the spread of invasive species and the
reduction of forest cover. Small islands are shown to be particularly vulnerable to coastal flooding and decreased extent of coastal vegetated wetlands. There is also a detectable
influence on marine and terrestrial pathogens, such as coral diseases and oyster pathogens,
linked to ENSO events. These changes are in addition to coral bleaching, which could become a biannual event in the next 30 to 50 years or sooner without an increase in thermal
tolerance of 0.2 to 1.0°C. according to the Hadley Centre Coupled Model version 3 general
circulation model (Donner et al, 2005). With a scenario of increasing extreme events such as cyclones, flooding and drought, forest biodiversity could be severely affected, as adaptation
responses of natural systems are expected to be slow, and impacts of storms may be
cumulative.
2.4 Social Impacts
Health
The Cook Islands, like many small island states, suffers health burdens from climate-
sensitive diseases, including morbidity and mortality from extreme weather events, certain vector-borne diseases, and food and water-borne diseases. Tropical cyclones, storm surges,
flooding, and drought have both short and long-term effects on human health, including
drowning, injuries, increased disease transmission, decreases in agricultural productivity,
and an increased incidence of common mental disorders. The incidence of diarrhoeal diseases is associated with annual average temperature and negatively associated with
water availability in the Pacific. Therefore, increasing temperatures and decreasing water
availability due to climate change may increase burdens of diarrhoeal and other infectious diseases in some small island states (ADB 2005). Ciguatera, a food borne illness caused by
the consumption of reef fish contaminated with dynoflagellates, is common in the Cook
Islands. Pollution and warming have been implicated in ciguatera outbreaks, including, in the Pacific, El Niño events.
Settlements and Infrastructure
The concentration of large settlements along with economic and social activities at or near
the coast is a well-documented feature of small islands. In the Cook Islands, villages are located on low coastal areas with most of the population living close to the shoreline. Fishing
infrastructure, government buildings and important facilities such as health clinics,
community meeting halls, churches and school buildings, which serve as cyclone shelters,
12
are frequently located close to the shore. Several challenges will confront the Cook Islands
as a result of climate variability and change. These include:
• In the transportation sector, the risk of closure of roads, airports and bridges due to
flooding and landslides, and damage to port/harbor facilities. The resulting disruption
would impact communications for dependent sectors and services including tourism,
agriculture, the delivery of health care, clean water, food security and market supplies.
• In coastal settlements, particularly on Rarotonga, internal migration from the outer islands
creates additional pressure on ecosystem services, utilities and resources, adding to
problems of waste disposal and land/housing availability. Changes in sea level, and in the magnitude and frequency of storm events, are likely to have serious consequences for
these land uses and for critical infrastructure.
• Inland, rural communities are more likely to be adversely affected by negative impacts on agriculture, given that they are often dependent upon crop production for many of their
nutritional requirements.
An important consideration in relation to settlements is housing. In the Cook Islands, like
many parts of the Pacific, traditional housing styles, techniques and materials were either resistant to damage or could be quickly repaired. The move away from traditional housing
designs have increased vulnerability to thermal stress, slowed housing reconstruction after
storms and flooding, and increased the dependence upon air-conditioning. As a result, settlement patterns in the Cook Islands have changed over the past two or three decades in
ways that may amplify the risk of climate impacts.
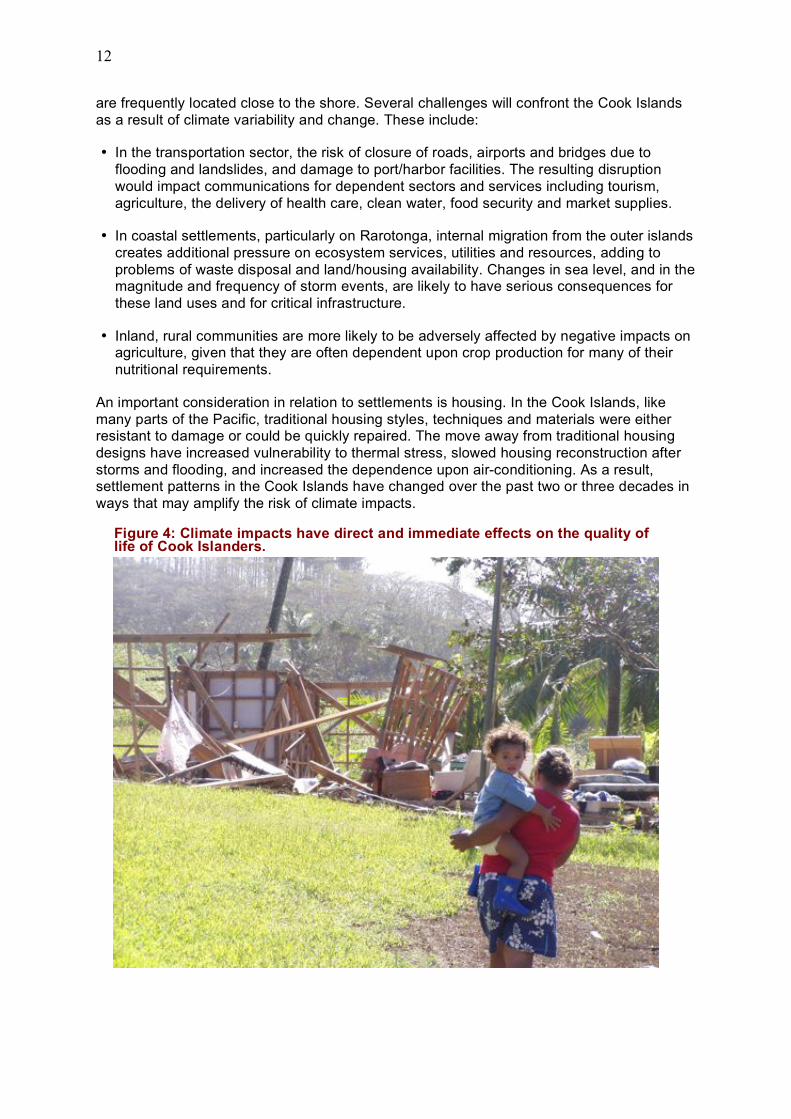
Figure 4: Climate impacts have direct and immediate effects on the quality of life of Cook Islanders.

13
Vulnerability (Exposure + Sensitivity) +/- Adaptive Capacity = Risk
(Adapted from IPCC Fourth Assessment Report, Working Group II,
Impacts, Adaptation, and Vulnerability, 2007)
2.5 Economic, financial and socio-cultural impacts
Tourism is a major economic sector in the Cook Islands, and its importance is increasing. Since the country's economy depends so highly on tourism, the impacts of climate change
on tourism resources will have significant effects, both direct and indirect. Sea-level rise and
increased sea water temperatures are projected to accelerate beach erosion, degrade
natural coastal defenses such coral reefs, and result in the loss of cultural heritage on coasts affected by inundation and flooding. These impacts will in turn reduce attractions for coastal
tourism. Shortage of water and increased risk of vector-borne diseases may steer tourists
away from small islands, while warmer climates in the higher-latitude countries may also result in a reduction in the number of people who want to visit small islands in the tropical
and sub-tropical regions. The cumulative impact of six cyclones on tourism in the Cook
Islands was very noticeable during the 2004-2005 season.
3 Vulnerability, Exposure and Adaptive Capacity of Vulnerable Cook Island
Communities
The IPCC Third Assessment Report (IPCC 2001, p 995, def 1) describes vulnerability as "The degree to which a system is susceptible to, or unable to cope with, adverse effects of
climate change, including climate variability and extremes. Vulnerability is a function of the
character, magnitude, and rate of climate variation to which a system is exposed, its sensitivity, and its adaptive capacity."
Exposure is defined in the same report as "The nature and degree to which a system is
exposed to significant climatic variations." Sensitivity is "the degree to which a system is affected, either adversely or beneficially, by climate-related stimuli. The effect may be direct
(e.g., a change in crop yield in response to a change in the mean, range or variability of
temperature) or indirect (e.g., damages caused by an increase in the frequency of coastal
flooding due to sea level rise)." Adaptive capacity is "The ability of a system to adjust to climate change (including climate variability and extremes) to moderate potential damages,
to take advantage of opportunities, or to cope with the consequences." Climate change risk
is summarized in Text Box 1.
Text Box 1: Climate Change Risk
Any assessment of climate change risk must take into consideration each of these aspects.
During the SGA project, work was undertaken with each of the pilot communities to ensure
that relevant elements of these aspects have been identified and considered in order to
produce the community vulnerability atlases and adaptation plans that will result in all climate change risks and concerns considered in the process, becoming acceptable.
An important factor, when considering adaptation and risk control responses at the
community level, is that stakeholders take time to review all relevant political, social, economic and environmental action plans. Actions taken elsewhere by governments,
14
organizations and individuals, etc., in response to non-climate change issues can impact
both directly and indirectly on the risk management process undertaken within vulnerable communities and determine the viability of the proposed responses to climate change. The
development context is an important aspect in determining adaptive capacity and thereby
possible risk management measures. Poor access to services and employment
opportunities, and migration trends from Outer Islands to Rarotonga must be considered when assessing adaptive capacity.
Determining adaptive capacity is not a precise science and will vary from community to
community; it will be determined by mechanisms that are available to respond to the nature of climate change vulnerability at the present stage of development in the Cook Islands. For
this project, a household survey to quantify access to infrastructure and resources and a
community self-assessment checklist were used to specify adaptive capacity relative to perceived needs. The assessment was undertaken in each pilot community to quantify
adaptive capacity at the level of household, community, sector, and government agency.
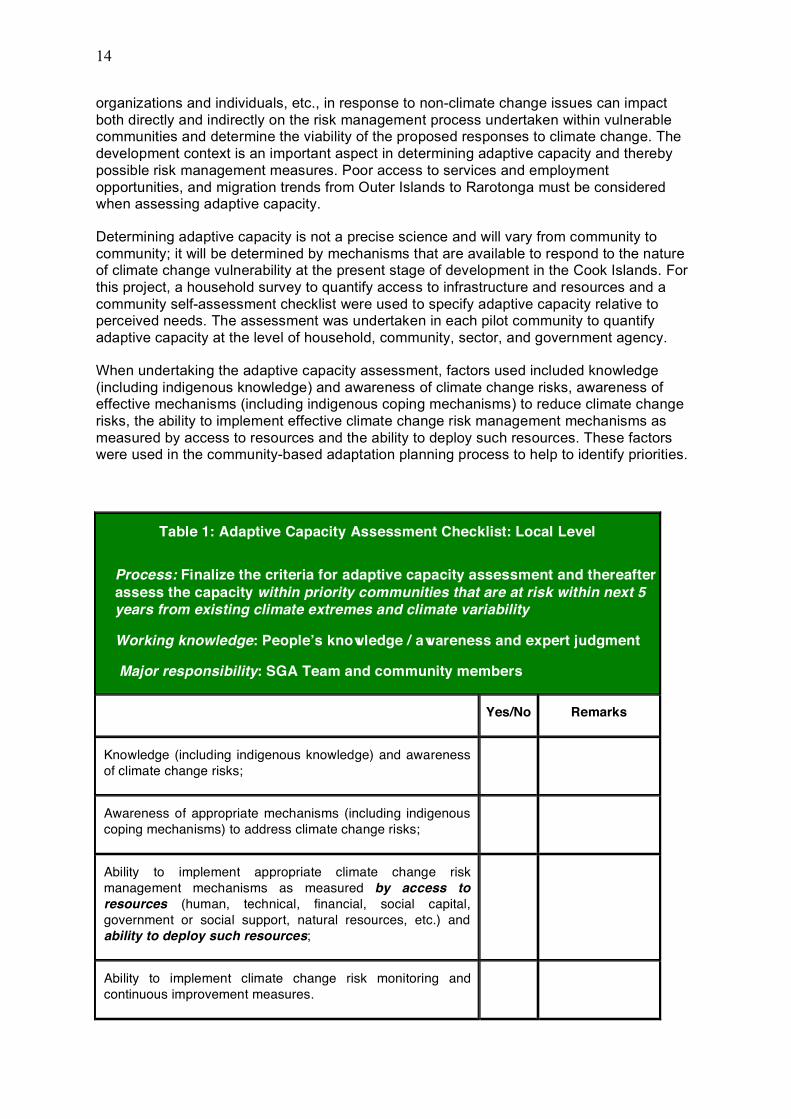
When undertaking the adaptive capacity assessment, factors used included knowledge
(including indigenous knowledge) and awareness of climate change risks, awareness of effective mechanisms (including indigenous coping mechanisms) to reduce climate change
risks, the ability to implement effective climate change risk management mechanisms as
measured by access to resources and the ability to deploy such resources. These factors were used in the community-based adaptation planning process to help to identify priorities.
Table 1: Adaptive Capacity Assessment Checklist: Local Level
Process: Finalize the criteria for adaptive capacity assessment and thereafter
assess the capacity within priority communities that are at risk within next 5
years from existing climate extremes and climate variability
Working knowledge: People’s knowledge / awareness and expert judgment
Major responsibility: SGA Team and community members
Yes/No Remarks
Knowledge (including indigenous knowledge) and awareness
of climate change risks;
Awareness of appropriate mechanisms (including indigenous
coping mechanisms) to address climate change risks;
Ability to implement appropriate climate change risk
management mechanisms as measured by access to
resources (human, technical, financial, social capital,
government or social support, natural resources, etc.) and
ability to deploy such resources;
Ability to implement climate change risk monitoring and
continuous improvement measures.
15
4 Managing the Risks: The Community-Based Adaptation Planning
4.1 Methods and activities undertaken to implement the SGA project
The following sections summarize the main activities undertaken to implement the
community-based mapping and adaptation planning project.
Step 1—Formulate methodology for the preparation of GIS-based Climate
Vulnerability and Risk Atlas (January—February 2010)
Activity
WWF Cook Islands met with national experts to develop a set of "indicators" for mapping
community vulnerability. The set of indicators were developed in consultation with the
National Environment Service (NES). Thereafter, once indicators had been identified, WWF-
Cook Islands met with the government (Ministry of Infrastructure and Planning, Emergency Management/Office of Prime Minister) and private GIS experts to:
1) Design a system for capturing the information in the form of a contextually relevant set of
fields, symbols, and tags that can annotate features with economic, social, and ecological information the communities will provide during the on-the-ground mapping phase, and
2) Specify hardware and software requirements and specifications compatible with the
Government's GIS system (the government system is based on the MapInfo software package). Pathfinder software was used as the interface between the handheld Juno GPS
units and the Mapinfo software package.
The output from focus group meetings with GIS experts within government was in a format
to guide software and hardware procurement undertaken under Activity 2 below.
Method: The indicators of climate change vulnerability included geo-physical in addition to
socio-economic elements, and elements that capture a community's "adaptive capacity".
The starting point for discussion with stakeholders was the list of potential indicators drawn from Cook Islands Initial National Communication and a pioneering community-based
approach to climate change risk management for vulnerable marine and terrestrial
biodiversity under a GEF-funded "Special Program on Adaptation to Climate Change" (SPACC) program in the eastern Caribbean that is being led by the project’s Climate
Change Adaptation Specialist.
Step 2—Software/Hardware Acquisition (February 2010)
Activity
Based upon outputs from the meetings with GIS experts, WWF-CI procured the necessary
GPS hardware and GIS software required for the SGA project3. Hardware and software
procured was selected to be compatible with Government's GIS platform. Once procured, the project's GIS expert configured the hardware and software to contribute to the
documentation of areas of value and concern to communities, to be mapped as GPS
waypoints and annotated with descriptions according to the format developed under Activity
3 In the course of project implementation, the project team concluded that the advantages of using the same software as the government, although convenient in the short term, was due to cost and complexity a significant barrier to entry and an impediment to working at scale.
16
1. This was to be used in Steps 3 and 4 for data collection, to be transformed into a GIS map
layer for use in Step 5.
Step 3—Training of community mappers (March 2010)
Activity
WWF-Cook Islands in collaboration with the project's GIS Expert, the Community Mapping Expert, the National Environment Service and the Ministry of Infrastructure and Planning:
• Prepared training material
• Conducted four day training sessions with individuals from the four target communities to develop their capacity to undertake the community mapping exercise using the acquired
GPS equipment that incorporated the "indicators" for mapping community vulnerability
developed under Step 1.
Methods
Training in participatory mapping methods took place on both Rarotonga and Aitutaki over
four days—two consisting primarily of classroom instruction and practice using paper maps
and two in field practice.
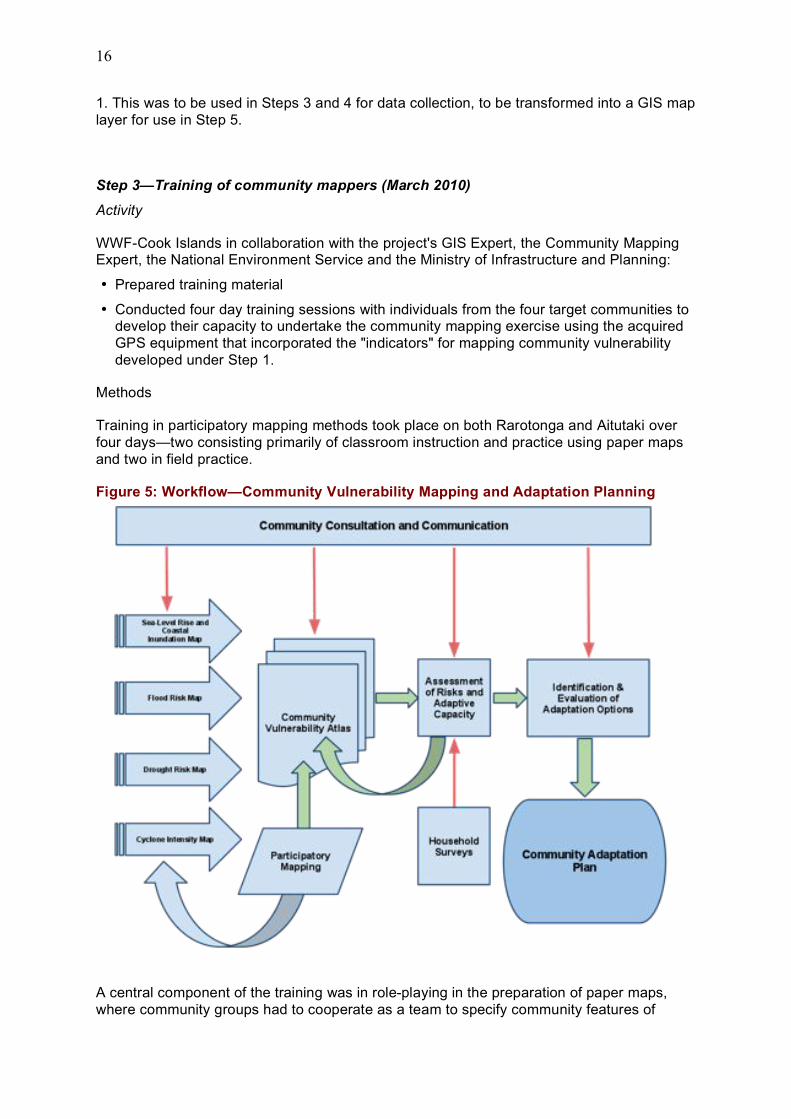
Figure 5: Workflow—Community Vulnerability Mapping and Adaptation Planning
A central component of the training was in role-playing in the preparation of paper maps,
where community groups had to cooperate as a team to specify community features of
17
particular interest or concern, without specification or guidance on the part of the trainers.
This produced a period of uncertainty in which participants had to work out for themselves what could be construed to be significant. The results were telling—invariably the first items
mapped by the groups were marae, ceremonial platforms central to Polynesian culture and
history. Beyond that, the outcomes ranged from recreation (football pitches, fast food
purveyors) to economically important sites (pa'i, or taro swamps, tourism sites), and social sites (churches, schools, and community centers). Natural sites, including infrastructure for
collecting surface water for the community water supplies and areas of pollution, were added
after further reflection, and it was acknowledged that government maps already included almost all the built infrastructure on the islands, discussion focused on the less tangible
features of the cultural and bio/geophysical landscape.
Components of the training included:
• Introduction to participatory mapping (paper map exercises)
• Introduction to vulnerability and risk assessment and climate models
• Introduction to the use of global positioning systems in mapping
• Introduction to geographic information systems and mapping assets
• Map interpretation.
• Field practicum.
Outputs
As a result of the training, all participants had a basic familiarity with the methods to be used
in the project, and at least 80% of the participants had direct hands on experience in the use
of handheld GPS devices for collecting geographic data. Participants used this knowledge in the field sessions to begin to map assets. This achieved two goals, the collection of data and
the orientation of participants to a structured, spatial approach to the community, its assets,
and the forces acting upon these assets. This would in turn facilitate use of maps in planning
in steps 4 and 5.
Participants constituted a cross-section of the community demography, ranging from school
aged youth to elders, including community leaders, resource users, and professional
resource managers. They were mainly self-selected on the basis of personal interests. These interests ranged from technological interests in the Global Position System (GPS)
tools on the part of younger participants, through interests in the technical aspects of natural
resource management and disaster preparation/prevention in the working population, to
documentation of the changing world on the part of the community elders.
A total of 25 people were trained in two sessions (one on the island of Rarotonga for the two
Rarotongan communities and one on the island of Aitutaki for the two Aitutaki communities).
Trainees included: eight community elders (retirees), three youth (secondary school students), five government agency staff, and nine NGO staff and volunteers.
Lessons from the training phase
This project tested a maps based approach to community engagement. The community participants exhibited some initial passivity with regard to mapping on the premise that the
government had already mapped everything that was important. Once they were
empowered to re-envision maps, and given access to mapping tools, however, the
communities took to the exercise with enthusiasm. Being able to participate in the production of maps that were explicitly for and about them gradually led to discussions on their social
and physical environment that went well beyond the more obvious dimensions of climate
18
change and climate adaptation to deeper social issues such as cultural erosion, loss of
language, unsustainable resource use, invasive species, and out-migration. Planning for climate adaptation became a way of framing the broader suite of development issues.
Because of this, the communities were able to take ownership of mapping their environment
and the assets within it that are important to their identity and survival.
Whilst the attraction of technological tools drove the interest of some participants who expresses a keenness to learn new skills in GIS and GPS application, the training offered
went beyond use of technology and provided multi-disciplinary learning so there is a deeper
understanding of what, why and how they can adapt to the changing climate impacts. As one of the senior participants of the Aitutaki planning process observed, “I’ve lived on the
island most of my life, and have today seen things I’ve never noticed before.”
There is a significant lack of capacity relative to demand for mapping skills; the capacity building component of the project provided an introduction to participatory mapping
techniques and to mapping technology, thereby creating an avenue for potential GIS/GPS
users in the communities to seek further training, thus augmenting the limited number of
national GIS experts. Such an exercise could be built upon profitably with additional formal training in the use of geographic information systems.
The Rarotonga and Aitutaki communities are relatively cosmopolitan and accustomed to
government services. In contrast the outer islands with low but more self-reliant populations would have provided opportunities to compare experiences for use in future project design.
A contrast in the choice of sites allows for a more representative participatory approach that
is more beneficial to the recipient country’s needs for future donor investments—flexibility being central to maximizing the benefits of lessons learning from participatory processes
such as this.
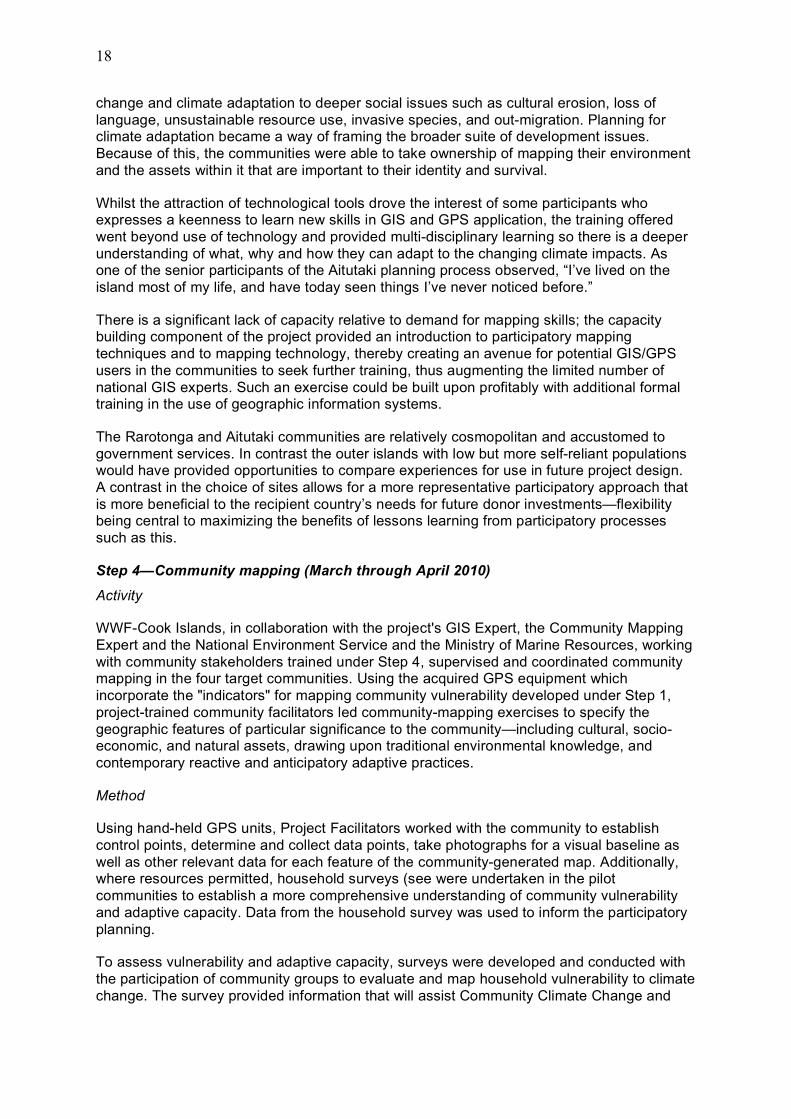
Step 4—Community mapping (March through April 2010)
Activity
WWF-Cook Islands, in collaboration with the project's GIS Expert, the Community Mapping
Expert and the National Environment Service and the Ministry of Marine Resources, working
with community stakeholders trained under Step 4, supervised and coordinated community mapping in the four target communities. Using the acquired GPS equipment which
incorporate the "indicators" for mapping community vulnerability developed under Step 1,
project-trained community facilitators led community-mapping exercises to specify the
geographic features of particular significance to the community—including cultural, socio-economic, and natural assets, drawing upon traditional environmental knowledge, and
contemporary reactive and anticipatory adaptive practices.
Method
Using hand-held GPS units, Project Facilitators worked with the community to establish
control points, determine and collect data points, take photographs for a visual baseline as
well as other relevant data for each feature of the community-generated map. Additionally, where resources permitted, household surveys (see were undertaken in the pilot
communities to establish a more comprehensive understanding of community vulnerability
and adaptive capacity. Data from the household survey was used to inform the participatory
planning.
To assess vulnerability and adaptive capacity, surveys were developed and conducted with
the participation of community groups to evaluate and map household vulnerability to climate
change. The survey provided information that will assist Community Climate Change and
19
Disaster Committees in developing and implementing priority risk management measures to
help individual households respond to climate change risks, including the following:
• An anticipated 0.8m sea level rise, which when combined with storm surge will result in
coastal areas being inundated to an elevation of 2.5m above mean high-water level
• Increase in extreme events (droughts, flooding)
• Increase in cyclone intensity (i.e. more category 4 and 5 cyclones)
• Changes in weather patterns
• Increased episodes of high temperature events
Output
GPS data were converted into GIS layers and integrated as necessary with government GIS
maps to produce working drafts for use in the planning process. Base maps provided by the
government included data on elevation, infrastructure, land use/land cover, and geology. Community data layers added socio-cultural data, primarily of significant cultural sites.
Additional data layers were added including available remote sensing imagery, data layers
derived from downscaled global climate models, and available GIS layers showing land
use/land cover, infrastructure, hydrological features, physical features, biotic communities, etc.
Short profiles were developed on the basis of the community mapping and household
surveys, which serve to set the context and provide an indication of vulnerability and adaptive capacity. These were developed for the four communities that are included in the
SGA community mapping program.
During the fieldwork, an additional issue arose that was not covered in the participatory mapping practices. This was the presence and potential impacts of invasive species on the
environment and ecosystem services. It was observed that the watersheds of both
Rarotonga and Aitutaki were infested with Cardiospermum grandiflorum or balloon vine,
Merremia peltata, and Mikania micrantha, mile-a-minute weed. These infestations present as yet unknown challenges in terms of the resilience of the water supply in the face of
climate change. Annex 3 addresses this issue.
Lessons from the mapping phase
Being faithful to participatory processes requires careful listening and understanding. In a
truly participatory process, participants will guide its evolution. In some cases, this can
produce unanticipated results. In this case, participants balanced the expected interest in
natural resources with a strong focus on cultural resources. Participants wanted to know how climate change could affect ritual platform sites such as marae and other sites of
cultural significance, the availability of traditional medicinal plants, and food security. That
they would use cultural frames of reference for adaptation is an indication that the concerns that they have about climate change go beyond economic and material impacts. Their
concern is for ways in which climate change could accelerate concerns about the impact of
globalization and outbound economic migration on cultural frames of reference, including loss of language and weakening of customary relationships within communities.
20
Figure 6: Community mapping, Aitutaki
Step 5—Preparation of GIS-based Community Climate Change Vulnerability and Risk
Atlases in select communities (April 2010)
Activity
WWF-Cook Islands in collaboration with the project's GIS Expert, the Community Mapping
Expert, the National Environment Service and the Ministry of Infrastructure and Planning developed GIS-based Community Climate Vulnerability and Risk Atlases for the four select
communities (see below).
Method
Local GIS experts with familiarity with government mapping systems, and the same software
used by government were employed in the project to ensure the compatibility of products
from the project with ongoing government climate adaptation.
The project team (consultants, local GIS experts, WWF staff) identified a common set of map outputs combining map layers to address issues identified by community participants in
the training and mapping exercises. These were produced as paper maps (posters) for use
in the planning meetings.
Combining these data helped the communities to "find themselves" in the "official"
geography, and specifically, to see where the priority areas that they themselves have
identified as important might be vulnerable to climate-related risks. Compiled and analyzed data constitute a Community-Level Vulnerability Atlas, which will be housed within the
national GIS office of the Ministry of Infrastructure and Planning, and made available in
printed maps for on-site use by local authorities and community-based risk management
stakeholders.
21
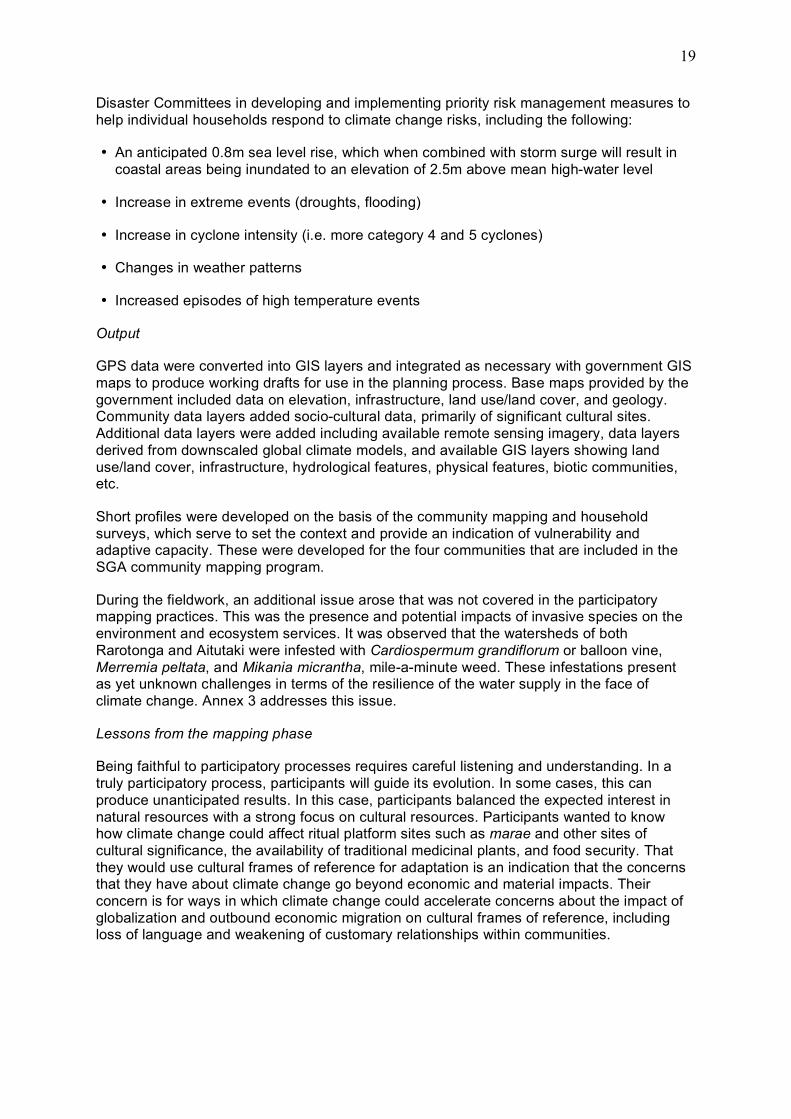
Output
A map series was produced for each community, which constitutes a “vulnerability atlas” for
the community. These were prepared as paper maps for the community planning
workshops. The map files were shared with government to be integrated into the
government GIS database and made accessible to the National Environment Service, the Ministry of Marine Resources and target communities.
Figure 7: Community consultation utilizing draft vulnerability maps
Lessons from the GIS phase: GIS skills are in high demand, primarily due to the amount of disaster risk reduction effort now underway in the region. The project was delayed by the
competing demands for the time and attention of the local experts, an issue that emerged
after the project was planned. In response, WWF/Te Rito Enua identified and trained one of
its own staff in GIS. However, it is clear that the high cost of the proprietary commercial GIS software and the hardware to run it is a significant barrier to entry into this profession.
Step 6—Workshops with communities to review climate change risks and develop the
corresponding adaptation strategies (April to July 2010)
Activity
WWF-Cook Islands in collaboration with the project's Climate Change Adaptation Specialist,
the GIS Expert, the National Environment Service and the Ministry of Infrastructure and Planning convened meetings in the four target communities to specify priority adaptation
options to reduce vulnerabilities recorded on the Community Climate Vulnerability and Risk
22
Atlases (see Figure 5). Based upon the risks, expressed in terms of what is most important
to the community, a Risk Assessment was conducted, and a specific Community Adaptation Strategy developed for each community to protect, substitute, or relocate important "at risk"
assets.
Method
Facilitated workshops were then conducted with Community Climate Change and Disaster Committees and the communities at-large to discuss implications of the mapping and survey
process for community perceptions of climate change. These workshops initiated a process
of prioritization of identified risks and the identification of priority actions.
All project activities were undertaken with the active participation and involvement of Village
Councils, Island Councils and interested members of the site communities. Government
agencies involved were National Environment Service, Ministry of Marine Resources, Ministry of Cultural Development, Ministry of Health, Emergency Management and the
Ministry of Infrastructure and Planning. These agencies provided advise to the initial
development of the project with MOIP, NES and EMCI following through during
implementation. MOIP and Ministry of Culture staff were present at all community consultations and assisted greatly in guiding the community mapping.
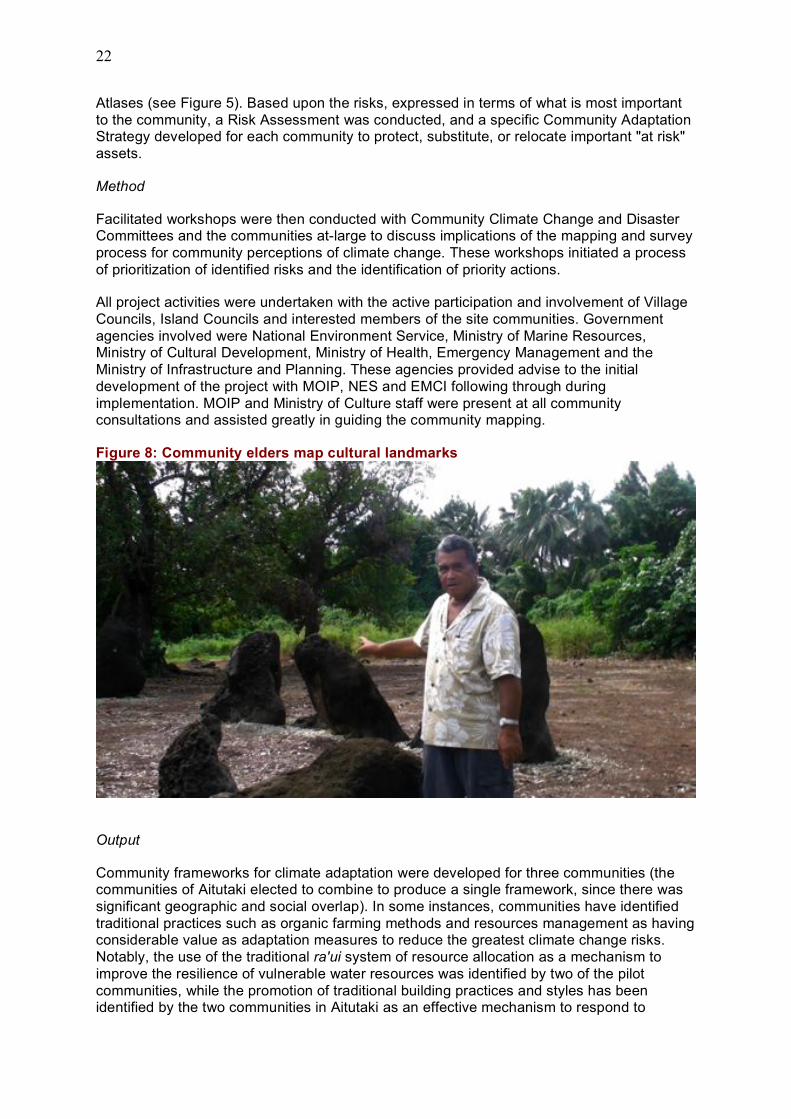
Figure 8: Community elders map cultural landmarks
Output
Community frameworks for climate adaptation were developed for three communities (the communities of Aitutaki elected to combine to produce a single framework, since there was
significant geographic and social overlap). In some instances, communities have identified
traditional practices such as organic farming methods and resources management as having considerable value as adaptation measures to reduce the greatest climate change risks.
Notably, the use of the traditional ra'ui system of resource allocation as a mechanism to
improve the resilience of vulnerable water resources was identified by two of the pilot
communities, while the promotion of traditional building practices and styles has been identified by the two communities in Aitutaki as an effective mechanism to respond to
23
impacts from the anticipated increased in extreme heat events. The positioning of marae by
customary leaders in pre-missionary times as an indication of the boundary for development is worthy of note. In Matavera, all marae were located along the upper boundary of the zone
making them less vulnerable to sea-level rise and storm surge. Their positioning historically
marks the boundaries of pre-contact settlements and the current seaward side of
development. Unfortunately, with the resettlement to the coast in post-missionary times, modern lifestyle has taken precedence in most communities where the wisdom of traditional
norms and practices have blurred with time, therefore elevating their vulnerability to the
impacts of climate change.
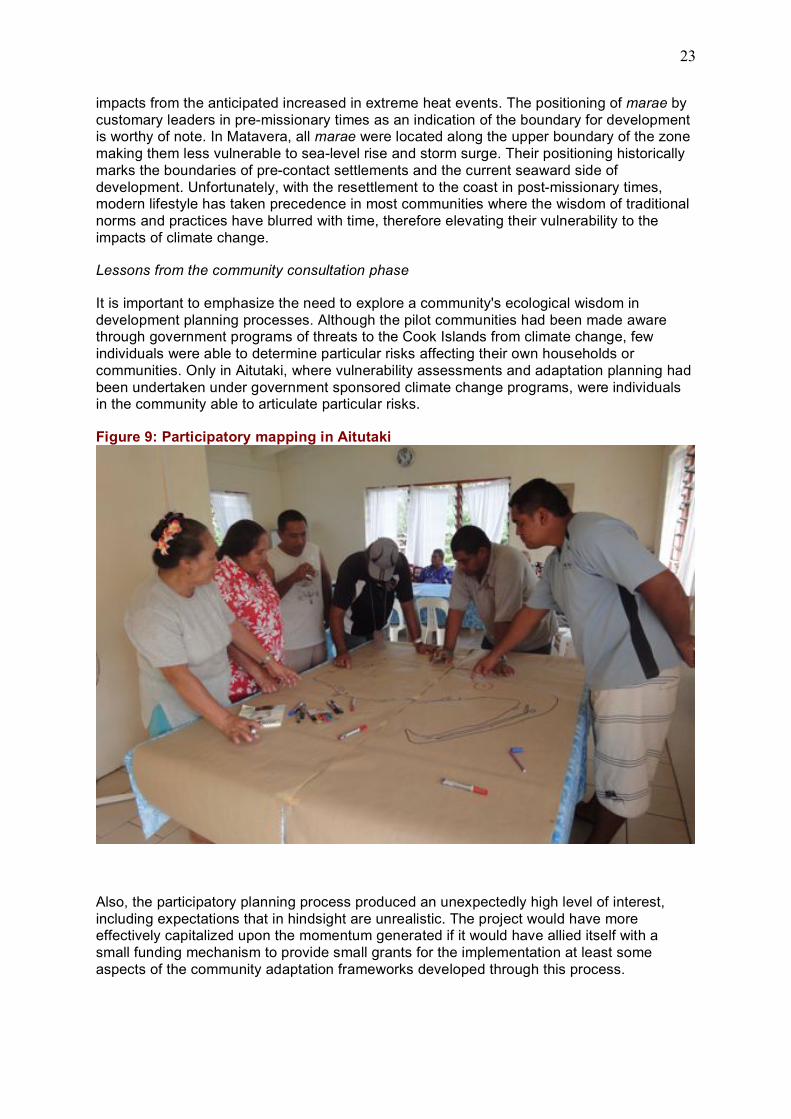
Lessons from the community consultation phase
It is important to emphasize the need to explore a community's ecological wisdom in
development planning processes. Although the pilot communities had been made aware through government programs of threats to the Cook Islands from climate change, few
individuals were able to determine particular risks affecting their own households or
communities. Only in Aitutaki, where vulnerability assessments and adaptation planning had
been undertaken under government sponsored climate change programs, were individuals in the community able to articulate particular risks.
Figure 9: Participatory mapping in Aitutaki
Also, the participatory planning process produced an unexpectedly high level of interest,
including expectations that in hindsight are unrealistic. The project would have more effectively capitalized upon the momentum generated if it would have allied itself with a
small funding mechanism to provide small grants for the implementation at least some
aspects of the community adaptation frameworks developed through this process.
24
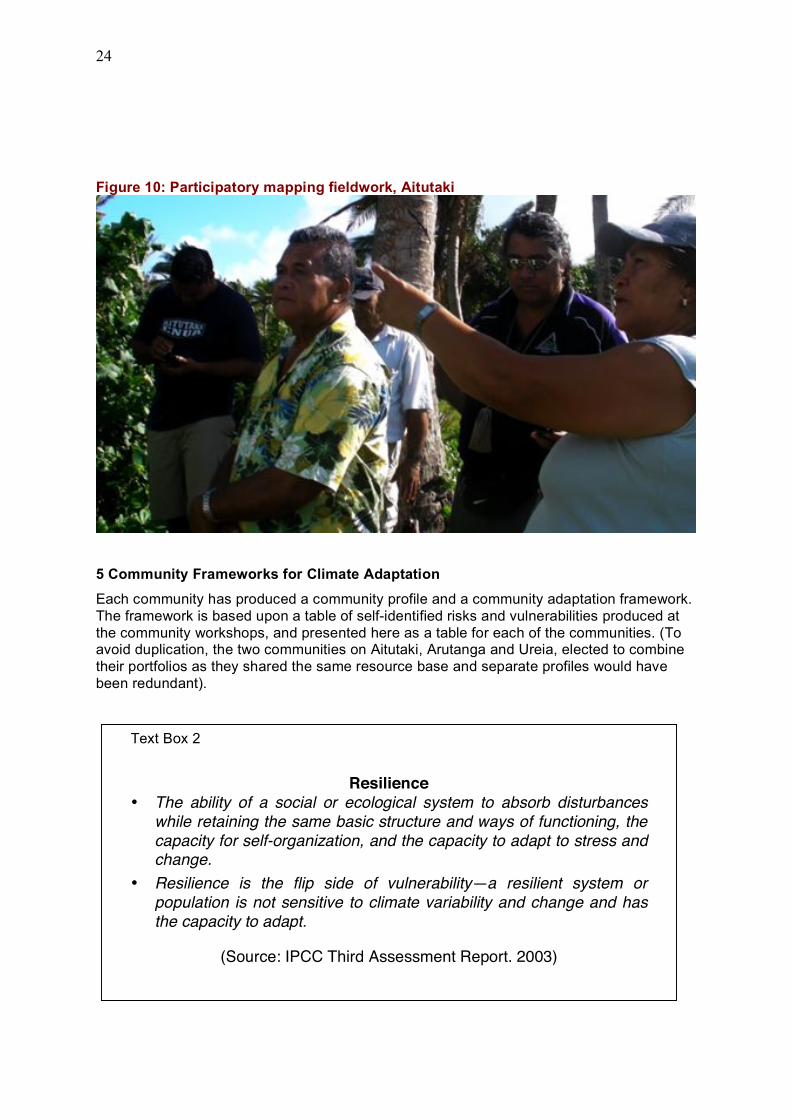
Figure 10: Participatory mapping fieldwork, Aitutaki
5 Community Frameworks for Climate Adaptation
Each community has produced a community profile and a community adaptation framework.
The framework is based upon a table of self-identified risks and vulnerabilities produced at
the community workshops, and presented here as a table for each of the communities. (To avoid duplication, the two communities on Aitutaki, Arutanga and Ureia, elected to combine
their portfolios as they shared the same resource base and separate profiles would have
been redundant).
Text Box 2
Resilience
• The ability of a social or ecological system to absorb disturbances
while retaining the same basic structure and ways of functioning, the
capacity for self-organization, and the capacity to adapt to stress and change.
• Resilience is the flip side of vulnerability—a resilient system or
population is not sensitive to climate variability and change and has
the capacity to adapt.
(Source: IPCC Third Assessment Report. 2003)
25
5.1 Matavera
5.1.1 Community Profile
Location: Also known as Rangiatea, Matavera is a quiet village in Takitumu located to the
coastal northeast of Rarotonga. It was chosen as one of four sites for testing the
participatory planning process in building community capacity to identify, assess, develop
and plan response strategies relevant to their specific situation in the face of climate change.
Most people live on the coast where beachfront homes are built in the vicinity of 100m from
the waters edge. Given the proximity to the sea and reef, at least a third of the community is
vulnerable to storm surges and sea level rise impacts. Inland of the village is a typical terrain of agricultural terraces, flats, and swamps where families plant subsistence crops and raise
livestock with the exception of a few market gardens, and pawpaw and nono plantations for
overseas export. The hilly interior is a water catchment area with an intake that also services the neighboring village of Upper Tupapa.
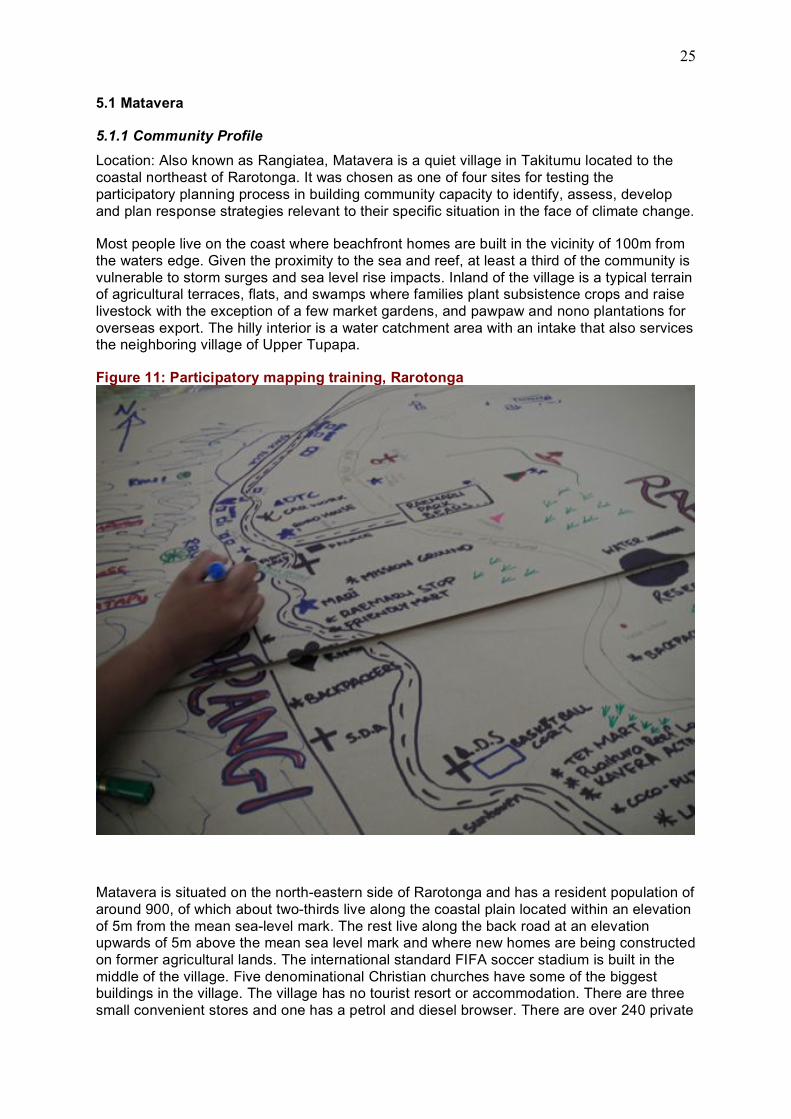
Figure 11: Participatory mapping training, Rarotonga
Matavera is situated on the north-eastern side of Rarotonga and has a resident population of
around 900, of which about two-thirds live along the coastal plain located within an elevation
of 5m from the mean sea-level mark. The rest live along the back road at an elevation upwards of 5m above the mean sea level mark and where new homes are being constructed
on former agricultural lands. The international standard FIFA soccer stadium is built in the
middle of the village. Five denominational Christian churches have some of the biggest buildings in the village. The village has no tourist resort or accommodation. There are three
small convenient stores and one has a petrol and diesel browser. There are over 240 private
26
homes of which locals own 41% outright. 52 of these homeowners rent their properties out;
36 of these properties are rented by businesses. Of homes built in the past two decades, 25% are mortgaged to a bank.
A summary of the household survey was used in the planning process to identify risks and
vulnerabilities of the community. This can be found in annex 1.
Governance: The village has a hierarchical governing system. The Pou'ara as the council of traditional leaders works closely with church groups on social and development issues in the
village. Each of the five religious denominations have their own youth and uniform
organizations who undertake service projects as part of their church's community services. Up until the last general election Matavera had Vaka Councilors who were democratically
elected and supported by the Ministry of Internal Affairs. Their role was to implement small
development projects and maintenance of the village's roads and public properties such as bus shelters. Since the abolition of the Vaka Council however, the community has
maintained the upkeep of roadsides with monthly work parties.
State of the Environment: Matavera has a land area of 4.765 square kilometers,
encompassing its coastal front and hilly interior. Weather conditions are mild with an oceanic climate and two predominant seasons. The drier months from April to November have an
average temperature of about 26 degrees centigrade and an average minimum temperature
of around 20 degrees centigrade. The wetter humid months known as the cyclone season run from December to March with an average temperature of 28o centigrade and an average
minimum of 22o centigrade.
In the last five years, residents have begun to build further inland as occupation rights along the coast leave little room for development. Home construction is expected to fill up the
interior of the district in the near future. Land scarcity will introduce a new range of
environmental issues. Water and land use management is imperative if the village is to
sustain the integrity of its natural resources. The prolific spread of a variety of invasive alien species in the interior is a concern. In particular the balloon vine (Cardiospermum
grandiflorum), mile-a-minute (Mikania micrantha) and peltate morning-glory (Merremia
peltata) infestation in the interior of Rarotonga is rapidly spreading further into the forests and watersheds, resulting in significant, and unsustainable, deforestation.
5.1.2 Vulnerability Atlas
The Matavera community has developed a vulnerability atlas based upon the government
data layers, including maps highlighting the following climate change event risks:
• An anticipated 50cm rise in sea-level, which when combined with storm surge will result
in coastal areas being inundated to an elevation of 3.5m above mean high-water level;
• Increase in extreme events (droughts, flooding)
• Increase in cyclone intensity (i.e. more category 4 and 5 cyclones)
• Changes in weather patterns
• Increased episodes of high temperature events
The vulnerability atlas maps are presented in Figures 14-18.
27
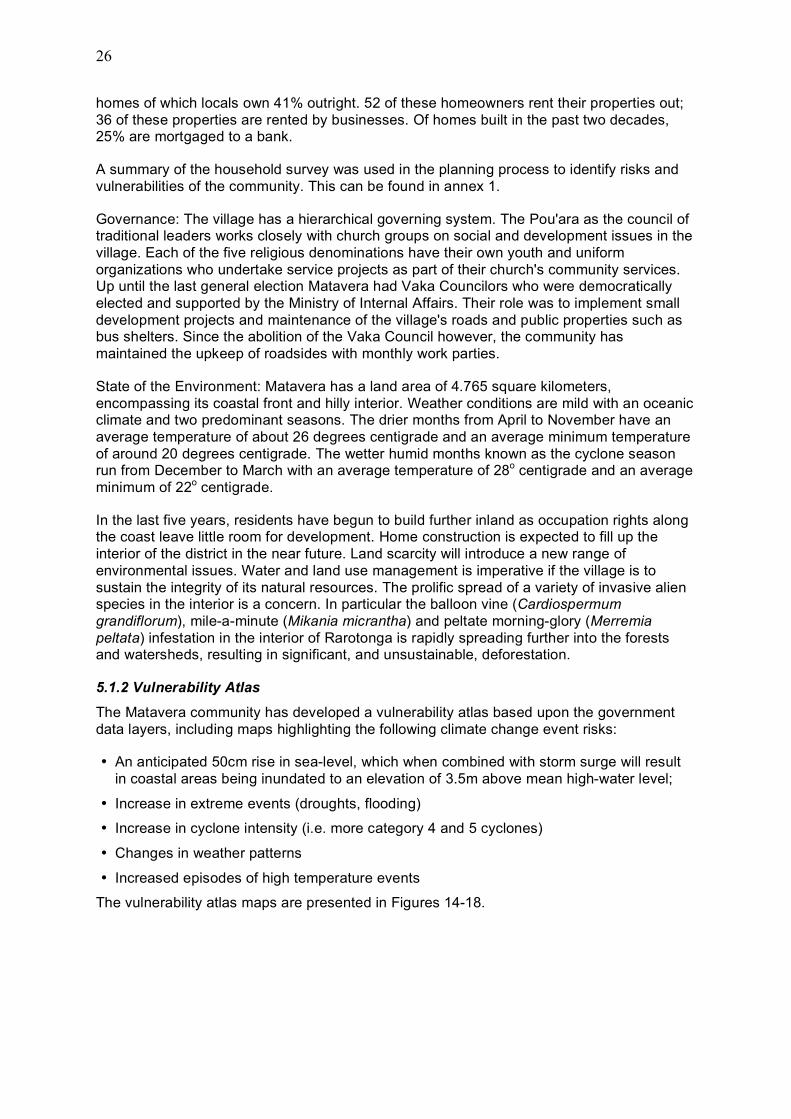
Table 2. Identification of Priority Climate Change Risks for Matavera
Key to Risk Levels: 1=High, 2=medium/high, 3=medium, 4=low, 5=minimal
Key to Threat Ranking: F1 - likely to occur annually, F2 - likely to occur several times/decade, F10, likely to
occur at least once within decade
Key to Severity Levels: a 1-5 scale (1 is highest) based on economic, social, cultural and environmental
impacts
Event Risk Outcome Risk
Risk
Level Severity Frequency
1.1 Damage to cyclone shelter 1 1 F10
1. Sea Level 1.2 Damage to homes and properties 1 1 F10
Rise and Storm 1.3 Loss of income – outmigration 2 1 F10
Surge 1.4 Displaced families 1 2 F10
1.5 Pollution of lagoon and marine life 1 1 F2
2.1 Damage to homes and properties 3 3 F10
2. Increased
2.2 Damage to crops and agricultural
land - staple food shortage 3 2 F2
Incidents 2.3 Loss of income - outmigration 3 3 F2
of Flooding
2.4 Pollution of water ways and
lagoon 1 1 F2
2.5 Displaced families 3 4 F10
3.1 Water shortage 1 1 F2
3. Increased 3.2 Low yield of agricultural crops 2 3 F2
Incidents 3.3 Loss of income - outmigration 4 3 F2
of Drought
3.4 Increased spread of invasive
plants 1 1 F2
3.5 Biodiversity loss 1 1 F2
4.1 Damage to homes and properties 1 2 F2
4.2 Damage to infrastructure 1 2 F2
4.3 Damage to staple food crops 1 2 F2
4. Increase in 4.4 Damage to commercial properties 1 2 F2
Cyclone 4.5 Loss of income – outmigration 3 3 F2
Intensity 4.6 Displaced families 1 3 F2
4.7 Pollution of waterways and
marine life 1 1 F2
4.8 Water and food shortage 2 2 F10
28
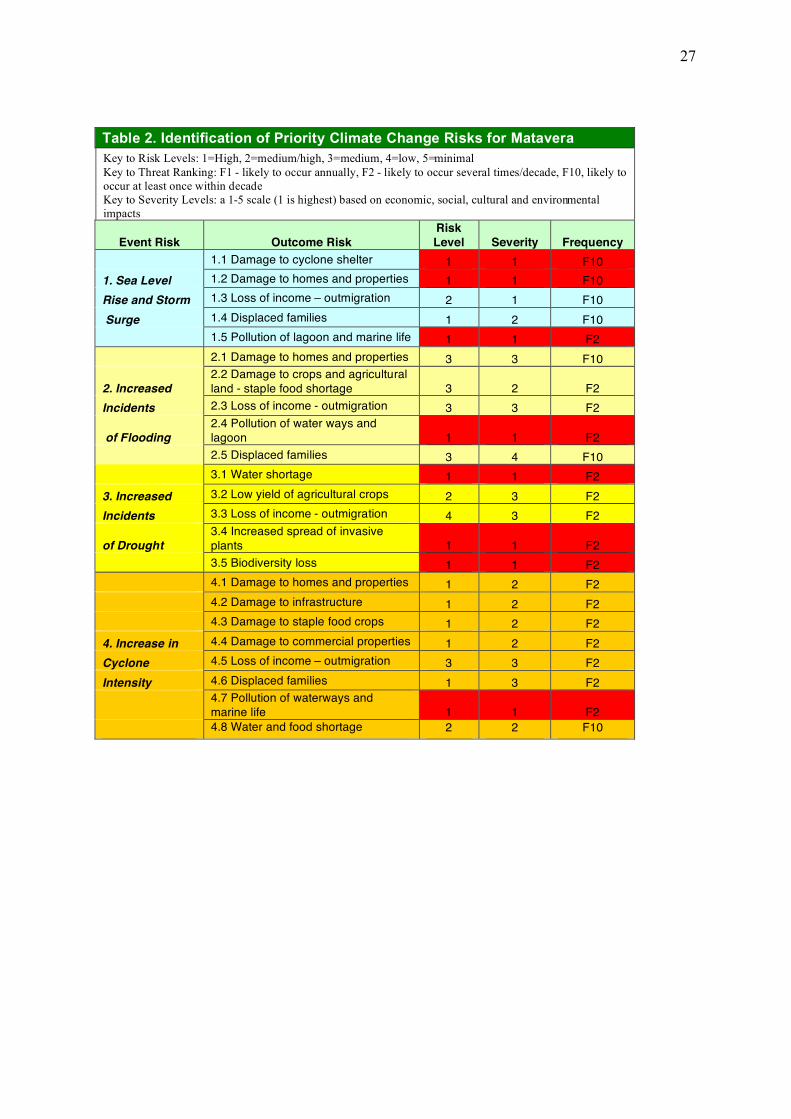
Figure 12: Matavera vulnerable map—flooding (daily total precipitation greater than 200 mm with a total hourly precipitation above 50mm)
29
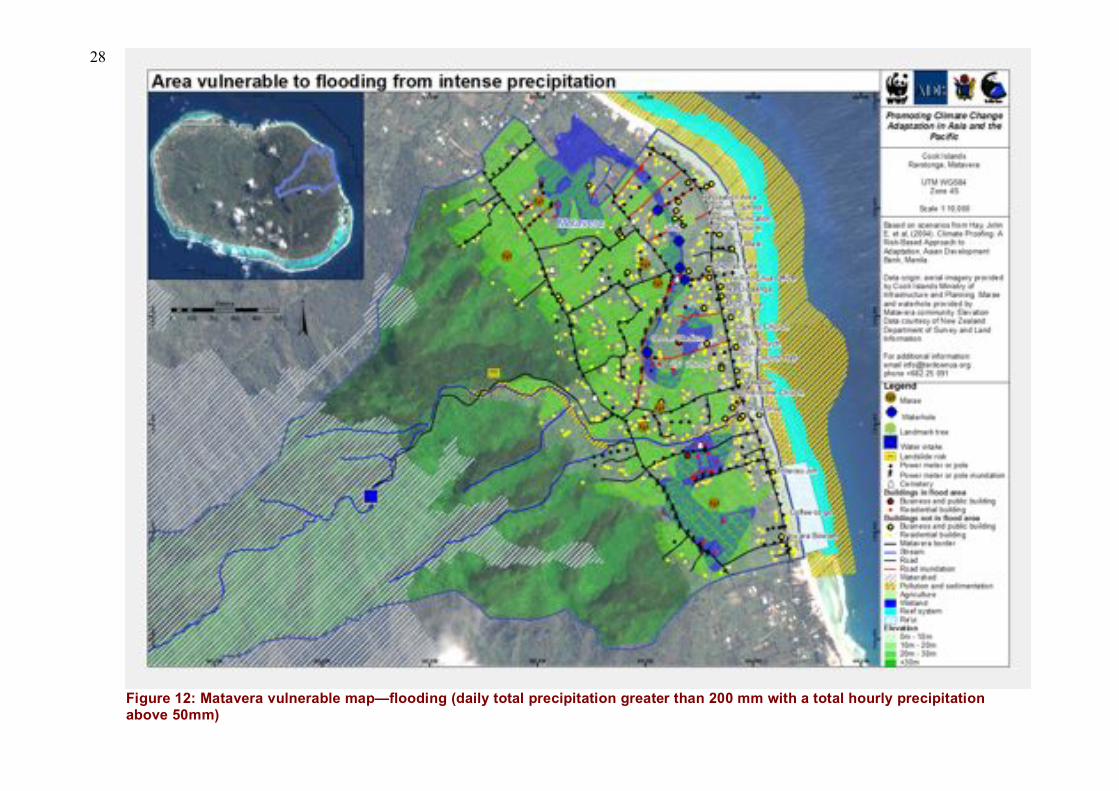
Figure 13: Matavera vulnerable map—drought (areas where more than 4 months in the year are likely to be without precipitation or
experience less than 20% of average monthly precipitation recorded for the 1960-1991 period)
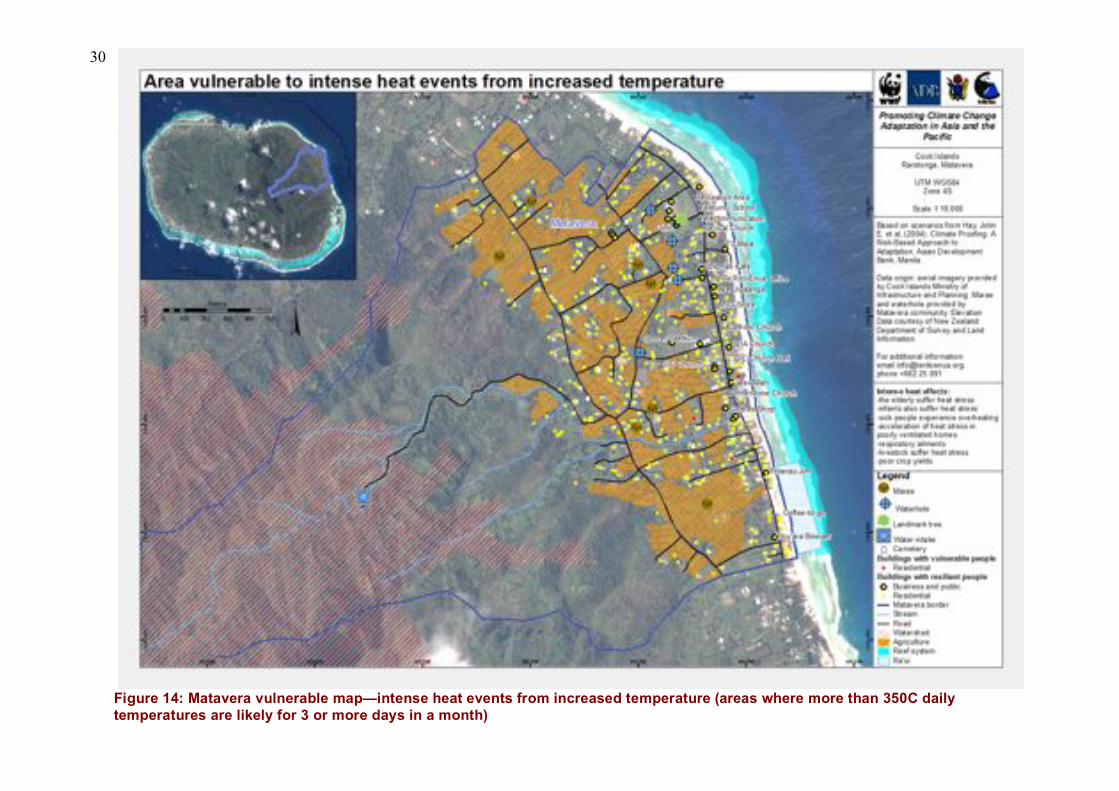
30
Figure 14: Matavera vulnerable map—intense heat events from increased temperature (areas where more than 350C daily
temperatures are likely for 3 or more days in a month)
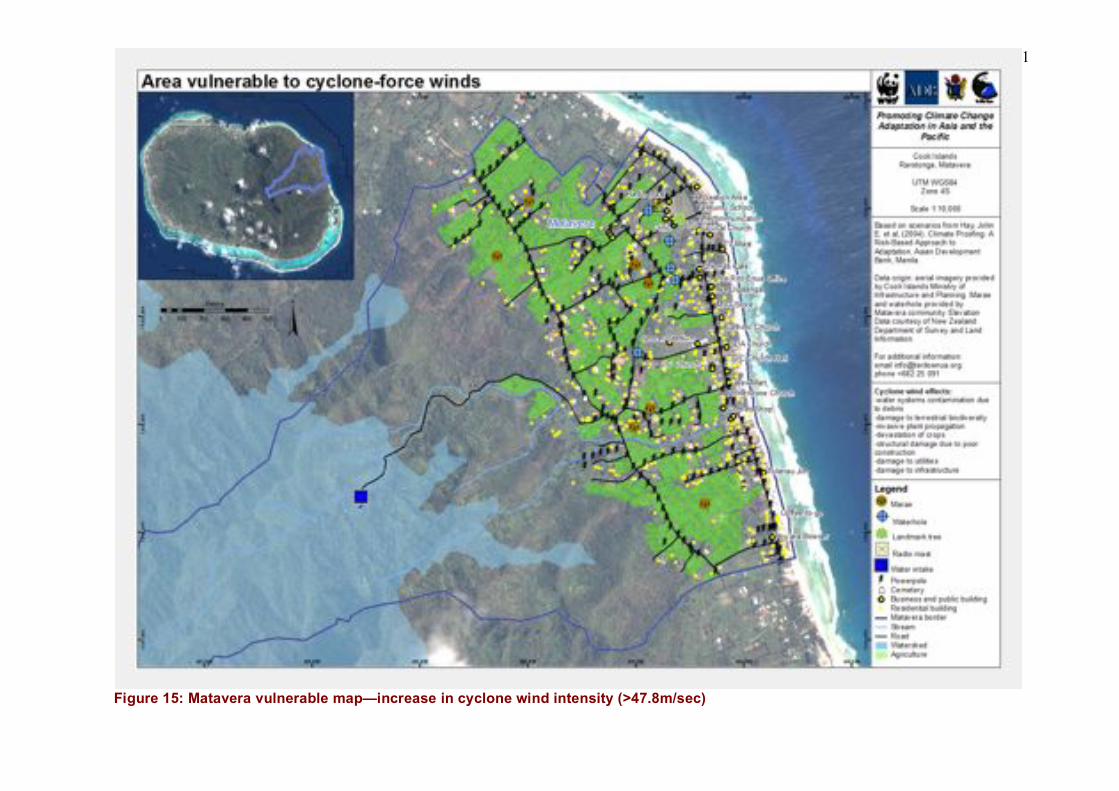
31
Figure 15: Matavera vulnerable map—increase in cyclone wind intensity (>47.8m/sec)
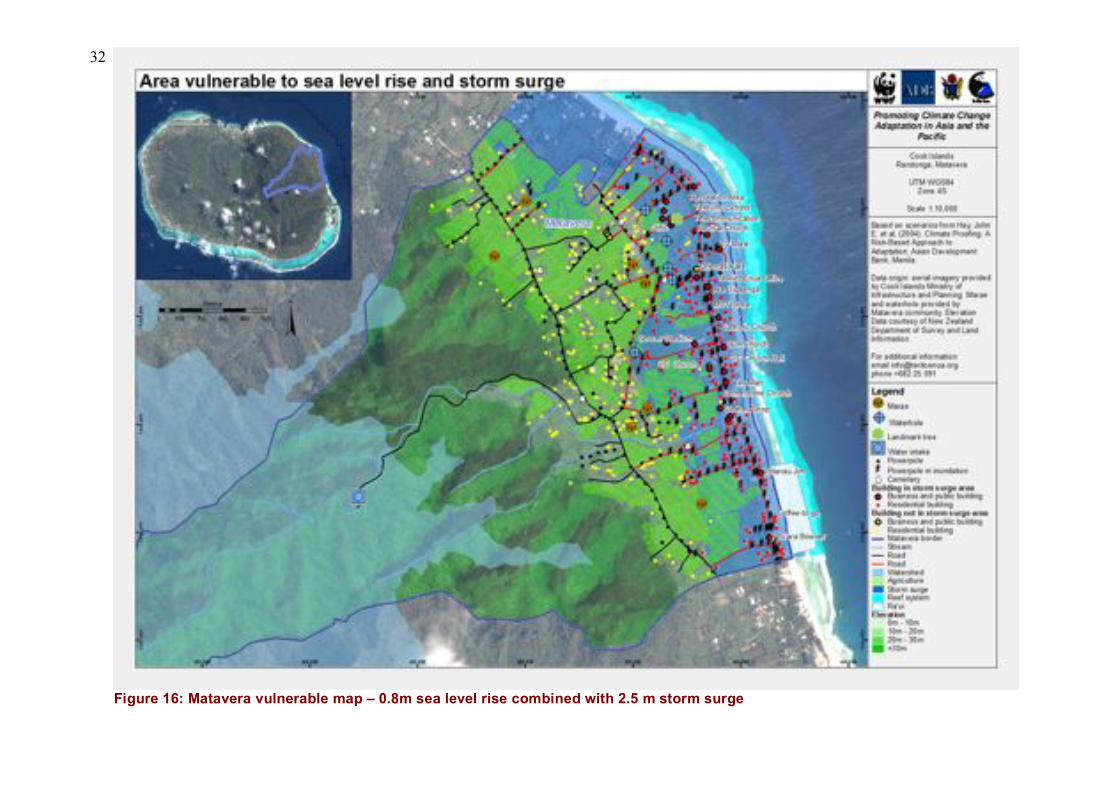
32
Figure 16: Matavera vulnerable map – 0.8m sea level rise combined with 2.5 m storm surge

33
Table 3: Draft Community Adaptation Plan for Matavera
Priority Issue 1: Institutional Arrangements and Disaster Preparedness
– Corresponds to all event risks in Table 2) Agreed Actions
Current Status: Matavera has three designated cyclone shelters; these are
the CICC Sunday School building, the Catholic community hall and the
Takitumu Primary School. All buildings are located on the coast; the two
church halls are within 100m of the foreshore while the school is further inland
at a distance of between 400-500m from the waters edge. These buildings
are used all year round and are fairly well maintained. Community
consultations however have defined the coastal zone as a high-risk area in
the event of cyclones, sea level rise and storm surges. It was noted that pre-
missionary communities lived inland rather than on the coast – as indicated
by the location of the customary Marae that generally follow the 5m elevation
contour. Building cyclone shelters requires careful planning, foremost is
securing land to build on, setting up an implementation body to manage and
mobilize community support.
1. Traditional leaders to call a community meeting to inform
community of findings and discuss/secure 3 inland sites for
cyclone shelter (corresponds to event risk 1.4)
2. Form a working group to implement this action item
3. Set timeframe for report back - end of 2010
4. Utilize government services - NES, MMR, MP to assist in the
re-location of the cyclone shelter,
5. Reform the Village Council representative of
CBOs/NGOs/Traditional leaders/Youth & Uniform
groups/other focus groups in the community and establish a
Community Disaster/Climate Change Committee to
implement this Adaptation Plan.
Priority Issue 2: (Sea Level Rise & Storm Surge)
Damage to homes – (Corresponds to Event Risk 1.2 in Table 2) Agreed Actions
Current Status: The coastal area has an elevation of 5m below sea level,
which makes it a 'high risk' zone. Coastal residents totaling about a quarter of
Matavera's 1000 population are the most vulnerable to sea level rise, storm
surges and cyclone damaging high seas. Most homes are built within 100m of
the foreshore. Natural vegetation on the coastal front provides buffers against
high seas and wind. A few homeowners have cyclone shutters installed and
some homeowners have been proactive in planting coconut trees on their
beachfront for extra protection. Most homeowners have not taken the extra
measures against potential future cyclone damage. There is no insurance
available against cyclone or storm surge for coastal residents.
1. A "community partnering" program where those people with
homes that are located in the vulnerable zone can be
"partnered" with a home in the "safe" area where they can
relocate their family, pets and valuables during a period of
inundation. In this manner, the vulnerable home owners will
ensure the safety and protection of their families and
valuable property, and at best have to re-wire their homes if
the electrical system is damaged by the inundation. At worst,
the community can assist in rebuilding those homes that may
suffer more substantial damage (event risk 1.2)
2. Encouraging new buildings (or renovations to existing
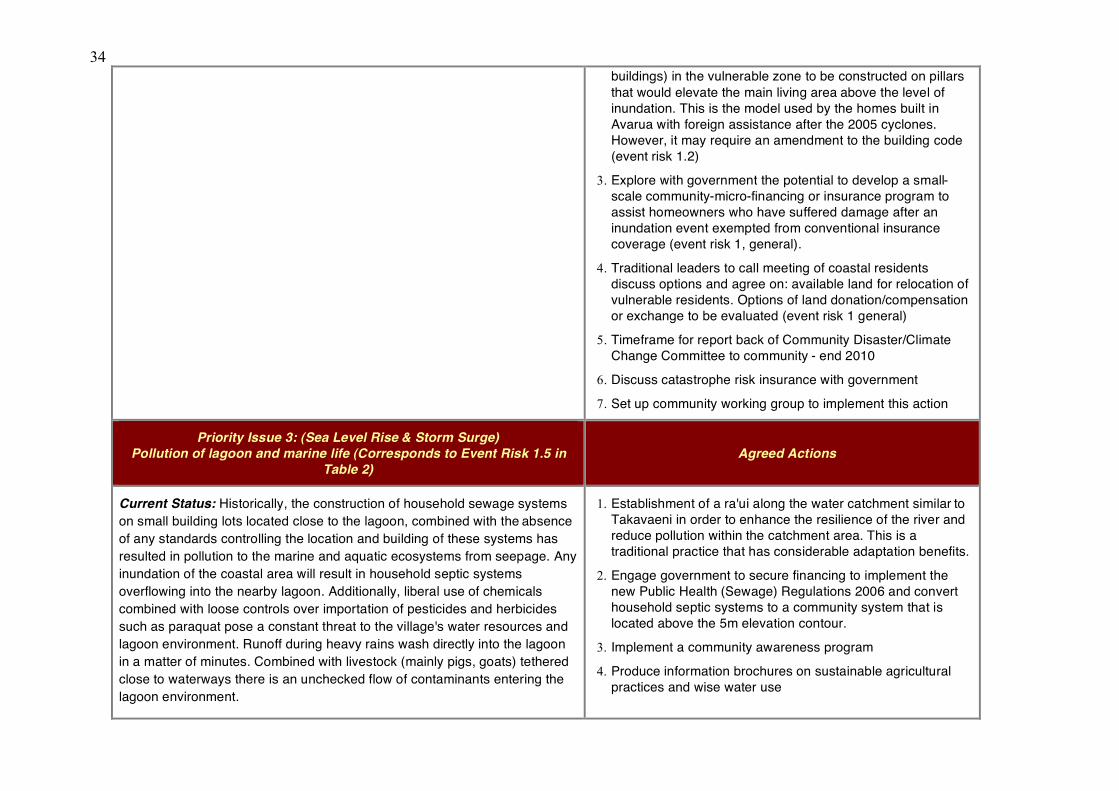
34
buildings) in the vulnerable zone to be constructed on pillars
that would elevate the main living area above the level of
inundation. This is the model used by the homes built in
Avarua with foreign assistance after the 2005 cyclones.
However, it may require an amendment to the building code
(event risk 1.2)
3. Explore with government the potential to develop a small-
scale community-micro-financing or insurance program to
assist homeowners who have suffered damage after an
inundation event exempted from conventional insurance
coverage (event risk 1, general).
4. Traditional leaders to call meeting of coastal residents
discuss options and agree on: available land for relocation of
vulnerable residents. Options of land donation/compensation
or exchange to be evaluated (event risk 1 general)
5. Timeframe for report back of Community Disaster/Climate
Change Committee to community - end 2010
6. Discuss catastrophe risk insurance with government
7. Set up community working group to implement this action
Priority Issue 3: (Sea Level Rise & Storm Surge)
Pollution of lagoon and marine life (Corresponds to Event Risk 1.5 in
Table 2)
Agreed Actions
Current Status: Historically, the construction of household sewage systems
on small building lots located close to the lagoon, combined with the absence
of any standards controlling the location and building of these systems has
resulted in pollution to the marine and aquatic ecosystems from seepage. Any
inundation of the coastal area will result in household septic systems
overflowing into the nearby lagoon. Additionally, liberal use of chemicals
combined with loose controls over importation of pesticides and herbicides
such as paraquat pose a constant threat to the village's water resources and
lagoon environment. Runoff during heavy rains wash directly into the lagoon
in a matter of minutes. Combined with livestock (mainly pigs, goats) tethered
close to waterways there is an unchecked flow of contaminants entering the
lagoon environment.
1. Establishment of a ra'ui along the water catchment similar to
Takavaeni in order to enhance the resilience of the river and
reduce pollution within the catchment area. This is a
traditional practice that has considerable adaptation benefits.
2. Engage government to secure financing to implement the
new Public Health (Sewage) Regulations 2006 and convert
household septic systems to a community system that is
located above the 5m elevation contour.
3. Implement a community awareness program
4. Produce information brochures on sustainable agricultural
practices and wise water use
35
Priority Issue 4: Water shortage and impact on water quality/quantity
due to increased incidents of extreme events (Corresponds to Event
Risks 1.5, 2.3, 3.1, 4.7, 4.8)
Agreed Actions
Current Status: Matavera has one of Rarotonga's 12 interior water intakes,
which feeds into the island-wide network. Water is piped to all homes but the
quality is variable with a tendency to run muddy during heavy rains. Dry
periods are typically during May to October and although Matavera has not
yet experienced water shortage, low pressure during the dry months and
wastage is an issue national government has been trying to address for a
number of years. The user pays concept is recommended to encourage
behavioral change and wise use of water on the island. During flooding
events the main water pipe is frequently damaged or broken where it crosses
the road-bridges as a result of being struck by debris in the swollen streams.
1. Encourage rainwater harvesting and water storage tanks for
all homes - Assist all homeowners to install rain-water
collection pipes and water storage facilities; engage
government to identify financial support
2. Design and implement a water conservation information &
education program in collaboration with the NES
3. Prepare community water management program with
assistance from NES and other relevant agencies
4. Recommend to MOIP, NES that a shut-off valve be installed
at either side of the main water pipe where it crosses the
bridge with a back-up connector pipe that can be rapidly
installed thereby ensuring that water supply is quickly
restored and reducing the time when water supply is
contaminated because of the break in the water main.
Priority Issue 5: Biodiversity loss due to increased incidents of invasive
species from climate variability (Corresponds to Event Risks 3.4, 3.5) Agreed Actions
Current Status: The prolific spread of invasive alien species in the interior of
the village has been a national issue for over 20 years although it was not a
priority concern until recent times with its spread in residential areas. A rapid
assessment of the status of the balloon vine in Matavera shows that the
invasive has spread from the lowlands to dominate the hilly slopes and water
catchment areas of the village. Research has proven that the balloon vine is a
hardy invasive, which overtakes native species and forests. The cloud forests
of the watershed areas hold certain plant species endemic to the Cook
Islands.
1. Control or eradication program - consult with MoA, NHP on
best removal options.
36
5.1.3 Risk Assessment and Adaptation Framework For Matavera
The Risk Assessment undertaken with participants from Matavera resulted in the identification of priority risks expressed in terms of what is most important to the community.
Thereafter, the Community Adaptation Strategy was developed with the community,
specifying measures required to protect important "at risk" assets (Table 3).
The community identified the following:
• The impact of sea level rise and storm surges will affect 168 residential homes along the
coast, seven commercial buildings, eight community meeting halls, five churches
including annexed buildings (pastors house/Sunday school Hall), five commercial buildings with annexed homes; five spring waterholes, one marine ra’ui (protected area
under customary law), two marae situated within the 10m elevation area (most being on
higher ground inland).
• The impact of flooding from extreme weather in Matavera will affect close to 200 homes
in low-lying areas of under 10m elevation; a landmark tree in the primary school grounds
is in the same area. Twenty-three homes are built in flood prone areas, one business
premises, one public building (FIFA stadium and convention centre), the reef system including one ra’ui area, five waterholes are in the low lying areas, swamp taro will be
waterlogged. One landslide risk in the +30m elevation; flooding of streams will cause soil
runoff into the lagoon with severe impacts on marine life.
• The impact of heat and drought in Matavera will be universal, given the size of the
villages. Water availability and quality, agriculture activities, human and environmental
health, animals and the economy will be affected. Drought and heat resistant invasive weeds may flourish in dry conditions.
• The chance of structural damage from cyclone winds on poorly constructed buildings is
widespread (but no data on such buildings available).
The following actions were identified as priorities to be met through the leadership of a proposed Community Disaster/Climate Change Committee:
• Relocate emergency shelters inland
• Reduce vulnerable housing through relocation, home improvements, and pairing with householders with secure housing for emergency relocation
• Establishment of a ra’ui (traditional resource allocation system) in the coastal zone to
protect vulnerable resources and increase resilience
• Convert household septic systems into a waste treatment system for the community
• Encourage water conservation and rainwater housing
• Control and/or eradicate alien invasive species
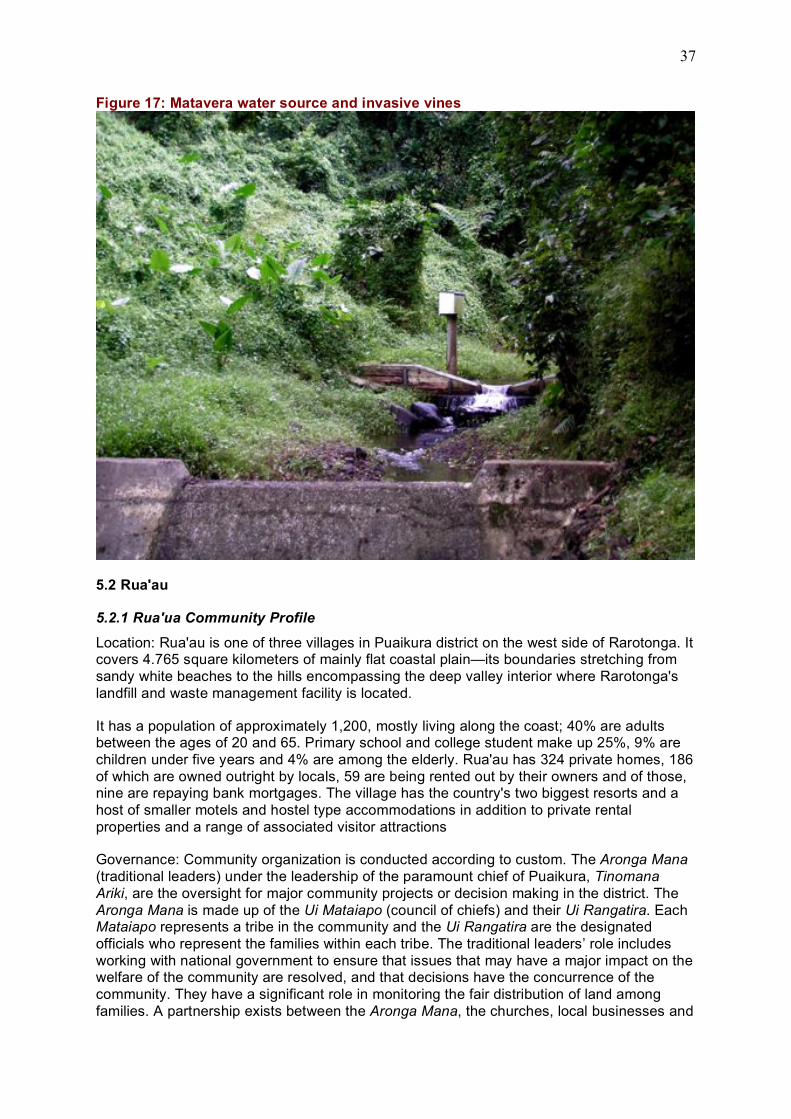
37
Figure 17: Matavera water source and invasive vines
5.2 Rua'au
5.2.1 Rua'ua Community Profile
Location: Rua'au is one of three villages in Puaikura district on the west side of Rarotonga. It covers 4.765 square kilometers of mainly flat coastal plain—its boundaries stretching from
sandy white beaches to the hills encompassing the deep valley interior where Rarotonga's
landfill and waste management facility is located.
It has a population of approximately 1,200, mostly living along the coast; 40% are adults between the ages of 20 and 65. Primary school and college student make up 25%, 9% are
children under five years and 4% are among the elderly. Rua'au has 324 private homes, 186
of which are owned outright by locals, 59 are being rented out by their owners and of those, nine are repaying bank mortgages. The village has the country's two biggest resorts and a
host of smaller motels and hostel type accommodations in addition to private rental
properties and a range of associated visitor attractions
Governance: Community organization is conducted according to custom. The Aronga Mana
(traditional leaders) under the leadership of the paramount chief of Puaikura, Tinomana
Ariki, are the oversight for major community projects or decision making in the district. The
Aronga Mana is made up of the Ui Mataiapo (council of chiefs) and their Ui Rangatira. Each Mataiapo represents a tribe in the community and the Ui Rangatira are the designated
officials who represent the families within each tribe. The traditional leaders’ role includes
working with national government to ensure that issues that may have a major impact on the welfare of the community are resolved, and that decisions have the concurrence of the
community. They have a significant role in monitoring the fair distribution of land among
families. A partnership exists between the Aronga Mana, the churches, local businesses and
38
the police to maintain a crime free and visitor friendly Puaikura. The district was the first in
the country to successfully establish a neighborhood-watch program.
State of the Environment: Land based activities to a large extent have direct impacts on the
health of the lagoon and the resources the community depends upon. Typically, poor
farming and agricultural practices are among the most harmful of activities coupled with
apathy toward environmental care that makes small communities like Rua'au extra vulnerable to the impacts of climate change. With ongoing issues of health and
environmental hazards associated with the landfill nestled in the valley behind the village,
residents are constantly exposed to a variety of health risks from air pollution, to mosquito outbreak and more recently, the village was plagued with blowflies, a phenomenon not
previously experienced in its history. Dumping of all types of waste at the landfill has
reduced the sites life-span by ten years—the question of where the next location for a waste facility will be is still to be resolved. In the meantime, continued misuse of the landfill has
become the biggest environmental challenge for Rua'au residents.
A summary of the household survey was used in the planning process to identify risks and
vulnerabilities of the community. This can be found in annex 1.
5.2.2 Vulnerability Atlas
The Rua'au community has developed vulnerability maps highlighting the following climate
change risks:
• An anticipated .8m rise in sea-level, which when combined with 2.5m storm surge will
result in coastal areas being inundated to an elevation of 3.3m above mean high-water
level
• Increase in extreme events (droughts, flooding)
• Increase in cyclone intensity (i.e. more category 4 and 5 cyclones)
• Changes in weather patterns
• Increased episodes of high temperature events
The vulnerability atlas maps are presented in Figures 20-24.
5.2.3. Risk Assessment and Adaptation Framework For Rua'au
The Risk Assessment undertaken with participants from Rua'au resulted in the identification of priority risks expressed in terms of what is most important to the community. This is
summarized in Table 4. Community consultation identified the following risks:
• The impact of sea level rise and storm surge will affect 158 residential homes, thirty
commercial buildings (shops, tourist accommodation), four power substation huts, four marae, one waterhole, five burial grounds, and 106 power meters/poles.
• Two businesses and twenty-eight homes in Rua’au are built in flood areas; five marae
and five cemeteries are located in low lying area of under 10m elevation; sixty commercial buildings are not in the flood zone but are in the under 10m elevation zone.
Sixteen power poles in the flood plain. A major effect will be runoff from the Rarotonga
landfill waste management site. This site is problematic during heavy rains when polluted water runs into a nearby creek to the lagoon. The village clubhouse, health welfare clinic
and a tourist resort are close to the same stream; the pollution affects the lagoon and
coral reef systems.
39
• As in Matavera, the impact of heat, drought and wind damage in Rua’au will be
widespread. Water availability and quality, agriculture activities, human and environmental health, animals and the economy is affected. Drought and heat resistant
invasive weeds flourish in dry conditions. Strong winds will damage livestock and
property. Poorly constructed buildings will suffer the worst.
Thereafter, the Community Adaptation Strategy was developed with the community, specifying measures required to protect important "at risk" assets (Table 5). The following
actions were identified as priorities to be acted upon through the establishment of a
Community Disaster/Climate Change Committee:
• Work with the government to reduce pollution from the landfill
• Renovate or rebuild vulnerable buildings
• Develop micro-financing or insurance program to assist homeowners with flood damage, and establish a reinsurance scheme for tour operators and resorts
• Improve public awareness of the need to build more resilient infrastructure and homes
• Replant stream banks to increase resilience in aquatic ecosystems.
• Relocate emergency shelters
• Determine safe-partner-homes for relocation during disaster events
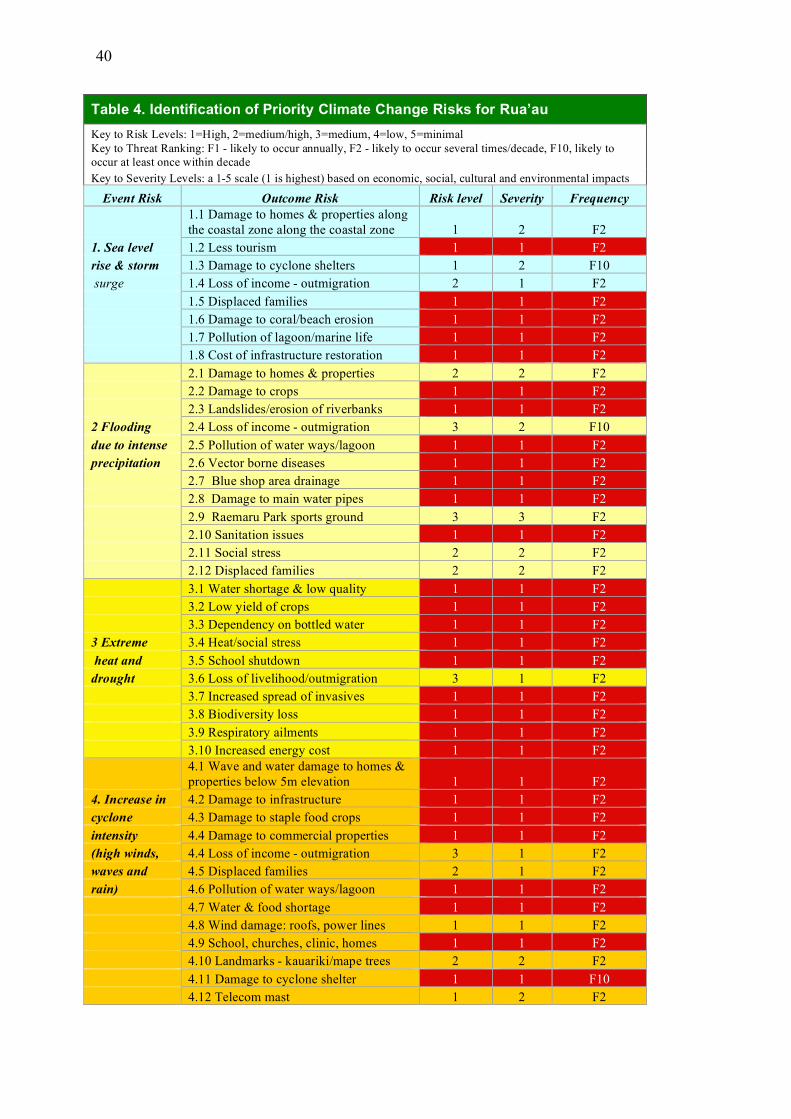
40
Table 4. Identification of Priority Climate Change Risks for Rua’au
Key to Risk Levels: 1=High, 2=medium/high, 3=medium, 4=low, 5=minimal
Key to Threat Ranking: F1 - likely to occur annually, F2 - likely to occur several times/decade, F10, likely to
occur at least once within decade
Key to Severity Levels: a 1-5 scale (1 is highest) based on economic, social, cultural and environmental impacts
Event Risk Outcome Risk Risk level Severity Frequency
1.1 Damage to homes & properties along
the coastal zone along the coastal zone 1 2 F2
1. Sea level 1.2 Less tourism 1 1 F2
rise & storm 1.3 Damage to cyclone shelters 1 2 F10
surge 1.4 Loss of income - outmigration 2 1 F2
1.5 Displaced families 1 1 F2
1.6 Damage to coral/beach erosion 1 1 F2
1.7 Pollution of lagoon/marine life 1 1 F2
1.8 Cost of infrastructure restoration 1 1 F2
2.1 Damage to homes & properties 2 2 F2
2.2 Damage to crops 1 1 F2
2.3 Landslides/erosion of riverbanks 1 1 F2
2 Flooding 2.4 Loss of income - outmigration 3 2 F10
due to intense 2.5 Pollution of water ways/lagoon 1 1 F2
precipitation 2.6 Vector borne diseases 1 1 F2
2.7 Blue shop area drainage 1 1 F2
2.8 Damage to main water pipes 1 1 F2
2.9 Raemaru Park sports ground 3 3 F2
2.10 Sanitation issues 1 1 F2
2.11 Social stress 2 2 F2
2.12 Displaced families 2 2 F2
3.1 Water shortage & low quality 1 1 F2
3.2 Low yield of crops 1 1 F2
3.3 Dependency on bottled water 1 1 F2
3 Extreme 3.4 Heat/social stress 1 1 F2
heat and 3.5 School shutdown 1 1 F2
drought 3.6 Loss of livelihood/outmigration 3 1 F2
3.7 Increased spread of invasives 1 1 F2
3.8 Biodiversity loss 1 1 F2
3.9 Respiratory ailments 1 1 F2
3.10 Increased energy cost 1 1 F2
4.1 Wave and water damage to homes &
properties below 5m elevation 1 1 F2
4. Increase in 4.2 Damage to infrastructure 1 1 F2
cyclone 4.3 Damage to staple food crops 1 1 F2
intensity 4.4 Damage to commercial properties 1 1 F2
(high winds, 4.4 Loss of income - outmigration 3 1 F2
waves and 4.5 Displaced families 2 1 F2
rain) 4.6 Pollution of water ways/lagoon 1 1 F2
4.7 Water & food shortage 1 1 F2
4.8 Wind damage: roofs, power lines 1 1 F2
4.9 School, churches, clinic, homes 1 1 F2
4.10 Landmarks - kauariki/mape trees 2 2 F2
4.11 Damage to cyclone shelter 1 1 F10
4.12 Telecom mast 1 2 F2
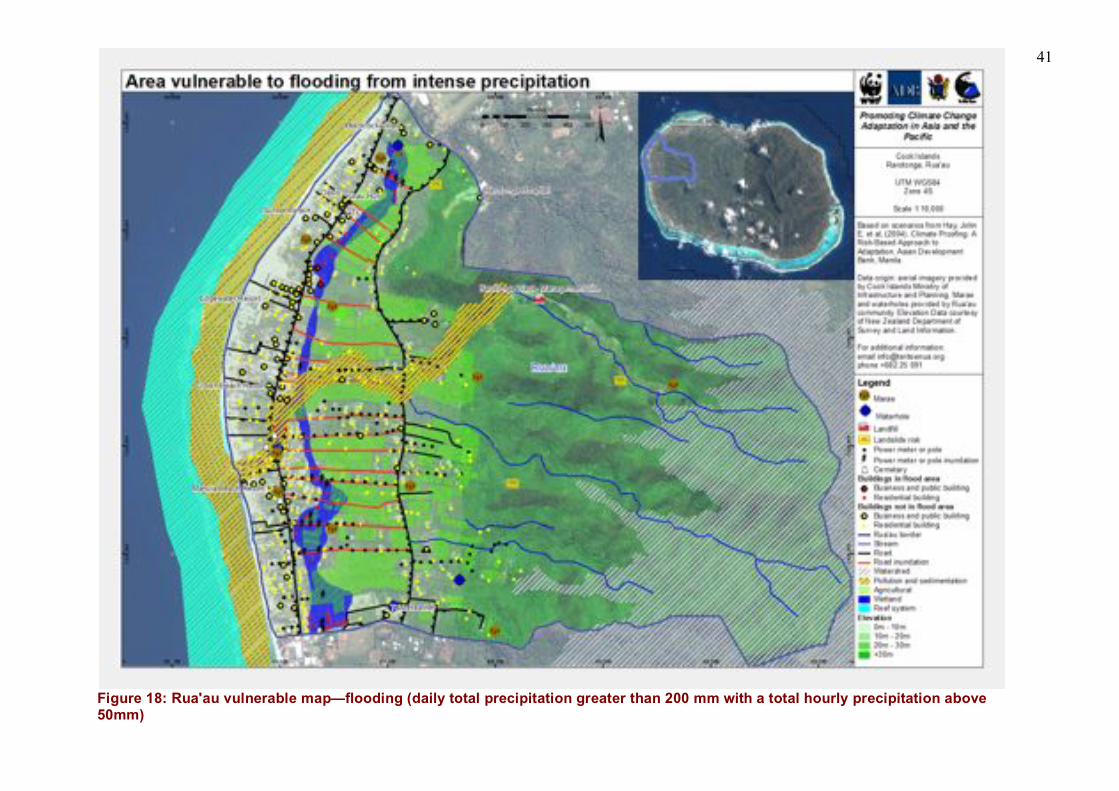
41
Figure 18: Rua'au vulnerable map—flooding (daily total precipitation greater than 200 mm with a total hourly precipitation above 50mm)
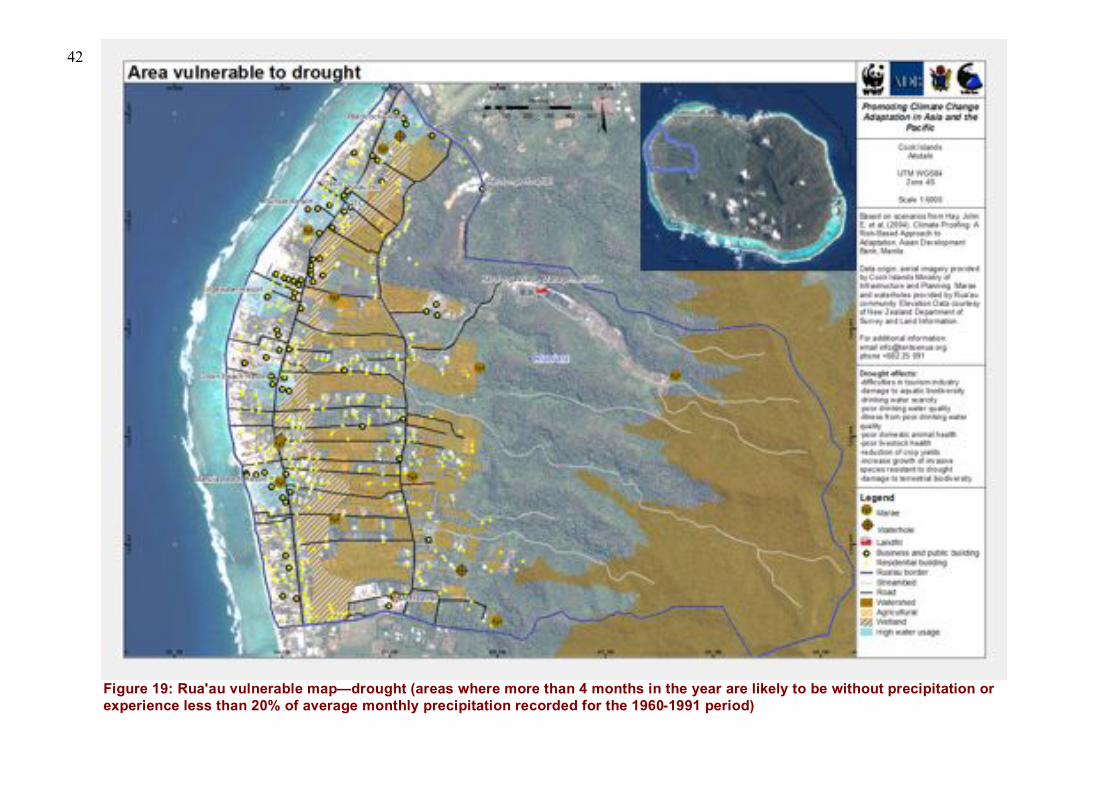
42
Figure 19: Rua'au vulnerable map—drought (areas where more than 4 months in the year are likely to be without precipitation or
experience less than 20% of average monthly precipitation recorded for the 1960-1991 period)
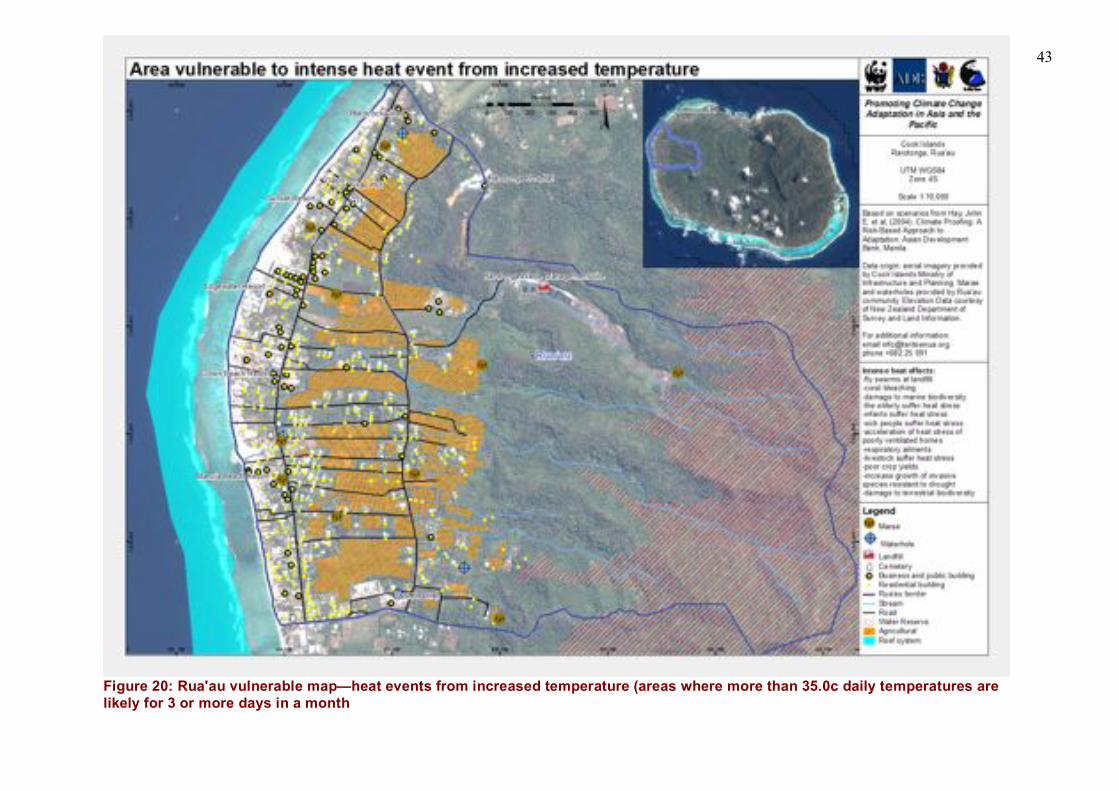
43
Figure 20: Rua'au vulnerable map—heat events from increased temperature (areas where more than 35.0c daily temperatures are
likely for 3 or more days in a month
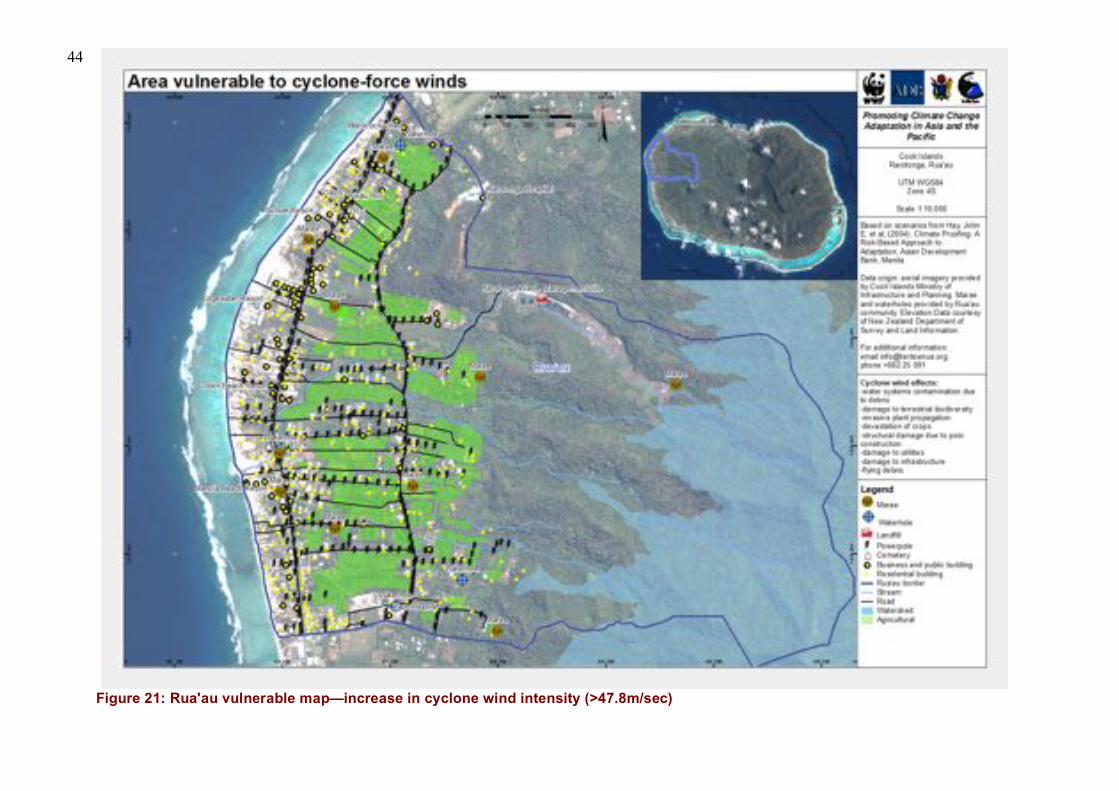
44
Figure 21: Rua'au vulnerable map—increase in cyclone wind intensity (>47.8m/sec)
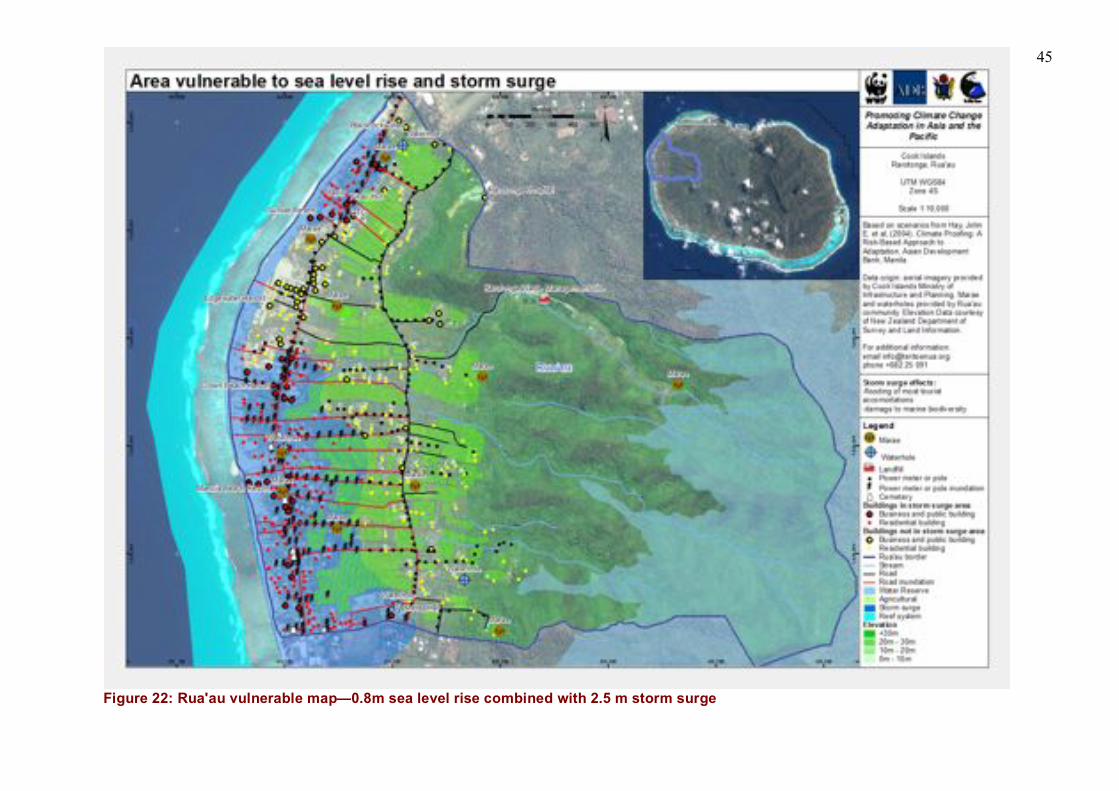
45
Figure 22: Rua'au vulnerable map—0.8m sea level rise combined with 2.5 m storm surge
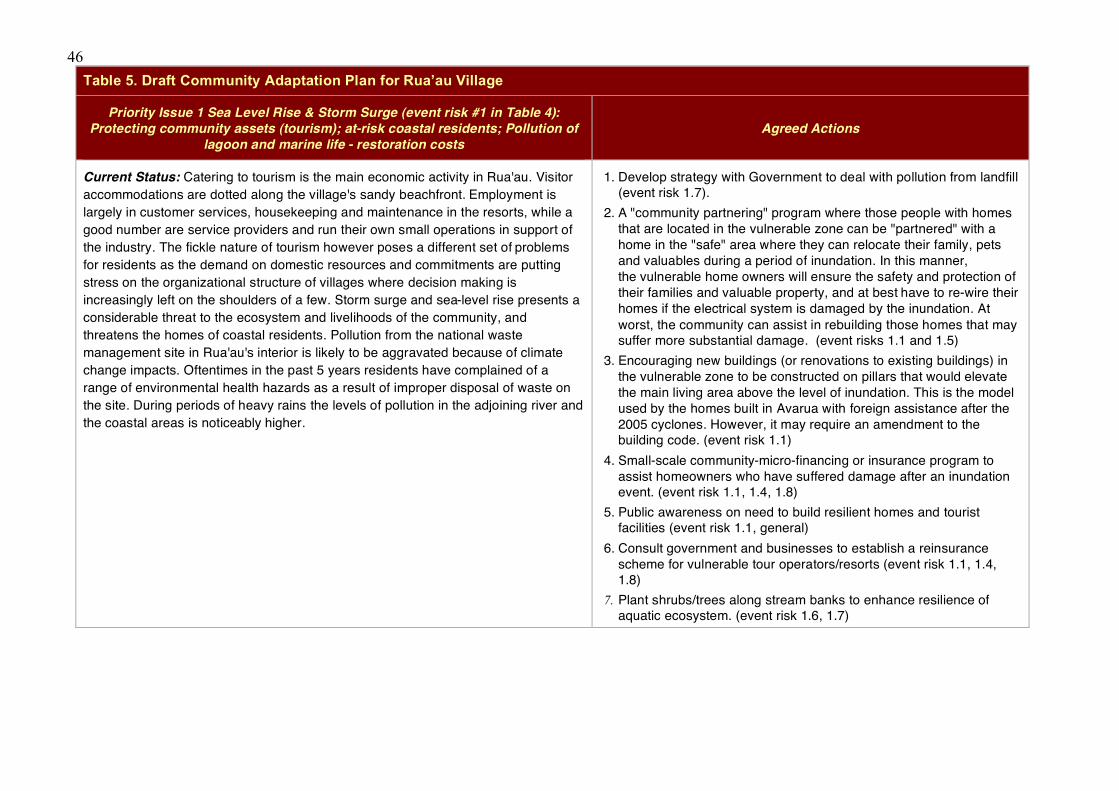
46
Table 5. Draft Community Adaptation Plan for Rua’au Village
Priority Issue 1 Sea Level Rise & Storm Surge (event risk #1 in Table 4):
Protecting community assets (tourism); at-risk coastal residents; Pollution of
lagoon and marine life - restoration costs
Agreed Actions
Current Status: Catering to tourism is the main economic activity in Rua'au. Visitor
accommodations are dotted along the village's sandy beachfront. Employment is
largely in customer services, housekeeping and maintenance in the resorts, while a
good number are service providers and run their own small operations in support of
the industry. The fickle nature of tourism however poses a different set of problems
for residents as the demand on domestic resources and commitments are putting
stress on the organizational structure of villages where decision making is
increasingly left on the shoulders of a few. Storm surge and sea-level rise presents a
considerable threat to the ecosystem and livelihoods of the community, and
threatens the homes of coastal residents. Pollution from the national waste
management site in Rua'au's interior is likely to be aggravated because of climate
change impacts. Oftentimes in the past 5 years residents have complained of a
range of environmental health hazards as a result of improper disposal of waste on
the site. During periods of heavy rains the levels of pollution in the adjoining river and
the coastal areas is noticeably higher.
1. Develop strategy with Government to deal with pollution from landfill (event risk 1.7).
2. A "community partnering" program where those people with homes
that are located in the vulnerable zone can be "partnered" with a
home in the "safe" area where they can relocate their family, pets
and valuables during a period of inundation. In this manner,
the vulnerable home owners will ensure the safety and protection of
their families and valuable property, and at best have to re-wire their
homes if the electrical system is damaged by the inundation. At
worst, the community can assist in rebuilding those homes that may suffer more substantial damage. (event risks 1.1 and 1.5)
3. Encouraging new buildings (or renovations to existing buildings) in
the vulnerable zone to be constructed on pillars that would elevate
the main living area above the level of inundation. This is the model
used by the homes built in Avarua with foreign assistance after the
2005 cyclones. However, it may require an amendment to the building code. (event risk 1.1)
4. Small-scale community-micro-financing or insurance program to
assist homeowners who have suffered damage after an inundation event. (event risk 1.1, 1.4, 1.8)
5. Public awareness on need to build resilient homes and tourist facilities (event risk 1.1, general)
6. Consult government and businesses to establish a reinsurance
scheme for vulnerable tour operators/resorts (event risk 1.1, 1.4, 1.8)
7. Plant shrubs/trees along stream banks to enhance resilience of aquatic ecosystem. (event risk 1.6, 1.7)
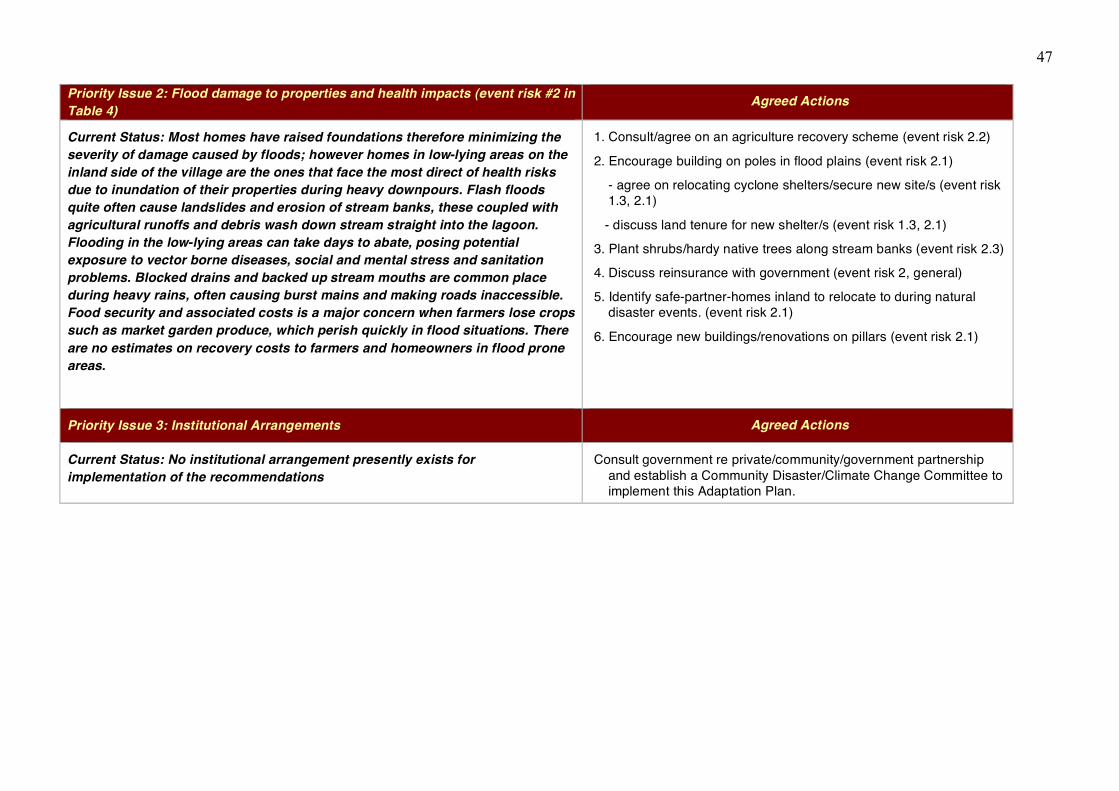
47
Priority Issue 2: Flood damage to properties and health impacts (event risk #2 in
Table 4) Agreed Actions
Current Status: Most homes have raised foundations therefore minimizing the
severity of damage caused by floods; however homes in low-lying areas on the
inland side of the village are the ones that face the most direct of health risks
due to inundation of their properties during heavy downpours. Flash floods
quite often cause landslides and erosion of stream banks, these coupled with
agricultural runoffs and debris wash down stream straight into the lagoon.
Flooding in the low-lying areas can take days to abate, posing potential
exposure to vector borne diseases, social and mental stress and sanitation
problems. Blocked drains and backed up stream mouths are common place
during heavy rains, often causing burst mains and making roads inaccessible.
Food security and associated costs is a major concern when farmers lose crops
such as market garden produce, which perish quickly in flood situations. There
are no estimates on recovery costs to farmers and homeowners in flood prone
areas.
1. Consult/agree on an agriculture recovery scheme (event risk 2.2)
2. Encourage building on poles in flood plains (event risk 2.1)
- agree on relocating cyclone shelters/secure new site/s (event risk 1.3, 2.1)
- discuss land tenure for new shelter/s (event risk 1.3, 2.1)
3. Plant shrubs/hardy native trees along stream banks (event risk 2.3)
4. Discuss reinsurance with government (event risk 2, general)
5. Identify safe-partner-homes inland to relocate to during natural disaster events. (event risk 2.1)
6. Encourage new buildings/renovations on pillars (event risk 2.1)
Priority Issue 3: Institutional Arrangements Agreed Actions
Current Status: No institutional arrangement presently exists for
implementation of the recommendations
Consult government re private/community/government partnership
and establish a Community Disaster/Climate Change Committee to implement this Adaptation Plan.
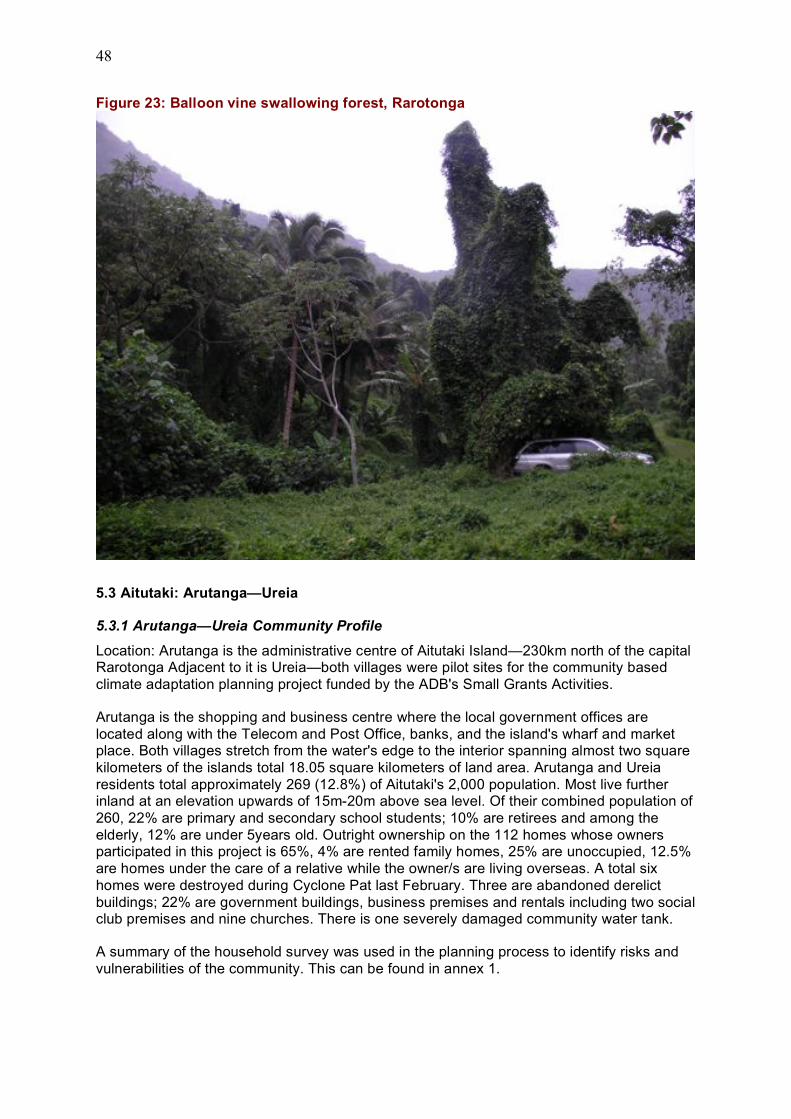
48
Figure 23: Balloon vine swallowing forest, Rarotonga
5.3 Aitutaki: Arutanga—Ureia
5.3.1 Arutanga—Ureia Community Profile
Location: Arutanga is the administrative centre of Aitutaki Island—230km north of the capital Rarotonga Adjacent to it is Ureia—both villages were pilot sites for the community based
climate adaptation planning project funded by the ADB's Small Grants Activities.
Arutanga is the shopping and business centre where the local government offices are
located along with the Telecom and Post Office, banks, and the island's wharf and market place. Both villages stretch from the water's edge to the interior spanning almost two square
kilometers of the islands total 18.05 square kilometers of land area. Arutanga and Ureia
residents total approximately 269 (12.8%) of Aitutaki's 2,000 population. Most live further inland at an elevation upwards of 15m-20m above sea level. Of their combined population of
260, 22% are primary and secondary school students; 10% are retirees and among the
elderly, 12% are under 5years old. Outright ownership on the 112 homes whose owners participated in this project is 65%, 4% are rented family homes, 25% are unoccupied, 12.5%
are homes under the care of a relative while the owner/s are living overseas. A total six
homes were destroyed during Cyclone Pat last February. Three are abandoned derelict
buildings; 22% are government buildings, business premises and rentals including two social club premises and nine churches. There is one severely damaged community water tank.
A summary of the household survey was used in the planning process to identify risks and
vulnerabilities of the community. This can be found in annex 1.
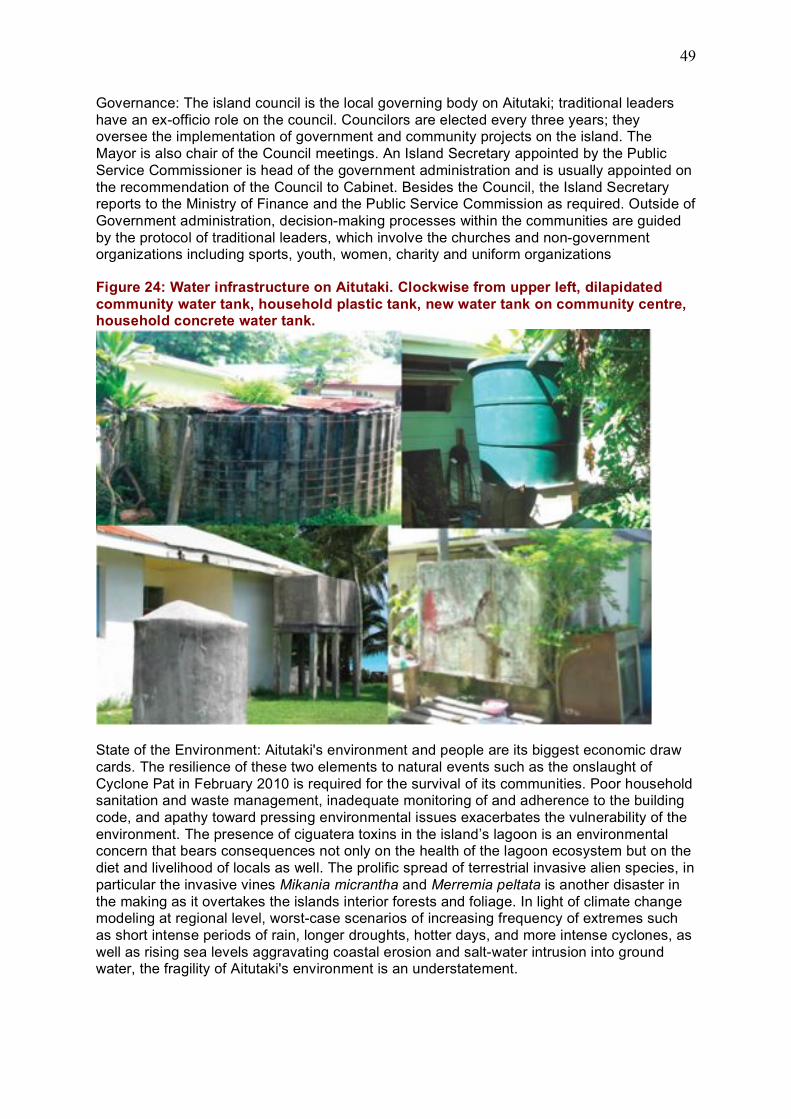
49
Governance: The island council is the local governing body on Aitutaki; traditional leaders
have an ex-officio role on the council. Councilors are elected every three years; they oversee the implementation of government and community projects on the island. The
Mayor is also chair of the Council meetings. An Island Secretary appointed by the Public
Service Commissioner is head of the government administration and is usually appointed on
the recommendation of the Council to Cabinet. Besides the Council, the Island Secretary reports to the Ministry of Finance and the Public Service Commission as required. Outside of
Government administration, decision-making processes within the communities are guided
by the protocol of traditional leaders, which involve the churches and non-government organizations including sports, youth, women, charity and uniform organizations
Figure 24: Water infrastructure on Aitutaki. Clockwise from upper left, dilapidated
community water tank, household plastic tank, new water tank on community centre, household concrete water tank.
State of the Environment: Aitutaki's environment and people are its biggest economic draw
cards. The resilience of these two elements to natural events such as the onslaught of
Cyclone Pat in February 2010 is required for the survival of its communities. Poor household sanitation and waste management, inadequate monitoring of and adherence to the building
code, and apathy toward pressing environmental issues exacerbates the vulnerability of the
environment. The presence of ciguatera toxins in the island’s lagoon is an environmental concern that bears consequences not only on the health of the lagoon ecosystem but on the
diet and livelihood of locals as well. The prolific spread of terrestrial invasive alien species, in
particular the invasive vines Mikania micrantha and Merremia peltata is another disaster in
the making as it overtakes the islands interior forests and foliage. In light of climate change modeling at regional level, worst-case scenarios of increasing frequency of extremes such
as short intense periods of rain, longer droughts, hotter days, and more intense cyclones, as
well as rising sea levels aggravating coastal erosion and salt-water intrusion into ground water, the fragility of Aitutaki's environment is an understatement.
50
5.3.2 Vulnerability Atlas
A vulnerability atlas containing maps highlighting the following climate change risks have been developed by the Arutanga—Ureia community. These are found in figures 27-30
below. They include:
• An anticipated .8m rise in sea-level, which when combined with 2.5m storm surge will
result in coastal inundation to an elevation of 3.3m above mean high-water level
• Increase in extreme events (droughts, flooding)
• Increase in cyclone intensity (i.e. more category 4 and 5 cyclones)
• Changes in weather patterns
• Increased episodes of high temperature events
5.3.3 Risk Assessment and Adaptation Framework For Arutanga – Ureia
The Risk Assessment undertaken with participants from Arutanga—Ureia resulted in the identification of priority risks expressed in terms of what is most important to the community,
as summarized in table 6. The following features at risk were identified:
• The impact of SLR and storm surge will cause inundation of 111 buildings (including
residential, government and commercial properties).
• Flood impact In Arutanga-Ureia will cause pollution of streams affecting twenty-three
buildings that are either built in or on the periphery of flood prone areas; forty-nine homes
are located in low-lying areas of 5 to 20 meters elevation. The lagoon systems will be affected by storm runoffs, septic overflow and debris.
• The Impact of heat and prolonged drought in Arutanga-Ureia will affect water quality and
availability, affect agriculture activities and livestock, the populations health will be affected, there will be terrestrial biodiversity loss as invasive plant species resistant to
heat and drought will spread; the economy will suffer due to an anticipated decline in
visitor numbers.
• Wind damage in Arutanga-Ureia will affect all buildings and utilities, the health sector, food and water security, social welfare, and tourism. Fifty-four of the buildings are in
highly exposed areas (40+ meters elevation), and thirty-two are moderately exposed in
the 30-40 meter elevation range.
• In Arutanga-Ureia, areas vulnerable to flooding, water and vector-borne disease, and
pollution from excess precipitation were identified. Specific households that have
inadequate rainwater harvesting and storage facilities were identified in some
communities.
The following actions were identified as priorities to be acted upon through the establishment
of a Community Disaster/Climate Change Committee:
• Discourage building in vulnerable areas
• Establish a community partnering program to provide safe shelter for those in the most
vulnerable homes
• Amend building code and encourage new construction to higher standards
• Establish community micro-finance or insurance to assist homeowners affected by
cyclones and/or inundation, and develop a reinsurance scheme for vulnerable businesses
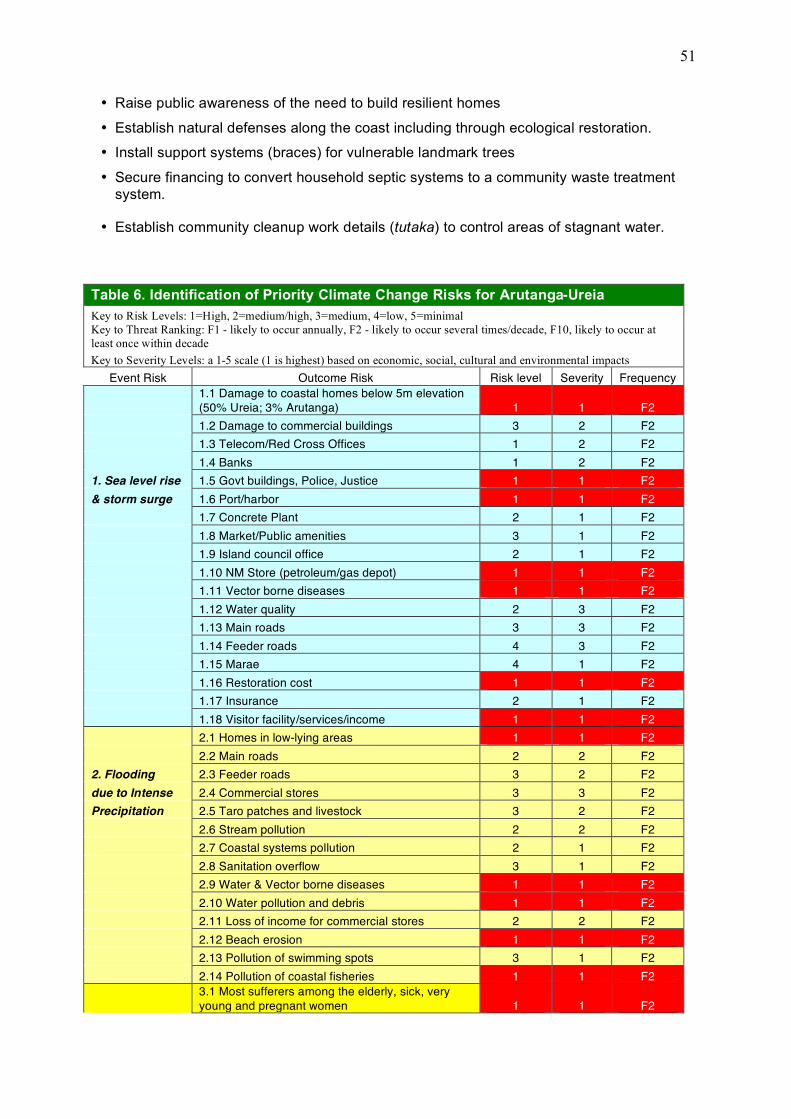
51
• Raise public awareness of the need to build resilient homes
• Establish natural defenses along the coast including through ecological restoration.
• Install support systems (braces) for vulnerable landmark trees
• Secure financing to convert household septic systems to a community waste treatment
system.
• Establish community cleanup work details (tutaka) to control areas of stagnant water.
Table 6. Identification of Priority Climate Change Risks for Arutanga-Ureia
Key to Risk Levels: 1=High, 2=medium/high, 3=medium, 4=low, 5=minimal
Key to Threat Ranking: F1 - likely to occur annually, F2 - likely to occur several times/decade, F10, likely to occur at
least once within decade
Key to Severity Levels: a 1-5 scale (1 is highest) based on economic, social, cultural and environmental impacts
Event Risk Outcome Risk Risk level Severity Frequency
1.1 Damage to coastal homes below 5m elevation
(50% Ureia; 3% Arutanga) 1 1 F2
1.2 Damage to commercial buildings 3 2 F2
1.3 Telecom/Red Cross Offices 1 2 F2
1.4 Banks 1 2 F2
1. Sea level rise 1.5 Govt buildings, Police, Justice 1 1 F2
& storm surge 1.6 Port/harbor 1 1 F2
1.7 Concrete Plant 2 1 F2
1.8 Market/Public amenities 3 1 F2
1.9 Island council office 2 1 F2
1.10 NM Store (petroleum/gas depot) 1 1 F2
1.11 Vector borne diseases 1 1 F2
1.12 Water quality 2 3 F2
1.13 Main roads 3 3 F2
1.14 Feeder roads 4 3 F2
1.15 Marae 4 1 F2
1.16 Restoration cost 1 1 F2
1.17 Insurance 2 1 F2
1.18 Visitor facility/services/income 1 1 F2
2.1 Homes in low-lying areas 1 1 F2
2.2 Main roads 2 2 F2
2. Flooding 2.3 Feeder roads 3 2 F2
due to Intense 2.4 Commercial stores 3 3 F2
Precipitation 2.5 Taro patches and livestock 3 2 F2
2.6 Stream pollution 2 2 F2
2.7 Coastal systems pollution 2 1 F2
2.8 Sanitation overflow 3 1 F2
2.9 Water & Vector borne diseases 1 1 F2
2.10 Water pollution and debris 1 1 F2
2.11 Loss of income for commercial stores 2 2 F2
2.12 Beach erosion 1 1 F2
2.13 Pollution of swimming spots 3 1 F2
2.14 Pollution of coastal fisheries 1 1 F2
3.1 Most sufferers among the elderly, sick, very
young and pregnant women 1 1 F2
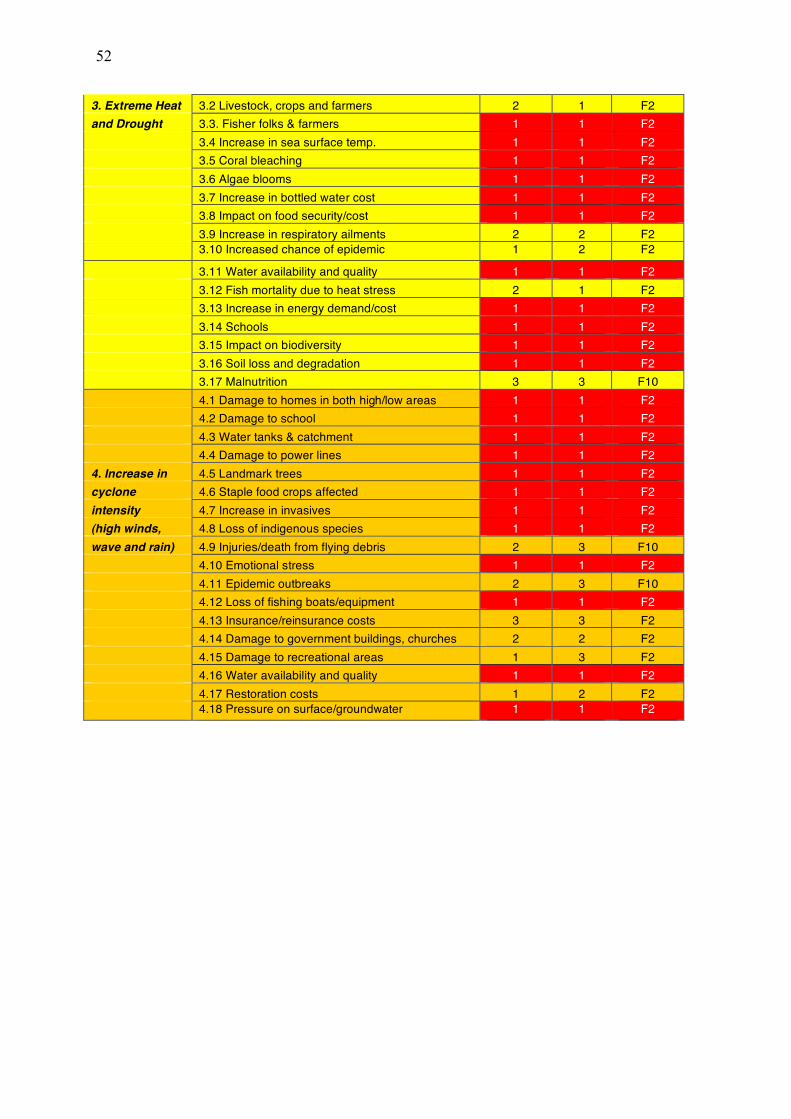
52
3. Extreme Heat 3.2 Livestock, crops and farmers 2 1 F2
and Drought 3.3. Fisher folks & farmers 1 1 F2
3.4 Increase in sea surface temp. 1 1 F2
3.5 Coral bleaching 1 1 F2
3.6 Algae blooms 1 1 F2
3.7 Increase in bottled water cost 1 1 F2
3.8 Impact on food security/cost 1 1 F2
3.9 Increase in respiratory ailments 2 2 F2
3.10 Increased chance of epidemic 1 2 F2
3.11 Water availability and quality 1 1 F2
3.12 Fish mortality due to heat stress 2 1 F2
3.13 Increase in energy demand/cost 1 1 F2
3.14 Schools 1 1 F2
3.15 Impact on biodiversity 1 1 F2
3.16 Soil loss and degradation 1 1 F2
3.17 Malnutrition 3 3 F10
4.1 Damage to homes in both high/low areas 1 1 F2
4.2 Damage to school 1 1 F2
4.3 Water tanks & catchment 1 1 F2
4.4 Damage to power lines 1 1 F2
4. Increase in 4.5 Landmark trees 1 1 F2
cyclone 4.6 Staple food crops affected 1 1 F2
intensity 4.7 Increase in invasives 1 1 F2
(high winds, 4.8 Loss of indigenous species 1 1 F2
wave and rain) 4.9 Injuries/death from flying debris 2 3 F10
4.10 Emotional stress 1 1 F2
4.11 Epidemic outbreaks 2 3 F10
4.12 Loss of fishing boats/equipment 1 1 F2
4.13 Insurance/reinsurance costs 3 3 F2
4.14 Damage to government buildings, churches 2 2 F2
4.15 Damage to recreational areas 1 3 F2
4.16 Water availability and quality 1 1 F2
4.17 Restoration costs 1 2 F2
4.18 Pressure on surface/groundwater 1 1 F2
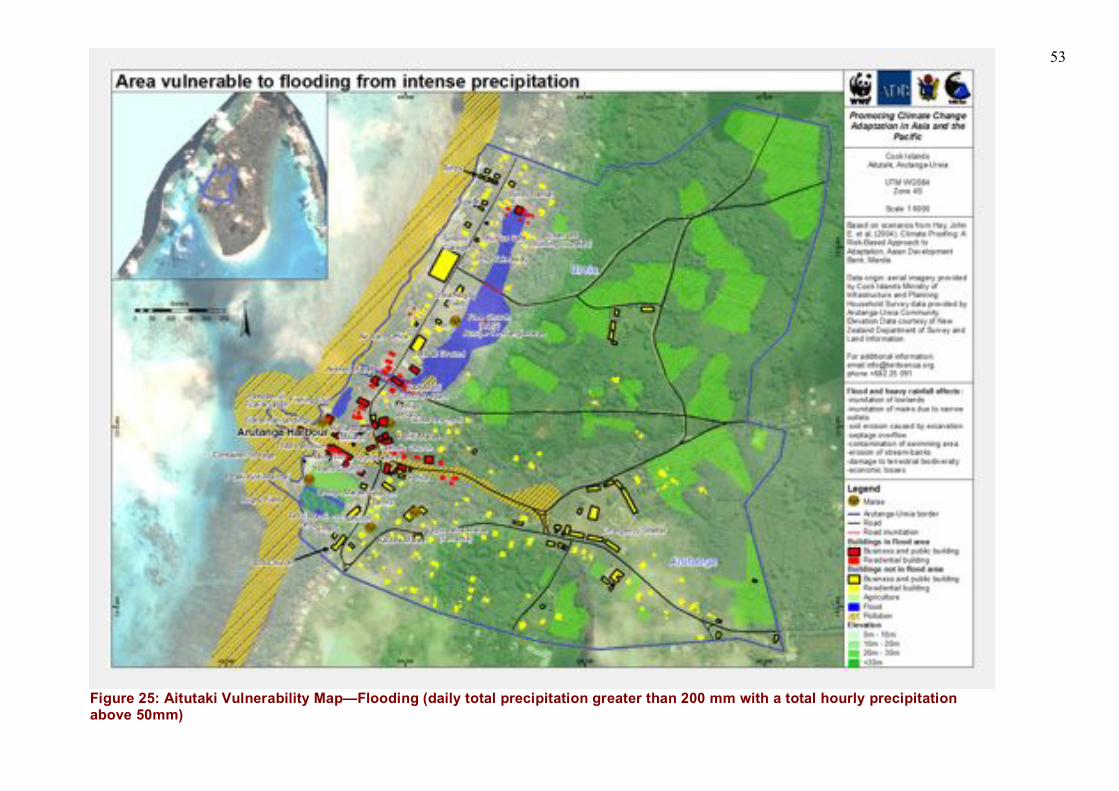
53
Figure 25: Aitutaki Vulnerability Map—Flooding (daily total precipitation greater than 200 mm with a total hourly precipitation above 50mm)
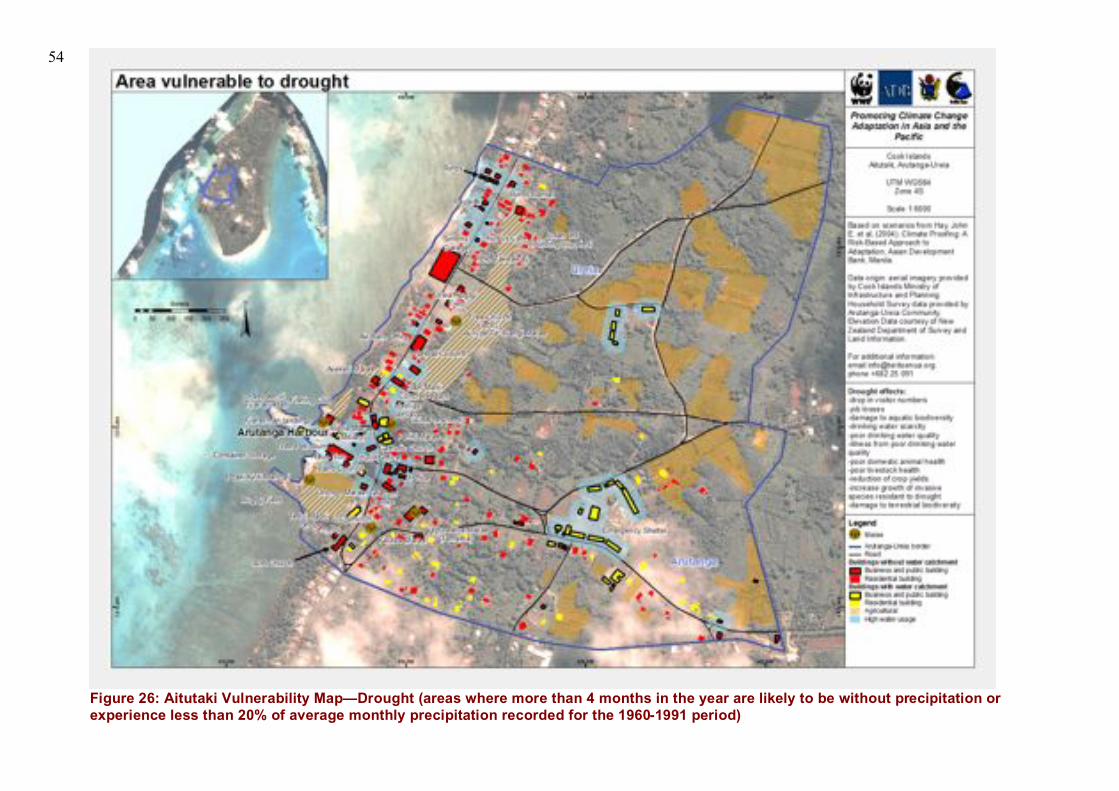
54
Figure 26: Aitutaki Vulnerability Map—Drought (areas where more than 4 months in the year are likely to be without precipitation or
experience less than 20% of average monthly precipitation recorded for the 1960-1991 period)
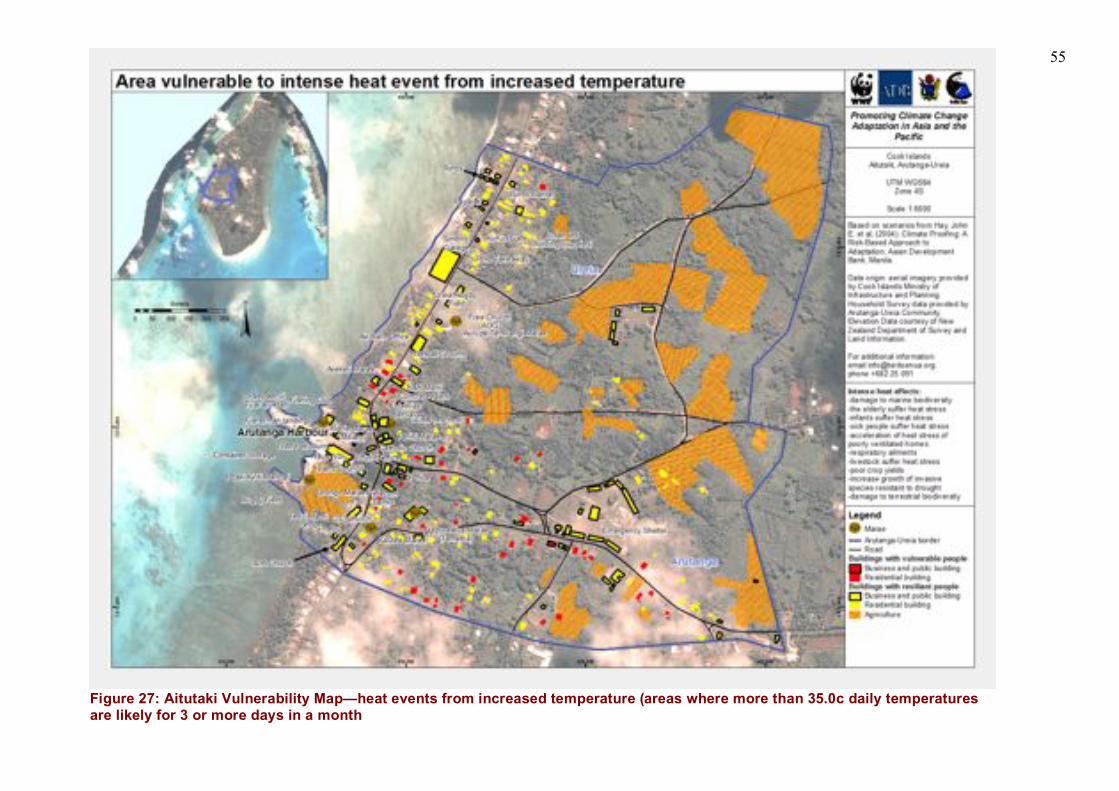
55
Figure 27: Aitutaki Vulnerability Map—heat events from increased temperature (areas where more than 35.0c daily temperatures are likely for 3 or more days in a month
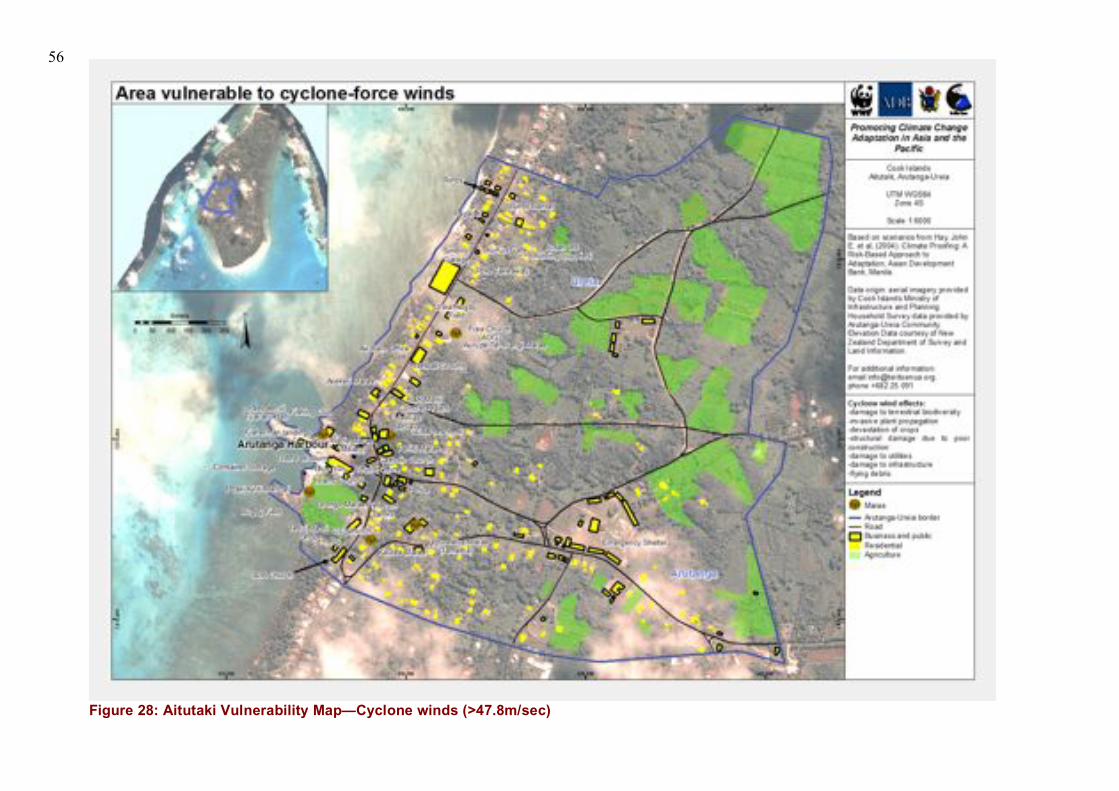
56
Figure 28: Aitutaki Vulnerability Map—Cyclone winds (>47.8m/sec)
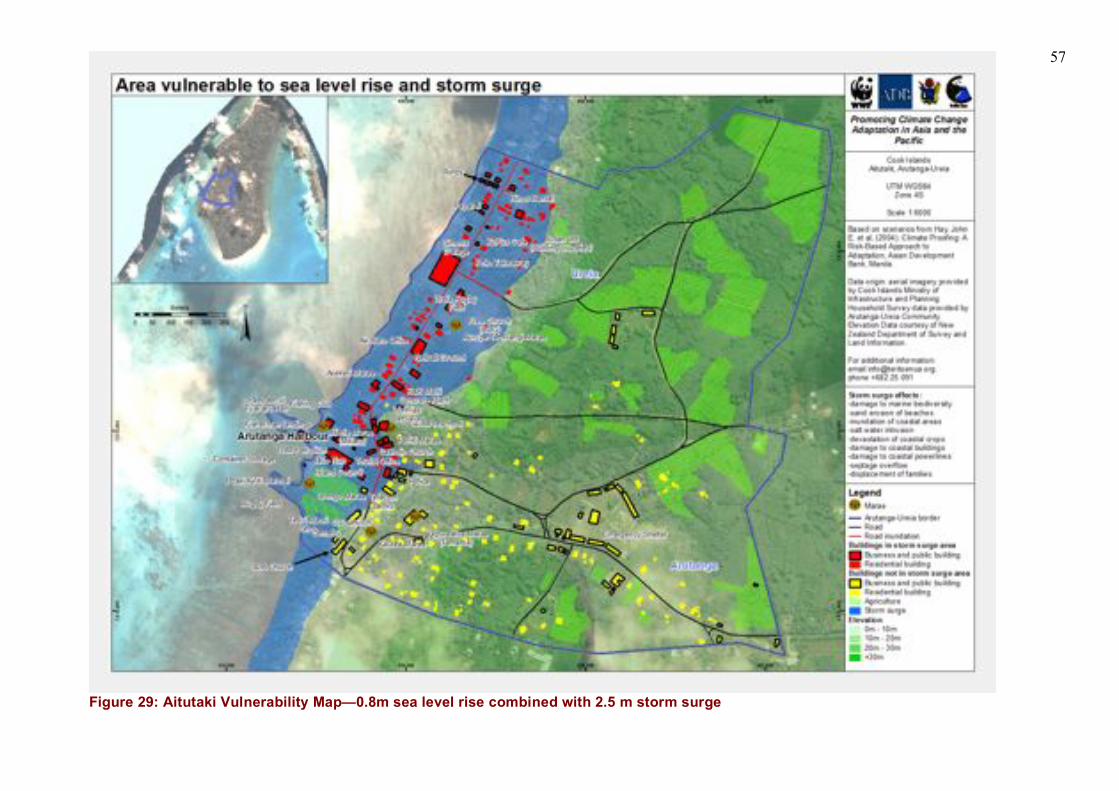
57
Figure 29: Aitutaki Vulnerability Map—0.8m sea level rise combined with 2.5 m storm surge
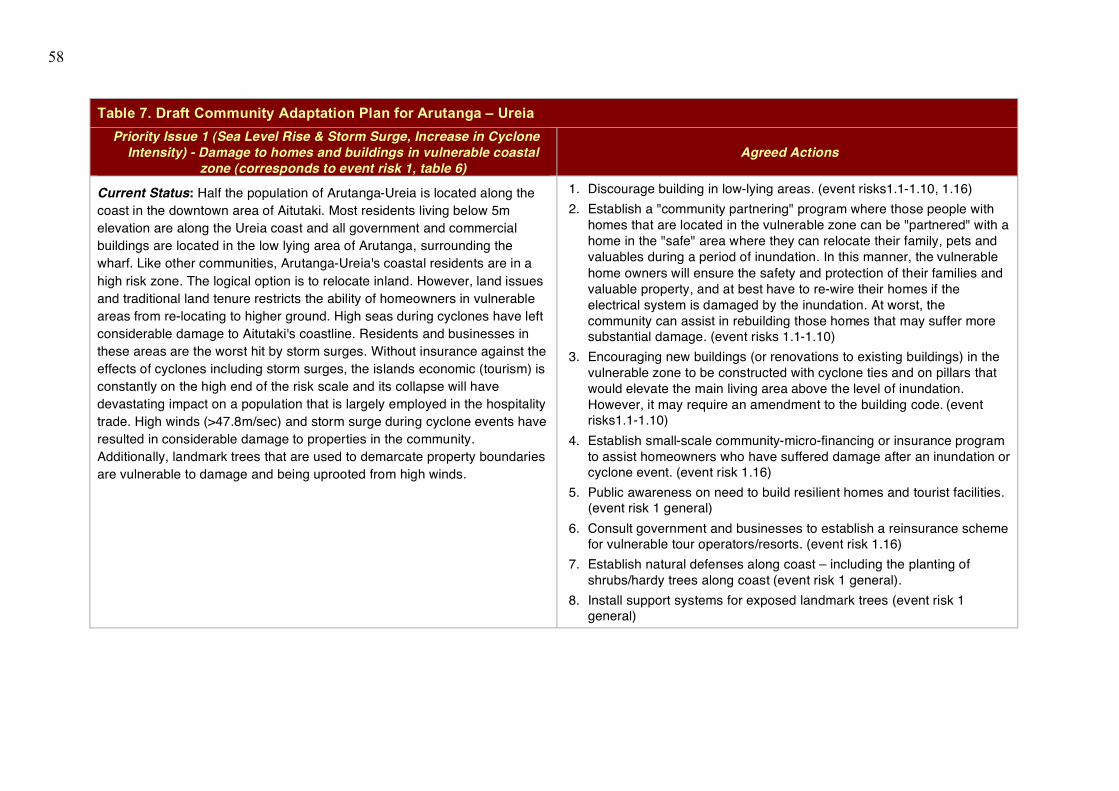
58
Table 7. Draft Community Adaptation Plan for Arutanga – Ureia
Priority Issue 1 (Sea Level Rise & Storm Surge, Increase in Cyclone
Intensity) - Damage to homes and buildings in vulnerable coastal
zone (corresponds to event risk 1, table 6)
Agreed Actions
Current Status: Half the population of Arutanga-Ureia is located along the
coast in the downtown area of Aitutaki. Most residents living below 5m
elevation are along the Ureia coast and all government and commercial
buildings are located in the low lying area of Arutanga, surrounding the
wharf. Like other communities, Arutanga-Ureia's coastal residents are in a
high risk zone. The logical option is to relocate inland. However, land issues
and traditional land tenure restricts the ability of homeowners in vulnerable
areas from re-locating to higher ground. High seas during cyclones have left
considerable damage to Aitutaki's coastline. Residents and businesses in
these areas are the worst hit by storm surges. Without insurance against the
effects of cyclones including storm surges, the islands economic (tourism) is
constantly on the high end of the risk scale and its collapse will have
devastating impact on a population that is largely employed in the hospitality
trade. High winds (>47.8m/sec) and storm surge during cyclone events have
resulted in considerable damage to properties in the community.
Additionally, landmark trees that are used to demarcate property boundaries
are vulnerable to damage and being uprooted from high winds.
1. Discourage building in low-lying areas. (event risks1.1-1.10, 1.16)
2. Establish a "community partnering" program where those people with
homes that are located in the vulnerable zone can be "partnered" with a
home in the "safe" area where they can relocate their family, pets and
valuables during a period of inundation. In this manner, the vulnerable
home owners will ensure the safety and protection of their families and
valuable property, and at best have to re-wire their homes if the
electrical system is damaged by the inundation. At worst, the
community can assist in rebuilding those homes that may suffer more substantial damage. (event risks 1.1-1.10)
3. Encouraging new buildings (or renovations to existing buildings) in the
vulnerable zone to be constructed with cyclone ties and on pillars that
would elevate the main living area above the level of inundation.
However, it may require an amendment to the building code. (event risks1.1-1.10)
4. Establish small-scale community-micro-financing or insurance program
to assist homeowners who have suffered damage after an inundation or cyclone event. (event risk 1.16)
5. Public awareness on need to build resilient homes and tourist facilities. (event risk 1 general)
6. Consult government and businesses to establish a reinsurance scheme for vulnerable tour operators/resorts. (event risk 1.16)
7. Establish natural defenses along coast – including the planting of
shrubs/hardy trees along coast (event risk 1 general).
8. Install support systems for exposed landmark trees (event risk 1 general)
59
Priority Issue 2 – Pollution to Lagoon from Extreme Events (Storm
Surge, Flooding) and associated Health Impacts – corresponds to event risk 2, table 6)
Agreed Actions
Current Status: Historically, the construction of household sewage systems
on small building lots located close to the lagoon, combined with the
absence of any standards controlling the location and building of these
systems has resulted in pollution to the marine and aquatic ecosystems
from seepage. Any flooding or inundation of the coastal area will result in
household septic systems overflowing into the nearby lagoon. 44% of
homes in Arutanga and Ureia have septic tanks although over half of the
households surveyed have flush toilets indoors, the rest have additional
flush, pour flush or pit latrines outside. Almost a third of the population has
no wastewater treatment in place nor do they recycle water. Sanitation and
septic tank issues remain on top of potential health risks in the event of
storm surges, and flooding leading to pollution of the lagoon and coral,
disease outbreaks and mosquito infestation.
1. Secure financing to implement the new Public Health (Sewage)
Regulations 2006 and convert household septic systems to a
community system that is located above the 5m elevation contour
(event risk 2.8)
2. Establish community awareness/education on health risks associated
with poor septic treatment (event risk 2 general)
3. Establish community cleanup program (tutaka) and program to control
areas of stagnant water that are breeding grounds for mosquitoes
(event risk 2.6-2.14)
60
Priority Issue 3: Changes in Water Quality and Availability from Climate
Variability (corresponds to event risk 2 and 3, table 6) Agreed Actions
Current Status: All households have access to water - over half have piped
water into their homes, the rest use rainwater collected in mostly plastic tanks,
some are concrete and metal structures. However, only 43% of the households
harvest rainwater from the roof. While almost half the homes having guttering
for rainwater catchment (49%), only 25% have guttering around half of the
building, and a mere 6% have full spouting around their homes, There are still
an alarming number of government buildings without proper fittings to harvest
rainwater from the roofs. There is a need for continuous maintenance of
community water storage facilities and for ongoing awareness-raising of good
land use practices to avoid contamination of the water table. The island’s
ground water source is very close to the beaches. The Vaipeka water gallery
that supplies the whole island with water is about 100 meters from the beach
and below sea level. Some galleries are even closer than that Therefore, salt-
water intrusion into water galleries as a result of anticipated climate change
impacts and sea level rise is inevitable. Excess demand, system leakage, and
storm surges already result in mains water frequently being too brackish for
use. In addition, increasing climate variability evidenced by shifting rainfall
patterns in the past decade, affecting recharge of ground water mean provision
for drinking water is becoming the main concern for the people in Aitutaki.
1. Establishment of a ra'ui along the water catchment and along stream
banks similar to Takavaeni (Rarotonga) in order to enhance the
resilience of the river and reduce pollution within the catchment
area. This is a traditional practice that has considerable adaptation
benefits (event risk 2 and 3, general)
2. Work with government to undertake an inventory and assessment of
water quality for underground water (event risk 2 and 3, general)
3. Establish a community education/awareness on wise conservation
and sustainable farming practices (event risks 2 and 3, general)
4. Establish community program to protect springs and waterholes
(event risks 2 and 3, general)
Priority Issue 4: Biodiversity loss due to Climate Variability and
Increased Incidents of Extreme Events (corresponds to event risks 4 and 5, table 6)
Agreed Actions
Current Status: Extreme heat and cyclone events have resulted in the prolific
spread of invasive plant species throughout Aitutaki overtaking native cover.
Rising temperatures have resulted in incidents of coral bleaching and algae
blooms attributed to be the catalyst to fish poisoning in the lagoon. While
people have lived with fish poisoning for years and use a variety of
homeopathic remedies to combat the effects, there is concern with regards to
the potential loss of cultural sites to development and the changing
priorities/commitments of the community. The uncontrollable spread of invasive
plant species therefore threatens the preservation of traditional values and an
important aspect of the cultural identity of this community.
1. Establish greenhouse/hydroponic garden (event risks 3.15, 3.16,
4.8)
2. Work with government to establish a seed bank (event risks 3.15,
3.16)
3. Re-impose ban on use of Paraquat to protect reefs and promote reef
resilience, reduce stress, encourage friendly chemicals and green
cleaning products (event risk 3.16, 4 general)
61
Priority Issue 5: Impacts of extreme heat and drought (corresponds to
event risk 3, table 6)
Agreed Actions
Current Status Heat and social stress are ranked a priority concern. There is
a high number of electrical appliances in the community, which are susceptible
to power outages during times of high-energy use when air
conditioners/refrigerators are in demand. Dry periods disrupt education as
schools are shut down to avoid sanitation issues. Increase of drought resistant
invasive species are prevalent in the interior causing biodiversity loss and
adding to the pests farmers have to control or risk their crops and fruit trees
being overtaken by invasive species. People with respiratory ailments suffer
the most during extreme heat conditions and the cost of generating energy to
keep homes cool is high, while the costs of imported bottled water is
prohibitively expensive for most households.
1. Promote energy conservation and establish community renewable
energy program (solar, wind) in collaboration with tourist facilities
located in community (event risk 3.13)
2. Establish roster of asthmatic sufferers and the elderly and establish
community support program during periods of intense heat (event
risk 3.1, 3.9)
3. Promote traditional building methods/designs to ensure cooler
homes and the promotion of uniquely Polynesian architecture as a
tourism product for Aitutaki. (event risk 3, general , and 1.18)
4. Encourage a community tree-planting program to create shade in
public areas (3 general)
Priority issue 6: Institutional Arrangements Agreed Actions
Current status There are at present no institutional arrangements for
implementation of these recommendations or for community self-help,
preparation for disasters
1. Establish a Community Disaster/Climate Change Committee to
promote education and awareness about cyclone
preparedness, and oversee community response during and
after cyclone events. Practice cyclone response to reduce stress associated with poor planning and awareness.
2. Establish a Community emergency response plan.
3. Stock emergency food/water supplies in cyclone shelters during cyclone seasons.
4. Relocate priority government buildings – particularly government document centre where land title documents are stored.
5. Encourage business to develop and implement Business
Emergency Response Plan, which may involve re-locating businesses from vulnerable areas.
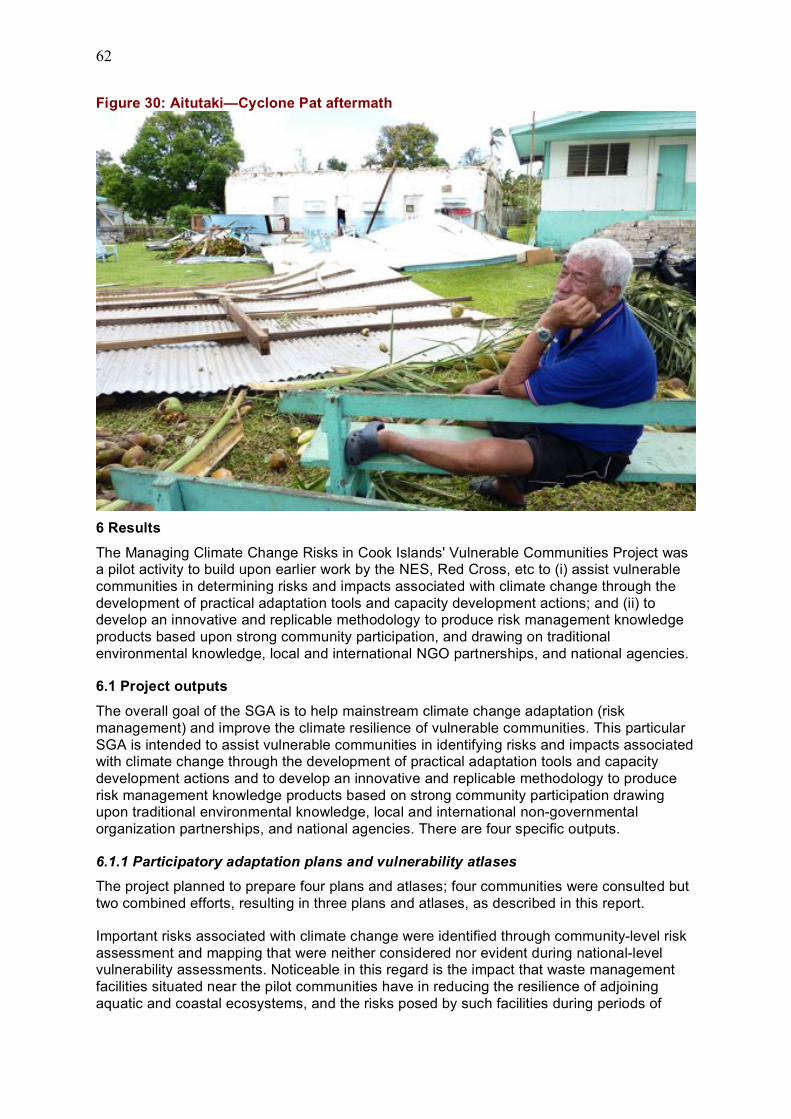
62
Figure 30: Aitutaki—Cyclone Pat aftermath
6 Results
The Managing Climate Change Risks in Cook Islands' Vulnerable Communities Project was a pilot activity to build upon earlier work by the NES, Red Cross, etc to (i) assist vulnerable
communities in determining risks and impacts associated with climate change through the
development of practical adaptation tools and capacity development actions; and (ii) to develop an innovative and replicable methodology to produce risk management knowledge
products based upon strong community participation, and drawing on traditional
environmental knowledge, local and international NGO partnerships, and national agencies.
6.1 Project outputs
The overall goal of the SGA is to help mainstream climate change adaptation (risk
management) and improve the climate resilience of vulnerable communities. This particular
SGA is intended to assist vulnerable communities in identifying risks and impacts associated with climate change through the development of practical adaptation tools and capacity
development actions and to develop an innovative and replicable methodology to produce
risk management knowledge products based on strong community participation drawing upon traditional environmental knowledge, local and international non-governmental
organization partnerships, and national agencies. There are four specific outputs.
6.1.1 Participatory adaptation plans and vulnerability atlases
The project planned to prepare four plans and atlases; four communities were consulted but
two combined efforts, resulting in three plans and atlases, as described in this report.
Important risks associated with climate change were identified through community-level risk
assessment and mapping that were neither considered nor evident during national-level vulnerability assessments. Noticeable in this regard is the impact that waste management
facilities situated near the pilot communities have in reducing the resilience of adjoining
aquatic and coastal ecosystems, and the risks posed by such facilities during periods of
63
intense precipitation. In light of the impact on vulnerable coastal biodiversity and natural
resources upon which these communities rely for their livelihoods, the runoff from these landfills, which occur during periods of intense precipitation, requires urgent attention. These
considerations should certainly be a part of the design specifications when future waste
management sites are being developed. This emphasizes the need for community
empowering in the participatory planning process. Additionally, it is apparent from this level of mapping that community disaster response shelters are often placed in areas vulnerable
to sea-level rise and storm surge inundation. Additionally, the vulnerability of individual
households to changes in water availability due to climate change impacts is readily discernable and should inform water resource management programs, water conservation
measures, and adaptation programs targeting better rainwater harvesting. Finally, there is a
need to investigate the potential risks to water supply from changes in vegetation resulting from the prolific spread of invasive species.
6.1.2 Integration of vulnerability atlases and adaptation plans into infrastructure
design by communities and government.
Map layers produced and composite maps have been conveyed to the National Environmental Service, Emergency Management Cook Islands, the Ministry of Finance and
Economic Management, and the Ministry of Infrastructure and Planning, together with the
recommendation that participatory mapping be replicated as a standard component of infrastructure development.
Whether this output will be mainstreamed and translate into an outcome of improved
adaptation throughout the Cook Islands can only be determined over a time horizon of at least five years. For the participating communities, however, the genie will not be put back in
the bottle; a more proactive approach to adaptation by these communities is a reasonable
expectation.
6.1.3 Information and education campaign formulated to promote the use of micro-adaptation strategies in target communities, Island Councils, and national agencies
Throughout the project, outreach has been a key element, including local television, radio
and print news coverage during the training and consultation phases. This continues through the creation of posters based upon the maps developed for the project for use in community
centers for the four pilot communities, and continued outreach to civil society through Te
Rito Enua and the Cook Islands Climate Action Network on the benefits of participatory
approaches and the importance of proactive community engagement in climate adaptation preparations.
6.1.4 Climate proofing of selected infrastructure project
The original concept was that the project would work with an ADB technical assistance team engaged in “climate proofing” infrastructure in the Cook Islands, to collaborate on the
identification of adaptation measures for the Aitutaki harbor. However, due to an
unanticipated delay in the project approval process, this project was not able to work in parallel with the team from this TA, and the opportunity was lost. Through the community
frameworks for adaptation, the project did identify further infrastructure opportunities,
particularly in the areas of waste disposal, water supply, and housing.
6.2 Conclusions
Outcomes from the goals identified in 7.1 cannot be readily determined in the short time
span of a small grant activity such as this. Implementation of findings is outside the scope of
the SGA. It is therefore recommended that:
64
• Government and the four pilot communities work together to implement the agreed-upon
community adaptation plans. Communities were able to specify adaptation measures that could be implemented by individuals, households or by the community themselves, in
many instances with minimal external support from government. However, in many
instances, many adaptation measures require the active involvement of government, the
donor community, and ideally the private sector. In particular, the establishment of an insurance scheme to cover households for flood and cyclone damage has been identified
by all communities as a priority which clearly requires government intervention and
leadership, and which could be supported by the ADB in light of the need within the Pacific of such a scheme to assist households and communities that presently have no
insurance coverage to protect against flood and cyclone damage. Given that the private
sector has been reluctant to bear risks for some of the most important climate risks, notably cyclones, a public/private partnership may be required.
Another example of an adaptation issue of concern to the communities but beyond the
scope of community control is deficiencies identified in government waste management
systems and water supply, which increases the vulnerability of nearby communities, or reduces the resilience of critical ecosystems. This clearly requires government
intervention and support from the ADB in light of the large capital costs associated with
such projects and the leadership role the ADB has taken in these sectors.
• Government integrate knowledge from this experience into national adaptation planning
processes, including through follow on workshops to build capacity in other communities,
in partnership with WWF/Te Rito Enua.
In all instances, the pilot communities identified the need to establish a Community
Disaster/Climate Change Committee to coordinate the implementation of priority
adaptation measures with the support of both the local government authorities and traditional leaders. In Aitutaki, a climate change committee, comprising community
leaders, was formed by the National Environment Service to support SGA activities, and
there was consensus that the committee be formally constituted to implement the adaptation framework developed under the project. National government in principle
supports any follow-up activities from this project in partnership with communities to
increase resilience.
The government should support the development of an information clearinghouse with resources for communities to use in adaptation planning, including maps (building upon
Ministry of Infrastructure and Planning’s online map library now under development, but
with resources from international organizations and processes, the private sector, civil society, and other ministries as well)
• Infrastructure development planning at the national and local levels, including in partnership with donor agencies, integrate participatory planning processes and their
results into infrastructure design, drawing upon the capacities and methods developed
through this project.
The project was limited to two of the more cosmopolitan of the Cook Islands. Further work
should expand to outer islands, which are, by virtue of their relative remoteness, less able
to depend upon external support for adaptation. The approach can and should be expanded to other Small Island Development States, and ultimately to vulnerable
communities elsewhere. In doing so, project design should take into account the need to
provide for institutional arrangements for implementation of the recommendations, and seed money to initiate implementations of priority recommendations.
65
• That the Cook Islands support a learning network of practitioners in participatory planning
methodologies, including but not limited to participatory mapping, to continuously improve and support community development practice.
Because of the exposure of communities in this project to the techniques and
technologies involved, they provide a platform for training of other communities in participatory mapping. Measures to build upon this project would include using the
existing capacity as an emerging centre of excellence, its prime role to provide a training
of trainers course to improve the ability of community mapping practitioners to convey techniques and best practices to other communities. There is also a need for training in
the use of open-source GIS tools. To overcome the bottleneck in trained personnel and
the high costs of using MapInfo and comparable commercial products, training of young and motivated community members in open source GIS products that are freely available,
such as Q-GIS, will make the adoption of this technology for community mapping
possible.
• That the Cook Islands integrate ecological, as well as infrastructure considerations into participatory adaptation planning.
In particular, work is required on the use of participatory processes, including community
mapping, to meet the challenge of alien invasive species, the occurrence of which is expected to increase as a result of climate change, and which pose potentially severe
threats to ecosystem services, particularly water resources, in the Cook Islands. This is a
major and under-studied issue in the project sites. In both Aitutaki and Rarotonga, the project identified major infestations of invasive non-native vines. In Rarotonga, extensive
mortality of tree species in the interior forest was observed. Since Rarotonga is entirely
dependent upon surface water for its drinking water supply, it is of paramount importance
to understand the life histories of these invasive vine species and their responses to climate change. The invasive vines may stabilize soils, but their response to extreme
weather associated with climate change is not well understood. Die-offs in periods of
drought or during cyclones could result in erosion with potentially significant impacts on water supply. Moreover, the invasive species are a threat to the biodiversity of the interior
forest. Specific measures that should be undertaken include:
• Mapping of the extent and rate of spread of the invasive vines.
• Targeted research into the response of these species to climate change
• Methods for control and eradication of the species, including biological controls,
chemical controls, physical removal, and potential for use of the biomass for
alternative fuel sources
• Hydrological modeling for purposes of planning
• Alternative water supply strategies, including water conservation, better water
retention and storage, and alternative sources.
As similar problems exist in other Pacific DMCs, knowledge gained in the Cook Islands
will have relevance for other Pacific DMCs, and can strengthen their capacity to respond
to climate impacts on water supply and alien invasive species management
7. Project Replicability
In addition to the specific outputs, a more general goal is the development of a replicable
model. Although empirical testing for replicability is outside the scope of this SGA, certain
66
conclusions can be drawn that will enhance the likelihood of a successful outcome. The
following considerations and recommendations are provided to enhance further
7.1 Measures to Support Replication
There is recognition that governments do not have adequate resources to meet all the
priority needs in the adaptation plans of vulnerable communities, and therefore requires a
greater level of self-reliance by those communities. This approach to adaptation is consistent with the "self-help" approach that has been adopted for the region-wide tsunami early
warning and response program, and is worthy of being expanded throughout the Cook
Islands and other Pacific island countries. In order to extend the participatory planning approach developed in this SGA, regional support could:
• Develop an internet-based learning network for community practitioners to promote
continued learning and sharing.
• Support peer-to-peer networking between communities to accelerate growth in regional
capacity.
• Boost growth in regional capacity to use the participatory GIS approach to adaptation
planning in resolving environment and development issues including biodiversity conservation, water management, waste management, and invasive species
management.
• Establish one or more regional or subregional clearinghouses of participatory planning tools, supporting both low and high tech approaches, including consultation best
practices, community self assessments and surveys, mapping, GIS, and modeling data.
Ideally free or low cost high-resolution remote sensing imagery to be made available through such a clearinghouse, the expanded use of open-source GIS software (including
training in its use), and the creation of a peer-to-peer learning network of participatory
planners to permit adaptive learning on a continuous basis, and to provide ongoing
technical assistance.
• Support is encouraged for a regional centre of excellence in participatory climate
adaptation planning that can develop and disseminate participatory approaches and
tools.
7.2 General lessons for replication
A community-based approach doesn't substitute for a technically rigorous national approach
to climate change, both because of matters of scope (some important technical issues lie
outside the competency of communities) and matters of scale (a patchwork of community approaches could potentially result in the geographic division of responsibilities that require
a more unified approach). For example, ecosystem-based approaches require interventions
at ecosystem scales. Management at inappropriate scales can result in a breakdown of coherence.
However, it is also clear that the communities are not fully engaged on the realities of
climate change. This is clearly an issue of environmental awareness and ownership. Climate change issues have so far been the 'government's role' in the eyes of the community, largely
due to government officials being the ones engaged in the climate debate and conducting
climate change vulnerability and adaptation activities. This somewhat limits communications
and information flow within a predominantly technical level between government, donors and the international community. Linking the national efforts to local communities therefore is
best demonstrated through the community-based approach of site-specific adaptation
planning.
67
Adaptation thus becomes everyone's business. Effective operation across different scales is
required, which means that there is an important role for communities and community-based participatory approaches that cannot be easily addressed through national-level approaches.
A major impediment to implementation of the map-based approach was the competition for
the time of the limited number of people capable of working with GIS in the Cook Islands.
The project was implemented during a period of unexpectedly high demand for GIS services. This demand shows no sign of abatement. On balance, this is a positive
development, as it means that the geospatial knowledge base is growing in the Pacific
. Future mapping efforts will benefit from the variety of map layers available, if the responsible authorities are able to develop and maintain necessary information, including a
collection of digital maps, climate models, and relevant documentation.
This project demonstrates that participatory mapping does improve community capacity and interest in local climate adaptation strategies, which will result in a more proactive approach
at the local level including measures to reduce and mitigate risk, organize for disaster, and
produce an informed constituency that will demonstrate greater interest and participation in
adaptation work, including in demand for and support to government led initiatives.
Capacity in participatory GIS is an asset for the Pacific, and could be integrated into a wide
range of regional programs. Mainstreaming participatory GIS into development in Pacific
DMCs will be easier if skills can be developed and maintained through a cadre of practitioners organized in a network. The mapping teams developed in the Cook Islands
constitute an emerging centre of excellence that can be built upon to scale up the approach.
Participatory approaches can also be seen as a positive contribution to an overall movement in the direction of aid transparency inasmuch as it encourages an open source approach to
knowledge generation and information management.
8 Observations
A community-based participatory approach is a valuable tool for bringing the reality of climate change to bear at the local and household level. The approach provides a way for
citizens to internalize the knowledge being generated through more technical processes at
the national level. A process of discussing, debating, and problem solving produces more resilient communities that are better able to self-organize for change.
The engagement of communities in risk assessment and mapping provides an important tool
to reduce climate risks, through which their adaptive capacity, and thereby their resilience to
climate change impacts, has been considerably improved. Not only does the approach provide communities with tangible evidence of the risks associated with climate change, but
the community mapping process also highlights behavioral and development issues that
affect the vulnerability of individual households and the community at large. There was a discernable sense of empowerment by participating communities in developing vulnerability
maps and having them available. Without exception, all the pilot communities requested
printed copies of the vulnerability atlases for display in public places to engender support for change and implementation of their proposed action plans.
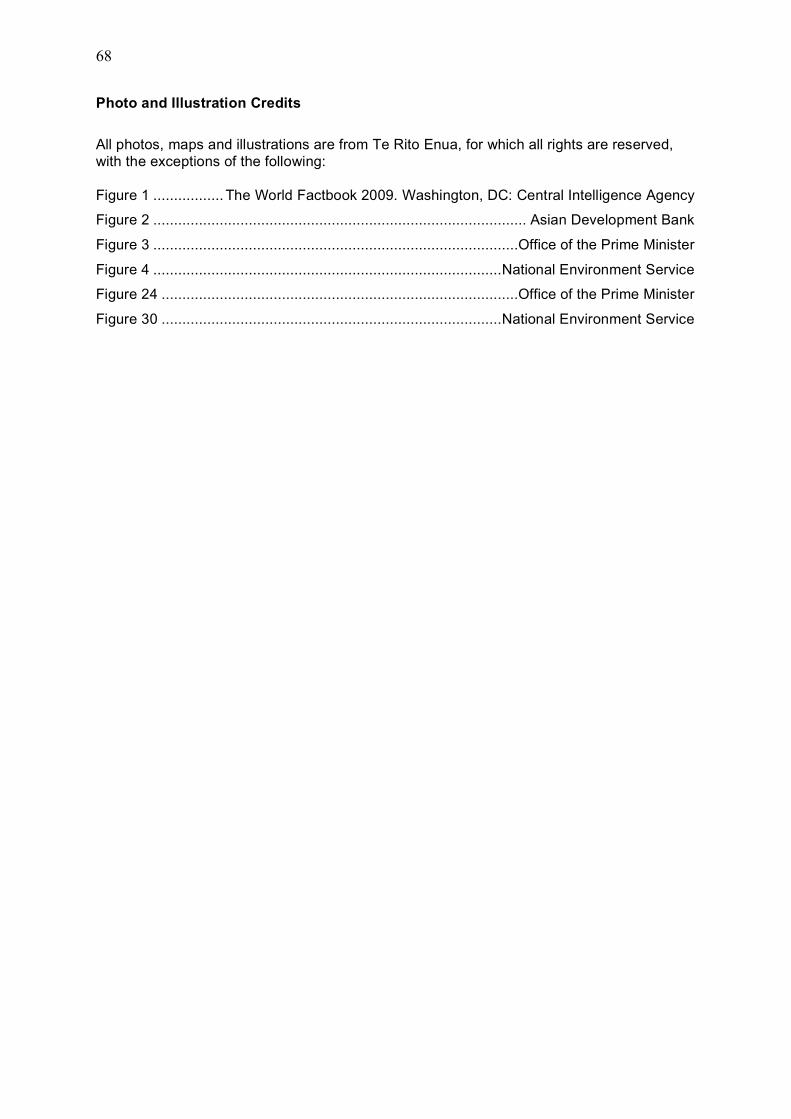
68
Photo and Illustration Credits
All photos, maps and illustrations are from Te Rito Enua, for which all rights are reserved,
with the exceptions of the following:
Figure 1 ................. The World Factbook 2009. Washington, DC: Central Intelligence Agency
Figure 2 .......................................................................................... Asian Development Bank
Figure 3 ........................................................................................Office of the Prime Minister
Figure 4 ....................................................................................National Environment Service
Figure 24 ......................................................................................Office of the Prime Minister
Figure 30 ..................................................................................National Environment Service
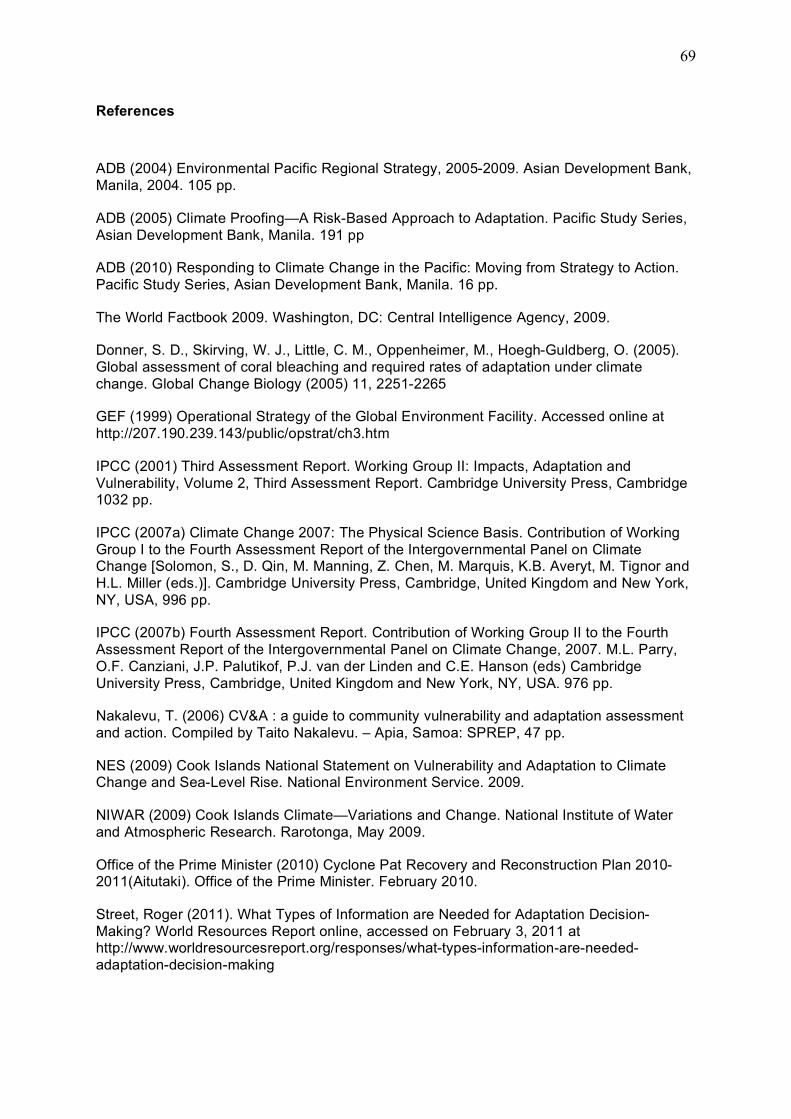
69
References
ADB (2004) Environmental Pacific Regional Strategy, 2005-2009. Asian Development Bank,
Manila, 2004. 105 pp.
ADB (2005) Climate Proofing—A Risk-Based Approach to Adaptation. Pacific Study Series,
Asian Development Bank, Manila. 191 pp
ADB (2010) Responding to Climate Change in the Pacific: Moving from Strategy to Action.
Pacific Study Series, Asian Development Bank, Manila. 16 pp.
The World Factbook 2009. Washington, DC: Central Intelligence Agency, 2009.
Donner, S. D., Skirving, W. J., Little, C. M., Oppenheimer, M., Hoegh-Guldberg, O. (2005).
Global assessment of coral bleaching and required rates of adaptation under climate
change. Global Change Biology (2005) 11, 2251-2265
GEF (1999) Operational Strategy of the Global Environment Facility. Accessed online at
http://207.190.239.143/public/opstrat/ch3.htm
IPCC (2001) Third Assessment Report. Working Group II: Impacts, Adaptation and
Vulnerability, Volume 2, Third Assessment Report. Cambridge University Press, Cambridge 1032 pp.
IPCC (2007a) Climate Change 2007: The Physical Science Basis. Contribution of Working
Group I to the Fourth Assessment Report of the Intergovernmental Panel on Climate Change [Solomon, S., D. Qin, M. Manning, Z. Chen, M. Marquis, K.B. Averyt, M. Tignor and
H.L. Miller (eds.)]. Cambridge University Press, Cambridge, United Kingdom and New York,
NY, USA, 996 pp.
IPCC (2007b) Fourth Assessment Report. Contribution of Working Group II to the Fourth
Assessment Report of the Intergovernmental Panel on Climate Change, 2007. M.L. Parry,
O.F. Canziani, J.P. Palutikof, P.J. van der Linden and C.E. Hanson (eds) Cambridge
University Press, Cambridge, United Kingdom and New York, NY, USA. 976 pp.
Nakalevu, T. (2006) CV&A : a guide to community vulnerability and adaptation assessment
and action. Compiled by Taito Nakalevu. – Apia, Samoa: SPREP, 47 pp.
NES (2009) Cook Islands National Statement on Vulnerability and Adaptation to Climate Change and Sea-Level Rise. National Environment Service. 2009.
NIWAR (2009) Cook Islands Climate—Variations and Change. National Institute of Water
and Atmospheric Research. Rarotonga, May 2009.
Office of the Prime Minister (2010) Cyclone Pat Recovery and Reconstruction Plan 2010-2011(Aitutaki). Office of the Prime Minister. February 2010.
Street, Roger (2011). What Types of Information are Needed for Adaptation Decision-
Making? World Resources Report online, accessed on February 3, 2011 at http://www.worldresourcesreport.org/responses/what-types-information-are-needed-
adaptation-decision-making

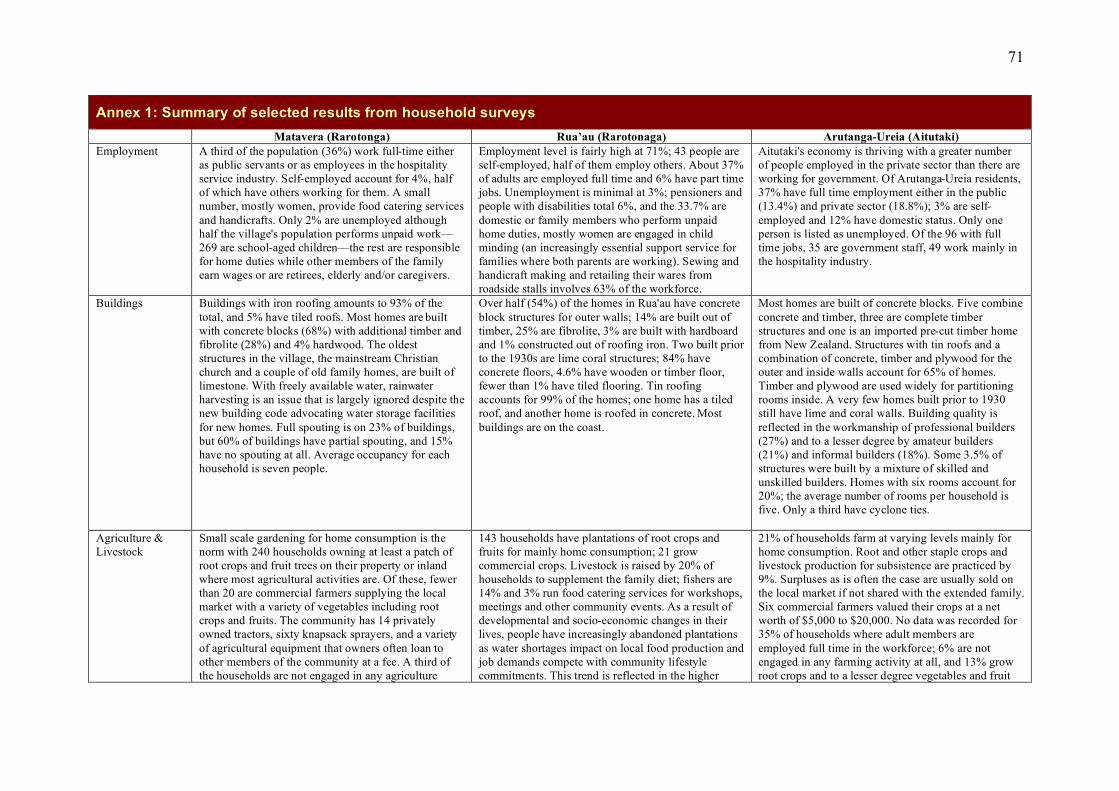
71
Annex 1: Summary of selected results from household surveys
Matavera (Rarotonga) Rua’au (Rarotonaga) Arutanga-Ureia (Aitutaki)
Employment A third of the population (36%) work full-time either as public servants or as employees in the hospitality service industry. Self-employed account for 4%, half of which have others working for them. A small number, mostly women, provide food catering services
and handicrafts. Only 2% are unemployed although half the village's population performs unpaid work—269 are school-aged children—the rest are responsible for home duties while other members of the family earn wages or are retirees, elderly and/or caregivers.
Employment level is fairly high at 71%; 43 people are self-employed, half of them employ others. About 37% of adults are employed full time and 6% have part time jobs. Unemployment is minimal at 3%; pensioners and people with disabilities total 6%, and the 33.7% are
domestic or family members who perform unpaid home duties, mostly women are engaged in child minding (an increasingly essential support service for families where both parents are working). Sewing and handicraft making and retailing their wares from roadside stalls involves 63% of the workforce.
Aitutaki's economy is thriving with a greater number of people employed in the private sector than there are working for government. Of Arutanga-Ureia residents, 37% have full time employment either in the public (13.4%) and private sector (18.8%); 3% are self-
employed and 12% have domestic status. Only one person is listed as unemployed. Of the 96 with full time jobs, 35 are government staff, 49 work mainly in the hospitality industry.
Buildings Buildings with iron roofing amounts to 93% of the
total, and 5% have tiled roofs. Most homes are built with concrete blocks (68%) with additional timber and fibrolite (28%) and 4% hardwood. The oldest structures in the village, the mainstream Christian church and a couple of old family homes, are built of limestone. With freely available water, rainwater harvesting is an issue that is largely ignored despite the new building code advocating water storage facilities
for new homes. Full spouting is on 23% of buildings, but 60% of buildings have partial spouting, and 15% have no spouting at all. Average occupancy for each household is seven people.
Over half (54%) of the homes in Rua'au have concrete
block structures for outer walls; 14% are built out of timber, 25% are fibrolite, 3% are built with hardboard and 1% constructed out of roofing iron. Two built prior to the 1930s are lime coral structures; 84% have concrete floors, 4.6% have wooden or timber floor, fewer than 1% have tiled flooring. Tin roofing accounts for 99% of the homes; one home has a tiled roof, and another home is roofed in concrete. Most
buildings are on the coast.
Most homes are built of concrete blocks. Five combine
concrete and timber, three are complete timber structures and one is an imported pre-cut timber home from New Zealand. Structures with tin roofs and a combination of concrete, timber and plywood for the outer and inside walls account for 65% of homes. Timber and plywood are used widely for partitioning rooms inside. A very few homes built prior to 1930 still have lime and coral walls. Building quality is
reflected in the workmanship of professional builders (27%) and to a lesser degree by amateur builders (21%) and informal builders (18%). Some 3.5% of structures were built by a mixture of skilled and unskilled builders. Homes with six rooms account for 20%; the average number of rooms per household is five. Only a third have cyclone ties.
Agriculture & Livestock
Small scale gardening for home consumption is the norm with 240 households owning at least a patch of root crops and fruit trees on their property or inland where most agricultural activities are. Of these, fewer than 20 are commercial farmers supplying the local market with a variety of vegetables including root crops and fruits. The community has 14 privately owned tractors, sixty knapsack sprayers, and a variety
of agricultural equipment that owners often loan to other members of the community at a fee. A third of the households are not engaged in any agriculture
143 households have plantations of root crops and fruits for mainly home consumption; 21 grow commercial crops. Livestock is raised by 20% of households to supplement the family diet; fishers are 14% and 3% run food catering services for workshops, meetings and other community events. As a result of developmental and socio-economic changes in their lives, people have increasingly abandoned plantations
as water shortages impact on local food production and job demands compete with community lifestyle commitments. This trend is reflected in the higher
21% of households farm at varying levels mainly for home consumption. Root and other staple crops and livestock production for subsistence are practiced by 9%. Surpluses as is often the case are usually sold on the local market if not shared with the extended family. Six commercial farmers valued their crops at a net worth of $5,000 to $20,000. No data was recorded for 35% of households where adult members are
employed full time in the workforce; 6% are not engaged in any farming activity at all, and 13% grow root crops and to a lesser degree vegetables and fruit
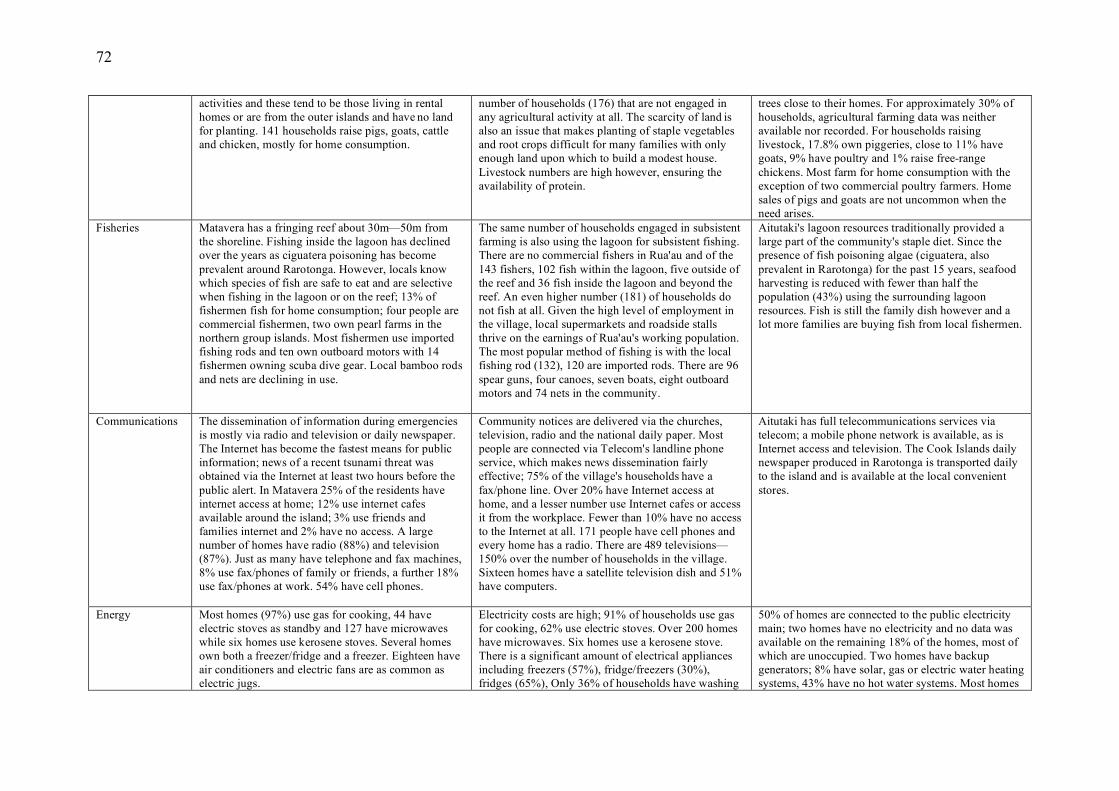
72
activities and these tend to be those living in rental
homes or are from the outer islands and have no land
for planting. 141 households raise pigs, goats, cattle
and chicken, mostly for home consumption.
number of households (176) that are not engaged in
any agricultural activity at all. The scarcity of land is
also an issue that makes planting of staple vegetables
and root crops difficult for many families with only
enough land upon which to build a modest house.
Livestock numbers are high however, ensuring the
availability of protein.
trees close to their homes. For approximately 30% of
households, agricultural farming data was neither
available nor recorded. For households raising
livestock, 17.8% own piggeries, close to 11% have
goats, 9% have poultry and 1% raise free-range
chickens. Most farm for home consumption with the
exception of two commercial poultry farmers. Home
sales of pigs and goats are not uncommon when the
need arises.
Fisheries Matavera has a fringing reef about 30m—50m from
the shoreline. Fishing inside the lagoon has declined
over the years as ciguatera poisoning has become
prevalent around Rarotonga. However, locals know
which species of fish are safe to eat and are selective
when fishing in the lagoon or on the reef; 13% of
fishermen fish for home consumption; four people are
commercial fishermen, two own pearl farms in the
northern group islands. Most fishermen use imported
fishing rods and ten own outboard motors with 14
fishermen owning scuba dive gear. Local bamboo rods
and nets are declining in use.
The same number of households engaged in subsistent
farming is also using the lagoon for subsistent fishing.
There are no commercial fishers in Rua'au and of the
143 fishers, 102 fish within the lagoon, five outside of
the reef and 36 fish inside the lagoon and beyond the
reef. An even higher number (181) of households do
not fish at all. Given the high level of employment in
the village, local supermarkets and roadside stalls
thrive on the earnings of Rua'au's working population.
The most popular method of fishing is with the local
fishing rod (132), 120 are imported rods. There are 96
spear guns, four canoes, seven boats, eight outboard
motors and 74 nets in the community.
Aitutaki's lagoon resources traditionally provided a
large part of the community's staple diet. Since the
presence of fish poisoning algae (ciguatera, also
prevalent in Rarotonga) for the past 15 years, seafood
harvesting is reduced with fewer than half the
population (43%) using the surrounding lagoon
resources. Fish is still the family dish however and a
lot more families are buying fish from local fishermen.
Communications The dissemination of information during emergencies
is mostly via radio and television or daily newspaper.
The Internet has become the fastest means for public
information; news of a recent tsunami threat was
obtained via the Internet at least two hours before the
public alert. In Matavera 25% of the residents have
internet access at home; 12% use internet cafes
available around the island; 3% use friends and
families internet and 2% have no access. A large
number of homes have radio (88%) and television
(87%). Just as many have telephone and fax machines,
8% use fax/phones of family or friends, a further 18%
use fax/phones at work. 54% have cell phones.
Community notices are delivered via the churches,
television, radio and the national daily paper. Most
people are connected via Telecom's landline phone
service, which makes news dissemination fairly
effective; 75% of the village's households have a
fax/phone line. Over 20% have Internet access at
home, and a lesser number use Internet cafes or access
it from the workplace. Fewer than 10% have no access
to the Internet at all. 171 people have cell phones and
every home has a radio. There are 489 televisions—
150% over the number of households in the village.
Sixteen homes have a satellite television dish and 51%
have computers.
Aitutaki has full telecommunications services via
telecom; a mobile phone network is available, as is
Internet access and television. The Cook Islands daily
newspaper produced in Rarotonga is transported daily
to the island and is available at the local convenient
stores.
Energy Most homes (97%) use gas for cooking, 44 have
electric stoves as standby and 127 have microwaves
while six homes use kerosene stoves. Several homes
own both a freezer/fridge and a freezer. Eighteen have
air conditioners and electric fans are as common as
electric jugs.
Electricity costs are high; 91% of households use gas
for cooking, 62% use electric stoves. Over 200 homes
have microwaves. Six homes use a kerosene stove.
There is a significant amount of electrical appliances
including freezers (57%), fridge/freezers (30%),
fridges (65%), Only 36% of households have washing
50% of homes are connected to the public electricity
main; two homes have no electricity and no data was
available on the remaining 18% of the homes, most of
which are unoccupied. Two homes have backup
generators; 8% have solar, gas or electric water heating
systems, 43% have no hot water systems. Most homes
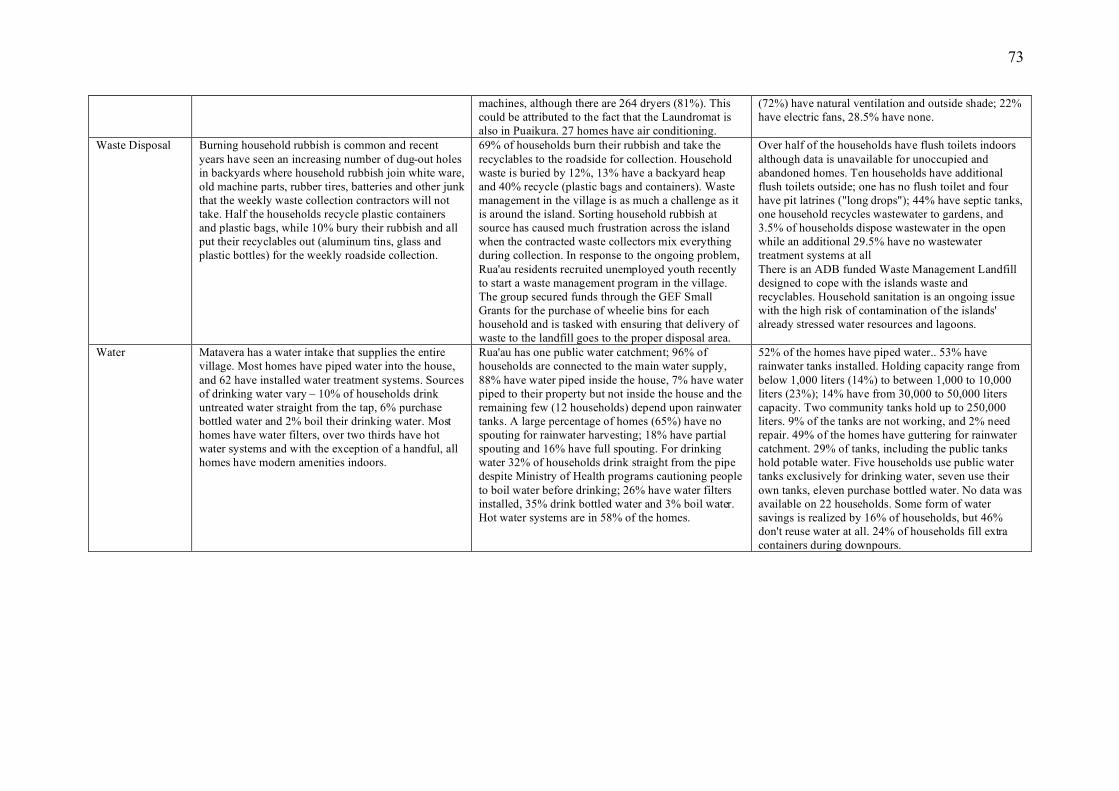
73
machines, although there are 264 dryers (81%). This
could be attributed to the fact that the Laundromat is
also in Puaikura. 27 homes have air conditioning.
(72%) have natural ventilation and outside shade; 22%
have electric fans, 28.5% have none.
Waste Disposal Burning household rubbish is common and recent
years have seen an increasing number of dug-out holes
in backyards where household rubbish join white ware,
old machine parts, rubber tires, batteries and other junk
that the weekly waste collection contractors will not
take. Half the households recycle plastic containers
and plastic bags, while 10% bury their rubbish and all
put their recyclables out (aluminum tins, glass and
plastic bottles) for the weekly roadside collection.
69% of households burn their rubbish and take the
recyclables to the roadside for collection. Household
waste is buried by 12%, 13% have a backyard heap
and 40% recycle (plastic bags and containers). Waste
management in the village is as much a challenge as it
is around the island. Sorting household rubbish at
source has caused much frustration across the island
when the contracted waste collectors mix everything
during collection. In response to the ongoing problem,
Rua'au residents recruited unemployed youth recently
to start a waste management program in the village.
The group secured funds through the GEF Small
Grants for the purchase of wheelie bins for each
household and is tasked with ensuring that delivery of
waste to the landfill goes to the proper disposal area.
Over half of the households have flush toilets indoors
although data is unavailable for unoccupied and
abandoned homes. Ten households have additional
flush toilets outside; one has no flush toilet and four
have pit latrines ("long drops"); 44% have septic tanks,
one household recycles wastewater to gardens, and
3.5% of households dispose wastewater in the open
while an additional 29.5% have no wastewater
treatment systems at all
There is an ADB funded Waste Management Landfill
designed to cope with the islands waste and
recyclables. Household sanitation is an ongoing issue
with the high risk of contamination of the islands'
already stressed water resources and lagoons.
Water Matavera has a water intake that supplies the entire
village. Most homes have piped water into the house,
and 62 have installed water treatment systems. Sources
of drinking water vary – 10% of households drink
untreated water straight from the tap, 6% purchase
bottled water and 2% boil their drinking water. Most
homes have water filters, over two thirds have hot
water systems and with the exception of a handful, all
homes have modern amenities indoors.
Rua'au has one public water catchment; 96% of
households are connected to the main water supply,
88% have water piped inside the house, 7% have water
piped to their property but not inside the house and the
remaining few (12 households) depend upon rainwater
tanks. A large percentage of homes (65%) have no
spouting for rainwater harvesting; 18% have partial
spouting and 16% have full spouting. For drinking
water 32% of households drink straight from the pipe
despite Ministry of Health programs cautioning people
to boil water before drinking; 26% have water filters
installed, 35% drink bottled water and 3% boil water.
Hot water systems are in 58% of the homes.
52% of the homes have piped water.. 53% have
rainwater tanks installed. Holding capacity range from
below 1,000 liters (14%) to between 1,000 to 10,000
liters (23%); 14% have from 30,000 to 50,000 liters
capacity. Two community tanks hold up to 250,000
liters. 9% of the tanks are not working, and 2% need
repair. 49% of the homes have guttering for rainwater
catchment. 29% of tanks, including the public tanks
hold potable water. Five households use public water
tanks exclusively for drinking water, seven use their
own tanks, eleven purchase bottled water. No data was
available on 22 households. Some form of water
savings is realized by 16% of households, but 46%
don't reuse water at all. 24% of households fill extra
containers during downpours.

75
Annex 2. Household Survey Form
Introduction: This survey to evaluate and map household vulnerability to climate change impacts is
being undertaken as part of a pilot project supported by the Asian Development Bank. The survey
will provide information that will assist the Community Climate Change and Disaster Committee in
developing and implementing priority risk management measures that will help individual
households respond to climate change risks, including the following:
• An anticipated 50cm rise in sea-level, which when combined with storm surge will result in
coastal areas being inundated;
• Increase in extreme events (droughts, flooding);
• Increase in cyclone intensity (i.e. more category 4 and 5 cyclones);
• Changes in weather patterns;
• Increased episodes of high temperatures.
Questionnaire Administrator ..................................................................................
Questionnaire completed by..................................................................................
Date:___/___/2010
House number:_______ (see reference map)
Managing Climate Change Risks to Vulnerable Communities
Aitutaki Household Vulnerability Study

76
Household Questions
Ingoa Name of Informant(s):
____________________________________________________
Number of Occupants:
_________________________________________________________
Household data (start with eldest)
How many years have you lived on Aitutaki? ________ Years or Whole Life
Questions about buildings/house - Do you own or rent the house?
_____________________
Age of building/structure (years) ______
Current condition of building and roof
Tick box and condition of the house and roof
Excellent Good Fair Bad
Roof Condition
Building Condition
Prone to Flooding Yes No
Is the house raised above ground?
Yes No
Approx how many meters above the ground is it raised? ……… (m)
What method has been used to raise the house above the ground: (tick box)
Piles
Raised foundation
Other Methods.
Describe:………………………………………………………………………………………
…………………………………………………………………………………………………
…………………………………………………………………………
What is the house made of:
Name Gender
(M, F)
Age: 60+, 16-60. 5-15
Up to 5 Occupation
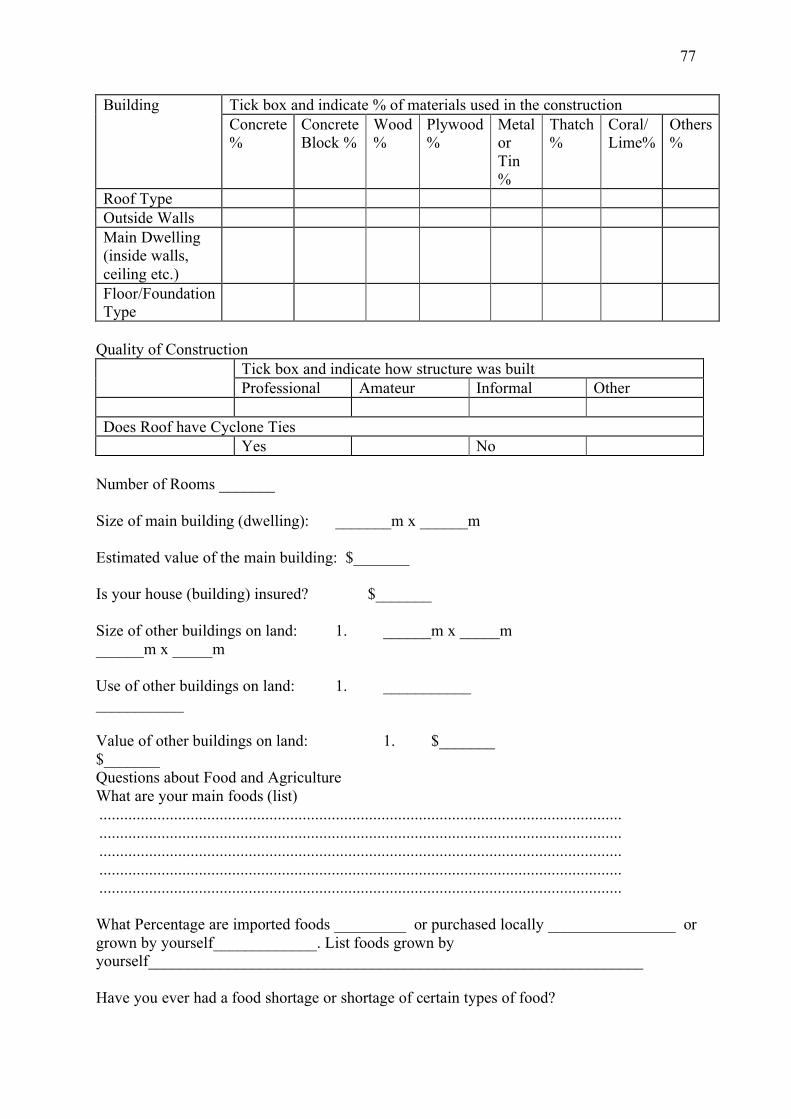
77
Tick box and indicate % of materials used in the construction Building
Concrete %
Concrete Block %
Wood %
Plywood %
Metal or Tin %
Thatch %
Coral/ Lime%
Others %
Roof Type
Outside Walls
Main Dwelling (inside walls, ceiling etc.)
Floor/Foundation Type
Quality of Construction
Tick box and indicate how structure was built
Professional Amateur Informal Other
Does Roof have Cyclone Ties
Yes No
Number of Rooms _______ Size of main building (dwelling): _______m x ______m Estimated value of the main building: $_______ Is your house (building) insured? $_______ Size of other buildings on land: 1. ______m x _____m ______m x _____m Use of other buildings on land: 1. ___________ ___________ Value of other buildings on land: 1. $_______ $_______ Questions about Food and Agriculture What are your main foods (list) .............................................................................................................................. .............................................................................................................................. .............................................................................................................................. .............................................................................................................................. .............................................................................................................................. What Percentage are imported foods _________ or purchased locally ________________ or grown by yourself_____________. List foods grown by yourself______________________________________________________________ Have you ever had a food shortage or shortage of certain types of food?
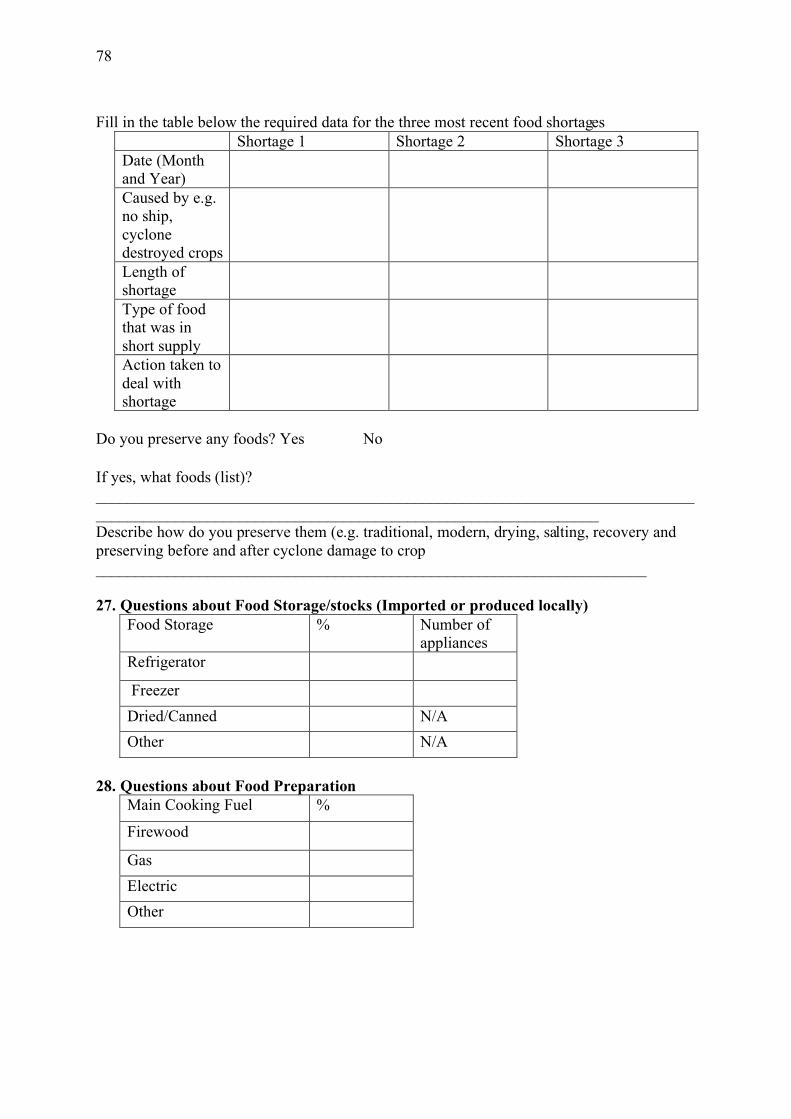
78
Fill in the table below the required data for the three most recent food shortages
Shortage 1 Shortage 2 Shortage 3
Date (Month
and Year)
Caused by e.g.
no ship,
cyclone
destroyed crops
Length of
shortage
Type of food
that was in
short supply
Action taken to
deal with
shortage
Do you preserve any foods? Yes No
If yes, what foods (list)?
___________________________________________________________________________
_______________________________________________________________
Describe how do you preserve them (e.g. traditional, modern, drying, salting, recovery and
preserving before and after cyclone damage to crop
_____________________________________________________________________
27. Questions about Food Storage/stocks (Imported or produced locally)
Food Storage % Number of
appliances
Refrigerator
Freezer
Dried/Canned N/A
Other N/A
28. Questions about Food Preparation
Main Cooking Fuel %
Firewood
Gas
Electric
Other

79
29. Questions about Farming and Livestock
Value of farm (if applicable): $_____________
Where is your growing activity Close to Household Away from Household
Where is your Livestock activity Close to Household Away from Household
Questions about Water Supply
Do you have piped water? Yes No
Do you have a water tank(s)? Yes No
If yes, what material is it made from
Plastic Metal Concrete Other (specify)
What size is the water storage tank (in litres)?____________
Is it is good working condition? Yes No
Does your roof catch rain? Yes No
If yes, how extensive is the guttering to catch the rain?
All around the house
Half of the house
A single spout (guttering-piece)
Pump from tank to house
Livestock Activity Est. Number
Poultry
Piggery
Goat
Other
Farming Agriculture type %
Subsistence/Domestic
Commercial
Other
Crops: (List)
None
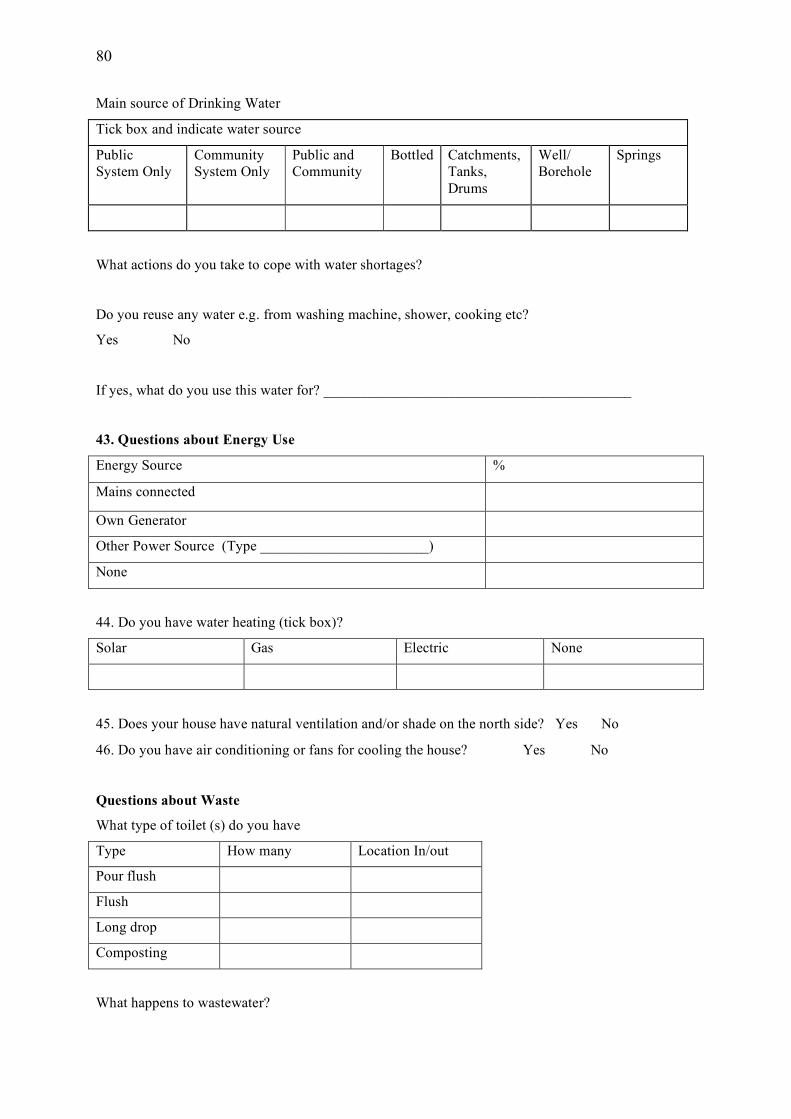
80
Main source of Drinking Water
Tick box and indicate water source
Public
System Only
Community
System Only
Public and
Community
Bottled Catchments,
Tanks,
Drums
Well/
Borehole
Springs
What actions do you take to cope with water shortages?
Do you reuse any water e.g. from washing machine, shower, cooking etc?
Yes No
If yes, what do you use this water for? __________________________________________
43. Questions about Energy Use
Energy Source %
Mains connected
Own Generator
Other Power Source (Type _______________________)
None
44. Do you have water heating (tick box)?
Solar Gas Electric None
45. Does your house have natural ventilation and/or shade on the north side? Yes No
46. Do you have air conditioning or fans for cooling the house? Yes No
Questions about Waste
What type of toilet (s) do you have
Type How many Location In/out
Pour flush
Flush
Long drop
Composting
What happens to wastewater?
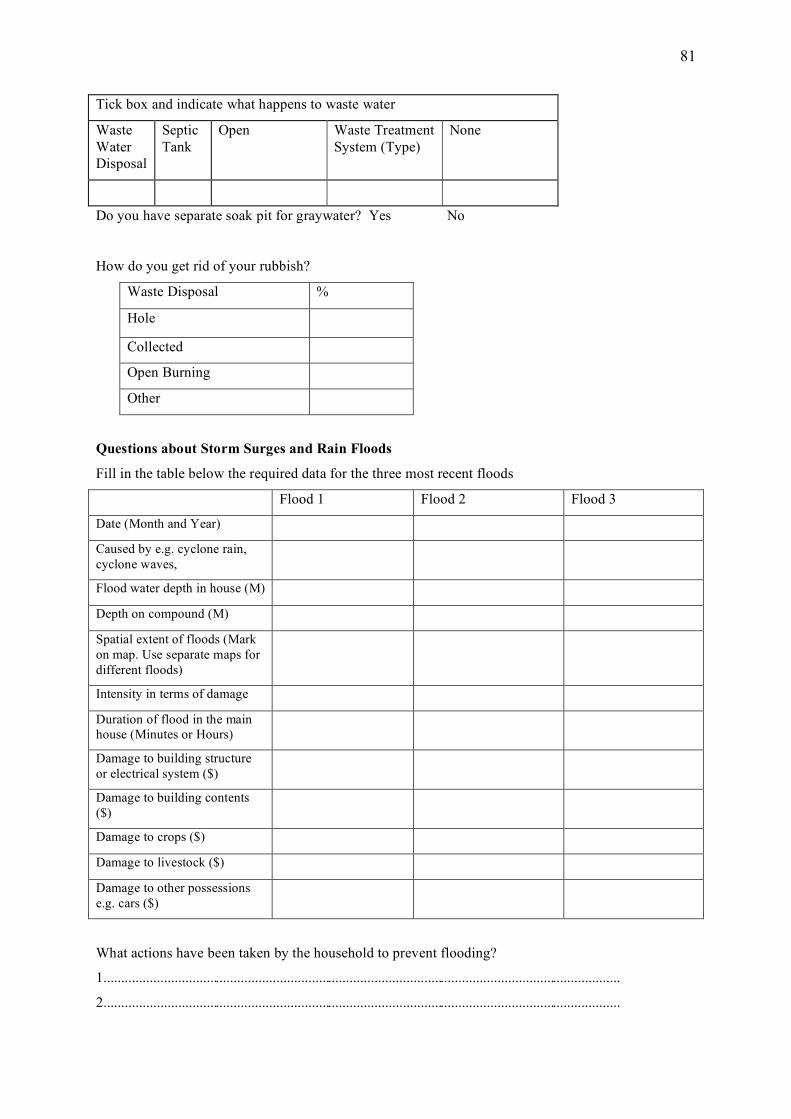
81
Tick box and indicate what happens to waste water
Waste
Water Disposal
Septic
Tank
Open Waste Treatment
System (Type)
None
Do you have separate soak pit for graywater? Yes No
How do you get rid of your rubbish?
Waste Disposal %
Hole
Collected
Open Burning
Other
Questions about Storm Surges and Rain Floods
Fill in the table below the required data for the three most recent floods
Flood 1 Flood 2 Flood 3
Date (Month and Year)
Caused by e.g. cyclone rain,
cyclone waves,
Flood water depth in house (M)
Depth on compound (M)
Spatial extent of floods (Mark
on map. Use separate maps for
different floods)
Intensity in terms of damage
Duration of flood in the main house (Minutes or Hours)
Damage to building structure
or electrical system ($)
Damage to building contents
($)
Damage to crops ($)
Damage to livestock ($)
Damage to other possessions
e.g. cars ($)
What actions have been taken by the household to prevent flooding?
1...................................................................................................................................................
2...................................................................................................................................................

82
3...................................................................................................................................................
4...................................................................................................................................................
5...................................................................................................................................................
Have you ever considered moving your house to a place less vulnerable to flooding or building up on
pillars?
Yes No
If yes, why have you not moved or built up on pillars?
.....................................................................................................................................................
.....................................................................................................................................................
.....................................................................................................................................................
If yes and have moved, where is this place i.e. location? Mark location on map and describe
.....................................................................................................................................................
.....................................................................................................................................................
.....................................................................................................................................................
Questions about Climate and Vegetation
Do you think the climate has changed over time? Yes No
If yes, what changes have you noticed?
.....................................................................................................................................................
.....................................................................................................................................................
What do you think caused these changes?
.....................................................................................................................................................
.....................................................................................................................................................
.....................................................................................................................................................
Has the vegetation changed over time? Yes No
If yes, is it more vegetated now than 10 or 20 years back?
.....................................................................................................................................................
.....................................................................................................................................................
.....................................................................................................................................................
Have there been bush fires in your area Yes No
If yes, what was the main cause of these fires? .....................................................................................................................................................
.....................................................................................................................................................
.....................................................................................................................................................
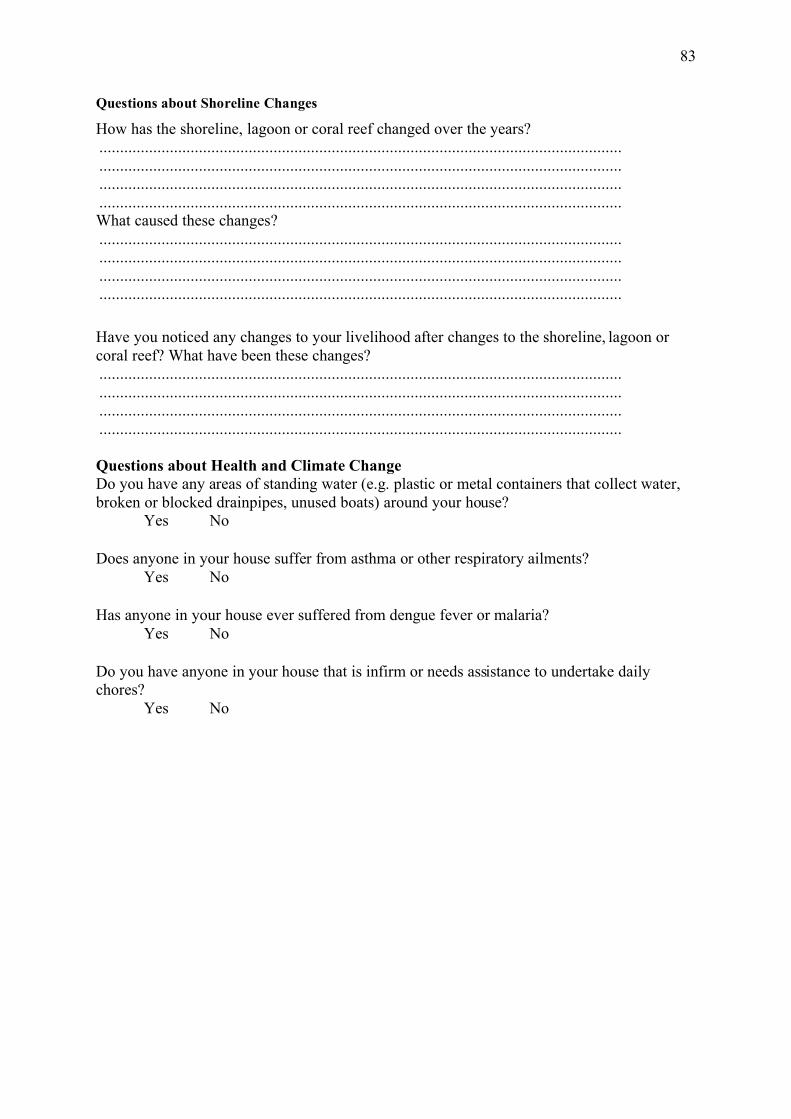
83
Questions about Shoreline Changes
How has the shoreline, lagoon or coral reef changed over the years?
..............................................................................................................................
..............................................................................................................................
..............................................................................................................................
..............................................................................................................................
What caused these changes?
..............................................................................................................................
..............................................................................................................................
..............................................................................................................................
..............................................................................................................................
Have you noticed any changes to your livelihood after changes to the shoreline, lagoon or
coral reef? What have been these changes?
..............................................................................................................................
..............................................................................................................................
..............................................................................................................................
..............................................................................................................................
Questions about Health and Climate Change
Do you have any areas of standing water (e.g. plastic or metal containers that collect water,
broken or blocked drainpipes, unused boats) around your house?
Yes No
Does anyone in your house suffer from asthma or other respiratory ailments?
Yes No
Has anyone in your house ever suffered from dengue fever or malaria?
Yes No
Do you have anyone in your house that is infirm or needs assistance to undertake daily
chores?
Yes No

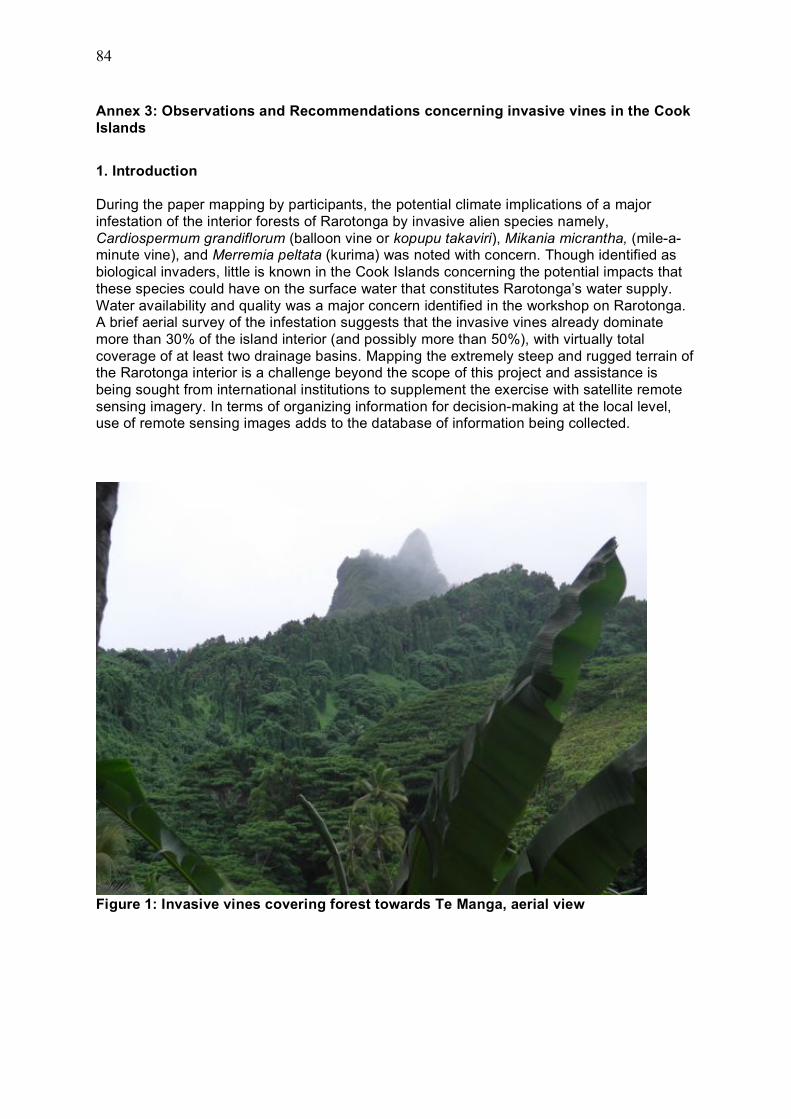
84
Annex 3: Observations and Recommendations concerning invasive vines in the Cook
Islands
1. Introduction
During the paper mapping by participants, the potential climate implications of a major
infestation of the interior forests of Rarotonga by invasive alien species namely,
Cardiospermum grandiflorum (balloon vine or kopupu takaviri), Mikania micrantha, (mile-a-minute vine), and Merremia peltata (kurima) was noted with concern. Though identified as
biological invaders, little is known in the Cook Islands concerning the potential impacts that
these species could have on the surface water that constitutes Rarotonga’s water supply.
Water availability and quality was a major concern identified in the workshop on Rarotonga. A brief aerial survey of the infestation suggests that the invasive vines already dominate
more than 30% of the island interior (and possibly more than 50%), with virtually total
coverage of at least two drainage basins. Mapping the extremely steep and rugged terrain of the Rarotonga interior is a challenge beyond the scope of this project and assistance is
being sought from international institutions to supplement the exercise with satellite remote
sensing imagery. In terms of organizing information for decision-making at the local level, use of remote sensing images adds to the database of information being collected.
Figure 1: Invasive vines covering forest towards Te Manga, aerial view
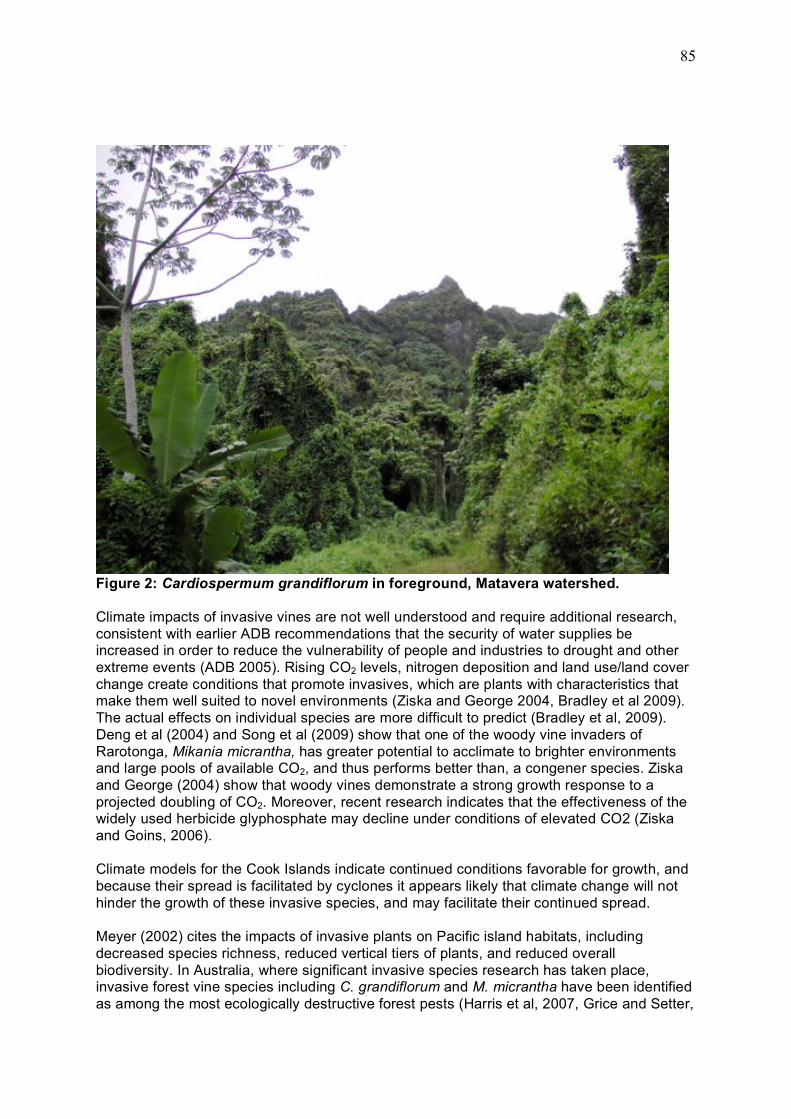
85
Figure 2: Cardiospermum grandiflorum in foreground, Matavera watershed.
Climate impacts of invasive vines are not well understood and require additional research,
consistent with earlier ADB recommendations that the security of water supplies be increased in order to reduce the vulnerability of people and industries to drought and other
extreme events (ADB 2005). Rising CO2 levels, nitrogen deposition and land use/land cover
change create conditions that promote invasives, which are plants with characteristics that make them well suited to novel environments (Ziska and George 2004, Bradley et al 2009).
The actual effects on individual species are more difficult to predict (Bradley et al, 2009).
Deng et al (2004) and Song et al (2009) show that one of the woody vine invaders of
Rarotonga, Mikania micrantha, has greater potential to acclimate to brighter environments and large pools of available CO2, and thus performs better than, a congener species. Ziska
and George (2004) show that woody vines demonstrate a strong growth response to a
projected doubling of CO2. Moreover, recent research indicates that the effectiveness of the widely used herbicide glyphosphate may decline under conditions of elevated CO2 (Ziska
and Goins, 2006).
Climate models for the Cook Islands indicate continued conditions favorable for growth, and
because their spread is facilitated by cyclones it appears likely that climate change will not
hinder the growth of these invasive species, and may facilitate their continued spread.
Meyer (2002) cites the impacts of invasive plants on Pacific island habitats, including
decreased species richness, reduced vertical tiers of plants, and reduced overall
biodiversity. In Australia, where significant invasive species research has taken place, invasive forest vine species including C. grandiflorum and M. micrantha have been identified
as among the most ecologically destructive forest pests (Harris et al, 2007, Grice and Setter,
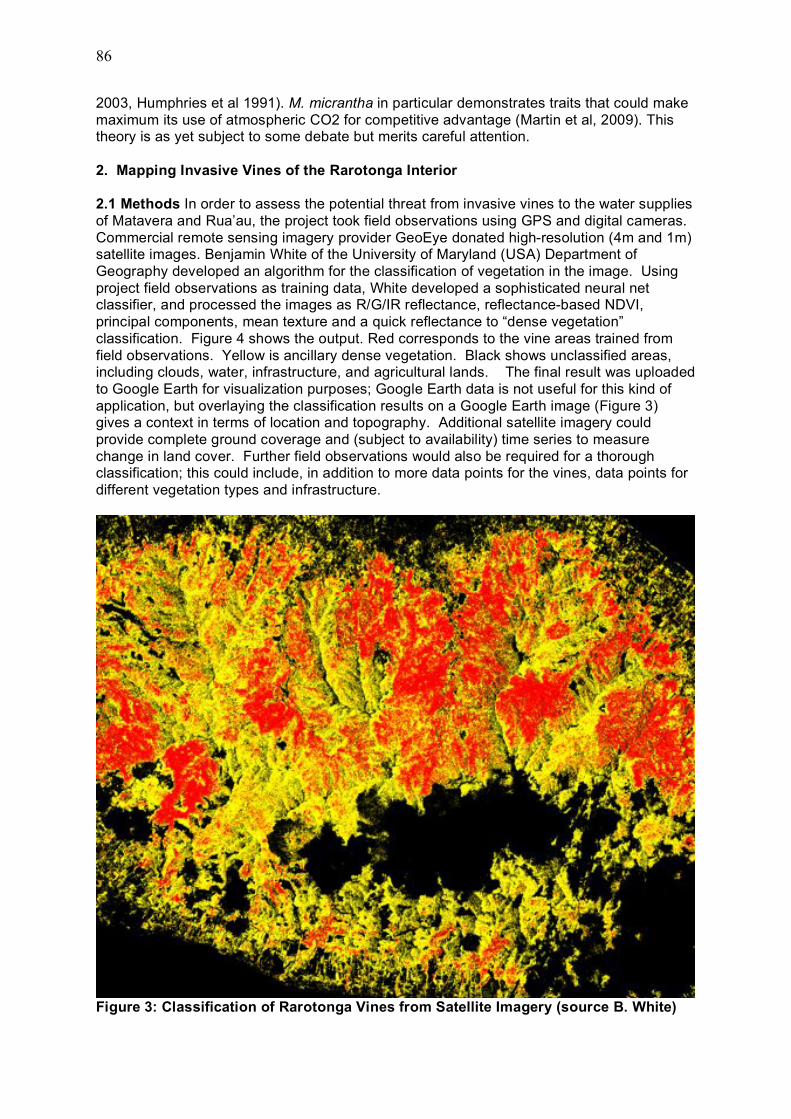
86
2003, Humphries et al 1991). M. micrantha in particular demonstrates traits that could make
maximum its use of atmospheric CO2 for competitive advantage (Martin et al, 2009). This theory is as yet subject to some debate but merits careful attention.
2. Mapping Invasive Vines of the Rarotonga Interior
2.1 Methods In order to assess the potential threat from invasive vines to the water supplies
of Matavera and Rua’au, the project took field observations using GPS and digital cameras.
Commercial remote sensing imagery provider GeoEye donated high-resolution (4m and 1m) satellite images. Benjamin White of the University of Maryland (USA) Department of
Geography developed an algorithm for the classification of vegetation in the image. Using
project field observations as training data, White developed a sophisticated neural net classifier, and processed the images as R/G/IR reflectance, reflectance-based NDVI,
principal components, mean texture and a quick reflectance to “dense vegetation”
classification. Figure 4 shows the output. Red corresponds to the vine areas trained from
field observations. Yellow is ancillary dense vegetation. Black shows unclassified areas, including clouds, water, infrastructure, and agricultural lands. The final result was uploaded
to Google Earth for visualization purposes; Google Earth data is not useful for this kind of
application, but overlaying the classification results on a Google Earth image (Figure 3) gives a context in terms of location and topography. Additional satellite imagery could
provide complete ground coverage and (subject to availability) time series to measure
change in land cover. Further field observations would also be required for a thorough classification; this could include, in addition to more data points for the vines, data points for
different vegetation types and infrastructure.
Figure 3: Classification of Rarotonga Vines from Satellite Imagery (source B. White)
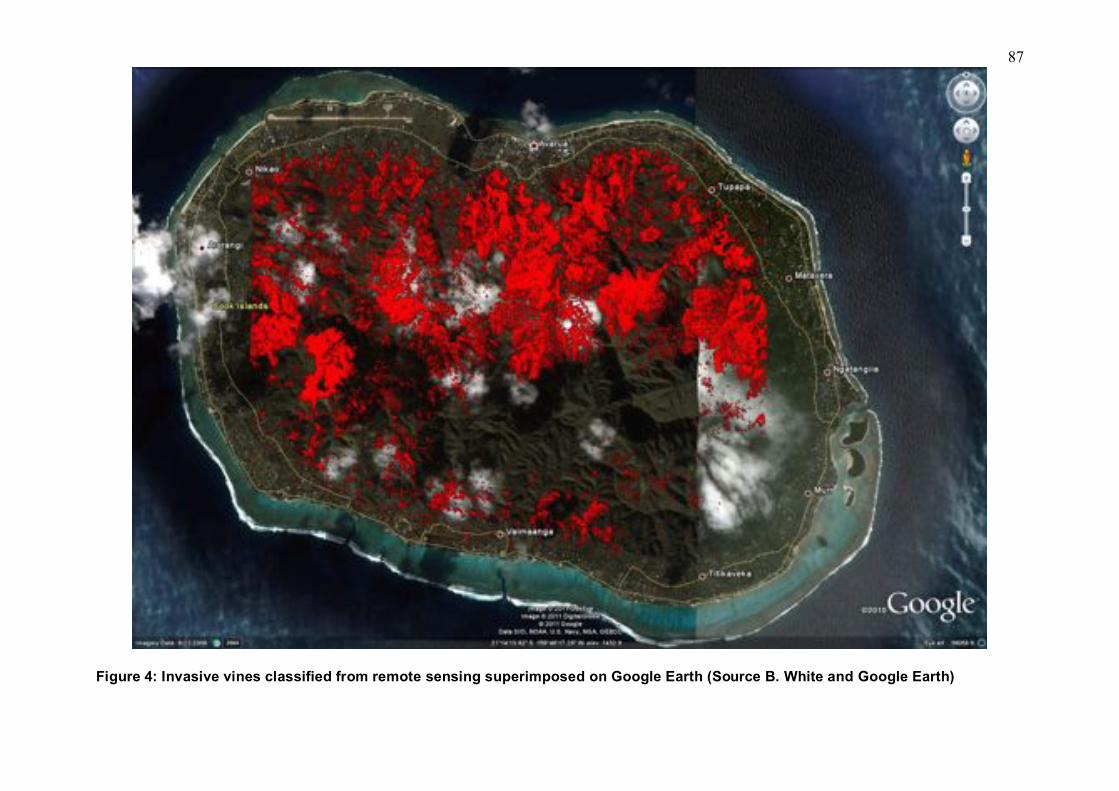
87
Figure 4: Invasive vines classified from remote sensing superimposed on Google Earth (Source B. White and Google Earth)
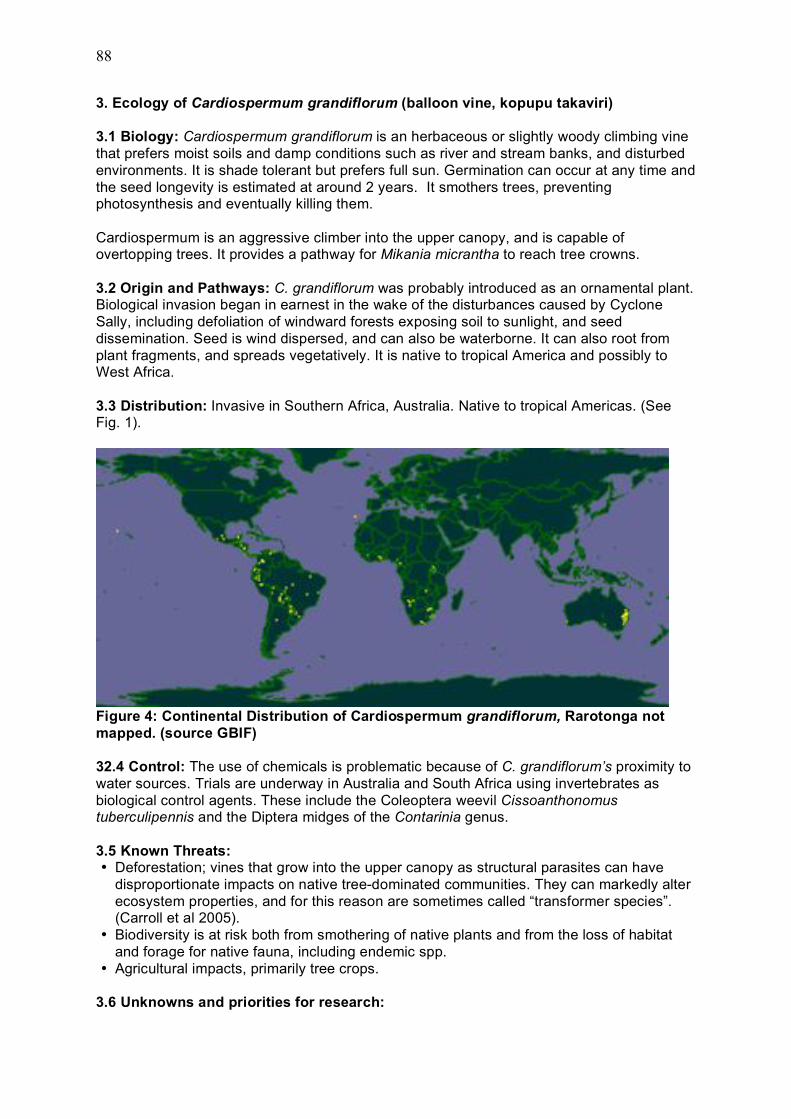
88
3. Ecology of Cardiospermum grandiflorum (balloon vine, kopupu takaviri)
3.1 Biology: Cardiospermum grandiflorum is an herbaceous or slightly woody climbing vine
that prefers moist soils and damp conditions such as river and stream banks, and disturbed
environments. It is shade tolerant but prefers full sun. Germination can occur at any time and
the seed longevity is estimated at around 2 years. It smothers trees, preventing photosynthesis and eventually killing them.
Cardiospermum is an aggressive climber into the upper canopy, and is capable of overtopping trees. It provides a pathway for Mikania micrantha to reach tree crowns.
3.2 Origin and Pathways: C. grandiflorum was probably introduced as an ornamental plant. Biological invasion began in earnest in the wake of the disturbances caused by Cyclone
Sally, including defoliation of windward forests exposing soil to sunlight, and seed
dissemination. Seed is wind dispersed, and can also be waterborne. It can also root from
plant fragments, and spreads vegetatively. It is native to tropical America and possibly to West Africa.
3.3 Distribution: Invasive in Southern Africa, Australia. Native to tropical Americas. (See Fig. 1).
Figure 4: Continental Distribution of Cardiospermum grandiflorum, Rarotonga not
mapped. (source GBIF)
32.4 Control: The use of chemicals is problematic because of C. grandiflorum’s proximity to
water sources. Trials are underway in Australia and South Africa using invertebrates as
biological control agents. These include the Coleoptera weevil Cissoanthonomus tuberculipennis and the Diptera midges of the Contarinia genus.
3.5 Known Threats: • Deforestation; vines that grow into the upper canopy as structural parasites can have
disproportionate impacts on native tree-dominated communities. They can markedly alter
ecosystem properties, and for this reason are sometimes called “transformer species”. (Carroll et al 2005).
• Biodiversity is at risk both from smothering of native plants and from the loss of habitat
and forage for native fauna, including endemic spp.
• Agricultural impacts, primarily tree crops.
3.6 Unknowns and priorities for research:
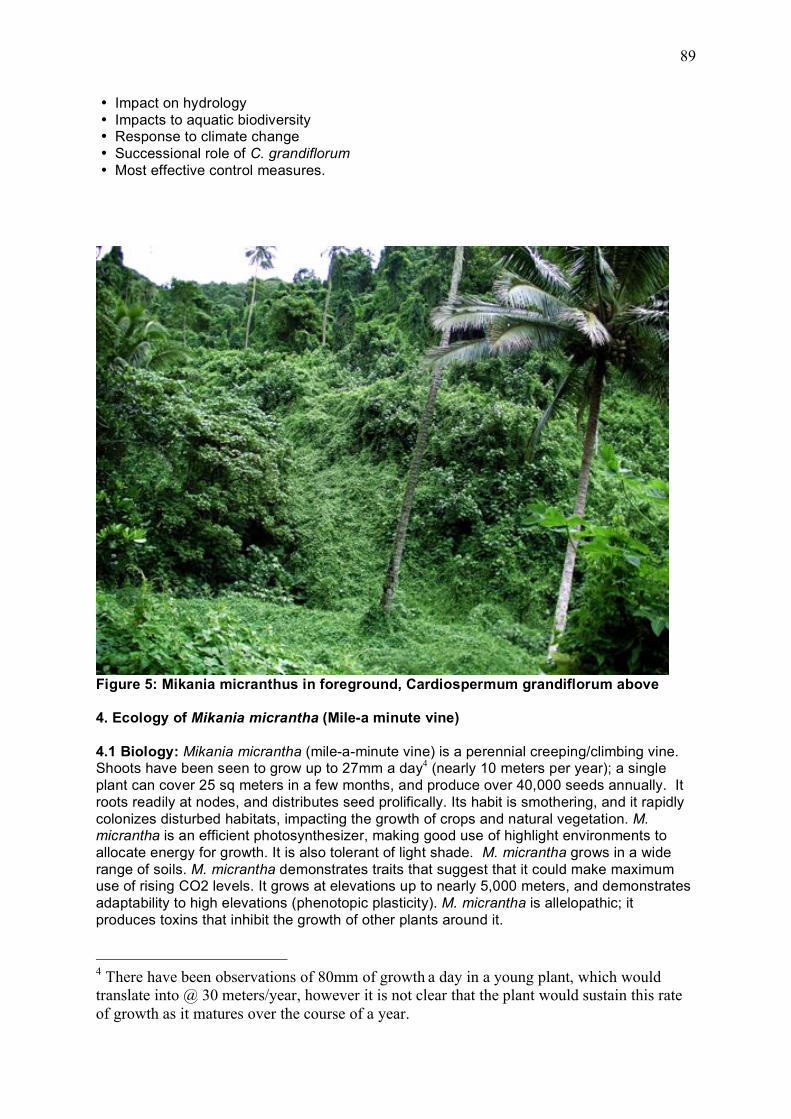
89
• Impact on hydrology
• Impacts to aquatic biodiversity • Response to climate change
• Successional role of C. grandiflorum
• Most effective control measures.
Figure 5: Mikania micranthus in foreground, Cardiospermum grandiflorum above
4. Ecology of Mikania micrantha (Mile-a minute vine)
4.1 Biology: Mikania micrantha (mile-a-minute vine) is a perennial creeping/climbing vine. Shoots have been seen to grow up to 27mm a day4 (nearly 10 meters per year); a single
plant can cover 25 sq meters in a few months, and produce over 40,000 seeds annually. It
roots readily at nodes, and distributes seed prolifically. Its habit is smothering, and it rapidly
colonizes disturbed habitats, impacting the growth of crops and natural vegetation. M. micrantha is an efficient photosynthesizer, making good use of highlight environments to
allocate energy for growth. It is also tolerant of light shade. M. micrantha grows in a wide
range of soils. M. micrantha demonstrates traits that suggest that it could make maximum use of rising CO2 levels. It grows at elevations up to nearly 5,000 meters, and demonstrates
adaptability to high elevations (phenotopic plasticity). M. micrantha is allelopathic; it
produces toxins that inhibit the growth of other plants around it.
4 There have been observations of 80mm of growth a day in a young plant, which would
translate into @ 30 meters/year, however it is not clear that the plant would sustain this rate
of growth as it matures over the course of a year.

90
4.2 Origin and Pathways: M. micrantha is native to Central and South America. It was
introduced to India as a fast-growing plant to camouflage airfields during the 2nd World War, and as ground cover for erosion control in Indonesia, Malaysia, and Sri Lanka. It is now
widespread. Its pathway to introduction in Rarotonga has not been definitively established;
according to Manarangi (2004) it was first noticed as an invasive plant on Rarotonga in the
1960s. It is a known seed-contaminant.
4.3 Distribution: Invasive throughout S, SE Asia, including China, and Oceania, including
Australia.
Figure 6: Continental Mikania micrantha distribution. Pacific island distribution, which
is widespread, is not visible in this map. (source U. Aarhus herbarium via GBIF)
4.4 Control: Control is difficult due to the high number of seeds it produces, and because it
can grow from small stem fragments. Chemical control is thought to be the only effective
control measure at the present; spraying must be conducted before the onset of flowering and seed setting. Work is underway on biocontrols including invertebrates and fungal
pathogens. Of the latter, the Trinidadian rust fungus Puccinia spegazzinii has shown
promise in trials in Kerala State, India. The fungus is host specific. It is intolerant of high temperature and low relative humidity and repeated applications may be necessary.
4.5 Known threats: • Loss of biodiversity, including plant biodiversity from direct competition, and fauna,
including endemic bird spp., from displacement of natural food sources and habitats
• Loss of productive land at lower elevations, including farmland and forest, with particular
impact on fruit and nut trees • Increased labor for farmers
• Deforestation
4.6 Unknowns:
• Impact on hydrology, including amount of water consumed by M. micrantha vs. native
forest and water retention characteristics of M. micrantha • Impacts on aquatic biodiversity
• Response to climate change
• Whether M. micrantha is a climax species that can maintain its structure indefinitely,
especially in light of eventual loss of structural support as dead trees decay and fall
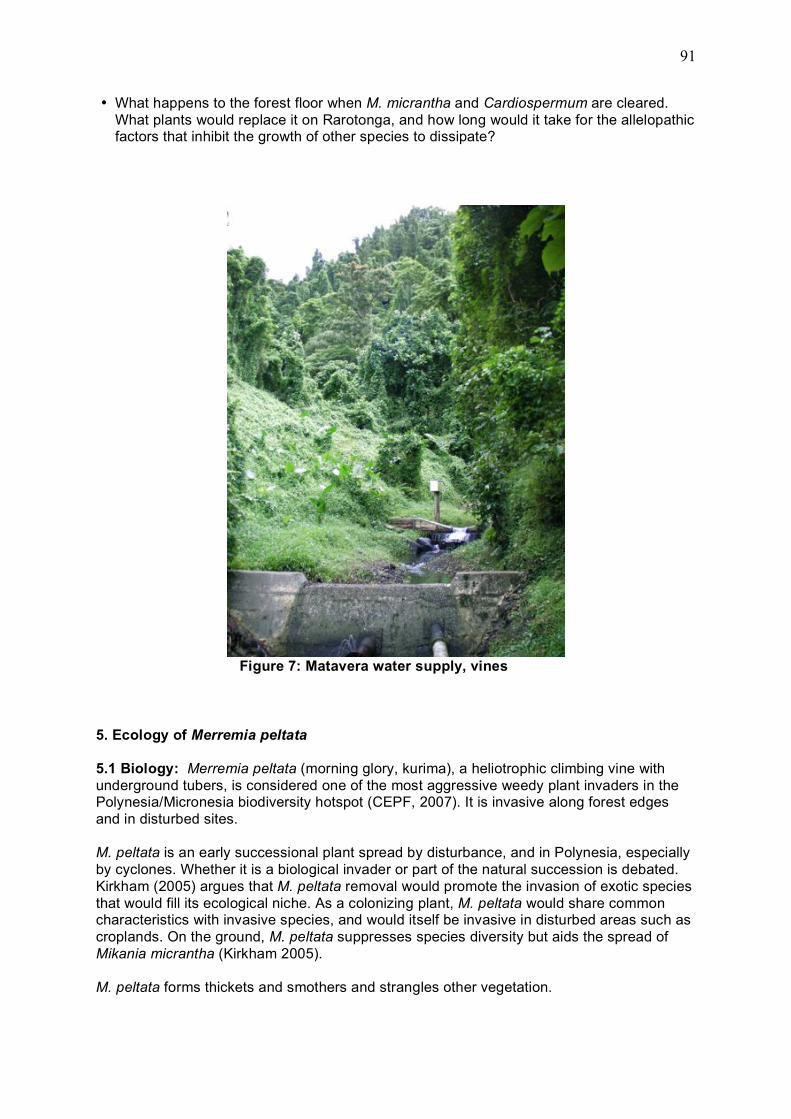
91
• What happens to the forest floor when M. micrantha and Cardiospermum are cleared.
What plants would replace it on Rarotonga, and how long would it take for the allelopathic factors that inhibit the growth of other species to dissipate?
Figure 7: Matavera water supply, vines
5. Ecology of Merremia peltata
5.1 Biology: Merremia peltata (morning glory, kurima), a heliotrophic climbing vine with
underground tubers, is considered one of the most aggressive weedy plant invaders in the Polynesia/Micronesia biodiversity hotspot (CEPF, 2007). It is invasive along forest edges
and in disturbed sites.
M. peltata is an early successional plant spread by disturbance, and in Polynesia, especially
by cyclones. Whether it is a biological invader or part of the natural succession is debated.
Kirkham (2005) argues that M. peltata removal would promote the invasion of exotic species
that would fill its ecological niche. As a colonizing plant, M. peltata would share common characteristics with invasive species, and would itself be invasive in disturbed areas such as
croplands. On the ground, M. peltata suppresses species diversity but aids the spread of
Mikania micrantha (Kirkham 2005).
M. peltata forms thickets and smothers and strangles other vegetation.
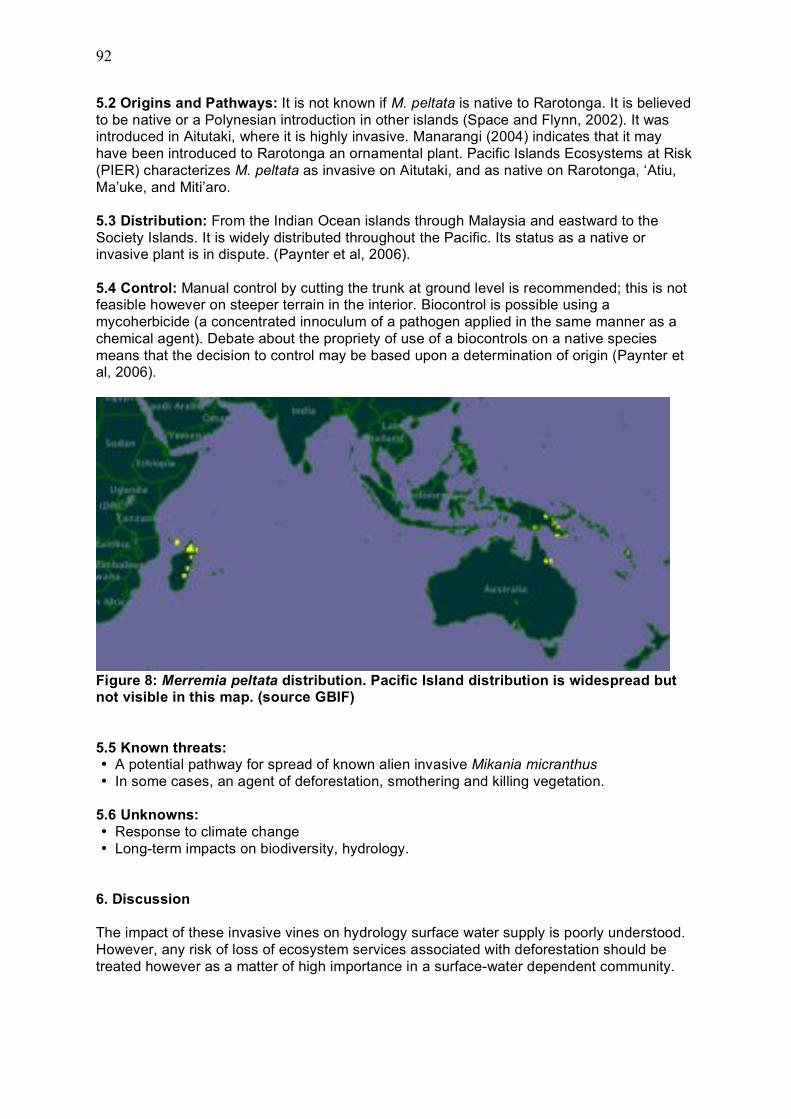
92
5.2 Origins and Pathways: It is not known if M. peltata is native to Rarotonga. It is believed
to be native or a Polynesian introduction in other islands (Space and Flynn, 2002). It was introduced in Aitutaki, where it is highly invasive. Manarangi (2004) indicates that it may
have been introduced to Rarotonga an ornamental plant. Pacific Islands Ecosystems at Risk
(PIER) characterizes M. peltata as invasive on Aitutaki, and as native on Rarotonga, ‘Atiu,
Ma’uke, and Miti’aro.
5.3 Distribution: From the Indian Ocean islands through Malaysia and eastward to the
Society Islands. It is widely distributed throughout the Pacific. Its status as a native or invasive plant is in dispute. (Paynter et al, 2006).
5.4 Control: Manual control by cutting the trunk at ground level is recommended; this is not feasible however on steeper terrain in the interior. Biocontrol is possible using a
mycoherbicide (a concentrated innoculum of a pathogen applied in the same manner as a
chemical agent). Debate about the propriety of use of a biocontrols on a native species
means that the decision to control may be based upon a determination of origin (Paynter et al, 2006).
Figure 8: Merremia peltata distribution. Pacific Island distribution is widespread but not visible in this map. (source GBIF)
5.5 Known threats: • A potential pathway for spread of known alien invasive Mikania micranthus
• In some cases, an agent of deforestation, smothering and killing vegetation.
5.6 Unknowns:
• Response to climate change
• Long-term impacts on biodiversity, hydrology.
6. Discussion
The impact of these invasive vines on hydrology surface water supply is poorly understood.
However, any risk of loss of ecosystem services associated with deforestation should be
treated however as a matter of high importance in a surface-water dependent community.
93
While knowledgeable about the invasive vines, the majority of Cook Islanders are not aware
of the full extent of the potential risks they pose. Available evidence, while not conclusive, suggests that the invasive vines may have devastating impact on the native vegetation and
natural watershed systems on Rarotonga and other islands, and consequently on the
economy and quality of life of the islands.
Several factors militate in favor of urgent action. The first is the risk associated with
deforestation, disruption of surface water supply, and sedimentation in the coastal zone
impacting coral reefs. The second is the inevitable time lags in identifying and implementing an appropriate treatment to control the vines. Biocontrols show promise but must be tested
and evaluated to ensure safe application. The third is the potential for climate change to
amplify the effects of invasive vines. The fourth is the lack of alternatives to environmental degradation resulting from biological invasion in the small island developing state context.
The biological invasion does present some opportunities as well. Notably, their prolific
growth patterns provide an abundant source of biomass, which potentially could become an interim energy source in a transition away from petroleum, either as cellulosic methanol or
as biochar with a syngas byproduct. The steep terrain of Rarotonga will restrict access, and
it is not yet established that sufficient biomass is available within the accessible reaches of the interior range. Care must also be taken that energy dependency does not become a
disincentive to effective control of the invasive plants.
7. Recommendations
Mikania micranthus, Merremia peltata and Cardiospermum grandiflorum should be
considered en suite as a potential risk to be included in a management strategy for invasive vine species.
In order to effectively respond to the challenge, the Cook Islands should be provided with
technical and financial assistance to:
a) Map the extent of the infestation through a combination of community-based mapping and
remote sensing technologies, and if possible determine the rate of spread from earlier
maps.
b) Research the impacts of the invasive plants on the biodiversity, the hydrology and surface water supply of the islands and the ecology of the coastal zone, and the relationship
between the invasive plants and climate change as a matter of priority
c) On the basis of a) and b) conduct a risk assessment
d) On the basis of the risk assessment, develop a control strategy. It is recommended that
such a control strategy mobilize communities to the full extent possible.
At the same time;
e) Undertake a feasibility study for the use of the invasive plant biomass for energy and/or
biochar as part of an integrated development strategy. If the use of the biomass for fuel
production is shown to be feasible, undertake an assessment of the carbon footprint of
biomass fuels in comparison with that of current fossil fuel use and other energy alternatives. If feasible, and consistent with the control strategy discussed in d) above, a
proposal could be made to government for a pilot fuel production project.
94
7. References and resources
Asia-Pacific Forest Invasive Species Network (2007). Mile-a-minute weed (Mikania
micrantha). In INVASIVES newsletter of the APFISN. Vol 8, 2007.
ADB (2005) Climate Proofing—A Risk-Based Approach to Adaptation. Pacific Study Series,
Asian Development Bank, Manila. 191 pp
Bradley, B., Blumenthal, D., Wilcove, D., and Ziska, L. (2009). Predicting Plant Invasions in
an Era of Global Change. Trends in Ecology and Evolution Vol XXX No. X
Carroll SP, Mathieson M, Loye JE (2005) Invasion history and ecology of the environmental weed balloon vine, Cardiospermum grandiflorum Swartz, in Australia. Plant Protection
Quarterly 20, 140-4
Critical Ecosystem Partnership Fund (CEPF) (2007) Ecosystem Profile: Polynesia-Micronesia Biodiversity Hotspot. Conservation International, Washington.
Deng, X., Ye, W., Feng, H., Yang, Q., Cao, H., Xu, K., and Zheng, Y. (2004). Gas exchange
characteristics of the invasive species Mikania micrantha and its indigenous congener
Mikania cordata (Asteracea) in South China. Bot. Bull. Acad. Sin. (2004) 45:213-220.
Fernando Mc Kay, Marina Oleiro, Andries Fourie and David Simelane, (2010). Natural
enemies of balloon vine Cardiospermum grandiflorum (Sapindaceae) in Argentina and their
potential use as biological control agents in South Africa. International Journal of Tropical Insect Science (2010), 30:67-76
Grice, A.C. and Setter, M.J. (2003) Weeds of Rainforests and Associated Ecosystems.
Cooperative Research Centre for Tropical Rainforest Ecology and Management. Rainforest CRC, Cairns. (116 pp)
Harris, Jarla J., Murray, Brad R, Hose, Grant C., and Hamilton, Mark A. (2007). Introduction
history and invasion success in exotic vines introduced to Australia. Diversity and
Distributions, 13: 467-475.
Humphries, S.E., Groves, R.H. & Mitchell, D.S. (1991) Plant invasions of Australian
ecosystems: a status review and management directions. Kowari 2. Plant invasions: the
incidence of environmental weeds in Australia (ed. by R. Longmore). Australian National Parks and Wildlife Service, Canberra, Australian Capital Territory.
Kirkham, William S. (2005). Valuing Invasives: Understanding the Merremia peltata invasion
in post-colonial Samoa. PhD dissertation, University of Texas. Accessed online August 25,
2010 at https://repositories.lib.utexas.edu/handle/2152/1595
Manarangi, Anau (2004) A Survey And Reducing the Impact of Invasive Alien Species on
Rarotonga, Aitutaki, Mauke, Atiu And Mitiaro. Cook Islands National Environmental Service,
Avrua, 2004.
Martin, Patrick H., Canham, Charles D., and Marks Peter L. (2009). Why forests appear
resistant to exotic plant invasions: intentional introductions, stand dynamics, and the role of
shade tolerance. Front Ecol Environ 2009, 7(3): 142-149
Meyer, J.-Y. 2000. Preliminary review of the invasive plants in the Pacific islands (SPREP
member countries). In Invasive Species in the Pacific: A Technical Review and Draft
Regional Strategy. Sherley, G. (Ed.). SPREP, Apia.
95
Pacific Island Ecosystems at Risk assessment, accessed on-line at
http://www.hear.org/pier/wra/pacific/cardiospermum_grandiflorum_htmlwra.htm
Paynter, Quentin, Harman, Helen, and Waipara, Nick. (2006). Prospects for biological
control of Merremia peltata. Landcare Research, Auckland.
Song, L., Wu, J., Li., C., Peng, S., and Chen, B. (2009). Different responses of invasive and
native species to elevated CO2 concentration. Acta Oecologica 35: 128-135.
Space, James C. and Flynn, Tim (2002). Report to the Government of the Cook Islands on
Plant Species of Environmental Concern. USDA Forest Service, Pacific Southwest
Research Station, Institute of Pacific Islands Forestry, Honolulu, Hawai’i
SPREP (2000). Invasive species in the Pacific: a technical review and draft regional
strategy. Ed. G. Sherley. South Pacific Regional Environment Programme, Apia.
Weaver, Richard (2009). The Mile-a-Minute (Mikania micrantha). Unpublished report to the Florida (USA) Department of Agriculture and Consumer Services. Accessed on-line at
http://www.doacs.state.fl.us/pi/enpp/botany/images/weaver-mikania-micrantha-report-
121109.pdf
Ziska LH, Goins EW (2006) Elevated atmospheric carbon dioxide and weed populations in glyphosphate treated soybean. Crop Sci 46:1354–1359
Ziska, L. and George, K (2004). Rising Carbon Dioxide and Invasive, Noxious Plants.
Potential Threats and Consequences. World Resources Review, Vol. 16, No. 4
Related Documents