CONVEYING CONVERSATIONAL CUES THROUGH VIDEO A DISSERTATION SUBMITTED TO THE DEPARTMENT OF ELECTRICAL ENGINEERING AND THE COMMITTEE ON GRADUATE STUDIES OF STANFORD UNIVERSITY IN PARTIAL FULFILLMENT OF THE REQUIREMENTS FOR THE DEGREE OF DOCTOR OF PHILOSOPHY Milton Chen June 2003

Welcome message from author
This document is posted to help you gain knowledge. Please leave a comment to let me know what you think about it! Share it to your friends and learn new things together.
Transcript

CONVEYING CONVERSATIONAL CUES THROUGH VIDEO
A DISSERTATION
SUBMITTED TO THE DEPARTMENT OF ELECTRICAL ENGINEERING
AND THE COMMITTEE ON GRADUATE STUDIES
OF STANFORD UNIVERSITY
IN PARTIAL FULFILLMENT OF THE REQUIREMENTS
FOR THE DEGREE OF
DOCTOR OF PHILOSOPHY
Milton Chen
June 2003

ii
© Copyright by Milton Chen 2003
All Rights Reserved

iii
I certify that I have read this dissertation and that, in my opinion, it is fully adequate in scope and quality as a dissertation for the degree of Doctor of Philosophy.
__________________________________
Patrick Hanrahan, Co-Principal Advisor
I certify that I have read this dissertation and that, in my opinion, it is fully adequate in scope and quality as a dissertation for the degree of Doctor of Philosophy.
__________________________________
Terry Winograd, Co-Principal Advisor
I certify that I have read this dissertation and that, in my opinion, it is fully adequate in scope and quality as a dissertation for the degree of Doctor of Philosophy.
__________________________________
Anoop Gupta
I certify that I have read this dissertation and that, in my opinion, it is fully adequate in scope and quality as a dissertation for the degree of Doctor of Philosophy.
__________________________________
Tom Moran
Approved for the University Committee on Graduate Studies.

iv
Abstract
Visual conversational cues such as hand gestures, lip movements, and eye contact can be
conveyed through a video medium. However, existing videoconferencing systems often
subtly distort these conversational cues such that the person, rather than the medium, is
viewed with negative attributes. For example, a delayed response due to video
transmission may cause the person to be viewed as slow. Lip movements not
synchronized with speech due to video compression may cause the person to be viewed
as less credible. And difficulties with eye contact due to camera placement may cause
the person to be viewed as unfriendly.
In this dissertation, we describe empirical findings and novel algorithms for conveying
floor control hand gestures, lip movements, and eye contact over the video medium. We
describe (1) a variable frame rate streaming algorithm based on our finding that the
average video frame rate can be reduced to one frame every few seconds and still allow
effective floor control if hand movements are transmitted without delay; (2) a low latency
lip synchronization algorithm based on our finding that audio can temporarily lead video
and still be perceived as synchronized if the audio and video are brought into synchrony
within a short period; and (3) an eye contact algorithm based on our finding that the
sensitivity to eye contact is asymmetric, in that we are less sensitive to eye contact when
people look below our eyes than when they look to the left, right, or above our eyes.
We implemented our algorithms in a scalable software-based visual communication
system called the Video Auditorium. The implementation of Video Auditorium is
motivated by our 6-month classroom observational study of Stanford Online that found
when the instructor couldn’t see the remote students, there was essentially no interaction
with them. We used Video Auditorium to visually connect students in Germany,
Sweden, Slovenia, and Berkeley with Stanford in a 4-month pilot class, and found that
the instructor was able to effectively interact with the remote students.
v
Acknowledgements
In general, I don’t consider myself a lucky guy. But at a few critical junctions of my life,
I have been extremely lucky. When I first arrived at Stanford, I had the fortune of
becoming Pat Hanrahan’s student. Pat taught me how to do research, write papers, and
present results; he set a gold standard for quality that I have and will continue to struggle
to meet. When it became clear to me that human factors, in addition to streaming
technology, is a major barrier to videoconferencing, I had the fortune of joining Terry
Winograd’s group. Terry opened my eyes to a new way of thinking about technology
and I plan to continue conducting research on this vector after Stanford. I am also
indebted to Tom Moran, Anoop Gupta, and Cliff Nass for their insightful comments that
significantly improved this dissertation.
This research would not have been possible without the financial support of a
Department of Defense Graduate Fellowship and the Immersive Television grant from
Intel, Sony, and Interval Research.
I also had the good fortune to learn from many talented fellow students; from the Flash
Graphics Group: Ian Buck, Ziyad Hakura, Greg Humphreys, Homan Igehy, Kekoa
Proudfoot, Tim Purcell, and Gordon Stoll; from the Immersive Television Group: Cindy
Chen, Erika Chuang, James Davis, Bill Mark, Li-Yi Wei, Bennett Wilburn, and Danny
Yang; and from the Interactive Workspaces Group: Tico Ballagas, Karen Grant, Francois
Guimbretiere, Pedram Keyani, Brad Johanson, Wendy Ju, Brian Lee, Heidy Maldonado,
Shankar Ponnekanti, Merrie Ringel, Caesar Sengupta, Richard Salvador, Susan Shepard,
and Ron Yeh.
As I contemplate my leave from Stanford, I know I will miss the wonderful support
staff of Ada Glucksman, Heather Gentner, John Gerth, and Charlie Orgish. In addition,
Dan Nelson, Brian Luehrs, and Bob Smith of Center for Innovations in Learning
generously provided the lab space and equipment for the eye contact study. Evelin
Sullivan, my long time writing tutor, performed miracles at improving my writing skills.
vi
My officemates Matthew Eldridge, John Owens, Niloy Mitra, and David Ackers made
room 396 a fun place to work. I am also indebted to Mike Cammarano, Cindy Chang,
King Chen, Albert Huntington, Andrew Kan, Niny Khor, Lily Kuo, Lisa Kwan, Yung-
Hsiang Lu, Christina Pan, Pradeep Sen, Xin Tong, Charles Wang, Linda Wang, Claire
Wu, and Wendy Yu for assisting my experiments and proofreading my papers.
I would also like to thank Jingli Wang who has been so patient and supportive with
my many non-academic pursuits such as living in a car and starting a dating service, and
my brother Marc, his wife Helen, and their son Matthew for their love, encouragements,
and many delicious meals.
Lastly, I would like to thank my parents Robert and Cynthia Chen, whose love has
been a constant source of strength for me. This thesis is dedicated to them.

vii
Contents
Abstract iv Acknowledgements vi 1 Introduction 1 2 Beneficial and Harmful Effects of Video 4 2.1 A Case Study: Distance Learning without Seeing the Students . . . . . . . 4
2.1.1 Stanford Online Survey . . . . . . . . . . . . . . . . . . . . . . . . . . . . . . . 4
2.1.2 Stanford Online Observation . . . . . . . . . . . . . . . . . . . . . . . . . . 6
2.2 Beneficial Effect of Video . . . . . . . . . . . . . . . . . . . . . . . . . . . . . . . . . . . . 7
2.2.1 Support Interactivity when Group is Large . . . . . . . . . . . . . . . . . 7
2.2.2 Support Complex Collaboration . . . . . . . . . . . . . . . . . . . . . . . . . . 8
2.2.3 Build Personal Relationship . . . . . . . . . . . . . . . . . . . . . . . . . . . . . 9
2.3 Harmful Effect of Video . . . . . . . . . . . . . . . . . . . . . . . . . . . . . . . . . . . . 9
2.3.1 Degrade Audio Quality . . . . . . . . . . . . . . . . . . . . . . . . . . . . . . . 10
2.3.2 Unintentional Communication . . . . . . . . . . . . . . . . . . . . . . . . 10
3 Floor Control 12 3.1 Related Work . . . . . . . . . . . . . . . . . . . . . . . . . . . . . . . . . . . . . . . . . . . . 13
3.1.1 Low-bandwidth Video Compression . . . . . . . . . . . . . . . . . . . . 13
3.1.2 Minimum Required Frame Rate . . . . . . . . . . . . . . . . . . . . . . . 14
3.2 Design of Gesture-Sensitive Streaming . . . . . . . . . . . . . . . . . . . . . . . 15
3.2.1 Gesture Detection Algorithm . . . . . . . . . . . . . . . . . . . . . . . . . . 16
3.2.2 Effect of Frame Rate on Bandwidth . . . . . . . . . . . . . . . . . . . 19
3.3 User Study of the Impact of Frame Rate . . . . . . . . . . . . . . . . . . . . . . . 20

viii
3.3.1 Methodology . . . . . . . . . . . . . . . . . . . . . . . . . . . . . . . . . . . . . . 20
3.3.2 Results . . . . . . . . . . . . . . . . . . . . . . . . . . . . . . . . . . . . . . . . . . . 21
3.4 Discussion . . . . . . . . . . . . . . . . . . . . . . . . . . . . . . . . . . . . . . . . . . . . . 24
3.5 Conclusion . . . . . . . . . . . . . . . . . . . . . . . . . . . . . . . . . . . . . . . . . . . . . . . 25
4 Lip Synchronization 27 4.1 Lip Synchronization Algorithm . . . . . . . . . . . . . . . . . . . . . . . . . . . . . . 28
4.1.1 Algorithm Overview . . . . . . . . . . . . . . . . . . . . . . . . . . . . . . 28
4.1.2 Implementation Description . . . . . . . . . . . . . . . . . . . . . . . . . 31
4.2 Perception of Lip Synchronization . . . . . . . . . . . . . . . . . . . . . . . . . . . . 32
4.2.1 Detectable AV Skew . . . . . . . . . . . . . . . . . . . . . . . . . . . . . . . . . 32
4.2.2 McGurk Effect under Asynchrony . . . . . . . . . . . . . . . . . . . . . 33
4.2.3 Impact on Speech Understanding . . . . . . . . . . . . . . . . . . . . . . . 34
4.2.4 Summary of Previous Findings . . . . . . . . . . . . . . . . . . . . . . . 35
4.3 Methodology . . . . . . . . . . . . . . . . . . . . . . . . . . . . . . . . . . . . . . . . . . . . . 35
4.3.1 Experiment 1: Perception of Constant Skew . . . . . . . . . . . . . . 36
4.3.2 Experiment 2: Perception of Variable Skew . . . . . . . . . . . . . . 37
4.3.3 Experiment 3: System Evaluation . . . . . . . . . . . . . . . . . . . . . 37
4.4 Results . . . . . . . . . . . . . . . . . . . . . . . . . . . . . . . . . . . . . . . . . . . . . . . . . . 38
4.5 Conclusion . . . . . . . . . . . . . . . . . . . . . . . . . . . . . . . . . . . . . . . . . . . . . . . 40
5 Eye Contact 42 5.1 Previous Work . . . . . . . . . . . . . . . . . . . . . . . . . . . . . . . . . . . . . . . . . . 43
5.1.1 Perceiving Eye Contact . . . . . . . . . . . . . . . . . . . . . . . . . . . . . . 44
5.1.2 Perceiving Eye Contact in a Videoconference . . . . . . . . . . . 45
5.2 Methodology . . . . . . . . . . . . . . . . . . . . . . . . . . . . . . . . . . . . . . . . . . . . . 47
5.2.1 Gaze Recording and Measuring Studio . . . . . . . . . . . . . . . . . . 47
5.2.2 Experiment 1: Sensitivity to Gaze Direction . . . . . . . . . . . . . 48
5.2.3 Experiment 2: Sensitivity to Eye Appearance . . . . . . . . . . . . . 49
5.2.4 Experiment 3: Error Due to Recording . . . . . . . . . . . . . . . 49
5.2.5 Experiment 4: Influence of Video Quality . . . . . . . . . . . . . . . 50
5.3 Results . . . . . . . . . . . . . . . . . . . . . . . . . . . . . . . . . . . . . . . . . . . . . . . . . 50
5.4 The Nature of Eye Contact . . . . . . . . . . . . . . . . . . . . . . . . . . . . . . . . . . 54

ix
5.4.1 The Snap to Contact Theory . . . . . . . . . . . . . . . . . . . . . . . . . . . 55
5.5 Requirement for Eye Contact . . . . . . . . . . . . . . . . . . . . . . . . . . . . . . . . 57
6 Design of a Video Auditorium 59 6.1 Previous Work . . . . . . . . . . . . . . . . . . . . . . . . . . . . . . . . . . . . . . . . . . 60
6.2 Auditorium Environment . . . . . . . . . . . . . . . . . . . . . . . . . . . . . . . . . . . 62
6.2.1 Display Wall . . . . . . . . . . . . . . . . . . . . . . . . . . . . . . . . . . . . . . 62
6.2.2 Eye Contact with Directed Gaze . . . . . . . . . . . . . . . . . . . . . . . 65
6.2.3 Student Interface . . . . . . . . . . . . . . . . . . . . . . . . . . . . . . . . . . . 67
6.3 Software Implementation . . . . . . . . . . . . . . . . . . . . . . . . . . . . . . . . . . . 67
6.3.1 Modular AV Streaming . . . . . . . . . . . . . . . . . . . . . . . . . . . . . . 68
6.3.2 Audio Streaming . . . . . . . . . . . . . . . . . . . . . . . . . . . . . . . . . . . 69
6.3.3 Video Streaming . . . . . . . . . . . . . . . . . . . . . . . . . . . . . . . . . . . 70
6.3.4 Conference Session Startup . . . . . . . . . . . . . . . . . . . . . . . . . . 71
6.3.5 Hiding Machine Boundaries . . . . . . . . . . . . . . . . . . . . . . . . . . 72 6.4 Pilot Class Evaluation . . . . . . . . . . . . . . . . . . . . . . . . . . . . . . . . . . . . . . 73
6.5 Future improvements . . . . . . . . . . . . . . . . . . . . . . . . . . . . . . . . . . . . . . 74
7 Conclusions 76 Bibliography 80

x
List of Figures
Figure 2.1 Survey of attitude toward distance learning. . . . . . . . . . . . . . . . . . . . . 5
Figure 2.2 Survey of the importance of face-to-face interaction. . . . . . . . . . . . . . 6
Figure 2.3 Survey of the perceived learning outcome. . . . . . . . . . . . . . . . . . . . . 6
Figure 3.1 Screen shot of our multiparty videoconferencing user interface. . . . . . . 16
Figure 3.2 Illustration of gesture-detection algorithm. . . . . . . . . . . . . . . . . . . . . 18
Figure 3.3 Measured bandwidth of gesture-sensitive streaming. . . . . . . . . . . . . . . . 19
Figure 3.4 Observed number of speaker change during a discussion. . . . . . . . . . . 22
Figure 3.5 Survey of attitude toward gesture-sensitive streaming. . . . . . . . . . . . . 22
Figure 4.1 Illustration of lip synchronization latency . . . . . . . . . . . . . . . . . . . . . . 30
Figure 4.2 Summary of previous lip synchronization findings . . . . . . . . . . . . . . . 36
Figure 4.3 Perception of constant audio-video skew . . . . . . . . . . . . . . . . . . . . . . 38
Figure 4.4 Perception of variable audio-video skew . . . . . . . . . . . . . . . . . . . . . 39
Figure 4.5 Survey of attitudes toward differential lip synchronization . . . . . . . . 40
Figure 5.1 Picture of gaze recording studio. . . . . . . . . . . . . . . . . . . . . . . . . . . . . . 48
Figure 5.2 Effect of gaze direction on eye contact. . . . . . . . . . . . . . . . . . . . . . . 51
Figure 5.3 Effect of eye appearance on eye contact. . . . . . . . . . . . . . . . . . . . . . . 52
Figure 5.4 Effect of conversation on eye contact. . . . . . . . . . . . . . . . . . . . . . . . . 53
Figure 5.5 Effect of video on eye contact. . . . . . . . . . . . . . . . . . . . . . . . . . . . . . 54
Figure 5.6 Illustration of Snap to Contact theory of eye contact. . . . . . . . . . . . . 56
Figure 5.7 Desktop prototype for achieving eye contact. . . . . . . . . . . . . . . . . . . . 58
Figure 6.1 The Video Auditorium display wall. . . . . . . . . . . . . . . . . . . . . . . . . . . 63
Figure 6.2 The Video Auditorium control panel. . . . . . . . . . . . . . . . . . . . . . . . . . . 63
Figure 6.3 A top view diagram of the Video Auditorium. . . . . . . . . . . . . . . . . . . . 64

xi
Figure 6.4 Screen shot of the Video Auditorium student interface. . . . . . . . . . . . . 64
Figure 6.5 Illustration of Directed Gaze. . . . . . . . . . . . . . . . . . . . . . . . . . . . . . . . 66
Figure 6.6 The vLink DirectShow filter graphs. . . . . . . . . . . . . . . . . . . . . . . . . . . 69
Figure 6.7 Measured processor utilization for video processing. . . . . . . . . . . 71
Figure 6.8. The pilot class web page for launching the Video Auditorium. . . . . . 74

1
“We express ourselves into existence.”
- Iris Murdoch Chapter 1 Introduction
With extensive practice and perhaps an inborn instinct, we are skilled at expressing
ourselves. Devices such as the telephone and the videophone extend our expressive skills
to reach people beyond our physical vicinity. Visual conversational cues such as hand
gestures, lip movements, and eye contact can be conveyed through the video medium.
However, existing video communication systems often subtly distort these conversational
cues such that the person, rather than the medium, is viewed with negative attributes. For
example, a delayed response due to transmission may cause the person to be viewed as
slow [Brady, 1971; Kitawaki et al., 1991]. Lip movements not synchronized with speech
due to video compression may cause the person to be viewed as less credible [Reeves and
Nass, 1996]. And difficulties with eye contact due to camera placement may cause the
person to be viewed as unfriendly [Argyle and Cook, 1976]. The negative portrayal of
the remote person through video sometimes creates instant dislike toward the remote
person and the sensation of talking to a “mentally defective foreigner” [Egido, 1988].
The goals of this research are 1) to advance our understanding of conversations by
measuring people’s conversation behavior and sensitivity to conversational cues, and 2)
to leverage our experimental findings to build a video communication system that can
better convey visual conversational cues. Although we are motivated by the immediate
goal of improving video communication, we believe our experimental findings can
eventually aid the design of communication devices that can be more useful than the
mere reproduction of a face-to-face communication experience.

2
In this dissertation, we describe empirical findings of three conversational cues
commonly distorted over the video medium: hand gestures for signaling floor control, lip
movements that accompany speech, and gaze direction associated with eye contact.
Based on our findings, we describe methods to convey these conversational cues. Then,
we describe the implementation of these methods in a video communication software
system. Besides being an algorithm test bed, our implementation is also motivated by a
classroom observational study of Stanford Online. Lastly, we describe the evaluation of
our system in a Stanford pilot class. The contributions of this dissertation are:
1. The finding that the average video frame rate can be reduced to one frame every
few seconds and still allow effective floor control if hand movements are
transmitted immediately; and a variable frame rate streaming method that
leverages this finding [Chen 2002b].
2. The finding that audio can temporarily lead video and still be perceived as
synchronized if the audio and video are brought into synchrony within a short
period; and a low latency synchronization method that leverages this finding
[Chen 2003].
3. The finding that the sensitivity to eye contact is asymmetric, in that we are less
sensitive to eye contact when people look below our eyes than when they look to
the left, right, or above our eyes; and an eye contact method that leverages this
finding [Chen 2002a].
4. The finding that when the instructor cannot see the remote students in a Stanford-
Online classroom, there is little classroom interaction with the remote students;
and the design of a video communication system for distance learning called the
Video Auditorium [Chen 2001].
5. The finding that when the instructor can see the remote students using our Video
Auditorium in a pilot class, the instructor was able to effectively interact with the
remote students.
This dissertation is organized as follows. We describe the beneficial and harmful
effects of communicating using video as compared to using only audio in Chapter 2.

3
Chapter 2 also presents a case study of Stanford Online on the effect of not seeing the
remote students. We describe the floor control, lip synchronization, and eye contact
findings, in Chapter 3, Chapter 4, and Chapter 5, respectively. We describe the design
and implementation of our video communication software in Chapter 6. Chapter 6 also
presents a pilot class evaluation. We conclude the dissertation in Chapter 7.

4
“The heart is stirred more slowly by the ear than by the eye.”
– Horace Chapter 2 Beneficial and Harmful Effects of Communicating through Video
Our research is motivated by the assumption that the availability of a video
communication medium in addition to an audio medium is crucial for certain types of
tasks. In this chapter, we review evidence that suggests this assumption. We will first
present a case study of the consequence of not able to see the students in a distance-
learning classroom. Next, we will describe the general characteristics of a video medium
that makes it essential for certain types of communication. Lastly we will describe
characteristics of a video medium that can make it worse than an audio-only
communication medium.
2.1 A Case Study: Distance Learning without Seeing the Students
The most popular approach to synchronous distance learning today is to broadcast the
instructor and the visual aids through a television network or the Internet [Rowe, 2000].
To promote classroom interaction, students can talk to the instructor through a telephone
or an Internet phone, but the instructor cannot see the remote students. This approach has
been used to educate thousands of remote students at Stanford University since 1969
[SCPD].
2.1.1 Stanford Online Survey
The School of Engineering at Stanford University conducted a one-year study to better
understand the quality of this form of distance learning. I was a member of the study

5
team. We surveyed 41 faculty members, 14 teaching assistants, and 126 on-campus
students who also took distance learning courses.
Figure 2.1 shows the responses to the question “What is your attitude toward teaching
or learning using Stanford’s distance learning system.” Note that students
overwhelmingly enjoy distance learning; however, significantly fewer faculty members
enjoy distance learning. One of the reasons the faculty members cited for their dislike of
distance learning is the drop in classroom attendance. To better understand this concern,
we counted the number of students present in the classroom of 42 courses over a one-
week period. The count was conducted 20 minutes after the beginning of the class. The
number of in-class students was smaller than the number of registered on-campus
students in 38 courses; in addition, the attendance rate was below 50% in 22 courses.
Attitude toward distance learning
0%
50%
100%
stude
nts TAsfac
ulty
enjoy
does not matter
dislike
other
Figure 2.1 Survey of attitude toward distance learning.
A key difference between in-class learning and current distance learning is that the
faculty members cannot see the remote students. Figure 2.2 shows the responses to the
question “How important is face-to-face interaction.” Note that more than 50% of the
faculty members reported that face-to-face interaction is extremely or very important; in
addition; 86% of the teaching assistants reported that face-to-face interaction is extremely
or very important. One explanation for the difference between faculty members and
teaching assistants is that faculty members often deliver well-rehearsed lectures while
teaching assistants often lead dynamic discussions.

6
Importance of f2f interaction
0%
50%
100%
students TAs faculty
extremelyverymoderatelysomewhatnot
Figure 2.2 Survey of the importance of face-to-face interaction.
Figure 2.3 shows the response to the question “What is the effect on student’s learning
outcome.” Note that teaching assistants and faculty members overwhelmingly believe
that student’s learning outcome suffers with distance learning. One of the reasons cited
for the decrease in learning outcome is the decrease in student-instructor interaction.
Learning outcome
0%
50%
100%
stude
nts TAs
facult
y
increasegreatly
increasesomewhat
does notchange
decreasesomewhat
decreasegreatly
Figure 2.3 Survey of the perceived learning outcome.
2.1.2 Stanford Online Observation
To better understand instructor’s interaction with in-class and distance learning students,
in a follow-up study, I observed four computer science courses over a 3-month period.
Students can attend these courses either in class or using distance learning. For each

7
class session, I counted the number of times that the instructor would ask a question to
the class, the number of times an in-class student would interrupt the instructor to ask a
question, and the number of times that a distance learning student would interrupt the
instructor to ask a question. The instructor asked an average of nine questions per class
and the local students asked an average of three questions per class. However, the remote
students only asked a single question over the 3-month period.
In summary, the current Stanford distance learning system does not allow the
instructor to see the students, and we found that while students enjoy distance learning, 1)
fewer students come to class, 2) instructors reports that face-to-face interaction is
important, and 3) there is essentially no interaction with the remote students.
2.2 Beneficial Effect of Video
The distance learning case study suggests that when the instructor cannot see the remote
students, there is little interaction with them. In this section, we describe previous
findings suggesting that in general a visual channel is needed to 1) support interactivity
when the group size is large, 2) support tasks that require complex collaboration, and 3)
build personal relationships. Other works provide a more complete review of the
previous findings on visual communication [Argyle and Cook, 1976; Finn et al., 1996;
Rutter, 1987; Short et al., 1976].
2.2.1 Support Interactivity when Group is Large
In a conversation, the speaker typically adapts the message to the audience [Kraut et al.,
1982; Mane, 1997]. For example, if the audience appears to have difficulty
understanding what is being said, the speaker may add a simple analogy to illustrate the
point. If the audience appears to agree with what is being said, the speaker may skip the
planned supporting arguments. The speaker adapts the message based on the feedback
from the audience. In a face-to-face conversation, the audience can provide feedback
through a verbal channel with utterances such as “yeah” or “ahem” and a visual channel
with facial expressions or body postures. A property of the audio channel is that typically
only one person can be speaking or providing feedback at a time; however, when a visual
8
channel is available, everyone in the audience can provide visual feedback while the
speaker is speaking.
One way to evaluate the value of a visual channel is to measure its influence on the
interactivity of the conversation. The number of speaker changes is often used to indicate
the interactivity of a conversation [Sellen, 1995]. For example, a formal meeting may
have a few speaker changes while a heated brainstorming session would have more
speaker changes.
From everyday experience, we know that it is not difficult to have an interactive
conversation on the telephone with one other person. When the conversation involves
three or four people, studies found that there is little difference in the number of speaker
changes between audio-only, audio-and-video, and face-to-face conversations [Sellen,
1995]. When the group size is increased to 20 to 30 people or larger, the distance
learning study described in Section 2.1 suggests that there is fewer speaker changes
involving the unseen remote students.
One explanation for the insensitivity to the availability of a visual channel when the
group size is small is that the audio channel can support adequate feedback; however,
when the group size is large, it becomes more difficult for the speaker to gauge the
audience’s reaction from the audio channel. In fact, except for group responses such as
laughter, people typically do not use the audio channel to supply individual feedback
when many people are listening. When the speaker cannot gauge the impact of his or her
speech, he or she may become less confident of what he or she is saying, thus is less
likely to speak. When the speaker can see the audience, he or she is more confident
[Mane, 1997], thus is more likely to speak. Other factors that influence the interactivity
of a conversation include the familiarity of the group members with each other and the
formal relationship between the group members.
2.2.2 Support Complex Collaboration
Both the audio and visual channel can support the transmission of audience feedback;
however, we are more inclined to show our mood and attitude through facial and bodily
cues [Short et al., 1976]. In addition, it is typically considered rude and taboo to express
feedback that may be viewed as negative through the audio channel [Short et al., 1976].

9
For example, people typically express boredom through facial expressions and body
posture, but will rarely interrupt the instructor to say, “I am bored.”
One way to evaluate the value of visual channel is to measure its impact on task
outcome. Based on the observation that we are inclined to express our attitude through
the visual channel, we would expect the visual channel to impact tasks where the
knowledge of personal attitude is important. A large number of experiments have
compared task outcome of simple problem solving tasks that are less dependent on
personal attitude; and it is generally found that the availability of the visual channel does
not impact task outcome for such tasks [Chapanis et al., 1972; Chapanis, 1975; Gale,
1989; Reid, 1977; Rutter and Robinson, 1981; Short et al., 1976; Williams, 1977].
However, when the task requires complex collaboration, such as bargaining, or the role
and power relationship of people involved is unclear, it is generally found that the visual
channel improves task outcomes [Short et al., 1976].
2.2.3 Build Personal Relationship
Besides being the dominant channel to transmit personal attitude, the visual channel is
uniquely suited to transmit the human face. Our identity is associated with our face, and
seeing the face facilitates the forming and building of personal relationships [Bruce and
Young, 1998].
One way to evaluate the value of a visual channel is to measure its impact on the
forming and building of personal relationships. However we are not aware of any
experiment that directly measures this. Everyday experience suggest that people often
form close relationships with those whom they see the most often. In addition, even
when video does not help to accomplish the task at hand, people prefer to see the other
person [Fish et al., 1993; Tang and Isaacs 1993].
2.3 Harmful Effect of Video
The previous section suggests that a visual channel is important in supporting
interactivity when the group is large, in supporting complex collaborations, and in
building personal relationships; thus, it may be surprising that with few exceptions,
essentially all videoconferencing products have been market failures [Egido, 1990; Noll,

10
1992]. Perhaps a fundamental reason for the market failures is that video can also do
harm: that sometimes is it better to communicate through audio only. In this section, we
describe two conditions when video does harm: 1) when video degrades audio quality,
and 2) when video makes the remote person look bad.
2.3.1 Degrade Audio Quality
Compare to a telephone, many early video communication systems degrade the audio
quality in order to support video. To limit the required bandwidth, some systems only
allowed half-duplex audio [O’Conaill et al., 1993]. To maintain lip synchronization,
some systems increased the total audio delay to 400 to 700 msec [O’Conaill et al., 1993].
A consequence of half-duplex audio is that laughter is virtually eliminated since in
order for the laughter to be heard, the laughing person must first press a button to acquire
the audio channel [Isaacs et al., 1995]. A consequence of excessive audio delay is that it
can be difficult to interrupt the speaker such as to ask a question [Cohen, 1982]. This can
lead to a reduction in the number of speaker changes and can reduce the satisfaction of a
conversation [Isaacs and Tang 1993]. It is generally concluded that audio quality should
not be sacrificed to support video [Whittaker and O’Conaill, 1997].
2.3.2 Unintentional Communication
Compare to face-to-face conversation, video communication systems often subtly distort
the conversational cues such that the person, rather than the medium, is viewed with
negative attributes. For example, users are often not aware of the transmission delay, and
may attribute the perceived delay in response to the other person [Brady, 1971; Kitawaki
et al., 1991]. Lip movements not synchronized with speech due to video compression
may cause the person to be viewed as less credible [Reeves and Nass, 1996]. And
difficulties with eye contact due to camera placement may cause the person to be viewed
as unfriendly [Argyle and Cook, 1976]. The negative portrayal of the remote person
through video sometimes creates instant dislike toward the remote person and the
sensation of talking to a “mentally defective foreigner” [Egido, 1988].
We would like to design a video communication system that can convey
conversational cues such that the person will not be viewed negatively. In this

11
dissertation, we focus on conveying hand motion, lip movement, and eye contact cues.
We focused on these cues since the expression of these cues are often cited as deficient in
critique of video communication systems [Finn et al., 1997].

12
Chapter 3 Floor Control
In the previous chapter, we described the finding that there is essentially no interaction
with the remote students whom the instructor cannot see. A visual feedback channel
from the remote students to the instructor may promote greater classroom interaction
[Short et al., 1976]. The feedback channel can be used for both awareness and floor
control. Awareness of the students’ facial expressions, gestures, and postures allows an
instructor to adapt the teaching to the students’ current interest and understanding. Floor
control, typically expressed through hand raising, allows students to indicate a desire to
speak. The feedback channel can be based on (1) the text medium, such as Instant
Messenger or chat [Jancke et al., 2000; Malpani and Rowe, 1997], (2) the graphics
medium, such as iconic representation of communication events [Isaacs et al., 1995;
Jancke et al., 2000], or (3) the video medium [Chen, 2001; Jancke et al., 2000].
Text and graphics feedback channels require very little network bandwidth, but
students must perform explicit actions to communicate. For example, they may have to
press a key to trigger a hand icon to indicate the desire to speak or click on an emoticon
to express a puzzled look. Usage studies suggest that ephemeral feedback such as a
fleeting smile or feedback that has a rigid timing requirement such as laughter after a joke
may not be transmitted if explicit action is required [Isaacs et al., 1995]. People are also
reluctant to explicitly express negative attitudes toward another [Short et al., 1976].
Instructors are thus unlikely to see emoticons indicating that students are bored. An
additional problem is that text and iconic channels do not transmit the appearance of the
participants, a cue that is important when people interact with strangers [Short et al.,
1976], as is the case in many class settings.

13
A video feedback channel does not require participants to make all communicative
actions explicit and conveys the appearance of the participants; however, the high
network bandwidth required to stream full-motion video limits its deployment.
Our goal is to explore whether it is possible to achieve most of the benefits of full-
motion video at significantly lower frame rates for remote classrooms. Our hypothesis is
that the visual cues necessary for classroom interaction do not need to be updated at the
same rate. For example, while full-motion video is necessary for seeing a fleeting facial
expression, low-frame-rate video may suffice for seeing posture changes. While floor
control signals may require immediate transmission, delayed delivery of awareness cues
may still have value.
To test our hypothesis, we implemented a multiparty video communication system
that supports full-motion video, low-frame-rate video where the video is updated only
once every few seconds, and a hybrid scheme where full-motion video is transmitted
when the system detects that a user is making a gesture and low-frame-rate video is
transmitted at all other times. We studied people using our system for small-group
discussions and found that the gesture-sensitive scheme was as effective for floor control
as using full-motion video while requiring only a fraction of the bandwidth.
We begin by describing approaches to low-bandwidth video communication and
studies on the minimum frame rate necessary for effective communication. Next, we
describe the implementation of our gesture-sensitive communication system. Then, we
describe our user study and the findings. We conclude this chapter with a discussion of
our results.
3.1 Related Work
The required network bandwidth for video communication can be lowered by using more
efficient compression algorithms or by reducing the frame rate.
3.1.1 Low-bandwidth Video Compression
Discrete cosine transform (DCT) is used in most video communication systems. A
modern DCT compressor requires roughly 100 Kbps for a 320x240x15 fps video of a

14
person’s upper body [Chen, 2001]. If a DCT compressor is used below its target data
rate, the video image may contain blocking artifacts and motions may appear jerky.
Two alternative approaches to DCT have been developed for extremely low
bandwidth video communication. The first approach encodes only the outlines of an
image, the second approach encodes parameters to animate a 3D model of a person’s
head. Studies have shown that people can recognize the identity and facial expression of
a person by the outlines of facial features [Bruce, 1996; Stapley, 1972]; thus, a colored
image can be quantized into a binary image and only the edges in the binary image need
to be encoded. A modern implementation of this idea delivers usable video at less than
10 Kbps [Li et al., 2001].
The second approach analyzes a person’s facial movements, transmits a description of
the movements, and animates a 3D graphics model of the person’s head at the remote
end. The MPEG committee is standardizing this approach [MPEG-4, 2001] and a
modern implementation delivers usable video at less than 1 Kbps [Eisert and Girod,
1998]. A drawback of this approach is that the animated person may not look natural
since it is difficult to capture every nuance of the person’s facial expression.
The DCT, the feature-outline, and the model-animation approach to video encoding do
not use gesture information; thus, these approaches may be combined with our gesture-
sensitive algorithm to achieve even lower data rates.
3.1.2 Minimum Required Frame Rate
The required network bandwidth can be lowered also by lowering the frame rate. The
Portholes project has demonstrated that a frame rate as low as one update every five
minutes can provide awareness in a work environment [Dourish and Bly, 1992];
however, a direct application of this idea to remote classrooms may not be sufficient.
Students often signal the desire to speak by raising their hands; this signal would be
excessively delayed if transmitted through a Porthole-like system and the delayed
delivery of floor control signals may disturb the instructional dialogue [Jancke et al.,
2000]. We augment a Porthole-like system to transmit floor control signals without
delay.

15
Results of user ratings suggest that 5 fps is a lower bound on the acceptable frame rate.
Tang and Isaacs reported that people rated 5 fps as tolerable [Tang and Isaacs, 1993].
Watson and Sasse found that audio and video is not perceived as synchronized at less
than 5 fps [Watson and Sasse, 1996].
Studies of user behavior found little difference in task outcome or communication
behavior when the frame rate is lowered from 25 fps to 5 fps. Masoodian et al. studied
pairs of people solving a jigsaw puzzle via a 5 and a 25 fps video communication system
and found that the frame rate had no effect on task completion time, number of
utterances, amount of overlapping speech, number of speaker changes, or number of floor
change attempts [Masoodian et al., 1995]. Jackson et al. studied pairs and groups of four
people creating a tourist poster via a 5 and 25 fps video communication system [Jackson
et al., 2000]. They found that the frame rate had no effect on the quality of the poster or
the number of words spoken; however, they did find a small increase in the number of
speaker changes when two people conferenced at 25 fps.
Experiments have also shown that lowering the frame rate from 25 to 15 and 5 fps
does not decrease a person’s understanding of the content of the video [Ghinea and
Thomas, 1998]. In fact, comprehension sometimes increased at 5 fps.
Studies reviewed so far suggest that 5 fps may be the minimum required frame rate;
however, experiments have also shown that video can be useful at 1 fps. For example,
novices were able to learn and effectively recognize American Sign Language at 1 fps
[Johnson and Caird, 1996].
All studies reviewed so far examined the effect of constant-frame-rate conditions,
while our study examined the effect of non-uniform-frame-rate conditions.
3.2 Design of Gesture-Sensitive Streaming
We implemented a multiparty video communication system that allows dozens of
students to take a class from different locations. Each student, as well as the instructor,
attends the class via a personal computer. Figure 3.1 shows the user interface. Note that
all participants in the class are shown in a video grid. The usage model is that all
participants can be seen and heard at all times.

16
Figure 3.1 Screen shot of our multiparty videoconferencing user interface.
We describe a simple gesture-detection algorithm in Section 3.2.1, and compare the
required network bandwidth at different frame rates in Section 3.2.2. The
implementation framework is described in Chapter 6.
3.2.1 Gesture Detection Algorithm
Within the computer vision community, the goal of using computers to detect, identify,
and interpret human behavior has become a central research topic [Pentland, 2000]. A
review of the state-of-the-art in gesture tracking and recognition algorithms can be found
in [Gavrila, 1999; Pavlovic et al., 1997]. These algorithms are often designed with a
limited assumption about the scene so that they can be useful for a wide range of
applications; furthermore, the algorithms must minimize both false positive and false
negative identifications. We use two assumptions to make our algorithm robust while the
required computation is minimized. First, we assume that each camera will see a head-
and-shoulders view of a single person. Further, we assume that the background behind
any one person will not undergo rapid changes most of the time since the person is
attending a class. This assumption allows us to detect hand motion using only motion
cues instead of using both motion and color cues. Algorithms that use both motion and
color cues often do not run in realtime [Pavlovic et al., 1997]. Second, our algorithm
only needs to minimize false negative identifications since the penalty for a false positive

17
identification is a modest increase in bandwidth. This assumption simplifies the selection
of threshold values in our gesture-detection algorithm and, consequently, allows us to use
relatively coarse-grained computer vision processing to minimize computational load.
Figure 3.2 illustrates our gesture-detection algorithm. For each video frame, a video
analysis module computes the pixel-by-pixel difference between the input frame and the
previous frame. Next, an erosion filter is applied to the pixel difference. The erosion
filter sets each pixel to the minimum value of that pixel and its eight neighbors. The
effect of the erosion filter is to remove spurious pixels such as those from noise and to
thin out the difference between the two frames. The erosion filter is applied four times, a
number that we empirically determined to give good results. Note in Figure 3.2 that
when a person slightly changes body position, any frame difference is essentially gone
after erosion, whereas the erosion filter does not erase the motion of a hand being raised.
Finally, the module sums the pixel values of the eroded frame and if this value exceeds a
threshold, this frame is compressed and transmitted.
The algorithm just outlined cannot distinguish large body movements from hand
motion since the erosion filter may not filter out all body movements. Our usage model
assumes that each camera will capture a head-and-shoulders shot of a single person; we
use this a priori information to distinguish types of motion in the eroded frame.
Observation of the eroded frame has shown us that hand motion typically causes a
concentrated pixel difference in a single region while large body motion causes the
eroded frame to show a pixel difference in many regions scattered over a larger area. For
the eroded frame difference, the area of the bounding box containing non-zero pixel
difference is computed, and only when this area is less than a threshold will it be
considered as a possible hand motion.
Figure 3.2 shows that a hand raise or a hand drop causes a spike in the graph of the
eroded frame difference. We have used this characteristic to implement an ultra-low-
bandwidth communication system that conveys only hand raises and hand drops. In this
mode, instead of transmitting at full-motion whenever hand motion is detected, a frame is
transmitted only at the end of each spike in the eroded frame difference. However, we
did not investigate this ultra-low-bandwidth mode in our user study.

18
input frame frame difference after erosion
0
0.5
1
0 100 200time (frame number)
norm
aliz
ed su
m o
f pi
xel d
iffer
ence
frame differenceafter erosion
Figure 3.2 Gesture-detection algorithm. The top row of images shows an input frame, the pixel-by-pixel difference of this frame with respect to the previous frame, and the pixel difference after the erosion filter is applied. The second row of images shows the same processing pipeline when a hand is raised. The graph shows the frame-by-frame value of the sum of the frame difference and the sum of the eroded frame difference for a representative video. The person was initially sitting very quietly, next he moved back and forth in his chair, and finally he raised and then dropped his hand.
We implemented our gesture-detection algorithm using Intel’s Image Processing
Library [Intel IPL]. The algorithm uses 15% of the processor cycles of a Pentium III
500MHz to process a 320 by 240 pixel video stream at 15 frames per second.

19
0
25
50
75
100
0 100 200 300time (frame number)
fram
e si
ze (k
bits
)
a) full-motion video communication
0
25
50
75
100
0 100 200 300time (frame number)
fram
e si
ze (k
bits
)
b) low-update video communication
0
25
50
75
100
0 100 200 300time (frame number)
fram
e si
ze (k
bits
)
c) gesture-sensitive video communication
Figure 3.3 Size of compressed frames for full-motion, low-update, and gesture-sensitive video communication. All frames are 320 by 240 pixels and compressed using Microsoft’s MPEG4 codec.
3.2.2 Effect of Frame Rate on Bandwidth
Figure 3.3 shows the network bandwidth required for full-motion video at 15 frames per
second, low-update video at 1 frame every 5 seconds, and gesture-sensitive video. The

20
graph plots the network packet size of each frame for a 20-second video sequence
compressed using Microsoft’s MPEG4 codec. The video sequence was representative of
the videos recorded in our user study.
The three large spikes in the full-motion condition correspond to I-Frames. Low-
update and gesture-sensitive conditions use reliable transmission; thus, the compression
module does not generate any I-Frames after the initial I-Frame. In the gesture-sensitive
condition, the first spike around frame 250 corresponds to a hand being raised and the
following spike corresponds to the dropping of the hand. The largest compressed image
for the full-motion, the low-update, and the gesture-sensitive condition are 77 Kbits, 14
Kbits, and 17 Kbits, respectively. The average bandwidths for the full-motion, the low-
update, and the gesture-sensitive condition are 108 Kbps, 2 Kbps, and 11 Kbps,
respectively.
The actual bandwidth requirement of gesture-sensitive communication will depend on
the frequency of hand raising and other gestures. From our user study, we found that one
hand being raised every 20 seconds per person would result in a very lively discussion
environment; thus, the expected bandwidth in practice should still be less than that
required for full-motion video.
3.3 User Study of the Impact of Frame Rate
The goal of this user study is to evaluate the impact of frame rate on conversational
behavior, specifically, people’s ability to request to speak and to judge when to stop
speaking in a remote classroom environment.
3.3.1 Methodology
We used the task of group discussion. To suppress the effect of subjects’ background
knowledge, we chose a simple topic to stimulate lively discussions. The discussion
scenario was that a successful software engineer in her late twenties had recently been
laid off. Having worked hard since graduating, she wants to take a year off to travel. She
would prefer not to spend more than twenty-five thousand dollars. The discussion topic
was where she should go, what she should do, and how she should do it frugally.

21
Eight groups of four people per group participated in the discussion. The participants
were current and recent graduates of Stanford University. The people in each group first
met face to face in our lab and then each sat in front of a computer and continued the
conversation using our video communication software. The participants were told that
they should raise their hand to indicate a desire to speak and that they should be called on
before speaking. The last person who spoke chose the next speaker. The hand raising
protocol was designed to create a polite but lively discussion environment.
The three experimental conditions were full-motion at 15 frames per second, low-
update at 1 frame every 5 seconds, and gesture-sensitive, where automatically detected
gestures were transmitted at full-motion and at all other times frames were transmitted as
in the low-update condition. In a pilot user study, we also tested low-update conditions at
1 frame every 5 minutes, as in the Portholes system [Dourish and Bly, 1992], and at 1
frame every 10 seconds; however, users considered these frame updates as too infrequent
to be worth paying attention to. We did not try updates at a rate higher than 1 frame
every 5 seconds so the low-update condition would have difficulties conveying gestures
and facial expressions. In summary, the full-motion condition conveys facial
expressions, gestures, and posture positions, the gesture-sensitive condition conveys
gestures and posture positions, and the low-update condition conveys posture positions.
Each video frame had a resolution of 320 by 240 pixels and was captured using a
LogiTech QuickCam Pro 3000 USB camera. We used 20-inch monitors and set the
display resolution at 640 by 480 pixels, so the videos of the four participants covered the
entire screen. For each of the three conditions, a three-minute warm up preceded five
minutes of discussion. Each group held discussion using all three conditions, and the
order of the conditions was counterbalanced. The audio and video of each participant
were recorded using our software. After the discussion, participants filled out a
questionnaire and were interviewed to collect open-ended feedback.
3.3.2 Results
A measure of the liveliness of a discussion is the number of speaker changes. Figure 3.4
shows the average number of speaker changes per minute during the discussion for the
three frame-rate conditions. The low-update condition resulted in fewer speaker changes

22
than the full-motion condition, while the gesture-sensitive condition achieved a similar
number of speaker changes.
0
1
2
3
4
5
full motion gesture sensitive low update
spea
ker c
hang
e pe
r min
ute
Figure 3.4 Average number of speaker change per minute during the discussion.
1
2
3
4
5
6
7
1. re
ques
t for
floo
r
2. g
ive
up fl
oor
3. y
our e
ngag
emen
t
4. o
ther
s eng
agem
ent
5. y
our e
njoy
men
t
6. o
ther
s enj
oym
ent
7. u
sefu
lnes
sfullmotiongesturesensitivelowupdate
Figure 3.5 Survey results. Graph shows the average of users’ responses to the statements in Table 3.1. A response of 1 corresponds to strongly disagree, 4 corresponds to neutral, and 7 corresponds to strongly agree.

23
Figure 3.5 shows the survey results. Table 3.1 lists the survey questions. Note that
the gesture-sensitive condition was more effective in supporting floor control than the
low-update condition. Questions on engagement and enjoyment showed less difference
between the three conditions, indicating perhaps that these awareness metrics are less
sensitive to frame rate. Overall, the gesture-sensitive and the full-motion condition were
judged to be useful to the discussion while the low-update condition was not.
1. This condition did not limit your
ability to request for floor (signal your
desire to speak)
Floo
r con
trol
2. This condition did not limit your
ability to judge when others want to
speak
3. You were engaged (absorbed) in the
discussion under this condition
4. Other people were engaged
(absorbed) in the discussion under this
condition
5. You enjoyed the discussion under
this condition
Enga
gem
ent a
nd e
njoy
men
t
6. Other people enjoyed the discussion
under this condition
Util
ity 7. Overall this condition was useful
for the discussion
Table 3.1 Survey questions posed to the users.

24
3.4 Discussion
Figure 3.5 shows that participants viewed the low-update condition as ineffective for
floor control, and yet Figure 3.4 shows that the three frame rate conditions did not result
in as large a difference in the speaker changes as Figure 3.5 might suggest. To explain
this finding, we define two terms, floor holding time and floor change latency. The floor
holding time is the time between speaker changes, which is about 20 seconds on average
in our user study. The floor change latency is the time between when a person requests to
speak and when that person begins to speak. The floor change latency introduced by the
video medium is on average 2.5 seconds for the low-update condition and 33
milliseconds for the full-motion and the gesture-sensitive condition. Since the additional
latency introduced by the low-update condition is a small percentage of the floor holding
time, we should not see a large decrease in the number of speaker changes even though
participants felt that the low-update condition was ineffective for floor control.
If the frame rate in the low-update condition were decreased to the order of the floor
holding time, then we would expect a large decrease in the number of speaker changes.
On the other hand, if the floor holding time were significantly longer than 20 seconds, as
is the case in a more formal discussion or lecture, then we may not be able to measure
any difference between the three conditions in terms of speaker change.
A common complaint about the low-update and the gesture-sensitive condition is that
people can be caught at a moment that makes them look silly, typically in the middle of a
movement, with the consequence of all the participants laughing. This effect may be
minimized if the time when the camera will take the next shot can be indicated to the
user, perhaps by a graphical count-down indicator. However, such an indicator may also
be districting since users may attempt to pose for each shot.
Hand raising is the predominant social protocol for requesting to speak in a classroom,
but it is not always required for effective floor control. When the participants know each
other well, they learn to thread their comments or questions between the natural breaks in
the current speaker’s utterance; thus audio communication alone may suffice under these
conditions. In a pilot study, we asked groups of four people who knew each other well to
participate in our study. Unlike our main study, these participants were not told to raise

25
their hands to request the floor. We found that the participants often did not look at the
videos. They would start to speak as soon as the current speaker pauses.
Even when participants always raise their hands to request to speak, floor control also
depends on other signals. An experienced speaker, for example, monitors the listeners’
gaze, facial expressions, and body positions. If listeners appear to be confused, the
speaker may pause and invite a question or comment from the audience. Unlike full-
motion video communication, gesture-sensitive communication is ineffective at
transmitting gaze, facial expressions, and high-frequency body movements. One way to
minimize this shortcoming is to detect the natural pauses in a speaker’s delivery and
stream at full-motion during these pauses. Speakers tend to not look at the listeners
during an utterance but to look at them at the end of the utterance [Argyle and Cook,
1976], presumably to check for feedback from the audience. Streaming during the
speech pauses may offer enough visual feedback to allow a speaker to adapt to the
audience. We plan to conduct user studies to verify or refute this speculation.
Instead of gesture-sensitive communication, an alternative improvement to low-frame-
rate communication is to allow students to use a keyboard to signal the desire to speak,
for instance by overlaying the student’s image with an iconic representation of a raised
hand. However, instructors in a face-to-face classroom expect a spectrum of different
gestures, from the hesitantly raised hand to the must-speak-immediately thrust. It is
unclear how to effectively map different gestures to graphical icons and whether such a
system will be easy to learn and use. Given that congenitally blind children make
gestures similar to those of sighted children, even when they know the listener is blind
[Iverson and Goldin-Meadow, 1998], the ability to make and interpret gestures may be
inborn; thus, a system that conveys gestures in their natural form may have a biological
performance advantage.
3.5 Conclusion
Multiparty video communication with even a small number of people is often infeasible
due to the high network bandwidth required. Commodity video communication products
often compete in the maximum visual fidelity of a single video stream that they can
deliver. Our research explores the minimum visual fidelity necessary for video

26
communication to be effective. Our contributions are (1) the design and implementation
of a gesture-sensitive video communication system and (2) a user study on the effect of
frame rate on small-group discussions in a remote classroom environment.
The three frame-rate are (i) full-motion, which conveys facial expressions, gestures,
and postures, (ii) gesture-sensitive, which conveys gestures and postures, and (iii) low-
update, which conveys postures. Our data suggests that conveying postures alone is
insufficient for small group discussions due to difficulties with floor control. Our data
also suggests that conveying gestures in addition to postures is a viable option if limited
bandwidth would otherwise prevent using video communication at all. For future work,
we plan to incorporate more sophisticated computer vision modules to detect head and
eye movements so that these signals can also be selectively transmitted.

27
“We shape our tools, and thereafter our tools shape us” - Marshal Mcluhan Chapter 4 Lip Synchronization
Audio is presented ahead of the video in some video communication systems since audio
requires less time to process. We measured the audio and video processing times on a
Pentium 4, and observed that it takes less than 1 msec to encode a 30-msec audio packet
using the widely used TrueSpeech codec, while it can take more than 250 msec to encode
a 720x480 frame using a high-quality MPEG-4 codec.
The conventional approach to synchronizing audio and video is to delay the audio so
that the audio and video latencies are matched; however, the time required to process
video can exceed the maximum perceived audio latency that is acceptable in a
conversation. Video communication systems may not synchronize the audio with the
video since supporting perceptually instantaneous audio is more important than
maintaining lip synchronization [Isaacs and Tang, 1997]. However, we all read lips
[McGurk and MacDonald, 1976]. Seeing lip movements improves speech
comprehension in the presence of background noise [Sumby and Pollack, 1954] or when
the listener suffers from hearing loss [Binnie et al., 1986]; unfortunately, lip reading is
less effective when the lip movements are unsynchronized with the utterance [Campbell
and Dodd, 1980; Koenig, 1965; Knoche et al., 1999; McGrath and Summerfield, 1985;
Pandey et al, 1986].
We built a video communication system to achieve lip synchronization with minimal
perceived audio latency. Instead of adding a fixed audio delay, our system time stretches
the audio at the beginning of each utterance until the audio is synchronized with the

28
video. At the end of each utterance, audio and video are unsynchronized and the audio is
time compressed until the audio is once again presented without delay.
We conducted user studies and found that (1) audio could lead video by roughly 50
msec and still be perceived as synchronized, and that this sensitivity could shift by as
much as 150 msec between different speakers; (2) audio could lead video by 300 msec
and still be perceived as synchronized if the audio was time stretched to synchronization
within a short period; and (3) users preferred our system over an unsynchronized lower-
latency or a synchronized higher-latency video communication system.
Our contributions are (1) the design and implementation of a video communication
system to bridge the traditional tradeoff between audio latency and lip synchronization,
and (2) the first lip synchronization study of variable AV skew. We begin by describing
our algorithm. Next, we summarize previous experimental findings on lip
synchronization. Then, we describe the methodology and findings of our lip
synchronization experiment.
4.1 Lip Synchronization Algorithm
In this section, we provide an overview of our lip synchronization algorithm, and then
describe an implementation of the algorithm.
4.1.1 Algorithm Overview
Figure 4.1 depicts the latency of possible lip synchronization algorithms. Option 1 does
not synchronize the audio with video in order to maintain low audio latency. Note that
Ba (audio play out time) occurs before Bv (video play out time) since audio requires less
time to encode and decode. Option 2 achieves synchronization by lowering the video
quality. Option 3 achieves synchronization by adding a fixed delay to audio.
Option 4 illustrates our algorithm. Rather than delaying the audio at all times, the
audio is delayed only when the user is speaking. The algorithm has two states: low
latency and lip synchronized. In the low-latency state, audio is presented as soon as it is
decoded. In the lip-synchronized state, audio is synchronized with video. The transition
from the low-latency state to the lip-synchronized state is triggered at the beginning of an
utterance. During the transition, the system time stretches each decoded audio sample by

29
a fixed amount until the audio delay matches the video processing latency. Note that Ba
in this option occurs at the same moment as the Ba in option 1, the low-audio-latency
option, and that shortly after person A begins to speak, the audio and video become
synchronized as in option 3.
Our algorithm transitions from the lip-synchronized state to the low-latency state at
the end of an utterance. During the transition, the system time compresses the audio until
newly decoded audio is presented without delay. The beginning of an utterance is
defined as the moment when the audio volume exceeds a silence threshold, the maximum
measured audio volume when the user is not talking. The end of an utterance is defined
as the moment when the audio volume is less than the silence threshold.

30
encodenetworkdecodesync
A
Ba Bv
time1) low-audio-latency but unsynchronized
encodenetworkdecodesync
A
Bav
time3) lip-sync by adding a fixed audio delay
encodenetworkdecodesync
A A’’
Ba Bv B’’av
time4) lip-sync by dynamically time stretching audio
A’
B’a B’v
encodenetworkdecodesync
A
Bav
time2) lip-sync by decreasing video quality
encodenetworkdecodesync
A
Ba Bv
time1) low-audio-latency but unsynchronized
encodenetworkdecodesync
encodenetworkdecodesync
A
Ba Bv
time1) low-audio-latency but unsynchronized
encodenetworkdecodesync
encodenetworkdecodesync
A
Bav
time3) lip-sync by adding a fixed audio delay
encodenetworkdecodesync
encodenetworkdecodesync
A A’’
Ba Bv B’’av
time4) lip-sync by dynamically time stretching audio
A’
B’a B’v
encodenetworkdecodesync
encodenetworkdecodesync
A
Bav
time2) lip-sync by decreasing video quality
Figure 4.1 Latency of lip synchronization algorithms. The diagrams separate latency into encoding, network transmission, decoding, and synchronization components. Label A indicates the moment person A begins to speak. Labels Ba, Bv, and Bav indicate the moment person B hears A, sees A, and hears and sees A, respectively. Option 1 does not attempt synchronization: Ba occurs before Bv since audio is presented as soon as it is decoded. Option 2 lows the video quality until Ba and Bv can occur at the same moment. Option 3 adds a fixed delay after audio decoding so that Ba occurs at the same moment as Bv. In option 4, audio is initially presented as soon as it is decoded. After the first sound is presented to B, audio is time stretched. The effect of time stretching is to increase the delay of audio; thus, the difference between B’a and B’v is smaller than Ba and Bv, where A’ indicates a short moment after person A’s first utterance. The audio time stretch is continued until the audio delay matches the corresponding video, as indicated by B”av.

31
Three observations motivated our algorithm: (1) audio latency is detectable only
during a speaker change, (2) a short period of unsynchronized lip movement followed by
a period of synchronized lip movement is perceived as synchronized overall, (3) a brief
audio time stretch at the beginning of an utterance is difficult to notice. Observation (2)
is from a study to be reported in this chapter. Observation (3) is from informal
observation. We plan to formally evaluate this claim in a future study.
Observation (1) is valid since latency can only be detected during a round trip event.
For example, the processing latency of a television is generally not noticed. In a
videoconference, the only round trip event is a speaker change. Observation (1) suggests
that the overall perceived latency can be minimized as long as the latency during a
speaker change is minimized. Figure 4.1 shows that our algorithm has the same audio
latency as the low-audio-latency option for the initial utterance during a speaker change
(Ba occurs at the same moment in the two options); thus our algorithm can minimize the
perceived latency during a speaker change.
The actual perceived latency of our algorithm is greater than option 1, where audio is
never delayed after decoding, and less than option 3, where audio is always delayed after
decoding. Suppose person A stops speaking and then person B starts to speak. In this
speaker change, the last utterance of A is delayed since the algorithm is still in the lip-
synchronized state. When B starts to speak after hearing the end of A’s utterance, B’s
initial utterance is not delayed since the algorithm is still in the low-latency state; thus, A
will perceive a round trip audio latency equal to the one-way audio latency of option 3
plus the one-way audio latency of option 1.
The perceived round trip audio latency of our algorithm can be equal to the round-trip
latency of option 1 if we can predict the moment an utterance will end. In this case, we
would begin to unsynchronize the audio and video a short moment before the end of the
utterance so that the final sound of the utterance can be presented without delay.
4.1.2 Implementation Description
We implemented our lip synchronization algorithm within the Stanford vLink framework
[vlink]. The Stanford vLink is a multiparty video communication software that allows
third party developers to add processing modules within its audio and video streaming
32
pipeline. Only a single module was added to the vLink pipeline. This module was
inserted before the audio rendering module within the receiver. The added module
performs three functions: estimates a silence threshold, the maximum volume when the
user is not speaking, time stretches the audio if necessary, and time compresses the audio
if necessary.
Our system time stretches audio by resampling and interpolating the original audio
packet. Even though the time stretch is applied only during a brief period at the
beginning of an utterance, a pitch shift may be noticed. In our study, we limited the
operating range of time stretch so that the pitch shift is not noticeable.
We use sample truncation for audio time compression since compression is only
applied at the end of an utterance where the audio is silent; thus the newly decoded audio
packets can be discarded without harm.
4.2 Perception of Lip Synchronization
The visual display of speech will arrive at a listener earlier than the corresponding
auditory component since light travels faster than sound. The neural response to light
may be slower than sound since the chemical process of transducing light is slower than
the basilar membrane that transduces sound [Massaro et al., 1996]. To accommodate
these natural asymmetries in auditory and visual detection, the brain considers an
auditory event and a visual event as simultaneous if they are detected within a certain
interval. We do not know the exact neurological process that yields a simultaneity
judgment; however, numerous experiments have measured the length of the interval
required to produce a simultaneity response, the basis for the sensation of lip-
synchronized speech.
4.2.1 Detectable AV Skew
Dixon and Spitz used a video recorder with a movable sound head to show the film of a
man reading prose [Dixon and Spitz, 1980]. While watching the film, subjects pressed a
key and the picture and the sound gradually became out of sync. The subject was to
release the key as soon as any asynchrony was detected. Dixon and Spitz found that

33
audio could be 257.9 msec behind the video or 131.1 msec ahead of the video before any
asynchrony was detected.
Steinmetz presented a person reading news where the audio was shifted from 320
msec ahead of the video to 320 msec behind the video at a step of 40 msec [Steinmetz,
1996]. He found that subjects did not report asynchrony if the audio was within 80 msec
of the video, and that nearly everyone reported asynchrony if the audio shift was more
than 160 msec.
Miner and Caudell presented a male speaking a sentence where the audio was delayed
in 10 msec steps [Miner and Caudell, 1998]. They found that subjects perceived an audio
delay less than 203.32 msec as synchronized.
In the television industry, the International Telecommunication Union specifies that
audio can be at most 20 msec ahead or 40 msec behind the video [CCIR 717] and
National Association of Broadcasters specifies that audio can be at most 25 msec ahead
or 40 msec behind the video [NAB, 1985]. However, these are conservative
specifications with regard to lip synchronization since an asynchrony of 40 msec is too
short to be perceived [Cooper, 1988].
4.2.2 McGurk Effect under Asynchrony
The McGurk effect is the phenomenon where the brain perceives conflicting auditory and
visual stimuli as something new, which is neither the original auditory nor the original
visual stimulus. For example, most people hear “da” when they are presented with the
sound of “ba” synchronized with the lip movement of “ga”.
Massaro and Cohen paired visual “ba” with audio “da” where the audio was shifted
from 200 msec ahead to 200 msec behind the visual [Massaro and Cohen, 1993]. They
found that the visual stimulus influenced the perceived sound even when the asynchrony
was 200 msec.
Tillmann, Pompino-Marschall, and Porzig paired the visual “gier” with audio “bier”
where the audio was shifted from 500 msec ahead to 500 msec behind the visual for
German subjects [Tillman et al., 1984]. They found that subjects perceived more “dier”

34
than “bier”, a manifestation of the McGurk effect, when the audio was at up to 250 msec
ahead or behind of the visual.
Munhall, Gribble, Sacco, and Ward paired visual “aga” or “igi” with audio “aba”
where the audio was shifted from 360 msec ahead of the visual to 360 msec behind the
visual [Munhall et al., 1996]. They observed the McGurk effect even when the audio
lagged the visual by 180 msec.
Massaro, Cohen, and Smeele paired the visual “ba”, “va”, “õa”, and “da” with audio
“ba”, “va”, “õa”, and “da” where the audio was shifted from 533 msec ahead of the visual
to 533 msec behind the visual [Massaro et al., 1996]. They observed the McGurk effect
at an asynchrony of up to quarter of a second, but not when the asynchrony was increased
to half a second.
4.2.3 Impact on Speech Understanding
Koenig constructed a magnetic drum with multiple recording and playback heads,
thereby allowing him to delay the audio by 0, 15, 30, 60, 120, 240, 480, 960, or 1920
msec [Koenig, 1965]. He found that the understanding of low-pass filtered speech,
whether of isolated words or sentences, was impaired when the delay exceeded 240 msec.
Campbell and Dodd presented subjects with consonant-vowel-consonant words where
the audio was masked by 41 to 50 dB of white noise and was delayed by 0, 400, 800, or
1600 msec [Campbell and Dodd, 1980]. Subjects were to repeat the presented words.
They found that accuracy was highest when the audio and video were in sync. The three
audio delayed conditions had similar accuracies, and were significantly better than the
audition or vision alone condition.
Pandey, Kunov, and Abel presented subjects with sentences where the audio was
masked by multi-talker babble and was delayed by 0, 60, 120, 180, 240, or 300 msec
[Pandey et al., 1986]. Subjects were to repeat the presented sentences. They found that
accuracies at delays up to 120 msec were comparable to the in-sync condition, and
accuracies at delays greater than 120 msec were worse than the in-sync condition but
better than the audition or vision-alone condition.

35
Knoche, Meer, and Kirsh presented subjects with four syllable nonsense words where
the audio was masked by a 11 dB white noise and was skewed from 160 msec ahead of
the video to 160 msec behind the video at 40 msec steps [Knoche et al., 1999]. The
subjects were to identify the second consonant in the nonsense word. They found that
identification accuracy decreased sharply if the skew was more than 120 msec.
McGrath and Summerfield used a laryngograph to replace the acoustical signal of
speech into a series of rectangular pulses [McGraph and Summerfield, 1985]. Rosen et
al. had previously shown that knowing these pulses together with lip reading is
significantly more effective than lip reading alone [Rosen et al., 1981]. McGraph and
Summerfield delayed the acoustical pulses by 0, 20, 40, 80, or 160 msec with respect to
the video, and asked subjects to identify content words. They found that performance did
not decrease with a delay of 20, 40, or 80 msec; however, at a delay of 160 msec,
performance decreased to that of lip reading without the auditory signal.
4.2.4 Summary of Previous Findings
Figure 4.2 summarizes the described experiments. The figure suggests that the minimum
detectable AV skew is less than the skew that can elicit a McGurk effect. Also, the
minimum detectable AV skew is roughly the skew that would cause degradation in
speech understanding. This minimum detectable skew ranges from 80 to 130 msec for
audio leading video, and 80 to 258 msec for audio lagging video.
4.3 Methodology
We conducted three experiments to evaluate our lip synchronization algorithm. First, we
measured the perceived lip synchronization when the audio and video were skewed by a
fixed amount. Second, we measured the perceived synchronization when an initially
unsynchronized recording was brought into synchronization through audio time
stretching. Third, we evaluated our system during a simulated videoconference.
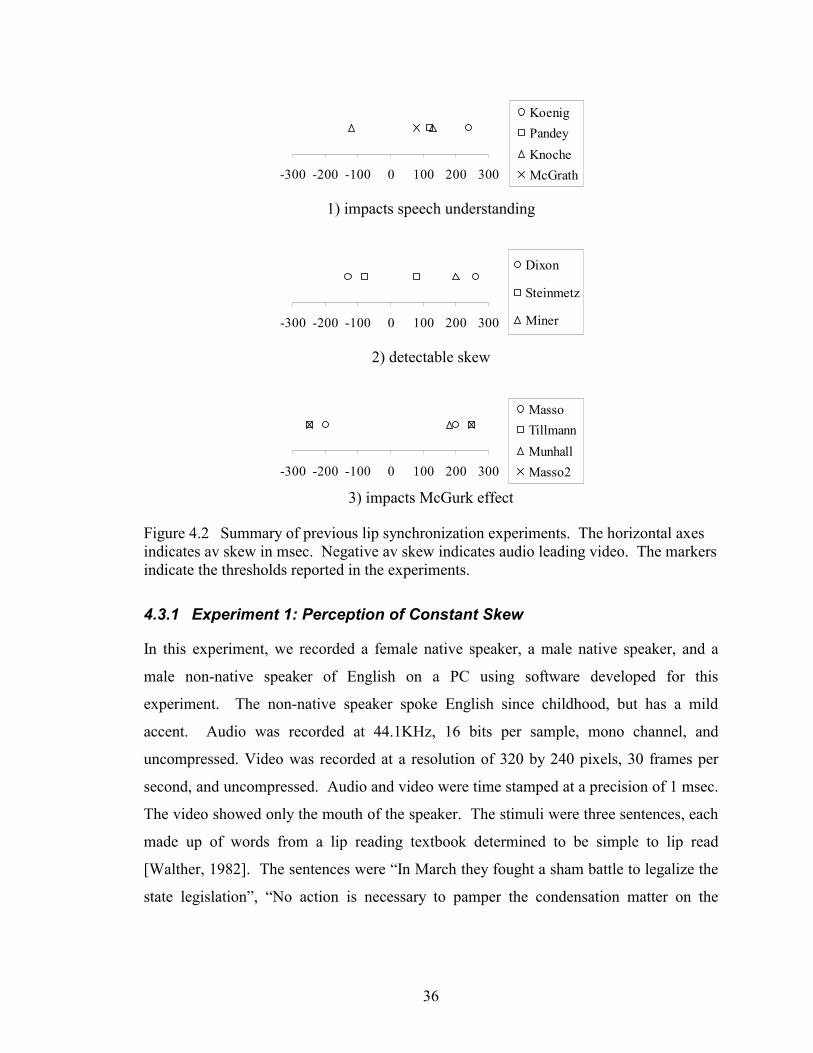
36
-300 -200 -100 0 100 200 300
KoenigPandeyKnocheMcGrath
1) impacts speech understanding
-300 -200 -100 0 100 200 300
Dixon
Steinmetz
Miner
2) detectable skew
-300 -200 -100 0 100 200 300
MassoTillmannMunhallMasso2
3) impacts McGurk effect
Figure 4.2 Summary of previous lip synchronization experiments. The horizontal axes indicates av skew in msec. Negative av skew indicates audio leading video. The markers indicate the thresholds reported in the experiments. 4.3.1 Experiment 1: Perception of Constant Skew
In this experiment, we recorded a female native speaker, a male native speaker, and a
male non-native speaker of English on a PC using software developed for this
experiment. The non-native speaker spoke English since childhood, but has a mild
accent. Audio was recorded at 44.1KHz, 16 bits per sample, mono channel, and
uncompressed. Video was recorded at a resolution of 320 by 240 pixels, 30 frames per
second, and uncompressed. Audio and video were time stamped at a precision of 1 msec.
The video showed only the mouth of the speaker. The stimuli were three sentences, each
made up of words from a lip reading textbook determined to be simple to lip read
[Walther, 1982]. The sentences were “In March they fought a sham battle to legalize the
state legislation”, “No action is necessary to pamper the condensation matter on the

37
panes”, and “The import phantom automobile candidate will predominate”. Each speaker
was recorded three times, each time speaking one of the sentences.
Sixteen students or recent graduates of Stanford University viewed the recordings
using a program written for this experiment. For each viewing, the audio and video were
skewed by a constant offset. Subjects judged if the recording was lip synchronized. The
offset ranged from audio leading video by 200 msec to audio lagging video by 350 msec
in steps of 50 msec. Every subject viewed all speakers speaking all sentences, and the
order of the speakers, sentences, and skew offsets was counterbalanced.
4.3.2 Experiment 2: Perception of Variable Skew
In this experiment, the recordings from experiment 1 were displayed to the same 16
subjects from experiment 1. For each viewing, audio initially led video by 200, 300, or
500 msec and was time stretched to synchronization in 50 msec, 300 msec, or was never
time stretched. The never-time-stretched condition is a repeat of the constant offset
condition of experiment 1. Subjects were instructed to pay special attention to the
beginning of an utterance and to report “not synchronized” if any part of the sentence
appeared out of sync. The order of the speakers, sentences, initial skews, and time stretch
intervals was counterbalanced.
4.3.3 Experiment 3: System Evaluation
In this experiment, eight subjects from the first two experiments videoconferenced with
an experimenter under three conditions: 1) 0 msec of audio delay and 250 msec of video
delay, 2) 250 msec of audio and video delay, and 3) variable audio delay and 250 msec of
video delay. Condition 1 models algorithm 1 in Figure 4.1, representing a low audio
latency but unsynchronized system. Condition 2 models algorithm 3 in Figure 4.1,
representing a synchronized system using a fixed audio delay. Condition 3 models
algorithm 4 in Figure 4.1, representing our new algorithm.
The subjects and the experimenter were blind to the modeled latencies. The subject
and the experimenter each sat in an adjoining room and the two rooms were linked using
analog audio and VGA video cables. The subject and experimenter engaged in casual
conversation, and the subject filled out a questionnaire at the end.

38
4.4 Results
Figure 4.3 shows the results of the first experiment, the perception of lip synchronization
where audio and video were skewed by a fixed amount. Note that the curve for the male
non-native speaker is shifted to the left by roughly 150 msec from the curve of the female
native speaker. The magnitude of this shift is comparable to the difference between
previous findings shown in Figure 4.2. Previous experiments typically only measured a
single speaker and different experiments used different speakers, thus perhaps the
difference between the previous findings is due to the speaking characteristics of different
speakers. If we consider the 75-percentile line to indicate the subjects’ detection
threshold, the average of the three speakers crosses the detection threshold when audio
led video by 47 msec or lagged by 154 msec.
Figure 4.3 Perception of constant audio-video skew, experiment 1. The curves show the percentage of times that lip synchronization was perceived for the three speakers: female native speaker of English (f-nat), male native speaker (m-nat), and male non-native speaker (m-non). Negative AV skew indicates audio leading video. Each curve is the average of sixteen subjects. The average standard deviation is 27, 31, and 34 percent for the female native, male native, and male non-native speaker, respectively.
Figure 4.4 shows the results of the second experiment, the perception of lip
synchronization where audio and video were skewed by a variable amount. Note that
most subjects perceived lip synchronization even when audio initially led video by 300
msec if the audio is synchronized with the video within a short period. In addition, the
time stretch period, 50 or 300 msec, did not strongly influence the perception of lip
0
25
50
75
100
-200 -100 0 100 200 300av skew (msec)
lip sy
nchr
oniz
atio
n (%
)
f-natm-natm-non

39
synchronization. All subjects mentioned that judging lip synchronization is an extremely
difficult task. This may explain the decrease in sensitivity from judging constant skews
to judging variable skews since it is more difficult to notice the asynchrony if the
asynchrony only lasts for a fraction of a second.
Figure 4.4 Perception of variable audio-video skew, experiment 2. The curves show the percentage of times that lip synchronization was perceived for the three speakers. The horizontal axis indicates the initial AV skew and the time used to stretch audio to synchronization. “-“ indicates that audio was not time stretched, corresponding to the fixed skew condition. The initial AV skew is negative to indicate that audio initially led video. Each curve is the average of sixteen subjects. The average standard deviation is 45, 36, and 23 percent for the female native, male native, and male non-native speaker, respectively.
Figure 4.4 shows that subjects perceived more synchronization when viewing the male
non-native speaker than the female native speaker. This can be explained by the
difference between the two speakers observed in Figure 4.3. For example, with an initial
skew of –100 msec, Figure 4.3 shows that the male non-native speaker appeared
synchronized while the female native speaker did not; thus a shorter time stretch interval
is required to make the male non-native speaker appear to be completely in sync.
Figure 4.5 shows the results of the third experiment, a comparison of our system to the
traditional unsynchronized lower-latency and synchronized higher-latency system. Note
that our system does appear to strike a favorable balance between minimizing audio
latency and supporting lip synchronization. We asked subjects which system they would
0
25
50
75
100
-200,5
0
-200,3
00-20
0, -
-300,5
0
-300,3
00-30
0,-
-500,5
0
-500,3
00-50
0,-
av skew, stretch time (msec)
lip s
ynch
roni
zatio
n (%
)f-natm-natm-non

40
prefer to use. Six subjects preferred our system and two preferred the unsynchronized
low-latency system. The two subjects who preferred the unsynchronized system
mentioned that while they noticed the unsynchronized lip movements, it didn’t bother
them. They mentioned that low audio latency was more important than lip
synchronization, a finding also reported by Isaacs and Tang [Isaacs and Tang, 1997].
1234567
latency is low is synchronized
0-250250-250var - 250
Figure 4.5 Survey results of comparing three video communication systems, experiment 3. The three system labels, 0-250, 250-250, and var-250, indicated the audio and video latency in msec. “var” indicates variable audio latency in the case of using audio time stretch for synchronization. The graph shows the average response to the statements 1) the audio has low latency and 2) the audio and video is lip synchronized, where a response of 1 indicates strongly disagree, 4 neutral, and 7 strongly agree.
4.5 Conclusion
The conventional approach to support lip-synchronized video communication is to delay
the audio by a fixed amount so that the audio and video latencies are matched. Instead of
using a fixed audio delay, we propose that the perceived audio latency can be minimized
if audio is time stretched at the beginning of each utterance. We built one such video
communication system, and the system appears to strike a favorable balance between
minimizing audio latency and supporting lip synchronization.
We conducted user studies and found that (1) audio could lead video by roughly 50
msec and still be perceived as synchronized and that this sensitivity could shift by as
much as 150 msec between different speakers; and (2) audio could lead video by 300
msec and still be perceived as synchronized if the audio was time stretched to
synchronization within a short period.

41
Our perception experiments mainly used recorded videos; for future work, we plan to
repeat our studies using live videos so that we can better predict people’s sensitivity to
asynchrony in an actual videoconference. In addition, we plan to implement
sophisticated audio time stretch algorithms and conduct a formal study on the range of
conditions that will allow audio time stretch at the beginning of an utterance to be
unnoticed. Finally, we would like to explore algorithms that may predict the end of an
utterance, so that the perceived latency can be further reduced.

42
Chapter 5 Eye Contact
People use their eyes to sense the world and to express themselves. When two people
look into each other’s eyes, they experience eye contact. Eye contact is a natural
experience of face-to-face communication [Argyle and Cook, 1976].
A major criticism of video-mediated communication is that most video
communication systems do not allow eye contact. The camera is typically mounted
above the display; thus, attempts to engage in eye contact are typically perceived as
looking down rather than into the remote observer’s eyes.
Eye contact can be supported using one of three approaches: (1) warping the video so
that it appears to be captured from the remote observer’s eyes, (2) merging the camera
and display optical path, or (3) mounting the camera close to the display so that they
appear to share the same optical path. Computer vision has been used for video warping
[Gemmell et al., 2000] but it can produce unnatural looking eyes. The camera and the
display optical path can be merged either by placing the camera behind a semi-
transparent display [Ishii and Kobayashi, 1992; Okada et al., 1994] or by placing the
camera behind a small hole on a front-projected screen. A disadvantage of the second
approach is that commodity displays, such as the ubiquitous desktop monitor, cannot be
used. The third approach has been used successfully on a 12-inch diagonal display
[Buxton et al., 1997; Sellen, 1995] and a 76-inch display [Chen, 2001]; however, it is
unknown if this approach can be applied to all display sizes.
Eye contact may also be supported metaphorically. The GAZE Groupware System
allows users to express gaze direction as image orientation in a 3D virtual environment
[Vertegaal, 1999]. This approach allows gaze awareness in video communication with
many participants; however, since image rotation may not alter the perceived gaze

43
direction of the person in the image, the gaze direction derived from the person in the
image may conflict with the gaze direction expressed by the image’s orientation.
In the hope of improving the perception of eye contact in video communication, we
conducted experiments to determine how accurately people perceive eye contact. Our
goal is to provide parameters for the design of video communication systems;
specifically, regarding the precision requirements to support eye contact in video
communication.
We begin by summarizing the classic findings. Next, we describe our experimental
procedure and present our discovery that the sensitivity to eye contact is asymmetric.
People are less sensitive to whether there is eye contact when others look below their
eyes than when others look to the left, right, or above their eyes. We conjecture that this
asymmetry is due to the anatomical properties of people’s eyes: it is harder to tell
whether the other person is attempting eye contact or is looking down. After presenting
our results, we propose the theory that people are prone to perceive eye contact: they will
think that there is eye contact unless they are certain that the person is not looking into
their eyes. Lastly, we suggest design parameters for video communication systems, and
as a demonstration, we describe a simple dyadic video communication prototype
constructed from commodity components. This prototype allows eye contact for the
majority of our subjects.
Throughout this chapter, we will use the terms adopted by the early gaze researchers: a
“looker” is defined as the person sending out the gaze and an “observer” is defined as the
person judging the gaze.
5.1 Previous Work
A common belief is that people can precisely judge the direction of another person’s
gaze. The exact precision was measured by psychologists who wanted to understand
visual communication and by those designers of video communication systems who
wanted to support eye contact.

44
5.1.1 Perceiving Eye Contact
Gibson and Pick performed the first study on the perception of gaze direction [Gibson
and Pick, 1963]. They instructed a looker to assume a passive facial expression and to
fixate on seven points on a horizontal line while facing an observer at a distance of 2m.
The gaze targets were 10 cm apart, the middle target being the bridge of the observer’s
nose. For each fixation, the observer judged whether the looker was looking directly at
him or not. There were six observers, and they perceived 84 percent of fixations at the
bridge of the nose as the looker looking directly at them. More importantly, the standard
deviation of the responses over the seven targets corresponded to an angular deviation of
2.8°, and Gibson and Pick defined this standard deviation as the just noticeable deviation
of the looker’s gaze from the bridge of the observer’s nose. A 2.8° rotation of the
eyeballs roughly corresponds to 1 mm of linear displacement of the looker’s iris. From 2
m, 1 mm corresponds to 1 minute of arc. Since human Snellen visual acuity is typically
said to be 1 minute of arc, Gibson and Pick concluded that the acuity of perceiving eye
contact is as good as the Snellen visual acuity.
In contrast to Gibson and Pick, who examined the perception of a looker who looked
to the left and right of the observer, Cline used a half-silvered mirror to allow his looker
to fixate on targets to the left, right, upward, and downward of the bridge of an observer’s
nose [Cline, 1967]. The gaze targets were 2°, 8°, and 12° in each direction. The looker
assumed a passive facial expression and sat 122 cm from the observer. Both the looker’s
and the observer’s heads were held in place with headrests. For each fixation, the
observer marked the looker’s gaze direction on a transparent response board. There were
five observers and the fixations at the bridge of the observer’s nose had a standard
deviation of 0.75° horizontally and 1.25° vertically; from this, Cline reaffirmed Gibson
and Pick’s conclusion that the acuity of eye contact is as good as the Snellen visual
acuity. When the looker looked below the observer’s eyes by 8° and 12°, the perceived
directions were on average 1.6° and 3.7° below the gaze targets, respectively.
Gibson and Pick’s as well as Cline’s conclusion that a gaze directed at the bridge of an
observer’s nose can be perceived with an acuity matching the Snellen visual acuity was

45
further affirmed by Jaspars et al. [Jaspers et al., 1969]. They found that observers could
discriminate between gaze shifts of 0.6°.
The studies described so far all used gaze targets separated by large visual angles.
Their claim that a gaze deviation of roughly one degree is accurately detected can be
tested directly if the gaze targets are more closely spaced. Kruger and Huckstedt
performed one such experiment [Kruger and Huckstedt, 1969]. Their looker fixated on
seven points around the observer’s eyes: forehead, bridge of the nose, tip of the nose,
right and left eye, and right and left face edge. The observers were able to correctly
identify the location of the feature points 35 and 10 percent of the time from a distance of
80 and 200 cm, respectively. Ellgring repeated the Kruger and Huckstedt experiment
with a homogeneous group of schoolgirls and obtained a higher percentage of correct
judgments [Ellgring, 1970]. However, even the most accurate judgments, fixations at the
eyes, were still short of 50 percent accuracy. From 80 cm, the gaze targets were about
1.7° apart. If the acuity of gaze perception matched the Snellen visual acuity, we would
expect a higher percentage of correct responses. Perhaps the observers were able to
precisely see the iris positions but were unable to precisely judge the gaze direction from
the iris positions.
Researchers also found two systematic errors in the perception of gaze. First, if the
looker’s head is rotated away from the observer, the observer tends to underestimate the
angle of this rotation [Anstis et al., 1969; Cline, 1967; Gibson and Pick, 1963]. For
example, if the looker aims his head toward the observer’s left, more eye contact is
perceived when the looker looks toward the observer’s left than when he actually looks
between the observer’s eyes. Second, at greater distance, observers tend to overestimate
eye contact [Knight et al., 1973; Stephenson and Rutter, 1970]. Lastly, Ellgring and
Cranach showed that the accuracy of gaze perception for gaze targets around the face
could be improved with practice; however, the perception of gaze aimed at the bridge of
the observer’s nose did not improve [Ellgring and Cranach, 1972].
5.1.2 Perceiving Eye Contact in a Videoconference
Bell Laboratories performed the first study on perceiving eye contact in a
videoconference during the design of the Mod II PicturePhone [Stokes, 1969]. They

46
found that the threshold of losing eye contact is 4.5º for looks to the side of the camera
and 5.5º for looks above or below the camera. Unfortunately only the results of their
study are known; it is unclear whether the decrease in the sensitivity of perceiving eye
contact from around 1º as found by [Cline, 1967; Gibson and Pick, 1963; Jaspers et al.,
1969] in the face-to-face condition to around 5º in their video condition is caused by the
video medium. The actual visual angle between the PicturePhone camera and the
expected eyes on the display is 5.8º. The PicturePhone team also found that people like
to view the other party’s eyes 40% down from the top edge of the display; thus, the
camera should be placed above the display.
The claim that the camera should be placed above the display was challenged by
Stapley [Stapley, 1972]. Stapley mounted a line of miniature light bulbs on a camera at a
spacing of 2.5 cm. The looker, while 1 m from the camera, was instructed to look into
the camera or the lighted bulb. An observer judged eye contact while viewing the looker
on a monitor from a distance of 1 m. Stapley found that the camera should be placed 1.4º
to the right and 1.4º below the display. However, he reassigned the looker to be the
observer in each experiment, which meant that the observer knew the expected
percentage of eye contact. White has shown that eye contact judgments can be shaped by
the experimenter’s bias [White et al., 1970].
In contrast to the PicturePhone team and Stapley, who asked the observers to judge
whether they felt eye contact, Anstis et al. asked their observers to judge where the looker
was looking [Anstis et al., 1969]. They found little difference between the face-to-face
medium and the video medium. In both, the observers’ eye contact sensitivity was high.
They also found no significant asymmetry in acuity regarding the different gaze
directions.
The common belief that we can precisely judge the direction of another person’s gaze
is generally confirmed by the findings of classic gaze experiments; however, the exact
precision can be further refined: one degree [Anstis et al., 1969; Cline, 1967; Gibson and
Pick, 1963; Jaspers et al., 1969; Stapley, 1972] vs. a few degrees [Ellgring, 1970; Kruger
and Huckstedt, 1969; Stokes, 1969]. The classic findings also suggest that the sensitivity
to eye contact is roughly symmetric in that there is no one direction that is significantly
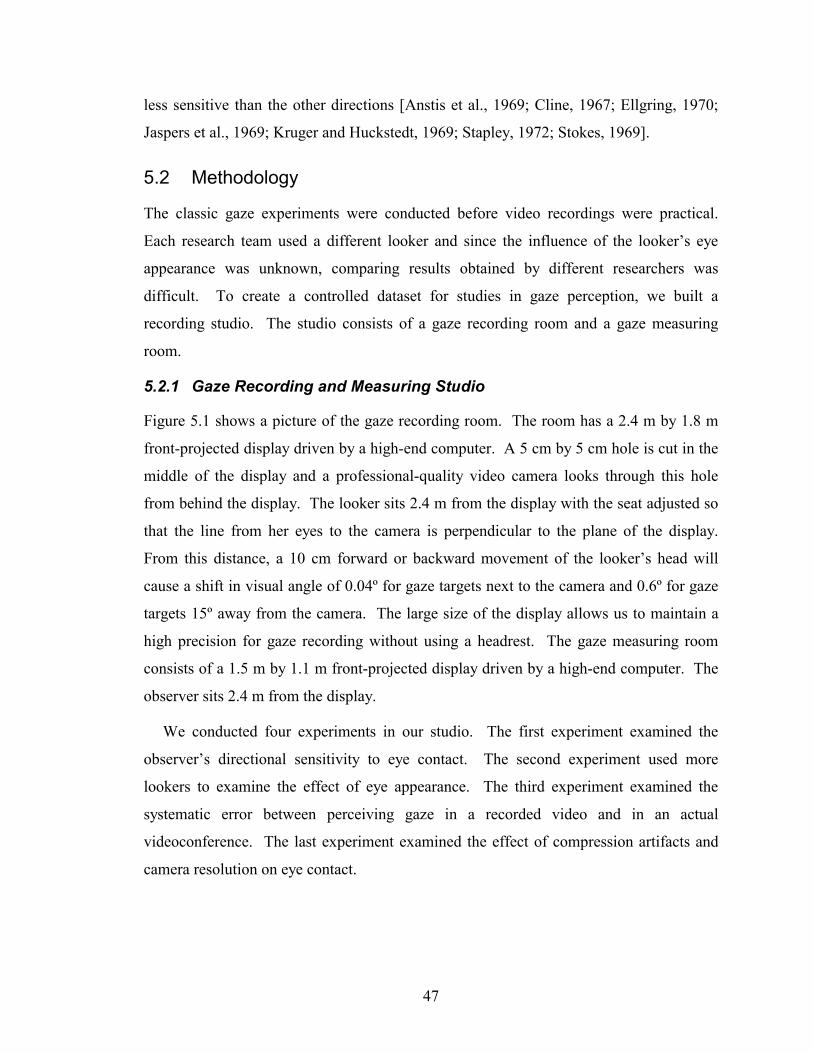
47
less sensitive than the other directions [Anstis et al., 1969; Cline, 1967; Ellgring, 1970;
Jaspers et al., 1969; Kruger and Huckstedt, 1969; Stapley, 1972; Stokes, 1969].
5.2 Methodology
The classic gaze experiments were conducted before video recordings were practical.
Each research team used a different looker and since the influence of the looker’s eye
appearance was unknown, comparing results obtained by different researchers was
difficult. To create a controlled dataset for studies in gaze perception, we built a
recording studio. The studio consists of a gaze recording room and a gaze measuring
room.
5.2.1 Gaze Recording and Measuring Studio
Figure 5.1 shows a picture of the gaze recording room. The room has a 2.4 m by 1.8 m
front-projected display driven by a high-end computer. A 5 cm by 5 cm hole is cut in the
middle of the display and a professional-quality video camera looks through this hole
from behind the display. The looker sits 2.4 m from the display with the seat adjusted so
that the line from her eyes to the camera is perpendicular to the plane of the display.
From this distance, a 10 cm forward or backward movement of the looker’s head will
cause a shift in visual angle of 0.04º for gaze targets next to the camera and 0.6º for gaze
targets 15º away from the camera. The large size of the display allows us to maintain a
high precision for gaze recording without using a headrest. The gaze measuring room
consists of a 1.5 m by 1.1 m front-projected display driven by a high-end computer. The
observer sits 2.4 m from the display.
We conducted four experiments in our studio. The first experiment examined the
observer’s directional sensitivity to eye contact. The second experiment used more
lookers to examine the effect of eye appearance. The third experiment examined the
systematic error between perceiving gaze in a recorded video and in an actual
videoconference. The last experiment examined the effect of compression artifacts and
camera resolution on eye contact.

48
Figure 5.1 The gaze recording room. The 2.4 by 1.8 m front-projected display has a small hole in the middle that allows a camera to be placed behind the display. The small picture on the display is the gaze target. Radiating in eight directions at an incremental step of 1º of visual angle, the dots on the display indicate the locations at which the gaze target can appear.
5.2.2 Experiment 1: Sensitivity to Gaze Direction
In this experiment, we recorded a male looker with dark brown eyes and wearing contact
lenses in the gaze recording room. A gaze target was shown on the display and the
looker was instructed to examine the gaze target. When the looker pressed a key, the
computer began to record a head-and-shoulders video of him. The recording stopped
after 3 seconds and the gaze target was shown at a new location to begin a new recording
cycle. A studio-quality videoconferencing light illuminated the looker. The videos were
recorded at 640x480 pixels per frame, 15 frames per second, and compressed using
MPEG-4. The videos were of sufficient quality for the observers to see the eyes of the
looker clearly.
The gaze target was a 5 cm by 5 cm image of a person’s face that was chosen to
minimize gaze fatigue. We used a small cross as the gaze target at first; however, lookers
had difficulty keeping their gaze focused for the duration of the recording and the
looker’s eyes sometimes diverged during the forced fixation.
The dots on the display in Figure 5.1 indicate the gaze target locations. The gaze
targets radiate in eight directions from the camera at an incremental step of 1º of visual

49
angle. The downward direction covers a range of 15º, and the other seven directions
cover a range of 5º. Fifty-one videos were recorded for this looker.
After the recording, we showed the videos to an observer in the gaze measuring room.
For each video, the observer was asked if the looker in the video was looking directly
into the observer’s eyes. Each video was looped until the observer responded. The
videos were shown in random order until each video had been shown three times.
Sixteen observers with 20/20 vision after correction participated in this experiment. The
observers were chosen from current students and recent graduates of Stanford University.
5.2.3 Experiment 2: Sensitivity to Eye Appearance
In this experiment, we recorded a male looker with light blue eyes and wearing contact
lenses, a female looker with dark brown eyes and wearing contact lenses, and a male
looker with dark brown eyes and wearing glasses under the same condition as in
Experiment 1.
We showed the videos of these three lookers to the sixteen observers in the first
experiment. The experimental procedure was the same as in the first experiment except
only videos where the lookers were looking below the camera were shown.
5.2.4 Experiment 3: Error Due to Recording
In this experiment, we linked the gaze recording and measuring room with live audio and
video. The gaze target was replaced by a live video of the observer, and the observer saw
a live video of the looker. The transmitted videos were of the same quality as those in the
first two experiments.
During the experiment, the looker and the observer engaged in casual conversation.
At random times, the looker would ask the observer if she thought that the looker was
looking into her eyes. As in the second experiment, only the gaze target at the camera
and the fifteen targets below the camera were used. The targets were displayed in

50
random order. The looker from the first experiment and the sixteen observers from the
previous two experiments participated in this study.
5.2.5 Experiment 4: Influence of Video Quality
In this last experiment, we repeated the third experiment with uncompressed video and
face-to-face conditions. For the uncompressed video case, everything was identical to the
third experiment except that analog uncompressed video instead of MPEG-4 compressed
video was used in linking the rooms.
For the face-to-face case, the looker sat 1 m from the observer. While looking at the
observer’s eyes, nose, mouth, chin, neck, or chest, the looker engaged in casual
conversation with the observer. At random times, the looker would ask the observer
about eye contact. At the end of this experiment, the distances between the feature points
on the observer and the observer’s eyes were measured. The looker and the observers
from the first experiment participated in this experiment. The order in which the
observers participated in each of the four experiments was randomized.
5.3 Results
Figure 5.2 shows the result of the first experiment, the sensitivity of eye contact with
respect to the direction in which gaze deviates from the camera. Notice that the observers
were very sensitive when the looker looks up, left, or to the right, but less sensitive when
the looker looks below the camera. For the up, left and right cases, the looker can look at
most 1º away from the camera before perception of eye contact is lost. However, for the
down case, observers were much less sensitive to eye contact.
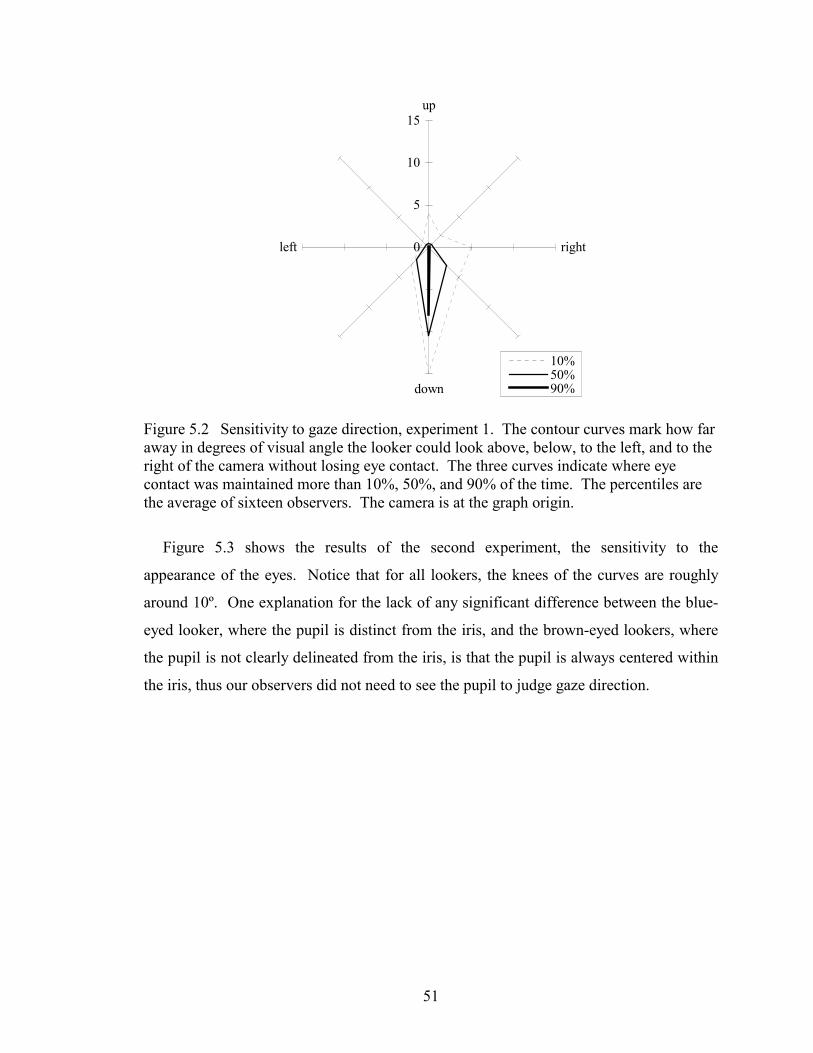
51
0
5
10
15up
right
down
left
10%50%90%
Figure 5.2 Sensitivity to gaze direction, experiment 1. The contour curves mark how far away in degrees of visual angle the looker could look above, below, to the left, and to the right of the camera without losing eye contact. The three curves indicate where eye contact was maintained more than 10%, 50%, and 90% of the time. The percentiles are the average of sixteen observers. The camera is at the graph origin.
Figure 5.3 shows the results of the second experiment, the sensitivity to the
appearance of the eyes. Notice that for all lookers, the knees of the curves are roughly
around 10º. One explanation for the lack of any significant difference between the blue-
eyed looker, where the pupil is distinct from the iris, and the brown-eyed lookers, where
the pupil is not clearly delineated from the iris, is that the pupil is always centered within
the iris, thus our observers did not need to see the pupil to judge gaze direction.

52
0
25
50
75
100
0 5 10 15visual angle (deg)
eye
cont
act (
%)
mBrComBlCofBrComBrGs
Figure 5.3 Sensitivity to eye appearance, experiment 2. The curves show the percentage of times that eye contact was perceived for four lookers looking in the down direction in Figure 5.2. The horizontal axis marks the visual angle in degrees that the looker looked below the camera. The four lookers were a male with dark brown eyes wearing contact lenses (mBrCo), a male with light blue eyes wearing contact lenses (mBlCo), a female with dark brown eyes wearing contact lenses (fBrCo), and a male with dark brown eyes wearing glasses (mBrGs). Each curve is the average of sixteen observers. The average standard deviation is roughly 30% for each looker.
Figure 5.4 shows the results of the third experiment, the difference between perceiving
eye contact in a recorded video and in an actual videoconference. Notice that when the
looker was seen in videoconferences, the observers were more likely to perceive eye
contact. This effect is especially pronounced around the critical angle where eye contact
is lost. One explanation for this phenomenon is that when the observers are not sure
whether the looker is looking at them, they will believe there is eye contact if they are
engaged in a conversation with the looker since people typically look into each other’s
eyes during face-to-face conversation.

53
0
25
50
75
100
0 5 10 15visual angle (deg)
eye
cont
act (
%)
recordedvideoconference
Figure 5.4 Error due to recording, experiment 3. The curves show the percentage of times that eye contact was perceived when the looker was recorded in advance or was live through videoconferencing. The horizontal axis marks the visual angle in degrees that the looker looked below the camera. Each curve is the average of sixteen observers. The average standard deviations are 31% for recorded and 17% for videoconferencing.
Figure 5.5 shows the results of the fourth experiment, the influence of video quality.
Notice that high quality compression seems to achieve roughly the same results as
uncompressed video; however, the observers were more sensitive in the face-to-face
medium. The difference between the face-to-face and videoconference conditions could
be due to viewing distance, 1 m for face-to-face and 2.4 m for videoconference. When
the observer is far from the looker, the observer tends to overestimate eye contact [Knight
et al., 1973; Stephenson and Rutter, 1970]; however, we have scaled the video size to
match the viewing distance. Another possible explanation is that the limited resolution of
the camera and the video capture board limited the observer’s sensitivity to eye contact.

54
0
25
50
75
100
0 5 10 15visual angle (deg)
eye
cont
act (
%)
mpeguncompf2f
Figure 5.5 Influence of video quality, experiment 4. The curves show the percentage of times that eye contact was perceived when the looker and observer were in visual conference. The three conditions are videoconferencing with MPEG-4 compressed video, videoconference with uncompressed analog video, and face-to-face conference. The horizontal axis marks the visual angle in degrees that the looker looked below the camera or the eyes of the observer. Each curve is the average of sixteen observers. The average standard deviation is 22% for the face-to-face conference.
5.4 The Nature of Eye Contact
The claim that our sensitivity in perceiving eye contact is lower when a looker’s eyes are
looking downward than in other directions may be explained by the characteristics of our
anatomy. When a looker looks to the left or right of the camera, his eyeballs rotate
within the eye socket, which causes a noticeable change in the position of the iris within
the sclera, the whites of the eyes. When the looker looks above the camera, the rotations
of his eyes again causes a noticeable change in the position of iris within the sclera: his
upper eyelids track the iris position while his lower eyelids remain stationary. When the
looker looks below the camera, both his upper and lower eyelids track the iris position,
thus there is not a very noticeable change in the position of the iris with respect to the
sclera. We have observed this characteristic of anatomy in our lookers. This
characteristic was also noticed by [Stapley, 1972].
An intriguing observation in both the Gibson and Pick experiment and in our
experiment 2 is that even when the looker looks directly into the observer’s eyes or the
camera, the observers do not perceive eye contact 100 percent of the time. The reported

55
eye contact is 84 percent in Gibson and Pick and roughly 90 percent in our study. We
viewed the videos of our lookers frame-by-frame and found that for a significant number
of frames, the looker’s eyes do not appear to be optically balanced, that is, the eyes do not
appear to focus at the same point in space. This is rather surprising since all of our
lookers appeared to have optically balanced eyes during an initial face-to-face eye
inspection.
We examined the pictures of people in popular magazines who at first glance were
looking at us. Much to our surprise, a number of them did not appear to have optically
balanced eyes upon close inspection. A good way to see this is to cover up one of the
eyes in the picture to judge where it is pointing, repeat the procedure for the other eye,
and finally judge both eyes together. After a minute or so of repeating this cycle, we
sometimes perceive that the eyes do not converge.
It is possible that our lookers’ eyes are optically balanced; however, when they are forced
into the unnatural task of staring at a fixed target, their eyes become diverged. We
hypothesize that the resulting slight optical imbalance of a looker’s eyes is the reason
why looking into the camera does not always result in eye contact. We further
hypothesize that judging gaze direction is a time-consuming effort and the to-be-judged
eyes tend to be constantly in motion. Thus, we typically are unable to see the optical
imbalance.
5.4.1 The Snap to Contact Theory
The perception of eye contact and the more general task of judging gaze direction have
often been framed as a spatial perception task. The spatial perception model, as
described in the influential work of Gibson and Pick [Gibson and Pick, 1963], states that
an observer estimates a looker’s head orientation and eye position within the face;
together, this allows the determination of an absolute gaze direction. This model implies
that the percentage of perceived eye contact can be approximated by a normal
distribution, where the standard deviation can be used to indicate the just noticeable
deviation of the looker’s gaze from the observer’s eyes. Gibson and Pick’s data do
support the spatial perception model: their data roughly followed a bell-shaped curve;

56
however, their study only measured a looker who looked to the left and right of an
observer’s eyes.
To explain our findings when the looker looks below the camera, when the looker
engages in conversation with the observer, and when the viewing condition is changed
from videoconference to face-to-face, we extend the spatial perception model to account
for the observer’s expectation. Figure 5.6 illustrates this idea and we call it the Snap to
Contact theory. The theory assumes that people cannot always judge gaze direction
accurately and they will bias their perception toward contact unless they are certain that
the looker is not looking at them. If the looker looks below the camera, the resulting
change in appearance is less pronounced than if the looker were looking in other
directions, thus more eye contact will be perceived in the down direction, as shown in
Figure 5.2. If the observer is conversing with the looker, the looker is expected to engage
in eye contact, thus more eye contact will be perceived, as shown in Figure 5.4. If the
viewing condition changes from face-to-face to videoconference, the limited resolution of
the conference system will make judging gaze direction more difficult, thus more eye
contact will be perceived, as shown in Figure 5.5.
0
100
0 15visual angle (deg)
eye
cont
act (
%) Spatial Perception
Snap to Contact
Figure 5.6 The Snap to Contact theory. The Spatial Perception curve illustrates the classic model for eye contact: the percentage of perceived eye contact can be approximated by a normal distribution. The Snap to Contact curve illustrates the theory that observers are prone to perceive eye contact. The critical angle at which eye contact is lost is influenced by the observer’s expectations and viewing conditions.

57
5.5 Requirement for Eye Contact
Our experimental results suggest the precision requirements for camera positioning in a
video communication system and simple improvements. Because our sensitivity in the
downward direction is lower than in other directions, the camera should be placed above
the display to support eye contact. Figure 5.3 suggests that a conservative solution is to
make the visual angle between the camera and the eyes rendered on the display less than
5º.
For a hand-held device such as a PDA or cell phone, assuming a 1 foot viewing
distance, 5º translates to a maximum distance of 1 inch between the camera and the
rendered eyes. For a desktop monitor-based communication system, and assuming a 3
foot viewing distance, 5º translates to a maximum distance of 3 inches between the
camera and the rendered eyes. For an 8-foot wall size display, and assuming an 8 foot
viewing distance, 5º translates to a maximum distance of 8 inches between the camera
and the rendered eyes. These suggested design parameters appear to be achievable using
commodity parts. As a demonstration, we pieced together commodity components to
meet the just described design parameters in a desktop communication system.
Figure 5.7 shows our prototype. A 640 by 480 video window is centered along the top
edge of a 20” monitor. The size of the window is 10 by 7 inches. The camera, a LogiTech
Pro 3000, is mounted so that the centerline of the lens is 1” from the top edge of the
monitor screen. Assuming the viewer’s head is 36” from the display, the vertical error in
gaze is less than 5º, below the experimentally verified threshold.
We asked eight subjects to converse with the looker from Experiment 1 using our
prototype. These subjects were different from the sixteen observers in our main
experiments. All eight of the subjects perceived eye contact; however, the looker did not
perceive eye contact in the case of one of the subjects: he appeared to be looking down.
This subject’s upper right eyelid droops a little, making him appear to look slightly
downward even face to face. While our prototype seems to demonstrate that a simple
modification of current systems would allow most people to perceive eye contact, many
more lookers should be tested to validate this claim.

58
Figure 5.7 Desktop videoconference prototype. We constructed a mechanical camera holder for supporting eye contact in a desktop video communication system.
The experiments in this paper were designed to minimize subject fatigue;
consequently, the number of sample points is limited. We plan to measure a significantly
larger number of subjects in order to expose the shortcomings of our results.

59
“I have been teaching blind for 10 years, [with the Video Auditorium] I saw my students smile” - Prof. Renate Fruchter Chapter 6 Design of a Video Auditorium
The previous three chapters each examined a specific aspect of video-mediated
communication. In this chapter, we describe the implementation of a complete system
that served as the test bed for the presented ideas. In addition, we will motivate our
implementation with the task of remote teaching.
Teaching is an inexact art. Since the days of Socratic dialogs, most educators have
believed that learning is most efficient when the instruction is tailored to the students’
current understandings [Bransford et al., 2000]. In a classroom, students can display
verbal and visual cues to indicate their state of comprehension. Teachers learn to alter
the path of instruction when looks of puzzlement, boredom, or excitement are observed.
As P.W. Jackson elegantly said, “Stray thoughts, sudden insights, meandering digressions
and other unpredicted events constantly ruffle the smoothness of the instructional dialog.
In most classrooms, as every teacher knows, the path of educational progress could be
more easily traced by a butterfly than by a bullet” [Jackson, 1967].
Currently, the most popular synchronous distance learning method is a broadcast
video lecture with an audio back channel [Rowe, 2000]. These systems, such as the
Stanford Instruction Television Network (SITN), allow remote students to see and hear
the instructor, but the instructor and other students can only hear the remote students.
Chapter 2 describes a study that shows that there is little classroom interaction with the
remote students in these SITN classrooms.

60
Some studies suggest that adding video to an audio link does not significantly alter the
surface structure of communication or the task outcomes [Noll, 1992; Ochsman and
Chapanis, 1974; Sellen, 1995]; however, these studies did not include the task of teaching
and learning. We hypothesize that dialog-based distance teaching is possible if we allow
the instructor to see the remote students and the remote students to see each other. We
designed and implemented a Video Auditorium to test this hypothesis.
The Video Auditorium allows dozens of students to take a class from different
locations. Each student requires a web camera and a high-speed computer network
connection. Students can see the instructor and other students in a video grid on their
computers. The instructor can see the students projected near life-size on a tiled wall-size
display. The instructor can also establish eye contact and direct his gestures to any one
student, a group of students, or the entire class.
We begin by describing previous work in the next section. The auditorium
environment is described in Section 6.2. The software architecture is described in
Section 6.3. Section 6.3 also describes an interface that allows a single pointing device to
move videos anywhere on the display wall without regard to computer boundaries.
6.1 Previous Work
Despite enormous development efforts in videoconferencing, it remains a challenge to
link dozens of people when each person is in a different location. Commercial systems
typically can show four sites through picture-in-picture or connect with a larger number
of sites through voice-activated switching [Buxton, et al., 1997]. The picture-in-picture
approach merges all videos into a single video at a multipoint control unit (MCU); thus,
participants can see each other, but each person is transmitted at a reduced resolution. In
voice-activated switching, all videos are streamed to the MCU; the MCU then transmits
the videos such that the current speaker sees the previous speaker and other people see
the current speaker. The inability to choose whom to see has been observed to be
unpleasant [Sellen, 1995]. An advantage of the MCU is that the bandwidth and
processing required for each participant does not increase as the number of participants
increases; however, the processing requirement of the MCU makes it difficult to build.

61
A system that does not use a MCU is the Mbone conferencing tools [MBONE].
Audio and video are multicast; thus, in theory, very large-scale conferences are possible.
A recent application of the Mbone tools is the AccessGrid, where each node is a room
that can accommodate 3 to 20 people [AccessGrid]. Each node has a wall-size display
illuminated by up to six projectors; however, the single computer that drives the six
projectors is a potential bottleneck. To avoid this bottleneck, we use multiple computers
to drive a multi-projector display. Our AV capture hardware is selected from the
AccessGrid specification, which greatly accelerated our effort.
Three projects, Forum, Flatland, and TELEP, studied the usage pattern of conference
technology. The Forum system broadcasted the instructor’s audio and video to all
students, and a student’s audio was broadcast when he pressed a button [Isaacs et al.,
1995]. The Forum team found that instructors preferred to see students and that the
press-button-to-talk usage model did not support instantaneous feedback such as laughter
and applause. To support spontaneous feedback, we use high-end echo cancellation
hardware and microphone headsets so that all microphones can be open at all times.
The Flatland project team studied how users adapted to alternative interaction models
over time when the remote students could not send audio or video [White et al., 2000].
They presented encouraging data showing that people could adapt to non-face-to-face
interaction models; however, like Forum, they reported that instructors missed the verbal
and visual feedback of a face-to-face classroom.
The TELEP project studied the effect of allowing the instructor to see the remote
students [Jancke et al., 2000]. TELEP could display up to 38 headshots of remote
students on a large screen to the instructor. One drawback of TELEP was that its
streaming engine introduced a 10 to 15 second delay before the audio and video were
presented to the remote audience. Round-trip audio delays exceeding 200 milliseconds
are noticeable [Riez and Klemmer, 1963] and excessive audio delay can make a
conferencing system difficult to use [Kraut and Fish, 1997]. Our system supports low
latency audio and video streaming.

62
6.2 Auditorium Environment
A Video Auditorium consists of an instructor node and up to a few dozen student nodes.
The instructor node consists of a wall-sized display powered by a cluster of computers.
Each student node consists of a Pentium III or faster PC. High-speed computer networks
connect all nodes.
The conceptual usage model of the Video Auditorium is that all participants can be
seen and heard with minimal latency at all times. Unlike voice-activated switching, the
Video Auditorium lets the user decide at whom to look. Unlike SITN and FORUM
[Isaacs et al., 1995], the Video Auditorium does not require a student to explicitly request
the audio channel before he can be heard. Our observations of SITN classrooms as well
as the findings of [Isaacs et al., 1995; White et al., 2000] suggests that keeping all
channels open all the time is essential in creating spontaneous and lively dialogs.
The instructor node can also accommodate local students. The local students would
be seated in front of the display wall such that the remote students appear as an extension
of the local students. A complication of having local students is that the conceptual usage
model of one camera capturing one person may be broken, thus potentially causing
difficulties in interaction between the remote and local students.
6.2.1 Display Wall
The instructor can see the remote students on the display wall shown in Figure 6.1. The
instructor can sit behind the control panel shown in Figure 6.2 or walk around in front of
the display wall. Figure 6.3 shows the layout of the display wall and control panel in the
auditorium.
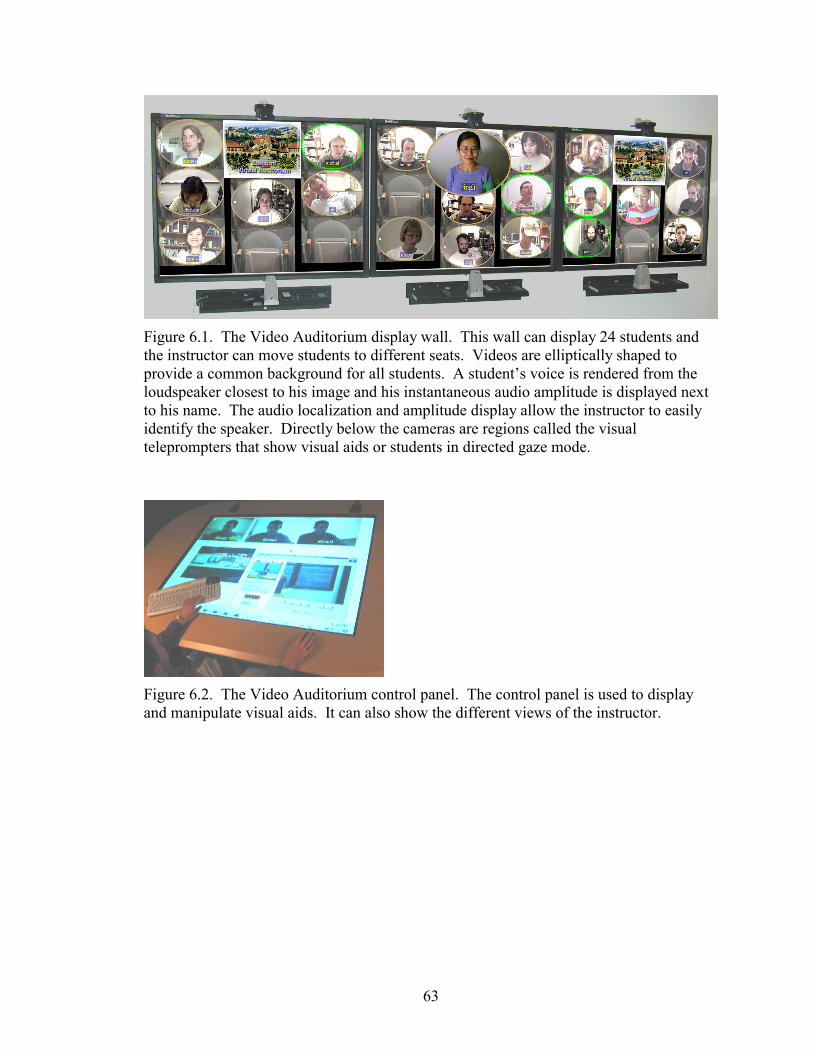
63
Figure 6.1. The Video Auditorium display wall. This wall can display 24 students and the instructor can move students to different seats. Videos are elliptically shaped to provide a common background for all students. A student’s voice is rendered from the loudspeaker closest to his image and his instantaneous audio amplitude is displayed next to his name. The audio localization and amplitude display allow the instructor to easily identify the speaker. Directly below the cameras are regions called the visual teleprompters that show visual aids or students in directed gaze mode.
Figure 6.2. The Video Auditorium control panel. The control panel is used to display and manipulate visual aids. It can also show the different views of the instructor.

64
omni-directional microphone
wireless mouse and keyboard
control panel
instructor chair
pan-tilt camera
mono speaker
displaywall
XGA projectormirror
omni-directional microphone
wireless mouse and keyboard
control panel
instructor chair
pan-tilt camera
mono speaker
displaywall
XGA projectormirror
Figure 6.3. A top view diagram of the Video Auditorium. The display wall consists of three rear-projected displays spanning a total of 15 by 4 feet. The projectors point upward and mirrors are used to fold the 7-foot throw distance into the 4-foot deep space behind the display wall. The control panel is a 4 by 3 feet table illuminated from below. The instructor chair is 10 feet from the display wall. Mono loudspeakers are used to enhance sound localization. An echo cancellation mixer frees the instructor from wearing a headset during class. The auditorium walls are soundproofed and the ventilation system is tuned to decrease the ambient sound level.
Figure 6.4. Screen shot of the Video Auditorium student interface.
The display wall allows the instructor to see the remote students at roughly life size.
Three rear-projected displays are tiled to form the 15 by 4 foot display wall. The wall is
divided into a grid of seats where students can appear. The instructor can alter the

65
seating arrangement by dragging the student’s video to any empty seat using a wireless
mouse.
The display wall audio system allows the instructor to easily locate the speaking
student. Each of the three sections of the display wall has a loudspeaker and students
displayed on the same section share the same loudspeaker. Since students displayed on
different sections of the display wall use different loudspeakers, the instructor can locate
the general direction of the speaking student from the location of the loudspeaker. Each
student’s instantaneous audio volume is displayed next to his or her name to enhance the
visual signal of lip movement; thus, allowing the instructor to easily locate the speaking
student from within each sections of the display wall.
From the control panel, the instructor can share visual aids with the students. The
control panel runs a custom viewer for Microsoft PowerPoint, Excel, and Word that we
wrote. A down-sampled version of the visual aids also appears at the visual
teleprompters. Mouse and keyboard middleware links the control panel and the three
sections of the display wall into a single sheet [Johanson et al., 2002], thus allowing a
single mouse and keyboard to move seamlessly across the displays.
6.2.2 Eye Contact with Directed Gaze
The instructor can establish eye contact with any one student, a group of students, or the
entire class using a technique called directed gaze. Three cameras with pan, tilt, and
zoom capability are mounted above the display wall. Figure 6.5 shows the three views of
an instructor from these cameras. Below each camera is a region of the display wall
called the visual teleprompter. The angle between a camera and its visual teleprompter is
minimized, as suggested in Chapter 5, such that the instructor can establish eye contact
with the student displayed at the visual teleprompter.
When the instructor is lecturing, only visual aids are shown at the visual teleprompter.
Each student sees the instructor from the camera closest to the location that he occupies
on the display wall; therefore, when the instructor looks at the visual teleprompter, the
instructor is making eye contact with all of the students rendered on that section of the
display wall.

66
looking into the middle camera
looking at the middle camera’s visual teleprompter
looking at the student directly above the middle loudspeaker
from left camera from middle camera from right camera
Figure 6.5. Illustration of Directed Gaze. The pictures are laid out on a grid where the horizontal axis indicates the camera used to take the picture and the vertical axis indicates where the instructor was looking. Notice that from the middle camera, looking into the camera is indistinguishable from looking at the visual teleprompter. The figure also shows that students looking from the left and right cameras can see that the instructor is looking at someone else.
When a student is speaking, his video is enlarged and displayed at the closest visual
teleprompter. At the same time, all the other students sharing that display begin viewing
the instructor from one of the other two cameras; therefore, when the instructor looks at
the student displayed at the visual teleprompter, the instructor is making eye contact with
only this student. The instructor can also manually place a student at the visual
teleprompter by double clicking on that student’s video; thus, allowing him to establish
eye contact with a currently silent student. Directed gaze can also be used to direct
gestures to a target student.

67
A disadvantage of directed gaze is that the conceptual usage model is different from a
face-to-face environment. In a face-to-face classroom, the instructor can establish eye
contact with any student by looking at that student; however, in the Video Auditorium,
the instructor must select a student first before eye contact can be established with a silent
student. An advantage of directed gaze is that only two cameras are required to allow eye
contact with any student independent of the class size.
6.2.3 Student Interface
Students attend the class in front of their computers equipped with Universal Serial Bus
or other inexpensive cameras. Students are also required to wear microphone headsets
unless local echo cancellation devices are available. Figure 6.4 shows a screen shot of a
student’s monitor. Note that the instructor is not framed differently from the students to
encourage student discussions. The instructor can also choose a lecture centric layout for
the students’ monitors, where only him or her and the visual aids are shown. A student
can request to speak by raising his hand, as described in Chapter 3.
6.3 Software Implementation
Videoconferencing with a large number of students is difficult due to the communication
and computation requirements. Linking 20 students using a NetMeeting-grade
compression scheme could require the network to sustain up to 200Mbps, a requirement
that can challenge even networks such as Internet 2. One approach to lowering the
bandwidth requirement is to use a more efficient codec. Section 6.3.1 describes one such
system based on MPEG-4 and Windows Media.
A single PC currently cannot decompress a large number of high quality video
streams. One solution is to use multiple computers and piece together the computer
outputs into a single display. Such a parallel-decoding system is easier to use if a
seamless user interface can span all the computers driving the display. The interface
should allow a single pointing device to move videos to anywhere on the display without
regard to computer boundaries. Section 6.3.5 describes one such interface based on
stream migration.

68
Significant effort is usually required to retrofit an existing conference system to use a
newer codec or better transport mechanism. Section 6.3.1 describes a modular
architecture based on Microsoft’s DirectShow that allows streaming components to be
upgraded with minimal programming effort. This architecture also allows for rapid
prototyping.
Noticeable audio delay can make spontaneous and lively communication difficult;
thus, the total system delay must be comparable to that of the telephone. Current
commercial systems typically cannot stream television quality video and it is unclear
what level of video quality is required for a remote classroom. Nevertheless, our
implementation should allow streaming of television quality video to support user studies
on video quality. In order of importance, our design goals are:
• Telephone quality audio and television quality video
• Lower bandwidth requirement than the current commercial conferencing systems
• Seamless user interface that hides the machine boundaries of a multi-computer
display wall
• Modular architecture for component upgrade and rapid prototyping
6.3.1 Modular AV Streaming
Our implementation uses Microsoft DirectShow. DirectShow specifies language-
independent interfaces for multimedia software and hardware components, also known as
filters. DirectShow also provides a framework for controlling filters, which form directed
graphs. Data originates from source filters such as video capture, flows through
transform filters such as compression codecs, and is consumed by sink filters such as
video renderers. Filters negotiate with each other on a common media format and the
DirectShow framework automatically inserts format converters if required. A
disadvantage of DirectShow is that unlike previous systems with similar characteristics
[McCanne et al., 1997], it requires the Microsoft Windows operating system. An
advantage of DirectShow is that numerous commodity filters are available.
Figure 6.6 shows the Video Auditorium filter graphs. We implemented all the filters
shown except the video compression and decompression filters. Commodity filters were
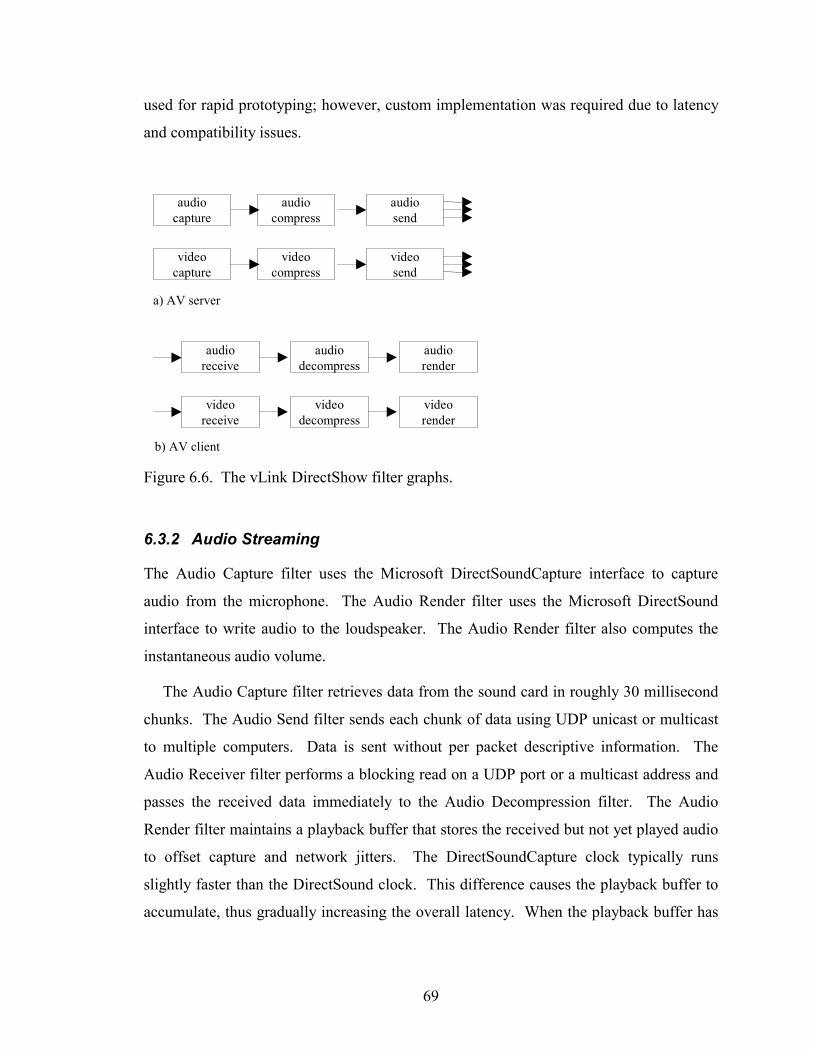
69
used for rapid prototyping; however, custom implementation was required due to latency
and compatibility issues.
audiocapture
audiocompress
audiosend
audioreceive
audiodecompress
audiorender
videocapture
videocompress
videosend
videoreceive
videodecompress
videorender
a) AV server
b) AV client Figure 6.6. The vLink DirectShow filter graphs.
6.3.2 Audio Streaming
The Audio Capture filter uses the Microsoft DirectSoundCapture interface to capture
audio from the microphone. The Audio Render filter uses the Microsoft DirectSound
interface to write audio to the loudspeaker. The Audio Render filter also computes the
instantaneous audio volume.
The Audio Capture filter retrieves data from the sound card in roughly 30 millisecond
chunks. The Audio Send filter sends each chunk of data using UDP unicast or multicast
to multiple computers. Data is sent without per packet descriptive information. The
Audio Receiver filter performs a blocking read on a UDP port or a multicast address and
passes the received data immediately to the Audio Decompression filter. The Audio
Render filter maintains a playback buffer that stores the received but not yet played audio
to offset capture and network jitters. The DirectSoundCapture clock typically runs
slightly faster than the DirectSound clock. This difference causes the playback buffer to
accumulate, thus gradually increasing the overall latency. When the playback buffer has

70
accumulated 200 milliseconds of audio, we clip the playback buffer to 60 milliseconds.
These two parameters were empirically tested to yield good sound quality.
The overall audio latency is comparable to that of the telephone. Audio Capture
incurs roughly 60 milliseconds of latency, a limitation of DirectSoundCapture. Audio
Compression, using the TrueSpeech 8.5 codec, incurs a few milliseconds of latency.
Audio Render incurs another 60 milliseconds of latency in the playback buffer. Network
delay is typically 10 to 20 milliseconds. Audio and video are synchronized during
playback as described in Chapter 4. The processor utilization for audio processing is
negligible on a modern PC.
6.3.3 Video Streaming
The Video Capture filter can capture video from any video capture card or camera that
supports the Video-For-Windows or the Windows-Driver-Model interface. The Video
Render filter can use Microsoft’s GDI or DirectDraw to render video to an arbitrarily
shaped window. It also exposes an interface for annotating video with the student name
and audio volume.
The Video Send filter can use UDP unicast or multicast to stream raw video data to
nodes with different bandwidth requirements. Compressed video frames larger than the
maximum UDP packet size are divided into multiple packets. A packet descriptor is
attached to the end of each network packet. Attaching the descriptor to the tail, rather
than the head, of each packet allows the buffer allocated for compression to be used to
construct the network packet, thus saving a memory copy. The descriptor contains the
media sample time, sequence number, and DirectShow specific sample information.
The filter graph in Figure 6.6 can use a different compression and decompression
scheme by changing the Video Compression and Decompression filters. This is the only
change necessary since the Video Send and Video Receiver filters can accept any
compression format and the Video Render filter accepts uncompressed video frames. We
have evaluated Microsoft MPEG-4, Intel H263, Intel wavelet, PICVideo Motion-JPEG,
and PICVideo Lossless-JPEG. At approximately the same visual quality, Microsoft
MPEG-4 has the lowest data rate at roughly 100Kbps for a 320x240x15fps video; this is
roughly half the bandwidth requirement of Microsoft NetMeeting.
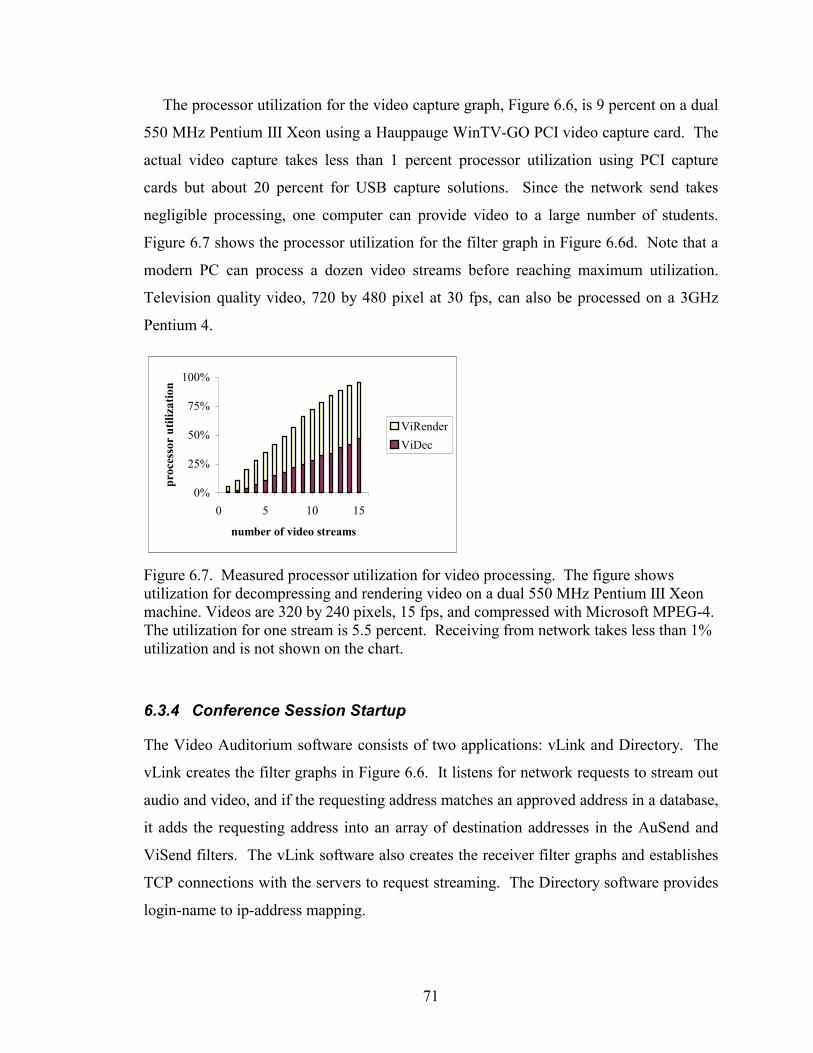
71
The processor utilization for the video capture graph, Figure 6.6, is 9 percent on a dual
550 MHz Pentium III Xeon using a Hauppauge WinTV-GO PCI video capture card. The
actual video capture takes less than 1 percent processor utilization using PCI capture
cards but about 20 percent for USB capture solutions. Since the network send takes
negligible processing, one computer can provide video to a large number of students.
Figure 6.7 shows the processor utilization for the filter graph in Figure 6.6d. Note that a
modern PC can process a dozen video streams before reaching maximum utilization.
Television quality video, 720 by 480 pixel at 30 fps, can also be processed on a 3GHz
Pentium 4.
0%
25%
50%
75%
100%
0 5 10 15
number of video streams
proc
esso
r ut
iliza
tion
ViRenderViDec
Figure 6.7. Measured processor utilization for video processing. The figure shows utilization for decompressing and rendering video on a dual 550 MHz Pentium III Xeon machine. Videos are 320 by 240 pixels, 15 fps, and compressed with Microsoft MPEG-4. The utilization for one stream is 5.5 percent. Receiving from network takes less than 1% utilization and is not shown on the chart.
6.3.4 Conference Session Startup
The Video Auditorium software consists of two applications: vLink and Directory. The
vLink creates the filter graphs in Figure 6.6. It listens for network requests to stream out
audio and video, and if the requesting address matches an approved address in a database,
it adds the requesting address into an array of destination addresses in the AuSend and
ViSend filters. The vLink software also creates the receiver filter graphs and establishes
TCP connections with the servers to request streaming. The Directory software provides
login-name to ip-address mapping.

72
The Video Auditorium software can be started from Internet Explorer using an
ActiveX web page that contains a text box and connect button. After entering the name
of the computer to be connected in the text box and pressing the connect button, ActiveX
downloads the required DirectShow filters and applications, registers the filters with the
operating system, and launches the vLink applications. This process can be repeated to
connect additional people, or alternatively, a class name can be entered to connect to a
group of people. An advantage of this startup procedure is that an explicit software
install is not required to use the Video Auditorium.
6.3.5 Hiding Machine Boundaries
Figure 6.7 showed that it is difficult to decode a large number of video streams using a
single computer, thus parallel decoding is necessary to show a large number of videos.
Such a parallel-decoding system is more usable if a seamless user interface can span all
the computers driving the display; specifically, the user should be allowed to use a single
pointing device to drag video windows across computer boundaries.
To allow a single pointing device, a mouse in our case, to control the multiple
computers driving a display wall, all computers run a mouse server [Johanson et al.,
2001]. The mouse is physically connected to another computer that intercepts all mouse
events, maps the mouse coordinates to the corresponding point on the display wall, and
passes the events to the computer driving that section of the display wall. The mouse
servers listen for mouse events and insert the received events into the Windows Message
Queue.
To allow dragging of vLink video windows between computers, all computers driving
the display wall run a remote execute server. When more than half of a vLink window
crosses a screen boundary, it calls the remote execution server to launch a vLink on the
next screen and closes itself. The new vLink uses the arguments of the parent vLink to
reestablish connections with the servers; thus, the instructor will see and hear the moved
student from the new screen. The physical relationship between the computers driving
the different sections of the display wall is stored in a database.

73
The migration process takes about one second to complete. The vLink that started the
migration process waits until the new vLink is running before exiting; this delay prevents
the moved student from disappearing from the display wall during the migration process.
6.4 Pilot Class Evaluation
Civil Engineering 222, Computer Integrated Architecture, Engineering, and Construction,
used the Video Auditorium software every Friday for 4 hours from January to April of
2003. Besides local students in Stanford, there were students in Sweden, Germany,
Slovenia, Kansas State, Georgia Tech, and UC Berkeley. The remote students were
projected on the sidewall of an experimental classroom. This class has been taught Prof.
Fruchter every year since 1993. Previously, telephone and NetMeeting were used to
connect the remote students to Stanford.
Chapter 2 reported that in a Stanford Online classroom where the instructor cannot see
the remote students, there is little interaction with the remote students. Based on Prof.
Fruchter’s 10-year experience teaching ce222, she agrees that interaction is difficult when
the students are not seen. After the first class session using the Video Auditorium, Prof.
Fruchter exclaimed “I saw my students smile.” We sat in about one third of the class
sessions and observed that there is little difference between the interactions between local
and remote student. Prof. Fruchter reported that she was able to interact effectively with
the remote students. Further, remote students took advantage of their camera to make
jokes. In one session, a student in Sweden pointed the camera at his dog during the
beginning of the class and caused the other students to laugh. In another, a student in
Germany made a series of funny gestures to the other students.
The remote students reported that the Video Auditorium was easy to install. In
addition, the use of a class web page, Figure 6.8, to launch the software made attending
the class every Friday a simple procedure. The students need to click one button to login,
and one button to see each remote site. Prof. Fruchter plans to use the Video Auditorium
in her future classes and believes the software to be a valuable teaching medium.

74
Figure 6.8. The pilot class web page for launching the Video Auditorium.
6.5 Future improvements
The Video Auditorium software was robust and never crashed during the 4-month pilot
class. However, a student in Georgia Tech had problems installing the software due to
the lack of administrator permissions on his school computer. A student in Sweden had
problems connecting to Stanford when he accidentally used HTTP rather than secure
HTTP to load the Video Auditorium. Video Auditorium currently requires secure HTTP.
Due to a programming bug, the Video Auditorium will fail to load if it is initially loaded
using HTTP even if secure HTTP is used afterwards. We are currently working on a fix.
Students were generally satisfied with the video quality; however, the student in
Slovenia had a poor network connection and the video was quite poor. In addition, vLink

75
currently does not give audio priority over video, and video streaming can hurt the audio
quality. We are currently re-implementing the streaming engine to guarantee that
streaming video will not harm audio quality.
The Video Auditorium Directory was also a point of possible failure. This Directory
is currently hosted on a single computer. When the computer network connecting this
computer is down, no directory is available for translating the login name to ip address
mapping. During past few months, the computer network was down several times;
however, we were lucky that the network down times did not overlap with the pilot class.
We are currently implementing a redundant directory mechanism to eliminate this single
point of failure.

76
Chapter 7 Conclusions
In this dissertation, we have described empirical findings and novel algorithms for
conveying floor control gestures, lip movements, and eye contact over a video medium.
In addition, we have described a video conferencing system called the Video Auditorium
and the classroom observation study that motivated this research. We will review our
contributions and describe directions for future work.
In Chapter 2, we reported the finding that there is essentially no interaction with the
remote students in a Stanford Online classroom that does not allow the instructor to see
the remote students. In Chapter 3, we reported the finding that the average video frame
rate can be reduced to one frame every few seconds and still allow effective floor control
if hand movements are transmitted immediately; in addition, we described a variable
frame rate streaming method that leverages this finding. In Chapter 4, we reported the
finding that audio can temporarily lead video and still be perceived as synchronized if the
audio and video is brought into synchrony within a short period; in addition, we
described a low latency synchronization method that leverages this finding. In Chapter 5,
we reported the finding that the sensitivity to eye contact is asymmetric, in that we are
less sensitive to eye contact when people look below our eyes than when they look to the
left, right, or above our eyes; in addition, we described an eye contact method that
leverages this finding. In Chapter 6, we described the design and implementation of a
scalable video communication system for distance learning. In 6.4, we reported
anecdotal evidence based on a four-month pilot class suggesting that when the instructor
can see the remote students, the instructor is able to interact effectively with the remote
students.
We are currently conducting research on the visualization of classroom
communication patterns. In addition, we have just begun a research project to create a

77
distance-learning classroom that is more effective than a face-to-face real classroom. In
the long run, we would like to use brain imaging to evaluate the effectiveness of
communication systems.

78
Bibliography
[Abowd et al., 2000] G. Abowd, C. Atkeson, A. Feinstein, C. Hmelo, R. Kooper,
S. Long, N. Sawhney, and M. Tani. Teaching and Learning
as Multimedia Authoring: The Classroom 2000 Project.
Proceedings of ACM Multimedia, pages 187-198, 1996.
[Anderson, 1996] A. Anderson, A. Newlands, J. Mulin, A. Fleming, G.
Doherty-Sneddon, and J. Velden. Impact of Video-Mediated
Communication on Simulated Service Encounters.
Interacting with Computers, pages 193-206, 1996.
[Anstis et al., 1969] S. Anstis, J. Mayhew, and T. Morley. The Perception of
where a Face or Television ‘Portrait’ is Looking. American
Journal of Psychology, pages 474-489, 1969.
[Argyle and Cook, 1976] M. Argyle and M. Cook. Gaze and Mutual Gaze.
Cambridge University Press, 1976.
[Binnie, 1986] C. Binnie, A. Montgomery, and P. Jackson. Auditory and
Visual Contributions to the Perception of Selected English
Consonants for Normally Hearing and Hearing-impaired
Listeners. Visual and Audio-visual Perception of Speech,
volume 4, pages 181-209, 1986.
[Brady, 1971] P. Brady. Effects of Transmission Delay on Conversational
Behavior on Echo Free Telephone Circuits. Bell System
Journal, volume 49, pages 115-134, 1971.
[Bransford et al., 2000] J. Bransford, A. Brown, and R. Cocking.
How People Learn: Brain, Mind, Experience and School.
National Academy Press, 2000.
[Bruce, 1996] V. Bruce. The Role of the Face in Communication:
Implications for Videophone Design. Interacting with
Computers, pages 166-176, 1996.

79
[Bruce and Young, 1998] V. Bruce and A. Young. In the eye of the beholder: The
science of face perception. Oxford University Press, 1998.
[Buxton et al., 1997] W. Buxton. Living in Augmented Reality: Ubiquitous Media
and Reactive Environments. Video-Mediated
Communication (edited by K. Finn, A. Sellen, and S. Wilbur),
Lawrence Erlbaum Associates, pages 363-384, 1997.
[Buxton et al., 1997] W. Buxton, A. Sellen, and M. Sheasby. Interfaces for
Multiparty Videoconferences. Video-Mediated
Communication (edited by K. Finn, A. Sellen, and S. Wilbur),
Lawrence Erlbaum Associates, pages 385-400, 1997.
[Campbell and Dodd, 1980] R. Campbell and B. Dodd. Hearing by Eye. Quarterly
Journal of Experimental Psychology, Volume 32, pages 85-
99, 1980.
[Chen et al., 2000] C. Chen, M. Rouan, J. Edwards, and C. Moore. An
Exploratory Study on the Impact of Broadcast Courses at
Stanford University. Prepared for the Stanford Dean of
Engineering, 2000.
[Chen, 2001] M. Chen. Design of a Virtual Auditorium.
Proceedings of ACM Multimedia, pages 19-28, 2001.
[Chen, 2002a] M. Chen. Leveraging the Asymmetric Sensitivity of Eye
Contact for Videoconferencing. Proceedings of ACM
Conference on Human Factors and Computing Systems,
pages 49-56, 2002.
[Chen, 2002b] M. Chen. Achieving Effective Floor Control with a Low-
Bandwidth Gesture-Sensitive Videoconferencing System.
Proceedings of ACM Multimedia, pages 476-483, 2002.
[Chen, 2003] M. Chen. A Low-Latency Lip-Synchronized
Videoconferencing System. Proceedings of ACM Conference
on Human Factors and Computing Systems, pages 465-471,
2003.
[Claypool and Tanner, 1999] M. Claypool and J. Tanner. The Effects of Jitter on the
Perceptual Quality of Video. Proceedings of ACM
Multimedia, pages 115-118, 1999.

80
[Cline, 1967] M. Cline. The Perception of Where a Person is Looking.
American Journal of Psychology, pages 41-50, 1967.
[Cooper, 1988] J. Cooper. Video-to-Audio Synchrony Monitoring and
Correction. Journal of the Society of Motion Picture and
Television Engineers, pages 695-698, September, 1988.
[Dixon and Spitz, 1980] N. Dixon and L. Spitz. The Detection of Auditory Visual
Desynchrony. Perception, volume 9, pages 719-721, 1980.
[Dourish and Bly, 1992] P. Dourish and S. Bly. Portholes: Supporting Awareness in a
Distributed Work Group. Proceedings of Conference on
Human Factors and Computing Systems, pages 541-547,
1992.
[Eisert and Girod, 1998] P. Eisert and B. Girod. Analyzing Facial Expressions for
Virtual Conferencing. IEEE Computer Graphics &
Applications: Special Issue on Computer Animation for
Virtual Humans, pages 70-78, 1998.
[Ellgring et al., 1970] J. Ellgring. Die Beurteilung des Blickes auf Punkte innerhalb
des Gesichtes. Zeitschrift fur experimentelle und angewandte
pshchologie, pages 600-607, 1970.
[Ellgring and Cranach, 1972] J. Ellgring and M. von Cranach. Processes of learning in the
recognition of eye-signals. European Journal of Social
Psychology, pages 33-43, 1972.
[Erber and DeFilippo, 1978] N. Erber and C. DeFilippo. Voice/Mouth Synthesis and
Tactual/Visual Perception of Pa, Ba, Ma. Journal of
Acoustical Society of America, volume 64, pages 1015-1019,
1978.
[Finn et al., 1997] K. Finn, A. Sellen, and S. Wilbur. Video-Mediated
Communication, Lawrence Erlbaum Associates, 1997.
[Gavrila, 1999] D. Gavrila. The Visual Analysis of Human Movement: A
Survey. Computer Vision and Image Understanding, pages
82-98, January 1999.
[Gemmell et al., 2000] J. Gemmell, C. Zitnick, T. Kang, K. Toyama, and S. Seitz.
Gaze-awareness for Videoconferencing: A Software
Approach. IEEE Multimedia, Vol. 7, No. 4, pages 26-35,
2000.

81
[Ghinea and Thomas, 1998] G. Ghinea and J. Thomas. QoS Impact of User Perception
and Understanding of Multimedia Video Clips. Proceedings
of ACM Multimedia, pages 49-54, 1998.
[Gibbons et al., 1977] J. Gibbons, W. Kincheloe, and K. Down. Tutored Videotape
Instruction: a New Use of Electronics Media in Education.
Science, pages 1139-1146, 1977.
[Gibson and Pick, 1963] J. Gibson and A. Pick. Perception of Another Person’s
Looking Behavior. American Journal of Psychology, pages
386-394, 1963.
[He et al., 1999] L. He, E. Sanocki, A. Gupta, and J. Grudin.
Auto-Summarization of Audio-Video Presentations.
Proceedings of ACM Multimedia, pages 489-498, 1999.
[He et al., 2000] L. He, E. Sanocki, A. Gupta, and J. Grudin. Comparing
Presentation Summaries: Slides vs. Reading vs. Listening.
Proceedings of Conference on Human Factors and
Computing Systems, pages 177-184, 2000.
[Isaacs et al., 1995] E. Isaacs, T. Morris, T. Rodriguez, and J. Tang. A
Comparison of Face-to-face and Distributed Presentations.
Proceedings of Conference on Human Factors and
Computing Systems, pages 354-361, 1995.
[Isaacs and Tang, 1997] E. Isaacs and J. Tang. Studying Video-Based Collaboration
in Context: from Small Workgroups to Large Organizations.
Video-Mediated Communication, Lawrence Erlbaum
Associates, pages 173-197, 1997.
[Ishii and Kobayashi, 1992] H. Ishii and M. Kobayashi. ClearBoard: a Seamless Medium
for Shared Drawing and Conversation with Eye Contact.
Proceedings of Conference on Human Factors and
Computing Systems, pages 525-532, 1992.
[Iverson and Meadow, 1998] J. Iverson and S. Goldin-Meadow. Why people gesture when
they speak. Nature, volume 396, pages 228, November 1998.
[Jackson et al., 2000] M. Jackson, A. Anderson, R. McEwan, and J. Mullin. Impact
of Video Frame Rate on Communicative Behavior in Two
and Four Party Groups. Proceedings of CSCW, pages 11-20,
2000.
82
[Jackson, 1967] P. Jackson. The Teacher and The Machine.
Horace Mann Lecture, 1967.
[Jancke, 2000] G. Jancke, J. Grudin, and A. Gupta. Presenting to Local and
Remote Audiences: Design and Use of the TELEP System.
Proceedings of Conference on Human Factors and
Computing Systems, pages 384-391, 2000.
[Jaspers et al., 1969] J. Jaspers, et al. Het observen van ogencontact. Nederlands
Tijdschrift voor de Psychologie, 28, pages 67-81, 1969.
[Johnson and Caird, 1996] B. Johnson and J. Caird. The Effect of Frame Rate and Video
Information Redundancy on the Perceptual Learning of
American Sign Language Gestures. Proceedings of
Conference on Human Factors and Computing Systems,
pages 121-122, 1996.
[Johanson et al., 2002] B. Johanson, G. Hutchins, T. Winograd, and M. Stone.
PointRight: Experience with Flexible Input Redirection in
Interactive Workspaces. Proceedings of Symposium on User
Interface Software and Technology, pages 227-234, 2002.
[Johanson et al., 2001] B. Johanson, S. Ponnekanti, C. Sengupta, and A. Fox.
Multibrowsing: Moving Web Content across Multiple
Displays. Proceedings of Ubiquitous Computing Conference,
2001.
[Kitawaki et al., 1991] N. Kitawaki, T. Kurita, and K. Itoh. Effects of Delay on
Speech Quality. NTT Review, volume 3, pages 88-94, 1991.
[Knight et al., 1973] D. Knight, D. Langmeter, and D. Landgren. Eye-contact,
Distance, and Affliliation: the Role of Observer Bias.
Sociometry, pages 390-401, 1973.
[Knoche et al., 1999] H. Knoche, H. De Meer, and D. Kirsh. Utility Curves: Mean
Opinion Scores Considered Biased. Proceedings of the
Seventh International Workshop on Quality of Service, 1999.
[Koenig, 1965] E. Koenig. Data discussed at Round table meeting on
Modification of Speech Audiometry. VII International
Congress on Audiology, volume 4, pages 72-75, 1965.
[Kraut and Fish, 1997] R. Kraut and R. Fish. Prospects for Videotelephony.
Video-Mediated Communication (edited by K. Finn, A.

83
Sellen, and S. Wilbur), Lawrence Erlbaum Associates, pages
541-561, 1997.
[Kraut et al., 1982] R. Kraut, S. Lewis, and L. Swezey. Listener Responsiveness
and the Coordination of Conversation. Journal of Personality
and Social Psychology, pages 718-731, 1982.
[Kruger and Huckstedt, 1969] K. Kruger and B. Huckstedt. Die Beurteilung von
Blickrichtungen. Zeitschrift fur experimentelle und
angewandte psychologie, pages 452-472, 1969.
[Li et al., 2001] J. Li, G. Chen, J. Xu, Y. Wang, H. Zhou, K. Yu, K. Ng, and
H. Shum. Bi-level Video: Video Communication at Very
Low Bit Rates. Proceedings of ACM Multimedia, pages 392-
400, 2001.
[Malpani and Rowe, 1997] R. Malpani and L.Rowe. Floor Control for Large-Scale
Mbone Seminars. Proceedings of ACM Multimedia, pages
155-163, 1997.
[Mane, 1997] A. Mane. Group Space: The Role of Video in Multipoint
Videoconferencing and Its Implications for Design. Video-
Mediated Communication (edited by K. Finn, A. Sellen, and
S. Wilbur), Lawrence Erlbaum Associates, pages 401-414,
1997.
[Masoodian et al., 1995] M. Masoodian, M. Apperley, and L. Frederickson. Video
Support for Shared Work-space Interaction: an empirical
study. Interacting with computers, pages 237-273, 1995.
[Massaro and Cohen, 1993] D. Massaro and M. Cohen. Perceiving Asynchronous
Bimodal Speech in Consonant-Vowel and Vowel Syllables.
Speech Communication, volume 13, pages 127-134, 1993.
[Massaro et al., 1996] D. Massaro, M. Cohen, and P. Smeele. Perception of
Asynchronous and Conflicting Visual and Auditory Speech.
Journal of the Acoustical Society of America, volume 100,
pages 1777-1786, 1996.
[McCanne et al., 1997] S. McCanne, E. Brewer, R. Katz, L. Rowe, E. Amir, Y.
Chawathe, A. Coopersmith, K. Patel, S. Raman, A. Schuett,
D. Simpson, A. Swan, T. Tung, D. Wu, and B. Smith.
Toward a Common Infrastructure for Multimedia-
84
Networking Middleware. Proceedings of International
Workshop on Network and Operating System Support for
Digital Audio and Video, 1997.
[McGurk and MacDonald, 1976] H. McGurk and J. MacDonald. Hearing Lips and Seeing
Speech. Nature, volume 264, pages 746-748, 1976.
[McGrath and Summerfield, 1985] M. McGrath and Q. Summerfield. Intermodal timing relations
and audio-visual speech recognition by normal-hearing
adults. Journal of Acoustical Society of America, volume 77,
pages 678-685, 1985.
[Miner and Caudell, 1998] N. Miner and T. Caudell. Computational Requirements and
Synchronization Issues of Virtual Acoustic Displays.
Presence: Teleoperators and Virtual Environments, volume
7, pages 396-409, 1998.
[Mukhopadhyay and Smith, 1999] S. Mukhopadhyay and B. Smith.
Passive Capture and Structuring of Lectures.
Proceedings of ACM Multimedia, pages 477-487, 1999.
[Munhall et al., 1996] K. Munhall, P. Gribble, L. Sacco, and M. Ward. Temporal
Constraints on the McGurk Effect. Perception &
Psychophysics, volume 58, pages 351-362, 1996.
[Noll, 1992] A. Noll. Anatomy of a Failure: PicturePhone Revisited.
Telecommunications Policy, pages 307-316, 1992.
[Ochsman and Chapanis, 1974] R. Ochsman and A. Chapanis. The Effects of 10
Communication Modes on the Behavior of Teams During
Co-operative Problem-Solving. International Journal of
Man-Machine Studies, pages 579-619, 1974.
[Okada et al., 1994] K. Okada, F. Maeda, Y. Ichikawaa, and Y. Matsushita.
Multiparty Videoconferencing at Virtual Social Distance:
MAJIC Design. Proceedings of CSCW, pages 385-393,
1994.
[Pandey et al., 1986] P. Pandey, H. Kunov, and S. Abel. Disruptive Effects of
Auditory Signal Delay on Speech Perception with
Lipreading. Journal of Auditory Research, volume 26, pages
27-41, 1986.

85
[Pavlovic et al., 1997] V. Pavlovic, R. Sharma, and T. Huang. Visual Interpretation
of Hand Gestures for Human-Computer Interaction: A
Review. IEEE Transaction on Pattern Analysis and Machine
Intelligence, pages 677-695, July 1997.
[Pentland, 2000] A. Pentland. Looking at People: Sensing for Ubiquitous and
Wearable Computing. IEEE Transaction on Pattern Analysis
and Machine Intelligence, pages 107-118, January 2000.
[Reeves and Nass, 1996] B. Reeves and C. Nass. The Media Equation : How People
Treat Computers, Television, and New Media like Real
People and Places. University of Chicago Press, 1996.
[Riez and Klemmer, 1963] R. Riez and E. Klemmer. Subjective Evaluation of Delay and
Echo Suppressers in Telephone Communication.
Bell System Technical Journal, pages 2919-2942, 1963.
[Rosen et al., 1981] S. Rosen, A. Fourcin, and B. Moore. Voice Pitch as an Aid to
Lipreading. Nature, volume 291, pages 150-152, 1981.
[Rowe, 2000] L. Rowe. ACM Multimedia Tutorial on Distance Learning,
2000.
[Sellen, 1995] A. Sellen. Remote Conversations: The Effects of Mediating
Talk with Technology. Human-Computer Interaction, pages
401-444, 1995.
[Short et al., 1976] J. Short, E. Williams, and B. Christie. The Social Psychology
of Telecommunications. London, U.K. Wiley, 1976.
[Stapley, 1972] B. Stapley. Visual Enhancement of Telephone Conversations.
Ph.D. Thesis, University of London, 1972.
[Steinmetz, 1996] R. Steinmetz. Human Perception of Jitter and Media
Synchronization. IEEE Journal on Selected Areas in
Communications, volume 14, pages 61-72, 1996.
[Stephenson and Rutter, 1970] G. Stephenson and D. Rutter. Eye-contact, Distance and
Affiliation: a Re-evaluation. British Journal of Psychology,
pages 385-393, 1970.
[Stokes, 1969] R. Stokes. Human Factors and Appearance Design
Considerations of the Mod II PicturePhone Station Set. IEEE
Transactions on Communication Technology, pages 318-
323, 1969.

86
[Sumby and Pollack, 1954] W. Sumby and I. Pollack. Visual Contribution to Speech
Intelligibility in Noise. Journal of Acoustical Society of
America, volume 26, pages 212-215, 1954.
[Tang and Isaacs, 1993] J. Tang and E. Isaacs. Why Do Users Like Video? Studies of
Multimedia-Supported Collaboration. Computer-Supported
Cooperative Work: An International Journal, pages 163-196,
1993.
[Tillmann et al., 1984] H. Tillmann, B. Pompino-Marschall, and H. Prozig. Zum
Einfluß visuell dargeborener Sprachbewegungen auf die
Wahrnehmung der akustisch dodierten Artikulation.
Forschungsberichtedes Instituts fur Phonetik und Sprachliche
Kommunikation der Universitat Munchen, volume 19, pages
318-338, 1984.
[Vertegaal, 1999] R. Vertegaal. The GAZE Groupware System: Mediating Joint
Attention in Multiparty Communication and Collaboration.
Proceedings of Conference on Human Factors and
Computing Systems, pages 294-301, 1999.
[Walther, 1982] E. Walther. Lipreading, Nelson-Hall Publishers, 1982.
[Watson and Sasse, 1996] A. Watson and A. Sasse. Evaluating Audio and Video
Quality in Low-cost Multimedia Conferencing Systems.
Interacting with Computers, pages 255-275, 1996.
[White et al., 1970] H. White, J. Hegarty, and N. Beasley. Eye Contact and
Observer Bias: a Research Note. British Journal of
Psychology, pages 271-273, 1970.
[White et al, 2000] S. White, A. Gupta, J. Grudin, H. Chesley, G. Kimberly, and
E. Sanocki. Evolving Use of A System for Education at a
Distance. Proceedings of Hawaii International Conference on
System Sciences, 2000.
[Whittaker and O’Conaill, 1997] S. Whittaker and B. O’Conaill. The Role of Vision in Face-
to-Face and Mediated Communication. Video-Mediated
Communication (edited by K. Finn, A. Sellen, and S. Wilbur),
Lawrence Erlbaum Associates, pages 23-49, 1997.

87
[AccessGrid] AccessGrid.
http://www-fp.mcs.anl.gov/fl/accessgrid
[CCIR, 1990] Tolerances for Transmission Time Differences between the
Vision and the Sound Components of a Television Signal.
CCIR Recommendation 717, Dusseldorf, 1990.
[Intel IPL] Intel Image Processing Library.
http://developer.intel.com/software/products/perflib/ipl
[MBONE] Lawrence Berkeley National Laboratory Mbone tools.
http://www-nrg.ee.lbl.gov/nrg.html
University College London Mbone tools.
http://www-mice.cs.ucl.ac.uk/multimedia/software
[MPEG4, 2001] MPEG-4 Overview.
ISO/IEC JTC1/SC29/WG11 N4030, March 2001.
[NAB, 1985] Television Signal Transmission Standards. NAB Engineering
Handbook, 7th Edition, National Association of Broadcasters,
pages 41-49, 1985.
[NSF, 1992] NSF Workshop on Facial Expression Understanding, 1992.
http://mambo.ucsc.edu/psl/nsf.txt
[SCPD] Stanford Center for Professional Development.
http://scpd.stanford.edu/scpd/about/history.htm
[vLink] Stanford vLink.
http://graphics.stanford.edu/~miltchen/VideoAuditorium
Related Documents