Part One Humans dominate the planet and their influence extends to every part of the world. Over the last 20 years the extent of land area harvested has increased by 16 per cent, the area under irrigation has doubled, and agricultural production has grown nearly three- fold. Yet close to one billion people remain undernourished. There is enormous pressure on global land resources due to rising food demand, a global shift in dietary habits, biofuel production, urbanization, and other competing demands. Landfills, mining, and other extraction activities also contribute to the pressure on land resources. Hence, healthy and productive land is becoming scarce. It is clear that unsustainable human activities put land at risk and at the same time threaten the ecosystem services on which all humanity depends. In Europe alone, poor land management practices account for an estimated 970 million tons of soil loss due to erosion each year; worldwide, the annual loss of soil is estimated at 24 billion tons. Satellite observations suggest that globally between 2000 and 2012, 2.3 million km 2 of forest were lost, while only 0.8 million km 2 were reforested. The loss of forests and other natural ecosystems directly affects biodiversity and ecosystem services, such as nutrient, carbon, and water cycles and climate regulation. Agriculture provides food, fiber, and other products that sustain human life. Croplands occupy about 14 per cent of the total ice- free land area on the planet while pastures occupy about 26 per cent. Almost 45 per cent of the world’s agricultural land is located on drylands, mainly in Africa and Asia; it supplies about 60 per cent of the world’s food production. While increases in food production are essential to feed a growing population, agricultural expansion threatens local and regional ecosystem functions and the vital services they provide to all species. CHAPTER 4 CONVERGENCE OF EVIDENCE 52 UNCCD | Global Land Outlook | Chapter 4 | Convergence of Evidence

Welcome message from author
This document is posted to help you gain knowledge. Please leave a comment to let me know what you think about it! Share it to your friends and learn new things together.
Transcript

Part One
Humans dominate the planet and their influence extends to every part of the world. Over the last 20 years the extent of land area harvested has increased by 16 per cent, the area under irrigation has doubled, and agricultural production has grown nearly three-fold. Yet close to one billion people remain undernourished. There is enormous pressure on global land resources due to rising food demand, a global shift in dietary habits, biofuel production, urbanization, and other competing demands. Landfills, mining, and other extraction activities also contribute to the pressure on land resources. Hence, healthy and productive land is becoming scarce.
It is clear that unsustainable human activities put land at risk and at the same time threaten the ecosystem services on which all humanity depends. In Europe alone, poor land management practices account for an estimated 970 million tons of soil loss due to erosion each year; worldwide, the annual loss of soil is estimated at 24 billion tons. Satellite observations suggest that globally between 2000 and 2012, 2.3 million km2 of forest were lost, while only 0.8 million km2 were reforested. The loss of forests and other natural ecosystems directly affects biodiversity and ecosystem services, such as nutrient, carbon, and water cycles and climate regulation.
Agriculture provides food, fiber, and other products that sustain human life. Croplands occupy about 14 per cent of the total ice-free land area on the planet while pastures occupy about 26 per cent. Almost 45 per cent of the world’s agricultural land is located on drylands, mainly in Africa and Asia; it supplies about 60 per cent of the world’s food production. While increases in food production are essential to feed a growing population, agricultural expansion threatens local and regional ecosystem functions and the vital services they provide to all species.
CHAPTER 4
CONVERGENCE OF EVIDENCE
52 UNCCD | Global Land Outlook | Chapter 4 | Convergence of Evidence

Decreasing productivity trends do not per se indicate land
degradation, or increasing trends indicate recovery. For
further evaluation with the aim of identifying critical land
degradation zones, an analytical convergence of evidence
framework using additional thematic information is required.
INTRODUCTION
Measuring the extent of land degradation is difficult;
experts disagree about both the status and trends
even in well-studied areas like Europe and North
America. The World Atlas of Desertification (WAD),1
a project coordinated by the Joint Research Centre
(JRC) of the European Commission with collaboration
of the United Nations Convention to Combat
Desertification (UNCCD), looks beyond conventional
desertification analyses to consider, more generally,
the status and trends in global anthropogenic land
change processes, with an emphasis on croplands
and rangelands. The WAD is further complemented
with the large evidence base on forests, water
resources, biodiversity, and soil conditions that
is summarized in Part Two of this Outlook. After
summarizing some of the key findings of the WAD,
this chapter concludes by contrasting current status
and trends in land productivity dynamics with some
of the goods and services that widespread land
degradation will put at risk.
Considering the drivers and multiple factors
underlying land degradation and the need for
context-specific responses, developing a single
indicator or index to represent or map land
degradation represents a big challenge. Thus,
the WAD builds on a systematic framework
that provides a “convergence of evidence”
regarding human-environment interactions.
This allows for the identification of thematic
pathways and geographically-explicit patterns of
coinciding processes that can potentially lead to
land degradation.
This approach to providing and combining geospatial
information with local level indicators is consistent
with the monitoring and evaluation framework of
the UNCCD2 and the application of landscape-level
approaches to the implementation of the land
degradation neutrality target (SDG 15.3).
By evaluating a reference period of approximately
15 to 20 years, the time since the publication of the
last Atlas, and taking account of the findings of the
Millennium Ecosystem Assessment3 in 2005, the
WAD global mapping approach is designed to help
identify areas potentially affected by persistent
land degradation as well as areas that are showing
signs of recovering their productive capacity.
These maps are overlaid with information on the
most commonly documented direct and indirect
causes of land degradation, and also include, when
available, information on sustainable land use and
management practices, such as agroforestry and
conservation agriculture.
The WAD implements a systematic and transparent
framework to trace where the main human-
environment processes and interactions coincide.
This geographic convergence of evidence is
instructive in that it highlights areas and possible
pathways of land degradation as well as responses
including the protection, sustainable management,
and restoration of land resources. The third edition
of the WAD focuses on global datasets that yield
discernable patterns in potentially stressed areas.
The combination of these stressors is then filtered
through a variety of stratifications representing a
range of stakeholder interests, such as cropland or
rangeland perspectives. As a global scale exercise,
the WAD remains limited in its ability to interpret
specific local situations, which need to be addressed
with contextual information and interpreted based
on the understanding of their interactions at
that scale. Nevertheless, the WAD convergence
framework can be useful in providing background
information for more detailed studies at national or
sub-national scales.
UNCCD | Global Land Outlook | Chapter 4 | Convergence of Evidence 53

Land Productivity DynamicsLand productivity addresses the net primary
production (NPP) per unit of area and time. It reflects
the overall quality of land and soil that results
from environmental conditions and land resource
use/management. Persistent decreases in land
productivity point to the long-term alteration of the
health and productive capacity of the land. Such
decreases directly and indirectly impact on virtually
all terrestrial ecosystem services, i.e., the benefits
that form the basis for sustainable livelihoods and
economic growth in all human communities. This
indicator relies on multi-temporal and thematic
evaluation of global long-term time series of
remotely-sensed land productivity measures
equivalent to NPP, at high spatial resolution (1 km
or better) and operationally addressed by existing
Earth Observation Systems.
Box 4.1: Methodology for assessing the status of land cover
In the past, land degradation maps have been
controversial; their value questioned due to the
multifaceted nature of the phenomenon, the
complexity of processes involved, and the difficulty
of interpretation at a global scale. However,
progress in the last two decades – the emergence
of improved global datasets, a better understanding
of underlying processes, and rapidly advancing
analytical tools – has improved the accuracy of this
type of analysis.
The state of the Earth’s vegetative cover and its
development over time is a generally accepted
representation of land productivity and dynamics,
reflecting integrated ecological conditions and the
impact of natural and anthropogenic environmental
change. The term “land productivity dynamics” (LPD)
as used in the WAD reflects the fact that the primary
productivity of a stable land system is not a steady
state, but often highly variable between different
years and vegetation growth cycles due to natural
variation and/or human intervention. This implies
that land productivity changes cannot be assessed
meaningfully by comparing land productivity values
of single reference years or averages of a few years,
and emphasizes the need for approaches based
on longer term trends. Therefore, the LPD dataset
relies on multi-temporal and thematic evaluation
of long-term global time series of remotely-sensed
vegetation indices, allowing for the calculation of
equivalents to net primary productivity. These time
series datasets coupled with model-derived bio-
physical variables are increasingly being provided by
existing national and international Earth Observation
Systems, such as the Group on Earth Observations.4,5
The LPD map used does not provide a numerical
measure of land productivity. Rather, it depicts
the persistent trajectory of land productivity
dynamics during the last 15 years. It provides five
qualitative classes of persistent land productivity
trajectories from 1998 to 2013: in other words,
a qualitative combined measure of the intensity
and persistence of negative or positive trends and
changes of vegetation cover. The main elements of
the LPD dataset processing chain are summarized in
Annex 2, considering also aspects of validation and
accuracy of the data product.
Class Value Description
1 Persistent severe decline in
productivity
2 Persistent moderate decline in
productivity
3 Stable, but stressed; persistent
strong inter-annual productivity
variations
4 Stable productivity
5 Persistent increase in productivity
Table 4.1: Five
classes of land
productivity
dynamics
The WAD’s key message is that land degradation is a multifaceted
global phenomenon with distinct variations between regions and
across key land cover/land use systems and which cannot be
captured by one or a limited set of indicators.
54 UNCCD | Global Land Outlook | Chapter 4 | Convergence of Evidence

The WAD’s key message is that land degradation
is a multifaceted global phenomenon with distinct
variations between regions and across key land
cover/land use systems and which cannot be
captured by one or a limited set of indicators. A
crucial indicator in the WAD framework is the Land
Productivity Dynamics (LPD) dataset that refers to
the standing biomass productivity, and is derived
from phenological analyses of a 15-year time
series (1998-2013) of global normalized difference
vegetation index (NDVI) observations from SPOT-
VGT, composited in 10-day intervals at a spatial
resolution of 1 km. The map shows 5 classes
indicating areas of negative or positive change or
stability and is an indicator of change or stasis of
the land’s apparent capacity to sustain the dynamic
equilibrium of primary productivity in the given
15- year observation period.
Indications of decreasing productivity can be
observed globally, with up to 22 million km2
affected, i.e., approximately 20 per cent of the
Earth’s vegetated land surface shows persistent
declining trends or stress on land productivity.
These global trends are evident in 20 per cent of
cropland, 16 per cent of forest land, 19 per cent
of grassland, and 27 per cent of rangeland (i.e.,
shrubland, herbaceous and sparsely vegetated
areas). For grasslands and rangelands, the global
extent of the areas experiencing decreases in
productivity exceeds that showing increases.
South America and Africa are the most affected
by productivity declines in absolute terms,
with Australia and Oceania showing the largest
proportion of areas affected: approximately 37 per
cent for Australia, 27 per cent for South America,
and 22 per cent for Africa.
It must be clearly understood and communicated that
“land productivity” in the context of the LPD dataset
strictly refers to the overall above-ground vegetation
biomass productivity. This is not conceptually the
same as, nor necessarily directly related to, agricultural
income per area unit or “land productivity” as used in
conventional agricultural terminology.
Considering that immense effort and resources
are being committed to maintain and enhance the
productivity of arable and permanent cropland as
well as the fact that there are clear limitations to
the further expansion of cropland, these figures are
cause for concern and action. This analysis can be
further disaggregated according to land cover/land
use classification. In the next step of the analysis,
the distribution of LPD classes is further broken
down to coarse land cover/land use categories at
global and continental levels:
• Cropland including arable land, permanent crops,
and mixed classes with over 50 per cent crops
• Grassland including natural grassland and
managed pasture land
• Rangelands including shrub land, herbaceous,
and sparsely vegetated areas
• Forestland including all forest categories and
mixed classes with tree cover over 40 per cent
This breakdown reveals significant differences in
the respective areas (Figure 4.3) and proportions
(Figure 4.4) affected by declining or stressed (i.e.,
unstable) land productivity dynamics. The overall
picture gets more nuanced when disaggregating at
continental/regional and sub-regional levels. This
is evident in the substantial differences between
continents as regards the dimension and extent of
potentially critical areas and their association to land
cover/land use.
UNCCD | Global Land Outlook | Chapter 4 | Convergence of Evidence 55

Figure 4.2: Regional
groupings refer to a
continental classification
system (Australia &
Oceania includes New
Zealand, Papua New
Guinea, and Pacific Islands;
North & Central America
includes the Caribbean).
Figure 4.1: Global Land
Productivity Dynamics
map 1999 to 2013
showing 5 classes
of persistent land
productivity trajectories
during the observation
period. Decreasing
productivity trends do
not per se indicate land
degradation, or increasing
trends indicate recovery.
For further evaluation
with the aim of identifying
critical land degradation
zones, an analytical
convergence of evidence
framework using additional
thematic information is
required.
Key
Declining
Moderate decline
Stressed
Stable
Increasing
0% 5% 10% 15% 20% 25% 30% 35% 40%
Europe
Asia
North America
Africa
South America
Australia & Oceania
WORLD
Key
Declining and moderate decline combined
Stressed
56 UNCCD | Global Land Outlook | Chapter 4 | Convergence of Evidence

Figure 4.4: Per cent
distribution of LPD
classes for 4 major LC/LU
categories at global level
Figure 4.3: Global spatial
extent of LPD classes
under selected LC/LU
categories
million km2
0 10 20 30 5040
Cropland
Grassland
Forest land
Rangelands
0% 10% 20% 30% 40% 50% 60% 70% 80% 90% 100%
moderate declinedeclining stressed stable increasing
Cropland
Grassland
Forest land
Rangelands
UNCCD | Global Land Outlook | Chapter 4 | Convergence of Evidence 57

Figure 4.7:
Per cent distribution
of LPD classes
for 4 major LC/LU
categories in AfricaCropland
Grassland
Forest land
Rangelands
Total continent
0% 10% 20% 30% 40% 50% 60% 70% 80% 90% 100%
decreasing stressed stable increasing
Cropland
Grassland
Forest land
Rangelands
Total continent
0 5 10 15 15 25
million km2
Figure 4.6:
Spatial extent of
LPD classes in Africa
under selected LC/LU
categories
In Africa, approximately 16 per cent of the vegetated
land surface is assigned as cropland, of which
about 23-24 per cent shows signs of decreasing
or unstable land productivity. African rangelands
and grasslands, an essential resource for livestock
production and livelihoods of large parts of the
population, are experiencing productivity declines
similar to that of affected croplands. The overall
expansion of declining land productivity appears to
be above global averages and exceeds the extent
of areas experiencing increasing productivity or
recovery, especially in the croplands and grasslands.
These critically unbalanced land productivity trends
in African cropland and grasslands are particularly
concerning given expected population growth.
Forests in Africa still cover about 7 million km2,
16 per cent affected by decreasing or stressed land
productivity and 34 per cent of the tree covered land
showing signs of increasing productivity. This may
be a positive signal that programmes stimulating
forest protection, afforestation, and tree planting
for sustainable agro- and silvo-pastoral land use
systems have made some progress in the last 10
to 15 years.
Figure 4.5:
Land Productivity
Dynamics map 1999 to
2013 for Africa showing
5 classes of persistent
land productivity
trajectories during the
observation period
Key
Declining
Moderate decline
Stressed
Stable
Increasing
58 UNCCD | Global Land Outlook | Chapter 4 | Convergence of Evidence

Figure 4.10:
Per cent
distribution of
LPD classes for
4 major LC/LU
categories in Asia
million km2
Cropland
Grassland
Forest land
Rangelands
Total continent
0 10 20 30 40
Cropland
Grassland
Forest land
Rangelands
Total continent
0% 10% 20% 30% 40% 50% 60% 70% 80% 90% 100%
decreasing stressed stable increasing
Figure 4.9:
Spatial extent
of LPD classes
in Asia under
selected LC/LU
categories
Figure 4.8:
Land Productivity
Dynamics map 1999 to
2013 for Asia showing
5 classes of persistent
land productivity
trajectories during the
observation period
Key
Declining
Moderate decline
Stressed
Stable
Increasing
In Asia, croplands show relatively small
proportions of declining productivity trends that
are below global averages, with approximately
12 per cent. Nevertheless, this accounts for up
to 1 million km² of croplands that appear to be
affected. Some critical pressures potentially
leading to decreasing land productivity at the
ecosystem level may be masked by effects of the
relatively recent changes towards more input-
intensive agriculture in many Asian countries.
Areas where accumulation of anthropogenic
pressures exist are identified on the convergence
of evidence maps below.
Rangelands are proportionally the most affected by
declining land productivity trends (up to 20 per cent),
greater than the proportion of increasing or recovering
land productivity. This is most apparent in the belt of
decreasing land productivity trends across the Central
Asian region, which has undergone dramatic changes
in land use after the foundation of independent states
during the 1990s. In many cases, more sedentary
forms of livestock production have led to overstocking
and overgrazing of vulnerable rangeland systems
while at the same time large-scale collective arable
and livestock land use systems were abandoned.
About 12 per cent of Asian forest lands show signs of
persistent decline or instability in primary productivity
while more than 35 per cent experience increasing
trends, i.e., recovery. This is evident in around 2 million
km2, with large patches of cover emerging in Siberia
and complex patterns of decreasing and increasing
productivity in south and southeast Asia, which
reflect the high dynamics of forest transformations in
these regions.
UNCCD | Global Land Outlook | Chapter 4 | Convergence of Evidence 59
Cropland
Grassland
Forest land
Rangelands
Total continent
0% 10% 20% 30% 40% 50% 60% 70% 80% 90% 100%
decreasing stressed stable increasing
Cropland
Grassland
Forest land
Rangelands
Total continent
0 2 4 6 8 10
million km2
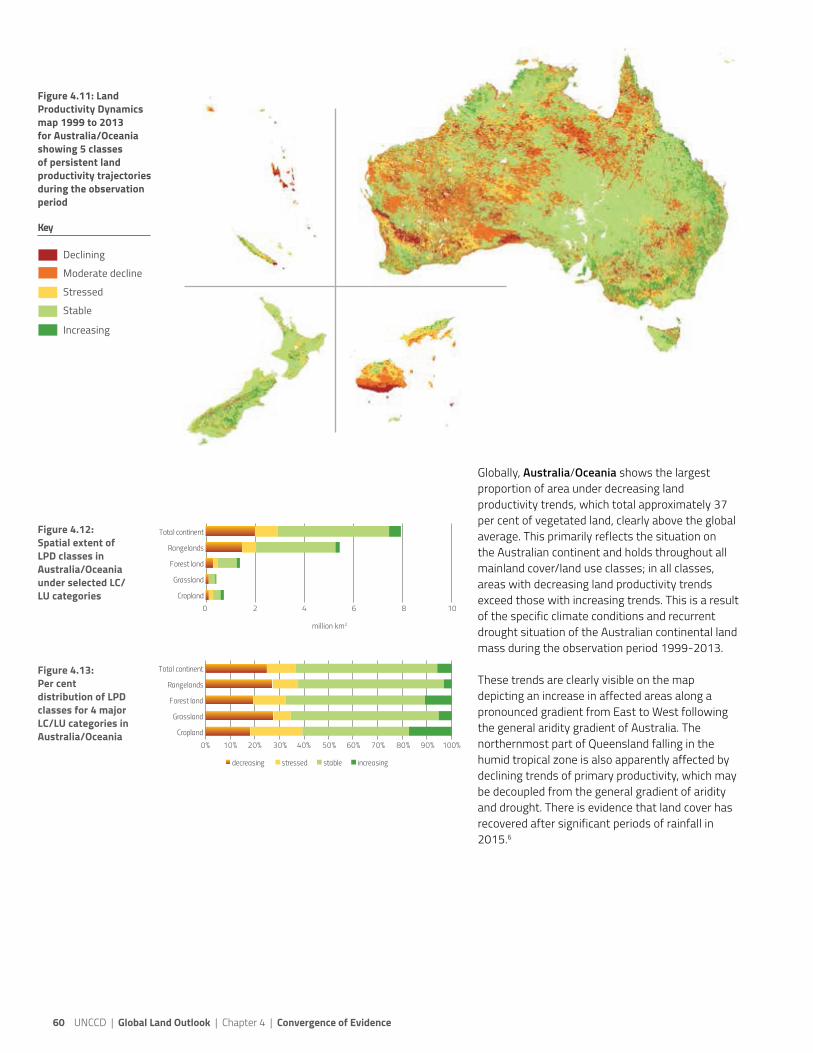
Globally, Australia/Oceania shows the largest
proportion of area under decreasing land
productivity trends, which total approximately 37
per cent of vegetated land, clearly above the global
average. This primarily reflects the situation on
the Australian continent and holds throughout all
mainland cover/land use classes; in all classes,
areas with decreasing land productivity trends
exceed those with increasing trends. This is a result
of the specific climate conditions and recurrent
drought situation of the Australian continental land
mass during the observation period 1999-2013.
These trends are clearly visible on the map
depicting an increase in affected areas along a
pronounced gradient from East to West following
the general aridity gradient of Australia. The
northernmost part of Queensland falling in the
humid tropical zone is also apparently affected by
declining trends of primary productivity, which may
be decoupled from the general gradient of aridity
and drought. There is evidence that land cover has
recovered after significant periods of rainfall in
2015.6
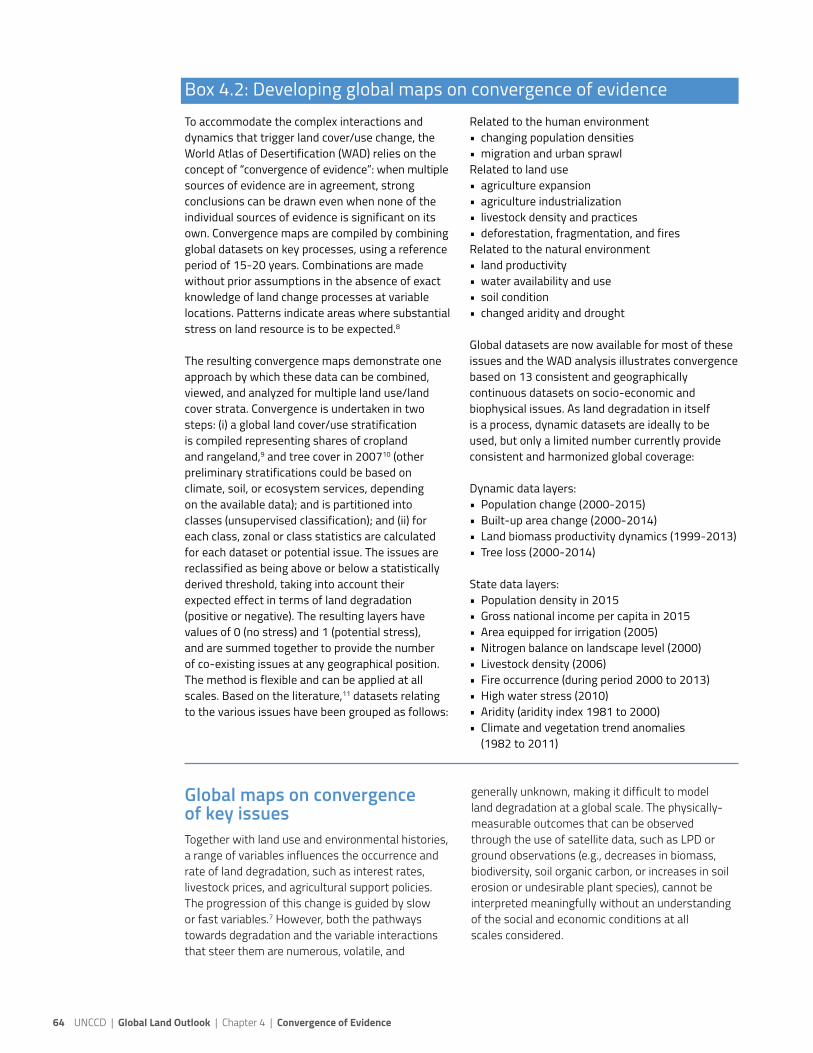
Figure 4.12:
Spatial extent of
LPD classes in
Australia/Oceania
under selected LC/
LU categories
Figure 4.13:
Per cent
distribution of LPD
classes for 4 major
LC/LU categories in
Australia/Oceania
Figure 4.11: Land
Productivity Dynamics
map 1999 to 2013
for Australia/Oceania
showing 5 classes
of persistent land
productivity trajectories
during the observation
period
Key
Declining
Moderate decline
Stressed
Stable
Increasing
60 UNCCD | Global Land Outlook | Chapter 4 | Convergence of Evidence

Figure 4.15:
Spatial extent of
LPD classes in South
America under
selected LC/LU
categories
Figure 4.16: Per
cent distribution
of LPD classes
for 4 major LC/LU
categories in South
America
Figure 4.14: Land
Productivity Dynamics
map 1999 to 2013 for
South America showing 5
classes of persistent land
productivity trajectories
during the observation
period
In South America, all of the LC/LU classes were
affected by negative land productivity trends,
considerably above global averages, while at
the same time the areas with increasing land
productivity areas typically do not exceed those
declining, remaining below global averages in this
regard. One of the main anomalies of declining
productivity trends on the global map is located
in the vast semi-arid plain of the Dry Chaco in
the border region between Argentina, Brazil,
and Paraguay.
The spatial distribution of the declining productivity
areas generally correlates with the rapid expansion
of crop production and cattle ranching at the
expense of ecologically high-value primary dry
forests. The patterns of productivity decline or
instability in the tropical rainforest areas are
more diffuse. The north-eastern Brazilian dryland
area shows the effect of severe drought conditions
towards the end of the observation period. Long
term effects of this anomaly, now visible as
declining productivity, cannot be estimated yet.
Cropland
Grassland
Forest land
Rangelands
Total continent
0% 10% 20% 30% 40% 50% 60% 70% 80% 90% 100%
decreasing stressed stable increasing
million km2
Cropland
Grassland
Forest land
Rangelands
Total continent
0 5 10 15 20
Key
Declining
Moderate decline
Stressed
Stable
Increasing
UNCCD | Global Land Outlook | Chapter 4 | Convergence of Evidence 61

Cropland
Grassland
Forest land
Rangelands
Total continent
0% 10% 20% 30% 40% 50% 60% 70% 80% 90% 100%
decreasing stressed stable increasing
million km2
Cropland
Grassland
Forest land
Rangelands
Total continent
0 5 10 15 20
Figure 4.18:
Spatial extent of
LPD classes in North
America under
selected LC/LU
categories
Figure 4.19:
Per cent distribution
of LPD classes
for 4 major LC/LU
categories in North
America
Figure 4.17:
Land Productivity
Dynamics map 1999 to
2013 for North America
showing 5 classes
of persistent land
productivity trajectories
during the observation
period
In North America, declining productivity trends
within the 4 LC/LU types are typically similar to or
below global averages. Grasslands and rangelands
appear to be the most affected where the extent of
area with declining trends are estimated at 20-22
per cent in both classes, clearly greater than areas
showing signs of increasing or recovering primary
productivity.
Only 13 per cent of the croplands are characterized
by declining trends or persistent instability,
nevertheless approximately 500,000 km2. The most
prominent declining anomaly falls in the southern
part of the semi-arid Great Plains in the border
region between New Mexico, Texas, Oklahoma, and
Kansas, where large areas are dedicated to input-
intense, irrigated crops (e.g., cotton in northwest
Texas) that depend primarily on fossil groundwater.
Key
Declining
Moderate decline
Stressed
Stable
Increasing
62 UNCCD | Global Land Outlook | Chapter 4 | Convergence of Evidence

Figure 4.21:
Spatial extent
of LPD classes
in Europe under
selected LC/LU
categories
Figure 4.22:
Per cent distribution
of LPD classes
for 4 major LC/LU
categories in Europe
Figure 4.20:
Land Productivity
Dynamics map 1999 to
2013 for Europe showing
5 classes of persistent
land productivity
trajectories during the
observation period
In Europe, declining productivity trends within the
LC/LU classes are typically below global averages.
However, being the continent with the relatively
highest proportion of croplands, European farmland
is proportionally the most affected when compared
to the other land cover types considered. An estimated
18 per cent of the croplands may be subject to
significant drivers leading to productivity declines,
especially in the south of Eastern Europe where,
similar to Central Asia, large-scale collective arable
Cropland
Grassland
Forest land
Rangelands
Total continent
0% 10% 20% 30% 40% 50% 60% 70% 80% 90% 100%
decreasing stressed stable increasing
0 2 4 6 8 10
million km2
Cropland
Grassland
Forest land
Rangelands
Total continent
and livestock land use systems have been substantially
transformed as a result of the economic crisis.
Some hotspots of declining land productivity in
Western Europe, especially in the Mediterranean
region, are characterized by agricultural
intensification often intermingled with the rapid
expansion of infrastructure and built-up areas into
croplands. In many European croplands, the impacts
of land and soil degradation on productivity may be
masked by the sustained capacity to compensate
for losses in soil fertility but at a significant cost to
biodiversity and quality of freshwater resources.
When disaggregated and viewed by broad land
cover/land use categories, the LPD allows for the
identification of meaningful patterns of land
transformations occurring at continental to national
levels. Thus, LPD provides a first approximation and
comparison of different regions or even countries
according to their capacity to sustain primary
productivity in land use systems. In order to
substantiate this type of information in the context
of underlying causes and drivers of land
degradation, the WAD promotes the concept of
convergence of evidence.
Key
Declining
Moderate decline
Stressed
Stable
Increasing
UNCCD | Global Land Outlook | Chapter 4 | Convergence of Evidence 63
Global maps on convergence of key issues
Together with land use and environmental histories,
a range of variables influences the occurrence and
rate of land degradation, such as interest rates,
livestock prices, and agricultural support policies.
The progression of this change is guided by slow
or fast variables.7 However, both the pathways
towards degradation and the variable interactions
that steer them are numerous, volatile, and
generally unknown, making it difficult to model
land degradation at a global scale. The physically-
measurable outcomes that can be observed
through the use of satellite data, such as LPD or
ground observations (e.g., decreases in biomass,
biodiversity, soil organic carbon, or increases in soil
erosion or undesirable plant species), cannot be
interpreted meaningfully without an understanding
of the social and economic conditions at all
scales considered.
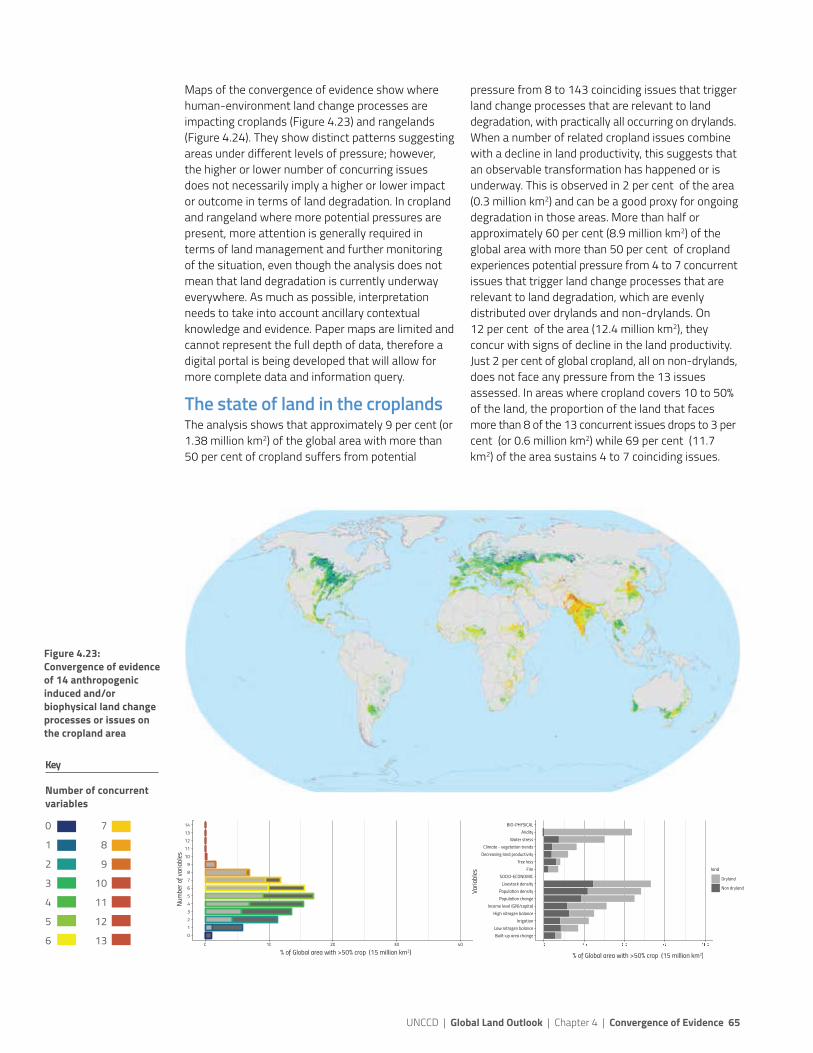
Box 4.2: Developing global maps on convergence of evidence
To accommodate the complex interactions and
dynamics that trigger land cover/use change, the
World Atlas of Desertification (WAD) relies on the
concept of “convergence of evidence”: when multiple
sources of evidence are in agreement, strong
conclusions can be drawn even when none of the
individual sources of evidence is significant on its
own. Convergence maps are compiled by combining
global datasets on key processes, using a reference
period of 15-20 years. Combinations are made
without prior assumptions in the absence of exact
knowledge of land change processes at variable
locations. Patterns indicate areas where substantial
stress on land resource is to be expected.8
The resulting convergence maps demonstrate one
approach by which these data can be combined,
viewed, and analyzed for multiple land use/land
cover strata. Convergence is undertaken in two
steps: (i) a global land cover/use stratification
is compiled representing shares of cropland
and rangeland,9 and tree cover in 200710 (other
preliminary stratifications could be based on
climate, soil, or ecosystem services, depending
on the available data); and is partitioned into
classes (unsupervised classification); and (ii) for
each class, zonal or class statistics are calculated
for each dataset or potential issue. The issues are
reclassified as being above or below a statistically
derived threshold, taking into account their
expected effect in terms of land degradation
(positive or negative). The resulting layers have
values of 0 (no stress) and 1 (potential stress),
and are summed together to provide the number
of co-existing issues at any geographical position.
The method is flexible and can be applied at all
scales. Based on the literature,11 datasets relating
to the various issues have been grouped as follows:
Related to the human environment
• changing population densities
• migration and urban sprawl
Related to land use
• agriculture expansion
• agriculture industrialization
• livestock density and practices
• deforestation, fragmentation, and fires
Related to the natural environment
• land productivity
• water availability and use
• soil condition
• changed aridity and drought
Global datasets are now available for most of these
issues and the WAD analysis illustrates convergence
based on 13 consistent and geographically
continuous datasets on socio-economic and
biophysical issues. As land degradation in itself
is a process, dynamic datasets are ideally to be
used, but only a limited number currently provide
consistent and harmonized global coverage:
Dynamic data layers:
• Population change (2000-2015)
• Built-up area change (2000-2014)
• Land biomass productivity dynamics (1999-2013)
• Tree loss (2000-2014)
State data layers:
• Population density in 2015
• Gross national income per capita in 2015
• Area equipped for irrigation (2005)
• Nitrogen balance on landscape level (2000)
• Livestock density (2006)
• Fire occurrence (during period 2000 to 2013)
• High water stress (2010)
• Aridity (aridity index 1981 to 2000)
• Climate and vegetation trend anomalies
(1982 to 2011)
64 UNCCD | Global Land Outlook | Chapter 4 | Convergence of Evidence
Maps of the convergence of evidence show where
human-environment land change processes are
impacting croplands (Figure 4.23) and rangelands
(Figure 4.24). They show distinct patterns suggesting
areas under different levels of pressure; however,
the higher or lower number of concurring issues
does not necessarily imply a higher or lower impact
or outcome in terms of land degradation. In cropland
and rangeland where more potential pressures are
present, more attention is generally required in
terms of land management and further monitoring
of the situation, even though the analysis does not
mean that land degradation is currently underway
everywhere. As much as possible, interpretation
needs to take into account ancillary contextual
knowledge and evidence. Paper maps are limited and
cannot represent the full depth of data, therefore a
digital portal is being developed that will allow for
more complete data and information query.
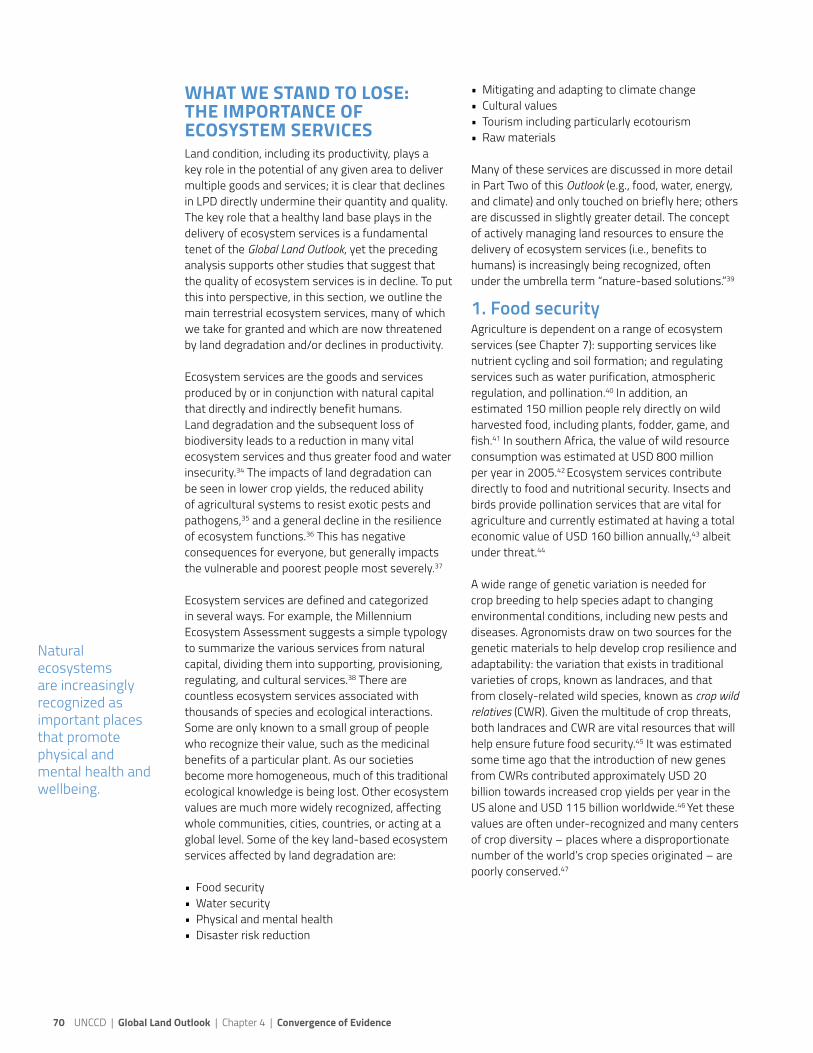
The state of land in the croplandsThe analysis shows that approximately 9 per cent (or
1.38 million km2) of the global area with more than
50 per cent of cropland suffers from potential
pressure from 8 to 143 coinciding issues that trigger
land change processes that are relevant to land
degradation, with practically all occurring on drylands.
When a number of related cropland issues combine
with a decline in land productivity, this suggests that
an observable transformation has happened or is
underway. This is observed in 2 per cent of the area
(0.3 million km2) and can be a good proxy for ongoing
degradation in those areas. More than half or
approximately 60 per cent (8.9 million km2) of the
global area with more than 50 per cent of cropland
experiences potential pressure from 4 to 7 concurrent
issues that trigger land change processes that are
relevant to land degradation, which are evenly
distributed over drylands and non-drylands. On
12 per cent of the area (12.4 million km2), they
concur with signs of decline in the land productivity.
Just 2 per cent of global cropland, all on non-drylands,
does not face any pressure from the 13 issues
assessed. In areas where cropland covers 10 to 50%
of the land, the proportion of the land that faces
more than 8 of the 13 concurrent issues drops to 3 per
cent (or 0.6 million km2) while 69 per cent (11.7
km2) of the area sustains 4 to 7 coinciding issues.
Figure 4.23:
Convergence of evidence
of 14 anthropogenic
induced and/or
biophysical land change
processes or issues on
the cropland area
0
1
2
3
4
5
6
7
8
9
10
11
12
13
14
0 10 20 30 40
Number of variables
% of Global area with >50% crop (15 million km2)
Built-up area change
Low nitrogen balance
Irrigation
High nitrogen balance
Income level (GNI/capita)
Population change
Population density
Livestock density
SOCIO-ECONOMIC
Fire
Tree loss
Decreasing land productivity
Climate - vegetation trends
Water stress
Aridity
BIO-PHYSICAL
� � � � � � � � � �Variables land
Dryland
Non dryland
% of Global area with >50% crop (15 million km2)
Number of concurrent
variables
0
1
2
3
4
5
6
7
8
9
10
11
12
13
Key
UNCCD | Global Land Outlook | Chapter 4 | Convergence of Evidence 65

The main cropland areas facing multiple pressures
include, but are not limited to:
• Asia including Indian and Pakistani croplands,
agricultural expansion areas in northwest China,
and hotspots in the Philippines and Java;
• southeast Australia and small areas in southwest
Australia;
• sub-Saharan Africa including Burkina Faso,
northern Nigeria, eastern Sudan, south Kenya,
Malawi, and Zimbabwe;
• North Africa and the Middle East including
northern Morocco, Egyptian Nile area,
the Tigris-Euphrates region;
• intense agricultural areas in the Mediterranean
and central Europe;
• Central Asia around the Aral sea and croplands
in eastern Kazakhstan, Uzbekistan, Kyrgyzstan,
and Tajikistan;
• hotspots in Latin America and the Caribbean,
including the northeast Brazilian drylands,
agriculture expansion areas in the Argentinean
Chaco area, central Chile, southern Mexican
croplands, and parts of Cuba and Haiti; and
• irrigated areas in the western USA.
The state of land in the rangelands
Approximately 5 per cent (0.5 million km2) of global
rangeland suffers from potential pressure from 8
to 13 concurrent issues that trigger land change
processes that are relevant to land degradation, with
practically all occurring on drylands. Approximately
52 per cent (13.1 million km2) of global rangeland
experiences potential pressure from 5 to 8
concurrent issues that trigger land change processes
that are relevant to land degradation, more than
two-thirds of this is on drylands. Again, only 2 per
cent of rangelands, all on non-drylands, do not face
pressures from any of these issues.
The main rangeland areas facing multiple pressures
include, but are not limited to: India; Central Asia;
China’s Inner Mongolia area; areas of eastern
Australia; the fringes of the Sahel; eastern Africa and
parts of southern Africa; southwest Madagascar;
north-central Chile and southern Ecuador; central
Mexico; and south-central USA.
Figure 4.24: Convergence
of evidence of 14
anthropogenic induced and/
or biophysical land change
processes or issues on the
rangeland area
0 10 20 30 40
% of Global ranging area with >50% crop (18.8 million km2)
0
1
2
3
4
5
6
7
8
9
10
11
12
13
14
Number of variables
Built-up area change
Irrigation
High nitrogen balance
Income level (GNI/capita)
Low nitrogen balance
Population density
Population change
Livestock density
SOCIO-ECONOMIC
Tree loss
� � � �Climate - vegetation trends
Water stress
Decreasing land productivity
Aridity
BIO-PHYSICAL
� � � � � � � � � �Variables
% of Global ranging area with >50% crop (18.8 million km2)
land
Dryland
Non dryland
Number of concurrent
variables
0
1
2
3
4
5
6
7
8
9
10
11
12
13
Key
66 UNCCD | Global Land Outlook | Chapter 4 | Convergence of Evidence

Figure 4.25: Recent
Earth Observation
studies show a positive
trend in rainfall and
vegetation index over
the last decades for the
majority of the Sahel –
known as the re-greening
of the Sahel.24 This has been interpreted as an increase in biomass, and contradicts prevailing narratives of widespread degradation caused by human overuse and climate change. Yet observable areas of decreasing productivity, e.g. in Niger and Sudan, indicate that the re-greening process is not uniform across the entire Sahel.
Regional and national highlights
Middle East and Central Asia A fundamental issue
in this area is the scarcity and management of
water resources. Over 70 per cent of the global
net permanent surface water loss occurred in
the Middle East and Central Asia.12 Irrigation
demands combined with intensive agriculture
pose unsustainable pressure on the land resource.
Livestock numbers remain high and productive
pastureland is reduced or fragmented by population
increase and agriculture expansion.13
India Since the 1700s, high population density has
been a major pressure throughout India.14 India
hosts 18 per cent of the world population and 15
per cent of its livestock, but has only 2.4 per cent of
the world’s land area.15 Since the 1960s, the portion
of cropland available per person decreased three-
fold, to 0.12 ha per person; 53 per cent of India is
farmland, using an average of 157 kg/ha of fertilizer
with more than 36 per cent under irrigation; annual
freshwater withdrawal is one of the highest globally
at 761 billion m3. This suggests a significant pressure
on cropland. Land productivity dynamics, however,
show a stable state during the last 15 years. Some
areas, but not all, overlap with the detailed national
assessment of ongoing degradation that is based on
identification of biophysical processes observed by
satellite data.16
China Biomass land productivity status, observed
by satellite from 1999-2014, is mapped as stable
or increasing over most of China. However, in the
Beijing-Hebei-Shandong area, dense population
combined with intensive, mostly irrigated,
agriculture is leading to water stress and poor land
quality. The introduction of agriculture in marginal
lands traditionally used for grazing sheep and cattle
has caused erodible soil surfaces, a process known
as “sandification,” in large areas of northern China,
especially Inner Mongolia and western Xinjiang.17
In Inner Mongolia, government policies aiming to
settle nomadic pastoralists and privatize collective
grasslands have increased pressure on rangeland
resulting in large-scale degradation.18 From 1980,
the privatization of farmland and introduction of
state incentives increased productivity in northern
China, largely driven by groundwater irrigation and
fertilizer use. Together with legal access regulations
and restrictions, the expansion of cropland into
environmentally-sensitive rangelands has been
slowed, and moving dunes and sand sheets partially
stabilized. However, this has been accompanied by
the rapid depletion of groundwater resources where
smallholder irrigation systems have increasingly
been replaced by large-scale pivot irrigation
schemes. These schemes tend to lower water
tables and today many lakes and wetlands have
disappeared as seen in satellite images.
Sahel In the past 50 years, an increase in sedentary
human presence and activities, together with climatic
variability, has caused major environmental changes
in the semi-arid Sahelian zone. The accumulation of
land change processes over vast stretches of the
Sahel’s croplands is significant, considering that
water resources are limited,19 population is still
growing, domestic food demands are increasing,
and cropland resources are scarce and managed
by smallholders with limited means and income.
Cultivation is mainly rainfed (except in parts of
Ethiopia) and, in general, on rather poor soils with
medium or low soil organic matter. Smallholder
systems are mainly low-input farming systems
mixed with high livestock densities and increasing
pressure from a growing sedentary population.
Slope value: Changes in NDVI (NDVI units) over total period
-0.05<
-0.05 — -0.04<
-0.04 — -0.03<
-0.03 — -0.02<
-0.02 — -0.01<
-0.01 — 0.01
>0.01 — 0.02
>0.02 — 0.03
>0.03 — 0.04
>0.04 — 0.05
>0.05
Not significant
Sahel (150-700mm/year precipitation isohyets)
UNCCD | Global Land Outlook | Chapter 4 | Convergence of Evidence 67

The degradation of arable lands has been a major
concern for livelihoods and food security in the
Sahel, but despite decades of intensive research on
human–environmental systems, there is no overall
consensus about the severity of land degradation.20
Earth observation data suggest an overall increase
in vegetation greenness that can be confirmed
by ground observations. However, it remains
unclear if the observed positive trends provide an
environmental improvement with positive effects on
people’s livelihoods.21 While there is no widespread
decrease in biomass productivity over the last 15
years, pockets of biomass decline can be seen.22
Long-term assessments of biodiversity at finer
scales highlight in some cases a negative trend in
species diversity.23 The Sahel underlines the need
to monitor land dynamics by combining long-term
information from Earth observation with in situ
observations that improve the understanding of
the site specific impact of changes in land use and
observed land cover trends
Brazil/Argentina Input-intensive farming schemes
on prime quality land, using large quantities of water
and fertilizer, for short-term economic gain put
land resources at risk by depleting and/or polluting
soil and water.25,26 Deforestation with subsequent
irrigated farming is, for instance, a threat to land
resources in the vast Chaco area in Argentina,
Paraguay, and Bolivia, where the native vegetation,
particularly dry forests, is undergoing one of the
highest deforestation rates in the world (see
Figure 4.26). This is attributed to rapid agricultural
expansion and intensification, especially for crop
production (e.g., soy, maize) and cattle ranching.27
Land transformations driven by cultivation have
resulted in significant losses of biodiversity,
landscape fragmentation, and a reduction in
essential ecosystem services,28 which will likely lead
to further land degradation.29 Monitoring is essential
to identify biophysical, social, political, and economic
drivers of changes and to develop land use planning
and management policies that mitigate or reverse
land degradation trends.
As in other countries where tropical and subtropical
climate predominates, agriculture in Brazil was
initially developed using traditional inversion
tillage, based on farmers’ experiences acquired in
temperate regions of the Northern Hemisphere.30
In this climate, the potential for land degradation
arises from a combination of soils highly vulnerable
to erosion, high pressure on land use, and intense
rainfall when soils are most susceptible to erosion.31
Annual soil losses were estimated at 0.8 billion tons
in areas under crops and pastures.32 Off-farm costs
of erosion were estimated at USD 1.3 billion.33
United States and Europe Input-intensive food
production systems are driven by mechanization and
high fertilizer applications that have made farmland
dependent on continuous inputs of nutrients to
ensure high yields. This is a risky balancing act, but
favorable economic situations have so far made
it possible to keep the land resource mostly in
equilibrium. Local farming practices often result
in water and wind erosion and other degradation
phenomena that, however, cannot be captured
universally at the scale of analysis with the current
datasets available.
Figure 4.26: Between 1976
and 2012, 20 per cent of
the whole ecoregion has
been transformed, with
an exponentially growing
annual transformation rate
in Paraguay. Areas colored from red (transformed in 1976) to yellow (transformed in 2013) show the extent and rapid pace of transformation of Dry Chaco into crops or pastures.
68 UNCCD | Global Land Outlook | Chapter 4 | Convergence of Evidence

© Dorin Vancea
UNCCD | Global Land Outlook | Chapter 4 | Convergence of Evidence 69
WHAT WE STAND TO LOSE: THE IMPORTANCE OF ECOSYSTEM SERVICES Land condition, including its productivity, plays a
key role in the potential of any given area to deliver
multiple goods and services; it is clear that declines
in LPD directly undermine their quantity and quality.
The key role that a healthy land base plays in the
delivery of ecosystem services is a fundamental
tenet of the Global Land Outlook, yet the preceding
analysis supports other studies that suggest that
the quality of ecosystem services is in decline. To put
this into perspective, in this section, we outline the
main terrestrial ecosystem services, many of which
we take for granted and which are now threatened
by land degradation and/or declines in productivity.
Ecosystem services are the goods and services
produced by or in conjunction with natural capital
that directly and indirectly benefit humans.
Land degradation and the subsequent loss of
biodiversity leads to a reduction in many vital
ecosystem services and thus greater food and water
insecurity.34 The impacts of land degradation can
be seen in lower crop yields, the reduced ability
of agricultural systems to resist exotic pests and
pathogens,35 and a general decline in the resilience
of ecosystem functions.36 This has negative
consequences for everyone, but generally impacts
the vulnerable and poorest people most severely.37
Ecosystem services are defined and categorized
in several ways. For example, the Millennium
Ecosystem Assessment suggests a simple typology
to summarize the various services from natural
capital, dividing them into supporting, provisioning,
regulating, and cultural services.38 There are
countless ecosystem services associated with
thousands of species and ecological interactions.
Some are only known to a small group of people
who recognize their value, such as the medicinal
benefits of a particular plant. As our societies
become more homogeneous, much of this traditional
ecological knowledge is being lost. Other ecosystem
values are much more widely recognized, affecting
whole communities, cities, countries, or acting at a
global level. Some of the key land-based ecosystem
services affected by land degradation are:
• Food security
• Water security
• Physical and mental health
• Disaster risk reduction
• Mitigating and adapting to climate change
• Cultural values
• Tourism including particularly ecotourism
• Raw materials
Many of these services are discussed in more detail
in Part Two of this Outlook (e.g., food, water, energy,
and climate) and only touched on briefly here; others
are discussed in slightly greater detail. The concept
of actively managing land resources to ensure the
delivery of ecosystem services (i.e., benefits to
humans) is increasingly being recognized, often
under the umbrella term “nature-based solutions.”39
1. Food securityAgriculture is dependent on a range of ecosystem
services (see Chapter 7): supporting services like
nutrient cycling and soil formation; and regulating
services such as water purification, atmospheric
regulation, and pollination.40 In addition, an
estimated 150 million people rely directly on wild
harvested food, including plants, fodder, game, and
fish.41 In southern Africa, the value of wild resource
consumption was estimated at USD 800 million
per year in 2005.42 Ecosystem services contribute
directly to food and nutritional security. Insects and
birds provide pollination services that are vital for
agriculture and currently estimated at having a total
economic value of USD 160 billion annually,43 albeit
under threat.44
A wide range of genetic variation is needed for
crop breeding to help species adapt to changing
environmental conditions, including new pests and
diseases. Agronomists draw on two sources for the
genetic materials to help develop crop resilience and
adaptability: the variation that exists in traditional
varieties of crops, known as landraces, and that
from closely-related wild species, known as crop wild
relatives (CWR). Given the multitude of crop threats,
both landraces and CWR are vital resources that will
help ensure future food security.45 It was estimated
some time ago that the introduction of new genes
from CWRs contributed approximately USD 20
billion towards increased crop yields per year in the
US alone and USD 115 billion worldwide.46 Yet these
values are often under-recognized and many centers
of crop diversity – places where a disproportionate
number of the world’s crop species originated – are
poorly conserved.47
Natural ecosystems are increasingly recognized as important places that promote physical and mental health and wellbeing.
70 UNCCD | Global Land Outlook | Chapter 4 | Convergence of Evidence
2. Water securityResilient, functioning ecosystems play a critical
role in water security, maintaining the quality and
in some cases the quantity of water as well as
regulating flows. Natural vegetation and healthy
soil can help maintain water quality and in some
circumstances increase the quantity of water
available (see Chapter 8).48 Today most of the
world’s population lives downstream of forested
watersheds:49 these offer higher quality water
supply than watersheds under alternative land uses,
which tend to be more disturbed, have increased
soil erosion, and are likely polluted by pesticides,
fertilizers, or toxic waste.50
Some ecosystems, such as cloud forests and the
paramos vegetation of central South America absorb
water droplets from clouds and increase net water
flow. For example, the cloud forests of La Tigra
National Park in Honduras provide more than 40
per cent of the water supply to Tegucigalpa, and in
Ecuador 80 per cent of Quito’s population receive
drinking water from two protected areas.51 Over
a third of the world’s 100 largest cities draw a
significant proportion of their drinking water from
protected forests.52 In some cases, the effects may
be felt hundreds or thousands of miles away from
the ecosystem supplying the service. Water vapor
from the Amazon travels thousands of miles south
to provide rainfall for some of the richest agricultural
area on the continent, which without these so-
called “flying rivers” would be far more arid.53
3. Physical and mental healthNatural ecosystems are increasingly recognized as
important places that promote physical and mental
health and well-being. Much of modern medicine is
derived from or replicated synthetically from natural
sources. Locally-collected traditional medicines are
a major resource for primary health care needs in
Asia, Latin America, and Africa,54 with more species
of medicinal plants harvested than any other natural
product.55 India and China harvest 90 per cent and
80 per cent respectively of their medicinal plants
from the wild.56 Natural medicines are traded
internationally, with a market estimated at over USD
50 billion annually.57 Wild species also provide raw
material for pharmaceutical development; forests
are particularly important sources of medicinal
compounds58 and some companies pay for the
right to explore in protected areas or other high
biodiversity regions..
More fundamentally, spending time in nature is
recognized as a critical factor in maintaining mental
and physical health. It has been calculated that, in
the United States, every USD 1 invested in physical
activity leads to a saving in medical costs of USD
3.2,59 and people with access to attractive public
spaces are likely to walk more.60 A growing number
of countries are encouraging walkers, runners,
and cyclists to use nature reserves as places to
exercise, also known as the green gym concept.
In Scotland, the health benefits of woodlands
have been estimated at between USD 17.6- 23.6
million per year (at 2006 prices) by helping to
avoid premature deaths and morbidity through
increased physical exercise, reduced air pollution,
savings in mental health costs, and reduced absence
from work.61 Natural environments help people
recuperate from mental fatigue and can enhance the
ability to recover from illness and injury, and cope
with stress.62
4. Disaster risk reductionNatural and well-managed ecosystems are
important for mitigating the impacts of extreme
weather events and the progression into full-
fledged disasters. The worst disasters, in terms
of loss of human life and economic costs, are
often in those places where natural defenses
have been degraded or destroyed.63 Forests
protect against floods, avalanches, typhoons and
hurricanes, desertification, droughts, and landslides;
wetlands can mitigate flooding; and coral reefs and
mangroves help to protect against storm surges,
tsunamis, and flooding.64,65
Some key benefits of ecosystem services in terms
of disaster risk reduction (DRR) are outlined in Table
4.2. Ecosystems that are healthy, functioning, and
diverse are more resilient to these hazards. After
the Asian tsunami of 2004, a study in Sri Lanka
found that an area with a diverse landscape of sand,
mangrove-fringed lagoons, coconut plantations,
scrub forest, and home gardens, was much less
seriously affected than areas that had been
cleared of natural vegetation, as these ecosystems
absorbed much of the energy of the waves.75
Conserving natural ecosystems is increasingly
seen as a way of protecting against hazards from
weather or severe events.76
UNCCD | Global Land Outlook | Chapter 4 | Convergence of Evidence 71

5. Climate change mitigation and adaptation
Healthy forests, grasslands, wetlands, and the
soil and sedimentation beneath them hold carbon
stocks and sequester atmospheric carbon, thus
playing a key role in climate change mitigation
(see Chapter 10): for example, wetlands hold
approximately 33 per cent of the planet’s carbon.78
Conversely, their destruction and release of
carbon is one of the factors leading to accelerating
climate change. Carbon flux management is an
important argument for persuading governments
to conserve natural ecosystems, although current
compensation schemes under Reducing Emissions
from Deforestation and Forest Degradation (REDD)+
are not usually enough on their own to make up
for the values forgone in development. The climate
mitigation values of natural ecosystems have also
now been reflected in the role of protected areas.79
Natural and well-managed ecosystems also help
society to adapt to changing climate by maintaining
the ecosystem services that are critical for survival:
for example, protecting shorelines from rising seas,
watersheds against flooding caused by heavy rain,
and wild food sources often help communities to
survive periods of emergency created by droughts
or other weather events.80
6. Cultural valuesNatural ecosystems are not devoid of human
influence. Many contain important archeological
sites, historic buildings, pilgrimage routes, and
traditional or sacred land uses. In the same way
that iconic buildings, writers, and football teams
can embody the heart of a nation or region, so too
can heritage landscapes and their species. Natural
areas often contain sacred sites or landscapes
that are cherished by local communities, such as
sacred groves, waterfalls, and mountains. Iconic
national parks like Yellowstone, the Blue Mountains
outside Sydney, the Lake District in the UK, and the
Japanese Alps have inspired artists and writers for
generations. On a more local scale, these natural
habitats provide rich sources of ideas and energy
for poets, painters, musicians, and other artists.
Box 4.3: Ecosystem services in the Mekong delta
Inland fisheries in the Mekong watershed yield an
estimated 2 million tons of fish a year,66 for example
contributing almost 80 per cent of animal protein
for people in Cambodia.67 Rising human populations
put these resources under threat. Protected areas
help regulate off-take: 60 per cent of fish caught
in the region come from Tonle Sap Lake, a UNESCO
Man and Biosphere reserve,68 and the Ream
National Park in Cambodia produces an estimated
USD 1.2 million a year to local residents from
fishing.69 In Lao PDR, Fish Conservation Zones are
co-managed for fisheries; villagers report significant
increases in stocks of over 50 fish species.70
Ecosystem services are an important form of
disaster risk reduction. Low-lying land and frequent
storms open the Mekong delta to coastal damage,
a situation likely to increase under climate change.
Natural barriers such as mangroves and corals
are increasingly valued. In Sri Lanka and Thailand,
mangrove species were found to be effective
barriers.71 The storm protection value of mangroves
in Thailand has been estimated at USD 27,264-
35,921 per hectare.72 Restoring mangroves can
be a cost-effective option for improving coastal
protection. A USD 1.1 million mangrove restoration
scheme in northern Vietnam provided effective
protection during typhoons and saved an estimated
USD 7.3 million a year in sea dyke maintenance.73
Poorer people still rely on collecting natural
products from the forest. In Nam Et National
Biodiversity Conservation Area in Lao PDR, 81
village communities depend on non-timber forest
products with a value estimated at USD 1.88
million/year (30 per cent cash income and the rest
subsistence), providing villagers in the region with
a higher than average per capita income.74
72 UNCCD | Global Land Outlook | Chapter 4 | Convergence of Evidence

Table 4.2: Role of natural
ecosystems in disaster
mitigation77
Event Role of Ecosystems
Flooding Providing space for floodwaters to dissipate without causing major damage
Absorbing the impacts of floods with natural vegetation
Landslide Stabilizing soil
Packing snow
Slowing earth, rock, and snow movement and limiting extent of damage
Storm surge,
tsunamis, erosion
Corals and mangroves creating a natural barrier to the force of waves
Roots stabilizing wetlands
Droughts and
desertification
Reducing pressure (particularly grazing pressure) thus reducing desert formation
Maintaining populations of drought resistant plants to serve as food during
droughts
Fires Limiting encroachment into the most fire-prone areas
Maintaining traditional management systems that have controlled fire
Protecting intact natural systems better able to withstand fire
Hurricanes and
typhoons
Mitigating floods and landslides
Buffering communities against impacts of storm events (e.g. storm surge)
Earthquakes Preventing or mitigating associated hazards including landslides and rock falls
© Adriel Kloppenburg
UNCCD | Global Land Outlook | Chapter 4 | Convergence of Evidence 73

Typology Value Example
Materials for construction
or for physical protection
(including timber, reeds,
bamboo, and grasses)
Housing In Mexico’s Yucatan peninsula, the value of palm thatch
for roofing material is estimated at USD 137 million per
year.85
Materials for grazing livestock
(e.g. grasses, plants)
Food
(livestock)
A significant percentage of India’s 471 million livestock
are sustained by forest grazing or fodder collected from
forests.86
Fuels
(e.g. timber, fuelwood)
Fuel (cooking
and heating)
In developing nations, 2.4 billion people – more than a
third of the world population – rely on wood or other
biomass fuels for cooking and heating.87
Materials for handicrafts
(including grasses, reeds,
seeds, wood, bamboo, etc.)
Income In Namibia’s Caprivi Game Reserve, one of the few
sources of income for local women is through the sale
of palm baskets to tourists. By 2001, these producers
had grown from 70 in the 1980s to more than 650.88
Materials collected and sold
(either as such or as inputs
into other products) to provide
income (including corals, sea
shells, rubber, cork, honey, etc.)
Income Matsutake mushrooms collected from China’s
Baimaxueshan Nature Reserve have helped to increase
incomes 5 to 10-fold in 70 villages.89 A kilogram of
these mushrooms can bring more income than the
average annual wage in Yunnan Province.90
Materials with traditional,
cultural, or spiritual value
Cultural/
spiritual
In the Nordic region NTFPs such as mushrooms, herbs,
and berries are extremely important culturally as well
as economically.91
Table 4.3: Examples of
materials collected from
natural ecosystems.
7. Tourism Tourism is a major source of income, generating
USD 7.2 trillion (or 9.8 per cent of global GDP) and
284 million jobs (1 in 11 jobs) to the global economy
in 2015.81 For many countries, natural or semi-
natural landscapes have allowed the development
of ecotourism, defined as “Responsible travel to
natural areas that conserves the environment and
improves the well-being of local people.”82 Global
spending on ecotourism has been increasing by 20
per cent a year, about six times the industry-wide
rate of growth.83 In Kenya, an estimated 80 per cent
of the tourism market is centered on wildlife, with
the overall tourism industry generating a third of the
country’s foreign exchange earnings.84 Ecotourism
depends on maintaining the quality of land
resources; a degraded landscape or disappearing
wildlife will no longer be attractive to visitors.
8. Raw materialsMany raw materials are collected from the wild,
often in huge volumes, including timber, fuelwood,
resin, rubber, grass, rattan, and minerals, with
many communities dependent on these for their
livelihoods. Examples are shown in Table 4.3 below.
Estimating the value of natural ecosystems
While provisioning services, such as food, fuel, and
fiber, have market values, the value of other benefits
from natural ecosystems can be assessed at three
levels: qualitative, quantitative, and monetary.85
Qualitative valuation focuses on non-numerical
values, for example by describing the role of a
particular mountain or landscape in defining local
culture and identity. Quantitative indicators of value
focus on numerical data, such as the number of
visitors to or quantity of carbon stored in a national
park. Monetary valuation reflects service values
in monetary terms, for example, by calculating
74 UNCCD | Global Land Outlook | Chapter 4 | Convergence of Evidence

Box 4.4: Assessing the value of national parks systems in Eastern Europe
In the Dinaric Arc region of Europe (the countries of
former Yugoslavia and Albania), an assessment was
carried out in 2013 and 2014, using a standardized
methodology,88 of ecosystem services in all the
national parks in the region. Workshops provided an
insight into local cultures and traditions and raised
awareness on the range of benefits provided by
the park. Some clear patterns emerged across the
region of how protected areas can better promote
conservation, protect local culture, and develop
sustainable funding strategies: in 96 per cent of
protected areas, stakeholders receive economic
benefits from tourism, and commercial water use
has a major economic value in over half, while 60
per cent of protected areas have local food values.
There is potential in developing branding for local/
regional products from protected areas (e.g. honey,
mushrooms, medicinal plants, cheese). Protected
areas were a major employer in regions that had
suffered rural decline, making their future important
to local politicians. A bottom-up assessment
system, involving over a thousand people in 58
national parks, provides clear information about the
values of ecosystem services, even if many of these
had not been calculated in economic terms.89
CONCLUSION
Maintaining or improving the productive capacity of land and its associated resources requires us to maintain and surpass a position of “no net loss” of land quality. This is a matter of preserving or enhancing the ability of soil, water, and biodiversity to support the necessary ecosystem functions and services to meet the demands of today and the needs of the future.
More sustainable management of land resources
can help close yield gaps, increase resilience to
stress and shocks, and thus support human health,
well-being, and security in the long term. The WAD
provides a useful global overview of status and
trends in the condition of our land resources as
well as the potential human impacts. By identifying
those areas under stress, decision-makers can be
empowered to take remedial actions and create
a supportive environment for stakeholders to do
the same.
the revenue generated by fish caught in a river
system or the value of carbon stored in a peatland
assuming there are markets for these services.
It is primarily the provisioning services that can be
captured through monetary indicators. Therefore,
a comprehensive assessment of benefits is likely
to build on a combination of all three.
An estimate for the total global ecosystem services
in 2011 was USD 125-145 trillion per year.86 The
challenge is how to incorporate these values in
decision-making: for an individual land owner or
someone using a natural resource, it is often more
profitable in the short term to degrade the resource
even though the cost to the wider society is much
greater. Payment for Ecosystem Service (PES)
schemes is an attempt to address these issues by
making direct payments to those who maintain
and restore ecosystem services. How these values
benefit the poorest people is a more complex
question and depends on issues such as governance
quality, rule of law, degree of corruption, and the
willingness of decision-makers to support poverty
reduction programmes.87
UNCCD | Global Land Outlook | Chapter 4 | Convergence of Evidence 75

REFERENCES1 Joint Research Centre of the European Commission. Forthcoming. World Atlas of Desertification. 3rd edition. Ispra, Italy.2 http://www.unccd.int/en/programmes/Science/Monitoring-Assessment/Documents/Decision22-COP11.pdf 3 http://www.millenniumassessment.org/en/index.html4 Yengoh, G.T., Dent, D., Olsson, L., Tengberg, A.E., and Tucker III, C.J. 2015.Use of the Normalized Difference Vegetation Index (NDVI) to Assess Land Degradation at Multiple Scales. Springer.5 GEO. 2017. Earth Observations in support of the 2030 Agenda for Sustainable Development. Geneva. http://www.earthobservations.org/documents/publications/201703_geo_eo_for_2030_agenda.pdf 6 Metcalfe, D.J. and Bui, E.N. 2017. Australia State of the Environment 2016: Land. Australian Government Department of the Environment and Energy, Canberra.7 Geist, H.J. and Lambin, E.F. 2004. Dynamic causal patterns of desertification. Bioscience 54: 817-829.8 Craglia, M. and Shanley, L. 2015. Data democracy – increased supply of geospatial information and expanded participatory processes in the production of data. International Journal of Digital Earth 8-9: 1-15.9 Ramankutty, N., Evan, A.T., Monfreda, C., and Foley, J.A. 2008. Farming the planet: 1. Geographic distribution of global agricultural lands in the year 2000. Global Biogeochemical Cycles 22 doi:10.1029/2007GB002952.10 Hansen, M.C., Potapov, P.V., Moore, R., Hancher, M., Turubanova, S.A., et al. 2013. High-resolution global maps of 21st-century forest cover change. Science 342: 850-853.11 For example Geist, H. 2005. The Causes and Progression of Desertification. Gower Publishing, London.12 Pekel, F., Cottam, A., Gorelick, N., and Belward, A.S. 2016. High-resolution mapping of global surface water and its long-term changes. Nature 540: 418-422.13 Thornton, P.K. 2010. Livestock production: Recent trends, future prospects. Philosophical Transactions of the Royal Society B: Biological Sciences 365: 2853-2867.14 Eswaran, H., Reich, P., and Vearasilp, T. 2004. Perspectives on desertification during the Anthropocene. In: Faz Cano, A., Ortiz, R., and Garcia, G. (eds.) Fourth International Conference on Land Degradation, Cartagena, Murcia, Spain, September 2004. ISBN 84-95781-42-5.15 Mythili, G. and Goedecke, J. 2015. Economics of land degradation in India. In: Nkonya, E.M., Mirzabaev, A., and von Braun, J. (eds.) Economics of Land Degradation and Improvement – A Global Assessment for Sustainable Development. Springer International Publishing, Cham. pp. 431-469.16 Indian Space Research Organisation. 2016. Desertification and Land Degradation Atlas of India. Government of India, Delhi.17 PR China State Forestry Administration. 2008. Atlas of Desertified and Sandified Land in China. 18 Conte, T.J. 2015. The effects of China’s grassland contract policy on Mongolian herders’ attitudes towards grassland management in northeastern Inner Mongolia. Journal of Political Ecology 22: 79-97.19 Pekel, J.F., et al. 2016. Op. Cit.20 Rasmussen, K., D’haen, S., Fensholt, R, Fog, B., Horion, S., et al. 2016. Environmental change in the Sahel: reconciling contrasting evidence and interpretations. Regional Environmental Change 16 (3): 673-680.21 Herrmann, S.M., Sall, I., and Oumar, S. 2014. People and pixels in the Sahel: A study linking coarse-resolution remote sensing observations to land users’ perceptions of their changing environment in Senegal. Ecology and Society 19 (3): http://dx.doi.org/10.5751/ES-06710-190329.22 Fensholt, R., Langanke, T., Rasmussen, K., Reenberg, A., Prince, S.D., et al. 2012. Greenness in semi-arid areas across the globe 1981-2007 — an Earth observing satellite based analysis of trends and drivers. Remote Sensing of Environment 121: 144-158.23 Brandt, M., Hiernaux, P., Tagesson, T., Verger, A., Rasmussen, K., et al. 2016. Woody plant cover estimation in drylands from Earth observation based seasonal metrics. Remote Sensing of Environment 172: 28-38.24 Fensholt, R., Rasmussen, K., Kaspersen, P., Huber, S., Horion, S., et al. 2013. Assessing land degradation/recovery in the African Sahel from long-term Earth observation based primary productivity and precipitation relationships. Remote Sensing 5 (2): 664-686.25 Wassenaar, T., Gerber, P., Verburg, P.H., Rosales, M., Ibrahim, M., et al. 2007. Projecting land use changes in the Neotropics: The geography of pasture expansion into forest. Global Environmental Change 17: 86-104. 26 Zak, M.R., Cabido, M., Cáceres, D., and Díaz, S. 2008. What drives accelerated land cover change in central Argentina? Synergistic consequences of climatic, socioeconomic, and technological factors. Environmental Management 42: 181-189.
27 Vallejos, M., Volante, J.N., Moscario, M.J., Vale, L.M., Bustamante, M.L., et al. 2015. Transformation dynamics of the natural forest cover in the Dry Chaco ecoregion: A plot level geo-database from 1976-2012. Journal of Arid Environments 123: 3-11.28 REDAF. 2012. Monitoreo de Deforestación en los Bosques Nativos de la Región Chaqueña. Red Agroforestal Chaco Argentina, 1-34.29 Grau, H.R., Tortres, R., Gasparri, N.I., Blendinger, P.G., Marinaro, S, et al. 2015. Natural grassland in the Chaco: A neglected ecosystem under threat by agriculture expansion and forest-orientated conservation policies. Journal of Arid Environments 123: 40-46.30 De Freitas, P.L. de and Landers, J.N. 2014. The transformation of agriculture in Brazil through development and adoption of Zero Tillage Conservation Agriculture. International Soil and Water Conservation Research 2 (1): 35-46.31 Ramalho-Filho, A., de Freitas P.L., and Claessen, M.E.C. 2009. Land degradation and the zero-tillage system in Brazil. Advances in GeoEcology 40: 311-324.32 Hernani, L.C., de Freitas, P.L., Pruski, F.F., de Maria, I.C., Castro-Filho, C., et al. 2002. A Erosão e seu Impacto (Water Erosion and its impact). In: Manzatto, C.V., Freitas-Júnior, E. and Peres, J.R.R. (eds.) Uso agrícola dos solos Brasileiros (Agricultural use of Brazilian Soils). Embrapa, Rio de Janeiro, pp. 47-60.33 Landers, J.N., Barros, G S., de Rocha, M.T., Manfrinato, W.A., and Weiss, J. 2001. Environmental impacts of zero tillage in Brazil: A first approximation. Proceedings of the World Congress on Conservation Agriculture. Conservation agriculture: A worldwide challenge. FAO-ECAF, Madrid, pp. 317-326.34 Díaz, S., Fargione, J., Chappin III, S.F., and Tilman, D. 2006. Biodiversity loss threatens human wellbeing. PLoS Biology 4 (8): 1300-1305.35 Cardinale, B.J., Duffy, J.E., Gonzalez, A., Hooper, D.U., Perrings, C., et al. 2012. Biodiversity loss and its impact on humanity. Nature 486: 59-67.36 Oliver, T.H., Isaac, N.J.B., August, T.A., Woodcock, B.A., Roy, D.B, et al. 2015. Declining resilience of ecosystem functions under biodiversity loss. Nature Communications. DOI: 10.1038/ncomms10122.37 Agrawal, A. and Redford, K. 2006. Poverty, Development, and Biodiversity Conservation: Shooting in the Dark? Working Paper number 26. Wildlife Conservation Society, New York.38 Millennium Ecosystem Assessment. 2003. Ecosystems and Human Wellbeing: A framework for assessment, Millennium Ecosystem Assessment, Island Press, Covelo, California and New York.39 Cohen-Sacham, E., Walters, G. Janzen, C., and Maginnis, S. (eds.) 2016. Nature-based solutions to address societal challenges. IUCN, Gland, Switzerland.40 Zhang, W., Ricketts, T.H., Kremen, C., Carney, K., and Swinton, S.M. 2007. Ecosystem services and dis-services to agriculture. Ecological Economics 56 (2): 253-260. doi:10.1016/j.ecolecon.2007.02.02441 Elliott, J., Grahn, R., Sriskanthan, G., and Arnold, C. 2002. Wildlife and Poverty Study, Department for Environmental Development, London, UK.42 Millennium Ecosystem Assessment. 2005. General Synthesis Report. Island Press, Washington, DC.43 Gallai, N., Salles, J.M., Settele, J., and Vaissière, B.E. 2009. Economic valuation of the vulnerability of world agriculture confronted with pollinator decline. Ecological Economics 68: 810-821.44 Goulson, D., Nicholls, E., Botias, C., and Rotheray, E.L. 2015. Bee declines driven by combined stress from parasites, pesticides and lack of flowers. Science, 347 (6229): 1255957.45 Hunter, D. and Heywood, V.H. (eds.) 2011. Crop Wild Relatives: A Manual of In Situ Conservation. Earthscan, London.46 Pimentel, D., Wilson, C., McCullum, C., Huang. R., Dwen, P., et al. 1997. Economic and environmental benefits of biodiversity. BioScience 47: 747-757.47 Stolton, S., Boucher, T., Dudley, N., Hoekstra, J., Maxted, N., et al. 2008. Ecoregions with crop wild relatives are less well protected, Biodiversity 9 (1-2): 52-55.48 Hamilton, L. 2008. Forests and Water. FAO Forestry paper 155. FAO, Rome.49 Reid, W.V. 2001. Capturing the value of ecosystem services to protect biodiversity. In: Chichilenisky, G., Daily, G.C., Ehrlich, P., Heal, G., et al. (eds.) Managing human-dominated ecosystems, Monographs in Systematic Botany 84, Missouri Botanical Garden Press. St Louis, USA.50 Stolton, S. and Dudley, N. (eds.) 2010. Arguments for Protected Areas. Earthscan, London.51 http://www.un-page.org/countries/page-exchange/ecuador52 Dudley, N. and Stolton, S. 2003. Running Pure: The importance of forest protected areas to drinking water, WWF, Gland.
76 UNCCD | Global Land Outlook | Chapter 4 | Convergence of Evidence
53 Nobre, A.D. 2014. The Future Climate of Amazonia: Scientific Assessment Report. ARA: CCST-INPE: INPA. São José dos Campos, SP, Brazil.54 World Health Organization. 2002. WHO Traditional Medicine Strategy 2002-2005. WHO, Geneva.55 Hamilton, A., Dürbeck, K., and Lawrence, A. 2006. Towards a sustainable herbal harvest: A work in hand. Plant Talk, 43: January.56 Alves, R.R.N. and Rosa, L.M.L. 2007. Biodiversity, traditional medicine and public health: Where do they meet? Journal of Ethnobiology and Ethnomedicine 3: 14. doi:10.1186/1746-4269-3-14.57 Cunningham, A.B., Shanley, P., and Laird, S. 2008. Health, habitats and medicinal plant use. In: Colfer, C.J.P. (ed.), Human health and forests: A global overview of issues, practice and policy. Earthscan, London.58 Pierce Colfer, C.J., Sheil, D., and Kishi, M. 2006. Forests and human health: Assessing the evidence. CIFOR Occasional Paper 45. Center for International Forestry Research, Bogor, Indonesia.59 Bird, W. 2004. Natural Fit: Can Green Space and Biodiversity Increase Levels of Physical Activity? RSPB and The Faculty of Public Health, UK.60 Giles-Corti, B., Broomhall, M.H., Knuiman, M., Collins, C., Douglas, K., et al. 2005. Increasing walking – How important is distance to, attractiveness, and size of public open space? American Journal of Preventative Medicine 28: 2.61 RPA and Cambridge Econometrics. 2008. The Economic Impact of Scotland’s Natural Environment. Scottish Natural Heritage Commissioned Report No. 304, Scotland.62 Maller, C., Townsend, M., Pryor, A., Brown, P., and St. Leger, L. 2006. Healthy nature – healthy people: ‘Contact with nature’ as an upstream health promotion intervention for populations. Health Promotion International 21 (1): 45-54.63 Abramovitz, J. 2001. Unnatural Disasters. Worldwatch Paper 158, Worldwatch Institute, Washington, DC.64 Stolton, S., Dudley, N., and Randall, J. 2008. Natural Security: Protected areas and hazard mitigation. WWF, Gland, Switzerland.65 Renaud, F.G., Sudmeier-Rieux, K., and Estrella, M. (eds.) 2013. The Role of Ecosystems in Disaster Risk Reduction. United Nations University Press, Tokyo, New York, Paris.66 Welcomme, R.L., Cowx, I.G., Coates, D., Béné, C., Funge-Smith, S., et al. 2010. Inland capture fisheries. Philosophical Transactions of the Royal Society B 365: 2881-2896.67 Hortle, K.G. 2007. Consumption and the yield of fish and other aquatic animals from the Lower Mekong Basin. MRC Technical Paper 16, Mekong River Commission: Vientiane, Laos.68 ICEM. 2003. Regional Report on Protected Areas and Development: Review of Protected Areas and Development in the Lower Mekong River Region. ICEM, Indooroopilly, Queensland, Australia.69 Emerton, L. (ed.) 2005. Values and Rewards: Counting and Capturing Ecosystem Water Services for Sustainable Development. IUCN, Ecosystems and Livelihoods Group Asia, Sri Lanka.70 Baird, I. 2000. Integrating Community-Based Fisheries Co-Management and Protected Areas Management in Lao PDR: Opportunities for Advancement and Obstacles to Implementation. Evaluating Eden Series. International Institute for Environment and Development, London, UK.71 Tanaka, N., Sasaki, Y. Mowjood, M.I.M., Jinadasa, K.B.S.N., and Homchuen, S. 2007. Coastal vegetation structures and their functions in tsunami protection: Experience of the recent Indian Ocean tsunami. Landscape and Ecological Engineering 3: 1. DOI:10.1007/s11355-006-0013-972 Sathirathai, S. and Barbier, E.B. 2001. Valuing mangrove conservation in Southern Thailand. Contemporary Economic Policy 19: 109-122.73 Brown, O., Crawford, A., and Hammill, A. 2006. Natural Disasters and Resource Rights: Building resilience, rebuilding lives. International Institute for Sustainable Development, Manitoba, Canada.74 ICEM. 2003. Lessons learned in Cambodia, Lao PDR, Thailand and Vietnam. ICEM, Indooroopilly, Queensland, Australia.75 Caldecott, J. and Wickremasinghe, W.R.M.S. 2005. Sri Lanka: Post-Tsunami Environmental Assessment. United Nations Environment Programme, Nairobi.76 Murti, R. and Buyck, C. (eds.) 2014. Safe Havens: Protected areas for disaster risk reduction and climate change adaptation. IUCN, Gland, Switzerland.77 Drawn from Stolton, S., et al. 2008. Op cit. 78 Pritchard, D. 2009. Reducing Emissions from Deforestation and Forest Degradation in developing countries (REDD) - the link with wetlands. A background paper for Foundation for International Environmental Law and Development, London.
Part One CHAPTER 4
79 Dudley, N., Stolton, S., Belokurov, A., Krueger, L., Lopoukhine, N., et al. (eds.) 2009. Natural Solutions: Protected areas helping people cope with climate change, IUCN-WCPA, TNC, UNDP, WCS, The World Bank and WWF, Gland, Switzerland, Washington, DC, and New York.80 Andrade Pérez, A., Herrera Fernandez, B., and Cazzolla Gatti, R. (eds.) 2010. Building Resilience to Climate Change: Ecosystem-based adaptation and lessons from the field. IUCN, Gland, Switzerland.81 http://www.wttc.org/research/economic-research/economic-impact-analysis/#undefined accessed January 16, 2017.82 TIES website : www.ecotourism.org83 TEEB. 2009. The Economics of Ecosystems and Biodiversity, Summary for Policy Makers. UNEP and EC, Nairobi and Brussels.84 The International Ecotourism Society, 2000 Ecotourism Statistical Fact Sheet.85 Kettunen, M. and ten Brink, P. (eds.) 2013. Social and Economic Benefits of Protected Areas: An assessment guide. Routledge, UK.86 Costanza, R., de Groot, R., Sutton, P., van der Ploeg, S., Anderson, S.J., et al. 2014. Changes in the global value of ecosystem services. Global Environmental Change http://dx.doi.org/10.1016/j.gloenvcha.2014.04.002.87 Dudley, N., Mansourian, S., Stolton, S., and Suksuwan, S. 2008. Safety Net: Protected areas and poverty reduction, WWF International, Gland, Switzerland.88 Stolton, S. and Dudley, N. 2009. The Protected Areas Benefits Assessment Tool. WWF International, Gland, Switzerland.89 Ivanić, K.Z., Štefan, A., Porej, D., and Stolton, S. 2017. Using a participatory assessment of ecosystem services in the Dinaric Arc of Europe to support protected area management. PARKS 23 (1): 61-74.
UNCCD | Global Land Outlook | Chapter 4 | Convergence of Evidence 77
Related Documents


