19 Ann. Fac. Medic. Vet. di Parma (Vol. XXV, 2005) - pag. 19 - pag. 46 CONTROLLING FOR CONFOUNDING IN CASE-CONTROL STUDIES Parodi S. 1 , Bottarelli E. 2 Introduction The case-control study is an observational epidemiological investigation, characterized by the measure of past exposure to risk factors, of two separate groups, named “cases” and “controls” (Breslow and Day, 1980; Kleinbaum et al., 1982). For this reason it is also known as “retrospective study”. Information about past exposures and other factors possibly associated with the disease under study is generally collected by an anamnestic procedure, based on the administration of a questionnaire. Sometimes, information from genetic analyses or biological samples is also collected. The case-control study differs from the cross-sectional study in the selection of cases and controls from two different populations. Moreover, it differs from the cohort (or follow-up) study, which gathers information on one population unaffected by the disease under study and followed up to detect the occurrence of a specific phenomenon (e.g., incidence of diseases or mortality for specific causes, in general after the identification of an exposed sub-cohort). Among the major advantages of the case-control study, which account for its large diffusion in environmental epidemiology, there are ethical reasons, because this study is directly applicable to human beings, since the exposures are not administered by an experimenter. Differently from cohort studies, it also allows: a) evaluation of the joint effect of many exposures; b) easy collection of information about many possible confounders. Moreover, it has a higher statistical power, as it includes a higher number of cases, especially when it is focused on rare diseases, that have a low incidence and can be evaluated only after a long observation period. Furthermore, it is less expensive and may be carried out in a shorter time. Despite these advantages, the case-control study has some limits, especially when compared with the cohort study: a) it is unsuited to evaluate the effect of rare exposures, even if such a limit is present only when the prevalence of exposed individuals in the cases series is low; b) it can only provide relative estimates of disease occurrence, even though it may provide incidence rates estimation, when population-based; c) it is prone to many biases, including the unproper selection of either cases or (more commonly) controls (selection biases) and the different quality or completeness of information drawn from the cases compared to the controls (information biases). In particular, especially in human medicine, cases tend to correlate the onset of their disease with specific risk 1 Epidemiology and Biostatistics Section, Scientific Directorate, G. Gaslini Childrenʼ s Hospital, Largo G. Gaslini 5, 16147 Genoa (Italy); e-mail: [email protected] 2 Università degli Studi di Parma, Dipartimento di Salute Animale. Via del Taglio 10, 43100 PARMA. e-mail: [email protected]

Welcome message from author
This document is posted to help you gain knowledge. Please leave a comment to let me know what you think about it! Share it to your friends and learn new things together.
Transcript

19
Ann. Fac. Medic. Vet. di Parma (Vol. XXV, 2005) - pag. 19 - pag. 46
CONTROLLING FOR CONFOUNDINGIN CASE-CONTROL STUDIES
Parodi S.1, Bottarelli E.2
Introduction
The case-control study is an observational epidemiological investigation, characterized by the measure of past exposure to risk factors, of two separate groups, named “cases” and “controls” (Breslow and Day, 1980; Kleinbaum et al., 1982). For this reason it is also known as “retrospective study”. Information about past exposures and other factors possibly associated with the disease under study is generally collected by an anamnestic procedure, based on the administration of a questionnaire. Sometimes, information from genetic analyses or biological samples is also collected.
The case-control study differs from the cross-sectional study in the selection of cases and controls from two different populations. Moreover, it differs from the cohort (or follow-up) study, which gathers information on one population unaffected by the disease under study and followed up to detect the occurrence of a specifi c phenomenon (e.g., incidence of diseases or mortality for specifi c causes, in general after the identifi cation of an exposed sub-cohort).
Among the major advantages of the case-control study, which account for its large diffusion in environmental epidemiology, there are ethical reasons, because this study is directly applicable to human beings, since the exposures are not administered by an experimenter. Differently from cohort studies, it also allows: a) evaluation of the joint effect of many exposures; b) easy collection of information about many possible confounders. Moreover, it has a higher statistical power, as it includes a higher number of cases, especially when it is focused on rare diseases, that have a low incidence and can be evaluated only after a long observation period. Furthermore, it is less expensive and may be carried out in a shorter time. Despite these advantages, the case-control study has some limits, especially when compared with the cohort study: a) it is unsuited to evaluate the effect of rare exposures, even if such a limit is present only when the prevalence of exposed individuals in the cases series is low; b) it can only provide relative estimates of disease occurrence, even though it may provide incidence rates estimation, when population-based; c) it is prone to many biases, including the unproper selection of either cases or (more commonly) controls (selection biases) and the different quality or completeness of information drawn from the cases compared to the controls (information biases). In particular, especially in human medicine, cases tend to correlate the onset of their disease with specifi c risk
1 Epidemiology and Biostatistics Section, Scientifi c Directorate, G. Gaslini Childrenʼs Hospital, Largo G. Gaslini 5, 16147 Genoa (Italy); e-mail: [email protected] 2 Università degli Studi di Parma, Dipartimento di Salute Animale. Via del Taglio 10, 43100 PARMA. e-mail: [email protected]

20
Ann. Fac. Medic. Vet. di Parma (Vol. XXV, 2005) - pag. 19 - pag. 46
factors, thus reporting past exposures too much extensively with respect to controls. Such information bias is characteristic of case-control studies and it is known as “recall bias”. Finally, as in most observational studies and in many experimental studies, the presence of variables associated with both exposures and disease onset may induce a bias in the association estimates (confounding bias). Differently from selection and information biases, which are hard to control, the effect of confounding bias may be managed either in the phase of study design or during data analysis. The main strategies to control for confounding in case-control studies are illustrated in the next paragraphs, while their planning and implementation have been illustrated elsewhere (Parodi and Bottarelli, 2004).
Measures of association in the case-control study
In the simple case of a dichotomous exposure and in the absence of confounders, the result of a case-control study may be resumed in a 2x2 table as follows:
Table 1. Result of a case control study with exposure reported at two levels (either present or absent).
Disease condition
Cases Controls Total
Exposed a b a+bExposure
Ocurrence Unexposed c d c+d
a+c b+d a+b+c+d
The most common estimator of association in case-control studies is the Exposure Odds Ratio (OR), which represents an estimate of the Risk OR and, therefore, is a relative risk estimator.
It may be calculated by the following simple equation:
cbdaRO
(1)
Under the (null) hypothesis of no-effect of the exposure, the expected OR value equals 1, while under the hypothesis of a higher risk for the exposed group, this value will be higher. Finally, in the case of a protective effect of the exposure, OR will range between 0 and 1, and the risk factor should accordingly be called

21
Ann. Fac. Medic. Vet. di Parma (Vol. XXV, 2005) - pag. 19 - pag. 46
“protective factor”. If the sampling of cases and controls is not independently performed, in
particular when controls are “matched “ to cases by some specifi c characteristic (like age or gender), as illustrated in the next paragraph, data will still be resumed in a 2x2 table, as follows:
Table 2. Result of a case-control study with matched data (matching ratio 1:1) and exposure at two levels (present or absent).
Exposed
Controls
Unexposed
Controls
Total
Exposed Cases A B A+B
Unexposed Cases C D C+D
Total A+C B+D A+B+C+D
In that case, the OR estimate may be obtained looking at the couples of cases and controls with discordant appearance, i.e., ignoring the exposed cases matched with the exposed controls and the unexposed cases matched with the unexposed controls. OR estimate is easily obtained as follows:
CB
RO
(2)
When actual data are analysed, i.e., using a fi nite sample, it is necessary to evaluate if an OR different from 1 results either from an association between exposure and risk of disease, or from the random fl uctuation related to sampling variability. Such evaluation is the object of the statistical inference, and it may be performed by calculating the confi dence limits of the OR at a selected 1-α value (in general, 95% or 90%). Some methods have been described in a previous paper (Parodi and Bottarelli, 2004). In this review, the Woolf method, which assumes a log-normal distribution for the OR, will be shortly illustrated by some numerical examples.
The estimate of the variance of the (natural) logarithm of an OR, obtained from a table like Table 1, may be calculated under the assumption of the independence of a, b, c and d fi gures (conditional to the number of cases and controls), as follows:
dcbaORraV 1111lnˆ
(3) The corresponding confi dence interval (CI) for the ln(OR) is easily computed,

22
Ann. Fac. Medic. Vet. di Parma (Vol. XXV, 2005) - pag. 19 - pag. 46
and the corresponding CI of OR can be obtained by exponentiating these values:
ORraVzeORORCI lnˆ2/%95(4)
where za/2
is the critical value of the standardized normal distribution (e.g., z = 1.96 for α = 0.05). If the CI does not contain the expected OR value of 1, a statistically signifi cant association between exposure and disease risk can be assumed.
In the case of a matched study (Table 2), the counts within A, B, C and D cells are not independent. The CI estimate of the corresponding OR may be obtained from the relation linking the binomial function to the Fisherʼs F distribution (Pearson and Hartley, 1966, cited in Parodi and Bottarelli, 2004). More simply, equation 4 may be applied using the following estimate of the variance of ln(OR), according to Silcocks (2005):
CBORraV 11lnˆ
(5)
where counts B and C are extracted from Table 2.
Confounding and effect modifying
As already briefl y mentioned, in case-control study and other epidemiological investigations, it is mandatory to control for the possible effect of extraneous variables, which might infl uence the outcome of the analyses when associated with both the exposure levels and the risk of disease. Such a phenomenon is known as “confounding” and the related variables are called “confounders”. For example, both in animals and in human beings, ageing is associated with the risk of numerous diseases (e.g., incidence of most cancers). If the exposure is not homogeneously distributed among different age groups, its effect may be hidden by the effect of ageing. Differently from the other biases (i.e., selection and information biases), confounding may be controlled both during the study design and at the stage of data analysis. In experimental studies such a control may be performed by the randomization process, while in observational investigations, as the case-control study, the distribution of confounders may be measured (at least partly) by the researchers, who may thus reduce their effect by adequate strategies.
Figure 1 shows an example of the effect of a hypothetical confounder measured at two levels on the basis of the occurrence of a specifi c feature (e.g., male or female gender, Caucasian or Afro-American ethnic group, etc.). When confounding is not taken into account, no association emerges between the risk estimator (which in the case-control studies is almost invariably the OR) and the exposure (Figure 1, left). After having identifi ed the two confounder categories (corresponding to black

23
Ann. Fac. Medic. Vet. di Parma (Vol. XXV, 2005) - pag. 19 - pag. 46
and white squares in Figure 1, right), a positive association emerges.
Figure 1 – Example of confounding in an epidemiological study
Another example of the possible effect of a confounder, when also the exposure is measured on a categorical scale, may be a (hypothetical) case-control study, where the proportion of exposed subjects and the disease risk (and, accordingly, the proportion of cases and controls) are associated with another categorical variable (e.g., gender). In that case, the occurrence of confounding may be highlighted by comparing the estimates of association between risk and exposure obtained either using the pooled data set or after stratifying by the levels of the confounder. In particular, in a case-control study with dichotomous (e.g., present/absent) exposure and confounding variable, such a comparison may be performed analyzing the following table:
Table 3. Result of a hypothetical case-control study without matching, using either pooled data (part a) or data stratifi ed by a two-level confounder (part b and part c).
a) All subjects b) Stratum 1 c) Stratum 2
Cases Controls Cases Controls Cases Controls
Exposed a b Exposed a1 b1 Exposed a2 b2
Unexposed c d Unexposed c1 d1 Unexposed c2 d2
ORT=ad/bc OR1= a1 d1/ b1 c1 OR2= a2 d2/ b2 c2
If OR1 and OR
2 are similar, but differ from OR
T, confounding will occur.
Conversely, if at least one is different from ORT, but they also differ from one another,
an interaction between the confounder and the exposure will occur, as illustrated further on in this paragraph. Finally, if OR
T, OR
1 and OR
2 are similar, there is no
evidence of the presence either of confounding or of interaction.
Example 1
24
Ann. Fac. Medic. Vet. di Parma (Vol. XXV, 2005) - pag. 19 - pag. 46
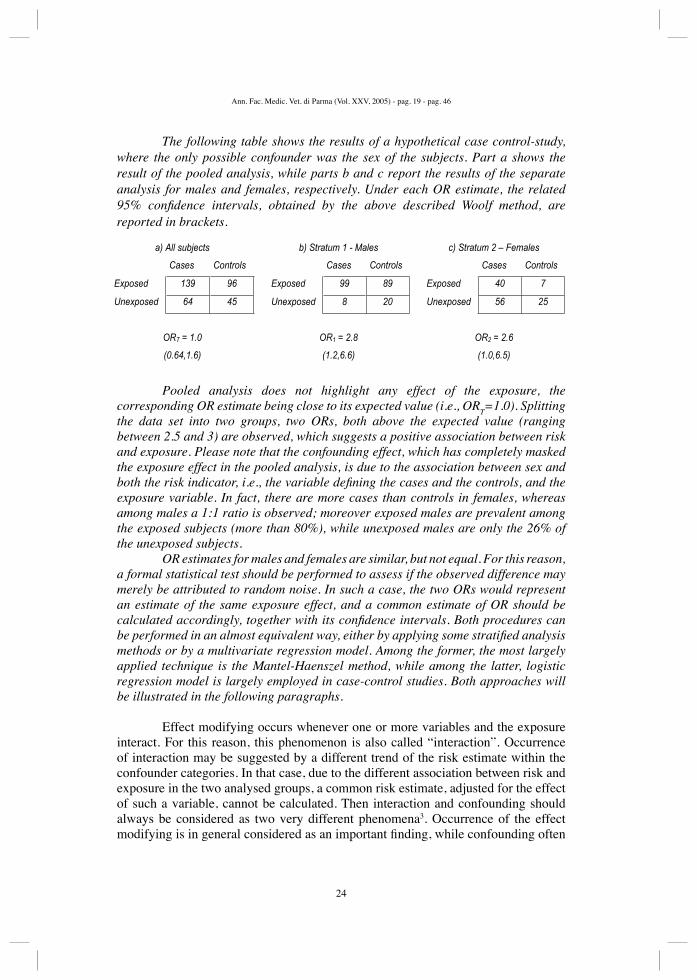
The following table shows the results of a hypothetical case control-study, where the only possible confounder was the sex of the subjects. Part a shows the result of the pooled analysis, while parts b and c report the results of the separate analysis for males and females, respectively. Under each OR estimate, the related 95% confi dence intervals, obtained by the above described Woolf method, are reported in brackets.
a) All subjects b) Stratum 1 - Males c) Stratum 2 – Females
Cases Controls Cases Controls Cases Controls
Exposed 139 96 Exposed 99 89 Exposed 40 7
Unexposed 64 45 Unexposed 8 20 Unexposed 56 25
ORT = 1.0
(0.64,1.6)
OR1 = 2.8
(1.2,6.6)
OR2 = 2.6
(1.0,6.5)
Pooled analysis does not highlight any effect of the exposure, the corresponding OR estimate being close to its expected value (i.e., OR
T=1.0). Splitting
the data set into two groups, two ORs, both above the expected value (ranging between 2.5 and 3) are observed, which suggests a positive association between risk and exposure. Please note that the confounding effect, which has completely masked the exposure effect in the pooled analysis, is due to the association between sex and both the risk indicator, i.e., the variable defi ning the cases and the controls, and the exposure variable. In fact, there are more cases than controls in females, whereas among males a 1:1 ratio is observed; moreover exposed males are prevalent among the exposed subjects (more than 80%), while unexposed males are only the 26% of the unexposed subjects.
OR estimates for males and females are similar, but not equal. For this reason, a formal statistical test should be performed to assess if the observed difference may merely be attributed to random noise. In such a case, the two ORs would represent an estimate of the same exposure effect, and a common estimate of OR should be calculated accordingly, together with its confi dence intervals. Both procedures can be performed in an almost equivalent way, either by applying some stratifi ed analysis methods or by a multivariate regression model. Among the former, the most largely applied technique is the Mantel-Haenszel method, while among the latter, logistic regression model is largely employed in case-control studies. Both approaches will be illustrated in the following paragraphs.
Effect modifying occurs whenever one or more variables and the exposure interact. For this reason, this phenomenon is also called “interaction”. Occurrence of interaction may be suggested by a different trend of the risk estimate within the confounder categories. In that case, due to the different association between risk and exposure in the two analysed groups, a common risk estimate, adjusted for the effect of such a variable, cannot be calculated. Then interaction and confounding should always be considered as two very different phenomena3. Occurrence of the effect modifying is in general considered as an important fi nding, while confounding often

25
Ann. Fac. Medic. Vet. di Parma (Vol. XXV, 2005) - pag. 19 - pag. 46
regards not interesting variables. However, some exceptions may occur, for example when two (or more) important exposures act towards each other as confounders. In that case, as illustrated further on, a multivariate statistical model may be used to separate their effects.
Figure 2 shows an example of interaction or effect modifying. Splitting the subjects under study into the two categories of the effect modifi er, a rise in the risk for the exposed subjects emerges in a subgroup (Figure 2, right, black squares), whereas a negative association is observed for another subgroup (white squares).
Figure 2 – Example of interaction or effect modifying
In the case of a categorical exposure variable (Table 3), if the ORs in the two strata differ, the stratifi cation variable is suggested to modify the exposure effect, by interacting with the exposure and so changing the estimated risk of disease, as illustrated in Example 2.
Example 2
Let s now suppose that gender acts as an effect modifi er of the exposure effect in a case-control study. Part a of the following table illustrates the pooled analysis of the whole data set, while parts b and c refer to the results of a separate analysis for males and females, respectively. Under each OR estimate, the related 95% confi dence intervals, obtained by the Woolf method, are reported in brackets.
a) All subjects b) Stratum 1 - Males c) Stratum 2 – Females
Cases Controls Cases Controls Cases Controls
Exposed 182 108 Exposed 124 101 Exposed 58 7
Unexposed 78 87 Unexposed 38 58 Unexposed 40 29
ORT = 1.9
(1.3,2.8)
OR1 = 1.8
(1.1,3.0)
OR2 = 6.0
(2.4,15.1)
A statistically signifi cant association emerges between exposure and the risk of disease, which remains almost unchanged when the analysis is restricted to
3 However, the same variable may behaves both as a confounder and an effect modifi er.

26
Ann. Fac. Medic. Vet. di Parma (Vol. XXV, 2005) - pag. 19 - pag. 46
males. On the contrary, in females the exposure impact seems to be enhanced, the related OR being three times higher than the corresponding fi gure in males. Then, these results suggest that an interaction between sex and exposure exists. However, the possibility that the different risk observed by gender was simply due to the high variability of the OR estimated among females (who represent the smallest group under analysis) could not be completely ruled out. An incorrect, but very common, approach to assess whether the ORs between the two sexes are signifi cantly different, consists in comparing the related 95% confi dence intervals, which in the case of example 2 overlap. Conversely, a correct approach includes a formal statistical test applied to a stratifi ed analysis or using a regression model, as illustrated in the following paragraphs.
The occurrence of interaction may cause a reversal of the relative risk in the two categories of the effect modifi er. In that case the interaction is called “qualitative”, while when the risks estimated in the two exposure categories are both either above or below 1, the interaction is called “quantitative”, because the effect modifi er infl uences the strength of the association, but not its direction.
In some cases it is possible to make a distinction between a “synergistic” interaction, which occurs when the presence of the effect modifi er enhances the impact of the exposure, and an “antagonist” interaction, when the effect modifi er reduces the effect of the exposure. An example of synergistic interaction is the effect of the simultaneous exposure to asbestos and smoking habit on the risk of developing lung cancer, especially observed in occupational studies. In fact, workers exposed to both factors showed a much higher risk than workers exposed to only one factor, and such joint effect was clearly higher than the sum of the effects of the two single exposures (Nelson and Kelsey, 2002).
Main methods to control for confounding
The main strategies to control for confounding in observational epidemiological investigations and, in particular, in case-control studies, are: restriction, matching, stratifi cation and fi tting of regression models. Such methods are not mutually exclusive, because they may be combined to control for the effect of many confounders.
Restriction simply consists in the exclusion from the study of some individuals (for example, people who have an illness closely related to the disease characterizing the cases, as HIV seropositives in a study about pesticides exposure and risk of lymphomas). Restriction does not imply particular problems from a statistical point of view, but it represents a very delicate decision to be adopted in the phase of study design, because it unavoidably reduces the representativeness of the population under study.
Matching is a method for confounding control typical of case-control

27
Ann. Fac. Medic. Vet. di Parma (Vol. XXV, 2005) - pag. 19 - pag. 46
studies. It consists on the selection of controls with characteristics homogeneous to those of the cases. A fi xed number of controls is selected at random for each case, among the population (e.g., people living in the same area or hospitalized in the same institution) showing one or more similar characteristics, like age, gender or region of residence. Matching may then be considered as a variant of the restriction, applied only to control selection. This procedure allows control for some confounders by enhancing the statistical power of the investigation. For such a reason, matching allows the execution of studies based on a smaller number of individuals than studies where controls are selected by simple randomization. Its major limit consists in its incapability of producing estimates of the effect of the confounders involved in matching. Moreover, non independent sampling of the statistical units must be taken into account during data analysis. Specifi c statistical methods have to be adopted accordingly, such as the conditional logistic regression model.
Individual matching is performed at the level of each subject, while frequency matching is based on groups of individuals. The latter is rather unusual. Moreover, matching is called “artifi cial” when the possible confounders for the matching process are selected by the researcher. On the contrary, it is called “natural” when cases and controls are matched on the basis of some natural characteristic, allegedly associated with most of the possible confounders. Examples of natural matching are those studies carried out on couples of twins, one affected by a specifi c disease (thus belonging to the group of cases) and the other unaffected (belonging to the controls).
Stratifi ed analysis represents quite a simple method to control for the effect of one or more confounders. It consists in the measure of the association between the exposure and the risk of a specifi c disease within each level (also called “stratum”) of the confounder, as illustrated in Table 4. Strata may be the different levels of some confounder, when it is categoric (e.g., sex, race), or groups obtained by aggregating the individuals in classes on the basis of the values of a continuous variable (e.g., age). At the end of the stratifi cation procedure, the homogeneity of the effects estimated per each stratum must be tested to assess whether interaction occurs. If interaction does not occur, a common measure of association should be obtained and its statistical signifi cance should be evaluated by another formal test. As illustrated in the next paragraph, estimates of a common effect may be obtained as appropriate weighted means of the stratum-specifi c estimates.
Finally, regression models, in particular logistic regression, represent the most largely employed method to control for confounding in case-control studies, also providing an estimate of the joint effects of many confounders and exposure variables. Furthermore, risk estimates may also be obtained when a certain degree of data dispersion across the cells occurs (i.e., when there are many sub-groups of exposures or confounders, like observation periods, age classes and gender). In that case, estimation procedure is based on the assumption of a mathematical relation between the variable under study (the risk of developing a disease) and the variables describing either the different exposures or the possible confounders.

28
Ann. Fac. Medic. Vet. di Parma (Vol. XXV, 2005) - pag. 19 - pag. 46
Stratifi ed analysis in case-control studies: the Mantel-Haenszel Odds Ratio
Mantel-Haenszel (MH) estimators, introduced in Epidemiology at the end of the 1950s (Mantel and Haenszel, 1959) have been largely applied in epidemiological studies (Silcocks, 2005). Recently they have been in part replaced by the generalized linear models (GLM), of which they represent, in a certain sense, a specifi c case, because they are largely based on the same statistical theory (likelihood theory).
In this paragraph, a brief mention will be made about the MH method to estimate a common OR, adjusted for the effect of possible confounders, in case-control studies. A characteristic of the MH OR (shared by all MH estimators) is the capability of producing consistent estimates even when one or more strata of the confounder lack observations.
Let K be the number of confounder strata in a case-control study. The association between exposure and risk of disease may be resumed in a table similar to Table 4. For each j stratum, an OR
j may be accordingly estimated as the product
(ajd
j)/(c
jb
j) and the inference about its value can be made under an approximate log-
normal distribution assumption, by applying the above illustrated Woolf method for the estimate of its variance, as follows:
jjjjj dcba
ORraV 1111)(logˆ
(5)
It can be immediately noted that an estimate of the common OR obtained by averaging the stratum-specifi c OR
j is expected to yield not real values when 0 occurs
in at least one cj or b
j cell (i.e., when there are neither exposed controls nor unexposed
cases in at least one stratum of confounder). The same happens for the corresponding variance of its logarithm.
Table 4. Stratifi ed analysis of data in a case-control study.
Stratum(e.g., age classes)
Exposurecondition
Cases Controls Total
1 Exposed a1 b1 n11
Unexposed c1 d1 n01
Total m11 m01 n1
... ... ... ... ...
... ... ... ... ...
j Exposed aj bj n1j
Unexposed cj dj n0j
Total m1j m0j nj
... ... ... ... ...
... ... ... ... ...
K Exposed aK bK n1K
Unexposed cK dK n0K
Total m1j m0j nK

29
Ann. Fac. Medic. Vet. di Parma (Vol. XXV, 2005) - pag. 19 - pag. 46
Conversely, the MH OR (ORMH
) is obtained by the following formula:
K
j j
jj
K
j j
jj
MH
ncbnda
RO
1
1ˆ
(6)
The corresponding test for the null hypothesis:ORMH
= 1, known as the “Mantel-Haenszel chi squared”, is expressed in the following equation:
K
jj
K
j
K
jjj
MH
araV
aEa
1
2
1 12
ˆ
(7)where:
1ˆ
21010
jj
jjjjj nn
nnmmaraV
(8)
In conclusion, the MH χ2 test is equivalent in assessing whether the sum of a
j exposed cases signifi cantly differs from its expected value.
A consistent estimate of the variance of ln(ORMH
) can be obtained using the following formula, proposed by Robins, Breslow and Greenland (Robins et al, 1986; Silcocks P, 2005) :
2
1
1
11
1
2
1
1
222
ˆlnˆK
j j
jj
K
j j
jj
j
jj
K
j j
jjK
j j
jj
K
j j
jj
j
jj
j
jj
j
jj
K
j j
jj
K
j j
jj
j
jj
MH
ncb
ncb
ncb
ncb
nda
nda
ncb
nda
ncb
nda
nda
nda
ROraV
(9)
Assuming an approximate log-normal distribution of the ORMH
, its corresponding confi dence intervals at a selected 1-α level may be obtained by the following equation, similar to equation 4:

30
Ann. Fac. Medic. Vet. di Parma (Vol. XXV, 2005) - pag. 19 - pag. 46
MHROraVzMHeRO
ˆlnˆ2/ˆ
(10)
ORj homogeneity, i.e., the occurrence of interaction, may be formally tested
via the following χ2 test with K-1 degrees of freedom (Breslow and Day, 1980):
K
jK
jj
K
j j
j
j
j
ROraV
ROraVRO
ROraVRO
1
1
2
12
2
ˆlnˆ
ˆlnˆ
ˆln
ˆlnˆ
ˆln
(11)
where the variance of ln(ORj) is obtained by equation 5.
Example 3
Data from examples 1 and 2 may be re-analysed by the MH method to provide a common estimate of the ORs, adjusted for the effect of the confounding variable (Sex). A test checking for a possible effect modifying of such a variable is also performed.
As regards the data in the Example 1, the common estimate of relative risk (i.e., the OR
MH) is obtained as follows:
67.2
128567
216889
1282540
2162099
ˆMHRO
Applying equation 9, the variance of ln(ORMH
) is:
128567
216889
1282540
21620992
1282540
128567
1282540
128567
2162099
216889
2162099
216889
1282540
21620992
1282540
1282540
2162099
2162099
ˆlnˆ 2MHROraV
1051.0
128567
2168892
128567
128567
216889
216889
2

31
Ann. Fac. Medic. Vet. di Parma (Vol. XXV, 2005) - pag. 19 - pag. 46
Furthermore, applying equation 10, the 95% confi dence intervals of ORMH
are obtained as follows:
04.5;41.167.2 1051.096.1e
Finally, the homogeneity of the stratum-specifi c ORs (indicated as OR1 for
the males and OR2 for the females, respectively, accordingly to Example 1) may be
tested by equation 11. However, before applying such a formula, the variance of the corresponding logarithms must be estimated, by applying equation 12:
1963.081
201
891
991lnˆ 1ORraV
2257.0561
251
71
401lnˆ 2ORraV
Putting such estimates into equation 11, the χ2 test for homogeneity is obtained:
018.0
2257.01
1963.01
2257.055.2ln
1963.078.2ln
2257.055.2ln
1963.078.2ln
2
222
The observed value is clearly lower than the critical value of χ2 distribution with 1 degree of freedom (i.e., 3.84). As a consequence, it can be stated that there is no evidence of an interaction between sex and exposure.
As far as data from Example 2 are concerned, the ORMH
estimate is:
49.2
134407
32138101
1342958
32158124
ˆMHRO

32
Ann. Fac. Medic. Vet. di Parma (Vol. XXV, 2005) - pag. 19 - pag. 46
and the variance of its logarithm:
134407
32138101
1342958
321581242
1342958
134407
1342958
134407
32158124
32138101
32158124
32138101
1342958
321581242
1342958
1342958
32158124
32158124
ˆlnˆ 2MHROraV
0462.0
134407
321381012
134407
134407
32138101
32138101
2
Finally, the related 95% confi dence interval of ORMH
is:
79.3;63.149.2 0462.096.1e
The variances of the logarithm of the estimated stratum –specifi c ORs are:
0615.0381
581
1011
1241logˆ 1ORraV
2196.0401
291
71
581logˆ 2ORraV
Putting such estimates in equation 11, the value of the test for the OR homogeneity is obtained as follows:
849.4
2196.01
0615.01
2196.001.6log
0615.087.1log
2196.001.6log
0615.087.1log
2
222
The observed value exceeds the critical one for α = 0.05, then it may be concluded that there is evidence of an interaction between sex and exposure, then the common OR estimate (OR
MH) is not suitable to describe the impact of the exposure.
Separate analysis by gender should instead be adopted.

33
Ann. Fac. Medic. Vet. di Parma (Vol. XXV, 2005) - pag. 19 - pag. 46
An introduction to the generalized linear models
The analysis of epidemiological data often makes use of statistical models, which represent a reduction and an analogy of the actual world (Piccolo, 2000).
In general, the application of a statistical model needs three conceptual phases:
1) model specifi cation: a relation between the variables under study is hypothesized and made explicit in a mathematical way. A statistic (stocastic) model differs from a deterministic one, because the relation between the considered variables is probabilistic;
2) parameter estimation: estimates of resuming variables, called “parameters”, which are the object of scientifi c investigation, may be obtained by means of specifi c procedures from the observed sample (e.g., time trend of incidence rates, estimate of a relative risk between two groups, as the OR, and so on). Parameters of a statistical model applied to epidemiological data may be used both to estimate the occurrence of a phenomenon, like the incidence or the prevalence of specifi c diseases (estimates of disease occurrence) and its association with some risk factors (estimates of association or effect);
3) checking for goodness-of-fi t of the model: it comprises a group of procedures aimed at assessing the general fi t of the model to experimental data, looking for any violation of the assumptions underlying the parameters estimate, and identifying extreme values (called “outliers”) that may have infl uenced parameters estimates.
In spite of this importance, point 3 will not be discussed in this paper for lack of space.
Among statistical models applied to Epidemiology, regression models are largely employed for their conceptual simplicity. In fact, a regression model relates one variable (e.g., the odds of exposure, whose ratio between cases and controls represents the OR) with one or more variables, in general (but not only) exposure measures and confounders. A dependent variable is then defi ned, which is assumed to be associated with one or more independent variables. The dependent variable is also called “the response” and independent variables “the predictors”.
During the last decades, generalized linear models (GLM), which include the logistic regression model (commonly applied to case-control studies) have largely spread in Epidemiology. Theory at the basis of GLM is very complex and the reader interested in it may refer to Dobson (1990) or McCullagh and Nelder (1989). In Appendix I a short mention of the likelihood theory, which is at the basis of such a statistical modelling, is provided. However, in spite of their complexity and the need for methods of sophisticated automatic computation, some GLMs may fruitfully be applied to epidemiological data, just knowing some of their statistical properties and without focusing on theoretical details.
A GLM is defi ned by specifying the following characteristics: (Dobson, 1990; Piccolo, 2000):
1) error function: it must belong to a group of functions, called “the exponential family”, which includes Normal, Binomial, Poisson and many other

34
Ann. Fac. Medic. Vet. di Parma (Vol. XXV, 2005) - pag. 19 - pag. 46
distributions;2) variance of the response variable: it is put in connection with the mean
value μ by a variance function:
vYVar
(11)
The variance of the response variable Y is assumed to be proportional either to its mean value μ or to its transformation v. The proportionality constant φ is called “scale parameter”;
3) the expected (mean) value of the response variable depends on a linear function of parameters:
)...( 110 pp xxfYE
(12)
The linear function of parameters: pp xx ...110 is called “linear predictor”, and it forms the deterministic component of the model, while the function f, which relates the deterministic part with the stocastic one, is called “link function”.
The Logistic Regression Model
The logistic regression model represents one of the most largely applied techniques to model binary variables. It is largely used in Epidemiology, especially in case-control studies, to obtain OR estimates, adjusted for the effect of confounding variables (Breslow and Day, 1980). It is also employed in cross-sectional studies to model prevalence OR. Furthermore, it can also be used in clinical investigation, allowing the modelling of the association between a specifi c condition (e.g., ill vs. healthy) and classifi cation variables (e.g., occurrence of a clinical pathologic value).
The logistic model was fi rstly applied to an epidemiological framework by Jerome Cornfi eld, who is considered as one of the fathers of the modern case-control study. Cornfi eld was the fi rst to demonstrate, both from a theoretical point of view and using data from a cohort study, the equivalence between the exposure OR (equation 1) and the relative risk (Cornfi eld, 1951). Afterward, the logistic model had a great evolution, towards models for the analysis of matched data (conditional logistic regression) and for ordinal data (continuation ratio model, cumulative odds model). A complete treatment of the different applications of the logistic model and its variants may be found in the book by Hosmer and Lemeshow (2000).
The simplest formulation of an unconditional logistic regression model assumes the following relation between the response variable Y, which may only take

35
Ann. Fac. Medic. Vet. di Parma (Vol. XXV, 2005) - pag. 19 - pag. 46
either 0 or 1 values (e.g., corresponding to the disease status, i.e., case or controls) and a set of predictors x:
pp xxexYE ...1101
1,
(13)
This model also assumes the independence of the observations, and it is accordingly applied to case-control studies without matching. A variant of this model exists, that is usually applied to studies with matching.
The logistic model can be formulated as a GLM assuming for the linear predictor the following (usual) formula: ppxx ...110 , for the function error the binomial distribution (because the response variable is binary) and as link function the logit function, which corresponds to the logarithm of the odd of Y (i.e., the probability of Y divided by its complement to 1). In the framework of the case-control study, the response variable is in general coded 0 when the subject belongs to the controls and 1 when the subjects belongs to the cases. Letting the predictor E represent the exposure of interest, which assumes the values of 0 and 1, respectively in the absence and in the presence of the exposure, an estimate of OR adjusted for the possible effect of other covariates may be obtained by exponentiating the corresponding estimated coeffi cient 1 . In fact, when only one confounder C is included in the model:
CEeY
210ˆˆˆ1
1ˆ
(14)
Applying the logit transformation to the Y variable, the following equation is obtained:
CEe
e
eYYYit
CE
CE
CE
210ˆˆˆ
ˆˆˆ
ˆˆˆˆˆˆ1ln
111
11
lnˆ1
ˆlnˆlog
210
210
210
The expected value of the logit of Y for the unexposed group (corresponding to E=0), will be:
NENENE
NE CCYY
20210ˆˆˆ0ˆˆ
ˆ1
ˆln
(15)

36
Ann. Fac. Medic. Vet. di Parma (Vol. XXV, 2005) - pag. 19 - pag. 46
where the NE subscript in the response and confounder variables indicates that the logit estimate is performed within the unexposed subgroup.
Likewise, the expected value of logit in the exposed subgroup (i.e., E = 1), will be:
EE
E
E CCYY
210210ˆˆˆˆ1ˆˆ
ˆ1
ˆln
(16)
Subtracting equation 15 from equation 16:
NEENEENE
NE
E
E CCCCYY
YY
2120210ˆˆˆˆˆˆˆ
ˆ1
ˆlogˆ1
ˆlog
Finally, for equal values of C confounder in the two subgroups (i.e., when C
E=C
NE), and remembering that the difference between the logarithm of two values
equals the logarithm of their ratio, the following equation is obtained:
OR
YYYY
NE
NE
E
E
11ˆexpˆ
ˆ1
ˆˆ1
ˆ
ln
(17)
Inference about Maximum Likelihood Estimators
After obtaining some maximum likelihood estimates (MLE) from a logistic regression model (as shortly illustrated in Appendix I), it is necessary to test whether such estimates fi t a specifi c hypothesis (e.g., in general, whether the coeffi cients for the exposures are different from 0, which implies that the corresponding OR signifi cantly differs from 1). A method similar to that applied to linear regression models consists in dividing the difference between an estimated coeffi cient and its expected value, under a specifi c (null) hypothesis, by the standard error of such a difference (corresponding to the standard error of the estimated coeffi cient). In the GLM, this test (Wald test) has an asymptotic approximate standardized normal distribution:
ˆ
ˆ0
VARz H
(18)

37
Ann. Fac. Medic. Vet. di Parma (Vol. XXV, 2005) - pag. 19 - pag. 46
The Wald test also makes it possible to obtain the confi dence intervals for the parameter, by the usual way:
ˆˆ;ˆˆ:1;ˆ VARzVARzCI
(19)
where zα represents the critical value of the standardized normal distribution at a specifi c α value. The so obtained confi dence intervals may be used to make statistical inference.
Another test, more accurate than the Wald test, is based on the ratio between the likelihood of the MLE estimate of the OR and the related likelihood that will be obtained under the null hypothesis. That is briefl y illustrated in Appendix I.
Testing the interaction by a logistic regression modelling
If variable M was an effect modifi er, different OR values would correspond to different levels of M. A new variable (interaction variable), obtained as the product between the exposure E and M, may be introduced in the model to test such interaction:
EMMEYit 3210ˆˆˆˆˆlog
(20)
The logit in the exposed subgroup is:
MMYY
E
E3210ˆˆˆˆ
ˆ1
ˆln
(21)
while the logit among the unexposed is:
MYY
NE
NE20ˆˆ
ˆ1
ˆlog
(22)
Subtracting equation 22 from equation 21 the following relation between the ln(OR) and M is obtained:

38
Ann. Fac. Medic. Vet. di Parma (Vol. XXV, 2005) - pag. 19 - pag. 46
MOR
YYYY
NE
NE
E
E
31ˆˆln
ˆ1
ˆˆ1
ˆ
ln
(23)
Applying equation 23, different OR values may be obtained, corresponding to different values of the effect modifi er M. Let (for simplicity) M be a binary variable, assuming value 0 when the effect modifi er is absent and 1 when it is present. Two
different ORs estimates will be accordingly calculated, i.e.: 1ˆ0ˆ eMRO , and
31ˆˆ1ˆ eMRO .
When β3 = 0 there is no interaction between M and E, then the occurrence
of effect modifying may be assessed by testing the statistical signifi cance of this coeffi cient, e.g., by Likelihood Ratio Test. Contrary to interaction, confounding occurence cannot be assessed by a test on the related coeffcient (i.e., β
2 in the equation
14). In fact, this coeffcient just measures the association between the variable C and the predictor Y, but C behaves as a confounder only if it is also associated with the exposure. Formally testing the confounding occurrence is feasible in theory, but generally useless, because confounding does not represent an interesting phenomenon for the researcher, who just wants to reduce its impact. Conversely, effect modifying and its interpretation often represent an issue of great interest from a bio-medical point of view.
Example 4
The analysis of data used in Example 1 may also be performed by applying a logistic regression model (in the present example, using STATA for Windows statistical package). Including only the exposure variable among the predictors (univariate model) the estimate of the pooled OR is obtained without adjusting for the confounding effect of Sex.
Logit estimates Number of obs = 344 LR chi2(1) = 0.01 Prob > chi2 = 0.9394Log likelihood = -232.82188 Pseudo R2 = 0.0000
------------------------------------------------------------------------------ CaCo | Odds Ratio Std. Err. z P>|z| [95% Conf. Interval]-------------+---------------------------------------------------------------- Esp | 1.018066 .2397501 0.08 0.939 .6416851 1.615215------------------------------------------------------------------------------

39
Ann. Fac. Medic. Vet. di Parma (Vol. XXV, 2005) - pag. 19 - pag. 46
The software automatically provided the OR estimates obtained by exponentiating the estimates of the coeffi cients for each predictor. Moreover, it also provided the related 95% confi dence intervals (i.e., 0.64;1.62), by exponentiating the confi dence intervals of the estimated coeffi cient, obtained by the Wald method (equation 19). Please note that results of the analysis by the logistic regression model are almost identical to those obtained by the Woolf method.
The statistical software also provided the log-likelihood of the model, the total number of observations, the LR test performed comparing the fi tted model with the corresponding model including only the intercept (indicated as “LR chi2”), the related statistical signifi cance (reported as “Prob > chi2”) and, fi nally, the pseudo-R2, which represents a goodness-of-fi t statistic, analogous to the R2 of the linear regression model. Fitting the model with both predictors (called “main effect model”, to distinguish it from the interaction model and other more complex models), the exposure OR estimate, adjusted for the effect of the sex variable, is obtained.
Logit estimates Number of obs = 344 LR chi2(2) = 32.36 Prob > chi2 = 0.0000Log likelihood = -216.64513 Pseudo R2 = 0.0695
------------------------------------------------------------------------------ CaCo | Odds Ratio Std. Err. z P>|z| [95% Conf. Interval]-------------+---------------------------------------------------------------- Esp | 2.672364 .8662628 3.03 0.002 1.415707 5.044495 Sesso | 5.341609 1.731241 5.17 0.000 2.830046 10.08209------------------------------------------------------------------------------
Please note that including the Sex predictor in the model, the estimate of exposure effect (i.e., the OR for Esp variable, which represents the exposure) changes from 1.0 to 2.7 and reaches statistical signifi cance (as highlighted by the 95% confi dence interval: 1.42; 5.04, which does not include the expected value of 1). This fi nding indicates that the exposure effect was masked by the different proportion of males and females among cases and controls and by the association of the Sex variable with the exposure, which is made evident by the OR estimated value for the variable itself (5.3, statistically signifi cant). Please note that results of this analysis completely overlap those obtained by stratifying analysis using the MH method (fi rst part of Example 3).
Finally, to assess the occurrence of effect modifying, as illustrated above, it is suffi cient to introduce in the model an interaction term, equivalent to the product of the variables corresponding to the main effect (i.e., Sex and Exposure).

40
Ann. Fac. Medic. Vet. di Parma (Vol. XXV, 2005) - pag. 19 - pag. 46
Logit estimates Number of obs = 344 LR chi2(3) = 32.38 Prob > chi2 = 0.0000Log likelihood = -216.63631 Pseudo R2 = 0.0695
------------------------------------------------------------------------------ CaCo | Odds Ratio Std. Err. z P>|z| [95% Conf. Interval]-------------+---------------------------------------------------------------- _IEsp_1 | 2.780899 1.232214 2.31 0.021 1.166859 6.627534 _ISesso_1 | 5.6 2.702295 3.57 0.000 2.174895 14.41908_IEspXSes_~1 | .9173366 .5959521 -0.13 0.894 .2567684 3.277297------------------------------------------------------------------------------
The OR estimates, automatically provided by the output of the program, are not easily interpretable, because the occurrence of interaction indicates that two separated estimates of ORs should be made in each stratum of the effect modifi er. Moreover, to obtain the statistical signifi cance of the interaction, 95% confi dence interval for the related exponentiated coeffi cient (incorrectly indicated as OR) may be compared with the expected value under the null hypothesis (i.e., 1). Otherwise, a LR test may be performed, as briefl y described at the end of Appendix I.
Logistic: likelihood-ratio test chi2(1) = 0.02 Prob > chi2 = 0.8944
Please note that the result (i.e., χ2 = 0.02, test for the interaction) completely overlap that obtained by MH method (Example 3).
The results of the same approach applied to the data of Example 2, where a statistically signifi cant interaction emerged, are provided below.
Univariate analysis: model with only one variable for the exposure:
Logit estimates Number of obs = 455 LR chi2(1) = 10.27 Prob > chi2 = 0.0014Log likelihood = -305.58979 Pseudo R2 = 0.0165
------------------------------------------------------------------------------ CaCo | Odds Ratio Std. Err. z P>|z| [95% Conf. Interval]-------------+---------------------------------------------------------------- Esp | 1.87963 .371523 3.19 0.001 1.275927 2.768973------------------------------------------------------------------------------

41
Ann. Fac. Medic. Vet. di Parma (Vol. XXV, 2005) - pag. 19 - pag. 46
Main effect model for the control of confounding due to the Sex variable:
Logit estimates Number of obs = 455 LR chi2(2) = 39.46 Prob > chi2 = 0.0000Log likelihood = -290.99137 Pseudo R2 = 0.0635
------------------------------------------------------------------------------ CaCo | Odds Ratio Std. Err. z P>|z| [95% Conf. Interval]-------------+---------------------------------------------------------------- Esp | 2.505299 .5396665 4.26 0.000 1.642488 3.821351 Sesso | 3.437588 .8269118 5.13 0.000 2.145346 5.508208------------------------------------------------------------------------------
Model with an interaction term to assess the effect modifying of Sex:
Logit estimates Number of obs = 455 LR chi2(3) = 44.69 Prob > chi2 = 0.0000Log likelihood = -288.37866 Pseudo R2 = 0.0719
------------------------------------------------------------------------------ CaCo | Odds Ratio Std. Err. z P>|z| [95% Conf. Interval]-------------+---------------------------------------------------------------- _IEsp_1 | 1.873893 .4647959 2.53 0.011 1.15243 3.047016 _ISesso_1 | 2.105263 .675786 2.32 0.020 1.122205 3.949487_IEspXSes_~1 | 3.205703 1.699638 2.20 0.028 1.134026 9.061989------------------------------------------------------------------------------
LR test for the statistical signifi cance of the interaction term:
Logistic: likelihood-ratio test chi2(1) = 5.23 Prob > chi2 = 0.0223
The advantages of applying a logistic regression model rather than the MH method, become evident when the effect of many exposure variables have to be modelled in the presence of many confounders. Furthermore, the logistic model allows an estimate of the effect of continous variables, if any, whereas stratifying analysis, like the MH method, does not. However, the MH method may be applied by a pocket calculator, while fi tting a logistic regression model needs dedicated statistical software.

42
Ann. Fac. Medic. Vet. di Parma (Vol. XXV, 2005) - pag. 19 - pag. 46
Appendix I
An outline of likelihood theory applied to logistic regression model
The concept of likelihood is central in theoretical statistics, because it provides the basis of the estimator theory, which plays a fundamental role in statistical inference. Likelihood is defi ned as the probability of some unknown parameters given the observed data, under an hypothesis of probabilistic distribution4.
In epidemiology, binomial function may be employed to model the distribution of the proportion of sick subjects (either prevalent or new cases of a specifi c disease, the latter called “incident” cases) in different study designs. In particular, in case-control studies, a binomial distribution may be assumed for the proportion of cases within the different categories of exposure and confounding variables. Binomial function has the following expression for the probability of observing y events (for example, cases of a disease) in n trials (e.g., the number of subjects within an exposure group):
yny
ynynnyYP 1
!!!,
The likelihood of π|y,n is obtained as a function of the y observed events, as follows:
yny
ynynnyL 1
!!!,
Since n and y are fi xed, likelihood being calculated from observed data, the likelihood of a binomial distribution may be more simply expressed in the following way:
ynxnyL 1,
(A.1)
Formally, an estimated parameter ˆ is a maximum likelihood estimator if:
*ˆ YLYL
where * represents any other parameter.
4 Sometimes, likelihood is defi ned up to a specifi c constant, basically for computational reasons.

43
Ann. Fac. Medic. Vet. di Parma (Vol. XXV, 2005) - pag. 19 - pag. 46
Applying equation A.1 to data from a case-control study, an estimate of the likelihood in each subgroup under analysis (e.g., older exposed males, or older unexposed females, etc.) is easily obtained.
According to the theorem of independent probabilities, the likelihood of the logistic model may simply be obtained as the product of the likelihoods of each subgroup. For many reasons, including some computational ones, instead of directly modelling the likelihood function, its logarithimc transformation (log-likelihood) is commonly used. According to a known property of the logarithm function, log-likelihood of the whole model will be equal to the sum of the log-likelihoods of each subgroup. Finally, the relationship linking the log-likelihood to the β parameters to be estimated is obtained by replacing the unknown parameter π with the logistic function (equation 13).
After having obtained (not in a trivial way) the estimate of the coordinates of the point of the maximum of the likelihood function, values of the β coeffi cients corresponding to this point are calculated, which provide the maximum likelihood estimates (MLEs) of such parameters.
Formally, the log-likelihood of a logistic model (and of any other model with a binomial error) is:
jjjjjj ymyl ˆ1lnˆln
(A.2)
where j indicates the different subgroups, mj the corresponding number of
observed subjects and yj the number of the cases.
Moreover, in the logistic model, the following relation between the π parameter and the linear predictor is assumed (according to equation 13):
pp xxje
xYE ...11011,ˆ
MLEs of β coeffi cients and, accordingly, those of the unknown parameter π are obtained by identifying the maximum value of the function l.
The difference between two log-likelihoods corresponds to the logarithm of the ratio of related likelihood functions. Based on this property, a statistical test (called the “Likelihood Ratio Test”) may be obtained to assess the statistical signifi cance of one or more selected coeffi cients in a GLM, including logistic regression models. In fact, the double of the difference between the log-likelihood of the model containing the variable, whose effect has to be tested, and the model without such variable, follows (asymptotically) a χ2 distribution with 1 degree of freedom under the null hypothesis of no effect (i.e., when the corresponding coeffi cient does not differ from

44
Ann. Fac. Medic. Vet. di Parma (Vol. XXV, 2005) - pag. 19 - pag. 46
0). If the test is performed on more than one variable, the assumption of χ2 distribution still holds, while the corresponding degrees of freedom will be equal to the number of the variables left out from the model. Differently from many other statistical tests applied to epidemiological and bio-medical research, likelihood ratio test does not employ any estimate of the variance of the parameters.
Acknowledgements
This work was partly supported by a grant from the Fondazione Italiana Neuroblastoma. We thank Dr Anna Capurro for revising the English.
References
BRESLOW N.E., DAY N.E.: Statistical Methods in Cancer Research – Volume 1 – The analysis of case-control studies. IARC Scientifi c Publications N. 32, Lyon, 1980.
CORNFIELD J.: A method for estimating comparative rate from clinical data; Applications to cancer of the lung, breast and cervix - J. Natl. Cancer Inst., 11:1269-75, 1951;.
DOBSON A.J.: An introduction to generalized linear models. Chapman & Hall, New York, 1990.
HOSMER W., LEMESHOW S.: Applied Logistic Regression – Second Edition. John Wiley and Son, New York, 2000.
KLEINBAUM D.G., KUPPER L.L., MORGENSTERN H.: Epidemiologic research: principles and quantitative methods. John Wiley & Sons, Inc., New York, 1982.
MANTEL N., HAENSZEL, W.: Statistical aspects of the analysis of data from retrospective studies of disease. - J Natl. Cancer Inst., 22: 719-748, 1959.
MCCULLAGH P., NELDER J.A.: Generalized Linear Models - Chapman and Hall, 2nd edition, New York, 1989.
NELSON H.H., KELSEY K.T. The molecular epidemiology of asbestos and tobacco in lung cancer - Oncogene.21(48), 7284-8, 2002.
PARODI S., BOTTARELLI E.: Introduzione allo studio caso-controllo in epidemiologia - Annali Fac. Medic. Vet. di Parma, XXIV, 209, 2004.
PEARSON E.S., HARTLEY H.O.: Biometrika Tables for Statisticians, Vol.I (3rd

45
Ann. Fac. Medic. Vet. di Parma (Vol. XXV, 2005) - pag. 19 - pag. 46
Edition), Cambridge University Press, Cambridge, (UK), 1966.
PICCOLO D.: Introduzione ai modelli statistici. In: Statistica. Il Mulino, Bologna 2000, pagg. 827-921.
ROBINS J., BRESLOW N., GREENLAND S.: Estimators of the Mantel-Haenszel variance consistent in both sparse data and large-strata limiting models - Biometrics 1986, 42:311-323.
SILCOCKS P.: An easy approach to the Robins-Breslow-Greenland variance estimator - Epidemiologic Perspectives & Innovations, 2:9, 2005.
Key words
Case control studies, bias, confounders, logistic regression, Maximum Likelihood Estimates
SUMMARY
The case-control study is one of the main observational epidemiological investigations. It collects and compares information about past exposures of two different groups: the cases, which are subjects (or animals) affected by the disease under study, and the controls, which are unaffected by the disease. Such a study design is characterized by numerous advantages in terms of statistical power and feasibility (low cost and short execution time), and it can be applied to make causal inference, because, under proper conditions, it can assess a causal relation between one or more exposures and the risk of developing selected diseases. In spite of such undeniable advantages, the case-control study is more prone than prospective investigations to many biases, which may be classifi ed into three categories: selection bias, information bias and confounding bias. The fi rst two may be controlled only by selecting a proper study design, while confounding bias may be partly overcome by (a) matching or restriction in the phase of study design, and (b) statistical modelling in the phase of data analysis. In this paper the main methods to control for confounding in case-control studies are illustrated. In particular, some techniques of stratifi ed (Mantel-Haenszel method) and multivariate (logistic regression) analysis are described. Many examples are provided using simulated data sets.
RIASSUNTO
Lo studio caso-controllo rappresenta uno dei principali studi epidemiologici osservazionali. La sua caratteristica principale risiede nel reperimento dellʼinformazione pregressa sullʼavvenuta esposizione in due gruppi distinti a

46
Ann. Fac. Medic. Vet. di Parma (Vol. XXV, 2005) - pag. 19 - pag. 46
confronto: i casi, ovvero soggetti affetti dalla patologia in esame e i controlli, ovvero soggetti non affetti dalla patologia di interesse. Tale disegno di studio presenta notevoli vantaggi in termini di potenza statistica, fattibilità (bassi costi e brevi tempi di realizzazione) ed è in grado di compiere inferenza causale, ovvero, sotto opportune condizioni, di stabilire la presenza di un nesso causale tra una o più esposizioni e il rischio di contrarre una determinata patologia. A fronte degli innegabili vantaggi, rispetto agli studi prospettici lo studio caso-controllo risulta maggiormente vulnerabile a fattori di distorsione, denominati bias, che possono essere classifi cati come: bias di selezione, di informazione e da confondimento. Mentre i primi due possono essere contrastati solamente mediante un opportuno disegno di studio, i bias da confondimento possono essere almeno parzialmente controllati in fase di disegno dello studio, mediante appaiamento (matching) o restrizione, oppure, in fase di analisi dei dati, adottando un opportuno modellamento statistico. Il presente lavoro riassume i principali metodi per il controllo del confondimento, illustrando tecniche di analisi stratifi cata (metodo di Mantel-Haenszel) e di analisi multivariata (modello di regressione logistica), e fornendo alcuni esempi su data set simulati.

47
Ann. Fac. Medic. Vet. di Parma (Vol. XXV, 2005) - pag. 47 - pag. 72
* Corresponding author: [email protected] - Doctorate in zoology** Dipartimento di Produzioni Animali, Biotecnologie Veterinarie, Sicurezza degli Alimenti
BIOMECHANICAL STUDIES ON FLAT-COAT DOGS
Gosi S.*, Michelotti M.**, Bracchi P.G.
INTRODUCTION
The quantitative movement analysis of the dog may have important outcomes in the clinical practice, in particular concerning the diagnosis of pathologies of the locomotor apparatus and the evaluation of the effi cacy of both pharmacological and surgical therapies [3,2].
Despite many papers have been published on both human and horse cinematic [5], little is known on canine cinematic. Even less is known on specifi c dog breed, as the publications available are scarce – Studies on the pathologies of Grey-Hounds – [1,14].
The current study is aimed at analysing the movements of a single breed, Flat Coat, that is characterized in each subject by sexual dimorphism and morphological features comparable as all the specimens of the same sex have similar and homogeneous gait.
In particular, females are short sized, their height of the withers is 4 cm shorter compared to males.
Among the aims of this study was the determination, in safe animals, of the variations in terms of angular positions of the different segments of which fore and hind limbs are made at two different velocities (4 and 6 km/h) that correspond to walking and trotting.
It could be useful to collate the two different gaits in order to evaluate whether the obtained wave patterns would change when passing form walk to trot. The comparison between the right and left side in the subjects of the study could represent a useful tool to evaluate whether the animal is moving properly during the trials on the treadmill. In fact, animals tend to compensate several orthopaedic pathologies of a single limb with changes in the movements of the controlaterale limb.
Angular velocities of each animal when trained at the two different speeds have been taken into account and collated. The aim was to understand whether among the subjects of the study angular velocities were similar both considering the pattern of the wave and the absolute values and whether this could represent a helpful tool in detecting lameness.

48
Ann. Fac. Medic. Vet. di Parma (Vol. XXV, 2005) - pag. 47 - pag. 72
A head to head comparison between male and female belonging to the same breed could be useful to demonstrate whether the sexual dimorphism can induce differences in gaits at the different speeds considered in this study.
METHODS
Eight Flat-Coat dogs have been included in the study and divided into two groups according to the sex (4 males e 4 females).
Animals have been trained on a treadmill which has been set on two speeds:
• the fi rst, 4 km/h, corresponds, due to the size of this animal, to a rather fast gait,
• the second speed, 6 km/h corresponds in every subjects to trotting.Markers have been fi xed to the skin of the animals by means of an adhesive
glue.The animals have been videotaped using two digital cameras synchronized
and genlocked in order to shoot both the right and the left side simultaneously. In order to avoid the onset of shuffl es made by the markers on the video
when the animal is moving to fast, the shooting has been conducted at 50Hz and using 1/500 seconds as exposition time.
Images captured by the computer (and stored on CD) have been analysed using SIMI Motion System.
In previous works it has been observed that all the specimens, at whatever speed, took often different times to perform the same gait cycle [4,16] even though the wave shapes were very similar (Fig. 1 a).
These waves have been then cut into different phases (Fig. 1 b), each corresponding at a single step starting and ending at the moment of maximal fl exion. For every single step taken into account the medium alongside with the relative standard deviation has been calculated (Fig. 1 c). Within the series considered, the anomalous steps have not been withdrawn as the animal compensated the anomaly with natural adjustments.
a b

49
Ann. Fac. Medic. Vet. di Parma (Vol. XXV, 2005) - pag. 47 - pag. 72
c
Fig. 1
When illustrating the outcomes of this study the graphs report on the abscisses axis the times of execution of the movement and on the ordinate axis the angular variations. In some cases the movements have been compared at different speeds that correspond to different execution times therefore these graphs are not identical (Fig. 2 a). The data have been all transformed into percentage values in order to better collate the waves obtained.
4 km/h
6 km/h
Expressed aspercentage
a - degrees/time b - degrees/percentage
Fig. 2
Within the research protocol the variation due to the possible different positioning of the markers on the animal body has not been taken into account. This variable, which may represent a source of bias, has been investigated in other studies conducted on dogs [1], but there has never been attempts to fi nd a clue to quantify or correct it. In the current project we have tried to reduce this occurrence as much as possible by means of manual measurements as double check assurance. However, the movements of the markers placed on the skin at joint level have not been considered, even though they might be considered as possible biases, as we have reckoned that this sort of error [6,7,8] would have been constant in all the animals.
In order to reduce the incidence of errors, such as the oscillation of the markers where spheres are applied, we have used little back-refl ecting hemispheres that have higher contact surface on the skin and during the movements their oscillation is negligible.

50
Ann. Fac. Medic. Vet. di Parma (Vol. XXV, 2005) - pag. 47 - pag. 72
RESULTS
Herewith are the results which will be discussed in the following chapter.
Carpus FemaleAngular Variation
Specimen A Specimen B Specimen C Specimen D4km/h 6km/h 4km/h 6km/h 4km/h 6km/h 4km/h 6km/h
Flexion 102° 97° 77° 74° 102° 81° 106° 90°Extension 227° 240° 203° 204° 230° 234° 227° 225°
Angular Velocity (expressed as degree/s)Peak1° 909 896 783 1025 774 1020 963 8082° -961 -1069 -1017 -1079 -1074 -1304 -986 -1199
Carpus MaleAngular Variation
Specimen A Specimen B Specimen C Specimen D4km/h 6km/h 4km/h 6km/h 4km/h 6km/h 4km/h 6km/h
Flexion 75° 75° 82° 74° 92° 80° 93° 88°Extension 211° 213° 206° 206° 206° 212° 207° 214°
Angular Velocity (expressed as degree/s)Peak1° 1043 1127 893 1008 675 876 794 8022° -978 -1158 -1042 -1040 -876 -1056 -941 -1003
Elbow FemaleAngular Variation
Specimen A Specimen B Specimen C Specimen D4km/h 6km/h 4km/h 6km/h 4km/h 6km/h 4km/h 6km/h
Flexion 100° 105° 78° 80° 105° 93° 80° 71°1 exten. 147° 149° 125° 127° 155° 152° 128° 129°
129° 125° 122° 106° 141° 129° 117° 110°2 exten. 150° 155° 134° 128° 164° 158° 148° 133°Min.stance
Angular Velocity (expressed as degree/s)Peak1° 460 428 447 446 456 576 436 4991° stance -169 -237 -107 -196 -106 -231 -109 -1662° stance 119 207 133 182 142 246 135 1692° -392 -393 -453 -417 -467 -532 -585 -603

51
Ann. Fac. Medic. Vet. di Parma (Vol. XXV, 2005) - pag. 47 - pag. 72
Elbow MaleAngular Variation
Specimen A Specimen B Specimen C Specimen D4km/h 6km/h 4km/h 6km/h 4km/h 6km/h 4km/h 6km/h
Flexion 69° 73° 66° 61° 82° 76° 83° 86°1 exten. 120° 130° 125° 128° 122° 122° 125° 128°
2 exten. 103° 113° 116° 107° 133° 137° 116° 107°Min.stance
Angular Velocity (expressed as degree/s)Picco1° 476 546 519 624 336 445 493 5111° stance -211 -312 -147 -257 -80 -69 -65 -1122° stance 62 110 58 70 133 82 76 1892° -292 -373 -378 -399 -365 -447 -464 -493
Stifle FemaleAngular Variation
Specimen A Specimen B Specimen C Specimen D4km/h 6km/h 4km/h 6km/h 4km/h 6km/h 4km/h 6km/h
Flexion 87° 68° 84° 73° 106° 86° 92° 68°1 exten. 144° 149° 144° 136° 148° 147° 137° 126°
119° 112° 125° 117° 129° 122° 117° 108°2 exten. 122° 122° 128° 128° 139° 134° 118° 118°Min.stance
Angular Velocity (expressed as degree/s)Peak1° 485 611 508 576 368 543 412 5391° stance -163 -203 -106 -139 -81 -165 -95 -1092° stance 26 100 35 106 52 154 7 952° -261 -387 -372 -487 -274 -495 -245 -492
Stifle MaleAngular Variation
Specimen A Specimen B Specimen C Specimen D4km/h 6km/h 4km/h 6km/h 4km/h 6km/h 4km/h 6km/h
Flexion 86° 79° 77° 63° 97° 95° 103° 103°1 exten. 141° 141° 134° 124° 147° 147° 154° 154°
119° 117° 118° 104° 131° 128° 136° 134°2 exten. 122° 124° 130° 126° 140° 140° 137° 141°Min.stance
Angular Velocity (expressed as degree/s)Peak1° 516 592 493 526 437 493 429 4491° stance -112 -143 -106 -193 -77 -109 -109 -1582° stance 24 72 96 208 80 115 -6 572° -339 -439 -492 -621 -327 -410 -274 -351

52
Ann. Fac. Medic. Vet. di Parma (Vol. XXV, 2005) - pag. 47 - pag. 72
Hock FemalesAngular Variation
Specimen A Specimen B Specimen C Specimen D4km/h 6km/h 4km/h 6km/h 4km/h 6km/h 4km/h 6km/h
Flexion 94° 69° 101° 86° 112° 96° 110° 83°1 exten. 137° 125° 149° 138° 142° 141° 147° 128°
111° 98° 129° 116° 119° 108° 119° 106°2 exten. 145° 141° 157° 161° 152° 157° 149° 150°Min.stance
Angular Velocity (expressed as degree/s)Peak1° 410 546 438 442 295 435 371 4611° stance -246 -252 -181 -196 -204 -310 -278 -2192° stance 158 371 137 181 -149 -331 154 3172° -422 -500 -507 -416 -345 -599 -360 -664
Hock MalesAngular Variation
Specimen A Specimen B Specimen C Specimen D4km/h 6km/h 4km/h 6km/h 4km/h 6km/h 4km/h 6km/h
Flexion 100° 96° 90° 72° 116° 114° 120° 120°1 exten. 145° 148° 142° 128° 151° 150° 155° 154°
126° 125° 117° 105° 130° 124° 132° 126°2 exten. 158° 161° 155° 152° 163° 163° 152° 161°Min.stance
Angular Velocity (expressed as degree/s)Peak1° 453 528 495 565 328 363 324 3391° stance -182 -210 -196 -211 -199 -262 -222 -2802° stance 142 260 161 325 154 305 87 1962° -553 -641 -607 -785 -392 -449 -308 -401
HIP FemalesAngular Variation
Specimen A Specimen B Specimen C Specimen D4km/h 6km/h 4km/h 6km/h 4km/h 6km/h 4km/h 6km/h
Flexion 103° 98° 93° 95° 112° 111° 78° 80°Extension 137° 134° 142° 142° 157° 153° 120° 118°
Angular Velocity (expressed as degree/s)PeakEarly stance 84 129 141 184 117 164 145 173Mid stance 127 149 122 170 203 179 146 161Swing -202 -239 -275 -304 -247 -212 -272 -242

53
Ann. Fac. Medic. Vet. di Parma (Vol. XXV, 2005) - pag. 47 - pag. 72
HIP MalesAngular Variation
Specimen A Specimen B Specimen C Specimen D4km/h 6km/h 4km/h 6km/h 4km/h 6km/h 4km/h 6km/h
Flexion 93° 92° 106° 101° 107° 111° 118° 116°Extension 132° 131° 156° 156° 148° 144° 149° 153°
Angular Velocity (expressed as degree/s)PeakEarly stance 161 210 167 286 116 116 87 139Mid stance 95 150 142 195 113 142 116 141Swing -276 -277 -270 -334 -233 -211 -210 -251
DISCUSSION
The movements of the eight subjects have been collated according to four parameters: the average time of every single step, the average of angular variation of the segments that constitute joints, angular velocities of the same segments, the standard deviations obtained collating the steps made by each animal.
In the following paragraphs the dissertation will be divided according to the limb taken into account. Only few graphs have been included, whoever wishes to see the others can ask for them at the Section of Informatics and Biomathematics of the Department of Animal Productions, Veterinary Biotechnology, Food Quality and Assurance of the Veterinary Medicine Faculty of Parma.
CARPUSTimes: comparing at the two different speeds the average times of execution
of a gait cycle of the carpus (starting from the maximal fl exion to the starting point) a certain variability is detectable among the specimens.
In most cases these differences are within 0.06 seconds, in same cases the values are corresponding, just in a single experiment the difference recorded was higher, 0.10 seconds for each step. These data show that the animals that require less time in the interval considered will make a higher number of steps both at walk and trot. It is clear that when moving from walk to trot the times for execution decrease 0.15-0.20 seconds according to the specimen and on the contrary the frequency of steps in the interval will increase.
Angular variations: as it clearly appears in the graphs (see Graph 1 - Carpus) the line has a rounded shape, which outlines the fl uidity of movements which is comprised between 80°-90° during the fl exion and 230°-240° for the extension.
As already mentioned, when times have been discussed, a certain variability has been observed within the group of males and females.
The fi rst group turned out to me more homogenous and in fact the differences in terms of movements were comprised within 5° in extension whereas the variations for the fl exion were higher reaching even 17°.

54
Ann. Fac. Medic. Vet. di Parma (Vol. XXV, 2005) - pag. 47 - pag. 72
Within the female group, three specimens appeared really homogeneous during all the phases of movements and differences were limited to 4°, however, the fourth subject (which already had a difference in time of 0.10 sec) were approximately 25°-30° in all the phases of the movements.
Time
Deg
rees
swin
g
swin
g
stance
Graph 1 - Carpus
When comparing the two groups the average difference was 10°-15° both in fl exion and extension. These differences are likely due to sexual dimorphism of this breed.
Speed: when analyzing the values and the shapes of the waves obtained it is clear that they all are constant in time.
The shape of the waves (see Graph 2 - Carpus) has the following features: values closed to zero at the moment of fl exion and during the stance phase, a relative maximum during the stance phase, a relative minimum during the late stance (from now on, maximum and minimum will be mentioned as peaks) when the limb was suspended with angular values of approximately 150°, which corresponds to half way between the phase of early stance and that of maximal fl exion.
Time
Deg
rees
/Tim
e
Graph 2 - Carpus
The two peaks of maximum and minimum both display in all the specimens different values. The x values of the relative maximum (which correspond to the

55
Ann. Fac. Medic. Vet. di Parma (Vol. XXV, 2005) - pag. 47 - pag. 72
phase of stance) are always lower, as absolute values, to the relative minimums (which correspond to the phase of late stance).
These differences tend to begin higher when the gait moved from walk to trot reaching values even greater than 200°/sec. for the minimum.
A difference has been observed in the peak values of speed between males and females, the latter being faster of 100°/sec. during the trot.
Standard deviation: the step represented in the graphs of angular variation is the average of all the singles steps made by the animal in the interval of time. By means of this operation the standard deviation has been calculated. The average of the standard deviations is represented in another chart (see Graph 3 - Carpus) where the two maximal correspond to the peaks of velocity, which in turn correspond to the values of 150° in terms of angular velocities.
TimeGraph 3 - Carpus
The maximum values of the standard deviations have higher variability in the peaks that correspond to the late stance and both tend to increase moving from walk to trot with values of 6.73 for the fi rst and 7.82 for the second respectively.
ELBOWTimes: the comparison of the average execution times of a complete cycle of
movement of the elbow has not lead to signifi cant differences compared to the times recorded for the carpus. Modifying the gait from walk to trot the times of execution decrease of 0.20 seconds for each step in every single animal. All the considerations previously mentioned for the carpus refl ect the outcomes of the times recorded for the elbow. However, in three specimens the time of execution of a complete cycle of movements were different in the right elbow compared to the left one, these differences were comprised between 0.03-0.06 seconds.
Angular variations: the graphs describing the average angular variations of the elbow during a gait cycle outline the peculiar though similar characteristics among the specimens studied (see Graph 1 - Elbow).

56
Ann. Fac. Medic. Vet. di Parma (Vol. XXV, 2005) - pag. 47 - pag. 72
Time
Deg
rees
sw
ing
stance
Graph 1 - Elbow
The graphs have a trapezoid shape, characterised by values that form two peaks in correspondence of the vertexes of the minor base. The fi rst peak correspond to the maximal extension during the stance phase, the second to a new maximal extension during the late stance. Just after the peak of the stance phase the values tend to increase rapidly of 20°-25° in all the subjects. This minimum value is usually positioned at 1/3 between the two peaks. Thereafter the values tend to increase until the second peak of the late stance to diminish again during the fl exion.
This phase comprised between the two peaks corresponds to the stance phase and turn to be shorter when animals trot.
Calculating the differences between the average angular values of maximal fl exion and maximal extension, between 50°and 65° degrees are obtained depending on the subject.
At the moment of maximal fl exion data are comprised between 70° and 100° whereas those relative to extension between 135° and 160° (these values refer to the peaks).
Within the female group a wide variability among specimens has been observed, the differences being as high as 35° at the moment of fl exion and 30° for extension.
The angular values of the elbow in the male group appear to be more homogeneous. The maximal differences observed among the specimens do not exceed 20° for both fl exion and extension.
Moving to the analysis of the angular values at trot (6 km/h) no signifi cant differences have been observed compared to walk, with the exception of two subjects with differences as low as 7°/8°.
Velocity: the graphs of the angular velocities of the elbow has a similar pattern in all the subjects (see Graph 2 - Elbow). Two peaks are detectable (with positive values for the extension and negative values as for the fl exion) and in six cases out of eight do not differ and their values are comprised between 400°/sec and 600°/sec according to the subject. Both angular velocity peaks, as for the carpus, correspond to the suspension phase of the limb: The fi rst peak is approximately half way between the moment of maximal fl exion and that of maximal extension, whereas

57
Ann. Fac. Medic. Vet. di Parma (Vol. XXV, 2005) - pag. 47 - pag. 72
the second is halfway between maximal extension and maximal fl exion. This is true for both walk and trot.
Collating the values of the angular velocities of the specimens at 4 km/h and at 6 km/h (walk-trot), in 6 subjects out of 8, there are no differences in the peaks, whereas in the two remaining subjects the angular velocities increase of approximately 150°/s.
Time
Deg
rees
/Tim
e
Graph 2 - Elbow
In all the specimens the duration of the stance phase the increase of the angular velocity appeared to be constant; it double in those subjects that did not show differences in the peaks of maximum speed.
Standard deviation: the average standard deviation of the angular variations of the elbow among all the steps made during a trial with the same dog were rather low (see Graph 3 - Elbow): 0.5 with two main peaks. The fi rst peak refl ects the suspension phase and the maximum speed. The second represent lower values and it corresponds to the phase just after the beginning of fl exion.
Time
Graph 3 - Elbow

58
Ann. Fac. Medic. Vet. di Parma (Vol. XXV, 2005) - pag. 47 - pag. 72
HOCKTimes: if we compare among themselves the angles of the segments involved
in the stance – Carpus and Hock – the average times of execution of a step are different in fi ve subjects out of eight. These require, for the hock, 0.03 sec. less in performing a complete gait cycle. For the remaining three animals the times of execution for both Carpus and Hock were the same.
Despite these differences, the variability within both the male and female groups turned out to be very similar between hock and carpus.
The average time of execution of every single step at trot has turned to be, for each specimen, for the hock of 0.17 sec., which is on an average basis 0.03 sec. inferior to the execution time recorder for the movement of the carpus.
Angular variability: the graph of the average angular variation of the Hock has a similar pattern in all the subjects (see Graph 1 - Hock): it is characterized by a minimum in correspondence of the fl exion and two peaks of maximal values, which correspond to the two movements of maximal extension (early stance and late stance). The second peak has in all the subject values of 4° to 13° higher compared to the fi rst. These are due to a major extension just before beginning the fl exion.
Between these two peaks there is a minimum corresponding to the stance phase on the ground which is closer to the fi rst peak (early stance phase). Measuring the time of execution during the stance phase it has been observed that: at 4 km/h all the specimens use the fi rst third of time of the stance phase to reach the minimum value. The remaining 2/3 of the time are used to re-extend the limb until reaching the second peak (late stance). At 6 km/h the time spent to reach the minimum value, during the stance phase, remains unchanged whereas the time necessary to re-extend the Hock until the second peak tend to decrease even though not homogeneously in all the subjects.
Time
Deg
rees
sw
ing
stance
Graph 1 - Hock
Whereas at 4 km/h the ratio between the two phases of the stance phase was constant, 1/3 fi rst phase and 2/3 second phase, at 6 km/h this ratio is extremely variable among specimens. Analyzing the values of the maximal fl exion and maximal

59
Ann. Fac. Medic. Vet. di Parma (Vol. XXV, 2005) - pag. 47 - pag. 72
extension of the Hock in the female group the values appear to be homogeneous. Considering the gait at 4 km/h, the variations are comprised between 100°
and 112°, for the fl exion, and between 137° and 148°, for the fi rst peak of the early stance phase and between 145° and 157° for the second peak of the late stance phase, the minim values of the stance phase are between 111° and 125°.
The male group has a greater variability at the fl exion with values between 90° and 120°. The values between the two peaks are more homogeneous, between 142° and 151° for the fi rst peak and between 154° and 163° for the second peak; the minimum values of the stance phase are 118° to 132°.
Switching to trot, in three subject no signifi cant differences have been observed, only little variations between 1° and 4° in all the gait cycle.
However, the fourth subject has variation of approximately 28° compared to the three other during the fl exion and of 15° in the fi rst peak of extension, on the contrary the second peak is the same of the other animals. It has also been reported a reduction of approximately 15° at the moment of fl exion as in correspondence of the fi rst peak of extension in all the subjects. In the second peak of fl exion, the values remain unchanged (maximal variations 2°-3°), whereas the minimal value decrease of 10°.
Angular velocity: the graphs representing the angular velocities of the hock have a characteristic pattern similar in all the subjects.
The main features are 4 main peaks of velocity which are more signifi cant on the ordinate axis (see Graph 2 - Hock).
The two velocity peaks (1 and 4) which have on the ordinate the maximum absolute value correspond to the moment of swing, halfway in between maximal fl exion and maximal extension at approximately 123° of the angular variation.
Time
Deg
rees
/Tim
e 1
2
3
4
Graph 2 - Hock
The remaining two velocity peaks (2 and 3) with absolute minimum value on the ordinate appear during the stance phase. In particular, they are spot as follows: (2) halfway between the fi rst extension and the minimum value of the stance phase of the angular variation of the hock; (3) halfway between the minimum value and the second peak of extension, just before the beginning of the fl exion phase.

60
Ann. Fac. Medic. Vet. di Parma (Vol. XXV, 2005) - pag. 47 - pag. 72
In the female group at trot the values of angular velocity are similar in all the phases above described for each specimen. When changing gait from walk to trot the data are more variable among subjects.
When the data of the walk and trot have been compared the latter has shown to increase slightly with values comprised between 100°/s and 200°/s.
The male group both at 6 km/h and 4 km/h has displayed a great variability in terms of angular velocity among the specimens in all the movements. Moreover, a great difference has been recorded between the two peaks in all the animals.
The comparison between the angular velocity at 4 km/h and 6 km/h has outlined a variability so complex that cannot be untangled.
Standard deviation: The analysis of the standard deviation has not revealed signifi cant data, the values are comprised between 2.0 and 3.0.
TimeGraph 3 - Hock
STIFLETimes: the average times of execution of a complete gait cycle of the stifl e,
in females, have a homogeneous pattern during walk, differences do not exceed 0.01 sec. among specimens. Just one subject had a difference lower of 0.05 sec, for each step, as compared to the group. When switching from walk to trot the average times of execution slow down between 0.16 sec. and 0.20 sec. for each step. In three subjects the differences turned out to be up to 0.04 sec, the fourth had greater differences up to 0.10 sec compared to the other animals.
In the male group, at walk, the differences in execution times were comprised within 0.05 sec. for each step. Moving from walk to trot a reduction in the execution times has been recorded in a complete gait cycle comprised between 0.18 and 0.22 sec. depending on the subject. The comparison among the specimens at this gait have revealed a certain uniformity with times which are equal of differ very little , no more than 0.03 sec.

61
Ann. Fac. Medic. Vet. di Parma (Vol. XXV, 2005) - pag. 47 - pag. 72
Angular variability: the graph drawn by the average angular variation, starting from the minimum value of the fl exion, has a similar shape in all the specimens at 4 km/h. When changing gait to trot the graph of the female group tend to display different features compared to walk.
Time
Deg
rees
A
B
D
(a)(b)
swin
g
stance
Graph 1 - Stifl e
At 4 km/h, in all the female and male subjects the graph of the angular variations (see Graph 1 - Stifl e) has a trapezoid shape.
The segment A-B is generated by the angular variations starting from the maximal fl exion until the extension of the stance phase, and turn to be longer than the segment C-D which starts from the second extension just before the swing phase ending with the maximal fl exion. This difference in length between the two segments is due to the different times of execution of stance and swing. Moreover, the second peak (C), just before the swing, in all the subjects has lower values, comprised between 8° and 23° compared to (B), due to a lesser extension. When moving from walk to trot, within the segment B-C a minimum can be observed in the area closed to the peak (C) which comes before the swing. This minimum is more marked in females compared to males.
The average angular values have a great variability in the male group while on the contrary a marked homogeneity in the female group. The values obtained at 4 km/h for the fl exion, in the female group, are comprised between 84° and 92° while those related to the fi rst extension are between 136° and 144°. When switching to trot the values relative to fl exion slow down of 10° and 20° according to the specimen, whereas those for the extension of 5° and 10°. Calculating the gap between the maximal fl exion and maximal extension the values are comprised between 50° and 60°.
In the male group, data relative to fl exion, at 4 km/h, have displayed values comprised between 77° and 103° whereas those relative to extension between 132° and 151°.
When changing gait, the values on the fl exion either remain unchanged, or move slightly, with differences comprised between 0° and 11°. Concerning the extension, in three subjects the data are identical whereas the fourth had a little

62
Ann. Fac. Medic. Vet. di Parma (Vol. XXV, 2005) - pag. 47 - pag. 72
reduction of 5°. Even in the male group, as for the females, the evaluation of the angular gap between fl exion and extension have showed values between 50° and 60° both in walk and trot.
Angular velocity: the graphs of the variations of the average angular velocities, in all the specimens, have outlined different shapes according to the gait which the animals were trained: 4 km/h or 6 km/h.
Time
Deg
rees
/Tim
e 13
42
Graph 2 - Stifl eAngular velocities at 4 Km/h (grey) and 6 Km/h (black) (data are expressed as per-centage, as execution times are different)
In the graphs of the walk (see Graph 2 - Stifl e 4 km/h) two peaks can be observed (1-4): the fi rst half way between the fl exion and the beginning of the stance, the second half way between the end of the stance and the fl exion. The fi rst peak (1) compared to the second (4) has ordinal absolute values higher, comprised between 400°/sec. and 500°/sec. depending on the subject, on the contrary, the second peak had values between 250°/sec and 350°/sec., these values are both for males and females.
Within the female group the values referred to the two peaks (1-4) are more homogeneous and in the fi rst once they are doubled compared to the second peak in every single animal.
In the male group the data on velocity have a higher variability among specimens and for the values on the two peaks (1-4) a great difference can be observed despite not reaching the same ratio (2:1) recorded in the female group.
In the graph of the velocities recorded at 6 km/h the two peaks are still clear as previously described, displaying the same characteristics, however in the part of the graph that corresponds to the stance phase two new velocity peaks appear (see Graph 2 - Stifl e). The fi rst comes just after the fi rst maximal extension whereas the second just before the second maximal extension which precedes the fl exion.
These two new peaks appeared at trot have always different values (considered as absolute values). The fi rst has higher values between 130°/sec. and 200°/sec., the second always lower comprised between 50°/sec. and 120°/sec., in all

63
Ann. Fac. Medic. Vet. di Parma (Vol. XXV, 2005) - pag. 47 - pag. 72
the specimens.When collating the values at 4 km/h and 6 km/h the two peaks of maximal
velocities, corresponding to the swing phase, have different patterns between the female and male groups. In the fi rst group the values of the fi rst peak (stance peak) tend to increase to 100°/sec. - 150°/sec. Whereas the second peak (swing peak) increase between 200°/sec and 250°/sec. This feature takes the values of the two peaks much closer to each other thus erasing the ratio 2:1 previously observed at walk. When considering the male group the values of the fi rst peak of velocity are generally unchanged and in one case the velocity slows down, though slightly, whereas the second (swing peak), the values increase between 80°/sec. and 140°/sec..
In the male group, though maintaining the same variability recorded at 4 km/h, has reduced, as in the female group, the differences between the two peaks of maximal velocity recorded at walk.
Standard deviation: In all the subject no signifi cant values are detectable. Standard deviations are comprised between 2 and 5 in all graphs that represent the average of the gait referred to the angular variations of the stifl e.
Tempo
Grafi co 3 - Stifl e
The only exception is represented by the standard deviation within the female group at 6 km/h, in which all the specimens display two peaks that correspond to the maximal velocities recorded during the swing phase.
HIPTimes: In the hip too the average times of execution of a gait cycle have
outlined a higher homogeneity in the female group, with variations non higher than 0.05 sec. in three subjects, whereas the fourth has higher values compared to the fi rst three. In the male group the variability of the average times of execution is higher and the differences are up to 0.10 sec.

64
Ann. Fac. Medic. Vet. di Parma (Vol. XXV, 2005) - pag. 47 - pag. 72
When moving gait from walk to trot the average times of execution tend to decrease between 0.16 sec. and 0.20 sec. for each stepfall, according to the subject, and these differences are equally distributed between males and females.
Angular variations: The graphs of the angular variations of the hip show a typical pattern in all the subjects studied. The shape of the wave tend to be triangular ABC (see Graph 1 - Hip).
In all the specimens, on the tract AB, which corresponds to the phase of extension of the segments of the hip joint, a rapid increase in the angular values are observed after the maximal fl exion with a slight decrease in DE. Collating the data obtained with the images and graphs of the stifl e and hock, it is evident that the decrease in velocity of the tract DE accompanied by increased angular values correspond with the stance phase of the animals. The value of maximal extension of the hip (B) is reached by all the animals at 2/3 of the stance phase. Once the maximal extension is reached the values tend to decrease rapidly anticipating of 0.07 sec the fl exion of the angle of both stifl e and hock which are still in extension.
The numerical values obtained outline the difference between the female and the male group. The fi rst group appears to be less homogenous in terms of hip values, compared to the data previously obtained for stifl e and hock.
Time
Deg
rees
swing
D
A E
B
C
swin
g
stance
Graph 1 - Hip
The difference in fl exion among subject at walk appear to be as high as 32°, with values comprised between 80° and 112°. The same results are obtained for the data on extension where the maximal difference is 37° and the values are between 120° and 157°.
When the animals move from walk to trot no signifi cant angular variations are recordable between the two gaits with differences between 0° and 5°. These records are to be considered true for both fl exion and extension.
The gap between maximal fl exion and extension is comprised in all the subjects of the female group between 35° and 45°.
In the male group the average angular variations in the hip are more

65
Ann. Fac. Medic. Vet. di Parma (Vol. XXV, 2005) - pag. 47 - pag. 72
homogeneous compared to those of the female group but also compared to angular variations of both stifl e and hock.
The differences among the subjects are up to 25° with values from 92° to 117° for fl exion and from 131° to 155° for extension.
When animals change gait into trot no signifi cant variations have been observed between the angular variations which in two cases tend to decrease of 3°-4° despite the increased velocity, whereas the two others do not vary. The gap between maximal fl exion and maximal extension in the males is extremely variable and comprised between 32° and 51°.
Only in the male group a characteristic angular variations has been recorded between the right and left hip. In three of the four specimens studied both fl exion and extension the values of the right hip were higher compared to the left one. In the fourth subjects, on the contrary, the values are higher for the movement of the left hip. These differences are comprised between 7° and 15° for the fl exion and between 9° and 19° for the extension. No differences have been recorded when moving form walk to trot.
Angular velocities: the graphs obtained from the variations of the angular velocities of the hip have similar features in all the subjects. The shapes of the wave have three important peaks (1-2-3) (see Graph 2 - Hip): the fi rst appears during the early stance phase, the second during the stance phase and the third during the swing phase. The fi rst and third peak off angular velocity are at approximately half of the stance phase the fi rst and half of the swing phase the latter. The second peak of velocity it at 2/3 of the stance phase, which corresponds to the movement just before the beginning of the fl exion of the hip.
12
3
Time
Deg
rees
/Tim
e
Graph 2 - Hip
It is worth nothing that the fi rst angular velocity peak of the hip corresponds to the velocity peak of the stance of the stifl e. The third angular velocity peak of the hip, in six specimens out of eighth, corresponds to the beginning of the fl exion in the angular velocity of the stifl e, anticipating the movement of maximal angular velocity of the stifl e during the fl exion of 0.05-0.11/sec., for each stepfall depending

66
Ann. Fac. Medic. Vet. di Parma (Vol. XXV, 2005) - pag. 47 - pag. 72
on the subject. For the remaining two subjects the times when the maximal angular velocity of the stifl e and hip fl exion are reached are the same.
The three peaks of velocity when compared appear to be different in all the subjects. The fi rst two which are in the phase of fl exion of the hip (the fi rst in the swing phase, the second during the stance phase), display when compared similar values which are often the same. Both turn to have lower absolute values compared to the third peak of the swing phase.
The latter in most cases has angular velocity values doubled compared to the fi rst two. When collating the angular velocities of the hip to those of stifl e and hock it is clear that the fi rst are much lower compared to the last two. The values differ of 200°-300°/sec.. The hip angular velocities are not much high, with a maximum of 300°/sec., during the fl exion peak, in the two other peaks the values are between 100°-140°/sec..
If we compared the angular velocities of each specimen walking or trotting no signifi cant differences can be observed among the peaks of maximal velocity, sometimes these tend to be lower in the trot compared to the walk. From the analysis of the angular velocities of the hips in the male group, where a difference in the angular variations was observed between left and right hip, no signifi cant differences have been observed between the two sides of the animal. This has been recorded for both the peaks of maximal velocity and for the relative waves.
CONCLUSIONS
The cinematic values recorded in the current study have overall confi rmed data previously obtained in other studies with other dogs, the variability observed among specimens is probably due to the morphological differences of each animal.
Time
Deg
rees
Graph A
However, among this differences it cannot be excluded that the animals may have displayed different approaches to the movement induced by a machine such as the treadmill.

67
Ann. Fac. Medic. Vet. di Parma (Vol. XXV, 2005) - pag. 47 - pag. 72
Among all the movements analyzed in this study one would deserve much attention: the movement in which took place all the joints that in stationary position have acute angles (elbow, hock, stifl e).
Looking at the graphs of the angular variations of the above mentioned limbs (see Graph A) a particular feature is worth of notice.
Letʼs analyze the movement: starting for the maximal fl exion the process of distension of the limb reaches its maximal extension just before it touches the ground. Once reached this maximum, the movements proceeds with variations throughout the stance phase on the round until a new maximal extension just before starting a new fl exion with a swing phase that will conclude the cycle with maximal fl exion.
Within the stance phase a minimum due to a fl exion has been detected, this may be due to the weight-force of the animal that unloads on the limb on stance phase. It is clear that the weight force will infl uence more those segments that create acute angles. After this minimum on the stance the animal recovers the extension with force due to the muscular work to return to a new maximum before the fl exion.
The ordinate of the above mentioned minimum will change when moving from walk to trot (from 4 km/h to 6 km/h) (see Graph B and Graph C). At gait change average variations of the stifl e turn out to be of 7° for females and 3° for males. In the hock these values increase twofold to 13° for females and 6° for males. This increment within the stance phase could be explained by the increase of the inertial force due to the increased speed of the animal. On the joints taken into account the constant weight force of the animals and the increase in the inertial force, due to the increased movement, are unloaded. The shear force increases determining an increased fl exion with the stance phase.
Wei
ght F
orce
Wei
ght F
orce
Risultante Risultante
Inertial Force Inertial Force
Fig. 1 Fig. 2
The aforementioned values concerning a decreasing of the minimum when
the speed vary during the stance phase seem to be of little signifi cance. However, considering the moment of maximal extension and the difference with the minimum within the stance phase is calculated, the increase in the movement determines a reduction in this minimum of ¼ compared to the difference between the maximum and minimum previously obtained. This is implied for an increase in speed of only 3 km/h.
In the female group, this minimum at trot is amplifi ed compared to the male group, and it moves, considering the movement as a whole, in the second part of the stance phase, delaying the recover from the gait of 0.5 sec.
This could confi rm the hypothesis above mentioned. As the females are

68
Ann. Fac. Medic. Vet. di Parma (Vol. XXV, 2005) - pag. 47 - pag. 72
smaller size compared to males, at the same speed they have to increase the number of steps. This in turn determines and increased speed of the movement of the limb and consequentially the quantity of movement as a whole.
Expressed as %
Deg
rees
Graph B - Stifl e: 4 Km/h (black) and 6 Km/h (grey)
Expressed as %
Deg
rees
Graph C - Hock: 4 Km/h (grey) and 6 Km/h (black)
This movement can be considered as a shock absorber at the moment of the impact with the round and the foot represents the fulcrum, whereas the joints as levers.
All this could contribute to reduce the vertical and oblique forces coming form beneath which would otherwise be redirected to the pelvis and the vertebral column. It would be interesting to understand all the causes of this peak of minimum within the stance phase and being thus able to tell apart the inertial causes and those related to a neuro-muscular work.
Probably, a more precise knowledge of this movement could represent an important indicator of the slight lameness as the movement that comes just after the stance phase seems to be a critical point in the cycle of the step.
Moreover, additional hypothesis on the angular speed during all the phases of a step could be worth of investigation. The data obtained on the different speeds have been analysed collating the positive values of the extension to the negative values of the fl exion. In all the cases the value obtained from the sum of all the data has turned

69
Ann. Fac. Medic. Vet. di Parma (Vol. XXV, 2005) - pag. 47 - pag. 72
to be 0.0±0.54°/s as it was expected (the values slightly different from zero could be due to little mistakes related to the gathering of the signals from the markers by the software). When analysing the data on the speed those more relevant appear to be the peaks. In all the animals the peaks are always positioned in well established moments. The comparison of these maximal values turn to be different form animal to animal, sometimes the peaks with positive values fi t together, some times the negative ones. As the sum of all the values is always zero, the speeds which are not reached in the maximal moments are distributed on other phases of the movement. This speculation comes from the comparison of all the graphs on the speeds of the animals however it does not lead to a quantitative analysis. A better comprehension of the possible causes of a non homogenous distribution of the speeds among the specimens could lead in the future to further knowledge on some gait disorders. An advantage in the analysis of speeds is represented by the shapes of the relative graphs, in fact it is easy to compare the shape of the relative waves as they all start form a speed of zero easily identifi able in the moment of maximal fl exion.
Another set of data which could be worth of further investigation is represented by the homogeneity of the movement within the two groups of males and females respectively. Comparing the different values of the angular variations of the male group the forelimbs are similar and homogeneous. Those of the female group on the contrary do differ among them.
Expressed as %
Deg
rees
Graph D - Comparison of angles in female stifl e (6 Km/h)
Expressed as %
Deg
rees
Graph E - Comparison of angles in male stifl e (6 Km/h)

70
Ann. Fac. Medic. Vet. di Parma (Vol. XXV, 2005) - pag. 47 - pag. 72
These outcomes are up side down when considering the hindlimb: the values of the females are more similar (see Graph D) and homogeneous whereas the male ones are more vary and dispersed (see Graph E). These differences may be due to the sexual dimorphism which characterize this breed. According to observational data the male thorax is wider and more muscular, whereas the females have a wider pelvis. These structural differences may represent the cause of a major stability of the forelimbs in the males and the hindlimbs in the female. However, these consideration can be true only for this breed and rely on observations made on only eight specimens. It could be interesting and worth investigating whether these speculations would be confi rmed in a more numerous population and in other breeds too.
ACKNOWLEDGEMENTS
The authors gratefully acknowledges Clara Ninimosi and Cesare Damaschi for their technical assistance and Roberto Marena for his availability and cooperation.
Key words: biomechanic, dog, angols, jointsParole chiave: biomeccanica, cane, angoli, giunturePalabras claves: biomecanica, perro, angulos, unionMots clés: biomecanique, chien, angles, jointures
BIBLIOGRAPHY
1) Martinez S.A., DeCamp C.E.,Cimino L.D., et al.: Repeatability of kinematic variables in the normal gait of adult Greyhounds. Vet. Surg. 1995.
2) Bennet R.L., DeCamp C.E., Flo G.L., et al.: Kinematic gait analysis in dog with hip dysplasia. Am. J. Vet. Res. 57:966-971,1995.
3) E. Adriany, U. Matis: Gait analysis in dogs following TPLO: short-term results of a prospective study. 1st World Orthopaedic Veterinary Congress, Munich 2002.
4) Schaefer S.L., DeCamp C.E., Hauptman J.G., et al.: Kinematic gait analysis of hind limb symmetry in dogs at the trot. Am. J. Vet. Res. 1998; 59:680-685.
5) Kaleps I., Clauser C.E., Young J.W., et al.: Investigation into the mass distribution properties of the human body and its segments. Ergonomics 1984:27; 1225-1237.
6) Van Weeren P.R., Van den Bogert A.J., Barneveld A.: Quantifi cation of skin displacement near the carpal ,tarsal and fetlock joints of the walking horse. Equine Vet. J. 1998; 20:203-208.
7) Van Weeren P.R., Van den Bogert A.J., Barveled A.: Quantifi cation of skin displacement in the proximal parts of the limbs of the walking horse. Equine Vet. J. 1990; suppl. 9:110-118.
8) Van den Bogert A.J., Van Weeren P.R., Schamhardt H.: Correction for skin displacement errors in movement analysis of the horse. J. Biomech. 1990; 23:97-101.

71
Ann. Fac. Medic. Vet. di Parma (Vol. XXV, 2005) - pag. 47 - pag. 72
9) Little M.J., Jessup G.T.: Determining limb volume by a point gauge, water-displacement technique. Res. Q. Exerc. Sport 1977, 48:239-243.
10) Jansen M.O., Van Raaij J.A., Van den Bogert A.J., et al.: Quantitative analysis of computer averaged electromyographic profi les of intrinsic limb muscles in ponies at the walk. Am. J. Vet. Res. 1992; 53:2343-2349.
11) Conzemius M.G., Aper R.L., Hill C.M.: Evalaution of a canine total-elbow arthroplasty system: a preliminary study in normal dogs. Vet. Surg. 2001; 30:11-20.
12) Colborne G.R., Lanovaz J.L., Springings E.J., et al.: Forelimb joint moments and power during the walking stance phase of horses. Am. J. Vet. Res. 1998; 59:609-614.
13) Clayton H.M., Hoyt D.F., Wickler S.J. et al.: Hindlimb net joint energies during swing phases as a function of trotting velocity: Equine Vet. J. Suppl. 2002; 34:363-6.
14) McLaughlin R.J., Roush J.K.: Effect of subject stance time and velocity on ground reaction forces in clinically normal GreyHounds at the trot. An. J. Vet. Res. 1994; 55:1666-1671.
15) Lombard W.P.: The action of two joint muscles. Am. Phys. Educ. Rev. 1903; 8:141-145.
16) Apkarian J., Naumann S., Cairns B.: A three-dimensional kinematic and dynamic model of lower limb. J. Biomech. 1989; 22:143-155.
ABSTRACT
The aim of this work is to furnish a contribution to a dogs biomechanic understanding. The movement of eight samples all belonging to the same race (Flat-Coat) have been studied. In every sample joints angular variation and angular velocity have been analyzed at two different speeds (walk and trot). The obtained data have been used to point out contingent differences due to the different gaits. In addition, a comparison has been done between movements of each animal divided in two categories (male and female) to evidence and quantify the difference due to different morphology.
RIASSUNTO
Il lavoro ha lo scopo di fornire un contributo alla comprensione della biomeccanica dei cani. Si è studiato il movimento di otto campioni appartenenti tutti alla stessa razza (Flat-Coat). Di ogni singolo campione si sono studiate le variazioni angolari e le velocità angolare delle articolazioni a due diverse velocità (al passo e al trotto). Si sono usati i dati ottenuti per rilevare eventuali differenze dovute alle due andature. Si è inoltre proceduto ad un confronto fra i movimenti dei singoli animali divisi in due categorie (maschi e femmine) per evidenziarne e quantifi carne le differenze dovute alla diversa morfologia.

72
Ann. Fac. Medic. Vet. di Parma (Vol. XXV, 2005) - pag. 47 - pag. 72

73
Ann. Fac. Medic. Vet. di Parma (Vol. XXV, 2005) - pag. 73 - pag. 94
EXPERIMENTAL DIRECT AND INDIRECT PROLONGED OCHRATOXIN A INTOXICATION IN SWINE
OSSERVAZIONI E RILIEVI SULLʼINTOSSICAZIONE PROTRATTA, DIRETTA ED INDIRETTA, DA OCRATOSSINA
IN SUINI. CONTRIBUTO SPERIMENTALE
Cabassi E.1, Miduri F.1, Valente L.2, Corradi A.1, Cantoni A.M.1, Fusari A.1, Gregori A.3
PAROLE CHIAVE:
suino, ocratossina A (OTA), linfociti, immunotossicosi, nefropatia.swine, ochratoxin A (OTA), lymphocytes, immunotoxicosis, nephropathy.
Premesse
Lo stimolo per lo studio di nuove indagini sperimentali per la dimostrazione e per un più preciso inquadramento del potere immunotossico esercitato dalle micotossine sul suino, nasce dalle osservazioni di campo che evidenziano come gli animali esposti a tali tossici siano in realtà più sensibili a diverse malattie intercorrenti e trova suggerimenti da prove concluse in altre specie domestiche (C.A.S.T. Report n°139, Ames, Iowa, 2003).
In siffatto contesto si inserisce il nostro interesse per un ampliamento ed approfondimento di questa tematica, del rapporto eziopatogenetico tra micotossine di varia natura ed insorgenza di disfunzioni nella risposta immunitaria, senza trascurare il comportamento ematoclinico, nonché lʼassetto morfostrutturale.
Comʼè noto, le micotossine sono molecole tossiche derivanti dal metabolismo secondario di alcuni funghi appartenenti alle specie Aspergillus, Pennicillum e Fusarium, e possono entrare nella catena alimentare attraverso cereali inquinati, latte, carne, uova ottenuti da animali alimentati con mangimi contaminati. Devegowda G. et al. (1996) riportano che queste tossine sono presenti nel 25% circa del raccolto mondiale di cereali.
Tra le micotossine, le più note e più studiate sono lʼafl atossina B1 (AFB1), lʼocratossina A (OTA), la fumonisina B1 (FB1), lo zearalenone (ZEN), il deoxynivalenolo (DON) e la tossina T2. I loro principali effetti tossici riguardano la potenziale attività cancerogena, genotossica, teratogena ed immunosoppressiva. Tuttavia, gli effetti morbosi evidenziati nellʼuomo e negli animali domestici si
1 Dipartimento di Salute Animale - Sezione di Patologia Generale ed Anatomia Patologica Veterinaria, Università degli Studi di Parma2 Consulente Servizio Veterinario di Ateneo per il Controllo del Benessere Animale3 IZLER, Brescia

74
Ann. Fac. Medic. Vet. di Parma (Vol. XXV, 2005) - pag. 73 - pag. 94
possono manifestare, sia come forme patologiche ben defi nite, quali la sindrome di Reye nellʼuomo (riferibile allʼAFB1), la leucoencefalomalacia dellʼequino e lʼedema polmonare del suino (assegnabili alla FB1), lʼiperestrogenismo delle scrofette (ascrivibile allo ZEN) e la nefropatia endemica dei Balcani (attribuibile allʼOTA), ma ancor più possono apparire come stati di tossicità subacuta o cronica, non sempre clinicamente riconoscibili, capaci, però, di alterare più o meno gravemente la funzionalità dellʼorganismo e compromettere così le produzioni zooeconomiche (Galvano F. et al., 2001; Piva G. & Pietri A., 2002).
Gli animali domestici mostrano suscettibilità diversa nei confronti delle micotossine a seconda della specie, della dose assunta, della durata dellʼesposizione, dellʼetà, del sesso, dello stato fi siologico in cui si trova lʼanimale, nonché dellʼeventuale sinergismo con altre micotossine contemporaneamente presenti nellʼalimento (OʼBrien E. et al., 2005).
Nellʼambito delle micotossicosi un ruolo importante rivestono le ocratossine, non solo per lʼinfl uenza negativa che possono determinare sulle performances e sul benessere degli animali, ma soprattutto per gli effetti deleteri che possono provocare nellʼuomo a seguito del consumo di alimenti contaminati.
Le ocratossine, derivati isocumarinici legati alla L-β-fenilalanina, sono classifi cate come pentachetidi e sono prodotte principalmente da due specie di miceti, Penicillum verrucosum ed Aspergillus ochraceus (A.alutaceus). In letteratura si segnalano almeno otto forme di ocratossine, che variano per tossicità in base alla costante di dissociazione del gruppo fenolico. Le ocratossine A (OTA) e C (OTC) sono le più tossiche, con costante di dissociazione molto simile, mentre lʼocratossina B (OTB) è circa 10 volte meno tossica dellʼOTA. OTA e OTB sono le uniche ocratossine presenti nelle piante. Unʼaltra tossina prodotta da Penicillum verrucosum è la citrinina, che agisce in sinergismo con lʼOTA provocando gravi danni renali.
L OTA è un composto relativamente stabile, poco solubile in acqua, mediamente in blande soluzioni di bicarbonato e molto solubile nei solventi organici (Hollinger K. & Ekperigin H.E., 1999).
La quantità di ocratossine prodotte dalle suddette specie fungine può essere infl uenzata principalmente da alcuni fattori, quali: la temperatura, il tipo di substrato e la presenza di una fl ora competitiva. In cereali stoccati è stato individuato che il range di temperatura ottimale per la produzione di OTA da parte di A.ochraceus è compreso tra 12° e 37°C, e per P.verrucosum tra 4° e 31°C; questʼultimo sembra essere il maggior responsabile della produzione di OTA nei cereali nelle zone a clima più freddo, mentre A.ochraceus sembra essere coinvolto nella produzione di OTA nei paesi a clima medio-caldo (Krogh P., 1992).
Il substrato su cui le due specie fungine crescono è di fondamentale importanza per la produzione di ocratossine. In uno studio in vitro, si è dimostrato che i semi di soia e di arachidi costituiscono il substrato ottimale per la produzione di OTA ed OTB da parte di A.ochraceus., mentre lʼorzo ed il frumento fungono da miglior substrato per la produzione di OTA e citrinina da parte di P.verrucosum; è stato inoltre evidenziato che non esiste un rapporto diretto tra lo sviluppo del micete e la quantità di micotossina prodotta (Madhyastha M.S. et al.,1990)
La presenza di una microfl ora competitiva allʼinterno di cereali interferisce

75
Ann. Fac. Medic. Vet. di Parma (Vol. XXV, 2005) - pag. 73 - pag. 94
con la produzione di ocratossine da parte di A.ochraceus; Chelack W.S. et al. (1991) hanno, infatti, osservato che la produzione di OTA su un substrato sterile di orzo è maggiore rispetto a quella prodotta su analogo substrato non sterilizzato e che il reintegro del microbiota indigeno in questo substrato colturale, determina una graduale diminuzione della produzione della tossina stessa.
L OTA viene rapidamente assorbita dal tratto gastroenterico di tutti gli animali ad eccezione dei ruminanti, la cui microfl ora ruminale la idrolizza rapidamente in un metabolita meno tossico (ocratossina-α), prima di essere assorbita (Patterson D.S.P. et al., 1981; Xiao H. et al., 1991a,b). Entrata in circolo, lʼOTA si lega allʼalbumina plasmatica e si distribuisce nei vari tessuti, in concentrazioni decrescenti: polmone, fegato, rene, cuore, tessuto adiposo, intestino, etc. Le concentrazioni più basse di OTA si rinvengono a livello di muscoli, milza e cervello. Il ricircolo entero-epatico ed il forte legame che lʼOTA crea con le albumine sono i maggiori responsabili del prolungamento dellʼemivita plasmatica della tossina stessa. Inoltre è stato dimostrato che lʼOTA può attraversare la placenta ed essere quindi trasferita alla prole nel ratto, nel topo e nel suino; residui della stessa tossina si possono altresì ritrovare nel latte e nelle uova (Hollinger K. & Ekperigin H.E., 1999).
L azione tossica dellʼOTA si esplica su diversi processi enzimatici più o meno congiunti, che riguardano: a) il metabolismo della fenilalanina, quali la fenilalanina-transferasi e fenilalanina-idrossilasi (Dirheimer G. et al., 1991); b) la perossidazione lipidica, con modifi cazioni della permeabilità di membrana e di conseguenza necrosi cellulare (Creppy E. et al., 1995); c) lʼattività mitocondriale, con alterazione nella produzione di ATP; d) il danneggiamento del DNA, dellʼRNA e della sintesi proteica di molti organismi viventi (Creppy E. et al., 1986; Meisner H. & Polsinelli L., 1986).
Alcuni AA (Schaaf G.J. et al., 2002; Baldi A. et al., 2004), ritengono che il danno cellulare provocato dallʼOTA sia principalmente da ricondursi alla produzione di radicali attivi dellʼossigeno (ROS), unitamente alla sua potenziale capacità di attivare la citocromo p450 (enzima in grado di metabolizzare un gran numero di composti generalmente liposolubili), che stimolano la perossidazione OTA-dipendente dei lipidi e determinano la trasformazione dellʼocratossina A nei suoi metaboliti mutageni.
In rapporto al tempo ed alla modalità di ingestione, lʼOTA può causare fenomeni di tossicità acuta in molte specie animali quali suini, pecore, ratti, polli, tacchini e trote.
La tossicità orale acuta, espressa come dose letale LD50 (mg/kg di p.v.), varia da 1 a 6 per il suino, 3,3 per il pollo e 0,2 per il cane (Kuiper-Goodman T. & Scott P.M., 1989); non sono riportati valori di tossicità acuta per i ruminanti, tuttavia è stato evidenziato che dosaggi superiori a 2 mg/kg di OTA sembrano determinare nei vitelli depressione del sensorio, diminuzione del peso corporeo e disidratazione (Marquardt R.R. & Frohlich A.A., 1992). I principali sintomi clinici associati ad una forma acuta di ocratossicosi includono: anoressia, perdita di peso, vomito, tenesmo, proctite, congiuntivite, tonsillite, polidipsia, poliuria, ipertermia, disidratazione, prostrazione e morte dopo circa due settimane dallʼassunzione della tossina (Chu F.S., 1974).

76
Ann. Fac. Medic. Vet. di Parma (Vol. XXV, 2005) - pag. 73 - pag. 94
Apprezzabili e precoci espressioni di ocratossicosi sembrano essere il decremento ponderale e lʼipofunzionalità renale, fi no ad una grave insuffi cienza conseguente alla progressiva nefrosclerosi. Huff W.E. et al. (1988) ritengono che i livelli sierici delle proteine totali, nonchè delle albumine, siano da considerarsi indicatori sensibili per la valutazione dellʼocratossicosi nel pollo. Altri ricercatori hanno dimostrato che la diminuzione dellʼattività dellʼenzima renale fosfoenol-piruvato carbochinasi (PEPCK) sembra essere il segnale più mirato e specifi co per lʼidentifi cazione di uno stato di intossicazione da OTA nella specie suina (Krogh P. et al., 1988).
Processi di tossicità cronica, oltre il rene, coinvolgono vari altri organi che possono comportare quadri genotossici, carcinogenetici, teratogenetici o disfunzioni immunitarie. Fenomeni di tossicità cronica da OTA sono stati evidenziati soprattutto nella specie suina. Krogh P. et al. (1974) riportano che dopo 4 mesi di esposizione a vari dosaggi di OTA, suini alimentati con diete contenenti da 200 a 4000μg/Kg di tossico, sviluppano quadri nefropatici. In questa specie sembra che le lesioni più imponenti siano caratterizzate da degenerazione dei microvilli dei tubuli contorti prossimali, accompagnati da sparsi fenomeni di fi broplasia connettivale dellʼinterstizio, fi no alla nefrosclerosi (Marquardt R.R. & Frohlich A.A., 1992). Le modifi cazioni a carico delle componenti tubulari renali determinano glicosuria, ipercreatininemia ed iperazotemia, associate a ridotta capacità di concentrare le urine. Studi analoghi sui polli hanno evidenziato che, anche in questa specie, lʼorgano maggiormente colpito dallʼazione tossica cronica dellʼOTA è il rene anche se altri organi quali fegato, tratto gastrointestinale, linfonodi, midollo osseo, timo, apparato scheletrico ed organi riproduttivi possono essere coinvolti (Burns R.P. & Dwivedi P., 1986).
Tra gli animali di interesse zootecnico, il suino è probabilmente quello che manifesta la più alta sensibilità nei riguardi dellʼOTA, presentando oltre al quadro nefropatico (“nefropatia micotossica del suino”) frequenti lesioni anche in altri parenchimi quali fegato, milza, timo (Hussein M.S. et al., 2001). Va da sé che in tale ottica di coinvolgimento di organi emolinfopoietici sia presumibile che anche il sistema immunitario possa risentirne, sia direttamente con la formazione di addotti con il DNA, capaci di interferire sulle funzioni cellulari della produzione anticorpale o della citolisi cellulo-mediata, sia indirettamente per gli effetti tossici generalizzati a più organi (Robens J.F. et al., 1992).
Per quanto attiene le alterazioni della risposta immunitaria, ricerche effettuate su polli hanno evidenziato che lʼOTA determina deplezione delle cellule linfoidi nel timo, nella Borsa di Fabrizio, nella milza e nelle placche del Peyer. La deplezione delle cellule timiche è accompagnata da fenomeni di ipersensibilità ritardata, suggerendo, in questo modo, una possibile soppressione dellʼimmunità cellulo-mediata (Dwivedi P. & Burns R.P.,1984,1985).
L attività immunotossica dellʼOTA è stata studiata in diversi modelli sperimentali, utilizzando vari dosaggi e vie di somministrazione, con risultati spesso di diffi cile interpretazione. E stato osservato che lʼesposizione allʼOTA: a) interferisce con i livelli plasmatici delle immunoglobuline nei ratti e nei polli (Dortant P.M. et al., 2001; Dwivedi P. & Burns R.P.,1984); b) comporta, nel topo, soppressione della risposta anticorpale agli eritrociti di pecora (SRBC) (Creppy E.E. et al., 1983;

77
Ann. Fac. Medic. Vet. di Parma (Vol. XXV, 2005) - pag. 73 - pag. 94
Thuvander A. et al., 1995); c) non determina modifi cazioni della risposta proliferativa dei linfociti B nel ratto (Dortant P.M. et al., 2001) e nel topo (Thuvander A. et al., 1995), mentre inibisce quella dellʼuomo (Lea T. et al., 1989). Relativamente alla risposta immunitaria cellulo-mediata, è stato osservato nei roditori che lʼesposizione allʼOTA per quasi un mese non modifi ca la risposta ai mitogeni delle cellule T, mentre risulta diminuita dopo 90 giorni (Luster M.I. et al., 1987; Dortant P.M. et al., 2001; Thuvander A. et al., 1995). Ricerche effettuate sul suino e sul pollo hanno messo in evidenza un forte decremento della risposta proliferativa ai mitogeni da parte dei linfociti T, a seguito dellʼesposizione allʼOTA (Harvey R.B. et al., 1992; Elissalde M.H. et al., 1994). I risultati relativi agli effetti dellʼOTA sullʼattività delle cellule NK sono talvolta contradditori; infatti una diminuzione della loro attività è stata osservata nel topo, ma non in altri roditori (Luster M.I. et al., 1987; Dortant P.M. et al., 2001; Thuvander A. et al., 1995). Sempre nel topo, lʼattività dei linfociti T ad azione citotossica sembra non essere modifi cata dallʼesposizione allʼOTA, mentre disfunzioni sono state osservate a carico dei macrofagi sia nel topo che nel pollo (Campbell M.L. et al., 1983; Boorman G.A. et al., 1984; Luster M.I. et al., 1987; Muller G. et al., 1995). Recentemente Alvarez L. et al. (2004), in ratti intossicati con dosi di OTA comprese tra 50 e 450 μg/kg p.v. per 28 giorni, oltre al quadro nefrotossico, hanno osservato riduzione del potere macrofagico nonché dellʼattività citotossica dei linfociti.
Nella specie suina è tuttora in fase di studio lʼesistenza di un eventuale rapporto eziopatogenetico tra ocratossina e disfunzioni del sistema immunitario. In lavori su suini trattati con OTA (7-50 μg/kg p.v.) sono stati evidenziati: riduzione della componente leucocitaria, aumento dei fenomeni di apoptosi dei fagociti, incremento nella produzione dei ROS nel sangue, nonchè alterazioni nella ripartizione delle sottopopolazioni linfocitarie (Muller G. et al, 1999; Muller G. et al., 2004).
In ordine ai frequenti riscontri di OTA negli alimenti destinati agli animali allevati in produzione zootecnica si inserisce la presente ricerca, intesa ad analizzare lʼeffi cacia di potenziali trattamenti ocratossina protettivo-detossifi canti nellʼalimentazione animale. In particolare, nel contesto presente, si intende valutare il comportamento della risposta immunitaria e le eventuali alterazioni morfofunzionali in scrofe, direttamente intossicate con OTA, con o senza supplementazione di vitamine A ed E, durante il periodo di gestazione e lattazione, nonchè nella loro prole indirettamente esposta.
Metodologia
Il protocollo sperimentale, approvato dal Comitato etico dʼAteneo, ha previsto lʼutilizzo di 15 scrofe primipare e gravide da almeno 40 giorni, appartenenti alla stessa linea genetica (Duroc x (LWxL)) e tenute nelle stesse condizioni ambientali e di alimentazione. Quattro scrofe sono state adibite a controllo (gruppo A) ed alimentate ad libitum con mangime testato privo di micotossine; le rimanenti 11 sono state suddivise in tre sottogruppi: uno di 3 scrofe (gruppo B) e due di 4 soggetti ciascuno (gruppo C e gruppo D); questi ultimi hanno ricevuto ad libitum, per circa 100 giorni

78
Ann. Fac. Medic. Vet. di Parma (Vol. XXV, 2005) - pag. 73 - pag. 94
(dal 45° giorno di gestazione fi no al termine dellʼallattamento) lo stesso mangime del gruppo controllo contaminato però da ocratossina A. Alle scrofe del gruppo B sono state somministrate giornalmente nel mangime 160 ppb di ocratossina A, derivante da un substrato colturale di riso contaminato da A.ochraceus; i soggetti del gruppo C e del gruppo D hanno invece ricevuto unʼalimentazione contenente complessivamente 500 ppb di ocratossina A, rappresentata da 160 ppb di tossico derivante dal predetto substrato colturale, e da 340 ppb di ocratossina cruda (SIGMA); inoltre, al fi ne di limitare i danni ossidativi determinati dallʼOTA, la razione dei soggetti del gruppo D è stata supplementata con 60 UI di vitamina E associata ad 11.000 UI di vitamina A per Kg di alimento, quote vitaminiche che in nostre precedenti esperienze avevano dimostrato unʼeffi cace azione protettivo-detossifi cante verso la contaminazione da afl atossina B1 (Cabassi E. et al., 2003). Su tutte le scrofe, quotidianamente seguite sotto il profi lo clinico e comportamentale, sono stati effettuati prelievi di sangue al 65° ed al 95° giorno di gravidanza, nonché a 3 ed a 21 giorni dopo il parto. Inoltre, in 21ª giornata dal parto si è provveduto a prelevare da tutte le scrofe singole aliquote di latte per accertare lʼeventuale passaggio di OTA dal mangime al latte materno. Al parto, da ogni scrofa sono stati scelti casualmente 4 suinetti, ai quali sono stati prelevati campioni di sangue al 3° ed al 21° giorno di vita.
Sul sangue raccolto (scrofe e suinetti) sono state effettuate valutazioni emocitometriche (emocromo e formula leucocitaria) ed ematochimiche (glucosio, lipidi totali, trigliceridi, urea, creatinina, metaemoglobina, albumina, bilirubina totale, calcio, fosforo, sodio, potassio), nonché dellʼimmunofenotipo riguardante le principali sottopopolazioni linfocitarie T (CD4, CD8, CD3, TCRγδ), B (CD21) e di quelle a carattere monocitario (CD14), mediante analisi citofl uorimetrica, seguendo metodiche da noi già sperimentate in altre ricerche (Luppi A. et al.,2002). I campioni di latte prelevati sono stati analizzati per la ricerca dellʼOTA, mediante HPLC, secondo le metodiche seguite da Turconi G. et al. (2004).
Su tutte le scrofe ed i suinetti esaminati, sacrifi cati in 22ª giornata dopo il parto mediante Tanax®, sono stati condotti accurati esami necroscopici, prelevando porzioni di fegato, rene, milza, ileo, linfonodi mesenterici e timo, che sono stati fi ssati in formalina tamponata, processati e colorati per lʼallestimento di sezioni istologiche.
Risultati
Durante la sperimentazione non si sono osservati segni di sofferenza clinica, né anomalie comportamentali, sia a carico delle scrofe che della rispettiva prole.
Per quanto attiene i parametri ematologici ed immunofenotipici saggiati, non si sono evidenziate variazioni statisticamente signifi cative nei valori ottenuti, pur con oscillazioni individuali, tra le scrofe controllo (gruppo A) e quelle intossicate (gruppi B, C, D); tuttavia nei gruppi C e D (500 ppb di OTA con e senza supplementazione vitaminica), sono stati rilevati modesti rialzi della metaemoglobinemia e della creatininemia, una lieve riduzione della componente eritrocitaria, dellʼemoglobina, nonchè dellʼalbuminemia ed un contenuto decremento delle principali sottopopolazioni

79
Ann. Fac. Medic. Vet. di Parma (Vol. XXV, 2005) - pag. 73 - pag. 94
linfocitarie T (CD4+, CD8+), B (CD21) e monocitarie (CD14), parametri questi in parte espressione di un incremento dei processi ossidativi e dallʼaltra potenzialmente correlabili ad una diminuzione dellʼattività funzionale renale e della capacità reattiva del sistema immunitario.
Anche le determinazioni ematologiche e del comportamento immunofenotipico delle principali sottopopolazioni linfocitarie T, B e monocitarie, effettuate su tutti i 60 suinetti in sperimentazione (controllo ed indirettamente intossicati), non hanno palesato differenze statisticamente signifi cative, che pur oscillando nei valori individuali, mostrano propensioni per una riduzione dei valori eritro-leucocitari, nonché emoglobinici.
Le indagini sui campioni di latte delle scrofe dei gruppi C e D, alimentate con la dieta contenente 500 ppb di OTA con o senza supplementazione vitaminica, hanno mostrato rispettivamente livelli di residui di OTA dellʼordine medio di 5,2 e 5,6 ppb, senza particolari variazioni individuali.
Le indagini macroscopiche effettuate sulle scrofe trattate e su quelle controllo non hanno evidenziato lesioni degne di nota a carico degli organi e tessuti esaminati. Sul piano istologico, invece, nelle scrofe intossicate con il più alto dosaggio di OTA (500 ppb con e senza supplementazione vitaminica) si sono osservati nel rene fenomeni di infi ltrazione interstiziale (Fig.1), associati a processi distrofi ci focali, principalmente a carico degli epiteli dei tubuli prossimali con quadri di rigonfi amento citoplasmatico e di microvacuolizzazione (Fig. 2).
Al contrario, nei suinetti esaminati appartenenti ai quattro gruppi sperimentali, controllo ed indirettamente intossicati, non si sono evidenziate lesioni degne di nota sia dal punto di vista macroscopico che microscopico.
Discussione e conclusioni
Sulla base delle risultanze conseguite, nelle condizioni di tossicosi in cui abbiamo operato, in scrofe direttamente intossicate con diversi dosaggi di OTA, con o senza supplementazione di vitamina A e vitamina E nella dieta, e nei loro suinetti indirettamente esposti, non abbiamo riscontrato processi morbosi clinicamente appariscenti, rivelatori di una più o meno marcata condizione di tossicosi.
Il dosaggio di OTA utilizzato per intossicare i soggetti appartenenti al gruppo B (160 ppb) si è dimostrato non suffi ciente a creare uno stato di tossicosi. Va segnalato, tuttavia che mentre Tapia M.O. e Seawright A.A. (1984) considerano un dosaggio pari a 200 ppb nella dieta non in grado di indurre tossicosi nel suino, Krogh P. (1992) ritiene che lo stesso dosaggio, protratto per tre mesi nella dieta di lattonzoli, comporti alterazioni distrofi che nella funzionalità renale con lesioni microscopicamente evidenziabili nellʼassetto nefrotubulare. Analoghe alterazioni sono state da noi riscontrate unicamente nelle scrofe intossicate con il dosaggio più elevato di OTA (500 ppb con o senza supplementazione vitaminica), ma non nella rispettiva prole, che ha ricevuto durante lʼintera fase di allattamento, quote subminimali di OTA con lʼassunzione del latte.
Stoev S.D. et al. (2002) ritengono che le nefropatie osservate in molti casi

80
Ann. Fac. Medic. Vet. di Parma (Vol. XXV, 2005) - pag. 73 - pag. 94
di ocratossicosi suina, possano essere la risultante di unʼesposizione combinata con altre micotossine. Va ricordato, inoltre, che la maggior parte dei ricercatori che si sono occupati di ocratossicosi suina, hanno operato direttamente su suinetti e non su soggetti adulti e, come riportano OʼBrien E. e Dietrich D.R. (2005), lʼetà sembra infl uire sulla comparsa della condizione tossica, quantomeno più facilmente acquisibile nei giovani (uomo, ratto) e meno negli adulti.
Le determinazioni emocitometriche, ematochimiche ed immunofenotipiche prese in considerazione, hanno portato ad una pressochè sovrapponibilità quanti-qualitativa di riscontri tra tutti i gruppi di scrofe intossicate rispetto ai controlli; tuttavia nei gruppi C e D si sono osservate tendenze allʼincremento per alcuni parametri ematochimici (creatinina, albumina e metaemoglobina) associate ad un debole decremento eritrocitario di emoglobina e di alcune sottopopolazioni linfocitarie T, B e monocitarie, tale da far presupporre una risposta immunitaria solo parzialmente compromessa. Sul piano istopatologico, non si sono evidenziate alterazioni morfostrutturali nelle scrofe del gruppo B (160 ppb di OTA), mentre si sono osservati focali quadri distrofi ci nefrotubulari sovrapponibili nei due gruppi di scrofe che hanno ricevuto il maggior dosaggio di tossico (500 ppb con o senza supplementazione vitaminica).
In altre nostre ricerche (Cabassi E. et al., 2002; Cabassi E. et al., 2003), atte a valutare lʼazione protettiva ed eventualmente detossifi cante di una supplementazione quotidiana di vitamina A e vitamina E in scrofe intossicate con afl atossine in gravidanza e durante la lattazione, si erano osservati riduzione dei processi lesivi a carico di fegato e reni, più contenute oscillazioni nei valori dei parametri ematochimici saggiati, unitamente ad un comportamento pressoché normale della risposta difensiva cellulo-mediata. Per contro i suinetti nati dalle suddette scrofe non avevano ricevuto alcun benefi cio dallo stato di supplementazione vitaminica materna, presentando alterazioni morfostrutturali a carico dei principali parenchimi, associate a decrementi nella popolazione linfocitaria, evocando quindi potenziali rallentamenti o limitazioni nella reazione difensiva.
Per quanto riguarda le indagini effettuate sui campioni di latte, queste hanno mostrato, nelle scrofe trattate con il dosaggio massimo di OTA, con o senza lʼapporto di vitamine A ed E, una modesta quota residuale di tossina, ed i suinetti, indirettamente intossicati durante la gravidanza e direttamente con il latte assunto, non hanno palesato modifi cazioni morfostrutturali appariscenti, nè a carico della componente emocitometrica, ematochimica, né a carico della risposta immunitaria. Questo risultato va unicamente ricondotto al basso quantitativo ed al limitato periodo di assunzione di residuo tossico quotidianamente assunto con il latte.
Sulla base della nostra esperienza in corso di ocratossicosi cronica, riteniamo quindi che:
a) la somministrazione di un substrato colturale di A.ochraceus con 160 ppb di OTA nella dieta di scrofe durante la gravidanza e lʼallattamento, non determini modifi cazioni nellʼassetto morfostrutturale del rene, né dei principali altri organi o tessuti presi in considerazione e neppure evochi disfunzioni a livello ematoclinico ed immunodifensivo, rispetto alle scrofe non intossicate;

81
Ann. Fac. Medic. Vet. di Parma (Vol. XXV, 2005) - pag. 73 - pag. 94
b) anche la prole indirettamente esposta al livello di intossicazione di cui sopra, durante la gravidanza e lʼallattamento, comparativamente ai soggetti di controllo, non risenta dellʼazione del tossico, non rilevando alterazioni nelle componenti morfofunzionali e nella risposta immunitaria;
c) la somministrazione nella dieta di 500 ppb di OTA, per circa 100 giorni, in scrofe in fase di gestazione e lattazione, con o senza supplementazione di vitamina A e vitamina E, quali fattori protettivi-detossifi canti, confermi lʼinsorgenza di lesioni microscopiche tubulonefrosiche focali, quale conseguenza dellʼazione della micotossina, mentre statisticamente non sembrano emergere altri elementi di rilievo nei valori ematoclinici ed immunofenotipici saggiati, tra scrofe trattate e controllo;
d) i suinetti, nati dalle suddette scrofe ed indirettamente esposti a 500 ppb di OTA, non risentano del livello di micotossina quotidianamente ricevuta durante la vita fetale (Hollinger K. & Ekperigin H.E., 1999) ed ancor più della quota assunta durante il periodo di allattamento, non essendo state accertate turbe dello stato di salute, né particolari modifi cazioni per quanto riguarda lʼaspetto morfofunzionale e della risposta immunitaria cellulo-mediata ed umorale;
e) la supplementazione vitaminica nella razione quotidiana, contaminata da 500 ppb di OTA, ai livelli da noi utlizzati (vitamina A 11.000 UI più vitamina E 60 UI/Kg mangime); a differenza di quanto osservato in nostre analoghe ricerche sperimentali in corso di afl atossicosi (Cabassi E. et al., 2002; Cabassi E. et al.,2003), non sia suffi ciente a prevenire, né tantomeno ridurre le lesioni da noi riscontrate nelle scrofe alimentate con la medesima dieta contaminata con OTA allo stesso dosaggio, ma senza lʼaggiunta delle succitate vitamine.Le risultanze sopra riportate non consentono ovviamente di trarre illazioni
e conclusioni di decisivo interesse scientifi co e pratico, sul piano dellʼazione preventiva-detossifi cante svolta dalle vitamine A ed E in corso di ocratossicosi cronica, ma prospettano tuttavia suggestive ipotesi di lavoro, fondate su alcune tendenze registrate nel corso della prova, ai livelli più alti di OTA, quali segni di eritrocitopenia, linfo-monocitopenia ed incremento della metaemoglobinemia, che potrebbero rappresentare ipotesi di approfondimento per ulteriori indagini.
Bibliografi a
1. Alvarez L., Gil A.G., Ezpeleta O., Garcia-Jalon, Lopez de Cerain: Immunotoxic effects of ochratoxin A in wistar rats after oral administration – Food and Chemical Toxicology 42, 825, 2004.
2. Baldi A., Losio M.N., Cheli F., Rebucci R., Sangalli L., Fusi E., Bertasi B., Pavoni E., Carli S., Politis I.: Evaluation of the protective effects of a-tocopherol and retinol against ochratoxin A cytotoxicity - Brit.J. of Nutr. 91, 507, 2004.
3. Boorman G.A., Hong H.L., Dieter M.P., Hates H.T., Pohland A.E., Stack M., Luster M.I.: Myelotoxicity and macrophage alteration in mice exposed to

82
Ann. Fac. Medic. Vet. di Parma (Vol. XXV, 2005) - pag. 73 - pag. 94
ochratoxin A - Toxicol. Appl. Pharmacol. 72, 304, 1984.4. Burns R.P. & Divedi P.: The natural occurence of ochratoxin A and its effects in
poultry. A review - Part II. Pathology and immunology. Worldʼs Poult. Sci. J. 42, 48. 1986.
5. Cabassi E., Borghetti P., Miduri F., De Angelis E., Luppi A., Corradi A.:Afl atoxicosis in pregnant sows: cell-mediated response in their new-born piglets - Proc.20th Meet.ESVP 234, 2002.
6. Cabassi E., Miduri F., Lombardi G., Losio M.N., Fusari A., Corradi A.: Afl atossicosi indotta e risposta immunitaria in scrofe gravide: effetti della supplementazione con vitamina A e vitamina E - Atti SIPAS, Salsomaggiore Terme (PR) 385, 2003.
7. Campbell M.L., May J.D., Huff W.E., Doerr J.A.: Evaluation of immunity of young broiler chickens during simultaneus afl atoxicosis and ochratoxicosis - Poultry Science 62, 2138, 1983.
8. C.A.S.T. (Council for Agricultural Science and Technology): Mycotoxins: Risk in Plant, Animal and human Systems - Task Force Report, Report n° 139, Ames, Iowa, 2003.
9. Chelack W.S., Borsa J., Marquardt R.R., Frohlich A.A.: Role of competitive microbial fl ora in the radiation-induced enhancement of ochratoxin production by Aspergillus alutaceus var alutaceus NRRL-3174 - Appl. Environ. Microbiol., 57, 2492, 1991.
10. Chu F.S.: Studies in ochratoxin - CRC Crit. Rev. Toxicol. 2, 499, 1974.11. Creppy E.E., Stormer F.C., Roschenthaler R., Dirheimer G.: Effects of two
metabolites of ochratoxin A, (4R)-4-hydroxy-ochratoxin A and ochratoxin alfa, on immune responce in mice - Infection and Immunity 39, 1015, 1983.
12. Creppy E.E., Kane A., Giessen-crouse E, Roth A., Roschenthaler R., Dirheimer G.: Effects of ochratoxin a on enzyme activities and macromolecules synthesis in MDCK cells - Arch. Toxicol. Suppl. 9, 310, 1986.
13. Creppy E.E., Baudrimont I., Betbeder M.: Prevention of nephrotoxicity of ochratoxin A, a food contaminant - Toxicology Letters 82/83, 869, 1995.
14. Devegowda G., Aravind B.I.R., Morton M.G.: Saccharomyces cerevisiae and mannanoligosaccharides to counteract afl atoxicosis in broilers - Proc.Aust.Poult.Sci.Symp. 8, 103, 1996.
15. Dirheimer G., Creppy E.E.: Mechanism of action of ochratoxin A - IARC Sci.Publ. 115, 171, 1991.
16. Dortant P.M., Peters-Volleberg G.W.M., Van Loveren H., Marquardt R.R., Speijers G.J.A.: Age-related differences in the toxicity of ochratoxin A in female rats - Food and Chemical Toxicology 39, 55, 2001.
17. Dwivedi P. & Burns R.B.: Phathology of ochratoxin A in young broiler chiks - Res. Vet. Sci. 36, 92, 1984.
18. Dwivedi P. & Burns R.B.: Immunosoppressive effects of ochratoxin A in young turkeys - Avian Pathol. 14, 213, 1985.
19. Elissalde M.H., Ziprin R.L., Huff W.E., Kubena L.F., Harvey R.B.: Effects of ochratoxin A on Salmonella-challenged broiler chicks - Poultry Sci. 73, 1241, 1994.

83
Ann. Fac. Medic. Vet. di Parma (Vol. XXV, 2005) - pag. 73 - pag. 94
20. Galvano F., Piva A., Ritieni A., Galvano G.: Dietary strategies to counteract the effects of micotoxins: a review – J. Food Prot. 1, 120, 2001.
21. Harvey R.B., Elissalde M.H., Kubena L.F., Weaver E.A., Corrier D.E., Clement B.A.: Immunotoxicity of ochratoxin A to growing gilts – Am.J.Vet.Res. 53, 1966, 1992.
22. Hollinger K., Ekperigin H.E.: Micotoxicosis in food producing animals – Vet.Clin.North Am: Food Animal Practice 15, 1, 133, 1999.
23. Huff W.E., Kubena L.F., Harvey R.B.: Progression of ochratoxicosis in broiler chickens - Poultry Sci. 67, 1139, 1988.
24. Hussein S.H., Brasel J.M.: Toxicity, metabolism, and impact of mycotoxins on humans and animals - Toxicology 167, 101, 2001.
25. Krogh P., Axelsen N.H., Elling F., Gyrd-Hansen N., Hald B., Hyldgaard-Jensen J., Larsen A.E., , Madsen A., Mortensen H.P., Moller T., Petersen O.K., Ravnsko V., Rostgaard M., Aalund O.: Experimental porcine nephropathy. Changes of renal function and structure induced by ochratoxin A contaminated feed - Acta Pathol. Microbiol. Scand. Sect. A Suppl. 246, 1, 1974.
26. Krogh p., Gyrd-Hansen N., Hald B., Larsen S., Nielsen J.P., Smith M., Ivanoff C., Meisner H.: Renal enzyme activities in experimental ochratoxin A-induced porcine nephropathy: diagnostic potential of phosphoenolpyruvate carboxykinase and gamma-glutamyl transpeptidase activity - J. Toxicol. Environ. Health 23, 1, 1988.
27. Krogh P.: Role of ochratoxin in disease causation - Food and Chemical Toxicology 30, 3, 213, 1992.
28. Kuiper-Goodmann T & Scott P.M.: Risk assessment of the mycotoxin ochratoxin A - Biomed. Environ. Sci. 2, 179, 1989.
29. Lea T., Stein K., Stormer F.C.: Mechanism of ochratoxin A-induced immunosuppression - Mycopathologia 107, 153, 1989.
30. Luppi A., De Angelis E., Losio M.N., Lombardi G., Miduri F., Cabassi E.: Immunotossicità da afl atossine in scrofe gravide - Atti SIPAS XXVIII, PC, 127, 2002.
31. Luster M.I., Germolec D.R., Burleson G.R., Jameson C.W., Ackermann M.F., Lamm K.R., Hayes H.T.: Selective immunosuppression in mice of natural killer cell activity by ochratoxin A - Cancer Res.47, 2259, 1987.
32. Madhyastha M.S., Marquardt R.R., Frohlich A.A., Abramson D.: Effects of different cereal and oilseed substrates on the growth and production of toxins by Aspergillus alutaceus and Penicillum verrucosum - J. Agric. Food Chem. 38, 1506, 1990.
33. Marquardt R.R..& Frohlich A.A.: A review of recent advances in understanding ochratoxicosis - J.Anim.Sci. 70, 3968, 1992.
34. Meisner H. & Polsinelli L.: Changes of renal mRNA species abundance by ochratoxin A - Biochem. Pharmacol. 35, 661, 1986.
35. Muller G., Kielstein H., Kohler H., Berndt a., Rosner H.: Studies of the infl uence of ochratoxin A on immune and defence reactions in the mouse model - Mycoses 38, 85, 1995.
36. Muller G., Kielstein P., Rosner H., Berndt A., Heller M., Kohler H: Studies of the

84
Ann. Fac. Medic. Vet. di Parma (Vol. XXV, 2005) - pag. 73 - pag. 94
infl uence of ochratoxin A on immune and defence reactions weaners – Mycoses 42, 495, 1999.
37. Muller G., Burkert B., Moller U., Diller R., Rohrmann B., Rosner H., Kohler H.: Ochratoxin A and some of ist derivatives modulate radical formation of porcine blood monocytes and granulocytes - Toxicology 199, 251, 2004.
38. OʼBrien E. & Dietrich D.R.: Ochratoxin A: the continuing enigma - Critical Rev. Toxicol., 35, 33, 2005.
39. Patterson D.S.P., Shreeve B.J., Roberts B.A., Berret S., Brush P.J., Glancy E.M.: Effect on calves of barley naturally contaminated with ochratoxin A and groundnut meal contaminated with low concentrations of afl atoxin B - Res. Vet. Sci. 31, 213, 1981.
40. Piva G. & Pietri A.: Micotossine e allevamento suino – Atti SIPAS, 43, 2002.41. Robens J.F., Richard J.L.: Afl atoxins in animal and human health - Rev.Environ.
Contam.Toxicol. 127, 69, 1992.42. Schaaf G.J., Nijmaijer S.M., Maas R.F.M., Roestenberg P., De Groene E.M.,
Fink-gremmels J.: The role of oxidative stress in the ochratoxin A-mediated toxicity in the proximal tubular cells - Biochim. Biophys. Acta 1588, 149, 2002.
43. Stoev S.D., Paskalev M., MacDonald S., Mantle P.G.: Experimental one year ochratoxin A toxicosis in pigs - Exp. Toxic. Pathol. 53, 481, 2002.
44. Tapia M.O. & Seawright A.A.: Experimental ochratoxicosis A in pigs - Australian Vet. J. 61, 219, 1984.
45. Thuvander A., Breitholtz-Emanuelsson A., Olsen M.: Effects of ochratoxin A on the mouse immune system after subchronic exposure - Food and Chemical Toxicology 33, 1005, 1995.
46. Turconi G., Guarcello M., Livieri C., Comizzoli S., Maccarini L., Castellazzi A.M., Pietri A., Piva G., Roggi C.: Evaluation of xenobiotics in human milk and ingestion by the newborn. An epidemiological survey in Lombardy (Northern Italy) – Eur.J.Nutr. 43, 191, 2004.
47. Xiao H., Marquardt R.R., Frohlich A:A., Phillips G.D., Vitti T.G.: Effect of a hay and a grain diet on the rate of hydrolysis of ochratoxin A in the rumen of sheep - J. Anim. Sci. 69, 3706, 1991a.
48. Xiao H., Marquardt R.R., Frohlich A:A., Phillips G.D., Vitti T.G.: Effect of a hay and a grain diet on the bioavailability of ochratoxin A in the rumen of sheep - J. Anim. Sci. 69, 3715, 1991b.
Summary
The AA aim to study the morphostructural alterations and the modifi cations of T (CD4, CD8, CD3, TCRγδ), B (CD21) lymphocyte and monocyte (CD14) subpopulations in sows fed daily with a diet contaminated (160ppb, 500ppb) with ochratoxin A (OTA), with or without vitamin A and E, during the gestation/lactation period, and in their piglets. Our results demonstrate that vitamin A and E supplementation, under toxicosis conditions (500ppb), do not seem to exhibit a preventive/detoxifying action. In fact, histological alterations and hematic values

85
Ann. Fac. Medic. Vet. di Parma (Vol. XXV, 2005) - pag. 73 - pag. 94
showed a qualitative/quantitative superimposition of results from the intoxicated sows with or without vitamin supplementation (500ppb), when compared to the control animals. No alterations were seen in the piglets.
Riassunto
Gli AA hanno condotto una serie di sperimentazioni, in scrofe gravide ed in lattazione e nei loro suinetti, per valutare le alterazioni morfofunzionali, il comportamento di parametri ematoclinici, della risposta immunitaria (CD4, CD8, CD3, TCRγδ, CD21, CD14), conseguenti allʼassunzione di un mangime contaminato con diversi dosaggi di OTA (160 ppb e 500 ppb) con o senza supplementazione di vitamine A ed E, quali fattori protettivo-detossifi canti. I risultati non sembrano evidenziare azioni preventive/detossifi canti ad opera delle vitamine A ed E utilizzate, poiché le determinazioni rilevate hanno portato ad una pressoché sovrapponibilità quanti-qualitativa di riscontri tra soggetti intossicati (500 ppb) con o senza supplementazione vitaminica, in rapporto ai soggetti controllo. Nulla da segnalare nei suinetti.
Si ringrazia il Dott.Guerino Lombardi dellʼIZSLER di Brescia, unitamente ai Proff. Amedeo Pietri e Paola Battilani della Facoltà di Agraria di Piacenza, per la preziosa collaborazione offerta.
Ricerca eseguita nellʼambito del progetto COFIN N°2003077024 _ 003

86
Ann. Fac. Medic. Vet. di Parma (Vol. XXV, 2005) - pag. 73 - pag. 94
Fig 1. Rene di scrofa intossicata con 500 ppb di OTA.Modesti quadri di infi ltrazione fi bro-connettivale a livello interstiziale (EE 10X).
Fig.2. Rene di scrofa intossicata con 500 ppb di OTA.Quadri di microvacuolizzazione a livello di epitelio tubulare (EE 20X).

87
Ann. Fac. Medic. Vet. di Parma (Vol. XXV, 2005) - pag. 73 - pag. 94
Introduction
Mycotoxins, one of many alimentary pollutants, have acquired a place of primary scientifi c and health importance due to their widespread diffusion and the danger they represent to domestic animals and humans (C.A.S.T. Report n°139, Ames, Iowa, 2003).
Regularly, fodder and feedstuff are infected by various species of fungi, during harvest and stockpiling, which produce metabolic toxins under specifi c humidity and temperature conditions. Also dangerous to animals is the use of by-products from the feedstuff industries, such as threshing residue, cereal liquids and waste bread products, which are easily contaminated by mycotoxins. Mycotoxins are toxic compounds derived from the secondary metabolism of fungi species, such as Aspergillus, Pennicillium and Fusarium, which can enter the human food chain through contaminated cereals, milk, meat and eggs produced by intoxicated animals (Devegowda G. et al., 1996).
Mycotoxins are known to cause carcinomas, genotoxicity, teratogenicity and immunosuppression. The effects in domestic animals are manifested in well defi ned pathological forms, such as Reye s disease in man (caused by afl atoxin B1), equine leukoencephalomalacia, porcine pulmonary edema (caused by fumonisin B1), hyperestrogenism in sows (caused by zearalenon) and Balkan endemic nephropathy (caused by ochratoxin A). The effects may be subacute or chronic, not always clinically recognized, but capable of seriously altering the function of the organism and compromising zooeconomic production (Galvano F. Et al.,2001; Piva G. & Pietri A., 2002).
Domestic animals demonstrate various grades of sensitivity to mycotoxins, depending on the animal species, the intake level, duration of exposure, age, sex, physiological status and eventual synergy between mycotoxins simultaneously present in the feed (OʼBrien E. et al.,2005).
An important role in animal mycotoxicosis is played by ochratoxins, toxic metabolites principally produced by two species of fungi, Penicillium verrucosum and Aspergillus ochraceus, which cause diseases in plants and mouldy feedstuff.
Ochratoxins are derivatives of isocoumarin linked to L-β phenylalanine and are classifi ed as pentaketides. Ochratoxins exist in several forms with varying toxicity based on the dissociation constants of the phenolic hydroxyl group. Ochratoxin A (OA) and C (OC) are the most toxic forms, sharing similar dissociation constants, whereas ochratoxin B (OB) is approximately ten times less toxic than OA. Other forms exist, possessing lesser degrees of toxicity. OA and OB are the only naturally occurring ochratoxins in plants, although identifi cation of OB-contaminated commodities is rare. Another toxin produced by Penicillum is citrinin, which can act synergistically with OA to damage the kidney.
OA is a stable compound, slightly soluble in water, more soluble in dilute aqueous bicarbonate, and most soluble in polar organic solvents (Hollinger K. & Ekperigin H.E., 1999).
The amount of OA produced by any given species is infl uenced by many factors, including temperature, type of substrate and the presence of competitive microfl ora. The temperature range for OA production by A.ochraceus is 12° to 37 °C,

88
Ann. Fac. Medic. Vet. di Parma (Vol. XXV, 2005) - pag. 73 - pag. 94
whereas that for P.verrucosum is 4 to 31°C. These data correspond with observations on OA contamination in stored grain. P.verrucosum is the major OA producer in cereals in cold climates, in contrast OA production in crops in warm climates is primarily by strains of A.ochraceus (Krogh P., 1992).
The substrate on which Penicillium and Aspergillus species are grown strongly infl uences OA production. An in vitro study revealed that oilseeds (peanuts and soybeans) supported a much higher production of OTA and OTB by A.ochraceus than did the grain crops (wheat and corn), whereas the two grains were much better substrates for the production of OA and citrinin by P.verrucosum than the oilseed crops. Furthermore, there did not seem to be a close association between the total amount of fungal mass and the amount of mycotoxin produced (Madhyastha M.S. et al., 1990).
The presence of competing microfl ora on a cereal substrate also affects the production of OTA by A.ochraceus; Chelack W.S. et al. (1991) demonstrated that the production of OTA by A.ochraceus on sterilized barley was much greater than its production of OTA on unsterilized barley and that OTA production by this fungus was greatly suppressed by the reintroduction of non-OA-producing fl ora that had been isolated from the barley.
OTA is rapidly absorbed from the gastrointestinal tract, with the exception of ruminants whose rumenal microfl ora hydrolyze OTA prior to absorbtion into ochratoxin-α, a less toxic metabolite (Patterson D.S.P. et al., 1981; Xiao H. et al., 1991 a,b). OTA, once absorbed into the blood, binds with albumin and is distributed in decreasing tissue concentrations to lung, liver, kidney, heart, fat, intestine, etc. Lowest levels occur in muscle, spleen, and brain. OTA has been demonstrated to cross the placenta and transfer into the fetus in rats, mice and pigs. In addition, OTA has been shown to be transmitted into milk and eggs. Enterohepatic recycling and strong albumin binding are associated with the prolonged half-life of the toxin (Hollinger K. & Ekperigin H.E., 1999).
The primary effects of OTA intoxication seem to be associated with an alteration of: a) the enzymes involved in phenylalanine metabolism, including phenylalanyl transferase and phenylalanine hydroxylase (Dirheimer G. et al., 1991); b) lipid peroxidation with modifi cation of membrane permeability and, consequently, cellular necrosis (Creppy E. et al., 1995); c) mitochondrial function; d) DNA, RNA and protein synthesis in many different organisms (Creppy E. et al., 1986; Meisner H. & Polsinelli L., 1986).
Some authors (Schaaf et al., 2002; Baldi A. et al., 2004) maintain that the cellular damage provoked by OTA is attributed to the production of reactive oxygen species (ROS), as well as its potential capacity to activate cytochrome P450 (enzyme able to metabolize liposoluble compounds), which stimulates OTA-dependent lipid peroxidation and converts non-mutagenic OTA into mutagenic metabolites.
Ochratoxin A is acutely toxic to several species of animals, including chicks, hens, turkeys, rats, sheep, swine, and rainbow trout. The acute oral toxicities of OTA when expressed as LD
50 values (milligrams/kilogram BW) are 1.0 to 6.0 for
pigs, 3.3 for chickens and 0.2 for dogs (Kuiper-Goodman T. & Scott P.M., 1989). No LD
50 values have been reported for ruminants; however, doses as high as 2.0
89
Ann. Fac. Medic. Vet. di Parma (Vol. XXV, 2005) - pag. 73 - pag. 94
mg/kg BW caused reduced BW, clinical depression, and dehydration in calves. These results indicate that in acute toxicity studies with OTA, dogs and pigs are the most sensitive species and rats and mice, and possibly ruminants, are the least sensitive (Marquardt R.R. & Frohlich A.A., 1992).
The main clinical patterns associated with acute ochratoxicosis include initial anorexia, weight loss, emesis, followed by tenesmus, passage of clots of blood-stained mucus from the rectum, elevated rectal temperature, polydipsia, polyuria, dehydration, prostation, and death within 2 weeks after administration of the toxin (Chu F.S., 1974).
In veterinary medicine, the damaging effects of this toxin involve the kidneys, where degeneration can be observed in the microvilli of the proximal convoluted tubules, which are associated, as the intoxication progresses, with interstitial connective tissue fi brosis, leading to sclerosis.
Traits such as kidney weight and the serum concentrations of several proteins and metabolites and the activity of certain enzymes can be used as sensitive and earlier indicators of ochratoxicosis. Among these traits, Huff W.E et al. (1988) concluded that total serum protein and albumin levels are the most sensitive indicators of ochratoxicosis in chickens. Other reseachers have shown that a decrease in renal phosphoenol-pyruvate carboxykinase (PEPCK) activity is a highly sensitive and specifi c indicator of OTA toxicity in pigs (Krogh P. et al., 1988).
The chronic effects of OTA are demonstrated chiefl y in pigs. Krogh P. et al. (1974) reported that pigs fed diets containing 200 to 4000 μg/kg of OTA developed nephropathy after 4 months at all levels of exposure. All the lesions, in this specie, were confi ned to the kidney, and most of the renal effects were associated with damage to the proximal tubules (degeneration of microvilli, interstitial connective tissue fi brosis and sclerosis) (Marquardt R.R. & Frohlich A.A., 1992). Burns R.P. & Dwivedi P. (1986) reported that the target organ of OTA in poultry, as shown in other species, seems to be the kidney, although other systems such as the liver, gastrointestinal tract, lymphoid organs, skeletal system, hematopoietic tissues, and the reproductive organs can be affected.
The domestic animal most sensitive to OTA is the pig, which shows nephropathy and lesions involving other organs, such as the liver, spleen and thymus (Hussein M.S. et al., 2001). Studies with laboratory animals have indicated that OTA causes immunomodulation. The depletion of lymphoid cells after OTA ingestion, particularly in the thymus, bursa of Fabricius, spleen and Peyerʼs patches, has been reported for different species of animals. Depletion of the thymus occurs concurrently with a delayed hypersensitivity response, suggesting a possible suppression of cell-mediated immunity by OTA (Dwivedi P. & Burns R.P.,1984,1985).
With respect to immunotoxicity, it is not always evident from the studies whether the effects observed are truly immunotoxic, or derived from acute toxic effects that exert an indirect infl uence on the immune system (Dortant P.M. et al., 2001).
The immunotoxic potential of OTA has been studied in different experimental models, after a single and repeated administration, by various modes, of a wide range of doses. Therefore, the available data is often contradictory and diffi cult to interpret. OTA exposure: a) affects the plasma levels of immunoglobulins in rats and in broiler

90
Ann. Fac. Medic. Vet. di Parma (Vol. XXV, 2005) - pag. 73 - pag. 94
chicks (Dortant P.M. et al., 2001; Dwivedi P. & Burns R.P.,1984); b) suppresses the antibody response to sheep red blood cells (SRBC) in mice (Creppy E.E. et al., 1983; Thuvander A. et al., 1995); c) does not modify the proliferative response of B cells in rats (Dortant P.M. et al., 2001) or mice (Thuvander A. et al., 1995), while inhibiting it in humans (Lea T. et al., 1989). OTA does not modify the T cell response to mitogenic stimuli in rodents after 1 month, but a decrease is found after 90 days of exposure (Luster M.I. et al., 1987; Dortant P.M. et al., 2001; Thuvander A. et al., 1995). The proliferative response of T lymphocytes is decreased in pigs and broiler chicks (Harvey R.B. et al., 1992; Elissalde M.H. et al., 1994).
Data regarding OTA effects on NK cell activity is contradictory. A decrease of NK activity was observed in a study with mice whereas no effects were found in other studies with rodents (Luster M.I. et al., 1987; Dortant P.M. et al., 2001; Thuvander A. et al., 1995).
T cytotoxic lymphocyte (CTL) activity was not affected in mice, although OTA interferes with macrophage activity in mice and broiler chicks (Campbell M.L. et al., 1983; Boorman G.A. et al., 1984; Luster M.I. et al., 1987; Muller G. et al., 1995). Recently, immunotoxic effects of OTA were investigated by Alvarez L. et al. (2004) in rats intoxicated with 50 to 450 μg/kg BW, for 28 days, and they observed a reduction in cytotoxic T lymphocyte activity and in the bacteriolytic capability of macrophages.
In pigs, more information is needed to confi rm a supposed ethiopathogenic relationship between OTA and immune system alterations. Particularly, in weaning animals that have been administrated OTA in low doses (7-50 μg/kg BW), the effects of immune suppression are characterized by a decrease in leukocyte count, increase in phagocytic apoptosis, increase in ROS production in the blood and changes in the expression of lymphocyte-surface markers (Muller G. et al, 1999; Muller G. et al., 2004).
The nephrotubular fi ndings in directly intoxicated sows prompted this experiment to verify if the protective and detoxifying role of anti-toxic agents (vitamins A and E) prevent or reduce the microscopic renal alterations. We also evaluated the immune response in sows fed daily with a diet contaminated with OTA and supplemented or not with vitamins A and E, during the period of gestation and lactation, and in their indirectly exposed piglets, in comparison to controls.
Methodology
The experimental protocol, approved by the University Ethics Committee, used fi fteen primi gravidae sows, pregnant for at least 40 days and belonging to the same genetic line (Duroc X (LW XL)).
All the sows were raised in the same environment and under the same nutritional conditions. Four sows were assigned as controls (group A) and were fed ad libitum with mycotoxin-free tested feedstuff. The remaining eleven sows were subdivided in 3 sub-groups: one with three sows (group B), and two with four sows each (group C and D). These 3 sub-groups were fed ad libitum with the same feedstuff as the control group, but contaminated with OTA, for about a hundred days (from the

91
Ann. Fac. Medic. Vet. di Parma (Vol. XXV, 2005) - pag. 73 - pag. 94
45th day of gestation until the end of lactation). Sows in group B received a daily bolus containing 160 ppb of OTA (derived from a rice cultured substrate of A.ochraceus), while sows in group C and D received a daily diet contaminated with 500 ppb of OTA (160 ppb derived from a rice cultured substrate of A.ochraceus and 340 ppb of crude ochratoxin, SIGMA). The ration of the sows in group D was supplemented with 60 I.U of vitamin E associated with 11.000 I.U. of vitamin A per kilo of feedstuff. In our previous experiments, during intoxication with afl atoxin B1, these doses of vitamins had shown an effi cient detoxifying action (Cabassi E. et al.,2003).
Blood samples were collected on the 65th and the 95th day of gestation, and also on the 3rd and 21st day after delivery, from all the sows that were clinically controlled daily. In addition, on the 21st day after delivery, milk samples were taken from all sows, to verify OTA passage from feedstuff to the milk. At delivery, four piglets from every sow were randomly chosen, and blood samples were taken on the 3rd and the 21st day of life.
From the blood samples, taken from the sows and piglets, hemocytometric and hematochemical tests (glucose, total lipid, triglycerides, urea, creatinine, methemoglobin, albumin, total bilirubin, calcium, phosphorus, sodium and potassium) were performed, as well as the immunophenotype regarding the most important T lymphocyte (CD4, CD8, CD3, TCRγδ), B lymphocyte (CD21) and monocyte (CD14) subpopulations, by means of fl ow cytometry according to the methods we previously used (Luppi A., et al., 2002). Milk samples were analyzed by HPLC, according to the methods applied by Turconi G. et al. (2004).
Accurate necroscopic examinations were performed on all sows and piglets, sacrifi ced with Tanax® on the 22nd day after delivery, removing portions of liver, kidney, spleen, ileum, meseraic lymph nodes and thymus, which were fi xed in 10% buffered formalin, processed and coloured for histological examination.
Results
During the experiment, no signs of clinical suffering nor abnormal behaviour were observed in the sows nor in their offspring.
Signifi cant statistical variations were not found in the hematological and immunophenotypical values obtained, although individual variations were observed in the values between the control sows (group A) and the intoxicated ones (groups B, C, D). Nevertheless, in the two groups C and D of intoxicated sows (500 ppb of OTA with or without vitamin supplementation), a modest heightening of methemoglobinemia and creatininemia associated with a light reduction in hemoglobin, albuminemia and a contained decrease of T (CD4+, CD8+) and B lymphocyte (CD21) and monocyte (CD14) subpopulations were shown. These parameters are potentially related to an increase of oxidative processes, a decrease in renal function and in the reactive capacity of the immune system.
The hematology results and the immunophenotypic values of T and B lymphocyte and monocyte subpopulations in piglets belonging to the four groups (controls and indirectly intoxicated), did not show signifi cant differences, although

92
Ann. Fac. Medic. Vet. di Parma (Vol. XXV, 2005) - pag. 73 - pag. 94
variations were observed in the individual values, and a light trend in the reduction of hemoglobin and in leukocytic/erithrocytic values.
Milk samples, from sows belonging to groups C and D (500 ppb of OTA with or without vitamin supplementation), revealed the presence OTA residues in similar levels, 5,2 and 5,6 ppb respectively.
The macroscopic investigations, made on the intoxicated and the control sows, did not reveal any lesions in the organs examined. Histology, however, showed focal interstitial processes and dystrophic phenomena located on the epithelium of the proximal renal tubule with cytoplasmatic swelling and microvacuolation, in sows intoxicated with 500 ppb of OTA with or without vitamin supplementation (group C and D) (Figg.1, 2).
On the contrary, in piglets belonging to the four experimental groups, neither macroscopic or microscopic lesions were present.
Discussion and Conclusion
Our results show that the vitamin A and E supplementation, under toxic conditions, does not seem to exert a preventive/detoxifying action, both in sows fed daily with a diet contaminated with different doses of OTA, with or without vitamin supplementation, and in their indirectly exposed piglets. In fact, histological alterations and hematic values showed a qualitative/quantitative superimposition of results between the intoxicated sows with or without vitamin supplementation (500ppb), with reference to the control sows. Sows intoxicated with 160 ppb of OTA (group B) did not show any grade of toxicosis, however, with regard to the dose, not all researchers agree on the OTA levels which produce functional alterations.
While Tapia M.O. & Seawright A.A. (1984) consider a dose equivalent to 200 ppb of OTA in the diet insuffi cient to determine toxicosis in swine, Krogh P. (1992) retains that the same dose, protracted for three months in the piglets diet, brings about dystrophic alterations in renal function, with microscopic lesions in the nephrotubular structures. We have found the same alterations in the two groups (C and D) of sows, intoxicated with 500 ppb of OTA, with or without vitamin supplementation, but not in their respective offspring.
Stoev S.D. et al. (2002) take into consideration that nephropathies, observed in many cases of swine ochratoxicosis, may be the result of combined exposure to other metabolic mycotoxins such as citrinine and penicillic acid. The majority of researchers studying ochratoxicosis, retain that age seems to infl uence the toxic manifestation more readily acquired in young subjects, as shown in similar studies in humans and rats (OʼBrien E. et al., 2005).
Our results seem to partially agree with the literature, since the immunosuppression observed, as a weak decrease of T and B lymphocyte and monocyte subpopulations in the intoxicated sows (group C and D), seems to be only partial.
In our other works (Cabassi E. et al., 2002; Cabassi E. et al., 2003), concerning the evaluation of the protective and detoxifying role of vitamins A and E, in sows

93
Ann. Fac. Medic. Vet. di Parma (Vol. XXV, 2005) - pag. 73 - pag. 94
fed daily with a diet contaminated with afl atoxins and supplemented with these vitamins, during the period of gestation and lactation, we observed reduction in liver and kidney lesions, light modifi cations of hematochemical parameters and a normal defensive immune response. On the contrary, in their indirectly intoxicated piglets this vitamin supplementation did not exert either prophylactic or detoxifying actions, since morphostructural alterations in various organs and a decrease of lymphocyte subpopulations in blood, were found.
Milk samples, from sows belonging to group C and D (500 ppb of OTA with or without vitamin supplementation), revealed the presence OTA residues, but piglets, directly intoxicated by the ingestion of milk, did not manifest striking morphostructural, hematochemical and immunological alterations. This result depends on: 1) the low quantity of toxins in the milk; 2) the limited period of ingestion.
In conclusion, our experience, during chronic ochratoxicosis, demonstrated that:
a) intoxicating sows with 160 ppb of OTA, during the period of gestation and lactation, did not cause any grade of toxicosis, since no morphostructural, hematochemical or immunological alterations, were found;
b) piglets, indirectly intoxicated with the same dose as above, did not manifest any grade of toxicosis, as compared to controls;
c) sows fed daily, for a hundred days, with a diet contaminated with 500 ppb of OTA, with or without vitamin A and E supplementation, during the period of gestation and lactation, demonstrated focal dystrophic nephrotubular processes, but no hematoclinic or immunophenotypic modifi cations, with reference to controls;
d) piglets, indirectly intoxicated with the same dose as above, did not show traces of the daily assumption of OTA during gestation and lactation, since no morphostructural and immunological alterations, were found;
e) vitamin A and E supplementation, under the toxic conditions we studied (OTA, 500ppb; vitamin A, 11.000 I.U./kg feedstuff; vitamin E, 60 I.U./Kg feedstuff), does not seem to exert a preventive, or detoxifying action, since it does not prevent nor reduce the alterations observed in sows fed daily with a contaminated diet of the same dose of OTA, without vitamin addition. Furthermore, histological alterations and hematic values showed a qualitative/quantitative superimposition of results between the intoxicated sows with or without vitamin supplementation (500ppb), with reference to the control ones.Further investigations are needed in order to carefully examine the importance
of the modifi cations of some parameters, such as hemoglobin and leukocyte/erithrocyte reduction and methemoglobinemia and creatininemia heightening, since they could represent fundamental elements in the diagnosis of ochratoxicosis.

94
Ann. Fac. Medic. Vet. di Parma (Vol. XXV, 2005) - pag. 73 - pag. 94

95
Ann. Fac. Medic. Vet. di Parma (Vol. XXV, 2005) - pag. 95 - pag. 100
1 Dipartimento di Salute Animale – Sezione di Clinica Medica Veterinaria2 Dipartimento di Salute Animale – Sezione di Patologia Generale e Anatomia Patologica Veterinaria3 Clinica Veterinaria “Via Emilia”, Sordio (LO).
LONG TERM REMISSION OF A NASAL LYMPHOMA WITH INTRACRANIAL EXTENSION IN A CAT
Bianchi E.1, Bonati L.1, Callegari D.1, Cantoni A.M.2, Di Lecce R.2,Dodi P.L.1, Quintavalla C.1, Zeira O.3
Introduction
Lymphoma of the nasal cavity is a rare neoplasm in the cat, but represents the most common nasal tumour of this species 1. It is usually B-cell in origin and affects primarily older FeLV negative subjects 2. This is generally a localised disease that causes signs mainly restricted to the nasal cavity 3, 4. The aim of this paper is to describe a feline nasal tumour diagnosed as a lymphoma with an intracranial extension. Radiotherapy and chemotherapy are often effective in obtaining excellent control and prolonged survivals in feline nasal lymphoma 5. The cat object of this paper is still alive 21 months after the diagnosis of lymphoma.
Clinical case
A 3 years old female domestic shorthair cat was presented for chronic nasal discharge and sneezing. Signs deteriorated over 3 months leading to bilateral epista-xis, facial swelling and right exophthalmos. Findings on physical examination were weight loss, mild dehydration, stertor and a tissue proliferation around the right se-cond upper premolar (Fig 1). The right eye was exophthalmic, with a strabismus and a pervasive corneal opacity. The affected eye also showed photophobia, blepharospa-sm and epiphora. On ocular examination she had absent menace reaction, and direct and consensual pupillary light refl ex in the right eye. In this eye there was also a cen-tral corneal ulcer, while Schirmer test and eye pressure evaluation were unremarka-ble. The only abnormality in blood CBC and chemistry profi le and urine analysis was a mild neutrophilic leukocytosis. Serologic tests for FIV and FeLV were negative (FIV-IC, FeLV-IC - Agrolabo s.p.a., Scarmagno, TO - Italy ). The diagnostic workup was completed under a light sedation with medetomidine (Domitor®, Pfi zer). Dor-soventral intraoral and lateral radiographs of the skull showed a soft tissue opacity of the right nasal cavity with loss of turbinate detail and signs of bone erosion. Ultraso-nography revealed the presence of abnormal tissue infi ltrating the right retrobulbar space. Nasal swabs were submitted for cytology and bacterial and mycotic cultures. A mixed bacterial fl ora, sensitive to several antibiotics, was isolated.
A sample obtained from the right nasal cavity by transcutaneous needle aspiration was partly used to prepare smears and partly fi xed in formalin 10% and

96
Ann. Fac. Medic. Vet. di Parma (Vol. XXV, 2005) - pag. 95 - pag. 100
included in paraffi n. The smears, stained with May Grunwald-Giemsa, demonstrated the presence of medium and large round cells with round or indented nuclei, evident nucleoli e moderately basophylic cytoplasm; these cells were morphologically comparable to lymphocytic cells (Fig 3a). The immunohistochemical examination of the fi xed specimen demonstrated that these cells were CD79 positive (Fig 3b). CD79 is a B lymphocytes marker. Thoracic radiographs, abdominal ultrasound and a bone marrow aspiration failed to detect systemic involvement. A diagnosis of stage Ia B-cell lymphoma was therefore made.
The owner decided for a treatment with a chemotherapy multiagent protocol since the nearest radiation therapy centre was 400 km distant. The cyclophosphamide, vincristine, prednisone, doxorubicin protocol 6 produced a dramatic improvement of clinical signs and reduction of the head deformity in 3 weeks (Fig 2).
Approximately 5 months after the beginning of chemotherapy the cat began showing anorexia, weakness, ataxia, seizures, left hemiparesis and circling. Echocardiografi c evaluation failed to identify doxorubicin-associated cardiomyopathy. The neurologic examination suggested the presence of a lesion of the right forebrain. A helical CT scan (Toshiba Helical Express) of the neuro and splancnocranium was performed in general anaesthesia without and with contrast enhancement. It showed the frontal sinus on both sides containing pathological material and lysis of the right nasal and frontal bones. Contrast agent slightly enhanced frontal sinuses content. CT scan also demonstrated a left shift of the brain midline and the same slight contrast enhancement at the level of both brain frontal lobes (Fig 4). At the ownerʼs request the chemotherapy treatment was discontinued. The cat was only treated with decreasing doses of glucocorticoids for 3 weeks and had a dramatic improvement of the clinical signs and an almost complete recover from neurologic defi cits. Twenty-one months after the diagnosis of lymphoma and 16 months after the onset of neurologic signs the cat is still asymptomatic except for a slight left forearm paresis without being subject to any further therapy. Moreover, during this remission period the cat has experienced a normal pregnancy and an uneventful delivery (Fig 5).
Discussion and conclusions
Only very locally aggressive nasal tumours like adenocarcinomas and olfactory neuroblastomas are usually associated with brain invasion 1, 7. Feline nasal lymphoma generally causes signs mainly restricted to the nasal cavity and doesnʼt extend to surrounding structures like cranial and oral cavity 4. To the authors knowledge, this may be the fi rst report of a feline nasal lymphoma with such a locally aggressive behaviour. Also unusual is the age of the patient since the reported median age for this disease in cats is over 8 years 2, 8. In a recent paper on 18 cases of feline nasal lymphoma the youngest subject of the group was 7 years old 4.
The progression of the tumour in the CNS despite chemotherapy, that seemed otherwise effective against this tumour, could be explained by the incapability of the agents used, apart from prednisone that was suspended on day 28, of passing the blood-brain barrier. As the owner declined further advanced diagnostic imaging of

97
Ann. Fac. Medic. Vet. di Parma (Vol. XXV, 2005) - pag. 95 - pag. 100
the brain the explanation of the long term remission of neurologic signs without drugs is open to different speculative interpretations. The CNS signs were probably caused mainly by nervous tissue edema and intra-cranial pressure increase that were well controlled with glucocorticoids; these also delay the growth of the lymphoma 7. The long symptom-free period may suggest a slow growth of the tumour mainly in the frontal lobes of the brain, as tumours with this location and rate of growth are often associated with prolonged periods without or with only mild neurologic signs 7, 9. However the long survival of this subject is in agreement with the fi ndings reported in literature on nasal lymphoma in FeLV negative cats treated with radio or chemotherapy 2.
References
1) Mukaratirwa S et al.: Feline nasal and paranasal sinus tumours: clinicopathological study, histomorphological description and diagnostic immunohistochemistry of 123 cases. JFMS 3: 235-245, 2001.
2) Vail D. M., MacEwen E.G.: Feline Lymphoma and Leukemias. In: Withrow S.J., MacEwen E.G. eds. Small Animal Clinical Oncology-3rd edition. WB Saunders, Philadelphia, 2001.
3) Ettinger S.N.: Principles of treatment for feline lymphoma. Clin Tech Small Anim Pract 18: 98-102, 2003.
4) Day M.J. et al.: An immunohistochemical investigation of 18 cases of feline nasal lymphoma. J Comp Path 130: 152-161, 2004.
5) Lana S.E., Withrow S.J.: Nasal tumors. In: Withrow S.J., MacEwen E.G. eds. Small Animal Clinical Oncology-3rd edition. WB Saunders, Philadelphia, 2001.
6) Crystal M.A.: Chemioterapia per il linfoma. In: Norsworthy G.D. et al. Ads. Medicina felina, manuale pratico. Masson, Milano, 1999.
7) LeCouteur R.A.: Tumors of the nervous system. In: Withrow S.J., MacEwen E.G. eds. Small Animal Clinical Oncology-3rd edition. WB Saunders, Philadelphia, 2001.
8) Henderson SM et al.: Investigation of nasal disease in the cat – a retrospective study of 77 cases. JFMS 6: 245-257, 2004.
9) Oliver J.E. et al.: Handbook of veterinary neurology. WB Saunders, Philadelphia, 1997.
Abstract
This paper describes a clinical case of a cat affected by a nasal lymphoma with an intracranial extension. After a brief description of the symptoms, the results of the clinical examination and of the diagnostic procedures are illustrated. The therapy instituted and the follow up of the patient are then reported. Considerations concerning the peculiarities of the clinical case together with a brief review of the scientifi c literature on this topic are also discussed.

98
Ann. Fac. Medic. Vet. di Parma (Vol. XXV, 2005) - pag. 95 - pag. 100
Riassunto
Questo articolo descrive un caso clinico di un gatto affetto da un linfoma nasale con estensione intracranica. Dopo un breve descrizione dei sintomi vengono illustrati i risultati della visita clinica e delle procedure diagnostiche eseguite. Quindi viene riportato dagli autori lʼapproccio terapeutico utilizzato e informazioni riguardanti il follow up del paziente. Completa lʼarticolo la discussione delle caratteristiche peculiari del caso clinico e della letteratura scientifi ca disponibile sullʼargomento.
Key wordsCat, nasal lymphoma, chemotherapy.
Parole chiaveGatto, linfoma nasale, chemioterapia.
Acknowledges: the authors wish to thank Mr Giorgio Ritrovato for referring the case and for the contributions concerning follow up.
Figure 1: facial swelling, right exophthalmos and tissue proliferation around the right second upper premolar in the cat at time of fi rst presentation.

99
Ann. Fac. Medic. Vet. di Parma (Vol. XXV, 2005) - pag. 95 - pag. 100
Figure 2: images of the cat 3 weeks after the beginning of chemotherapy.
Figure 3a: cytology: in an erythrocytic context presence of medium and large round-cell with round or indented nuclei, evident nucleoli e moderately basophylic cyto-plasm (lymphocytic cells). (May Grunwald-Giemsa, original magnifi cation 20X).
Figure 3b: histology: CD79 positivity of the lymphocytic cells (original magnifi ca-tion 40X).

100
Ann. Fac. Medic. Vet. di Parma (Vol. XXV, 2005) - pag. 95 - pag. 100
Figure 5: the cat and her kittens a few days after birth.
Figure 4: axial, sagittal and coronal CT sections of the frontal and orbital region with contrast enhancement showing the tumour.

101
Ann. Fac. Medic. Vet. di Parma (Vol. XXV, 2005) - pag. 101 - pag. 110
QUICK HPLC METHOD TO DETERMINE VITAMIN E CONCENTRATION IN COWʼS MILK
Ubaldi A., Delbono G., Fusari A., Serventi P.Sezione di Diagnostica e Tossicologia Sperimentale - Dipartimento di Salute Animale
INTRODUCTION
Vitamin E active compounds are part of the antioxidants system inactivating free radicals and take a part in the oxidative stress1. Chemistry of vitamin E is relatively complex and term includes two big groups of molecules: tocopherols and tocotrienols, each of them including thirty two stereoisomers2. Tocopherols family includes four substances: α-tocopherol (Vitamin E in the proper sense of the word), β-tocopherol, γ-tocopherol e δ-tocopherol. Tocotrienols family (very similar to tocopherols) includes four different substances, too.
Chemical structure in tocopherols is represented by a saturated carbonic chain bind to a cyclocromarole with methyl groups. In tocotrienols, the carbonic chains is unsaturated. α-tocopherol has three methyl groups and is the most active form. β-tocopherol ed il γ-tocopherol have two methyl groups. δ-tocopherol has only one methyl group and is the most potent, but the less effective.
Vitamin E is commercially distributed as α-tocopherol, but also in esterifi ed form (acetate-tocopheroil) that is more stable and less oxidable.
Vitamin E is synthesized in plants, algae, mould, but not in animals2. Vegetable products are the major source of Vitamin E. The greatest quantities of vitamin E are found in cereals, (in which tocotrienols prevail, except for mais in which β and γ tocopherols are prevalent, such as in soy) and vegetable oils2, much more rich in α and γ forms, particularly mais oil2. Leguminosae present a good content in Vitamin E, especially in mature leafs. In animals tissues and organs, α-tocopherol is essentially represented, but in low concentration.
In milk, Vitamin E is bind to lipids and it is represented principally by α-tocopherol. Fat content and composition of milk depend on several factors: feed (traditional or TMR), seasons, stage of lactation, quantity and quality of feed, as well as thermic treatments sustained by milk 3,4.
To determine vitamin E concentration several methods are available, depending on the goal of the analysis and on the matrix. In some cases, it is necessary to quantify α-tocopherol, while in other cases it is necessary to quantify both tocopherols and tocotriens. Anyway, sample has to be pre-treated to break structures into which vitamin E is bind (membranes, lipoproteins, liposomes), to eliminate interferences determinated by proteins and carbohydrates which are soluble in organic phase, and to create a medium in which vitamin E should be soluble and could freely elute. For this purpose, usually, ethanol or methanol are used. In food with a low lipid concentration method provides directly for the extraction with diethyl ether. In more fatty food it is necessary to apply a saponifi cation.

102
Ann. Fac. Medic. Vet. di Parma (Vol. XXV, 2005) - pag. 101 - pag. 110
This treatment permits to separate saponifi able components (glycerol, fatty acid salts) which could interfere with Vitamin E determination: as these compounds are soluble in the aqueous status, they can be removed. Saponifi cation is carried out utilising potassium hydrate associated to antioxidants to avoid oxidation.
After saponifi cation, not saponifi able components, like Vitamin E, are extracted adding an apolar organic solvent (hexane, acetone, diethyl ether) and the solution mixed: fatty acids, glycerol and other undesired substances stay in the alkaline aqueous phase and do not interfere with Vitamin E determination.
Comparison between methods with or without saponifi cation shows that saponifi cation permits to quantify α forms, while δ forms are degraded.
Methods without saponifi cation permit to quantify γ and δ forms, too.
To determine vitamin E different analytical procedure (TLC, GC, HPLC, CEC) are utilised. Because of their easier applicability, HPLC techniques are more frequently used. To identify all fractions normal phase HPLC technique (silica gel HPLC column) with fl uorescence detector is used. Reverse-phase HPLC technique (C18 ODS column) presents good reproducibility, more rapid balancing and column highly stable but it is not able to separate γ and δ forms. Electrochemical detector is highly sensible, but it is applicable only with reverse-phase HPLC technique, fl uorescence detector is sensible, specifi c and is applicable with normal- and reverse-phase techniques, but it does not reveal esterifi ed forms. The ultraviolet detector presents the lowest sensibility5.
Parameters considered to validate method were determined on suggestions of international protocols9,10
Key words: HPLC, method , vitamin E, milk, validation
MATERIALS AND METHODS
PrincipleMilk sample is treated with a methanol/ethanol solution to denature
lipoproteins. Alkaline saponifi cation of the test material eliminates fats and liberates vitamin E from test material as unsaponifi able material that is successively extracted with petroleum ether. The extract is dried, solubilized with methanol and injected in HPLC (C18 column, reversed-phase). The quantitative determination of vitamin E was carried out by UV detector settled at 294 nm
Equipment- Vortex - Thermostatic multiple water-bath (GFL 1041) equipped with round-
bottom fl ask (100ml) fi tted with ground stopper, cooling columns and gas-tube;
- Separating funnels (100 ml);- Volumetric fl asks and (100 ml);

103
Ann. Fac. Medic. Vet. di Parma (Vol. XXV, 2005) - pag. 101 - pag. 110
- Rotary Evaporator (Buchi 461);- Centrifuge (ALC 4235 A)- HPLC Shimadzu LC-10 AD - Detector UV-Vis Shimadzu SPD-6AV- Recorder Shimadzu C-R5A, - Column CS Spherisorb C18, 250 mm ODS 10μ- Hamilton syringe (50 μl. )
Reagents- Extra pure petroleum ether (J.T.Baker)- 0,5% ascorbic acid daily prepared solution (Dissolve 0,5g of pure
crystallized ascorbic acid in 4ml distilled water, mix with 20ml ethanol and dilute with methanol to 100ml).
- 50% potassium hydroxide (1 Kg potassium hydroxide pellets in 1 L distilled water).
- Pure Dl-α tocopherol (Supelco), for calibration purpose- Methyl alcohol (J.T.Baker)- Nitrium or helium gas (oxygen-free)
Standard solutionStock solution (1000 mg/l) was obtained dissolving 100mg of DL-α-
tocopherol in 100ml methanol.Work solutions (0,3ppm, 0,5ppm, 0,75ppm, 1ppm e 2ppm) were obtained
progressively diluting stock solution in methanol
SamplesAfter homogenisation, milk samples were divided in 10g aliquots, conserved
in polyethylene tube and frozen at –20°C until analysis.
Saponifi cationMilk sample, at room temperature, was mixed and 10g were put into a
round-bottom fl ask, 10ml of ascorbic acid solution were added and brought to 80°C in water-bath while purging with helium gas. At boiling point (after about twenty minutes) 2ml of KOH solution were added. After 20 minutes the fl ask was removed from water-bath and kept in the dark until cooling.
ExtractionAfter cooling, test material was put into a separating funnel, rinsed two times
with 5ml water and successively with 30ml ether. The funnel was closed and mixed several times. Aqueous phase was recovered in the round-bottom fl ask and ether phase was put into a fl ask. Extraction procedure was repeated 2 times with 30ml ether. Ether phases were combined and transferred in the separating funnel, rinsed 6 times with 50ml water, and recovered in a round-bottom fl ask. Separating funnel was rinsed with 10ml ether recovered in the round-bottom fl ask. Then, the test material was evaporate to dryness in a rotary evaporator under partial vacuum at water-bath

104
Ann. Fac. Medic. Vet. di Parma (Vol. XXV, 2005) - pag. 101 - pag. 110
temperature of 45°C (5 minutes). After cooling, test material was recovered with 5ml methanol, well mixed and transferred in a glass tube, centrifuged at 4000 rpm for 5 minutes. To prepare four samples about four hours were needed.
Conditions of High Performance Liquid ChromatografyColumn: Steinless steel, length 25 cm, diameter 4,6 mmStationary phase: ODSMobile phase: Methyl alcohol Flow rate: 1ml/minInjection volume. 20 μlDetection: UV (Shimadzu SPD-6AV)Wavelenght: 294 nmRetention time: 5 minColumn temperature: ambient
RESULTS AND DISCUSSION
Calibration curve and linearityCalibration curve was obtained analysing fi ve times each, six different
solutions of known concentrations of analyte included between 0.3 and 2.0 ppm,. The curve equation y = bx + m calculated with linear regression method to determine samples concentration was utilised. It is possible to evaluate model effectiveness by R2 value and by spreads between known concentration and concentration calculated on the calibration curve. Results are reported in Table n.1 and Figure n.1
y=2767x-259.98 R2=0.9995
0
500
1000
1500
2000
2500
3000
3500
4000
4500
5000
5500
0 0,1 0,2 0,3 0,4 0,5 0,6 0,7 0,8 0,9 1 1,1 1,2 1,3 1,4 1,5 1,6 1,7 1,8 1,9 2 2,1 2,2
Concentrations (ppm)
ar
ea
Figure n.1 Calibration curve for vitamin E determination in milk sample
The equation of the curve and the R2 value (0.9995) shows the good linearity of the analytical method under examination. Values of coeffi cients of variation are very low, except for the lowest amount (5,3%). Spreads between concentrations

105
Ann. Fac. Medic. Vet. di Parma (Vol. XXV, 2005) - pag. 101 - pag. 110
calculated by regression curve and actual ones reach maximum values about of 5%, to be considered acceptable.
Table n.1: Analytical data obtained from injection of vitamin E standards utilised to plot calibration curve
Vitamin E standard concentrations (ppm)
0,3 0,5 0,75 1 1,5 2
Means of areas 617 1061 1809 2539 3871 5284
RSD% 33,7 4,6 7,9 4,9 2,1 1,8
Obtained concentration (ppm) 0,317 0,478 0,748 1,012 1,493 2,003
spread % +5,3 -4,7 -0,3 +1,1 -0,5 +0,2
Because of vitamin E concentrations in milk rarely exceed 1 mg/kg, maximum standard concentrations of 2 mg/kg was choosen in consideration of the method concentration factor stated as 2.
Repeatability Repeatability is the closeness of agreement between independent results
obtained with the same method on identical test material, under the same conditions (same operator, same apparatus, same laboratory and after short intervals of time).
In our trial repeatability was measured on the basis of fi ve determinations in fi ve aliquots each of a milk sample obtained in a farm producing Parmisan cheese. Results are recorded in Table n.2.
Table n. 2: Intra-analisi repeatability test realized on fi ve aliquots of the same milk sample
Aliquot 1 Aliquot 2 Aliquot 3 Aliquot 4 Aliquot 5Area 1 2073 2181 2699 2535 2389
Area 2 2141 2444 2458 2401 2201
Area 3 2183 2188 2305 2303 2408
Area 4 1968 2408 2405 2345 2490
Area 5 2476 2155 2189 2496 2178
Mean of areas 2168 2275 2411 2416 2333
St.Dev. 190 139 191 98 137
RSD % 8.8 6.1 7.9 4.1 5.9
Concentration (ppm) 0.439 0.458 0.483 0.484 0.469Spread -5.8 -1.7 3.6 3.8 0.6
Intra-analysis repeatability on fi ve determinations of the same sample shows a RSD% from 4.1 to 8.8. As these values are less than 10%, they have to be considered acceptable.

106
Ann. Fac. Medic. Vet. di Parma (Vol. XXV, 2005) - pag. 101 - pag. 110
Data recorded in Table n. 2 were utilised to calculate inter-analysis repeatability and limit of repeatability. To calculate limit of repeatability equation r = 2.8 s
r. {ISO
5725-6, 4.1.4} was employed, to verify that values obtained under repeatability conditions (i.e., same sample, same operator, same apparatus, same laboratory, and short interval of time) may be expected to lie within a specifi c probability (typically 95%)12. Limit of repeatability calculated on the fi rst two extraction on the same test material shows a value 0.0952, as recorded in Table n.3
Table n. 3: calculation of the limit of repeatability (r)
Mean concentration. (mg/kg) 0.439
St dev 0.034
Limit of repeatability (r) = 2.8 x st dev 0.0952
Comparison between the difference of the means of concentrations and the limit of repeatability indicates that the method is able to furnish repeatable results with a probability of 95%. The same considerations can be formulated relating to all the determination recorded in Table n.2
RecoveryRecovery identifi es ratio between quantity of analyte, experimentally
determined in known concentration material, and the expected value. In our trial, in fi ve aliquots of the same milk sample, fi ve sequential additions were made. In Table n.4 means of fi ve determinations for each aliquots are recorded.
Table n. 4: Analytical data obtained from recovery test
Concentrationdetermed in sample
(ppm)
Concentrationadded
to sample (ppm)
Expected concentration
(ppm)
Obtainedconcentration
(ppm)
Recovery (%)
0.466 0.250 0.716 0.668 93.3
0.466 0.500 0.966 1.008 104.3
0.466 1.000 1.466 1.547 105.5
0.466 2.500 2.966 3.038 102.4
0.466 5.000 5.466 5.499 100.6
Mean of the determinations realised for the repeatability test (Table n.3) was considered as sample concentration. Expected value was calculated spiking milk sample with known amounts of pure Vitamin E. Recovery percentages are satisfactory:

107
Ann. Fac. Medic. Vet. di Parma (Vol. XXV, 2005) - pag. 101 - pag. 110
mean recovery value is 101.2%. On the basis of these data we can also assert that calibration curve of this method is applicable in milk containing concentrations of Vitamin E over 5ppm. Data obtained by recovery test are recorded in Table n.4
Limit of quantitationLimit of quantitation is the lowest amount or concentration of analyte in a
sample which can be quantitatively determined with an acceptable level of precision and accuracy11. Three milk samples with decreasing amounts of the analyte were injected fi ve times each. Data utilised to state the limit of quantitation are recorded in Table n.5
Table n. 5: Analytical data obtained to determine limit of quantifi cation (LOQ)
Extractions Means of concentrations
(ppm)
Means of concentrations
xDilution(ppm)
Recovery(%)
1 2 3 4
Means of areas
1137 1026 863 1079
Diluizione 1:2 CV % 10.8 11.8 16.4 12.1
Concentration
(ppm)0.252 0.232 0.203 0.242 0.232 0.465 99.7
Means of areas
632 720 704 566
Diluizione 1:3 CV % 9.8 8.8 13.9 8.1
Concentration
(ppm)0.161 0.177 0.174 0.149 0.165 0.496 106.4
Means of areas
498 515 503 535
Diluizione 1:4 CV % 20.4 11.3 24.3 15.5
Concentration
(ppm)0.137 0.140 0.138 0.144 0.140 0.559 119.8
Relating to the dilutions 1:2 and 1:3, RSD% values are about 10%, that is acceptable. In correspondence of 1:4 dilution RSD% values worsen in a sensible manner together with percentage of recovery, showing a trend of the method to overvalue in correspondence of low concentrations. On this basis, limit of quantitation of 0.165 ppm was stated. RSD% values indicates loss of precision and accuracy of the method when working with concentrations lower than 0.165 ppm.
SensitivitySensitivity is the measure of the magnitude of the response caused by a
certain amount of analyte11. To evaluate the capability of the method to discriminate

108
Ann. Fac. Medic. Vet. di Parma (Vol. XXV, 2005) - pag. 101 - pag. 110
small differences of analyta, quintuple determinations of three different standard solutions at different concentrations was realised. Data are summarized in Table n.6.
Table n. 6: Data obtained performing test of sensitivity in standard Vitamin E solu-tions
Concentration of Vitamin E standard solution (ppm)
1 0.95 0.9Area 1 2556 2253 2206
Area 2 2342 2426 2125
Area 3 2423 2644 2401
Area 4 2714 2185 2193
Area 5 2413 2461 2258
Media delle aree 2490 2394 2237dev.st 147 181 103
CV% 5.9 7.6 4.6
Concentrazione (ppm) 0.994 0.959 0.902
In Table n.7, results regarding signifi cance obtained by t-student test applied to fi ve determinations of three standard solutions injected are reported.
Table n. 7: t-student test (p) of sensitivity test relating to test of sensitivity realised in standard vitamin E solutions on Δ concentrations of 0.100 ppm e 0.05 ppm.
Δ concentrazioni p1.00- 0.90 0.0141.00- 0.95 0.3860.90-0.95 0.131
Following the evaluation of the data in Table n.7, it is possible to state that this method is able to discriminate differences of concentrations of magnitude 0.100mg/kg, but not of magnitude 0.05 mg/kg
CONCLUSIONS
To monitor vitamin E concentration in milk and dairy products during dietetic and clinical trial, method to be employed must be quick, accurate and repeatable. Traditional methods utilise different toxic reagents used in quite high quantities6. Our goal was to set-up a method, based on previous stated HPLC techniques, in different matrix, utilising low reagents quantities, less expansive, less toxic for technicians and environment7,8.Experimental trial realised to determine α-tocopherol in milk

109
Ann. Fac. Medic. Vet. di Parma (Vol. XXV, 2005) - pag. 101 - pag. 110
samples furnished positive responses regarding to the intrinsic characteristics of the analytical method under examination. Characteristics of linearity, repeatability, accuracy, recover, limit of quantitation and sensitivity were good enough to draw the conclusion that the analytical method is applicable to the milk matrix being sure to obtain good analytical results.
Further of this trial, we are point out a new analytical method to test the vitamin E contents in solid matrix as cheese and milk products.
REFERENCES
1) LINDSAY D.G., ASTLEY S.B.: European research on the functional effects of dietary antioxidants: EUROFEDA. Mol. Aspects med., 23, 1, 2002
2) CUVELIER C., DOPTREPPE O., ISTASSE L. : Chimie, sources alimentaires et dosage de la vitamina E. Ann. Mèd. Vet., 147, 315, 2003
3) BRUSCHI L., MANZI P., PANFILI G., QUATTRUCCI E.: Aspetti metodologici della determinazione chimica di nuovi prodotti lattiero-caseari: vitamine liposolubili. Il latte, 1156, 1992
4) SYVAOJA E.L., PIRONEN V., VARO P., KOIVISTOINEN P., SALMINEN K.: Tocopherols and tocotrienols in Finnish foods: Dairy products and eggs. Milchwissenschaft, 40 (8), 467, 1985
5) ABIDI S.L.: Chromatographic analysis of tocol-derived lipid antioxidants. J. Chromatogr. A, 881, 197, 2000
6) KELLER H.E.: Analytical Methods fot Vitamins and Carotenoids in Feed. Hoffman-La Roche Inc., Basel, Switzerland 1988, p.120
7) RENZI M., RIGHI F., QUARANTELLI C., QUARANTELLI A., BONOMI A.: Simplifi ed HPLC-UV method for determination of α-tocopherol in plasma. Ital. J .Sci., 4, 191, 2005
8) UBALDI A., SERVENTI P., DELBONO G., RENZI M.: Valutazione di un metodo rapido in HPLC per la determinazione di a-tocopferolo nel plasma di sangue. Atti VII Congresso Nazionale SIDILV, 7, 175, 2005
9) GREEN J.M. : A Pratical Guide to Analytical Method Validation. Analitical Chemstry, 68 305A, 1996
10) US FDA General Principles of Validation, Rockville, MD, Centre for Drug Evaluation and Reasearch (CDER), May 1997.
11) Harmonised Guidelines for the in-house validation of methods of analysis (Technical report) – IUPAC\In.House\Budapest
12) ISO Standard 78-2: Chemistry – Layouts for standards - Part 2: Methods of Chemical Analysis (Second edition, 1999)

110
Ann. Fac. Medic. Vet. di Parma (Vol. XXV, 2005) - pag. 101 - pag. 110
SUMMARY
A quick HPLC method to determine vitamin E levels in milk samples is described. The goal of the trial is to reduce time need to saponify sample and to extract vitamin E to be dosed and reduce quantity of reagents and time to preserve technician health and environment from pollution. Major validation parameters to test linearity, repeatability, accuracy, recover, limit of quantitation and sensitivity were assayed. On the basis of the results obtained, the method described is to be considered precise and repeatable when applied on milky matrix.
RIASSUNTO
Gli Autori descrivono un nuovo metodo rapido in HPLC per la determinazione della Vitamina E nel latte vaccino. Il nuovo metodo è stato messo a punto e validato allo scopo di ridurre i tempi dʼanalisi nelle fasi preparatorie quali la saponifi cazione del campione, lʼestrazione della vitamina E e di ridurre le quantità dei reagenti impiegati. Per la validazione del metodo sono stati considerati i principali parametri della validazione quali linearità, ripetibilità, accuratezza, recupero, limite di quantifi cazione e sensibilità, in base alle indicazione delle principali linee guida. Dalla disamina dei risultati ottenuti gli Autori hanno verifi cato la validità del metodo quando applicato su matrici lattee.

111
Ann. Fac. Medic. Vet. di Parma (Vol. XXV, 2005) - pag. 111 - pag. 130
1 Research funded by FIL project – University of Parma.2 Dipartimento di Produzioni Animali, Biotecnologie Veterinarie, Qualità e Sicurezza degli Alimenti; Sezione di Scienze Zootecniche e Qualità delle Produzioni Animali. Corresponding author: [email protected]
EFFECT OF HOUSING TYPE ON VEAL CALF PERFORMANCE1
Sabbioni A., Beretti V., Bertocchi A., Zanon A., Soffi antini C.S., Superchi P.2
Key words: veal calf; individual stall; multiple pen; housing type; meatParole chiave: vitello a carne bianca; gabbia singola; box multiplo; tipo di
stabulazione; carne
INTRODUCTION
Veal calf production in Italy is actually a very important sector of cattle production; compared to other countries in EU, our Country is today one of the fi rst fi ve markets, after Germany, France, Holland and Poland (EUROSTAT, 2005).
Veal calf facilities are distributed above all in the Northern area (Lombardia, Veneto and Piemonte). During the Sixties this breeding was generally improved by the presence of two kind of surplus (milk powder and calves from milk breeds) (Parigi Bini and Someda de Marco, 1989); the subsequent introduction of milk quotas strongly affected the prize of milk replacers and reduced the number of calves, with a negative impact on market value.
Nevertheless veal calf represents about 20% of total meat intake in Italy (ISTAT, 2005). This is probably due to its intrinsic qualities, with reference to chemical composition (high protein and low fat content), tenderness, digestibility and pale colour (Manfredini, 1988), in line with the nutritional policy of the last years, requiring a light and dietetic feeding.
An aspect that in last years penalized the breeding of the veal calf, in the perception of the public opinion, regards the welfare of animals, with reference to housing conditions and feed management. The constriction in individual stalls of small dimensions, and the not physiological feeding with only milk replacers until an age, at which the other calves are already weaned, created a strong movement of contrary opinion to such breeding (Brambell Committee, 1965; EU SCIENTIFIC VETERINARY COMMITTEE, 1995; S.C.A.H.A.W., 2001), that determined the emanation of specifi c directives (91/629/EEC and 97/2/EC, containing the minimal norms for the protection of calves) oriented to improve the breeding conditions. Such directives have been then accepted at national level (D.L. n. 533 of the 30/12/1992 and D.L. n. 331 of the 1/9/1998), introducing radical changes in this productive fi eld.
The present paper reports the results of a fi eld trial, carried out with the

112
Ann. Fac. Medic. Vet. di Parma (Vol. XXV, 2005) - pag. 111 - pag. 130
objective to estimate the effects of housing type (individual vs multiple box) on the growth characteristics and meat quality of veal calf.
MATERIALS AND METHODS
The trial has been lead on 48 Italian Holstein male veal calves, reared in one herd in the province of Brescia, during its adaptation period to EU directives, in which both typologies of stalls (individual and multiple) were present. So it has been possible to use the same feeding schedule and to have the same environmental conditions, in order to focus the interest on housing conditions.
At the arrival, 24 calves were raised in individual stalls of 1.65 x 0.68 m (space allowance: 1.12 m2/head) with grilled pavement during the complete period, while the other 24 were introduced in individual stalls of 1.5 x 0.75 m (space allowance: 1.13 m2/head) in which they remained until d 72. At that time, by removing the divisors between adjacent stalls, multiple pens containing six calves were obtained, of 2.4 x 4.6 m (space allowance: 1.84 m2/head).
With reference to the feeding plan, the animals at the day of arrival were submitted to oral rehydration by means of a commerce product. The feeding plan was then common to both groups, and it was characterized by a 1st period milk replacer, from d 1 to 72, and a 2nd period milk replacer, from d 73 until slaughtering (d 168), at daily doses from g 280 to g 3450, melted in water at increasing concentrations from 4.5% to 19%. From d 31 until slaughtering a complementary feed, at a dose from 50 g/head/day to 300 g/head/day, increasing 50 g every 10 d, was also administered. Two meals/day were supplied, except Sunday (13 meals/week). Daily total dry matter intake is represented in fi gure 1. The chemical composition of milk replacers (1st and 2nd period) and of the complementary feed is reported in tables 1, 2, 3.
The animals were individually weighted at the beginning, at d 72 (change of the type of housing and feeding) and at the end of the trial (d 168). Dry matter intake per group was recorded and then feed conversion ratios were calculated.
At the day of weighting, blood samples were collected from all calves by needle puncture in the jugular vein at the same hour. At their arrival in laboratory the samples have been immediately submitted to haemochromocytometric analysis (red blood cells, RBC; haemoglobin, Hb; packed cell volume, PCV); also, chemical-clinical analysis (total protein; Fe; creatin kinase, CK; lactate dehydrogenase, LDH; cortisol) were performed; to this aim the samples have been centrifuged at 3000 x g for 15 min and therefore stored at -20°C until analysis (Collin, 2000; Verriel and Bedouet, 2000); mean corpuscular volume (MCV), mean corpuscolar Hb (MCH) and mean corpuscolar Hb concentration (MCHC) were calculated from PCV, Hb and RBC values (Reece and Hotchkiss, 1987).
At the end of the trial, the animals have been slaughtered, after 12 hours fasting. At the slaughter house, due to technical causes, it was not possible to weigh the carcasses and, consequently, to calculate the slaughtering yields. Carcass conformation (score from 1 to 15) and meat colour on l.dorsi muscle were valued. In particular, on the fresh cut of l.dorsi muscle, the colour was determined by means

113
Ann. Fac. Medic. Vet. di Parma (Vol. XXV, 2005) - pag. 111 - pag. 130
of a Minolta Chromameter Refl ectance II CR100/08, using the channel 1, containing a calibration with a Standard Gardner pink tile no.CG6625 (Y=45.97; x=0.3658; y=0.3250). On each calf 4 measures were done, in different points of the loin area, and results have been expressed as L* a* b* (Novelli et al., 1991). The values of hue and chrome were calculated, respectively, as arctg(b*/a*) and √(a*2+b*2).
Data have been elaborated by means of analysis of variance (SAS, 2002-2003), using a general linear model with a fi xed factor (housing type: individual vs multiple pen); when necessary a covariance model was used, in which the covariate was represented by the initial value of the dependent variable.
RESULTS AND DISCUSSION
During the trial, 7 calves (14.6%) died, of which 3 (6.3%) in the individual box group and 4 (8.3%) in the multiple box, due to causes independent by the experimental factor.
The table 4 reports the main infra vitam parameters of calves during the trial. The fi nal live weight was signifi cantly higher (P<0.05) in multiple pens housed calves than in individual stalls group (+10.3%); also daily weight gain from d 72 to d 168 was improved in the fi rst group (+27.5%; P<0.05). The feed conversion ratio was better in multiple pens group (P<0.05), with reference both to milk replacer and to total dry matter (milk replacer + complementary feed). The results are in agreement with those reported by Warnick et al. (1977), Jongebreur and Smits (1982), Richard et al. (1988) and Cozzi et al. (2000).
Despite the higher space allowance, group housed calves have shown the better performance, probably due to a lower stress level and a consequent lower energy consumption, caused by lower excitement (Dellmeier et al., 1985).
With the aim to verify such hypothesis, blood cortisol content was analyzed, because of its relevance in monitoring the stress status of animals (Biagi et al., 2002).
Group housed veal calves have shown lower cortisol levels than individual housed, but the difference was not signifi cant (P>0.05) (table 5), probably due to the high variability showed by the parameter (high RSE value). Trunkfi eld et al. (1991) have shown a higher corticosurrenal reactivity in individually housed calves, than in group housed, when calves were submitted to acute stressors; however, other researches excluded a correlation between housing type and cortisol levels (Rushen, 1991). Wilson et al. (1999) did not shown differences in cortisol content of veal calves housed in individual or multiple pens. Stull and McMartin (1992) reported higher cortisol content in group reared calves and suggested that an important role could be played by the stress induced by manipulation during blood drawing.
As total proteins were higher in the individual housed group (P<0.05), no differences were shown between groups with reference to LDH, CK an Fe content (P>0.05), that could be considered as indicators of muscle activity. This was probably due to the same amount of movement in the calves of the two groups, although the space allowance was different.
Direct and indirect blood parameters (table 6 and 7) have highlighted some
114
Ann. Fac. Medic. Vet. di Parma (Vol. XXV, 2005) - pag. 111 - pag. 130
signifi cant (P<0.05) differences between groups. Contrary to that reported by Cozzi et al. (2000), PCV and Hb content were higher (+12% and +10%, resp.) in individually housed than in multiple housed calves. This result has a strong practical impact and the disagreement with previous reports is probably due to the lower space allowance in the trial by Cozzi et al. (2000) than in the present research (resp. 1.5 and 1.84 m2/head in multiple pens; 0.84 and 1.12 m2/head in individual stalls). As the RBC number was similar, both MCV and MCH were slightly lower in multiple housed calves. According to Reece and Hotchkiss (1987) the higher space allowance has not determined a stimulus for erythropoiesis.
Slaughtering data (table 8) showed no signifi cant differences between groups (P>0.05), with reference to carcass conformation and meat colour, except for a higher lightness of meat from group reared calves (P<0.05); the result agrees with the above seen lower haemoglobin content of blood in that group. Also Cozzi et al. (2000) found no differences in carcass conformation between individually or group housed veal calves, as lightness and Hb were higher in individually stabulated group.
CONCLUSIONS
The results of this fi eld trial must be read in the context of the literature about the effect of the application of housing conditions oriented toward the welfare of veal calves (Wilson et al., 1999; Verga et al., 1999), indicating a lower activity of group housed animals towards structures, self-grooming, game with the tongue, while the single cage induces to an increase of the frequency of the substitutive activities. Such behavioural state justifi es the best performances, also through a higher energy rate available for the less stressed animal. Actually, national and European legislation have defi nitively abandoned the use of individual stalls; so the impact of new housing systems on productive parameters and on carcass and meat quality can be valued.
The results of the present study induce to conclude that group housed veal calves show a better performance both during the productive life and after slaughtering. The impact of the housing system on blood parameters is more diffi cult to interpret, because of the high variability of most parameters. In particular group housed calves have shown better growth parameters, and a meat quality nearer to consumerʼs expectations.
REFERENCES
BIAGI G., NANNIPIERI S., SIGNORINI G. (2002) - Benessere in allevamento. Le nuove normative sui suini. Annali Fac. Med. Vet. di Pisa, 55, 41-58.
BRAMBELL COMMITTEE (1965) - Report of the Technical Committee to Enquire into the Welfare of Animals kept under Intensive Livestock Husbandry System.Command Report 2836, Her Majestyʼs Stationery Offi ce, London.
COLLIN E. (2000) - Gli esami ematici nel bovino 2 - Utilizzo pratico dellʼematologia - Summa Veterinaria, 6, pp 59-64.
115
Ann. Fac. Medic. Vet. di Parma (Vol. XXV, 2005) - pag. 111 - pag. 130
COZZI G., GOTTARDO F., ANDREOLI D., ANDRIGHETTO I., MATTIELLO S., FERRANTE V., VERGA M. (2000) - Somministrazione di un mangime solido a vitelli a carne bianca stabulati in gabbia individuale o in box di gruppo. 1. Prestazioni produttive e qualità della carne. Zoot. Nutr. Anim., 26, 233-242.
DELLMEIER G.R., FRIEND T.H., GBUR E.E. (1985) - Comparison of four methods of calf confi nement. 2. Behaviour. J.Anim.Sci., 60, 1102-1109.
EU SCIENTIFIC VETERINARY COMMITTEE (1995) - Report on the welfare of calves (Report on calf welfare 9/11 /95). Commission of the European Communities.
EUROSTAT (2005) - http://epp.eurostat.cec.eu.int/ISTAT (2005) - http://www.istat.it/societa/consumi/JONGEBREUR A.A., SMITS A.C. (1982) - Group housing systems for veal calves.
In “Welfare and Husbandry of calves (ed. By Signoret J.P.), Martinus Nijhoff Publ., The Hague, NL, p 217-224.
MANFREDINI M. (1988) - Aspetti qualitativi della carne di vitello. Agricoltura e Ricerca, 10, 89, 77-84.
NOVELLI, E., CAMPESATO, E., CAMPANINI, G., DAZZI, G., MADARENA, G., BADIANI, A., CHIZZOLINI, R. (1991) - Valutazione strumentale della qualità della carne suina. 1. Premessa. Riv. Suin., 32, (2):39-49.
PARIGI - BINI R., SOMEDA DE MARCO A. (1989) Zootecnia Speciale dei bovini. 2. Produzione della carne. Patron Editore, Bologna.
REECE W.O., HOTCHKISS D.K. (1987) - Blood studies and performance among calves reared by different methods. J.Dairy Sci., 70, 1601-1611.
RICHARD A.L., HEINRICHS A.J., MULLER L.D. (1988) - Feeding acidifi ed milk replacer ad libitum calves housed in group versus individual pens. J.Dairy Sci., 71, 2203-2209.
RUSHEN J. (1991) - Problems associated with the interpretation of physiological data in the assessment of animal welfare. Appl. An. Beh. Sci., 28, 381-386.
SAS (2002-2003) - SAS/Stat Userʼs Guide, ver. 9.1. SAS Institute Inc., Cary, NC, USA.
SCAHAW - Scientifi c Committee on Animal Health and Animal Welfare (2001) - The welfare of cattle kept for beef production. 25 April 2001. SANCO.C.2/AH/R22/2000, http://europa.eu.int/comm/food/fs/sc/scah/outcome_en.html
STULL C.L., McMARTIN D.A. (1992) - Welfare parameters in veal calf production facilities. Special Report p 23. Coop. Ext., Scholl of Vet. Med., Univ. of California, Davis.
TRUNKFIELD H.R.; BROOM D.M.; MAATJE K.; WIERENGA H.K.; LAMBOOY E. & KOOIJMAN J. (1991) - Effects of housing on responses of veal calves to handling and transport. In: Metz J.H.M. & Groenestein (Eds.), New Trends in Veal Calves Production, pp. 40-43.
VERGA M., CARENZI C., LE NEINDRE P. (1999) - La ricerca internazionale nel settore del benessere animale. In Atti Convegno “Problematiche nazionali ed europee del benessere animale”, Brescia.
VERRIEL M., BEDOUET J. (2000). Gli esami ematici nei bovini 1. Le chiavi per utilizzare la biochimica clinica. Summa Veterinaria, 5, pp 27-31.

116
Ann. Fac. Medic. Vet. di Parma (Vol. XXV, 2005) - pag. 111 - pag. 130
WARNICK V.D., ARAVE C.W., MICKELSEN E.W. (1977) - Effect of group, individual and isolated rearing of calves on weight gain and behaviour. J.Dairy Sci., 60, 947-953.
WILSON L.L., TEROSKY T.L., STULL C.L., STRICKLIN W.R. (1999) - Effects of individual housing design and size on behaviour and stress indicators of special-fed Holstein veal calves. J.Anim.Sci., 77, 1341-1347.
SUMMARY
The Authors refer the results of a fi eld trial, carried out with the aim to value the effect of housing type (individual stall vs multiple pen) on growth parameters and carcass quality in veal calves. Multiple pen housed calves showed a higher weight gain (+27.5%; P<0.05) than individually housed calves, a better feed/gain ratio (-13.6%; P<0.05) and a lower blood Hb content (-9.4%; P<0.05); meat from group housed calves was nearer to consumerʼs expectations (l.dorsi muscle lightness: +4.5%; P<0.05).
RIASSUNTO – Effetto del tipo di stabulazione sulla produzione del vitello a carne bianca
Gli Autori espongono i risultati di una prova condotta al fi ne di valutare lʼeffetto del tipo di stabulazione (gabbia singola vs box multiplo) sulle caratteristiche dellʼaccrescimento e sulla qualità della carcassa del vitello a carne bianca. I soggetti stabulati in box multiplo hanno manifestato un più elevato incremento ponderale rispetto a quelli allevati in gabbia singola (+27,5%; P<0,05), i migliori indici di conversione (-13,6%; P<0,05) ed un più basso tenore di emoglobina (-9,4%; P<0,05); la carne è inoltre risultata in possesso di caratteristiche più aderenti alle aspettative del consumatore (L*: +4,5%; P<0,05).

117
Ann. Fac. Medic. Vet. di Parma (Vol. XXV, 2005) - pag. 111 - pag. 130
0
500
1000
1500
2000
2500
3000
3500
4000
Day of housing
g dm
/hea
d
Figure 1 - Dry matter intake (g/head/day)
Table 1 – Chemical composition of 1st period milk replacer.
Analytical values
Moisture % 5.00
Crude protein % 23.00
Fat % 19.00
Crude fibre % 0.30
Ash % 7.00
Integration (per kg)
Vitamin A I.U. 25000
Vitamin D3 I.U. 3000
Vitamin E mg 50
Vitamin C mg 40
Copper (as sulphate) mg 10
Iron (as sulphate) mg 40
Ingredients
Dairy products (spray skimmed milk at least 50%), fats and oils,
cereal products and by-products, minerals, BHT

118
Ann. Fac. Medic. Vet. di Parma (Vol. XXV, 2005) - pag. 111 - pag. 130
Table 2 – Chemical composition of 2nd period milk replacer.
Analytical values
Moisture % 5.00
Crude protein % 21.00
Fat % 21.00
Crude fibre % 6.00
Ash % 1.70
Lysine % 0.55
Methionine % 0.20
Cystine % 4.00
Integration (per kg)
Vitamin A I.U. 25000
Vitamin D3 I.U. 4000
Vitamin C mg 100
Vitamin E mg 100
Vitamin B1 mg 5
Vitamin B2 mg 10
Vitamin B6 mg 6
Vitamin B12 mg 0.05
Vitamin K3 mg 2
Niacin mg 35
D-pantothenic acid mg 18
Choline mg 200
Zinc (as sulphate) mg 100
Manganese (as sulphate) mg 40
Copper (as sulphate) mg 8
Selenium (as sodium selenite) mg 0.25
Cobalt (as sulphate) mg 1.5
Ingredients
Dairy products (spray skimmed milk at least 51%), fats and oils,
high oil seeds products and by-products
Table 3 – Chemical composition of complementary feed.
Analytical values
Moisture % 60.50
Crude protein % 2.70
Fat % 1.00
Crude fibre % 7.40
Ash % 2.20
Components
Whole maize silage, corn meal, ammonium propionate

119
Ann. Fac. Medic. Vet. di Parma (Vol. XXV, 2005) - pag. 111 - pag. 130
Table 4 – Live weight, average daily gain (ADG) and feed conversion ratio (FCR) (least squares means).
(*): values covaried with initial live weighta,b different for P<0.05
Housing type Covariate RSE
Individual stall Multiple pen
Initial live weight kg 48.10 49.00 - 1.62
Live weight at d 72 (*) kg 115.65b
110.75a
3.66 3.91
Live weight at d 168 (*) kg 229.35a
252.93b
6.26 15.71
ADG 1-72 d g/d 912 884 - 81
ADG 73-168d g/d 1171a
1493b
- 174
ADG 1-168 d g/d 1059a
1232b
- 106
FCR (milk powder) d 1-72 g/g 1.47 1.52 - 0.14
FCR (milk powder) d 73-168 g/g 2.52b 1.97
a - 0.36
FCR (milk powder) d 1-168 g/g 2.11b 1.82
a - 0.20
FCR (total dry matter) d 1-72 g/g 1.54 1.59 - 0.14
FCR (total dry matter) d 73-168 g/g 2.62b 2.04
a - 0.37
FCR (total dry matter) d 1-168 g/g 2.20b 1.90
a - 0.21
Table 5 – Blood parameters: total proteins (TP), iron (Fe), creatinkinase (CK), lac-tate dehydrogenase (LDH) and cortisol (least squares means).
(*) values covaried with initial contenta,b different for P<0.05
Housing type
Individual stall Multiple penCovariate RSE
TP
- d 0 g/dl 5.78 5.68 - 0.45
- d 72 (*) g/dl 6.14 5.96 0.20 0.44
- d 168 (*) g/dl 7.22b
6.82a
0.30 0.58
Fe
- d 0 μg/dl 53.42 52.25 - 17.41
- d 72 (*) μg/dl 39.93 39.88 0.35 8.52
- d 168 (*) μg/dl 40.17 38.49 0.35 12.60
CK
- d 0 U/l 152.88 163.38 - 171.59
- d 72 (*) U/l 71.65 84.61 -0.003 50.65
- d 168 (*) U/l 162.40 135.83 0.072 55.18
LDH
- d 0 U/l 699.92 620.88 - 212.42
- d 72 (*) U/l 648.35 713.40 -0.12 115.51
- d 168 (*) U/l 1089.68 1044.58 -0.16 232.64
Cortisol
- d 0 U/l 3.37 5.22 - 3.85
- d 72 (*) U/l 1.19 0.60 -0.007 0.84
- d 168 (*) U/l 0.45 0.36 -0.005 0.47

120
Ann. Fac. Medic. Vet. di Parma (Vol. XXV, 2005) - pag. 111 - pag. 130
Table 6 – Direct erythrocyte analysis: red blood cells (RBC), haemoglobin (Hb), packed cell volume (PCV) (least squares means).
(*) values covaried with initial contenta, b different for P<0.05
Housing type
Individual stall Multiple penCovariate RSE
RBC
- d 0 106/mm
310.40 8.49 - 3.49
- d 72 (*) 106/mm
38.97
a9.75
b-0.17 1.09
- d 168 (*) 106/mm
39.34 9.34 -0.14 0.94
Hb
- d 0 g/dl 9.30 9.24 - 1.78
- d 72 (*) g/dl 9.84b
8.20a
0.50 1.05
- d 168 (*) g/dl 7.90b
7.16a
0.25 0.90
PCV
- d 0 % 27.36 27.69 - 5.24
- d 72 (*) % 28.87b
24.46a
0.52 3.09
- d 168 (*) % 24.94b
22.36a
0.28 3.01
Table 7 – Indirect erythrocyte analysis: mean corpuscular volume (MCV), mean corpuscolar Hb (MCH) and mean corpuscolar Hb concentration (MCHC) (least squares means).
(*) values covaried with initial contenta, b different for P<0.05
Housing type
Individual stall Multiple penCovariate RSE
MCV
- d 0 μm3
28.65a
30.94b
- 3.90
- d 72 (*) μm3
29.63b
25.80a
0.48 3.21
- d 168 (*) μm3
27.31b
23.63a
0.41 4.49
MCH
- d 0 pg 9.74 10.32 - 1.31
- d 72 (*) pg 10.04b
8.66a
0.43 1.14
- d 168 (*) pg 8.61b
7.62a
0.40 1.37
MCHC
- d 0 g/dl 34.06a
33.47b
- 0.55
- d 72 (*) g/dl 34.29 33.36 -0.18 1.50
- d 168 (*) g/dl 31.76 31.75 0.15 0.50

121
Ann. Fac. Medic. Vet. di Parma (Vol. XXV, 2005) - pag. 111 - pag. 130
Table 8 - Slaughtering data (least squares means).
(§) scores from 1 to 15.a,b different for P<0.05.
Housing type
Individual stall Multiple penRSE
Carcass conformation (§) 7.69 7.71 0.78
Colour:
Lightness (L*) 43.09a
45.02b 3.01
Redness (a*) 10.18 11.15 2.49
Yellowness (b*) 3.76 4.02 1.22
Hue 0.353 0.346 0.08
Chrome 10.871 11.910 2.61

122
Ann. Fac. Medic. Vet. di Parma (Vol. XXV, 2005) - pag. 111 - pag. 130

123
Ann. Fac. Medic. Vet. di Parma (Vol. XXV, 2005) - pag. 111 - pag. 130
EFFETTO DEL TIPO DI STABULAZIONE SULLA PRODUZIONE DEL VITELLO A CARNE BIANCA1
Sabbioni A., Beretti V., Bertocchi A., Zanon A., Soffi antini C.S., Superchi P.2
Parole chiave: vitello a carne bianca; gabbia singola; box multiplo; tipo di stabulazione; carne
Key words: veal calf; individual stall; multiple pen; housing type; meat
INTRODUZIONE
In Italia la produzione del vitello a carne bianca è un settore importante dellʼattività zootecnica, tanto che il nostro Paese è oggi sicuramente uno dei primi cinque mercati nellʼUE, insieme a Germania, Francia, Olanda e Polonia (EUROSTAT, 2005).
Negli anni 60 la produzione del vitello a carne bianca venne favorita in Europa sia dalle forti eccedenze di latte, almeno fi no allʼintroduzione del contingentamento della produzione, che dalla disponibilità di un gran numero di vitelli di razze lattifere non adatti alla produzione del vitellone (Parigi Bini e Someda de Marco, 1989).
Attualmente il consumo di carne di vitello rappresenta circa un quinto del consumo totale di carne (ISTAT, 2005). Le carni del vitello possiedono eccezionali qualità nutrizionali e organolettiche, derivanti dallʼelevato tenore proteico, dal basso tenore in grasso, dalla tenerezza, dalla digeribilità e dal colore chiaro (Manfredini, 1988). Ma, forse, a rendere tanto richiesto questo tipo di carne, oltre ai citati fattori connaturati in essa, hanno contribuito, in modo determinante, le tendenze nutrizionali degli ultimi anni, che guardano in particolare ad unʼalimentazione leggera e dietetica.
Un aspetto che ha sempre penalizzato lʼallevamento del vitello a carne bianca, nei confronti dellʼopinione pubblica, rispetto agli altri tipi di allevamento, riguarda le condizioni di stabulazione. La costrizione in box singoli di dimensioni ridotte, e lʼalimentazione non fi siologica con soli sostitutivi del latte fi no ad unʼetà nella quale gli altri vitelli sono già svezzati, ha creato a livello europeo un forte movimento dʼopinione contrario a tale allevamento, che ha determinato lʼemanazione di specifi che direttive (97/2/CE del 20 gennaio 1997 recante modifi ca della direttiva 91/629/CEE che stabilisce le norme minime per la protezione dei vitelli) volte al miglioramento delle condizioni di allevamento. Tali direttive sono state poi recepite a livello nazionale (D.L. n. 533 del 30/12/1992 e D.L. n. 331 del 1/9/1998), introducendo radicali cambiamenti in questo settore produttivo.
1 Ricerche condotte con fondi FIL – Università di Parma.2 Dipartimento di Produzioni Animali, Biotecnologie Veterinarie, Qualità e Sicurezza degli Alimenti; Se-zione di Scienze Zootecniche e Qualità delle Produzioni Animali. Indirizzo per corrispondenza: [email protected]

124
Ann. Fac. Medic. Vet. di Parma (Vol. XXV, 2005) - pag. 111 - pag. 130
Il presente lavoro riporta i risultati di una prova sperimentale, svolta a seguito dei nuovi cambiamenti dettati dallʼUnione Europea in termini di strutture di allevamento, con lʼobiettivo di valutare gli effetti del tipo di stabulazione (box singolo o multiplo) sulle caratteristiche dellʼaccrescimento e sulla resa zootecnica del vitello a carne bianca.
MATERIALI E METODI
La prova è stata condotta su 48 vitelli maschi di razza Frisona Italiana, presso un allevamento commerciale della provincia di Brescia, nel quale erano presenti entrambe le tipologie di box, dal momento che era in corso lʼadeguamento alla normativa in materia. In tal modo è stato possibile utilizzare lo stesso piano alimentare ed usufruire delle stesse condizioni ambientali, per focalizzare lʼinteresse solo sulla tipologia di gabbia.
Allʼarrivo metà degli animali è stata alloggiata per tutto il periodo di allevamento in gabbie singole di m 1,65 x 0,68 (spazio per capo: 1,12 m2) con pavimento grigliato, mentre lʼaltra metà è stata introdotta in gabbie singole di m 1,50 x 0,75 (spazio per capo: 1,13 m2) nelle quali sono rimasti per i primi 72 d. A quel punto, togliendo le transenne fra gabbie adiacenti sono stati ottenuti box multipli da sei soggetti, di dimensioni pari a m 2,40 x 4,60 (spazio per capo: 1,84 m2).
Con riferimento allʼalimentazione, gli animali allʼarrivo sono stati sottoposti a reidratazione per via orale con una soluzione del commercio. Il piano alimentare, comune ad entrambi i gruppi sperimentali, ha previsto la somministrazione di latte in polvere ricostituito dal secondo giorno fi no al 72° (1° periodo) e dal 73° fi no alla macellazione (2° periodo), a dosi crescenti da g 280 a g 3450, sciolto in acqua a concentrazioni crescenti dal 4.5% al 19%. A partire dal 31° giorno si è proceduto alla somministrazione anche di un mangime complementare, alla dose iniziale di 50 g/capo, con scatti di 50 g ogni 10 d, fi no ad una dose massima di 300 g per capo e per giorno fi no alla macellazione. Gli alimenti sono stati forniti in due pasti giornalieri, tranne la domenica, nel corso della quale veniva somministrato un solo pasto (13 pasti settimanali). La quantità di sostanza secca fornita giornalmente è rappresentata nel grafi co n. 1. La composizione chimica del latte ricostituito (1° e 2° periodo) e del mangime è riportata nelle tabelle nn. 1, 2, 3.
Gli animali sono stati pesati individualmente allʼinizio, al 72° giorno (momento del cambio del tipo di stabulazione e di alimentazione) e alla fi ne del periodo di allevamento (168° d). Nel corso del ciclo sono stati misurati i consumi di sostanza secca per gruppo, dai quali sono stati calcolati gli indici di conversione.
In occasione delle pesate individuali gli animali sono stati sottoposti a prelievi ematici dalla vena giugulare per lʼeffettuazione di analisi chimico-cliniche ed emocromocitometriche. Il prelievo è stato eseguito in provette con litio eparina (analisi chimico-cliniche) o K-EDTA (esame emocromocitometrico), al mattino prima del pasto.
Allʼarrivo in laboratorio i campioni sono stati immediatamente analizzati nel caso dellʼesame emocromocitometrico, mentre per gli altri parametri sono stati

125
Ann. Fac. Medic. Vet. di Parma (Vol. XXV, 2005) - pag. 111 - pag. 130
centrifugati a +4°C per 20 minuti a 3000 rpm e quindi conservati a -20°C fi no al momento dellʼanalisi (Collin, 2000; Verriel e Bedouet, 2000).
Sono stati oggetto di indagine diretta il contenuto in globuli rossi (RBC), in emoglobina (Hb), il valore ematocrito (PCV), il contenuto di proteine totali (TP), di Fe, i valori di CK e LDH; indirettamente sono stati poi calcolati il volume eritrocitario medio (MCV), la concentrazione emoglobinica globulare media (MCHC) ed il contenuto globulare medio dellʼemoglobina (MCH).
Al termine della prova gli animali sono stati macellati, previo digiuno alimentare di 12 ore. Al macello non è stato possibile pesare la carcassa e, conseguentemente, calcolare la resa di macellazione. Sono stati invece effettuati il rilievo soggettivo della conformazione (punteggio da 1 a 15) e la determinazione del colore della carne sul muscolo l.dorsi. Più in particolare, sul taglio fresco del muscolo è stato misurato il colore in superfi cie servendosi di un colorimetro Minolta Chromameter Refl ectance II CR100/08, utilizzando il canale 1 contenente una taratura con una piastrella rosa Standard Gardner n.CG6625 (Y=45,97; x=0,3658; y=0,3250). Per ogni soggetto sono state fatte 4 misure, in altrettanti punti diversi, che sono state espresse in L* a* b* (Novelli e coll., 1991). I valori di tinta e croma sono stati calcolati, rispettivamente, come arctg(b/a) e √(a2+b2).
I dati sono stati elaborati mediante analisi della varianza (SAS, 2002-2003), utilizzando un modello comprendente un fattore fi sso (tipo di stabulazione: singolo vs multiplo); quando necessario è stato utilizzato un modello di analisi della covarianza, nel quale la covariata era rappresentata dal valore iniziale del parametro.
RISULTATI E DISCUSSIONE
Nel corso della prova sono morti 7 soggetti (14,6%), di cui 3 (6,3%) nel gruppo a stabulazione singola e 4 (8,3%) in quello a stabulazione multipla, per cause indipendenti dal fattore sperimentale.
La tabella n. 4 riporta i principali parametri infra vitam rilevati sui vitelli in prova.
Il peso vivo fi nale è risultato signifi cativamente superiore (P<0,05) nei soggetti del gruppo a stabulazione multipla, rispetto a quelli allevati in box singolo (+10,3%); anche lʼincremento ponderale giornaliero nel periodo fra il 72° ed il 168° d è risultato a favore (P<0,05) dello stesso gruppo (+27,5%). Nel corso della prova il gruppo a stabulazione in box multiplo ha messo in evidenza i migliori indici di conversione (P<0,05), con riferimento sia alla trasformazione della polvere di latte, sia della sostanza secca totale (latte+mangime). I risultati concordano con quelli reperiti in letteratura (Warnick et al., 1977; Jongebreur e Smits, 1982; Richard et al., 1988; Cozzi et al., 2000).
Nonostante la maggior attività fi sica, gli animali stabulati in gruppo hanno quindi messo in evidenza migliori performance, probabilmente a causa di un più basso livello di stress e di consumo di energia, legato alla minore eccitabilità (Dellmeier et al., 1985).
Per verifi care tale ipotesi gli animali sono stati sottoposti ai prelievi

126
Ann. Fac. Medic. Vet. di Parma (Vol. XXV, 2005) - pag. 111 - pag. 130
ematici volti alla determinazione del cortisolo, che risulta essere importante per il monitoraggio dello stato di stress degli animali. In genere per stress si intende uno stato pre-patologico, durante il quale lʼalterato stato endocrino dellʼanimale può causare problemi immunologici e riproduttivi (Biagi et al., 2002). L aumento dellʼattività pituitaria-adrenocorticale è una risposta non specifi ca a vari stimoli che viene rilevata anche attraverso lʼaumento della concentrazione plasmatica di glucocortiroidi: il livello di cortisolo nel plasma è stato quindi spesso utilizzato come indicatore di stress e, nonostante esistano molteplici motivazioni a sfavore della sua semplice misurazione, viene ritenuto in genere un valido strumento per valutare il benessere animale. Trunkfi eld et al. (1991) hanno rilevato una reattività corticosurrenale più elevata in vitelli allevati in box individuale rispetto a quelli allevati in gruppo, quando gli animali sono stati sottoposti a stressori acuti; tuttavia in altre ricerche, sempre su vitelli, tale reattività non è risultata correlata al tipo di stabulazione (Rushen, 1991). Wilson et al. (1999) non hanno riscontrato differenze nel contenuto di cortisolo di vitelli a carne bianca allevati in box multipli o singoli. Stull e McMartin (1992) hanno riscontrato valori più elevati di cortisolo in vitelli allevati in gruppo ed hanno suggerito che tale evenienza può essere messa in relazione con la maggior diffi coltà nel prelevare il sangue rispetto ad animali stallati individualmente. Nella nostra ricerca, i soggetti stabulati in gruppo hanno manifestato livelli di cortisolo inferiori, anche se in modo statisticamente non signifi cativo (P>0,05) rispetto a quelli stabulati in box singolo (tabella n. 5). Il dato assume quindi solo un valore indicativo (lʼassenza di signifi catività si potrebbe spiegare con lʼelevata variabilità del parametro, come si evince dallʼelevato valore del RSE).
Circa gli altri parametri ematici, nessuna differenza signifi cativa tra i gruppi è stata evidenziata per LDH, CK e sideremia (P>0,05), indicatori di attività muscolare, probabilmente a motivo del fatto che pur essendo allevati in gruppo con un maggior spazio a disposizione, il movimento non risultava particolarmente diverso nei due gruppi. Ne consegue che lʼattività muscolare non dovrebbe essere stata infl uenzata dal trattamento. Le proteine totali sono risultate invece signifi cativamente più elevate (P<0,05) nel gruppo a stabulazione singola, pur mantenendosi in entrambi i gruppi, e fi n dallʼinizio della prova, entro valori ritenuti indicativi di un corretto apporto alimentare.
I parametri eritrocitari diretti e indiretti (tabelle nn. 6 e 7) hanno evidenziato alcune differenze signifi cative (P<0,05) fra i gruppi sperimentali. Contrariamente a quanto riportato da Cozzi et al. (2000), PCV ed Hb sono risultati maggiori (risp. +12% e +10%) nei soggetti a stabulazione singola rispetto a quelli allevati in box multiplo. Tale dato, che risulta di grande impatto economico in questo tipo di allevamento, ma di diffi cile interpretazione, è probabilmente da ascrivere al diverso spazio a disposizione degli animali nella prova condotta da Cozzi et al. (2000) (risp. m2/capo 1,5 e 0,84 per i gruppi a stabulazione multipla e singola), rispetto a quello della nostra prova (m2/capo 1,84 e 1,12 per i gruppi a stabulazione multipla e singola), che ha permesso una diversa possibilità di movimento agli animali.
Mentre il numero di globuli rossi è rimasto invariato nei due gruppi, sia il volume eritrocitario medio che il contenuto globulare medio di emoglobina sono risultati lievemente inferiori nel gruppo a stabulazione multipla. In accordo con

127
Ann. Fac. Medic. Vet. di Parma (Vol. XXV, 2005) - pag. 111 - pag. 130
Reece e Hotchkiss (1987), non vi è stato quindi alcuno stimolo allʼeritropoiesi, come invece si osserva in vitelli a seguito dellʼaumento dello spazio/capo.
Con riferimento ai dati di macellazione (tabella n.8) non sono state riscontrate differenze signifi cative tra i gruppi (P>0,05), con riferimento alla conformazione della carcassa ed al colore, se si esclude una maggiore luminosità della carne proveniente dai soggetti allevati in gruppo (P<0,05), tra lʼaltro prevista sulla base dei dati relativi al contenuto di emoglobina del sangue. Anche Cozzi et al. (2000) non hanno trovato differenze nella conformazione delle carcasse fra i due sistemi di stabulazione, mentre la luminosità (come del resto anche il contenuto di emoglobina del sangue) è risultata maggiore nei soggetti allevati in gabbia singola. Con ogni probabilità, anche in questo caso lo stress della gabbia singola può avere infl uenzato il parametro.
CONCLUSIONI
I risultati della sperimentazione vanno letti anche nel contesto delle numerose referenze bibliografi che reperite sullʼargomento, che sono servite da supporto nel diffi cile passaggio che ha interessato lʼallevamento del vitello a carne bianca fra le condizioni della stabulazione singola e quella di gruppo.
Poiché la legislazione europea in argomento, recepita anche a livello nazionale, ha ormai sancito lʼabbandono dellʼallevamento in gabbia singola dei vitelli, è oggi possibile valutare lʼimpatto di tale nuova tecnologia sullʼeffi cienza dellʼallevamento.
Lo stato di benessere derivante dallʼallevamento in box multiplo è dimostrato da numerosi lavori che hanno controllato i principali parametri etologici dei vitelli (Wilson et al., 1999; Verga et al., 2000): i soggetti allevati in gruppo manifestano in genere una riduzione dei principali comportamenti orali (attività verso strutture, self-grooming, gioco con la lingua), indicando come questo sistema stabulativo soddisfi maggiormente le esigenze comportamentali dellʼanimale, mentre la gabbia singola induce ad un aumento della frequenza delle attività sostitutive. Tale stato comportamentale giustifi ca le migliori performance, anche attraverso una maggiore quota di energia netta alimentare disponibile per lʼanimale meno stressato.
I risultati del presente studio permettono di concludere che i vitelli stabulati in box multipli hanno messo in evidenza prestazioni migliori sia durante la vita produttiva che dopo la macellazione. L effetto del sistema di stabulazione sui parametri ematici è più diffi cile da interpretare, a causa dellʼalta variabilità riscontrata. In particolare i vitelli stabulati in box multiplo hanno manifestato un maggior sviluppo e una produzione di carne con caratteristiche più aderenti alle aspettative del consumatore.
BIBLIOGRAFIA
BIAGI G., NANNIPIERI S., SIGNORINI G. (2002) - Benessere in allevamento. Le nuove normative sui suini. Annali Fac. Med. Vet. di Pisa, 55, 41-58.

128
Ann. Fac. Medic. Vet. di Parma (Vol. XXV, 2005) - pag. 111 - pag. 130
BRAMBELL COMMITTEE (1965) - Report of the Technical Committee to Enquire into the Welfare of Animals kept under Intensive Livestock Husbandry System.Command Report 2836, Her Majestyʼs Stationery Offi ce, London.
COLLIN E. (2000) - Gli esami ematici nel bovino 2 - Utilizzo pratico dellʼematologia - Summa Veterinaria, 6, pp 59-64.
COZZI G., GOTTARDO F., ANDREOLI D., ANDRIGHETTO I., MATTIELLO S., FERRANTE V., VERGA M. (2000) - Somministrazione di un mangime solido a vitelli a carne bianca stabulati in gabbia individuale o in box di gruppo. 1. Prestazioni produttive e qualità della carne. Zoot. Nutr. Anim., 26, 233-242.
DELLMEIER G.R., FRIEND T.H., GBUR E.E. (1985) - Comparison of four methods of calf confi nement. 2. Behaviour. J.Anim.Sci., 60, 1102-1109.
EU SCIENTIFIC VETERINARY COMMITTEE (1995) - Report on the welfare of calves (Report on calf welfare 9/11 /95). Commission of the European Communities.
EUROSTAT (2005) - http://epp.eurostat.cec.eu.int/ISTAT (2005) - http://www.istat.it/societa/consumi/JONGEBREUR A.A., SMITS A.C. (1982) - Group housing systems for veal calves.
In “Welfare and Husbandry of calves (ed. By Signoret J.P.), Martinus Nijhoff Publ., The Hague, NL, p 217-224.
MANFREDINI M. (1988) - Aspetti qualitativi della carne di vitello. Agricoltura e Ricerca, 10, 89, 77-84.
NOVELLI, E., CAMPESATO, E., CAMPANINI, G., DAZZI, G., MADARENA, G., BADIANI, A., CHIZZOLINI, R. (1991) - Valutazione strumentale della qualità della carne suina. 1. Premessa. Riv. Suin., 32, (2):39-49.
PARIGI - BINI R., SOMEDA DE MARCO A. (1989) Zootecnia Speciale dei bovini. 2. Produzione della carne. Patron Editore, Bologna.
REECE W.O., HOTCHKISS D.K. (1987) - Blood studies and performance among calves reared by different methods. J.Dairy Sci., 70, 1601-1611.
RICHARD A.L., HEINRICHS A.J., MULLER L.D. (1988) - Feeding acidifi ed milk replacer ad libitum calves housed in group versus individual pens. J.Dairy Sci., 71, 2203-2209.
RUSHEN J. (1991) - Problems associated with the interpretation of physiological data in the assessment of animal welfare. Appl. An. Beh. Sci., 28, 381-386.
SAS (2002-2003) - SAS/Stat Userʼs Guide, ver. 9.1. SAS Institute Inc., Cary, NC, USA.
SCAHAW - Scientifi c Committee on Animal Health and Animal Welfare (2001) - The welfare of cattle kept for beef production. 25 April 2001. SANCO.C.2/AH/R22/2000, http://europa.eu.int/comm/food/fs/sc/scah/outcome_en.html
STULL C.L., McMARTIN D.A. (1992) - Welfare parameters in veal calf production facilities. Special Report p 23. Coop. Ext., Scholl of Vet. Med., Univ. of California, Davis.
TRUNKFIELD H.R.; BROOM D.M.; MAATJE K.; WIERENGA H.K.; LAMBOOY E. & KOOIJMAN J. (1991) - Effects of housing on responses of veal calves to handling and transport. In: Metz J.H.M. & Groenestein (Eds.), New Trends in Veal Calves Production, pp. 40-43.

129
Ann. Fac. Medic. Vet. di Parma (Vol. XXV, 2005) - pag. 111 - pag. 130
VERGA M., CARENZI C., LE NEINDRE P. (1999) - La ricerca internazionale nel settore del benessere animale. In Atti Convegno “Problematiche nazionali ed europee del benessere animale”, Brescia.
VERRIEL M., BEDOUET J. (2000). Gli esami ematici nei bovini 1. Le chiavi per utilizzare la biochimica clinica. Summa Veterinaria, 5, pp 27-31.
WARNICK V.D., ARAVE C.W., MICKELSEN E.W. (1977) - Effect of group, individual and isolated rearing of calves on weight gain and behaviour. J.Dairy Sci., 60, 947-953.
WILSON L.L., TEROSKY T.L., STULL C.L., STRICKLIN W.R. (1999) - Effects of individual housing design and size on behaviour and stress indicators of special-fed Holstein veal calves. J.Anim.Sci., 77, 1341-1347.
RIASSUNTO
Gli Autori espongono i risultati di una prova condotta al fi ne di valutare lʼeffetto del tipo di stabulazione (gabbia singola vs box multiplo) sulle caratteristiche dellʼaccrescimento e sulla qualità della carcassa del vitello a carne bianca. I soggetti stabulati in box multiplo hanno manifestato un più elevato incremento ponderale rispetto a quelli allevati in gabbia singola (+27,5%; P<0,05), i migliori indici di conversione (P<0,05) ed un più basso tenore di emoglobina; la carne è inoltre risultata in possesso di caratteristiche più aderenti alle aspettative del consumatore (L*: +4,5%; P<0,05).
SUMMARY - Effect of housing type on veal calf performanceThe Authors refer the results of a fi eld trial, carried out with the aim to value
the effect of housing type (individual stall vs multiple pen) on growth parameters and carcass quality in veal calves. Multiple pen housed calves showed a higher weight gain (+27.5%; P<0.05) than individually housed calves, a better feed/gain ratio (-13.6%; P<0.05) and a lower blood Hb content (-9.4%; P<0.05); meat from group housed calves was nearer to consumer s expectations (l.dorsi muscle lightness: +4.5%; P<0.05).

130
Ann. Fac. Medic. Vet. di Parma (Vol. XXV, 2005) - pag. 111 - pag. 130

131
Ann. Fac. Medic. Vet. di Parma (Vol. XXV, 2005) - pag. 131 - pag. 144
1 Research funded by FIL project – University of Parma.2 Dipartimento di Produzioni Animali, Biotecnologie Veterinarie, Qualità e Sicurezza degli Alimenti, Sezione di Scienze Zootecniche e Qualità delle Produzioni Animali. Corresponding Author: [email protected]
PRELIMINARY RESULTS ABOUT MORPHOLOGICAL AND DEMOGRAPHIC TRAITS OF ROMAGNOLO DONKEY(1)
Beretti V., Zanon A., Soffi antini C.S., Sabbioni A.(2)
Key words: Romagnolo donkey morphology, body measures, inbreeding.Parole chiave: Asino Romagnolo, morfologia, misure somatiche,
consanguineità.
INTRODUCTION
In the past, donkey breeding was spread and blooming in Italy. A census taken in 1918 counted 949162 heads, putting Italy at the second place in the Western Europe after Spain. The progressive mechanization of the agricultural activity, the depopulation of rural districts and the consequent reduction of request of working donkeys and mules of burden, caused a gradual decrease of consistence since the end of the Second World War, with a strong accentuation from 1970s onwards. The fi fth Italian Agricultural census (ISTAT, 2006) reports an ass population of 19325 heads in the year 2000.
Nowadays, the donkey breeds offi cially standardized in Italy are: Amiata, Asinara, Martina Franca, Ragusano and Sardo. However, many other breeds are spread on the national territory, for example Grigio Siciliano, Pantelleria and Romagnolo.
Originally, from the phylogenetic point of view, Italian donkeys were divided into four ancestral breeds: Pugliese, Siciliana, Pantelleria and Sarda (Marchi et al., 1925). Besides, within these breeds it was possible to recognize some subdivisions or local breeds; for example, Siciliana breed was divided into two populations, one of the West and the other of the East of the island. The Pugliese breed, the most diffused in Italy in the past, included the populations of Calabrese, Basilicata, Leccese, Martina Franca, Marchigiana and Romagnolo. Then, the Romagnolo stock is related to the Pugliese breed.
As reported in the General Catalogue of Horses Stallions and Jacks of Regio Deposito of Reggio Emilia, in the 1941 forty-six jacks of Romagnolo breed were registered for reproduction in Emilia Romagna and Marche countries. Afterwards, Romagnolo stallions were utilized in the Tosco-Emiliano Apennines; it seems undoubted the correlation between the Amiata breed (more recently formed) and the Romagnolo breed (A.A.V.V.,1952; Arzilli, 2002).
The Italian Catalogue of stallions horses and jacks, drawn up by Italian Ministry of Agriculture in the 1978, didnʼt point out any Romagnolo jackass stallion

132
Ann. Fac. Medic. Vet. di Parma (Vol. XXV, 2005) - pag. 131 - pag. 144
used for breeding in the stud farms. From 1996, the local Breeders Association of Forlì-Cesena-Rimini area promoted the recovery of the breed and started a project in order to recognize the breed in the National Stud Book. During 2005, the Central Technical Commitee of Italian Breeders Association expressed a positive verdict to admit the breed into the Register. The registered heads are actually less than one hundred, distributed in farms of Forlì-Cesena, Rimini, Ravenna, Bologna and Reggio Emilia areas and monitored by the local Breeders Associations. The animals which gave rise to the breed, derive from stocks used for burden in the old traditional sheep-breeding during the transhumance. The FAO Institution (http://dad.fao.org/en/Home.htm) classifi es the population with a strong risk of extinction, considering it a critic situation.
Here is reported a synthetic breed standard of Romagnolo ass.TYPE – Strong constitution and proportionate diameters with good general
development. Good carriage.HEIGHT – High size; males: from cm 135 to 145; females: from cm 132 to 140.COAT COLOUR – Grey-dun and dark bay. Black is rare.TEMPERAMENT – Lively, willing and reliable disposition.MOVEMENTS – Agile and steady trot, kept for long distances.APTITUDE – Strong for burden and draught.HEAD - Well proportioned, of medium length. Rectilinear profi le, slightly
sub-concave, with slightly prominent eyebrows. The eyes elliptical in shape, big and alive. The ears are of medium length.
NECK - of medium length, the junction between head and neck is harmonious, the neck is deep in the base and well inserted between the shoulders, rising up from the withers.
WITHERS - Well defi ned and long, with a smooth transition from the back to the neck. Always higher than the croup.
CHEST - Of medium size, deep and muscular.RIBCAGE - Well developed, long and deep with the ribs obliquely arched
into the joint with the spinal column which promotes a short and full fl ank.SHOULDERS - Long, slanting and well muscled.BACK - Well defi ned and tending towards the horizontal making a smooth
union between the withers and loins.LOINS - Short, wide, muscular, slightly convex, well connected with the
back and croup with which they form a continuous harmonious line.CROUP - Strong and rounded, well balanced, slightly slanting, the profi le is
convex and harmonious.TAIL - Emerges from the same line as the croup and is high attached, with
long, silky and abundant hair.LEGS - Well defi ned and proportioned without being too open, of medium
length. Hooves are rounded, with a strong horn of hoof.The aim of this paper, related to other research studies about autochthonous
breeds of the Emilia-Romagna country (Sabbioni et al., 2005), is to describe the morphological traits of recorded animals and to analyze the main demographic parameters.
133
Ann. Fac. Medic. Vet. di Parma (Vol. XXV, 2005) - pag. 131 - pag. 144
MATERIALS AND METHODS
The body measures and the genealogical data contained in the individual cards of the whole population of Romagnolo donkey, were supplied by the local Breeders Association of Forlì-Cesena-Rimini, Ravenna, Bologna and Reggio Emilia. The complete dataset consisted of 92 animals, of which 22 males and 70 females.
Data concerning the linear measures (height at withers, chest circumference and cannon circumference), from which the anamorphosis index (chest circumference2
/ height at withers) and the dactylo-thoracic index (cannon circumference * 100 / chest circumference) have been then calculated, were submitted to analysis of the variance following a model with age, sex and province of breeding as fi xed factors (SAS, 2002-2003). Also the coat colour has been considered, when reported on the individual cards.
Genealogical data were elaborated with the program Minbreed v.1.0 (Gandini and De Filippi, 1998), in order to obtain the main demographic parameters, such as the inbreeding and the number of equivalent and absolute founders (f
e and f
t).
The effective population size, using the formula of Falconer and McKay (1996) [N
e = 4*M*F/(M+F), in which M and F are the living males and females,
and M<F], and the variation of the inbreeding by generation (∆F=1/2Ne) and year
(∆Fyear
=∆F/L, where L= generationʼs interval) have been calculated (Pagnacco, 2004).
RESULTS AND DISCUSSION
Average (± SD) body measures and morphologic indexes of the whole population is reported in table 1. Data are rather variable, and prevent us to derive useful conclusions. Instead, data shown in table 2 report body measures and morphologic indexes in adults (age ≥ 3 years; 47 donkeys, 11 males and 36 females). Height at withers, cannon circumference and dactylo-thoracic index were signifi cantly different (P<0.05) between males and females. Compared to Amiata donkey (Orlandi et al., 1997), Romagnolo donkey is slightly higher, both in males (cm 137 vs 135.5), and in females (cm 131.6 vs 130); dactylo-thoracic index is lower, both in males (11.9 vs 12) and in females (11 vs 11.6), so denoting, beside a higher size, a lighter skeletal structure in Romagnolo than in Amiata donkey. That is in agreement to literature about the origin of the two breeds. In fact, according to some Authors (A.A.V.V., 1952; Arzilli, 2002), Amiata donkey derives from Romagnolo donkey after crosses with local donkeys, characterized by a smaller size, due to environmental conditions.
With reference to coat colour, data reported in morphological cards were analyzed and results are reported in table 3. About 75% of population showed the typical grey-dun colour, as 4% was bay; however about 20% of the population coat colour had not been reported.
Pedigree was 5 generations deep and generation interval resulted 4.8 years. Effective population size (N
e) was 53.55 and N
e/N ratio was 0.669. So ∆F

134
Ann. Fac. Medic. Vet. di Parma (Vol. XXV, 2005) - pag. 131 - pag. 144
resulted 0.934% and annual ∆F 0.19%. Table 4 refers mean inbreeding values (±SD), calculated from the whole pedigree and from living males and females. The inbreeding coeffi cients resulted very low in absolute, especially if compared to those deriving from analogous studies on different donkey breeds (Gutièrrez et al., 2005), probably due to the low population size and to the lack of some pedigree registrations.
Mean relationship between living males and females (80 donkeys, of which 17 males and 63 females), calculated taking into account all the possible combinations, was equal to 1.4%; in theory, therefore, in the next generation, if the matings will be casual, the expected coeffi cient of inbreeding would be of 0.7%, slightly lower than that calculated from the effective number, and strongly greater than that actually calculated in the living population, that is attested on 0.1%. Such difference fi nds its justifi cation in the number of males, that theoretically would be corrected, but that in truth is overestimated, because only few are used for the reproduction; this fact allows a strong increase of inbreeding from one generation to the following. The reported inbreeding coeffi cients are lower if compared to those calculated for other donkey populations (Gutierrez et al., 2005); in the Catalan ass the living population shows an inbreeding coeffi cient of 4.71%, with a population size of 336 donkeys. In the Romagnolo ass the number of equivalent founders (f
e) was equal to 17.9, and the
number of absolute founders (ft) was of 28, with a relationship f
e/f
t = 0.6389: a value
lower than 1 can mean that the contribution of the founders has not been balanced, having some of them contributed very small or in some cases for nothing to the actual population.
CONCLUSIONS
Though the low population size, at the moment problems related to inbreeding seem to be negligible in Romagnolo donkey population; however it is possibile that in future high relationship coeffi cients among the living population will be achieved; so it is important to plan accurately all matings and to increase the size of population to avoid the risk of high inbreeding.
Body measures show that current population meets the breed standards, also if a small increase of body size could be desirable.
In this phase it is important to point out that the aim of the breeding is to maintain the variability and to increase the population size, rather than to select toward an improvement of morphological traits. In future it will be important that breeders associations harmonize the measuring procedures and the registration cards and that matings are exactly registered, so to obtain complete pedigrees, useful to monitor the genetic parameters of the population.
BIBLIOGRAPHY
A.A.V.V. (1952) Enciclopedia Agraria Italiana. Ed. R.E.D.A., Roma, ItalyA.A.V.V. (1960) Enciclopedia dellʼAgricoltura. Ed. UTET., Torino, Italy
135
Ann. Fac. Medic. Vet. di Parma (Vol. XXV, 2005) - pag. 131 - pag. 144
ARZILLI L. (2002) Risorse genetiche animali autoctone della Toscana Ed. A.R.S.I.A. Firenze Italy
FALCONER D.S., McKAY T.F.C. (1996) Introduction to quatitative genetics, 4th Ed., Longman S&T, Harlow, UK.
GANDINI G., De FILIPPI P. (1998) Proc. VI Congr. Genetics Applied to Livestock Prod.
GUTIERREZ J. P., MARMI J., GOUACHE F., JORDANA. J. (2005) Pedigree information reveals moderate to high levels of inbreeding and a weak population structure in the endangered Catalonian donkey breed. J. Anim. Breed. Genet. 122, 378-386.
LACY R.C. 1989. Analysis of founder representation in Pedigrees. Zoo Biology, 8, 111-123.
MARCHI E., MASCHERONI E., (1925) Zootecnia Speciale Ed. UTET, Torino, Italy
ORLANDI M., BERNI P., BENEDETTI R., CURADI M.C. (1997a) Indici Morfologici nellʼasino Amiatino Ann. Facol. Med. Vet. di Pisa 50, 39-46.
ORLANDI M., CURADI M.C., LEOTTA R., IMPEDUGLIA R., BENEDETTI R. (1997b) Morpho-physiological characterization of Amiatan donkey. Proc. 48th EAAP Congr., 392.
PAGNACCO G. (2004) Genetica Animale Applicata, Ed. CEA, Milano.SABBIONI A., BERETTI V., ZANON A., PAGANI G.P., SUPERCHI P., BONOMI
A., FILIPPINI S., CATALANO A.L. 2005 Demographic Characterization and genetic variability of Bardigiano horse breed from genealogical data. Proc. 59th SISVET Congr. 451-452.
SAS (2002-2003) SAS Userʼs Guide ver. 9.1, Statistical Analysis System, SAS Insti-tute Inc., Cary, NC, USA.
Summary
The Authors refer the results of a study about the morphological and demographic traits of Romagnolo donkey by means of the analysis of individual cards supplied by Breeders Organization. Body measurements and morphological indexes of the whole population (92 donkeys, 22 males and 70 females) were considered, beside genealogical data. Body measures are rather variable; height at withers, cannon circumference and dactylo-thoracic index are higher in males than in females (P<0.05). Mean inbreeding coeffi cient in living population was 0.1% (range 0-6.2%); mean relatedness between living males and females was 1.4%; number of equivalent founders (f
e) was 17.9, number of absolute founders (f
t) was 28 and f
e/f
t
ratio was 0.6389.
RIASSUNTO – Risultati preliminari sui caratteri morfologici e demografi ci dellʼasino Romagnolo
Gli Autori espongono i risultati di un indagine condotta al fi ne di valutare la morfologia, ed i caratteri demografi ci dellʼAsino Romagnolo attraverso lʼimpiego

136
Ann. Fac. Medic. Vet. di Parma (Vol. XXV, 2005) - pag. 131 - pag. 144
delle informazioni contenute nelle schede individuali fornite dalle Associazioni Allevatori. Sono stati presi in considerazione le misure lineari e gli indici morfologici di tutta la popolazione (92 animali, di cui 22 maschi e 70 femmine), nonché i dati genealogici. I dati morfologici manifestano una certa variabilità; per quanto riguarda lʼaltezza al garrese, la circonferenza dello stinco e lʼindice dattilo-toracico sono state riscontrate differenze signifi cative fra maschi e femmine (P<0,05). Il coeffi ciente di consanguineità medio della popolazione vivente è pari allo 0,1% (range 0-6,2%); il coeffi ciente di parentela medio di maschi e femmine viventi è risultato pari allʼ1,4%, il numero di fondatori equivalenti (f
e) è stato pari a 17,9, e il numero di fondatori
assoluti (ft) è risultato di 28, con un rapporto f
e/f
t = 0,6389.
Parameter Mean ± SD Minimum Maximum
Coefficient
of variability
Height at withers cm 132.2 4.6 117 145 3.5
Chest circumference cm 149.3 10.1 119 178 6.7
Cannon circumference cm 17.0 1.3 14 21 7.5
Dactylo-thoracic index (*) 11.4 0.9 9.7 12.9 7.5
Anamorphosis index (**) 168.8 19.1 121.0 220.3 11.3
Table 1 – Body measures and morphological indexes in Romagnolo donkey population.
(*) : Cannon circumference * 100 / Chest circumference(**) : Chest circumference 2 / Height at withers
Table 2 – Body measures and morphological indexes in adult animals (age ≥ 3 years) by sex.
(*) : Cannon circumference * 100 / Chest circumference(**) : Chest circumference 2 / Height at withersa,b different (P<0.05)
Parameter Males
(n = 11)
Females
(n = 36) RSD
Height at withers cm 137.0 b 131.6 a 3.5
Chest circumference cm 155.6 151.3 8.6
Cannon circumference cm 18.4 b 16.7 a 1.0
Dactylo-thoracic index (*) 11.9 b 11.0 a 0.6
Anamorphosis index (**) 177.3 174.2 17.3

137
Ann. Fac. Medic. Vet. di Parma (Vol. XXV, 2005) - pag. 131 - pag. 144
Table 3 – Coat color frequencies in Romagnolo donkeys population.
Provinces
Forlì-
Cesena-
Rimini
Ravenna Bologna Reggio
Emilia Overall
Gery-dun 64.7 83.3 90.9 70.6 74.9
Bay 5.9 11.1 0 0 3.8
Unknown 29.4 5.6 9.1 29.4 21.3
Table 4 – Population parameters in Romagnolo donkey.
n Mean (± SD) range
Whole population 92 0.001±0.007 0-0.062
Living males 17 0.000±0.000 0-0
Living females 63 0.001±0.008 0-0.062
Living population 80 0-0.062
Relationship between living
males and females 1071 0.014±0.070 0-0.5
0.001±0.007

138
Ann. Fac. Medic. Vet. di Parma (Vol. XXV, 2005) - pag. 131 - pag. 144

139
Ann. Fac. Medic. Vet. di Parma (Vol. XXV, 2005) - pag. 131 - pag. 144
RISULTATI PRELIMINARI SUI CARATTERI MORFOLOGICI E DEMOGRAFICI
DELLʼASINO ROMAGNOLO(1)
Beretti V., Zanon A., Soffi antini C.S., Sabbioni A.(2)
Parole chiave: Asino Romagnolo, morfologia, misure somatiche, consanguineità.
Key words: Romagnolo donkey, morphology, body measures, inbreeding.
INTRODUZIONE
L allevamento asinino era in passato diffuso e fi orente in Italia. Un censimento svolto nel 1918 contava ben 949.162 capi, posizionando lʼItalia al secondo posto dopo la sola Spagna in tutta lʼEuropa occidentale. La progressiva meccanizzazione che ha interessato lʼattività agricola, lo spopolamento delle zone rurali e la conseguente riduzione della richiesta di asini e muli da lavoro, hanno determinato un declino progressivo della consistenza di tali animali a partire dal secondo dopoguerra, con una forte accentuazione del fenomeno dagli anni ʻ70 in poi. Il V censimento dellʼAgricoltura (ISTAT, 2006) riporta per lʼanno 2000 in Italia una popolazione asinina di 19325 capi.
Le razze asinine riconosciute uffi cialmente nel nostro Paese sono oggi rappresentate dallʼasino dellʼAmiata, dellʼAsinara, di Martina Franca, Ragusano e Sardo. Molte altre razze e popolazioni locali sono tuttavia presenti sul territorio nazionale, quali il Grigio Siciliano, lʼasino di Pantelleria ed il Romagnolo.
Dal punto di vista fi logenetico le razze asinine Italiane erano in origine fondamentalmente quattro: Pugliese, Siciliana, di Pantelleria e Sarda (Marchi et al., 1925). In seno a queste era poi possibile riconoscere alcune sottorazze o popolazioni locali; così era facile identifi care in seno alla razza Siciliana due tipi, uno con diffusione nella zona occidentale ed uno in quella orientale dellʼisola. La razza Pugliese, considerata quella con la maggior diffusione sul territorio nazionale, comprendeva le sottorazze Calabrese, di Basilicata, Leccese, di Martina Franca, Marchigiana ed infi ne Romagnola. L asino Romagnolo sarebbe quindi un prodotto della selezione dallʼasino Pugliese.
Dai dati rilevati nellʼElenco Generale dei Cavalli e Asini Stalloni del Regio Deposito Stalloni di Reggio Emilia nel 1941 erano iscritti alla monta per le Regioni Emilia Romagna e Marche 46 stalloni di Razza asinina Romagnola. In seguito si ha
1 Ricerche condotte con fondi FIL – Università di Parma.2 Dipartimento di. Produzioni Animali, Biotecnologie Veterinarie, Qualità e Sicurezza degli Alimenti, Sezione di Scienze Zootecniche e Qualità delle Produzioni Animali. Indirizzo per corrispondenza: [email protected]

140
Ann. Fac. Medic. Vet. di Parma (Vol. XXV, 2005) - pag. 131 - pag. 144
notizia dellʼutilizzo di stalloni Romagnoli nelle zone montane dellʼAppennino Tosco-Emiliano, tanto che sembra appurato che la razza dellʼAmiata, di formazione più recente, sia in parte derivata dallʼasino Romagnolo (A.A.V.V.,1952; Arzilli, 2002).
Lʼelenco stalloni redatto nellʼanno 1978 ad opera del Ministero dellʼAgricoltura e Foreste non rilevava ormai alcuno stallone Romagnolo iscritto alla monta pubblica. Dal 1996 lʼAssociazione Provinciale Allevatori di Forlì-Cesena-Rimini, ha favorito il recupero della razza ed ha avviato un progetto di costituzione di Registro Anagrafi co, che ha già ricevuto un parere positivo da parte della Commissione Tecnica Centrale nellʼanno appena trascorso. Meno di un centinaio sono gli esemplari attualmente registrati, distribuiti in allevamenti delle province di Forlì-Cesena, Rimini, Ravenna, Bologna e Reggio Emilia e controllati dalle relative APA. Gli animali fondatori derivano per lo più da nuclei mantenuti da pastori transumanti che utilizzavano gli asini per il trasporto degli agnelli lattanti al seguito dei greggi. Si tratta quindi attualmente di una popolazione “reliquia” a forte rischio di estinzione, considerata dalla FAO come critica (http://dad.fao.org/en/Home.htm).
Viene qui riportato uno Standard sintetico di razza dellʼasino Romagnolo:1. TIPO - costituzione robusta e diametri proporzionati a un buon sviluppo
generale. Grande portamento e distinzione.2. ALTEZZA – Sopra la media, - Maschi: Statura da 135 a 145 cm; Femmine:
Statura da 132 a 140 cm.3. MANTELLO – grigio sorcino, baio scuro (descritti anche il baio e il
morello). Pelo corto e liscio.4. TEMPERAMENTO - Carattere vivace, volenteroso e affi dabile.5. ANDATURE - possiede un trotto vivace e sostenuto che mantiene per
lunghe distanze. 6. ATTITUDINE – Potente nel traino e tiro leggero.7. TESTA – ben proporzionata di media lunghezza con profi lo rettilineo
tendente al concavilineo, ben portata e distinta, fronte larga, narici piccole e asciutte. Occhi grandi a fi or di testa con arcate orbitali prominenti. Orecchie diritte e frangiate di moderata lunghezza.
8. COLLO – di media lunghezza, la giunzione tra la testa e il collo è armoniosa, il collo è profondo alla base e ben inserito tra le spalle, originando dal garrese.
9. GARRESE – Ben defi nito e lungo, con una passaggio graduale da collo a dorso. Sempre più alto della groppa.
10. TORACE - Petto ampio e profondo, torace molto sviluppato.11. COSTATO – Ben sviluppato, lungo e profondo con costole oblique
arquate in prossimità della colonna vertebrale, in modo di avere fi anchi corti e forti. 12. SPALLE – Lunghe, defi nite e ben muscolose.13. DORSO – Ben defi nito e tendente allʼorizzontale con un graduale
passaggio tra garrese e lombi.14. LOMBI – Corti, ampi, muscolosi, leggermente convessi, ben connessi
con il dorso e la groppa a formare una linea continua e armoniosa.15. GROPPA – Forte e arrotondata, ben bilanciata, leggermente inclinata; il
profi lo è convesso ed armonioso.

141
Ann. Fac. Medic. Vet. di Parma (Vol. XXV, 2005) - pag. 131 - pag. 144
16. CODA.-. Emerge dalla linea della groppa ed è attaccata alta, con lunghi, setosi ed abbondanti crini.
17. ARTI - Arti proporzionati senza essere troppo aperti, di media lunghezza, zoccoli solidi e ben conformati.
Scopo del presente lavoro, che si inserisce in un fi lone di ricerca relativo allo studio delle razze autoctone della Regione Emilia-Romagna (Sabbioni et al., 2005), è quello di descrivere le caratteristiche morfologiche degli animali attualmente inquadrati nel Registro Anagrafi co e di analizzarne i principali parametri demografi ci.
MATERIALI E METODI
Sono stati utilizzati le misure somatiche e i dati anagrafi ci contenuti nelle schede individuali, fornite dalle Associazioni Provinciali Allevatori di Forlì-Cesena-Rimini, Ravenna, Bologna e Reggio Emilia, dellʼintera popolazione di asino Romagnolo; il dataset completo consisteva di 92 animali, di cui 22 maschi e 70 femmine.
I dati riguardanti le misure somatiche (altezza al garrese, circonferenza toracica e circonferenza dello stinco), dai quali sono stati poi calcolati lʼindice di anamorfosi (circonferenza toracica2/altezza al garrese) e lʼindice dattilo-toracico (circonferenza dello stinco * 100/circonferenza toracica), sono stati sottoposti ad analisi della varianza secondo un modello che prevedeva come fattori fi ssi lʼetà, il sesso, e la provincia di allevamento (SAS, 2002-2003). È anche stato preso in esame il colore del mantello dei soggetti, ove riportato sulle schede individuali.
I dati genealogici sono stati analizzati con il programma Minbreed v.1.0 (Gandini e De Filippi, 1998), per ottenere i principali parametri relativi alla consanguineità e al numero di fondatori equivalenti ed assoluti (f
e e f
t). Sono stati
quindi calcolati la numerosità effettiva della popolazione, utilizzando la formula di Falconer e McKay (1996) [N
e = 4*M*F/(M+F), in cui M e F sono i maschi e
le femmine viventi e M<F], e la variazione della consanguineità per generazione (∆F=1/2N
e) e per anno (∆F
annuo=∆F/L, ove L=intervallo di generazione) (Pagnacco,
2004).
RISULTATI E DISCUSSIONE
Nella tabella 1 sono riportate le medie (± DS) delle misure lineari e degli indici morfologici di tutta la popolazione. Come è possibile rilevare, i dati sono caratterizzati da una certa variabilità, che non permette di trarre considerazioni utili circa la morfologia degli animali. Più interessante al riguardo è la tabella 2, che mette in evidenza le misure somatiche e gli indici morfologici nei soggetti adulti (età ≥ 3 anni; 47 soggetti di cui 11 maschi e 36 femmine). Per quanto riguarda lʼaltezza al garrese, la circonferenza dello stinco, e lʼindice dattilo-toracico sono state riscontrate differenze signifi cative fra maschi e femmine (P<0,05). Rispetto allʼasino dellʼAmiata

142
Ann. Fac. Medic. Vet. di Parma (Vol. XXV, 2005) - pag. 131 - pag. 144
(Orlandi et al, 1997), lʼasino Romagnolo presenta unʼaltezza al garrese lievemente superiore, sia nei maschi (cm 137 vs 135,5), che nelle femmine (cm 131,6 vs 130,0) e valori leggermente inferiori per lʼindice dattilo-toracico, sia nei maschi (11,9 vs 12,0) che nelle femmine (11,0 vs 11,6), denotando, quindi, accanto ad una maggior statura, una struttura scheletrica più leggera. Ciò è in accordo con la letteratura relativa allʼorigine delle due razze asinine. Secondo alcuni autori (A.A.V.V.,1952; Arzilli, 2002), infatti, lʼasino dellʼAmiata deriva dallʼasino Romagnolo a seguito di incroci con soggetti locali, caratterizzati da una mole inferiore, in considerazione delle caratteristiche dellʼambiente di allevamento.
Per quanto riguarda il colore del mantello, i dati ottenuti dalle schede morfologiche dei soggetti sono stati raccolti ed elaborati ed i risultati sono riportati in tabella 3. È stato possibile mettere in evidenza che circa il 75% dei soggetti iscritti ha il mantello sorcino che è tipico della razza, e il 4% dei soggetti ha il mantello baio; tuttavia, più del 20% dei soggetti non ha la registrazione di questo carattere.
La profondità del pedigree è risultata pari a 5 generazioni, con un intervallo medio di generazione di 4,8 anni. La numerosità effettiva della popolazione (N
e), è
stata calcolata pari a 53,55, con un rapporto Ne/N di 0,669. Il ∆F è quindi risultato
di 0,934% (∆Fannuo
= 0,19%), La tabella 4 riporta i valori medi di consanguineità (± DS) calcolati sullʼintero pedigree, oppure solo su maschi e femmine viventi, nonché i relativi range. I valori risultano in assoluto molto bassi, specialmente se confrontati con quelli derivanti da ricerche analoghe effettuate su altre razze asinine (Gutièrrez et al., 2005), probabilmente a causa della ridotta numerosità dei soggetti monitorati e della mancanza di alcune registrazioni genealogiche.
Il coeffi ciente di parentela medio di maschi e femmine viventi (80 soggetti di cui 17 maschi e 63 femmine), calcolato tenendo conto di tutte le possibili combinazioni, è risultato pari allʼ1,4%; in teoria, quindi, nella prossima generazione, se gli accoppiamenti fossero casuali, il coeffi ciente di consanguineità medio atteso sarebbe dello 0,7%, lievemente inferiore a quello calcolato a partire dalla numerosità effettiva, e di molto superiore a quello attuale della popolazione vivente che si attesta sullo 0,1%. Tale differenza trova la sua giustifi cazione nel numero di maschi, che teoricamente sarebbe corretto, ma che nella realtà risulta sovrastimato, dal momento che solo pochi sono usati per la riproduzione: ciò favorisce un forte aumento di consanguineità da una generazione allʼaltra. Il valore riscontrato risulta invece inferiore se lo si paragona a quello di altre popolazioni asinine (Gutierrez et al., 2005); nellʼasino Catalano la popolazione vivente presenta un coeffi ciente di consanguineità medio del 4,71%, con una numerosità pari a 336 soggetti.
Nellʼasino romagnolo il numero di fondatori equivalenti (fe) è stato pari a
17,9, e il numero di fondatori assoluti (ft) è risultato di 28, con un rapporto f
e/f
t =
0,6389: il valore inferiore a 1 può signifi care che il contributo dei fondatori allʼattuale popolazione non è stato bilanciato, avendo alcuni di essi contribuito in maniera molto piccola o in alcuni casi per niente.

143
Ann. Fac. Medic. Vet. di Parma (Vol. XXV, 2005) - pag. 131 - pag. 144
CONCLUSIONI
Nonostante la numerosità limitata non sembrano esistere attualmente problemi di consanguineità nellʼasino Romagnolo, anche se è presumibile che vista la ridotta numerosità della popolazione nel prossimo futuro si possano raggiungere livelli di parentela molto elevati fra i soggetti, ed è quindi indispensabile a livello locale pianifi care gli accoppiamenti ed incentivare lʼallevamento di soggetti di questa razza per scongiurare tale rischio.
Le misurazioni somatiche indicano che la popolazione attuale rientra negli standard di razza proposti, anche se è auspicabile un lieve aumento della statura senza spingere eccessivamente con la selezione per evitare di ridurre la numerosità effettiva della popolazione che è già molto esigua e che porterebbe inevitabilmente ad una perdita di variabilità genetica nella popolazione.
In futuro è auspicabile che le Associazioni Provinciali Allevatori armonizzino le metodiche di misurazione e le schede di valutazione degli animali e che venga effettuata una rigorosa certifi cazione degli accoppiamenti al fi ne di avere pedigree completi su cui poter effettuare un utile monitoraggio dei parametri genetici della popolazione di questa importante razza asinina autoctona.
BIBLIOGRAFIA
A.A.V.V. (1952) Enciclopedia Agraria Italiana. Ed. R.E.D.A., Roma, ItalyA.A.V.V. (1960) Enciclopedia dellʼAgricoltura. Ed. UTET., Torino, ItalyARZILLI L. (2002) Risorse genetiche animali autoctone della Toscana Ed. A.R.S.I.A.
Firenze ItalyFALCONER D.S., McKAY T.F.C. (1996) Introduction to quatitative genetics, 4th Ed.,
Longman S&T, Harlow, UK.GANDINI G., De FILIPPI P. (1998) Proc. VI Congr. Genetics Applied to Livestock
Prod.GUTIERREZ J. P., MARMI J., GOUACHE F., JORDANA. J. (2005) Pedigree
information reveals moderate to high levels of inbreeding and a weak population structure in the endangered Catalonian donkey breed. J. Anim. Breed. Genet. 122, 378-386.
LACY R.C. 1989. Analysis of founder representation in Pedigrees. Zoo Biology, 8, 111-123.
MARCHI E., MASCHERONI E., (1925) Zootecnia Speciale Ed. UTET, Torino, Italy
ORLANDI M., BERNI P., BENEDETTI R., CURADI M.C. (1997a) Indici Morfologici nellʼasino Amiatino Ann. Facol. Med. Vet. di Pisa 50, 39-46.
ORLANDI M., CURADI M.C., LEOTTA R., IMPEDUGLIA R., BENEDETTI R. (1997b) Morpho-physiological characterization of Amiatan donkey. Proc. 48th EAAP Congr., 392.
PAGNACCO G. (2004) Genetica Animale Applicata, Ed. CEA, Milano.SABBIONI A., BERETTI V., ZANON A., PAGANI G.P., SUPERCHI P., BONOMI
A., FILIPPINI S., CATALANO A.L. 2005 Demographic Characterization and

144
Ann. Fac. Medic. Vet. di Parma (Vol. XXV, 2005) - pag. 131 - pag. 144
genetic variability of Bardigiano horse breed from genealogical data. Proc. 59th SISVET Congr. 451-452.
SAS (2002-2003) SAS Userʼs Guide ver. 9.1, Statistical Analysis System, SAS Institute Inc., Cary, NC, USA.
RIASSUNTO – Gli Autori espongono i risultati di unʼindagine condotta al fi ne di valutare la morfologia ed i caratteri demografi ci dellʼAsino Romagnolo attraverso lʼimpiego delle informazioni contenute nelle schede individuali fornite dalle Associazioni Allevatori. Sono stati presi in considerazione le misure lineari e gli indici morfologici di tutta la popolazione (92 animali, di cui 22 maschi e 70 femmine), nonché i dati genealogici. I dati morfologici manifestano una certa variabilità; per quanto riguarda lʼaltezza al garrese, la circonferenza dello stinco e lʼindice dattilo-toracico sono state riscontrate differenze signifi cative fra maschi e femmine (P<0,05). Il coeffi ciente di consanguineità medio della popolazione vivente è pari allo 0,1% (range 0-6,2%); il coeffi ciente di parentela medio di maschi e femmine viventi è risultato pari allʼ1,4%, il numero di fondatori equivalenti (f
e) è stato pari a 17,9, e il
numero di fondatori assoluti (ft) è risultato di 28, con un rapporto f
e/f
t = 0,6389.
Summary - Preliminary results about morphological and demographic traits of Romagnolo donkey.
The Authors refer the results of a study about the morphological and demographic traits of Romagnolo donkey by means of the analysis of individual cards supplied by Breeders Organization. Body measurements and morphological indexes of the whole population (92 donkeys, 22 males and 70 females) were considered, beside genealogical data. Body measures are rather variable; height at withers, cannon circumference and dactylo-thoracic index are higher in males than in females (P<0.05). Mean inbreeding coeffi cient in living population was 0.1% (range 0-6.2%); mean relatedness between living males and females was 1.4%; number of equivalent founders (f
e) was 17.9, number of absolute founders (f
t) was 28 and f
e/f
t ratio was
0.6389.

145
Ann. Fac. Medic. Vet. di Parma (Vol. XXV, 2005) - pag. 145 - pag. 166
SEASONAL VARIATIONS OF HERD MILK QUALITY IN PARMIGIANO-REGGIANO CHEESE MANUFACTURE:
COMPARISON BETWEEN JERSEY AND ITALIAN FRIESIAN CATTLE BREEDS
Malacarne M., Summer A., Formaggioni P., Franceschi P.,Beltrami A.1, Mariani P.
Dipartimento di Produzioni Animali, Biotecnologie Veterinarie,Qualità e Sicurezza degli Alimenti - Sezione di Scienze Zootecniche e Qualità degli Alimenti.
Università degli Studi di Parma. Via del Taglio 8, 43100 Parma.
Key words: milk quality, season, Parmigiano-Reggiano, Jersey, Italian Friesian
INTRODUCTION
Seasons could have a role in the variations of the organic and inorganic constituents of milk. These modifi cations can infl uence its processing properties, with signifi cant repercussions on the quality of cheese. The effect of “season”, in the wider sense, is the result of the interaction of physiological, climatic and feeding factors that act and interact with variable intensity throughout the year. The variations of milk quality parameters in Parmigiano-Reggiano cheese production area throughout the year have been the object of several papers (Sandri et al. 2001; Malacarne et al. 2003; Malacarne et al., 2004; Gobbi, 2005). Malacarne et al. (2003) and Sandri et al. (2001) studied the variation of milk quality parameters in about 83,000 herd milk samples collected during 10 years (from 1991 to 2000). Malacarne et al. (2004) analysed milk quality in 583 Italian Friesian herd milk samples collected during one year. Gobbi (2005) analysed monthly variations of milk quality parameters in 64,215 herd milk samples collected during the years 2002, 2003 and 2004.
The total number of dairy cows in the Parmigiano-Reggiano district is 336,000, representing about 15% of the entire italian dairy cattle population. Currently, Italian Friesian cows make up 85% of the cows in the Parmigiano-Reggiano area. Due to EU restrictions on milk production (milk “quotas”) and the introduction of a milk quality payment system for Parmigiano-Reggiano cheese, there is new interest in cattle breeds that produce milk of high quality, particularly in terms of cheese yield. In this regard, it would be interesting to study the cheesemaking features of milk from Jersey cows, whose milk is characterised by elevated contents of protein and fat. From 1994 to 2003 the number of Jersey cows in Italy increase from 2257 (170 herds) to 5870
1Medico Veterinario libero professionista.

146
Ann. Fac. Medic. Vet. di Parma (Vol. XXV, 2005) - pag. 145 - pag. 166
(560 herds) (AIA, 2003). The national Herd Book of the Jersey breed was constituted in 1999 and a genetic index was introduced to improve milk production and quality (http://www.anafi .it/Jersey/). Recently, about 500 cows of this breed were introduced into a dairy herd in the Parmigiano-Reggiano cheese production area.
The aim of this research was to investigate seasonal variations of milk production and quality of Jersey cows and to compare its traits with those observed for milk of Italian Friesian cows.
MATERIALS AND METHODS
Four dairy cattle herds, located in the province of Reggio Emilia, were involved in the research: one herd of Jersey cows (yearly average number of lactating cows 348±19) and 3 herds of Italian Friesian cows (193±35; 369±14; 144±11). The milk from the 4 herds was destined to Parmigiano-Reggiano cheesemaking.
Management (housing, milking interval) and feeding (TMR, fodder, concentrates) practices were similar in the four herds. Cows were fed according to their milk production level and to the feeding regulation for dairy cows that produce milk destined for Parmigiano-Reggiano cheesemaking (http://www.parmigiano-reggiano.it/ilconsorzio-regolamento_alimentazione_bovine.cfm).
During the year 2003, herd milk production and the corresponding number of lactating cows were recorded daily in each dairy herd; from this data, the average daily cow milk production was calculated for each herd.
Milk quality parameters were recorded, almost daily throughout the year 2003, in each dairy herd on bulk milk samples, both from the evening and morning milking. The following analyses were carried out on milk samples:
- Titratable acidity (Anon., 1963); fat and protein with lectures in the mean IR (Biggs, 1978) by Milko-Scan; urea with enzymatic reaction catalysed by urease (Pecorari et al., 1975) by means of Bun-analyzer; somatic cell with the fl uoro-opto-electric method (Schmidt-Madsen, 1975) by Fossomatic 250. Somatic cell values were transformed in Somatic Cell Score (SCS) according to the following equation: Somatic Cell Score = log
2 (SCC/100,000) + 3
Statistical signifi cance of the effect of breed, season, and milking period on milk production and milk quality parameters were calculated by means of ANOVA univariate using the software SPSS 13.0 (SPSS, Chicago, Illinois, USA), according to the following model:
yijkl
= μ + Bi + S
j + M
k + (BS)
ij + (BM)
ik + (MS)
kj + (BMS)
ijk + e
ijkl
yijkl
= dependent variable; μ = overall mean; Bi = effect of breed (i = 1 Jersey,
2 Italian Friesian); Sj = effect of season (j = 1 winter; 2 spring; 3 summer; 4 autumn);
Mk = milk sample type (k = 1 sample from the evening milking, 2 sample from the
morning milking); eijkl
= residual error.When the values of daily cow milk production and daily number of lactating
cows were submitted to statistical analysis, the effect of “milk sample type” was eliminated from the model.

147
Ann. Fac. Medic. Vet. di Parma (Vol. XXV, 2005) - pag. 145 - pag. 166
To evaluate differences in seasonal trends among herds, apart from the breed, on milk production and milk quality parameters the following model was used:
yijk
= μ + Hi + S
j + (HS)
ij + e
ijk
yijk
= dependent variable; μ = overall mean Hi = effect of herd (i = 1 Jersey
herd, 2 Italian Friesian herd n. 1, 3 Italian Friesian herd n. 2, 4 Italian Friesian herd n. 3); S
j = effect of season (j = 1 winter; 2 spring; 3 summer; 4 autumn); e
ijk = residual
error.
RESULTS
Means and variability of data collected according to breed are reported in table 1. Jersey values were referred to one dairy herd; Italian Friesian values were referred to 3 different herds. The variability of milk quality parameters was similar for the two breeds. The variability of fat content was higher than casein content and titratable acidity value. Milk urea content had shown the highest variability. The somatic cell score resulted rather variable, particularly in Italian Friesian breed.
The results of ANOVA were reported in table 2. The variations of all milk quality parameters resulted signifi cantly infl uenced by the effect of breed (Jersey vs Italian Friesian) and season (winter vs spring vs summer vs autumn). Titratable acidity, fat content and urea content were signifi cantly different between the evening milking and the morning milking. Except for casein content, seasonal variations of all parameters resulted different between the breeds, as indicated by the P values of the effect “Breed x Season”. In relation to the aims of this research, it is interesting to note the signifi cance of the effect of interaction of the three factors considered – breed, season, sample type – on the contents of fat and casein. This means that seasonal variations of these two parameters, between evening and morning milking, were different in the two breeds.
Seasonal variations of milk quality and production: effect of the breed Seasonal values of milk production and milk quality parameters, according
to breed, are reported in table 3. Milk production – Yearly mean value of milk production of Jersey cows was
on average 25% lower than Italian Friesian. Also seasonal values of milk production of Jersey cows were always lower with respect to Italian Friesian cows: the difference ranged from a minimum of –23% in summer to a maximum of –29% in autumn.
Seasonal variations of milk production were statistically different between breeds (P<0.01; data not shown). Jersey milk production increased (+8.8%) from winter to spring (20.5 winter vs 22.3 spring; kg/cow). Summer value (22.1 kg/cow) was similar to the spring one. A decrease of milk production (-5.0%), with respect to summer, was recorded in autumn, and the value observed (21.0 kg/cow) was slightly higher than the winter one. As observed for Jersey herd, milk production of Italian Friesian cows increased from winter (28.1) to spring (28.9). However, in this case, the “relative” increase (+2.8%) was clearly lower than that observed for Jersey cows. In summer, Italian Friesian milk production (28.7 kg/cow) was slightly lower than

148
Ann. Fac. Medic. Vet. di Parma (Vol. XXV, 2005) - pag. 145 - pag. 166
Jers
ey
Jers
ey
Itali
an F
ries
ian
Fri
son
a I
tali
an
a
no
.M
ean
Med
ia
SD
DS
CV
(%)
Min
.M
ax.
no
.M
ean
Med
ia
SD
DS
CV
(%)
Min
.M
ax.
Lac
tati
ng
co
ws
Va
cch
e in
la
tta
zio
ne
33
46
62
06
43
76
23
89
74
11
25
39
6
Dai
ly m
ilk
pro
du
ctio
n (
kg
/co
w)
Pro
d. g
iorn
ali
era
la
tte (
kg/v
acca
)
38
52
1.4
41
.30
6.0
51
6.0
92
3.0
91
09
52
8.7
91
.68
5.8
22
2.0
93
2.2
5
Tit
rata
ble
acid
ity
(°S
H/5
0 m
L)
26
33
.89
0.1
33
.34
3.4
04
.50
79
63
.34
0.1
13
.29
2.8
03
.80
Fat
(g
/10
0g
)
Gra
sso
54
34
.52
0.2
96
.42
1.8
45
.69
16
35
3.3
00
.29
8.7
92
.25
Cas
ein
1 (
g/1
00
g)
Ca
sein
a1
54
33
.04
0.1
23
.95
2.7
53
.28
16
35
2.6
20
.13
4.9
62
.23
3.5
4
Ure
a (m
g/1
00
mL
) 2
35
26
.93
2.5
19
.32
18
.00
33
.00
6
99
26
.73
3.2
41
2.1
23
.00
38
.00
SC
S2
52
73
.90
.37
.42
.52
.5
16
18
3.8
0.6
15
.21
.15
.11 I
R p
rote
in x
0.7
7;
Pro
tein
a I
R x
0,7
72 S
om
atic
Cell
Sco
re =
lo
g2 (
SC
C/1
00
,00
0)
+ 3
; P
un
teg
gio
lin
eare
del
le c
ellu
le s
om
ati
che
= l
og
2 (
no
. ce
llu
le i
n m
igli
aia
/10
0)
+ 3
4.2
0
Aci
dit
à t
ito
lab
ile
Tabl
e 1
– D
escr
iptiv
e ch
arac
teri
stic
s of
the
data
base
ana
lyse
d.Ta
bella
1 –
Car
atte
rist
iche
des
crit
tive
del
cam
pion
e an
aliz
zato
.

149
Ann. Fac. Medic. Vet. di Parma (Vol. XXV, 2005) - pag. 145 - pag. 166
Tabl
e 2
– A
naly
sis
of v
aria
nce.
Tabe
lla 2
– A
nali
si d
ella
var
ianz
a.
So
urc
e o
f v
aria
tio
n,
Fo
nte
di
vari
azi
on
e
B1
S2
M3
Bx
S
Bx
M
Sx
M
Bx
Sx
M
Deg
ree o
f fr
eed
om
Gra
di
di
lib
ertà
13
13
13
3
Tit
rata
ble
acid
ity
(°S
H/5
0 m
L)
Acid
ità
tit
ola
bil
e
**
**
**
**
**
NS
NS
Fat
(g
/10
0g
)
Gra
sso
**
**
**
**
**
**
**
Cas
ein
4 (
g/1
00
g)
Ca
sein
a4
**
**
NS
NS
**
NS
*
Ure
a (m
g/1
00
mL
)
*
*
**
*
*
**
N
S
NS
N
S
SC
S5
**
*
*
NS
*
*
**
N
S
NS
1 B
= e
ffec
t o
f b
reed
; B
= e
ffett
o d
ell
a r
azz
a2 S
= e
ffect
of
seas
on
; S
= e
ffet
to d
ella
sta
gio
ne
3 ma
ttin
a4
IR p
rote
in x
0.7
7;
Pro
tein
a I
R x
0,7
75
22
mig
lia
ia/1
00
) +
3
NS
, P
>0
.05
; *
, P
<0
.05
; *
*,
P<
0.0
1;
NS
, P
>0
,05
; *
, P
<0
,05
; *
*,
P<
0,0
1;
M =
eff
ect
of
mil
k s
amp
le t
yp
e: e
ven
ing
mil
k v
s m
orn
ing
mil
k;
M =
eff
etto
del
tip
o d
i ca
mp
ion
e: l
att
e se
ra v
s la
tte
So
mat
ic C
ell
Sco
re =
lo
g (
SC
C/1
00
,00
0)
+ 3
; P
un
teg
gio
lin
eare
del
le c
ellu
le s
om
ati
che =
lo
g (
no
. cel
lule
in

150
Ann. Fac. Medic. Vet. di Parma (Vol. XXV, 2005) - pag. 145 - pag. 166
Win
ter
In
ver
no
Sp
rin
g
Pri
ma
vera
S
um
mer
E
sta
te
A
utu
mn
A
utu
nn
o
O
ver
all
G
ener
ale
JIF
J
IF
J IF
J
IF
J IF
Dai
ly m
ilk
pro
du
ctio
n (
kg
/co
w)
Pro
d. g
iorn
ali
era
la
tte (
kg/v
acca
)
20
.5
28
.1
22
.3
28
.9
22
.1
28
.7
21
.0
29
.4
21
.5
28
.8
SE
, E
S0
.2
0.1
0
.2
0.1
0
.2
0.1
0
.1
0.1
0
.1
0.1
La
cta
tin
g c
ow
s -
Va
cch
e in
la
tta
zio
ne
33
9
23
8
35
5
24
2
35
8
23
3
29
1
23
7
33
6
23
8
SE
, E
S9
5
9
5
9
5
8
5
5
3
Tit
rata
ble
acid
ity
– A
c. T
it.
(°S
H/5
0m
L)
3
.84
3
.37
3
.87
3
.31
3
.89
3
.31
3
.99
3
.36
3
.90
3
.34
SE
, E
S0
.01
0
.01
0
.01
0
.01
0
.01
0
.01
0
.01
0
.01
0
.01
0
.01
74
2
19
6
4
19
5
71
2
20
5
4
16
2
26
3
79
6
Fat
– G
rass
o (g
/10
0g
) 4
.83
3
.40
4
.23
3
.18
4
.18
3
.21
4
.90
3
.41
4
.53
3
,30
SE
, E
S0
.02
0
.01
0
.02
0
.01
0
.02
0
.01
0
.02
0
.01
0
.01
0
.01
14
4
42
9
13
1
39
8
14
8
44
7
12
0
36
1
54
3
16
35
Cas
ein
1 –
Ca
sein
a1 (
g/1
00
g)
3.1
2
2.7
0
2.9
5
2.5
4
2.9
5
2.5
2
3.1
7
2.7
4
3.0
5
2,6
2
SE
, E
S0
.01
0
.00
0
.01
0
.00
0
.01
0
.00
0
.01
0
.00
0
.00
3
0.0
02
14
4
42
9
13
1
39
8
14
8
44
7
12
0
36
1
54
3
16
35
Ure
a (m
g/1
00
mL
)
27
.38
2
8.0
4
26
.91
2
8.3
8
25
.50
2
4.0
9
29
.01
2
5.5
5
27
.2
26
,52
SE
, E
S0
.31
0
.18
0
.31
0
.17
0
.32
0
.19
0
.46
0
.27
0
.18
0
.1
68
1
99
7
0
21
6
66
1
91
3
1
93
2
35
6
99
SC
S2
3.9
6
3.9
2
3.9
4
3.6
4
3.9
3
3.8
4
3.8
5
3.5
7
3.9
2
3,7
4
SE
, E
S0
.04
0
.02
0
.04
0
.02
0
.04
0
.02
0
.05
0
.03
0
.02
0
.01
14
2
42
3
13
5
41
0
14
8
44
7
10
2
33
8
52
7
16
18
1IR
pro
tein
x 0
.77
; P
rote
ina
IR
x 0
,77
2S
om
atic
Cel
l S
core
= l
og
2 (
SC
C/1
00
,00
0)
+ 3
; P
un
teg
gio
lin
eare
del
le c
ellu
le s
om
ati
che
= l
og
2 (
no
. ce
llu
le i
n m
igli
aia
/10
0)
+ 3
no
. o
f sa
mp
les,
n. d
i ca
mp
ion
i
no
. o
f sa
mp
les,
n. d
i ca
mp
ion
i
no
. o
f sa
mp
les,
n. d
i ca
mp
ion
i
no
. o
f sa
mp
les,
n. d
i ca
mp
ion
i
no
. o
f sa
mp
les,
n. d
i ca
mp
ion
i
Tabl
e 3
– Se
ason
al v
aria
tions
of
milk
pro
duct
ion
and
qual
ity in
Jer
sey
(J)
and
Ital
ian
Frie
sian
(IF
) he
rds.
Tabe
lla 3
– V
aria
zion
i st
agio
nali
del
la p
rodu
zion
e di
lat
te e
dei
par
amet
ri q
uali
tati
vi i
n al
leva
men
ti d
i va
cche
di
razz
a Je
rsey
e i
n al
leva
men
ti d
i vac
che
di r
azza
Fri
sona
Ita
lian
a.

151
Ann. Fac. Medic. Vet. di Parma (Vol. XXV, 2005) - pag. 145 - pag. 166
spring value. While a decrease of milk production was observed in Jersey cows from summer to autumn, Italian Friesian cows showed an increase (+2.4%) in the same period and the value reached in autumn (29.4 kg/cow) was the highest seasonal value recorded.
Titratable acidity – Yearly mean value of titratable acidity of Jersey milk was higher (+17%) than that of Italian Friesian milk. All seasonal values of Jersey milk resulted higher than Italian Friesian milk. The difference of milk titratable acidity seasonal values between the two breeds increased throughout the year (from 13.9% in winter to 18.6% in autumn), particularly from winter (+13.9%) to spring (+17.1%).
Seasonal trends of milk titratable acidity differed signifi cantly between the two breeds (see effect BxS, table 2; P<0.01). Jersey milk value of titratable acidity progressively increased from winter to summer (3.84 in winter, 3.87 in spring and 3.89 in summer; °SH/50mL). From summer to autumn a more accentuated increase was recorded (+2.6%). As far as Italian Friesian milk seasonal variations of titratable acidity are concerned, a decrease (-1.8%) was observed from winter (3.37 °SH/50mL) to spring (3.31 °SH/50mL). Summer value was equal to that recorded in spring. An increase (+1.5%) of titratable acidity value was observed in autumn and the value (3.36 °SH/50mL) was similar to winter one.
Fat content – Yearly mean value of fat content was higher in Jersey milk than in Italian Friesian (+37.2%; P<0.01). Throughout the seasons the difference between the two breeds, particularly high in winter (+42%) and in autumn (+44%), remain signifi cant in spring (+33%) and summer (+30%).
Seasonal trends of milk fat content were signifi cantly different between breeds (see effect BxS, table 2; P<0.01). From winter (4.83g/100g) to spring (4.23g), a marked decrease (-12.4%) of fat content was recorded in Jersey milk. The summer value (4.18g) was slightly lower than the spring one. In autumn, a marked increase of fat content (+17.2%) was observed in Jersey milk and the value recorded was the highest seasonal value, equal to 4.90g. As observed for Jersey milk seasonal trend, a marked decrease of milk fat was registered also in Italian Friesian milk from winter to spring. However, the entity of the difference was clearly lower (-6.8%) than that recorded in Jersey milk (-12.4%) in the same period. The summer value of fat content (3.21g) was slightly higher than the spring one. In autumn, as reported for Jersey, a marked increase (+6.23%) of milk fat content was observed also in Italian Friesian and the value (3.41) was similar to that recorded in winter.
Casein content – Yearly mean value of casein content (calculated as protein IR x 0.77) of Jersey milk was higher (+16.4%; P<0.01) than Italian Friesian milk. Also seasonal values of Jersey milk were always higher than Italian Friesian milk. The difference was quite similar in all seasons, ranging from +15% (winter) to +17% (summer).
Seasonal variations of milk casein were not different between breeds (see effect BxS, table 2; P>0.05). A marked decrease of milk casein content was observed from winter to spring in both cattle breeds: Jersey milk varies from 3.12 to 2.95g/100g, whereas Italian Friesian milk varies from 2.70g to 2.54g. In both breeds, summer values were similar to those observed in spring: 2.95g for Jersey and 2.52g for Italian

152
Ann. Fac. Medic. Vet. di Parma (Vol. XXV, 2005) - pag. 145 - pag. 166
Friesian. In autumn, an increase of milk casein content was observed in both breeds: 3.17g for Jersey and 2.74g for Italian Friesian.
Urea content – Yearly milk urea content resulted higher in Jersey milk than Italian Friesian milk: 27.20 vs 26.52 mg/100mL (P<0.01). However this was not true in all seasons; winter and spring values of urea content of Jersey milk resulted lower (-2.3% and -5.2%, respectively) than Italian Friesian milk, while, on the contrary, summer and autumn values were higher in Jersey milk: +5.8% and +13.5% respectively.
The urea content of the milk of the two breeds showed statistically different seasonal variations (see effect BxS, table 2; P<0.01). From winter to summer, a decrease (-6.9%) of milk urea content was recorded in Jersey breed: from 27.38mg to 25.50mg. The autumn value was clearly higher (+13.8%) than the summer one, reaching the highest seasonal value for Jersey milk equal to 29.01mg/100mL. A slight increase of milk urea content was recorded from winter to spring in Italian Friesian breed: from 28.04 to 28.38mg. The summer value (24.09mg) was clearly lower than the spring one (-15.1%). In autumn, an increase (+5.7%) of milk urea content was observed. The autumn value (25.55mg), however, was lower than winter and spring values.
Somatic cell score – Yearly value of somatic cell score resulted higher in Jersey milk than Italian Friesian one (+4.81%; P<0.01). Jersey milk seasonal values were higher in all seasons with respect to Italian Friesian milk and the difference varied from a minimum of 1.1% in winter to a maximum of 8.3% in spring. Summer and autumn difference were equal to 2.3% and 7.6%, respectively
Seasonal variations of SCS resulted signifi cantly different between the two breeds (see effect BxS, table 2; P<0.01). SCS values of Jersey milk resulted almost unvaried from winter to summer (3.96 in winter, 3.94 in spring, 3.93 in summer). Autumn value of SCS was clearly lower than summer one (-2.0%), reaching the value of 3.85. Concerning Italian Friesian milk, SCS value decrease (-7.1%) from winter (3.92) to spring (3.64). In summer an increase (+5.5%) of SCS was recorded to a value of 3.84. From summer to autumn a decrease (-7.0%) of SCS was observed, reaching a value in autumn of 3.57.
Seasonal variations of milk quality and production: effect of the herdSeasonal variations of milk production and milk quality parameters among
dairy herds, apart from the breed reared, are illustrated in fi gures from 1 to 7. As far as milk production, titratable acidity, fat and casein contents, the
seasonal values of the Jersey dairy herd were quite different with respect to the 3 Italian Friesian herds. When urea and somatic cell score are concerned, the variations of seasonal values seem to be due to herd management rather than to the breed reared. In fact, fi gure 6 shows that seasonal values of milk urea content in the Jersey herd and in Italian Friesian herd number 2 (IF 2) resulted similar between them but different with respect to Italian Friesian herd number 1 (IF 1) and Italian Friesian herd number 3 (IF 3). Also the seasonal values of somatic cell score seems to be mainly infl uenced by herd management conditions rather than breed reared. Jersey seasonal values were higher than IF 1 and IF 2, but lower than IF 3 (Figure 7).

153
Ann. Fac. Medic. Vet. di Parma (Vol. XXV, 2005) - pag. 145 - pag. 166
Figure 1 – Seasonal trends of daily milk production of the herds studied: 1 dairy herd of Jersey cows (Jersey) and 3 dairy herds of Italian Friesian cows (IF 1, IF 2 and IF 3).Figura 1 – Variazioni stagionali della produzione giornaliera di latte negli allevamenti studiati: 1 allevamento di vacche di razza Jersey (Jersey) e 3 allevamenti di vacche di razza Frisona Italiana (IF 1, IF 2 e IF 3).
Figure 2 – Seasonal trends of lactating cows of the herds studied: 1 dairy herd of Jersey cows (Jersey) and 3 dairy herds of Italian Friesian cows (IF 1, IF 2 and IF 3).Figura 2 – Variazioni stagionali del numero di vacche in lattazione negli allevamenti studiati: 1 allevamento di vacche di razza Jersey (Jersey) e 3 allevamenti di vacche di razza Frisona Italiana (IF 1, IF 2 e IF 3).
17
22
27
32
Jersey
IF 1
IF 2
IF 3
Winter
Inverno
Spring
Primavera
Summer
Estate
Autumn
Autunno
17
22
27
32
Jersey
IF 1
IF 2
IF 3
Winter
Inverno
Spring
Primavera
Summer
Estate
Autumn
Autunno
kg/c
ow
kg/vacca
Winter
Inverno
Spring
Primavera
Summer
Estate
Autumn
Autunno
100
150
200
250
300
350
400
Jersey
IF 1
IF 2
IF 3
Winter
Inverno
Spring
Primavera
Summer
Estate
Autumn
Autunno
Va
cch
e in
la
tta
zio
ne
100
150
200
250
300
350
400
Jersey
IF 1
IF 2
IF 3
(n.)
Winter
Inverno
Spring
Primavera
Summer
Estate
Autumn
Autunno
100
150
200
250
300
350
400
Jersey
IF 1
IF 2
IF 3
Winter
Inverno
Spring
Primavera
Summer
Estate
Autumn
Autunno
100
150
200
250
300
350
400
Jersey
IF 1
IF 2
IF 3
La
cta
tin
gco
ws
(no.)

154
Ann. Fac. Medic. Vet. di Parma (Vol. XXV, 2005) - pag. 145 - pag. 166
Figure 3 – Seasonal trends of titratable acidity values of milk in the herds studied: 1 dairy herd of Jersey cows (Jersey) and 3 dairy herds of Italian Friesian cows (IF 1, IF 2 and IF 3).Figura 3 – Variazioni stagionali dellʼacidità titolabile del latte negli allevamenti studiati: 1 allevamento di vacche di razza Jersey (Jersey) e 3 allevamenti di vacche di razza Frisona Italiana (IF 1, IF 2 e IF 3).
Figure 4 – Seasonal trends of fat content of milk in the herds studied: 1 dairy herd of Jersey cows (Jersey) and 3 dairy herds of Italian Friesian cows (IF 1, IF 2 and IF 3).Figura 4 – Variazioni stagionali del contenuto di grasso del latte negli allevamenti studiati: 1 allevamento di vacche di razza Jersey (Jersey) e 3 allevamenti di vacche di razza Frisona Italiana (IF 1, IF 2 e IF 3).
WinterInverno
SpringPrimavera
SummerEstate
AutumnAutunno
°SH/50mL
3
3,2
3,4
3,6
3,8
4
4,2
Jersey
IF 1
IF 2
IF 3
WinterInverno
SpringPrimavera
SummerEstate
AutumnAutunno
3
3,2
3,4
3,6
3,8
4
4,2
Jersey
IF 1
IF 2
IF 3
Titratableacidity–Ac.titolabile
WinterInverno
SpringPrimavera
SummerEstate
AutumnAutunno
3
3,2
3,4
3,6
3,8
4
4,2
Jersey
IF 1
IF 2
IF 3
WinterInverno
SpringPrimavera
SummerEstate
AutumnAutunno
3
3,2
3,4
3,6
3,8
4
4,2
Jersey
IF 1
IF 2
IF 3
Winter
Inverno
Spring
Primavera
Summer
Estate
Autumn
Autunno
g/1
00g
2,9
3,4
3,9
4,4
4,9
Jersey
IF 1
IF 2
IF 3
Winter
Inverno
Spring
Primavera
Summer
Estate
Autumn
Autunno
g/1
00g
2,9
3,4
3,9
4,4
4,9
Jersey
IF 1
IF 2
IF 3Fa
t-Grasso
Winter
Inverno
Spring
Primavera
Summer
Estate
Autumn
Autunno
g/1
00g
2,9
3,4
3,9
4,4
4,9
Jersey
IF 1
IF 2
IF 3
Winter
Inverno
Spring
Primavera
Summer
Estate
Autumn
Autunno
g/1
00g
2,9
3,4
3,9
4,4
4,9
Jersey
IF 1
IF 2
IF 3Fa
t-Grasso

155
Ann. Fac. Medic. Vet. di Parma (Vol. XXV, 2005) - pag. 145 - pag. 166
Figure 5 – Seasonal trends of casein content of milk in the herds studied: 1 dairy herd of Jersey cows (Jersey) and 3 dairy herds of Italian Friesian cows (IF 1, IF 2 and IF 3).Figura 5 – Variazioni stagionali del contenuto di caseina del latte negli allevamenti studiati: 1 allevamento di vacche di razza Jersey (Jersey) e 3 allevamenti di vacche di razza Frisona Italiana (IF 1, IF 2 e IF 3).
Figure 6 – Seasonal trends of urea content of milk in the herds studied: 1 dairy herd of Jersey cows (Jersey) and 3 dairy herds of Italian Friesian cows (IF 1, IF 2 and IF 3).Figura 6 – Variazioni stagionali del contenuto di urea del latte negli allevamenti studiati: 1 allevamento di vacche di razza Jersey (Jersey) e 3 allevamenti di vacche di razza Frisona Italiana (IF 1, IF 2 e IF 3).
Winter
Inverno
Spring
Primavera
Summer
Estate
Autumn
Autunno
g/1
00g
2,4
2,6
2,8
3,0
3,2
3,4
Jersey
IF 1
IF 2
IF 3Casein
-Caseina
Winter
Inverno
Spring
Primavera
Summer
Estate
Autumn
Autunno
g/1
00g
2,4
2,6
2,8
3,0
3,2
3,4
Jersey
IF 1
IF 2
IF 3Casein
-Caseina
WinterInverno
SpringPrimavera
SummerEstate
AutumnAutunno
mg/100mL
22
23
24
25
26
27
28
29
30
Jersey
IF 1
IF 2
IF 3
Urea
WinterInverno
SpringPrimavera
SummerEstate
AutumnAutunno
22
23
24
25
26
27
28
29
30
Jersey
IF 1
IF 2
IF 3

156
Ann. Fac. Medic. Vet. di Parma (Vol. XXV, 2005) - pag. 145 - pag. 166
Figure 7 – Seasonal trends of somatic cell score (SCS) of milk in the herds studied: 1 dairy herd of Jersey cows (Jersey) and 3 dairy herds of Italian Friesian cows (IF 1, IF 2 and IF 3).Figura 7 – Variazioni stagionali del punteggio lineare delle cellule somatiche del latte negli allevamenti studiati: 1 allevamento di vacche di razza Jersey (Jersey) e 3 allevamenti di vacche di razza Frisona Italiana (IF 1, IF 2 e IF 3).
Winter
Inverno
Spring
Primavera
Summer
Estate
Autumn
Autunno
SC
S
Punte
ggio
lin
eare
cellu
le s
om
atiche
2,5
3
3,5
4
4,5
Jersey
IF 1
IF 2
IF 3
Winter
Inverno
Spring
Primavera
Summer
Estate
Autumn
Autunno
SC
S
Punte
ggio
lin
eare
cellu
le s
om
atiche
2,5
3
3,5
4
4,5
Jersey
IF 1
IF 2
IF 3

157
Ann. Fac. Medic. Vet. di Parma (Vol. XXV, 2005) - pag. 145 - pag. 166
DISCUSSION
Titratable acidity, fat and casein content and somatic cell score resulted higher in Jersey milk than Italian Friesian milk. This is in line with the observations reported by Malacarne (2005) in a study on the physico-chemical characteristics of herd milks from Jersey cows and Italian Friesian cows. Auldist et al. (2004), comparing the physico-chemical characteristics of individual milks of Jersey and Holstein cows, reared in New Zealand, report higher value of casein and fat contents in Jersey milk. The higher values of SCS of Jersey milk than Italian Friesian milk observed in this study was also reported by Ferruzzi et al. (2004).
Seasonal variations of Jersey milk observed in this research seems to be mainly infl uenced by the physiological status of the cows. In fact, as reported in table 3, the number of lactating cows throughout the year indicate a higher concentration of parities during the winter than in other seasons. This could partly explain the decrease of contents of milk fat and casein recorded in spring-summer period, in correspondence with the higher milk production levels, and the increase of the values observed in autumn, when a higher proportion of the milking cows were in late-lactation.
The analysis of milk production and milk quality parameters seasonal values among herd, as opposed to the cattle breed reared, showed that values of milk production, titratable acidity, fat and casein contents of the Jersey herd were quite distinctive with respect to Italian Friesian herds. When the urea content and the somatic cell score are considered, the differences observed resulted mainly from herd management rather than the breed reared.
CONCLUSIONS
Seasonal trends of milk production and milk quality parameters, except casein, resulted statistically different between Jersey cows and Italian Friesian cows. At herd level, seasonal values of milk production, titratable acidity values, contents of fat and casein of milk of Jersey herd were clearly distinctive from those of Italian Friesian herds. When the urea content and the somatic cell score are considered, the differences observed resulted mainly from herd management rather than the breed reared.
REFERENCES
ANON.: Determinazione del grado di acidità del latte secondo Soxhlet-Henkel – Milchwissenschaft 18, 520, 1963.
AULDIST M.J., JOHNSTON K.A., WHITE N.J., FITZSIMONS W.P., BOLAND M.J.: A comparison of the composition, coagulation characteristics and cheesemaking capacity of milk from Friesian and Jersey dairy cows – J. Dairy Res. 71, 51, 2004

158
Ann. Fac. Medic. Vet. di Parma (Vol. XXV, 2005) - pag. 145 - pag. 166
BIGGS D.A.: Instrumental infrared estimation of fat, protein and lactose in milk: collaborative study. J. Assoc. Off. Anal. Chem. 61, 1015, 1978
FERRUZZI G., PISTOIA A., POLI P., CASAROSA L., BALESTRI G.: Caratteristiche tecnologiche del latte di bovine di razza Jersey – Atti S.I.S.Vet. 58, 253, 2004.
GOBBI L.: Infl uenza del clima sul benessere bovino: la qualità del latte – Degree thesis, Parma University, 66pp, 2005.
MALACARNE M., FOSSA E., SANDRI S., TOSI F., FORMAGGIONI P., FRANCESCHI P., SUMMER A.: Variazioni stagionali delle caratteristiche del latte nella zona di produzione del Parmigiano-Reggiano durante gli anni 1990 – Sci. Tecn. Latt.-Cas., 55, 63, 2004.
MALACARNE M., SUMMER A., FIENI S., FRANCESCHI P., MARIANI P.: Variazioni stagionali del tempo di rassodamento del coagulo di latti di stalla di vacche di razza Frisona in rapporto allʼacidità titolabile e al contenuto di cellule somatiche – Atti S.I.S.Vet. 58, 251, 2004.
MALACARNE M.: Fattori genetici, qualità del latte e produzione di Parmigiano-Reggiano – PHD Thesis, Parma University, 99 pp, 2005.
PECORARI M., MARIANI M.S., CALZOLARI M.G., TEDESCHI G.: Il contenuto di urea nel latte: variazioni e rapporti con i parametri tecnologici – Sci. Tecn. Latt.-Cas., 44, 144, 1993.
SANDRI S., TOSI F., MARIANI M.S., VECCHIA P., MALACARNE M., SUMMER A.: Osservazione sullʼandamento delle principali caratteristiche casearie del latte per Parmigiano-Reggiano durante gli ani 1990 – Ann. Fac. Med. Vet. Univ. Parma, 21, 235, 2001.
SCHMIDT-MADSEN P. (1975). Fluoro-opto-electronic cell-counting on milk – J. Dairy Res. 42, 227, 1975.

159
Ann. Fac. Medic. Vet. di Parma (Vol. XXV, 2005) - pag. 145 - pag. 166
VARIAZIONI STAGIONALI DELLA QUALITÀ DEL LATTE DI ALLEVAMENTO DESTINATO ALLA CASIFICAZIONE IN
FORMAGGIO PARMIGIANO-REGGIANO: CONFRONTO TRA LE RAZZE JERSEY E FRISONA ITALIANA
Malacarne M., Summer A., Formaggioni P., Franceschi P.,Beltrami A., Mariani P.
Parole chiave: qualità del latte, stagione, Parmigiano-Reggiano, Jersey, Frisona Italiana
PREMESSA
La stagione, in senso lato, può esercitare unʼinfl uenza signifi cativa nei riguardi di diversi costituenti organici ed inorganici del latte, le cui modifi cazioni si rifl ettono sul suo comportamento tecnologico e sulla qualità del formaggio. Si tratta di variazioni legate principalmente allʼinfl uenza combinata di diversi fattori di ordine fi siologico, alimentare e climatico, che nel corso dellʼanno agiscono ed interagiscono con intensità variabile. Le variazioni dei parametri qualitativi del latte nel comprensorio di produzione del Parmigiano-Reggiano, nel corso dellʼanno, sono state soggetto di diverse ricerche (Sandri et al. 2001; Malacarne et al. 2003; Malacarne et al., 2004; Gobbi, 2005). Malacarne et al. (2003) e Sandri et al. (2001) hanno studiato le variazione delle caratteristiche qualitative del latte in circa 83000 campioni di latte di allevamento raccolti nel corso di 10 anni (dal 1991 al 2000). Malacarne et al. (2004) hanno analizzato la qualità del latte in 583 campioni di latte di massa di allevamenti di razza Frisona Italiana. Gobbi (2005) ha analizzato le variazioni dei parametri qualitativi in 64215 campioni di latte di allevamento raccolti negli anni 2002, 2003 e 2004.
Il numero di vacche presenti nel comprensorio di produzione del Parmigiano-Reggiano è di 336000 unità, corrispondenti al 15% circa dellʼintero patrimonio bovino italiano. Attualmente, lʼ85% dei capi allevati nel comprensorio del Parmigiano-Reggiano è di razza Frisona Italiana. A causa delle restrizioni riguardanti la produzione di latte dettate dalle normative comunitarie (quote latte) e dellʼintroduzione di un sistema di pagamento latte a qualità nel comprensorio del Parmigiano-Reggiano, cʼè un nuovo interesse nei confronti dei tipi genetici i cui secreti mammari si contraddistinguono per migliori caratteristiche qualitative. A tal riguardo, sarebbe interessante studiare le caratteristiche tecnologico-casearie del latte di vacche di razza Jersey, il cui latte si caratterizza per elevati contenuti di proteina e grasso. In Italia si è passati dai 2257 capi registrati (170 allevamenti) nel 1994 ai 5870 capi (560 allevamenti) nel 2003. Il libro genealogico della razza Jersey è stato istituito nel 1999 e un indice genetico è stato introdotto per migliorare le caratteristiche produttive e qualitative del latte (http://www.anafi .it/Jersey/). Recentemente, bovine di questa razza razza sono state introdotte (circa 500 vacche) in un allevamento situato nel comprensorio di produzione del Parmigiano-Reggiano.

160
Ann. Fac. Medic. Vet. di Parma (Vol. XXV, 2005) - pag. 145 - pag. 166
L obiettivo della ricerca è stato studiare le variazioni stagionali delle caratteristiche produttive e qualitative del latte di vacche di razza Jersey e di confrontarle con quelle osservate nel latte di vacche di razza Frisona Italiana.
MATERIALI E METODI
L indagine ha interessato 4 differenti allevamenti bovini da latte situati in provincia di Reggio Emilia, 1 di vacche di razza Jersey (no. medio annuo vacche in lattazione 348±19) e 3 di vacche di razza Frisona Italiana (193±35; 369±14; 144±11), il cui latte era destinato alla produzione di formaggio Parmigiano-Reggiano. In particolare 2 allevamenti di Frisona si trovavano nel comune di Albinea, 1 allevamento di Frisona era sito nel comune di Rivalta, mentre, quello di Jersey, nel comune di Vezzano sul Crostolo. Le aziende, appartenenti ad uno stesso allevatore, erano gestite nelle stesse condizioni manageriali (stessi foraggi, stessi mangimi, tecnica unifeed, somministrati in quantità rapportate alla produzione di latte).
I campioni sono stati raccolti ed analizzati nel corso del 2003. Presso ciascun allevamento si è proceduto alla registrazione giornaliera della produzione totale di latte e del numero di vacche in lattazione, da cui è stata ricavata la produzione media giornaliera per vacca. In ogni allevamento, i parametri qualitativi del latte sono stati determinati, pressoché giornalmente, sul campione di latte di massa della mungitura della sera e su quello della mungitura del mattino. Sono stati analizzati i seguenti parametri qualitativi: acidità titolabile (Anon., 1963), grasso e proteina, mediante letture nel medio infrarosso (Biggs, 1978), con Milko-scan 134A/B; caseina ricavata dalla proteina x 0,77; urea per reazione enzimatica catalizzata dallʼureasi con apparecchio Bun Analyzer (Pecorari et al. 1993); cellule somatiche mediante conteggio fl uoro-opto-elettronico (Schmidt-Madsen, 1975) con apparecchio Fossomatic 250. I valori delle cellule sono stati trasformati in punteggio lineare per la “normalizzazione”, utilizzando la seguente formula: punteggio lineare = log
2 (no.
cellule in migliaia/100) + 3.Analisi statistica – i dati raccolti sono stati elaborati per mezzo ANOVA
univariata, utilizzando il software SPSS 13.0 (Chicago, Illinois, USA) secondo il seguente modello linerare:
yijkl
= μ + Bi + S
j + M
k + (BS)
ij + (BM)
ik + (MS)
kj + (BMS)
ijk + e
ijkl
yijkl
= media comune a tutte le osservazioni; Bi = effetto della razza (i = 1
Jersey, 2 Frisona Italiana); Sj = effetto della stagione (j = 1 inverno; 2 primavera; 3
estate; 4 autunno); Mk = campione di latte (k = 1 campione della mungitura della sera,
2 campione della mungitura della mattina); eijkl
= errore residuoQuando sono stati analizzati la produzione giornaliera di latte e il numero di
vacche in lattazione, lʼeffetto “campione di latte” è stato eliminato dal modello.Inoltre, per evidenziare variazioni tra allevamenti, indipendentemente dalla
razza, è stato utilizzato il seguente modello:y
ijk = μ + H
i + S
j + (HS)
ij + e
ijk
yijk
= variabile dipendente; μ = media generale; Hi = effetto dellʼallevamento
(i = 1 allevamento di Jersey, 2 allevamento di Frisona Italiana n. 1, 3 allevamento di

161
Ann. Fac. Medic. Vet. di Parma (Vol. XXV, 2005) - pag. 145 - pag. 166
Frisona Italiana n. 2, 4 allevamento di Frisona Italiana n. 3); Sj = effetto della stagione
(j = 1 inverno; 2 primavera; 3 estate; 4 autunno); eijk
= errore residuo.
RISULTATI
Nella tabella 1 sono riportate medie e coeffi cienti di variabilità dei dati distinti per razza. I valori della razza Jersey riguardano un solo allevamento; i dati osservati per la Frisona Italiana sono relativi a tre differenti allevamenti, situati in due diversi comuni. Indipendentemente dalla razza, le pratiche gestionali, in termini di tipo stabulazione e alimentazione (disponibilità foraggi, mangimi e tecniche alimentari), erano le stesse in tutti gli allevamenti. La variabilità dei parametri qualitativi del latte è risultata similare per le due razze. Il contenuto di grasso ha mostrato una variabilità maggiore rispetto a quanto osservato per il contenuto di caseina e per il valore dellʼacidità titolabile. La variabilità dellʼurea è risultata la più elevata. Il punteggio delle cellule somatiche ha mostrato una variabilità elevata, specie nella Frisona Italiana
La signifi catività statistica degli effetti considerati viene riportata nella tabella 2. Le variazioni di tutti i parametri qualitativi del latte sono risultate infl uenzate, in maniera statisticamente signifi cativa, dalla razza e dalla stagione (inverno, primavera, estate, autunno). La mungitura, a sua volta, mungitura sera o mungitura della mattina, ha infl uenzato, in maniera statisticamente signifi cativa, lʼacidità titolabile, il contenuto di grasso e il contenuto di urea. Gli andamenti stagionali di tutti i parametri, fatta eccezione per il contenuto di caseina, sono risultati differenti nelle due razze bovine, come indicano chiaramente i valori di signifi catività fattore “razza x stagione”. Con riferimento agli obiettivi della ricerca, appare interessante la signifi catività statistica dellʼeffetto legato allʼinterazione dei tre fattori considerati – razza, stagione e mungitura – nei riguardi dei contenuti di grasso e di caseina; ciò vuol dire che le variazioni stagionali di questi due costituenti, osservate tra mungitura della sera e mungitura della mattina, sono diverse per le due razze.
Variazioni stagionali delle caratteristiche produttive e qualitative del latte: effetto della razza
Nella tabella 3 sono mostrati gli andamenti stagionali della produzione del latte e dei parametri qualitativi in rapporto alla razza.
Produzione di latte – Per quanto concerne i livelli produttivi, mediamente le vacche Jersey hanno presentato una produzione giornaliera del 25% inferiore rispetto alle vacche Frisona Italiana. I valori stagionali della produzione di latte sono risultati statisticamente differenti nelle due razze (dato non mostrato P<0,01); quelli della Jersey sono stati inferiori rispetto alla Frisona Italiana in tutte le stagioni. La produzione di latte della Jersey ha mostrato un incremento (+8,8%) dallʼinverno alla primavera (20,5 inverno vs 22,3 primavera; kg/vacca); in estate il valore, pari a 22,1 kg/vacca, è risultato pressoché uguale a quello della primavera. In autunno, si è registrato un calo di produzione rispetto allʼestate (-5,0%) e il valore osservato, pari a 21,0 kg/vacca, è stato di poco superiore a quello dellʼinverno. Negli allevamenti di

162
Ann. Fac. Medic. Vet. di Parma (Vol. XXV, 2005) - pag. 145 - pag. 166
Frisona Italiana, come nel caso della Jersey, la produzione di latte ha fatto registrare un incremento dallʼinverno alla primavera (28,1 inverno vs 28,7 primavera; kg/vacca), ma nel caso della Frisona Italiana, lʼincremento è risultato percentualmente inferiore: +2,8%. In estate, il livello produttivo, pari a 28,7 kg/capo giorno, ha mostrato una lieve fl essione rispetto a quello della primavera. In autunno, diversamente da quanto visto nella razza Jersey, la produzione di latte ha registrato un lieve incremento (+2,4%), raggiungendo il valore più elevato nel corso dellʼanno, pari a 29,4 kg/vacca. I valori stagionali di produzione della Jersey, rispetto a quelli della Frisona Italiana, hanno mostrato uno scarto minimo di –23% in estate ed uno massimo di –29% in autunno.
Acidità titolabile – Il valore dellʼacidità titolabile del latte di Jersey è risultato mediamente superiore del 17% rispetto a quello di Frisona Italiana. Anche gli andamenti stagionali sono risultati signifi cativamente differenti (vedi effetto B x S in tabella 2, P<0,01): i valori della Jersey sono stati più elevati, rispetto a quelli della Frisona Italiana, in tutte le stagioni. Dallʼinverno allʼestate, lʼacidità titolabile del latte della Jersey ha mostrato un progressivo ma leggero incremento (3,84 inverno, 3,87 primavera e 3,89 estate, °SH/50mL). Dallʼestate allʼautunno si è registrato, invece, un maggiore incremento di acidità titolabile (+2,6%). Per quanto riguarda il latte della Frisona Italiana, lʼacidità titolabile ha fatto registrare una diminuzione (-1,8%) dallʼinverno (3,37 °SH/50mL) alla primavera (3,31 °SH/50mL). In estate, il valore è risultato uguale a quello della primavera. In autunno, si è registrato un incremento (+1,5%) di acidità che ha raggiunto il valore 3,36 °SH/50mL, pressoché uguale a quelli registrati in inverno. La scarto tra i valori di acidità del latte delle due razze è andato aumentando nel corso dellʼanno. Lo scarto percentuale è aumentato in misura maggiore nel passaggio dallʼinverno alla primavera, stagione in corrispondenza della quale la differenza tra i valori di acidità titolabile del latte della Jersey e di quello di Frisona Italiana è passata da +13,9 a +17,1%. Nelle stagioni successive la differenza è risultata pari a +17,5% in estate e a +18,6% in autunno.
Contenuto di grasso – Per quanto riguarda il grasso, il latte della Jersey ha mostrato un valore medio signifi cativamente maggiore (+37,2%; P<0,01) rispetto a quello di Frisona Italiana. I dati della Jersey sono risultati maggiori rispetto a quelli della Frisona Italiana in tutte le stagioni. Anche per il grasso, lʼanalisi statistica ha messo in evidenza differenze signifi cative tra i valori stagionali delle due razze (vedi effetto B x S in tabella 2; P<0,01). Dallʼinverno alla primavera, il latte di Jersey ha fatto registrare un forte calo di grasso (-12,4%) che è passato da 4,83 a 4,23g/100g. In estate il grasso è risultato di poco inferiore a quello della primavera, pari a 4,18g. In autunno si è registrato, invece, un netto incremento, rispetto allʼestate (+17,2%), ed il contenuto di grasso ha raggiunto il valore più elevato, pari a 4,90g. Per quanto riguarda gli andamenti stagionali della Frisona Italiana, analogamente a quanto visto per la Jersey, dallʼinverno alla primavera è stato osservato un calo del contenuto di grasso, da 3,40 a 3,18g. Tuttavia, lʼentità della diminuzione è risultata chiaramente inferiore (-6,8%) rispetto a quella osservata nello stesso periodo per il latte della Jersey (-12.4%). In estate, il valore è risultato leggermente superiore rispetto a quello della primavera, pari a 3,21g. In autunno, al pari di quanto visto per la Jersey, ma in misura minore, è stato osservato un incremento di grasso (+6,23%) che ha raggiunto un valore (3,41g) pressoché uguale a quello dellʼinverno (3,40g). Il contenuto di

163
Ann. Fac. Medic. Vet. di Parma (Vol. XXV, 2005) - pag. 145 - pag. 166
grasso del latte di Jersey è risultato sempre maggiore rispetto a quello della Frisona Italiana particolarmente in inverno e in autunno, con valori pari, rispettivamente, a 42 e a 44%; in primavera ed in estate la differenza è risultata, rispettivamente, del 33 e del 30%.
Contenuto di caseina – Il contenuto di caseina, ricavato moltiplicando il valore della proteina grezza determinata nel medio IR per il fattore 0,77, è risultato chiaramente superiore nel latte di Jersey (+16,4%) rispetto a quello del latte di Frisona Italiana. Anche i singoli valori stagionali del contenuto di caseina sono risultati maggiori per il latte di Jersey. Tra le due razze, per proteina (caseina), non sono state osservate differenze signifi cative (vedi effetto B x S in tabella 2, P>0,05) circa le variazioni stagionali. In entrambe le razze è stato registrato un calo del contenuto di caseina dallʼinverno alla primavera: per la Jersey la caseina è calata da 3,12 a 2,95g, mentre la Frisona Italiana è passato da 2,70g a 2,54g. In estate i valori di caseina di entrambe le razze sono risultati analoghi a quelli della primavera, pari a 2,95g per la Jersey e a 2,52g per la Frisona Italiana. In autunno, sia il latte di Jersey che quello di Frisona Italiana, hanno mostrato un aumento del contenuto di caseina, facendo registrare pari a 3,17 e a 2,74g, rispettivamente. La caseina del latte di Jersey è risultato percentualmente maggiore rispetto a quello di Frisona Italiana in eguale misura circa in tutte le stagioni, per valori compresi tra +15% (inverno) e +17% (estate).
Contenuto di urea – Il contenuto di urea è risultato mediamente più elevato nel latte di Jersey rispetto a quello del latte di Frisona Italiana: 27,20 vs 26,52 mg/100mL (P<0,01). In inverno ed in primavera, tuttavia, il latte di Frisona Italiana si è caratterizzato per valori di urea superiori rispetto a quelli di Jersey, mentre, in estate ed in autunno, sono stati maggiori i valori osservati nel latte di Jersey. Gli andamenti stagionali dellʼurea sono risultati signifi cativamente differenti per le due razze (vedi effetto B x S in tabella 2, P<0,01). Per il latte di Jersey è stato osservato un calo di urea dallʼinverno allʼestate (-6,9%), da 27,38 mg a 25,50 mg in estate. In autunno il valore di urea ha mostrato un chiaro incremento (+13,8%) rispetto al valore osservato in estate, raggiungendo i 29,01 mg. Nel latte di Frisona Italiana è stato osservato un leggero incremento di urea dallʼinverno alla primavera: da 28,04 a 28,38 mg. In estate, lʼurea, pari a 24,09 mg, ha fatto registrare una netta diminuzione (-15,1%) rispetto al valore primaverile. In autunno è stato osservato un incremento di urea di +5,7%, il cui valore si è attestato a 25,55 mg/100mL. Riguardo le differenze tra i valori stagionali delle due razze, in inverno ed in primavera il contenuto di urea del latte di Jersey è risultato inferiore rispetto a quello del latte di Frisona Italiana del 2,3 e del 5,2%, rispettivamente. In estate ed in autunno, invece, il latte di Jersey si è caratterizzato per valori di urea superiori rispetto a quelli del latte di Frisona Italiana, +5,8% e +13,5%, rispettivamente.
Punteggio lineare delle cellule somatiche – Il punteggio lineare delle cellule somatiche è risultato signifi cativamente maggiore (+4,81%; P<0,01) nel latte di Jersey rispetto a quello di Frisona Italiana. I valori stagionali del latte di Jersey sono risultati maggiori in tutte le stagioni. Gli andamenti stagionali sono risultati signifi cativamente differenti tra le due razze (vedi effetto B x S in tabella 2, P<0,01). Sotto questo profi lo, il latte di Jersey ha presentato valori di punteggio pressoché

164
Ann. Fac. Medic. Vet. di Parma (Vol. XXV, 2005) - pag. 145 - pag. 166
analoghi dallʼinverno allʼestate (3,96 inverno, 3,94 primavera; 3,93 estate), mentre, in autunno il punteggio delle cellule somatiche ha registrato un deciso decremento (-2,0%), toccando il valore di 3,85. Riguardo il latte di Frisona Italiana, il punteggio lineare delle cellule somatiche ha mostrato un decremento (-7,1%) dallʼinverno (3,92) alla primavera (3,64). In estate è stato osservato un incremento del punteggio (+5,5%) che ha raggiunto un valore pari a 3,84. Dallʼestate allʼautunno si è osservato un decremento (-7,0%) del punteggio, che in autunno ha fatto registrare un valore di 3,57. Per quanto concerne il confronto tra i valori stagionali del punteggio lineare del latte, lo scarto percentuale a favore della Jersey è variato tra un minimo di 1,1% in inverno ed un massimo di 8,3% in primavera. In estate ed in autunno la differenza a favore del latte di Jersey è risultata pari a 2,3 e a 7,6%, rispettivamente.
Variazioni stagionali delle caratteristiche produttive e qualitative del latte: effetto dellʼallevamento
L analisi degli andamenti stagionali in rapporto allʼallevamento (Figure da 1 a 7), indipendentemente dalla razza considerata, ha evidenziato valori stagionali nettamente distinti tra lʼallevamento di Jersey e quelli di Frisona Italiana, per quanto riguarda produzione giornaliera di latte per vacca, valori di acidità titolabile e contenuti di grasso e caseina del latte. Per quanto concerne il contenuto di urea (Figura 6) e i valori delle cellule somatiche del latte (Figura 7), è stato possibile evidenziare che gli andamenti stagionali dellʼallevamento della Jersey e quelli relativi agli allevamenti di Frisona Italiana non sono distinguibili in rapporto alla razza allevata, per cui sono per lo più legati alle modalità di conduzione dellʼallevamento.
CONCLUSIONI
Gli andamenti stagionali di tutti i parametri studiati (produzione latte, acidità titolabile, contenuto di grasso e urea del latte, punteggio delle cellule somatiche) fatta eccezione per il contenuto di caseina, sono risultati differenti tra le vacche di razza Jersey e quelle di razza Frisona Italiana. L analisi degli andamenti stagionali in rapporto allʼallevamento, indipendentemente dalla razza considerata, ha evidenziato valori stagionali nettamente distinti tra lʼallevamento di Jersey e quelli di Frisona Italiana, per quanto riguarda produzione giornaliera di latte per vacca, valori di acidità titolabile e contenuti di grasso e caseina del latte. Per quanto concerne il contenuto di urea e i valori delle cellule somatiche del latte è stato possibile evidenziare che gli andamenti stagionali dellʼallevamento della Jersey e quelli relativi agli allevamenti di Frisona Italiana non sono distinguibili in rapporto alla razza allevata, per cui sono da ritenere per lo più legati alle modalità di conduzione dellʼallevamento.

165
Ann. Fac. Medic. Vet. di Parma (Vol. XXV, 2005) - pag. 145 - pag. 166
RIASSUNTO
Le variazioni stagionali delle caratteristiche produttive e qualitative del latte di massa di vacche di razza Jersey sono state confrontate con quelle del latte di massa di vacche di razza Frisona Italiana. L analisi della varianza ha evidenziato variazioni stagionali statisticamente differenti tra le due razze per quanto riguarda produzione giornaliera di latte (per vacca), acidità titolabile, e contenuti di grasso, di urea, e cellule somatiche, questo ultimo espresso come punteggio lineare. Tuttavia, per quanto riguarda urea e cellule somatiche, le differenze osservate tra gli andamenti stagionali sono risultate maggiormente infl uenzate dalle pratiche gestionali piuttosto che dalla razza allevata.
ABSTRACT
Seasonal variations of milk production and quality between bulk milk from Jersey cows and from Italian Friesian cows. The analysis of variance evidenced statistically signifi cant variations, between the two breeds, of seasonal values of milk productions (per cows), titratable acidity, fat, caseina and urea contents of milk and somatic cell score. However, seasonal differences of urea and somatic cell score trend seems to be mainly related to herd management practices rather than to the breed reared.

166
Ann. Fac. Medic. Vet. di Parma (Vol. XXV, 2005) - pag. 145 - pag. 166

167
Ann. Fac. Medic. Vet. di Parma (Vol. XXV, 2005) - pag. 167 - pag. 174
CHARACTERIZATION OF LACTIC ACID BACTERIA ISOLATED FROM AN ITALIAN DRY FERMENTED
SAUSAGE
Conter M.1, Muscariello T. 2, Zanardi E. 1, Ghidini S. 1, Vergara A. 2,Campanini G. 1, Ianieri A 1.
Abstract
Studies were carried out on the microbiological changes which occurred during the ripening of an Italian dry fermented sausage, manufactured without starter cultures. Lactic acid bacteria were studied using the commercially available system API 50 CH for the characterization of carbohydrate fermentation patterns. The results obtained indicated that lactobacilli constituted the predominant fl ora throughout the ripening period. Characterisation of 90 lactic isolates indicated that microfl ora was dominated by facultative heterofermentative lactobacilli: approximately 51,1% of them could be identifi ed as Lactobacillus sakei. The API 50 CH identifi cation system did not prove to be reliable: 10% of the isolates remained unidentifi ed and software response for L. sakei subs. sakei reference strain was Lactococcus lactis subsp. lactis. In this way, this species could not be positively identifi ed solely by means of the match index, but must be associated with other phenotypic or genotypic characters.
Riassunto
È stato condotto uno studio sulle modifi cazioni microbiologiche che si verifi cano durante la maturazione di un salame italiano prodotto senza colture starter. L evoluzione dei batteri lattici è stata seguita impiegando il sistema API 50 CH per la caratterizzazione dei pattern di fermentazione dei carboidrati. I risultati ottenuti indicano che i lattobacilli costituiscono la parte principale della fl ora del salame durante la maturazione. La caratterizzazione dei 90 ceppi di batteri lattici isolati mostra che la microfl ora è dominata dai lattobacilli eterofermentanti facoltativi: il 51,1% degli isolati, infatti, è stato identifi cato come Lactobacillus sakei. Il sistema di identifi cazione API 50 CH non è, però, completamente affi dabile: il 10% degli isolati è rimasto non identifi cato, inoltre la risposta del software di identifi cazione per L. sakei è stato Lactococcus lactis subsp. lactis. In questo modo, questa specie non può essere identifi cata impiegando solamente lʼindice di corrispondenza, ma deve essere associao con altre caratteristiche fenotipiche o genotipiche.
1 Dipartimento di Produzioni Animali, Biotecnologie Veterinarie, Qualità e Sicurezza degli Alimenti, Università degli Studi di Parma2 Dipartimento di Scienze degli Alimenti. Università degli Studi di Teramo

168
Ann. Fac. Medic. Vet. di Parma (Vol. XXV, 2005) - pag. 167 - pag. 174
1. Introduction
ʻFilzetta is a popular dry fermented sausage, produced in Italy. It is made of minced lean pork, mixed with fat, spices and different additives, stuffed into natural casing and ripened for two months. The shelf-life is determined by a low water activity (aw) and a pH level close to 5.0 which prevents growth of pathogenic microorganisms. Different microorganisms, derived from raw materials and the environment, naturally contaminate dry sausage mixtures. Among them, lactic acid bacteria (LAB) are responsible for the main event during dry sausage ripening. Lactic acid bacteria ferment the sugars to acid and thus lower the pH, improving the texture of the products, providing prolonged stability against the proliferation of food pathogens and producing some aromatic compounds (Montel et al., 1998; Ordónez et al., 1999). Lactobacilli are the predominant part of the lactic acid microfl ora of meat and meat products (Schillinger & Lücke, 1987).
Although the use of starter cultures is increasing in large scale factories, small manufacturers are continuing to use the traditional method without starter cultures. In this way, the LAB present in these products come from the meat itself or the environment, representing the so-called ʻhouse fl oraʼ. Different studies on the identifi cation and characterisation of these ʻhouse fl ora have been carried out on different types of products (Schillinger and Lücke, 1987; Santos et al., 1998). Little information is available on the isolation and characterisation of LAB from Italian dry fermented sausages (Vergara et al., 1999; Parente et al., 2001; Greco et al., 2005).
The aim of this study was the isolation and characterisation of the LAB present in the traditional ʻfi lzetta manufactured in Northern Italy. Samples were taken at three different stages of ripening to determine the species present and the succession of these species during the process.
2. Materials and Methods
2.1 Food samples, sampling, strains and culture conditionsSausages were produced by a local artisanal plant in Langhirano (Parma,
Italy), according to the traditional method (without the use of starter cultures and with a natural fermentation step at close to +10°C for 30 days after fi lling). The basic initial sausage mixture included: lean pork, lard, NaCl, black pepper, lactose, garlic, and spices. Samples were taken immediately after fi lling, 30 days after ripening (+7°C and 70% relative humidity), and at the end of seasoning (30 days, +15°C and 75% relative humidity). For microbiological analysis, the natural casing was aseptically removed; pieces of each sample were cut using sterile knives and homogenised with nine part of sterile Ringerʼs solution (Oxoid, UK) in a stomacher (AES Laboratoire).
The appropriate dilutions were plated on the appropriate medium.Enterobacteriaceae were enumerated on Violet Red Bile Glucose (VRBGA)
agar (Oxoid, Italy), incubated at +32°C for 24-48h, enterococci on Kanamicin Aesculin Azide agar (Oxoid, Italy), incubated at +35°C for 24h. Malt Extract agar

169
Ann. Fac. Medic. Vet. di Parma (Vol. XXV, 2005) - pag. 167 - pag. 174
(Oxoid, Italy) and Pseudomonas CFC agar Cetrimide, Fucidine and Cephaloridine (Oxoid, Italy), were used to enumerate yeast and mould and Pseudomonas spp. respectively. Yeast and mould were incubated at +25-30°C for 2-5 days respectively; Pseudomonas spp. were incubated at +25°C for 48h.
LAB were enumerated on MRS agar (Oxoid, Italy), plates were anaerobically incubated in AnaeroGen Compact (Oxoid, Italy) at +30°C for 48h. Coagulase-positive staphylococci and Staphylococci/Kocuria were plated on Baird Parker with RPF (Rabbit Plasma Fibrinogen) (Biomérieux, Italy) and incubated at +37°C for 24-48h.
The determination of pH was carried out by homogenisation with distilled water (1/10 weight/volume). Measurement was carried out with a pH meter (PHM 82 STANDARD Phmeter, Radiometer, Copenhagen) with a combined electrode (Crison 52-32). Water activity (aw) was measured using a water activity meter (Aqualab, Decagon devices, USA).
2.2 Identifi cationIndividual isolates from countable MRS agar plates were randomly-picked,
representatives from all morphologically distinct colonies, and were sub-cultured and purifi ed using MRS agar fi ve times. Pure strains, as judged by microscopic observations for homogeneity of cellular morphology, were maintained in MRS broth (Oxoid), plus 40% glycerol (Carlo Erba, Italy) at -20°C. Eleven type strains of lactic acid bacteria were sub-cultured on MRS agar, along with the 90 food isolates. Bacterial isolates were tested for Gram reaction, catalase production and cell morphology.
The type strains used in this study and their sources are illustrated in Table 1.
2.3 API 50 CH and API Staph fermentation assayOvernight cultures of lactobacilli isolates and type strains grown in 15 ml
MRS broth (Oxoid) at 30°C were centrifuged at 9800 x g for 10 min. The pellets were suspended in API 50 CHL medium (API system, BioMérieux, France). Using sterile PSIpette, homogenized suspension of the cells in the medium, with subsequent vortex mixing, were transferred into each of the 50 wells of the API 50 CH strips. All wells were overlaid with sterile paraffi n oil to effect anaerobiosis. Strips were moistened and covered as recommended by the manufacturer and incubated at 30°C. Changes in colour from violet were monitored after 1, 2 and 7 days. Results for each strip were graded from 1 to 5, where 5 denoted a complete change to yellow and 1 no change at all. The fi rst strip served as a control well. Aesculin hydrolysis (revealed by a change to a darker colour or black) was represented by a positive sign (+), while a negative sign (-) represented no change. Grades of fermentation results 3, 4 and 5 were interpreted as positive whereas 1 and 2 were negative (-). The resulting patterns were analysed with API WEB (BioMerieux). This computer program is commercially available and discriminates between species on the basis of a pattern-matching principle, but it does not take the basic morphological and physiological issues into account.

170
Ann. Fac. Medic. Vet. di Parma (Vol. XXV, 2005) - pag. 167 - pag. 174
3. Results and DiscussionFigure 1 shows the changes in pH and aw during the ripening of the sausages.
At the end of the fermentation, a slight decrease in the pH was observed, whereas in subsequent ripening stages, there was an increase. On the contrary, aw decreased during the entire maturation phase.
Changes in microbial contents during ripening of dry sausages are represented in table 2. Numbers of lactobacilli increased from 2.60 log
10 CFU/g in the stuffed batter
to 6.89 log10
CFU/g in the fi nal product, showing that this group rapidly dominates the total microfl ora. These results are in agreement with those reported for other traditional fermented sausages produced in Italy (Coppola et al., 2000). During the fi rst period of drying, a pH decrease from 5.70 to 5.15 (fi gure 1), parallel to a maximal increase in LAB counts (table 2) was observed. As it is well known, the fi nal product is characterized by the colonization on the sausages surface of moulds, which oxidise lactate with consequent increase of pH. In all samples, Micrococcaceae showed a lower population of LAB (about 1 to 4 log units). The behaviour of Micrococcaceae refl ected their poor competitiveness in presence of actively growing aciduric bacteria (Samelis et al., 1998). Coagulase negative staphylococci counts were lower than LAB counts, and they did not increase beyond 2.23 log
10 CFU/g. The low pH value reduces
the Enterobacteriaceae counts, which became undetectable both in the semi-ripened sample and in the fi nal product. The behaviour of Pseudomonas spp. is similar: their number decreases until 3.11 log
10 CFU/g in the fi nal product, probably due to the
lower aw value. Enterococci were not detectable at the start, but they were present in the semi-ripened sample and increased slightly up to 3 logs. Yeasts and moulds were detected only in the ripened sample.
These results confi rm the predominance of LAB in dry fermented sausages, as previously reported by many authors (Coppola et al., 2000; Lizaso at al., 1999; Samelis et al., 1994). Ninety presumptive LAB were randomly isolated from MRS agar plates. All the isolates were Gram-positive and catalase-negative bacteria. Most strains (61.1%) were facultative heterofermentative lactobacilli, confi rming that meat is one of the main habitats for this group of LAB; the remaining were obligate heterofermenter lactobacilli (17.8%). The evolution of the different species isolated during the ripening process is shown in table 3. Lb. sakei is confi rmed as main species in meat product, as reported by other researchers (Santos et al., 1998; Greco et al., 2005). L. fermentum, an obligate heterofermenter, decreased during ripening process, whilst L. brevis, which have frequently been described in other Italian dry fermented products (Coppola et al., 2000), were rarely isolated. Leuconostocs (9 isolates) were the major group of coccal-shaped lactic acid bacteria isolated, and they slightly increased during the ripening. They have been widely reported as occurring on meat or in meat products but, as found in the present study, they are usually not a dominant component of the fl ora (Sanz et al., 1988). The isolated strains were classifi ed as Leuconostoc mesenteroides.
The commercially available system used in this study for the identifi cation of LAB, based on physiological test associated with carbohydrate fermentation patterns was not able to allocate 19 strains out of 90 isolates (21.1%). Moreover, the identifi cation procedure, based on API WEB, resulted in an incorrect identifi cation

171
Ann. Fac. Medic. Vet. di Parma (Vol. XXV, 2005) - pag. 167 - pag. 174
of reference strain L. sakei subs. sakei DSM 20017T because this pattern was not present in the database. The software response for the cited reference strain was Lactococcus lactis subsp. lactis. In this way, this species could not be positively identifi ed solely by means of the match index, but must be associated with other phenotypic or genotypic characters. In particular, microscopic observation of cellular morphology together with the scheme proposed by Schillinger & Lücke (1987) allowed the correct identifi cation of both reference strain L. sakei and the fi eld strains obtained from sausages. This aspect is particularly important, considering that L. sakei widely represent the dominant species of lactic acid bacteria in the investigated sausages, in accordance with the results obtained on similar salami produced in Italy (Coppola et al., 1998 and 2000; Andrighetto et al., 2001).
Characterizing LAB as a naturally occurring microfl ora in sausages is an important step which could help to identify and protect the product. Further research is needed to characterize the properties which have an infl uence on the sensorial characteristics of the product, such as the determination of lactic acid production, proteolytic and lipolytic activity, and the production of inhibitory substances. Phenotypic characterization based on sugar fermentation pattern may not always provide suffi cient basis for the reliable identifi cation of LAB, as reported by other researchers (Nigatu, 2000; Corsetti et al., 2001; Muyana et al., 2003) although it is a useful tool for presumptive classifi cation. Commercially available systems based on carbohydrate fermentation should be combined with conventional phenotypic properties other than carbohydrate fermentation or with genotypic techniques.
Acknowledgment
The research is part of the project “Assessment and improvement of safety of traditional dry sausages from producers to consumers” (N° QLK1-CT-2002-02240), funded by European Union, in the framework of the programme “Quality of Life and Management of Living Resources” in the Fifth Framework Programme.
References
1. Andrighetto C., Zampese L. & Lombardi A. RAPD-PCR characterization of lactobacilli isolated from artisanal meat plants and traditional fermented sausage of Veneto region (Italy). Letters in Applied Microbiology 33 (2001), pp. 26-30.
2. Coppola R., Giagnacovo B., Iorizzo M. & Grazia L. Characterization of lactobacilli involved in the ripening of soppressata molisana, a typical southern Italy fermented sausage. Food Microbiology 15 (1998), pp. 347–353.
3. Coppola S., Mauriello G., Aponte M., Moschetti G. & Villani F. Microbial succession during ripening of Naples-type salami, a southern Italian fermented sausage. Meat Science 56 (2000), pp. 321-329.
4. Corsetti A., Lavermicocca P., Morea P., Baruzzi F., Tosti N. & Gobbetti M. Phenotypic and molecular identifi cation and clustering of lactis acid bacteria and

172
Ann. Fac. Medic. Vet. di Parma (Vol. XXV, 2005) - pag. 167 - pag. 174
yeast from wheat (species Triticum durum and Triticum aestivum) sourdoughs of Southern Italy. International Journal of Food Microbiology 64 (2001), pp. 95-104.
5. Greco M., Mazzette R., De Santis E.P.L., Corona A. & Cosseddu A.M. Evolution and identifi cation of lactis acid bacteria isolated during the ripening of Sardinian sausages. Meat Science 69 (2005), pp. 733-739.
6. Lizaso G., Chasco J. & Beriain M.J., Microbiological and biochemical changes during ripening of Salchichón, a Spanish dry cured sausage. Food Microbiology 16 (1999), pp. 219–228.
7. Montel M.C., Masson F. & Talon R. Bacterial role in fl avour development. Meat Science 49 (Supplement 1) (1998), pp. S111-S123.
8. Muyana C., Narvhus J.A., Treimo J. & Langsrud T. Isolation , characterization and identifi cation of lactic acid bacteria from bushera: a Ugandan traditional fermented beverage. International Journal of Food Microbiology 80 (2003), pp. 201-210.
9. Nigatu A. Evaluation of numerical analyses of RAPD and API 50 CH patterns to differentiate Lactobacillus plantarum, Lact. fermentum, Lact. rhamnosus, Lact. sake, Lact parabuchneri, Lact gallinarum, Lact. casei, Weissella minor and related taxa isolated from kocho and tef. Journal of Applied Microbiology 89 (2000), pp. 969-978.
10. Ordónez J.A., Hierro E.M. & Bruna J.M. Changes in the components of dry-fermented sausages during ripening. Critical Review in Food Science and Nutrition 39 (1999), pp. 329-367.
11. Parente E., Grieco S. & Crudele M.A. Phenotypic diversity of lactic acid bacteria isolated from fermented sausages produced in Basilicata (Southern Italy). Journal of Applied Microbiology 90 (2001), pp. 943-952.
12. Samelis J., Stavropoulos S., Kokouri A. & Metaxopoulos J. Quantifi cation and characterization of microbial populations associated with naturally fermented Greek salami. Food Microbiology 11 (1994), pp. 447–460.
13. Samelis J., Metaxopoulos J., Vlassi M. & Aristea P. Stability and safety of traditional Greek salami – a microbiological ecology study. International Journal of Food Microbiology 44 (1998), pp. 69-82.
14. Santos E.M., González-Fernández C., Jaime I. & Rovira J. Comparative study of lactic acid bacteria house fl ora isolated in different varieties of ʻchorizoʼ. International Journal of Food Microbiology 39 (1998), pp. 123-128.
15. Schillinger U. & Lücke F.-K., Identifi cation of lactobacilli from meat and meat products. Food Microbiology 4 (1987), pp. 199–208.
16. Vergara A., Tantillo G., Aprile A. Isolamento e identifi cazione di ceppi autoctoni di lattobacilli e micrococcaceae da salumi tipici locali. Atti IX Convegno Nazionale A.I.V.I. (1999), pp. 165-170.

173
Ann. Fac. Medic. Vet. di Parma (Vol. XXV, 2005) - pag. 167 - pag. 174
Table 1: Reference strains of lactic acid bacteria and their source.
Strain DSM numberLactobacillus curvatus 20010Lactobacillus sakei subsp. sakei 20017 T
Lactobacillus fermentum 20052T
Lactobacillus brevis 20054 T
Lactobacillus delbrueckii subsp. lactis 20072 T
Lactobacillus plantarum 20174 T
Pediococcus acidilactici 20284 T
Pediococcus pentosaceus 20336 T
Lactococcus lactis subsp. lactis 20343 T
Leuconostoc mesenteroides subsp. mesenteroides 20481 T
Leuconostoc mesenteroides subsp. dextranicum 20484 T
Table 2: Microbial changes during ripening of dry sausages (log10
CFU/g).
Samples Enterobacteriaceae Staph./Kocuria
Staph.Coag +
Pseudomonas LAB Enterococci Yeast/Mould
z 3.18 1.60 <1 6.48 2.60 <1 <1m <1 1.17 <1 3.87 5.85 2.30 <1f <1 2.23 <1 3.11 6.89 3.08 2.60
z: stuffed batterm: product after dryingf: ripened sample
Table 3: Distribution of lactic acid bacteria during ripening.
Species Number of isolates at Total isolatesz m f
Lactic acid bacteria 30 30 30 90Lb. sakei 14 17 15 46Lb. fermentum 7 4 3 14Lb. brevis 1 0 1 2Ln. mesenteroides 2 3 4 9Not identified 6 6 7 19
z: stuffed batterm: product after dryingf: ripened sample
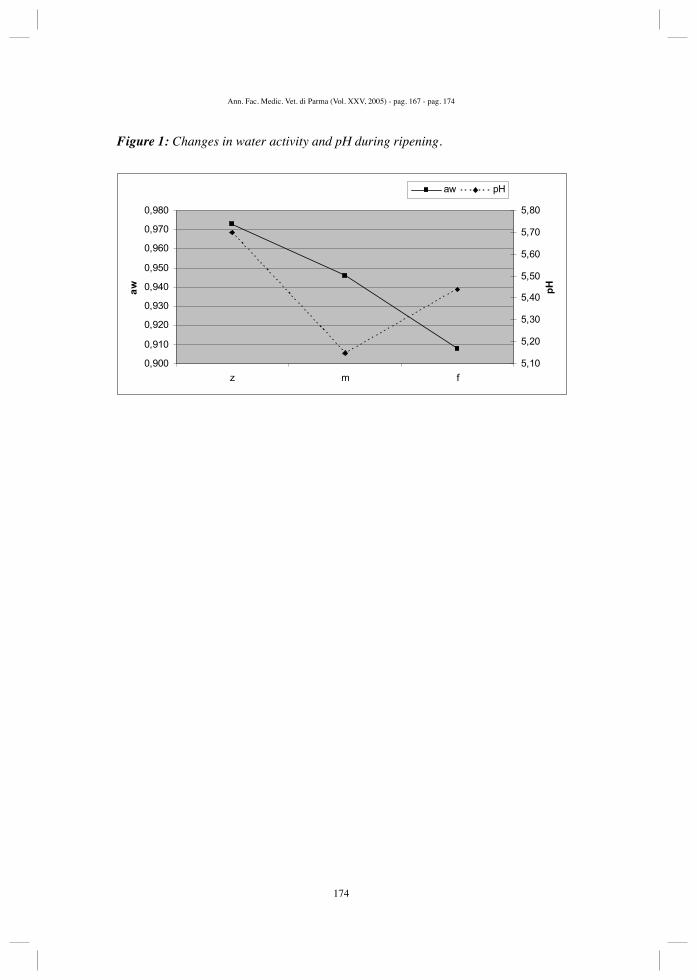
174
Ann. Fac. Medic. Vet. di Parma (Vol. XXV, 2005) - pag. 167 - pag. 174
Figure 1: Changes in water activity and pH during ripening.
0,900
0,910
0,920
0,930
0,940
0,950
0,960
0,970
0,980
z m f
aw
5,10
5,20
5,30
5,40
5,50
5,60
5,70
5,80
pH
aw pH

175
Ann. Fac. Medic. Vet. di Parma (Vol. XXV, 2005) - pag. 175 - pag. 180
Department of Animal Health, Section of Animal Origin Food Inspection, University of Parma* corresponding author. e-mail address: [email protected]
RELATION BETWEEN THE PRESENCE OF EXTRACHROMOSOMAL DNA AND VIRULENCE
FEATURES IN SALMONELLA ENTERICA STRAINS
Bacci C.*, Paris A., Salsi A., Bonardi S., Brindani F.
Introduction
Although several attempts to control its diffusion, Salmonella is still the fi rst responsible of foodborne disease all over the world. The considerable incidence of salmonellosis can be frequently connected to the consumption of food of animal origin; among these, poultry meat, pork and eggs are often involved.
The International Surveillance Network for the Enteric Infections (Enter-Vet, 2004) registered 1.925 isolates from foodstuffs in Italy. The strains, mostly coming from pigs (40.10%) and from poultry (21.87%), belonged to S. Typhimurium (24.78%), S. Derby (14.10%), S. Enteritidis (5.6%), S. Infantis (3.58%) and S. Virchow (0.46%) serotypes.
No signifi cant variations in the prevalence of the main serotypes were noticed about pork isolates, regarding biennium 2002-2003, while in poultry meat a meaningful increase in the frequency of S. Livingstone and a dicrease of S. Virchov were observed (9).
Salmonellas ingested with food, in order to be able to survive and replicate in hosts, must possess chromosomic and plasmidic codifi cated virulence factors. However, phenotypic expression of the virulence genotype depends on the environment and on the growth phase of the microorganism.
The presence of one or more nucleotidic virulence sequences can infl uence the pathogenicity of the various serotypes and even of different strains belonging to the same serovar (4). Particularly, as reported in the literature, the serotypeʼs infectious dose may be infl uenced also by the presence of extrachromosomal stuff like, for example, the virulence plasmid pKDSC50 (49.503 bp).
It is assessed that strains belonging to serovars whose virulence is well known, just as S. Choleraesuis, S. Dublin, S. Enteritidis, S. Pullorum and S. Typhimurium, own differently sized plasmids (50 – 90 Kb).
These plasmids carry both serovar-specifi c virulence genes, and common genic sequences; among these, spv region (6-8 Kb), comprising spvR positive regulon and four structural genes (spvABCD) (1, 2, 8).
Experimental studies suggested that the presence of spv region increases Salmonellaʼs intracellular increase in extraintestinal tissues and favours the interaction between the microorganism and the hostʼs immune system, even if the molecular mechanism is not still completely clear (5, 7).

176
Ann. Fac. Medic. Vet. di Parma (Vol. XXV, 2005) - pag. 175 - pag. 180
In this purpose, the aim of this research was to detect, genic fragments contained in spv region (spvC and spvR genes) in Salmonella enterica strains isolated from poultry meat and pork. Subsequently, the presence of virulence plasmid was evaluated, in order to check the possible integration of plasmidic genes in the bacterial chromosome.
Materials and methods
A total of 25 pork (“cotechino” and sausage) and 20 poultry samples (breast, legs, leg quarters, kebabs of meat and vegetables) were collected from different shops of the large-scale retail trade, in Parma and Reggio Emilia provinces. The isolation of S. enterica was carried out by ISO Standard 6579/1993 method by a reference laboratory; the strains were then serotyped. InstaGeneTM Matrix – Biorad (10) chelating resin was used to extract the genomic DNA from cultures.
The plasmidic genic sequences were amplifi ed in GeneAmp PCR System 2400 (Perkin Elmer) thermal cycler, using primer couples Spvc for/Spvc rev (699 bp) and SPVR1/SPVR2 (891 bp), respectively for spvC and spvR genes (3).
The extraction and the subsequent purifi cation of the plasmid, fi rstly applied to the positive control E. coli K12 strain (NTCC 50192-39R861), was carried out by MiniPrep kit (Invitrogen). The method starts from the preparation of a culture, added with different buffers (Resuspension Buffer, Lysis Buffer, Precipitation Buffer).
The DNA linking and washing step was performed into a purifi cation column, added with Wash Buffer and Elution Buffer, in order to obtain the elution of the genetic stuff.
The amplifi ed fragments and the plasmid extracted from the cultures were visualized by the transluminator, after electrophoresis on agarose gel, respectively 1.6% and 0.8% (Agarose Standard, Eppendorf).
Results
A total of 41 S. enterica strains (11 from poultry and 30 from pork) were isolated. The serotype identifi cation, performed by serological tests, led to the individuation of 12 different serovars (S. Enteritidis, S. Typhimurium, S. Virchow, S. Derby, S. Livingstone, S. Senftenberg, S. Infantis, S. Coeln, S. Agona, S. Bredeney, S. Brandeburg and S. Bovis-morbifi cans).
The research of plasmidic genes detected the presence of spvR gene in all the strains, while spvC gene was individuated only in one S. Enteritidis strain (2.4%) (Picture n. 1).
The results also show that 9 S. enterica strains (21.95%) own the pKDSC50 plasmid (Picture n. 2).
Particularly, plasmid between 63.4 Kb and 148 Kb were detected in S. Enteritidis (1/10), S. Typhimurium (4/13), S. Virchow (2/5), S. Derby (1/3) and S. Infantis (1/1) serotypes (Table n. 1).

177
Ann. Fac. Medic. Vet. di Parma (Vol. XXV, 2005) - pag. 175 - pag. 180
The plasmid was mainly present in S. enterica strains isolated from pork (88.89%) than those from poultry meat (11.11%).
Considerations and conclusions
This study showed a strong heterogeneity between different S. enterica strains regarding the presence of the virulence plasmid. On the contrary the plasmidic gene distribution appeared less diversifi ed, instead; spvR gene was detected in all the strains, while spvC gene was always absent, with the esception of one only strain. It is important to remember that the presence of these genic fragments is not directly connected with bacterial virulence, since their phenotypical expression is strongly depedent on environmental and nutritional stress conditions.
The results showed that only 9 strains on 41 (21.95%) possess the plasmid, thus suggesting that the functions codifi ed by extrachromosomal genic sequences are rarely indispensable for the bacterial survival, in optimum conditions. This could also explain why the bacteria can easily loose the plasmid, above all when the microrganism is sub-cultivated for a long period, as in our research (11).
In plasmid-negative strains (78.05%) owning to the different serovars, spvR plasmidic gene was always detected. It is interesting to notice that one particular S. Enteritidis strain lacked the extrachromosomal stuff but presented both the gene spvR and spvC. This situation emphasizes the possibility of integration of these genic fragments in the bacterial chromosome. In this purpose must be remembered that plasmids can independently replicate independently but, frequently, they can also integrate themselves in the chromosome and multiply with it (episomes).
Finally it is intersting to observe the constant lacking of spvC gene in the 9 plasmid-positive strains, which was probably detached by the plasmid, because of successive coltural passages. Among the plasmid-positive strains, an high percentage is represented by to S. Typhimurium strains (30.76%). This feature is very signifi cant because this serovar, which is the fi rst responsible of human and animal infections, is frequently related to multiresistant phenotypes (e.g. S. Typhimurium DT104 phagetype), which is known to be plasmid-codifi ed (6). In Italy Enter-Vet system detected an high incidence (75.76%) of multiresistant strains, just belonging to this serovar; the phenomenon also appeared quite signifi cant for S. Infantis (13.21%), S. Derby (13.14%) and S. Virchow (10%) (9).

178
Ann. Fac. Medic. Vet. di Parma (Vol. XXV, 2005) - pag. 175 - pag. 180
Table n. 1: Presence of virulence plasmid in strains belonging to different serovars.
Serotypesno. tested strains
no. plasmid-positive strains
PorkPoultry
meat
S. Enteritidis - 10 1 S. Typhimurium 13 - 4S. Virchow 5 - 2S. Derby 3 - 1S. Livingstone 2 - -S. Seftenberg 2 - -S. Coeln 1 - -S. Agona 1 - -S. Bredeney 1 - -S. Brandeburg - 1 -S. Bovis-morbifi cans 1 - -S. Infantis 1 - 1
Totale 30 11 9
Figure n. 1: Electrophoretic course of the amplicon (699 bp) identifying spvC gene.
M N 3 6 11 4 8 22 23 34 28 39 P - - -
699 bp
Legenda:M = marker (Step Ladder 50 bp) (50-3.147 bp) (Sigma)N = negative controlC = positive controln. 23 = positive strainnn. 3, 6, 11, 4, 8, 22, 34, 28, 39 = negative strains

179
Ann. Fac. Medic. Vet. di Parma (Vol. XXV, 2005) - pag. 175 - pag. 180
Figure n. 2 Electrophoretic course related to the presence of virulence plasmid.
M 1 2 12 13 20 25 27 36 40 C
90 Kb
Legenda:M = Pulse marker (2,067-16,210 Kb) (Sigma)C = positive control (E. coli K12, NTCC 50192-39R861)nn. 2-12-13-25-27-36 = positive strains
Key-words: Salmonella enterica, virulence genes, plasmid, pork, poultry meat.
Parole chiave: Salmonella enterica, geni di virulenza, plasmidio, carne di suino, carne di pollo.
Mots clés: Salmonella enterica, genes de virulence, plasmide, viande de porc et poule.
References
1. Abe A., Kawahara K. (1995). Trascriptional regulation and promoter sequence of the spvR gene of virulence plasmid pKDSC50 in Salmonella choleraesuis sierovar Choleraesuis. FEMS Microbiol. Lett., 129, 225-230.
2. Abe A., Matsui H., Danbara H., Tanaka K., Takahashi H., Kawarahara K. (1994). Regulation of spvR gene expression of salmonella virulence plasmid pKDSC50 in Salmonella choleraesuis sierovar Choleraesuis. Mol Microbiol., 12, (5), 779-787.
3. Abouzeed Y. M., Hariharan H., Poppe C., Kibenge F. S. B. (2000). Characterization of Salmonella isolates from beef cattle, broiler, chickens and human sources on Prince Edwards Island. Comp. Immunol. Microbiol. Infect. Dis., 23, (4), 253-266.
4. Bacci C., Paris A., Bonardi S., Brindani F. (2004). Fattori di patogenicità in stipiti di Salmonella spp. isolati da differenti matrici alimentari: indagini preliminari.

180
Ann. Fac. Medic. Vet. di Parma (Vol. XXV, 2005) - pag. 175 - pag. 180
Atti XIV Convegno A.I.V.I. Vol. XIV, pag. 403-408.5. Bakshi C. S., Singh V. P., Malik M., Singh R. K., Sharma B. (2003). 55 Kb
Plasmid and virulence-associated genes are positively with Salmonella enteritidis phatogenicity in mice and chickens, Vet. Res. Comm., 27, 425-432.
6. Cox J. (2000). Salmonella. Enciclopedia of food Microbiology, Batt C. A., Patel P. D., Academic Press, 1928-1935.
7. Gulig P., Danbara H., Guiney D. G., Lax A. J., Norel F., Rhen M. (1993). Molecular analysis of spv virulence genes of the Salmonella virulence plasmids. Mol. Microbiol. 7, (6), 825-830.
8. Haneda T., Okada N., Nakazawa N., Kawakami T., Danbara H. (2001). Complete DNA sequenze and comparative analysis of the 50-Kilobase virulence plasmid of Salmonella enterica serovar Choleraesuis. Inf. Immunol. 69, (4), 2612-2620.
9. http://www.izsvenezie.it10. International Standard ISO 6579:2002 Fourth Edition (15.07.2002). Microbiology
of food and animal feeding stuffs. Horizontal method for the detection of Salmonella spp.
11. Swamy S. C., Barnhart H. M., Lee M. D., Dreesen D. W. (1996). Virulence determinants invA and spvC in Salmonellae isolated from poultry products, wastewater and human sources. Appl. Environ. Microbiol. 62, (10), 3768-3771.
Summary: The presence of the virulence plasmid pKDSC50 was investigated in Salmonella enterica strains isolated from pork and poultry meat. Genic fragments (spvC and spvR) included in the homonimous plasmidic region were also detected by biomolecular technique (PCR). 41 S. enterica strains (30 from pork and 11 from poultry meat) were collected. Serotyping allowed to detect 12 different S.enterica serovars. SpvR gene was found in all the strains, while spvC gene was found only in one S. Enteritidis strain (2.40 %). The investigation on the virulence plasmid resulted in 9 positive S. enterica strains (21.95%). Particularly, plasmids sized from 63.4 Kb and 148 Kb were detected in S. Enteritidis (1/10), S. Typhimurium (4/13), S. Virchow (2/5), S. Derby (1/3) and S. Infantis (1/1).
Riassunto: E stata ricercata la presenza del plasmidio di virulenza pKDSC50 in stipiti di Salmonella enterica, isolati da matrici carnee avicole e suine e, con tecnica biomolecolare (PCR), sono stati individuati i frammenti genici (geni spvC e spvR) appartenenti alla regione plasmidica omonima. Sono stati isolati complessivamente 41 stipiti di S. enterica, 11 di provenienza avicola e 30 suina. L indagine sierologica ha portato allʼindividuazione di 12 diversi serovar (S. Enteritidis, S. Typhimurium, S.Virchow, S. Derby, S. Livingstone, S. Seftenberg, S. Infantis, S. Coeln, S. Agona, S. Bredeney, S. Brandeburg e S. Bovis-morbifi cans). Il gene spvR è stato trovato in tutti i ceppi saggiati, mentre spvC è risultato presente solamente in uno stipite di S. Enteritidis (2,4%). La presenza del plasmidio di virulenza è stata evidenziata in 9 stipiti di S. enterica (21,95%); in particolare sono stati rilevati plasmidi, di dimensioni comprese tra 63,4 Kb e 148 Kb, nei sierotipi S. Enteritidis (1/10), S. Typhimurium (4/13), S. Virchow (2/5), S. Derby (1/3) e S. Infantis (1/1).

181
Ann. Fac. Medic. Vet. di Parma (Vol. XXV, 2005) - pag. 181 - pag. 190
1 Dipartimento di Salute Animale, Sezione di Ispezione degli Alimenti di origine animale Facoltà di Medicina Veterinaria, Università di Parma2 Istituto Zooprofi lattico Sperimentale della Lombardia e dellʼEmilia Romagna, Sede di Parma* corresponding authore-mail address: [email protected]
NON-O157:H7 VEROCYTOTOXIN-PRODUCING ESCHERICHIA COLI ISOLATED FROM CATTLE AT
SLAUGHTER IN NORTHERN ITALY
Bonardi S.1*, Chiapponi C.2, Bacci C.1 , Paris A.1, Salsi A.1
Introduction
The clinical importance of verocytotoxin-producing Escherichia coli (VTEC) was fi rst recognised in the U.S.A. in 1982, when E. coli O157:H7 infection was associated to an outbreak of haemorrhagic colitis due to the consumption of ground beef (Riley et al., 1983). Since then, numerous epidemiological studies have been carried out to better understand the role of cattle as reservoir of the microorganism. Nevertheless, E. coli O157:H7 is not the only VTEC serotype responsible of human illnesses. Approximately 60 other VTEC serotypes have been implicated in human diseases ranging from mild diarrhoea to severe haemorrhagic colitis (HC) and life-threatening haemolytic uraemic syndrome (HUS). Toxins produced by VTEC are considered the major causes of illnesses; they are referred as verocytotoxin 1 (VT1) and verocytotoxin 2 (VT2).
The involvement of non-O157:H7 VTEC strains in human foodborne outbreaks has increased dramatically in the past decade. In Australia (Goldwater and Bettelheim, 1996) and Argentina (Lopez et al., 1989), non-O157 VTEC infections appear to be more common than O157:H7 infections, and in Germany non-O157 VTEC serotypes have replaced O157:H7 as the VTEC most commonly isolated in HUS cases (Huppertz et al., 1996). The most common non-O157 VTEC serogroups associated with human diseases are O26, O111, O128, and O103 (Bettelheim, 2000). Infections by O111:H- in Italy (Caprioli et al., 1994) and Australia (Cameron et al., 1995) are well documented, as infections by O111:H2 in Germany (Morabito et al., 1998), by O111:H8 in the USA (CDC, 2000), by O103:H2 in France (Mariani-Kurkdjian et al., 1993), in the USA (Tarr et a.l, 1996) and in Germany (Karch et al., 1997), by O145:H5 in Japan (Kudoh et al., 1994) and by O104:H21 in the USA (CDC, 1995). In December 2005, an outbreak of HUS associated to O26 VTEC contaminated unpasteurized Camembert cheese was recognized in France (http://www.promedmail.org). In Italy, in 2005 six children infected with O26 VTEC developed HUS in Salerno Province and one of them died (Scavia et al., 2005).
Previous surveys elucidated the role of cattle as reservoirs of VTEC O157:H7 in Italy (Conedera et al., 1997; Bonardi et al., 1999; Bonardi et al., 2001) but

182
Ann. Fac. Medic. Vet. di Parma (Vol. XXV, 2005) - pag. 181 - pag. 190
little is known about the prevalence of other VTEC serotypes in cattle reared and slaughtered in our country. Therefore, as nowadays it seems unrealistic to investigate cattle for only one serotype as O157:H7, the aim of latter studies was to examine the prevalence of non-O157 VTEC serotypes in cattle at slaughter in Italy (Bonardi et al., 2004).
Materials and Methods
Sampling
Between September 2001 and September 2004, a total of 247 samples of bovine caecal content were collected immediately after slaughter in fi ve abattoirs of Emilia Romagna Region, northern Italy. The samples were collected and analysed in two different periods. In particular, 145 samples were collected between September 2001 and June 2002 (part i sampling), and the remaining 114 samples were collected from October 2003 to September 2004 (part ii sampling). Specimens were from 121 feedlot cattle (intensively reared cattle, not at pasture; live weight 550-650 kg) and 126 dairy cows. The animals were reared in 71 and 87 farms respectively, located in eight Italian provinces (Parma, Reggio Emilia, Piacenza, Modena, Mantova, Cremona, Brescia, and Perugia).
Faecal material was aseptically collected from the caecum of cattle immediately after slaughter, placed in separate sterile containers and examined on the day of collection. During transport to the laboratory, all samples were stored at + 4°C.
Immunomagnetic separation - slide agglutination technique
For non-O157 VTEC strains detection, two different analytical procedures were followed in the two sampling periods.
In part i sampling, a 10-g aliquot of caecal material was suspended in 90 ml Tryptone Soya Broth (TSB, CM 129; Oxoid, Basingstoke, UK) added with vancomycin 8 μg/l (N1404; Sigma-Aldrich, Steinheim, Germany), and incubated at 37° C overnight. After enrichment, the brothcultures were ten-fold diluted to 10-6 in Phosphate Buffer Solution (PBS, BR 14G; Oxoid) and a 10 μl-aliquot of each dilution was plated onto Enterohaemolysin Agar (EHLY Agar, PB 5105; Oxoid) and onto MacConkey Agar (CM 007; Oxoid). Plates were incubated at 37° C for 24 h. Colonies surrounded by a narrow zone of haemolysis (Beutin et al., 1989) were selected for confi rmation. Moreover, as not all VTEC strains produce the enterohaemolysin (Beutin, 2001; Jenkins et al., 2002), non-haemolytic colonies on EHLY agar, or purple colonies on MacConkey agar, were picked up for further testing. Up to 10 colonies per sample were tested for indole production. Indole-positive cultures were confi rmed biochemically as E. coli by using API 20E system (bioMérieux, Marcy-lʼEtoile, France).
In part ii sampling, faecal samples were examined for the presence of non-

183
Ann. Fac. Medic. Vet. di Parma (Vol. XXV, 2005) - pag. 181 - pag. 190
O157 VTEC by using an immunomagnetic separation (IMS) technique. A 10-g aliquot of caecal material was suspended in 90 ml of modifi ed Tryptone Soya Broth (m-TSB, CM 989; Oxoid) supplemented with novobiocin 20 mg/l (N1628; Sigma-Aldrich). The enrichment broths were incubated at 37° C overnight. IMS was performed using the Dynabeads ® anti-E. coli O26, O103, O111, and O145 (DY 71013, DY 1011, DY 1009, DY 1007; Dynal, Oslo, Norway), following the manufacturerʼs instructions. Two-50 μl-aliquots of serogroup O26, O103, O111, O145 beads were streaked onto Chromocult ® Coliform Agar (1.10426; Merck, Darmstadt, Germany) and EHLY agar. For O26 VTEC detection, the chromogenic medium was replaced by Cefi xime Tellurite Rhamnose Mac Conkey Agar (CT – RMAC). RMAC was prepared as follows from Mac Conkey agar base (281810; Difco, Detroit, Mich.) with no lactose: MacConkey agar base (40 g) and rhamnose (10 g) were mixed in 1 liter of distilled water, autoclaved at 121°C for 15 m and then supplemented with Cefi xime (0.05 mg/l) and Potassium Tellurite (2.5 mg/l) (CT Selective Supplement, SR 172E; Oxoid). In CT-RMAC, lactose of Mac Conkey agar is replaced by rhamnose because VTEC O26 strains do not ferment the latter carbohydrate, generating colourless colonies easier to select (Hiramatsu et al., 2002).
Chromocult ® Coliform agar, EHLY agar and CT-RMAC plates were incubated at 37° C for 24 h. Suspect E. coli colonies (dark blue-violet on Chromocult ® Coliform agar, smooth and surrounded by a narrow halo of haemolysis on EHLY agar, colourless on CT-RMAC plates) were picked up for further testing. Colonies from EHLY agar and CT-RMAC were tested for indole production and, if positive, for slide agglutination with specifi c antisera. Colonies from Chromocult ® Coliform agar were tested for slide agglutination, without performing the indole-production screening test. Slide agglutination test was performed with serogroup O26, O103, O111, and O145 specifi c antisera (Statens Serum Institut, Copenhagen, Denmark). Agglutinating colonies were plated on Tryptone Soy Agar (TSA), incubated at 37° C overnight, and pure cultures were biochemically identifi ed as E. coli by using the API 20E system (bioMérieux).
Identifi cation of VTEC strains by the Vero Cell Assay (VCA) and PCR analysis
Presumptive O26, O103, O111, and O145 VTEC strains were tested on Vero Cell monolayers (Caprioli et al., 1992) and VCA positive cultures were analysed for the presence of virulence genes. PCR amplifi cation was performed by using the primer pairs KS7/KS8 for vt1 gene (Russmann et al., 1995), GK3/GK4 for vt2 (Russmann et al., 1995), and SK1/SK2 for eae gene (Karch et al., 1993).
Serotyping of non-O157 VTEC
Seroyping of O-antigens of non-O157 VTEC isolates was performed by the “Robert Koch Institute” of Berlin, Germany, according to Orskov and Orskov

184
Ann. Fac. Medic. Vet. di Parma (Vol. XXV, 2005) - pag. 181 - pag. 190
methods (1984). Typing of H-antigens was performed by the “National Escherichia coli Reference Laboratory” of Melbourne University, Australia.
Results
A total of nine non-O157 VTEC strains were isolated from the faecal matter of 247 slaughtered cattle (3.6%) in the two different sampling periods, as shown in Tables 1 and 2.
The isolates were detected from 7 of 126 dairy cows (5.7%) and from 2 of 121 feedlot cattle (1.6%). Eight of nine strains lacked the eae gene for intimate adherence to epithelial cells of large bowel and for A/E lesions, while only the O26 E. coli isolate possessed the eae gene virulence determinant.
The faecal carriers came from nine farms located in different regions of Italy.
Animal VCA Toxin genotype eae gene Serotype Vtx1 Vtx2
Dairy cow + - + - O91:H-Dairy cow + + + - O109:H-Dairy cow + + - - O116:H21Feedlot cow + + + - ONTDairy cow + + + - O117:H7Dairy cow + + - - O110:H2Dairy cow + + + - O74:HNT
Table 1: Non-O157 VTEC strains isolated from the intestinal content of cattle at slaughter (fi rst sampling period: September 2001 – June 2002)
Animal VCA Toxin genotype eae gene Serogroup/seroptype Vtx1 Vtx2
Dairy cow + + - + O26Feedlot cow + - + - O91:H-
Table 2: Non-O157 VTEC strains isolated from the intestinal content of cattle at slaughter (second sampling period: October 2003 – September 2004)
Discussion and conclusions
The two studies on non-O157 VTEC carriage by feedlot cattle and dairy cows reared in Italy showed that different VTEC serotypes were shedding by slaughtered animals, although the prevalence was low (3.6%).

185
Ann. Fac. Medic. Vet. di Parma (Vol. XXV, 2005) - pag. 181 - pag. 190
The only VTEC strain responsible for severe human disease, isolated from healthy cattle, belonged to serogroup O26. Nowadays in Italy O26 VTEC isolates represent the major cause of HUS in children (Scavia et al., 2005). Since 1988 to 2004, O26 VTEC strains have been responsible for 21.1% of aetiological identifi ed HUS cases in paediatric patients (EnterNet Italia, 2005). In USA, a twenty-year study that confi rmed the importance of non-O157 VTEC strains in human infections, pointed out that, among non-O157 serogroups, the most common were O26 (22%), O111 (16%), O103 (12%), O121 (8%), O45 (7%), and O145 (5%) (Brooks et al., 2005). As described by Bettlheim (2003), O26 VTEC should be considered as pathogens for both cattle and humans, being isolated from sick and healthy cattle (ratio 4:3) as well as from sick and healthy people (ratio 76:3). The O26 VTEC serogroup probably occurs exclusively in cattle, their foodstuffs, and humans (Bettleheim, 2003).
Among eae-negative VTEC strains, two O91:H- isolates were detected in the intestinal content of healthy dairy cows. VTEC O91:H- , VT2 positive, is responsible for human non-bloody diarrhoea (Pierard et al., 1994; Beutin et al,. 2001; Caprioli et al., 2001) and has been isolated from healthy people and cattle (Bettelheim, 2003) as well as from healthy pigs (DesRosiers et al., 2002). Another human pathogenic VTEC isolate, E. coli O117:H7, VT1 and VT2 positive, shedded by a dairy cow, is responsible for diarrhoeal disease in humans (Pierard et al., 1990; Pierard et al., 1994).
E. coli serotype O116: H21, VT1 positive, detected in a dairy cow, was isolated from healthy cattle in previous studies in USA (Wells et al., 1991) and in Canada (Sandhu et al., 1996) and can be considered distributed all over the world.
Two different analytical procedures were employed to detect VTEC strains. In the previous study, the faecal samples enrichment step was followed by serial dilutions and plating onto EHLY Agar and MacConkey Agar. Therefore, phenotypic characters (enterohaemolysin production and lactose fermentation) were employed as markers for the selection of colonies and further characterization of the isolates. Moreover, as some VTEC strains do not produce the enterohaemolysin (Beutin, et al, 2001; Jenkins et al., 2002), for each sample at least two or three not-haemolytic colonies were selected for confi rmation. In this investigation, anyway, no isolate lacking the enterohaemolytic phenotype was recognized as VTEC strain. In the second study, after the enrichment step, the faecal cultures were tested with IMS technique by the use of O26, O103, O111, and O145 antibodies coated beads and thereafter the beads-bacteria complexes were plated onto different selective media. The most useful medium for the isolation of O26 VTEC strains resulted to be the CT-RMAC (Hiramatsu et al., 2002). Surprisingly, in the second study one O91:H- VTEC strain was detected because of its not-specifi cally coating to O103 Dynabeads®.
On our opinion, the present results could be useful for other non-O157 VTEC investigations based on conventional microbiological methods, because the contemporary employ of both analytical procedures seems to be necessary for the detection of a wider spectrum of VTEC serotypes. After a common enrichment step, the cultures should be both processed by IMS technique and plated onto EHLY agar after serial dilutions, in order to recognize VTEC strains on the basis of the serogroup (IMS) and the enterohaemolysin production (EHLY agar medium). The use of CT-

186
Ann. Fac. Medic. Vet. di Parma (Vol. XXV, 2005) - pag. 181 - pag. 190
RMAC is strongly recommended for selecting rhamnose not-fermenting O26 VTEC colonies after O26-IMS technique.
The major problem in detecting non-O157 VTEC is, in fact, that apart from VT1 and/or VT2 production, they are very similar to other commensal E. coli strains (Bettelheim, 2003). The only characteristics that could be really discriminating for colonies selection is a decreased ability to ferment carbohydrate-like substances (Bettelheim, 1997), as sorbitol for O157 VTEC and rhamnose for O26 VTEC, and the enterohaemolysin production (Beutin et al., 1989). Anyway, VTEC colonies confi rmation is necessary linked to virulence determinants identifi cation, mostly performed by PCR technique.
As there are over 60 VTEC serotypes that have been associated with human illnesses (HC and HUS), any attempt should be made to isolate them from human or animal sources (Bettelheim, 2003). Moreover, as VTEC strains may be often harmless to ruminants, in which they are able to spread from animal to animal, while they are so potent human pathogens, surveillance in the natural host niche (ruminants) and in foodstuffs thereof should be never interrupted.
Acknowledgements
The authors gratefully acknowledge Dr. Lothar Beutin, Robert Koch Institut, Berlin, and Prof. Karl Bettelheim, National Escherichia coli Reference Laboratory, Melbourne University, for VTEC strains serotyping.
We are grateful to Mrs. Ida Poli and Mrs. Giuseppina Trentadue for technical assistance.
References
• Bettelheim K.A. Biochemical studies on enterohaemorrhagic Escherichia coli (EHEC). In: Kay D., Fricker C., Eds. Coliforms and E. coli. Problem or Solution. Gateshead, Tyne, and Wear, UK: Royal Society of Chemistry. Ateneum Press, pp. 243-248, 1997.
• Bettelheim K.A. Role of non-O157 VTEC. J. Appl. Microbiol. Symp. Suppl. 88: 38S-50S, 2000.
• Bettelheim K.A. Non-O157 Verotoxin-producing Escherichia coli: a problem, paradox, and paradigm. Exp. Biol. Med. 228:333-344, 2003.
• Beutin L., Montenegro M. A., Orskov I., Orskov, F., Prada, J., Zimmermann, S. Stephan, R. Close association of Verotoxin (Shiga-like toxin) production with enterohemolysin production in strains of Escherichia coli. J. Clin. Microbiol. 27: 2559-2564, 1989.
• Beutin L., Zimmermann S. Gleier K. Association between serotypes, virulence markers and disease in a group of 679 Verocytotoxin-producing Escherichia coli (VTEC) strains isolated from human patients in Germany (1997-1999). A technical booklet produced for an EU Concerted Action (CT98-3935), pp. 5-11,

187
Ann. Fac. Medic. Vet. di Parma (Vol. XXV, 2005) - pag. 181 - pag. 190
ISBN 1 84170 147 5, 2001.• Bonardi S., Maggi E., Bottarelli A., Pacciarini M.L., Ansuini A., Vellini G.,
Morabito S., Caprioli A. Isolation of Verocytotoxin-producing Escherichia coli O157:H7 from cattle at slaughter in Italy. Vet. Microbiol. 67: 203-211, 1999.
• Bonardi S., Maggi E., Pizzin G., Morabito S., Caprioli A. Faecal carriage of Verocytotoxin- producing Escherichia coli O157 and carcass contamination in cattle at slaughter in northern Italy. Int. J. Food Microbiol. 66: 47-53, 2001.
• Bonardi S., Foni E., Brindani F., Bacci C., Chiapponi C., Cavallini P. Detection and characterization of verocytotoxin-producing Escherichia coli (VTEC) in cattle at slaughter. New Microbiologica, 27, 255-261, 2004.
• Brooks J.T., Sowers E.G., Wells J.G., Greene K.D., Griffi n P.M., Hoekstra R.M., Strockbine N.A. Non-O157 Shiga toxin-producing Escherichia coli infections in the Unites States, 1983-2002.
• Cameron S., Walzer C., Beers M., Rose N., Anear E. Enterohaemorrhagic Escherichia coli outbreak in South Australia associated with consumption of mettwurst. Comm. Dis. Intell. 19, 70-71, 1995.
• Caprioli A., Luzzi I., Rosmini F., Pasquini P., Cirrincione R., Gianviti A., Matteucci M.C. Rizzoni G. Hemolytic-uremic syndrome and Vero cytotoxin-producing Escherichia coli infection in Italy. The HUS Italian Study Group. J.Infect. Dis. 166: 154-158, 1992.
• Caprioli A., Luzzi I., Rosmini F., Resti C., Edefonti A., Per fumo F., Farina C., Goglio A., Gianviti, Rizzoni G. Community-wide outbreak of hemolytic-uremic sindrome associated with non-O157 verocytotoxin-producing Escherichia coli.J. Infect. Dis. 169, 208-211, 1994.
• Caprioli A., Morabito S., Minelli F., Marziano M.L., Gorietti S., Pinchiorri T., Tozzi A. E. VTEC infections, 1988-2000. Notiziario dellʼIstituto Superiore di Sanità, 14, Suppl. 1, 2-3, 2001.
• Conedera G., Marangon S., Chapman P.A., Zuin A., Caprioli A. Atypical strains of verocytotoxin-producing Escherichia coli O157 in beef cattle at slaughter in Veneto region. J. Vet. Med. B 44: 301-306, 1997.
• Centers for Disease Control and Prevention. Outbreak of acute gastroenteritis attributable to Escherichia coli serotype O104:H21 – Helena, Montana, 1994. Centers for Disease Control and Prevention. Morbid. Mortal. Weekly Rep. 44:501-503.
• Centers for Disease Control and Prevention. Escherichia coli O111:H8 outbreak among teenage campers - Texas, 1999. Centers for Disease Control and Prevention. Morbid. Mortal. Weekly Rep. 49:321-324.
• DesRosiers A., Fairbrother J.M., Johnson R.P., Desautels C., Letellier A., Quessy S. Phenotypic and genotypic characterization of Escherichia coli verotoxin-producing isolates from humans and pigs. J. Food Prot., 64, 1904-1911.
• ENTER-NET Italia. Sorveglianza delle infezioni da E. coli produttori di verocitotossina (VTEC) nella popolazione umana: 1988-2004. (Surveillance of human infection by verocytotoxin-producing E. coli (VTEC): 1988-2004).Available from: www.simi.iss.it/enternet/dati
• Goldwater P.N., Bettelheim K.A. An outbreak of haemolytic uremic syndrome due

188
Ann. Fac. Medic. Vet. di Parma (Vol. XXV, 2005) - pag. 181 - pag. 190
to Escherichia coli O157:H7: or was it? Emerg. Infect. Dis. 2: 153-154, 1996.• Hiramatsu R., Matsumoto M., Miwa Y., Suzuki Y., Saito M., Miyazaki Y.
Characterization of Shiga-toxin producing Escherichia coli O26 strains and establishment of a selective isolation media for these strains. J. Clin. Microbiol. 40: 922-925, 2002.
• Huppertz H., Busch D., Schmidt H., Aleksic S., Karch H. Diarrhea in young children associated with Escherichia coli non-O157 organisms that produce Shiga-like toxins. J. Pediatr. 128: 341-346, 1996.
• Jenkins C., Pearce M.C., Chart H., Cheasty T., Willshaw G.A., Gunn G.J., Dougan G., Smith H.R., Synge B.A., Frankel G. An eight-month study of a population of verocytotoxigenic Escherichia coli (VTEC) in a Scottish cattle herd. Appl. Microbiol. 93: 944-953, 2002.
• Karch H., Geitz C., Schmidt H. Increased Incidence of Infections with EHEC O103:H2. Notiziario dellʼIstituto Superiore di Sanità 10 (3):2, 1997.
• Kudoh Y., Kai A., Obata H., Kusunoki J., Monma C., Shingaki M., Yanagawa Y., Yamada S., Mtushita S., Itoh T., Ohta K. Epidemiological Surveys on Verocytotoxin-Producing Escherichia coli Infections in Japan. In: Karmali M.A., Goglio A.G., Eds. Recent Advances in Verocytotoxin-Producing Escherichia coli Infections (Excerpta Medica International Congress Series 1072). Amsterdam, The Netherlands: Elsevier Science, pp. 53-56, 1994.
• Lopez E.L., Diaz M., Grinstein S., Devoto S., Mendila-hatzu F., Murray B.E. et al. Hemolytic uremic syndrome and diarrhoea in Argentine children: the role of Shiga-like toxins. J. Infect. Dis. 160: 469-475, 1989.
• Mariani-Kurkdjian P., Denamur E., Milon A., Picard B., Cave H., Lambert-Zechovsky N., Loirat C., Goullet P., Sansonetti P., Elion J. Identifi cation of a clone of Escherichia coli O103:H2 as a potential agent of haemolytic uremic syndrome in France. J. Clin. Microbiol. 31: 296-301, 1993.
• Morabito S., Karch H., Mariani-Kurkdjian P., Schmidt H., Minelli F., Bingen E., Caprioli A. Enteroaggregative, Shiga-toxin producing Escherichia coli O111:H2 associated with an outbreak of haemolytic-uremic syndrome. J. Clin. Microbiol. 34: 840-842, 1998.
• Orskov F. , Orskov I. (1984). Serotyping of Escherichia coli. Methods in Microbiology Academic Press, London. 14, 43-112.
• Pierard D., Van Etterijck R., Breynaert J., Moriau L., Lauwers S. Escherichia coli in faeces in Belgium. Eur. J. Clin. Microbiol. Infect. Dis., 9 (3): 198-201, 1990.
• Piérard D., Van Damme L., Stevens D., Moriau L., Lauwers S. Three years screening for VTEC in human stools in Brussels. In: Karmali M.A., Goglio A.G., Eds. Recent Advances in Verocytotoxin-Producing Escherichia coli Infections (Excerpta Medica International Congress Series 1072). Amsterdam, The Netherlands: Elsevier Science, pp. 33-36, 1994.
• Riley L.W., Remis R.S., Helgerson S.D., McGee H.B., Well J.G., Davis B.R., Hebert R.J., Olcott E.S., Johnson L.M., Hargrett N.T., Blake P.A., Cohen M.L. Hemorrhagic colitis associated with a rare Escherichia coli serotype. New Engl. J. Med. 308: 681-685, 1983.
• Sandhu K.S., Clarke R.C., McFadden K., Brouwer A., Loouie M., Wilson J., Lior

189
Ann. Fac. Medic. Vet. di Parma (Vol. XXV, 2005) - pag. 181 - pag. 190
H., Gyles C.L.. Prevalence of the eaeA gene in verotoxigenic Escherichia coli strains from dairy cattle in Southwest Ontario. Epidemiol. Infect., 116, 1-7, 1996.
• Scavia G., Botta A., Ciofi degli Atti M.L., Di Fluri G., Ferretti A., Galero G., Marziano M.L., Merla R., Minelli F., Montini G., Pecoraro C., Pizzuti R., Tozzi A.E, Trani A.M., Caprioli A. Episodio epidemico di Sindrome Emolitico Uremica (SEU) associata a infezione da E. coli O26, in provincia di Salerno. V Workshop Nazionale Enter-net Italia, Sistema di sorveglianza delle infezioni enteriche. Sorveglianza e prevenzione delle infezioni gastroenteriche. Istituto Superiore di Sanità, Roma, 1-2 Dicembre 2005, pp. 73.
• Tarr P.I., Fouser L.S., Stapleton A.E., Wilson R.A., Kim H.H., Vary J.C., Clausen C.R. Hemolytic-uremic syndrome in a six-year-old girl after a urinary tract infection with Shiga-toxin-producing Escherichia coli O103:H2. N. Engl. J. Med. 335: 635-638, 1996.
• Wells J.G., Shipman L.D., Greene K.D., Sower E.G., Green J.H., Cameron D.N., Downes F.P., Martin M.L., Griffi n P.M., Ostroff S.M. et al. Isolation of Escherichia coli O157:H7 and other Shiga-liketoxin-producing E. coli from dairy cattle. J. Clin. Microbiol., 29, 985-989, 1991.
Riassunto
Gli stipiti di Escherichia coli verocitotossici (VTEC) rappresentano un problema per la salute pubblica, in quanto responsabili di gravi forme cliniche nellʼuomo, quali la sindrome emolitico-uremica e la colite emorragica, oltre ad episodi di diarrea non ematica. Oltre ad E. coli O157, che vede nella specie bovina un importante reservoir, le infezioni umane sono sostenute da altri sierogruppi VTEC, quali O26, O103, O111, O145. Allo scopo di valutare lʼimportanza dei bovini quali portatori intestinali di E. coli produttori di verocitotossine appartenenti a sierogruppi diversi da O157, 247 animali sono stati esaminati al termine delle operazioni di macellazione. Dal contenuto cecale di 8 soggetti (3,2%) sono stati isolati ceppi di E. coli produttori di verocitotossine appartenenti ai sierotipi O91:H-, O109:H-, O116:H21, O117:H7, O110:H2, O74:HNT, ma sprovvisti del gene eae per lʼadesione alle cellule dellʼepitelio intestinale. Da un solo animale (0,4%) è stato isolato un ceppo di E. coli O26 provvisto dei geni vtx1 ed eae , quindi uno stipite altamente patogeno per lʼuomo.
Parole chiave: Escherichia coli, verocitotossine, VTEC, bovini
Summary
Verocytotoxin-producing Escherichia coli (VTEC) strains have emerged as pathogens that can cause food poisoning and severe and potentially fatal illnesses. They are a major cause of gastroenteritis that may be complicated by hemorrhagic colitis or the haemolytic-uremic syndrome. Human infections are caused by E. coli

190
Ann. Fac. Medic. Vet. di Parma (Vol. XXV, 2005) - pag. 181 - pag. 190
serogroup O157, frequently shedded by cattle, and by other VTEC serogroups such as O26, O103, O111, O145. The aim of this study was to evaluate the carriage rate of non-O157 VTEC strains by cattle at slaughter. A total of 247 cattle were randomly selected at slaughter and from the caecal material of 8 animals (3.2%) were detected the following VTEC serotypes lacking the eae gene: O91:H-, O109:H-, O116:H21, O117:H7, O110:H2, O74:HNT. E. coli O26, positive for vtx1 and eae genes, was isolated from only one slaughtered animal (0.4%).
Key words: Escherichia coli, verocytotoxins, VTEC, cattle

191
Ann. Fac. Medic. Vet. di Parma (Vol. XXV, 2005) - pag. 191 - pag. 204
LE PATOLOGIE OCULARI NEL PASTORE TEDESCO: STUDIO RETROSPETTIVO
Bacchini M., Simonazzi B.
Sezione di Clinica Chirurgica Veterinaria e Medicina DʼUrgenza, Dipartimento di Salute Animale, Facoltà di Medicina Veterinaria, Università degli Studi di Parma.
INTRODUZIONE
Il Pastore Tedesco, secondo alcuni discenderebbe dai lupi selvatici incrociati con cani selvatici, secondo altri, invece, trarrebbe origine dallʼantico cane dellʼetà del bronzo, vissuto alcuni millenni prima di Cristo, originario dellʼAsia e diffusosi rapidamente in Europa; per tornare a tempi più recenti, il Pastore Tedesco nella sua forma attuale, è frutto di una ferrea selezione degli allevatori della Germania che hanno curato in maniera veramente abile, sia lʼaspetto estetico funzionale, sia quello caratteriale.
La testa è proporzionata alle dimensioni del corpo (la lunghezza è circa il 40% dellʼaltezza al garrese), deve essere cuneiforme, né troppo tozza, né troppo allungata, asciutta nellʼinsieme e moderatamente larga tra le orecchie. La fronte, vista sia dal davanti che di profi lo, appare leggermente convessa, senza solco mediano o appena accennato. La lunghezza del cranio corrisponde a quella della fronte, mentre la larghezza corrisponde allʼincirca alla sua lunghezza. Vista dallʼalto la testa si restringe regolarmente verso il muso cuneiforme, dalle orecchie al tartufo, con salto naso-frontale non molto accentuato. Mascella e mandibola sono ben sviluppate e forti. La canna nasale è diritta.
La selezione e la ricerca degli allevatori, per avere cani di razza Pastore Tedesco sempre più vitali e sani, hanno indotto a sottoporre molti soggetti a controlli sanitari di vario tipo. Oggi esistono soggetti, sottoposti a controllo veterinario specialistico, in possesso di certifi cazioni dʼassenza di patologie tipiche della razza. Lo stesso ENCI sta avvertendo lʼesigenza di migliorare sempre più le varie razze con certifi cazioni che ne comprovano la salute e la riproduzione di qualità. Esiste, infatti, da qualche anno, il problema dei soggetti provenienti da paesi poco attenti alla salute degli animali: in genere paesi dellʼest europeo o extraeuropei. In questo caso, per unʼeconomia dʼacquisto, si portano in casa, elementi malati o destinati a malattie anche molto gravi. Gli allevatori seri e appassionati della razza proseguono nel tentativo di tutela, anche se con diffi coltà; molti altri invece si ritirano e lasciano il passo al business e alla speculazione, con danni terribili e irreparabili.
Gli occhi del Pastore Tedesco sono di media grandezza, a mandorla, leggermente obliqui e non sporgenti. Il colore deve essere adeguato a quello del pelo, il più scuro possibile; lʼocchio chiaro, pungente è indesiderato perché altera lʼespressione.
Il College Americano degli Oftalmologi Veterinari ha riportato come patologie oculari supposte di natura ereditaria nel Pastore Tedesco: la cheratite

192
Ann. Fac. Medic. Vet. di Parma (Vol. XXV, 2005) - pag. 191 - pag. 204
cronica superfi ciale (CSK), la distrofi a epitelio/stromale corneale, la cataratta, la displasia retinica, lʼatrofi a retinica generalizzata e lʼipoplasia del nervo ottico (1, 3, 4, 5, 6, 7, 8, 9).
Scopo di questo studio, è stato quello di segnalare la nostra esperienza riguardo le patologie oculari riscontrate nei cani di razza Pastore Tedesco presentatisi alla nostra attenzione per una visita specialistica.
In particolare abbiamo cercato di evidenziare e differenziare le patologie oculari di sospetta origine ereditaria da quelle defi nite di natura acquisita.
MATERIALI E METODI
In questo studio sono stati presi in considerazione 72 cani di razza Pastore Tedesco sottoposti a visita oftalmologica per un problema oculare.
Tutti i soggetti sono stati sottoposti ad una visita oculistica completa, quindi sono stati valutati la reazione di ammiccamento alla minaccia, i rifl essi pupillari diretti e consensuali, la produzione lacrimale (Schirmer tear test, Schering Plough Animal Health) e la pressione intraoculare mediante tonometria per applanazione. E stato eseguito, inoltre, il test di colorazione con fl uoresceina (Fluorescein sterile strips, HS International).
L esame del segmento anteriore è stato effettuato mediante biomicroscopia, mentre il segmento posteriore è stato valutato mediante oftalmoscopia diretta, previa dilatazione pupillare con tropicamide 0,5% e fenilefrina 10% (Visumidriatic Fenilefrina collirio, Visufarma).
RISULTATI
L età media dei 72 soggetti presi in esame è risultata di 6,5 anni, con un minimo di 3 mesi e un massimo di 13 anni. Sono stati esaminati 40 maschi e 32 femmine. In 14 cani è stato colpito lʼocchio destro, in 7 il sinistro, per un totale di 21 casi monolaterali e 51 bilaterali. Diciassette cani hanno riportato contemporaneamente patologie oculari diverse tra loro (Tabella 1).
Complessivamente sono stati diagnosticati 33 casi di CSK (foto 1), 7 casi di congiuntivite follicolare (6 bilaterali) (foto 2), 7 casi bilaterali di plasmoma (foto 1), 6 casi di cataratta di cui 4 monolaterali e 2 bilaterali, (in 2 casi la cataratta era dʼorigine traumatica, in 1 caso dʼorigine congenita e negli altri 3 casi è stata supposta dʼorigine ereditaria) (foto 3).
Sono stati evidenziati 4 casi monolaterali di calazio, riguardanti la palpebra superiore, 4 casi di distrofi a corneale, 4 casi di glaucoma (2 bilaterali) di cui 3 cronici (foto 4), in 3 cani è stata diagnosticata unʼulcera corneale monolaterale, 3 cani hanno presentato uveite, di cui 2 bilaterale, altri 3 sono stati interessati da cisti iridee monolaterali.
In 2 soggetti è stata diagnosticata una lacerazione palpebrale monolaterale (in 1 soggetto era interessata sia la palpebra superiore che quella inferiore) (foto 5) e

193
Ann. Fac. Medic. Vet. di Parma (Vol. XXV, 2005) - pag. 191 - pag. 204
2 presentavano la sindrome di Horner (foto 6).Sono stati diagnosticati anche singoli casi di sindrome della tasca del
canto mediale bilaterale, di ostruzione dei dotti naso-lacrimali, di cisti delle vie lacrimali monolaterale, di dermoide corneale monolaterale, di leucoma cicatriziale monolaterale, di ustione chimica corneale, di ferita corneale penetrante, di emorragia della sclera monolaterale conseguente a trauma, di melanocitoma epibulbare monolaterale, di episclerite nodulare monolaterale, di ifema bilaterale, di atrofi a iridea senile bilaterale, di tisi del bulbo monolaterale (foto 7) e di neoplasia retrorbitale (Tabella 1).
Complessivamente le patologie oculari riportate sono state 92 di cui 41 di natura ereditaria o presunta tale, e 51 di tipo acquisito.
I 33 casi di CSK sono stati trattati con una terapia locale a base di ciclosporina A unguento oftalmico (due volte al di, mattina e sera, continuata nel tempo), desonide fosfato collirio (una volta al di, la sera, continuata nel tempo) e desametasone associato a tobramicina collirio (4 volte al di per 10 giorni, 3 volte al di per 10 giorni e 2 volte al di per 10 giorni), di questi, 5 sono stati trattati con iniezioni sottocongiuntivali con 0,25 ml di metilprednisolone acetato. I cani che presentavano congiuntivite follicolare sono stati sottoposti a trattamento locale con desametasone collirio (3-4 volte al di, per 15 giorni), in 1 caso è stata somministrata localmente tobramicina collirio (2-3 volte al di, sino a guarigione) poiché il soggetto era positivo al test della fl uoresceina, una volta guarita la lesione è stata sostituita dal desametasone unguento oftalmico locale (3-4 volte al di).
I casi di plasmoma sono stati trattati mediante somministrazione locale di ciclosporina A unguento oftalmico (2 volte al di, continuata nel tempo), desametasone associato a tobramicina collirio (4 volte al di 10 giorni, in seguito 3 volte al di 10 giorni e poi 2 volte al di per 10 giorni) e desonide fosfato unguento oftalmico (1 volta al di, la sera, continuato nel tempo).
Dei 6 casi di cataratta, solo la cataratta matura è stata sottoposta ad intervento chirurgico mentre gli altri 5 non hanno effettuato nessun tipo di terapia per volontà del proprietario.
Dei 4 casi di calazio, 2 sono stati sottoposti a chirurgia, i restanti 2 non hanno effettuato alcun tipo di terapia.
I 4 cani che presentavano distrofi a corneale sono stati sottoposti ad accertamenti, in particolare è stato consigliato di eseguire esami ematici per valutare il profi lo metabolico del soggetto.
Un caso di glaucoma cronico con un valore di IOP (pressione intraoculare) di 46 mm/Hg è stato trattato mediante intervento chirurgico di enucleazione, i restanti 3 casi di glaucoma secondario ad uveite sono stati sottoposti a terapia con prednisone per os (1 mg/Kg a scalare, per un totale di 20 giorni) e diclofenamide per os (2mg/Kg/die per 20 giorni) e a terapia locale con desametasone collirio (3-4 volte al di) e dorzolamide cloridrato associato a timololo maleato collirio (3 volte al di).
I 3 cani in cui è stata diagnosticata unʼuveite sono stati sottoposti allo stesso trattamento dei cani con glaucoma in quanto presentavano già un rialzo della pressione intraoculare, e sono stati effettuati esami sierologici per escludere malattie sistemiche sostenute da Toxoplasma, Ehrlichia, Leishmania e Borrelia.

194
Ann. Fac. Medic. Vet. di Parma (Vol. XXV, 2005) - pag. 191 - pag. 204
I 3 soggetti che presentavano ulcera corneale sono stati sottoposti a trattamento locale con cloramfenicolo collirio (3-4 volte al di, sino a guarigione) e atropina solfato 1% collirio (mattina e sera i primi 3 giorni ed in seguito solo la mattina).
Nei casi di cisti iridea non è stata effettuata nessuna terapia, ma si è consigliato loro di tenere controllata la IOP.
Un caso di lacerazione palpebrale è stato sottoposto ad intervento chirurgico per suturare la ferita, mentre lʼaltro soggetto è stato trattato con una terapia locale a base di tobramicina unguento oftalmico (3 volte al giorno, sino a guarigione).
Le Sindromi di Horner non sono state sottoposte ad alcuna terapia, in quanto dopo aver effettuato la diagnosi, i proprietari non hanno voluto procedere ed eseguire ulteriori accertamenti per conoscere lʼeziologia della patologia.
La sindrome della tasca del canto mediale non è stata trattata, il caso che presentava ostruzione dei dotti naso lacrimali è stato sottoposto al drenaggio degli stessi con soluzione fi siologica e alla somministrazione locale di tobramicina collirio (2 volte al giorno, per 7 giorni) e di desametasone collirio (2 volte al giorno, per 7 giorni), la cisti delle vie lacrimali è stata trattata chirurgicamente mediante asportazione della stessa.
Il cane con dermoide corneale è stato sottoposto ad intervento chirurgico dʼasportazione del dermoide e cheratectomia a cui è seguita una terapia locale a base di tobramicina unguento oftalmico (4-5 volte al di, per 15 giorni), il cane con leucoma cicatriziale non è stato sottoposto ad alcuna terapia, il cane che presentava gli esiti di unʼustione chimica corneale è stato trattato con terapia locale a base di desametasone unguento oftalmico (4-5 volte al di, per 15 giorni). La ferita corneale penetrante, per prevenire lʼeventuale insorgenza di unʼuveite facoclastica, è stata trattata con prednisone per os (1mg/Kg a scalare per un totale di 20 giorni) e, localmente, con tobramicina collirio alternandola ad ofl oxacina collirio (4-5 volte al di, sino a guarigione) e atropina 1% collirio per via locale (1 goccia 2 volte al di i primi 3 giorni e poi 1 goccia solo la mattina).
Il soggetto con emorragia della sclera è stato soppresso per i gravi defi cit neurologici riportati in seguito al trauma, al soggetto con melanocitoma epibulbare è stato consigliato lʼintervento di asportazione della neoformazione.
Il soggetto con episclerite nodulare è stato sottoposto a terapia locale a base di desametasone unguento oftalmico (4 volte al giorno, per 15 giorni).
Il cane con ifema, causato da un sospetto avvelenamento, è stato sottoposto a terapia sistemica con vitamina K, doxiciclina, e prednisone per os (1mg/Kg a scalare) e a terapia locale con tobramicina collirio (4-5 volte al di, sino a guarigione).
Il cane con atrofi a iridea senile e il cane a cui è stata diagnosticata la tisi del bulbo, non sono stati sottoposti ad alcuna terapia.
Il cane che presentava una neoplasia retrorbitale non è stato trattato per volere dei proprietari.
I cani sottoposti sia a terapia farmacologica che chirurgica hanno presentato la completa risoluzione del quadro clinico, discorso a parte meritano i casi di uveite e glaucoma, in cui si è ottenuto solamente un miglioramento della situazione clinica dei soggetti. Un miglioramento signifi cativo, ma non una guarigione defi nitiva si è avuto nei cani interessati da CSK e plasmoma.

195
Ann. Fac. Medic. Vet. di Parma (Vol. XXV, 2005) - pag. 191 - pag. 204
Tabella n.1
SESSO ETA
ANNIOCCHIO PATOLOGIA
1 M 8 OD Lacerazione palpebra inferiore2 F 11 OD Calazio palpebra superiore3 M 6 OU CSK4 M 0,9 OS Dermoide corneale5 F 4 OU CSK6 M 6 OU CSK7 M 5 OU CSK8 F 5 OU CSK9 M 11 OU Tisi bulbo OD, Leucoma cicatriziale OD10 M 10 OU CSK11 M 3 OU CSK12 F 2 OD Ulcera corneale13 F 5 OU Congiuntivite follicolare, Ostruzione dotti naso
lacrimali14 M 11 OD Neoplasia retrorbitale,15 F 0,6 OS Emorragia sclera16 M 5 OD Calazio palpebra superiore17 F 1 OD Distrofi a corneale18 M 10 OU CSK19 M 13 OS Sindrome di Horner20 M 8 OU Atrofi a iridea, Uveite OS21 F 7 OD Glaucoma22 M 9 OU CSK23 M 8 OU Distrofi a corneale24 F 5 OU Glaucoma25 M 5 OS Cisti iridea26 M 9 OU Glaucoma27 F 3 OU CSK28 F 3 OD Congiuntivite follicolare29 M 0,5 OU Congiuntivite follicolare30 F 6 OU CSK31 F 6 OU Congiuntivite follicolare32 F 6 OU CSK33 F 5 OU CSK, Plasmoma34 F 10 OU Ifema35 F 9 OD Cataratta matura ereditaria36 M 10 OU Plasmoma, Cisti iridea OS37 F 8 OU CSK38 F 7 OU CSK, Plasmoma39 M 7 OU CSK40 M 7 OU CSK41 F 6,5 OU CSK42 M 9 OD Episclerite nodulare43 M 6 OU CSK44 F 10 OU CSK45 M 7 OU Uveite anteriore46 M 5 OU CSK

196
Ann. Fac. Medic. Vet. di Parma (Vol. XXV, 2005) - pag. 191 - pag. 204
47 M 10 OD Cataratta traumatica incipiente, Calazio palpebra superiore
48 M 6 OU CSK49 M 3,5 OS Ustione chimica50 F 6 OU Cataratta pulverulenta ereditaria immatura51 M 5 OD Cisti vie lacrimali52 M 2 OU Distrofi a corneale, Cataratta congenita
immatura, CSK53 F 8 OU CSK54 M 3,5 OU CSK55 F 5 OU Distrofi a corneale, Cisti iridea OD, Cataratta
ereditaria incipiente OS, Plasmoma56 F 13 OU CSK57 F 2,5 OU CSK, Plasmoma58 M 0,3 OD Ferita corneale penetrante, Cataratta traumatica
incipiente59 F 10 OU Congiuntivite follicolare, Calazio palpebra
superiore OS60 F 4 OU CSK61 F 11 OU Sindrome della tasca del canto mediale62 M 2 OU Ulcera corneale OD, Congiuntivite follicolare63 F 7 OU CSK, Plasmoma64 M 8 OU CSK, Plasmoma65 F 9 OU Uveite, Glaucoma OS66 M 12 OU CSK67 M 2,5 OU Congiuntivite follicolare68 M 12 OU CSK, Ulcera corneale OD69 M 0,9 OD Melanocitoma epibulbare70 M 7 OS Sindrome di Horner71 M 5 OU CSK72 F 11 OS Lacerazione palpebra superiore e inferiore
Legenda - OD: occhio destro, OS: occhio sinistro, OU: entrambi gli occhi
DISCUSSIONE E CONSIDERAZIONI CONCLUSIVE
Da questo lavoro emerge come il Pastore Tedesco sia colpito in misura maggiore da patologie di tipo acquisito (55,4%) piuttosto che da patologie di tipo ereditario (44,6%). Le patologie più frequenti sono state osservate a carico del segmento anteriore dellʼocchio (98,6%).
Tra queste, quelle più frequenti sono state osservate a carico della cornea (47,8%) in particolare CSK, distrofi a corneale, ulcera corneale, dermoide corneale, leucoma cicatriziale, ustione chimica e ferita corneale penetrante; della terza palpebra (15,2%) in particolare plasmoma e congiuntivite follicolare; e della lente (6,5%) in particolare cataratta.
Per quanto riguarda lʼetà, possiamo evidenziare come la media sia piuttosto elevata (6,5 anni) e come non ci siano differenze signifi cative per quanto

197
Ann. Fac. Medic. Vet. di Parma (Vol. XXV, 2005) - pag. 191 - pag. 204
riguarda il sesso. Pur non presentandosi direttamente alla nascita o nei primi anni di vita dellʼanimale, infatti, molte patologie compaiono in fase avanzata, poiché la predisposizione alla patologia può presentarsi in concomitanza con il raggiungimento dellʼetà adulta da parte dellʼanimale.
La cheratite cronica immunomediata del Pastore Tedesco o cheratite cronica superfi ciale (CSK) è unʼaffezione localizzata nella parte anteriore della cornea, caratterizzata da infi ltrazione cellulare, in particolare linfociti e plasmacellule, estesa vascolarizzazione e sostituzione del tessuto normale con quello di granulazione, tali alterazioni comportano unʼopacizzazione della cornea denominata “panno” (3, 4, 5, 6, 7, 8, 9).
La CSK è una patologia immunomediata che riconosce una predisposizione genetica, quale causa della malattia, ma anche un fattore scatenante dato dai raggi ultravioletti. Nel Pastore Tedesco lʼepitelio corneale è più sottile, la struttura dello stroma è più lassa e la cornea è più debole, e ciò potrebbe spiegare la maggior sensibilità ai raggi ultravioletti (4, 7, 8). In alcuni cani, la CSK insorge lentamente con lunghi periodi caratterizzati dallʼassenza di progressione, soprattutto nei mesi invernali, quando lʼesposizione al sole è minore; in altri cani, il decorso della malattia è esplosivo e porta rapidamente a cecità. Queste differenze dipendono sia da fattori ambientali che individuali (4).
E stato possibile evidenziare unʼassociazione tra cheratite superfi ciale cronica e altre malattie immunomediate, in particolare la congiuntivite linfoplasmocitaria della terza palpera (plasmoma), come riportato in bibliografi a (4, 9), nel 15,1% dei casi.
Il plasmoma è unʼinfi ammazione cronica della terza palpebra, caratterizzata dallʼinfi ltrazione di plasmacellule e linfociti, spesso sottoforma di follicoli linfoidi, solitamente, ma non invariabilmente, bilaterale e spesso asimmetrica. La patologia inizia con la comparsa sulla superfi cie anteriore della terza palpebra, in prossimità del suo margine libero, di eritema e di follicoli pallidi e rilevati, che aumentano di dimensioni sino ad apparire come zone rilevate e non pigmentate che conferiscono al margine libero della terza palpebra un aspetto dentellato.
Anche il plasmoma è una patologia immunomediata che è aggravata dai raggi ultravioletti (2).
A carico della terza palpebra, in alcuni casi, si è evidenziata anche la congiuntivite follicolare che comporta la comparsa di un elevato numero di follicoli a carico di questa struttura. La causa può essere unʼirritazione cronica, ad esempio dovuta alla polvere, oppure un fenomeno dʼipersensibilizzazione, per questo, è possibile sospettare una base immunomediata della patologia (9).
Il termine distrofi a corneale indica unʼopacità corneale primaria che si presenta bilaterale e simmetrica, ha unʼorigine ereditaria e non è associata ad unʼinfi ammazione corneale o ad una patologia sistemica, non ha un carattere progressivo o solo minimamente progressivo (6, 8).
La lesione clinicamente appare grigio-bianca o argentata, si localizza nella porzione centrale o paracentrale della cornea, e la sua incidenza sulla visione dipende dallʼestensione. Essendo una forma bilaterale, le lesioni spesso sono simmetriche nei due occhi, e possono interessare lʼepitelio, lo stroma o lʼendotelio. La densità e

198
Ann. Fac. Medic. Vet. di Parma (Vol. XXV, 2005) - pag. 191 - pag. 204
lʼopacità sono molto variabili, possono manifestarsi come una macula o come una nubecola, di forma ovale o circolare, con i margini ben demarcati. Le variazioni di dimensione e di densità rappresentano i differenti stadi di progressione della distrofi a.
La distrofi a corneale è caratterizzata dal deposito di cristalli di colesterolo tra le fi brille di collagene, a vari livelli dello stroma, ma soprattutto a livello sub-epiteliale, mantenendo, però, lʼepitelio intatto e di spessore normale (6).
Le modifi cazioni genetiche del Pastore Tedesco, come nelle altre razze canine, sono state originate sia in modo inconsapevole, sia al fi ne di ottenere determinate caratteristiche morfologiche, esasperandone alcune particolarità. Pertanto, alcune affezioni sono insorte, sia casualmente, sia come conseguenza della selezione degli allevatori. Mentre le patologie acquisite non si possono evitare, quelle ereditarie, con le loro gravi manifestazioni cliniche, devono essere prevenute. I difetti ereditari, infatti, possono essere eliminati o può essere ridotta al massimo la loro incidenza, mediante il controllo degli accoppiamenti, in modo tale da far riprodurre solo i soggetti sani. La CSK e la cataratta, che sono considerate patologie ereditarie, sono estremamente invalidanti, e possono frequentemente portare lʼanimale alla cecità. Mentre la cataratta è risolvibile dal punto di vista chirurgico (nonostante lʼintervento sia piuttosto delicato e dispendioso), la CSK richiede un trattamento farmacologico costante e protratto per tutta la durata della vita del cane.
Al fi ne di prevenire le patologie ereditarie, si rende necessario sensibilizzare gli allevatori affi nché selezionino soggetti esenti da queste patologie. Per far ciò sarebbe necessario consentire la riproduzione solamente dei soggetti che non presentano i segni clinici di patologie ereditarie.
Per molte patologie si parla di “predisposizione raziale”, poiché non sempre è possibile dimostrare il comportamento ereditario di determinate patologie. Tuttavia, la crescente incidenza di alcune forme, allʼinterno di specifi che razze, ed il Pastore Tedesco ne è un esempio, costituisce lʼindicazione iniziale che tali manifestazioni patologiche siano determinate geneticamente.
BIBLIOGRAFIA
1. ACVO Genetics Committee: Ocular disorders or suspected to be hereditary in dogs. ACVO ed., 2nd ed., 1996.
2. Barnett K.C. La congiuntivite plasmocitaria della terza palpebra nel cane. Atti Congresso ESVO-ECVO, Dresda, 1994, 59-61.
3. Bedford P.G.C., Longstaffe J.A. Corneal pannus (chronic superfi cial keratitis) in the German Shepherd Dog. J. Small Anim. Pract., 1979, 20, 41-56.
4. Bernard C. La cheratite superfi ciale cronica nel pastore Tedesco ed in altre razze di cani. Atti Congresso ESVO-ECVO, Dresda, 1994, 48-54.
5. Dice P.F. Primary corneal disease in the dog and cat. Veterinary clinics of North America: Small Animal Practice, 1980, 10 (2), 339-356.
6. Gelatt K.N. Veterinary ophthalmology. 3rd ed. Philadelphia, Lea & Febiger, 1999.

199
Ann. Fac. Medic. Vet. di Parma (Vol. XXV, 2005) - pag. 191 - pag. 204
7. Roze M. Pathologie infi ammatoire de la cornée. Prat Med Chir Anim Comp, 1997, 32, 93-102.
8. Sapienza J.S. Corneal disease of dogs and cats. Atti 27° Congresso Wsava-Fecava-Avepa, Granada, 2002, 478-482.
9. Stades F.C., Boevé M.H., Neumann W., Wymann M. Ophthalmology for the Veterinary Practitioner. Hannover, Schlütersche GmbH & Co., 1998.
Parole chiave: cane, occhio, Pastore Tedesco, cheratite, plasmomaKey words: dog, eye, German Shepherd, keratitis, plasmomaMots clés: chien, oeil, Berger Allemand, kératite, plasmoma
Riassunto
In questo studio vengono presi in considerazione 72 cani di razza Pastore Tedesco sottoposti a visita specialistica per un problema oculare. Vengono esaminati 40 maschi e 32 femmine, lʼetà media è di 6,5 anni con un minimo di 3 mesi e un massimo di 13 anni. La patologia è bilaterale in 51 casi. Complessivamente sono state diagnosticate le seguenti patologie oculari: CSK (33 casi), congiuntivite follicolare (7 casi), plasmoma (7 casi), cataratta (6 casi), calazio (4 casi), distrofi a corneale (4 casi), glaucoma (4 casi), ulcera corneale (3 casi), uveite (3 casi), cisti iridea (3 casi), lacerazione palpebrale (2 casi), sindrome di Horner (2 casi), sindrome della tasca del canto mediale (un caso), ostruzione dei dotti naso-lacrimali (un caso), cisti delle vie lacrimali (un caso), dermoide corneale (un caso), leucoma cicatriziale (un caso), ustione chimica corneale (un caso), ferita corneale penetrante (un caso), emorragia della sclera (un caso), melanocitoma epibulbare (un caso), episclerite nodulare (un caso), ifema (un caso), atrofi a iridea senile (un caso), tisi del bulbo (un caso) e neoplasia retrorbitale (un caso).
Le patologie oculari ereditarie sono risultate il 44,6% delle patologie complessivamente diagnosticate in questa razza.
Summary
In this study we considered 72 German Shepherd referred to a specialistic visit for an ocular problem. We examined 40 males and 32 females, the average age was 6,5 year with a range of 3 months to 13 years. Patology is bilateral in 51 cases. Overall, the following ocular pathologies were diagnosed: CSK (33 cases), follicular conjunctivitis (7 cases), plasmoma (7 cases), cataract (6 cases), chalazion (4 cases), corneal dystrophy (4 cases), glaucoma (4 cases), corneal ulcer (3 cases), uveitis (3 cases), iris cyst (3 cases), palpebral lacerations (2 cases), Hornerʼs syndrome (2 cases), syndrome of the pocket of the medial canthus (one case), ducts nase-lacrimal obstruction (one case), naso-lacrimal systems cyst (one case), corneal dermoid (one case), cicatriziale leukoma (one case), corneal chemistry ustion (one case), corneal penetrating injury (one case), bleeding scleraʼs (one case), epibulbare melanocitoma

200
Ann. Fac. Medic. Vet. di Parma (Vol. XXV, 2005) - pag. 191 - pag. 204
(one case), nodular episcleritis (one case), hyphema (one case), senile irisʼs atrophia (one case), phthisis bulbus (one case), retrorbital tumor (one case). Hereditary ocular pathologies have turned out to be 44,6% of all pathologies diagnosed in this breed.
Foto 1: csk associata a plasmoma della terza palpebra dellʼocchio sinistro.
Foto 2: plasmoma della terza palpebra dellʼocchio destro.

201
Ann. Fac. Medic. Vet. di Parma (Vol. XXV, 2005) - pag. 191 - pag. 204
Foto 3: congiuntivite follicolare dellʼocchio destro.
Foto 4: cataratta matura dellʼocchio destro.

202
Ann. Fac. Medic. Vet. di Parma (Vol. XXV, 2005) - pag. 191 - pag. 204
Foto 5: glaucoma associato a buftalmo dellʼocchio destro.
Foto 6: lacerazione della palpebra inferiore dellʼocchio destro.

203
Ann. Fac. Medic. Vet. di Parma (Vol. XXV, 2005) - pag. 191 - pag. 204
Foto 7: sindrome di Horner dellʼocchio sinistro.
Foto 8: tisi del bulbo dellʼocchio destro.

204
Ann. Fac. Medic. Vet. di Parma (Vol. XXV, 2005) - pag. 191 - pag. 204

205
Ann. Fac. Medic. Vet. di Parma (Vol. XXV, 2005) - pag. 205 - pag. 218
PROGETTO DI TERAPIA ASSISTITA DALLʼANIMALE CON VALUTAZIONE COMPORTAMENTALE E FISIOLOGICA DELLO STRESS DEL CANE
Cao S.1, Accorsi P.A.2, Bracchi P.G.3
PREMESSA
Da qualche decennio in Italia si è sentito sempre più spesso parlare di pet therapy, termine generico per descrivere progetti dove si coinvolgono animali da compagnia, come supporto in attività o terapie per persone con defi cit nella sfera fi sico-motoria e/o psicologica.
Le attività assistite dallʼanimale, solitamente di gruppo, sono rivolte a persone normodotate. Nelle terapie, invece, si hanno percorsi specifi ci e mirati verso un unico fruitore diversamente abile. Si tratta di interventi co-terapeutici rivolti al miglioramento dello stato di benessere dellʼutente in primis, ed al raggiungimento di specifi ci obiettivi.
Prima sezione: La basi teoriche di un progetto di zooantropologia
Di frequente si sente parlare del proprio pet come di un bambino, come un surrogato di precisi affetti umani che a noi mancano. Allʼopposto altre persone trattano lʼanimale come un oggetto o uno strumento da poter utilizzare. I progetti che si ispirano alle basi della zooantropologia cancellano totalmente questi concetti errati del rapporto uomo-animale. Il pet deve essere visto non come sostituto o come oggetto ma bensì come essere vivente diverso da noi, rispondente in primis a caratteri di riconoscibilità sociale10. Si deve riconoscere la diversità del pet e soprattutto si deve capire che le basi del rapporto uomo-animale sono incentrate su questa diversità. Infatti una relazione tra uomini trasmette dei valori ben precisi; ma anche la relazione tra uomo e animale, vista come interscambio di conoscenze, trasmette a sua volta dei valori diversi ma altrettanto importanti. Ogni individuo diventa tale grazie al rapporto con i propri simili, lʼambiente e gli animali; queste relazioni ed i valori appresi sono diversi ogni qualvolta si cambia interlocutore.
La referenza animale può assumere svariati caratteri, tra questi:un “faro”, ossia una struttura direzionale o progettuale capace di indicare la
direzione complessiva, lʼordine di impor tanza;Una “base sicura”, un “aiuto” o un “sostegno” quando ci si trova in diffi coltà,
un luogo di conforto o di sicurezza;
1Neolaureata, libero professionista Parma2Facoltà di medicina veterinaria di Bologna3Facoltà di medicina veterinaria di Parma

206
Ann. Fac. Medic. Vet. di Parma (Vol. XXV, 2005) - pag. 205 - pag. 218
La relazione porta obbligatoriamente allʼassunzione da parte degli interlocutori di ruoli precisi e soprattutto di contenuti specifi ci, defi nite dimensioni di relazione che a loro volta permettono particolari contenuti referenziali, che producono nel fruitore degli effetti benefi ciali, neutri o compromissori. Nel caso della perdita di un caro è molto avventato regalare un animale, in quanto questo rischia di diventare il sostituto della persona defunta e la relazione sarà esclusivamente basata su dei contenuti che produrranno degli effetti negativi sul fruitore.
Con questo si vuole sfatare totalmente la concezione del rapporto uomo-animale vista come un qualcosa di indiscriminatamente benefi co. Quindi è fondamentale nellʼattuazione di progetti di zooantropologia applicata, conoscere quali sono le dimensioni compromissorie e quelle benefi ciali per ogni fruitore.
La zooantropologia applicata si pone due ordini di obiettivi: valorizzare la relazione uomo animale, ampliando il posizionamento dellʼanimale nella nostra società e utilizzare la relazione per ottenere effetti benefi ciali attraverso interventi specifi ci sulla persona10. Nel caso si tratti della formazione di una coppia cane e proprietario normodotato si agirà soprattutto nellʼambito del primo ordine di obiettivi generali. Nelle attività assistenziali con lʼanimale si adotterà soprattutto il secondo.
Seconda sezione: Il progetto di zooantropologia assistenziale
Evoluzione progettualeIl progetto di Terapia Assistita dallʼAnimale è iniziato nellʼanno scolastico
2002/2003, presso lʼIstituto Comprensivo Sanvitale Fra Salimbene, ed è ancora in corso. Dopo unʼattenta valutazione del progetto da parte del dirigente scolastico, lo staff ogni anno individua i fruitori.
Nellʼanno 02/03 sono stati inseriti sette alunni, con fascia dʼetà compresa dai 6 ai 12 anni. Di questi alcuni erano segnalati come diversamente abili, e alcuni con diffi coltà socio-comportamentali. Sono state coinvolte le classi, di cui facevano parte cinque degli utenti.
Nellʼanno scolastico 03/04 sono stati inseriti sette fruitori, alcuni avevano partecipato anche lʼanno precedente. Sono state fatte partecipi due classi.
Nellʼanno scolastico 04/05 sono iniziati anche i progetti di zooantropologia applicata alla didattica a cui hanno aderito tre gruppi classe. Sono stati inseriti quattro alunni diversamente abili nel progetto di terapia assistita dallʼanimale, due dei quali partecipano anche allʼattività con la classe. Il progetto ha avuto unʼevoluzione notevole in questi anni dal punto di vista concettuale. Si è passati da un attività erroneamente basata sullʼutilizzo dellʼanimale, ad un lavoro molto più approfondito correlato alle basi della zooantropologia.
Le basi del progettoIn primis si attuano dei percorsi specifi ci per ogni contesto individuale,
seguendo protocolli di base: lʼintero percorso di ogni fruitore è deciso inizialmente dallʼequipe. Ogni seduta è precedentemente preparata in tutti i suoi aspetti strutturali. Teniamo a sottolineare che il progetto non vuole sostituire nessun tipo di attività scolastica o comunque specialistica, ma si vuole affi ancare ai percorsi in itinere, per aiutare il fruitore al raggiungimento degli stessi obiettivi. Per una riuscita ottimale del

207
Ann. Fac. Medic. Vet. di Parma (Vol. XXV, 2005) - pag. 205 - pag. 218
progetto deve essere presente un equipe professionale, che oltre a seguire tutta lʼattività pratica, ha il compito di monitorare e valutare periodicamente i risultati del progetto.
Molto importante è la scelta dellʼanimale e la sua tutela psico-fi sica, infatti si coinvolgono solo cani con una specifi ca educazione ed addestramento, dei quali non si cerca la performance bensì il loro piacere a relazionarsi con le persone.
Il gruppo classe, di cui fa parte il fruitore, viene coinvolto nel progetto. Vengono organizzati due o più incontri allʼinterno dellʼaula, nei quali si discute sulle attività di pet therapy e sul corretto rapporto uomo-animale.
Progetto di zooantropologia applicata alla didatticaSi sviluppa in un carnet di sei-otto lezioni, incentrate sul miglioramento
e sulla valorizzazione del rapporto bambino-animale. Attraverso questo rapporto, si possono ottenere dei precisi benefi ci in ambito educativo, didattico, disciplinare, relazionale e informativo.
Le basi del progettoSi riprendono le basi della progetto di zooantropologia assistenziale, con
alcuni cambiamenti considerata la presenza di un numero maggiore di bambini ed il raggiungimento di obiettivi diversi.
Date le diverse esigenze educative di alcune classi, può accadere che i due progetti si integrino tra loro, diventando così un unico percorso lavorativo.
In questo tipo di attività possono essere impiegate diverse specie animali, ponendo una particolare attenzione nei confronti della loro tutela psico-fi sica. L incontro con lʼanimale avviene solo dopo unʼaccurata preparazione degli alunni.
Per ogni gruppo classe, si attuano dei percorsi specifi ci seguendo protocolli di base: lʼintero percorso è preparato inizialmente dallʼequipe. Gli obiettivi del percorso sono decisi dagli insegnanti, in base ai problemi riscontrati allʼinterno del gruppo classe.
L attività è suddivisa in una discussione iniziale sul lavoro da svolgere, seguita da una parte di attività pratica. A fi ne seduta gli alunni avranno dei compiti, inerenti alla tematica svolta. Durante le lezioni si ricorre allʼausilio di documentazione video e fotografi ca.
Schede di valutazioneSi è ritenuto fondamentale lʼuso di schede di valutazione e griglie per ogni parte
del progetto. Le schede relative allʼalunno diversamente abile sono di totale competenza del personale che si occupa del fruitore, nel nostro caso lʼinsegnante di sostegno.
Per ogni gruppo classe e per ogni utente diversamente abile è stata compilata una scheda specifi ca inerente a tutto il percorso, redatta dal conduttore dellʼanimale e dagli insegnanti5. A fi ne lavoro ogni insegnante responsabile degli utenti ha steso una relazione su tutta lʼattività.
Materiale informativoConsiderando che si tratta di unʼattività nuova e poco conosciuta in Italia
e soprattutto nellʼambiente scolastico, si è data molta importanza alla divulgazione del progetto ed al coinvolgimento dei genitori. La nuova riforma scolastica richiede

208
Ann. Fac. Medic. Vet. di Parma (Vol. XXV, 2005) - pag. 205 - pag. 218
sempre di più una pubblicizzazione delle attività promosse dalla scuola. Sono stati preparati degli opuscoli, dei fi lmati come materiale divulgativo per i genitori, gli insegnati e per altri istituti. Si è partecipato al progetto scolastico Arion a livello europeo.
Lavori dei fruitori
Terza sezione: Lʼanimale per la zooantropologia applicata
Scelta del canePrima di iniziare un progetto di zooantropologia applicata si rende necessaria
unʼapprofondita conoscenza dellʼanimale. In questo progetto si è data molto importanza allʼacquisizione di notizie sui sensi, sulla comunicazione e sullʼintelligenza del cane9. Dobbiamo conoscere precisamente le caratteristiche comportamentali dellʼanimale con cui si formerà la coppia pet-partner e queste conoscenze devono essere prioritarie allʼacquisto del cucciolo, bisogna saper scegliere accuratamente quale cucciolo prendere perché diventi un super cane da lavoro.
Nella scelta dellʼanimale ci deve interessare il suo etogramma, solo in parte si andrà a valutare lʼaspetto morfologico, che però fa comunque parte dellʼetogramma. Se è vero che tutti i cani sono cani, è altresì vero che esistono delle differenze

209
Ann. Fac. Medic. Vet. di Parma (Vol. XXV, 2005) - pag. 205 - pag. 218
comportamentali molto rilevanti tra le diverse razze. La compilazione dellʼetogramma segue una fase preliminare di conoscenza minuziosa del comportamento dellʼanimale nelle diverse circostanze quali, ad esempio, le varie fasi del suo ciclo vitale, il periodo riproduttivo, le sue doti fi siche.18
Attualmente sono coinvolti in attività di zooantropologia assistenziale soprattutto Labrador e Golden Retriever, ma non è raro trovare meticci, Husky, Border Collie o Boxer. Se il conduttore valuta tutti i parametri comportamentali di quella razza e soprattutto di quel cane, e riesce a gestirli al meglio, non è assolutamente detto che non diventino super cani. Bisogna però sapere bene a cosa si va incontro prendendo una razza invece che unʼaltra; questa è una massima che vale sia nel cane in questione e sia nel cane di tutti i giorni.
Dopo aver scelto la razza bisogna andare a cercare il super cucciolo. In uno studio svolto da Pageat15 (veterinario comportamentalista) e dalla sua equipe si è sperimentato che già dalla fase prenatale il cucciolo inizia lʼapprendimento, infatti, madri gravide che venivano massaggiate partorivano cuccioli che erano più propensi al tatto con lʼuomo, in confronto ad altri gruppi di controllo17. Quindi si andrà a valutare come la madre sta passando i due mesi di gravidanza, che tipo di esperienze di vita fa. Un fattore da valutare accuratamente è anche il carattere della madre, che infl uenzerà notevolmente i primi due mesi di vita del cucciolo. Il nostro super cucciolo dovrà avere ovviamente un giusto stimolo ambientale, facendo attenzione agli eccessi sensoriali, o alla loro totale assenza.
Preparazione del caneUna volta scelto il cucciolo si inizia la fase dellʼeducazione. Per prima cosa
bisogna creare una coppia pet-owner stabile. Si diventa coppia pet partner solo dopo aver raggiunto le basi della relazione con il cane, che devono essere chiare nella teoria e nella pratica.
Per costruire una coppia stabile è necessario suddividere il percorso formativo in tre fasi: lʼeducazione, lʼistruzione e lʼaddestramento.
Quando il cane è ancora piccolo entra in gioco la fase dellʼeducazione, cioè lʼinsegnamento dei fondamenti comportamentali del cane, e del suo temperamento. Si andrà a lavorare su aspetti precisi, che seppur trattati separatamente devono entrare a far parte della quotidianità della coppia cucciolo-proprietario13.
La socializzazione: da due mesi fi no alla maturità sociale il cane deve poter conoscere e apprendere più cose possibili, dai luoghi, alle persone, alle situazioni. Nel caso del nostro super cucciolo dobbiamo pensare che da adulto entrerà in luoghi particolari, e situazioni fuori dal quotidiano, quindi si rende necessaria una socializzazione mirata verso ospedali, anziani, deambulatori, disabili, ecc. .
Segnali dʼarresto: nei primi 2 mesi di vita i cuccioli imparano il controllo del morso grazie allʼinsegnamento della madre ed ai giochi tra di loro. Iniziano in questo periodo a bloccare e regolare lʼeccitazione, ma se con il padrone si hanno solo interazioni ludiche il cucciolo aumenterà sempre di più il suo arousal (stato emozionale). Quindi si lavorerà sul controllo emozionale, con esercizi che premiano lo stato di quiete e lʼarresto. Nella pratica insegneremo al cane ad andare sul cibo o sui giochi al nostro comando. I segnali di arresto devono essere ben appresi anche per

210
Ann. Fac. Medic. Vet. di Parma (Vol. XXV, 2005) - pag. 205 - pag. 218
le situazioni dove può prevaricare lʼistinto predatorio.Distacco secondario: verso i due mesi la madre inizia ad allontanare i
cuccioli, questo comportamento è detto distacco primario. Quando il cucciolo entra nella nuova casa dobbiamo obbligatoriamente iniziare un distacco, ed insegnargli a star da solo. È importante che avvenga un apprendimento progressivo, isolarlo per troppo tempo può causare stati dʼansia nel cucciolo.
Dopo lʼeducazione si passa allʼistruzione, cioè allʼapprendimento dei comportamenti di base utili per una convivenza equilibrata nella società. Si inizia con lʼinsegnamento di esercizi di base: il seduto, lʼandare al guinzaglio, il terra, il resta, il richiamo ed il riporto. Ovviamente dovremmo valutare il modo in cui si insegna al cane. Tutti i comandi di base vengono appresi con piacere dal cane, ed è bene ricordare che un cucciolo ha un apprendimento velocissimo. Al cane piace lavorare insieme, e se lʼinsegnamento gli viene proposto in modo gratifi cante si noterà una voglia crescente quando si fanno esercizi nuovi. E necessario proporgli più casistiche possibili, il riporto sarà con qualsiasi oggetto, dalla penna ad una stampella, appoggiando lʼoggetto in una sedia, in un cesto, in mano del proprietario o di un estraneo ecc.
Con lʼesercizio del riporto passiamo allʼultima fase per far diventare il nostro cucciolo un super cane dʼassistenza: lʼaddestramento. Al cane viene insegnato un lavoro specifi co, nel nostro caso attività utili per la zooantropologia applicata.
Per prima cosa è opportuno lavorare su degli script comportamentali13, cioè sullʼinsegnamento di situazioni, oggetti, luoghi che facciano capire immediatamente al cane che in quella circostanza si sta lavorando, quindi deve avere attenzione massima. Per chiarire meglio ogni volta che si va in seduta, al cane viene messa una pettorina e un foulard e il partner ha un marsupio; questi oggetti si utilizzano solo in addestramento e seduta. Il cane memorizza il tipo di comportamento da avere quando sono presenti quegli oggetti. Nella sua testa marsupio e pettorina signifi cano che ora bisogna lavorare e stare concentrati. Lo script è un insieme di comportamenti e atteggiamenti adeguati, visti in un particolare contesto. Il suo stato comportamentale sarà diverso al parco o dentro un ospedale.
Oltre a proporre lʼinsegnamento degli script bisogna fornire al cucciolo un numero sempre maggiore di expertise performativi (esperienze formative). È preferibile impostare lʼaddestramento con diversi set scenici, personaggi e ambientazioni. Il super cucciolo dovrà saper lavorare in tutte le situazioni, spetta a noi fargli acquisire questa esperienza.
Non dimentichiamoci lʼimportanza di un altro fattore dellʼaddestramento del pet: la concertazione13. In natura è fondamentale per esempio nel branco di lupi capirsi durante le fasi della caccia, per arrivare a raggiungere lo scopo. La coppia pet partner dovrà essere talmente affi atata da capirsi in ogni situazione. Quando si lavora in seduta non ci sono due entità a se stanti ma si è una coppia, si lavora insieme.
Dopo aver superato tutte queste fasi insieme al cucciolo, ormai adulto potremmo dire di aver un super cane, ma attenzione la formazione della coppia deve continuare sempre. Non esiste raggiungere la perfezione, ci saranno sempre situazioni che insegneranno nuovi script o expertise alla coppia. Se si ha un po di fantasia sono infi niti gli esercizi che si possono far apprendere al cane.

211
Ann. Fac. Medic. Vet. di Parma (Vol. XXV, 2005) - pag. 205 - pag. 218
Valutazione dei segnali di stress del caneConoscere il comportamento del cane e capire gli stati di stress è
fondamentale nella coppia pet owner, ma ancora di più in quella pet partner, dove si lavora in situazioni che possono di per sé essere stressanti. In genere gli eventi competitivi, le frustrazioni, le eccessive punizioni, la somministrazione di reiterati stimoli avversivi, lʼisolamento, lʼinsuffi ciente costruzione di situazioni epimeletiche o collaborative, il rapporto di paura, le situazioni di stress prolungato possono minare il rapporto fi duciario12. Per sapere quando il pet è in uno stato eccessivo di tensione è necessario che lʼattenzione del partner sia concentrata su di lui per poterla riconoscere. Noi dobbiamo conoscere alla perfezione il nostro cane, con cui formiamo una coppia. Sono tantissime le azioni che indicano stress. Ne elenchiamo alcune:il sottrarsi allʼinterazione con il fruitore, lʼagitazione eccessiva, il grattarsi, lo sbadigliare, leccarsi il naso, dormire per ore dopo una seduta, voler andare verso lʼuscita, non eseguire comandi già totalmente appresi. In tutti quei casi in cui il cane ha un evidente stato di tensione bisogna bloccare la seduta. Si è visto che ogni cane manifesta in modo diverso lo stato di stress, quindi non basta conoscere i cani ma bisogna conoscere quel cane. La Border Collie ha manifestato stati di stress con sbadigli, grattamenti eccessivi o stati di ipo-attività durante la seduta. La Labrador tende invece ad allontanarsi dallʼinterazione. Ovviamente queste situazioni sono state rare perché un pet che lavora in zooantropologia applicata non deve assolutamente avere stress eccessivi, bisogna imparare ad evitarli.
Come evitare lo stress del caneL ambientazione dove si svolge il progetto è fondamentale per evitare stati di
tensione del cane. Prima della stesura dellʼattività pratica bisogna valutare una serie di punti ambientali. In prima istanza bisogna analizzare la stanza dove si svolgerà lʼattività, e evitare luoghi affollati e di passaggio, spazi troppo piccoli, vicini alla mensa e/o cucina, ricchi di distrazioni sia per il cane sia per il fruitore. Nel percorso per arrivare alla stanza dove si praticano le attività, non devono esserci troppi incontri con altro personale della struttura.
Sono assolutamente da evitare lʼingresso del cane allʼinterno delle classi, dove sicuramente ci sarà uno stress eccessivo dovuto allʼambiente ridotto ed al non controllo degli alunni. La stessa cosa vale per lʼora di ingresso, di uscita, di ricreazione e il dopo mensa; in queste situazioni è impossibile controllare tutti i bambini che il cane incontra. Bisogna necessariamente tenersi lontano dallʼambiente mensa perché stimola eccessivamente il canale olfattivo del cane.
Allʼinterno della stanza dove si svolge lʼattività bisogna valutare lo spazio in cui ci disponiamo, in particolare se si lavora con una classe intera. È preferibile portare il cane allʼinterno quando sono già presenti i fruitori e disporsi verso unʼuscita. L animale non deve assolutamente trovarsi circondato dai bambini, senza vie di fuga. Nel caso si lavori con un gruppo classe è obbligatoria una preparazione adeguata allʼincontro con il cane. Di solito si tratta di fruitori che non sanno relazionare correttamente con il pet, e soprattutto non hanno un buon autocontrollo. Prima dellʼincontro con il pet la classe segue un corso sul comportamento del cane, sono molto utili i giochi di fi nzione. Un bambino può fare il cane, un altro il proprietario

212
Ann. Fac. Medic. Vet. di Parma (Vol. XXV, 2005) - pag. 205 - pag. 218
ed un altro la persona estranea, far provare nella pratica lʼinterazione con il cane in questo modo facilita lʼapprendimento. Dopo la preparazione degli alunni si prepara minuto per minuto lʼincontro. La classe entra nella stanza e i bambini vengono fatti sedere, si ricordano insieme quali regole seguire, in primis non urlare, non correre e non assalire lʼanimale. Prima dellʼincontro bisogna sapere quali sono i bambini che hanno paura del cane, hanno allergie, sono molto esuberanti, ecc. In questi casi14
bisogna prendere particolari accorgimenti. Il cane entra solo quando la classe è sotto controllo. L interazione avviene solo dopo qualche minuto di osservazione, a gruppi di massimo 5 bambini. Il cane non deve superare più di 40 minuti di interazione con il gruppo classe, e ad un solo segnale di stress deve poter lasciare la stanza. È necessario fare unʼattenta valutazione del contributo degli insegnanti a tutta lʼattività. È preferibile non effettuare lʼincontro con il cane se la classe non ha raggiunto un grado alto di autocontrollo, e se lʼinsegnante non collabora.
La situazione cambia quando si ha un singolo fruitore. Prima di iniziare le sedute bisogna aver chiaro il tipo di handicap dellʼalunno e alcune informazioni personali, riferite al suo rapporto con gli animali. In base a tutte queste nozioni si decide che tipo di approccio avere. Anche la scelta del tipo di cane è fondamentale. Non è detto che il nostro super cane si trovi a suo agio con tutti i bambini. Durante la seduta il conduttore deve tutelare il benessere dellʼanimale, il fruitore deve essere seguito da unʼaltra persona2. La preparazione della coppia pet partner è fondamentale per evitare tutte quelle situazioni di stress del cane.
Ricordiamo che prevenire lo stress del pet signifi ca anche dargli la possibilità di riposarsi quando raggiunge una certa età. Il nostro super cane merita di godersi la vecchiaia.
La seduta non deve mai avere una durata eccessiva. Il cane non deve effettuare più di due incontri al giorno, con un intervallo di almeno unʼora.
A fi ne seduta in base al carattere del cane bisogna fargli fare qualcosa di estremamente piacevole. In ogni seduta del progetto gli ultimi minuti sono sempre dedicati al gioco senza o con il fruitore. Il gioco diventa un premio per il cane e per lʼalunno. Portare con se un tappetino e/o una gabbia può servire per dare al cane la possibilità di avere un posto dove poter stare tranquillo e rilassarsi. Per il benessere di salute dellʼanimale è necessario, sempre, avere a disposizione una ciotola per lʼacqua.
Quarta sezione: Valutazione fi siologica del caneDurante un anno di attività lavorativa sono stati eseguiti 60 campioni di feci
e 4 di pelo, su entrambi i due cani, per la ricerca delle concentrazioni di testosterone, progesterone e cortisolo. Il prelevamento e la preparazione dei campioni sono stati eseguiti dalla laureanda, la determinazione delle concentrazioni dal Dott. Accorsi.
In tutta la durata del prelevamento si è fatta particolare attenzione a delle variabili, decise in precedenza. In specifi co si sono segnate tutte le attività che potevano causare un aumento dello stress dellʼanimale.
I campioni di feci sono stati prelevati da Novembre 2003 fi no a Settembre 2004. I risultati ottenuti sono stati valutati seguendo una serie di variabili: il tempo (grafi co 1), lʼintensità lavorativa, il lavoro, ed i fattori stressanti esterni allʼattività dei cani. Si è tenuto conto del periodo in cui le due femmine erano in calore.

213
Ann. Fac. Medic. Vet. di Parma (Vol. XXV, 2005) - pag. 205 - pag. 218
Per variabile stress sʼintendono tutte quelle situazioni, diverse dallʼattività scolastica, che hanno creato un evidente stato di tensione comportamentale nel cane, durante il periodo in cui si sono eseguiti i prelievi: 1)Viaggio in aereo; 2) Altro; 3) Assenza del padrone; 4) Interventi chirurgici; 5) Momenti senza evidenti stati di stress; 6) Patologie; 7) Vaccinazioni.
Entrambi i cani presentano valori elevati di progesterone durante il viaggio in aereo, un soggiorno a Cagliari verso Dicembre, e lʼinizio dellʼattività lavorativa. Il Border Collie ha valori elevati di progesterone e testosterone durante lʼassenza del proprietario. La Labrador presenta un picco di cortisolo nel prelievo eseguito il giorno dopo lʼovarioisterectomia, in quei giorni il cane ha manifestato evidenti stati di stress.
Nella variabile lavoro si sono posti tre parametri: 1) Prima: campioni di feci prelevati il giorno precedente allʼattività scolastica; 2) Durante: campioni di feci prelevati in giorni di attività intensiva quotidiana; 3) Dopo: campioni di feci prelevati il giorno dopo lʼattività scolastica. I grafi ci relativi al progesterone danno uguali risultati per entrambi i cani, infatti si hanno valori maggiori nei campioni dopo, a seguire il parametro durante (grafi co 2). Il testosterone ha valori maggiori nel Labrador nel parametro dopo, ma nel Border Collie prima del lavoro. Il cortisolo presenta valori elevati per entrambi i cani nei campioni prelevati durante lʼattività.
Unʼaltra variabile presa in considerazione è stata lʼintensità lavorativa, che si riferisce a quei campioni prelevati durante giorni di attività scolastica alta, normale e giorni in cui i soggetti non hanno lavorato. In questo caso i grafi ci sono diversi a seconda del cane, infatti il Labrador presenta valori maggiori sia di progesterone sia di testosterone durante unʼattività lavorativa elevata, e valori minori in assenza di lavoro. La Border Collie ha un aumento dei 2 ormoni sopraccitati nel parametro nulla, che però coincide con il periodo del calore; escludendo questo ultimo fattore si hanno valori elevati per tutti e tre gli ormoni maggiormente in attività lavorativa intensa. Nel Labrador è molto evidente il picco di cortisolo, legato allʼintervento, durante attività nulla.
Greta - Feci - Progesterone
0,00
200,00
400,00
600,00
800,00
1000,00
1200,00
04/11/2003
18/11/2003
02/12/2003
16/12/2003
30/12/2003
13/01/2004
27/01/2004
10/02/2004
24/02/2004
09/03/2004
23/03/2004
06/04/2004
20/04/2004
04/05/2004
18/05/2004
01/06/2004
15/06/2004
29/06/2004
13/07/2004
27/07/2004
10/08/2004
24/08/2004
07/09/2004
21/09/2004
Data
pg/mg
Grafi co 1: variabile tempo Border Collie

214
Ann. Fac. Medic. Vet. di Parma (Vol. XXV, 2005) - pag. 205 - pag. 218
LAVORO - PROGESTERONE- MAIKA
0,00
50,00
100,00
150,00
200,00
250,00
300,00
350,00
400,00
450,00
prima durante dopo
DATA
pg/mg
Grafi co 2: variabile giorno lavorativo Labrador
I campioni di pelo sono rappresentati da quattro prelievi di pelo tagliato sempre nella stessa zona dellʼaddome. I valori ormonali dei campioni di feci rappresentano un parametro temporale giornaliero, cioè il risultato ottenuto si riferisce alle concentrazioni ormonali del cane del giorno precedente al prelievo. Nel caso dei campioni di pelo, invece, si tratta di un parametro mensile poiché il valore si riferisce alle concentrazioni ormonali del cane dei mesi precedenti. Si possono quindi valutare i risultati come parametri cronici.
Il grafi co relativo al progesterone presenta un graduale aumento del valore ormonale in entrambi i cani, con un crollo nellʼultimo prelievo per il Labrador. Molto simile anche lʼandamento del testosterone con un calo in entrambi i cani. Nel grafi co relativo al cortisolo si ha un calo dal primo al terzo campione, per avere poi un leggero aumento nellʼultimo prelievo.
Conclusioni
La zooantropologia applicata permette di lavorare in un ampio piano educativo. La relazione con lʼanimale è talmente ricca di insegnamenti che è spesso diffi cile, allʼinizio di ogni progetto, stilare un nucleo dʼinteresse ben preciso. Sono talmente tanti i campi che si possono trattare parlando dellʼanimale che si ha diffi coltà a scegliere lʼarea che porterà al raggiungimento degli obiettivi prefi ssati.
Spesso ci si chiede il perché del benessere e dei benefi ci di queste terapie, ma basta pensare ai principi della zooantropologia e soprattutto al ruolo dellʼanimale per capirne il motivo. E importante soffermarsi soprattutto sullʼimportanza della relazione con il cane, di cui si è ampiamente parlato nella terza sezione. Un cane coinvolto nella zooantropologia applicata è un super cane, di conseguenza va trattato come tale, dalla nascita alla morte. Nei tre anni di progetto ho potuto sperimentare il reale patrimonio affettivo e comportamentale che un cane può offrire durante i progetti di Pet Therapy, ma ho anche sperimentato quale grado di stress può reggere.

215
Ann. Fac. Medic. Vet. di Parma (Vol. XXV, 2005) - pag. 205 - pag. 218
Da ciò si evince quanto sia necessaria una tutela del pet ed una prevenzione degli stati di stress.
Lo studio svolto insieme alla facoltà di veterinaria di Bologna conferma lʼimportanza di preservare il pet da fattori stressanti eccessivi. Nei risultati ottenuti dalla ricerca delle concentrazioni degli ormoni nelle feci e nel pelo, si è osservato, in linea generale, che si hanno degli aumenti dei valori collegati a fattori stressanti, tra cui unʼattività lavorativa alta. Anche per questo motivo dobbiamo tutelare questi pet da ogni situazione che aumenti la tensione psicologica.
Perché un progetto di terapia assistita abbia successo ed arrivi al raggiungimento degli obiettivi prescelti, bisogna in primis seguire delle linee guida, dei protocolli e delle basi teoriche zooantropologiche.
L esperienza di questi tre anni ha evidenziato lʼimportanza della preparazione della coppia pet operator, ma anche del valore da attribuire alla collaborazione di tutta lʼequipe. Valutando i singoli casi che ho seguito, ho potuto constatare che, laddove lʼinsegnante di sostegno del gruppo classe e gli assistenti partecipavano attivamente, il progetto è andato a buon fi ne. Nei casi di scarsa collaborazione ho riscontrato enormi diffi coltà sia nelle singole sedute sia nel percorso globale.
Alla base di questo trattato e della zooantropologia sta la valorizzazione dellʼanimale e la riscoperta del suo ruolo. In questa società si tende a strumentalizzare o antropomorfi zzare lʼanimale ma dobbiamo, con questi progetti, far capire il valore referenziale di questo rapporto. Nellʼultimo secolo si è perso il bisogno delle referenze non umane; lʼevoluzione dellʼuomo è sempre stata accompagnata dallʼanimale, solo questo deve farci capire la reale importanza del rapporto.
Il rapporto con il cane e lʼanimale in generale ci offre dei valori referenziali di estrema rilevanza, se non si tutelano questi ci si accorgerà forse troppo tardi di quello che si è perduto.
Bibliografi a
1. Delta Society, 2002; Corso Pet Partners, AIUCA2. Gallicchio B., 2001; Lupi Travestiti, Edizioni Cinque3. Giannini G., 1992; Viaggio nellʼuniverso dellʼhandicap, Edizioni del Cerro4. Houpt K.A., 2000; Il comportamento degli animali domestici, EMSI 5. Mainardi D., 1992; Dizionario di etologia, Eianudi6. Marchesini R., 2001; A lezione dal mondo animale, Apeiron7. Marchesini R., 2003; Corso in etologia e benessere degli animali dʼaffezione,
AUSL Modena8. Marchesini R., 2004: Canone di Zooantropologia Applicata, Apeiron9. Marchesini R., 2004; Corso Base di Zooantropologia Applicata alla Didattica,
Centro Studi Scivac10. Marchesini R., 2004; Lʼidentità del cane, Apeiron11. Marchesini R., 2004; Nuove prospettive nelle attività e terapie assistite dagli
animali, Nestlè Purina

216
Ann. Fac. Medic. Vet. di Parma (Vol. XXV, 2005) - pag. 205 - pag. 218
12. Marchesini R., 2005; Corso Avanzato di Zooantropologia Applicata alla Didattica, Centro Studi Scivac
13. Montagner H., 2001; Il bambino, lʼanimale e la scuola, Alberto Perdisa Editore14. Notari L., 2004; Dal canile a casa vostra, Calderini15. Pageat P., 1999; Patologia comportamentale del cane, Point Veterinarie Italie16. Pittavino R., 2002; Corso di educatore cinofi lo, Cinofi lia17. Pittavino R., 2002; Corso di istruttore cinofi lo di primo livello, Cinofi lia 18. Pittavino R., 2004; Corso in riabilitazione del cane aggressivo, Cinofi lia19. Raikes R., 1997; Il Labrador e gli altri Retriever, G. De Vecchi Editore20. Rossi V., 2000; Il Border Collie, DVE Italia S.P.A.
RIASSUNTO
Il progetto è stato attuato per tre anni consecutivi (2003-2005) presso lʼIstituto Comprensivo SanVitale Fra Salimbene, (Parma), ed ha coinvolto in ciascun anno sette alunni diversamente abili e/o con disagi sociali e tre gruppi classe.
Per progetto di terapia assistita dallʼanimale si intende un intervento specialistico con il coinvolgimento di animali abilitati mirato al raggiungimento di precisi obiettivi.
Si sono seguiti i canoni della zooantropologia assistenziale, le cui basi si fondano sul corretto approccio e conoscenza del mondo animale e del rapporto con lʼuomo. Si è costituita unʼequipe composta dagli insegnanti di sostegno, il conduttore dellʼanimale (project manager), gli insegnanti delle classi e le assistenti. Gli interventi erano mirati ad obiettivi multidisciplinari, educativi, psico-sociali, e motori; ogni fruitore aveva una propria cartella con un suo percorso. Tutto il progetto è stato monitorato con schede di valutazione, registrazioni video e fotografi che e relazione fi nale.
I due cani coinvolti sono stati seguiti dal punto di vista veterinario e comportamentale; si è analizzato costantemente il loro stato psicologico, riuscendo ad elencare tutte quelle azioni che evidenziavano tensione nellʼanimale e sono state seguite, per la tutela dellʼanimale, regole ben precise per evitare tale situazione. Per un anno sono stati prelevati dei campioni di feci e pelo dai cani, per valutare le concentrazioni di progesterone, testosterone e cortisolo, per poterle analizzare in correlazione allʼattività lavorativa.
Summary
The project has been carried out for 3 years (2003 to 2005) at the Istituto Comprensivo Sanvitale Fra Salimbene, (Parma), and has seen the partecipation of seven pupils (with disabilities and/or with social problems) and three different class groups.

217
Ann. Fac. Medic. Vet. di Parma (Vol. XXV, 2005) - pag. 205 - pag. 218
A project of animals assisted therapy (also known as pet therapy) utilizes trained animals to achieve precise goals. The project and its related programs were devised following the zooanthropological principles, which are based on a correct approach and knowledge of the animal world and its relation with human beings.
Each program has been carried out with a team made up of remedial teachers, the animal handler (who is the project manager) the teachers of the classes involved and the school assistants. The modules were designed to achieve multidisciplinary, educational, psico-social and physical goals. Every child had his/her own work module. The whole project has been constantly checked with evaluations fi les, video recordings, pictures and a fi nale report.
The two dogs, that were being worked with, were checked from a veterinary and behaviour point of view. Their psycological condition has been costantly analized to recognize all the actions which pointed out stress in the animal and precise rules have been followed to protect the animal and prevent stressful situations.
During the whole year dogʼs faeces and hair samples have been taken to evaluate the progesterone, testosterone and hydrocortisone concentration, and so to be able to analize it according to the dogʼs working activity.

218
Ann. Fac. Medic. Vet. di Parma (Vol. XXV, 2005) - pag. 205 - pag. 218

219
Ann. Fac. Medic. Vet. di Parma (Vol. XXV, 2005) - pag. 219 - pag. 230
LATTE IN POLVERE: STRATEGIE DI CONTROLLO DEL RISCHIO DI CONTAMINAZIONE DA
ENTEROBACTER SAKAZAKII
Ballista C.1, Bonardi S.2
Introduzione
L allattamento al seno è tuttora considerato, sia dal punto di vista igienico-sanitario che sotto il profi lo nutritivo, il metodo più sicuro per lʼalimentazione del neonato ed è consigliato fi no al sesto mese di vita del bambino. Dopo tale periodo, però, i neonati hanno bisogno di ricevere, oltre al latte materno, anche prodotti alimentari complementari per soddisfare le crescenti esigenze nutrizionali.
In certe circostanze, inoltre, esistono situazioni tali da non permettere il ricorso allʼallattamento al seno. In tutti questi casi lʼalimentazione è costituita da latte formulato (liquido ed in polvere), preparato secondo standard riconosciuti in campo internazionale. L uso del latte in polvere richiede unʼadeguata conoscenza delle corrette modalità di preparazione e dei rischi igienici che possono derivare da manipolazione e conservazione impropri, sia a livello domestico che ospedaliero. Infatti, diversamente dal latte formulato liquido, che risulta sterile per effetto dei trattamenti tecnologici subiti prima della commercializzazione, le formulazioni in polvere hanno una fl ora microbica residua composta generalmente da germi saprofi ti e da Enterobacteriaceae.
Negli ultimi anni sono stati segnalati casi di malattia, a carattere invasivo, associati ad Enterobacteriaceae in neonati e lattanti, le cui cause potevano essere ricondotte allʼassunzione di alimenti in polvere per lʼinfanzia. In particolare ha assunto unʼimportanza sempre più rilevante un batterio appartenente al genere Enterobacter: Enterobacter sakazakii.
Recentemente lʼICMSF (International Commission on Microbiological Specifi cations for Foods) (2002) ha descritto E. sakazakii come “una grave minaccia per particolari categorie di persone, delle quali il batterio mette a rischio la stessa vita o comunque ne può alterare signifi cativamente la qualità a causa dei postumi, anche a lungo termine, dovuti allʼinfezione”. Di conseguenza questo batterio è stato inserito tra i più temuti patogeni di origine alimentare, al pari di Listeria monocytogenes, Clostridium botulinum tipo A e B e Cryptosporidium parvum.
1 Medico Veterinario2 Università di Parma, Facoltà di Medicina Veterinaria, Dipartimento di Salute Animale, Sezione di Ispezione degli Alimenti di origine animale

220
Ann. Fac. Medic. Vet. di Parma (Vol. XXV, 2005) - pag. 219 - pag. 230
E. sakazakii: caratteristiche ed ecologia
Enterobacter sakazakii appartiene alla famiglia delle Enterobacteriaceae e, in particolare, al genere Enterobacter. E un bacillo Gram negativo (0,6-1,0 X 1,2-3 μm), asporigeno, mesofi lo, mobile. Tutti i ceppi di E. sakazakii crescono rapidamente su TSA (Trypticase Soy Agar), agar BHI (Brain Heart Infusion) e agar sangue, dando origine a colonie pigmentate di giallo dopo 48 - 72 ore di incubazione. La produzione del pigmento è più pronunciata a 25°C rispetto a 36°C. Il range di temperatura che permette la crescita del microrganismo va da 6°C a 47°C (Nazarowec-White et al., 1999; Heuvelink et al., 2001).
Per quanto riguarda il profi lo biochimico, la produzione del pigmento giallo, la reazione generalmente negativa al test di fermentazione del sorbitolo, la reazione ritardata alla desossiribonucleasi e la produzione di Tween 80 esterasi, sono i test specifi ci per discriminare E. sakazakii da E. cloacae. Tutti i ceppi di E. sakazakii sono α-glucosidasi positivi e fosfamidasi negativi, caratteri che rendono possibile una sua rapida identifi cazione e differenziazione dalle altre Enterobacteriaceae (Farmer III et al., 1980)
Si conosce molto poco riguardo i fattori di virulenza e la patogenicità di E. sakazakii. In quanto batterio Gram negativo, possiede le endotossine, componenti lipopolisaccaridiche della membrana cellulare, termoresistenti e responsabili di attività tossica, effetto pirogeno e danni allʼapparato circolatorio (Duffy et al., 1997).
E. sakazakii può presentare anche una capsula composta da eteropolisaccaridi (29-30% acido glucuronico, 23-30% glucosio, 19-24% galattosio, 13-22% fucosio, 0-8% mannosio) cui probabilmente si deve la lunga sopravvivenza, fi no a 24 mesi, del microrganismo nel latte in polvere. La capsula, inoltre, è responsabile dellʼadesione a superfi ci di lattice, silicone e perfi no acciaio inossidabile, sulle quali determina la formazione di un biofi lm che lo rende più resistente agli agenti disinfettanti (Iversen e Forsythe, 2003; Iversen et al., 2004).
Nazarowec-White e Farber (1997a) hanno studiato la resistenza al calore di E. sakazakii nei prodotti in polvere per lʼinfanzia; nonostante sia più termotollerante della maggior parte delle altre Enterobacteriaceae, la sua resistenza termica non è suffi cientemente elevata per consentire la sopravvivenza alle temperature raggiunte durante la pastorizzazione.
E. sakazakii mostra una certa attitudine allʼosmotolleranza: questa sua proprietà favorirebbe la sopravvivenza del microrganismo nel latte in polvere, che ha unʼattività dellʼacqua (a
w) pari a circa 0,2. E. sakazakii è in grado di proteggersi
dallo stress osmotico accumulando rapidamente al proprio interno ioni, in particolare K+, ed in seguito soluti compatibili, come prolina, glicina, betaina e, in particolare, trealosio, un disaccaride del glucosio (Kempf e Bremer, 1998).
La buona sopravvivenza delle cellule di E. sakazakii sottoposte ad essiccazione ad elevate temperature (45°C) e la capacità di crescere fi no a 47°C, dimostrano che, in condizioni di ambiente caldo e secco come si possono avere, ad esempio, in prossimità di essiccatori nelle industrie, il batterio si trova competitivamente avvantaggiato rispetto ad altre Enterobacteriaceae (Breeuwer et

221
Ann. Fac. Medic. Vet. di Parma (Vol. XXV, 2005) - pag. 219 - pag. 230
al., 2003; Edelson-Mammel e Buchanan, 2004).Per quanto concerne lʼecologia, sebbene E. sakazakii sia stato isolato da
unʼampia varietà di fonti, il reservoir del microrganismo continua a non essere completamente noto ed a sfuggire agli innumerevoli tentativi di identifi carlo. E. sakazakii è stato isolato da acque superfi ciali (Ongradi , 2002), intestino dei moscerini della frutta messicani (Anostrepha ludens) (Kuzina et al., 2001) e delle larve della mosca di stalla Stomoxys calcitrans (Hamilton et al., 2003). S. calcitrans ha una distribuzione cosmopolita che può essere facilmente messa in relazione con le infezioni da E. sakazakii riportate in diverse nazioni. E. sakazakii è stato isolato anche da campioni provenienti da industrie alimentari, dove è stato isolato sui macchinari delle linee di produzione, nonché da abitazioni private (Kandhai et al., 2004a, 2004b; Guillame-Gentil et al., 2005).
Aspetti dellʼinfezione da E. sakazakii nel neonato
Le infezioni da E. sakazakii continuano a rimanere rare, ma sono riscontrabili molto più frequentemente a carico di neonati e bambini piuttosto che negli adulti.
Sepsi, meningite ed enterocolite necrotizzante (NEC) rappresentano i sintomi più comuni dellʼinfezione. Sebbene E. sakazakii sia in grado di provocare malattia in tutte le fasce dʼetà, sono i nati pre-termine (meno di 36 settimane di gestazione), i nati con basso peso (<2500 grammi), gli immunocompromessi, i nati da madri HIV-positive ed i neonati a termine ricoverati nei reparti di terapia intensiva, i soggetti maggiormente a rischio di contrarre lʼinfezione. Ciò è dovuto al fatto che essi, nella maggior parte dei casi, vengono alimentati con latte in polvere. Il microrganismo riesce facilmente a superare la barriera gastrica e causare lʼinfezione, in quanto il pH dello stomaco dei neonati risulta meno acido di quello degli adulti.
Tra le infezioni causate da E. sakazakii, la meningite rappresenta la forma più grave. E probabile che, come gli altri tre principali patogeni responsabili di meningite nei bambini al di sotto dei 5 anni dʼetà (Pneumococcus, Haemophilus, Meningococcus), anche E. sakazakii manifesti un particolare tropismo per il sistema nervoso centrale e, per la sua tendenza a causare lesioni cerebrali, è stato paragonato a Citrobacter diversus (Gallagher e Ball, 1991). Negli stadi avanzati della malattia, le manifestazioni patologiche più frequentemente riscontrate sono: ventricoliti, ascessi cerebrali, formazione di cisti, idrocefalo, quadriplegia, ritardato sviluppo mentale ed infarto cerebrale (Bar-Oz et al., 2001; Lai, 2001; Block et al., 2002).
L altra importante manifestazione patologica neonatale causata da E. sakazakii è lʼenterocolite necrotizzante (NEC). I prerequisiti coinvolti nella patogenesi di tale malattia sembrano essere: ischemia intestinale neonatale, colonizzazione microbica dellʼintestino ed un aumento del substrato proteico presente a livello intestinale, come può derivare dallʼassunzione di latte formulato (Lucas e Cole, 1990).
La NEC è caratterizzata da necrosi e pneumatosi intestinale e rappresenta la più comune patologia gastro-enterica dʼurgenza del neonato, con un tasso di mortalità che va dal 10 al 55% (Peter et al., 1999).

222
Ann. Fac. Medic. Vet. di Parma (Vol. XXV, 2005) - pag. 219 - pag. 230
Aspetti microbiologici degli IFM (Infant Formula Milk)
Il latte vaccino in polvere non è un prodotto sterile e, una volta reidratato, rappresenta un buon terreno di crescita per microrganismi. Studi che rivelano la presenza di Enterobacteriaceae nel latte in polvere sono numerosi: Muytjens et al. (1988) hanno isolato Enterobacteriaceae dal 52,5% di 141 campioni di latte formulato, nel 14,1% delle quali è stato rinvenuto E. sakazakii con un basso livello di contaminazione (0,36 a 66,0 UFC/100 grammi).
Per il loro potere patogeno, i microrganismi più frequentemente ricercati nei latti formulati in polvere, oltre alle Enterobacteriaceae, sono Staphylococcus aureus, Bacillus cereus, Clostridium perfringens e Salmonella spp. (Forsythe, 2005).
In base allʼassociazione causale tra la presenza nel latte in polvere e la malattia del neonato, i microrganismi patogeni possono essere suddivisi in 3 distinte categorie (FAO/WHO, 2004):o Categoria A (causalità evidente): appartengono a questa categoria Salmonella
enterica ed E. sakazakii, microrganismi che causano patologie gravi (infezioni sistemiche, enterocoliti necrotizzanti, diarree severe) nei soggetti alimentati con latte in polvere contaminato, per i quali è stata dimostrata microbiologicamente ed epidemiologicamente una chiara associazione tra presenza nel prodotto (veicolo e fonte di infezione) ed insorgenza della malattia.
o Categoria B (causalità plausibile ma non ancora dimostrata): appartengono a questa categoria altre specie di Enterobacteriaceae che sono capaci di causare patologie gravi (infezioni sistemiche, enterocoliti necrotizzanti, diarree severe) nei neonati e che sono state isolate nel latte in polvere per lʼinfanzia, ma per le quali non esistono chiare evidenze epidemiologiche e microbiologiche che dimostrino la correlazione tra il prodotto contaminato e lʼinfezione nei neonati. Questa categoria comprende, per esempio: Pantoea agglomerans ed Escherichia vulneris (entrambi formalmente conosciuti come Enterobacter agglomerans), Hafnia alvei, Klebsiella pneumoniae, Citrobacter koseri, Citrobacter freundii, Klebsiella oxytoca ed Enterobacter cloacae.
o Categoria C (causalità poco plausibile o non ancora dimostrata): appartengono a questa categoria microrganismi quali Bacillus cereus, Clostridium diffi cile, Clostridium perfringens, Clostridium botulinum, Staphylococcus aureus e Listeria monocytogenes, che sebbene capaci di provocare gravi malattie nei neonati, non sono stati isolati dal latte in polvere per lʼinfanzia o, quando ciò è avvenuto, non sono stati riconosciuti come gli agenti responsabili di malattia nei neonati.
Aspetti microbiologici e controllo del rischio a livello di produzione degli IFM
I latti formulati sono defi niti come “prodotti lattei per la prima e la seconda infanzia che si avvicinano molto per parametri nutritivi e di composizione al latte materno” (Del Bono e Stefani, 1997).
La tecnologia di produzione dei latti formulati ricalca fondamentalmente

223
Ann. Fac. Medic. Vet. di Parma (Vol. XXV, 2005) - pag. 219 - pag. 230
quella della produzione del latte essiccato con sistema spray-drying, salvo lievi modifi che che interessano soprattutto le integrazioni e le additivazioni dei complementi nutritivi, solitamente miscelati al latte prima del risanamento termico ed additivati prevalentemente in forma liquida.
I problemi microbiologici più importanti associati al consumo di IFM riguardano la presenza in questi ultimi di Salmonella ed altre Enterobacteriaceae, compreso E. sakazakii. La presenza di questi microrganismi negli IFM può realizzarsi in due modi:o contaminazione attraverso lʼutilizzo di ingredienti non sottoposti a trattamento
termico durante il processo di produzione;o contaminazione dallʼambiente di produzione durante i passaggi cosiddetti
“asciutti” del processo, come per esempio la contaminazione post - trattamento termico, in genere acquisita durante la disidratazione o il confezionamento del prodotto.
Partendo dal presupposto che il trattamento termico che il latte subisce effettui un risanamento del prodotto dal punto di vista microbiologico, si può desumere che probabilmente la contaminazione avvenga in qualche punto tra il processo di spray-drying ed il confezionamento. Quindi un aspetto cruciale per prevenire la contaminazione batterica del prodotto fi nito è il controllo dei microrganismi di derivazione enterica negli ambienti di essiccazione, post-essiccazione e pre-confezionamento.
I vari stabilimenti per la produzione del latte formulato differiscono per diversi aspetti, come per esempio lʼanno di costruzione, i materiali, la struttura e le condizioni di lavabilità; questi aspetti infl uenzano il grado di effi cienza nel controllare la popolazione microbica. Il rischio di contaminazione microbica negli IFM pare sia infatti maggiormente legato allʼambiente di produzione, più che ai singoli processi produttivi (Gurtler et al., 2005).
L applicazione delle Buone Pratiche di Lavorazione (GMP), delle Buone Pratiche Igieniche (GHP) e dellʼAnalisi del Rischio e Controllo dei Punti Critici (HACCP) sono misure volte ad identifi care e controllare le varie possibilità di contaminazione degli IFM sia a livello di produzione che di lavorazione (http://www.efsa.eu.it). Nellʼintero processo produttivo, la qualità igienica della materie prime, dei fi ltri per lʼaria o per lʼacqua, dei setacci, dei rilevatori di metalli e dei magneti, le temperature di pastorizzazione e di stoccaggio si pongono come importanti punti di controllo (http://www.efsa.eu.it; FAO/WHO, 2004).
Dato che per ridurre e minimizzare lʼincidenza di E. sakazakii nellʼambiente di produzione, e quindi anche nel prodotto fi nito, è necessario tenere sotto controllo le Enterobacteriaceae, un ulteriore elemento essenziale per la prevenzione è il mantenimento di opportune “condizioni di assenza di umidità” (dry conditions) in tutta lʼarea ad elevata igiene, in quanto lʼumidità ha un effetto immediato sullʼaumento numerico delle Enterobacteriaceae. Devono quindi essere assicurate condizioni di assenza di umidità attraverso lʼeliminazione di ogni possibile fonte di idrica (ingresso accidentale, condensa nei tubi di conduzione, acqua di lavaggio, ecc.) e lʼapplicazione di procedure di lavaggio a secco per le linee di produzione, le attrezzature e tutto lʼambiente di produzione (http://www.efsa.eu.it; FAO/WHO, 2004).

224
Ann. Fac. Medic. Vet. di Parma (Vol. XXV, 2005) - pag. 219 - pag. 230
L effi cacia di queste misure di controllo deve essere verifi cata attraverso lʼapplicazione di piani di monitoraggio microbiologico che prevedono la raccolta di campioni dagli ingredienti crudi (per il processo di miscelazione liquida), dai prodotti fi niti, dalle attrezzature poste sulle linee di produzione (residui, superfi ci a contatto con gli alimenti), nonché dallʼambiente di produzione (superfi ci esterne delle attrezzature e nelle vicinanze delle linee produttive).
Controllo del rischio in ambiente domestico e ospedaliero
In ambito domestico, i produttori di IFM raccomandano che il latte venga ricostituito, immediatamente prima di ogni poppata, utilizzando acqua bollente. L utilizzo di acqua a temperatura di 70° C o più è in grado di assicurare una riduzione della carica batterica di E. sakazakii pari o superiore a 4 logaritmi (Edelson-Mammel e Buchanan, 2004) ma può avere conseguenze per quanto riguarda lʼaspetto nutritivo (distruzione di elementi termolabili, come le vitamine) e può creare problemi nella manipolazione e somministrazione del prodotto. Per tali ragioni non sempre questa condizione viene rispettata e, di conseguenza, la temperatura prescelta spesso non è in grado di inattivare E. sakazakii.
Un altro problema connesso con lʼutilizzo di latte formulato riguarda la sua conservazione dopo la ricostituzione. Le ditte produttrici invitano ad eliminare il prodotto rimanente dopo la poppata, ma non è da escludere che a livello domestico vengono preparati più biberon pronti allʼuso da riscaldare al momento della somministrazione. Considerando la buona resistenza termica di E. sakazakii, questa abitudine è da ritenere altamente a rischio (Edelson-Mammel e Buchanan, 2004).
Nonostante sia stata dimostrata la cessazione della crescita di E. sakazakii a temperature di refrigerazione (4°C) (Nazarowec-White e Farber, 1997b), non sempre la temperatura dei frigoriferi domestici corrisponde a questo valore, principalmente per le ripetute operazioni di apertura e chiusura dellʼelettrodomestico che possono susseguirsi nellʼarco di una giornata.
Per la prevenzione del rischio, a livello domestico vengono fornite le seguenti raccomandazioni (ADA, 1991; FAO/WHO, 2004):o quando possibile utilizzare, al posto del latte in polvere, latti liquidi disponibili
sul mercato che non necessitano delle operazioni di ricostituzione pericolose per la contaminazione microbica del prodotto;
o attenersi scrupolosamente alle istruzioni riportate sulle confezioni;o utilizzare acqua calda (70-90°C) per la ricostituzione del latte in polvere;o adottare rigorose norme igieniche utilizzando contenitori puliti e disinfettati,
nonché unʼadeguata igiene personale (lavaggio delle mani);o preparare solo la poppata necessaria per il pasto, evitando di preparare in anticipo
quelle dei pasti successivi;o evitare di lasciare a temperatura ambiente il latte ricostituito, se non utilizzato;o assicurare il raffreddamento rapido del prodotto ricostituito e la sua conservazione
in frigorifero se non utilizzato immediatamente;

225
Ann. Fac. Medic. Vet. di Parma (Vol. XXV, 2005) - pag. 219 - pag. 230
o limitare a periodi di tempo non superiori alle 4 ore lʼintervallo di tempo tra la ricostituzione del prodotto ed il suo consumo (hang time);
Quando una grande quantità di latte in polvere viene reidratato con acqua calda per ottenere grandi quantitativi di latte ricostituito, come avviene nelle strutture ospedaliere e negli asili nido, la temperatura della miscela può diminuire e può risultare insuffi ciente ad inattivare E. sakazakii. Sebbene i produttori raccomandino che il latte in polvere venga ricostituito subito prima di ogni poppata, nei reparti neonatali a volte i biberon vengono preparati anticipatamente ed in seguito mantenuti a temperature di refrigerazione per soddisfare le necessità alimentari dei bambini nellʼarco dellʼintera giornata.
In sintesi, le norme da seguire per assicurare il massimo livello di sicurezza microbiologica a livello ospedaliero/asili nido sono le seguenti (ADA, 1991; FAO/WHO, 2004):o adottare buone pratiche igieniche nelle aree di preparazione;o predisporre linee guida riguardo preparazione, manipolazione, conservazione e
procedure di controllo del prodotto;o disporre di un locale adibito solamente alla preparazione, separato dai reparti di
degenza (negli ospedali), provvisto di unʼarea per lo stoccaggio del prodotto e frequentato unicamente da personale autorizzato;
o se la struttura manca di un apposito locale per la preparazione, predisporre comunque unʼarea da destinarsi unicamente a tale scopo;
o disporre di utensili e attrezzature atti ad una facile sanifi cazione;o sottoporre a trattamento termico (per esempio: lavaggio in lavastoviglie) o ad
autoclavaggio tutti gli utensili adoperati per la preparazione;o utilizzare, quando possibile, utensili monouso;o disporre di personale qualifi cato e specializzato;o assicurare il raffreddamento rapido del prodotto ricostituito e la sua conservazione
in frigorifero;o limitare a periodi di tempo non superiori alle 4 ore lʼintervallo di tempo tra la
ricostituzione del prodotto ed il suo consumo;o evitare di lasciare a temperatura ambiente il latte ricostituito, se non utilizzato;o richiudere opportunamente i contenitori delle polveri di latte non utilizzate
completamente, riporli in frigorifero, apponendo sopra la data di scadenza;o utilizzare, quando possibile, latte in forma liquida;o applicare un corretto piano di autocontrollo basato sui criteri HACCP.
Conclusioni
E. sakazakii è un patogeno emergente a localizzazione ubiquitaria, la cui discreta resistenza al calore, allo stress osmotico ed allʼessiccazione ne ha consentito lʼisolamento da unʼampia varietà di fonti animali e ambientali. La principale fonte di infezione per lʼuomo rimangono, comunque, gli alimenti e, in particolare, il latte formulato in polvere per lʼinfanzia.
Numerosi studi riportati in letteratura mostrano una correlazione signifi cativa

226
Ann. Fac. Medic. Vet. di Parma (Vol. XXV, 2005) - pag. 219 - pag. 230
tra lʼinfezione da E. sakazakii e lʼutilizzo di latti formulati in polvere. In particolare, le metodiche di tipizzazione genotipica degli isolati come, ad esempio, la PFGE, la RAPD-PCR e la ribotipizzazione, hanno permesso di isolare, in diversi episodi di infezione, ceppi identici del microrganismo sia dai casi clinici, sia dagli alimenti assunti dai pazienti. Considerando che i latti in polvere ricostituiti rappresentano un substrato ottimale per la crescita di E. sakazakii e che i soggetti che vengono alimentati con gli IFM sono ad alto rischio, il controllo del patogeno negli alimenti per lʼinfanzia ha assunto negli ultimi anni unʼimportanza sempre maggiore.
Nei Paesi industrializzati sono stati segnalati una sessantina di casi di infezione e numerosi decessi causati da E. sakazakii, in soggetti alimentati con latte in polvere. Questi casi hanno sempre portato al ritiro dal mercato del prodotto, a volte presente in quantitativi ingenti. In Italia, fi no ad oggi, non sono stati segnalati casi di infezione da E. sakazakii e non esiste un sistema di monitoraggio uffi ciale, escludendo quello che può essere realizzato dalle singole ditte produttrici nellʼambito del proprio piano HACCP. L interesse che ha suscitato il problema è comunque testimoniato dalla recente pubblicazione dellʼIstituto Superiore Sanità, inerente i pericoli microbiologici associati allʼalimentazione del neonato (Fiore et al., 2004).
Per quanto riguarda lʼUnione Europea, a norma dellʼarticolo 4 del Regolamento CE n° 852/2004, gli operatori del settore alimentare sono tenuti a rispettare specifi ci criteri microbiologici. Il Regolamento n° 2073/2005 della Commissione europea sui criteri microbiologici applicabili ai prodotti alimentari impone che negli “alimenti in polvere per lattanti e alimenti dietetici in polvere a fi ni medici speciali destinati ai bambini di età inferiore ai 6 mesi” venga eseguita la ricerca di Enterobacter sakazakii, che deve risultare assente in 10 g di prodotto. A tal fi ne, devono essere analizzate 30 unità campionarie per lotto durante il periodo di conservabilità del prodotto immesso sul mercato. I risultati sono considerati soddisfacenti se in tutte le unità campionarie non si rileva la presenza del microrganismo, insoddisfacenti se anche una sola unità campionaria risulta contaminata da E. sakazakii. Per valutare lʼigiene del processo produttivo, si deve invece procedere alla ricerca delle Enterobacteriaceae, che devono risultare assenti in 10 g di prodotto e in 10 unità campionarie per lotto. L analisi va eseguita alla fi ne del processo di lavorazione. Nel caso di risultati non soddisfacenti (presenza di Enterobacteriaceae in una delle unità campionarie), la partita deve essere sottoposta anche alla ricerca di E. sakazakii e Salmonella enterica.
Bibliografi a
American Dietetic Association (1991). Guidelines for preparation of formula and breastmilk in health care facilities. Accessed on November 13, 2003 at: http://www.eatright.org/Public/NutritionInformation/104_17242.cfm
Bar-Oz B., Preminger A., Peleg O., Block C., Arad I. (2001). Enterobacter sakazakii infection in the newborn. Acta Paediatrica, 90, 356-358.
Block C., Peleg O., Minster N., Bar-Oz B., Simhon A., Arad I., Shapiro M. (2002). Cluster of neonatal infections in Jerusalem due to unusual biochemical

227
Ann. Fac. Medic. Vet. di Parma (Vol. XXV, 2005) - pag. 219 - pag. 230
variant of Enterobacter sakazakii. European Journal of Clinical Microbiology and Infectious Diseases, 21, 613-616.
Breeuwer P., Lardeau A., Peterz M., Joosten H. M. (2003). Desiccation and heat tolerance of Enterobacter sakazakii. Journal of Applied Microbiology, 95, 967-973.
Del Bono G., Stefani A. (1997). Latte e derivati. Edizioni ETS, Pisa.Duffy L. C., Zielezny M. A., Carrion V., Griffi th E., Dryja D., Hilty M., Rook
C., Morin F. III (1997). Concordance of bacterial cultures with endotoxin and interleukin-6 in necrotizing enterocolitis. Digestive Diseases and Sciences, 42, (2), 359-365.
Edelson-Mammel S. G., Buchanan R. L. (2004). Thermal inactivation of Enterobacter sakazakii in rehydrated infant formula. Journal of Food Protection, 67, (1), 60-63.
EFSA (2004). Opinion of the Scientifi c Panel on Biological Hazards on a request from the Commission related to the microbiological risks in infant formulae and follow-on formulae. The EFSA Journal, 115, 1-35. http://www.efsa.eu.int
FAO/WHO (2004). Enterobacter sakazakii and other microrganisms in powdered infant formula. Meeting Report. Microbiological risk assessment series, 6.
Farmer III J. J., Asbury M. A., Hickman F. W., Brenner D. J. and the Enterobacteriaceae study group (1980). Enterobacter sakazakii: a new species of “Enterobacteriaceae” isolated from clinical specimens. International Journal of Systematic Bacteriology, 30, (3), 569-584.
Fiore A., Casale M., Aureli P. (2004). Pericoli microbiologici emergenti nellʼalimentazione del neonato: il caso Enterobacter sakazakii. Rapporti ISTISAN 04/13.
Forsythe S. J. (2005). Enterobacter sakazakii and other bacteria in powdered infant milk formula. Maternal and Child Nutrition, 1, 44-50.
Gallagher P. G., Ball W. S. (1991). Cerebral infarctions due to CNS infection with Enterobacter sakazakii. Pediatric Radiology, 21, 135-136.
Guillame-Gentil O., Sonnard V., Kandhai M. C., Marugg J. D., Joosten H. (2005). A simple and rapid cultural method for detection of Enterobacter sakazakii in environmental samples. Journal of Food Protection, 68, (1), 64-69.
Gurtler J. B., Kornacki J. L., Beuchat L. R. (2005). Enterobacter sakazakii: a coliform of increased concern to infant health. International Journal of Food Microbiology, 104, 1-34.
Hamilton J. W., Lehane M. J., Braig H. R. (2003). Isolation of Enterobacter sakazakii from midgut of Stomoxys calcitrans. Emerging Infectious Diseases Journal, 9, 1355-1356.
Heuvelink A. E., Kodde F. D., Zwartkruis-Nahuis J. T. M., De Boer E. (2001). Enterobacter sakazakii in melkpoeder. Keuringsdienst van Waren Oost. Project number OT 0110.
ICMSF (2002). Microbiological testing in food safety management. In: Microrganisms in foods, vol. 7, cap. 8. Kluwer Academic/Plenum Publishers, New York.
Iversen C., Forsythe S. J. (2003). Risk profi le of Enterobacter sakazakii, an emergent pathogen associated with infant milk formula. Trends in Food Science and Technology, 14, 443-454.

228
Ann. Fac. Medic. Vet. di Parma (Vol. XXV, 2005) - pag. 219 - pag. 230
Iversen C., Lane M., Forsythe S. J. (2004). The growth profi le, thermotolerance and biofi lm formation of Enterobacter sakazakii grown in infant formula milk. Letters in Applied Microbiology, 38, 378-382.
Kandhai M. C., Reij M. W., Gorris L. G., Guillame-Gentil O., Van Schothorst M. (2004a). Occurrence of Enterobacter sakazakii in food production environments and households. Lancet, 363, 39-40.
Kandhai M. C., Reij M., Van Puyvelde K., Guillame-Gentil O., Beumer R. R., Van Schothorst M. (2004b). A new protocol for the detection of Enterobacter sakazakii applied to environmental samples. Journal of Food Protection, 67, 1267-1270.
Kempf B., Bremer E. (1998). Uptake and synthesis of compatible solutes as microbial stress responses to high-osmolality environments. Archives of Microbiology, 170, 319-330.
Kosloske A. M. (1984). Pathogenesis and prevention of necrotizing enterocolitis: a hypotesis based on personal observation and a review of the literature. Pediatrics, 74, 1086-1092.
Kuzina L. V., Peloquin J. J., Vacek D. C., Miller T. A. (2001). Isolation and identifi cation of bacteria associated with adult laboratory Mexican Fruit fl ies, Anastrepha ludens (Diptera: Tephritidae). Current Microbiology, 42, 290-294.
Lai K. K. (2001). Enterobacter sakazakii infections among neonates, infants, children and adults : case reports and a review of the literature. Medicine (Baltimore), 80, 113-122.
Lucas e Cole (1990). Breast milk and neonatal necrotising enterocolitis. Lancet, 336, 1519-1523.
Muytjens H. L., Roelofs-Willemse H., Jaspar G. H. J. (1988). Quality of powdered substitutes for breast milk with regard to members of the family Enterobacteriaceae. Journal of Clinical Microbiology, 26, (4), 743-746.
Nazarowec-White M., Farber J. M. (1997a). Thermal resistance of Enterobacter sakazakii in reconstituted dried-infant formula. Letters in Applied Microbiology, 24, 9-13.
Nazarowec-White M., Farber J. M. (1997b). Incidence, survival and growth of Enterobacter sakazakii in infant formula. Journal of Food Protection, 60, (3), 226-230.
Nazarowec-White M., McKellar R. C., Piyasena P. (1999). Predictive modelling of Enterobacter sakazakii inactivation in bovine milk during high-temperature short-time pasteurization. Food Research International, 32, 375-379.
Ongradi J. (2002). Vaginal infection by Enterobacter sakazakii. Sexually Transmitted Infections, 78, 467.
Peter C. S., Feuerhahn M., Bohnhorst B., Schlaud M., Ziesing S., Von der Hardt H., Poets C. F. (1999). Necrotising enterocolitis: is there a relationship to specifi c pathogens? European Journal of Pediatrics, 158, 67-70.
Regolamento (CE) n. 852/2004 del Parlamento europeo e del Consiglio del 29 aprile 2004 sullʼigiene dei prodotti alimentari. Gazzetta Uffi ciale dellʼUnione Europea. 25.06.2004. L 226, 3-21.

229
Ann. Fac. Medic. Vet. di Parma (Vol. XXV, 2005) - pag. 219 - pag. 230
Regolamento (CE) n. 2073/2005 della Commissione del 15 novembre 2005 sui criteri microbiologici applicabili ai prodotti alimentari. Gazzetta Uffi ciale dellʼUnione Europea. 22.12.2005. L 338, 1-26.
Thurm V., Gericke B. (1994). Identifi cation of infant food as a vehicle in a nosocomial outbreak of Citrobacter freundii: epidemiological subtyping by allozyme, whole-cell protein and antibiotic resistance. Journal of Applied Bacteriology, 76, (6), 553-558.
Riassunto
Enterobacter sakazakii è un bacillo Gram negativo, asporigeno, mobile, appartenente alla famiglia delle Enterobacteriaceae. E. sakazakii, considerato generalmente un patogeno opportunista, recentemente sta assumendo unʼimportanza rilevante in quanto è stato associato a casi di meningite, enterocolite necrotizzante (NEC- Necrotizing Enterocolitis) e setticemia in neonati alimentati con latte formulato in polvere. Le fonti dʼinfezione possono essere ricondotte fondamentalmente a tre tipi di ambienti: industriale, ospedaliero e domestico. Il controllo del rischio può essere effettuato sia a livello di produzione (materie prime, processo produttivo, prodotto fi nito), sia a livello di ambiente ospedaliero mediante lʼapplicazione del metodo HACCP (Hazard Analysis and Critical Control Points), mentre in ambiente domestico il controllo del rischio risulta più diffi coltoso.
Parole chiave: Enterobacter sakazakii, latte in polvere, latte formulato, neonati, meningite, enterocolite necrotizzante, controllo del rischio.
Abstract
Enterobacter sakazakii is a motile, non-spore-forming Gram negative rod belonging to the family Enterobacteriaceae. E. sakazakii is usually considered an opportunistic pathogen. Recently the importance of this microrganism is growing because of its correlation with cases of meningitis, NEC (Necrotizing Enterocolitis) and septicemia in neonates fed with IFM (Infant Formula Milk). Sources of infection are factory, hospital and domestic environments. Strategies for controlling the risk of infection are based on the application of HACCP method (Hazard Analysis and Critical Control Points) all along the production process and even during hospital administering of IFM. In domestic environment the control of the risk is more diffi cult to realize.
Key words: Enterobacter sakazakii, powdered milk, IFM, neonates, meningitis, NEC, risk control.

230
Ann. Fac. Medic. Vet. di Parma (Vol. XXV, 2005) - pag. 219 - pag. 230
231
Ann. Fac. Medic. Vet. di Parma (Vol. XXV, 2005) - pag. 231 - pag. 246
1 Lo studio è frutto del lavoro comune dei due autori. Tuttavia, in sede di stesura del testo Giuseppe Bonazzi ha redatto i paragrafi 1, 2, 4 ed Elisa Manghi ha redatto il paragrafo 3. 2 Sezione Risorse del Territorio, Dipartimento di Salute Animale, Facoltà di Medicina Veterinaria, Università degli Studi di Parma.
IL FORMAGGIO PARMIGIANO-REGGIANOED IL CONTROLLO DELLA DENOMINAZIONE
DI ORIGINE PROTETTA1
Bonazzi G., Manghi E.2
1. Premessa
In Italia sono riconosciuti 31 formaggi a Denominazione di Origine Protetta, DOP, sulla base del Reg. CEE 2081/92, la produzione nellʼanno 2004 è stata di 451.556 ton, il Parmigiano-Reggiano è il secondo formaggio DOP per quantità prodotta (116.856 ton, preceduto dal Grana Padano con 149.153 ton).
Tabella n 1Produzione dei principali formaggi italiani DOP (anno 2004)
Denominazione Produzione (ton) % Grana Padano 149.153 33,03Parmigiano-Reggiano 116.856 25,88Gorgonzola 47.623 10,55Pecorino Romano 38.184 8,46Mozzarella di Bufala Campana 27.632 6,12Asiago 22.851 5,06Provolone Valpadana 13.468 2,98Taleggio 9.547 2,11Montasio 7.821 1,73Fontina 4.499 1,00Altri 13.922 3,08Totale 451.556 100,00
Fonte: Assolatte
La produzione di formaggio Parmigiano-Reggiano caratterizza il settore primario delle province di Parma, Reggio Emilia, Modena, Bologna alla sinistra del fi ume Reno e Mantova alla destra del fi ume Po.
Il formaggio Parmigiano-Reggiano è un prodotto a Denominazione di Origine Protetta (DOP), che il Reg. CEE 2081/92 designa come prodotti collegati in modo molto stretto alla regione di cui portano il nome e sottolinea il legame fra

232
Ann. Fac. Medic. Vet. di Parma (Vol. XXV, 2005) - pag. 231 - pag. 246
qualità del prodotto e origine geografi ca. Il Parmigiano-Reggiano è un formaggio semigrasso, a pasta dura, che si
ottiene impiegando latte vaccino della mungitura serale, scremato per affi oramento, e miscelato con quello intero della mungitura del mattino successivo. Il latte semigrasso è coagulato con caglio di vitello e siero innesto del giorno precedente, segue la rottura della cagliata, lo spurgo e la cottura, la salatura avviene in soluzione salina satura di cloruro di sodio per circa venti giorni, la stagionatura dura almeno 12 mesi. Il Parmigiano-Reggiano presenta forma cilindrica a scalzo leggermente convesso o quasi diritto, con facce piane leggermente orlate, le dimensioni della forma sono, per quanto riguarda il diametro delle facce piane da 35 a 45 cm, mentre lʼaltezza dello scalzo varia da 20 a 26 cm, il peso minimo della forma è di 30 Kg, con spessore della crosta di circa 6 mm.
Grafi co n 1Produzione di formaggio Parmigiano-Reggiano dal 1985 al 2004 (ton)
0
20.000
40.000
60.000
80.000
100.000
120.000
140.000
1985 1986 1987 1988 1989 1990 1991 1992 1993 1994 1995 1996 1997 1998 1999 2000 2001 2002 2003 2004
Fonte: Ns. elaborazione su dati del Consorzio del Formaggio Parmigiano-Reggiano
La produzione di formaggio Parmigiano-Reggiano è stata nel 2004 di 3.080.502 forme, pari a 116.856 ton, prodotte da 512 caseifi ci localizzati nelle cinque province del comprensorio, in tale area è stato prodotto il latte da 5.085 allevamenti. Negli anni recenti a fronte di un aumento della produzione si è riscontrato una riduzione del numero dei caseifi ci e degli allevamenti.

233
Ann. Fac. Medic. Vet. di Parma (Vol. XXV, 2005) - pag. 231 - pag. 246
Grafi co n 2Caseifi ci di produzione del formaggio Parmigiano-Reggiano dal 1985 al 2004 (n)
0
200
400
600
800
1000
1200
1985 1986 1987 1988 1989 1990 1991 1992 1993 1994 1995 1996 1997 1998 1999 2000 2001 2002 2003 2004
Fonte: Ns. elaborazione su dati del Consorzio del Formaggio Parmigiano-Reggiano
I caseifi ci sono prevalentemente società cooperative, 73,3% del totale, quelli aziendali sono il 13,9%, mentre i caseifi ci artigianali e industriali sono il 12,8%.
La percentuale di quantità esportata di formaggio Parmigiano-Reggiano sul totale delle vendite nel 2004 è stata del 16,7% pari a 16.030 ton. Il principale mercato di esportazione è la Francia cui è destinato il 21,7% dellʼexport, seguono la Germania con il 17,0% e il Regno Unito con il 15,8%, tra i paesi extraeuropei si posizionano nei primi posti gli Stati Uniti con lʼ8,2%, il Giappone 6,2% e il Canada 4,4%.
2. Il Dipartimento Controllo Qualità P.R.
Il Reg. CEE 2081/92 allʼart. 10 prescrive lʼistituzione a livello nazionale di “strutture di controllo aventi il compito di garantire che i prodotti agricoli e alimentari recanti una Denominazione Protetta rispondano ai requisiti del Disciplinare” a tal fi ne con la Legge n. 128/98 art. 53, modifi cata con la Legge n. 526/99, il Ministero delle Politiche Agricole e Forestali (MIPAF) diviene lʼautorità nazionale preposta al coordinamento dellʼattività di controllo e responsabile della vigilanza, lʼattività di controllo può essere svolta sia da organismi privati che pubblici secondo le condizioni stabilite nella norma EN 45011. E così costituita una Unità Centrale presso il MIPAF e sono costituite delle Unità Territoriali di Vigilanza a livello regionale come previsto dal Decreto 27.8.2005.
Con la creazione degli Organismi di Controllo e la loro autorizzazione si vengono a differenziare le attività svolte tra Consorzio di Tutela e Organismo di Controllo.

234
Ann. Fac. Medic. Vet. di Parma (Vol. XXV, 2005) - pag. 231 - pag. 246
In Italia per i 31 formaggi DOP operano 10 diversi Organismi di Controllo, alcuni agiscono esclusivamente su un solo tipo di formaggio (CertiAsiago, Dipartimento Controllo Qualità P.R.), altri operano su più formaggi (CSQA, INOQ); la maggioranza degli organismi è privata, ma sono presenti anche tre enti pubblici (Consorzio di ricerca per la fi liera lattiero casearia di Ragusa, Agenzia per la Garanzia della Qualità in Agricoltura (AQA) di Trento e lʼAgenzia Servizi Settore Agroalimentare (ASSAM) dellʼAssessorato Agricoltura della Regione Marche).
Tabella n 2Formaggi DOP italiani e relativi Organismi di Controllo (anno 2004)
Formaggi DOP Organismi di ControlloAsiago CSQA – Thiene (VI)Bitto CSQA – Thiene (VI)Bra INOQ – Moretta (CN)Caciocavallo Silano IS.ME.CERT. – NapoliCanestrato Pugliese Bioagricoop – Casalecchio di Reno
(BO)Casciotta dʼUrbino ASSAM – AnconaCastelmagno INOQ – Moretta (CN)Fiore Sardo OCPA – Olmeto (SS)Fontina CSQA – Thiene (VI)Formai de Mut dellʼAlta Valle Brembana CERTIPRODOP – Crema (CR)Gorgonzola CSQA – Thiene (VI)Grana Padano CSQA – Thiene (VI)Montasio CSQA – Thiene (VI)Monte Veronese CSQA – Thiene (VI)Mozzarella di Bufala Campana CSQA – Thiene (VI)Murazzano INOQ – Moretta (CN)Parmigiano-Reggiano DCQ P.R. – Reggio EmiliaPecorino Romano OCPA – Olmeto (SS)Pecorino Sardo OCPA – Olmeto (SS)Pecorino Siciliano Consorzio di ricerca per la fi liera
lattiero casearia – RagusaPecorino Toscano CERTIPRODOP – Crema (CR)Provolone Valpadana CSQA – Thiene (VI)Quartirolo Lombardo CERTIPRODOP – Crema (CR)Ragusano Consorzio di ricerca per la fi liera
lattiero casearia – RagusaMaschera INOQ – Moretta (CN)Robiola di Roccaverano INOQ – Moretta (CN)Spressa delle Giudicarie AQA – S.Michele allʼAdige (TN)Taleggio CERTIPRODOP – Crema (CR)Toma Piemontese INOQ – Moretta (CN)Valle dʼAosta Fromadzo CSQA – Thiene (VI)Valtellina Casera CSQA – Thiene (VI)
Fonte: DCQ P.R.

235
Ann. Fac. Medic. Vet. di Parma (Vol. XXV, 2005) - pag. 231 - pag. 246
Il Dipartimento Controllo Qualità P.R. (DCQ PR), società cooperativa a r.l., costituito il 24 aprile 1998, è lʼorganismo di controllo per la certifi cazione di conformità della DOP Parmigiano-Reggiano autorizzato dal MIPAF con decreto 13.10.1998, il Dipartimento è iscritto allʼAlbo degli Organismi di Controllo esistente presso il Ministero. Opera in qualità di incaricato di pubblico servizio secondo i principi di indipendenza e terzietà, in conformità alla norma europea EN 45011 con il coordinamento e la vigilanza del Ministero, lʼincarico ha la durata di tre anni rinnovabili.
Attività del Dipartimento è il controllo della Conformità al Disciplinare di produzione, allʼinterno della zona di origine, in ogni fase di produzione, trasformazione e stagionatura del prodotto, compresa la produzione di Parmigiano-Reggiano grattugiato e lʼemissione del Certifi cato di Conformità per caseifi ci e laboratori di grattugia.
L operatività del DCQ P.R. è regolata da una documentazione di riferimento costituita essenzialmente da: Norma UNI CEI EN 45011 inerente i requisiti generali relativi agli organismi che gestiscono sistemi di certifi cazione di prodotti; Decreto Ministeriale 29.5.1998 che individua le procedure concernenti le autorizzazioni degli Organismi di Controllo in materia di Indicazioni Geografi che Protette e di Denominazioni di Origine Protette; Disciplinare della DOP Parmigiano-Reggiano; Istruzioni per la redazione del Piano dei controlli dei formaggi DOP del Ministero delle Politiche Agricole e Forestali.
I requisiti generali che vengono richiesti allʼorganismo sono lʼimparzialità ed autonomia decisionale economica, la competenza tecnica, un sistema qualità in accordo alla norma ed alla attività svolta, una struttura organizzativa che documenti i ruoli e le responsabilità, un consiglio direttivo che rispetti la partecipazione di tutte le parti professionali della fi liera produttiva, uno specifi co sistema di certifi cazione, un sistema di raccolta dei dati dei produttori e della produzione, garanzie che nel caso di subappalto vengano rispettate le prescrizioni della norma EN 45011, presenza di un organismo per la gestione dei ricorsi e la presenza di un comitato di certifi cazione in cui tra i membri non predominino singoli interessi.
Per quel che riguarda il Disciplinare della DOP Parmigiano-Reggiano è costituito dal documento Standard di produzione, dal Regolamento per lʼalimentazione delle bovine e dal Regolamento di marchiatura.
Il Piano controlli del MIPAF, con schema controllo formaggi, evidenzia: soggetto di fi liera (allevamenti, caseifi ci, magazzini di stagionatura, laboratori di grattugia); procedura o fase di processo; requisito; autocontrollo; attività di controllo; tipo di controllo; entità del controllo per anno (in %); elemento controllato; documentazione comunicata al MIPAF; non conformità; gravità della non conformità; trattamento della non conformità; azione correttiva.
Il DCQ P.R. ha creato un piano di controlli e uno schema per il formaggio Parmigiano-Reggiano che è stato approvato dal Gruppo Tecnico del MIPAF ed è applicato dal 2002.
Le fasi necessarie per poter accedere alla certifi cazione del Parmigiano-Reggiano DOP sono Accesso al sistema, Attività di controllo, Apposizione del Marchio identifi cativo della DOP, Emissione del Certifi cato di Conformità.

236
Ann. Fac. Medic. Vet. di Parma (Vol. XXV, 2005) - pag. 231 - pag. 246
Accesso al sistema: i soggetti interessati (allevamenti, caseifi ci, magazzini di stagionatura, laboratori di grattugia) richiedono al DCQ P.R. lʼaccesso al sistema di certifi cazione DOP e dichiarano di accettare il Piano di controllo relativo al Disciplinare che viene fornito assieme alla domanda di accesso. Tutti i soggetti vengono iscritti in appositi elenchi di soggetti autorizzati dai quali possono essere sospesi in caso di non conformità.
Attività di controllo: si basa essenzialmente sul riconoscimento con verifi ca ispettiva iniziale del soggetto, sullʼidentifi cazione/rintracciabilità in entrata per materia prima o per semilavorato, sulla Conformità Disciplinare per processo e sulla Conformità Disciplinare per prodotto. Ogni anno vengono controllati, una volta, almeno il 35% degli allevamenti, caseifi ci, partite di prodotto e magazzini di stagionatura, per i grattugiatori si prevedono invece tre controlli allʼanno. Per le prove analitiche sono previste analisi grasso formaggio 30 analisi anno; analisi origine del caglio (di vitello) 20 analisi anno; analisi sensoriale del formaggio 50 analisi anno; analisi antifermentativi 200 allʼanno (minimo).
Apposizione del Marchio identifi cativo della DOP: una volta che il DCQ P.R. ha terminato lʼattività di controllo ed ha constatato lʼidoneità del prodotto a fregiarsi della DOP trasmette lʼautorizzazione al Consorzio il quale è detentore dei marchi e provvede ad apporre sulle forme il bollo ovale a fuoco che costituisce il marchio identifi cativo della DOP Parmigiano-Reggiano.
Emissione del Certifi cato di Conformità: il Comitato di Certifi cazione una volta verifi cata la conformità emette il Certifi cato di Conformità, in cui si attesta che il prodotto Parmigiano-Reggiano e lʼintero processo di produzione sono conformi al Disciplinare di produzione secondo quanto previsto dal Reg. CEE 2081/92. Il soggetto certifi cato viene quindi iscritto nellʼapposito registro delle aziende certifi cate. Il certifi cato può essere sospeso o revocato in seguito a specifi che mancanze da parte dei soggetti certifi cati.
Nel comprensorio di produzione nel 2004 risultavano attivi 512 caseifi ci, 5.085 allevamenti, 79 magazzini di stagionatura e 19 laboratori di grattugia mentre nel 2001 erano attivi 563 caseifi ci, 5.876 allevamenti, 66 magazzini di stagionatura e 16 laboratori di grattugia. Relativamente alle visite ispettive negli allevamenti si rileva che nel 2004 rispetto al 2001 sono aumentate in numero (2.152 contro 1.744) e in percentuale degli allevamenti esistenti (42,6% contro il 29,7%); per i caseifi ci, le visite ispettive sono invece diminuite sia numericamente (nel 2001 erano 386 mentre nel 2004 erano 295) sia in percentuale dei caseifi ci esistenti (nel 2001 venivano effettuate nel 68,6% dei caseifi ci mentre nel 2004 nel 57,6%). Il DCQ P.R. nel 2001 ha riscontrato negli allevamenti 65 non conformità lievi e 9 non conformità gravi mentre nel 2004 le non conformità lievi sono state 1.746 e le non conformità gravi 22; nei caseifi ci nel 2001 non ci sono state non conformità lievi e ci sono state 9 non conformità gravi, nel 2004 le non conformità lievi sono state 399 e le non conformità gravi 20.
Per quanto riguarda le analisi degli antifermentativi, le analisi del grasso, le analisi del caglio e le analisi sensoriali sul formaggio in pezzi non si hanno osservazioni e non conformità in entrambi gli anni, vi è stata una diminuzione del numero di analisi antifermentativi che da 1.283 nel 2001 sono passate a 254 nel 2004.

237
Ann. Fac. Medic. Vet. di Parma (Vol. XXV, 2005) - pag. 231 - pag. 246
Le visite ispettive ai magazzini di stagionatura, ai laboratori di grattugia e lʼanalisi del grattugiato fi no al 2001 non sono state effettuate perché il Piano di controlli del Ministero, che le comprende, è stato varato solo nel 2002.
Tabella n 3Attività di controllo negli anni 2001 e 2004
Tipo attività n. controlli (2001)
n. controlli (2004)
Conformi (2001)
Conformi (2004)
Osservazioni* (2001)
Osservazioni* (2004)
Non conformi** (2001)
Non conformi** (2004)
Visite ispettive allevamenti
1744 2152 1670 1207 65 1746 (concentrate nel 43% degli allevamenti)
9 22
Visite ispettive caseifi ci
386 295 377 139 0 399 (concentrate nel 53% dei caseifi ci)
9 20
Visite ispettive ai magazzini di stagionatura
_ 88 _ 60 _ 28 _
Controllo espertizzazione (valutazione prodotto fi nito)
309 294 271 272 35 22 (concentrate nel 7% dei lotti di formaggio)
3 2
Analisi antifermentativi formaggio fresco
1283 254 1283 254 0 0 0 0
Analisi grasso formaggio in pezzi
30 30 30 30 0 0 0 0
Analisi caglio 20 20 20 20 0 0 0 0
Analisi sensoriale formaggio in pezzi
50 54 50 54 0 0 0 0
Visite ispettive Lab. grattugia
_ 66 _ 30 _ 72 (concentrate nel 55% dei lab. grattugia)
_ 6
Analisi grattugiato (n. 6 analisi per controllo)
_ 21 _ 18 _ 1 _ 2
* Equivale a non conformità lieve per il MIPAF**Equivale a non conformità grave per il MIPAF
Fonte:Ns. elaborazioni su dati DCQ P.R.

238
Ann. Fac. Medic. Vet. di Parma (Vol. XXV, 2005) - pag. 231 - pag. 246
In Figura n 1 sono evidenziate le attività svolte dal Dipartimento Controllo Qualità P.R. relative ai Piani di controllo e le attività svolte dal Consorzio di Tutela relative a espertizzazione e marchiatura a fuoco.
Figura n. 1Controlli C.F.P.R. / DCQ P.R.
Fonte: DCQ P.R.
3. I marchi del Parmigiano-Reggiano
Il Consorzio del Formaggio Parmigiano-Reggiano è nato nel 1934 e da allora svolge la propria attività per la tutela della Denominazione dʼOrigine e la promozione e la valorizzazione della produzione.
Oggi il Consorzio a seguito della separazione delle attività svolte dallʼOrganismo di Controllo ha assunto funzioni di “tutela, promozione, valorizzazione, informazione del consumatore e cura generale degli interessi relativi alle denominazioni”, i Consorzi possono avanzare “proposte di disciplina regolamentare” relative ai prodotti tutelati attraverso la defi nizione dei regolamenti di produzione e delle caratteristiche fi nali del prodotto DOP, così come defi nito dalla legge n. 526/99 art. 14. Il Decreto 12.10.2000 sottolinea inoltre che lʼattività di vigilanza a tutela e salvaguardia delle DOP dei Consorzi si deve svolgere “prevalentemente alla commercializzazione” in collaborazione con lʼIspettorato Centrale Repressione Frodi.
Anche le disposizioni sanzionatorie in applicazione del Reg. (CEE) 2081/92, decreto legislativo 19.11.2004 attribuiscono ai Consorzi lʼincarico allʼaccertamento delle violazioni relative sia allʼuso commerciale del prodotto sia alla designazione e presentazione del marchio DOP. Lo stesso decreto attribuisce agli Organismi di Controllo la verifi ca sulla produzione effettuata tramite un Piano dei controlli

239
Ann. Fac. Medic. Vet. di Parma (Vol. XXV, 2005) - pag. 231 - pag. 246
approvato dal MIPAF. Il Consorzio del Formaggio Parmigiano-Reggiano provvede alla apposizione
dei marchi e contrassegni, segni distintivi della conformità al Disciplinare di produzione.
I marchi si distinguono in marchi dʼorigine e marchi di selezione.I marchi dʼorigine sono posti dai singoli caseifi ci mediante la placca di caseina
applicata sulla superfi cie che riporta anno di produzione/CFPR/codice alfanumerico che identifi ca ogni singola forma e lʼimpiego di apposite matrici (fasce marchianti) imprimenti sulla superfi cie dello scalzo di ogni forma la dicitura a puntini Parmigiano-Reggiano, il numero di matricola del caseifi cio, il mese e lʼanno di produzione la scritta DOP e la scritta Consorzio Tutela.
La marchiatura di selezione è effettuata mediante lʼapposizione di marchi indelebili dopo una valutazione effettuata da personale del Consorzio (“espertizzazione”) che esamina tutte le forme prodotte al raggiungimento del periodo minimo di stagionatura (12 mesi) e dopo il successivo controllo del DCQ P.R.. L espertizzazione del formaggio avviene attraverso la valutazione dellʼaspetto esterno, della struttura e delle caratteristiche olfattive della pasta, avvalendosi dellʼesame con il martello e con lʼago, le commissioni devono procedere al taglio di almeno una forma per lotto e, comunque, non meno di una ogni mille o frazione di mille, per valutarne le caratteristiche strutturali ed organolettiche.
Con lʼespertizzazione si individuano sulla base del Regolamento di marchiatura le categorie: a) prima categoria costituita dalle forme classifi cate come formaggio Parmigiano-Reggiano “scelto sperlato”, “zero”, “uno”; b) seconda categoria costituita dalle forme classifi cate come formaggio Parmigiano-Reggiano “mezzano”; c) terza categoria costituita dalle forme classifi cate come formaggio “scarto” e “scartone”.
Sulle forme di prima e seconda categoria si appone il marchio ovale a fuoco con la dicitura “Parmigiano-Reggiano Consorzio Tutela”. Il formaggio Parmigiano-Reggiano di seconda categoria, formaggio che presenta difetti di lieve e media entità nella struttura della pasta o della crosta, è sottoposto alla identifi cazione mediante un contrassegno indelebile sullo scalzo della forma, dei solchi paralleli, al fi ne di poter riconoscere questa categoria nelle successive fasi di commercializzazione.
Per le forme di terza categoria, unitamente a quelle con gravi difetti che non hanno consentito la stagionatura, forme che non raggiungono la soglia minima di qualità prevista dal Disciplinare, sono asportati i marchi dʼorigine della DOP con una operazione di raschiatura della crosta (annullamento dei contrassegni o sbiancatura).
Il Consorzio è il detentore dei marchi della DOP Parmigiano-Reggiano ed è incaricato di svolgere anche attività di vigilanza sul corretto uso dei marchi. Per questo il Consorzio ha individuato e registrato il marchio “forma e punta con scritta Parmigiano-Reggiano su fondo blu” come riferimento visivo di identifi cazione e di riconoscimento del Parmigiano-Reggiano in parti di forma.
Le porzioni di forme intere di Parmigiano-Reggiano preconfezionate di prima categoria si riconoscono quindi dai puntini sulla crosta e lʼetichetta riporta il marchio forma e punta con scritta Parmigiano-Reggiano su fondo blu.
Con la dizione Parmigiano-Reggiano Prima stagionatura si identifi ca il formaggio Parmigiano-Reggiano di seconda categoria. Le porzioni di forme intere di

240
Ann. Fac. Medic. Vet. di Parma (Vol. XXV, 2005) - pag. 231 - pag. 246
Parmigiano-Reggiano Prima stagionatura preconfezionate si riconoscono dai puntini sulla crosta e dalla rigatura e lʼetichetta riporta il marchio con la scritta Parmigiano-Reggiano su banda di colore verde.
La designazione Parmigiano-Reggiano può essere utilizzata anche per il prodotto grattugiato, ottenuto da forme intere in possesso dei requisiti defi niti dal Disciplinare. Tale prodotto è sottoposto a controlli e a specifi ca convenzione che prevede lʼutilizzo del marchio sulle confezioni, analogamente a quanto avviene per il confezionamento di Parmigiano-Reggiano porzionato in piccole pezzature tale da non evidenziare alcun elemento di riconoscibilità, anche in questo caso il prodotto è sottoposto a controlli e a specifi ca convenzione per lʼutilizzo del marchio.
E presente inoltre la possibilità di eseguire sulle forme già marchiate con almeno 18 mesi di stagionatura, una ulteriore selezione qualitativa al fi ne di qualifi care “Parmigiano-Reggiano Extra” o “Parmigiano-Reggiano Export” per il formaggio con caratteristiche merceologiche previste per il formaggio Parmigiano-Reggiano “scelto sperlato”. Le porzioni di forme intere di Parmigiano-Reggiano Extra e Parmigiano-Reggiano Export preconfezionate si riconoscono dalle etichette che riportano tali marchi.
I marchi descritti, di proprietà del Consorzio del Formaggio Parmigiano-Reggiano, sono concessi attraverso apposita convenzione con lʼimpresa commerciale richiedente. Il marchio permette di trasferire i contrassegni dʼorigine e di selezione presenti sulle forme intere alle porzioni preconfezionate a garanzia dellʼorigine e delle categorie merceologiche identifi cate in seguito allʼesame di selezione.
Figura n 2I marchi del Parmigiano-Reggiano
Marchi di Origine
Dicitura a puntini Parmigiano-Reggiano Placca di caseina

241
Ann. Fac. Medic. Vet. di Parma (Vol. XXV, 2005) - pag. 231 - pag. 246
Marchi di Selezione
Parmigiano-Reggiano
Parmigiano-Reggiano Prima stagionatura
Parmigiano-Reggiano Extra
Parmigiano-Reggiano Export

242
Ann. Fac. Medic. Vet. di Parma (Vol. XXV, 2005) - pag. 231 - pag. 246
4. Conclusioni
Il formaggio Parmigiano-Reggiano è un prodotto a Denominazione di Origine Protetta (DOP) sulla base del Reg. CEE 2081/92 che allʼart. 10 prescrive lʼistituzione a livello nazionale di “strutture di controllo aventi il compito di garantire che i prodotti agricoli e alimentari recanti una Denominazione Protetta rispondano ai requisiti del Disciplinare”. Con la Legge n. 128/98 art. 53, modifi cata con la Legge n. 526/99, il Ministero delle Politiche Agricole e Forestali (MIPAF) diviene lʼautorità nazionale preposta al coordinamento dellʼattività di controllo e responsabile della vigilanza, lʼattività di controllo può essere svolta sia da organismi privati che pubblici secondo le condizioni stabilite nella norma EN 45011.
Con la creazione degli Organismi di Controllo e la loro autorizzazione si vengono a differenziare le attività svolte tra Consorzi di Tutela e Organismi di Controllo.
Per il formaggio Parmigiano-Reggiano vengono così ad operare Consorzio del Formaggio Parmigiano-Reggiano e Dipartimento Controllo Qualità P.R..
Il Dipartimento Controllo Qualità P.R. opera in qualità di incaricato di pubblico servizio secondo i principi di indipendenza e terzietà, in conformità alla norma europea EN 45011 con il coordinamento e la vigilanza del MIPAF.
Attività del Dipartimento è il controllo della Conformità al Disciplinare di produzione, allʼinterno della zona di origine, in ogni fase di produzione, trasformazione e stagionatura del prodotto, compresa la produzione di Parmigiano-Reggiano grattugiato e lʼemissione del Certifi cato di Conformità per caseifi ci e laboratori di grattugia.
L operatività del DCQ P.R. è regolata da una documentazione di riferimento costituita essenzialmente da: Norma UNI CEI EN 45011; Decreto Ministeriale 29.5.1998; Disciplinare della DOP Parmigiano-Reggiano; Piano dei controlli dei formaggi DOP del Ministero delle Politiche Agricole e Forestali.
Le fasi necessarie per poter accedere alla certifi cazione del Parmigiano-Reggiano DOP sono Accesso al sistema, Attività di controllo, Apposizione del Marchio identifi cativo della DOP, Emissione del Certifi cato di Conformità.
Il Consorzio del Formaggio Parmigiano-Reggiano svolge funzioni di tutela, promozione, valorizzazione, informazione del consumatore e cura generale degli interessi relativi alle denominazioni, propone i regolamenti di produzione. Il Consorzio del Formaggio Parmigiano-Reggiano è il detentore dei marchi della DOP Parmigiano-Reggiano e provvede alla apposizione dei marchi e contrassegni, segni distintivi della conformità al Disciplinare di produzione, i marchi si distinguono in marchi dʼorigine e marchi di selezione.
Come emerge dallo schema riportato Consorzio del Formaggio Parmigiano-Reggiano e Dipartimento Controllo Qualità P.R. agiscono in rapporto agli stessi soggetti: allevamento, caseifi cio, prodotto; il primo attraverso la defi nizione del Disciplinare di Produzione e il secondo attraverso il Controllo di Conformità al Disciplinare di produzione. L espertizzazione del formaggio e la marchiatura sono fatte dal Consorzio del Formaggio Parmigiano-Reggiano previa validazione dellʼespertizzazione da parte del Dipartimento Controllo Qualità P.R. (DCQ P.R.).

243
Ann. Fac. Medic. Vet. di Parma (Vol. XXV, 2005) - pag. 231 - pag. 246
Le azioni di controllo svolte garantiscono lʼapplicazione e il rispetto del Disciplinare di produzione e rendono possibile la gestione della rintracciabilità nella fi liera.
Il rispetto del Disciplinare di produzione permette di ottenere un prodotto che trova nel legame con il territorio la propria differenziazione e lʼorigine del vantaggio competitivo. I marchi descritti sono lo strumento per certifi care e comunicare al consumatore le caratteristiche del prodotto. Occorre pertanto che tali marchi garantiscano lʼeffettiva differenziazione e siano conosciuti e percepiti dal consumatore. Pertanto grazie alla realizzazione di un controllo effi cace del rispetto del Disciplinare di produzione si viene a dare garanzia al produttore leale e al consumatore.
Figura n. 3Relazioni tra C.F.P.R. / DCQ P.R.
CASEIFICIO
ALLEVAMENTO
FORMAGGIO
De
fin
izio
ne
de
l D
ISC
IPL
INA
RE
d
i P
RO
DU
ZIO
NE
Co
ntr
oll
o d
i C
on
form
ità
al
DIS
CIP
LIN
AR
E
di
PR
OD
UZ
ION
E
CFPR DCQ P.R.
Marchio a fuoco
Parmigiano Reggiano DOP
ANNULLAMENTO MARCHI DI ORIGINE
FORMAGGIO NON DOP
ESPERTIZZAZIONE
FORMAGGIO
VALIDAZIONE
ESPERTIZZAZIONE
CASEIFICIOCASEIFICIO
ALLEVAMENTOALLEVAMENTO
FORMAGGIO
De
fin
izio
ne
de
l D
ISC
IPL
INA
RE
d
i P
RO
DU
ZIO
NE
Co
ntr
oll
o d
i C
on
form
ità
al
DIS
CIP
LIN
AR
E
di
PR
OD
UZ
ION
E
CFPR DCQ P.R.
Marchio a fuoco
Parmigiano Reggiano DOP
Marchio a fuoco
Parmigiano Reggiano DOP
ANNULLAMENTO MARCHI DI ORIGINE
FORMAGGIO NON DOP
ESPERTIZZAZIONE
FORMAGGIO
VALIDAZIONE
ESPERTIZZAZIONE
Fonte: DCQ P.R.

244
Ann. Fac. Medic. Vet. di Parma (Vol. XXV, 2005) - pag. 231 - pag. 246
Bibliografi a
Assolate (2005) “Industria lattiero-casearia italiana Rapporto 2004” Suppl. Il Mondo del latte n. 7.
Bonazzi G. (2004) “Il formaggio Parmigiano-Reggiano nel sistema agroalimentare europeo”, in Atti della Società Italiana di Buiatria, Volume XXXVI, Editografi ca, Bologna.
Consorzio del Formaggio Parmigiano-Reggiano (2005) “Relazione sullʼattività dei servizi Anno 2004”.
Mariani A., Vigano E. (2002) “Il sistema agroalimentare dellʼUnione Europea, economie e politiche”, Carocci Editore. Roma.
Zannoni M. (2005) “Control y certifi caciòn en las Denominaciones de Origen de Queso” Ordizia.
Sommario
Il formaggio Parmigiano-Reggiano ed il controllo della Denominazione di Origine Protetta
Il formaggio Parmigiano-Reggiano è un prodotto a Denominazione dʼOrigine Protetta (DOP), prodotto sulla base della normativa europea del Reg. CEE 2081/92 che designa prodotti collegati in modo molto stretto alla regione di cui portano il nome, sottolineando il legame fra qualità del prodotto e sua origine geografi ca.
Il Parmigiano-Reggiano è il secondo formaggio DOP per quantità prodotta in Italia.
Il Reg. CEE 2081/92 art. 10 prevede un sistema di controllo per garantire che i prodotti agricoli e alimentari recanti una denominazione protetta rispondano ai requisiti del Disciplinare di produzione.
Per il principio della terzietà ed indipendenza i Consorzi di tutela non possono svolgere attività di controllo sulle DOP, tale compito è affi dato dal MIPAF nel caso del Parmigiano-Reggiano al Dipartimento Controllo Qualità P.R. (DCQ P.R.) che effettua i controlli sulla DOP Parmigiano Reggiano.
La realizzazione di un controllo effi cace del rispetto del Disciplinare di produzione diviene garanzia per il produttore leale e per il consumatore.
Parole Chiave
Formaggio Parmigiano-ReggianoControllo DOPQualità e sicurezza alimentare

245
Ann. Fac. Medic. Vet. di Parma (Vol. XXV, 2005) - pag. 231 - pag. 246
Abstract
Parmigiano-Reggiano cheese and the control of the Protected Denomination of Origin
Parmigiano-Reggiano cheese is a “DOP” product (PDO - Protected Denomination of Origin) manufactured in accordance with European Regulation EEC 2081/92, which designates products that are strictly linked to the region whose name they bear, emphasising the links between the quality of a product and its geographical origin.
In quantity terms, Parmigiano-Reggiano is the second most important Italian DOP cheese.
Article 10 of the EEC Reg. 2081/92 provides for a control system to guarantee that agricultural and food products bearing the protected denomination respond to the requirements of the production specifi cation.
In line with the principles of impartiality and independence, the protection consortia cannot carry out control activities on their own DOP products, and therefore, in the case of Parmigiano-Reggiano, the Italian Ministry of Agriculture and Food has appointed the P.R. Quality Control Department (“DCQ PR”), to carry out the required controls on DOP Parmigiano-Reggiano.
The implementation of effi cacious controls in respect of the production specifi cation provides a guarantee for both diligent producers and the consumer.
Key words
Parmigiano-Reggiano cheesePDO controlFood quality and safety

246
Ann. Fac. Medic. Vet. di Parma (Vol. XXV, 2005) - pag. 231 - pag. 246

247
Ann. Fac. Medic. Vet. di Parma (Vol. XXV, 2005) - pag. 247 - pag. 268
1 Lavoro eseguito con fi nanziamento FIL (ex quota 60%). Lo studio è frutto di un lavoro comune dei due autori. Tuttavia in sede di stesura del testo Andrea Salghetti ha redatto i paragrafi 1, 5, 6, 8, 9, mentre Giovanni Ferri ha redatto i paragrafi 2, 3, 4, 7.2 Sezione di Risorse del Territorio, Dipartimento di Salute Animale, Facoltà di Medicina Veterinaria, Università degli Studi di Parma.
METODOLOGIA DI CALCOLO DEL COSTO DI PRODUZIONE DEL LATTE E ANALISI APPLICATIVA SU
ALLEVAMENTI CONVENZIONALI E BIOLOGICI1
Salghetti A., Ferri G.2
1. Introduzione
L analisi di effi cienza dellʼattività agricola viene determinata in prima istanza dai risultati economici di bilancio, che si concretizzano nel calcolo del valore del reddito netto. Si tratta di un risultato complessivo che attiene a tutti i processi produttivi svolti in azienda, quale compenso ai fattori conferiti dallʼimprenditore e dalla sua famiglia (1).
In presenza di un unico processo produttivo il risultato complessivo coincide con quello della produzione ottenuta. Nel settore agricolo i processi produttivi attuati sono generalmente più di uno e strettamente connessi tra di loro. Questo comporta delle diffi coltà nel differenziare i risultati economici delle singole produzioni (6).
Ciò nonostante è indispensabile per lʼimprenditore avere conoscenza delle produzioni più redditizie allo scopo di orientare le proprie scelte nelle successive annate agrarie. L analisi del costo di produzione ci consente di raggiungere questo scopo, nonostante le diffi coltà che si debbono affrontare per la sua determinazione.
Lo studio si prefi gge lo scopo di analizzare nella prima parte la metodologia di calcolo del costo di produzione, per approfondire poi lʼanalisi specifi ca del costo di produzione del latte. Successivamente verrà applicata la metodologia prescelta per il calcolo del costo di produzione del latte destinato alla trasformazione in formaggio Parmigiano-Reggiano in allevamenti convenzionali e biologici.
Gli strumenti da cui partire possono essere diversi. Si può partire dalle forme più semplici come lʼuso di questionari tramite intervista, ciò consente di ricostruire le operazioni amministrative funzionali al calcolo del costo di produzione. E un percorso veloce di acquisizione dei dati ed è quello meno oneroso, per contro ci fornisce dei dati molto approssimati, perché legati alle capacità mnemoniche degli imprenditori intervistati. Quindi di scarsa signifi catività ed attendibilità.
Vi sono poi le rilevazioni contabili di tipo sintetico che portano ad accrescere lʼattendibilità dei dati forniti in forma aggregata, lasciando dei vuoti nella fase di ripartizione dei costi per singoli processi produttivi.
Il metodo più completo e preciso rimane sempre quello che si avvale della contabilità di tipo analitico, in grado di differenziare la maggior parte dei costi specifi ci per ogni singolo processo produttivo e di acquisire i parametri oggettivi necessari alla ripartizione dei costi comuni.

248
Ann. Fac. Medic. Vet. di Parma (Vol. XXV, 2005) - pag. 247 - pag. 268
La composizione del costo di produzione è rappresentata da una componente oggettiva (costi specifi ci) e da una componente soggettiva (costi comuni, costi congiunti ecc.). Il signifi cato e la validità del calcolo del costo di produzione sarà tanto maggiore quanto più oggettive saranno le componenti raccolte.
Dunque il costo di produzione della singola attività si trova allʼinterno del costo di produzione totale dellʼazienda. Solo nel caso di aziende che svolgano una sola attività, si ripete, il costo totale ed il costo della singola attività coincidono. E il caso per esempio delle aziende monocolturali, che ottengono una sola produzione, come ad esempio le aziende maidicole di certe zone della bassa pianura lombarda. Più diffi cile è trovare aziende zootecniche da poter ricondurre a questa situazione. Infatti se si pensa ad un allevamento bovino che sia specializzato nella produzione di latte, è da subito evidente che questa non può essere la sola produzione ottenuta in quanto esiste anche la produzione, pur secondaria, di carne. Inoltre anche a livello di colture erbacee diffi cilmente queste aziende producono solo ed esclusivamente foraggi per gli animali, ma accanto a questi, allo scopo di realizzare una corretta pratica agricola, vengono alternate in rotazione altre colture quali cereali, colture da rinnovo ecc.
2. Classifi cazione e confi gurazione dei costi
I costi possono essere di diversa natura e si possono classifi care in vari modi, ma sinteticamente comprendono:
- specifi ci e comuni: i costi specifi ci sono attribuibili oggettivamente ad ogni singola produzione, mentre sono comuni i costi non direttamente imputabili ad un determinato prodotto e la cui suddivisione può avvenire solo attraverso operazioni di stima;
- diretti e indiretti: i costi diretti sono attribuiti al prodotto sulla base della quantità dʼimpiego, mentre quelli indiretti sono costi complessivi il cui consumo non è misurabile in riferimento al prodotto ottenuto;
- variabili e fi ssi: i primi variano in funzione del livello produttivo, mentre i secondi sono indipendenti dal volume di produzione, ma dipendono dalla struttura aziendale;
- storici (a consuntivo) e standard (preventivi): i primi sono quelli rilevati dalla contabilità aziendale a ciclo produttivo già avvenuto, mentre i secondi sono ipotetici e ottenuti sulla base di stime future;
- effettivi e medi o medi-normali: i primi corrispondono esattamente ai valori reali di spesa, mentre i secondi mirano ad adottare dei valori medi che annullino eventuali oscillazioni di congiuntura.Dovendo analizzare il costo di produzione di un prodotto, è necessario
defi nire la confi gurazione di costo da adottare, ovvero stabilire quali costi debbano essere compresi nel calcolo. Principalmente si possono avere confi gurazioni complete, che comprendono tutte le categorie di costo, e parziali che considerano solo alcune tipologie di costi.

249
Ann. Fac. Medic. Vet. di Parma (Vol. XXV, 2005) - pag. 247 - pag. 268
Tra le diverse confi gurazioni ci sono quelle indicate da Ghelfi (5):- costo primo: quando si considerano solo i costi diretti, quelli specifi ci; - costo pieno: nel caso in cui vengono imputati anche i costi indiretti, quelli
comuni;- direct cost: quando si considerano i soli costi variabili;- full cost: nel caso in cui si considerano anche i costi fi ssi.
Per fi nire si può aggiungere anche la confi gurazione a costo tecnico-economico, nella quale si considerano oltre ai costi reali anche i costi fi gurativi, corrispondenti al consumo dei fattori produttivi immessi nel ciclo produttivo dallʼimprenditore (terra, capitali e lavoro dellʼimprenditore e della sua famiglia).
Unʼaltra serie di confi gurazioni è proposta da Torquati (11) che partendo dalla classifi cazione dei costi di produzione agricoli, come nel piano dei conti della contabilità analitica, defi nisce:
- costo primo variabile: quello che include sostanzialmente tutti i costi variabili reali;
- costo pieno agricolo: che comprende i costi reali dei fattori di produzione diretti;
- costo pieno: che si ottiene aggiungendo al costo pieno agricolo la quota spesa per fattori funzionali generali relativi al prodotto in oggetto;
- costo complessivo: quello che comprende il costo di tutti fattori produttivi sia diretti che indiretti, e si ottiene sommando al costo pieno gli interessi e le imposte;
- costo economico/tecnico: comprende il costo di tutti i fattori, anche quelli cosiddetti fi gurativi che si riferiscono a spese non realmente sostenute, perché riguardanti fattori messi nel ciclo di produzione dallʼimprenditore o dalla sua famiglia (lavoro familiare, interessi sui capitali propri, ecc).La scelta del tipo di confi gurazione da adottare dipende dagli obiettivi che
si vogliono perseguire, anche se possiamo rilevare che quelle complete, rifacendosi anche a stime e valutazioni per la suddivisione dei costi non diretti, espongono il fi anco a possibili errori di valutazione, mentre quelle parziali, tralasciando i costi di alcuni fattori, fi niscono per essere poco precise.
A seconda poi che nel calcolo dei costi ci si riferisca rispettivamente a quelli consuntivi o storici, a quelli correnti, o a quelli preventivi si ottengono obiettivi differenti. Nel caso si utilizzino costi storici si persegue la fi nalità conoscitiva dei processi produttivi e la conseguente determinazione quantitativa dei risultati economici ottenuti. Si parla allora di controllo economico della gestione (11) che dà indicazioni sulla convenienza economica delle scelte effettuate. Se invece vengono utilizzati i costi correnti lo scopo è quello di svolgere il controllo esecutivo di gestione, ovvero il confronto continuo tra costi standard, che consentirebbero la realizzazione degli obiettivi aziendali prescelti e quelli effettivi. Infi ne la scelta di utilizzare i costi preventivi conduce a calcoli di convenienza economica che si traducono in decisioni aziendali di lungo o di breve periodo. Le prime comportano cambiamenti strutturali dellʼimpresa, le seconde riguardano solo alcune componenti del costo, con adattamenti parziali dellʼimpresa.

250
Ann. Fac. Medic. Vet. di Parma (Vol. XXV, 2005) - pag. 247 - pag. 268
3. I procedimenti in uso per la determinazione dei costi di prodotto
Dopo aver scelto la confi gurazione di costo cui fare riferimento occorre defi nire la metodologia di calcolo dei costi e quindi le regole per lʼattribuzione dei costi originari ai prodotti. Secondo Ghelfi (5) si possono avere due tipi di procedimenti in relazione anche alla tipologia produttiva dellʼazienda:
- diretti, o a uno stadio: applicabile nel caso di aziende agricole caratterizzate da monocolture o da monoallevamenti, in cui tutti i costi sono imputabili ad un solo prodotto;
- indiretti, o a due stadi: più frequentemente applicato nelle aziende agricole. I costi vengono suddivisi in entità di calcolo intermedie, chiamate “centri di costo”, per essere poi ripartiti sui prodotti. I centri di costo a loro volta si possono suddividere in:
- produttivi: relativi alle principali attività produttive;- ausiliari: ovvero di servizio ai centri produttivi che possono intervenire o
non intervenire nel ciclo di produzione; - funzionali o comuni: che svolgono attività sia nei confronti dei centri
produttivi che di quelli ausiliari.I costi generali devono essere suddivisi tra i vari processi produttivi sulla
base di criteri di proporzionalità. Le basi di imputazione sono i parametri utilizzati per trasferire i costi verso i centri di costo e partono dallʼesistenza di una relazione oggettiva di causa-effetto (per i costi diretti) o di uso-benefi cio (per i costi indiretti) tra il prodotto e il fattore produttivo. In questo caso si utilizza un criterio cosiddetto causale. Esiste un altro criterio defi nito commerciale che punta sullʼimportanza del prodotto sul volume complessivo della produzione, ritenendola il criterio migliore per la ripartizione dei costi indiretti. Si parla anche in questo caso di base dʼimputazione economica contrapposta a quelle tecniche (ore di lavoro macchina, ore manodopera). Comunque la diffi coltà connessa alla ripartizione dei costi indiretti ha portato negli anni ad un sempre maggiore utilizzo della tecnica del direct costing.
Il metodo proposto da De Roest et al. (4), del Centro Ricerche Produzioni Animali (CRPA) di Reggio Emilia, si basa sui dati della contabilità analitica e sui dati raccolti mediante una scheda di rilevazione aziendale realizzata conformemente a quella utilizzata dallʼEuropean Dairy Farmers, lʼAssociazione Europea dei Produttori di Latte. Attraverso questo strumento vengono rilevati i dati produttivi e riproduttivi, le spese reali relative agli acquisti degli alimenti, gli elementi necessari per la stima del capitale fondiario e agrario (che avviene partendo da un confronto col Prezziario Regionale per opere e interventi in agricoltura).
I costi sono suddivisi in specifi ci e generali; i primi riguardano esclusivamente le produzioni bovine, foraggi e mangimi acquistati, le spese per la produzione di foraggi aziendali e le spese veterinarie ecc, i secondi sono relativi a produzioni diverse, ad esempio spese relative a macchine che non vengano utilizzate esclusivamente per la foraggicoltura ecc.
I costi specifi ci e generali sono a loro volta suddivisi in espliciti e impliciti. I primi sono realmente sostenuti dallʼimprenditore (pagamenti di fatture o prestazioni), i

251
Ann. Fac. Medic. Vet. di Parma (Vol. XXV, 2005) - pag. 247 - pag. 268
secondi sono relativi a fattori di produzione messi nel ciclo produttivo dallʼimprenditore e devono essere a lui compensati (la terra di proprietà dellʼimprenditore, i capitali da lui investiti in azienda, il lavoro suo e della sua famiglia). Così il costo del lavoro familiare viene ottenuto sulla base delle tariffe dei salariati fi ssi a tempo indeterminato dellʼannata, e del tempo di lavoro svolto dallʼimprenditore e dalla sua famiglia. La tariffa oraria comprende anche le mensilità aggiuntive e gli oneri contributivi ricavati dalla contabilità analitica. Il calcolo degli interessi sui capitali fondiario e agrario avviene considerando un tasso medio di rendimento dei Bot a 12 mesi nellʼanno precedente la valutazione.
L originalità del metodo sta nella suddivisione dei costi generali, siano essi espliciti o impliciti, sulla base di due coeffi cienti, uno che tiene conto del riparto colturale aziendale ed in particolare del rapporto tra superfi cie a colture foraggere e superfi cie agricola utile totale, lʼaltro che considera lʼentità dei ricavi del latte e della carne in rapporto al ricavo aziendale totale.
Con tale determinazione è possibile ottenere il costo del latte suddividendo i costi comuni nel modo sopra detto, che appare abbastanza semplice ed effi cace.
Pretolani (7), tramite lʼOsservatorio sul Mercato dei Prodotti Lattiero-caseari e lʼIsmea, svolge unʼinteressante analisi dei costi di produzione del latte a livello nazionale, mettendoli a confronto con quelli delle principali regioni dellʼUnione Europea. A livello nazionale vengono utilizzati i dati contabili delle aziende facenti parte della rete RICA (Rete di Informazione Contabile in Agricoltura) che abbiano ordinamento produttivo specializzato nellʼallevamento bovino da latte, ossia quelle in cui la produzione lorda vendibile derivante dallʼallevamento bovino da latte, al netto di eventuali premi, è superiore ai 2/3 della produzione lorda vendibile complessiva dellʼimpresa. A livello comunitario vengono considerati i dati medi regionali aggregati delle aziende specializzate nella produzione di latte bovino appartenenti allʼOrdinamento tecnico economico (Ote) 41; anche in questo caso si tratta di allevamenti in cui oltre i 2/3 del reddito deriva dallʼallevamento bovino.
Il metodo attribuisce alla produzione principale, il latte, tutti i costi di produzione sostenuti a livello aziendale, in quanto gli altri prodotti ottenuti vengono considerati dei coprodotti inscindibili dalla produzione principale. Il costo totale si ottiene dalla somma dei costi espliciti, quelli effettivamente sostenuti, e di quelli impliciti relativi ai fattori della produzione forniti dallʼimprenditore; le voci di costo, comprensive di IVA, sono suddivise in quindici categorie, corrispondenti a sette gruppi di spese.
Successivamente il costo unitario si ottiene suddividendo il costo totale per la quantità di latte equivalente, calcolata dividendo il totale dei ricavi aziendali, al netto dei premi, per il prezzo del latte ottenuto dallʼazienda. Il valore unitario del latte è pari al prezzo di vendita o di conferimento del latte, anche in questo caso comprensivo di IVA.
L originalità del metodo consiste nel considerare lʼazienda come unʼunica unità produttiva, quella del latte, traducendo in latte le produzioni secondarie. Pertanto il costo totale dellʼazienda coincide con il costo del latte.
Da ricordare che per il calcolo del costo di produzione del latte nelle altre

252
Ann. Fac. Medic. Vet. di Parma (Vol. XXV, 2005) - pag. 247 - pag. 268
regioni europee non vengono attribuiti gli oneri relativi al lavoro famigliare e gli interessi sui capitali dellʼimprenditore. Pertanto ci si limita ai costi espliciti con il calcolo del reddito netto, che viene a sua volta suddiviso sulla quantità di latte prodotto.
4. Il controllo strategico dei costi
Dalla metà degli anni ottanta ad oggi sono cambiate le condizioni economiche produttive e si è passati da un sistema produttivo effi centista, con elevato impiego di mezzi di produzione e produzioni elevate, ad un sistema che oltre a produrre deve tener conto della tutela ambientale originando produzioni differenziate caratterizzate da tipicità ed elevati standard qualitativi; questo per effetto soprattutto di una riduzione delle quantità di beni domandati a fronte di un aumento delle quantità offerte sul mercato.
Queste trasformazioni hanno portato allʼaffermarsi di un modello di interpretazione delle strategie competitive noto come analisi della catena del valore secondo il quale “ogni azienda, nellʼambito delle proprie e specifi che funzioni, svolge una serie di attività, che vanno dal momento dellʼapprovvigionamento dei fattori produttivi, fi no a quello della commercializzazione dei prodotti” (5).
In questo senso per ogni azienda diventa necessario conoscere i costi e i risultati di ogni attività per poter concentrare le risorse nelle attività che generano maggior valore. Dunque lʼattenzione di chi svolge le analisi dei costi si va a spostare dai costi alle attività a partire dagli acquisti e quindi dal rapporto coi fornitori fi no ai clienti fi nali, considerando le economie a monte e a valle dellʼazienda. Il valore aggiunto aziendale diventa lʼelemento principale di calcolo e la sua massimizzazione diventa il fi ne della strategia aziendale che può far leva su bassi livelli di costi o sulla differenziazione dei prodotti.
La contabilità analitica tradizionale espone il fi anco ad alcune critiche che derivano dalla sua applicazione standardizzata in tutte le aziende senza tenere in considerazione gli obiettivi aziendali. Anche per quanto riguarda lʼadozione corretta delle basi dʼimputazione dei costi indiretti si possono fare alcune osservazioni, infatti il volume di produzione, correntemente usato, non può essere il solo criterio impiegato, occorre considerare anche altre variabili che infl uenzano il costo, sia strutturali (dimensione, tecnologia utilizzata, altitudine, tipo di stabulazione, tipologia del prodotto, dipendenza dal mercato) che operative (razionalità dei fattori di produzione, gestione della produzione e relativa qualità). Si tende dunque ad abbandonare i sistemi tradizionali di determinazione e di analisi dei costi per adottare sistemi di controllo strategico dei costi.
L espressione dei sistemi di controllo strategico dei costi sono i metodi basati sulle attività, uno di questi è lʼActivity Based Costing (ABC) (12). Stimolo per lo sviluppo del metodo è venuto dalla necessità, sentita da parte delle imprese, di un sistema di controllo che consentisse un contenimento dei costi comuni. Questo per effetto soprattutto dellʼaumento dei costi comuni avvenuto negli ultimi decenni determinatosi con lʼinnovazione dei sistemi di produzione. Inoltre è sorta la necessità

253
Ann. Fac. Medic. Vet. di Parma (Vol. XXV, 2005) - pag. 247 - pag. 268
da parte delle aziende di sistemi di calcolo dei costi di prodotto più corretti di quelli tradizionali che tendono a sovraccaricare di costi i prodotti a più alto volume (quando il criterio utilizzato è il livello produttivo).
L ABC mira al raggiungimento del costo pieno e lo fa raggruppando i costi originari in gruppi corrispondenti a una o più attività e individuando i cost drivers da utilizzare per misurare il consumo di attività da parte dei prodotti. L obiettivo, soprattutto in aziende caratterizzate da realtà produttive complesse, è evidenziare le cause dei costi strutturali e le attività generatrici di valore. Un limite di questo metodo viene evidenziato da Ghelfi (5): “Uno fra tutti è dovuto al fatto che il processo di “trasformazione” dei costi indiretti in costi diretti non può evidentemente essere portato a compimento in tutte le realtà produttive”.
5. Diffi coltà connesse al calcolo dei costi
Il rischio economico che si assume lʼimprenditore deriva dal fatto che a costi certi corrispondono ricavi incerti. La dizione costi certi può trarre in inganno soprattutto quando, come nella nostra trattazione, lʼobiettivo è la determinazione del costo di produzione di un prodotto. Le diffi coltà che si incontrano infatti sono correlate:
- alla molteplicità delle produzioni attuate in azienda;- allʼampiezza e rilevanza qualitativa della componente dei costi comuni da
attribuire a specifi ci oggetti di misurazione;- alla complessità delle misurazioni relative al costo dei fattori produttivi
reimpiegati;- allʼandamento delle rese produttive del processo agricolo, che possono
cambiare di anno in anno in funzione dellʼandamento climatico, determinando variazioni dei costi unitari indiretti di produzione che concorrono alla formazione del valore delle rimanenze, e quindi provocare variazioni del valore delle scorte dipendenti esclusivamente dalle fl uttuazioni legate agli andamenti climatici. Analizzando in particolare il settore zootecnico è evidente la diffi coltà e la
complessità nel caso di allevamenti bovini del calcolo dei costi da rinviare al futuro ai fi ni della loro valutazione in bilancio (come rimanenze o come immobilizzazioni) relativi agli animali nati in azienda. Infatti occorre considerare i costi relativi allʼottenimento dei riproduttori, i costi sostenuti per fattori produttivi di vario genere (cure veterinarie, medicinali, mano dʼopera ecc). Ciò presuppone sistemi amministrativi relativamente sofi sticati, come sottolinea Corbella (3).
Ciò non toglie che anche considerando i costi nella modalità sopraddetta si possano commettere delle approssimazioni, infatti a ben vedere è evidente il fenomeno di congiunzione ad esempio nel procedimento di calcolo dei costi relativi allʼalimentazione dei riproduttori di sesso femminile, in quanto tali costi sono relativi sia allʼottenimento del vitello che alla produzione del latte da parte della vacca.
Nelle discipline agrarie, sottolineano Capodaglio e Tozzi (2), fi n dal passato il problema del calcolo dei costi di prodotto è stato dibattuto e ha visto la

254
Ann. Fac. Medic. Vet. di Parma (Vol. XXV, 2005) - pag. 247 - pag. 268
contrapposizione di due concezioni: una favorevole, lʼaltra ostile, al calcolo dei costi di singoli prodotti (detti anche conti colturali). I fautori di questa tecnica ne sostenevano la necessità ai fi ni della conoscenza della convenienza delle colture, gli oppositori, sostenevano che lʼunitarietà del processo gestionale dellʼazienda generasse diffi coltà diffi cilmente superabili legate alla pratica della rotazione agraria, allʼattuazione di produzioni congiunte, alla pratica dei reimpieghi.
6. Una metodologia semplifi cata di calcolo dei costi
Le diffi coltà connesse al calcolo dei costi, in presenza di più processi produttivi, sono proprie del settore agricolo. La presenza di costi comuni a più prodotti impone la necessità di studiare le metodologie più corrette per la loro ripartizione in maniera da ridurre il più possibile la componente soggettiva di calcolo.
Le nuove metodologie proposte di riparto dei costi, sempre più raffi nate, richiedono rielaborazioni contabili complesse, a fronte di risultati che lasciano ancora notevoli spazi alle componenti soggettive di valutazione.
Con il presente lavoro ci siamo proposti di mettere a punto un metodo di calcolo del costo di produzione che sia in grado di raggiungere un triplice obiettivo:
- rendere il più oggettivo possibile il calcolo dei costi impliciti;- semplifi care e ridurre le operazioni di riparto dei costi;- limitare le valutazioni soggettive nella ripartizione dei costi comuni.
La metodologia semplifi cata verrà adottata per il calcolo del costo di produzione del latte destinato alla trasformazione in formaggio Parmigiano-Reggiano. Il comprensorio di produzione del formaggio Parmigiano-Reggiano comprende diverse province: Parma, Reggio Emilia, Modena, Bologna (sinistra Reno) e Mantova (destra Po). Le caratteristiche delle aziende ricadenti in questʼarea sono abbastanza differenti, soprattutto in rapporto alla dimensione e alla collocazione geografi ca. Infatti si possono incontrare ancora realtà abbastanza piccole caratterizzate dallʼimpiego in toto o in gran parte di manodopera familiare, ma anche aziende di dimensioni medie, fi no a unità produttive di notevoli dimensioni che sono quelle che hanno avuto il maggior sviluppo negli ultimi anni.
Dunque lʼapplicazione di un modello di determinazione dei costi deve riguardare realtà aziendali diverse, da quelle più piccole e semplici a quelle più grandi e complesse che hanno integrato anche altre attività, come quella della trasformazione in formaggio Parmigiano Reggiano direttamente in azienda.
Un elemento comune che è possibile individuare è comunque quello della specializzazione produttiva. Trattasi infatti quasi sempre di aziende che hanno fatto dellʼattività zootecnica di produzione del latte per il Parmigiano Reggiano la loro attività principale.
Pertanto vi sono tutte le condizioni ideali per poter applicare la Teoria del Proni (8), che trova ancora oggi piena validità metodologica, secondo la quale il costo di produzione di un bene che rappresenta nellʼazienda la quota largamente prevalente di tutta la produzione, può essere calcolato correttamente in due fasi:
- nella prima fase si procede al calcolo di tutti i costi aziendali nel loro

255
Ann. Fac. Medic. Vet. di Parma (Vol. XXV, 2005) - pag. 247 - pag. 268
complesso, indistintamente dalle produzioni ottenute;- nella seconda fase si procede alla sottrazione dal costo totale del costo delle
produzioni secondarie, per differenza otterremo il costo di produzione del latte, che rappresenta la produzione principale.Per quanto riguarda lo sviluppo della prima fase, per il calcolo del costo
totale, è possibile avvalerci dei risultati del bilancio economico dellʼazienda, ottenuti dalle rilevazioni contabili. Dal bilancio possiamo conoscere tutti i costi espliciti sostenuti dallʼazienda e come tali sono costi reali e quindi effettivi, perché attestati dai documenti contabili.
A questa serie di costi, che comprendono tutte le spese di reintegrazione ed eventualmente una parte dei compensi ai fattori produttivi acquisiti dallʼesterno, e quindi pagati, è necessario aggiungere i compensi ai fattori produttivi forniti dallʼimprenditore e dalla sua famiglia.
La determinazione del costo aziendale non si limita quindi ai soli costi espliciti, ma richiede anche il calcolo dei costi impliciti relativi ai fattori della produzione messi dallʼimprenditore nel ciclo di produzione. Per la determinazione dei costi impliciti, o costi-reddito, ci si avvale dellʼattribuzione dei compensi ai fattori produttivi forniti dallʼimprenditore prendendo come riferimento le remunerazioni alternative e concorrenti di mercato (9).
La remunerazione dei fattori varia da impresa ad impresa, in funzione del reddito netto che lʼimprenditore riesce a realizzare. In ogni caso la loro singola remunerazione non ci è nota, essendo inclusa nel coacervo del reddito netto, senza alcuna distinzione.
Il calcolo dei costi impliciti, al fi ne della determinazione del costo totale, deve essere avulso dal reddito netto dellʼimprenditore, che può avere la capienza o meno di remunerazione dei fattori aziendali, ma deve fare riferimento alle remunerazioni mercantili dei fattori, come investimenti alternativi e concorrenti. Pertanto ad ognuno dei fattori produttivi forniti dallʼimprenditore, noti in termini quantitativi dalle rilevazioni contabili ed extracontabili, abbiamo applicato le remunerazioni correnti di mercato.
Innanzitutto occorre verifi care se lʼimprenditore è proprietario di tutto o di parte del capitale fondiario e per la parte di sua proprietà determinare il relativo compenso. Il criterio da utilizzare è quello, si ripete, dellʼuso alternativo che il titolare avrebbe potuto fare del suo bene. In tal caso si fa riferimento al mercato degli affi tti della zona, in quanto se lʼimprenditore non avesse utilizzato personalmente i suoi terreni, avrebbe potuto concederli in locazione ad altri. Il calcolo può essere facilitato dalla presenza in azienda di una parte di terreno in affi tto, magari attiguo e con analoga potenzialità produttiva di quello dellʼimprenditore.
Per il compenso alla terra in proprietà abbiamo tenuto conto del canone di affi tto vigente per terreni analoghi, al netto degli oneri a carico della proprietà, perché gia inclusi nei costi espliciti.
Per il compenso ai capitali investiti abbiamo preso a riferimento le remunerazioni del mercato fi nanziario per investimenti di analoga rischiosità. Si ricorda che il CRPA adotta lo stesso criterio di remunerazione anche per la terra.
Ed infi ne per la remunerazione del lavoro familiare abbiamo preso in

256
Ann. Fac. Medic. Vet. di Parma (Vol. XXV, 2005) - pag. 247 - pag. 268
considerazione i salari dei lavoratori dipendenti a tempo indeterminato di stalla, risalendo ai compensi orari della zona, depurati degli oneri fi scali e contributivi in quanto già inclusi nei costi espliciti per la manodopera familiare.
Con questa procedura la determinazione del costo totale dellʼazienda è stato ottenuto sommando ai costi espliciti, già noti nel bilancio, i costi impliciti che abbiamo determinato su base mercantile. In questo modo i costi impliciti, che sono classifi cati costi soggettivi, vengono riportati nella sfera dellʼoggettività.
A questo punto possiamo affrontare la seconda fase del calcolo, cioè la determinazione del costo delle produzioni secondarie. Sempre attingendo alla già citata teoria del Proni, in presenza di una produzione principale il costo delle produzioni secondarie può essere equiparato al prezzo di mercato, nellʼipotesi che tali produzioni siano state ottenute in un mercato di perfetta concorrenza. Dunque è ragionevole assumere il costo delle produzioni secondarie pari a quello dei ricavi di vendita delle stesse. Inoltre anche se si commettesse un errore, ad esempio del 10%, sulle produzioni secondarie, che quantitativamente incidono sulla produzione totale in misura limitata, sulla produzione principale si tradurrebbe in un errore dellʼ1%, posto che questa rappresenti il 90% del totale, quindi è un limite di errore accettabile.
Le operazioni di calcolo, come abbiamo evidenziato, risultano pertanto semplifi cate in termini di procedimento, lasciando poco spazio alla componente soggettiva di attribuzione dei valori.
Pertanto la metodologia proposta di calcolo del costo di produzione del latte può trovare applicazione diffusa e rientrare nelle operazioni di routine per lʼanalisi di effi cienza delle aziende orientate verso il mercato.
7. Analisi del costo di produzione del latte
7.1 Le aziende sotto controllo
Il metodo semplifi cato di determinazione del costo di produzione del latte lo abbiamo applicato a due strategie imprenditoriali differenti della zootecnia da latte del comprensorio di produzione del formaggio Parmigiano-Reggiano: quella che ha convertito il processo produttivo al metodo biologico e a quella che ha mantenuto il metodo di produzione convenzionale.
Lo scopo è quello di fornire delle esemplifi cazioni pratiche al metodo proposto, con dei dati aziendali attuali desunti da rilevazioni di contabilità analitica. I risultati sul costo di produzione del latte vanno quindi valutati come esemplifi cativi di due diverse realtà produttive e non rappresentativi del territorio, per il quale sarebbe necessario disporre di un campione di aziende più numeroso e rappresentativo.
Alcuni confronti tra le aziende ci consentiranno di conoscere gli adattamenti strutturali e gestionali che la conversione al metodo biologico di produzione ha determinato sui risultati aziendali. Le rilevazioni aziendali si riferiscono allʼannata agraria 2004.

257
Ann. Fac. Medic. Vet. di Parma (Vol. XXV, 2005) - pag. 247 - pag. 268
7.2 Le caratteristiche strutturali
Le aziende prese in esame sono altamente specializzate nella produzione di latte per Parmigiano-Reggiano, che rappresenta oltre lʼ85% dei ricavi.
L azienda biologica è collocata nel primo pedecolle della Provincia di Reggio Emilia, è estesa per 40,40 ettari di cui 18,80 in affi tto, con una Sau complessiva di 38,00 ettari. L indirizzo produttivo è misto bovino-cerealicolo, anche se le colture praticate sono per la quasi totalità quelle foraggere. La forma di conduzione è diretta del coltivatore che apporta, insieme alla sua famiglia, tutto il lavoro necessario (le Ulu familiari sono 1,5). L azienda aderisce ad un caseifi cio sociale per la trasformazione del latte in Parmigiano-Reggiano.
L azienda convenzionale si trova in provincia di Parma nel comprensorio della Bassa ovest, dispone di una superfi cie totale di 65,00 ettari, di cui ben 54,60 sono in affi tto, la Sau aziendale è pari a 63,00 ettari. L indirizzo produttivo è, come per la realtà biologica, quello misto bovino-cerealicolo, ma lʼincidenza delle colture cerealicole è leggermente superiore in questa azienda rispetto alla precedente. La conduzione è anche in questo caso diretta del coltivatore e le Ulu familiari complessive sono 2,5. Anche questa azienda conferisce il latte ad un caseifi cio sociale per la trasformazione in formaggio Parmigiano-Reggiano.
In entrambi i casi si tratta di aziende familiari che, accanto ad una parte di terreno in proprietà, si avvalgono di superfi cie in affi tto, per poter ampliare la dimensione aziendale senza troppi oneri.
7.3 I costi espliciti
Dal punto di vista operativo ci avvaliamo dei dati contabili raccolti dal nostro Laboratorio di Gestione e Contabilità Agraria. Partendo dal libro mastro aziendale andiamo ad estrarre tutti i costi espliciti (che in contabilità derivano da fatti amministrativi modifi cativi e dalla parte modifi cativa dei fatti misti), ovvero quelli effettivamente sostenuti dallʼimprenditore. Sono i costi che nel bilancio economico dellʼazienda vengono classifi cati in:
- Spese di reintegrazione del capitale tecnico circolante. Si tratta degli esborsi di moneta sostenuti per lʼacquisto dei capitali circolanti, defi niti anche a fecondità semplice, in quanto esauriscono la loro funzionalità produttiva in un solo ciclo produttivo; sono le sementi, i concimi, i presidi sanitari, gli alimenti e i lettimi, i carburanti e i lubrifi canti; la defi nizione di queste poste è abbastanza semplice, esistono infatti dei conti specifi ci sul libro mastro che le individuano direttamente, e nei quali sono riportati gli acquisti fatti durante il corso dellʼanno e le consistenze iniziali e fi nali di magazzino. Il saldo del conto fornisce il consumo del mezzo di produzione dellʼannata.
- Quote dʼuso dei capitali tecnici fi ssi. Sono le spese sostenute per lʼutilizzo dei capitali tecnici fi ssi, detti anche a fecondità ripetuta in quanto la loro durata economica è di diversi anni; comprendono le quote di ammortamento, manutenzione e assicurazione. Anche in questo caso la loro individuazione è abbastanza semplice in quanto esistono dei costi specifi ci sul mastro aziendale

258
Ann. Fac. Medic. Vet. di Parma (Vol. XXV, 2005) - pag. 247 - pag. 268
dove questi importi sono registrati. La loro determinazione presuppone comunque la tenuta degli inventari dei capitali fi ssi presenti in azienda.
- Spese per i servigi extra-aziendali. Questa categoria di spese comprende le prestazioni dei professionisti (veterinari, tecnici e commercialisti) i noleggi di macchine e mezzi non aziendali, le imposte e i contributi; la loro individuazione viene fatta direttamente sul mastro o dal bilancio economico. Anche in questo caso esistono fatture di prestazioni o cartelle esattoriali cui fare riferimento.
- Compensi pagati per i fattori della produzione acquisiti esternamente. Si tratta dei compensi pagati per lʼaffi tto dei terreni presi in locazione, dei salari per il lavoro dipendente, degli interessi sui capitali presi a prestito. Trattandosi di costi reali questi sono indicati nel mastro o nel bilancio economico e sono desunti dai contratti di affi tto, dalle buste paga, o dai mutui bancari esistenti.
Tab. 1 – Costi espliciti (euro)
Descrizione Biologica Convenzionale
Totale %Per ettaro
Sau Totale %Per ettaro
Sau
sementi 968 0,9 25 3.588 1,5 57
concimi 0 0,0 0 4.154 1,8 46
presidi sanitari (per UGB) 653 0,6 10 3.700 1,6 38
alimenti e lettimi (per UGB) 35.412 34,4 558 81.453 34,4 840
carburanti e lubrifi canti 3.081 3,0 81 4.732 2,0 75
spese varie 12.035 11,7 317 21.346 9,0 339
Spese per cap. circolante 52.149 50,6 1.372 118.973 50,3 1.888ammortamenti 20.039 19,4 527 49.436 20,9 785
manutenzioni 3.782 3,7 100 3.751 1,6 60
assicurazioni 1.974 1,9 52 6.156 2,6 98Quote 25.795 25,0 679 59.343 25,1 942Spese di reintegrazione 77.944 75,6 2.051 178.316 75,4 2.830prestazioni sanitarie (per UGB) 661 0,6 10 4.498 1,9 46
noleggi 452 0,4 12 16.931 7,2 269
imposte e contributi 15.523 15,1 409 10.517 4,4 167
Servigi extraaziendali 16.636 16,1 438 31.946 13,5 507affi tto (per terreno in affi tto) 8.464 8,2 450 22.156 9,4 406
salari 0 0,0 0 0 0,0 0
interessi 0 0,0 0 4.337 1,8 69
Compensi pagati 8.464 8,2 223 26.493 11,2 236Totale costi espliciti 103.044 100,0 2.712 236.755 100,0 3.758

259
Ann. Fac. Medic. Vet. di Parma (Vol. XXV, 2005) - pag. 247 - pag. 268
Graf. 1 – Composizione dei costi espliciti
52.149 118.973
16.636 31.946
26.493
25.795 59.343
8.464
Biologica Convenzionale
Aziende
Cos
ti (%
) Compensi pagati
Servigi extraaziendali
Quote
Spese per cap. circolante
Passando allʼanalisi dei costi effettivamente sostenuti dalle aziende, che sono riportati nella tabella 1, si sono considerati oltre al loro valore complessivo anche alcuni rapporti che meglio consentono il confronto tra aziende aventi dimensioni e numero di capi diversi: in particolare i costi sono stati rapportati alla superfi cie agricola utile o al numero di capi grossi o alla superfi cie in affi tto.
Circa il 50% dei costi espliciti è costituito da spese per lʼacquisto di capitale circolante per entrambe le aziende; la voce più signifi cativa è per gli alimenti e i lettimi, con il 34,4% sia per la prima che per la seconda azienda. Un altro 25% è rappresentato dalle quote per lʼuso di capitali tecnici fi ssi sia nellʼazienda biologica che in quella convenzionale. Quindi per entrambe le realtà considerate circa il 75% dei costi espliciti aziendali è dato dalle spese di reintegrazione. La parte rimanente di questa categoria di costi è costituita dalle spese extra-aziendali e dai compensi: le prime sono percentualmente più alte nellʼazienda biologica (16,1%) che in quella convenzionale (13,5%); i secondi, rappresentati per lo più dal compenso pagato per la terra presa in affi tto, sono più alti in quella convenzionale (11,2%) rispetto a quella biologica (8,2%).
In realtà lʼincidenza per ettaro delle spese extraziendali si presenta più elevata nellʼazienda convenzionale (507 euro) rispetto a quella biologica (438 euro).
Andando poi nello specifi co si evidenzia che lʼazienda biologica non ha spese per concimi e molto basse sono quelle per presidi sanitari, ha inoltre costi più bassi anche per quanto riguarda la voce alimenti e lettimi riferiti ai capi grossi. Simili invece sono sia i costi per carburanti e lubrifi canti che le spese varie. Per quanto riguarda le quote, queste sono maggiori nellʼazienda convenzionale rispetto a quella biologica, se riferite allʼettaro di Sau. In effetti gli investimenti fatti di recente nellʼazienda convenzionale giustifi cano maggiori quote di ammortamento e

260
Ann. Fac. Medic. Vet. di Parma (Vol. XXV, 2005) - pag. 247 - pag. 268
assicurazione, a fronte di minori quote di manutenzione.Le spese per servigi extraziendali, per ettaro di Sau, sono maggiori per
lʼazienda convenzionale per effetto soprattutto dei noleggi e delle prestazioni sanitarie, mentre le imposte e i contributi risultano superiori per lʼazienda biologica.
Per quanto riguarda i compensi si può fare un confronto per il terreno in affi tto, che mostra un onere per ettaro superiore per lʼazienda biologica, mentre gli interessi pagati sono relativi alla sola azienda convenzionale che ha contratto i mutui per i nuovi investimenti.
Le due modalità di produrre sottintendono due diverse strategie dʼimpresa: lʼazienda biologica si avvale maggiormente di risorse aziendali reimpiegate, mentre quella convenzionale si rivolge al mercato per lʼacquisizione di ulteriori mezzi e fattori di produzione.
7.4 I costi impliciti
La determinazione dei costi impliciti non è altrettanto semplice come lʼindividuazione dei costi espliciti appena visti. Infatti mentre questi ultimi vanno ricercati nei dati già esistenti, i primi devono essere calcolati sulla base delle quantità di fattori portati dallʼimprenditore e dalla sua famiglia. Il compenso ai fattori, come già detto, viene fatto sulla base dei prezzi di mercato per impieghi alternativi e concorrenti (10).
Il compenso da attribuire alla terra in proprietà viene determinato analizzando i contratti di affi tto di terreni simili per caratteristiche produttive a quelli oggetto di studio. Se poi, come nel caso delle due realtà aziendali esaminate, vi sono contratti di locazione di terreni in corso, si considerano questi, come base di calcolo, sottraendo gli oneri a carico della proprietà, che sono già stati pagati. Si calcola un compenso medio per ettaro che verrà utilizzato per determinare il compenso complessivo dei terreni di proprietà dellʼimpresa.
Per quanto riguarda il compenso relativo ai capitali investiti in azienda sotto forma di miglioramenti fondiari e capitale agrario, sono stati considerati investimenti analoghi per rischiosità. In particolare si è stabilito di considerare un tasso dellʼ1% per i miglioramenti fondiari, considerata la loro natura molto sicura, e del 2% per il capitale agrario, che comprende il bestiame, le scorte morte e il capitale di anticipazione, considerati come investimenti a rischio più elevato. I tassi sono comunque molto bassi e tengono conto del rendimento attuale del denaro sul mercato fi nanziario.
Infi ne per la remunerazione del lavoro familiare, conoscendo il numero di ore lavorate in azienda dallʼimprenditore e dai membri della sua famiglia, è necessario determinare il compenso orario da attribuire. Il calcolo viene effettuato sulla base dei salari dei lavoratori dipendenti a tempo indeterminato di stalla della zona, sottratti degli oneri fi scali e contributivi; infatti per la manodopera familiare, questi costi sono già inclusi alla voce imposte e contributi dei costi espliciti.

261
Ann. Fac. Medic. Vet. di Parma (Vol. XXV, 2005) - pag. 247 - pag. 268
Tab. 2 – Costi impliciti (euro)
Compensi calcolati Biologica % Convenzionale %
Compenso per la terra in proprietà 7.409 11.7 3.099 3.6Interessi sui miglioramenti fondiari 1.379 2,2 2.432 2,8Interessi sul capitale agrario 2.573 4,1 7.011 8,2Compenso per il lavoro familiare 51.810 82,0 72.820 85.3Totale costi impliciti 63.171 100,0 85.362 100,0
Graf. 2 – Composizione dei costi impliciti
51.810 72.820
7.409
7.0112.5731.379
2.4323.099
Biologica Convenzionale
Aziende
Cos
ti (%
)
Compenso per la terra
Interessi sui miglioramenti fondiari
Interessi sul capitale agrario
Compenso per il lavoro familiare
La composizione dei costi impliciti è rappresentata per lo più dai compensi per il lavoro prestato dallʼimprenditore e dai membri della sua famiglia (oltre lʼ80% in entrambe le aziende). Un altro dato da rilevare è la maggiore incidenza degli interessi sul capitale agrario nellʼazienda convenzionale, in funzione della maggiore dotazione, mentre per quel che riguarda lʼincidenza degli interessi sui miglioramenti fondiari notiamo una sostanziale equivalenza. Il compenso per la terra incide maggiormente nellʼazienda biologica, a motivo della maggior superfi cie in proprietà e del compenso per ettaro di poco superiore.
7.5 I costi totali dellʼazienda
Il costo totale dellʼazienda si ottiene sommando ai costi espliciti i costi impliciti, ed è riferito a tutti i processi produttivi realizzati nellʼannata agraria.
In termini assoluti i costi aziendali sono circa il doppio nellʼazienda convenzionale rispetto a quella biologica, in relazione alla diversa dimensione; maggiore è soprattutto lʼincidenza dei costi espliciti a dimostrazione del maggiore

262
Ann. Fac. Medic. Vet. di Parma (Vol. XXV, 2005) - pag. 247 - pag. 268
ricorso al mercato dei mezzi produttivi nella forma convenzionale; in quella biologica si fa maggior leva sui reimpieghi dellʼazienda. In particolare le spese di reintegrazione sono il 65,3% del costo totale per lʼazienda convenzionale ed il 56,9% per quella biologica. Tra i compensi si osserva che lʼincidenza del fattore terra sul costo totale è assai vicina (9,5% per lʼazienda biologica e 7,8% per quella convenzionale); i capitali hanno invece unʼimportanza quasi doppia in quella convenzionale rispetto a quella biologica; al contrario è maggiore lʼincidenza del compenso per il lavoro in quella biologica rispetto a quella convenzionale sempre in rapporto al costo totale (31,2% per lʼazienda biologica contro il 22,6% per quella convenzionale).
Tab. 3 – Costi totali (euro)
Descrizione Biologica Convenzionale
Espliciti Impliciti Totali % Espliciti Impliciti Totali %
Spese di reintegrazione 94.580 - 94.580 56.9 210.262 - 210.262 65,3terra 8.464 7409 15.873 9,5 22.156 3099 25.255 7,8
capitali 0 3.952 3.952 2,4 4.337 9.443 13.780 4,3
lavoro 0 51.810 51.810 31,2 0 72.820 72.820 22,6
Compensi 8.464 63.171 71.635 43,1 26.493 85.362 111.855 34,7Costi totali 103.044 63.171 166.215 100,0 236.755 85.362 322.117 100,0
7.6 Il costo delle produzioni secondarie
Il costo delle produzioni secondarie, in presenza di una produzione principale, può essere equiparato al prezzo di mercato, nellʼipotesi che tali produzioni siano state ottenute in un mercato di perfetta concorrenza. Quindi possiamo considerare il costo delle produzioni secondarie pari ai ricavi ottenuti dalla vendita delle stesse. I dati vengono individuati dalla contabilità aziendale o nel bilancio economico, o comunque dalle fatture di vendita dei prodotti. Solo nel caso della produzione di carne i dati non sono reperibili nelle sole fatture di vendita, bensì attraverso lʼUtile Lordo di Stalla (ULS). Si tratta di un bilancio parziale la cui parte attiva è costituita dal valore delle consistenze fi nali di stalla e dai capi venduti, mentre nella parte passiva viene ascritto il valore delle consistenze iniziali di stalla e degli eventuali acquisti di bestiame.
Tab. 4 – Le produzioni aziendali (euro)
Descrizione Biologica % Convenzionale %
Produzione principale (latte) 146.819 84,9 271.860 89,3Produttività per vacca (q) 60,2 - 78,6 -Produzioni secondarie 26.180 15,1 32.481 10,7- vegetali 2.281 1,3 10.510 3,5- animali 22.885 13,2 20.772 6,8- altre 1.014 0,6 1.199 0,4Totale produzioni 172.999 100,0 304.341 100,0

263
Ann. Fac. Medic. Vet. di Parma (Vol. XXV, 2005) - pag. 247 - pag. 268
Le produzioni secondarie delle due aziende oggetto di studio sono relative:- alle produzioni vegetali, frumento per lʼazienda biologica, e frumento e mais
per quella convenzionale;- alle produzioni animali, rappresentate dallʼaccrescimento in carne della
mandria, come si accennava sopra, e quindi dallʼULS (carne); - dalle altre produzioni, nella fattispecie si tratta dei contributi pubblici
erogati alle aziende secondo i regolamenti derivanti dalla Politica agricola comunitaria (Pac).
Graf. 3 – Composizione delle produzioni secondarie
2.281
10.510
22.885
20.772
1.014 1.199
Biologica ConvenzionaleAziende
Prod
uzio
ni (%
) Altre
Produzioni animali
Produzioni vegetali
Nel complesso esse rappresentano il 15,1% della Produzione lorda vendibile nellʼazienda biologica ed il 10,7% in quella convenzionale, percentuali effettivamente basse, che giustifi cano lʼapplicazione della teoria del Proni.
Per quanto riguarda la composizione delle produzioni secondarie, emerge una differenza tra le due aziende che vede in quella convenzionale una maggior incidenza delle produzioni vegetali, derivante dalla maggior superfi cie aziendale destinata alla coltivazione di cereali.
Sulla produzione aziendale, la produzione principale, il latte, incide per lʼ84,9% per lʼazienda biologica, e per lʼ89,3% per lʼazienda convenzionale, rimarcando la forte specializzazione lattiera delle aziende esaminate.
8. Calcolo del costo di produzione del latte
Il costo di produzione del latte si ottiene semplicemente sottraendo al costo totale aziendale il costo delle produzioni secondarie appena determinato, che è pari

264
Ann. Fac. Medic. Vet. di Parma (Vol. XXV, 2005) - pag. 247 - pag. 268
al valore delle relative produzioni. Successivamente, dividendo il costo così ottenuto per la quantità di latte prodotto dalle singole aziende si giunge alla determinazione del costo unitario.
Tab. 5 – Costo di produzione del latte (euro)
Descrizione Biologica Convenzionale
Costo aziendale 166.215 322.117Costo delle prod. secondarie 26.180 32.481Costo del latte 140.035 289.636Latte prodotto (Kg) 271.018 554.100Costo unitario (euro/100Kg) 50,5 52,3Prezzo (euro/100Kg) 53,0 49,1
Profi tto (euro/100Kg) 2,5 -3,2
Il confronto tra le due aziende mostra due costi di produzione sostanzialmente simili, anche se quello dellʼazienda convenzionale risulta essere leggermente superiore a quello dellʼazienda biologica di 1,8 centesimi il chilogrammo. L altro confronto che si deve affrontare è quello con il prezzo di mercato del latte per lʼanno preso in considerazione. Per lʼannata 2004 il prezzo di riferimento per la provincia di Parma, ossia il prezzo che ogni anno viene concordato tra i rappresentanti dei produttori di latte destinato a Parmigiano-Reggiano e i trasformatori acquirenti non è stato ancora determinato. Per lʼannata 2003 il prezzo concordato è stato di 44,86 euro per quintale di latte consegnato. Le due aziende in questione comunque non vendono il latte ai caseifi ci industriali, ma conferiscono la loro produzione ai caseifi ci cooperativi di cui sono soci. Dunque si assumono i rischi tecnici ed economici della trasformazione del latte in formaggio. Di conseguenza ciò che viene loro liquidato a fi ne anno deriva dal bilancio di trasformazione della cooperativa. L azienda biologica, inoltre, conferisce il latte ad un caseifi cio che trasforma separatamente la sua produzione per ottenere Parmigiano-Reggiano biologico, ed effettua separatamente la vendita del proprio prodotto biologico che ha un prezzo differente dal formaggio convenzionale. L azienda quindi percepisce la liquidazione del latte come da bilancio del caseifi cio, come tutti gli altri soci, poi se la vendita del proprio prodotto ha generato un maggior ricavo rispetto alla produzione convenzionale, percepirà anche questi maggiori proventi.
Nellʼannata oggetto di studio, per lʼazienda biologica il prezzo di liquidazione percepito dal caseifi cio è stato di 0,53 euro/kg. Tale prezzo deriva, come si diceva, dal bilancio presentato dalla cooperativa calcolato sulla base dei prezzi di vendita del formaggio in giacenza e sulle stime di prezzo della produzione 2004 non ancora venduta, dedotte le spese di trasformazione. Successivamente lʼazienda percepirà anche il maggior utile derivante dalla vendita del formaggio biologico, venduto solitamente a stagionatura completa e quindi dopo oltre 2 anni dalla data di produzione. Il prezzo di liquidazione ottenuto dal caseifi cio è superiore al costo di produzione e quindi consente di remunerare in toto i fattori della produzione

265
Ann. Fac. Medic. Vet. di Parma (Vol. XXV, 2005) - pag. 247 - pag. 268
conferiti dallʼimprenditore e dalla sua famiglia, così come sono stati calcolati tra i costi impliciti. La gestione dellʼannata risulta dunque soddisfacente.
Per lʼazienda convenzionale il prezzo liquidato dal caseifi cio è stato per lʼannata 2004 pari a 0,49 euro/kg. Si tratta di un compenso che non copre il costo di produzione del latte. Saranno i compensi relativi ai fattori della produzione conferiti dallʼimprenditore a non poter essere remunerati in misura piena. Il risultato non deve meravigliare, in quanto lʼazienda ha fatto negli ultimi anni investimenti consistenti i cui ammortamenti gravano sul costo di produzione, ma che consentono allʼazienda di guardare al futuro con suffi ciente ottimismo, in quanto la produttività è aumentata costantemente e continua a crescere.
L analisi della produttività per vacca mostra che nellʼazienda convenzionale questa è superiore di circa il 30% (Tab. 4) rispetto a quella biologica, anche se a fronte di questo risultato si osserva un maggior impiego di mezzi produttivi specifi ci, come gli alimenti-lettimi e i presidi sanitari. La spesa mercantile per lʼalimentazione, riferita allʼunità di bovino adulto (UGB), è superiore del 50% nellʼazienda convenzionale rispetto a quella biologica, mentre la spesa per i presidi sanitari è quasi 4 volte superiore (Tab.1); anche gli oneri per le prestazioni sanitarie risultano essere di gran lunga superiori (46 euro/UGB per lʼazienda convenzionale e 10 euro/UGB per la biologica).
Applicando la metodologia di calcolo del costo di produzione del latte proposta dallʼOsservatorio sul Mercato dei Prodotti Lattiero-caseari e dallʼIsmea, trattata nelle pagine precedenti, si ottiene un risultato molto simile a quello che abbiamo presentato. Infatti il costo unitario di produzione del latte che ne deriva è sostanzialmente identico. Questo rappresenta una ulteriore conferma della bontà della metodologia di calcolo che abbiamo adottato, come risulta nella tabella 6.
Tab. 6 – Il metodo del latte equivalente
Descrizione Biologica Convenzionale
Totale produzioni (euro) 172.999 304.341Produzioni al netto dei premi (euro) 171.985 303.142Prezzo del latte(euro/100kg) 53,0 49,1
Latte equivalente (Kg) 324.500 617.900Costo totale aziendale (euro) 166.215 322.117Costo unitario (euro per 100 kg di latte equivalente) 51,2 52,1
La scelta del metodo biologico o convenzionale nella produzione delle due aziende comporta strategie dʼimpresa differenti. Nel nostro caso si conferma la validità della scelta del biologico con un costo di produzione del latte leggermente inferiore, al quale si aggiunge un prezzo di liquidazione del latte da parte del caseifi cio maggiore, anche se questo non dipende dalla capacità dellʼimprenditore. Rimane inoltre lʼulteriore vantaggio della vendita del formaggio biologico ad un
266
Ann. Fac. Medic. Vet. di Parma (Vol. XXV, 2005) - pag. 247 - pag. 268
prezzo superiore rispetto al formaggio convenzionale, che procura allʼimprenditore ulteriori utili.
Il metodo biologico di produzione si dimostra in questo caso più vantaggioso di quello convenzionale, grazie alla confl uenza di tre condizioni favorevoli:
- un costo di produzione del latte inferiore, grazie alla strategia di scelta dellʼimprenditore;
- un prezzo del latte maggiore liquidato dal caseifi cio, frutto di una gestione migliore da parte della cooperativa;
- un utile della vendita del formaggio biologico.In precedenti ricerche condotte sul costo di produzione del latte biologico
abbiamo rilevato degli oneri superiori rispetto al costo di produzione del latte convenzionale. Nel contempo abbiamo assistito anche ad un processo di contenimento dei costi con ritmi maggiori da parte dei produttori biologici rispetto a quelli convenzionali nel corso degli ultimi anni (10).
I risultati che emergono dalla ricerca confermano questo processo di avvicinamento dei costi di produzione nelle due strategie dʼimpresa, con leggero vantaggio, in questo caso, per il metodo biologico.
9. Alcune conclusioni
La metodologia semplifi cata di calcolo del costo di produzione del latte che abbiamo proposto risulta essere di facile applicazione, disponendo di una contabilità aziendale. Il metodo infatti non necessita di parametri per la ripartizione dei costi comuni.
I risultati ottenuti vengono confermati anche dal confronto con il metodo messo a punto dallʼOsservatorio sul Mercato dei Prodotti Lattiero-caseari e dallʼIsmea che adotta il criterio del latte equivalente.
Il calcolo del costo di produzione del latte deve consentire allʼimprenditore di migliorare la gestione economica dellʼazienda, con riferimento alla produzione principale, il latte. Dal suo confronto col prezzo di mercato si ottiene la misura dellʼeffi cienza imprenditoriale. Nel caso in cui il costo del latte sia superiore al prezzo percepito lʼimprenditore dovrà accontentarsi di remunerare solo in parte i suoi fattori della produzione. Questo dovrebbe consentirgli di valutare meglio le scelte da farsi relativamente al proseguimento dellʼattività produttiva e agli adattamenti da introdurre nel breve e nel lungo periodo.
Sembra che la strategia adottata con il metodo biologico dia in questo caso risultati migliori nel contenimento del costo di produzione del latte. Per quanto riguarda invece il prezzo liquidato dai caseifi ci, dobbiamo ricordare che i produttori sono in posizione di price taker, non potendo infl uire sul prezzo. Nel nostro caso viene ulteriormente avvantaggiato il produttore biologico che riceve un prezzo del latte dal suo caseifi cio superiore a quello del produttore convenzionale.
Inoltre il produttore biologico è ancora in attesa di lucrare sul maggior prezzo di vendita del formaggio biologico rispetto a quello convenzionale.

267
Ann. Fac. Medic. Vet. di Parma (Vol. XXV, 2005) - pag. 247 - pag. 268
Parole chiave:Latte biologico e convenzionale, Parmigiano-Reggiano, costo di
produzione
Key words:Organic and conventional milk, Parmigiano-Reggiano, production cost
Bibliografi a
1) BREGOLI A.: Bilancio e contabilità nellʼazienda agraria. Liviana editrice, Padova, 1987, p.11.
2) CAPODAGLIO G., TOZZI I.: Determinazioni di costo nellʼazienda agricola. Clueb, Bologna, 1995, p.33.
3) CORBELLA S.: Il calcolo economico nellʼimpresa agricola. Aspetti generali e problematiche di redazione del bilancio di esercizio. FrancoAngeli, Milano, 2001, p.159.
4) DE ROEST K., MENGHI A., CORRADINI E.: Costi di produzione e di trasformazione del latte in Emilia-Romagna. C.R.P.A. Notizie n. 10/2004. Tecnograf, Reggio Emilia, 2004, p.2.
5) GHELFI R.: Evoluzione delle metodologie di analisi dei costi aziendali in relazione alle innovazioni tecniche ed organizzative. Atti del XXXVII Convegno di studi Sidea “Innovazione e ricerca nellʼagricoltura italiana”. Bologna, 2000, p.407.
6) GIACINTI R., TELLARINI V., SALVINI E., DI IACOVO F., ANDREOLI M., MORUZZO R., OLIVIERI D.: Analisi e gestione economico–contabile per lʼimpresa agro-zootecnica. FrancoAngeli, Milano, 2002, p.215.
7) PRETOLANI R.: I costi di produzione del latte in Osservatorio Latte – Ismea. Il mercato del latte. Rapporto 2004. Francoangeli, Milano, 2004, p.125.
8) PRONI G.: Contributo allo studio del costo di produzione in agricoltura. INEA, Roma, 1940.
9) SALGHETTI A.: Produzioni biologiche e convenzionali negli allevamenti bovini. CNR-RAISA. Università degli Studi di Parma, Istituto di Economia Rurale e Zooeconomia, 1997, p.172.
10) SALGHETTI A., BONAZZI G.: Cinque anni di zootecnia biologica a confronto. Annali Fac. Med. Vet., Università di Parma, XXI, 2001, p.183.
11) TORQUATI B.: Economia e gestione dellʼimpresa agraria. Ed agricole, Bologna, 2003, p.260.
12) TOZZI I. : Il metodo ABC per il calcolo del costo di prodotto. Cisb, Bologna, 1995.

268
Ann. Fac. Medic. Vet. di Parma (Vol. XXV, 2005) - pag. 247 - pag. 268
RIASSUNTO
E stata proposta una metodologia semplifi cata di calcolo del costo di produzione del latte, valida per gli allevamenti specializzati, che supera le diffi coltà di ripartizione dei costi comuni, assicurando maggiore oggettività ai risultati.
Questa procedura è stata applicata al metodo biologico e convenzionale di produzione del latte nel comprensorio del formaggio Parmigiano-Reggiano. I risultati ottenuti hanno confermato la validità del metodo di calcolo proposto, anche in relazione ad altre ricerche condotte sullʼargomento.
I costi di produzione del latte messi a confronto indicano che il metodo biologico di produzione sta recuperando competitività rispetto a quello convenzionale, grazie al maggiore riutilizzo di materie prime aziendali, al contenimento degli acquisti di prodotti sul mercato e alla valorizzazione mercantile del formaggio biologico, nonostante una minore produttività di latte delle vacche.
ABSTRACT
Methodology for the calculation of milk production costs and applied analysis of conventional and organic farms.
A simplifi ed method for the calculation of milk production costs has been proposed. This method is valid for specialist farms, and overcomes the diffi culties in the repartition of joint costs, thus assuring more objective results.
This procedure has been applied to the organic and conventional milk production methods used within the Parmigiano-Reggiano cheese production area. The results obtained confi rm the validity of the proposed calculation method, also in relation to other research carried out on this subject.
The compared milk production costs show that organic production methods are gaining in competitivity compared to conventional methods, due to the increased reuse of raw materials in-company, the limited purchase of products from the market and the marketable valorisation of organic cheese, despite the lower milk production of the cows.

269
Ann. Fac. Medic. Vet. di Parma (Vol. XXV, 2005) - pag. 269 - pag. 292
1 Lo studio è frutto del lavoro comune dei due autori. Tuttavia, in sede di stesura del testo Giuseppe Bonazzi ha redatto i paragrafi 1, 2, 3, 4, 9 e Mattia Iotti ha redatto i paragrafi 5, 6, 7, 8. 2 Sezione Risorse del Territorio, Dipartimento di Salute Animale, Facoltà di Medicina Veterinaria, Università degli Studi di Parma.
ANALISI PER INDICI NELLʼIMPRESA AGRARIA1
Bonazzi G., Iotti M.2
1. Premessa
La valutazione dellʼandamento gestionale delle imprese è un tema che inte-ressa le scelte dellʼimprenditore, ma che infl uenza le decisioni anche di altri soggetti che con le imprese hanno relazioni.
Il lavoro ha come obiettivi lʼanalisi di redditività aziendale, lʼanalisi di so-lidità della struttura patrimoniale e fi nanziaria e lʼanalisi di sostenibilità del ciclo aziendale di unʼimpresa agraria. Per queste fi nalità lʼanalisi del conto economico fornisce indicazioni relative alla redditività aziendale, in termini assoluti, ed in ter-mini relativi, in rapporto al valore della produzione e agli investimenti effettuati. L analisi patrimoniale e fi nanziaria, relativa allʼanalisi degli investimenti effettuati e alle relative coperture di tipo fi nanziario, si sofferma in particolare sui dati dello stato patrimoniale procedendo poi alla verifi ca di sostenibilità del ciclo aziendale.
Per effettuare dette analisi sono stati utilizzati gli schemi di bilancio median-te riclassifi cazioni ed analisi per indici.
2. Le riclassifi cazioni di bilancio e lʼanalisi per indici
Le analisi gestionali, condotte con criteri omogenei secondo gli standard dei principi contabili internazionali, facilitano il confronto degli esiti gestionali tra diver-se imprese agrarie e tra imprese agrarie ed imprese attive in altri settori economici. Inoltre la valutazione degli esiti di gestione secondo parametri omogenei rispetto a quelli utilizzati per le imprese dellʼindustria e del terziario assume un rilievo anche nellʼottica delle analisi svolte dagli Istituti di Credito per la concessione di fi nanzia-menti, imposti dagli accordi interbancari denominati “Basilea II”. Per lʼaccesso al credito bancario le imprese sono infatti valutate sulla base di parametri oggettivi di valutazione, applicati anche alle imprese agrarie in sede di istruttoria di pratiche di affi damento. Dette analisi considerano, accanto ai tradizionali parametri di redditività e solidità patrimoniale, il potenziale di autofi nanziamento delle aziende e la conse-guente capacità di rimborsare i debiti contratti, valutando la concessione del credito non solo sulla base delle garanzie offerte dai soggetti in defi cit fi nanziario, ma soprat-tutto sulla base della capacità di rimborso del debito.

270
Ann. Fac. Medic. Vet. di Parma (Vol. XXV, 2005) - pag. 269 - pag. 292
Per quanto riguarda le analisi delle imprese agrarie il presente studio fa ri-ferimento ad imprese che dispongono del bilancio dʼesercizio, composto di conto economico e stato patrimoniale. L analisi del conto economico fornisce indicazioni, in primo luogo, sulla redditività e sulla composizione dei valori positivi e negativi di reddito. La riclassifi cazione di bilancio utilizzata nelle analisi è detta “a valore aggiunto” e permette di confrontare aggregati omogenei di componenti positive e negative di reddito, calcolando altresì margini intermedi di redditività. In detta ri-classifi cazione, le componenti positive di reddito sono aggregate nel valore della produzione, cui si aggiungono i proventi accessori ed i proventi fi nanziari, oltre alle rivalutazioni e alle componenti straordinarie di reddito.
Le componenti negative di reddito sono riclassifi cate in diversi aggregati, delle quali la componente principale è quella dei costi di produzione, cui si aggiungo-no gli oneri diversi di gestione, gli oneri fi nanziari, le svalutazioni e gli oneri straor-dinari, ed infi ne le imposte sul reddito dʼesercizio. La riclassifi cazione adottata nelle analisi permette di individuare risultati gestionali intermedi, fornendo altresì infor-mazioni sulle diverse aree gestionali in cui si forma la redditività dellʼazienda.
Le analisi di tipo patrimoniale hanno come riferimento lo stato patrimoniale del bilancio dʼesercizio, suddiviso in sezione attiva e sezione passiva. Le attività, che esprimono gli investimenti effettuati nellʼazienda e che formano lʼattivo dello stato patrimoniale, sono riclassifi cate sulla base del criterio di liquidità/esigibilità, in attivi-tà immobilizzate e in attività circolanti. In questo modo, tra le attività immobilizzate sono classifi cati quegli investimenti in beni durevoli destinati a trasformarsi in dena-ro liquido in un periodo superiore a 12 mesi. Tra le attività circolanti sono classifi cati quegli investimenti in beni utilizzati dallʼimpresa nel ciclo corrente dellʼattività e destinati a trasformarsi in denaro liquido in un periodo inferiore a 12 mesi. Anche le passività, che esprimono le fonti di fi nanziamento dellʼazienda, sono riclassifi cate. In primo luogo le passività sono state suddivise tra mezzi propri e mezzi terzi. Inoltre, anche le passività sono riclassifi cate sulla base del criterio fi nanziario di liquidità/esi-gibilità. Il patrimonio netto è classifi cato come fonte di fi nanziamento strutturalmente disponibile per fi nanziare il ciclo aziendale, quindi fonte di fi nanziamento consolida-ta. I mezzi di terzi sono suddivisi in mezzi di terzi a breve termine, che devono cioè essere rimborsati entro 12 mesi, e mezzi di terzi a medio lungo termine, ovvero mezzi di terzi consolidati, che devono cioè essere rimborsati oltre 12 mesi. La riclassifi ca-zione adottata nelle analisi permette di individuare elementi di solidità patrimoniale, nel breve e nel medio lungo periodo, oltre a fornire informazioni sulla sostenibilità fi nanziaria del ciclo aziendale.
Le riclassifi cazioni del bilancio sono integrate, ai fi ni dellʼanalisi aziendale, con le analisi per indici e margini di bilancio. Detti indici sono stati individuati ed utilizzati nelle analisi in quanto in grado di fornire indicazioni sintetiche sullʼanda-mento della gestione aziendale. Gli indici sono suddivisi in diverse categorie. Gli indici reddituali sono alla base della valutazione del risultato gestionale dal punto di vista dei rapporti tra margini economici e investimenti e forniscono dati utili per le analisi sulla sostenibilità del ciclo aziendale, anche dal punto di vista fi nanziario. Relativamente alla redditività, è stato utilizziato il Roa (Return on asset), che esprime la redditività del complesso dei capitali investiti in azienda. Il Roa è calcolato come

271
Ann. Fac. Medic. Vet. di Parma (Vol. XXV, 2005) - pag. 269 - pag. 292
rapporto tra il reddito operativo ed il totale degli investimenti, cioè il totale dellʼattivo patrimoniale. Il Roe (Return on equity), che esprime la redditività dei mezzi propri, è calcolato come rapporto tra il risultato dʼesercizio ed il patrimonio netto, al netto del risultato dʼesercizio. Il Ros (Return on sales), che esprime la redditività delle vendite, è calcolato come rapporto tra il reddito operativo ed il fatturato. L analisi di redditività si accompagna allʼanalisi del costo dellʼindebitamento. Infatti, nel caso di un costo dellʼindebitamento superiore rispetto alla redditività del capitale investito, lʼinvestimento con ricorso a capitale di terzi è un elemento di ulteriore aggravio degli esiti reddituali della gestione. Al fi ne di effettuare tale analisi è stato calcolato il Rod (Return on debts), indice che esprime il costo medio dellʼindebitamento, ed è calcola-to come rapporto tra saldo della gestione fi nanziaria e Posizione fi nanziaria netta. Tra gli indici di rotazione del capitale, sono da considerare il Turnover, calcolato come rapporto tra fatturato e totale attivo, che esprime la rotazione del capitale investito, cioè quante volte gli investimenti ruotano nellʼesercizio per effetto del fatturato, e lʼIntensità di capitale, che è calcolata come reciproco del Turnover.
Tra gli indici patrimoniali è da considerare il Quoziente di indebitamen-to, calcolato come rapporto fra i mezzi di terzi ed i mezzi propri. A questo indice si accompagna il Leverage, calcolato come rapporto tra totale degli investimenti e mezzi propri. Detti indici patrimoniali sono calcolati al fi ne di indicare il rapporto di equilibrio strutturale fra il totale degli investimenti, con particolare attenzione allʼequilibrio nel fi nanziamento con mezzi propri e con mezzi di terzi. Sempre tra gli indici patrimoniali, lʼequilibrio fi nanziario di breve periodo è espresso dallʼindice di Liquidità corrente, calcolato come rapporto fra investimenti a breve e mezzi di terzi a breve. A questo indice si accompagna lʼindice di Liquidità immediata, calcolato come rapporto fra investimenti a breve, al netto delle scorte di magazzino, ed i mezzi di terzi a breve. Questa coppia di indici è calcolata al fi ne di indicare il rapporto di equilibrio di breve periodo fra investimenti e fonti di fi nanziamento, con particolare attenzione alla capacità di sostenere il ciclo fi nanziario aziendale nel breve periodo.
Nelle analisi aziendali rilievo assumono anche i margini di stato patrimo-niale, tra questi, il Margine di struttura totale è calcolato come differenza tra i mezzi propri ed i mezzi di terzi consolidati e gli investimenti in attività immobilizzate. L in-dice esprime la capacità dellʼimpresa di fi nanziare le attività immobilizzate con fonti di fi nanziamento consolidate, cioè disponibili nel medio lungo periodo. Il Margine di tesoreria è calcolato come differenza tra attivo a breve, al netto del magazzino, e passivo a breve. L indice esprime la capacità dellʼimpresa di far fronte agli impegni a breve con la liquidazione degli investimenti a breve, senza far ricorso al magazzino.
Per quanto riguarda la valutazione di sostenibilità del ciclo aziendale si con-sidera la situazione debitoria verso il sistema bancario, espressa dalla Posizione fi -nanziaria netta (Pfn), data dalla differenza fra le liquidità immediate ed i debiti fi nan-ziari, in rapporto allʼattivo investito e al fatturato. Detti indici esprimono il livello di indebitamento dellʼimpresa nei confronti del sistema bancario. Per quanto riguarda la valutazione di sostenibilità del ciclo aziendale, tra gli indici signifi cativi è stato con-siderato anche il rapporto tra Ebitda ed oneri fi nanziari, che esprime la capacità del-lʼimpresa di pagare gli oneri fi nanziari a servizio del debito con i fl ussi di reddito al netto di interessi, imposte, ammortamenti e svalutazioni. A questo indice si aggiunge

272
Ann. Fac. Medic. Vet. di Parma (Vol. XXV, 2005) - pag. 269 - pag. 292
il rapporto tra Ebit ed oneri fi nanziari, che esprime la capacità dellʼimpresa di pagare gli oneri fi nanziari a servizio del debito con i fl ussi di reddito al netto di interessi e imposte. Sempre in tema di capacità di rimborso del debito sono da considerare i rap-porti tra cash fl ow ed oneri fi nanziari, cash fl ow e Posizione fi nanziaria netta e cash fl ow e totale attivo. Detti indici esprimono, rispettivamente, lʼincidenza dei fl ussi di cassa sul costo dellʼindebitamento, sulla posizione, attiva o passiva, verso banche, e sul totale degli investimenti. Gli indici danno una misura della capacità di autofi nan-ziamento dellʼimpresa, in rapporto agli aggregati di costo del debito, indebitamento bancario e totale dellʼinvestimento in azienda, rispettivamente.
Relativamente alla sostenibilità del ciclo aziendale è da considerare anche il rapporto tra cash fl ow e Posizione fi nanziaria netta, a sua volta rapportato al costo del debito (Rod). Il rapporto tra cash fl ow e Posizione fi nanziaria netta esprime quanta parte del debito fi nanziario è rimborsabile nel corso dellʼesercizio. Nel caso in cui lʼindice assume valore maggiore allʼunità, lʼimpresa crea fl ussi fi nanziari positivi, superiori al costo del debito, ed è quindi in grado oltre a pagare gli interessi sul debito, a procedere anche al rimborso in linea capitale del debito fi nanziario. Nel caso in cui lʼindice assume valore maggiore di zero ma inferiore allʼunità, lʼimpresa crea fl ussi fi nanziari positivi, ma inferiori al costo del debito, e non è quindi in grado di proce-dere al rimborso in linea capitale del debito fi nanziario, essendo in grado di coprire solo in parte il costo dellʼindebitamento. Nel caso in cui lʼindice assume valore infe-riore a zero, lʼimpresa non crea fl ussi fi nanziari positivi e quindi è in una situazione di erosione fi nanziaria, con impossibilità di far fronte non solo alla restituzione del debito ma anche al costo dellʼindebitamento. Un ulteriore indicatore di sostenibilità del ciclo aziendale è dato dalla rappresentazione in coppia di valori ascisse/ordinate della variazione dellʼattivo investito e del cash fl ow. Sullʼasse delle ascisse è espressa la variazione dellʼattivo investito, mentre sullʼasse delle ordinate è espresso il cash fl ow. Detta rappresentazione cartesiana esprime la capacità dellʼimpresa di generare fl ussi fi nanziari suffi cienti a garantire la sostenibilità del ciclo aziendale. Nel caso in cui il fl usso di cassa sia superiore allʼinvestimento incrementale, lʼimpresa è in grado di sostenere un investimento incrementale, senza far ricorso a fonti fi nanziarie ester-ne. Si tratta di una situazione di surplus fi nanziario. Nel caso in cui il fl usso di cassa sia positivo, ma inferiore allʼaumento dellʼinvestimento incrementale, oppure sia ne-gativo, ma maggiore della diminuzione dellʼinvestimento incrementale, si rileva una necessità di far ricorso a nuovo indebitamento. Si tratta di una situazione di defi cit fi nanziario. Nel caso in cui il fl usso di cassa sia negativo, in presenza di aumento dellʼinvestimento incrementale, lʼimpresa non genera risorse fi nanziarie e disperde le risorse fi nanziarie già presenti in azienda. Si tratta di una situazione di erosione fi nanziaria. Infi ne, è da considerare anche il rapporto tra la redditività dellʼattivo in-vestito (Roa) e costo dellʼindebitamento fi nanziario (Rod). Detto rapporto esprime la capacità dellʼimpresa di sostenere un incremento dellʼindebitamento grazie ai fl ussi di reddito derivanti dallʼinvestimento in azienda. Nel caso in cui detto valore sia superiore allʼunità la redditività degli investimenti in impresa è superiore al costo dellʼindebitamento e quindi lʼimpresa è in grado di sostenere lʼindebitamento incre-mentale per effetto dei fl ussi di reddito derivanti da attività di gestione superori al costo dellʼindebitamento (sino a livello di rischio dato da eccesso di indebitamento).

273
Ann. Fac. Medic. Vet. di Parma (Vol. XXV, 2005) - pag. 269 - pag. 292
Nel complesso, questi indici sono stati selezionati in quanto esprimono in misura sintetica, ma esaustiva, il profi lo reddituale, patrimoniale e fi nanziario di un azienda, permettendo un confronto con imprese del settore e con imprese di settori diversi. In particolare rendono possibile la valutazione di redditività degli investi-menti effettuati, dellʼequilibrio tra investimenti e fonti di fi nanziamento, nel medio lungo periodo e nel breve periodo. Inoltre, detti indici premettono di valutare anche la sostenibilità fi nanziaria del ciclo aziendale, con una particolare attenzione alla ca-pacità delle imprese analizzate di far fronte al rimborso dellʼindebitamento. È altresì da notare come dette analisi, che sono applicate ad un bilancio riclassifi cato di una società di capitali, possono trovare applicazione anche in ambito di analisi di gruppi aziendali, società cooperative e ad imprese individuali, pur con gli opportuni adat-tamenti degli indici utilizzati alle realtà aziendali così differenziate per parametri gestionali e disponibilità delle fonti informative.
3. Lʼimpresa campione
La verifi ca della signifi catività delle analisi proposte è stata eseguita su unʼimpresa agraria campione, con produzioni vegetali e produzioni zootecniche, tra cui allevamento bovino da latte, latte trasformato nel caseifi cio aziendale ed alleva-mento di suini. L impresa ha forma giuridica di società di capitali, con conseguente obbligo annuale di deposito del bilancio dʼesercizio presso il Registro delle Imprese. Il bilancio dʼesercizio, comprensivo di stato patrimoniale, conto economico e nota integrativa, e completo degli allegati, quali verbale assembleare di approvazione di bilancio, relazione sulla gestione e relazione del collegio sindacale, è la base delle analisi condotte. Per quanto riguarda lʼorizzonte temporale, lʼanalisi ha interessato una serie storica decennale, con periodo di riferimento compreso tra lʼesercizio 1995 e lʼesercizio 2004. La serie storica decennale è stata suddivisa in due serie storiche quinquennali, relative al primo ed al secondo quinquennio. I dati degli esercizi sino al 2001, originariamente espressi in Lire italiane, sono convertiti in Euro sulla base del tasso di conversione tra Lira italiana ed Euro. I dati sono espressi in valori correnti.
4. Lʼanalisi dei dati economici
Relativamente allʼanalisi dei dati economici dellʼimpresa, il punto di par-tenza è dato dal valore dei ricavi delle vendite e delle prestazioni, voce A1) del con-to economico civilistico, espressivo del fatturato dellʼimpresa. Detta voce è pari in media a 1,525 milioni di Euro annui, con una deviazione standard nel decennio di 261mila Euro, pari al 17,13% della voce stessa. Da rilevare una contrazione del fat-turato nel corso del decennio, con media del primo quinquennio pari a 1,567 milioni di Euro annui e media del secondo quinquennio pari a 1,483 milioni di Euro annui. Il fatturato incide mediamente per il 92,85% del valore della produzione, comprenden-do in tale aggregato, in concordanza con la notazione civilistica, la variazione delle scorte di prodotti in corso di lavorazione, semilavorati e prodotti fi niti, espressiva di
274
Ann. Fac. Medic. Vet. di Parma (Vol. XXV, 2005) - pag. 269 - pag. 292
voci di variazione di scorte che subiscono trasformazione interna allʼimpresa. Il valo-re della produzione è pari in media a 1,665 milioni di Euro annui, con una deviazione standard nel decennio di 227mila Euro, pari al 13,60% della voce stessa, inferiore quindi alla deviazione standard fatta rilevare dal fatturato. Da rilevare, peraltro, una contrazione anche del valore della produzione nel corso del decennio, con media del primo quinquennio pari a 1,749 milioni di Euro annui e media del secondo quin-quennio pari a 1,582 milioni di Euro annui. La voce degli altri ricavi e proventi, voce A5) del conto economico civilistico, è stata considerata tra le componenti positive del reddito dʼesercizio non tipiche e quindi non riclassifi cata quale componente del valore della produzione.
Per quanto riguarda i costi esterni della produzione, della gestione tipica, questi sono suddivisi in costi per acquisto di materie prime, costi per servizi e costi per godimento di beni di terzi, voci B6), B7) e B8) del conto economico civilistico, ed incluse nella macro classe B) del conto economico civilistico, tra i costi di produzio-ne. Secondo le indicazioni del legislatore civilistico, tra i costi esterni di produzione sono state classifi cate anche le variazioni delle materie prime, sussidiare, di consumo e merci, espressive di voci di costo relative a scorte che non subiscono trasformazio-ne interna allʼazienda, voce B11) del conto economico civilistico. Nel complesso, i costi esterni di produzione, sono pari in media a 880mila Euro annui, con una devia-zione standard nel decennio di 83mila Euro, pari al 9,29% della voce stessa. I costi di produzione appaiono in crescita, con una tendenza differente rispetto al valore della produzione. La media dei costi esterni di produzione del primo quinquennio è pari a 861mila Euro annui, mentre nel secondo quinquennio è pari a 900mila Euro annui. I costi esterni di produzione sono pari al 53,53% del valore della produzione nella me-dia del decennio, con un incremento dal 50,03% del primo quinquennio, al 57,06% del secondo quinquennio. Gran parte dei costi esterni di produzione sono relativi ad acquisto di materie prime, sussidiare, di consumo e merci, tra cui prevalgono i costi per alimentazione zootecnica, costi per sementi, diserbanti e fertilizzanti. Un certo peso è poi assunto nei costi per servizi tra cui le lavorazioni in conto terzi relative alla coltivazione dei campi e le spese veterinarie. Modesto infi ne il peso dei costi per godimento di beni di terzi, per lʼassenza di beni in leasing, e per la modesta presenza di oneri per affi tti. Al riguardo è da notare come, nellʼimpresa oggetto di analisi, sia modesto il peso degli affi tti in quanto i fabbricati ed i terreni utilizzati nel ciclo pro-duttivo sono in gran parte detenuti a titolo in proprietà.
Sottraendo dal valore della produzione i costi esterni di produzione si pervie-ne al valore aggiunto, margine economico intermedio che evidenzia il valore genera-to dalle trasformazioni effettuate dallʼazienda ed evidenzia altresì il margine disponi-bile per la remunerazione dei fattori interni di produzione. Il valore aggiunto è pari al 46,46% del valore della produzione nella media del decennio, con una diminuzione marcata, dal 59,97% del primo quinquennio al 42,94% del secondo quinquennio. Emerge quindi come circa la metà dei costi sostenuti dallʼimpresa siano fi nalizzati alla remunerazione di fattori di produzione reperiti esternamente allʼazienda stessa, mentre la restante metà dei costi è destinata alla remunerazione di fattori interni di produzione tra cui lavoro, investimenti in attività immobilizzate e capitale di terzi e proprio. Peraltro, nel corso del decennio oggetto di analisi, lʼeffetto congiunto di

275
Ann. Fac. Medic. Vet. di Parma (Vol. XXV, 2005) - pag. 269 - pag. 292
una diminuzione del valore della produzione ed un incremento dei costi esterni di produzione ha determinato la diminuzione del valore aggiunto, determinando quindi una diminuzione del margine disponibile per la remunerazione dei fattori interni di produzione tra cui, tra gli altri, il capitale apportato dai soci.
Per quanto riguarda i fattori interni di produzione il maggior costo è quello relativo alla remunerazione del personale dipendente, voce che comprende il costo del personale assunto con contratto a tempo indeterminato ed il costo del personale assunto a tempo determinato, come personale avventizio. Il costo del personale è pari al 28,59% del totale del valore della produzione, con un incremento nel corso del decennio considerato. Il costo del personale passa infatti dal 26,65% del valore della produzione per il primo quinquennio al 30,53% del valore della produzione per il secondo quinquennio. Il peso degli accantonamenti per rischi e altri accantonamenti è pari al 2,21% del valore della produzione, con accantonamenti concentrati solo nel primo quinquennio di analisi.
Sottraendo al valore aggiunto questo secondo aggregato di costi si ottiene il Margine operativo lordo (Mol), defi nito in terminologia anglosassone Ebitda. Detto margine esprime il margine disponibile per la remunerazione dei fattori di produzio-ne fi ssi tra cui attività immobilizzate e capitale, proprio e di terzi. Il Margine operati-vo lordo è pari al 15,65% del valore della produzione in media nel decennio, con una contrazione dal 18,90% del primo quinquennio al 12,41% del secondo quinquennio. Il valore appare piuttosto modesto, in quanto indica come solo il 15,65% del valore della produzione è disponibile per la remunerazione degli investimenti in attività im-mobilizzate, attraverso lo stanziamento degli ammortamenti, e per la remunerazione dei capitali, di terzi e propri, attraverso il pagamento degli interessi passivi sul debito, e mediante la distribuzione o il reinvestimento del risultato dʼesercizio.
Sottraendo dal Margine operativo lordo il peso degli ammortamenti e delle svalutazioni, pari al 4,07% del valore della produzione, si perviene al risultato della gestione tipica, che è pari allʼ11,59% del valore della produzione.
Sommando algebricamente al risultato della gestione tipica il saldo delle gestione accessorie, cioè la somma algebrica delle voci del conto economico civili-stico “altri ricavi e proventi”, con segno positivo, e “oneri diversi di gestione”, con segno positivo, del valore della produzione, si perviene al reddito operativo, defi nito in terminologia anglosassone Ebit. Il reddito operativo è pari al 21,89% del valore della produzione nella media del decennio, anche in questo caso con una contrazione dal 25,15% del valore della produzione nel primo quinquennio, al 18,46% del valore della produzione nel secondo quinquennio. Dai dati emerge come nella formazio-ne del reddito operativo abbiano un peso rilevante i saldi delle gestioni accessorie. Infatti, la voce “altri ricavi e proventi” incide, con segno positivo, per il 19,64% in media nel decennio in rapporto al valore della produzione, mentre la voce relativa agli “oneri diversi di gestione” incide, con segno negativo, per il 9,43% in media nel decennio in rapporto al valore della produzione. Da notare come, nella voce “altri ricavi e proventi”, i contributi pubblici abbiano un peso importante, pari al 45,11% di detta voce, e pari al 7,03% del totale del valore della produzione. Il peso della contri-buzione pubblica sul valore della produzione fa segnare un incremento nel corso del decennio analizzato. Nel conto economico il peso della contribuzione pubblica passa

276
Ann. Fac. Medic. Vet. di Parma (Vol. XXV, 2005) - pag. 269 - pag. 292
dal 4% del valore della produzione circa del primo quinquennio di analisi al 10% del valore della produzione circa del secondo quinquennio di analisi. La crescita della contribuzione pubblica, in una situazione di sostanziale stabilità del valore delle pro-duzione nel decennio considerato, è da ascrivere ad un incremento in valore assoluto della voce suddetta.
La riclassifi cazione del conto economico a valore aggiunto permette di con-siderare lʼeffetto sulla redditività aziendale dato dal saldo della gestione fi nanziaria, defi nito come somma algebrica dei proventi fi nanziari, degli oneri fi nanziari e del-lʼutile o perdita derivante dallʼoscillazione dei tassi di cambio. Il saldo della gestione fi nanziaria evidenzia, in sintesi, lʼeffetto sulla redditività aziendale delle scelte di fi nanziamento effettuate dalle aziende.
I dati analizzati mostrano come il saldo della gestione fi nanziaria incide in modo marcato sulla redditività dellʼimpresa oggetto di analisi. Infatti, il saldo della gestione fi nanziaria è negativo. Si tratta di una componente negativa di reddito, pari al 21,54% del valore della produzione, nella media del decennio. Il dato, che pur fa segnare una riduzione di incidenza dal 24,64% del valore della produzione per il pri-mo quinquennio al 18,43% del valore della produzione per il secondo quinquennio, ha tuttavia un effetto di incidenza importante sulla redditività aziendale. Infatti, il saldo delle gestione fi nanziaria è la terza voce per rilievo tra le componenti negative di reddito, dietro ai costi per acquisto di materie prime e dietro ai costi per il perso-nale.
Per quanto riguarda lʼeffetto sulla redditività aziendale derivante dalle retti-fi che di valore di attività fi nanziarie e del saldo delle partite straordinarie, emerge una sostanziale ininfl uenza di detti comparti gestionali, che incidono, con segno positivo, sulla redditività aziendale al di sotto dello 0,01% del valore della produzione in me-dia nel decennio.
Sommando algebricamente al reddito operativo i saldi della gestione fi nan-ziaria, delle rettifi che di valore di attività fi nanziarie e delle partite straordinarie, si perviene al risultato ante imposte, che è pari allo 0,26% del valore della produzione in media nel decennio, con una contrazione nel secondo quinquennio, in cui lʼutile ante imposte è mediamente pari allo 0,02% del valore della produzione, rispetto allo 0,49% del valore della produzione del primo quinquennio.
Sottraendo al risultato ante imposte gli oneri relativi alle imposte sul reddito dellʼesercizio, pari ad 1,25% del valore della produzione, si perviene ad un risultato dʼesercizio negativo, in media nel decennio, per lo 0,99% del valore della produ-zione, anche in questo caso con un peggioramento degli esiti reddituali nel secondo quinquennio, in cui la perdita dʼesercizio è mediamente pari allo 0,23% del valore della produzione, rispetto allʼ1,68% del valore della produzione del primo quinquen-nio. Al riguardo è da notare come, nel primo quinquennio, in due esercizi su cinque si rilevi una perdita dʼesercizio, mentre nel secondo quinquennio emerge un ulteriore peggioramento degli esiti reddituali, con una perdita dʼesercizio in quattro esercizi su cinque.

277
Ann. Fac. Medic. Vet. di Parma (Vol. XXV, 2005) - pag. 269 - pag. 292
5. Lʼanalisi per indici reddituali e di costo dellʼindebitamento
Dopo aver proceduto allʼanalisi del conto economico riclassifi cato, sempre in ambito di analisi della redditività aziendale, sono calcolati alcuni indici fi nalizzati al calcolo della redditività aziendale e del costo dellʼindebitamento. Il Roa assume un valore medio per il decennio di analisi del 4,96%. La deviazione standard del valore nel decennio è pari a 1,98%, pari al 39,87% del valore medio nel decennio stesso. Il valore dellʼindice nel primo quinquennio è pari al 6,28%, mentre il valore dellʼindice è pari al 3,64% nel secondo quinquennio. Il Roa evidenzia una redditività del complesso degli investimenti effettuati in impresa al di sotto del 5% annuo, un valore che remunera gli investimenti ad un livello di poco superiore rispetto ad un tasso risk free, quale, ad esempio, un tasso di rendimento dei titoli di stato. Inol-tre, dallʼanalisi emerge un peggioramento dellʼandamento reddituale della gestione aziendale nel corso del decennio, a conferma delle analisi effettuate relativamente al conto economico riclassifi cato. Il Roe assume un valore medio negativo per il decen-nio di analisi, pari allo 0,74%. La deviazione standard del valore nel decennio è pari a 1,49%, pari al 202,14% del valore medio nel decennio stesso. Il valore dellʼindice nel primo quinquennio è negativo, e pari allo 0,23%, mentre il valore dellʼindice, sempre con segno negativo, è pari ad 1,25% nel secondo quinquennio. Il Roe evidenzia una redditività negativa dei mezzi propri apportati dallʼimprenditore. In questo modo, il capitale proprio investito nellʼazienda, o reinvestito, non ha avuto remunerazione, ed è stato eroso dallʼesito della gestione aziendale, per tutto il corso del decennio, ad eccezione di tre soli esercizi, sui dieci considerati, in cui la gestione aziendale ha fatto registrare un utile dʼesercizio. Il Ros assume un valore medio per il decennio di ana-lisi del 24,55%. La deviazione standard del valore nel decennio è pari a 9,63%, pari al 39,23% del valore medio nel decennio stesso. Il valore dellʼindice nel primo quin-quennio è pari al 29,50%, mentre il valore dellʼindice è pari al 19,60% nel secondo quinquennio. Il Ros evidenzia una redditività del complesso delle vendite piuttosto elevata, pur con una contrazione nel secondo quinquennio di analisi. Peraltro, lʼesito gestionale netto, in termini di redditività aziendale, è fortemente penalizzato dal sal-do della gestione fi nanziaria, che erode integralmente redditività delle vendite.
Il Rod assume un valore medio per il decennio di analisi del 11,42%. La deviazione standard del valore nel decennio è pari a 4,48%, pari al 39,16% del va-lore medio nel decennio stesso. Il valore dellʼindice nel primo quinquennio è pari al 14,58%, mentre il valore dellʼindice è pari al 8,32% nel secondo quinquennio. Emer-ge un costo medio del debito molto elevato, in particolare nel primo quinquennio. Dallʼanalisi delle note integrative emerge infatti come lʼimpresa fa ricorso a forme tecniche di indebitamento molto costose, quali lo scoperto di conto corrente. Inol-tre, lʼelevato costo del debito può esprimere, in via indiretta, come lʼimpresa fosse giudicata dal sistema bancario impresa a rischio, con un costo dellʼindebitamento superiore di diversi punti percentuali rispetto al costo medio del debito negli anni considerati, ad esempio facendo ricorso ai tassi pubblicati dallʼAssociazione Ban-caria Italiana (ABI). Inoltre, il Rod è superiore al Roa di 6,49 punti percentuali in media nel decennio. In questo modo emerge come il costo del reperimento di denaro dal sistema bancario per il fi nanziamento dellʼattività aziendale è più oneroso rispetto

278
Ann. Fac. Medic. Vet. di Parma (Vol. XXV, 2005) - pag. 269 - pag. 292
alla redditività degli investimenti nellʼattività aziendale per effetto della gestione. Emerge quindi che, in una tale situazione, un aumento di investimenti fi nanziati con debito bancario determina un progressivo peggioramento degli esiti di gestione, per effetto del costo dellʼindebitamento superiore alla redditività degli investimenti, de-terminando quindi la non sostenibilità del ciclo aziendale con il ricorso al capitale di terzi oneroso, in una situazione di costanza dei parametri gestionali evidenziati. Proseguendo nellʼanalisi, per quanto riguarda il Turnover, cioè la rotazione del ca-pitale investito, questa è pari al 20,29% del fatturato. Il dato indica come il fatturato generato dallʼimpresa oggetto di analisi è pari al 20,29% degli investimenti. Dal dato emerge che lʼimpresa è di tipo capital intensive, con maggior valore dellʼinvestimen-to rispetto al fatturato. Il dato è confermato anche dallʼIntensità di capitale, infatti, il capitale investito è pari al 508,95% del fatturato. L intensità di capitale, calcolata come reciproco del Turnover, esprime il fatto che per generare 1 euro di fatturato sia necessario disporre di 5,09 euro di investimenti. L impresa oggetto di analisi necessi-ta quindi di grandi investimenti, in termini di attività immobilizzate e circolanti, per sostenere il ciclo delle vendite.
6. Lʼanalisi dei dati patrimoniali
Nellʼimpresa oggetto di analisi prevalgono gli investimenti in attività im-mobilizzate, in gran parte terreni e fabbricati, che sono pari, in media nel decennio considerato, al 57,90% degli investimenti effettuati in azienda. Il dato, sostanzial-mente stabile per tutto il decennio, ha una deviazione standard pari a 1,46%. Il dato evidenzia il peso degli investimenti, in particolare in attività immobilizzate, necessari per realizzare la produzione aziendale. Da notare come le vacche da latte presenti in azienda, secondo una metodologia prescritta dai principi contabili internazionali, sono classifi cate tra le attività immobilizzate. Gli investimenti in attività a breve sono pari, in media nel decennio considerato, al 42,10% degli investimenti effettuati in azienda. Il dato, anche in questo caso, è sostanzialmente stabile per tutto il decennio, con una deviazione standard sempre pari a 1,46%. Da notare come, tra le attività a breve, prevalga il peso delle scorte di magazzino, che rappresentano lʼ87,81% delle attività a breve, in media nel decennio considerato, ed il 36,90% del totale dellʼattivo investito. Al riguardo è da notare come lʼimpresa oggetto di analisi svolga anche at-tività di trasformazione casearia e quindi il peso del magazzino sia, in parte, dovuto alla presenza in impresa di formaggio in corso di stagionatura. Peraltro, nel caso in cui parte del formaggio in stagionatura dovesse essere posto in vendita oltre i 12 mesi, sarebbe anche opportuno riclassifi care detta posta di magazzino tra le attività immobilizzate, secondo una metodologia fi nanziaria di riclassifi cazione delle poste dellʼattivo di bilancio. In caso contrario è corretta la riclassifi cazione, anche dal punto di vista fi nanziario, tra le attività a breve termine. Da notare inoltre come gli animali da carne presenti in azienda, secondo una metodologia prescritta dai principi con-tabili internazionali, sono classifi cati tra le poste di bilancio del capitale circolante. Anche queste attività, ove lʼanimale fosse macellato oltre i 12 mesi, sono da riclas-sifi care dal punto di vista fi nanziario tra le attività immobilizzate. In caso contrario è

279
Ann. Fac. Medic. Vet. di Parma (Vol. XXV, 2005) - pag. 269 - pag. 292
corretta la classifi cazione tra le attività a breve termine.Per quanto riguarda il passivo di stato patrimoniale, questo è stato suddiviso
in mezzi propri (patrimonio netto) e mezzi di terzi. In media, nel decennio oggetto di analisi, i mezzi propri rappresentano il 29,55% delle fonti di fi nanziamento dellʼim-presa, mentre i mezzi di terzi rappresentano il 70,45% delle fonti di fi nanziamento dellʼimpresa. I mezzi di terzi a breve rappresentano il 49,38% delle fonti di fi nan-ziamento dellʼimpresa, mentre i mezzi terzi consolidati sono il 21,07% delle fonti di fi nanziamento dellʼimpresa. Nel complesso il totale delle fonti di fi nanziamento stabilmente al servizio dellʼazienda, cioè la somma dei mezzi propri e dei mezzi terzi consolidati, rappresentano il 50,62% del totale delle fonti di fi nanziamento, mentre i mezzi di terzi a breve rappresentano il 49,38% del totale delle fonti di fi nanziamento. Nel corso del decennio analizzato, emerge un cambiamento nelle scelte di fi nanzia-mento, come evidenziato anche nelle note integrative e nelle relazioni accompagna-torie ai bilanci. Infatti, a fronte degli investimenti in attività immobilizzate, lʼimpresa sposta il proprio indebitamento dal breve al medio lungo periodo al fi ne di perseguire una maggior coerenza, in termini di allineamento temporale, tra investimenti in attivi-tà immobilizzate e relative coperture fi nanziarie, effettuate con passività consolidate e patrimonio netto. Infatti, nel primo quinquennio i mezzi di terzi a breve sono pari al 53,53% delle fonti di fi nanziamento, mentre i mezzi di terzi a medio lungo sono pari al 14,04% delle fonti di fi nanziamento, mentre nel secondo quinquennio i mezzi di terzi a breve sono pari al 45,69% delle fonti di fi nanziamento, mentre i mezzi di terzi a medio lungo sono pari al 27,31% delle fonti di fi nanziamento. In questa dinamica il peso dei mezzi sul totale delle fonti di fi nanziamento scende dal 32,42% al 26,99%. È altresì da notare come lʼinvestimento complessivo passi da 7,113 milioni di Euro medi del primo quinquennio a 8,003 milioni di Euro medi del secondo quinquennio. Questo comporta un aumento di investimenti di circa 0,9 milioni di Euro, integral-mente fi nanziato con mezzi di terzi. Tra le voci di mezzi di terzi, in dettaglio, si evi-denziano in particolare, per il loro rilievo un incremento dei mutui passivi bancari, con scadenza oltre 12 mesi, che passano da 653 mila Euro nel primo anno di analisi, a 1,788 milioni di Euro nellʼultimo anno di analisi. Inoltre, dal bilancio emerge anche un fi nanziamento da soci allʼazienda, a partire dal terzo anno, con importo iniziale di 516 mila Euro, che si assesta a 804 mila Euro nellʼultimo anno di analisi.
7. Lʼanalisi per indici di struttura patrimoniale e fi nanziaria
Proseguendo lʼanalisi dal punto di vista della situazione della struttura pa-trimoniale è stato calcolato il Leverage, indice che esprime il rapporto di equilibrio strutturale fra il totale degli investimenti ed i mezzi propri. L indice assume valore medio pari a 339,50% ed indica quindi come il totale degli investimenti sia pari al 339,50% del valore dei mezzi propri. Il Quoziente di indebitamento, che esprime il rapporto fra i mezzi di terzi ed i mezzi propri, assume valore medio pari a 239,50%, ed indica quindi come il totale degli investimenti sia pari al 239,50% del valore dei mezzi propri. Entrambi gli indici evidenziano un progressivo aumento nel corso del decennio, esprimendo quindi un incremento del livello dellʼindebitamento, determi-

280
Ann. Fac. Medic. Vet. di Parma (Vol. XXV, 2005) - pag. 269 - pag. 292
nato da un incremento degli investimenti nellʼimpresa non supportati da fl ussi di utili reinvestiti o da nuovi apporti dei soci in termini di patrimonio netto. Questa situazione determina la necessità di far ricorso a capitale di terzi per fi nanziare il ciclo aziendale incrementando, di conseguenza, il livello di indebitamento.
L equilibrio fi nanziario di breve periodo è analizzato mediante una coppia di indici che esprimono il rapporto di equilibrio di breve periodo tra attività investite e fonti di fi nanziamento. Al riguardo lʼIndice di liquidità corrente, che esprime il rapporto fra investimenti a breve e mezzi di terzi a breve, assume un valore medio di 85,59% nel decennio ed indica come, in media, gli investimenti a breve siano pari allʼ85,59% delle fonti di fi nanziamento a breve. L indice mostra un incremento nel corso del decennio a confermare il già rilevato miglioramento dellʼequilibrio fi nan-ziario tra investimenti e fonti di fi nanziamento, in termini di allineamento temporale delle relative scadenze. Sempre per quanto riguarda il rapporto di equilibrio di breve periodo tra attività investite e fonti di fi nanziamento lʼIndice di liquidità immediata, che esprime il rapporto fra investimenti a breve, al netto delle scorte di magazzino, ed i mezzi di terzi a breve, assume un valore medio di 10,71% nel decennio ed in-dica come, in media, gli investimenti a breve, senza considerare il magazzino, siano pari al 10,71% delle fonti di fi nanziamento a breve. L indice, che pur evidenzia un incremento nel corso del decennio, conferma lʼinfl uenza delle scorte di magazzino sullʼequilibrio fi nanziario di breve termine.
Alcune notazioni ulteriori vengono dallʼanalisi per margini di stato patri-moniale. Il Margine di struttura totale, calcolato in relazione ai mezzi propri ed ai mezzi di terzi consolidati, espressivo della capacità dellʼimpresa di fi nanziare le atti-vità immobilizzate con fonti di fi nanziamento stabilmente al servizio dellʼattività di impresa, è negativo per 550 mila Euro in media nel decennio. Emerge quindi il fatto che lʼimpresa oggetto di analisi non fi nanzi gli investimenti in attività immobilizzate con fonti di fi nanziamento consolidate, date dai mezzi propri e dai mezzi di terzi consolidati, indicando quindi una non coerenza tra investimenti effettuati e scadenza temporale delle fonti di fi nanziamento utilizzate per la loro copertura fi nanziaria. L indice esprime tuttavia un miglioramento nel corso del decennio, confermando un progressivo aumento della coerenza nellʼallineamento temporale tra investimenti e fonti di fi nanziamento. Infatti, nel primo quinquennio il Margine di struttura totale ha valore negativo per 878 mila Euro in media, mentre nel secondo quinquennio il Mar-gine di struttura totale ha valore negativo per 223 mila Euro, con una riduzione del disavanzo per 655 mila Euro. Anche il Margine di tesoreria calcolato come differenza tra attivo a breve, al netto delle scorte di magazzino, e passivo a breve, è negativo, per 3,337 milioni di Euro in media nel decennio. Emerge quindi il fatto che lʼimpresa oggetto di analisi presenti un notevole indebitamento nel breve periodo, in confronto con gli investimenti a breve. Il Margine esprime tuttavia un miglioramento nel corso del decennio confermando un miglioramento, anche nella dinamica fi nanziaria di breve periodo, in termini di coerenza nellʼallineamento temporale tra investimenti e fonti di fi nanziamento. Infatti nel primo quinquennio il Margine di tesoreria ha valore negativo per 3,513 milioni di Euro in media, mentre nel secondo quinquennio il Margine di tesoreria totale ha valore negativo per 3,161 milioni, con una riduzione del disavanzo per 352 mila Euro. Il dato evidenzia lʼesposizione fi nanziaria del breve

281
Ann. Fac. Medic. Vet. di Parma (Vol. XXV, 2005) - pag. 269 - pag. 292
periodo con notevole peso dei debiti a breve, in particolare debiti verso banche e de-biti verso fornitori, in rapporto ai crediti a breve ed alle disponibilità liquide.
8. Lʼanalisi di sostenibilità del ciclo aziendale
Alcune note merita anche il livello della posizione debitoria verso il sistema bancario espressa dalla Posizione fi nanziaria netta (Pfn), data dalla differenza fra le liquidità immediate ed i debiti fi nanziari, base di partenza per lʼanalisi di sostenibi-lità del ciclo aziendale. La Posizione fi nanziaria netta media dellʼimpresa oggetto di analisi esprime un elevato livello di indebitamento, considerando che la Posizione fi nanziaria netta media nel decennio è pari al 43,12% dellʼattivo investito medio nel decennio. Inoltre la Posizione fi nanziaria netta media nel decennio è pari al 220,48% del fatturato medio nel decennio. Entrambi gli indici mostrano il livello di indebita-mento elevato e crescente nel corso del decennio oggetto di analisi.
L analisi della posizione debitoria dellʼimpresa oggetto di analisi consente alcune ulteriori rifl essioni in merito alla sostenibilità dal punto di vista economico e dal punto di vista fi nanziario del ciclo aziendale, oltre che alcune rifl essioni sulla valutazione degli investimenti effettuati in azienda.
Per quanto riguarda la valutazione di sostenibilità del ciclo aziendale sono considerati alcuni indici, espressivi della capacità dellʼimpresa di generare reddito e fl ussi fi nanziari in grado di coprire il costo dellʼindebitamento e restituire il debito. Al riguardo lʼanalisi parte dal rapporto tra Ebitda e oneri fi nanziari, che è inferiore allʼunità in media nel decennio, ed indica che lʼimpresa non è stata in grado di pagare gli oneri fi nanziari a servizio del debito con i fl ussi di reddito al netto di interessi, imposte, ammortamenti e svalutazioni. Il rapporto tra Ebit e oneri fi nanziari è di poco superiore allʼunità, in media nel decennio, ed indica che lʼimpresa è stata in grado di pagare gli oneri fi nanziari a servizio del debito con i fl ussi di reddito al netto degli interessi e imposte, ma non è in grado di rimborsare la quota capitale del debito con-tratto. Detta capacità di pagamento degli oneri fi nanziari deriva dal risultato positivo delle gestioni accessorie, tra cui i proventi derivanti da contributi pubblici, senza i quali lʼimpresa oggetto di analisi non sarebbe stata in grado di pagare gli interessi sul debito contratto. Per quanto riguarda la capacità di rimborso del debito è stato posto a confronto il cash fl ow con gli oneri fi nanziari, con la Posizione fi nanziaria netta e con il totale attivo, cioè il totale degli investimenti effettuati in azienda. Dallʼanalisi emerge come il cash fl ow sia pari al 23,68% circa degli oneri fi nanziari in media nel decennio. Il dato evidenzia come il fl usso di cassa disponibile per pagare gli interes-si sul debito sia pari al solo 23,68% degli interessi stessi. Infatti, buona parte delle risorse generate dalla gestione reddituale sono assorbite dagli investimenti effettuati in azienda e quindi non disponibili per il pagamento degli interessi sul debito. Detta dinamica ha imposto allʼimpresa un progressivo aumento dellʼindebitamento, tra cui un ricorso allʼapporto dei soci in forma di fi nanziamento da soci, per la copertura del disavanzo di gestione.
Per quanto riguarda il rapporto tra cash fl ow e Posizione fi nanziaria netta e tra cash fl ow e totale attivo, emerge che il cash fl ow è pari al 2,78% circa della Po-

282
Ann. Fac. Medic. Vet. di Parma (Vol. XXV, 2005) - pag. 269 - pag. 292
sizione fi nanziaria netta in media nel decennio, mentre il cash fl ow è pari allʼ1,19% circa del totale attivo in media nel decennio. Il dato mette in luce come il fl usso di cassa sia modesto rispetto allʼindebitamento ed al totale degli investimenti. Infat-ti, anche senza considerare il costo dellʼindebitamento dato dagli interessi passivi, emerge come su dati medi del decennio lʼimpresa oggetto di analisi avrebbe necessità di circa 36 anni per restituire lʼindebitamento accumulato, in ipotesi di costanza dei fl ussi di cassa, redditività degli investimenti, costo dellʼindebitamento e ammontare dellʼindebitamento.
Per quanto riguarda la capacità di sostenere fi nanziariamente il ciclo azien-dale sono considerati ulteriori tre indicatori. Il primo indicatore è relativo alla capaci-tà di sostenere fi nanziariamente il ciclo aziendale ed è dato dal rapporto tra cash fl ow e Posizione fi nanziaria netta, a sua volta rapportato al costo del debito. Il rapporto tra cash fl ow e Posizione fi nanziaria netta esprime quanta parte del debito fi nanziario è possibile rimborsare nel corso dellʼesercizio. Nel caso analizzato, in cui detto valore è inferiore al costo del debito, lʼimpresa non è in grado di pagare gli interessi sul debito e nemmeno procedere al rimborso in linea capitale del debito fi nanziario. I dati confermano, unitamente al rapporto tra cash fl ow e oneri fi nanziari, come lʼim-presa non sia in grado di rimborsare il debito fi nanziario, in ipotesi di costanza dei fl ussi di cassa, redditività degli investimenti, costo dellʼindebitamento e ammontare dellʼindebitamento, ed anzi debba far ricorso a debito aggiuntivo per il pagamento degli interessi passivi sul debito fi nanziario, come evidenziato anche dal rapporto tra cash fl ow e oneri fi nanziari inferiore allʼunità. Il secondo indicatore relativo alla capacità di sostenere fi nanziariamente il ciclo aziendale è dato dalla rappresentazione in coppia di valori ascisse/ordinate della variazione dellʼattivo investito e del cash fl ow, esprime la capacità dellʼimpresa di generare fl ussi fi nanziari suffi cienti a ga-rantire la sostenibilità del ciclo aziendale. I dati illustrano come lʼimpresa oggetto di analisi abbia fatto registrare tre esercizi di surplus fi nanziario e sei esercizi di defi cit fi nanziario. Il dato è confermato anche dallʼandamento del fl usso fi nanziario annuo al netto dellʼinvestimento incrementale, cioè come fl usso di cassa al netto della va-riazione annua dellʼinvestimento in azienda, che indica come in soli tre esercizi il fl usso di cassa sia stato superiore allʼincremento dellʼinvestimento in azienda. Il terzo indicatore, relativo alla capacità di sostenere fi nanziariamente il ciclo aziendale, è dato dal rapporto redditività dellʼattivo investito e costo dellʼindebitamento fi nan-ziario. Detto rapporto esprime la capacità dellʼimpresa di sostenere un incremento dellʼindebitamento grazie ai fl ussi di reddito derivanti dallʼinvestimento in azienda. L indice evidenzia come in tutti gli esercizi considerati il costo dellʼindebitamento sia stato superiore alla redditività dei capitali investiti in azienda.
9. Conclusioni
Dallʼanalisi per indici emerge la possibilità di confrontare imprese attive in agricoltura mediante indicatori sintetici di redditività aziendale, struttura patrimonia-le e sostenibilità fi nanziaria degli investimenti tra loro e con imprese di altri settori.

283
Ann. Fac. Medic. Vet. di Parma (Vol. XXV, 2005) - pag. 269 - pag. 292
Si è così pervenuti alla identifi cazione di un insieme di indici di bilancio, applicati e verifi cati su una serie di dati aziendali di unʼimpresa agraria, con forma giuridica di società di capitali.
Le analisi effettuate, nel caso in esame, evidenziano una redditività azien-dale modesta, con rilievo dei contributi pubblici nella formazione del reddito, cui si accompagna un peso notevole, sulla redditività aziendale, degli oneri fi nanziari. In particolare il risultato dʼesercizio è modesto e in diversi esercizi negativo, con margi-ni reddituali intermedi quali valore aggiunto, Ebitda ed Ebit non elevati ed espressivi di una scarsa capacità di remunerare gli investimenti effettuati. Il dato che spicca è anche quello relativo al peso degli oneri fi nanziari, elemento dovuto ad un livello di indebitamento che, pur non elevato in assoluto, risente di un costo unitario del debito elevato e di scelte di forme tecniche di indebitamento spesso non coerenti, dal punto di vista dellʼallineamento temporale, con gli investimenti effettuati.
I dati patrimoniali evidenziano peraltro un indebitamento crescente, unito alla necessità di elevati investimenti in azienda, con unʼintensità di capitale di gran lunga superiore a quella rilevata in altri settori. La necessità di investimenti, il costo dellʼindebitamento ed i fl ussi di cassa modesti rendono, nel caso analizzato, non so-stenibile lʼattività aziendale senza il ricorso a ulteriori capitali apportati dai soci che, peraltro, sono remunerati ad un livello molto modesto e, in svariati esercizi, in modo negativo con perdita di parte del capitale investito.
Le analisi evidenziano come lʼimpresa oggetto di analisi non sia in grado di generare i fl ussi di cassa per restituire lʼindebitamento e nemmeno per pagare gli oneri fi nanziari in diversi esercizi della serie storica considerata. Inoltre il risultato reddituale mostra un peggioramento negli anni oggetto di analisi, con esiti peggiori nel secondo quinquennio rispetto al primo quinquennio, con investimenti crescenti nel ciclo aziendale che non trovano remunerazione dal punto di vista reddituale e non sono sostenibili dal punto di vista fi nanziario, senza ulteriore ricorso a fonti esterne di fi nanziamento. Infatti lʼimpresa, per generare un valore della produzione sostan-zialmente stabile, deve ricorrere ad ulteriori investimenti che, in assenza di fl ussi di cassa, vengono fi nanziati con un aumento dellʼindebitamento.
L analisi effettuata mette in luce lʼopportunità dellʼutilizzo degli strumenti dellʼanalisi gestionale, con unʼattenzione particolare alla scelta e allʼapplicazione di opportuni indici di analisi delle redditività degli investimenti, di solidità patrimoniale e sostenibilità del ciclo fi nanziario aziendale.
Detti indici, inoltre, possono essere utilizzati anche per analisi riferite a gruppi aziendali, società cooperative ed imprese individuali, prevedendo opportuni adattamenti nella loro applicazione per parametri gestionali e disponibilità delle fonti informative.

284
Ann. Fac. Medic. Vet. di Parma (Vol. XXV, 2005) - pag. 269 - pag. 292
Indici reddituali
ROA (reddito operativo/totale attivo)
ROE (risultato d'esercizio/patrimonio netto)
ROS (reddito operativo/fatturato)
Indici di costo dell'indebitamento
ROD (saldo gestione finanziaria/posizione finanziaria netta)
Indici di rotazione del capitale
Turnover (fatturato/totale attivo)
Intensità di capitale (totale attivo/fatturato)
Indici patrimoniali
Quoziente di indebitamento (mezzi di terzi/patrimonio netto)
Leverage (totale passivo/patrimonio netto)
Indice di liquidità corrente (attivo a breve/mezzi di terzi a breve)
Indice di liquidità immediata (attivo a breve al netto del magazzino/mezzi di terzi a breve)
Margini di bilancio
Margine di struttura (mezzi propri + mezzi di terzi consolidati - attività immobilizzate)
Margine di tesoreria (attivo a breve - magazzino - mezzi di terzi a breve)
Indici di sostenibilità del ciclo aziendale
PFN (Valore assoluto)/totale attivo
PFN (Valore assoluto)/fatturato
EBITDA / OF (valore assoluto)
EBIT / OF (Valore assoluto)
Cash Flow / OF (Valore assoluto)
Cash Flow / PFN (Valore assoluto)
Cash Flow / Totale attivo
Indici di sostenibilità del rimborso del debito
(Cash Flow / PFN in valore assoluto) / Totale attivo
Indici di sostenibilità dell'investimento incrementale
Variazione dell'investimento - Cash flow
Indici di sostenibilità dell'indebitamento incrementale
Roa/Rod
Tab. 1 - Indici e margini di bilancio

285
Ann. Fac. Medic. Vet. di Parma (Vol. XXV, 2005) - pag. 269 - pag. 292
attivo
Disponibilità di magazzino
Liquidità differite
Liquidità immediate
Attivo a breve
Totale immobilizzazioni immateriali nette
Totale immobilizzazioni materiali nette
Totale immobilizzazioni nanziarie
Totale crediti immobilizzati
Attivo immobilizzato
Totale attivo
passivo
Obbligazioni ed Obbligazioni Convertibili entro 12 mesi
Debiti verso soci per nanziamenti entro 12 mesi
Debiti verso banche entro 12 mesi
Debiti verso altri nanziatori entro 12 mesi
Acconti e Debiti verso fornitori entro 12 mesi
Debiti rappresentati da titoli di credito entro 12 mesi
Debiti verso imprese controllate, collegate e controllanti entro 12 mesi
Debiti tributari e Debiti verso istituti di previdenza e sicurezza sociale entro 12 mesi
Altri debiti entro 12 mesi
Totale debiti a breve termine
Ratei e risconti passivi
Mezzi di terzi a breve
Fondi per rischi ed oneri
Fondo Tfr
Obbligazioni ed Obbligazioni Convertibili oltre 12 mesi
Debiti verso soci per nanziamenti oltre 12 mesi
Debiti verso banche oltre 12 mesi
Debiti verso altri nanziatori oltre 12 mesi
Acconti e Debiti verso fornitori oltre 12 mesi
Debiti rappresentati da titoli di credito oltre 12 mesi
Debiti verso imprese controllate, collegate e controllanti oltre 12 mesi
Debiti tributari e Debiti verso istituti di previdenza e sicurezza sociale oltre 12 mesi
Altri debiti oltre 12 mesi
Mezzi di terzi consolidati
Patrimonio netto
Totale passivo
Tab. 2 - Stato patrimoniale riclassifi cato

286
Ann. Fac. Medic. Vet. di Parma (Vol. XXV, 2005) - pag. 269 - pag. 292
Tab. 3 - Conto economico riclassifi cato a valore aggiunto
Ricavi delle vendite e delle prestazioni
Variazioni rimanenze di prodotti in corso di lavorazione..
Valore della produzione
Variazione delle materie prime, sussidiarie, di consumo…
Costi per materie prime, sussidiarie, di consumo…
Consumo materie prime
MARGINE SULLA MATERIA PRIMA
Costi per servizi
Costi per godimento di beni di terzi
Costi esterni di produzione
VALORE AGGIUNTO
Costi per il personale
Accantonamento per rischi e Altri accantonamenti
Costo del lavoro ed accantonamenti
EBITDA - MARGINE OPERATIVO LORDO - MOL
Ammortamenti e svalutazioni
RISULTATO DELLA GESTIONE TIPICA
Altri ricavi e proventi
Oneri diversi di gestione
Saldo gestioni accessorie
EBIT - REDDITO OPERATIVO
Proventi da partecipazione
Altri proventi finanziari
Totale proventi finanziari
Interessi e altri oneri finanziari
Totale oneri finanziari
Utili e perdite su cambi
Saldo gestione finanziaria
Rivalutazioni
Svalutazioni
Saldo rettifiche di valori di attività finanziarie
Proventi straordinari
Oneri straordinari
Saldo gestione straordinaria
Risultato ante imposte
Imposte reddito d'esercizio, correnti, differite…
Risultato d'esercizio

287
Ann. Fac. Medic. Vet. di Parma (Vol. XXV, 2005) - pag. 269 - pag. 292
Pri
mo
qu
inq
ue
nn
ioS
ec
on
do
qu
inq
ue
nn
ioTo
tale
de
ce
nn
io
Att
ivo a
bre
ve
41,19%
42,91%
42,10%
Att
ivo im
mobili
zzato
58,81%
57,09%
57,90%
Tota
le a
ttiv
o100,0
0%
100,0
0%
100,0
0%
Mezzi di te
rzi a b
reve
53,53%
45,69%
49,38%
Mezzi di te
rzi consolid
ati
14,04%
27,31%
21,07%
Patr
imonio
nett
o32,43%
26,99%
29,55%
Tota
le p
assiv
o100,0
0%
100,0
0%
100,0
0%
Tab.
4 -
Sta
to p
atri
mon
iale
ric
lass
ifi ca
to in
val
ori p
erce
ntua
li -
ana
lisi
azi
enda
le
Pri
mo
qu
inq
ue
nn
ioS
ec
on
do
qu
inq
ue
nn
ioTo
tale
de
ce
nn
io
Fatt
ura
to91,26%
94,43%
92,85%
Valo
re d
ella
pro
duzio
ne
100,00%
100,00%
100,00%
Cost
i est
ern
i della
pro
duzio
ne
-50,03%
-57,06%
-53,54%
Valo
re a
ggiu
nto
49,97%
42,94%
46,46%
EBIT
DA
- M
OL (
marg
ine o
pera
tivo lord
o)
18,90%
12,41%
15,65%
EBIT
- R
eddit
o o
pera
tivo
25,13%
18,46%
21,79%
Sald
o d
ella
gest
ione
nanzia
ria
-24,64%
-18,43%
-21,54%
Ris
ult
ato
d'e
serc
izio
-0,30%
-1,68%
-0,99%
Tab.
5 -
Con
to e
cono
mic
o ri
clas
sifi c
ato
in v
alor
i per
cent
uali
- a
nali
si a
zien
dale

288
Ann. Fac. Medic. Vet. di Parma (Vol. XXV, 2005) - pag. 269 - pag. 292
Tab.
6 -
Ind
ici e
mar
gini
di b
ilan
cio
- an
alis
i azi
enda
le
Pri
mo
qu
inq
ue
nn
ioS
ec
on
do
qu
inq
ue
nn
ioTo
tale
decen
nio
Ind
ici
red
dit
ua
li
RO
A (
reddito o
pera
tivo/tota
le a
ttiv
o)
6,2
8%
3,6
4%
4,9
6%
RO
E (
risultato
d'e
serc
izio
/patr
imonio
netto)
-0,2
3%
-1,2
5%
-0,7
4%
RO
S (
reddito o
pera
tivo/fattura
to)
29,5
0%
19,6
0%
24,5
5%
Ind
ici
di
co
sto
de
ll'in
de
bit
am
en
to
RO
D (
sald
o g
estione f
inanzia
ria/p
osiz
ione f
inanzia
ria n
etta)
14,5
8%
8,3
2%
11,4
5%
Ind
ici
di
rota
zio
ne
de
l c
ap
ita
le
Turn
over
(fattura
to/tota
le a
ttiv
o)
21,9
7%
18,6
0%
20,2
9%
Inte
nsità d
i capitale
(to
tale
attiv
o/fattura
to)
465,0
4%
552,8
7%
508,9
5%
Ind
ici
pa
trim
on
iali
Quozie
nte
di in
debitam
ento
(m
ezzi di te
rzi/patr
imonio
netto)
208,4
9%
270,5
1%
239,5
0%
Levera
ge (
tota
le p
assiv
o/p
atr
imonio
netto)
308,4
9%
370,5
1%
339,5
0%
Indic
e d
i liq
uid
ità c
orr
ente
(attiv
o a
bre
ve/m
ezzi di te
rzi a b
reve)
77,2
4%
94,1
5%
85,6
9%
Indic
e d
i liq
uid
ità im
media
ta (
attiv
o a
bre
ve a
l netto d
el m
agazzin
o/m
ezzi di te
rzi a b
reve)
7,6
5%
13,7
6%
10,7
1%
Ma
rgin
i d
i b
ila
nc
io
Marg
ine d
i str
uttura
(m
ezzi pro
pri +
mezzi di te
rzi consolid
ati -
attiv
ità im
mobili
zzate
)877.7
52,3
8-
2
22
.63
6,2
0-
5
50
.19
4,2
9-
Marg
ine d
i te
sore
ria (
attiv
o a
bre
ve -
magazzin
o -
mezzi di te
rzi a b
reve)
3.5
13.6
28,1
5-
3.1
61
.25
6,6
4-
3.3
37
.44
2,3
9-
Ind
ici
di
so
ste
nib
ilit
à d
el
cic
lo a
zie
nd
ale
PF
N (
Valo
re a
ssolu
to)/
tota
le a
ttiv
o42,4
8%
43,7
6%
43,1
2%
PF
N (
Valo
re a
ssolu
to)/
fattura
to197,4
6%
243,5
0%
220,4
8%
EB
ITD
A /
OF
(valo
re a
ssolu
to)
74,4
1%
70,5
6%
72,4
8%
EB
IT /
OF
(V
alo
re a
ssolu
to)
101,7
6%
99,0
1%
100,3
8%
Cash F
low
/ O
F (
Valo
re a
ssolu
to)
31,1
6%
16,2
1%
23,6
8%
Cash F
low
/ P
FN
(V
alo
re a
ssolu
to)
4,1
9%
1,3
7%
2,7
8%
Cash F
low
/ T
ota
le a
ttiv
o1,8
0%
0,5
8%
1,1
9%

289
Ann. Fac. Medic. Vet. di Parma (Vol. XXV, 2005) - pag. 269 - pag. 292
Graf. 1 - Sostenibilità del rimborso del debito
Graf. 2 - Sostenibilità dellʼinvestimento incrementale

290
Ann. Fac. Medic. Vet. di Parma (Vol. XXV, 2005) - pag. 269 - pag. 292
Graf. 3 - Sostenibilità dellʼindebitamento incrementale

291
Ann. Fac. Medic. Vet. di Parma (Vol. XXV, 2005) - pag. 269 - pag. 292
Bibliografi a
Anthony R.N. (2002), “Il controllo manageriale”, Franco Angeli, Milano.Bonazzi G. (2002) “Aspetti della gestione delle imprese agroindustriali: il prosciut-
tifi cio in provincia di Parma”, supplemento a “Lʼavvenire agricolo”, Anno 110, n. 6, Parma.
Bruni F. (2001) “Strumenti per la gestione dellʼimpresa agraria”, in Rifl essioni ed analisi sullʼeconomia dellʼazienda agraria, Quaderno n.1 del gruppo di lavoro: Economia dellʼazienda, Padova.
Corbella S. (2001), “Il calcolo economico nellʼimpresa agricola”, Franco Angeli, Milano.
Ferri G., Iotti M. (2001) “Pianifi cazione e controllo nelle aziende agro-alimentari: il caseifi cio cooperativo”, in Economia Agroalimentare, n. 3, Franco Angeli, Mi-lano.
Gallerani V. (2001) “Dallʼazienda agricola alle reti dʼimpresa: capacità normati-ve dellʼeconomia agraria”, in Rifl essioni ed analisi sullʼeconomia dellʼazienda agraria, Quaderno n.1 del gruppo di lavoro: Economia dellʼazienda, Padova.
Ghelfi R. (2001) “Il bilancio dʼesercizio nellʼimpresa agraria: struttura, normative civilistiche e logiche di valutazione”, in Rifl essioni ed analisi sullʼeconomia del-lʼazienda agraria, Quaderno n.1 del gruppo di lavoro: Economia dellʼazienda, Padova.
Giacinti R., Tellarini V., Salvini E., Di Iacovo F., Andreoli M., Moruzzo R., Olivieri D. (2002), “Analisi e gestione economico-contabile per lʼimpresa agro-zootecni-ca”, Franco Angeli, Milano.
Pavarani E., a cura di, (2002), “Analisi fi nanziaria”, McGraw-Hill, Roma.Pezzani F., a cura di, (2004) “Il bilancio dʼesercizio nellʼinformativa esterna dʼim-
presa” Giuffrè, Milano.Sciarelli S. (1997) “Economia e gestione dellʼimpresa”, CEDAM, Padova.Torquati B. (2003) “Economia e gestione dellʼimpresa agraria”, Edagricole, Bolo-
gna.
Sommario
La valutazione dellʼandamento gestionale delle imprese è un tema che inte-ressa le scelte dellʼimprenditore, ma che infl uenza le decisioni anche di altri soggetti che con le imprese hanno relazioni.
Le analisi gestionali condotte con criteri omogenei secondo gli standard dei principi contabili internazionali facilitano il confronto degli esiti gestionali tra diver-se imprese agrarie e tra imprese agrarie ed imprese attive in altri settori economici.
Nel lavoro si è pervenuti alla identifi cazione di un insieme di indici di bi-lancio, applicati e verifi cati, su una serie di dati aziendali di unʼimpresa agraria, con forma giuridica di società di capitali, valutandone la redditività, la solidità e la soste-nibilità del ciclo aziendale nellʼarco di un decennio.
Nel caso in esame le analisi effettuate evidenziano una redditività aziendale

292
Ann. Fac. Medic. Vet. di Parma (Vol. XXV, 2005) - pag. 269 - pag. 292
modesta con elevata incidenza degli oneri fi nanziari. Da notare anche fl ussi di cassa insuffi cienti per restituire lʼindebitamento con ciclo fi nanziario aziendale non soste-nibile senza ricorso ad indebitamento aggiuntivo.
L analisi effettuata mette in luce lʼopportunità dellʼutilizzo degli strumenti dellʼanalisi gestionale, con unʼattenzione particolare alla scelta e allʼapplicazione di opportuni indici di analisi delle redditività degli investimenti, di solidità patrimoniale e sostenibilità del ciclo fi nanziario aziendale.
Parole Chiave
Analisi gestionaleImpresa agrariaIndici di bilancio
AbstractIndex analysis of agricultural concerns
The evaluation of company management progress is an issue that affects not only the choices of the entrepreneur, but also those decisions made by other parties that have relationships with the company.
Management analyses carried out using uniform criteria that are in line with the standards of international accounting principles facilitate the comparison of management results of different agricultural concerns, and that between agricultural concerns and other companies operating in other economic sectors.
This aim of this paper is to identify a set of applied and verifi ed balance sheet indices on a series of business data from an agricultural concern with share capital legal status, evaluating the profi tability, solidity and sustainability of the company activity cycle over a period of ten years.
In this case study, the analyses carried out show modest company profi tability, with a high incidence of fi nancial costs. It should also be noted that the cash fl ows are insuffi cient to assure the repayment of debt, and the company fi nancial cycle unsustainable without running into further debt.
The analysis carried out also highlights the opportunity to use management analysis tools, with particular attention on the choice and application of appropriate analysis indices for investment profi tability, capital solidity and the sustainability of the company fi nancial cycle.
Key words
Management analysisAgricultural concernBalance sheet indices

293
Ann. Fac. Medic. Vet. di Parma (Vol. XXV, 2005) - pag. 293 - pag. 306
LA NORMATIVA COMUNITARIA VIGENTENEL SETTORE ALIMENTARE
Signorini G.1, Biagi G.2, Nannipieri S.3, Pandolfi C.4
Introduzione
L Unione Europea, per garantire un elevato livello di sanità pubblica ha fatto della sicurezza alimentare una delle grandi priorità del programma politico europeo partendo dal presupposto che ogni cittadino europeo ha diritto a unʼalimentazione sana, di qualità e variata e che ogni tipo di informazione sulla composizione, sul processo di fabbricazione e sullʼimpiego dei prodotti alimentari deve risultare chiara e precisa.
Risulta pertanto evidente quanto grande sia lʼimportanza che i settori agricolo e alimentare rivestono per lʼeconomica europea anche in considerazione del fatto che lʼUE è il secondo esportatore mondiale di prodotti agricoli, dopo gli Stati Uniti e la sua industria agroalimentare di trasformazione è la prima nel mondo. Con oltre 370 milioni di consumatori, il mercato europeo è uno dei più vasti del mondo e lʼallargamento verso i paesi dellʼEuropa centrale e orientale potenzierà ulteriormente tale tendenza. Meglio informati e meglio organizzati, i consumatori hanno esigenze crescenti in materia di sicurezza e di qualità alimentare che i responsabili del settore non possono più ignorare.
Le crisi alimentari che hanno caratterizzato gli anni ʻ90, hanno fatto sì che la Commissione europea abbia preso coscienza della necessità di fi ssare e di fare rispettare norme più strette di sicurezza sullʼinsieme della catena alimentare per conseguire gli obiettivi generali della politica di sicurezza alimentare: garantire un livello elevato di protezione della salute umana e degli animali attraverso un aumento dei controlli sullʼintera catena alimentare; porre al centro delle preoccupazioni la qualità, concetto indissociabile dalla sicurezza alimentare distinguibile in qualità non negoziabile, che riguarda la sicurezza dellʼalimentazione e le esigenze minime in materia di protezione dellʼambiente e delle specie animali e vegetali, ed in qualità relativa o soggettiva, che rende un prodotto alimentare veramente unico attraverso il gusto, lʼaspetto, lʼodore, i metodi di produzione e la facilità di utilizzazione; ripristinare la fi ducia dei consumatori potenziando la sicurezza dei prodotti alimentari attraverso procedure più rigorose di sorveglianza e di controllo in modo che i consumatori dispongano di unʼinformazione chiara e precisa sugli aspetti importanti della sicurezza alimentare.
Il corpus legislativo europeo concernente sicurezza, qualità e tracciabilità dei prodotti alimentari è in continua evoluzione e lʼemanazione dal 2000 di Regolamenti e Direttive comunitarie cerca di soddisfare la sempre maggiore attenzione che il consumatore dedica allʼigienicità e alla sicurezza dei prodotti che arrivano sulle nostre tavole.
1 Scuola di Specializzazione in “Diritto e Legislazione Veterinaria” – Università Studi Parma2 Dipartimento di Clinica Veterinaria – Università Studi Pisa3 Veterinario Dirigente – ASL 6 Zona di Livorno4 Libero professionista – Ancona

294
Ann. Fac. Medic. Vet. di Parma (Vol. XXV, 2005) - pag. 293 - pag. 306
Le norme da prendere in considerazione sono quelle riportate nella Tabella n.1.
Tabella n. 1
- Direttiva n. 2000/13/CE del Parlamento europeo e del Consiglio del 20 marzo 2000 relativa al ravvicinamento delle legislazioni degli Stati membri concernenti lʼetichettatura e la presentazione dei prodotti alimentari, nonché la relativa pubblicità (GUCE n. L 109, 06/05/200) attuata in Italia con il Decreto Legislativo (D. Lgs) n. 181 del 23 giugno 2003 “Attuazione della direttiva 2000/13/CE concernente lʼetichettatura e la presentazione dei prodotti alimentari, nonché la relativa pubblicità” (GURI n. 167, 21 luglio 2003)
- Regolamento CE 1760/2000 del Parlamento europeo e del Consiglio del 17 luglio 2000 che istituisce un sistema di identifi cazione e di registrazione dei bovini e relativo allʼetichettatura delle carni bovine e dei prodotti a base di carni bovine, e che abroga il regolamento (CE) n. 820/97 del Consiglio (GUCE n. L 204, 11/08/2000)
- Regolamento CE 178/2002 del Parlamento europeo e del Consiglio del 28 gennaio 2002 che stabilisce i principi e i requisiti generali della legislazione alimentare, istituisce lʼAutorità europea per la sicurezza alimentare e fi ssa procedure nel campo della sicurezza alimentare (GUCE n. L 031, 01/02/2002)
- Regolamento CE 1829/2003 del Parlamento europeo e del Consiglio del 22 settembre 2003 relativo agli alimenti e ai mangimi geneticamente modifi cati (Testo rilevante ai fi ni del SEE) (GUCE n. L 268, 18/10/2003)
- Regolamento CE 1830/2003 del Parlamento europeo e del Consiglio del 22 settembre 2003 concernente la tracciabilità e lʼetichettatura di organismi geneticamente modifi cati e la tracciabilità di alimenti e mangimi ottenuti da organismi geneticamente modifi cati, nonché recante modifi ca della direttiva 2001/18/CE (GUCE n. L 268, 18/10/2003)
- Direttiva n. 2003/89/CE del Parlamento europeo e del Consiglio del 10 novembre 2003 che modifi ca la direttiva 2000/13/CE per quanto riguarda lʼindicazione degli ingredienti contenuti nei prodotti alimentari (Testo rilevante ai fi ni del SEE) (GUCE n. L 308, 25/11/2003)
- Regolamento CE 2295/2003 della Commissione del 23 dicembre 2003 recante modalità di applicazione del regolamento (CEE) n. 1907/90 del Consiglio relativo a talune norme di commercializzazione applicabili alle uova (GUCE n. L 340, 24/12/2003)
- Regolamento CE n. 852/2004 del Parlamento europeo e del Consiglio, del 29 aprile 2004, sullʼigiene dei prodotti alimentari (GUCE n. L 139, 30/04/2004)
- Regolamento CE 853/2004 del Parlamento europeo e del Consiglio, del 29 aprile 2004, che stabilisce norme specifi che in materia di igiene per gli alimenti di origine animale (GUCE L 139, 30/04/2004)
- Regolamento CE 854/2004 del Parlamento europeo e del Consiglio, del 29 aprile 2004, che stabilisce norme specifi che per lʼorganizzazione di controlli uffi ciali sui prodotti di origine animale destinati al consumo umano (GU n. L 139 del 30.4.2004)
- Regolamento CE 882/2004 del Parlamento europeo e del Consiglio, del 29 aprile 2004, relativo ai controlli uffi ciali intesi a verifi care la conformità alla normativa in materia di mangimi e di alimenti e alle norme sulla salute e sul benessere degli animali (GUCE n. L 191, 30/04/2004)

295
Ann. Fac. Medic. Vet. di Parma (Vol. XXV, 2005) - pag. 293 - pag. 306
Direttiva n. 2000/13/CE
La Comunità Europea con la Direttiva n. 79/112/CEE del Consiglio (18 dicembre 1978; GUCE n. L 33, 08/02/1979) relativa al ravvicinamento delle legislazioni degli Stati membri sullʼetichettatura e sulla presentazione dei prodotti alimentari, nonché sulla relativa pubblicità, modifi cata a più riprese ed in maniera sostanziale nel corso degli anni, aveva ritenuto che le differenze tra le disposizioni legislative, regolamentari e amministrative degli Stati membri in questo settore potevano ostacolare la libera circolazione degli stessi prodotti alimentari e creare altresì disparità nelle condizioni di concorrenza. La Direttiva n. 2000/13/CE è stata emanata con lo scopo di stabilire le norme comunitarie di carattere generale ed orizzontale applicabili a tutti i prodotti alimentari immessi in commercio ritenendo che qualsiasi regolamentazione relativa allʼetichettatura dei prodotti alimentari deve essere fondata anzitutto sulla necessità dʼinformare e tutelare i consumatori fornendo informazioni adeguate sulla natura esatta e sulle caratteristiche del prodotto, per consentire al consumatore di operare la sua scelta con cognizione di causa.
Si stabilisce che lʼetichettatura e le relative modalità di realizzazione non devono essere tali da indurre in errore lʼacquirente, specialmente per quanto riguarda le caratteristiche del prodotto alimentare e in particolare la natura, lʼidentità, le qualità, la composizione, la quantità, la conservazione, lʼorigine o la provenienza, il modo di fabbricazione o di ottenimento, o attribuendo al prodotto alimentare effetti o proprietà che non possiede, o suggerendo che il prodotto alimentare possiede caratteristiche particolari, quando tutti i prodotti alimentari analoghi possiedono caratteristiche identiche; infi ne, fatte salve le disposizioni comunitarie applicabili alle acque minerali naturali e ai prodotti alimentari destinati ad unʼalimentazione particolare, attribuire al prodotto alimentare proprietà atte a prevenire, curare o guarire una malattia umana né accennare a tali proprietà.
La Direttiva n. 2000/13/CE è stata modifi cata dalla Direttiva n. 2003/89/CE almeno per quanto riguarda lʼindicazione degli ingredienti contenuti nei prodotti alimentari partendo dal presupposto che taluni ingredienti o altre sostanze, se utilizzati nella produzione dei prodotti alimentari e presenti negli stessi, sono allʼorigine di allergie o intolleranze nei consumatori, e che alcune di queste allergie o intolleranze rappresentano un pericolo per la salute delle persone che ne soffrono: il legislatore europeo ha ritenuto quindi opportuno rendere obbligatoria lʼinclusione nellʼelenco degli ingredienti di tutti gli ingredienti e di tutte le altre sostanze presenti in un determinato prodotto alimentare.
In Italia la Direttiva n. 2000/13/CE, ma anche le Direttive n. 2001/101/CE (GUCE n. L 310, 28/11/2001) (relativa allʼetichettatura delle carni utilizzate quali ingredienti di prodotti alimentari, che modifi ca in modo sostanziale e restrittivo la defi nizione di “carne” distinguendo fra lʼaltro fra carne, grasso, tessuto connettivo) e n. 2002/67/CE (GUCE n. L 191, 19/07/2002) (relativa allʼetichettatura dei generi alimentari contenenti chinino e dei prodotti alimentari contenenti caffeina), sono state recepite con il Decreto Legislativo (D. L.gs) n. 181 del 23 giugno 2003 (GURI n. 167, 21/07/2003)

296
Ann. Fac. Medic. Vet. di Parma (Vol. XXV, 2005) - pag. 293 - pag. 306
che, pur integrandoli ed aggiornandoli, non apporta radicali modifi cazioni ai precedenti Decreti Legislativi in materia, quali ad esempio il D. L.gs n. 109, 27 gennaio 1992, “Attuazione delle direttive n. 89/395/CEE e n. 89/396/CEE concernenti lʼetichettatura, la presentazione e la pubblicità dei prodotti alimentari” (GURI n. 39, 17/02/1992, SO n. 31), il D. L.gs n. 68, 25 febbraio 2000, “Attuazione della direttiva 97/4/CE, che modifi ca la direttiva 79/112/CEE, in materia di etichettatura, presentazione e pubblicità dei prodotti alimentari destinati al consumatore fi nale” (GURI n. 72, 27/03/2000), il D. L.gs n. 259, 10 agosto 2000, “Attuazione della Direttiva 1999/10/CE (che introduce deroghe alle disposizioni di cui allʼart. 7 della Direttiva n. 79/112/CEE per quanto riguarda lʼetichettatura dei prodotti alimentari) in materia di etichettatura dei prodotti alimentari (GURI n. 220, 20/09/2000). Il D. L.gs n. 181/2003 aggiunge alle precedenti disposizioni quella di indicare espressamente la quantità di alcuni ingredienti e la presenza di sostanze alcoliche in volume superiore allʼ1,2% e per quanto riguarda il campo di applicazione si riferisce ai prodotti alimentari, destinati alla vendita al consumatore nellʼambito del mercato nazionale. Le carni utilizzate come ingredienti di un prodotto alimentare devono essere indicate con il nome della specie animale ed eventualmente con lʼindicazione del grasso e del tessuto connettivo contenuto; il chinino e la caffeina, utilizzati come aromi nella fabbricazione o nella preparazione dei prodotti alimentari, devono essere indicati nellʼelenco degli ingredienti del prodotto composto con la loro denominazione specifi ca, immediatamente dopo il termine “aroma”. Viene meglio defi nito il termine minimo di conservazione (la data fi no alla quale il prodotto alimentare conserva le sue proprietà specifi che in adeguate condizioni di conservazione) che è determinato dal produttore o dal confezionatore ed è apposto sotto la loro diretta responsabilità e che, sui prodotti preconfezionati rapidamente deperibili dal punto di vista microbiologico e che possono costituire, dopo breve tempo, un pericolo per la salute umana, è sostituito dalla data di scadenza. Sono infi ne stabilite le menzioni obbligatorie che devono fi gurare sui prodotti preconfezionati, sfusi o preincartati.
Regolamento CE n. 1760/2000
In base a questa norma, ogni Stato membro istituisce, oltre ad un sistema di identifi cazione e di registrazione dei bovini, anche un sistema comunitario obbligatorio di etichettatura delle carni bovine e dei prodotti a base di carni bovine che sia in grado di permettere di evidenziare il nesso fra, da un lato, lʼidentifi cazione della carcassa, del quarto o dei tagli di carne, dallʼaltro, il singolo animale (individuato come “lotto”), oppure il gruppo di animali di cui trattasi, ove ciò sia suffi ciente a consentire di verifi care informazioni che fi gurano sullʼetichetta. Sullʼetichetta devono fi gurare un numero di riferimento o un codice di riferimento che evidenzi il nesso tra le carni e lʼanimale o gli animali; il numero di approvazione del macello; il numero di approvazione del laboratorio di sezionamento. Devono essere indicati anche lo Stato membro o il paese terzo di nascita; quello in cui ha avuto luogo lʼingrasso; quello in cui ha avuto luogo la macellazione.
In etichetta possono essere altresì fornite informazioni aggiuntive rispetto

297
Ann. Fac. Medic. Vet. di Parma (Vol. XXV, 2005) - pag. 293 - pag. 306
a quelle obbligatorie solo se lʼAutorità competente dello Stato membro, per lʼItalia il Ministero delle Politiche Agricole, ha approvato un disciplinare che indiche quali informazioni da indicare sullʼetichettatura; le misure da adottare per garantire la veridicità delle informazioni; il sistema di controllo che sarà applicato in tutte le fasi della produzione e della vendita, inclusi i controlli da effettuarsi ad opera di un organismo indipendente riconosciuto dallʼautorità competente e designato dallʼoperatore o dallʼorganizzazione; le misure da adottare nei confronti dei membri che violino il disciplinare nel caso di unʼorganizzazione.
Regolamento CE n. 178/2002
Questo regolamento stabilisce i principi comuni e le competenze, i mezzi per assicurare un solido fondamento scientifi co, le procedure ed i meccanismi organizzativi effi cienti a sostegno dellʼattività decisionale nel campo della sicurezza degli alimenti e dei mangimi; fornisce i principi generali da applicare nella Comunità e a livello nazionale in materia di alimenti e mangimi in generale, e di sicurezza degli alimenti e dei mangimi in particolare; disciplina tutte le fasi della produzione, della trasformazione e della distribuzione degli alimenti e dei mangimi; stabilisce procedure relative a questioni aventi unʼincidenza diretta o indiretta sulla sicurezza degli alimenti e dei mangimi.
Ai fi ni del conseguimento dellʼobiettivo generale di un livello elevato di tutela della vita e della salute umana, la legislazione alimentare si basa sullʼanalisi del rischio, la cui valutazione si basa sugli elementi scientifi ci a disposizione ed è svolta in modo indipendente, obiettivo e trasparente. La gestione del rischio tiene conto dei risultati della valutazione del rischio, e in particolare dei pareri dellʼAutorità, nonché di altri aspetti, se pertinenti, e del principio di precauzione. Gli operatori del settore alimentare devono attuare sistemi e procedure in grado di attuare la tracciabilità e permettano, in caso di prodotto ritenuto o sospettato di essere nocivo per la salute, di ritirarlo immediatamente dal mercato e darne comunicazione alle Autorità competenti oltre che agli utilizzatori.
Inoltre è istituita unʼAutorità europea per la sicurezza alimentare che offre consulenza scientifi ca e assistenza scientifi ca e tecnica per la normativa e le politiche della Comunità in tutti i campi che hanno unʼincidenza diretta o indiretta sulla sicurezza degli alimenti e dei mangimi; fornisce informazioni indipendenti su tutte le materie che rientrano in detti campi e comunica i rischi; raccoglie e analizza i dati che consentono la caratterizzazione e la sorveglianza dei rischi che hanno unʼincidenza diretta o indiretta sulla sicurezza degli alimenti e dei mangimi; formula pareri scientifi ci che costituiscono la base scientifi ca per lʼelaborazione e per lʼadozione di misure comunitarie nelle materie di sua competenza.
Infi ne, riteniamo importante sottolineare che il 1° gennaio 2005 era lʼultima data di applicazione della rintracciabilità in tutte le aziende alimentari

298
Ann. Fac. Medic. Vet. di Parma (Vol. XXV, 2005) - pag. 293 - pag. 306
Regolamenti CE n. 1829/2003 e n. 1830/2003
Per proteggere la salute umana e animale, gli alimenti e i mangimi che contengono organismi geneticamente modifi cati (OGM) o sono costituiti o prodotti a partire da tali organismi è necessario che siano sottoposti a una valutazione della sicurezza tramite una procedura comunitaria prima di essere immessi sul mercato comunitario per garantire un corretto ed effi ciente sistema di tracciabilità. I due Regolamenti citati si propongono come obiettivi, il n. 1829/2003, quello di fornire la base per garantire un elevato livello di tutela della vita e della salute umana, della salute e del benessere degli animali, dellʼambiente e degli interessi dei consumatori in relazione agli alimenti e mangimi geneticamente modifi cati, garantendo nel contempo lʼeffi cace funzionamento del mercato interno; di istituire procedure comunitarie per lʼautorizzazione e vigilanza degli alimenti e mangimi geneticamente modifi cati; di stabilire norme per lʼetichettatura degli alimenti e mangimi geneticamente modifi cati e il n. 1830/2003, quello di istituire un quadro normativo per la tracciabilità dei prodotti contenenti OGM o da essi costituiti e degli alimenti e mangimi ottenuti da OGM, allo scopo di facilitare unʼaccurata etichettatura, il monitoraggio degli effetti sullʼambiente e, se del caso, sulla salute, nonché lʼattuazione delle misure adeguate di gestione dei rischi, compreso, se necessario, il ritiro dei prodotti.
Sinteticamente si può dire che il fornitore di qualsiasi prodotto è responsabile della trasmissione delle informazioni, che devono fi gurare sui documenti di accompagnamento, sulla natura, presenza o derivazione da OGM e se consegna un materiale consistente, contenente o derivato da un OGM deve darne comunicazione scritta allʼacquirente; la documentazione di riferimento deve essere mantenuta e conservata per un periodo di cinque anni.
Inoltre sono stati stabiliti dei limiti di tolleranza: 0,9 per gli OGM autorizzati e 0,5 per gli OGM non autorizzati ma positivamente valutati dalle Autorità scientifi che competenti.
Direttiva n. 2003/89/CE
Poiché alcuni ingredienti o altre sostanze, se utilizzati nella produzione dei prodotti alimentari e presenti negli stessi, sono allʼorigine di allergie o intolleranze nei consumatori, e alcune di queste allergie o intolleranze rappresentano un pericolo per la salute delle persone che ne soffrono, con la Direttiva n. 2003/89/CE sono stati stabiliti le indicazioni degli ingredienti contenuti negli alimenti per quanto riguarda gli allergeni alimentari.
Dal 25 novembre 2005 è ormai vietata la vendita dei prodotti non conformi alla Direttiva e nella Tabella n. 2 riportiamo le sostanze considerate allergeni alimentari in base allʼAllegato III bis della Direttiva stessa.

299
Ann. Fac. Medic. Vet. di Parma (Vol. XXV, 2005) - pag. 293 - pag. 306
Tabella n. 2
- Cereali contenenti glutine (cioè grano, segale, orzo, avena, farro, kamut o i loro ceppi ibridati) e prodotti derivati
- Crostacei e prodotti a base di crostacei- Uova e prodotti a base di uova- Pesce e prodotti a base di pesce- Arachidi e prodotti a base di arachidi- Soia e prodotti a base di soia- Latte e prodotti a base di latte (compreso il lattosio)- Frutta a guscio cioè mandorle (Amigdalus communis L.), nocciole (Corylus
avellana), noci comuni (Juglans regia), noci di acagiù (Anacardium occidentale), noci pecan [Carya illinoiesis (Wangenh) K. Koch], noci del Brasile (Bertholletia excelsa), pistacchi (Pistacia vera), noci del Queensland (Macadamia ternifolia) e prodotti derivati
- Sedano e prodotti a base di sedano- Senape e prodotti a base di senape- Semi di sesamo e prodotti a base di semi di sesamo- Anidride solforosa e solfi ti in concentrazioni superiori a 10 mg/kg o 10 mg/l
espressi come SO2
Regolamento CE n. 2295/2003
A seguito del progresso tecnologico e delle esigenze dei consumatori che richiedono che venga rafforzata la tracciabilità dei prodotti e accelerate le operazioni di consegna, raccolta, classifi cazione ed imballaggio delle uova, a completamento della precedente normativa è stato promulgato il Regolamento CE n. 2295/2003 della Commissione del 23 dicembre 2003 recante modalità di applicazione del Regolamento CEE n. 1907/90 del Consiglio (GUCE n. L 173, 06/07/1990) relativo a talune norme di commercializzazione applicabili alle uova. In Italia il Ministero ha emanato il Decreto del 4 marzo 2005 contenente le regole che riguardano la commercializzazione delle uova, in particolare sullʼuso di particolari diciture.
Sul guscio delle uova, il giorno della classifi cazione e dellʼimballaggio, deve essere stampigliato il marchio relativo al numero distintivo del produttore, alla data di deposizione, allʼalimentazione delle galline ovaiole e allʼorigine regionale delle uova, in modo chiaramente visibile e leggibile, con un prodotto conforme alle disposizioni in vigore per quanto concerne le sostanze coloranti che possono essere utilizzate nei generi destinati al consumo umano per garantire la rintracciabilità, il controllo dellʼorigine e del metodo di produzione. La stampigliatura apposta sul guscio identifi ca con le sigle 0, biologico, 1, allʼaperto, 2, a terra, 3, in gabbia il tipo di allevamento; con la sigla IT, nel nostro caso, la Nazione; il codice ISTA del comune; la sigla della provincia dove ha sede lʼallevamento; il codice dellʼallevamento; la data di scadenza o la data di deposizione.

300
Ann. Fac. Medic. Vet. di Parma (Vol. XXV, 2005) - pag. 293 - pag. 306
Premesso che le uova di categoria “A” non debbono essere lavate, né pulite con un altro procedimento prima o dopo la classifi cazione né subire alcun trattamento di conservazione né essere state refrigerate in locali o impianti in cui la temperatura è mantenuta artifi cialmente al di sotto di + 5° C, sugli imballaggi devono essere riportate le categorie di peso la dicitura relativa al sistema di allevamento, il Codice ASL che identifi ca lʼazienda di produzione, il numero del centro di imballaggio otre ad altre diciture facoltative indicative di altre caratteristiche dopo averv ricevuto lʼautorizzazione dal Ministero delle Politiche Agricole.
Regolamenti CE n. 852, n. 853 e n. 854 del Parlamento europeo e del Consiglio, del 29 aprile 2004.
Questi tre Regolamenti, completati dal Regolamento CE n. 183/2005 del Parlamento europeo e del Consiglio, del 12 gennaio 2005 che stabilisce requisiti per lʼigiene dei mangimi (GUCE n. L 35, 08/02/2005), costituiscono il così detto “Pacchetto Igiene” dato che stabiliscono norme specifi che in materia di igiene degli alimenti in generale e per i prodotti di origine animale in particolare.
In Italia, le norme generali di igiene dei prodotti alimentari e le modalità di verifi ca dellʼosservanza di tali norme erano stabilite dal D.Lgs n. 155 del 26 maggio 1997, “Attuazione delle direttive 93/43/CEE e 96/3/CE concernenti lʼigiene dei prodotti alimentari” (GURI n. 136 SO n. 118, 13 giugno 1997). Nel quadro della revisione e della rivisitazione della legislazione comunitaria sullʼigiene dei prodotti alimentari, il Regolamento CE n. 852/2004, in vigore dal primo gennaio 2006, che abroga la Direttiva 93/43/CEE, ribadisce che il conseguimento di un elevato livello di protezione della vita e della salute umana è uno degli obiettivi fondamentali della legislazione alimentare nazionale e comunitaria, compreso lʼobiettivo della realizzazione della libera circolazione degli alimenti nella Comunità e sottolinea quanto sia importante defi nire gli obiettivi che devono essere perseguiti in materia di sicurezza alimentare. Stabilisce anche che la responsabilità principale per la sicurezza degli alimenti incombe allʼoperatore del settore alimentare e che è necessario garantire la sicurezza degli alimenti lungo tutta la catena alimentare, a cominciare dalla produzione primaria: gli operatori dovranno pertanto adottare tutte quelle misure ritenute adeguate e necessarie per essere in grado di garantire la non pericolosità dei prodotti forniti. NellʼAllegato I “Produzione primaria” vengono dati i “Requisiti generali in materia di igiene per la produzione primaria e le operazioni associate” che devono essere applicati oltre che alla produzione primaria vera e propria anche al trasporto, al magazzinaggio ed alla manipolazione di prodotti primari sul luogo di produzione, a condizione che ciò non alteri sostanzialmente la loro natura, al trasporto di animali vivi, e, in caso di prodotti di origine vegetale, prodotti della pesca e della caccia, alle operazioni di trasporto per la consegna di prodotti primari, la cui natura non sia ancora stata sostanzialmente modifi cata, dal luogo di produzione ad uno stabilimento. Inoltre, nella misura del possibile, gli operatori del settore alimentare devono assicurare, che i prodotti primari siano protetti da contaminazioni, tenendo conto di tutte le trasformazioni successive cui saranno soggetti. NellʼAllegato II sono enunciati i “Requisiti generali in materia di

301
Ann. Fac. Medic. Vet. di Parma (Vol. XXV, 2005) - pag. 293 - pag. 306
igiene applicabili a tutti gli operatori del settore alimentare” prendendo in considerazione il personale, i locali di lavorazione e gli eventuali siti esterni, le attrezzature, lʼapprovvi-gionamento idrico e lo smaltimento dei rifi uti. Naturalmente le disposizioni previste non escludono che vengano applicate ulteriori precauzioni ritenute indispensabili o necessarie rispetto allʼattività svolta o al tipo di prodotto lavorato.
Il Regolamento CE n. 853/2004, stabilisce norme ad integrazione del Regolamento CE n. 852/2004 e detta disposizioni specifi che in materia di igiene per gli alimenti di origine animale, trasformati e non, destinate agli operatori del settore alimentare che devono rispettarle. NellʼAllegato I sono elencati i prodotti di origine animale ai quali, data la possibilità di presentare rischi di natura microbiologica e chimica, deve essere applicato quanto specifi cato in questo Regolamento. L approccio settoriale del regolamento riguarda in particolare le carni (partendo dalla carne intesa come tutte le parti commestibili degli animali compreso il sangue; agli animali - ungulati domestici, pollame, lagomorfi , selvaggina selvatica (ungulati e lagomorfi selvatici, nonché altri mammiferi terrestri oggetto di attività venatorie ai fi ni del consumo umano compresi i mammiferi che vivono in territori chiusi in condizioni simili a quelle della selvaggina allo stato libero e selvaggina di penna), alla selvaggina dʼallevamento ed alla selvaggina selvatica piccola e grossa; dalla carcassa, carni fresche, frattaglie, visceri, carni macinate, carni separate meccanicamente (CSM), preparazioni di carni fi no al macello), i molluschi bivalvi vivi, i prodotti della pesca, il latte, uova, cosce di rana e lumache, i prodotti trasformati (a base di carne, lattiero-caseari, ovoprodotti, prodotti della pesca trasformati, grasso animale fuso, ciccioli, gelatina, collagene, stomachi, vesciche e intestini trattati).
Il terzo Regolamento del così detto “pacchetto igiene” è il Regolamento CE n. 854/2004 che stabilisce norme specifi che per lʼorganizzazione di controlli uffi ciali sui prodotti di origine animale e che si applica soltanto per le attività e le persone alle quali è destinato il Regolamento CE n. 853/2004. Dispone che nei casi previsti il veterinario uffi ciale sovrintenda alla bollatura sanitaria e ai bolli utilizzati assicurando in particolare che il bollo sanitario sia apposto soltanto se lʼanimale (ungulati domestici, mammiferi selvatici dʼallevamento diversi dai lagomorfi , e selvaggina in libertà di grosse dimensioni) è stato sottoposto a ispezione ante mortem e post mortem e non vi sono motivi per dichiarare le carni non idonee al consumo umano. I controlli uffi ciali sui prodotti di origine animale prevedono audit di buone prassi di igiene e procedure basate sui principi HACCP oltre a controlli specifi ci settore per settore. Il Regolamento esplica anche i compiti del Servizio Veterinario, la frequenza e la responsabilità dei controlli, i provvedimenti in caso di non rispetto della normativa.
Regolamento CE n. 882/2004
Il Regolamento CE n. 882/2004 è stato emanato con lo scopo di riorganizzare i controlli uffi ciali dei prodotti alimentari e dei mangimi per integrare i controlli durante tutte le fasi della produzione e in tutti i settori dato che fi ssa i compiti spettanti allʼUnione europea per quanto riguarda lʼorganizzazione dei controlli, nonché le disposizioni che le autorità nazionali responsabili dei controlli uffi ciali debbono rispettare, ivi

302
Ann. Fac. Medic. Vet. di Parma (Vol. XXV, 2005) - pag. 293 - pag. 306
comprese le misure di attuazione da adottare in caso di inottemperanza alla legislazione comunitaria.
In sintesi, si può dire che questo regolamento, facendo riferimento ai compiti di ispezione propri del Servizio Veterinario, stabilisce le regole generali per lʼesecuzione dei controlli uffi ciali, defi niti come “qualsiasi forma di controllo eseguita dallʼautorità competente o dalla Comunità per la verifi ca della conformità alla normativa in materia di mangimi e di alimenti e alle norme sulla salute e sul benessere degli animali”, intesi a verifi care la conformità alle normative, con lo scopo sia di prevenire, eliminare o ridurre a livelli accettabili i rischi per gli esseri umani e gli animali, siano essi rischi diretti o veicolati dallʼambiente che di garantire pratiche commerciali leali per i mangimi e gli alimenti e tutelare gli interessi dei consumatori, comprese lʼetichettatura dei mangimi e degli alimenti e altre forme di informazione dei consumatori. Si sottolinea anche che lʼesecuzione dei controlli uffi ciali lascia impregiudicata la responsabilità legale, in via principale, degli operatori del settore per la sicurezza dei mangimi e degli alimenti, come previsto dal regolamento (CE) n. 178/2002 e la responsabilità civile o penale risultante dalla violazione dei loro obblighi.
Vengono fi ssati gli obblighi generali cui devono ottemperare i singoli Stati che attraverso le Autorità competenti, e per quanto riguarda lʼItalia come già detto i Servizi Verterinari, garantiscono che i controlli uffi ciali siano eseguiti periodicamente, in base ad una valutazione dei rischi e con frequenza appropriata, tenendo conto da una parte dei rischi identifi cati associati con gli animali, con i mangimi o con gli alimenti, con le aziende del settore dei mangimi e degli alimenti, con lʼuso dei mangimi o degli alimenti o con qualsiasi trasformazione, materiale, sostanza, attività o operazione che possano infl uire nella sicurezza dei mangimi o degli alimenti, sulla salute o sul benessere degli animali; dallʼaltra dei dati precedenti relativi agli operatori del settore dei mangimi e degli alimenti per quanto riguarda la conformità alla normativa in materia di mangimi e di alimenti e alle norme sulla salute e sul benessere degli animali; oltre che dellʼaffi dabilità dei propri controlli già eseguiti e di qualsiasi informazione che possa indicare unʼeventuale non conformità. Si ribadisce che i controlli uffi ciali siano eseguiti senza preavviso, salvo qualora sia necessaria una notifi ca preliminare dellʼoperatore del settore dei mangimi e degli alimenti, come nel caso degli audit a meno che non debbano essere eseguiti su base “ad hoc”. Inoltre sono eseguiti in qualsiasi fase della produzione, della trasformazione e della distribuzione dei mangimi o degli alimenti e degli animali e dei prodotti di origine animale. In ciò rientrano i controlli sulle aziende del settore dei mangimi e degli alimenti, sullʼuso dei mangimi e degli alimenti, sul magazzinaggio dei mangimi e degli alimenti, su qualsiasi trasformazione, materiale, sostanza, attività o operazione, compreso il trasporto, relativi ai mangimi o agli alimenti e sugli animali vivi, richiesti per raggiungere gli obiettivi del presente regolamento.
I metodi di campionamento e analisi impiegati nel contesto dei controlli uffi ciali devono essere pienamente convalidati conformemente alla legislazione comunitaria o a protocolli internazionalmente accettati. I metodi di analisi devono essere caratterizzati dal criterio dellʼesattezza; dellʼapplicabilità (matrice e gamma di concentrazione); dal limite di rilevazione; dal limite di determinazione; dalla precisione; dalla ripetibilità; dalla riproducibilità; dal recupero; dalla selettività; dalla sensibilità; dalla linearità; dallʼincertezza delle misurazioni; e da altri criteri a scelta. Le analisi poi devono essere

303
Ann. Fac. Medic. Vet. di Parma (Vol. XXV, 2005) - pag. 293 - pag. 306
effettuate da laboratori accreditati a tal fi ne, conformemente agli standard elaborati dal Comitato Europeo di Normalizzazione (CEN).
Conclusioni
Dalla seppur breve disamina della legislazione comunitaria nel settore alimentare si evince che gli operatori del settore agricolo, insieme a quelli che operano nellʼambito dellʼindustria mangimistica e in quella alimentare, dovranno fronteggiare a partire dal 1° gennaio 2006 nuove disposizioni comunitarie in materia di sicurezza alimentare e di tutela della salute dei consumatori. Con gli ultimi Regolamenti sono state emanate norme tendenti a semplifi care, raggruppare e modifi care le disposizioni fi no ad oggi vigenti nel settorte alimentare e, in particolare, con il completamentodel cosiddetto “pacchetto igiene” mediante lʼapprovazione del Regolamento CE n. 183/2005 del Parlamento e del Consiglio del 12 gennaio 2005 che stabilisce requisiti per lʼigiene dei mangimi, si è arrrivati allʼintroduzione di specifi che normative che garantiscono lʼigiene nel settore della produzione di alimenti per gli animali (mangimi) ed al nuovo regime comunitario per i controlli uffi ciali per accertare la conformità degli alimenti e dei mangimi e il rispetto delle norme sulla salute e sul benessere degli animali. Si è così completato il progetto lanciato con la pubblicazione del Libro bianco sulla sicurezza alimentare nel 1998, che ha introdotto il principio di seguire il percorso dellʼalimento dal momento della produzione della materia prima agricola e zootecnica fi no al consumo fi nale.
Riteniamo che, in questa sede, la numerosità dei provvedimenti varati e la complessità e lʼeterogeneità della materia affrontata rendono diffi cile una trattazione completa, organica ed esaustiva anche se ribadiamo che è necessario acquisire la consapevolezza dellʼimportanza delle disposizioni varate e dei rifl essi che ci saranno a ogni livello, compreso quello della gestione ordinaria delle aziende agricole.
Sottolineiamo che nei nuovi provvedimenti comunitari è ribadito e rafforzato il principio che è il produttore colui che ha la responsabilità di garantire lʼigiene degli alimenti tanto che, oltre a possedere e rispettare i requisiti previsti (strutture conformi, protezione dei prodotti da contaminazione, rispetto delle norme igieniche in tutte le fasi del processo produttivo, personale addestrato e idoneo), deve tenere e conservare le registrazioni relative alle operazioni svolte e alle misure adottate (natura e origine degli alimenti somministrati agli animali, medicinali veterinari impiegati, prodotti fi tosanitari utilizzati, malattie e infestanti che hanno interessato la coltura). Pertanto, se da una parte lʼobbligo di attuare lʼHACCP è confermato per lʼindustria dallʼaltra viene esteso anche alle aziende agricole che devono usare i manuali nazionali di corretta prassi operativa in materia di igiene: contengono orientamenti, raccomandazioni e informazioni che assicurino un livello elevato di igiene, consentano il controllo dei rischi, evidenzino i pericoli che insorgono nel corso del processo produttivo, individuino misure da attuare per tenere sotto controllo le produzioni e la relativa sicurezza alimentare. I manuali vengono elaborati dagli stessi operatori del settore alimentare, sotto lʼegida degli organismi nazionali di normalizzazione e in accordo con i rappresentanti dei soggetti interessati (ad esempio i consumatori) e le autorità competenti.

304
Ann. Fac. Medic. Vet. di Parma (Vol. XXV, 2005) - pag. 293 - pag. 306
Parole chiave: Sicurezza alimentare, igiene degli alimenti di origine animale, Regolamenti, Direttive
Key words: Food safety, hygienic production of food of animal origin, Regulations, Directives
BIBLIOGRAFIA
Signorini G., Biagi G., Nannipieri S.(2005). La Farmacosorveglianza veterinaria. ODV, 26(1): 47-48
Biagi G., Luchetti E., Bagliacca M., Signorini G., Nannipieri S. (2005). Avvelenamento di animali con bocconi avvelenati. Nota I. Riferimenti legislativi. ODV 26(6): 41-45
Biagi G., Luchetti E., Bagliacca M., Signorini G., Nannipieri S. (2005). Avvelenamento di animali con bocconi avvelenati. Nota II. Applicazione della Legge Regionale Toscana. ODV 26(7/8): 31-35
Signorini G., Biagi G., Bagliacca M., Nannipieri S., Cardeti G., Parca F. (2005). Prevenzione delle malattie infettive delle specie ittiche e semina nelle acque pubbliche. Riferimenti normativi. ODV, 26(12): 41-45
RIASSUNTO
Il corpus legislativo europeo concernente sicurezza, qualità e tracciabilità dei prodotti alimentari è in continua evoluzione e lʼemanazione dal 2000 di Regolamenti e Direttive comunitarie cerca di soddisfare la sempre maggiore attenzione che il consumatore dedica allʼigienicità e alla sicurezza dei prodotti che arrivano sulle nostre tavole. Gli Autori, nonostante che la numerosità dei provvedimenti varati e la complessità e lʼeterogeneità di questo settore legislativo rendano diffi cile una trattazione completa, organica ed esaustiva della materia, effettuano una disamina delle Direttive e dei Regolamenti emanati dal 2000 nel settore alimentare. Infi ne, ribadiscono che è necessario acquisire la consapevolezza dellʼimportanza delle disposizioni varate e dei rifl essi che ci saranno a ogni livello, compreso quello della gestione ordinaria delle aziende agricole.
SUMMARY
The European legislative corpus regarding the security, quality and system of tracking relative to the alimentary products is continuously developing.. The law Regulations and Directives, updated from 2000, try to satisfy the growing attention of the consumers to the hygiene and security of the alimentary products that reach their dining tables.

305
Ann. Fac. Medic. Vet. di Parma (Vol. XXV, 2005) - pag. 293 - pag. 306
The Authors resumes and comments the Regulations and Directives entered into force and updated in the alimentary sector. The amount of rules entered in force and the complexity and heterogeneity of this ruling sector is diffi cult but the complete knowledge of this matter is required.
The knowledge of every rule is fundamental to understand the effects, at every level, that will change also the management of the farms.

306
Ann. Fac. Medic. Vet. di Parma (Vol. XXV, 2005) - pag. 293 - pag. 306

307
Ann. Fac. Medic. Vet. di Parma (Vol. XXV, 2005) - pag. 307 - pag. 318
OSTEOGENESIS AND BONE INTEGRATION:THE EFFECT OF NEW TITANIUM SURFACE TREATMENTS
C. Gabbi1, A. Cacchioli1, F. Ravanetti1, B. Spaggiari1, P. Borghetti2, F.M. Martini3, F. Leonardi3
RIASSUNTOIl titanio rappresenta un biomateriale d’elezione in implantologia orale ed
ortopedica grazie alle sue proprietà di elasticità, resistenza al carico ed inerzia in ambiente biologico.
Le modifi che di superfi cie del titanio sono in grado di incidere marcatamente sul processo di osteointegrazione degli impianti protesici. In particolare la microrugosità superfi ciale è un fattore determinante nell’adesione e colonizzazione osteoblastica durante la neodeposizione ossea nella sede perimplantare. Negli ultimi anni l’attenzione dei ricercatori si è concentrata sull’applicazione di gruppi funzionali (biomimesi) alla superfi cie del titanio, in grado di indurre ed accelerare i fenomeni di osteodeposizione (adesione osteoblastica, nucleazione di cristalli di idrossiapatite).
Lo scopo del nostro studio è la valutazione morfologica del potenziale di osteointegrazione di trattamenti chimici ed elettrochimici di modifi ca superfi ciale del titanio. In particolare sono stati testati un trattamento chimico ottenuto mediante doppio attacco acido ed un trattamento elettrochimico in liquidi corporei simulati (Bio-SparkTM). Come modello sperimentale sono stati utilizzati conigli di razza White New Zealand e come sede anatomica di impianto si è scelta l’epifi si distale del femore.
Secondo quanto osservato, le modifi che di superfi cie hanno migliorato ed accelerato il processo di osteointegrazione degli impianti trattati rispetto al controllo, in modo particolarmente evidente e precoce nel titanio trattato chimicamente con doppio attacco acido. Al termine dei tempi sperimentali considerati, i due trattamenti di superfi cie hanno prodotto un grado di osteointegrazione comparabile.
I risultati inducono a considerare positivamente questi trattamenti alfi ne di sempre migliori performances degli impianti protesici nell’applicazione clinica.
Parole chiave: biomateriali - titanio – trattamenti di superfi cie – coniglio - tessuto osseo –– osteointegrazione
SUMMARY Titanium represents a choice biomaterial in oral and orthopaedic
implantology due to its properties of elasticity, load resistance and inertness in
1 Dipartimento di Salute Animale, Sezione di Anatomia degli Animali di Interesse Medico Veterinario; 2 Dipartimento di Salute Animale, Sezione di Patologia Generale ed Anatomia Patologica Veterinaria; 3 Dipartimento di Salute Animale, Sezione di Clinica Chirurgica Veterinaria e Medicina dʼUrgenza.

308
Ann. Fac. Medic. Vet. di Parma (Vol. XXV, 2005) - pag. 307 - pag. 318
biological environment.Titanium surface modifi cations can considerably affect the osteointegration
process of prosthetic implants. In particular, surface micro-roughness is a key factor in osteoblast adhesion and colonization during bone neodeposition around the implant. In the last years researchers have focused their attention on the application of functional groups (biomimesis) to titanium surface, able to induce and speed up bone deposition processes (osteoblast adhesion, hydroxylapatite crystal nucleation).
The aim of our study is the morphological evaluation of osteointegration potential of chemical and electrochemical treatments aiming at titanium surface modifi cation. In particular, a chemical treatment, obtained by a double acid attack, and an electrochemical treatment in simulated body fl uids (Bio-SparkTM) were tested. White New Zealand breed rabbits were used as animal model and the femur distal epiphysis was chosen as implant anatomical location.
According to our fi ndings, surface modifi cations have improved and speeded up the osteointegration process of treated implants compared to control, in a marked and early way in double acid attacked titanium. At the end of experimental times, both surface treatments produced a comparable osteointegration rate.
Our results allow to positively consider these treatments in order to improve prosthetic implant performances in clinical application.
Key words: biomaterials - titanium – surface treatments - rabbit – bone tissue –– osteointegration
1-INTRODUCTIONTitanium, pure or alloyed with other elements (Ti6Al4V, Ti6Al7Nb), is a
widely used material for biomedical applications. Titanium is a bio-inert material with intermediate characteristics of
workability and load resistance. Biotolerated metallic alloys, like surgical steel or CoCrMo alloy, present excellent workability and load resistance, but give unsatisfactory bone response and implant osteointegration, while bioactive materials (hydroxylapatite (HA) ceramic, bio-glasses) can provide good osteointegration but have bad characteristics of load resistance. Titanium is more elastic than metallic alloys and provide high mechanical performance. Moreover, it presents high corrosion resistance and excellent biocompatibility. The minimal tissue reaction induced by titanium and the favourable tissue response is attributed to the protective and stable oxide layer naturally formed by spontaneous passivation on its surface in contact with air or water, isolating implant from external environment (1, 2).
Osteointegrated dental and orthopaedic implants are useful and commercially relevant clinical tools. Dental implants are made of pure titanium, while orthopaedic implants require the use of titanium alloys for higher load involved.
Further to biomechanical factors related to implant geometry and shape, the interaction between the implant and surrounding biological tissues plays a key role to achieve a good implant osteointegration. In this connection, the topography

309
Ann. Fac. Medic. Vet. di Parma (Vol. XXV, 2005) - pag. 307 - pag. 318
and chemistry of implant surface become relevant aspects for the performance of biomaterials in vivo (3-6, 7).
The osteointegration of an implant is the procedure by which mature bone is deposited directly on implant material without any intervening soft or fi brous tissue (8).
An ideal implant surface should be able to conduct or induce osteointegration, irrespectively of implant site, available bone volume or bone quality. As a consequence, the main attempt of research in implantology has focused on the surface modifying techniques to be applied to biomaterials, to obtain adequate biological responses.
Many procedures have been applied to titanium to improve tissue compatibility, making it suitable for dental and orthopaedic implants (1). Indeed, bone integration of titanium implants is modulated by its surface characteristics (9). Titanium implant surface can be smooth, rough or coated. Untreated surfaces possess at any rate titanium properties of enhancing osteogenesis (inertness in biological environment).
Surface micro-architecture can be optimised by the presence of rugosities or pores (10). Rough surfaces are obtained by chemical attacks (acid attack), sandblasting (with aluminium dioxide, titanium dioxide, HA, glass microspheres) (11) or titanium plasma spray coating. The resulting micro-roughness and high pureness improves prosthesis anchorage to bone tissue and mechanical stability to obtain a favourable load distribution. The surface roughness is one factor which helps in determining the balance between bone formation and resorption at the bone-implant interface, since it has been shown to affect the synthesis of biological factors by osteoblasts (9) and their cellular response to growth factors or cytokines (12).
Coated surfaces benefi t by the coating bioactivity to obtain the strongest bone-implant adhesion at an early stage after implantation. A bioactive material is able to exert a physical, chemical or pharmacological action on the host tissue metabolism. Titanium metal substrate can be coated with bioactive substances, that is calcium phosphate ceramics, like hydroxylapatite (HA) and tricalcium phosphate (TCP), and bio-glasses (7), by means of plasma spray techniques. These coatings are reported to promote direct bone-implant contact without intervening fi brous tissue (13). Nevertheless, bioactive coatings can present defective adhesion to metallic substrate for fragmentation, dissolution or delamination (14), that is, detachment between substrate and coating for their lack of homogeneity. The problem is probably related to the diffi culty to control the kinetics of deposit dissolution, which hampers the long term stability of such coatings (15). As a consequence, chronic infl ammatory reactions can develop and cause implant failure.
Different causes of failure have emerged, hampering implant durability. First of all, implant mobilization can occur for defective osteointegration associated with formation of fi brous connective tissue at the bone-implant interface in the fi rst period after implantation (14). This phenomenon is more likely to occur using smooth surface devices (2). A bad osteointegration can be caused by bacterial attack, infl ammatory reaction or exceeding loading/movement at the implant site during the phase of primary integration. Also, an allergic sensitization can take place after

310
Ann. Fac. Medic. Vet. di Parma (Vol. XXV, 2005) - pag. 307 - pag. 318
release of metallic ions. Focusing on physicochemical properties and morphology of implant surfaces
(15), the causes of failure can be contrasted modifying titanium surface and in particular the thickness, structure and composition of titanium oxide fi lm. Titanium surface treatments promote osteoblast adhesion and proliferation and inhibit bacterial adhesion and growth, enhancing osteointegration.
An essential requirement for a good osteointegration is the formation of “bone-like” apatite on the implant surface. Biomimesis is the presence of superfi cial functional groups able to promote apatite nucleation. In particular, the aim of biomimetic treatments is to create a new interface inserting proper functional groups, biological coatings with osteoconductive function (phospholipids) or biomolecules (biochemical functionalization) involved in bone regeneration process. These treatments enhance the mineralization process around the implanted material and improve the compatibility between implant and surrounding tissues.
Anodic oxidation is reported to be a preferred method to form rough, porous and thick oxide fi lms by spark discharges at a high electrolytic voltage (1). The treatment induces the formation of micropores and microprojections on the oxide fi lm. Increasing the oxide fi lm thickness usually increases its crystallinity and dissolution resistance (2). In the last years, anodic electrochemical treatments have allowed to supplement the titanium oxide fi lm with calcium and phosphorus, forming a thin and porous calcium phosphate-enriched surface layer. This technique is known as Anodic Spark Deposition (ASD) (1, 2, 10, 15). Coatings obtained by this process show good chemical and mechanical properties, as well as controlled microporosity (15). Some Authors (1) added a fi nal hydrotermal treatment to the ASD process aiming at changing the outer amorphous layer into a crystalline hydroxylapatite. The incorporation of calcium and phosphorus into the anodic oxide fi lm provide the compositional basis for the formation of calcium phosphates, primary inorganic phases of hard tissues, and has osteoinductive properties in physiological fl uids (2). These characteristics allow a more stable bind between metallic substrate and newly formed bone.
The aim of this study is to compare the biological response of bone tissue to differently treated titanium implants in rabbit femur. T1 is chemically-treated rough titanium achieved by a double step acid etching, and T2 is bioactive titanium obtained by Bio-SparkTM (BSP) treatment (15, 16). Tc is untreated machined titanium. Double step acid etching aims at providing a proper rough surface, after a previous decontamination by strong alkali etching, while BSP treatment involves a double ASD treatment and a fi nal alkali etching to modify the superfi cial titanium oxide fi lm. BSP treatment results in a thickened titanium oxide layer doped with calcium and phosporus. This layer exhibits a high bioactivity resulting in an enhanced calcium-phosphate nucleation from simulated body fl uids. Also, the presence of hydroxile groups on the oxide fi lm surface seem to affect the mineralisation potential (15).

311
Ann. Fac. Medic. Vet. di Parma (Vol. XXV, 2005) - pag. 307 - pag. 318
2-MATERIALS AND METHODS
2.1-Implants and surface treatmentsCylindrical implants of commercially pure grade 2 titanium with a diameter
of 3 mm and a length of 13 mm were used for testing 2 different titanium surface modifi cations in vivo.
Implant surfaces were obtained as follows: chemically-treated titanium, T1, resulted from a decontamination by strong alkali etching followed by a double step acid etching, the fi rst one carried out in 1M NaOH containing 2% H
2O
2 at 80°C for 10
minutes, the second in an acid water solution at 28°C for 1 hour. Electrochemically-treated titanium, named Bio-Spark
TM (BSP), T2, was prepared in an electrochemical
cell by 2 ASD treatments, the fi rst one performed in a solution containing calcium and phosphate ions, the second in a solution containing calcium ions only. A fi nal treatment in concentrated potassium hydroxide water solution at 60°C was performed. Untreated machined titanium, Tc, was used as control material. Materials were kindly supplied by the Department of Chemistry, Materials and Chemical Engineering “G.Natta”, Politecnico di Milano, Milano, Italy.
Materials were sterilized using gamma ray irradiation (25kGy for 14 hours).
2.2-Animals and surgery procedureApproval was obtained from Health Ministry prior to performing the study.
European and Italian regulations on animal experimentation were strictly followed according to the EC rules (EU 86/609). White New Zealand breeding age male rabbits of average weight 3,3 ± 0.2 Kg were used to evaluate osteointegration, biocompatibility and osteoinduction properties of testing materials. The study design was composed of two different experimental times: 45 and 90 days. For each experimental time, 4 animals were used and divided in two experimental groups of 2 animals each, group 1 for T1 and group 2 for T2. In each animal, T1 or T2 implants were inserted in the right femur distal epiphysis, while contralateral femur served as a control for the insertion of Tc implant.
Prior to surgery rabbits were given antibiotic therapy I.M. (Baytril, Bayer, 5 mg/kg) and analgesic therapy S.C. (Rimadyl, Pfi zer, 4 mg/kg). The specimens were inserted during surgical procedure in general anaesthesia (Domitor, Pfi zer, 0.1 ml/kg; Ketavet 100, Gellini, 0.3 ml/kg; Isofl urane-Vet, Mérial) with sterile techniques. After arthrotomy and luxaction of the rotula, a hole was performed in the throclear groove. The procedure was performed with attention to the specimen collocation in order to avoid motility. In the control segment of the left femur a hole was performed and the Tc implant was positioned in a stable way. Postoperative X-rays were taken to verify implant placement.
In order to assess the osteogenic activity, vital fl uorochromic bone markers were used, allowing to mark the areas of bone growth within the administration period (17, 18, 19). Labelling of bone deposition was performed by subcutaneous injections of two fl uorescent markers: Calcein Green (CG) (5 mg/Kg body weight, Sigma) and
312
Ann. Fac. Medic. Vet. di Parma (Vol. XXV, 2005) - pag. 307 - pag. 318
Xylenol Orange (XO) (90 mg/Kg body weight, Fluka). The animals belonging to the experimental time of 45 days were marked with CG on the 13th and 14th day after surgery, and with XO on the 31st, 32nd and 33rd after surgery. The animals belonging to the experimental time of 90 days were marked with CG on the 13th and 14th day after surgery and with XO on the 60th, 61st and 62nd day after surgery. CG shows a bright green fl uorescent glow (λ of absorption: 495 nm and λ of emission: 550 nm), while XO shows an orange fl uorescent glow (λ of absorption: 540 nm; λ of emission: 620 nm).
Animals were pharmacologically euthanised (Tanax, Roussel Hoechst, 0.3 ml/kg/bw) under general anaesthesia (Domitor, Pfi zer, 0.1 ml/kg; Ketavet 100, Gellini, 0.3 ml/kg).
2.3- Histological evaluationThe femoral distal epiphysis were harvested and processed for histological
evaluation. Undecalcifi ed bone specimens were fi xed in 70% ethanol, deydrated in graded ethanol (70%-100%) and embedded in MMA (Osteo-Bed, Polysciences).
Undecalcifi ed bone sections (thickness 100μm) of the embedded specimens were obtained with a diamond-edged blade in a rotating saw (Leiz 1600) following a section plane perpendicular to the implant long axis.
The histological evaluation was carried out taking into consideration at least six sections of each explanted bone segment at different heights; thus, corresponding sections from the left femur and from the right one at the same heights were compared (20). Controlateral implant allowed a paired evaluation, so that testing and control materials were compared within each animal. Thereby, the biological difference between individuals, which can be signifi cant, was essentially eliminated.
The analysis was performed by means of a stereomicroscope (Nikon SMZ 1000) with combined visualizing systems of polarised and fl uorescent light. The stereomicroscope was equipped with a digital camera for microscopic use (Nikon mod. DS-5M) connected to a PC with LUCIA G software, version 4.81 (Laboratories Universal Computer Image Analysis).
The Von Kossa stain technique was performed on 40 μm-thick deplasticized sections to differentiate mineralized bone, fi brous tissue and osteoid matrix.
3- Results and DiscussionIn the fi rst phase of analysis, polarised light was used due to its value in the
morphological-structural study of bone tissue. Such analysis provided the following information: the correct position of the implant, which was centrally located within the femur distal epiphysis and surrounded by spongeous bone tissue; the contact between bone tissue and the majority of the implant’s surface area in both control and testing materials, which showed a good interpenetration degree between the implant and bone tissue.
Bone tissue surrounding the implanted cylinders showed an alternate organization of waved and parallel fi bers. The presence of waved fi bers organization attests new bone deposition, since it represents the fi rst bone tissue forming in areas

313
Ann. Fac. Medic. Vet. di Parma (Vol. XXV, 2005) - pag. 307 - pag. 318
of quick reparation. No postoperative complications were seen. After performing Von Kossa stain on deplasticized sections, no fi brous tissue
ongrowth was observed around both testing and control implants.In the samples T1 and Tc from experimental group of 45 days, there was
contact between bone tissue and most of the implant surface; in the samples T2, the contact between bone tissue and implant was discontinuous.
The bone tissue surrounding the implanted cylinders showed an alternate organization of waved and parallel fi bers, but a waved fi ber organization prevailed at the interface with T1 and T2.
Analysis of samples from experimental group of 90 days showed a more extensive bone deposition around T1 samples than around T2 and Tc. After 90 days, the bone ring around T1 implant was thicker than the rings present around T2 and Tc, and than the ring around T1 after 45 days, too. After 90 days, the ring bone around T2 implant was continuous but thinner than the one around T1. At this experimental time the bone tissue surrounding implanted cylinders showed a prevalent organization of parallel fi bers characterized by regular birefringence. We hypothesize that the bone ongrowth could be remodelled after the fi rst phase of osteodeposition.
Figs. 1 and 2: Polarised light histological sections (magnifi cation 100X). Osteointegration of T1 implant (fi g. 1) and of T2 implant (fi g. 2) after 90 days.
Also, fl uorescent microscopy analysis was carried out on bone sections. Visualising marker fl uorescence, it was possible to assess the osteogenic activity of treated materials and control.
CG fl uorescence was present and well detectable in the samples of both experimental groups. The analysis of the samples from experimental group of 45 days showed a more extensive osteogenic activity around T1 implant than around T2 and Tc.
Nevertheless, the presence of bone tissue interposed between metal implant and fl uorescent lines was observed in T1 samples, while no interposition of bone tissue was detectable at the interface with T2. One might hypothesize that T1 stimulated
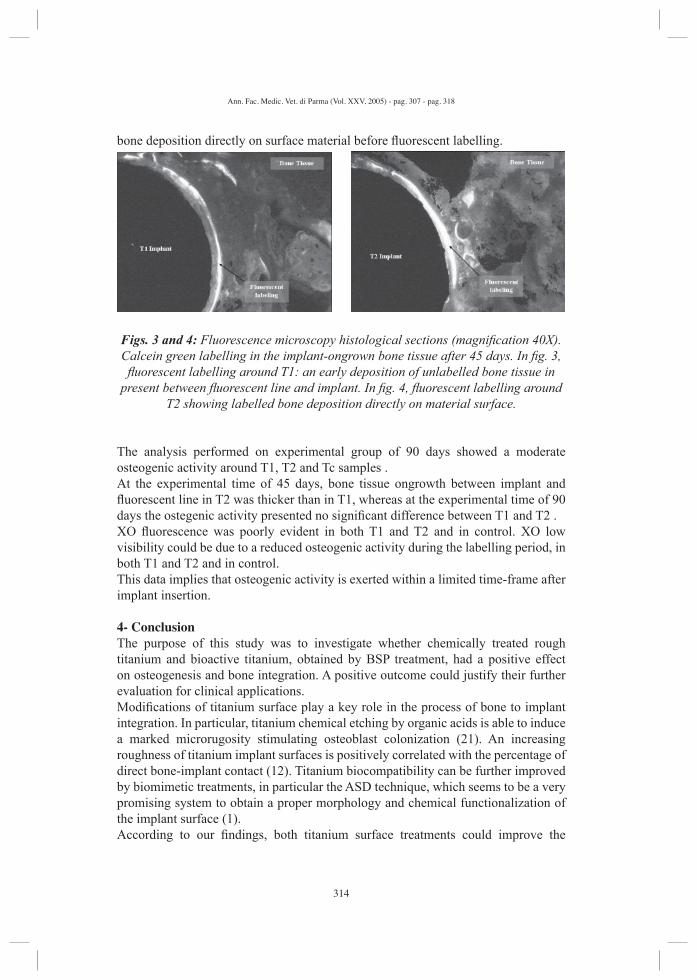
314
Ann. Fac. Medic. Vet. di Parma (Vol. XXV, 2005) - pag. 307 - pag. 318
bone deposition directly on surface material before fl uorescent labelling.
Figs. 3 and 4: Fluorescence microscopy histological sections (magnifi cation 40X). Calcein green labelling in the implant-ongrown bone tissue after 45 days. In fi g. 3, fl uorescent labelling around T1: an early deposition of unlabelled bone tissue in
present between fl uorescent line and implant. In fi g. 4, fl uorescent labelling around T2 showing labelled bone deposition directly on material surface.
The analysis performed on experimental group of 90 days showed a moderate osteogenic activity around T1, T2 and Tc samples . At the experimental time of 45 days, bone tissue ongrowth between implant and fl uorescent line in T2 was thicker than in T1, whereas at the experimental time of 90 days the ostegenic activity presented no signifi cant difference between T1 and T2 .XO fl uorescence was poorly evident in both T1 and T2 and in control. XO low visibility could be due to a reduced osteogenic activity during the labelling period, in both T1 and T2 and in control. This data implies that osteogenic activity is exerted within a limited time-frame after implant insertion.
4- Conclusion The purpose of this study was to investigate whether chemically treated rough titanium and bioactive titanium, obtained by BSP treatment, had a positive effect on osteogenesis and bone integration. A positive outcome could justify their further evaluation for clinical applications.Modifi cations of titanium surface play a key role in the process of bone to implant integration. In particular, titanium chemical etching by organic acids is able to induce a marked microrugosity stimulating osteoblast colonization (21). An increasing roughness of titanium implant surfaces is positively correlated with the percentage of direct bone-implant contact (12). Titanium biocompatibility can be further improved by biomimetic treatments, in particular the ASD technique, which seems to be a very promising system to obtain a proper morphology and chemical functionalization of the implant surface (1).According to our fi ndings, both titanium surface treatments could improve the

315
Ann. Fac. Medic. Vet. di Parma (Vol. XXV, 2005) - pag. 307 - pag. 318
osteointegration in the healing of bone adjacent to the implant in vivo. The chemically treated rough titanium T1 demonstrated to induce an early bone formation in the fi rst phase after implantation and the best bone apposition at the end of the experimental time. On the other hand, electrochemically-treated BSP titanium, T2, showed a good osteointegration, too, despite of the fact that bone deposition was slightly more delayed.However, after 90 days both T1 and T2 implants achieved a good grade of osteointegration.Both titanium surface treatments demonstrated that the achievement of a surface with similar morphological characteristics in terms of microroughness, avoiding the problems related to the coatings, could alone represent an interesting element speeding up bone contact to the implant surface. These results prove that the tested titanium surface treatments may be considered a key type of surface modifi cation for an increased osteogenesis and a strong and durable bone to implant connection in dental and orthopaedic implantology.
BIBLIOGRAFIA(1) Ishizawa H., Ogino M. (1995). Formation and characterization of anodic titanium
oxide fi lms containing Ca and P. J Biomed Mater Res 29: 65-72.(2) Zhu X., Kim K-H., Jeong Y. (2001). Anodic oxide fi lms containing Ca and P of
titanium biomaterial. Biomaterials 22: 2199-2206.(3) Tache A., Gan L., Deporter D., Pilliar R.M. (2004). Effect of surface chemistry
on the rate of osseointegration of sintered porous-surfaced Ti-6Al-4V implants. Int J Oral Maxillofac Implants 19(1):19-29.
(4) Cochran D.L., Schenk R.K., Lussi A., Higginbottom F.L., Buser D. (1998). Bone response to unloaded and loaded titanium implants with a sandblasted and acid-etched surface: a histometric study in the canine mandible. J Biomed Mater Res 40(1):1-11
(5) Cochran D.L., Nummikoski P.V., Higginbottom F.L., Hermann J.S., Makins S.R., Buser D. (1996). Evaluation of an endosseous titanium implant with a sandblasted and acid-etched surface in the canine mandible: radiographic results. Clin Oral Implants Res. 7(3):240-52
(6) Giavaresi G., Fini M., Cigada A., Chiesa R., Rondelli G., Rimondini L., Nicoli Aldini N., Martini L., Giardino R. (2003). Histomorphometric and microhardness assessments of sheep cortical bone surrounding titanium implants with different surface treatments. J Biomed Mater Res 67: 112-120
(7) Gabbi C., Cacchioli A., Ragionieri L. (2000). Valutazione istologica delle proprietà osteoconduttive di un doppio rivestimento bioattivo. Ann Fac Med Vet Parma XX: 29-33.
(8) Ahmad M., McCarthy M.B., Gronowicz G. (1999) An in vitro model for mineralization of human osteoblast-like cells on implant material. Biomaterials 20: 211-220.
(9) Bowers KT, Keller JC, Randolph BA, Wick DG, Michaels CM. (1992). Optimization of surface micromorphology for enhanced osteoblast responses in

316
Ann. Fac. Medic. Vet. di Parma (Vol. XXV, 2005) - pag. 307 - pag. 318
vitro. Int J Oral Maxillofac Implants 7:302-10. (10) Kryssman W., Kurze P., Dittrich K.H., Schneider H.G. (1984) Process
characteristics and parameters of anodic oxidation by spark deposition (ANOF). Crystal Research and Technology 19: 93-99.
(11) Li D, Ferguson S.J., Beutler T., Cochran D.L., Sitting C., Hirt H.P., Buser D. (2002) Biochemical comparison of the sandblasted and acid-etched titanium surface for dental implants. J Biomed Mater Res 60: 325-332.
(12) Suzuki K., Aoki K., Ohya K. (1997). Effects of surface roughness of titanium implants on bone remodeling activity of femurs in rabbits. Bone 21: 507-514.
(13) Klein CP, Patka P, van der Lubbe HB, Wolke JG, de Groot K. (1991). Plasma-sprayed coatings of tetracalciumphosphate, hydroxyl-apatite, and alpha-TCP on titanium alloy: an interface study. J Biomed Mater Res 25: 53-65.
(14) Albreksson T., Hansson H.A., Kasemo B., Larsson K., Lundstrom I. (1983). The interface zone of organic implants in vivo: titanium implants in bone. Ann Biomed Eng 11: 1-27
(15) Sandrini E., Chiesa R., Rondelli G., Santin M., Cigada A. (2003) A novel biomimetic treatment for an improved osteointegration of titanium. J Applied Biomat & Biomechanics 1: 33-42.
(16) Giordano C., Sandrini E, Del Curto B., Signorelli E., Rondelli G., Di Silvio L. (2004) Titanium for osteointegration: comparison between a novel biomimetic treatment and commercially exploited surfaces. J Applied Biomat & Biomechanics 2: 35-44.
(17) Rahn, B. A. and S. M. Perren (1971) Xylenol Orange, a fl uorochrome useful in polychrome sequential labeling of calcifying tissues. Stain Technol 46(3): 125-129.
(18) Rahn, B. A. (2003) Fluorochrome labelling of bone dynamics. Eur Cells and Mater 5(2): 41.
(19) Pautke, C., S. Vogt, et al. (2005) Polychrome labeling of bone with seven different fl uorochromes: enhancing fl uorochrome discrimination by spectral image analysis. Bone 37: 441-445.
(20) Schliephake, H., D. Scharnweber, et al. (2002) Effect of RGD peptide coating of titanium implants on periimplant bone formation in the alveolar crest. Clin Oral Implant Res 13: 312-319.
(21) Brunette D.M. (1988) The effects of implant surface topography on the behaviour of cell. Int J Oral Maxillofac Impl 3: 231-46.

Finito di stampare
nel mese di luglio 2006
da Toriazzi S.r.l. - Parma
Related Documents