Thesis Project Livestock Management June 2011 Hogeschool Van Hall Larenstein Broederij ter Heerdt Patrick Ketels Controlling chick quality

Welcome message from author
This document is posted to help you gain knowledge. Please leave a comment to let me know what you think about it! Share it to your friends and learn new things together.
Transcript
Thesis Project Livestock Management June 2011
Hogeschool Van Hall Larenstein
Broederij ter Heerdt
Patrick Ketels
Controlling chick quality

Controlling chick quality Hatchery ter Heerdt, June 2011
2
Preface This thesis is written at the request of Hatchery ter Heerdt, for the Bachelor Livestock management at hogeschool Van Hall Larenstein. The purpose of this project is to upgrade quality control and increase chick quality. First of all I want to thank my supervisors Marjan Peeters from Hatchery ter Heerdt and Ben Rankenberg from Van Hall Larenstein for their help and guidance during my thesis project. I am thankfull to Rob Nijsen and Edith Willemsen who gave me the needed input and guidance during my research in the hatchery. Also I want to thank Sander Lourens ( ASG) and Roos Molenaar (Hatchtech incubation technologies) who shared their knowledge and experience in researching chick quality and incubation processes. Their input of literature, guidance and ideas where from great value. Finally I would like to thank Hachery ter Heerdt for giving me the opportunity to fulfil my thesis project at their company.
Controlling chick quality Hatchery ter Heerdt, June 2011
3
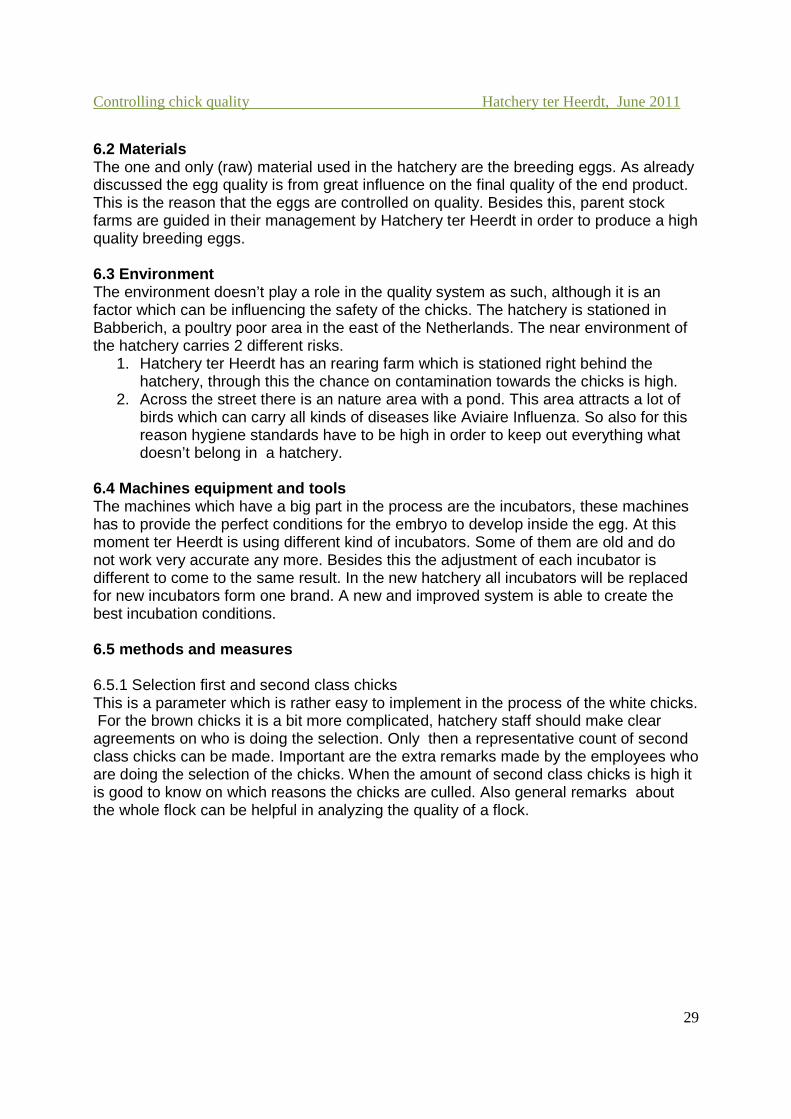
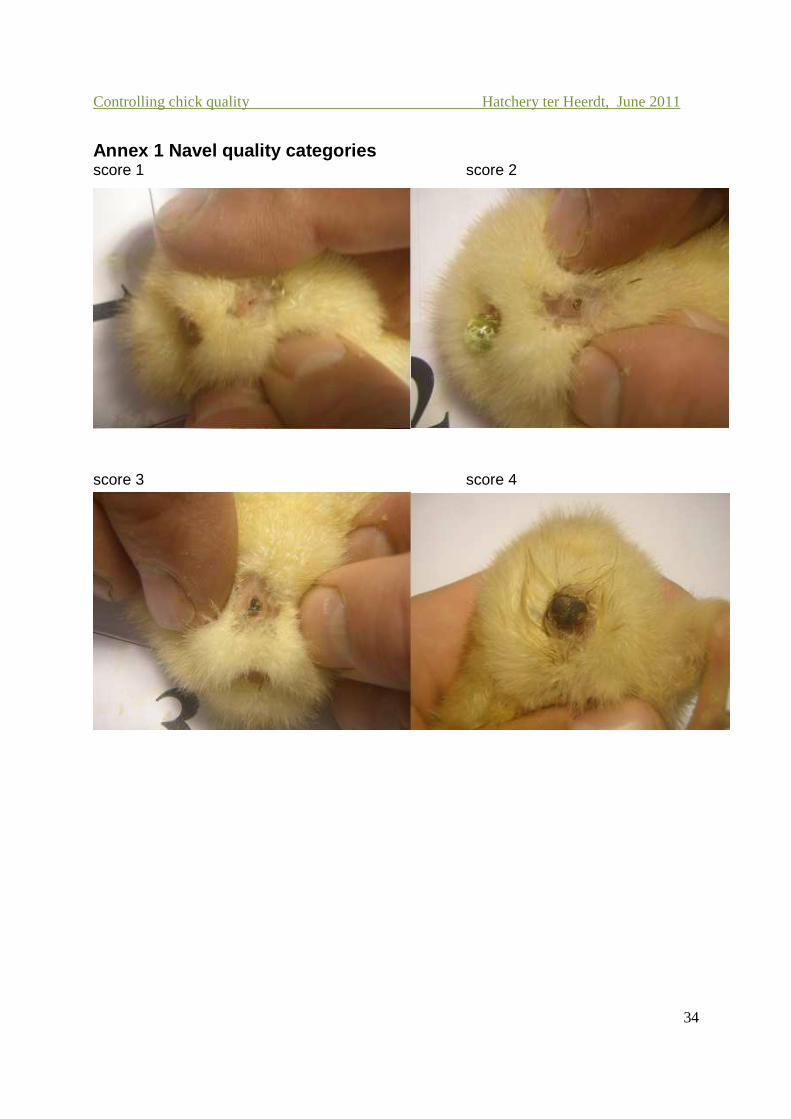
Summary In this thesis project I have done research how Hatchery ter Heerdt can improve their chick quality by introducing an objective quality scoring system for their outgoing product at the hatchery. New parameters like chick length and navel quality are tested in the hatchery. The results should be used to set goals and standards for the future. When these parameters are measured in the future the results can be compared with the preliminary results. The measurements provide information about the parent stock as well about the incubation process. The gathered information will make it possible to trace down possible problems in the hatchery or parent stock. Navel quality is one of the most important parameters in this quality control. The navel score is divided into 4 categories: 1 good, 2 sufficient, 3 feeble, 4 poor. The goal is to score at least 60% of the chicks with a navel quality in category 1 or 2. Chick length is another important parameter, literature shows an direct link between organ development and chick length. Beside there is a positive correlation between chick length and first week mortality. This shows the importance of chick length. During the tests in the hatchery an increasing chick length at a higher age of parent stock was found. A logical explanation is that an older parent stock produces bigger eggs in which bigger chicks can develop. The results are obtained by measuring and scoring 126 chicks per flock. Statistically this is a sufficient number of chicks for a sample. As well this sample size is practical implementable in the hatchery. Besides navel quality and chick length, other parameters are used to measure the chick quality. Uniformity, body temperature, hatching rate and the amount of second class chicks are measured as well. These parameters focus only on the quality of the chicks on day 1 of their life. Along the process of breeding much more quality matters are measured, for example the egg quality is controlled at the moment the eggs arrive at the hatchery. During this project a start is made on a quality scoring system in which the different quality controls could be combined. The control at the hatching day is combined with the egg quality and mortality during the first week as well. Trough this way a flock of chicks can earn 100 credits spread over all the parameters. In the end the gained credits give a quality score of the flock.
Controlling chick quality Hatchery ter Heerdt, June 2011
4
Table of content: Preface 2 Summary 3 Table of content 4 1 Introduction 6 1.1 Hatchery ter Heerdt 6 1.2 Objectives and research questions 7 1.3 Outline 8 2 Literature 9 2.1 Chick length 9 2.2 Uniformity 10 2.3 Navel score 10 2.4 Temperature 10 2.5 Other parameters 10 2.6 Egg storage 11 2.7 Incubation process 11 2.8 Other hatcheries (broilers) 11 3 Materials and methods 13 3.1 Selection during outcome 13 3.2 Navel score 13 3.3 Chick length 14 3.4 Uniformity 14 3.5 Statistics 15 3.6 Database 15 4 Results 16 4.1 Current situation 16 4.2 New parameters 17 4.3 Sample size 22 5 Discussion 24 5.1 Sub questions 25 5.2 Sample size 26 5.3 Influence of persons 27 5.4 Influence of incubation conditions 27 5.5 Influence of egg quality 27 5.6 Broilers standards 27
Controlling chick quality Hatchery ter Heerdt, June 2011
5
6 Conclusions & recommendations 28 6.1 Production process 28 6.2 Materials 29 6.3 Environment 29 6.4 Machines equipment and tool 29 6.5 Methods and measures 29 6.6 People 31 6.7 Final conclusion & recommendations 31 References 33 Annex 1: Navel quality categories Annex 2: Navel score & chick length measuring form Annex 3: Egg quality checklist Annex 4: incubation process from Annex 5: Chick processing Annex 6: Selection first and second class chicks Annex 7: Concept 100 point system

Controlling chick quality Hatchery ter Heerdt, June 2011
6
1.Introduction
Today Hatchery ter Heerdt is one of the leading companies in the poultry sector in the Netherlands. Their vision, to focus on producing a high quality layer hen is one of all times. This makes it necessary to keep up with the demands from today and be innovative towards the future. High resistant and long performing layer hens are the main target. Upcoming housing systems (organic and free range) demand a layer hen who can handle circumstances which are not optimal and a high infection pressure. The potential customers of Hatchery ter Heerdt are the type of farmers who really care about quality of their product. They believe that a high quality layer hen will be able to come to better results and high quality eggs. Therefore they will always demand the best quality layer hen. 1.1 Hatchery ter Heerdt Hatchery ter Heerdt produces and delivers 17 weeks old hens and 1 day old chicks for layer-poultry purposes. They have their own contracted parent stock and rearing farms, this makes it possible to control the quality from parent material to one day old chick and layer hen. In the Netherlands Hatchery ter Heerdt has a market share from approximately 40%. In 1935 Willem ter Heerdt didn’t expected that his mixed farm would grow until a leading company on the poultry market. In the sixties his sons Herman and Wim specified more on the poultry (layer) sector. At this moment the third generation ter Heerdt is leading the company. Together with Symen van de Velde, Niek and Chiel ter Heerdt are in charge of all practices, all of them own 1/3 of the company as well. During the years Hatchery ter Heerdt grew to the size it has today, still passion for the job is characterizing the people in the team ter Heerdt has. It is a family company who is proud on their expertise, entrepreneurship and reliability. (www.broederijterheerdt.nl) The directors of ter Heerdt all have their own responsibilities: Figure 1.1 Organization scheme Hatchery ter Heerdt
P & O
Inkoop
Administratie
Symenvan der Velde
Niekter Heerdt
Chielter Heerdt
Productie
Planning &Logistiek
Facilitairediensten
Eigen Opfok(Gerritshof)
Broederij
Pr &Netwerk
Verkoop &Marketing
Internationaal
Verkoop &MarketingNationaal
Kantoor
Controlling chick quality Hatchery ter Heerdt, June 2011
7
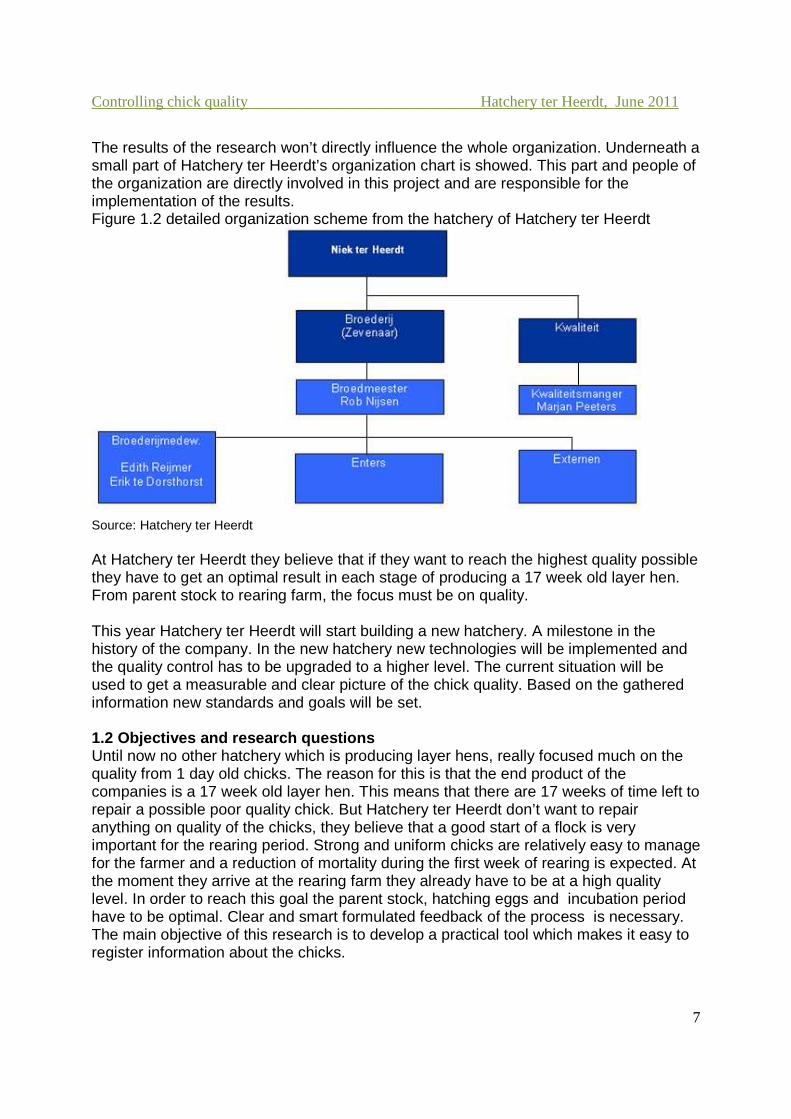
The results of the research won’t directly influence the whole organization. Underneath a small part of Hatchery ter Heerdt’s organization chart is showed. This part and people of the organization are directly involved in this project and are responsible for the implementation of the results. Figure 1.2 detailed organization scheme from the hatchery of Hatchery ter Heerdt
Source: Hatchery ter Heerdt At Hatchery ter Heerdt they believe that if they want to reach the highest quality possible they have to get an optimal result in each stage of producing a 17 week old layer hen. From parent stock to rearing farm, the focus must be on quality. This year Hatchery ter Heerdt will start building a new hatchery. A milestone in the history of the company. In the new hatchery new technologies will be implemented and the quality control has to be upgraded to a higher level. The current situation will be used to get a measurable and clear picture of the chick quality. Based on the gathered information new standards and goals will be set. 1.2 Objectives and research questions Until now no other hatchery which is producing layer hens, really focused much on the quality from 1 day old chicks. The reason for this is that the end product of the companies is a 17 week old layer hen. This means that there are 17 weeks of time left to repair a possible poor quality chick. But Hatchery ter Heerdt don’t want to repair anything on quality of the chicks, they believe that a good start of a flock is very important for the rearing period. Strong and uniform chicks are relatively easy to manage for the farmer and a reduction of mortality during the first week of rearing is expected. At the moment they arrive at the rearing farm they already have to be at a high quality level. In order to reach this goal the parent stock, hatching eggs and incubation period have to be optimal. Clear and smart formulated feedback of the process is necessary. The main objective of this research is to develop a practical tool which makes it easy to register information about the chicks.
Controlling chick quality Hatchery ter Heerdt, June 2011
8
At the moment quite some observations are done during processing of the chicks, but many of these observations aren’t written down or registered. The only specific chick quality information that is available is if the quality of chicks were good, average or poor. This judgment is always given by the breeding master and never by someone else, in times of absence nobody knows how the chicks are judged normally. Besides this some information about the breeding process and parent stock is recorded: egg outcome percentage, percentage of fertilized eggs and an egg quality score. Later on in the process the mortality during the first week at the rearing farm is registered as well. In order to provide the company with more detailed information about the quality of the one day old chicks a smart formulated quality score is necessary. In order to get this the following central question is formulated.
What is the best way for Hatchery ter Heerdt to determine an objective quality score system from their outgoing product at the hatchery?
Eventually the goal of the quality score system is to obtain a higher quality chick, the system is only a tool to measure the quality and to give an input where and how in the process factors could be changed to improve quality. To answer the main question and clarify the different influence factors on the production process in relation to quality control, , the ‘typical control points in agri-food production processes’ according to Luning (2002) will be used. The scoring system has to be created in a way that different employees at the hatchery can come to the same valuation of a flock. To get this a clear guideline has to be made and employees have to be trained to exclude different interpretations of the quality score system. To get an answer on the central question of this research the following sub questions are formulated.
Which parameters are used to measure chick quality in the current situation and what is done in other hatcheries to determine chick quality?
Which new parameters are needed; how to determine these and what should be the sample size?
What other quality checks are done now and how can the gathered information be combined?
1.3 Outline of the thesis report In Chapter 2 a literature review is given about the parameters and external influences on chick quality. Chapter 3 is describing the materials and methods of this research, this gives an explanation how and why certain parameters are used. The results are presented in chapter 4. In chapter 5 these results are discussed in the discussion. Finally in chapter 6 the conclusions and recommendations are given.

Controlling chick quality Hatchery ter Heerdt, June 2011
9
2. Literature Chick quality, a nice expression but what is chick quality? How can it be measured and decided which chick is high or poor quality. Several things can be observed on a one day old chick.
• Eyes, should be clean and bright. • Navel, closed, clean and not swollen. • Legs, no swollen or red hock, no malformations. • Beak, clean and normal colour, no malformations. • Yolk residue, belly is soft and pliable. • Down (feathers), dry and shiny. • Temperature, between 40 and 40.8 degree Celsius. • Chick length.
( Bestman. et all., 2011) All of these could be parameters to measure chick quality. Some of these also tell something about the development of the chicks; navel score and the length of the chick. Measuring chick length is developed and practically implemented by Hatchtech Incubation technologies. 2.1 Chick length The conclusion from Hill 2002,“The shortest chick length is found in hatcheries with the greatest first week mortality problems and hatchery problems” triggered Hatchtech’s own researchers to develop a way to measure chick length. The demand for a ‘tool’ which tells something about the development of an one day old chick is relatively big because chick weight doesn’t tell anything about it. During incubation the embryo is using the egg yolk for energy, and the end of the incubation period there is always some yolk left. This residual yolk is taken up in the body right before hatching. This yolk provides the chick from energy during the first days of life. This means that when a day old chick is weight not only the chick itself but also the yolk residue is weight.“ For example, a 45g day old chick weight may be a combination of 35g physical chick plus 10g of residual yolk, or it may be 42g chick plus 3g residual yolk. A difference of just 7g in actual bodyweight. Means that the 42g chick has developed 20% more body tissue than the 35g chick” ( Meijerhof, 2006) An important influence factor in chick length is the age of the parent stock. ‘chick length increases with breeder flock age”( Hill.D., 2002) This means that chicks only can be compared with chicks which come from a parent stock which is in the same age category. Chick length doesn’t only tell something about the development of a chick as a whole, there is a correlation between chick length and organ development as well. “The weight of the heart and liver was significantly different between the large and small group. The weight of the spleen was significant different between all three groups” (Molenaar R. and Reijrink I., 2006) The table on the next page presents an overview of the results founded by Molenaar and Reijrink.

Controlling chick quality Hatchery ter Heerdt, June 2011
10
2.2 Uniformity Uniformity in a flock is very important as day old chicks are not able to regulate their own body temperature. The environmental temperature is directly influencing the chicks body temperature. ‘This means that as environmental temperature decreases, the internal temperature of the chick is also reduced - and as small chicks have a higher surface to volume ratio, they lose more heat than large chicks.’(van de Ven.L., 2005) So to be able to create optimal conditions for al the chicks the uniformity plays an important role Figure 2.1 Average weight and length of chick parameters per group of chick length.
2.3 Navel score Another important parameter is the Navel score, it tells something about the quality and development of the chicks. When the incubation conditions were not optimal and the chicks are poor developed, a higher percentage chicks with a bad closed navel and navels with a black lump on the navel will be seen.(Lourens. A. and Jongbloed. A.W., 2008) A well developed Chick normally will have a clean and totally closed navel. A bad closed navel increases the risk on a yolk sac infection which is often deadly. “As bacteria penetrate into yolk sac, immune system and antibodies can't destroy them, since yolk sac does not contain blood vessels” (Rad.M. et all, 2003) 2.4 Temperature During the first days of a chickens life it is not able to regulate it own body temperature, besides this the digestive and immune systems are not fully developed yet. (www.Hatchbrood.nl) This means that the environment in which the chicks are living has to be at an optimal temperature for the chicks. ‘The optimal body temperature for a day old chick is 40,6 degrees Celsius, at this temperature metabolic processes, growth and development are optimized’ (Maartjens C., no date) Measuring the body temperature is the only correct way to control the environmental temperature of the chicks and this should be an input to regulate environmental conditions. 2.5 Other parameters The legs and beak are things to look at as well. ‘Red hocks and/or a red beak are symptoms which point to high temperatures in the setter and hatcher.’( Boerjan.M.,2006) The red spots on the hocks and beak aren’t a problem as such but it tells something about the circumstances during hatching. A to high temperature during and right after hatching makes it hard for the chicks to digest the yolk residue. This is increasing the chance on a yolk sac infection.
Controlling chick quality Hatchery ter Heerdt, June 2011
11
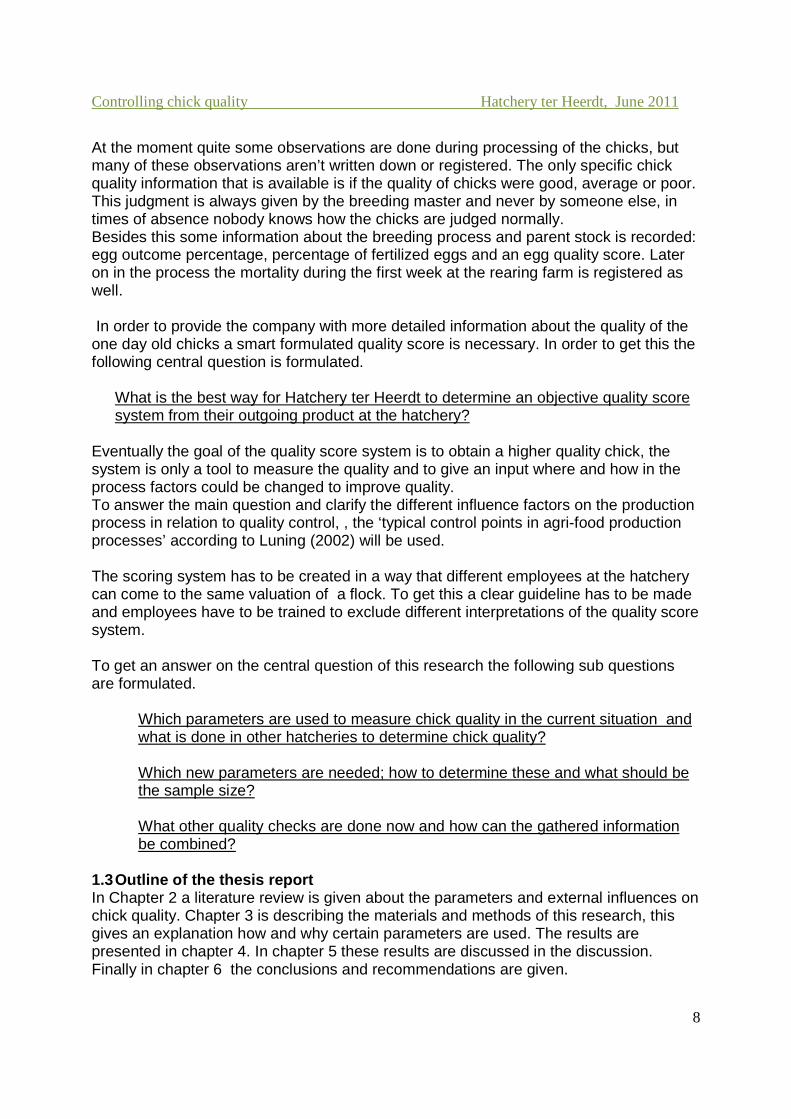
2.6 Egg storage Before the eggs start on the incubation period they are stored and transported to the hatchery. The conditions in which the eggs are stored is very important for the results of the incubation process. Most important is that before the eggs start on their incubation process there is no chance that there already was embryonic activity. This starts at a temperature of 18 degrees Celsius. This has to be reached by storing the eggs in the right circumstances. Figure 2.2 Recommended hatching egg storage temperatures
(Ernst, 2004) 2.7 Incubation process During the incubation period the egg shell temperature always should be the leading factor in the decisions of a breeding master. Research has shown that highest hatchability and embryo development were always found when eggshell temperature was maintained at 37.8 degrees C constantly throughout incubation. ( Lourens. A. et all, 2005) Another important factor is humidity, when regulating the relative humidity(RH) in the incubator there are two important things to take into account.
• ‘Eggs should lose 11-13 per cent of initial weight during the first 18 days of incubation.’ (Boerjan M., 2010 ) this happens through the evaporation of water. The RH in the incubator has to be at the level that the eggs can evaporate enough but not evaporate to much water.
• To get equal circumstances everywhere in the incubator, humidity is used as an conductor for temperature. (Nijsen.R.)
2.8 Other hatcheries (broilers) In broiler hatcheries the importance of good quality chicks is much more important than in the layer sector. The chicks only become 6 weeks old and thus called ‘sprinters’ when they have a bad start it is almost impossible to catch up. Different from the layer ‘stayer’ which has to perform over a much longer period. It is logical that for a breeder of broiler chicks the quality is more important, also because it is their end product and directly sold to the customer, so there it is impossible to ‘repair’ a poor quality chick in a rearing period. So the importance of a high quality chick is much bigger for a broiler hatchery than it is for a hatchery in the layer sector.

Controlling chick quality Hatchery ter Heerdt, June 2011
12
The breeding process in broilers is not only from higher importance, evaluating the results of the incubation process is a bit easier than in the layer sector. Broiler chicks have to perform straight away and important parameters are growth and mortality. Both of these are important for the farmer and as well for the hatchery. The start of the fattening period is very important and the results of the first week are good parameters for measuring the chick quality. In the hatchery quality control is been done as well, especially chick length, weight and navel quality are important parameters. Research has shown that there is a positive relation between chick length at day 0 and weight at day 7 (Molenaar R. and Reijrink I.,2006) This makes it logical for a broiler hatchery to measure chick length and search for ways to increase the chick length and with this the development of the chick at the moment of hatching. The weight of the chicks is measured as well. The weight of a one day old chick as an individual parameter doesn’t tell much but in combination with length it can have value for the breeding master as well. Besides this weight is very important in the broiler sector and thus broilers are weight on a daily base, so weights can be compared and thus the weight from the chick at day 0 has value as well. The quality of the navel is an important parameter in the broiler production, in general the quality of broiler chick navels is better than those from the layers. For the broiler sector Hatch-tech incubation technologies developed a quality control form with detailed standards for the quality of the navel: Figure 2.3 description of the navel quality Perfect (1) - Navel is flat and closed.
- Nothing is protruding from the navel. Moderate (2) - There is dried membrane in the navel.
- A black button that must be < 2mm. - The navel may be swollen or red. - A string may be present.
Poor (3) - There is a black button that exceeds 2mm.
Source: Hatchtech incubation technologies; chick quality program, navel quality Figure 2.4 pictures of the different navel quality categories
Source: Hatchtech incubation technologies; chick quality program, navel quality

Controlling chick quality Hatchery ter Heerdt, June 2011
13
3. Materials & methods In order to find and select the parameters which are necessary to evaluate the chick quality, literature is studied and experts (Rob Nijsen, Sander Lourens, Roos Molenaar) on breeding processes and chick quality are consulted. To collect information from the experts I have spoken with Sander Lourens (ASG), Roos Molenaar (Hatchtech) at the hatchery from Hatchery ter Heerdt and I visited hatchery Lagerwey (broilers) together with Inge Reijrink (Hatchtech).The information provided by Hatchtech incubation technologies is used to make the first concept version of a quality check list. To test the parameters in practice there where two possibilities every week, on each Tuesday and Friday chicks where processed. On each ‘chick day’ measurements on chick length and navel quality where done to get an impression of the quality of the chicks. The collected information is used to set standards and to build up comparison material. 3.1 Selection of outcome When the chicks are processed the chicks which don’t meet the minimum quality standard are culled, this is the first selection of the chicks. The percentages of chicks who are culled tells something about the general quality of the chicks. When the percentage of chicks which don’t reach the minimum quality standard is bigger, the overall quality of the chicks will be lower. In order to measure the quality of the chicks the number of chicks which are culled are counted and calculated into a percentage. During this first selection moment it is not possible to watch very precisely to all the chicks. But obvious malformations are often easily spotted by the employees. Examples of chicks who are culled: chicks without or with closed eyes, leg malformations, crossed beaks, very small and weak chicks, bold chicks, etc. All kinds of malformations are possible and need to be removed. 3.2 Navel score In this checklist the navel score plays an important role. To score the navel of a chick the choice is made to set 4 different categories. Originally the score from Hatchtech incubation technologies has 3 different categories: Perfect, average and poor. A fine working system but mainly developed to score broiler navels who generally are from a much higher quality than layer chicks. After a few try-outs with 3 categories there is decided to create an extra category which leads to more specific and valuable information for layer chicks. The navel score was divided in 4 different categories,: 1 good, 2 sufficient, 3 feeble, 4 bad (annex 1). To clarify each category pictures where made from several navels. three Hatchery employees and myself, independently from each other placed each picture in a category. The pictures which weren’t placed in the same category by al four of us where discussed in order to come to one single judgment. This judgment is used to clarify each category with the pictures.

Controlling chick quality Hatchery ter Heerdt, June 2011
14
3.3 Chick length Measuring chick length is developed by Hatchtech and they also wrote a protocol (chick quality analysis program) in which they describe how to measure the chick length. For this research most parts of Hatchtech’s protocol are used:
- To measure the chick length the tip of the beak is aligned on the end of a ruler and stretched along the ruler.
- The total length of the chick; from the tip of the beak to the end of the middle toe. It is important to stretch the chick to obtain an accurate measurement. During measuring no trauma of discomfort should be caused.
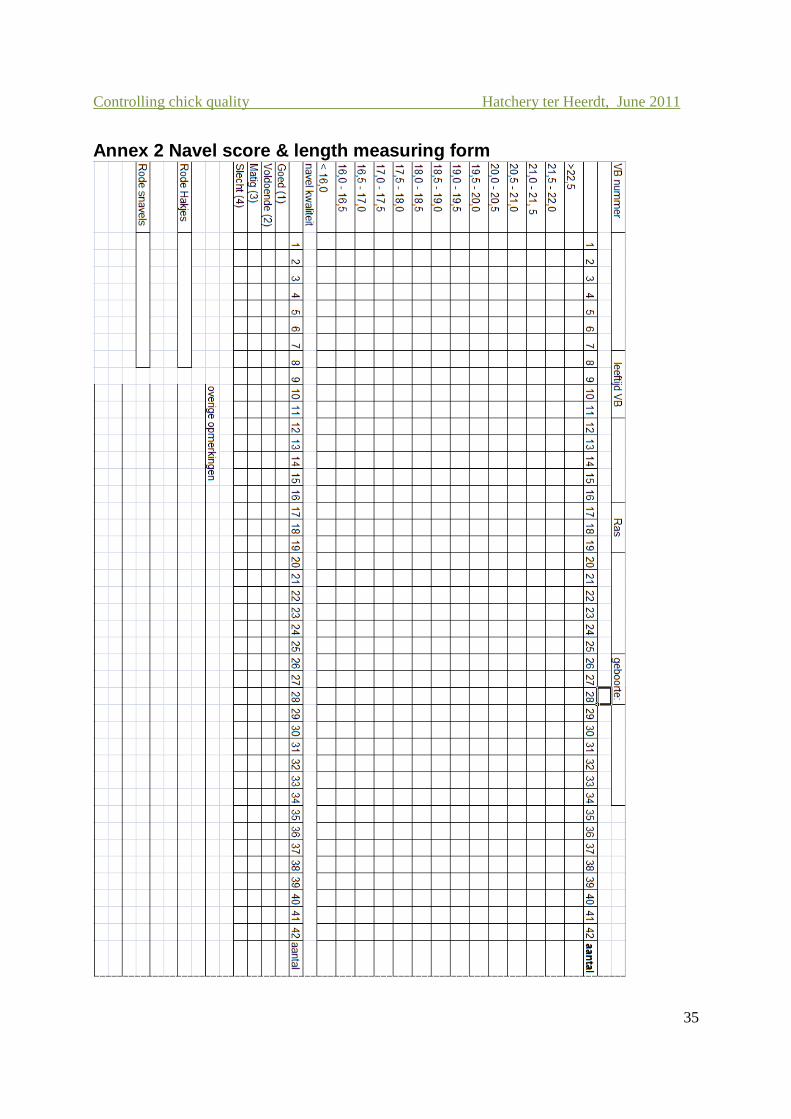
- Every measurement is marked in the correct category. Each category is 0.5 cm. for example when the length is 19.5 to 19.9 cm, it is recorded as category 19.5<20.0cm.
Different from the navel score, measuring chick length is done on the exact same way as Hatchtech developed it for measuring broiler chicks. The only difference is that the standards for a minimum chick length are different. Generally layer chicks are smaller than broiler chicks. To record the length and navel score during the control, the figure in annex 2 is used to note the results. 3.4 Uniformity The uniformity of a flock can be calculated with the measurements of the chick lengths. The chick length is measured in categories of 0.5 cm per category. A chick from 19,3 cm is noted in the category 19,0 to 19,5. To calculate the uniformity of a flock the number of chicks in the 3 biggest categories are counted, divided by the total number of chicks and multiplied by 100%. The result is the uniformity percentage. An example is given in figure 3.1. Figure 3.1 chick length used for uniformity
123/126 * 100% = 97.6 %
The uniformity of this example flock is 97.6 %
length: number of chicks
20,0 – 20,5 0
19,5 - 20,0 1
19,0 - 19,5 41
18,5 - 19,0 65
18,0 - 18,5 17 123
17,5 - 18,0 2
17,0 - 17,5 0
total: 126
Controlling chick quality Hatchery ter Heerdt, June 2011
15
3.5 Statistics In order to obtain a reliable outcome from the measurements a minimum sample size is needed. To find out which sample size is needed the following formula is used: n = p% × q% × ( z / e% )² This is a general formula which can be used for all kind of cases with an endless population (Saunders. M. et all, 2007). To be able to fill in all the needed figures tests are done in the hatchery. Most important in calculating the sample size is the reliability of the tests. For Hatchery ter Heerdt the tests need to have at least 95% reliability. On top of the statistical reliability of the test it is important for Hachery ter Heerdt that the test is practical implementable. It is important that it wouldn’t take a whole day of work for one person to score the quality of a flock. The first tests in the hatchery mainly had the purpose to find out the ability to implement certain parameters in the quality scoring system. 3.6 Database When all kinds of tests and controls are done on the incubation process and on the chicks, it is important to have a good database in which the results are recorded. When looking to general information of a parent stock or a rearing flock, the scores of chick quality have to be showed. One mark as result of the quality score will give a good impression in the general data from a parent stock or rearing flock. More detailed information only will be showed when someone is specifically looking. The ICT specialist of ter Heerdt will make it possible to implement chick quality information into the existing system.
Controlling chick quality Hatchery ter Heerdt, June 2011
16
4. Results In this chapter different results in different forms are presented. The current situation in relation to quality control is described in 4.1. New parameters are tested and the results of these tests are presented. The standards set based on these results are shown as well in 4.2 most important here are the navel score and the chick length. Several graphs clarify the results found in the hatchery. In order to execute the tests it was necessary to calculate the minimum sample size. The used formula and the figures used are explained in 4.3. Before the actual sample size was calculated some first testing was done already, this made it possible to predict a certain outcome which was necessary to calculate the minimum sample size 4.1 Current situation The parameters which are already used at the hatchery of Hatchery ter Heerdt are described in this chapter. The parameters shown here are not further tested during this thesis project. Only thing that is researched is which parameters are already used, how are these executed and way are they used. Each individual parameter used for the quality control in the current situation is described underneath. 4.1.1 Egg quality In the current situation several measurements are done to get a view on the eggs, incubation process and one day old chicks. The first thing that has been looked at is the quality of the breeding eggs. At the moment the eggs arrive at the hatchery the egg quality checklist (annex 3) is filled in by one of the employees. Each delivery is controlled on the correctness of the paperwork, eggs are weighed and random sampling is done to look at any abnormalities on the eggs. Possible special matters from the parent stock are noted as well. 4.1.2 Incubation period During the first 18 days of the incubation period several things are recorded. Every day each single incubator is controlled, temperature and humidity are recorded and when necessary adjustments are done on the settings of the incubator. To be able to know if the temperature of the incubator is leading to the correct egg temperature, egg temperature samples are taken. A thermometer is put trough the eggshell to measure the temperature inside the egg. Unfortunately this is lethal for the embryo, that is why often the eggshell temperature (EST) is measured as well with an infrared thermometer. Literature shows that 37.8 degrees Celsius is the optimal EST during incubation. It also shows the impact of EST during incubation (Lourens.A. et all.,2005).
Controlling chick quality Hatchery ter Heerdt, June 2011
17
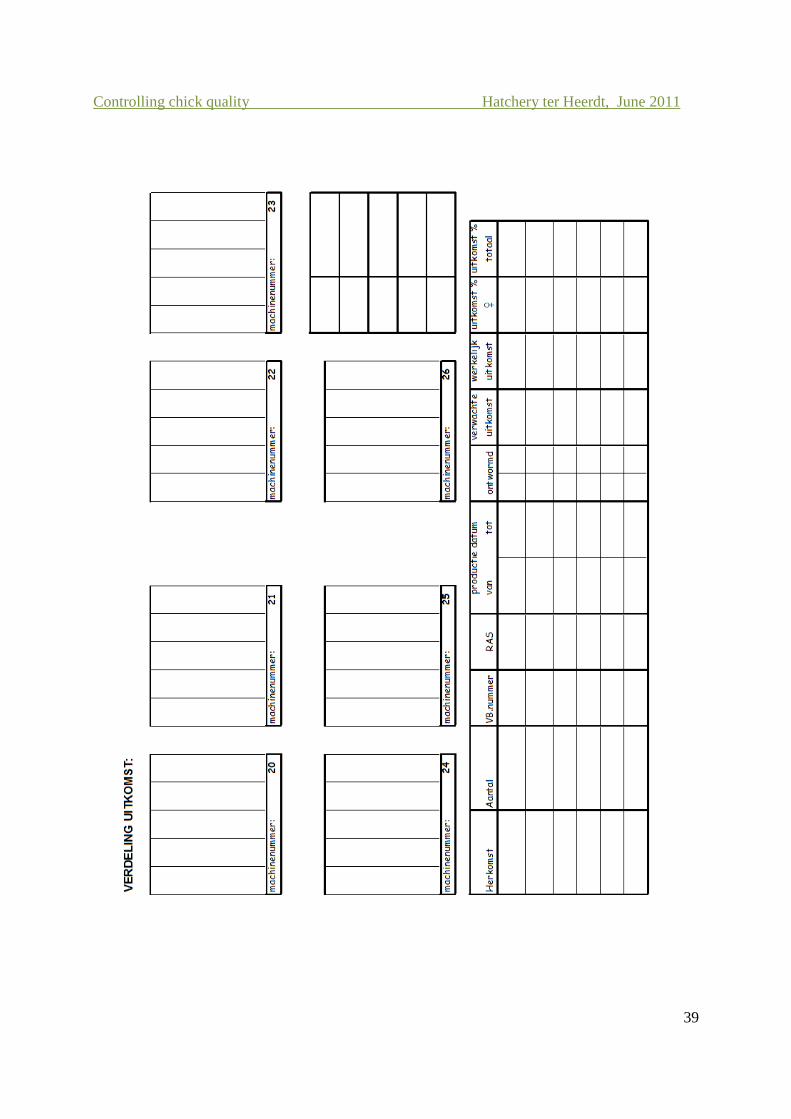
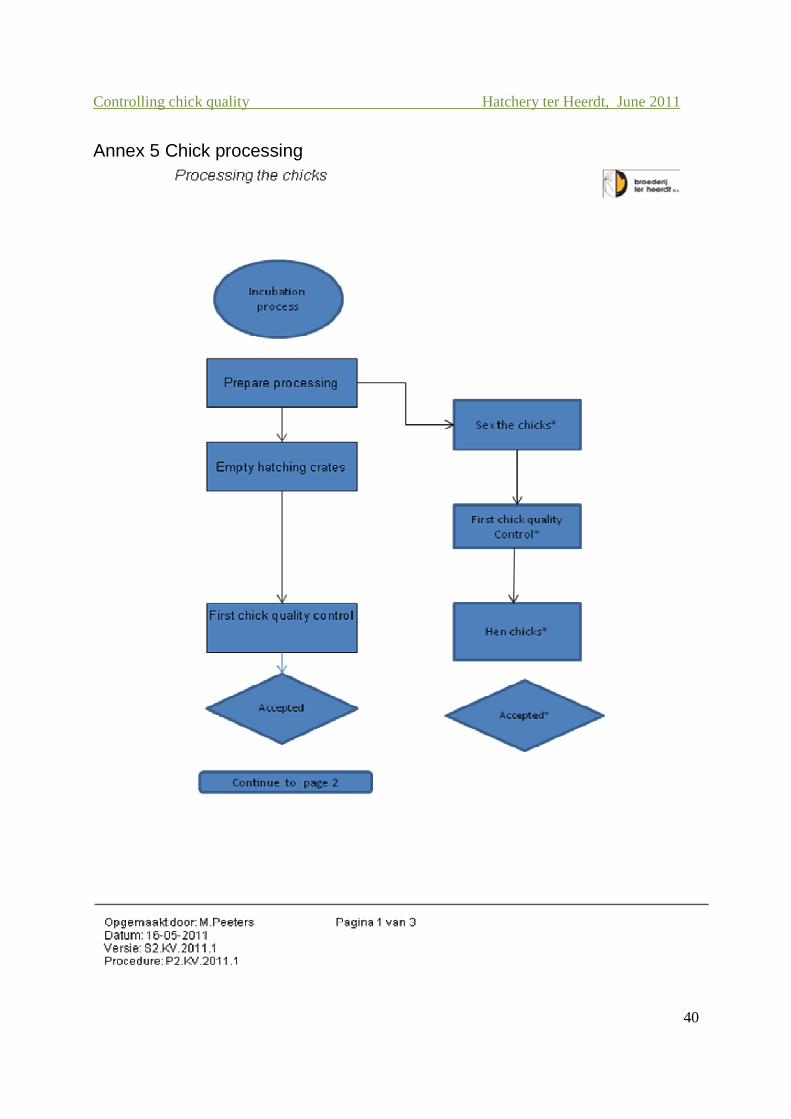
4.1.3 Conception rate On day 18 of the incubation process the eggs are moved to another incubator and put from drawers into crates. In these crates the chicks will hatch on day 21 of the incubation process. At the moment the eggs are moved from the drawers into the crates the conception rate is measured. A strong light makes it possible to see which eggs are fertilized and thus filled with an embryo and the eggs who aren’t fertilized and ‘empty.’ This is done to predict the number of chicks who will hatch at day 21, and to see how the parent stock is performing. The form which is used to register the unfertilized eggs is shown in annex 4. 4.1.4 Hatching rate The day the chicks are processed the hatching rate is calculated as well. this is done in a rather simple way. The chicks are counted at the end of the process, multiplied by 2 ( the cocks are taken away and killed) and divided by the number of eggs put in the incubators. This way of calculating hatching percentage means that only the first class chicks are counted. Every hen chick culled has no value and is not counted. The gathered information is used as feedback for the parent stock farmer and for the breeding master as well. For the breeding master the difference between the conception rate and hatching rate is important. 4.1.5 Judgment breeding master During the processing of the chicks the breeding master is judging the chicks on quality. This judgment is really based on the ‘ eye of the master’ The only thing that is recorded from this is the judgment: good, sufficient, feeble or poor. This judgment is mainly based on the vitality of the chicks. Problem is that there are no standards for vitality. When the breeding master is absent and someone else has to judge the chicks on quality, this judgment is not comparable with the judgments of the breeding master. 4.1.6 First week mortality The rearing farmer who works for Hatchery ter Heerdt have to send in all kind of information about the flock to Hatchery ter Heerdt. One of those things is the mortality from each week. The figures from the first week at the rearing farm tell something about the quality of the chicks and thus used to measure chick quality. 4.2 New parameters 4.2.1 Selection of first and second class chicks At the day of processing the chicks the selection of first and second class chicks is the first moment that the chicks are been watched. The chicks are processed by hand, employees put the chicks on conveyer belts to transport them further into the process. The process differs between brown and white brands (annex5). The brown chicks are sexed in the same crates as in which they hatched. So all the cocks are removed first and then the hen chicks are selected and transported towards the machine where they get several treatments. Because there are two different moments(annex 1) in the process on which chicks are removed from the crate it is hard to register the total number of chicks removed.
Controlling chick quality Hatchery ter Heerdt, June 2011
18
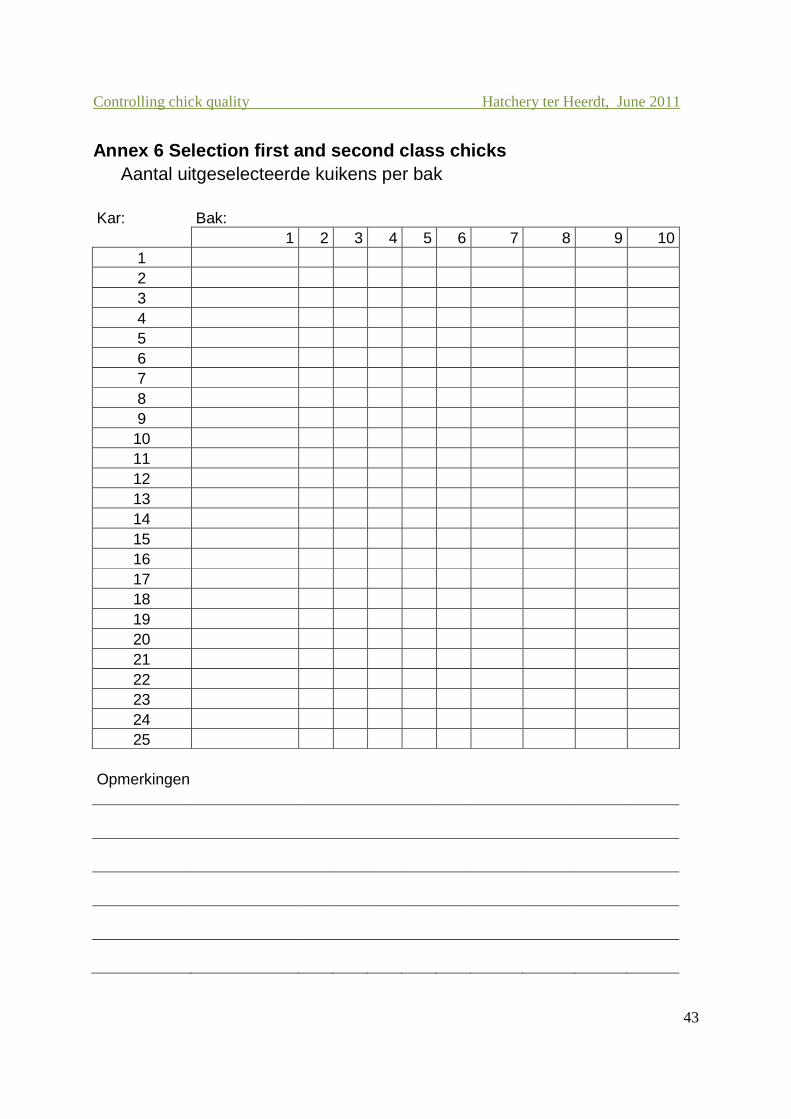
First the white chicks are selected and placed on a conveyer belt where specialized people remove the cocks from the hens. Big difference is that the white chicks are all removed from the crated at ones, every poor quality chick is left behind in the crate, both cocks and hens. This way of working makes it possible to get a good view on the number of chicks which don’t meet the minimum quality demands. To test the ability to implement this ‘chick count’ I chose logically for the white brands. In this process it is very easy to just write down how much chicks there are left in the crates after selection. From approximately 10 crates per 26 crates processed the number of chicks left over is written down. It hardly takes any time for one of the employees to fill in the list during the work. The number of chicks who don’t meet the quality demands tell something about the quality of the total flock. When the number of chicks with a poor quality is high there is a big chance that the general quality of the flock will be relatively poor. It gives an impression of the general quality of the chicks and it also shows more information about the difference between hatching and conception rate. The control list is showed in annex 6. To be able to implement this method on brown brands as well, further adjustments have to be done in the process. The people who sex the chicks shouldn’t cull the second grade chicks. This is a job for the ones who empty the crates. 4.2.2 Chick length Chick length is one of the parameters which is already used in broiler hatcheries and now introduced at the hatchery from Hatchery ter Heerdt. Different from the broilers is the size of the chicks, in the broiler sector the chicks are larger. This means that the standards used for the broilers are not ‘ready’ to use for layer chicks. The chick length of all the chicks which are measured is calculated into an average chick length. This is the figure which will be used to compare the chick length of the different flocks. The form used to register chick length and navel quality is shown in annex 2. Important in the comparison is that only the flocks which come from a parent stock with an age in the same category are compared with each other. For example, chicks from a parent stock with an age of 29 weeks can’t be compared with chicks from a parent stock with an age of 43 weeks. An older hen will lay an bigger egg and a bigger egg generally gives a bigger chick. In order to get an good comparison three different categories are used: young (25 until 30 weeks), middle (30 until 60 weeks) and old (60 weeks or more). Other factors which are strongly influencing the chick length are the brand of the chicks and the parent stock. So, the results of a certain flock can only be compared with another flock in the same age category and the same brand. The results tell something about how the different parent stocks from the same brand and age are performing compared to each other. An average of different parent stocks with the same brand could be compared with another breed as well. This will show how a brand is performing compared to other brands. Of course the age is taken into account as well.
Controlling chick quality Hatchery ter Heerdt, June 2011
19
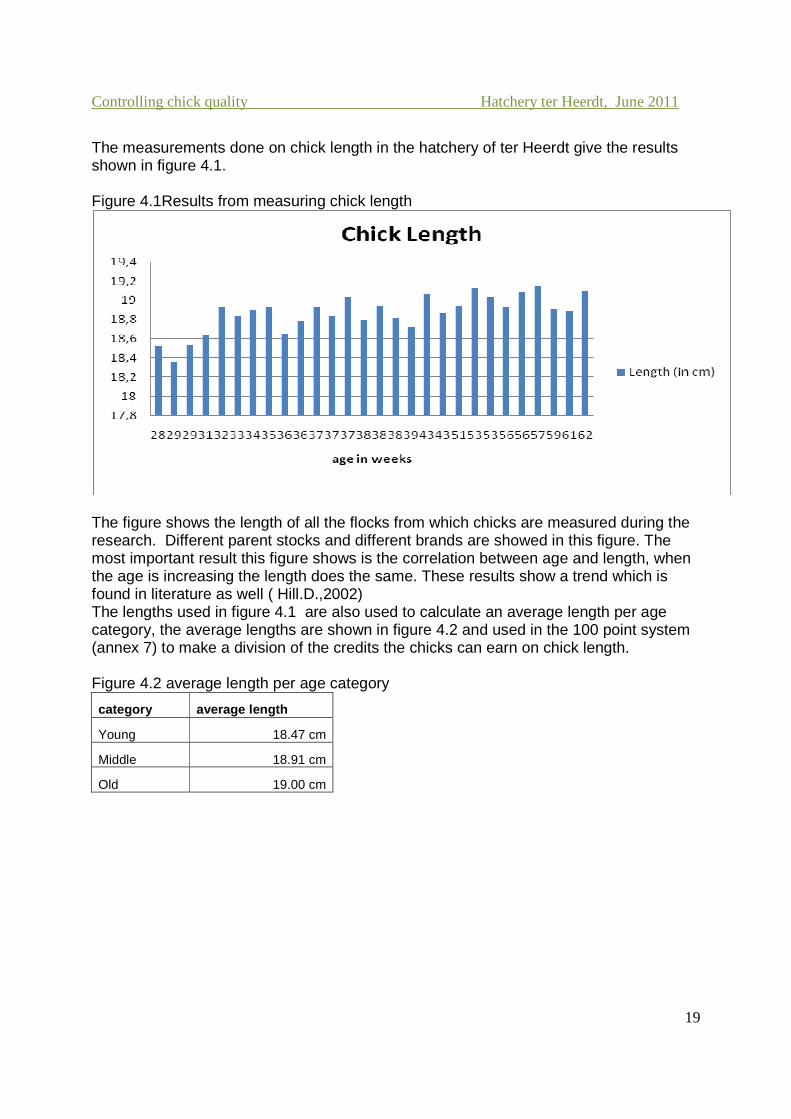
The measurements done on chick length in the hatchery of ter Heerdt give the results shown in figure 4.1. Figure 4.1Results from measuring chick length
The figure shows the length of all the flocks from which chicks are measured during the research. Different parent stocks and different brands are showed in this figure. The most important result this figure shows is the correlation between age and length, when the age is increasing the length does the same. These results show a trend which is found in literature as well ( Hill.D.,2002) The lengths used in figure 4.1 are also used to calculate an average length per age category, the average lengths are shown in figure 4.2 and used in the 100 point system (annex 7) to make a division of the credits the chicks can earn on chick length. Figure 4.2 average length per age category
category average length
Young 18.47 cm
Middle 18.91 cm
Old 19.00 cm

Controlling chick quality Hatchery ter Heerdt, June 2011
20
4.2.3 Uniformity The figure below shows the uniformity percentages of all the flocks who are measured, the standard for a good uniform flock in the broiler sector is 85%. Figure 4.3 Uniformity percentage per flock measured
Uniformity
80,0%
82,0%
84,0%
86,0%
88,0%
90,0%
92,0%
94,0%
96,0%
98,0%
100,0%
1 2 3 4 5 6 7 8 9 10 11 12 13 14 15 16 17 18 19 20 21 22 23 24 25 26
Reeks1
None of the flocks had an uniformity less than 85 % what means that all the flocks had a good uniformity in comparison with broiler standards. The average uniformity percentage of all the flocks together is even 93.3%. Literature shows the importance of uniformity (van de Ven.L. 2005) the high uniformity found in the tests make it possible to create optimal storage conditions for all the chicks of a flock. 4.2.4 Navel Quality The navel quality (annex 1) of a chick is a very important parameter which is telling something about the incubation process, the development of the individual chick and the chance on survival during the first week of rearing. (Lourens. A. and Jongbloed.A.W.,2008)(Rad. M. et all, 2003) Again also the factors brand and parent stock influence the quality. Although the biggest influence on the navel quality is the incubation process which has temperature as a leading factor. During the research different brands of chicks are scored on navel quality, at a hatching day the tests are done per flock from 1 parent stock, per test 126 chicks are been watched and judged. The tests are done together with measuring chick length. The two test together take about 1 hour of time per flock, what makes these quality test practical implementable. In figure 4.4 the different brands are compared to each other. The results consist out of different amounts of tests. The demand for certain brands (especially Dekalb White) is bigger than others and thus there were more possibilities to control the navel quality.

Controlling chick quality Hatchery ter Heerdt, June 2011
21
Figure 4.4; Navel quality per brand
The figure obvious shows which brand had the best navels and which brands the poorest. The chicks from Amberlink showed the poorest navels. The breeding master confirmed that this brand is more difficult to hatch then other brands. To see the differences between individual flocks, figure 4.5 is presenting the results of several flocks. Again it is obvious which flocks had a poor navel quality and which ones had good quality navels. Figure 4.5 Navel quality per flock
1 Amberlink
2 Bovans Brown
3 Dekalb White
4 ISA Brown
5 Lohman Brown
Controlling chick quality Hatchery ter Heerdt, June 2011
22
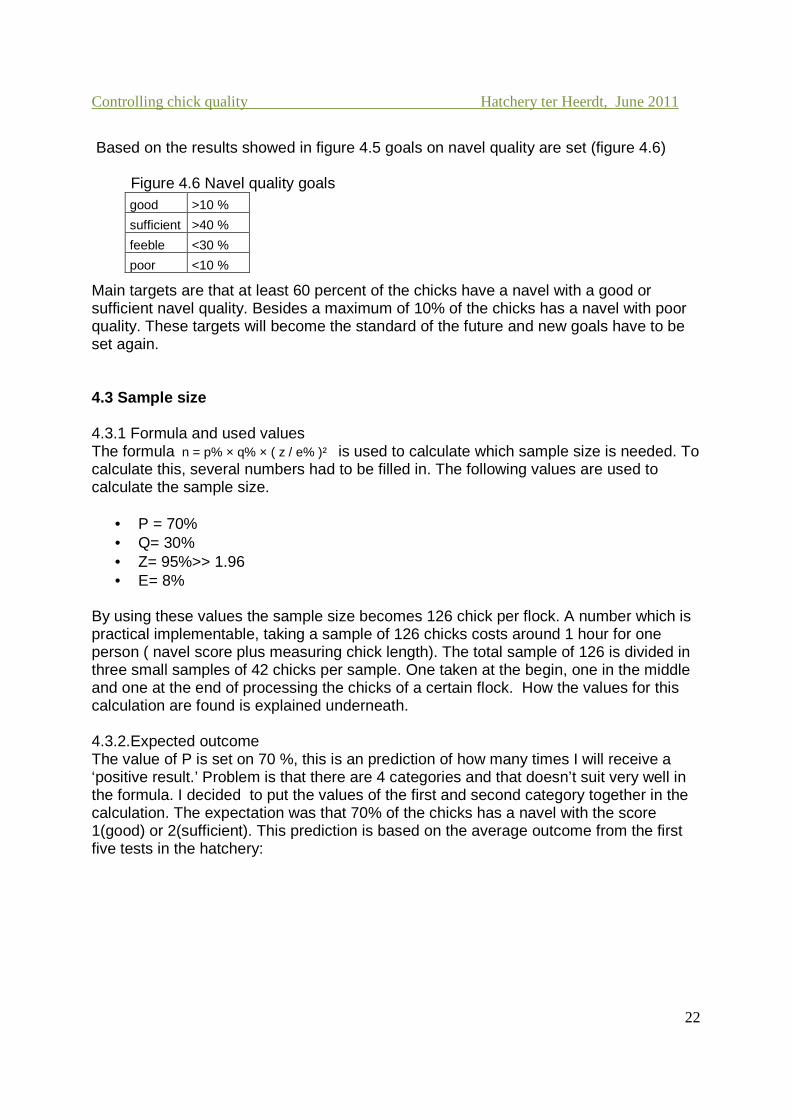
Based on the results showed in figure 4.5 goals on navel quality are set (figure 4.6) Figure 4.6 Navel quality goals
Main targets are that at least 60 percent of the chicks have a navel with a good or sufficient navel quality. Besides a maximum of 10% of the chicks has a navel with poor quality. These targets will become the standard of the future and new goals have to be set again. 4.3 Sample size 4.3.1 Formula and used values The formula n = p% × q% × ( z / e% )² is used to calculate which sample size is needed. To calculate this, several numbers had to be filled in. The following values are used to calculate the sample size.
• P = 70% • Q= 30% • Z= 95%>> 1.96 • E= 8%
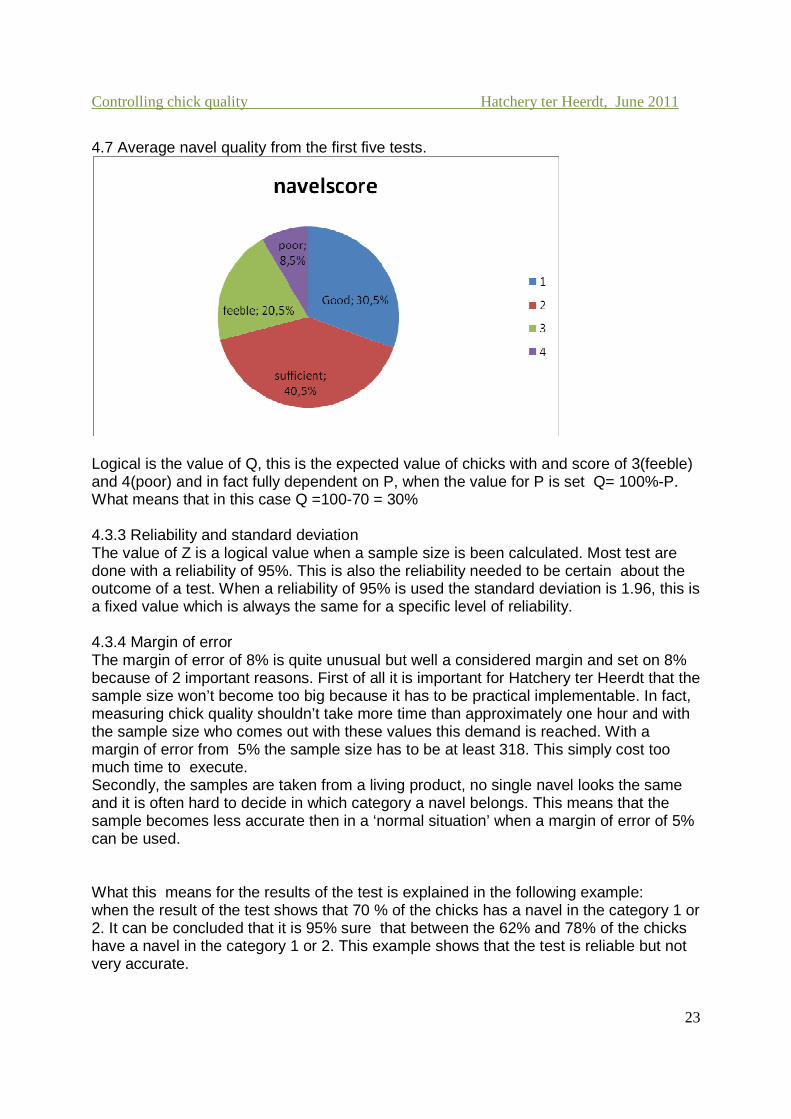
By using these values the sample size becomes 126 chick per flock. A number which is practical implementable, taking a sample of 126 chicks costs around 1 hour for one person ( navel score plus measuring chick length). The total sample of 126 is divided in three small samples of 42 chicks per sample. One taken at the begin, one in the middle and one at the end of processing the chicks of a certain flock. How the values for this calculation are found is explained underneath. 4.3.2.Expected outcome The value of P is set on 70 %, this is an prediction of how many times I will receive a ‘positive result.’ Problem is that there are 4 categories and that doesn’t suit very well in the formula. I decided to put the values of the first and second category together in the calculation. The expectation was that 70% of the chicks has a navel with the score 1(good) or 2(sufficient). This prediction is based on the average outcome from the first five tests in the hatchery:
good >10 %
sufficient >40 %
feeble <30 %
poor <10 %
Controlling chick quality Hatchery ter Heerdt, June 2011
23
4.7 Average navel quality from the first five tests.
Logical is the value of Q, this is the expected value of chicks with and score of 3(feeble) and 4(poor) and in fact fully dependent on P, when the value for P is set Q= 100%-P. What means that in this case Q =100-70 = 30% 4.3.3 Reliability and standard deviation The value of Z is a logical value when a sample size is been calculated. Most test are done with a reliability of 95%. This is also the reliability needed to be certain about the outcome of a test. When a reliability of 95% is used the standard deviation is 1.96, this is a fixed value which is always the same for a specific level of reliability. 4.3.4 Margin of error The margin of error of 8% is quite unusual but well a considered margin and set on 8% because of 2 important reasons. First of all it is important for Hatchery ter Heerdt that the sample size won’t become too big because it has to be practical implementable. In fact, measuring chick quality shouldn’t take more time than approximately one hour and with the sample size who comes out with these values this demand is reached. With a margin of error from 5% the sample size has to be at least 318. This simply cost too much time to execute. Secondly, the samples are taken from a living product, no single navel looks the same and it is often hard to decide in which category a navel belongs. This means that the sample becomes less accurate then in a ‘normal situation’ when a margin of error of 5% can be used. What this means for the results of the test is explained in the following example: when the result of the test shows that 70 % of the chicks has a navel in the category 1 or 2. It can be concluded that it is 95% sure that between the 62% and 78% of the chicks have a navel in the category 1 or 2. This example shows that the test is reliable but not very accurate.

Controlling chick quality Hatchery ter Heerdt, June 2011
24
5. Discussion 5.1 Sub questions 5.1.1Which parameters are used to measure chick quality in the current situation and what is done in other hatcheries to determine chick quality? To get a view on how to measure chick quality the current used parameters and the once used in other (broiler) hatcheries are studied. Most of the current used parameters at ter Heerdt are also used at the other hatcheries. All the parameters which aren’t used at ter Heerdt are showed in the list ‘other hatcheries.’ Current used parameters:
• Egg quality • Incubation period • Conception rate • Hatching rate • Judgment breeding master • First week mortality
Others hatcheries: • Chick length • Navel quality • Chick Weight • Mortality figures • Growth
5.1.2 Which new parameters are needed; how to determine these and what should be the sample size? Based on the parameters used by Hatchtech and other (broiler) hatcheries several parameters are introduced at ter Heerdt. The new parameters already proved their value in the broiler sector, to implement them at ter Heerdt the parameters are slightly adapted to make them valuable for layer chick production as well. Following parameters are used during this research and are implemented in the quality control system of Hatchery ter Heerdt.
• Selection first/second class chicks The amount of second class chicks together with some general remarks made by the people who work at this stage of the process gives a first impression of the chick quality. It has to be noted that the moment of hatching is influencing this test, when the chicks hatch relatively late the selection will be a bit higher because more chicks are still a bit wet and exhausted from hatching.
• Chick length A parameter which easily can be enrolled in the layer sector, only difficulty is setting the standards. When measuring chick length standards are set based on the average length of own produced chicks.
• Navel quality Measuring navel quality on a objective way is relatively difficult because the score is based on a judgment. Because the average navel quality from broiler chicks is better then those from layer chicks an extra navel quality category is added. Pictures are used to clarify the category and help to come to an objective and realistic judgment.

Controlling chick quality Hatchery ter Heerdt, June 2011
25
• Temperature
In order to control the environment during storage of the chicks temperature of the chick is measured several times. First at the end of the processing day, secondly right before transport and the last time right after arriving at the rearing farm. In the near future the Hatchbrood ( a machine in which chicks can be provided with feed, water and a perfect climate right after processing) will be used to create perfect environmental conditions for the chicks.
• Red hocks / beaks When the chick’s length is measured and the navel is scored, the beak and hocks are checked on red spots. these appear when the chicks are exposed to high temperatures during and right after hatching.
5.1.3 What other quality checks are done now and how can the gathered information be combined?
100 point system All the different information gathered about the quality of the breeding process and quality of the chicks must be combined. This will be done in a system where chicks can earn credits at each single parameter. This already starts at the moment the eggs arrive at the hatchery. The egg quality control will be the first stage of the total score. When a flock scores the maximum amount of credits at each stage it will earn 100 credits. With this system 1 single figure ( the total amount of credits) tells how the quality from a particular flock is. A concept version of the 100 point system is in annex 7. Only a structure about how to divide the credits is given, further development will be done by Hatchery ter Heerdt itself. An important issue to deal with is the frequency of the tests. The test will be done on ‘parent stock level’ this makes the result useful for all kinds of comparisons. The frequency is dependant of several factors. The idea is that from each parent stock a flock is scored 5 times. one time when the flock is young, three times when the flock is middle age and one time when the flock is old. Trough this way a good view on the development of a parent stock is obtained. And because there only can be done 1 score per ‘chick day’ this makes it relatively easy to plan the quality controls.
• 100 point system o Egg quality o Incubation period o Conception/hatching rate o Selection first/second class o Chick length o Navel quality o Chick temperature o Mortality first week
Controlling chick quality Hatchery ter Heerdt, June 2011
26
Quality assurance Doing quality controls and measurements are important but it is important that someone is comparing and controlling the outcomes as well. In practice the breeding master in cooperation with the hatchery workers will do the measurements in the hatchery. An important step after the different measurements, is processing the results into useful information. Important in this phase is that the information is not only processed but also checked and compared with each other. After the measurements are done at the hatchery, head of quality department will process the figures into the 100 point system and trace down possible mistakes in the measurements. The comparison between information out of the hatchery and the rearing farm should show the same trend. Unfortunately this system couldn’t be tested during this project, testing and developing the 100 point system will be done by hatchery employees from Hatchery ter Heerdt. 5.2 Sample size The sample size from 126 chicks per flock is based on a prediction that 70% of the chicks would have a navel score from 1 or 2. But the result of the tests show that only 60% of the chicks is reaching this navel quality. When this prediction is filled in the formula the minimum sample size is 144 instead of 126 chicks. Still a sample size of 126 chicks is used, most important reason is the practical ability to implement the quality score. With the current sample size it is able to do the scoring within an hour. When more chicks are checked on quality this will cost extra time. Besides this the current sample size is already bigger than the sample size used by others. Hatchtech is using a sample size of 100 chicks and is also advising her customers to use a sample size of 100 chicks when measuring chick quality. This gives ter Heerdt the confidence that 126 chicks in a test is enough to get an realistic view on a flock. The margin of error is 8% this means that the real outcome of a test can differ up to 16 percent from the result. Example: an outcome of a test is 50% this means that the real outcome lays between 42 and 58%, a range of 16%. So statistically seen the results of the test don’t tell that much about the real result. Again time was a limiting factor, the sample size can’t be too big because the tests should be practical implementable. When a lower margin of error was used for example 5 % the minimum sample size is 318. Practically impossible and thus the margin of error is set on 8%. All the test done are done with the same tools and instructions so it can be assumed that testing is done on the same way. This makes the results comparable with each other, and that is the most important thing for Hatchery ter Heerdt.

Controlling chick quality Hatchery ter Heerdt, June 2011
27
5.3 Influence of persons Measuring chick length and judging the chicks navels are two important parameters in the quality check. But there could be a lot of variety between the measurements of persons. When one person pulls hard on the leg of a chick and another doesn’t, chick length isn’t comparable. The tests done so far are all done by myself so the factor person isn’t an issue in the test results showed in this report. In the future employees of Hatchery ter Heerdt have to do the measurements by themselves. This means that there is a chance on different results. So it is important that the tests are done as much as possible by the same person. Besides this, pictures are used to decrease the influence of a person on the results. The test has to be objective so the standards are clarified as much as possible. 5.4 Influences of incubation conditions The incubation conditions are from great importance in the incubation process and from big influence on the quality of the chicks as well. Until now the conditions during the incubation period was not taken into account at the quality score. Because Hatchery ter Heerdt is using different kinds of incubators the circumstances in which the eggs incubated differ as well. In the future when all the incubators will be from one company this influence factor will be much smaller. For further testing it is wise to write down the numbers of incubators used for a specific flock. This makes it possible to compare the results from chicks coming out of different incubators. 5.5 Influence of egg quality The quality of the hatching eggs is very important in the incubation process. When an egg is broken it is practically useless for a hatchery because it won’t come out. Besides this, a dirty egg increases the change on bacterial growth and this can damage eggs or embryos as well. Also the egg size is important, it can be a useful parameter when chick length is analyzed. During the test I have done for this research, egg quality isn’t taken into account. This will be done in the total scoring system where the chick (egg) can earn credits at each stage in the incubation process. During the test the egg quality wasn’t relevant yet. When chick quality is poor, poor egg quality could be the explanation for it. And thus it is important to measure egg quality. But when setting an average quality standard for chick quality this isn’t relevant. Same thing counts for the influence of medicine use in the parent stock, often a bad hatching result is been found right after the use of medicines. Most regular is the treatment against worms. Because the impact from this could be quite big there are no flocks tested which recently had a treatment. 5.6 Broiler standards To measure the level of uniformity no layer standards are available and thus broiler standards are used to give a judgment. In the broiler sector uniformity of a flock of chicks is from comparable importance compared to layer flocks. For this reason I have assumed that an uniformity percentage of 85% or higher means that the uniformity of a flock is good.
Controlling chick quality Hatchery ter Heerdt, June 2011
28
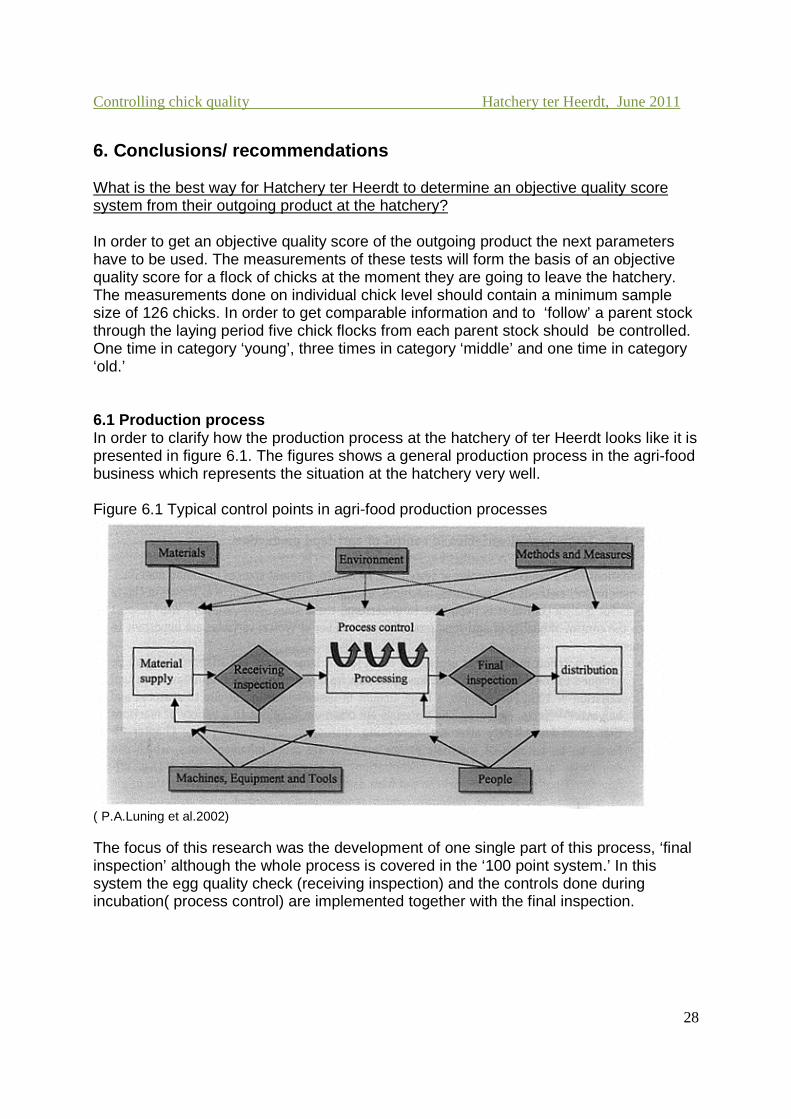
6. Conclusions/ recommendations What is the best way for Hatchery ter Heerdt to determine an objective quality score system from their outgoing product at the hatchery? In order to get an objective quality score of the outgoing product the next parameters have to be used. The measurements of these tests will form the basis of an objective quality score for a flock of chicks at the moment they are going to leave the hatchery. The measurements done on individual chick level should contain a minimum sample size of 126 chicks. In order to get comparable information and to ‘follow’ a parent stock through the laying period five chick flocks from each parent stock should be controlled. One time in category ‘young’, three times in category ‘middle’ and one time in category ‘old.’ 6.1 Production process In order to clarify how the production process at the hatchery of ter Heerdt looks like it is presented in figure 6.1. The figures shows a general production process in the agri-food business which represents the situation at the hatchery very well. Figure 6.1 Typical control points in agri-food production processes
( P.A.Luning et al.2002) The focus of this research was the development of one single part of this process, ‘final inspection’ although the whole process is covered in the ‘100 point system.’ In this system the egg quality check (receiving inspection) and the controls done during incubation( process control) are implemented together with the final inspection.
Controlling chick quality Hatchery ter Heerdt, June 2011
29
6.2 Materials The one and only (raw) material used in the hatchery are the breeding eggs. As already discussed the egg quality is from great influence on the final quality of the end product. This is the reason that the eggs are controlled on quality. Besides this, parent stock farms are guided in their management by Hatchery ter Heerdt in order to produce a high quality breeding eggs. 6.3 Environment The environment doesn’t play a role in the quality system as such, although it is an factor which can be influencing the safety of the chicks. The hatchery is stationed in Babberich, a poultry poor area in the east of the Netherlands. The near environment of the hatchery carries 2 different risks.
1. Hatchery ter Heerdt has an rearing farm which is stationed right behind the hatchery, through this the chance on contamination towards the chicks is high.
2. Across the street there is an nature area with a pond. This area attracts a lot of birds which can carry all kinds of diseases like Aviaire Influenza. So also for this reason hygiene standards have to be high in order to keep out everything what doesn’t belong in a hatchery.
6.4 Machines equipment and tools The machines which have a big part in the process are the incubators, these machines has to provide the perfect conditions for the embryo to develop inside the egg. At this moment ter Heerdt is using different kind of incubators. Some of them are old and do not work very accurate any more. Besides this the adjustment of each incubator is different to come to the same result. In the new hatchery all incubators will be replaced for new incubators form one brand. A new and improved system is able to create the best incubation conditions. 6.5 methods and measures 6.5.1 Selection first and second class chicks This is a parameter which is rather easy to implement in the process of the white chicks. For the brown chicks it is a bit more complicated, hatchery staff should make clear agreements on who is doing the selection. Only then a representative count of second class chicks can be made. Important are the extra remarks made by the employees who are doing the selection of the chicks. When the amount of second class chicks is high it is good to know on which reasons the chicks are culled. Also general remarks about the whole flock can be helpful in analyzing the quality of a flock.

Controlling chick quality Hatchery ter Heerdt, June 2011
30
6.5.2 Chick length Before someone can start on measuring chick length some training is necessary. What this person need is ‘feeling’ to do a good measurement the person needs to now how hard to pull. Researchers from Hatchtech are regularly in hatcheries to help and train people how to measure chick length. Before hatchery employees start on chick length measuring, Hatchtech’s researchers should be invited to teach them how it should be done. When trained people are measuring chick length it is a good measurable parameter which tells the hatchery a lot about the development of the chicks. The results founded in this research show the correlation between age of the parent stock and the length of the chicks. This makes it necessary to divide the flocks in different parent stock age groups to compare them with each other and to see if they meet the set standards. 6.5.3 Uniformity For management reasons rearing farmers and eventually the customer expect to receive an uniform flock form Hatchery ter Heerdt. And thus an important goal for Hatchery ter Heerdt’s breeding master is producing an uniform flock of chicks. The result of this research show that ter Heerdt is obeying this demand quite easily. None of the flocks tested had an uniformity percentage lower than 85% which means a good uniform flock in the broiler sector. And because of the absence of layer standards and a similar level of importance this standard of 85% is introduced at Hatchery ter Heerdt as well. 6.5.4 Navel score The navel score is a parameter which isn’t measured but scored based on the judgment of an employee. Through the usage of pictures the standards for different navel quality categories are set and the scoring could be done as objectively as possible. It is important that one person is doing the scoring so it is done on the same way over and over again. But when this person is not present someone else has to be able to take over the scoring. So communication between the ‘scoring’ people is very important. It seems wise to score chicks together once in a while to check if they judge equally. When possible, the breeding master himself is executing the tests, he is the one who can translate test results directly into actions during the incubation process. 6.5.5 Body temperature Measuring body temperature is a very good measurable parameter which is easy to implement as well. In fact it is already implemented and executed by the hatchery staff. At the end of the day on which the chicks are processed and waiting to be transported the body temperature is measured. A very important parameter in order to provide optimal circumstances during storage. To low or to high body temperature during the first day of life can have great impact on the chicks this underlines the importance of executing this control.

Controlling chick quality Hatchery ter Heerdt, June 2011
31
In the near future ter Heerdt probably will start to make use of the hatchbrood, a special devise in which the environmental circumstances are made perfect for the chicks. When this system is running well it can be assumed that measuring the body temperature will become less important. The hatchery staff then has to rely on the solidity of the hatchbrood, of course also the best machinery need to be controlled as well. First the machine has to prove that it is a useful and reliable device for Hatchery ter Heerdt before it is fully used. 6.6 People Important to know in a quality control system is who is responsible for what. First of all the general manager is responsible for the purchasing of breeding eggs. All the parent stock farmers have an advisor of Hatchery ter Heerdt who is supporting them in their management. Through this Hatchery ter Heerdt can keep a close eye on the production of their ‘raw material.’ The incoming eggs are controlled by a hatchery employee, the breeding master is responsible that the control is executed correctly. The next phase is the incubation period, the breeding master makes the decisions and will be responsible for the incubation process. The final control on the chicks in the hatchery is preferably executed by the breeding master, but can be done by another staff member. Fact is that the breeding master stays responsible for the testing. This means that the breeding master plays the most important role in this process. He is responsible for the quality of the chicks and for the quality control as well. The results of all the measurements done in the hatchery are combined and controlled by the quality manager. The different figures and measurements are compared and possible abnormalities are traced. Once in a while the quality manager will execute the measurements in the hatchery. 6.7 Final conclusion & recommendations In order to give a sequel to this project several things are from great importance. First of all the breeding master has to write down which actions he will undertake when the quality of the chicks is not sufficient. So what are the follow up actions when a certain problem occurs. Before this action can be taken the results of the tests are needed, to keep the hatchery staff motivated to execute the quality controls the results have to be showed to them regularly. The total quality control system is translated in the ‘100 point system’ this system need to be further developed, testing quality in the hatchery should be the main input to change standards and goals. Measuring chick length has to be done by trained people who can come to a comparable result. When untrained people measure chick length the results can differ a lot. The quality scoring system has to be implemented slowly, people have to get used to the extra work and changed expectations which come for their job, everyone has to be focused on quality. The standard for navel quality is set on 60% of the navels good or sufficient, on forehand 70% was expected. So it can be concluded that the navel quality is a bit less than expected. So the main goal on chick quality for the near future should be: improve navel quality.
Controlling chick quality Hatchery ter Heerdt, June 2011
32
In order to optimize the quality of the chicks as well as the control itself, it will be helpful to do some further research on rearing farms. What is important for rearing farmers? How do they look at chick quality and what are their parameters? By asking the rearing farmers these kind of questions Hatchery ter Heerdt can find out what the level of knowledge is and if it is necessary to inform them about chick quality. Farmers opinions and ideas could even be from value for Hatchery ter Heerdt. Investigate the possibilities for the follow up actions is something that is necessary. What can be done when the quality control has a certain result? How can the rearing farmer prepare himself on a relatively poor quality flock? And what can be done in the hatchery to prevent similar results in the future? These kind of questions have to be answered before the quality control system is running. The results of the quality control have to lead to actions. Evaluating the control system is very important. The employees in the hatchery have to put in a lot of effort to complete the quality score, this should lead to something valuable. The gathered information has to contribute in producing a higher quality chick.
Controlling chick quality Hatchery ter Heerdt, June 2011
33
References Bestman. M., Ruis. M., Heijmans. J., Middelkoop van. K. 2011. Kipsignalen. Boerjan. M. 2006. Maximising chick uniformity, performance and vitality Boerjan M. 2010. Optimal weight loss profile during incubation Ernst.A., Ralph., 2004, Hatching egg sanitation the key step in successful storage and production. Hill. D. 2002. Chick Length Uniformity profiles as a field measurement of chick quality Lourens. A., van den Brand. H., Meijerhof. R., and Kemp. B., 2005. Effect of eggshell temperature during incubation on embryo development, hatchability, and post hatch development. Lourens. A., Jongbloed.A.W. 2008. Effect van kruiden en kuikenkwaliteit op de respons van jonge biologische opfokhennen na een coccidiosebesmetting. Luning.P.A., Marcelis. W.J., Jongen.W.M.F., 2002, Food quality management a techno-managerial approach Maartjens.C.,no date. Maximizing day old potential Meijerhof. B. 2006. Chick size matters. Molenaar R. and Reijrink I., 2006, Chick length & Organ development. Rad.M., Esmailnejad. Z., Keleidari.Gh., 2003. Identification of gram positive bacteria involved in yolk sac infection. Saunders. M., Lewis.P., Thornhill. A., 2007, Research methods for business students Van de Ven. L., 2005, Maximizing uniformity through top level hatchery practice. Recourses : Hatchery ter Heerdt., organization chart http://www.hatchbrood.nl/hatchbrood/index.php., 10-05-2011 Hatchtech incubation technologies; chick quality program, navel quality Lourens. A., interview 02-03-2011, Lelystad Nijsen. R., interview 21-2-2011, Babberich .
Controlling chick quality Hatchery ter Heerdt, June 2011
34
Annex 1 Navel quality categories score 1 score 2
score 3 score 4
Controlling chick quality Hatchery ter Heerdt, June 2011
35
Annex 2 Navel score & length measuring form

Controlling chick quality Hatchery ter Heerdt, June 2011
36
Annex 3 Egg quality checklist Checklist controle inleg broedeieren
Inlegdatum
VB nummer
Ras
Gewicht
totaal gewicht per
tray Gewicht totaal gewicht per
tray Gewicht totaal gewicht per tray
1 6 11
2 7 12
3 8 13
4 9 14
5 10 15 Gewicht per tray = gewicht per 30 eieren
Controle per broedlade (150 eieren)
Broedlade 1 2 3 aantal
1 2 3
Vieze eieren ja/nee ja/nee ja/nee
Breuk ja/nee ja/nee ja/nee
Zandkoppen ja/nee ja/nee ja/nee
Dubbeldooiers ja/nee ja/nee ja/nee
Uniformiteit eieren goed/niet goed goed/niet goed goed/niet goed Eieren met punt naar beneden ja/nee ja/nee ja/nee
Stempel duidelijk ja/nee ja/nee ja/nee
Dagverse eieren ja/nee ja/nee ja/nee
Overige opmerkingen

Controlling chick quality Hatchery ter Heerdt, June 2011
37
Checklist controle inleg broedeieren
Inlegdatum
VB nummer
Ras
Datum ontvangst
Leverancier ISACOM / Verbeek / Siemers / Vepymo / Ander:
Volgens afspraak op tijd geleverd Ja / Nee Zo niet, wat was de reden van niet op tijd aanleveren
Aantal broedeieren Volgens afspraak juiste aantallen geleverd Ja / Nee
Zo nee, wat was de oorzaak
Juiste gegevens op kaart VB Ja / Nee
Zo nee, welke gegevens kloppen niet Zijn de karren waarop broedeieren worden aangeleverd schoon Ja / Nee
Ongedierte (muizen, bloedluizen etc) Ja / Nee
Temperatuur buiten
Overige opmerkingen

Controlling chick quality Hatchery ter Heerdt, June 2011
38
Annex 4 Incubator process form
Controlling chick quality Hatchery ter Heerdt, June 2011
39
Controlling chick quality Hatchery ter Heerdt, June 2011
40
Annex 5 Chick processing

Controlling chick quality Hatchery ter Heerdt, June 2011
41

Controlling chick quality Hatchery ter Heerdt, June 2011
42
Controlling chick quality Hatchery ter Heerdt, June 2011
43
Annex 6 Selection first and second class chicks Aantal uitgeselecteerde kuikens per bak
Kar: Bak: 1 2 3 4 5 6 7 8 9 10
1
2
3
4
5
6
7
8
9
10
11
12
13
14
15
16
17
18
19
20
21
22
23
24
25
Opmerkingen
Controlling chick quality Hatchery ter Heerdt, June 2011
44
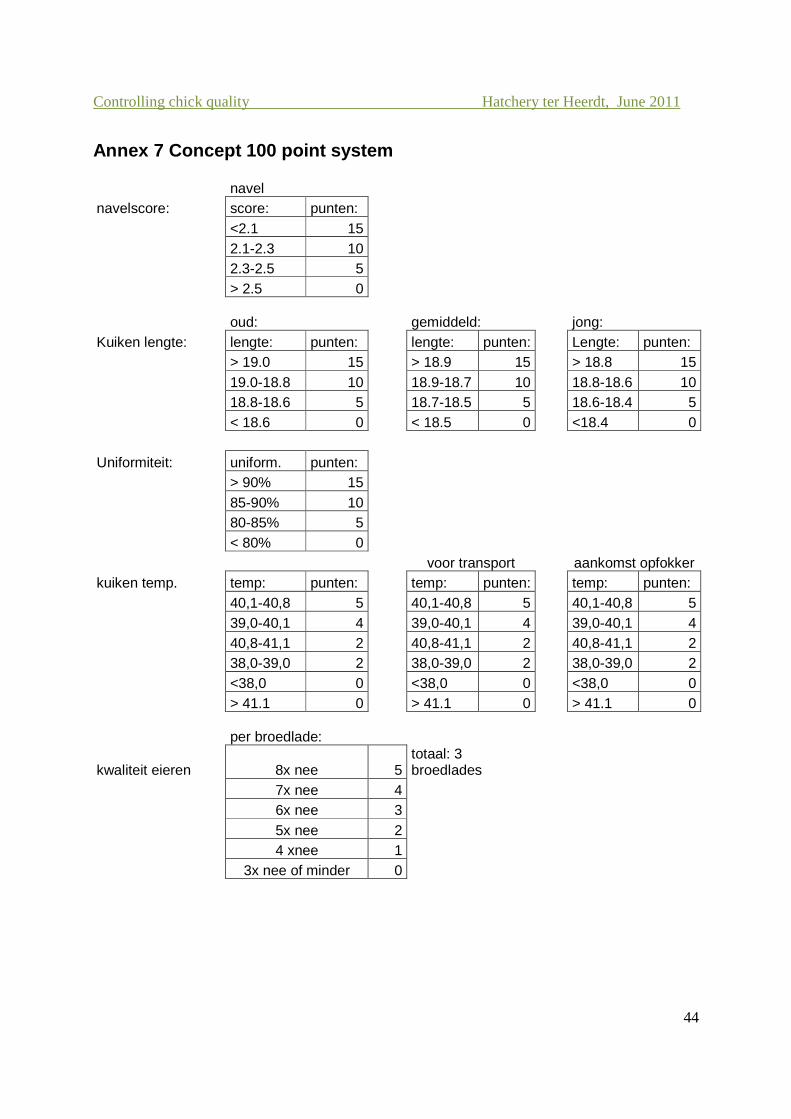
Annex 7 Concept 100 point system
navel navelscore: score: punten:
<2.1 15 2.1-2.3 10 2.3-2.5 5 > 2.5 0 oud: gemiddeld: jong:
Kuiken lengte: lengte: punten: lengte: punten: Lengte: punten: > 19.0 15 > 18.9 15 > 18.8 15 19.0-18.8 10 18.9-18.7 10 18.8-18.6 10 18.8-18.6 5 18.7-18.5 5 18.6-18.4 5 < 18.6 0 < 18.5 0 <18.4 0
Uniformiteit: uniform. punten: > 90% 15 85-90% 10 80-85% 5 < 80% 0
voor transport aankomst opfokker kuiken temp. temp: punten: temp: punten: temp: punten:
40,1-40,8 5 40,1-40,8 5 40,1-40,8 5 39,0-40,1 4 39,0-40,1 4 39,0-40,1 4 40,8-41,1 2 40,8-41,1 2 40,8-41,1 2 38,0-39,0 2 38,0-39,0 2 38,0-39,0 2 <38,0 0 <38,0 0 <38,0 0 > 41.1 0 > 41.1 0 > 41.1 0
per broedlade:
kwaliteit eieren 8x nee 5 totaal: 3 broedlades
7x nee 4 6x nee 3 5x nee 2 4 xnee 1
3x nee of minder 0

Controlling chick quality Hatchery ter Heerdt, June 2011
45
percentage punten uitkomstpercentage > 85% 15
80-85% 10 75-80% 5 <75% 0
percentage punten uitval 1e week < 0,5 % 15
0,5 -1 % 10 1-1.5% 5 > 1.5% 0
Related Documents