J. of Supercritical Fluids 51 (2010) 420–427 Contents lists available at ScienceDirect The Journal of Supercritical Fluids journal homepage: www.elsevier.com/locate/supflu Influence of nanoparticle surface chemistry and size on supercritical carbon dioxide processed nanocomposite foam morphology Kerem Goren, Limeng Chen, Linda S. Schadler, Rahmi Ozisik ∗ Department of Materials Science and Engineering, and Rensselaer Nanotechnology Center, Rensselaer Polytechnic Institute, Troy, NY 12180, USA article info Article history: Received 29 May 2009 Received in revised form 11 September 2009 Accepted 13 September 2009 Keywords: Foams Polymer nanocomposites Surface modification abstract Creating polymer foams with controlled pore size and pore density is an important part of controlling foam properties. The addition of nanoparticles has been shown to cause heterogeneous nucleation and can be used to reduce pore size. In the current study, the effects of filler size and filler surface chemistry on pore nucleation in silica/PMMA nanocomposites are investigated. It was found that as the nanofiller size decreased, the pore density increased by a factor of 2–3 decades compared to that of unfilled PMMA (pore cell densities above 10 12 cells/cm 3 were obtained). In addition, fluorination of the silica nanoparticle surface led to decreased pore size without changing the degree of silica aggregation and overall density. By monitoring the pore density as a function of pressure, a qualitative comparison was obtained that showed that fluorination of the nanoparticle reduced the critical free energy of nucleation. © 2009 Elsevier B.V. All rights reserved. 1. Introduction Polymeric foams are used in many industrial and commercial applications where weight is an important factor [1]. Their porous structure can be used to control thermal conductivity, dielectric constant and sound dampening behavior [2,3]. In addition, the strength-to-weight ratio of structural foams is reported to be two to five times greater than that of metals [4]. However, polymeric foams suffer from low mechanical strength, poor surface quality, and low thermal and dimensional stability [5]. In addition, they are either processed with chlorofluorocarbons that deplete ozone [5,6] or with chemical blowing agents that generate chemical residues in the foamed material and require further processing for purifi- cation [7]. These issues can be resolved by using physical blowing agents, which do not create chemical residues and are environ- mentally benign. Supercritical carbon dioxide (scCO 2 ) is a physical blowing agent and has many advantages such as low cost, non- toxicity, non-flammability, chemical inertness, easily accessible supercritical conditions (T c = 31 ◦ C, P c = 7.38 MPa) [8], and tenabil- ity of physicochemical properties (such as density and mobility) by varying pressure and temperature [9–12]. In addition, scCO 2 has been shown to create an evenly distributed micron size closed cell ∗ Corresponding author at: Department of Materials Science and Engineering, and Rensselaer Nanotechnology Center, Rensselaer Polytechnic Institute, 110 Eight Street, MRC-205, Troy, NY 12180, USA. Tel.: +1 518 276 6786. E-mail address: [email protected] (R. Ozisik). structure, which improves the mechanical properties compared to heterogeneous or open cell structures [5]. The final properties of polymeric foams (e.g., thermal conduc- tivity and dielectric constant) depend on the average pore size and size distribution, volume fraction of pores, and distribution of the pores within the matrix [13]. One advantage of using physi- cal blowing agents is that the pore structure can be controlled via processing temperature and pressure. However, to optimize prop- erties, an overall understanding of the diffusion, and nucleation and growth mechanism is required [9,13,14]. During nucleation, scCO 2 molecules overcome an energy barrier and form stable nuclei. In order to create pores with a uniform size, nucleation must occur at the same time following rapid depressurization. The common approach to solving this problem is to use fillers that act as nucleation agents [15,16]. Fillers reduce the nucleation free energy activation barrier and force the nucleation to occur at the filler–polymer interface. Because of the lowered activation bar- rier, higher pore densities (pores/volume) with smaller pore sizes can be achieved. The pore density and size depend on the size of the fillers, filler size distribution, and filler surface chemistry [17–19]. Nanoparticles offer a potential advantage over micron- sized fillers because at the same loading (by weight), they offer more nucleation centers and higher interfacial area. In a recent study with calcium carbonate filled and unfilled polystyrene, Chiu et al. [17] investigated the effect of fillers on foam density. Addi- tion of calcium carbonate led to an increase in foam density at high temperatures, but no change at intermediate foaming tem- peratures (120–130 ◦ C). On the other hand, the average pore size was consistent with expectations; filled samples showed lower average pore size than unfilled samples. In a different study, Chang 0896-8446/$ – see front matter © 2009 Elsevier B.V. All rights reserved. doi:10.1016/j.supflu.2009.09.007

Welcome message from author
This document is posted to help you gain knowledge. Please leave a comment to let me know what you think about it! Share it to your friends and learn new things together.
Transcript
Id
KD
a
ARR1A
KFPS
1
ascstfaeoicambtsivb
aS
0d
J. of Supercritical Fluids 51 (2010) 420–427
Contents lists available at ScienceDirect
The Journal of Supercritical Fluids
journa l homepage: www.e lsev ier .com/ locate /supf lu
nfluence of nanoparticle surface chemistry and size on supercritical carbonioxide processed nanocomposite foam morphology
erem Goren, Limeng Chen, Linda S. Schadler, Rahmi Ozisik ∗
epartment of Materials Science and Engineering, and Rensselaer Nanotechnology Center, Rensselaer Polytechnic Institute, Troy, NY 12180, USA
r t i c l e i n f o
rticle history:eceived 29 May 2009eceived in revised form
a b s t r a c t
Creating polymer foams with controlled pore size and pore density is an important part of controllingfoam properties. The addition of nanoparticles has been shown to cause heterogeneous nucleation and
1 September 2009ccepted 13 September 2009
eywords:oamsolymer nanocomposites
can be used to reduce pore size. In the current study, the effects of filler size and filler surface chemistryon pore nucleation in silica/PMMA nanocomposites are investigated. It was found that as the nanofillersize decreased, the pore density increased by a factor of 2–3 decades compared to that of unfilled PMMA(pore cell densities above 1012 cells/cm3 were obtained). In addition, fluorination of the silica nanoparticlesurface led to decreased pore size without changing the degree of silica aggregation and overall density.By monitoring the pore density as a function of pressure, a qualitative comparison was obtained that
of th
urface modification showed that fluorination. Introduction
Polymeric foams are used in many industrial and commercialpplications where weight is an important factor [1]. Their poroustructure can be used to control thermal conductivity, dielectriconstant and sound dampening behavior [2,3]. In addition, thetrength-to-weight ratio of structural foams is reported to be twoo five times greater than that of metals [4]. However, polymericoams suffer from low mechanical strength, poor surface quality,nd low thermal and dimensional stability [5]. In addition, they areither processed with chlorofluorocarbons that deplete ozone [5,6]r with chemical blowing agents that generate chemical residuesn the foamed material and require further processing for purifi-ation [7]. These issues can be resolved by using physical blowinggents, which do not create chemical residues and are environ-entally benign. Supercritical carbon dioxide (scCO2) is a physical
lowing agent and has many advantages such as low cost, non-
oxicity, non-flammability, chemical inertness, easily accessibleupercritical conditions (Tc = 31 ◦C, Pc = 7.38 MPa) [8], and tenabil-ty of physicochemical properties (such as density and mobility) byarying pressure and temperature [9–12]. In addition, scCO2 haseen shown to create an evenly distributed micron size closed cell∗ Corresponding author at: Department of Materials Science and Engineering,nd Rensselaer Nanotechnology Center, Rensselaer Polytechnic Institute, 110 Eighttreet, MRC-205, Troy, NY 12180, USA. Tel.: +1 518 276 6786.
E-mail address: [email protected] (R. Ozisik).
896-8446/$ – see front matter © 2009 Elsevier B.V. All rights reserved.oi:10.1016/j.supflu.2009.09.007
e nanoparticle reduced the critical free energy of nucleation.© 2009 Elsevier B.V. All rights reserved.
structure, which improves the mechanical properties compared toheterogeneous or open cell structures [5].
The final properties of polymeric foams (e.g., thermal conduc-tivity and dielectric constant) depend on the average pore sizeand size distribution, volume fraction of pores, and distribution ofthe pores within the matrix [13]. One advantage of using physi-cal blowing agents is that the pore structure can be controlled viaprocessing temperature and pressure. However, to optimize prop-erties, an overall understanding of the diffusion, and nucleationand growth mechanism is required [9,13,14]. During nucleation,scCO2 molecules overcome an energy barrier and form stablenuclei. In order to create pores with a uniform size, nucleationmust occur at the same time following rapid depressurization. Thecommon approach to solving this problem is to use fillers thatact as nucleation agents [15,16]. Fillers reduce the nucleation freeenergy activation barrier and force the nucleation to occur at thefiller–polymer interface. Because of the lowered activation bar-rier, higher pore densities (pores/volume) with smaller pore sizescan be achieved. The pore density and size depend on the sizeof the fillers, filler size distribution, and filler surface chemistry[17–19]. Nanoparticles offer a potential advantage over micron-sized fillers because at the same loading (by weight), they offermore nucleation centers and higher interfacial area. In a recentstudy with calcium carbonate filled and unfilled polystyrene, Chiuet al. [17] investigated the effect of fillers on foam density. Addi-
tion of calcium carbonate led to an increase in foam density athigh temperatures, but no change at intermediate foaming tem-peratures (120–130 ◦C). On the other hand, the average pore sizewas consistent with expectations; filled samples showed loweraverage pore size than unfilled samples. In a different study, Chang
ritical
etaaOcce
fiotarai
Pssuseis(tfc
2
2
ptc(p
2
sd4awittatTtr
2
wtirfi
K. Goren et al. / J. of Superc
t al. [18] used polyethylene–octene elastomers and nanoclays, andhe results showed that upon addition of clay, both foam densitynd average pore size decreased, however, SEM pictures suggestedbroadening of the pore size distribution in the presence of clays.n the other hand, Wee at al. [19] showed that while averageell size decreased, foam density increased with increasing clayontent in polystyrene. Clearly, a consistent picture has not yetmerged.
There are only a few studies reporting that modification of theller surface chemistry changes the nucleation rate [9]. Tetheringf CO2-philic polymers such as poly(methyl methacrylate) ontohe surface of nanoclays has been shown to double the nucle-tion density [5]. This is because the poly(methyl methacrylate)educed the dissolved gas-particle interfacial tension and contactngle, thus favoring the formation of nuclei at the clay/polymernterface.
In the current study, foams of poly(methyl methacrylate),MMA, and silica/PMMA nanocomposites were prepared by usingupercritical carbon dioxide as the blowing agent. Two sizes ofilica nanoparticles with two different surface chemistries weresed. The average size of silica was measured via dynamic lightcattering (DLS); dispersion of silica was assessed via transmissionlectron microscopy (TEM); surface modification of silica was ver-fied via infrared spectroscopy (IR); surface tethering density ofilica nanoparticles was obtained via thermogravimetric analysisTGA); and scanning electron microscope (SEM) was used to inves-igate the pore structure after supercritical carbon dioxide assistedoaming. The effect of saturation pressure, silica size and surfacehemistry were investigated.
. Experimental
.1. Materials
Poly(methyl methacrylate), PMMA, was kindly provided inellet form by ExxonMobil Chemical Co. Silane coupling agentridecafluoro-1,1,2,2-tetrahydrooctyl silane (TFTOS) was pur-hased from Gelest Inc. (Morrisville, PA). TetraethylorthosilicateTEOS) was purchased from Sigma–Aldrich. Ammonia solution wasurchased from Fischer Scientific.
.2. Preparation of silica nanoparticles
Nominally 15 and 150 nm diameter silica nanoparticles wereynthesized using ammonia, ethanol and TEOS. To make the 15 nmiameter silica nanoparticles, 194 g of ethanol was reacted with.99 g of ammonia in the presence of 8.62 g of TEOS at room temper-ture. To synthesize 150 nm silica nanoparticles, 87.5 g of ethanolere reacted with 4.12 g of ammonia and 4.37 g of deionized water
n the presence of 8.62 g of TEOS [20]. Both reactions took ∼24 ho complete at room temperature with mechanical mixing, andhe yield was 1.5–2 g. Bare nanoparticles were precipitated usingrotary evaporator. Any residual solvent was removed by placing
he nanoparticles in a vacuum oven overnight at room temperature.he resultant powders were washed with THF and distilled waterhree times and were placed in a vacuum oven to dry overnight toemove impurities and unused reactants.
.3. Surface modification of nanoparticles
Half of the synthesized nanoparticles were surface modified
ith fluorine containing silane coupling agent TFTOS prior to dryingo prevent agglomeration. 15 and 150 nm silica particles were mod-fied using 1.6 and 0.26 g of TFTOS, respectively. The modificationeaction took 24 h to complete at room temperature. The modi-ed nanoparticles were precipitated using a rotary evaporator. Any
Fluids 51 (2010) 420–427 421
residual solvent was removed by placing the nanoparticles in a vac-uum oven overnight at room temperature. The resultant powderswere washed with THF and distilled water three times and wereplaced in a vacuum oven to dry overnight to remove impuritiesand unused reactants.
2.4. Preparation of PMMA/silica nanocomposites
Bare silica and surface modified silica nanoparticles were desic-cated overnight prior to mixing with polymer. After weighing, thenanoparticles were premixed with polymer and then were fed toa Haake Benchtop extruder. The screw speed was set to 20 rpm.When the addition and melting of the nanoparticle/polymer mix-ture ended and the torque stabilized, the rotor speed was increasedto 60 rpm. During the mixing process, the temperature was setto 200 ◦C and the mixing duration was kept at 4 min for allsamples. At the end of mixing, the extrudate was flushed andlabeled.
To distinguish the four types of composites used, the followingnotations were used. B15 and B150 refer to the 15 and 150 nm diam-eter bare silica nanoparticles in PMMA, and F15 and F150 refer to15 and 150 nm diameter fluorinated silica nanoparticles in PMMA.All composites contained 1% silica by weight.
2.5. Foaming nanocomposites with supercritical carbon dioxide
Polymer nanocomposite extrudates were cut into small piecesand were placed in an autoclave. The autoclave (fixed head 4596Micro Reactor with 4843 controller, Parr Instrument Co.) had acylindrical chamber with a diameter of 2.54 cm, height of 5.08 cm,and volume of 25 mL. The stainless steel autoclave was rated for useup to 20.7 MPa at 350 ◦C. The autoclave had individual fittings forapplying vacuum, depressurization, and gas injection. Gas enteredthe autoclave chamber through a dip tube. Nanocomposite sampleswere soaked with scCO2 at 40 ◦C and 17.6, 13.8, 10.3, and 8.3 MPa(Tc = 31.1 ◦C, Pc = 7.4 MPa). Following rapid depressurization, sam-ples were placed in water at 63 ◦C for 1 min for foaming.
3. Results and discussion
3.1. Characterization of nanoparticles
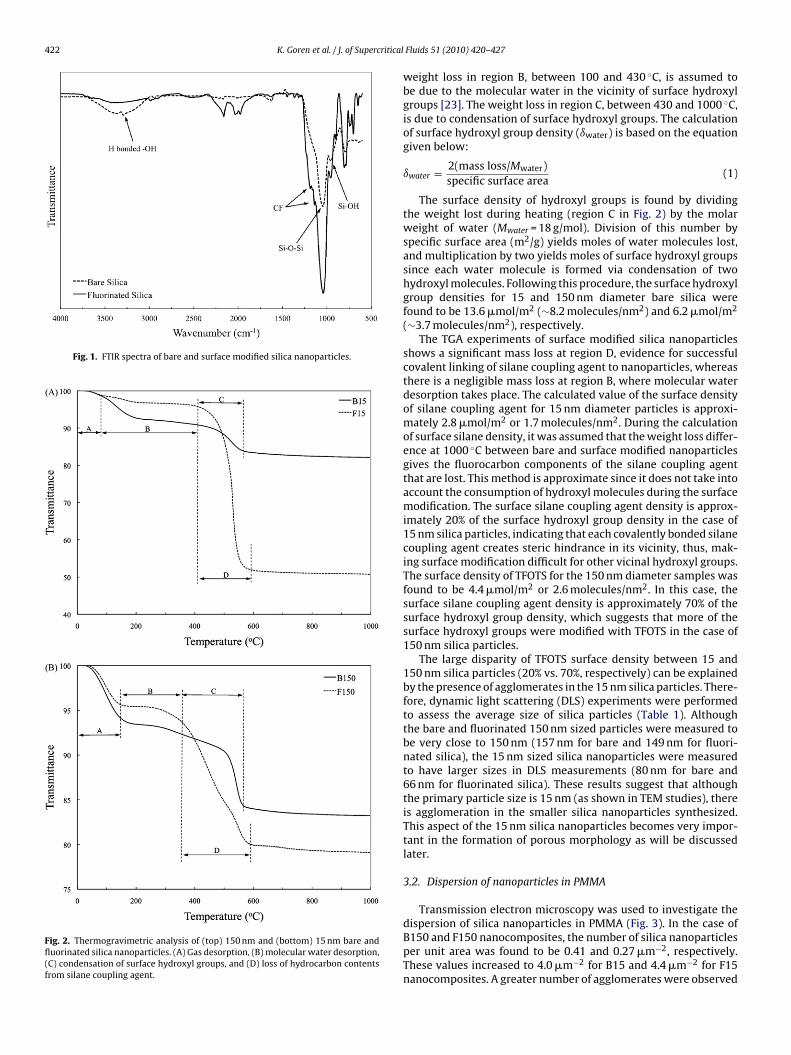
Synthesized SiO2 nanoparticles were analyzed with Fouriertransform infrared (FTIR) spectroscopy and thermogravimetricanalysis (TGA). FTIR spectra for bare and surface modified silicananoparticles are shown in Fig. 1. The broad stretching band at3300 cm−1 arose from the surface hydroxyl groups and the weakpeak at 1620 cm−1 from molecular water on pure SiO2. Since thesurface of bare silica nanoparticles contains hydroxyl groups, eventhe dried nanoparticles re-adsorbed molecular water quickly, andthis was visible in the FTIR spectra. The 1045 and 954 cm−1 peaksare attributed to Si–O–Si stretching and Si–OH bending, respec-tively [21,22]. FTIR also reveals the presence of silane couplingagent on the silica nanoparticle surface as indicated by the C–Fstretches as shoulders at 1186 and 1138 cm−1. A strong Si–O–Sistretching peak overshadows the C–F stretching peaks but the exis-tence of shoulders indicate surface modification. The broad peakwhich was present in bare silica nanoparticles at 3300 cm−1 wasevidently diminished due to the reaction between surface hydroxylgroups and silane coupling agent, which is also an indicator of sur-face modification.
The water content and surface hydroxyl and fluoroalkane den-sities of the silica nanoparticles were approximated using the TGAthermograms (Fig. 2) and BET measurements for each size and sur-face type. Three regions were observed in TGA thermograms forbare silica nanoparticles. Region A is related to gas desorption. The
422 K. Goren et al. / J. of Supercritical
Fig. 1. FTIR spectra of bare and surface modified silica nanoparticles.
Fig. 2. Thermogravimetric analysis of (top) 150 nm and (bottom) 15 nm bare andfluorinated silica nanoparticles. (A) Gas desorption, (B) molecular water desorption,(C) condensation of surface hydroxyl groups, and (D) loss of hydrocarbon contentsfrom silane coupling agent.
Fluids 51 (2010) 420–427
weight loss in region B, between 100 and 430 ◦C, is assumed tobe due to the molecular water in the vicinity of surface hydroxylgroups [23]. The weight loss in region C, between 430 and 1000 ◦C,is due to condensation of surface hydroxyl groups. The calculationof surface hydroxyl group density (ıwater) is based on the equationgiven below:
ıwater = 2(mass loss/Mwater)specific surface area
(1)
The surface density of hydroxyl groups is found by dividingthe weight lost during heating (region C in Fig. 2) by the molarweight of water (Mwater = 18 g/mol). Division of this number byspecific surface area (m2/g) yields moles of water molecules lost,and multiplication by two yields moles of surface hydroxyl groupssince each water molecule is formed via condensation of twohydroxyl molecules. Following this procedure, the surface hydroxylgroup densities for 15 and 150 nm diameter bare silica werefound to be 13.6 �mol/m2 (∼8.2 molecules/nm2) and 6.2 �mol/m2
(∼3.7 molecules/nm2), respectively.The TGA experiments of surface modified silica nanoparticles
shows a significant mass loss at region D, evidence for successfulcovalent linking of silane coupling agent to nanoparticles, whereasthere is a negligible mass loss at region B, where molecular waterdesorption takes place. The calculated value of the surface densityof silane coupling agent for 15 nm diameter particles is approxi-mately 2.8 �mol/m2 or 1.7 molecules/nm2. During the calculationof surface silane density, it was assumed that the weight loss differ-ence at 1000 ◦C between bare and surface modified nanoparticlesgives the fluorocarbon components of the silane coupling agentthat are lost. This method is approximate since it does not take intoaccount the consumption of hydroxyl molecules during the surfacemodification. The surface silane coupling agent density is approx-imately 20% of the surface hydroxyl group density in the case of15 nm silica particles, indicating that each covalently bonded silanecoupling agent creates steric hindrance in its vicinity, thus, mak-ing surface modification difficult for other vicinal hydroxyl groups.The surface density of TFOTS for the 150 nm diameter samples wasfound to be 4.4 �mol/m2 or 2.6 molecules/nm2. In this case, thesurface silane coupling agent density is approximately 70% of thesurface hydroxyl group density, which suggests that more of thesurface hydroxyl groups were modified with TFOTS in the case of150 nm silica particles.
The large disparity of TFOTS surface density between 15 and150 nm silica particles (20% vs. 70%, respectively) can be explainedby the presence of agglomerates in the 15 nm silica particles. There-fore, dynamic light scattering (DLS) experiments were performedto assess the average size of silica particles (Table 1). Althoughthe bare and fluorinated 150 nm sized particles were measured tobe very close to 150 nm (157 nm for bare and 149 nm for fluori-nated silica), the 15 nm sized silica nanoparticles were measuredto have larger sizes in DLS measurements (80 nm for bare and66 nm for fluorinated silica). These results suggest that althoughthe primary particle size is 15 nm (as shown in TEM studies), thereis agglomeration in the smaller silica nanoparticles synthesized.This aspect of the 15 nm silica nanoparticles becomes very impor-tant in the formation of porous morphology as will be discussedlater.
3.2. Dispersion of nanoparticles in PMMA
Transmission electron microscopy was used to investigate the
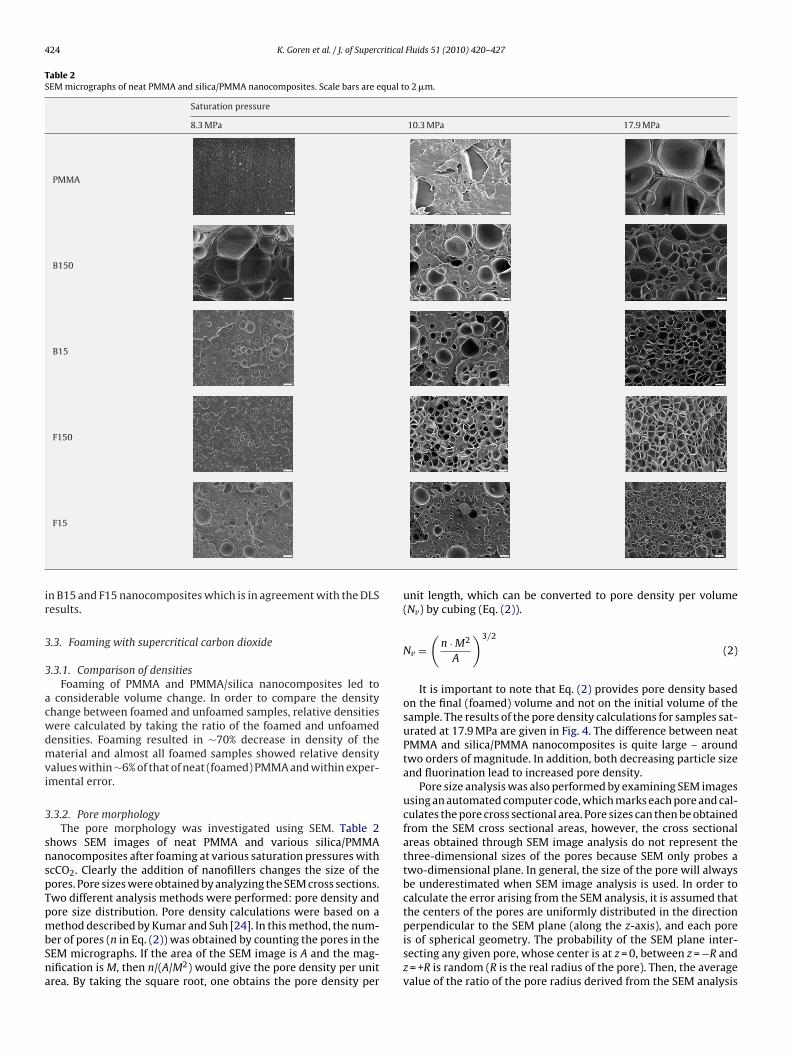
dispersion of silica nanoparticles in PMMA (Fig. 3). In the case ofB150 and F150 nanocomposites, the number of silica nanoparticlesper unit area was found to be 0.41 and 0.27 �m−2, respectively.These values increased to 4.0 �m−2 for B15 and 4.4 �m−2 for F15nanocomposites. A greater number of agglomerates were observed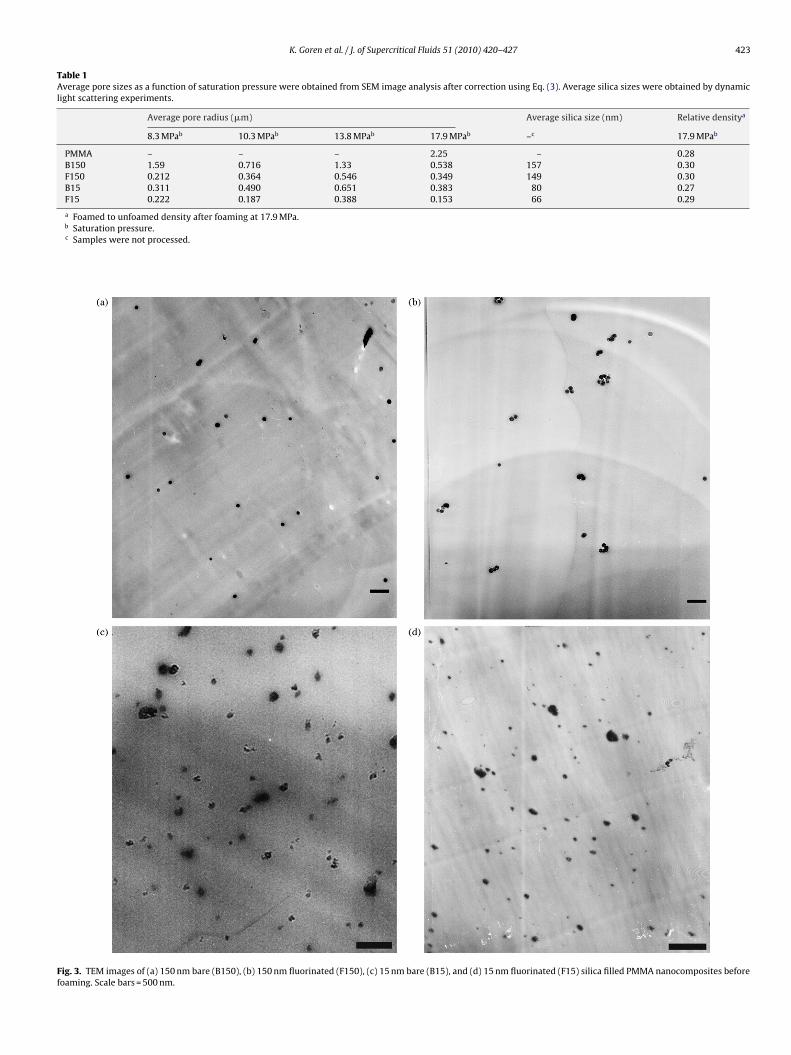
K. Goren et al. / J. of Supercritical Fluids 51 (2010) 420–427 423
Table 1Average pore sizes as a function of saturation pressure were obtained from SEM image analysis after correction using Eq. (3). Average silica sizes were obtained by dynamiclight scattering experiments.
Average pore radius (�m) Average silica size (nm) Relative densitya
8.3 MPab 10.3 MPab 13.8 MPab 17.9 MPab –c 17.9 MPab
PMMA – – – 2.25 – 0.28B150 1.59 0.716 1.33 0.538 157 0.30F150 0.212 0.364 0.546 0.349 149 0.30B15 0.311 0.490 0.651 0.383 80 0.27F15 0.222 0.187 0.388 0.153 66 0.29
a Foamed to unfoamed density after foaming at 17.9 MPa.b Saturation pressure.c Samples were not processed.
Fig. 3. TEM images of (a) 150 nm bare (B150), (b) 150 nm fluorinated (F150), (c) 15 nm bare (B15), and (d) 15 nm fluorinated (F15) silica filled PMMA nanocomposites beforefoaming. Scale bars = 500 nm.
424 K. Goren et al. / J. of Supercritical Fluids 51 (2010) 420–427
Table 2SEM micrographs of neat PMMA and silica/PMMA nanocomposites. Scale bars are equal to 2 �m.
Saturation pressure
8.3 MPa 10.3 MPa 17.9 MPa
PMMA
B150
B15
F150
F15
ir
3
3
acwdmvi
3
snspTpmbSna
n B15 and F15 nanocomposites which is in agreement with the DLSesults.
.3. Foaming with supercritical carbon dioxide
.3.1. Comparison of densitiesFoaming of PMMA and PMMA/silica nanocomposites led to
considerable volume change. In order to compare the densityhange between foamed and unfoamed samples, relative densitiesere calculated by taking the ratio of the foamed and unfoamedensities. Foaming resulted in ∼70% decrease in density of theaterial and almost all foamed samples showed relative density
alues within ∼6% of that of neat (foamed) PMMA and within exper-mental error.
.3.2. Pore morphologyThe pore morphology was investigated using SEM. Table 2
hows SEM images of neat PMMA and various silica/PMMAanocomposites after foaming at various saturation pressures withcCO2. Clearly the addition of nanofillers changes the size of theores. Pore sizes were obtained by analyzing the SEM cross sections.wo different analysis methods were performed: pore density andore size distribution. Pore density calculations were based on a
ethod described by Kumar and Suh [24]. In this method, the num-er of pores (n in Eq. (2)) was obtained by counting the pores in theEM micrographs. If the area of the SEM image is A and the mag-ification is M, then n/(A/M2) would give the pore density per unitrea. By taking the square root, one obtains the pore density per
unit length, which can be converted to pore density per volume(Nv) by cubing (Eq. (2)).
Nv =(
n · M2
A
)3/2
(2)
It is important to note that Eq. (2) provides pore density basedon the final (foamed) volume and not on the initial volume of thesample. The results of the pore density calculations for samples sat-urated at 17.9 MPa are given in Fig. 4. The difference between neatPMMA and silica/PMMA nanocomposites is quite large – aroundtwo orders of magnitude. In addition, both decreasing particle sizeand fluorination lead to increased pore density.
Pore size analysis was also performed by examining SEM imagesusing an automated computer code, which marks each pore and cal-culates the pore cross sectional area. Pore sizes can then be obtainedfrom the SEM cross sectional areas, however, the cross sectionalareas obtained through SEM image analysis do not represent thethree-dimensional sizes of the pores because SEM only probes atwo-dimensional plane. In general, the size of the pore will alwaysbe underestimated when SEM image analysis is used. In order tocalculate the error arising from the SEM analysis, it is assumed thatthe centers of the pores are uniformly distributed in the direction
perpendicular to the SEM plane (along the z-axis), and each poreis of spherical geometry. The probability of the SEM plane inter-secting any given pore, whose center is at z = 0, between z = −R andz = +R is random (R is the real radius of the pore). Then, the averagevalue of the ratio of the pore radius derived from the SEM analysis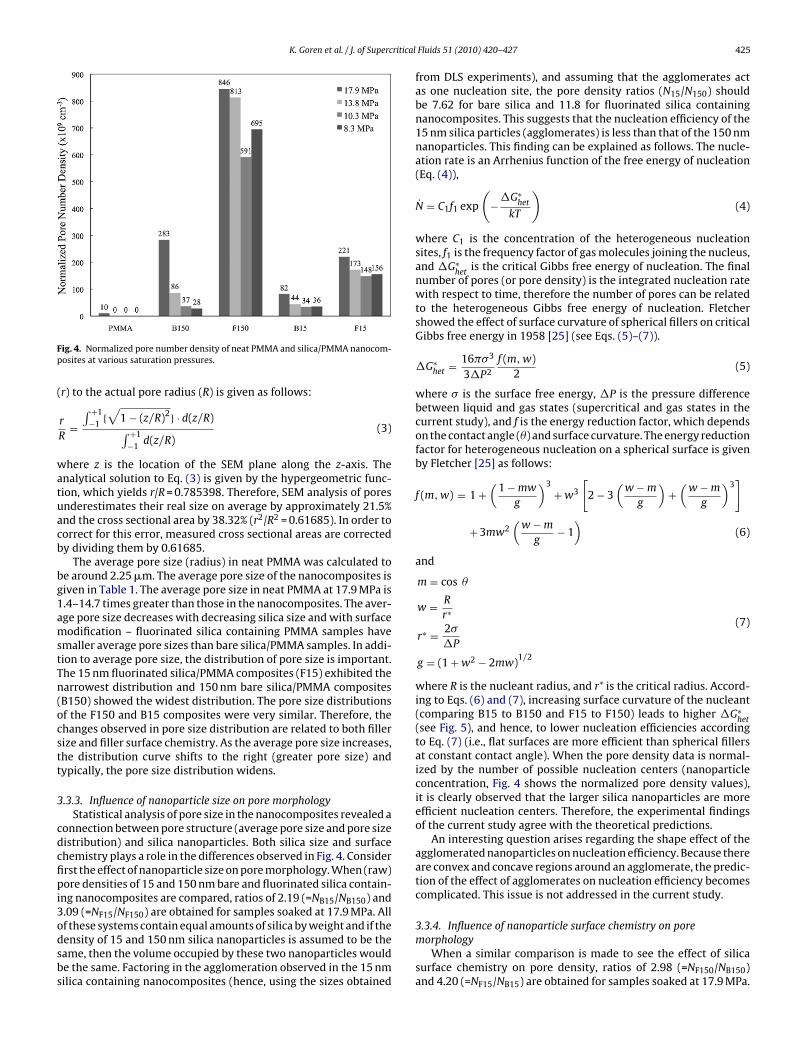
K. Goren et al. / J. of Supercritical
Fp
(
watuacb
bg1amstTn(ocstt
3
cdcfipi3odsbs
ig. 4. Normalized pore number density of neat PMMA and silica/PMMA nanocom-osites at various saturation pressures.
r) to the actual pore radius (R) is given as follows:
r
R=
∫ +1−1
{√
1 − (z/R)2} · d(z/R)∫ +1−1
d(z/R)(3)
here z is the location of the SEM plane along the z-axis. Thenalytical solution to Eq. (3) is given by the hypergeometric func-ion, which yields r/R = 0.785398. Therefore, SEM analysis of poresnderestimates their real size on average by approximately 21.5%nd the cross sectional area by 38.32% (r2/R2 = 0.61685). In order toorrect for this error, measured cross sectional areas are correctedy dividing them by 0.61685.
The average pore size (radius) in neat PMMA was calculated toe around 2.25 �m. The average pore size of the nanocomposites isiven in Table 1. The average pore size in neat PMMA at 17.9 MPa is.4–14.7 times greater than those in the nanocomposites. The aver-ge pore size decreases with decreasing silica size and with surfaceodification – fluorinated silica containing PMMA samples have
maller average pore sizes than bare silica/PMMA samples. In addi-ion to average pore size, the distribution of pore size is important.he 15 nm fluorinated silica/PMMA composites (F15) exhibited thearrowest distribution and 150 nm bare silica/PMMA compositesB150) showed the widest distribution. The pore size distributionsf the F150 and B15 composites were very similar. Therefore, thehanges observed in pore size distribution are related to both fillerize and filler surface chemistry. As the average pore size increases,he distribution curve shifts to the right (greater pore size) andypically, the pore size distribution widens.
.3.3. Influence of nanoparticle size on pore morphologyStatistical analysis of pore size in the nanocomposites revealed a
onnection between pore structure (average pore size and pore sizeistribution) and silica nanoparticles. Both silica size and surfacehemistry plays a role in the differences observed in Fig. 4. Considerrst the effect of nanoparticle size on pore morphology. When (raw)ore densities of 15 and 150 nm bare and fluorinated silica contain-
ng nanocomposites are compared, ratios of 2.19 (=NB15/NB150) and.09 (=NF15/NF150) are obtained for samples soaked at 17.9 MPa. All
f these systems contain equal amounts of silica by weight and if theensity of 15 and 150 nm silica nanoparticles is assumed to be theame, then the volume occupied by these two nanoparticles woulde the same. Factoring in the agglomeration observed in the 15 nmilica containing nanocomposites (hence, using the sizes obtainedFluids 51 (2010) 420–427 425
from DLS experiments), and assuming that the agglomerates actas one nucleation site, the pore density ratios (N15/N150) shouldbe 7.62 for bare silica and 11.8 for fluorinated silica containingnanocomposites. This suggests that the nucleation efficiency of the15 nm silica particles (agglomerates) is less than that of the 150 nmnanoparticles. This finding can be explained as follows. The nucle-ation rate is an Arrhenius function of the free energy of nucleation(Eq. (4)),
N = C1f1 exp
(−�G∗
het
kT
)(4)
where C1 is the concentration of the heterogeneous nucleationsites, f1 is the frequency factor of gas molecules joining the nucleus,and �G∗
hetis the critical Gibbs free energy of nucleation. The final
number of pores (or pore density) is the integrated nucleation ratewith respect to time, therefore the number of pores can be relatedto the heterogeneous Gibbs free energy of nucleation. Fletchershowed the effect of surface curvature of spherical fillers on criticalGibbs free energy in 1958 [25] (see Eqs. (5)–(7)).
�G∗het = 16��3
3�P2
f (m, w)2
(5)
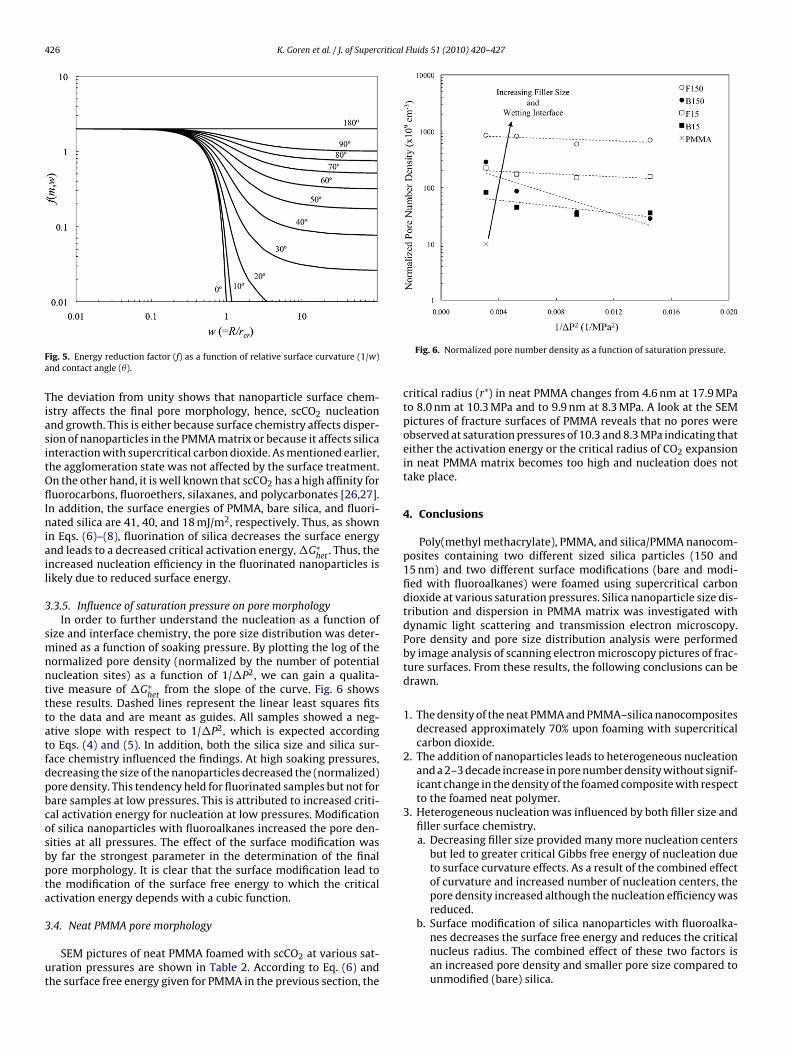
where � is the surface free energy, �P is the pressure differencebetween liquid and gas states (supercritical and gas states in thecurrent study), and f is the energy reduction factor, which dependson the contact angle (�) and surface curvature. The energy reductionfactor for heterogeneous nucleation on a spherical surface is givenby Fletcher [25] as follows:
f (m, w) = 1 +(
1 − mw
g
)3+ w3
[2 − 3
(w − m
g
)+
(w − m
g
)3]
+ 3mw2(
w − m
g− 1
)(6)
and
m = cos �
w = R
r∗
r∗ = 2�
�P
g = (1 + w2 − 2mw)1/2
(7)
where R is the nucleant radius, and r* is the critical radius. Accord-ing to Eqs. (6) and (7), increasing surface curvature of the nucleant(comparing B15 to B150 and F15 to F150) leads to higher �G∗
het(see Fig. 5), and hence, to lower nucleation efficiencies accordingto Eq. (7) (i.e., flat surfaces are more efficient than spherical fillersat constant contact angle). When the pore density data is normal-ized by the number of possible nucleation centers (nanoparticleconcentration, Fig. 4 shows the normalized pore density values),it is clearly observed that the larger silica nanoparticles are moreefficient nucleation centers. Therefore, the experimental findingsof the current study agree with the theoretical predictions.
An interesting question arises regarding the shape effect of theagglomerated nanoparticles on nucleation efficiency. Because thereare convex and concave regions around an agglomerate, the predic-tion of the effect of agglomerates on nucleation efficiency becomescomplicated. This issue is not addressed in the current study.
3.3.4. Influence of nanoparticle surface chemistry on poremorphology
When a similar comparison is made to see the effect of silicasurface chemistry on pore density, ratios of 2.98 (=NF150/NB150)and 4.20 (=NF15/NB15) are obtained for samples soaked at 17.9 MPa.
426 K. Goren et al. / J. of Supercritical Fluids 51 (2010) 420–427
Fa
TiasitOflIniail
3
smnntttatfdpbcosbpta
3
ut
ig. 5. Energy reduction factor (f) as a function of relative surface curvature (1/w)nd contact angle (�).
he deviation from unity shows that nanoparticle surface chem-stry affects the final pore morphology, hence, scCO2 nucleationnd growth. This is either because surface chemistry affects disper-ion of nanoparticles in the PMMA matrix or because it affects silicanteraction with supercritical carbon dioxide. As mentioned earlier,he agglomeration state was not affected by the surface treatment.n the other hand, it is well known that scCO2 has a high affinity foruorocarbons, fluoroethers, silaxanes, and polycarbonates [26,27].
n addition, the surface energies of PMMA, bare silica, and fluori-ated silica are 41, 40, and 18 mJ/m2, respectively. Thus, as shown
n Eqs. (6)–(8), fluorination of silica decreases the surface energynd leads to a decreased critical activation energy, �G∗
het. Thus, the
ncreased nucleation efficiency in the fluorinated nanoparticles isikely due to reduced surface energy.
.3.5. Influence of saturation pressure on pore morphologyIn order to further understand the nucleation as a function of
ize and interface chemistry, the pore size distribution was deter-ined as a function of soaking pressure. By plotting the log of the
ormalized pore density (normalized by the number of potentialucleation sites) as a function of 1/�P2, we can gain a qualita-ive measure of �G∗
hetfrom the slope of the curve. Fig. 6 shows
hese results. Dashed lines represent the linear least squares fitso the data and are meant as guides. All samples showed a neg-tive slope with respect to 1/�P2, which is expected accordingo Eqs. (4) and (5). In addition, both the silica size and silica sur-ace chemistry influenced the findings. At high soaking pressures,ecreasing the size of the nanoparticles decreased the (normalized)ore density. This tendency held for fluorinated samples but not forare samples at low pressures. This is attributed to increased criti-al activation energy for nucleation at low pressures. Modificationf silica nanoparticles with fluoroalkanes increased the pore den-ities at all pressures. The effect of the surface modification wasy far the strongest parameter in the determination of the finalore morphology. It is clear that the surface modification lead tohe modification of the surface free energy to which the criticalctivation energy depends with a cubic function.
.4. Neat PMMA pore morphology
SEM pictures of neat PMMA foamed with scCO2 at various sat-ration pressures are shown in Table 2. According to Eq. (6) andhe surface free energy given for PMMA in the previous section, the
Fig. 6. Normalized pore number density as a function of saturation pressure.
critical radius (r*) in neat PMMA changes from 4.6 nm at 17.9 MPato 8.0 nm at 10.3 MPa and to 9.9 nm at 8.3 MPa. A look at the SEMpictures of fracture surfaces of PMMA reveals that no pores wereobserved at saturation pressures of 10.3 and 8.3 MPa indicating thateither the activation energy or the critical radius of CO2 expansionin neat PMMA matrix becomes too high and nucleation does nottake place.
4. Conclusions
Poly(methyl methacrylate), PMMA, and silica/PMMA nanocom-posites containing two different sized silica particles (150 and15 nm) and two different surface modifications (bare and modi-fied with fluoroalkanes) were foamed using supercritical carbondioxide at various saturation pressures. Silica nanoparticle size dis-tribution and dispersion in PMMA matrix was investigated withdynamic light scattering and transmission electron microscopy.Pore density and pore size distribution analysis were performedby image analysis of scanning electron microscopy pictures of frac-ture surfaces. From these results, the following conclusions can bedrawn.
1. The density of the neat PMMA and PMMA–silica nanocompositesdecreased approximately 70% upon foaming with supercriticalcarbon dioxide.
2. The addition of nanoparticles leads to heterogeneous nucleationand a 2–3 decade increase in pore number density without signif-icant change in the density of the foamed composite with respectto the foamed neat polymer.
3. Heterogeneous nucleation was influenced by both filler size andfiller surface chemistry.a. Decreasing filler size provided many more nucleation centers
but led to greater critical Gibbs free energy of nucleation dueto surface curvature effects. As a result of the combined effectof curvature and increased number of nucleation centers, thepore density increased although the nucleation efficiency wasreduced.
b. Surface modification of silica nanoparticles with fluoroalka-
nes decreases the surface free energy and reduces the criticalnucleus radius. The combined effect of these two factors isan increased pore density and smaller pore size compared tounmodified (bare) silica.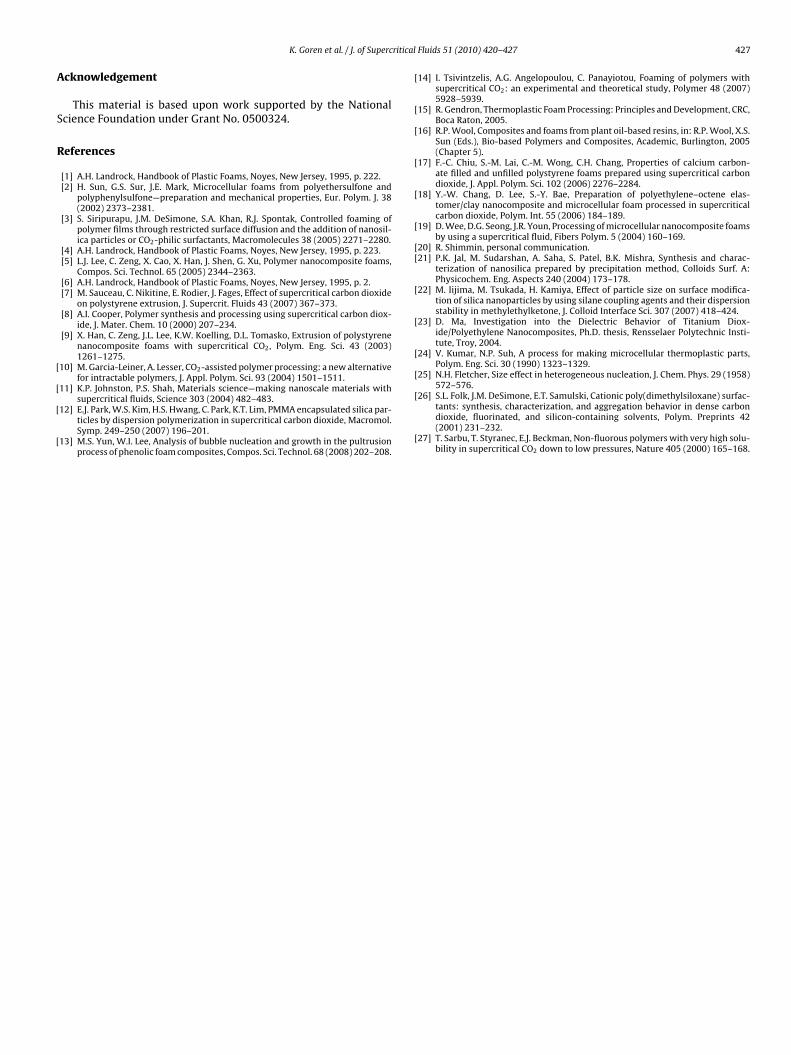
ritical
A
S
R
[
[
[
[
[
[
[
[
[
[
[[
[
[
[
[
K. Goren et al. / J. of Superc
cknowledgement
This material is based upon work supported by the Nationalcience Foundation under Grant No. 0500324.
eferences
[1] A.H. Landrock, Handbook of Plastic Foams, Noyes, New Jersey, 1995, p. 222.[2] H. Sun, G.S. Sur, J.E. Mark, Microcellular foams from polyethersulfone and
polyphenylsulfone—preparation and mechanical properties, Eur. Polym. J. 38(2002) 2373–2381.
[3] S. Siripurapu, J.M. DeSimone, S.A. Khan, R.J. Spontak, Controlled foaming ofpolymer films through restricted surface diffusion and the addition of nanosil-ica particles or CO2-philic surfactants, Macromolecules 38 (2005) 2271–2280.
[4] A.H. Landrock, Handbook of Plastic Foams, Noyes, New Jersey, 1995, p. 223.[5] L.J. Lee, C. Zeng, X. Cao, X. Han, J. Shen, G. Xu, Polymer nanocomposite foams,
Compos. Sci. Technol. 65 (2005) 2344–2363.[6] A.H. Landrock, Handbook of Plastic Foams, Noyes, New Jersey, 1995, p. 2.[7] M. Sauceau, C. Nikitine, E. Rodier, J. Fages, Effect of supercritical carbon dioxide
on polystyrene extrusion, J. Supercrit. Fluids 43 (2007) 367–373.[8] A.I. Cooper, Polymer synthesis and processing using supercritical carbon diox-
ide, J. Mater. Chem. 10 (2000) 207–234.[9] X. Han, C. Zeng, J.L. Lee, K.W. Koelling, D.L. Tomasko, Extrusion of polystyrene
nanocomposite foams with supercritical CO2, Polym. Eng. Sci. 43 (2003)1261–1275.
10] M. Garcia-Leiner, A. Lesser, CO2-assisted polymer processing: a new alternativefor intractable polymers, J. Appl. Polym. Sci. 93 (2004) 1501–1511.
11] K.P. Johnston, P.S. Shah, Materials science—making nanoscale materials with
supercritical fluids, Science 303 (2004) 482–483.12] E.J. Park, W.S. Kim, H.S. Hwang, C. Park, K.T. Lim, PMMA encapsulated silica par-ticles by dispersion polymerization in supercritical carbon dioxide, Macromol.Symp. 249–250 (2007) 196–201.
13] M.S. Yun, W.I. Lee, Analysis of bubble nucleation and growth in the pultrusionprocess of phenolic foam composites, Compos. Sci. Technol. 68 (2008) 202–208.
[
[
Fluids 51 (2010) 420–427 427
14] I. Tsivintzelis, A.G. Angelopoulou, C. Panayiotou, Foaming of polymers withsupercritical CO2: an experimental and theoretical study, Polymer 48 (2007)5928–5939.
15] R. Gendron, Thermoplastic Foam Processing: Principles and Development, CRC,Boca Raton, 2005.
16] R.P. Wool, Composites and foams from plant oil-based resins, in: R.P. Wool, X.S.Sun (Eds.), Bio-based Polymers and Composites, Academic, Burlington, 2005(Chapter 5).
17] F.-C. Chiu, S.-M. Lai, C.-M. Wong, C.H. Chang, Properties of calcium carbon-ate filled and unfilled polystyrene foams prepared using supercritical carbondioxide, J. Appl. Polym. Sci. 102 (2006) 2276–2284.
18] Y.-W. Chang, D. Lee, S.-Y. Bae, Preparation of polyethylene–octene elas-tomer/clay nanocomposite and microcellular foam processed in supercriticalcarbon dioxide, Polym. Int. 55 (2006) 184–189.
19] D. Wee, D.G. Seong, J.R. Youn, Processing of microcellular nanocomposite foamsby using a supercritical fluid, Fibers Polym. 5 (2004) 160–169.
20] R. Shimmin, personal communication.21] P.K. Jal, M. Sudarshan, A. Saha, S. Patel, B.K. Mishra, Synthesis and charac-
terization of nanosilica prepared by precipitation method, Colloids Surf. A:Physicochem. Eng. Aspects 240 (2004) 173–178.
22] M. Iijima, M. Tsukada, H. Kamiya, Effect of particle size on surface modifica-tion of silica nanoparticles by using silane coupling agents and their dispersionstability in methylethylketone, J. Colloid Interface Sci. 307 (2007) 418–424.
23] D. Ma, Investigation into the Dielectric Behavior of Titanium Diox-ide/Polyethylene Nanocomposites, Ph.D. thesis, Rensselaer Polytechnic Insti-tute, Troy, 2004.
24] V. Kumar, N.P. Suh, A process for making microcellular thermoplastic parts,Polym. Eng. Sci. 30 (1990) 1323–1329.
25] N.H. Fletcher, Size effect in heterogeneous nucleation, J. Chem. Phys. 29 (1958)572–576.
26] S.L. Folk, J.M. DeSimone, E.T. Samulski, Cationic poly(dimethylsiloxane) surfac-tants: synthesis, characterization, and aggregation behavior in dense carbondioxide, fluorinated, and silicon-containing solvents, Polym. Preprints 42(2001) 231–232.
27] T. Sarbu, T. Styranec, E.J. Beckman, Non-fluorous polymers with very high solu-bility in supercritical CO2 down to low pressures, Nature 405 (2000) 165–168.
Related Documents