This is the author’s version of a work that was submitted/accepted for pub- lication in the following source: Miura, Kyoko, Giskes, Katrina M.,& Turrell, Gavin (2011) Contribution of take-out food consumption to socioeconomic differences in fruit and veg- etable intake : a mediation analysis. Journal of The American Dietetic Association, 111(10), pp. 1556-1562. This file was downloaded from: c Copyright 2011 The American Dietetic Association this is the author’s version of a work that was accepted for publication in Journal of The American Dietetic Association. Changes resulting from the publishing process, such as peer review, editing, corrections, structural formatting, and other quality control mechanisms may not be reflected in this document. Changes may have been made to this work since it was submitted for publication. A definitive version was subsequently published in Journal of The American Dietetic Association, 111(10), pp.1556-1562 DOI: 10.1016/j.jada.2011.07.009 Notice: Changes introduced as a result of publishing processes such as copy-editing and formatting may not be reflected in this document. For a definitive version of this work, please refer to the published source: http://dx.doi.org/10.1016/j.jada.2011.07.009

Welcome message from author
This document is posted to help you gain knowledge. Please leave a comment to let me know what you think about it! Share it to your friends and learn new things together.
Transcript
This is the author’s version of a work that was submitted/accepted for pub-lication in the following source:
Miura, Kyoko, Giskes, Katrina M., & Turrell, Gavin (2011) Contribution oftake-out food consumption to socioeconomic differences in fruit and veg-etable intake : a mediation analysis. Journal of The American DieteticAssociation, 111(10), pp. 1556-1562.
This file was downloaded from: http://eprints.qut.edu.au/45940/
c© Copyright 2011 The American Dietetic Association
this is the author’s version of a work that was accepted for publication inJournal of The American Dietetic Association. Changes resulting from thepublishing process, such as peer review, editing, corrections, structuralformatting, and other quality control mechanisms may not be reflected inthis document. Changes may have been made to this work since it wassubmitted for publication. A definitive version was subsequently publishedin Journal of The American Dietetic Association, 111(10), pp.1556-1562DOI: 10.1016/j.jada.2011.07.009
Notice: Changes introduced as a result of publishing processes such ascopy-editing and formatting may not be reflected in this document. For adefinitive version of this work, please refer to the published source:
http://dx.doi.org/10.1016/j.jada.2011.07.009
1
Title: Contribution of take-out food consumption to socioeconomic differences in fruit and
vegetable intake: a mediation analysis
Authors:
Kyoko Miura PhD Candidate, Registered Associate Nutritionist (RANutr)
School of Public Health/Institute of Health and Biomedical Innovation,
Queensland University of Technology, Brisbane, AUSTRALIA.
Katrina Giskes PhD, Research Fellow, Accredited Practicing Dietitian (APD)
School of Public Health/Institute of Health and Biomedical Innovation,
Queensland University of Technology, Brisbane, AUSTRALIA.
Gavin Turrell PhD, Professor, Senior Research Fellow
School of Public Health/Institute of Health and Biomedical Innovation,
Queensland University of Technology, Brisbane, AUSTRALIA.
Corresponding author:
Kyoko Miura
C/- School of Public Health
Queensland University of Technology
Victoria Park Rd, Kelvin Grove
QLD, 4059 AUSTRALIA
Email: [email protected]
Keywords: Socioeconomic, fast-food, take-out food, fruit and vegetables, mediation
2
Abstract
Lower fruit and vegetable intake among socioeconomically disadvantaged groups has been
well documented, and may be a consequence of a higher consumption of take-out foods.
This study examined whether, and to what extent, take-out food consumption mediated
(explained) the association between socioeconomic position and fruit and vegetable intake. A
cross-sectional postal survey was conducted among 1500 randomly selected adults aged 25–
64 years in Brisbane, Australia in 2009 (response rate = 63.7%, N = 903). A food frequency
questionnaire assessed usual daily servings of fruits and vegetables (0 to 6), overall take-out
consumption (times/week) and the consumption of 22 specific take-out items (never to
≥once/day). These specific take-out items were grouped into ―less healthy‖ and ―healthy‖
choices and indices were created for each type of choice (0 to 100). Socioeconomic position
was ascertained by education. The analyses were performed using linear regression, and a
bootstrap re-sampling approach estimated the statistical significance of the mediated effects.
Mean daily serves of fruits and vegetables was 1.89 (SD 1.05) and 2.47 (SD 1.12)
respectively. The least educated group were more likely to consume fewer serves of fruit (β=
–0.39, p<0.001) and vegetables (β= –0.43, p<0.001) compared with the highest educated. The
consumption of ―less healthy‖ take-out food partly explained (mediated) education
differences in fruit and vegetable intake; however, no mediating effects were observed for
overall and ―healthy‖ take-out consumption. Regular consumption of ―less healthy‖ take-out
items may contribute to socioeconomic differences in fruit and vegetable intake, possibly by
displacing these foods.
3
INTRODUCTION
Socioeconomically disadvantaged groups experience a higher prevalence of cardiovascular
disease, type 2 diabetes and their associated risk factors including overweight/obesity (1-3).
The likelihood of developing these chronic conditions can be lowered by regularly
consuming an adequate amount of fruit and vegetables (4,5). Socioeconomically
disadvantaged groups are more likely to have a diet that is characterized by lower fruit and
vegetable intake compared with their advantaged counterparts (6-8), and these dietary
differences are thought to be one contributing factor to socioeconomic health inequalities
(1,2).
To date, most studies have documented the nature and extent of socioeconomic differences
in fruit and vegetable intake (6, 9); however, very few have investigated why these intake
differences exist. One possible explanation for the lower fruit and vegetable intake among
lower socioeconomic groups is their take-out food consumption. Socioeconomically
disadvantaged groups are more likely to eat/purchase take-out and fast-food compared with
advantaged groups (10-12), and these foods are associated with low diet quality, including
reduced fruit and vegetable intake (13-15). These findings suggest that take-out food
consumption may be displacing fruit and vegetable intake.
Previous studies have primarily examined fast-foods which are typically energy dense (10-
14). Take-out foods, on the other hand, encompass a wide variety of food types that range
from energy dense to relatively nutrient rich, and can be categorized into ―less healthy‖ and
―healthy‖ choices according to their nutritional profiles. Choosing different take-out food-
types may be socioeconomically patterned, as disadvantaged groups tend to have less healthy
diets (16,17). Furthermore, depending on the types of take-out food choices, the magnitude of
the effect on fruit and vegetable intake may be different. A recent Australian study reported
that participants who consumed ―less healthy‖ take-out foods in the previous 24-hours were
4
significantly less likely to eat any fruit and vegetables compared with those who did not;
however, opposite associations were seen for ―healthy‖ take-out foods (18). From these
findings, it was hypothesized that socioeconomic differences in fruit and vegetable intake
may be mediated by take-out food consumption and, especially, by the choice of take-out
food. This previous Australian study, however, had a number of limitations. First, it used
1995 data, and the range and sales of take-out food have increased substantially during the
last 16 years (19,20). Second, the study did not quantify the contribution of take-out food to
socioeconomic inequalities in fruit and vegetable intake. Third, the study combined fruit and
vegetable intake into a single dichotomized measure (consumed, not consumed) which did
not allow a separate examination of the association between take-out food consumption and
fruit and vegetable intake, or an assessment of how take-out foods are associated with
meeting the recommended intakes of fruit and vegetables.
This current study advances knowledge of the factors contributing to the lower fruit and
vegetable intake of socioeconomically disadvantaged groups by examining whether take-out
food consumption mediates socioeconomic differences in fruit and vegetable intake, using
data collected in 2009 and more detailed fruit and vegetable intake measures. Take-out food
is defined as foods or meals that are pre-prepared commercially and require no further
preparation by the consumer, and can be consumed immediately after purchase.
5
METHODS
Ethical approval was granted by the Queensland University of Technology Human Research
Ethics Committee (ID 0900000445).
Study participants
This cross-sectional study was conducted in the Brisbane metropolitan area (Australia)
between July and September 2009. A total of 1500 adults aged between 25–64 years were
randomly selected from the electoral roll of the Brisbane statistical sub-division. Data were
collected by a self-administered postal survey (21) that asked about usual take-out food
consumption, fruit and vegetable intake, and socio-demographic characteristics. A total of
903 participants completed the survey (response rate 63.7%). Respondents who had missing
or inadequate information on age, sex, education, take-out food consumption, fruit and
vegetable intake were excluded from the analyses (n=98), reducing the analytical sample to
N=805.
Outcome measures
Standard questions were used to assess fruit and vegetable intake (22). These questions are
used widely (15,23,24) and have been shown to be valid measures of fruit and vegetable
intake (25). Fruit intake included pure juices, raw, cooked, canned, frozen, or dried fruits, and
was measured by asking respondents how many serves of fruit they usually ate daily. A
standard serve size for fruit was defined as one medium piece or two small pieces; or 1/2 cup
of juice. Five response options ranged from ―don’t eat fruit‖, to ―≥ six serves per day‖.
Similar to that used in previous studies (26-28), responses were recorded to: don’t eat
fruit=0.0, ≤ one serve per day=1.0, two to three serves per day=2.5, four to five serves per
day=4.5, and ≥ six serves per day=6.0.
6
Vegetable intake was measured using an identical format and method to that used for fruit,
and included intakes of all raw, cooked, frozen, canned or dried vegetables and legumes, but
excluded potatoes. One serving of vegetables was defined as 1/2 cup of cooked
vegetables/beans, or 1 cup of salad vegetables. The test-retest reliability of fruit and vegetable
intake was assessed by weighted kappa statistic in a separate sample (n=37) who completed
the same survey twice, one month apart. The kappa coefficient was 0.54 for fruit intake and
0.65 for vegetable intake.
Mediators
Overall take-out food consumption
Participants were asked how often they usually consumed take-out foods in the last 12
months (―never‖ to ―once per day‖). Similar to the fruit and vegetable intake measures,
responses were re-coded to: never=0, rarely=0.1, < once a month=0.2, one to three times per
month=0.5, once per week=1.0, two to three times per week=3.0, five to six times per
week=5.5, and once per day=7.0. The weighted kappa coefficient for this measure was 0.71.
“Less healthy” and “healthy” take-out food-types
Participants who reported consuming take-out foods in the last 12 months (n=804) were
asked how often they usually ate each of 22 take-out foods, identified to be the most
frequently consumed take-out foods in Australia (18). Similar to overall take-out food
consumption, seven response options ranged from ―never or rarely‖ to ―once per day‖.
Each of these 22 items was classified as either ―less healthy‖ or ―healthy‖ choices. Similar
to a previous study (18), this classification was based on the Australian Guide to Healthy
Eating (29) which categorizes foods into five groups: cereals, vegetables, fruit, dairy, meat,
and ―extra‖ foods. The ―extra‖ foods (e.g. cakes and deep-fried take-out foods) are a non-
7
essential part of a diet and are typically high in fat, salt, or sugar. Most of the ―less healthy‖
take-out items were consistent with the ―extra‖ foods. To classify foods not identified in the
―extra‖ food list, nutrient composition data were used (30,31). Foods meeting ≥one of the
following criteria were classified as ―less healthy‖: >2500 kJ of energy per serve; >3g of
saturated fat; <2g of fiber per serve. Beverages classified as ―less healthy‖ were those
containing ≥600 kJ of energy per serve and/or >3g of saturated fat per 100g. Foods or
beverages not meeting any of these criteria were considered ―healthy‖ options. This
classification resulted in 13 ―less healthy‖ items and nine ―healthy‖ items.
―Less healthy‖ take-out foods comprised: potato chips, hamburger, pizza, savory pies,
fried fish/seafood, fried chicken, fried dim-sum, curry, cakes, non-diet soft drink, thick/milk
shake, flavored milk, and ice-cream. ―Healthy‖ take-out foods comprised: kebab, sandwiches,
fried rice, pasta, Asian-style noodles, sushi, salad, diet soft drink, and fruit/vegetable juices.
A score was calculated to characterize each participant’s take-out food consumption as
follows: never/rarely consumed the take-out item=0, consumed < once a month=1, one to
three times per month=2, four times per month=3, two to four times per week=4, five to six
times per week=5, and ≥once a day=6. ―Less healthy‖ and ―healthy‖ take-out food indices
were created by summing the items. Each respondent’s score was rescaled to range 0–100.
Higher scores were indicative of consuming a wider variety or greater frequency of
consumption in the last 12 months. The weighted kappa coefficients for ―less healthy‖ take-
out foods ranged from 0.34–0.66 (mean 0.53, SD 0.08) and ―healthy‖ items ranged from
0.17–0.71 (mean 0.48, SD 0.16).
Independent variable and covariates
Education was used as the socioeconomic measure and ascertained by the highest completed
qualification. Participant’s education was coded as 1) bachelor degree or higher (latter
8
includes graduate diploma, graduate certificate, and postgraduate degree); 2) diploma
(includes associate degree which is generally not a university-level education in Australia); 3)
vocational (trade or business certificate); and 4) no post-school qualifications. Covariates
used in the mediation analyses were age (continuous) and sex.
Statistical analyses
For the bivariate analyses, ANOVA was used for categorical variables, Pearson’s correlation
was used for normally distributed variables, and Spearman’s correlation was used for non-
normally distributed variables. The contribution of take-out food consumption to education
differences in fruit and vegetable intake was examined using the mediation test outlined by
Baron and Kenny (32). A series of multiple regression models evaluated the various
associations: Path a) associations between education and take-out food consumption
behaviors ; Path b) associations between take-out food consumption behaviors and fruit and
vegetable intake; Path c) association between education and fruit/vegetable intake; Path c’)
examines the association between education and fruit/vegetable intake controlling for take-
out food consumption behaviors; this is, a mediated effect by which education affects
fruit/vegetable intake through take-out food consumption.
The mediated (indirect) effect was formally tested using a non-parametric bootstrapping
procedure (n=5000 samples) that estimated the sampling distribution of the indirect effect
and the corresponding bias-corrected and accelerated 95% confidence interval (95% CI) (33);
this procedure is more statistically robust than the Sobel test (33-35). Indirect effects were
considered significant when the 95% CI did not include zero. For all other tests, statistical
significance was considered at p≤0.05 (two-tailed). All analyses were performed in SPSS
(version 18.0.1, 2009, SPSS Inc., Chicago, Illinois).
9
RESULTS AND DISCUSSION
Characteristics of participants
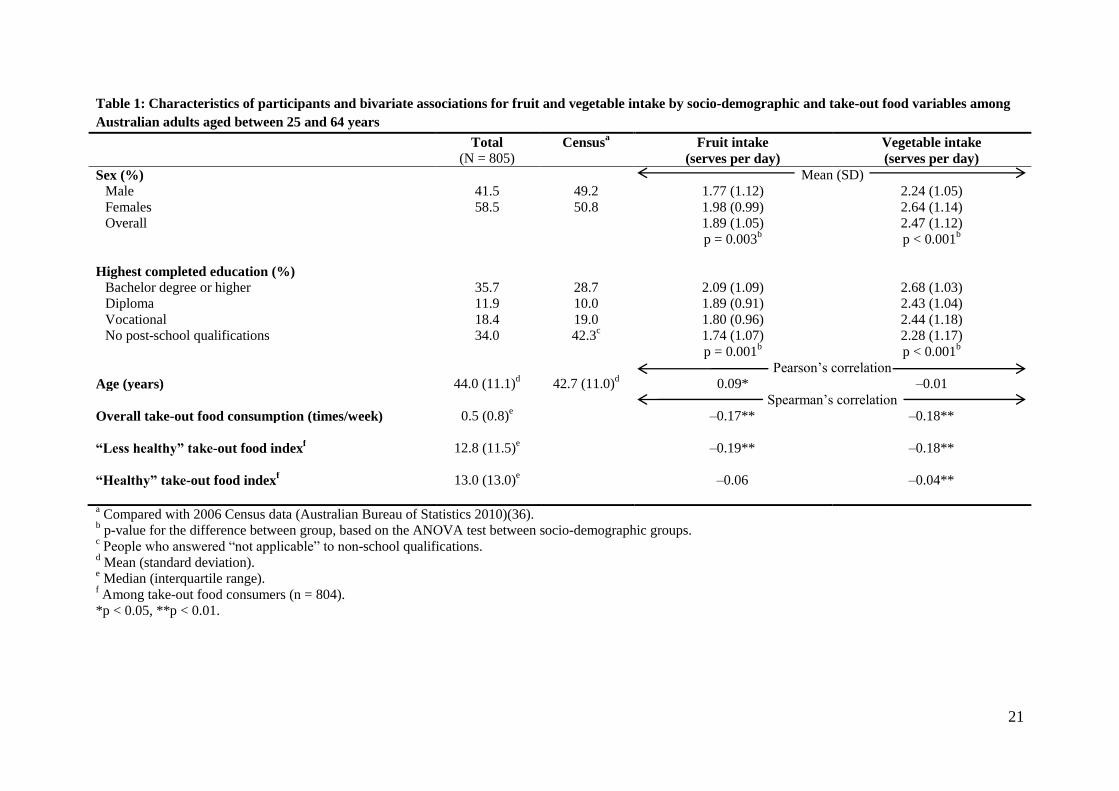
Compared with 2006 census data (36), participants were slightly older and over-represented
by women and the more educated (Table 1). The median overall take-out food consumption
was one to three times per month. A global test (ANOVA) showed education was
significantly associated with daily servings of fruit (p=0.001) and vegetables (p<0.001) and
intakes were highest among participants with a bachelor degree or higher. All take-out food
consumption measures were negatively correlated with fruit and vegetable intake (all p<0.001
except ―healthy‖ take-out food and fruit intake).
Association between education and take-out food consumption behaviors (Path a)
Participants with a diploma-level education had significantly higher overall take-out food
consumption than those with a bachelor degree or higher (β=0.317 times per week, p=0.017).
For the ―less healthy‖ take-out food, participants with vocational education (β=1.818,
p=0.042) and no post-school qualifications (β=2.910, p=0.001) scored significantly higher
compared with those with a bachelor degree or higher. Higher ―healthy‖ take-out scores were
observed among participants with a diploma-level education (β=3.186, p=0.015) compared
with those with a bachelor degree or higher. In all take-out food consumption measures, those
with a bachelor degree or higher showed the lowest consumption. Similar to a previous
Australian study, lower educated groups were more likely to consume ―less healthy‖ take-out
foods compared with highly educated groups (18). These results were generally consistent in
showing that socioeconomically disadvantaged groups had poorer dietary intakes (37,38), and
higher rates of diet-related chronic diseases (1,39) and overweight/obesity (37,39).
10
Association between take-out food consumption behaviors and fruit and vegetable intake
(Path b)
Overall and ―less healthy‖ take-out food consumption was negatively associated with fruit
intake. A one-unit increase in overall take-out food consumption was associated with a
reduction of 0.08 daily serves of fruit (p=0.011), while a one-unit increase on the ―less
healthy‖ take-out food score was associated with a reduction of 0.01 daily serves (p=0.002).
There was no significant association between the ―healthy‖ take-out food index and fruit
intake.
Likewise, overall and ―less healthy‖ take-out food consumption was negatively associated
with vegetable intake: a one-unit increase in overall take-out food consumption was
associated with a reduction of 0.14 daily serves of vegetables (p<0.001) whereas a one-unit
increase on the ―less healthy‖ take-out food score was associated with a reduction of 0.02
daily serves (p<0.001). ―Healthy‖ take-out food consumption was not associated with
vegetable intake. These findings suggest that consuming ―healthy‖ take-out food frequently
may not have a detrimental effect on fruit and vegetable intake. Previous research has
reported associations between higher nutritional knowledge and higher fruit and vegetable
intake (40), suggesting that health promotion strategies that impart the skills and knowledge
to select healthy take-out foods may improve fruit and vegetable intake. However, as the
majority of participants in this present study reported not consuming the recommended
amount of vegetables (≥ five serves) (29), programs and policies are still needed to improve
vegetable intake among the whole population.
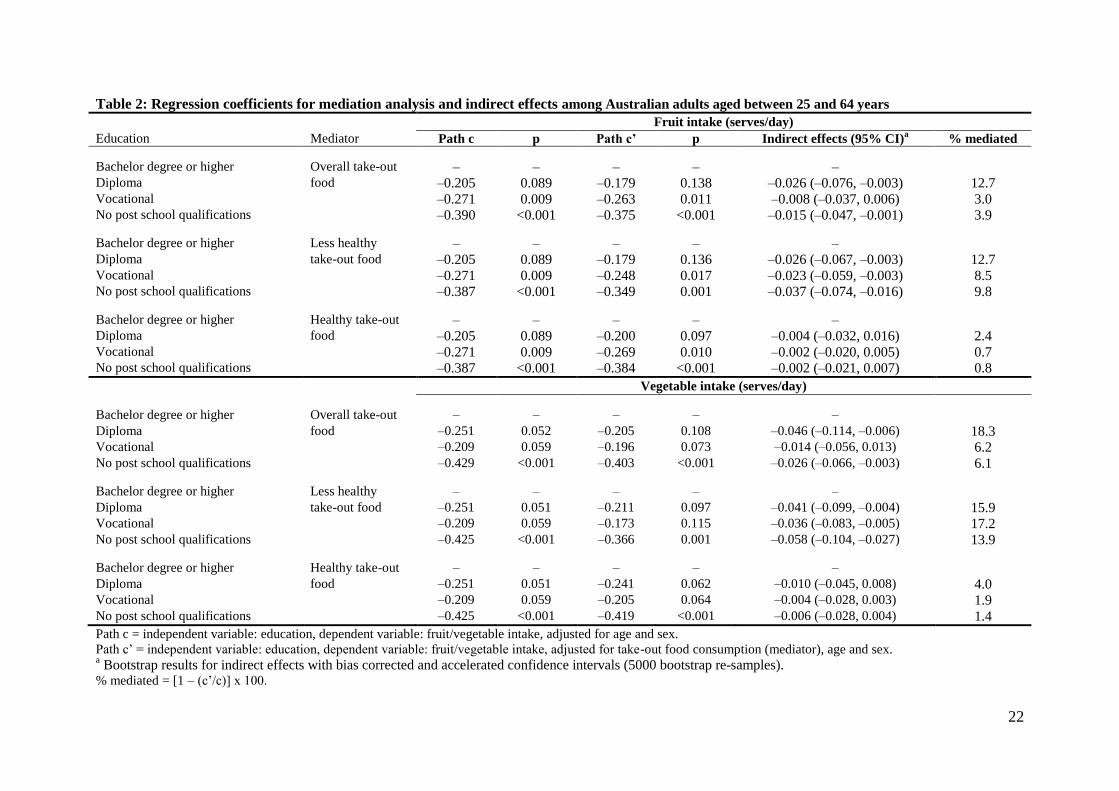
Education differences in fruit and vegetable intake (Path c) and the mediation effect of take-
out food consumption (Path c’)
11
Lower educated groups reported fewer daily serves of fruit (Path c, Table 2). Participants
with no post-school qualifications (p<0.001) and those with a vocational education (p=0.009)
had significantly lower fruit intake compared with those with a bachelor degree or higher.
When take-out food consumption measures were included in the model (Path c’), all
associations were slightly attenuated; however, those with no post-school qualifications and
vocational education remained significantly different from the highest educated in terms of
their fruit intake. The indirect effects through overall take-out food were significant among
participants with no post-school qualifications and diploma-level education as the 95% CI did
not include zero. Likewise, the indirect effects of ―less healthy‖ take-out food were
significant at all education levels. There was no significant indirect effect through ―healthy‖
take-out food at any education level.
For vegetables, lower educated groups consumed fewer serves per day (Path c):
participants with no post school qualifications had a significantly lower intake (p<0.001)
compared with those with a bachelor degree or higher. Those with vocational (p=0.059) and
diploma-level education (p=0.051) also showed reduced intake; however, the differences
were not statistically significant at p≤0.05. After the inclusion of any take-out food
consumption variables (Path c’), the associations became slightly weaker for all education
levels. Among the least educated, however, the association remained significant (p<0.001)
with adjustment for each type of take-out food. Significant indirect effects were observed for
overall take-out food among participants with no post-school qualifications and diploma-level
education, and all education levels for ―less healthy‖ take-out food. No significant indirect
effects were observed for ―healthy‖ take-out food consumption.
The results suggest that the frequency and choice of take-out food may play an important
role in fruit and vegetable intake. However, the observed contributions of ―less healthy‖ take-
out food to education differences in fruit and vegetable intake were small although
12
statistically significant. These may be attributable to the dietary assessment tool employed:
dietary intake assessed by a self-administered survey is typically misreported (41,42) and
generally food frequency questionnaires underestimate ―true‖ energy intakes (43).
Disadvantaged groups are likely to have lower abilities to recall and estimate dietary intakes
(44) and lower educated groups have been shown to underreport total energy intake measured
by self-reported dietary behaviors (41). People underreporting energy intake are more likely
to report lower daily consumption of take-out food types such as muffins, donuts, and soft-
drinks (45). Therefore, take-out consumption may be underestimated by lower educated
groups.
The largest absolute indirect effects, on average, were observed among participants with
no post-school qualifications for ―less healthy‖ take-out food consumption compared with
other groups. This suggests that discouraging the lower educated groups from consuming
―less healthy‖ take-out food may reduce the education differences in fruit and vegetable
intake. However, take-out food consumption is unlikely to be the sole explanation for the
education variations in fruit and vegetable intake, and other factors may be contributing to
these differences. Previous research has identified other possible mediators including:
nutritional knowledge (46), weight concerns (47), and belief and concerns for health (48).
Furthermore, social and environmental factors such as accessibility and availability of fast-
food (12,49,50), and exposure to food advertisements (51) may also influence socioeconomic
inequalities in fruit and vegetable intake. Environmental factors, however, may not play as
big role in dietary inequalities in Australia as in the US (52). Most Australian studies have
shown that there is little difference in the price and availability of healthy/less healthy foods
and food stores across different socioeconomic areas (53-55). Similarly, determinants of fast-
food and take-out meal purchasing seem to have more individual characteristics rather than
environmental (12,56).
13
Limitations
The statistical mediation model assumes temporal direction of causal order (i.e. independent
variable precedes mediator, and mediator precedes outcome variable) (57). However, due to
the cross-sectional study design causality cannot be attributed. All measures were self-
reported, and self-reported dietary measures, in particular, are prone to bias. Furthermore, the
lower educated groups were under-represented suggesting that the true education differences
in take-out food consumption are likely to be underestimated. Lastly, this study employed
education as a socioeconomic indicator. Results may differ if other indicators are used.
Despite these limitations, this is the first known study to provide evidence for a mediating
effect of take-out food consumption on education differences in fruit and vegetable intake.
CONCLUSION
―Less healthy‖ take-out food consumption appeared to partly explain education inequalities
in fruit and vegetable intake. The results highlight potentially important points for
interventions to educate the population about how to choose healthy take-out foods,
especially among lower educated groups. This may increase fruit and vegetable intake and,
subsequently, reduce the risks of developing diet-related chronic disease and socioeconomic
differences in these. Further research is required to confirm the observed findings and
investigate why take-out food consumption patterns were different across socioeconomic
groups.
14
REFERENCES
1. Davey Smith G. Brunner E. Socio-economic differentials in health: the role of nutrition.
Proc Nutr Soc. 1997; 56: 75-90.
2. James WPT, Nelson M, Ralph A, Leather S. The contribution of nutrition to inequalities
in health. BMJ. 1997; 314: 1545-1549.
3. Turrell G, Stanley L, de Looper M, Oldenburg B. Health inequalities in Australia:
morbidity, health behaviours, risk factors and health service use. Health Inequalities
Monitoring Series: No. 2. AIHW Cat. No. PHE 72. Canberra, Australia: Queensland
University of Technology, and the Australian Institute of Health and Welfare; 2006.
4. Hung HC, Joshipura KJ, Jiang R, Hu FB, Hunter D, Smith-Warner SA, Colditz GA,
Rosner B, Spiegelman D, Willet WC. Fruit and vegetable intake and risk of major
chronic disease. J Natl Cancer Inst. 2004; 96: 1577-1584.
5. Van Duyn MAS, Pivonka E. Overview of the health benefits of fruit and vegetable
consumption for the dietetics professional: selected literature. J Am Diet Assoc.
2000;100:1511-1521.
6. Giskes K, Turrell G, Patterson C, Newman B. Socioeconomic differences among
Australian adults in consumption of fruit and vegetables and intakes of vitamins A, C
and folate. J Hum Nutr Diet. 2002;15:375-385.
7. Giskes K, Avendano M, Brug J, Kunst AE. A systematic review of studies on
socioeconomic inequalities in dietary intakes associated with weight gain and
overweight/obesity conducted among European adults. Obes Rev. 2010;11:413-429.
8. Irala-Estevez JD, Groth M, Johansson L, Oltersdorf U, Prättälä R, Martínez-González
MA. A systematic review of socio-economic differences in food habits in Europe:
Consumption of fruit and vegetables. Eur J Clin Nutr. 2000;54:706-714.
15
9. Prättälä R, Hakala S, Roskam AJR, Roos E, Helmert U, Klumbiene J, Van Oyen H,
Regidor E, Kunst AE. Association between educational level and vegetable use in nine
European countries. Plublic Health Nutr. 2009;12:2174-2182.
10. Glanz K, Basil M, Maibach E, Goldberg J, Snyder D. Why Americans eat what they do:
taste, nutrition, cost, convenience, and weight control concerns as influences on food
consumption. J Am Diet Assoc. 1998;98: 1118-1126.
11. Pereira MA, Kartashov AI, Ebbeling CB, Van Horn L, Slattery, Martha L. Jacobs DR,
Ludwig DS. Fast-food habits, weight gain, and insulin resistance (the CARDIA study):
15-year prospective analysis. Lancet. 2005;365:36-42.
12. Thornton LE, Bentley RJ, Kavanagh AM. Individual and area-level socioeconomic
associations with fast food purchasing. J Epidemiol Commuty Health. 2011;65: 873-880.
13. Paeratakul S, Ferdinand DP, Champagne CM, Ryan DH, Bray GA. Fast-food
consumption among US adults and children: dietary and nutrient intake profile. J Am
Diet Assoc. 2003;103:1332-1338.
14. Schröder H, Fïto M, Covas MI. Association of fast food consumption with energy intake,
diet quality, body mass index and the risk of obesity in a representative Mediterranean
population. Br J Nutr. 2007;98:1274-1280.
15. Smith KJ, McNaughton SA, Gall SL, Blizzard L, Dwyer T, Venn A. Takeaway food
consumption and its associations with diet quality and abdominal obesity: a cross-
sectional study of young adults. Int J Behav Nutr Phys Act. 2009;6.
16. Galobardes B, Morabia A, Bernstein MS. Diet and socioeconomic position: does the use
of different indicators matter? Int J Epidemiol. 2001;30:334-340.
17. Turrell G, Hewitt B, Patterson C, Oldenburg B. Measuring socio-economic position in
dietary research: is choice of socio-economic indicator important? Public Health Nutr.
2003; 6:191-200.
16
18. Miura K, Giskes K, Turrell G. Socioeconomic differences in takeaway food consumption
and their contribution to inequalities in dietary intakes. J Epidemiol Community Health.
2009; 63:820-826.
19. Australian Bureau of Statistics. Cafes, restaurants and catering services, Australia 2006-
07. 2008. Cat No. 8655.0. Canberra, Australia: ABS; Available at
http://www.ausstats.abs.gov.au/Ausstats/subscriber.nsf/0/208E6A8D6857022ACA25743
500119553/$File/86550_2006-07.pdf. Accessed January 18, 2011.
20. BIS Shrapnel, 2009. Fast Food in Australia 2009.
http://www.bis.com.au/verve/_resources/Fast_Food_in_Australia_09_Proposal.pdf.
Accessed January 18, 2011.
21. Dillman DA. Mail and Internet Surveys: The Tailored Design Method. 2nd ed. New
York: John Wiley & Sons, Inc; 2000.
22. McLennan W, Podger A. National Nutrition Survey Users' Guide 1995. Camberra,
Australia: Australian Bureau of Statistics; 1998.
23. Crawford D, Ball K, Mishra G, Salmon J, Timperio A. Which food-related behaviours
are associated with healthier intakes of fruits and vegetables among women? Public
Health Nutr. 2007;10:256-265.
24. Inglis V, Ball K, Crawford D. Socioeconomic variations in women's diets: what is the
role of perceptions of the local food environment? J Epidemiol Community Health.
2008;62:191-197.
25. Coyne T, Ibiebele TI, McNaughton S, Rutishauser IHE, O'Dea K, Hodge AM,
McClintock C, Findlay MG, Lee A. Evaluation of brief dietary questions to estimate
vegetable and fruit consumption – using serum carotenoids and red-cell folate. Public
Health Nutr. 2005;8:298-308.
17
26. Ball K, MacFarlane A, Crawford D, Savige G, Andrianopoulos N, Worsley A. Can
social cognitive theory constructs explain socio-economic variations in adolescent eating
behaviours? A mediation analysis. Health Educ Res. 2009; 24:496-506.
27. Cancer Council Victoria. Dietary Questionnaire for Epidemiological Studies (DQES v2):
User Information Guide 2009. Victoria, Australia; 2009.
http://www.cancervic.org.au/downloads/cec/FFQs/CEC-DQESv2-User-Guide-09.pdf.
Accessed November 17, 2010.
28. Willett W. Nutritional Epidemiology. 2 ed. New York: Oxford University Press, Inc.;
1998.
29. The Commonwealth Department of Health and Family Services, The Australian Guide to
Healthy Eating: Background Information for Nutrition Educators. Camberra, Australia:
Department of Health and Family Services; 1998.
30. New South Wales Health and New South Wales Department of Education and Training,
Fresh Tastes at School: NSW Healthy School Canteen Strategy Canteen Menu Planning
Guide. New South Wales Health and New South Wales Department of Education and
Training; 2006.
https://www.det.nsw.edu.au/policies/student_serv/student_health/canteen_gu/CMPlanner
.pdf. Accessed November 17, 2010.
31. Queensland Health, A Better Choice Healthy Food and Drink Supply Strategy for
Queensland Health Facilities. Queensland Health; 2007.
http://www.health.qld.gov.au/ph/Documents/abetterchoice/32511.pdf. Accessed
November 17, 2010.
32. Baron RM, Kenny DA. The moderator–mediator variable distinction in social
psychological research: Conceptual, strategic, and statistical considerations. J Pers Soc
Psychol. 1986;51:1173-1182.
18
33. Preacher K, Hayes A. Asymptotic and resampling strategies for assessing and comparing
indirect effects in multiple mediator models. Behav Res Methods. 2008;40:879-891.
34. Hayes A. Beyond Baron and Kenny: Statistical mediation analysis in the new
millennium. Communication Monographs. 2009;76:408-420.
35. Preacher KJ Hayes A. SPSS and SAS procedures for estimating indirect effects in simple
mediation models. Behav Res Methods Instrum Comput. 2004;36:717-731.
36. Australia Bureau of Statistics. CDATA online: 2006 Census data.
http://www.abs.gov.au/CDataOnline. Updated August 2, 2010. Accessed August 4, 2011.
37. Hulshof KFAM, Brussaard JH, Kruizinga AG, Telman J, Löwik MRH. Socio-economic
status, dietary intake and 10y trends: The Dutch National Food Consumption Survey.
Eur J Clin Nutr. 2003;57:128-137.
38. Martikainen P, Brunner E, Marmot M. Socioeconomic differences in dietary patterns
among middle-aged men and women. Soc Sci Med. 2003;56:1397-1410.
39. Paeratakul S, Lovejoy JC, Ryan DH, Bray GA. The relation of gender, race and
socioeconomic status to obesity and obesity comorbidities in a sample of US adults. Int J
Obes Relat Metab Disord. 2002;26:1205-1210.
40. Ball K, Crawford D, Mishra G. Socio-economic inequalities in women's fruit and
vegetable intakes: a multilevel study of individual, social and environmental mediators.
Public Health Nutr. 2006;9:623-630.
41. Johansson L, Solvoll K, Bjørneboe GE, Drevon CA. Under- and overreporting of energy
intake related to weight status and lifestyle in a nationwide sample. Am J Clin Nutr.
1998;68:266-274.
42. Lutomski JE, van den Broeck J, Harrington J, Shiely F, Perry IJ. Sociodemographic,
lifestyle, mental health and dietary factors associated with direction of misreporting of
energy intake. Public Health Nutr. 2011;14:532-541.
19
43. Tooze JA, Subar AF, Thompson FE, Troiano R, Schatzkin A, Kipnis V. Psychosocial
predictors of energy underreporting in a large doubly labeled water study. Am J Clin
Nutr. 2004;79:795-804.
44. Giskes K, Avendano M, Brug J, Kunst AE. A systematic review of studies on
socioeconomic inequalities in dietary intakes associated with weight gain and
overweight/obesity conducted among European adults. Obes Rev. 2010;11: 413-429.
45. Millen AE, Tooze JA, Subar AF, Kahle LL, Schatzkin A, Krebs-Smith SM. Differences
between food group reports of low-energy reporters and non-low-energy reporters on a
food frequency questionnaire. J Am Diet Assoc. 2009;109: 1194-1203.
46. Wardle J, Parmenter K, Waller J. Nutrition knowledge and food intake. Appetite.
2000;34:269-275.
47. Glanz K, Basil M, Maibach E, Goldberg J, Snyder D. Why Americans eat what they do:
taste, nutrition, cost, convenience, and weight control concerns as influences on food
consumption. J Am Diet Assoc. 1998;98:1118-1126.
48. Wardle J, Steptoe A. Socioeconomic differences in attitudes and beliefs about healthy
lifestyles. J Epidemiol Community Health. 2003;57:440-443.
49. Block JP, Scribner RA, DeSalvo KB. Fast food, race/ethnicity, and income: A
geographic analysis. Am J Prev Med. 2004; 27:211-217.
50. Hemphill E, Raine K, Spence JC, Smoyer-Tomic KE. Exploring obesogenic food
environments in Edmonton, Canada: the association between socioeconomic factors and
fast-food outlet access. Am J Health Promot. 2008;22:426-432.
51. Scully M, Dixon H, Wakefield M. Association between commercial television exposure
and fast-food consumption among adults. Public Health Nutr. 2009;12:105-110.
52. Cummins S, Macintyre S. Food environments and obesity—neighbourhood or nation?.
Int J Epidemiol. 2006;35:100-104.
20
53. Giskes K, Van Lenthe FJ, Brug J, Mackenbach JP, Turrell G. Socioeconomic inequalities
in food purchasing: the contribution of respondent-perceived and actual (objectively
measured) price and availability of foods. Prev Med. 2007;45:41-48.
54. Winkler E, Turrell G, Patterson C. Does living in a disadvantaged area mean fewer
opportunities to purchase fresh fruit and vegetables in the area? Findings from the
Brisbane food study. Health Place. 2006;12:306-319.
55. Winkler E, Turrell G, Patterson C. Does living in a disadvantaged area entail limited
opportunities to purchase fresh fruit and vegetables in terms of price, availability, and
variety? Findings from the Brisbane Food Study. Health Place. 2006;12:741-748.
56. Turrell G, Giskes K. Socioeconomic disadvantage and the purchase of takeaway food: A
multilevel analysis. Appetite.2008;51:69-81.
57. MacKinnon DP, Fairchild AJ, Fritz MS. Mediation analysis. Annu Rev Psychol.
2007;58:593-614.
21
Table 1: Characteristics of participants and bivariate associations for fruit and vegetable intake by socio-demographic and take-out food variables among
Australian adults aged between 25 and 64 years
Total (N = 805)
Censusa Fruit intake
(serves per day)
Vegetable intake
(serves per day)
Sex (%) Mean (SD)
Male 41.5 49.2 1.77 (1.12) 2.24 (1.05)
Females 58.5 50.8 1.98 (0.99) 2.64 (1.14)
Overall 1.89 (1.05) 2.47 (1.12)
p = 0.003b p < 0.001
b
Highest completed education (%)
Bachelor degree or higher 35.7 28.7 2.09 (1.09) 2.68 (1.03)
Diploma 11.9 10.0 1.89 (0.91) 2.43 (1.04)
Vocational 18.4 19.0 1.80 (0.96) 2.44 (1.18)
No post-school qualifications 34.0 42.3c 1.74 (1.07) 2.28 (1.17)
p = 0.001b p < 0.001
b
Pearson’s correlation
Age (years) 44.0 (11.1)d 42.7 (11.0)
d 0.09* –0.01
Spearman’s correlation
Overall take-out food consumption (times/week) 0.5 (0.8)e –0.17** –0.18**
“Less healthy” take-out food indexf 12.8 (11.5)
e –0.19** –0.18**
“Healthy” take-out food indexf 13.0 (13.0)
e –0.06 –0.04**
a Compared with 2006 Census data (Australian Bureau of Statistics 2010)(36).
b p-value for the difference between group, based on the ANOVA test between socio-demographic groups.
c People who answered ―not applicable‖ to non-school qualifications.
d Mean (standard deviation).
e Median (interquartile range).
f Among take-out food consumers (n = 804).
*p < 0.05, **p < 0.01.
22
Table 2: Regression coefficients for mediation analysis and indirect effects among Australian adults aged between 25 and 64 years
Fruit intake (serves/day)
Education Mediator Path c p Path c’ p Indirect effects (95% CI)a % mediated
Bachelor degree or higher Overall take-out – – – – – Diploma food –0.205 0.089 –0.179 0.138 –0.026 (–0.076, –0.003) 12.7 Vocational –0.271 0.009 –0.263 0.011 –0.008 (–0.037, 0.006) 3.0 No post school qualifications –0.390 <0.001 –0.375 <0.001 –0.015 (–0.047, –0.001) 3.9
Bachelor degree or higher Less healthy – – – – – Diploma take-out food –0.205 0.089 –0.179 0.136 –0.026 (–0.067, –0.003) 12.7 Vocational –0.271 0.009 –0.248 0.017 –0.023 (–0.059, –0.003) 8.5 No post school qualifications –0.387 <0.001 –0.349 0.001 –0.037 (–0.074, –0.016) 9.8
Bachelor degree or higher Healthy take-out – – – – – Diploma food –0.205 0.089 –0.200 0.097 –0.004 (–0.032, 0.016) 2.4 Vocational –0.271 0.009 –0.269 0.010 –0.002 (–0.020, 0.005) 0.7 No post school qualifications –0.387 <0.001 –0.384 <0.001 –0.002 (–0.021, 0.007) 0.8
Vegetable intake (serves/day)
Bachelor degree or higher Overall take-out – – – – – Diploma food –0.251 0.052 –0.205 0.108 –0.046 (–0.114, –0.006) 18.3 Vocational –0.209 0.059 –0.196 0.073 –0.014 (–0.056, 0.013) 6.2 No post school qualifications –0.429 <0.001 –0.403 <0.001 –0.026 (–0.066, –0.003) 6.1
Bachelor degree or higher Less healthy – – – – – Diploma take-out food –0.251 0.051 –0.211 0.097 –0.041 (–0.099, –0.004) 15.9 Vocational –0.209 0.059 –0.173 0.115 –0.036 (–0.083, –0.005) 17.2 No post school qualifications –0.425 <0.001 –0.366 0.001 –0.058 (–0.104, –0.027) 13.9
Bachelor degree or higher Healthy take-out – – – – – Diploma food –0.251 0.051 –0.241 0.062 –0.010 (–0.045, 0.008) 4.0 Vocational –0.209 0.059 –0.205 0.064 –0.004 (–0.028, 0.003) 1.9 No post school qualifications –0.425 <0.001 –0.419 <0.001 –0.006 (–0.028, 0.004) 1.4
Path c = independent variable: education, dependent variable: fruit/vegetable intake, adjusted for age and sex.
Path c’ = independent variable: education, dependent variable: fruit/vegetable intake, adjusted for take-out food consumption (mediator), age and sex. a Bootstrap results for indirect effects with bias corrected and accelerated confidence intervals (5000 bootstrap re-samples).
% mediated = [1 – (c’/c)] x 100.
Related Documents