International Journal of Advanced Research in ISSN: 2278-6236 Management and Social Sciences Impact Factor: 6.943 Vol. 6 | No. 10 | October 2017 www.garph.co.uk IJARMSS | 20 CONTRIBUTION OF STAFF PERFORMANCE MANAGEMENT ON ACHIEVEMENT OF INSTITUTIONAL PERFORMANCE, NAROK COUNTY GOVERNMENT Naikuni D.M.N., Lecturer, Department of Business Management. Maasai Mara University, Kenya Abstract: The purpose of this study was to assess the contribution of Performance Staff Management in Achieving institutional performance. A multi-respondent survey of qualitative and quantitative data was collected using questionnaires from the 400 staff selected through purposive and stratified sampling from a population of 2496 from Narok County Government. The data collected using self administered questionnaires was analyzed using descriptive statistics; Percentages, Mean and Standard deviation and inferential Statistics; Factor Analysis, Pearson Correlation Coefficient, and Chi-square. The study findings show that there is an association between the variable of the study and the dependent variable. It is noted that there is a strong positive association between performance management and institutional performance with a Pearson’s R of 0.624, Phi of 2.766 and a cramers V of 0.556 and both have a P- value of 0.000. Pearson chi square is 2425.510 with 837 degrees of freedom and a p- value of 0.000. The critical chi square factor at 850 degrees of freedom is given as 932.689 which is below the calculated factor of 2425.510. This means that there is a significant association between training and development and the performance of county governments in Kenya. The study therefore recommends that institutions should emphasize on implementation of effective performance management practice in the achievement of institutional performance of Narok County Government. The findings are useful to the government of Kenya, Narok County Government, staff and contribute to the knowledge gap. Keywords: Staff, Performance Management, Institution 1.0 INTRODUCTION Most organizations have gone through the process of ensuring they measure the performance of their staff on pre-set and clearly marked Key Performance Indicators (KPIs) and the need to gauge their individual and departmental performance on actual output. According to Bae and Lawler (2000), Performance Management is both a strategic and an integrated approach to delivering successful results in organizations by improving the

Welcome message from author
This document is posted to help you gain knowledge. Please leave a comment to let me know what you think about it! Share it to your friends and learn new things together.
Transcript
International Journal of Advanced Research in ISSN: 2278-6236
Management and Social Sciences Impact Factor: 6.943
Vol. 6 | No. 10 | October 2017 www.garph.co.uk IJARMSS | 20
CONTRIBUTION OF STAFF PERFORMANCE MANAGEMENT ON ACHIEVEMENT
OF INSTITUTIONAL PERFORMANCE, NAROK COUNTY GOVERNMENT
Naikuni D.M.N., Lecturer, Department of Business Management. Maasai Mara University,
Kenya
Abstract: The purpose of this study was to assess the contribution of Performance Staff
Management in Achieving institutional performance. A multi-respondent survey of
qualitative and quantitative data was collected using questionnaires from the 400 staff
selected through purposive and stratified sampling from a population of 2496 from Narok
County Government. The data collected using self administered questionnaires was analyzed
using descriptive statistics; Percentages, Mean and Standard deviation and inferential
Statistics; Factor Analysis, Pearson Correlation Coefficient, and Chi-square. The study
findings show that there is an association between the variable of the study and the
dependent variable. It is noted that there is a strong positive association between
performance management and institutional performance with a Pearson’s R of 0.624, Phi of
2.766 and a cramers V of 0.556 and both have a P- value of 0.000. Pearson chi square is
2425.510 with 837 degrees of freedom and a p- value of 0.000. The critical chi square factor
at 850 degrees of freedom is given as 932.689 which is below the calculated factor of
2425.510. This means that there is a significant association between training and
development and the performance of county governments in Kenya. The study therefore
recommends that institutions should emphasize on implementation of effective performance
management practice in the achievement of institutional performance of Narok County
Government. The findings are useful to the government of Kenya, Narok County
Government, staff and contribute to the knowledge gap.
Keywords: Staff, Performance Management, Institution
1.0 INTRODUCTION
Most organizations have gone through the process of ensuring they measure the
performance of their staff on pre-set and clearly marked Key Performance Indicators (KPIs)
and the need to gauge their individual and departmental performance on actual output.
According to Bae and Lawler (2000), Performance Management is both a strategic and an
integrated approach to delivering successful results in organizations by improving the
International Journal of Advanced Research in ISSN: 2278-6236
Management and Social Sciences Impact Factor: 6.943
Vol. 6 | No. 10 | October 2017 www.garph.co.uk IJARMSS | 21
performance and developing the capabilities of teams and individuals. The term
performance management gained its popularity in early 1980’s when total quality
management programs received utmost importance for achievement of superior standards
and quality performance. Tools such as job design, leadership development, training and
reward system received an equal impetus along with the traditional performance appraisal
process in the new comprehensive and a much wider framework. Performance
management is an on-going communication process which is carried between the
supervisors and the employees throughout the year. The process is very much cyclical and
continuous in nature. A performance management process sets the platform for rewarding
excellence by aligning individual employee accomplishments with the organization’s mission
and objectives and making the employee and the organization understand the importance
of a specific job in realizing outcomes.
By establishing clear performance expectations which includes results, actions and
behaviours, it helps the employees in understanding what exactly is expected out of their
jobs and setting of standards help in eliminating those jobs which are of no use any longer.
Through regular feedback and coaching, it provides an advantage of diagnosing the
problems at an early stage and taking corrective actions. According to Ahmad & Schroeder
(2003), Performance management involves many roles one needs to be a communicator, a
leader, a role model and a collaborator. Each Individual member of the team needs to
understand exactly their responsibilities and expectations and the supervisor should work to
help them achieve the goals and that motivation increases when roles are clear, employees
likely to take ownership of their work and committed to the outcome when expectations
are clear hence the effectiveness of team members. Performance management can be
regarded as a proactive system of managing employee performance for driving the
individuals and the organizations towards desired performance and results.
It is the only way that the performance of individual members of the county governments
can measure their effectiveness and accountability. There exists a lot of skills gap in the
County Governments and inherited unskilled and illiterate workforce that can never drive
the devolution train to its destination. Performance management Systems are still lacking
since most Counties do not even have proper offices and therefore Human Resource policies
are sparingly absent and the making of decisions based on adhoc compromises. There are
International Journal of Advanced Research in ISSN: 2278-6236
Management and Social Sciences Impact Factor: 6.943
Vol. 6 | No. 10 | October 2017 www.garph.co.uk IJARMSS | 22
clear policies on the various aspects of Human resource management in Mombasa County it
will be hard in making decisions and there is likely to be several incidences of inconsistencies
and unfairness in handling staff issues. Most of the County officers lack training both
Technical and experiential since most of them have been brought on board as politically
correct individuals hence it becomes hard to apprehend them in the event of failure to
perform. If the recruitment process is wrong then there becomes a big problem in managing
them daily to make them have any contribution (Ulrich, 1997).
Problem Statement
Since, Kenya adopted a devolved system that led to the formation of forty-seven County
Governments (GoK, 2010). The contribution of SHRM practice in government institutions
performance from different sectors and contexts of devolved systems has not been
assessed. On Narok County for example, Auditor General in his Audit report of June 2013
noted that the county is faced with a Human resource challenge because of unqualified
staff, mismatch in qualification and placement. Complains have been raised on employment
criteria’s, Intellectual Capital availability, Management of resources, Corruption, staff
morale, staff turnover and completion and distribution of projects (Koisaba 2015). Based on
these claims the NCG Governor reshuffled his cabinet and 22 Chief Officers while giving
warning for possible retrenchment of ninety non performing County Staff. One Political
Advisor was sent home. It is against this background that this study was conducted in order
to examine the contributions of Performance Management practice in achieving
institutional performance of Narok County Government.
Study Objectives and Hypothesis
To establish whether Staff performance management contributes to the Achievement of
institutional performance of Narok County Government.
H01: There is no relationship between staff performance management and achievement of
institutional performance.
Justification, Scope and Limitations of the Study
The aim of this study was to assess how best we can achieve institutional performance using
Performance management practice in Kenyan County Governments. This was achieved
through a careful examination and investigation of the factors that contributes to strategic

International Journal of Advanced Research in ISSN: 2278-6236
Management and Social Sciences Impact Factor: 6.943
Vol. 6 | No. 10 | October 2017 www.garph.co.uk IJARMSS | 23
human resource management practices in achieving institutional performance in Narok
County Government.
This study helps employees improve their skills in understanding the importance of
Performance Management to their performance. Management of County Governments will
be improved through measures that enable workers to better apply Performance
Management techniques at work and thereby improve on their performance. This enables
County Governments execute their mandate of service delivery more efficiently to all
residents within their areas of jurisdiction assisted by effective and efficient workers. The
study also assist scholars of HRM understand the factors contributing to the use of SHRM in
current management of institutions.
It also provides new knowledge and insight into the organization of high organizational
performance hence assist the development of programs that can help institutions better
their performance and thus contribute to social and economic development of the whole
country.
The study focused on the workers currently employed and working in the County
Government and their respond on the factors that relate to Performance Management and
how it contributes to the achievement of institution performance in Kenya. It also
concentrated on decentralization involving the transfer of power from central government
to regional government.
The findings of this study may have been affected by the limitation of it capturing views
from respondents only from Narok County Government. This makes it difficult to compare
the findings of the respondents from Narok County Government with respondents from
other County Governments in Kenya which is usually important in spotting bias of
respondents. Some respondents may have feared giving information that Narok County
Government was not fairing on well in performance. This is because all the departments
said that they were performing quite well while this may not be true since some of the
departments have been documented to be having performing poorly.
The fact that County Governments are less than three years old in Kenya was also a
limitation on literature review.

International Journal of Advanced Research in ISSN: 2278-6236
Management and Social Sciences Impact Factor: 6.943
Vol. 6 | No. 10 | October 2017 www.garph.co.uk IJARMSS | 24
2.0 RESEARCH DESIGN AND METHODOLOGY
Research Design
The study used a survey research design to collect data from the target population using
self-administered questionnaires. A mixed method approach utilizing both qualitative and
quantitative methods was adopted. Qualitative approach was used to supplement and
strengthen the quantitative aspects and provide an opportunity for the researcher to
observe the application of HRM strategies first hand.
Target population
The study targeted a total population of 2496 who were staff working in Narok County
Government distributed in all Ministries and departments. The target population was
stratified as shown in Table 3.1.
Table 3.1: Target population
Executives Chief Officers
Directors Managers/PSB Members
Staff Total
County Service Board - - - 7 3 10
Education 1 1 0 0 478 480
Transport and Public Works 1 2 1 2 28 34
Health 1 2 1 0 661 665
Agriculture 1 1 1 0 218 221
Natural Resource and Forestry
1 2 1 0 502 506
Public Administration/ Service
1 2 0 6 120 129
Treasury and Economics 1 1 1 2 318 323
Co-operatives 1 1 1 1 6 10
Livestock and Fisheries 1 1 1 0 72 75
ICT 1 1 1 1 6 10
County Assembly 0 1 0 0 32 33
10 15 8 19 2444 2496
Sample design
A sample of 400 employees, which fulfils the requirements of efficiency, representativeness
(Kothari, 2004; Mugenda & Mugenda, 2012), reliability and validity, was selected. The
Yamane formula for calculating sample sizes was used to calculate the sample size at 95%
confidence level and P = 0.5. Where n is the sample size, N is the population size, and e is
the level of precision.
International Journal of Advanced Research in ISSN: 2278-6236
Management and Social Sciences Impact Factor: 6.943
Vol. 6 | No. 10 | October 2017 www.garph.co.uk IJARMSS | 25
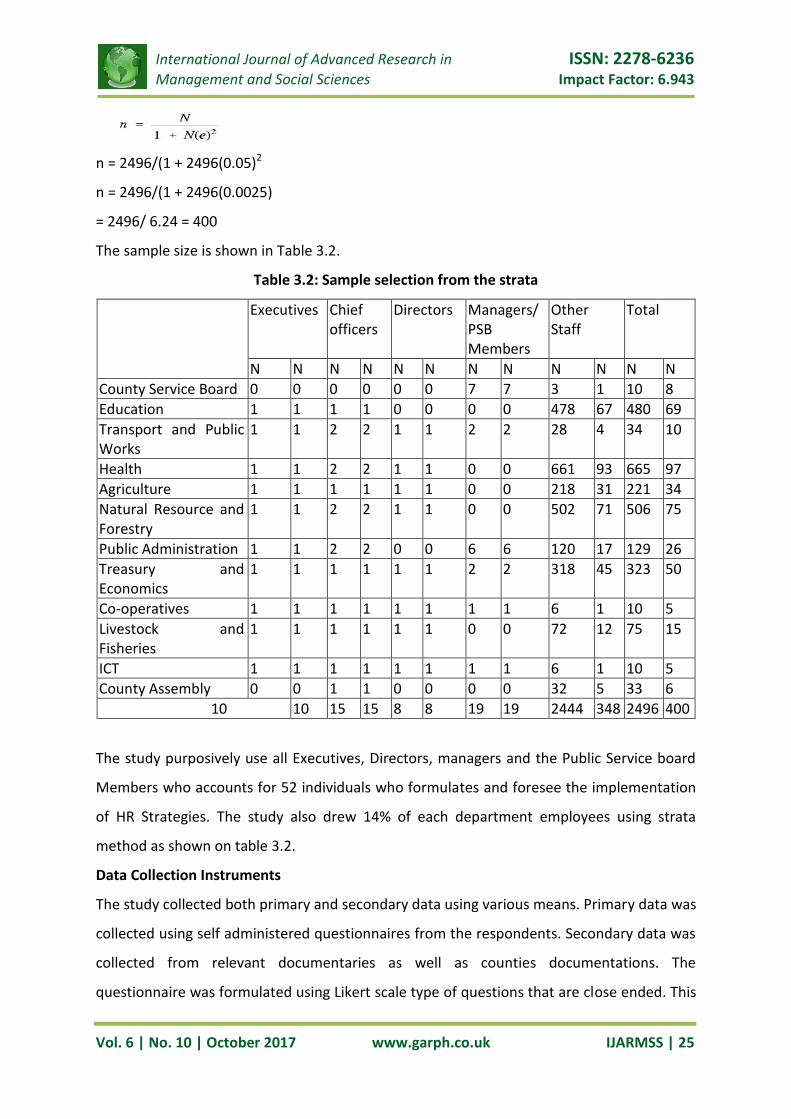
n = 2496/(1 + 2496(0.05)2
n = 2496/(1 + 2496(0.0025)
= 2496/ 6.24 = 400
The sample size is shown in Table 3.2.
Table 3.2: Sample selection from the strata
Executives Chief officers
Directors Managers/PSB Members
Other Staff
Total
N N N N N N N N N N N N
County Service Board 0 0 0 0 0 0 7 7 3 1 10 8
Education 1 1 1 1 0 0 0 0 478 67 480 69
Transport and Public Works
1 1 2 2 1 1 2 2 28 4 34 10
Health 1 1 2 2 1 1 0 0 661 93 665 97
Agriculture 1 1 1 1 1 1 0 0 218 31 221 34
Natural Resource and Forestry
1 1 2 2 1 1 0 0 502 71 506 75
Public Administration 1 1 2 2 0 0 6 6 120 17 129 26
Treasury and Economics
1 1 1 1 1 1 2 2 318 45 323 50
Co-operatives 1 1 1 1 1 1 1 1 6 1 10 5
Livestock and Fisheries
1 1 1 1 1 1 0 0 72 12 75 15
ICT 1 1 1 1 1 1 1 1 6 1 10 5
County Assembly 0 0 1 1 0 0 0 0 32 5 33 6
10 10 15 15 8 8 19 19 2444 348 2496 400
The study purposively use all Executives, Directors, managers and the Public Service board
Members who accounts for 52 individuals who formulates and foresee the implementation
of HR Strategies. The study also drew 14% of each department employees using strata
method as shown on table 3.2.
Data Collection Instruments
The study collected both primary and secondary data using various means. Primary data was
collected using self administered questionnaires from the respondents. Secondary data was
collected from relevant documentaries as well as counties documentations. The
questionnaire was formulated using Likert scale type of questions that are close ended. This
International Journal of Advanced Research in ISSN: 2278-6236
Management and Social Sciences Impact Factor: 6.943
Vol. 6 | No. 10 | October 2017 www.garph.co.uk IJARMSS | 26
enables the researcher to study the employee’s perception on effect of HR strategies on
institutional performance. Since the research was done under some limitations, a
combination of the said methods was used for effective analysis and presentation of data in
an orderly logical manner.
Pilot Test
A pilot test was carried out to test the validity and reliability of research instruments before
the study is conducted. A sample of 40 experts in the field of HRM was used to provide input
and suggestive feedback on the validity of the survey instruments. This was 10% of the
sample size as suggested by Mugenda & Mugenda (2012).
A Cronbach’s coefficient alpha scale of 0-1 was used to determine the internal reliability of
research instrument and an alpha of 0.7 and above was considered suitable for any study
(Schuler , Jackson &Storey, 2001) The reliability of instruments was tested and a cronbach’s
Alpha of 0.98 was realised. The instruments were hence accepted.
Data Collection Procedures
Self-administered questionnaires were used to collect data using research assistants in 3
weeks. In the event that the questionnaire was not received, a follow up telephone calls,
email or personal appearance was done and additional copies of the questionnaire were
administered.
Data analysis procedures
After successive data collection, the collected data was organized for processing. This
involved; coding the responses, tabulating the data and performing several statistical
computations. Using SPSS statistical software, the study employed both descriptive and
inferential statistics to analyse data collected and organized. Descriptive statistics;
Frequencies, Percentages, Mean, Standard Deviation and Kurtosis was calculated on the
independent variables to summarize and describe the data collected. This helps in
determining the extent of staff Resourcing, Training and Development, Performance
Management, Appraisal, Reward management in Achieving Institutional performance in
Narok County Government. Inferential statistics; Correlation, Chi-Square, and Pearson
Correlation Coefficient test was used to determine relationships, check the normality of
variables, and make generalizations about the characteristics of populations based on data
collected from the sample as follows in all objectives.
International Journal of Advanced Research in ISSN: 2278-6236
Management and Social Sciences Impact Factor: 6.943
Vol. 6 | No. 10 | October 2017 www.garph.co.uk IJARMSS | 27
Parametric Tests
In the study parametric tests were used to estimate the population parameter. Because this
estimation process involves a sample, a sampling distribution, and a population, certain
parametric assumptions are required to ensure all components are compatible with each
other. It’s used where the following three assumptions have been observed: Observations
are independent, where the sample data have a normal distribution and Scores in different
groups have homogeneous variances. In this study the following parametric tests were used.
Correlation Analysis
Correlation analysis was used to find out relationships between Variables; contributions of
strategic human resource management practices in achieving institutional performance of
Narok County Government. Using Pearson Correlation Coefficient, the study expressed the
extent to which the variables are related.
Pearson's correlation coefficient
The study used a Pearson's correlation coefficient to measure the linear correlation
between two variables. The result is measured on a value between +1 and −1 inclusive,
where 1 is total positive correlation, 0 is no correlation, and −1 is total negative correlation.
It was also used as a measure of the degree of linear dependence between the two
variables.
Non-parametric tests
The study used this method to test Distribution free statistics that do not require that the
data fit a normal distribution. It also requires less restrictive assumptions about the data and
allow for the analysis of categorical as well as rank data.
Chi-Square
Chi-Square statistic is used in the Test of Independence among various variables of a study.
In this study the test was used to investigate whether distributions of categorical variables
differ from one another. To make a conclusion about the hypothesis with 95% confidence,
the value of significance, that is the p-value of the Chi-Square statistic should be less than
.05 (which is the alpha level associated with a 95% confidence level). If the p-value < .05 and
the critical chi square value is less than the computed value then it is concluded that the
variables are dependent in the population and that there is a statistical relationship
between the categorical variables.

International Journal of Advanced Research in ISSN: 2278-6236
Management and Social Sciences Impact Factor: 6.943
Vol. 6 | No. 10 | October 2017 www.garph.co.uk IJARMSS | 28
Factor Analysis
In this Study Factor analysis was used to describe variability among observed, correlated
variables in terms of a potentially lower number of unobserved variables called factors. The
information gained about the interdependencies between observed variables was used in
the study to reduce the set of variables in a dataset. This technique is equal to low-rank
approximation of the matrix of observed variables.
Exploratory factor analysis (EFA) using varimax rotation method was used to determine
Component Matrix with the application of Kaiser-Meyer-Olkin measure (KMO). KMO results
ranged from 0 to 1, and a factor loading of 0.4 and above accepted for a good factor analysis
and all items that had a factor loading of below 0.4 were removed from the analysis.
Barltlett’s test of sphericity for independent and dependent variable was used with
significance level tested at less than 0.05 according to Pallant, (2005).
Moreover, correlation and chi square were used to explore the relationship and associations
between independent variables and dependent variables.
Ethical Issues
Kothari (2004) identified ethical concerns in research as voluntary participation, no harm to
respondents, anonymity and confidentiality, identifying purpose and sponsor, and analysis
and reporting. To control any ethical issues the researchers encouraged Voluntary
participation of respondents in order to reduce low response rate which can in turn
introduce response biasness. Based on this argument, multiple contacts were necessary, in
this study two contacts were made per potential participant. This was meant to monitor the
progress on response rate and solve any technical problems from the respondents.
Anonymity and confidentiality was provided to protect respondent’s identity. A cover letter
was used to introduce the subject matter of the study and the researcher. The researcher
assumed the responsibility to report problems and weaknesses experienced as well as the
positive results of the study.
3.0 RESEARCH FINDINGS AND DISCUSSION
This chapter presents the analysis of data as summarized by SPSS. The chapter is organized
to present the response rate, the demographic data, and descriptive data based on the
objectives. It also presents factor analysis as per the objectives, correlation, and Chi Square
analyses regarding the study objectives.

International Journal of Advanced Research in ISSN: 2278-6236
Management and Social Sciences Impact Factor: 6.943
Vol. 6 | No. 10 | October 2017 www.garph.co.uk IJARMSS | 29
For this section descriptive statistics were applied to give summary of the demographic data
of the samples and their characteristics. Exploratory factor analysis (EFA) using varimax
rotation method with the application of Kaiser-Meyer-Olkin measure (KMO) and Barltlett’s
test of sphericity for two groups of independent and one dependent variable. Moreover,
correlation and multiple regressions were used to explore the relationship between
independent variables, mediating variables and dependent variables. The results of the EFAs
showed that the KMO was .898 for the group of dependent, and independent variables.
Technically, KMO which ranges from 0 to 1, should be higher than the factor loading of 0.4
to be considered as an acceptable value for a good factor analysis and the Barltlett’s test of
sphericity significant level must be smaller than 0.05 (Pallant, 2005).
Findings of the Study
The findings of the study were presented in this section after tabulation, data analysis and
interpretation.
Response Rate
The study distributed a total of 400 questionnaires and only 342 were returned and used for
the analysis. This is 85.5% which was considered appropriate. According to Marton (2006) a
response rate above 70% is considered appropriate for a descriptive study. The distribution
of responses according to the departments is presented in table 4.1
Table 4.1: Departments
Departments Frequency Percent
Education, Social work, Youth and Gender 63 18.4
Agriculture, Livestock & Fisheries 26 7.6
Health 61 17.8
Transport & Roads 20 5.8
Tourism, Trade & Industry 49 14.3
Environment, Water & Natural Resource 16 4.7
Finance, Economic Planning & ICT 41 12.0
Administration Coordination of Decentralization & Disaster Management
26 7.6
Land& Urban Planning 8 2.3
County Assembly 20 5.8
Public Service Board 12 3.5
Total 342 100.0
The results on table 4.1 shows that majority 63(18.4%) of the respondents who participated
in the study were from the Education, Social work, Youth and Gender departments at the
International Journal of Advanced Research in ISSN: 2278-6236
Management and Social Sciences Impact Factor: 6.943
Vol. 6 | No. 10 | October 2017 www.garph.co.uk IJARMSS | 30
Gender of the respondents
Female, 153, 45%
Male, 189, 55%
Female Male
county government. This was followed by health with a response rate of 61(17.8%), while
Lands and Urban planning had the least number of respondents 8(2.3%). This was quite
proportional to the number of employees in these departments with Education, Social work,
Youth and Gender departments having the highest number of employees in the entire
county.
Demographic data
Demographic variables are important in any descriptive survey because they have an
influence on the response. For this study the gender, duration of service, engagement level
and duration of service were considered.
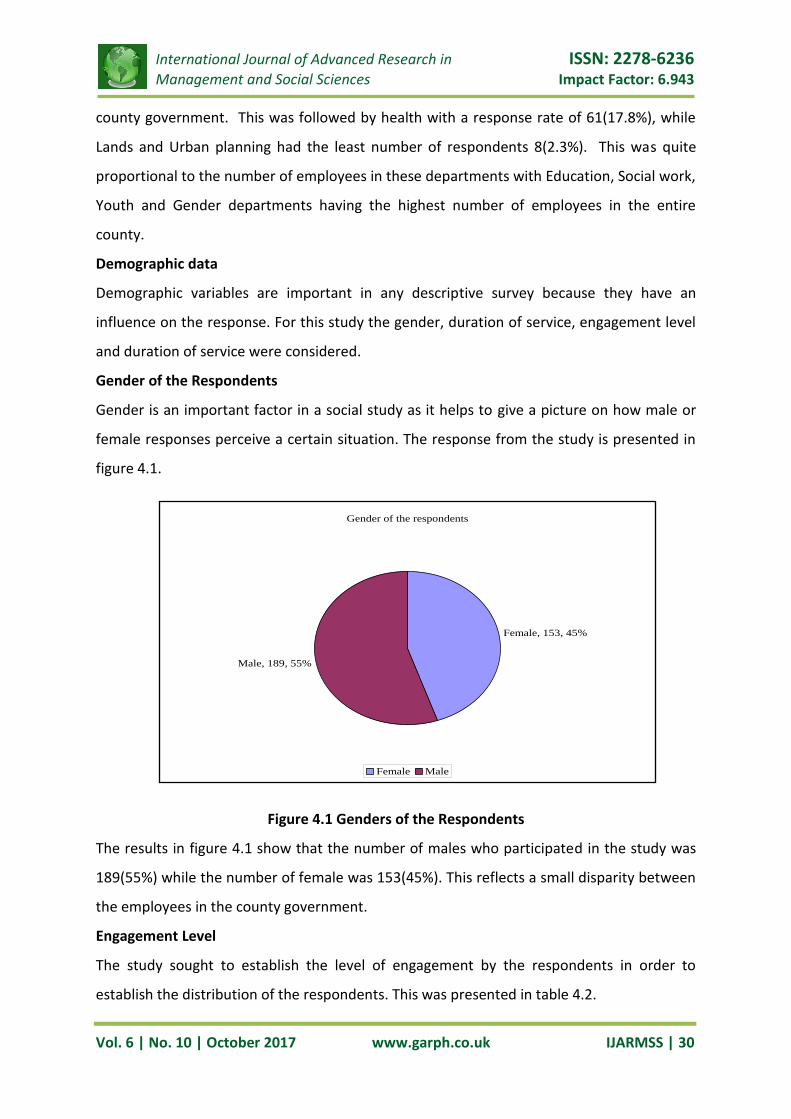
Gender of the Respondents
Gender is an important factor in a social study as it helps to give a picture on how male or
female responses perceive a certain situation. The response from the study is presented in
figure 4.1.
Figure 4.1 Genders of the Respondents
The results in figure 4.1 show that the number of males who participated in the study was
189(55%) while the number of female was 153(45%). This reflects a small disparity between
the employees in the county government.
Engagement Level
The study sought to establish the level of engagement by the respondents in order to
establish the distribution of the respondents. This was presented in table 4.2.
International Journal of Advanced Research in ISSN: 2278-6236
Management and Social Sciences Impact Factor: 6.943
Vol. 6 | No. 10 | October 2017 www.garph.co.uk IJARMSS | 31
Table4.2: Engagement Level of the Respondents
Level of engagement Frequency Percent
Executive 7 2.0 Chief Officer 7 2.0 Director 6 1.8 Manager 23 6.7 Employee 299 87.5 Total 342 100.0
Mean 4.75 Standard Deviation .768 Kurtosis 12.885 Std. Error of Kurtosis .263
The results presented on table 4.2 shows that 87.5 % of the respondents were employees
with only 12.5% representing the management level.
Duration in Service
It was also important to establish the duration of service among the respondents. Majority
of the respondents 227( 66.4%) have worked for the county government for between 1- 5
years while only 10(2.9%) , 52(15.2%) have worked for between 6-10 years, 15(4.4%) have
worked for between 11-15 years, 16( 4.7%) have worked for 16-20 years, 22(6.4%) have
worked for 21-25 years while 10(2.9%) had worked for more than 26 years meaning most of
the employees at the county government were hired when the county government come
into existence while the rest were adopted from the former Local government and
secondment from the National Government. The results indicate a mean of 1.78 and a
standard deviation of 1.378.
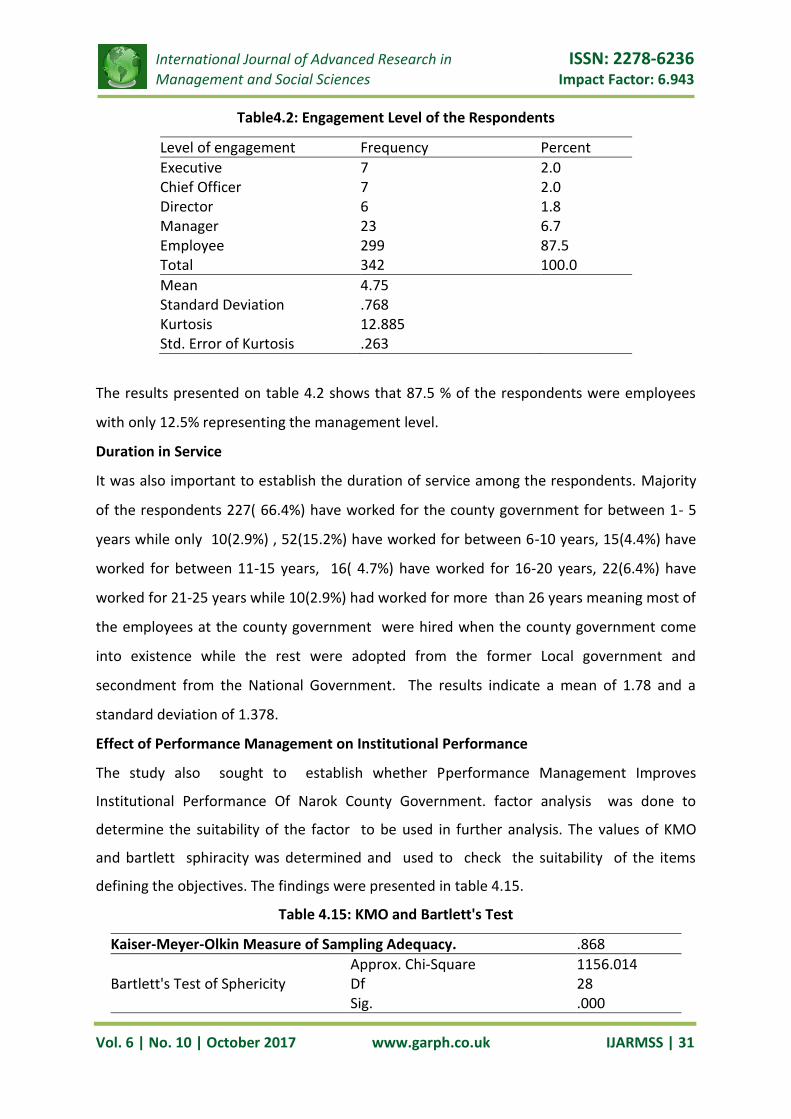
Effect of Performance Management on Institutional Performance
The study also sought to establish whether Pperformance Management Improves
Institutional Performance Of Narok County Government. factor analysis was done to
determine the suitability of the factor to be used in further analysis. The values of KMO
and bartlett sphiracity was determined and used to check the suitability of the items
defining the objectives. The findings were presented in table 4.15.
Table 4.15: KMO and Bartlett's Test
Kaiser-Meyer-Olkin Measure of Sampling Adequacy. .868
Bartlett's Test of Sphericity Approx. Chi-Square 1156.014 Df 28 Sig. .000

International Journal of Advanced Research in ISSN: 2278-6236
Management and Social Sciences Impact Factor: 6.943
Vol. 6 | No. 10 | October 2017 www.garph.co.uk IJARMSS | 32
The results show that Kaiser-Meyer-Olkin Measure of Sampling Adequacy is 0.868 with a
Bartlettes test of sphericity being less than 0.05`. This indicates that the factors are suitable
for further analysis. The actual factor loadings were presented in table 4.16.
Table 4.16: Component Matrixa
Items Component
Performance Management Practices are included in the County HR Policies. .463
I have participated in the performance evaluation process last financial year and received feedback on my job performance.
.711
Performance Review meetings are held annually at the department level and am a comfortable with the way it’s carried out.
.678
Performance Management is a continuous process within the county government and has improved organization performance.
.800
The process is conducted professionally without any biasness and this motivates employees’ hence high performance.
.713
The implementation of other strategies; Acquisition, Training and Development, Appraisal and Reward has been effective because of Performance management.
.807
The County Overall performance has improved due to continuous performance management Strategy.
.811
The County Performance rate compared to other counties and regions is encouraging.
.748
The objective was measured by using nine statements out of which only 8 statements met
the expected threshold of a factor loading of 0.4 and above. The results show that one
factor did not meet the expected factor loading and hence was eliminated from the
statement and hence was not used for further analysis. The factor with the highest loading
was indicating that County Overall performance has improved due to continuous
performance management Strategy while the factor with the lowest factor loading was
Performance Management Practices are included in the County HR Policies.
Descriptive Analysis
For descriptive analysis the study considered only the 8 factors that met the loading of 0.4
and above. The descriptive analysis was computed to determine the mean, standard
deviation, percentages and frequencies was computed and presented on table 4.17.

International Journal of Advanced Research in ISSN: 2278-6236
Management and Social Sciences Impact Factor: 6.943
Vol. 6 | No. 10 | October 2017 www.garph.co.uk IJARMSS | 33
Table 4.17: Descriptive analysis
i Ii iii Iv v Vi Vii Viii
Strongly Disagree
19 (5.6)
83 (24.3)
62 (18.1)
51 (14.9)
50 (14.6
64 (18.7
35 (10.2
41 (12.0
Disagree 38 (11.1)
99 (28.9)
83 (24.3)
62 (18.1)
85 (24.9
61 (17.8
74 (21.6
79 (23.1
Neutral 85 (24.9)
70 (20.5)
90 (26.3)
73 (21.3)
76 (22.2
88 (25.7
85 (24.9
84 (24.6
Agree 138 (40.4)
67 (19.6)
62 (18.1)
99 (28.9)
90 (26.3
66 (19.3
101 (29.5
96 (28.1
Strongly Agree 62 (18.1)
23 (6.7)
45 (13.2)
57 (16.7)
41 (12.0)
63 (18.4
47 (13.7
42 (12.3
TOTAL 342 342 342 342 342 342 342 342
Mean 3.54 2.56 2.84 3.14 2.96 3.01 3.15 3.06
Std. Deviation 1.081 1.238 1.286 1.311 1.257 1.365 1.205 1.218
Kurtosis -.182 -.978 -1.016 -1.093 -1.081 -1.168 -.933 -.984
The results shows that majority of the respondents 200 (58.5%) agreed that Performance
Management Practices are included in the County HR Policies while 57(16.7%) disagreed
with the statement. This showed a mean of 3.54; STD deviation = 1.081. The second
statement which sought to establish whether the respondents had participated in the
performance evaluation process for the last financial year and received feedback on job
performance. The results show that this factor had the highest standard deviation value
meaning that the results could have skewed to one side. This was established following the
negative kurtosis (mean of =2.56, STD deviation = 1.238 meaning and kurtosis = -.978) that
most of the respondents disagreed with the statement.
Correlation Analysis
The study sought to establish the relationship between performance management and
institutional performance. The results were presented on table 4.18.
Table 4.18: Performance Management and Institutional Performance
Institutional Performance
Performance Management Pearson Correlation .594** Sig. (2-tailed) .000 N 317
The results show that there is a strong positive relationship (R=0.594) between performance
management and institutional performance in county governments. The P –value = 0.000

International Journal of Advanced Research in ISSN: 2278-6236
Management and Social Sciences Impact Factor: 6.943
Vol. 6 | No. 10 | October 2017 www.garph.co.uk IJARMSS | 34
indicating a very significant relationship between the variables. This shows that
performance management is very essential for any organization that aims at performing.
These findings are similar to those of Armstrong (1998), who noted that Performance
Management is both a strategic and an integrated approach to delivering successful results
in organizations by improving the performance and developing the capabilities of teams and
individuals.
Chi Square Analysis for Performance Management
To test whether there is an association between performance measurement and the
performance of county governments. The chi square test of independence was used. Table
4.19 presents the results.
Table 4.19: Performance Management
Value df Asymp. Sig. (2-sided)
Pearson Chi-Square 2425.510a 837 .000
Likelihood Ratio 1160.942 837 .000
Linear-by-Linear Association 111.651 1 .000
N of Valid Cases 317
The results presented on table 4.19 show that the Pearson chi square is 2425.510 with 837
degrees of freedom and a p- value of 0.000. The critical chi square factor at 850 degrees of
freedom is given as 932.689 which is far much below the calculated factor of 2425.510. This
means that there is a significant association between performance and the performance of
county governments in Kenya. These results are also confirmed by the Phi and The Cramers
V values presented in table 4.20.
Table 4.20: Symmetric Measures
Value Asymp. Std. Errora
Approx. Tb Approx. Sig.
Nominal by Nominal
Phi 2.766 .000
Cramer's V .532 .000
Interval by Interval Pearson's R .594 .038 13.119 .000c
Ordinal by Ordinal Spearman Correlation
.574 .042 12.456 .000c
N of Valid Cases 317
The results on table 4.20 shows a Phi value of 2.766 and The Cramers V is 0.532 and both
have a P- value of 0.000. This again shows that there is a very significant association

International Journal of Advanced Research in ISSN: 2278-6236
Management and Social Sciences Impact Factor: 6.943
Vol. 6 | No. 10 | October 2017 www.garph.co.uk IJARMSS | 35
between performance management of employees and the performance of county
governments, indicating that is a significant association between performance management
and performance of employees at county governments in Kenya. The Pearson’s R of 0.594
shows a positive correlation and the T value of 13.111 which is much higher than the critical
value of t at +2 provides a ground for testing the study hypothesis.
4.9 Dependent Variable (Institutional Performance Indicators)
The dependent variable also tested for sampling adequacy and the results were presented
in table 4:33.
Table 4.33: KMO and Bartlett's Test
Kaiser-Meyer-Olkin Measure of Sampling Adequacy. .913
Bartlett's Test of Sphericity
Approx. Chi-Square 1488.318
Df 45
Sig. .000
The result shows that the items of the variable had a very high sampling adequacy since
the KMO value was 0.913 which is far much above 0.4. The Bartlett’s Test of Sphericity was
also less than 0.05. This shows that the variable was suitable for use in further analysis.
The component matrix was computed to establish whether all the items could be used for
further analysis or not. The results presented in table 4.34 shows those items were suitable
for use in further analysis.
Table 4.34: Component Matrix
Items Component
i Rate your level of participation in development of HR strategies such as Resourcing of staff, Training, Appraisal, Reward and Performance Management.
.643
ii Rate the County Management Competencies to initiate, implement and Changing of HR Strategies.
.747
iii Rate the attention paid in developing new HR strategies by Top management
.736
iv Rate the attention paid in adjusting to new HR strategies by Top management
.739
v Rate the commitment to HR strategic Management as a choice for your organization by Top management
.737
vi Rate the relevance and suitability of strategic Human resource Management to your organization
.600
vii Rate your organization success at identifying corrective actions on HR strategies
.719

International Journal of Advanced Research in ISSN: 2278-6236
Management and Social Sciences Impact Factor: 6.943
Vol. 6 | No. 10 | October 2017 www.garph.co.uk IJARMSS | 36
viii Rate the commitment of the Top management in providing financial resources to support implementation of Human resource Strategies
.744
ix Rate your organization success at identifying corrective actions on HR strategies
.784
x Rate your organization effectiveness at evaluating Impact of change in initiating HR strategies
.794
All the ten variables were established to have a factor loading of more than 0.4. The lowest
loading was 0.600 while the highest loading was 0.794. This shows that the items were all
suitable for use in further analysis.
4.9.1 Descriptive Statistics
Descriptive analysis was done to summarize the views and opinions of the respondents.
The respondents were required to respond to various items using a scale of Excellent= 5,
Very Good= 4, Good= 3, Fair= 2, Poor = 1. The results were presented in table 4.35.
Table 4.35: Institutional Performance Indicators
I ii Iii iv V vi Vii viii Ix x
Poor 43 (12.6)
33 (9.6)
44 (12.9)
31 (9.1)
48 (14.0)
22 (6.4)
31 (9.1)
54 (15.8)
34 (9.9)
46 (13.5)
Fair 76 (22.2)
69 (20.2)
76 (22.2)
94 (27.5)
68 (19.9)
82 (24.0)
75 (21.9)
88 (25.7)
82 (24.0)
56 (16.4)
Good 93 (27.2)
93 (27.2)
81 (23.7)
101 (29.5)
78 (22.8)
92 (26.9)
108 (31.6)
77 (22.5)
94 (27.5)
89 (26.0)
Very Good
90 (26.3)
95 (27.8)
85 (24.9)
59 (17.3)
97 (28.4)
83 (24.3)
79 (23.1)
72 (21.1)
94 (27.5)
84 (24.6)
Excellent 26 (7.6)
38 (11.1)
31 (9.1)
32 (9.4)
26 (7.6)
48 (14.0)
34 (9.9)
36 (10.5)
23 (6.7)
52 (15.2)
TOTAL 342 342 342 342 342 342 342 342 342 342
Mean 2.94 3.11 2.95 2.90 2.95 3.16 3.03 2.84 2.97 3.12
Std. Deviation
1.161 1.165 1.207 1.127 1.207 1.157 1.126 1.253 1.113 1.272
Kurtosis -.885 -.826 -.977 -.680 -1.011 -.903 -.713 -1.029 -.825 -.974
The results show that all the items had a mean less than 3.5 indicting that the respondents
indicated that the institutional performance indicators were good. This is also confirmed by
the high negative skewness indicated by the value of kurtosis.
Discussions of the Findings
The hypothesis stated that there is no relationship between performance management and
achievement of institutional performance. The results contradicts with the null hypothesis

International Journal of Advanced Research in ISSN: 2278-6236
Management and Social Sciences Impact Factor: 6.943
Vol. 6 | No. 10 | October 2017 www.garph.co.uk IJARMSS | 37
since the Pearson’s R of 0.594 shows a strong positive correlation and the T value of 13.119
which is much higher than the critical value of t at +2. The Pearson chi square is 2425.510
with 837 degrees of freedom and a p- value of 0.000. The critical chi square factor at 850
degrees of freedom is given as 932.689 which is far much below the calculated factor of
2425.510. This means that there is a significant association between performance
management and the performance of county governments in Kenya. Thus agreeing with
Armstrong (2008), findings that performance management is a mean of getting better
results by understanding and managing performance within an agreed framework of
planned goals, standard and competency requirements. Armstrong and Baron (1998) also
noted that Performance Management is both a strategic and an integrated approach to
delivering successful results in organizations by improving the performance and developing
the capabilities of teams and individuals.
Therefore, the county governments need to effectively put Performance Management
practice into consideration if they have to improve on the performance.
5.0 SUMMARY, CONCLUSIONS AND RECOMMENDATIONS
Summary of the Findings
The study established that strategic human resource management practices have a positive
relationship with firm performance. This shows that a firm that wants to develop a
competitive advantage over its rivals should embrace these “best practices”. The study
distributed a total of 400 questionnaires and only 342 were returned and used for the
analysis. This is 85.5% which was considered appropriate. According to Torrington &
Stephen (2006) a response rate above 70% is considered appropriate for a descriptive study.
The results on table 4.1 shows that majority 63(18.4%) of the respondents who participated
in the study were from the Education, Social work, Youth and Gender departments at the
county government. This was followed by health with a response rate of 61(17.8%), while
Lands and Urban planning had the least number of respondents 8(2.3%). This was quite
proportional to the number of employees in these departments with Education, Social work,
Youth and Gender departments having the highest number of employees in the entire
county.
The study established that the number of males who participated in the study were
189(55%) while the number of female were 153(45%). This reflects a small disparity

International Journal of Advanced Research in ISSN: 2278-6236
Management and Social Sciences Impact Factor: 6.943
Vol. 6 | No. 10 | October 2017 www.garph.co.uk IJARMSS | 38
between the employees in the county government. Majority of the respondents 227
(66.4%) have worked for the county government for between 1- 5 years while only 10(2.9%)
, 52(15.2%) have worked for between 6-10 years, 15(4.4%) have worked for between 11-15
years, 16( 4.7%) have worked for 16-20 years, 22(6.4%) have worked for 21-25 years while
10(2.9%) had worked for more than 26 years meaning most of the respondents were hired
when the county government came into existence while the rest were adopted from the
former Local government and secondment from the National Government. The results
indicate a mean of 1.78 and a standard deviation of 1.378.
Contribution of Performance Management on Institutional Performance
The results show that Kaiser-Meyer-Olkin Measure of Sampling Adequacy is 0.868 with a
Bartlettes test of sphericity being less than 0.05. This indicates that the factors are suitable
for further analysis. The results shows that majority of the respondents 200(58.5%) agreed
that Performance Management Practices are included in the County HR Policies while
57(16.7%) disagreed with the statement. This showed a mean of 3.54; STD deviation =
1.081.
On whether the respondents participated in the performance evaluation process for the last
financial year and received feedback on job performance. The results show that the highest
standard deviation value meaning that the results could have skewed to one side. This was
established following the negative kurtosis (mean of =2.56, STD deviation = 1.238 meaning
and kurtosis = -.978) that most of the respondents disagreed with the statement. The
results show that there is a strong positive relationship (R=0.594) between performance
management and institutional performance in county governments. It is also noted that
there is a strong positive association between performance management and institutional
performance with a Pearson’s R of 0.594, Phi value of 2.766 and a cramers V of 0.532 and
both have a P- value of 0.000. The critical chi square factor at 850 degrees of freedom is
given as 932.689 which is below the calculated factor of 2425.510. This means that there is a
significant association between performance management and the performance of county
governments in Kenya of institutional performance.
This showed that performance management is very essential practice for any organization
that aims at performing.
International Journal of Advanced Research in ISSN: 2278-6236
Management and Social Sciences Impact Factor: 6.943
Vol. 6 | No. 10 | October 2017 www.garph.co.uk IJARMSS | 39
5.3 Conclusions
The purpose of the study was to determine the Contribution of Strategic Human Resource
Management Practices in achieving Institution Performance. The study found that all the
human resource management practices had a positive and significant association with
performance. This means that with improved use of SHRM practices, institutional
performance also improves. The correlation between strategic human resource
management practices and performance ranged between 0.4 and 0.7 for the five variables
under study. This means that the different practices of strategic human resource positively
influence performance. The relationship was tested at a significant level of 0.05 using Chi
Square Test of Associations. The Strategic human resource management practices that were
examined for their contribution on achieving institution on performance included: Staff
resourcing, training and development, Performance Management, Staff Appraisal and
Reward management. An examination of their mean scores found that County Governments
have strived to adopt strategic human resource management practices to a great extent.
The results of this study add to the growing empirical evidence that suggest that strategic
human resource management impact on firm performance. However, the findings indicate
that direct and interactive contribution of the SHR practices vary with the performance
measure. Thus the findings of this study are consistent with the stream of research and
theory that support the universalistic perspective.
It is evident that SHRM practices are required by the county government if they have to
improve on their performance. The results have shown clearly that there is a positive and
significant association between staff resourcing and the performance of the institutions. The
results have shown that there is a weak relationship between staff resourcing and
performance but the association that the factor on performance is very significant. This
means that the County Governments focus on these processes in order to capture the right
stock of human talent that will lead to sustained competitive advantage. Study findings also
show that strategic human resource practices had a stronger positive relationship with
institution performance. This study therefore concludes that county governments like Narok
need to ensure that the staffing as a SHRM practice is essential for improved performance.
The study also noted that training and development as a SHRM practice has a positive
correlation with institutional performance. It is further noted that the strength of the

International Journal of Advanced Research in ISSN: 2278-6236
Management and Social Sciences Impact Factor: 6.943
Vol. 6 | No. 10 | October 2017 www.garph.co.uk IJARMSS | 40
relationship is very strong meaning that for the institutions to improve their performance
training and development is a major strategic practice that must be put in place. The study
established that through training employees are able to equip themselves with appropriate
skills that enhance their performance and hence the performance of the institution.
The study also shows that Strategic human resource Management Practices are considered
an important function in the County Government but there is need to improve in some area
like staff Appraisal and Performance management of employees. The level of interaction
between the human resource department and other departments is also taking place to a
great extent especially on human resource needs like training and organization strategic
development. The human resource manager heads an independent department and him or
her reports directly to the County Secretary. Thus the human resource role is gaining
importance. The research findings leave no doubt that Institutions that want to develop a
competitive advantage over the others need to adopt these strategic human resource
management practices and Implement them.
5.5 Recommendations
The County Governments in Kenya are faced with many challenges due to changes in the
business environment. Thus, investment in human capital management strategies helps to
improve on their performance, quality of service provided, labour cost reduction, high
productivity and operating effectiveness. However, what is important knows the best means
to make the impact. Thus, an important implication of this study is that;
1. The Productivity of individual employees and Institution Organs can only be
measured with performance management in place. Thus, the County Government to
introduce and effectively value the use of Performance Management as a SHRM
Practice. Performance Management Office should be introduced and regular
performance review meetings held. This helps to monitor individual and institutions
performance rate for competitive advantage, appreciate performers and discipline
non performers.
2. To motivate employees whose performance is outstanding and linked to the good
performance of the institution, reward management needs to be practiced. The
County Government has the responsibility of ensuring that rewards are offered fairly
to all deserving employees and individual efforts are recognized always. Uniformity

International Journal of Advanced Research in ISSN: 2278-6236
Management and Social Sciences Impact Factor: 6.943
Vol. 6 | No. 10 | October 2017 www.garph.co.uk IJARMSS | 41
in rewarding employees; Promotions, Salary increments and incentives, recognition,
holyday offers among others makes them to put more efforts at work hence more
returns. Discrimination should be avoided as it demoralizes individuals hence less
effort at work.
3. There is a need for a significant transformation of HRM responsibility to reflect the
new demands and realities of the public sector. This is geared to accommodate the
HR Managers as strategic partners in institutions whose role determine the end
results on productivity.
4. HRM specialists should be able to play a role of organizational change consultants,
and the cost-effectiveness evaluation of SHRM interventions should be performed.
This helps to reduce change resistance in institutions among the employees,
strategies development, policies implementation and evaluation. All this helps to
improve the County Performance at a low cost.
5.6 Suggestion for further study
Research on strategic performance management and institutional performance suggest that
future researchers to carry out research on other County Governments to establish the
extent to which the performance management of staff had influence their performance.
This is because this study focused on establishing the relationship between strategic
performance management and institutional performance and not the extent to which the
practice influence performance.
REFERENCES
1. Ahmad, O., & Schroeder, R.G. (2003). The impact of human resource management
practices on operational performance: Recognizing country and industry differences.
Journal of Operations Management, 21(1): 19-43.
2. Armstrong, M., Baron, A. (1998) Performance management: the new realities.
London: Institute of Personnel and Development. Kogan Page.
3. Armstrong, M. (2008) A Handbook of Strategic Human Resource Management
Practice. 5th ed. Kogan Page Amazon Publishers, Pp308
4. Bae, J., & Lawler, J.J. (2000). Organizational Performance and HRM strategies in
Korea: Impact on Firm Performance in an Emerging Economy. Academy of
Management Journal, 43 (3), 502–517.

International Journal of Advanced Research in ISSN: 2278-6236
Management and Social Sciences Impact Factor: 6.943
Vol. 6 | No. 10 | October 2017 www.garph.co.uk IJARMSS | 42
5. Constitution of Kenya, Kenya Law Reports(2010) .Retrieved December 10, 2014 from
http://www.kenyalaw.org
6. Koisaba, B. (2015), Entrenched corruption and impunity in Kenya; Two people killed,
four government officials arrested as Maasai protest mismanagement of resources in
Narok county, kenya. Retrieved on 29th January 2015. From
https://intercontinentalcry.org
7. Kothari C.R., (2004). Research Methodology: Methods and Techniques,(2nd Ed.).
New Dehli: New Age International Publishers Ltd. Pp 417
8. Marton, F., & Pang, M. F. (2006). On some necessary conditions of learning. The
Journal of the Learning Sciences, 15, 193–220
9. Mugenda, A., & Mugenda, O. (2012). Research Methods; Quantitative and
Qualitative Approaches.(5th Ed.). Nairobi: Acts Press Publishers. Pp 256
10. Pallant, J. (2006). SPSS Survival Manual: a step by step guide to data analysis using
SPSS, 4th Edition, Crows Nest, New South Wales, 2006
11. Pfeffer, J. (2001). Fighting the war for Talent is Hazardous for your Organization.
Stanford: performance. Cincinnati: South-Western Pearson Education.
12. Schuler, R.S., Jackson, S.E. and Storey, J. (2001).HRM and its Link with strategic
Management’, Productivity and corporate financial performance. Academy of
Management Journal, 38 J Storey (Ed), Human Resource Management: A critical
Text. 2nd Edition, Thompson Learning.
13. Torrington, D., Hall, L., & Stephen, T. (2006). Human Resource Management (7th
ed.). Edinburg: Pearson Education Limited.
14. Ulrich, D. (1997). Judgeme more by my future than my past. Human Resource
Management, Harvard Business School Press. 36: 5–8.
Related Documents