Contribution of General Motors’ Manufacturing Plants to the Economies of Ten States and the United States in 2013 and 2014 For UAW-General Motors Center for Human Resources Kristin Dziczek Debbie Maranger Menk Yen Chen 3005 Boardwalk, Suite 200 Ann Arbor, Michigan 48108 April 2015

Welcome message from author
This document is posted to help you gain knowledge. Please leave a comment to let me know what you think about it! Share it to your friends and learn new things together.
Transcript

Contribution of General Motors’ Manufacturing Plants to the
Economies of Ten States and the United States in 2013 and 2014
For UAW-General Motors Center for Human Resources
Kristin Dziczek
Debbie Maranger Menk
Yen Chen
3005 Boardwalk, Suite 200
Ann Arbor, Michigan 48108
April 2015


i
Contents List of Figures and Tables .............................................................................................................................. ii
Executive Summary ....................................................................................................................................... 1
GM Automotive Manufacturing is at the Core of GM’s Economic Contribution to the U.S. Economy ........ 2
GM’s Presence in the United States ............................................................................................................. 3
GM’s U.S. Sales and Market Share ........................................................................................................ 3
GM’s U.S. Manufacturing Employment and Production Sites .............................................................. 5
GM’s North American Capacity and Production ................................................................................... 6
Assembly ............................................................................................................................................... 7
Powertrain .......................................................................................................................................... 10
Stamping ............................................................................................................................................. 11
Other GM Manufacturing Facilities .................................................................................................... 11
Methodology ............................................................................................................................................... 12
Results ......................................................................................................................................................... 13
Conclusion ................................................................................................................................................... 14
Appendix ..................................................................................................................................................... 15
References .................................................................................................................................................. 17

ii
List of Figures and Tables
Figure 1: General Motors’ U.S. Sales and Market Share 2006-2014 ............................................................ 4
Figure 2: General Motors’ U.S. Manufacturing Employment, 2012-2014 .................................................... 5
Figure 3: General Motors’ U.S. Assembly, Powertrain, Stamping, and Component Manufacturing Plants. 6
Figure 4: General Motors’ North American Capacity and Production, 2006-2014 ...................................... 7
Figure 5: General Motors’ U.S. Small Car Sales: Korean-produced Chevrolet Aveo and Chevrolet Spark
and U.S.-produced Chevrolet Sonic, 2004-2014 .............................................................................. 9
Figure 6: General Motors’ U.S. Chevrolet Equinox Sales: Canadian vs. U.S.-produced Vehicles,
2004-2014 ........................................................................................................................................ 9
Table 1: GM U.S. Powertrain Plants ............................................................................................................ 10
Table 2: GM U.S. Stamping Facilities .......................................................................................................... 11
Table 3: Other GM U.S. Manufacturing Facilities ....................................................................................... 11
Table 4: Total Contribution of General Motors’ U.S. Manufacturing Operations to the Private Sector
Economy in the United States, Including Detail for Indiana, Kansas, Kentucky, Maryland,
Michigan, Missouri, New York, Ohio, Tennessee, and Texas—2013 Estimates ............................ 13
Table 5: Total Contribution of General Motors’ U.S. Manufacturing Operations to the Private Sector
Economy in the United States, Including Detail for Indiana, Kansas, Kentucky, Maryland,
Michigan, Missouri, New York, Ohio, Tennessee, and Texas—2014 Estimates ............................ 14
Table 6: Types of Indirect and Spin-Off Jobs Supported by GM’s U.S. Manufacturing Operations, 2013* 15
Table 7: Types of Indirect and Spin-Off Jobs Supported by GM’s U.S. Manufacturing Operations,
2014 Forecast* ............................................................................................................................... 16

© Center for Automotive Research 1
Executive Summary This report estimates the contribution of General Motors’ manufacturing plants to the United States
economy and the economies of the 10 U.S. states in which the company’s UAW-represented workforce
manufactures vehicles, parts, and components.1 The estimates produced are for these operations during
calendar years of 2013 and 2014. In 2014, General Motors operated 40 manufacturing facilities in the
United States—12 assembly plants, 12 powertrain manufacturing facilities, 10 stamping facilities, 4
component manufacturing plants, a tool & die facility, and a battery assembly plant. Michigan is home
to the largest share of GM manufacturing facilities with 16, followed by Ohio with 6, Indiana with 4,
Tennessee and New York with 3 each, Kansas, Missouri, and Texas with 2 each, and Kentucky and
Maryland—each with 1 plant.2 In calendar year 2014, GM manufactured nearly 2.1 million light vehicles
in the United States, and sold nearly 2.9 million cars and light trucks in the U.S. market.
To generate estimates of the economic contribution of GM’s UAW-represented manufacturing plants to
the U.S. economy, as well as to each of the ten individual states in which the plants are located, CAR
researchers customized a specially constructed regional economic contribution model using
employment and compensation data provided by the company. GM reported nearly 50,700 direct
hourly and salaried employees at its U.S. manufacturing facilities in 2013.3 CAR estimates that GM’s
direct employment supported a total of nearly 438,300 jobs in the U.S. economy; this employment
figure is in addition to the direct jobs at GM, and includes intermediate jobs at all suppliers to GM, and
expenditure-induced spin-off jobs. CAR’s analysis yields an employment multiplier of 9.6 in 2013—
meaning that every GM assembly, powertrain, stamping, tool & die, and components manufacturing job
supports another 8.6 jobs in the U.S. economy. GM’s U.S. manufacturing employment produced an
estimated $34.4 billion in compensation in the U.S. economy in 2013. CAR researchers estimate that
GM’s U.S. Manufacturing activities supported over $4.5 billion in transfer payments and social insurance
contributions, and more than $4.8 billion in federal personal income taxes in 2013.
In 2014, CAR estimates that GM’s U.S. manufacturing facilities employed 51,600 direct hourly and
salaried employees, and that these direct jobs supported another 431,300 jobs in the U.S. economy. The
analysis yields a slightly lower employment multiplier of 9.4 in 2014, which is largely due to improving
U.S. economic conditions which lead to higher demand in other sectors of the economy. CAR estimates
GM’s U.S. manufacturing employment produced an estimated $36.2 billion in compensation, supported
nearly $4.8 billion in transfer payments and social insurance contributions, and generated more than
$5.3 billion in federal personal income taxes in 2014.
1 In February 2014, CAR issued a research memorandum on the contribution of General Motors’ decision to
reopen three “stand-by” manufacturing facilities—Orion Assembly (Michigan), Pontiac Metal Center (Michigan), and Spring Hill Assembly (Tennessee). This report updates and expands CAR’s 2014 analysis. 2 General Motors also operates a number of parts warehousing and distribution sites throughout the United
States. While the UAW represents workers in these Customer Care and Aftersales locations, the economic contribution of these sites is not explicitly included in this report. 3 The UAW represents only the hourly production and skilled trades workers in General Motors’ manufacturing
facilities.

© Center for Automotive Research 2
GM Automotive Manufacturing is at the Core of GM’s Economic
Contribution to the U.S. Economy
his study measures the contribution of General Motor’s pure automotive manufacturing activities to the U.S. economy. To make these estimates, CAR researchers obtained GM’s 2013 employment for the 40 GM manufacturing facilities located across 10 U.S. states. From CAR’s past research in
this area, we know that these 50,700 jobs generate the overwhelming share of GM’s overall contributions to the U.S. economy for two reasons:
• First, automotive manufacturing activities are most vulnerable to import substitution. Imports comprise 29 percent of current U.S. light vehicle sales, and GM—like any global automaker—has the option of replacing its U.S. production with imports from many non-U.S. locations. That GM manufacturing is now globally competitive, and produces the company’s highest per-unit profits of any region where the company operates demonstrates a dramatic turn-around from past performance. Many other profitable U.S. manufacturing firms base their administration and design & engineering activities in the United States but outsource their product manufacturing, and the examples of Apple and Nike are just a few sad reminders of the real reasons for the economic decline of the U.S. middle class in recent decades—the erosion of the U.S. manufacturing base. CAR’s use of the REMI Inc. estimation model in this study estimates the impact on the U.S. economy if GM’s U.S. manufacturing operations were instead located overseas—much like Apple’s or Nike’s.
• Second, the employment multiplier for automaker manufacturing is much larger than that of GM’s other activities—such as administration, research & product development, or marketing. Manufacturing jobs at motor vehicle manufacturing firms are connected to the broadest and deepest set of supply chains associated with any final product industry, with at least 20 other major manufacturing and non-manufacturing industries each supplying billions of dollars to GM’s final assembly and component plants. The list of industry and industry groups supplying GM spans the gamut from materials and utilities, transportation and warehouse services, to the vast auto parts manufacturing industry itself. In contrast, an automaker’s non-manufacturing activities rely upon relatively few supplier sectors to provide services or materials; many of CAR’s past economic contribution studies have illustrated this fact. The economic impact of GM’s non-manufacturing operations is dwarfed by both the output of the company’s manufacturing labor force and the output of its massive supplier network. Note that a company’s contribution to the economy is correctly measured not just by its profitability, but also by the compensation paid to employees and suppliers as part of the enterprise’s overall value-added to the U.S. economy.
GM’s economic contributions to the U.S. economy are not just in the short run; as long as GM manufacturing remains globally competitive, it will continue to generate value added per hour worked and use resources at a far higher rate than any other economic activity in the United States where these labor or other resources could otherwise be employed.
Sean P. McAlinden, Ph.D. Executive Vice President for Research, Chief Economist Center for Automotive Research
T

© Center for Automotive Research 3
GM’s Presence in the United States General Motors (GM) has a 107-year history of designing, engineering, manufacturing, and selling motor
vehicles and parts in the United States, and a 78-year history of collective bargaining with its workforce
that is represented by the International Union, UAW.4 GM’s global headquarters are located in Detroit,
Michigan, and the company manufactures motor vehicles under 10 brands in 30 countries worldwide,
and also has significant investments in three joint venture subsidiaries in China, and one in Korea. In the
U.S. market, GM manufactures and sells under the Cadillac, Chevrolet, Buick, and GMC brands. GM
manufactured nearly 2.1 million cars and trucks in 2014, and sold over 2.9 million light vehicles in the
United States that same year—which represents nearly 30 percent of the company’s global vehicle
deliveries.
For purposes of this study for the UAW-GM Center for Human Resources, CAR examined only the hourly
and salaried employment and economic activity associated with GM’s U.S. manufacturing facilities. The
company employs an estimated 78,000 total U.S. employees; 50,700—or about two-thirds—of these
employees work in GM’s 40 manufacturing facilities in Indiana, Kansas, Kentucky, Maryland, Michigan,
Missouri, New York, Ohio, Tennessee, and Texas. The remaining third of GM’s employment represents
the primarily salaried employees, who work at GM’s headquarters, technical center, sales & marketing
support, as well as hourly and salaried workers in the company’s customer care & aftersales function;
these facilities and employees are excluded from this analysis.
GM’s hourly workers are represented by the United Automobile, Aerospace, and Agricultural Implement
Workers union (UAW). The workers are covered by a national labor agreement that sets company-wide
standards for pay, benefits, and conditions of work, as well as local contracts that cover work rules and
other non-economic aspects of work at each facility. The UAW-GM Center for Human Resources (CHR) is
a jointly-administered labor-management training and programs office that was established in 1984, and
funded by a negotiated fund that the company contributed to for every hour worked by UAW-GM
members.
GM’s U.S. Sales and Market Share
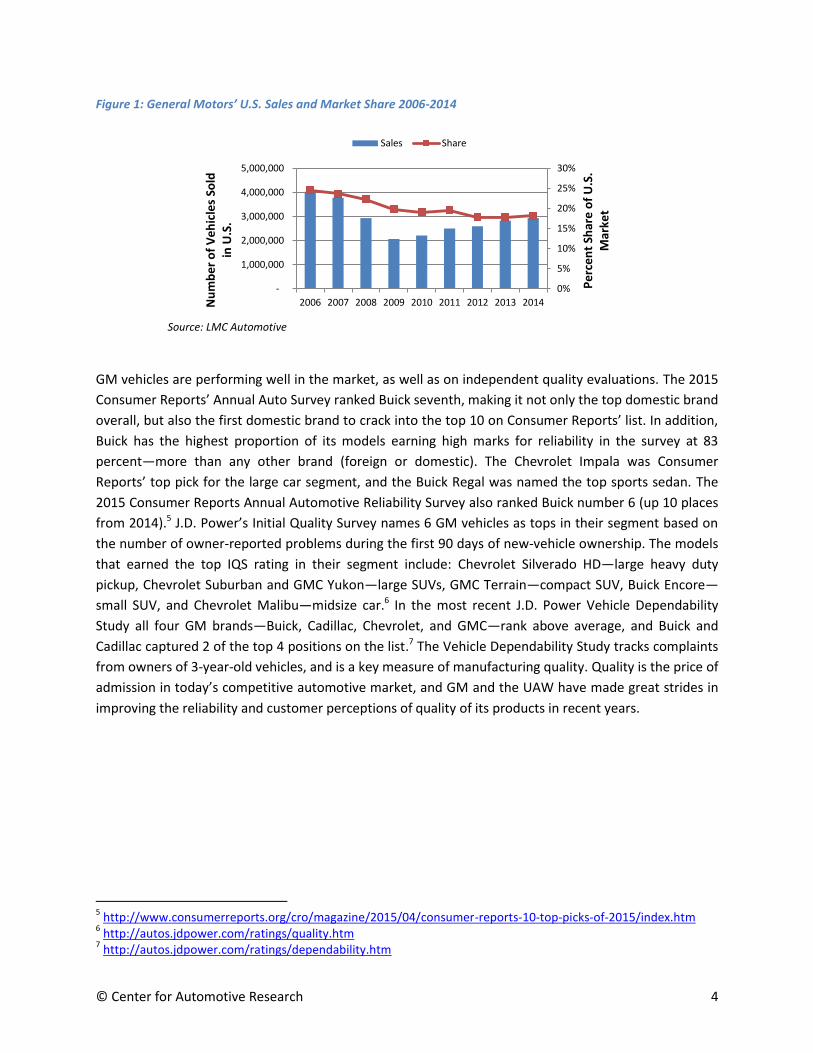
GM’s U.S. sales of over 2.9 million cars and trucks represented an 18.2 percent share of the U.S. market
in 2014. The company’s market share has recently stabilized between 17 and 18.5 percent, after a
decades-long period of decline. Vehicles such as the Chevrolet Silverado—the 2014 North American
Truck of The Year, the Chevrolet Cruze—the U.S.’s top selling domestic small car, and the Chevrolet
Volt—the first extended-range hybrid available in the U.S. market, demonstrate GM’s appeal in the
marketplace, the company’s technological leadership, and GM and the UAW-represented workforce’s
commitment to quality.
4 The full name of the UAW is: “International Union, United Automobile, Aerospace, and Agricultural Implement
Workers of America.”
© Center for Automotive Research 4
Figure 1: General Motors’ U.S. Sales and Market Share 2006-2014
Source: LMC Automotive
GM vehicles are performing well in the market, as well as on independent quality evaluations. The 2015
Consumer Reports’ Annual Auto Survey ranked Buick seventh, making it not only the top domestic brand
overall, but also the first domestic brand to crack into the top 10 on Consumer Reports’ list. In addition,
Buick has the highest proportion of its models earning high marks for reliability in the survey at 83
percent—more than any other brand (foreign or domestic). The Chevrolet Impala was Consumer
Reports’ top pick for the large car segment, and the Buick Regal was named the top sports sedan. The
2015 Consumer Reports Annual Automotive Reliability Survey also ranked Buick number 6 (up 10 places
from 2014).5 J.D. Power’s Initial Quality Survey names 6 GM vehicles as tops in their segment based on
the number of owner-reported problems during the first 90 days of new-vehicle ownership. The models
that earned the top IQS rating in their segment include: Chevrolet Silverado HD—large heavy duty
pickup, Chevrolet Suburban and GMC Yukon—large SUVs, GMC Terrain—compact SUV, Buick Encore—
small SUV, and Chevrolet Malibu—midsize car.6 In the most recent J.D. Power Vehicle Dependability
Study all four GM brands—Buick, Cadillac, Chevrolet, and GMC—rank above average, and Buick and
Cadillac captured 2 of the top 4 positions on the list.7 The Vehicle Dependability Study tracks complaints
from owners of 3-year-old vehicles, and is a key measure of manufacturing quality. Quality is the price of
admission in today’s competitive automotive market, and GM and the UAW have made great strides in
improving the reliability and customer perceptions of quality of its products in recent years.
5 http://www.consumerreports.org/cro/magazine/2015/04/consumer-reports-10-top-picks-of-2015/index.htm
6 http://autos.jdpower.com/ratings/quality.htm
7 http://autos.jdpower.com/ratings/dependability.htm
0%
5%
10%
15%
20%
25%
30%
-
1,000,000
2,000,000
3,000,000
4,000,000
5,000,000
2006 2007 2008 2009 2010 2011 2012 2013 2014
Pe
rce
nt
Shar
e o
f U
.S.
Mar
ket
Nu
mb
er
of
Ve
hic
les
Sold
in
U.S
.
Sales Share

© Center for Automotive Research 5
GM’s U.S. Manufacturing Employment and Production Sites
GM employed 50,700 hourly and salaried employees at the company’s 40 manufacturing facilities in the
United States in 2013, which represents a 6.3 percent increase over GM’s 2012 U.S. manufacturing
employment.
Figure 2: General Motors’ U.S. Manufacturing Employment, 2012-2014
Source: Company data; Center for Automotive Research analysis
GM currently operates 12 vehicle assembly plants,8 12 engine and transmission plants, 10 stamping
facilities, 4 component manufacturing plants, a tool & die facility, and a battery assembly plant in the
United States9
8 In addition, GM and the UAW agreed in 2009 to place four manufacturing plants on “stand-by” status; of these
four, only one—an assembly plant in Janesville, Wisconsin—remains idle. The Janesville plant is not included in the analysis presented in this report. 9 GM shuttered eight U.S. vehicle assembly, 5 engine & transmission, 7 stamping, and at least 10 components
manufacturing plants and other facilities between 2006 and 2013. A number of the closed plants were transferred to the assets of Motors Liquidation Company (the former General Motors Corporation). The Revitalizing Auto Communities Environmental Response (RACER) Trust was created by the U.S. Bankruptcy Court to remediate, market, and sell these and other former GM properties.
0
5,000
10,000
15,000
20,000
25,000
30,000
35,000
40,000
45,000
50,000
55,000
2012 2013 2014 (Est.)
Emp
loym
ent
© Center for Automotive Research 6
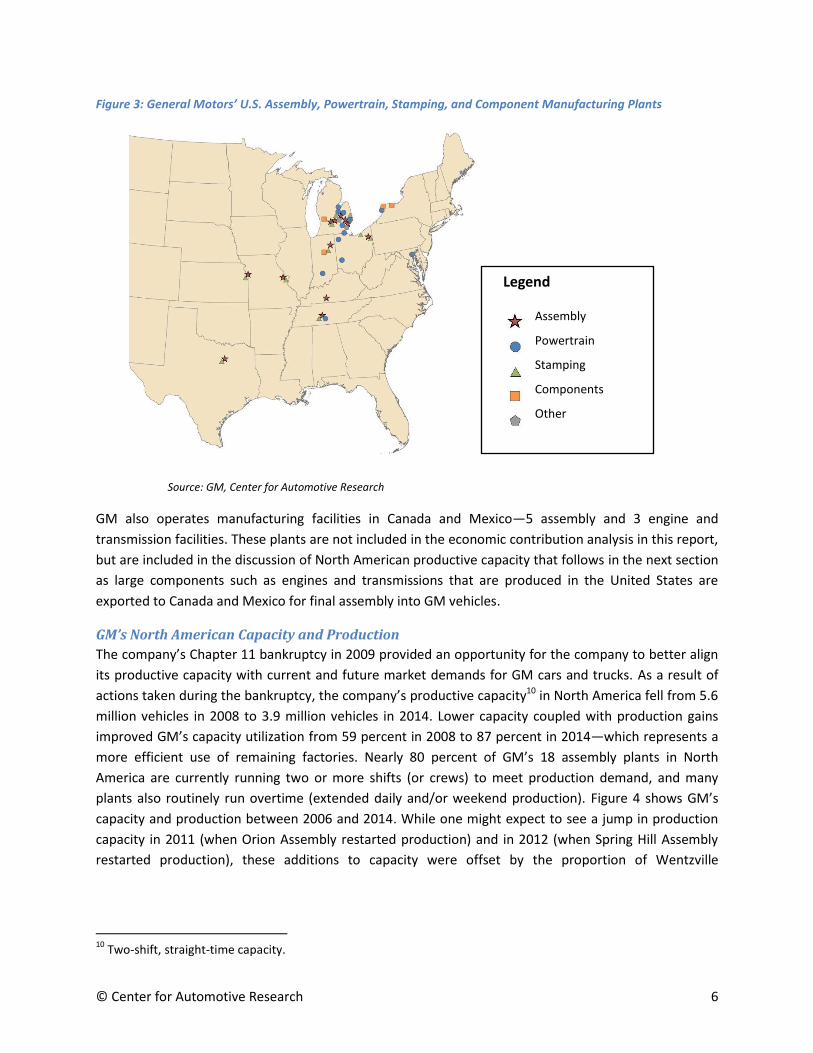
Figure 3: General Motors’ U.S. Assembly, Powertrain, Stamping, and Component Manufacturing Plants
Source: GM, Center for Automotive Research
GM also operates manufacturing facilities in Canada and Mexico—5 assembly and 3 engine and
transmission facilities. These plants are not included in the economic contribution analysis in this report,
but are included in the discussion of North American productive capacity that follows in the next section
as large components such as engines and transmissions that are produced in the United States are
exported to Canada and Mexico for final assembly into GM vehicles.
GM’s North American Capacity and Production
The company’s Chapter 11 bankruptcy in 2009 provided an opportunity for the company to better align
its productive capacity with current and future market demands for GM cars and trucks. As a result of
actions taken during the bankruptcy, the company’s productive capacity10 in North America fell from 5.6
million vehicles in 2008 to 3.9 million vehicles in 2014. Lower capacity coupled with production gains
improved GM’s capacity utilization from 59 percent in 2008 to 87 percent in 2014—which represents a
more efficient use of remaining factories. Nearly 80 percent of GM’s 18 assembly plants in North
America are currently running two or more shifts (or crews) to meet production demand, and many
plants also routinely run overtime (extended daily and/or weekend production). Figure 4 shows GM’s
capacity and production between 2006 and 2014. While one might expect to see a jump in production
capacity in 2011 (when Orion Assembly restarted production) and in 2012 (when Spring Hill Assembly
restarted production), these additions to capacity were offset by the proportion of Wentzville
10
Two-shift, straight-time capacity.
Assembly
Powertrain
Stamping
Components
Other
Legend

© Center for Automotive Research 7
Assembly’s productive capacity that was off-line to retool for new small trucks.11 The 2014 capacity
increase was due to this portion of Wentzville coming back on-line.
Figure 4: General Motors’ North American Capacity and Production, 2006-2014
Source: LMC Automotive
Assembly
GM produced 2,053,821 cars and trucks in 12 vehicle assembly plants in 8 U.S. states in 2014. Nearly 36
percent of all GM cars and trucks manufactured in the United States in 2014 were made in Michigan;
Indiana ranks second with 16 percent of GM’s U.S. vehicle production; Texas ranks third with 14
percent; and Ohio ranks right behind Texas with almost 13 percent of GM’s U.S. vehicle production. The
locations of each of GM’s assembly plants, 2014 models, and production volumes are shown in Table 1.
Table 1: GM U.S. Vehicle Assembly Plants
PLANTS
MODELS PRODUCED IN 2014 2014 PRODUCTION VOLUME
CA
RS
Bowling Green, KY Chevrolet Corvette Stingray; Performance Build Center (Engines)
46,727
Detroit-Hamtramck, MI Cadillac ELR; Chevrolet Impala, Malibu, and Volt; Opel Ampera
61,046
Fairfax, KS Buick LaCrosse; Chevrolet Malibu 174,823 Lansing Grand River, MI Cadillac ATS and CTS 40,720 Lordstown, OH Chevrolet Cruze 265,619 Orion, MI Buick Verano; Chevrolet Sonic 156,664
TRU
CK
S
Arlington, TX Cadillac Escalade and Escalade ESV; Chevrolet Suburban and Tahoe; GMC Yukon and Yukon XL
286,121
Flint, MI Chevrolet Silverado; GMC Sierra 184,655 Fort Wayne, IN Chevrolet Silverado; GMC Sierra 341,915 Lansing Delta Township, MI Buick Enclave; Chevrolet Traverse; GMC
Acadia 292,183
Spring Hill, TN Chevrolet Equinox 43,981 Wentzville, MO Chevrolet Colorado, Express; GMC
Canyon, Savana 159,367
11
Wentzville Assembly continued to produce full-size vans while the plant was retooling to produce GM’s new smaller trucks—the Chevrolet Colorado and the GMC Canyon.
0
1,000,000
2,000,000
3,000,000
4,000,000
5,000,000
6,000,000
2006 2007 2008 2009 2010 2011 2012 2013 2014
Nu
mb
er
of
Ve
hic
les
Capacity Production

© Center for Automotive Research 8
Since January 2009, GM has invested $5.6 billion in its U.S. assembly plants; the investments included:
Arlington Assembly—Retooling for Tahoe, Yukon, Escalade, and Suburban production
Bowling Green Assembly—Consolidating Performance Build Center operations and retooling for
the Chevrolet Corvette
Detroit-Hamtramck Assembly—Facility upgrades to produce the Chevrolet Volt, Malibu, Impala,
Cadillac ELR, and the redesigned next generation Chevrolet Volt, as well improvements to the
plants logistics and transportation facilities
Fairfax Assembly—Expansions to the paint shop, stamping facility, and retooling for Chevrolet
Malibu and a hybrid model of Buick LaCrosse
Flint Truck Assembly—A new paint shop, facility upgrades, and retooling to produce the new
model heavy-duty pickup trucks
Fort Wayne Assembly—Body shop additions
Lansing Delta Township—Expansion of general assembly, body shop, and paint shop
Lansing Grand River Assembly—Retooling for production of the Cadillac ATS, as well as for
logistics upgrades and a new stamping facility
Lordstown Assembly—Retooling for next generation Chevrolet Cruze—including a diesel model,
updates to the trim shop and press room, as well as a 2.2 megawatt solar array
Orion Assembly—Complete retooling for production of the Chevrolet Sonic12 and Buick Verano,
as well as upgrades to utilize more renewable fuels in the plant and recently-announced
investment for production of an all-new Chevrolet electric vehicle
Spring Hill Assembly—Retooling for flexible production system to produce the Chevrolet
Equinox, as well as a future mid-sized vehicles
Wentzville Assembly—Complete retooling to produce mid-sized pickup trucks—the Chevrolet
Colorado and GMC Canyon, and addition of stamping capacity
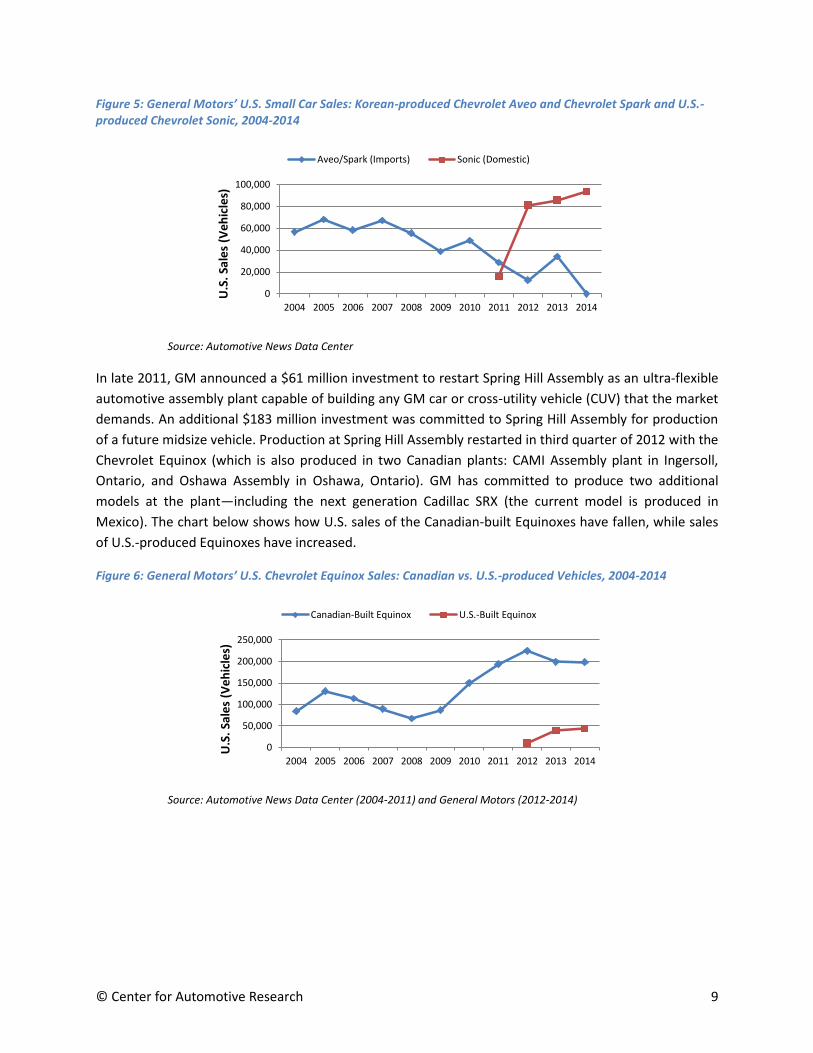
Some of GM’s investments have been to supplant imports with domestic production—which is also a
goal of the UAW in its negotiations with the company. For instance, GM’s small cars had previously been
supplied to the U.S. market as Chevrolet-badged captive imports from Korea. The chart below shows
how U.S. sales of the Chevrolet Aveo and Spark have fallen, while sales of the U.S.-produced Chevrolet
Sonic have increased dramatically since the car’s introduction in the 2012 model year.
12
The Sonic is the smallest car GM has assembled in the United States since the Chevrolet Chevette was produced in the years 1975-1987. Between 1987 and 2011 (when Sonic production began), GM rebadged and imported small cars from other manufacturers (Isuzu, Suzuki, and Toyota), as well as producing small Chevrolets in GM’s Korea (formerly Daewoo) plants for import to the United States. There were a number of specific agreements between the UAW and GM regarding conditions necessary for this investment; most notably, the union and the company agreed that due to the competitiveness of the small car segment in the United States, “innovative labor agreement provisions” would be required to produce these small vehicles profitably. The key “innovative” labor provision was the composition of the workforce—with an eventual goal that the Orion Assembly workforce would be entirely entry level workers, who earn a starting wage and benefit package that costs roughly half that of the more senior union workers in the plant.
© Center for Automotive Research 9
Figure 5: General Motors’ U.S. Small Car Sales: Korean-produced Chevrolet Aveo and Chevrolet Spark and U.S.-produced Chevrolet Sonic, 2004-2014
Source: Automotive News Data Center
In late 2011, GM announced a $61 million investment to restart Spring Hill Assembly as an ultra-flexible
automotive assembly plant capable of building any GM car or cross-utility vehicle (CUV) that the market
demands. An additional $183 million investment was committed to Spring Hill Assembly for production
of a future midsize vehicle. Production at Spring Hill Assembly restarted in third quarter of 2012 with the
Chevrolet Equinox (which is also produced in two Canadian plants: CAMI Assembly plant in Ingersoll,
Ontario, and Oshawa Assembly in Oshawa, Ontario). GM has committed to produce two additional
models at the plant—including the next generation Cadillac SRX (the current model is produced in
Mexico). The chart below shows how U.S. sales of the Canadian-built Equinoxes have fallen, while sales
of U.S.-produced Equinoxes have increased.
Figure 6: General Motors’ U.S. Chevrolet Equinox Sales: Canadian vs. U.S.-produced Vehicles, 2004-2014
Source: Automotive News Data Center (2004-2011) and General Motors (2012-2014)
0
20,000
40,000
60,000
80,000
100,000
2004 2005 2006 2007 2008 2009 2010 2011 2012 2013 2014
U.S
. Sa
les
(Ve
hic
les)
Aveo/Spark (Imports) Sonic (Domestic)
0
50,000
100,000
150,000
200,000
250,000
2004 2005 2006 2007 2008 2009 2010 2011 2012 2013 2014
U.S
. Sa
les
(Ve
hic
les)
Canadian-Built Equinox U.S.-Built Equinox

© Center for Automotive Research 10
Powertrain
GM operates 12 powertrain plants in the United States:
Table 1: GM U.S. Powertrain Plants
Baltimore Transmission, MD Romulus Powertrain, MI Bay City Powertrain, MI Saginaw Metal Casting Operations, MI Bedford Foundry, IN Spring Hill Engine, TN Defiance Foundry, OH Toledo Transmission, OH DMAX-Moraine, OH Tonawanda Engine, NY Flint Engine, MI Warren Transmission, MI
Since January 2009, GM has invested roughly $4.8 billion in its U.S. powertrain operations, including:
Baltimore Transmission—Expansion for production of vehicle electrification components
Bay City Powertrain—Retooling for components for a new V6 engine and the small Ecotec
Bedford Foundry—Retooling and expansion for 6-, 8-, and 10-speed transmissions and
powertrain castings
DMAX Engine—Design changes to meet future emissions requirements
Defiance Foundry—Part, components, and precision sand-cast blocks for the Ecotec 1.4L engine,
and V8 components
Flint Engine South—Expansion and retooling for V-6 engines, small Ecotec gasoline engineers,
and a new line of fuel-efficient engines for use in GM’s small cars
Romulus Powertrain—Retooling for a new V-6 engine and a new 10-speed transmission
Saginaw Metal Casting Operations—Retooling to produce castings for next generation engine
programs
Spring Hill Engine—Retooling for Ecotec engine program and new small displacement gasoline
engine
Toledo Transmission—Adding a new 8-speed transmission, and expanding capacity for 6-speed
transmissions
Tonawanda Engine—Retooling for a 4.3L V6, 5.3L V-8, and two variants of a 6.2L V-8
Warren Transmission—Retooling to shift production of the Chevrolet Volt’s electric drive unit
from Mexico to Michigan

© Center for Automotive Research 11
Stamping
GM operates 10 stamping facilities in the United States—including stand-alone Metal Centers and
facilities that are contiguous to an assembly plant:
Table 2: GM U.S. Stamping Facilities
Metal Centers Contiguous Stamping Operations
Flint, MI Arlington, TX Marion, IN Fairfax, KS Parma, OH Lansing Regional Stamping, MI Pontiac, MI Lordstown, OH Spring Hill, TN Wentzville, MO
Since January 2009, GM has invested approximately $700 million in its U.S. stamping facilities, including:
Retooling Fairfax, Flint, Lansing Regional Stamping, Lordstown, Marion, Parma, Pontiac, Spring
Hill, and Wentzville
Opening new contiguous stamping operations in Arlington and Lansing Grand River
Other GM Manufacturing Facilities
GM operates 6 other manufacturing facilities, including 4 components plants, a battery assembly plant,
and a tool and die operation. The components plants (Grand Rapids, Kokomo, Lockport, and Rochester)
had once been part of old GM’s components business that was spun off to form Delphi Automotive in
1994, but were re-integrated into GM’s operations in 2007 as the result of a Memorandum of
Understanding between GM, Delphi, and the UAW.
Table 3: Other GM U.S. Manufacturing Facilities
Components Holding Facilities Other
Grand Rapids, MI Brownstown Battery Assembly, MI Kokomo, IN Flint Tool & Die, MI Lockport, NY Rochester, NY
Since January 2009, GM has invested nearly $180 million in its other U.S. manufacturing operations,
including:
Brownstown Battery Assembly—expansion to produce more lithium-ion batteries for the
Cadillac ELR, Chevrolet Volt, and Opel Ampera
Flint Tool & Die—retooling for Chevrolet Volt
Investments in component production at Grand Rapids and Rochester

© Center for Automotive Research 12
Methodology CAR’s utilizes a specially constructed regional economic impact model (REMI13), and customizes the
analysis using proprietary company data on employment and compensation for each region, as well as
publicly available data on investments. The model is used to generate estimates of the economic
contribution associated with GM’s manufacturing operations in the United States, as well as in the 10
states in which the company manufactures vehicles, engines, transmissions, stampings, batteries, and
other components.
The REMI model has been fully documented and peer-reviewed, and was designed for the type of
analyses required for this report. The model has been used by CAR and other organizations for over two
decades. The version of the model used in this analysis represents the economy of the United States, as
well as the states of Indiana, Kansas, Kentucky, Maryland, Michigan, Missouri, New York, Ohio,
Tennessee, and Texas. CAR’s approach permitted simulation of the interaction among the regional
economies, as well as with the rest of the nation, providing for an accounting of interregional trade and
migration. The model can simulate economic impacts that occur in any one region resulting from
changing GM’s level of activities in any or all of the regions.
Consideration was paid to the potential of double-counting activities between suppliers and the various
GM assembly and manufacturing plants. Within the framework of the REMI model, there is an inter-
industry input-output table that calculates demand for intermediate inputs used in the production of
finished goods. By first running the simulation for GM’s direct U.S. manufacturing operations, and then
discounting the calculated demand for parts supplied by GM manufacturing operations, the CAR
research team was able to adjust for systemic double counting, and calculate only the net employment
effects for the 40 GM manufacturing plants that are the subject of this report. Since initial efforts were
made to avoid double counting between segments of the industry (automaker and parts supply), the
results for each of these segments can be added together to arrive at the total economic contribution of
GM’s U.S. manufacturing operations. Employment at GM’s powertrain, stamping, battery, and
components plants are counted as direct GM employment, but the indirect employment is adjusted to
account for the fact that these jobs are not in vehicle final assembly.
The general analytical methodology is to run baseline simulations for each region’s economy, then
subtract GM activities in each of the regions and run another set of simulations. The difference between
the simulations represents GM’s impact on each region. The results represent the current size of GM’s
40 U.S. manufacturing facilities, and the economic contribution of these plants to the U.S. economy, as
well as the economies of Indiana, Kansas, Kentucky, Maryland, Michigan, Missouri, New York, Ohio,
Tennessee, and Texas. Impacts are estimated for calendar 2013 and 2014.
13
Supplied and constructed specifically for this analysis by Regional Economics Models, Inc. (REMI) of Amherst, Massachusetts.

© Center for Automotive Research 13
Results The analysis shows that GM’s direct U.S. manufacturing employment of nearly 50,700 hourly and
salaried employees in 2013 supported an estimated 186,100 intermediate jobs (at facilities that directly
supply or service GM’s manufacturing plants in the United States), and roughly 252,200 spin-off jobs
(jobs that were created by the result of expenditures of GM’s U.S. employees at the company’s
manufacturing facilities). The result is a U.S. employment multiplier of 9.6—in other words, every direct
GM job in its manufacturing plants supported 8.6 jobs in the rest of the U.S. economy in 2013. GM’s
employment at the company’s U.S. manufacturing plants produced an estimated $34.4 billion in total
compensation in the U.S. economy, $4.5 billion in government transfer payments and social insurance
contributions, and $4.8 billion in federal personal income taxes paid. Table 4 details the 2013 estimates
for GM’s economic contribution to the United States as a whole, as well as for each of the states in
which GM manufactures vehicles, engines, transmissions, stampings, parts, and components.
Table 4: Total Contribution of General Motors’ U.S. Manufacturing Operations to the Private Sector Economy in the United States, Including Detail for Indiana, Kansas, Kentucky, Maryland, Michigan, Missouri, New York, Ohio, Tennessee, and Texas—2013 Estimates
Geographic Region
Direct Employment
Indirect & Spinoff Employment
Total Compensation (Billions)
Contributions for Government Social Insurance (Billions)
Personal Income Taxes (Billions)
U.S.* 50,690 438,300 $34.4 $4.5 $4.8
Indiana 7,160 27,220 $2.2 $0.3 $0.3
Kansas 3,620 8,770 $0.8 $0.1 $0.1
Kentucky 840 9,700 $0.6 $0.08 $0.09
Maryland 250 4,190 $0.3 $0.04 $0.06
Michigan 16,870 80,210 $7.1 $1.0 $1.0
Missouri 2,050 12,690 $1.0 $0.1 $0.1
New York 4,220 17,050 $2.0 $0.3 $0.4
Ohio 9,690 46,120 $3.7 $0.5 $0.6
Tennessee 1,990 13,860 $1.0 $0.1 $0.1
Texas 4,000 32,640 $2.6 $0.3 $0.3
Rest of U.S. 0 185,830 $12.9 $1.6 $1.7 *Totals may not sum exactly due to rounding errors.
CAR estimates that GM’s 2014 direct U.S. manufacturing employment was 51,610—a 1.8 percent
increase over 2013 employment levels. GM’s direct employment was estimated to support a total of
431,290 jobs—184,900 intermediate and roughly 246,400 spin-off jobs. The result is a U.S. employment
multiplier of 9.4 in 2014—which is slightly lower than the 2013 multiplier; this is not an unexpected
result. Between 2013 and 2014, the U.S. economy has continued its recovery, which means that other
sectors outside of automotive manufacturing are creating more demand for intermediate and spin-off
goods and services. GM’s 2014 manufacturing employment supports an estimated $36.2 billion in total
compensation in the U.S. economy, $4.8 billion in government transfer payments and social insurance
contributions, and $5.3 billion in federal personal income taxes paid. Table 5 details the 2014 GM

© Center for Automotive Research 14
economic contribution estimates for the U.S. and for each of the 10 states where the company operates
manufacturing facilities.
Table 5: Total Contribution of General Motors’ U.S. Manufacturing Operations to the Private Sector Economy in the United States, Including Detail for Indiana, Kansas, Kentucky, Maryland, Michigan, Missouri, New York, Ohio, Tennessee, and Texas—2014 Estimates
Geographic Region
Direct Employment
Indirect & Spinoff Employment
Total Compensation (Billions)
Contributions for Government Social Insurance (Billions)
Personal Income Taxes (Billions)
U.S.* 51,610 431,300 $36.2 $4.8 $5.3
Indiana 7,730 28,090 $2.4 $0.4 $0.4
Kansas 3,880 9,120 $0.9 $0.1 $0.1
Kentucky 930 9,990 $0.7 $0.09 $0.1
Maryland 260 4,060 $0.4 $0.04 $0.07
Michigan 16,120 77,870 $7.1 $1.1 $1.1
Missouri 2,470 13,570 $1.1 $0.2 $0.2
New York 4,360 15,980 $2.1 $0.3 $0.5
Ohio 9,710 46,130 $3.9 $0.5 $0.6
Tennessee 2,340 14,730 $1.2 $0.2 $0.1
Texas 3,810 31,820 $2.8 $0.3 $0.3
Rest of U.S. 0 179,940 $13.6 $1.6 $1.8 *Totals may not sum exactly due to rounding errors.
Conclusion General Motors’ manufacturing operations have long been, and continue to be a major driver of
economic activity in the United States. GM’s direct hourly and salaried manufacturing employment
supports nearly ten times as many total jobs in the U.S. economy, billions in compensation and tax
revenues, contribute to output growth in the economy, and support a vast supplier network that
reaches nearly every state in the union. In recent years, GM and the UAW have worked together to
vastly improve vehicle quality and the competitiveness of the business, and the results of this
partnership are being recognized in the market. The ongoing success of large manufacturing operations
such as GM’s are critical to the continued vitality of the nation’s economy, and are integral to the
economies of the states and communities in which they operate. As long as GM and the UAW remain
competitive in the business of manufacturing cars and trucks in the United States, the company will
continue to be an important driver of economic output and activity in the U.S. economy.

© Center for Automotive Research 15
Appendix The following two tables detail the industry sectors that contribute to the 2013 and 2014 induced
(indirect and spin-off) employment estimates supported by GM’s U.S. direct manufacturing
employment. The largest contributing sectors to the U.S. induced employment estimates are
manufacturing, administrative services, wholesale trade, and professional and technical services.
Table 6: Types of Indirect and Spin-Off Jobs Supported by GM’s U.S. Manufacturing Operations, 2013*
Industry Sector All U.S.
Intermediate Employment Spin-Off Employment
Manufacturing 50,000 22,300
Primary Metal 2,500 1,150
Fabricated Metal Products 9,600 2,500
Plastics, Rubber Products 3,100 2,200
Electrical or Computer Products 500 550
Motor Vehicle Parts Manufacturing 26,000 2,400
Other Manufacturing 8,300 13,500
Non-Manufacturing 136,100 229,900
Professional and Technical Services 21,000 15,000
Administrative and Services 28,300 6,900
Wholesale Trade 25,400 9,850
Retail Trade 5,800 32,450
Transportation and Warehousing 6,800 13,550
Finance and Insurance 9,700 14,950
Management of Companies 5,100 10,350
Other Services 27,150 85,750
Other Non-Manufacturing 6,850 41,100
TOTAL 186,100 252,200
*Non GM jobs; totals may not sum exactly due to rounding errors.

© Center for Automotive Research 16
Table 7: Types of Indirect and Spin-Off Jobs Supported by GM’s U.S. Manufacturing Operations, 2014 Forecast*
Industry Sector All U.S.
Intermediate Employment Spin-Off Employment
Manufacturing 49,700 21,100
Primary Metal 2,450 1,100
Fabricated Metal Products 9,600 2,550
Plastics, Rubber Products 3,150 2,150
Electrical or Computer Products 500 450
Motor Vehicle Parts Manufacturing 25,950 2,450
Other Manufacturing 8,050 12,400
Non-Manufacturing 135,200 225,300
Professional and Technical Services 20,900 15,450
Administrative and Services 28,250 6,700
Wholesale Trade 25,600 9,600
Retail Trade 6,000 30,300
Transportation and Warehousing 6,800 13,450
Finance and Insurance 9,350 13,850
Management of Companies 4,900 10,200
Other Services 26,650 81,100
Other Non-Manufacturing 6,750 44,650
TOTAL 184,900 246,400
*Non GM jobs; totals may not sum exactly due to rounding errors.
© Center for Automotive Research 17
References “2009 UAW-GM Modification Agreement,” May 2009.
Cole, David E., Sean P. McAlinden, Brett C. Smith, George A. Fulton, Donald R. Grimes, and Lucie G. Schmidt. “The Contribution of the International Auto Sector to the U.S. Economy.” University of Michigan, March 1998.
Dziczek, Kristin M., Debra Menk, Yen Chen. “CAR Research Memorandum: Economic Contribution of General Motors' Orion Assembly, Pontiac Metal Stamping, and Spring Hill Assembly Manufacturing Plants.” Center for Automotive Research, February 2014.
Hill, Kim, Debra Menk, Joshua Cregger, and Michael Schultz. “Contribution of the Automotive Industry to the Economies of All Fifty States and the United States.” Center for Automotive Research, January 2015.
Hill, Kim. “Contribution of Toyota to the Economics of Fourteen States and the United States in 2003.” Center for Automotive Research, June 2005.
Hill, Kim, Adam Cooper, and Debbie Maranger Menk. “Contribution of the Automotive Industry to the Economies of All Fifty States and the United States.” Center for Automotive Research, April 2010.
Hill, Kim, and Debbie Maranger Menk. “Contribution of the Motor Vehicle Supplier Sector to the Economies of the United States and Its 50 States.” Center for Automotive Research, January 2007.
Hill, Kim, and Debbie Maranger Menk. “Contribution of Toyota Motor North America to the Economies of Sixteen States and the United States, 2006.” Center for Automotive Research, October 2007.
Hill, Kim, and Debbie Maranger Menk. “Contribution of Toyota Motor North America to the Economies of Sixteen States and the United States in 2010.” Center for Automotive Research, March 2011.
Hill, Kim, and Debbie Maranger Menk. “Contribution of a Vehicle Infrastructure System to the Economy of Michigan: Economic and Industrial Impacts Update and Benefit-Cost Analysis.” Center for Automotive Research, June 2008.
Hill, Kim, and Debbie Maranger Menk. “The Economic and Environmental Impacts of a Corporate Fleet Vehicle Purchase Program.” Center for Automotive Research, October 2009.
Hill, Kim, Debbie Maranger Menk, and Joshua Cregger. “Assessment of Tax Revenue Generated by the Automotive Sector.” Center for Automotive Research, April 2012.
Hill, Kim, Debbie Maranger Menk, and Joshua Cregger. “Contribution of Urban-Based Suppliers to the Local Economy.” Center for Automotive Research, October 2012.
Hill, Kim, Debbie Maranger Menk, and Joshua Cregger. “Economic Impact of Hyundai in the United States.” Center for Automotive Research, November 2011.
Hill, Kim, Bernard Swiecki, Debbie Maranger Menk, Joshua Cregger, and Michael Schultz. “Economic Contribution of the Ford Motor Company Michigan Assembly Plant to the Michigan Economy.” Center for Automotive Research, March 2013.
Hill, Kim, Richard Wallace, Debbie Maranger Menk, and Joshua Cregger. “Analysis of the Economic Contribution of Constructing the New International Trade Crossing: A New Bridge Linking Detroit and Windsor.” Center for Automotive Research, April 2012.

© Center for Automotive Research 18
McAlinden, Sean P., Yen Chen, and Adam Cooper. “CAR Research Memorandum: The Economic and Fiscal Contributions of the “Cash for Clunkers” Program – National and State Effects.” Center for Automotive Research, January 2010.
McAlinden, Sean P., Adam Cooper, and Debbie Maranger Menk. “CAR Research Memorandum: The Impact on the U.S. Economy of Successful versus Unsuccessful Automakers Bankruptcies.” Center for Automotive Research, May 2009.
McAlinden, Sean P., Kristin Dziczek, and Debbie Maranger Menk. “CAR Research Memorandum: The Impact on the U.S. Economy of a Major Contraction of the Detroit Three Automakers.” Center for Automotive Research, November 2008.
McAlinden, Sean P., Kristin Dziczek, Debbie Maranger Menk, and Joshua Cregger. “CAR Research Memorandum: The Impact on the U.S. Economy of the Successful Automaker Bankruptcies.” Center for Automotive Research, November 2010.
McAlinden, Sean P., George A. Fulton, Donald R. Grimes and Lucie G. Schmidt, and Barbara C. Richardson. “Contribution of the Automotive Industry to the U.S. Economy in 1998: The Nation and Its Fifty States.” University of Michigan, Winter 2001.
McAlinden, Sean P., Kim Hill, David Cole, and Debbie Maranger Menk. “Contribution of Honda to the Economies of Seven States and the United States.” Center for Automotive Research, January 2009.
McAlinden, Sean P., Kim Hill, and Bernard Swiecki. “Economic Contribution of the Automotive Industry to the U.S. Economy: An Update.” Center for Automotive Research, Fall 2003.
McAlinden, Sean P., and Debbie Maranger Menk. “The Effect on the U.S. Economy of the Successful Restructuring of General Motors.” Center for Automotive Research, December 2013.
McAlinden, Sean P., and Bernard Swiecki. “The Contribution of the International Auto Sector to the U.S. Economy: An Update.” Center for Automotive Research, March 2005.
“Contribution of the U.S. Motor Vehicle Industry to the Economies of the United States, California, New York, and New Jersey in 2003.” Institute of Labor and Industrial Relations, University of Michigan, and the Center for Automotive Research, May 2004.
Note: The research staff of the Center for Automotive Research performed a few of these studies while
employed by the University of Michigan’s Office for the Study of Automotive Transportation.
Related Documents