Journal of Chromatography A, 1217 (2010) 7788–7799 Contents lists available at ScienceDirect Journal of Chromatography A journal homepage: www.elsevier.com/locate/chroma Contribution of beef base to aroma characteristics of beeflike process flavour assessed by descriptive sensory analysis and gas chromatography olfactometry and partial least squares regression Shiqing Song a , Xiaoming Zhang a,∗ , Khizar Hayat a,b , Meigui Huang a , Ping Liu a , Eric Karangwa a , Fenglin Gu a , Chengsheng Jia a , Shuqin Xia a , Zuobing Xiao c , Yunwei Niu c a State Key Laboratory of Food Science and Technology, School of Food Science and Technology, Jiangnan University, Wuxi, 214112 Jiangsu, China b Department of Biochemistry, Quaid-i-Azam University, Islamabad 45320, Pakistan c Department of Biology and Food Engineering, Shanghai Institute of Technology, 200235 Shanghai, China article info Article history: Received 6 July 2010 Received in revised form 13 September 2010 Accepted 12 October 2010 Available online 20 October 2010 Keywords: Beef base Beeflike process flavour Descriptive sensory analysis GC–O PLSR abstract Descriptive sensory analysis and gas chromatography–mass spectrometry (GC–MS) analysis were con- ducted to investigate changes in aroma characteristics of beeflike process flavours (BPFs) prepared from enzymatically hydrolyzed beef (beef base) of different DH (degree of hydrolysis) with other ingredients. Five attributes (beefy, meaty, simulate, mouthful and roasted) were selected to assess BPFs. The results of descriptive sensory analysis confirmed that BPF2 from beef base of moderate DH 29.13% was strongest in beefy, meaty and simulate characteristics; BPF4 and BPF5 from beef base of higher DH (40.43% and 44.22%, respectively) were superior in mouthful and roasted attributes respectively; while BPF0 without beef base gave weaker odour for all attributes. Twenty six compounds from GC–MS were selected as spe- cific compounds to represent beef odour based on their odour-active properties assessed by a detection frequency method of GC–O and correlation of their contents with sensory attributes intensity. Correlation analysis of molecular weight (MW) of peptides, odour-active compounds and sensory attributes through partial least squares regression (PLSR) further explained that beef base with DH of 29.13% was a desirable precursor for imparting aroma characteristics of beeflike process flavour. © 2010 Elsevier B.V. All rights reserved. 1. Introduction Beef flavours have been increasingly found application in meat analogues and processed instant foods. Recently, there have been various types of simulated meat flavours such as simple blended spices [1], recombined flavour components isolated and identified from cooked or fried meat [2], prepared from hydrolyzed vegetable protein (HVP) or hydrolyzed yeast [3], however, the most common type is “thermal process flavour”, which is a comparatively recent term given to a food flavour produced by heating a combination of two or more precursor materials under carefully controlled con- ditions [4]. The primary reaction occurring in this process is the Maillard reaction. It is well-known that meat flavour is thermally derived and consists of “meaty flavour” and “species-specific flavour”, which are imparted through coordination of Maillard reaction and lipid oxidation [5]. Therefore, precursors play an important role in the generation of process flavour. Generally, beef flavours are derived from the complex interactions of flavour precursors such as amino ∗ Corresponding author. Tel.: +86 510 85919106; fax: +86 510 85884496. E-mail address: [email protected] (X. Zhang). acids, peptides, sugars, thiamine, metabolites of nucleotides, and products of lipid oxidation. Considerable researches and patents have been done to develop beeflike flavour by Maillard reaction with various amino acids and sugars [6]. In contrast to pure amino acids, protein hydrolysates which contain free amino acids, peptides, nucleotides, reducing sugars, carbonyl compounds, and sulfur compounds, are inexpensive and have been used to produce beef flavours. For many years, HVP like soybean protein has been selected as potential precursor for beeflike process flavour [3,7]. However, meat flavours based on HVP can only partially simulate natural meat aroma, therefore, the thermal reaction model system has been evaluated for other flavour precursors (e.g. enzymatically hydrolyzed animal proteins) [8]. Some early researches related to meat hydrolysates have been involved in the preparation of meat flavour [9]. The first attempt of heating enzymatically degraded meat to produce meat flavour was made by Chhuy and Day [10]. Similar processes starting with the proteolysis of meat and meat by-products have been described by others [11]. The degree of hydrolysis (DH) of meat protein is a very important index for preparing meat flavours. Barbel Lieske and Gerd Konrad [12] confirmed that strong meatlike flavour notes would be inten- sified by heating the partial hydrolysates of meat protein in the 0021-9673/$ – see front matter © 2010 Elsevier B.V. All rights reserved. doi:10.1016/j.chroma.2010.10.046

Welcome message from author
This document is posted to help you gain knowledge. Please leave a comment to let me know what you think about it! Share it to your friends and learn new things together.
Transcript
Caa
SFa
b
c
a
ARR1AA
KBBDGP
1
avsfpttodM
caogf
0d
Journal of Chromatography A, 1217 (2010) 7788–7799
Contents lists available at ScienceDirect
Journal of Chromatography A
journa l homepage: www.e lsev ier .com/ locate /chroma
ontribution of beef base to aroma characteristics of beeflike process flavourssessed by descriptive sensory analysis and gas chromatography olfactometrynd partial least squares regression
hiqing Songa, Xiaoming Zhanga,∗, Khizar Hayata,b, Meigui Huanga, Ping Liua, Eric Karangwaa,englin Gua, Chengsheng Jiaa, Shuqin Xiaa, Zuobing Xiaoc, Yunwei Niuc
State Key Laboratory of Food Science and Technology, School of Food Science and Technology, Jiangnan University, Wuxi, 214112 Jiangsu, ChinaDepartment of Biochemistry, Quaid-i-Azam University, Islamabad 45320, PakistanDepartment of Biology and Food Engineering, Shanghai Institute of Technology, 200235 Shanghai, China
r t i c l e i n f o
rticle history:eceived 6 July 2010eceived in revised form3 September 2010ccepted 12 October 2010vailable online 20 October 2010
a b s t r a c t
Descriptive sensory analysis and gas chromatography–mass spectrometry (GC–MS) analysis were con-ducted to investigate changes in aroma characteristics of beeflike process flavours (BPFs) prepared fromenzymatically hydrolyzed beef (beef base) of different DH (degree of hydrolysis) with other ingredients.Five attributes (beefy, meaty, simulate, mouthful and roasted) were selected to assess BPFs. The resultsof descriptive sensory analysis confirmed that BPF2 from beef base of moderate DH 29.13% was strongestin beefy, meaty and simulate characteristics; BPF4 and BPF5 from beef base of higher DH (40.43% and
eywords:eef baseeeflike process flavourescriptive sensory analysisC–O
44.22%, respectively) were superior in mouthful and roasted attributes respectively; while BPF0 withoutbeef base gave weaker odour for all attributes. Twenty six compounds from GC–MS were selected as spe-cific compounds to represent beef odour based on their odour-active properties assessed by a detectionfrequency method of GC–O and correlation of their contents with sensory attributes intensity. Correlationanalysis of molecular weight (MW) of peptides, odour-active compounds and sensory attributes through
ssionroma
LSR partial least squares regreprecursor for imparting a
. Introduction
Beef flavours have been increasingly found application in meatnalogues and processed instant foods. Recently, there have beenarious types of simulated meat flavours such as simple blendedpices [1], recombined flavour components isolated and identifiedrom cooked or fried meat [2], prepared from hydrolyzed vegetablerotein (HVP) or hydrolyzed yeast [3], however, the most commonype is “thermal process flavour”, which is a comparatively recenterm given to a food flavour produced by heating a combinationf two or more precursor materials under carefully controlled con-itions [4]. The primary reaction occurring in this process is theaillard reaction.It is well-known that meat flavour is thermally derived and
onsists of “meaty flavour” and “species-specific flavour”, which
re imparted through coordination of Maillard reaction and lipidxidation [5]. Therefore, precursors play an important role in theeneration of process flavour. Generally, beef flavours are derivedrom the complex interactions of flavour precursors such as amino∗ Corresponding author. Tel.: +86 510 85919106; fax: +86 510 85884496.E-mail address: [email protected] (X. Zhang).
021-9673/$ – see front matter © 2010 Elsevier B.V. All rights reserved.oi:10.1016/j.chroma.2010.10.046
(PLSR) further explained that beef base with DH of 29.13% was a desirablecharacteristics of beeflike process flavour.
© 2010 Elsevier B.V. All rights reserved.
acids, peptides, sugars, thiamine, metabolites of nucleotides, andproducts of lipid oxidation. Considerable researches and patentshave been done to develop beeflike flavour by Maillard reactionwith various amino acids and sugars [6]. In contrast to pureamino acids, protein hydrolysates which contain free amino acids,peptides, nucleotides, reducing sugars, carbonyl compounds, andsulfur compounds, are inexpensive and have been used to producebeef flavours.
For many years, HVP like soybean protein has been selectedas potential precursor for beeflike process flavour [3,7]. However,meat flavours based on HVP can only partially simulate naturalmeat aroma, therefore, the thermal reaction model system hasbeen evaluated for other flavour precursors (e.g. enzymaticallyhydrolyzed animal proteins) [8]. Some early researches related tomeat hydrolysates have been involved in the preparation of meatflavour [9]. The first attempt of heating enzymatically degradedmeat to produce meat flavour was made by Chhuy and Day [10].Similar processes starting with the proteolysis of meat and meat
by-products have been described by others [11].The degree of hydrolysis (DH) of meat protein is a very importantindex for preparing meat flavours. Barbel Lieske and Gerd Konrad[12] confirmed that strong meatlike flavour notes would be inten-sified by heating the partial hydrolysates of meat protein in the
S. Song et al. / J. Chromatogr. A 1217 (2010) 7788–7799 7789
Table 1Changes of molecular weight (MW) distribution in different HBPs.
MW (Da) Samples
HBP1a HBP2 HBP3 HBP4 HBP5
>5000b 0.25 ± 0.01c 0.00 ± 0.00 0.14 ± 0.01 0.07 ± 0.00 0.06 ± 0.011000–5000 6.75 ± 0.12 4.45 ± 0.18 5.00 ± 0.12 3.56 ± 0.01 3.13 ± 0.30500–1000 19.05 ± 0.06 21.04 ± 0.10 18.11 ± 0.03 13.33 ± 0.09 12.69 ± 0.06200–500 54.49 ± 0.05 59.31 ± 0.03 62.55 ± 0.12 69.44 ± 0.06 70.77 ± 0.01>200 2.47 ± 0.02 1.21 ± 0.03 2.20 ± 0.06 4.59 ± 0.06 4.35 ± 0.01
a Five samples were denoted by the HBP followed by 1-digit Arabic numbers. Where “HBP” represents for beef enzymatic hydrolysate (beef base), the followed Arabicnumbers 1–5 denote DH 25.35%, 29.13%, 35.40%, 40.43% and 44.22%, respectively.
b Peptides in HBP as mg/mL of beef base.c Mean ± standard deviation (average of triplicate).
Table 2Analyses of variance for the main effects and their interactions for each of the five attributes in descriptive analysis.
F-values Adjusted F-value
Sample (S) (df = 5) Panelist (P) (df = 7) Replication (R) (df = 2) S × P (df = 35) P × R (df = 14) S × R (df = 10) Samplea (S) (df = 35) Sampleb (S) (df = 10)
Beefy 213.41*** 2.71* 3.18* 2.61*** 0.33 2.32* 81.64*** 66.76***
Meaty 416.65*** 16.98*** 2.96 11.48*** 0.75 1.18 36.29*** 33.60***
Simulate 401.53*** 0.96 0.88 0.90 1.59 1.04 445.91*** 441.35***
Roasted 67.36*** 6.43*** 2.58 2.24*** 0.73 1.22 29.38*** 22.58***
Mouthful 133.66*** 1.11 3.17 2.03** 1.05 0.47 65.84*** 71.21***
a SerroMSer
pwsD
1arktap
sbeGoGta(TDc
TT
t
Adjusted F-values of sample effect calculated using MSsample×panelist instead of Mb Adjusted F-values of sample effect calculated using MSsample×replication instead of* Significant at p ≤ 0.05.
** Significant at p ≤ 0.01.*** Significant at p ≤ 0.001.
resence of appropriate sulfur and carbohydrate sources comparedith the total hydrolysates. However, there is still a lack of more
ystematic study for the impact of beef hydrolysate with differentH on the aroma characteristics of beeflike process flavour.
Even though a great number of volatile compounds (more than000) have been reported in cooked beef meat, only some of themre important in terms of the characteristic beef flavour. In recentesearches, more great efforts have been made to find and identifyey aroma compounds in beef via gas chromatography in combina-ion with olfactometry (GC–O) [13,14]. However, a little was knownbout the aroma active components of beeflike process flavour pre-ared from enzymatically hydrolyzed beef, so called beef base.
The objectives of the present study are to (a) apply descriptiveensory analysis to describe and monitor the aroma attributes ofeeflike process flavours (BPFs) derived from beef base with differ-nt DH, (b) analyze the volatile compounds released from BPFs byC–MS and investigate the impact of beef base with different DHn their corresponding aroma-active compounds determined byC–O, and (c) identify which aroma-active compounds and pep-
ides of what MW have significant influence on individual sensory
ttributes through correlation analysis among molecular weightMW) of peptides, aroma-active compounds and sensory attributes.hrough the above analysis, the desirable beef base with suitableH is then recommended for controlled proteolysis to prepareharacteristic beef flavour precursors.able 3he mean intensity values of the 5 attributes for the 6 BPF samples in descriptive sensory
Beefy Meaty Simulate
SampleY Mean score Sample Mean score Sample M
BPF0 3.25a BPF0 1.21a BPF0 2BPF1 4.04b BPF1 4.33b BPF5 2BPF3 5.54c BPF5 6.13c BPF1 3BPF4 6.00d BPF3 6.13c BPF3 6BPF5 6.00d BPF4 6.88d BPF4 6BPF2 8.50e BPF2 8.58e BPF2 8
X Mean scores (listed in ascending order) for each attribute within a column with differest (n = 24; 8 panelists with 3 replications).
Y Six beaflike process flavours were denoted by the BPF0-5, which were prepared from
r as described in the text.ror as described in the text.
2. Materials and methods
2.1. Materials
Lean beef was purchased from Wal-Mart supermarket in Wuxi,China. Hydrolyzed vegetable protein (HVP) was provided by Tian-ning Flavour & Fragrance Co., Ltd. (Shanghai, China). Refinedtallow was purchased from Anhui Muyang Oil and Fats Co., Ltd.(Anhui, China). dl-methionine, d-xylose, glucose, l-cysteine, l-glutamic acid, l-proline, thiamine and taurine were purchased fromSinopharm Chemical Reagent Co., Ltd. (Shanghai, China). Alkalineprotease, activity 2.4 AU/mL, and flavourzyme, activity 500 LAPU/g,were purchased from Novozymes (Bagsvaerd, Denmark). 1,2-Dichlorobenzene and methanol were of chromatography gradefrom TCI Development Co., Ltd. (Shanghai, China). Other authen-tic reference compounds were obtained from commercial sourcesand Sigma–Aldrich Co. Ltd. (Shanghai, China).
2.2. Sample preparation
2.2.1. Preparation of beef baseLean beef (water content, 75.98%; protein content, 20.58%) was
minced with a tissue-tearor and mixed with deionized water at ameat–water ratio of 7:3. The mixture dispersion was then heatedat 95 ◦C for 10 min in order to make the endogenous enzyme
evaluation.X
Roasted Mouthful
ean score Sample Mean score Sample Mean score
.39a BPF4 5.71a BPF0 2.88a
.79b BPF0 6.25b BPF5 5.25b
.54c BPF3 6.63b BPF3 6.50c
.00d BPF2 7.50c BPF2 6.58c
.46e BPF1 7.92d BPF1 7.21d
.67f BPF5 8.75e BPF4 7.25d
ent letters are significantly different (p ≤ 0.05) using Duncan’s multiple comparison
without HBP and with HBP1, HBP2, HBP3, HBP4 and HBP5, respectively.

7790 S. Song et al. / J. Chromatogr. A 1217 (2010) 7788–7799
Table 4Volatile flavour compounds of 6 BPF samples, determined by gas chromatography–olfactometry analysis, the compounds’ detection frequencies (6 assessors, average of twosessions), statistical significance of beef base and odour descriptors.
Codea Compound Detection frequency pb Odour descriptionc IDd
BPF0 BPF1 BPF2 BPF3 BPF4 BPF5
A1 3-Methylbutanal 3 3 6 5 4 6 *** Chocolate, caramel, green, nutty BA2 Hexanal 3 4 6 3 4 5 *** Green, fruity BA3 Heptanal 3 5 5 4 4 4 *** Fruity, nutty BA4 (E,E)-2,4-Decadienal 5 5 5 3 4 5 *** Deep-fried, fatty, fried potato BA5 Nonanal 4 4 6 5 4 6 *** Grassy, green, beefy BA6 Decanal 5 4 5 5 5 6 NS Rubber tubing, smokey BA7 2-Undecenal 4 4 3 5 4 3 *** Fatty, green, boiled meat BA8 Benzaldehyde 3 6 6 4 5 4 *** Pop corn, caramel, herby, metallic BA9 1-Octen-3-ol 5 5 5 6 5 6 NS Mushroom BA10 2-Butanone 3 3 4 4 3 3 *** Sweet, buttery CA11 Unknown – – 4 – – – *** Green, fattyA12 2-decanone 4 4 4 3 3 3 NS Musty, fruity CA13 Hexanoic acid 3 3 3 3 4 5 *** Pungency, rancid BA14 Unknown 4 5 6 3 4 5 *** Tallow-likeA15 2-Methyl-3-(methylthio) furan 3 3 6 3 3 6 *** Meaty, sulfurous, onion BA16 2-Methyl-3-furanthiol (2-MF) – 3 6 4 – – *** Meaty, cooked rice BA17 Bis(2-methyl-3-furyl)disulfide – 5 6 5 4 4 *** Meaty, coffee, metallic BA18 2-Pentylfuran – – 6 5 5 5 *** Metallic, earthy, green BA19 2-Acetyl-1-pyroline 4 5 3 3 3 6 *** Roasted, popcorn, coffee BA20 2-Ethyl-3,6-dimethylpyrazine 3 5 4 3 4 6 *** Nutty, roasted BA21 2,5-Dimethylthiophene – 4 4 5 4 4 NS Beef, sweet, ham, rancid BA22 3-Methyl-2-thiophenecarboxaldehyde – 5 6 4 – – *** Sweet, beefy CA23 Sulfurol – 3 6 6 – – *** Nutty BA24 2-Pentylpyridine – – 4 5 5 4 *** Nutty, beefy CA25 Unknown – – 4 4 3 4 *** BreadA26 �-Nonalactone 3 5 5 4 5 5 *** Sweet, dairy, nutty B
a Code representing the 26 odour-active compounds observed in GC–MS.b
C–O.nds o
t .
dswep0tstr
2
ppwr
g(dfwhacw
2
2
a
*p ≤ 0.05; **p ≤ 0.01; ***p ≤ 0.001; NS: not significant.c Odour description as perceived by panelists at a given retention index during Gd Identification method: B, identified by comparing it with the reference compou
entatively by comparing it with literature data on the basis of RI and odour quality
eactivation and beef protein denaturation. Beef protein was con-ecutively hydrolyzed by alkaline protease and flavourzyme. Itas first hydrolyzed at 60 ◦C for 3 h using alkaline protease with
nzyme/substrate ratio (E/S) of 6.6 × 10⁻³ (AU/g minced meat) andH of 8.0, and then treated at 50 ◦C using flavourzyme with E/S of.25 (LAPU/g minced meat) and pH 6.6 for 2, 4, 6, 8 and 10 h, respec-ively, to prepare the beef base with different DH. The resultantlurry was heated at 95 ◦C for 10 min to inactivate the enzyme andhen centrifuged at 3500 rpm for 30 min to remove the insolubleesidue. The supernatant was used for further analysis.
.2.2. Preparation of beeflike process flavour (BPF)Controlled oxidation of tallow: The oxidized tallow was pre-
ared according to our early research [15]. The correspondingeroxide value (PV), acid value (AV) and p-anisidine value (p-AV)ere 242.88 mequiv./kg tallow, 0.93 mg KOH/g tallow and 80.76,
espectively.A mixture of HVP (4 g), dl-methionine (0.2 g), d-xylose (1 g),
lucose (1 g), l-cysteine (1 g), l-glutamic acid (0.25 g), l-proline0.25 g), thiamine (0.6 g), taurine (0.5 g), oxidized tallow (10 g), wasissolved in 81.2 g solution of the beef base. The solution was trans-erred into 50 mL screw-sealed tubes. The pH was adjusted to 6.5ith 6 moL/L NaOH, and the tubes were tightly capped and theneated in a thermostatic oil bath with magnetic stirring (150 rpm)t 120 ◦C for 120 min. After reaction, the tubes were immediatelyooled in ice-water and the thermal reaction products named BPFsere sampled for further use.
.3. Analysis methods
.3.1. Determination of degree of hydrolysis (DH)The degree of hydrolysis (DH) was defined as the ratio of free
mino groups present in the hydrolysate to the total amount of
n the basis of MS spectra, RI, odour quality and authentic compounds; C, identified
amino groups in the protein. The free amino group was determinedby a modified formol titration method [16]. The total nitrogen wasdetermined by Kjeldahl method.
2.3.2. Determination of amino acids and molecular weight (MW)distribution
Amino acids and molecular weight (MW) distribution of beefbase were determined according to the method reported by Lanet al. [17].
2.3.3. Sensory analysisQuantitative descriptive sensory analysis was applied for eval-
uating BPFs by a well-trained panel consisting of 8 members atthe age of 25–50, 5 females and 3 males. All panelists have passedscreening tests according to ISO standards [18], and had previousexperience with sensory evaluation. Sensory sessions took place ina sensory laboratory, which complied with international standardsfor test rooms [19]. Prior to the quantitative descriptive sensoryanalysis, the panelists had thoroughly discussed aroma propertiesof samples through three preliminary sessions, each spent 2 h, untilall of them had agreed to use them as the attributes according tothe objective of the present work. In total, 5 descriptors, includ-ing beefy, meaty, simulate, mouthful and roasted were used forthe descriptive analysis. And the reference materials were as fol-lows: pot roast (round bottom roast, approximately 200 g, wrappedwith aluminum foil and baked for 1 h at 150 ◦C) was labeled “beef-like” note; defatted beef brisket (0.5 kg, 2.5 cm thick, purchasedfrom Wal-Mart supermarket) boiled in water for 2 h was labeled
“meat-like” aroma; stewed beef product, purchased from Wal-Martsupermarket, the similarity degree of aroma was labeled “sim-ulate” note; 10 g bouillon cube (beef flavour consisting of MSG,yeast extract, and beef extract), dissolved in water was labeled“mouthfulness” attribute; ground roast coffee (Maxwell House Cof-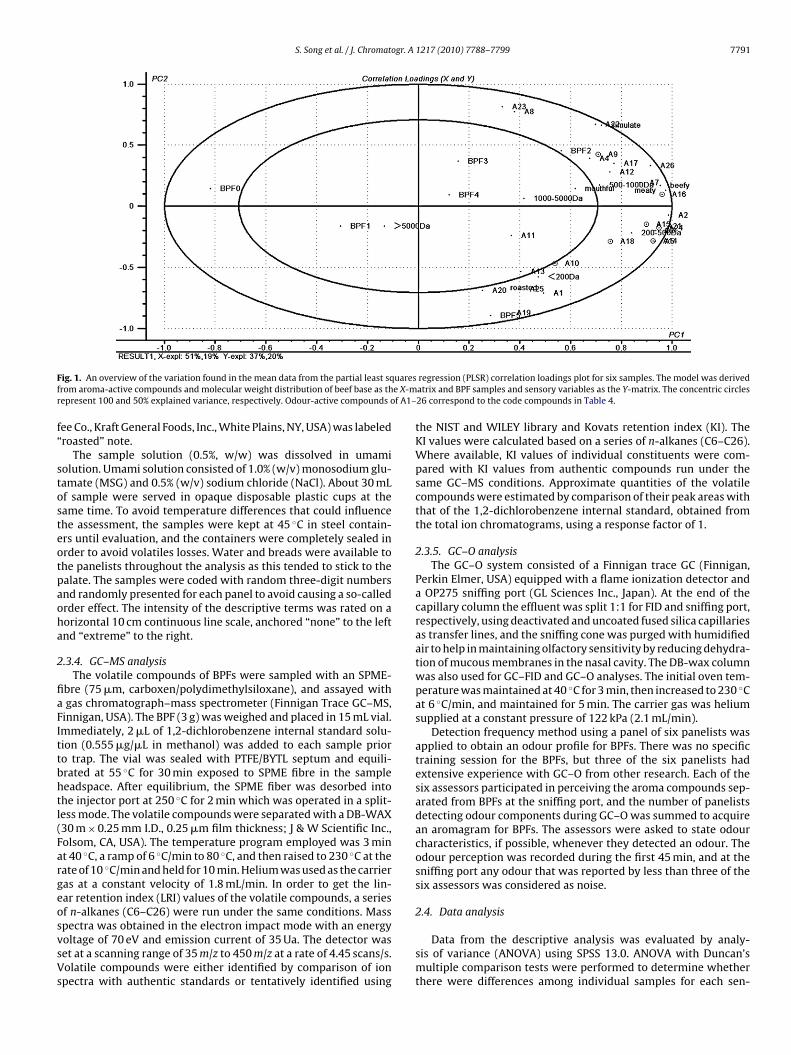
S. Song et al. / J. Chromatogr. A 1217 (2010) 7788–7799 7791
F uaresf e X-mr f A1–
f“
stosteotpaoha
2
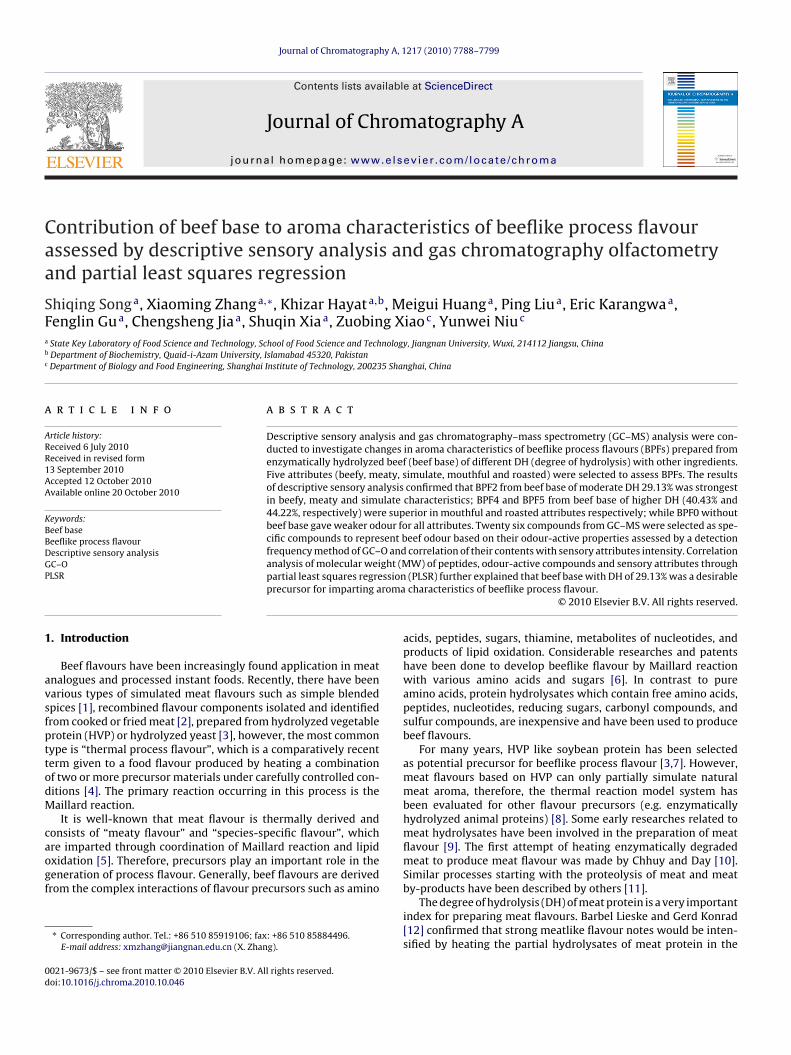
fiaFIttbhtl(FargeosvsVs
ig. 1. An overview of the variation found in the mean data from the partial least sqrom aroma-active compounds and molecular weight distribution of beef base as thepresent 100 and 50% explained variance, respectively. Odour-active compounds o
ee Co., Kraft General Foods, Inc., White Plains, NY, USA) was labeledroasted” note.
The sample solution (0.5%, w/w) was dissolved in umamiolution. Umami solution consisted of 1.0% (w/v) monosodium glu-amate (MSG) and 0.5% (w/v) sodium chloride (NaCl). About 30 mLf sample were served in opaque disposable plastic cups at theame time. To avoid temperature differences that could influencehe assessment, the samples were kept at 45 ◦C in steel contain-rs until evaluation, and the containers were completely sealed inrder to avoid volatiles losses. Water and breads were available tohe panelists throughout the analysis as this tended to stick to thealate. The samples were coded with random three-digit numbersnd randomly presented for each panel to avoid causing a so-calledrder effect. The intensity of the descriptive terms was rated on aorizontal 10 cm continuous line scale, anchored “none” to the leftnd “extreme” to the right.
.3.4. GC–MS analysisThe volatile compounds of BPFs were sampled with an SPME-
bre (75 �m, carboxen/polydimethylsiloxane), and assayed withgas chromatograph–mass spectrometer (Finnigan Trace GC–MS,
innigan, USA). The BPF (3 g) was weighed and placed in 15 mL vial.mmediately, 2 �L of 1,2-dichlorobenzene internal standard solu-ion (0.555 �g/�L in methanol) was added to each sample prioro trap. The vial was sealed with PTFE/BYTL septum and equili-rated at 55 ◦C for 30 min exposed to SPME fibre in the sampleeadspace. After equilibrium, the SPME fiber was desorbed intohe injector port at 250 ◦C for 2 min which was operated in a split-ess mode. The volatile compounds were separated with a DB-WAX30 m × 0.25 mm I.D., 0.25 �m film thickness; J & W Scientific Inc.,olsom, CA, USA). The temperature program employed was 3 mint 40 ◦C, a ramp of 6 ◦C/min to 80 ◦C, and then raised to 230 ◦C at theate of 10 ◦C/min and held for 10 min. Helium was used as the carrieras at a constant velocity of 1.8 mL/min. In order to get the lin-ar retention index (LRI) values of the volatile compounds, a seriesf n-alkanes (C6–C26) were run under the same conditions. Mass
pectra was obtained in the electron impact mode with an energyoltage of 70 eV and emission current of 35 Ua. The detector waset at a scanning range of 35 m/z to 450 m/z at a rate of 4.45 scans/s.olatile compounds were either identified by comparison of ionpectra with authentic standards or tentatively identified usingregression (PLSR) correlation loadings plot for six samples. The model was derivedatrix and BPF samples and sensory variables as the Y-matrix. The concentric circles26 correspond to the code compounds in Table 4.
the NIST and WILEY library and Kovats retention index (KI). TheKI values were calculated based on a series of n-alkanes (C6–C26).Where available, KI values of individual constituents were com-pared with KI values from authentic compounds run under thesame GC–MS conditions. Approximate quantities of the volatilecompounds were estimated by comparison of their peak areas withthat of the 1,2-dichlorobenzene internal standard, obtained fromthe total ion chromatograms, using a response factor of 1.
2.3.5. GC–O analysisThe GC–O system consisted of a Finnigan trace GC (Finnigan,
Perkin Elmer, USA) equipped with a flame ionization detector anda OP275 sniffing port (GL Sciences Inc., Japan). At the end of thecapillary column the effluent was split 1:1 for FID and sniffing port,respectively, using deactivated and uncoated fused silica capillariesas transfer lines, and the sniffing cone was purged with humidifiedair to help in maintaining olfactory sensitivity by reducing dehydra-tion of mucous membranes in the nasal cavity. The DB-wax columnwas also used for GC–FID and GC–O analyses. The initial oven tem-perature was maintained at 40 ◦C for 3 min, then increased to 230 ◦Cat 6 ◦C/min, and maintained for 5 min. The carrier gas was heliumsupplied at a constant pressure of 122 kPa (2.1 mL/min).
Detection frequency method using a panel of six panelists wasapplied to obtain an odour profile for BPFs. There was no specifictraining session for the BPFs, but three of the six panelists hadextensive experience with GC–O from other research. Each of thesix assessors participated in perceiving the aroma compounds sep-arated from BPFs at the sniffing port, and the number of panelistsdetecting odour components during GC–O was summed to acquirean aromagram for BPFs. The assessors were asked to state odourcharacteristics, if possible, whenever they detected an odour. Theodour perception was recorded during the first 45 min, and at thesniffing port any odour that was reported by less than three of thesix assessors was considered as noise.
2.4. Data analysis
Data from the descriptive analysis was evaluated by analy-sis of variance (ANOVA) using SPSS 13.0. ANOVA with Duncan’smultiple comparison tests were performed to determine whetherthere were differences among individual samples for each sen-

7 ogr. A
samabautb
Fs
792 S. Song et al. / J. Chromat
ory attribute. When the interaction was found to be significant,n adjusted F-test was subsequently conducted based on usingean square of the interaction instead of mean square of error
s the denominator for calculating F-value [20]. The correlations
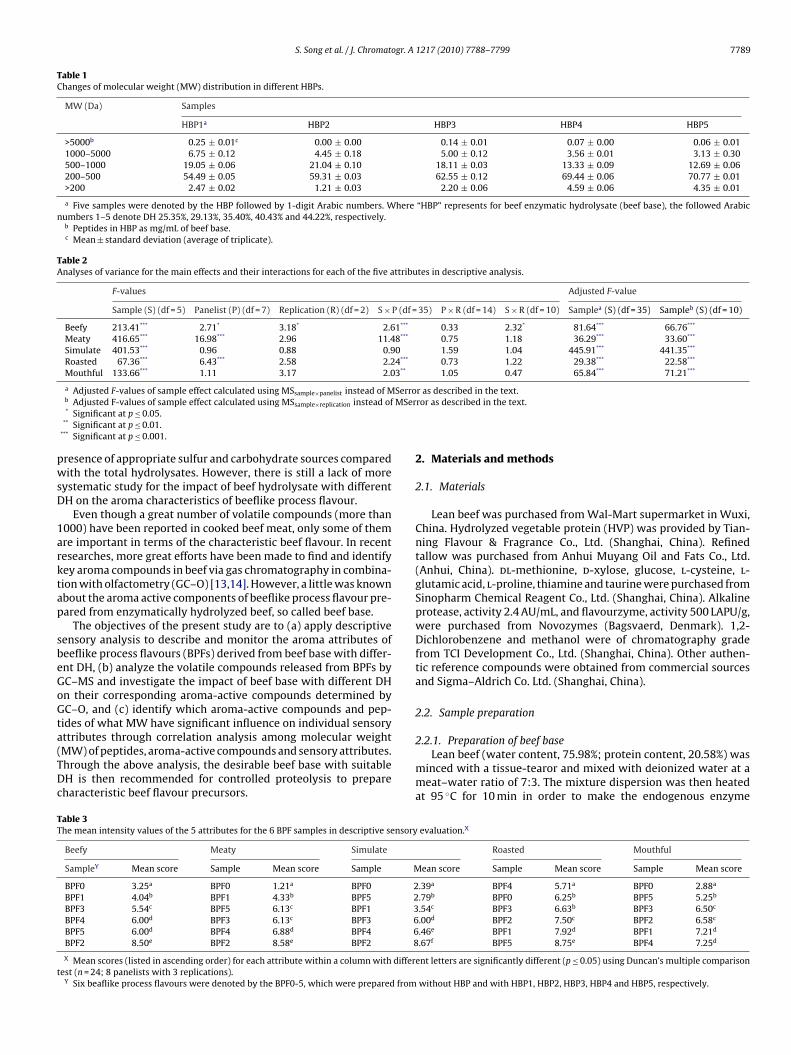
etween MW of peptides, aroma-active compounds and sensoryttributes were analyzed by partial least squares regression (PLSR)sing the Unscrambler version 9.7 (CAMO ASA, Oslo, Norway). Andhe detailed PLSR analysis method has been previously describedy Song et al. [21].ig. 2. Standardized, estimated regression coefficients and significance indications fromimulate (C), mouthful (D) and roasted (E) from aroma-active compounds. Odour-active c
1217 (2010) 7788–7799
3. Results and discussion
3.1. Analysis of amino acid composition of beef base
The enzymatic hydrolysate of beef was prepared according tothe method described above. Five samples were hydrolyzed for 2, 4,6, 8 and 10 h and the corresponding DH values were 25.35%, 29.13%,35.40%, 40.43%, and 44.22%, respectively. Each sample and relatedBPFs were used for further investigation.
PLS1 prediction models for the sensory attributes variables beefy (A), meaty (B),ompounds of A1–26 correspond to the code compounds in Table 4.

S. Song et al. / J. Chromatogr. A 1217 (2010) 7788–7799 7793
( Cont
rabatdta1
Fig. 2.
The distribution of free amino acids (FAA) can directly or indi-ectly influence the sensory perception of BPFs. The total freemino acids gradually increased from 86.62 to 161.67 mg/g dryasis with an increase of DH. Levels of all individual aminocid were different in the experimental beef base irrespective of
he conditions of hydrolysis used. Leucine was the most abun-ant free amino acid found in all samples, accounting for 19.26%o 20.68% of total free amino acids. The other abundant aminocid found in all samples was lysine, accounting for 16.94% to7.99% of the total free amino acids. Others like arginine, alanine,inued )
phenylalanine and methionine were also high in free form. Theseamino acids may play important role in thermal process flavours.The potent odourants 3-methylbutanal, phenylacetaldehyde andnumerous sulfur-containing compounds (e.g. dimethyltrisulfide, 3-(methylthio) propanal, and methanethiol) can arise from Strecker
degradation of leucine, phenylalanine and methionine, respectively[22]. Lysine can undergo thermal reactions leading to formation ofalkylpyrazines and 2-acetyl-1-pyrroline [23]. The remaining aminoacids especially serine, cystine and proline were relatively low inquantity.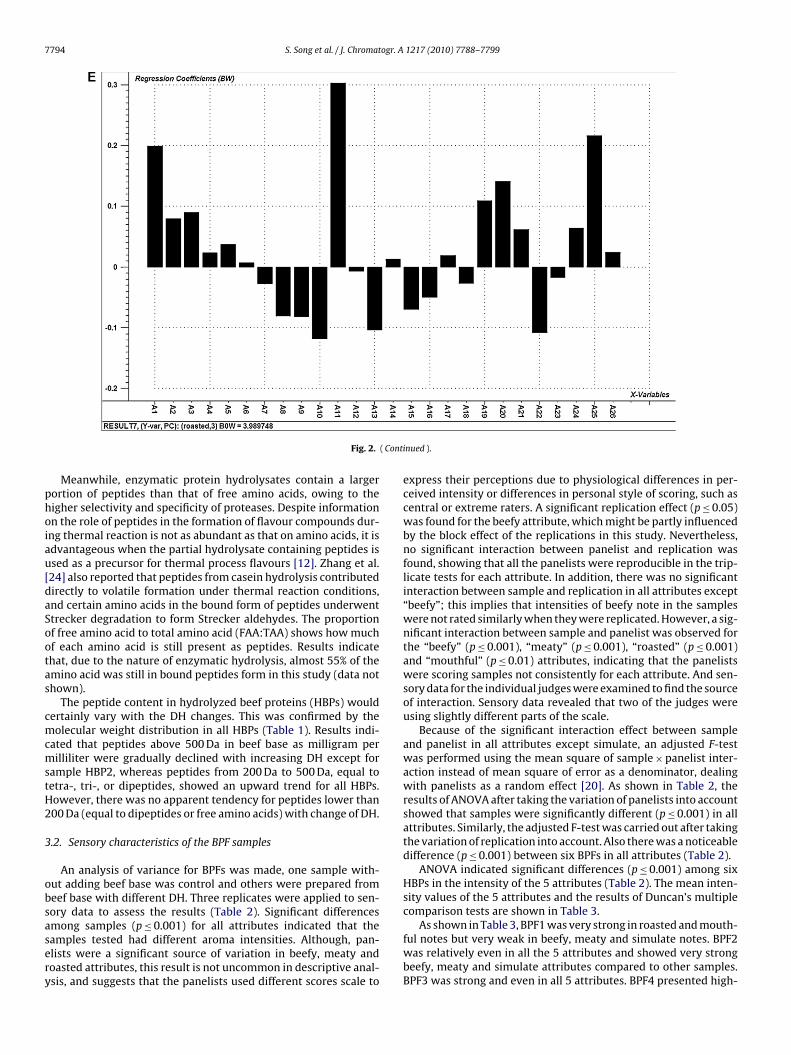
7794 S. Song et al. / J. Chromatogr. A 1217 (2010) 7788–7799
( Conti
phoiau[daSootas
cmcmstH2
3
obsasery
Fig. 2.
Meanwhile, enzymatic protein hydrolysates contain a largerortion of peptides than that of free amino acids, owing to theigher selectivity and specificity of proteases. Despite informationn the role of peptides in the formation of flavour compounds dur-ng thermal reaction is not as abundant as that on amino acids, it isdvantageous when the partial hydrolysate containing peptides issed as a precursor for thermal process flavours [12]. Zhang et al.24] also reported that peptides from casein hydrolysis contributedirectly to volatile formation under thermal reaction conditions,nd certain amino acids in the bound form of peptides underwenttrecker degradation to form Strecker aldehydes. The proportionf free amino acid to total amino acid (FAA:TAA) shows how muchf each amino acid is still present as peptides. Results indicatehat, due to the nature of enzymatic hydrolysis, almost 55% of themino acid was still in bound peptides form in this study (data nothown).
The peptide content in hydrolyzed beef proteins (HBPs) wouldertainly vary with the DH changes. This was confirmed by theolecular weight distribution in all HBPs (Table 1). Results indi-
ated that peptides above 500 Da in beef base as milligram perilliliter were gradually declined with increasing DH except for
ample HBP2, whereas peptides from 200 Da to 500 Da, equal toetra-, tri-, or dipeptides, showed an upward trend for all HBPs.owever, there was no apparent tendency for peptides lower than00 Da (equal to dipeptides or free amino acids) with change of DH.
.2. Sensory characteristics of the BPF samples
An analysis of variance for BPFs was made, one sample with-ut adding beef base was control and others were prepared fromeef base with different DH. Three replicates were applied to sen-ory data to assess the results (Table 2). Significant differences
mong samples (p ≤ 0.001) for all attributes indicated that theamples tested had different aroma intensities. Although, pan-lists were a significant source of variation in beefy, meaty andoasted attributes, this result is not uncommon in descriptive anal-sis, and suggests that the panelists used different scores scale tonued ).
express their perceptions due to physiological differences in per-ceived intensity or differences in personal style of scoring, such ascentral or extreme raters. A significant replication effect (p ≤ 0.05)was found for the beefy attribute, which might be partly influencedby the block effect of the replications in this study. Nevertheless,no significant interaction between panelist and replication wasfound, showing that all the panelists were reproducible in the trip-licate tests for each attribute. In addition, there was no significantinteraction between sample and replication in all attributes except“beefy”; this implies that intensities of beefy note in the sampleswere not rated similarly when they were replicated. However, a sig-nificant interaction between sample and panelist was observed forthe “beefy” (p ≤ 0.001), “meaty” (p ≤ 0.001), “roasted” (p ≤ 0.001)and “mouthful” (p ≤ 0.01) attributes, indicating that the panelistswere scoring samples not consistently for each attribute. And sen-sory data for the individual judges were examined to find the sourceof interaction. Sensory data revealed that two of the judges wereusing slightly different parts of the scale.
Because of the significant interaction effect between sampleand panelist in all attributes except simulate, an adjusted F-testwas performed using the mean square of sample × panelist inter-action instead of mean square of error as a denominator, dealingwith panelists as a random effect [20]. As shown in Table 2, theresults of ANOVA after taking the variation of panelists into accountshowed that samples were significantly different (p ≤ 0.001) in allattributes. Similarly, the adjusted F-test was carried out after takingthe variation of replication into account. Also there was a noticeabledifference (p ≤ 0.001) between six BPFs in all attributes (Table 2).
ANOVA indicated significant differences (p ≤ 0.001) among sixHBPs in the intensity of the 5 attributes (Table 2). The mean inten-sity values of the 5 attributes and the results of Duncan’s multiplecomparison tests are shown in Table 3.
As shown in Table 3, BPF1 was very strong in roasted and mouth-ful notes but very weak in beefy, meaty and simulate notes. BPF2was relatively even in all the 5 attributes and showed very strongbeefy, meaty and simulate attributes compared to other samples.BPF3 was strong and even in all 5 attributes. BPF4 presented high-
ogr. A
elisaipnwpmerpwD
aabediap
3c
ottasNi
fcsipmcbwa
GidaAcs
rdscooGoc
S. Song et al. / J. Chromat
st mouthful note. BPF5 was the strongest in roasted and withess extent in beefy, meaty and mouthful notes, while it was weakn simulate note. By contrast, the control sample BPF0 gave onlytrong roasted note and was very weak in the other 4 attributes,nd this is consistent with the fact that meat flavours based on mix-ng of pure amino acids and hydrolyzed vegetable protein can onlyartially simulate natural meat aroma. Also, it is obvious that a sig-ificant increase in perceived beefy aroma intensity was observedhen beef base with different DH were added to prepare BPF com-ared with control. In particular, BPF2 showed the strongest beefy,eaty and simulate characteristics compared to other samples, and
ach of other samples showed superiority in one or more attributes,espectively. This phenomenon implied that HBP with different DHroduced varying quantities of volatile compounds; however, thereas no apparent tendency for attributes changes with increasingH.
Furthermore, the differences in flavour profile developmentmongst the BPFs are also supported by different contents of freemino acids, peptides and protein (Table 1). This may be explainedy that certain peptides and free amino acids have an importantffect on its unique flavour formation and perception. Peptides mayirectly or indirectly contribute to form aroma-active compounds
nstead of undergoing hydrolysis of peptide bonds to free aminocids. Some compounds formed from peptides might enhance theerception.
.3. Effect of beef base with different DH on the volatileharacteristics of BPFs
The volatile compounds of BPFs were separated and detectedn a DB-WAX column: 19 alcohols, 16 aldehydes, 16 ketones, 13hiophenes, 12 alkanes, 8 lactones, 8 furans, 7 carboxylic acids, 6hiazoles, 4 pyridines, 3 sulfur compounds, 2 pyrazines, 2 pyrrolesnd 1 esters. They were either identified by comparison of ionpectra with authentic standards or tentatively identified using theIST and WILEY library and further characterized by their retention
ndices.To evaluate the influence of beef base with different DH on the
ormation of flavour characteristics of BPFs, the selection of specificompounds from GC analysis to represent the beeflike attributes inamples might be useful. Several researches [2,25] indicated that,n contrast to fruits or chocolates, no single character impact com-ound has been identified for either authentic meat or simulatedeat flavours, and that a number of volatiles of different chemical
lasses existing in specific quantitative proportions were responsi-le for the meat flavours. In this study, multiple aroma compoundsere also confirmed to be specific compounds responsible for the
roma characteristics of BPFs.To qualify as specific compound, the compound detected by
C–MS should be positively correlated (p ≤ 0.05) with attributesn descriptive sensory analysis. The correlation analysis was con-ucted between the descriptive analysis scores of the five sensoryttributes and all identified compounds by means of GC–MS.mong 117 volatile compounds, 67 compounds were significantlyorrelated with the specific sensory attributes (p ≤ 0.05) (data nothown).
It is well known that the concentration does not necessarilyeflect the perceived aroma intensity of the compound in a sampleue to the different odour threshold or differences in detector sen-itivity for different compounds [26]. An additional criterion for aompound to be considered as specific compound is that it must be
dour-active with greater than 50% detection frequency (i.e. halfr more detection frequency out of all panelists) as assessed byC–O. In this study, all samples were subjected to GC–O, basedn the detection frequency method, to determine the odour-activeompounds out of the range of volatiles. A total of 51 volatile com-1217 (2010) 7788–7799 7795
pounds possessed an odour activity in BPFs. Meanwhile, based onthe aforementioned correlation analysis and odour activity, amongthe 67 compounds that were positively correlated with sensoryattributes, only 26 compounds were identified as odour-active inBPFs, with greater than 50% detection frequency by GC–O. Of these26 compounds, 3 compounds were not able to be identified byGC–MS due to either small peak area or low quality of identification(Table 4).
Among the 26 aroma-active compounds, 16 compoundshave already been demonstrated to be responsible for beefaroma: 3-methylbutanal (chocolate, pungent, sweet, roasted),hexanal (green), heptanal (green, fatty, oily), nonanal (soapy),(E,E)-2,4-decadienal (deep-fried, fat), decanal (sweet popcorn,fatty), 1-octen-3-ol (mushroom), 2-butanone (chemical, burnt),2-decanone (musty, fruity), hexanoic acid (sweety), bis(2-methyl-3-furyl) disulfide (meaty), 2-methyl-3-(methylthio) furan(meaty, sweet, sulfurous), 2-methyl-3-furanthiol (2-MF) (meaty,cooked rice), 2-pentylfuran (metallic, earthy, green), 2-ethyl-3,6-dimethylpyrazine (nutty, roasted) and 2-acetyl-1-pyroline(roasted, popcorn, coffee) [13,17,27,28].
It is noted that 22 compounds were significantly influencedby beef base (p ≤ 0.001). Eleven of them were Maillard reac-tion products, 8 derived from lipids and 3 compounds werenot identified. 2-Methyl-3-furanthiol (2-MF), along with bis(2-methyl-3-furyl) disulfide which is a dimmer of 2-MF, is formedvia thermal degradation of thiamin or as the thermal product ofpentoses and cysteine [29]. 2-Methyl-3-(methylthio) furan wasproposed to be formed via either Maillard reaction of ribose andcysteine, involving the reaction with methanethiol, or the reac-tion of 2-MF with methanethiol [30]. 2-Acetyl-1-pyroline and2-ethyl-3,6-dimethylpyrazine can be produced from the Streckerdegradation, which involves interaction of nitrogen contain-ing molecules (e.g. �-amino acids) with dicarbonyls resultingfrom carbohydrate decomposition or lipid oxidation in a clas-sic Maillard reaction. Other heterocyclic compounds associatedwith typical flavours, like 2,5-dimethylthiophene, 3-methyl-2-thiophenecarboxaldehyde and 2-pentylpyridine, were also theproducts of the reaction of carbonyls with Strecker degradationproducts, i.e. ammonia, hydrogen sulfide [31]. The autoxidation ofsaturated or unsaturated fatty acids from tallow produce hexanal,heptanal, nonanal, decanal, 2-undecenal and (E,E)-2,4-decadienal.Lipid degradation also contributes to the formation of 1-octen-3-ol,2-butanone, 2-decanone, hexanoic acid and 2-pentylfuran. In addi-tion, strecker degradation of leucine contributes to the formationof 3-methylbutanal.
Evidently, 9 compounds possessing an odour activity were notdetected in BPF0 without beef base, including 2-MF, bis(2-methyl-3-furyl) disulfide, 2,5-dimethylthiophene, sulfurol, 2-pentylfuran,3-methyl-2-thiophenecarboxaldehyde, 2-pentylpyridine, A11 andA25. Those compounds could contribute to the production of a dif-ferent overall odour by adding their specific notes to the aromaprofile of BPFs. For instance, 2-MF and bis(2-methyl-3-furyl) disul-fide were reported as the most character impact compounds withhigh aroma values and were responsible for the meat-like odourin cooked beef [32]. The absence of these compounds for BPF0might be the cause of its weaker beefy, meaty and simulatenotes from sensory analysis compared with other BPFs (Table 3).Compound A11, which may contribute to characteristic of beeftallow flavour, was only detected in BPF2. 2-pentylfuran, A25and 2-pentylpyridine were found in BPF2, BPF3, BPF4 and BPF5,while 2-MF, sulfurol and 3-methyl-2-thiophenecarboxaldehyde
were only present in BPF1, BPF2 and BPF3. Among these,BPF2 showed significantly higher detection frequency scores formost aroma-active compounds than other samples especially for2-MF, 2-pentylfuran, 3-methyl-2-thiophenecarboxaldehyde andsulfurol. Moreover, decanal, 1-octen-3-ol, 2-decanone and 2,5-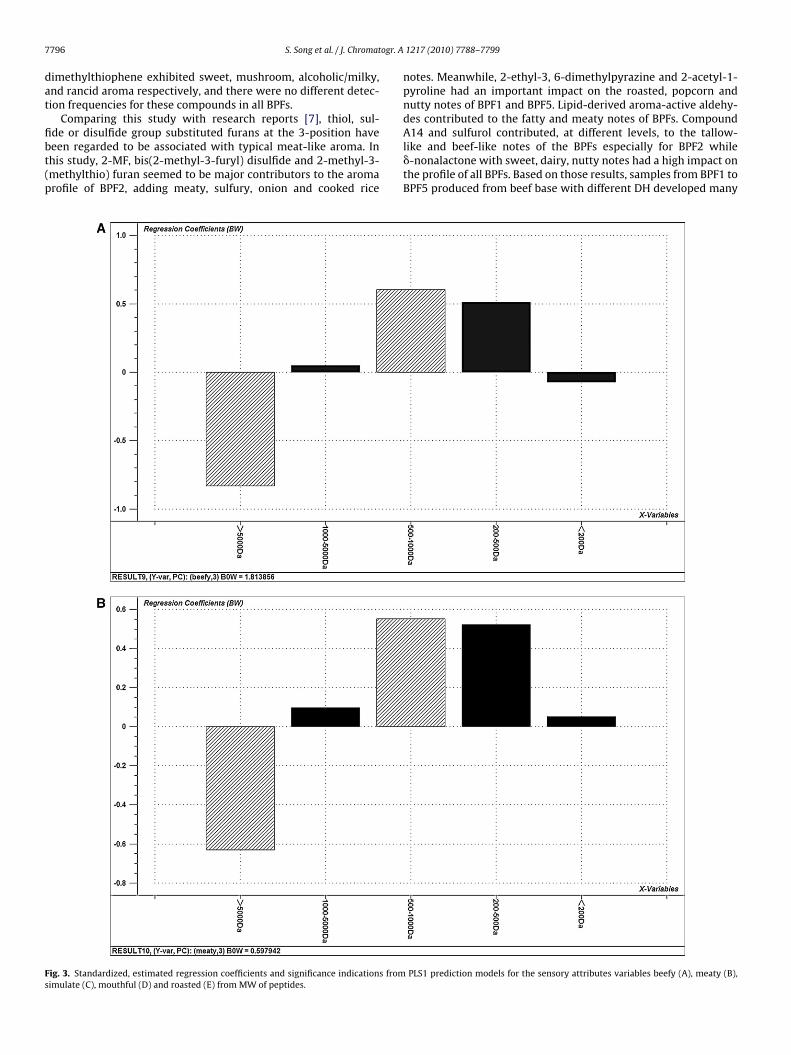
7 ogr. A
dat
fibt(p
Fs
796 S. Song et al. / J. Chromat
imethylthiophene exhibited sweet, mushroom, alcoholic/milky,nd rancid aroma respectively, and there were no different detec-ion frequencies for these compounds in all BPFs.
Comparing this study with research reports [7], thiol, sul-
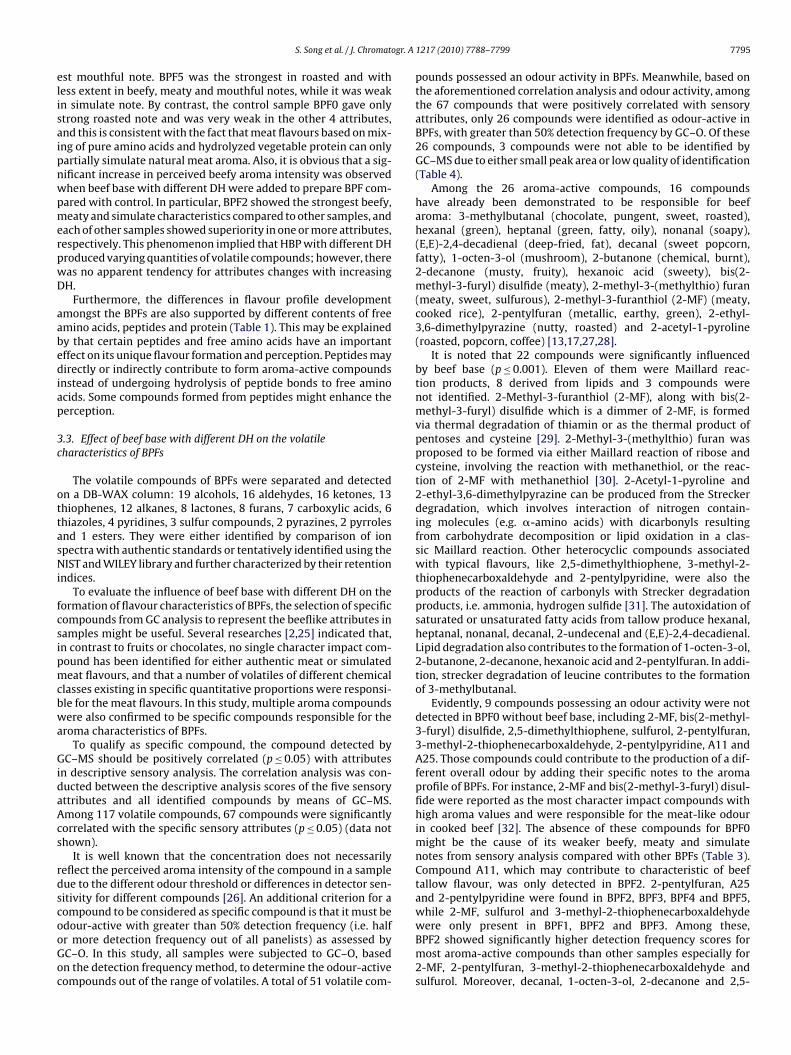
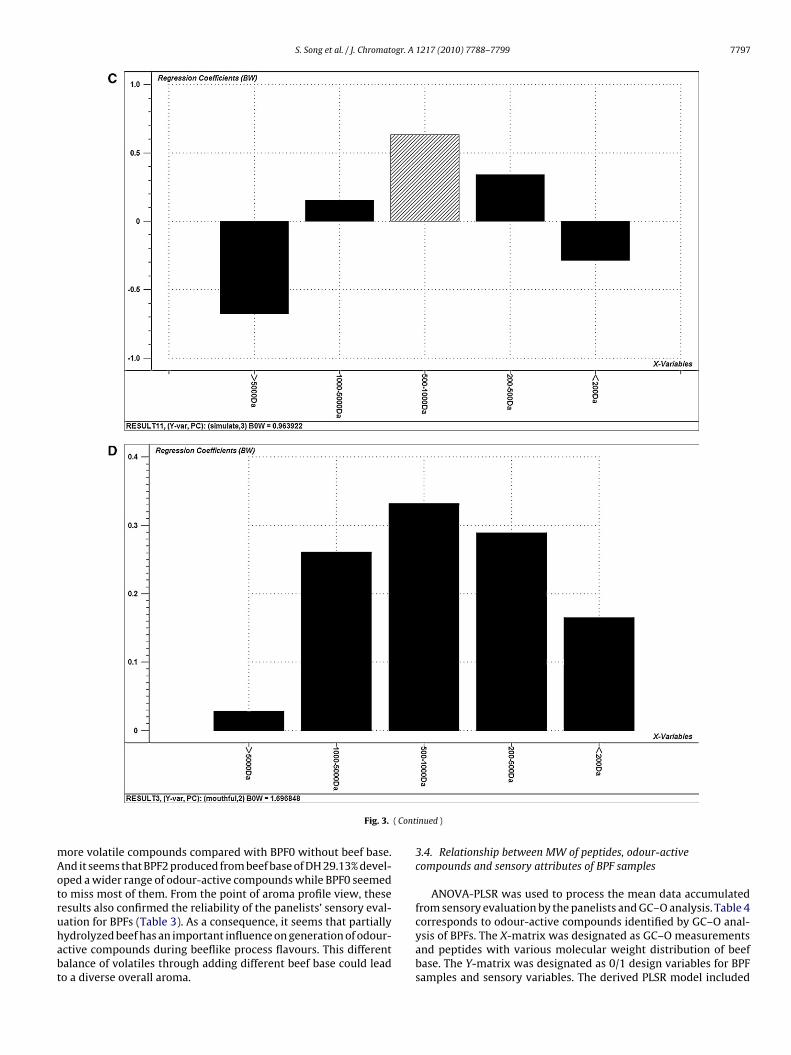
de or disulfide group substituted furans at the 3-position haveeen regarded to be associated with typical meat-like aroma. Inhis study, 2-MF, bis(2-methyl-3-furyl) disulfide and 2-methyl-3-methylthio) furan seemed to be major contributors to the aromarofile of BPF2, adding meaty, sulfury, onion and cooked riceig. 3. Standardized, estimated regression coefficients and significance indications fromimulate (C), mouthful (D) and roasted (E) from MW of peptides.
1217 (2010) 7788–7799
notes. Meanwhile, 2-ethyl-3, 6-dimethylpyrazine and 2-acetyl-1-pyroline had an important impact on the roasted, popcorn andnutty notes of BPF1 and BPF5. Lipid-derived aroma-active aldehy-des contributed to the fatty and meaty notes of BPFs. Compound
A14 and sulfurol contributed, at different levels, to the tallow-like and beef-like notes of the BPFs especially for BPF2 while�-nonalactone with sweet, dairy, nutty notes had a high impact onthe profile of all BPFs. Based on those results, samples from BPF1 toBPF5 produced from beef base with different DH developed manyPLS1 prediction models for the sensory attributes variables beefy (A), meaty (B),
S. Song et al. / J. Chromatogr. A 1217 (2010) 7788–7799 7797
( Cont
mAotruhabt
Fig. 3.
ore volatile compounds compared with BPF0 without beef base.nd it seems that BPF2 produced from beef base of DH 29.13% devel-ped a wider range of odour-active compounds while BPF0 seemedo miss most of them. From the point of aroma profile view, theseesults also confirmed the reliability of the panelists’ sensory eval-
ation for BPFs (Table 3). As a consequence, it seems that partiallyydrolyzed beef has an important influence on generation of odour-ctive compounds during beeflike process flavours. This differentalance of volatiles through adding different beef base could leado a diverse overall aroma.inued )
3.4. Relationship between MW of peptides, odour-activecompounds and sensory attributes of BPF samples
ANOVA-PLSR was used to process the mean data accumulatedfrom sensory evaluation by the panelists and GC–O analysis. Table 4
corresponds to odour-active compounds identified by GC–O anal-ysis of BPFs. The X-matrix was designated as GC–O measurementsand peptides with various molecular weight distribution of beefbase. The Y-matrix was designated as 0/1 design variables for BPFsamples and sensory variables. The derived PLSR model included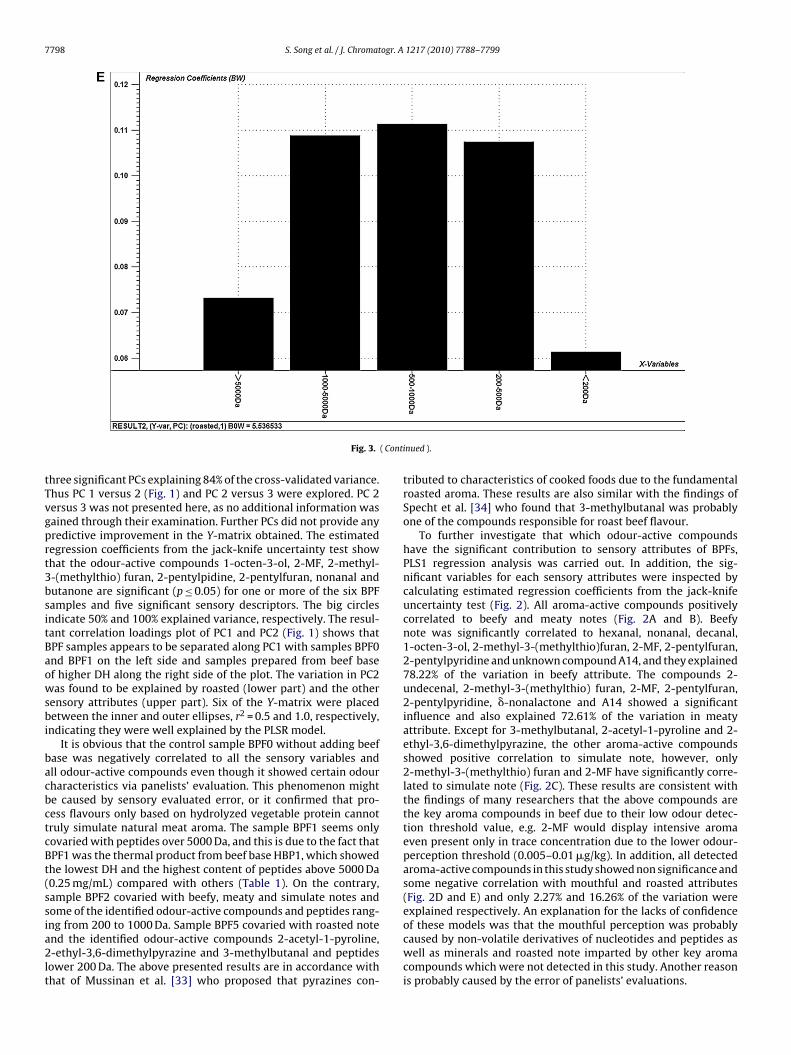
7798 S. Song et al. / J. Chromatogr. A 1217 (2010) 7788–7799
( Conti
tTvgprt3bsitBaowsbi
bacbctcBt(ssia2lt
Fig. 3.
hree significant PCs explaining 84% of the cross-validated variance.hus PC 1 versus 2 (Fig. 1) and PC 2 versus 3 were explored. PC 2ersus 3 was not presented here, as no additional information wasained through their examination. Further PCs did not provide anyredictive improvement in the Y-matrix obtained. The estimatedegression coefficients from the jack-knife uncertainty test showhat the odour-active compounds 1-octen-3-ol, 2-MF, 2-methyl--(methylthio) furan, 2-pentylpidine, 2-pentylfuran, nonanal andutanone are significant (p ≤ 0.05) for one or more of the six BPFamples and five significant sensory descriptors. The big circlesndicate 50% and 100% explained variance, respectively. The resul-ant correlation loadings plot of PC1 and PC2 (Fig. 1) shows thatPF samples appears to be separated along PC1 with samples BPF0nd BPF1 on the left side and samples prepared from beef basef higher DH along the right side of the plot. The variation in PC2as found to be explained by roasted (lower part) and the other
ensory attributes (upper part). Six of the Y-matrix were placedetween the inner and outer ellipses, r2 = 0.5 and 1.0, respectively,
ndicating they were well explained by the PLSR model.It is obvious that the control sample BPF0 without adding beef
ase was negatively correlated to all the sensory variables andll odour-active compounds even though it showed certain odourharacteristics via panelists’ evaluation. This phenomenon mighte caused by sensory evaluated error, or it confirmed that pro-ess flavours only based on hydrolyzed vegetable protein cannotruly simulate natural meat aroma. The sample BPF1 seems onlyovaried with peptides over 5000 Da, and this is due to the fact thatPF1 was the thermal product from beef base HBP1, which showedhe lowest DH and the highest content of peptides above 5000 Da0.25 mg/mL) compared with others (Table 1). On the contrary,ample BPF2 covaried with beefy, meaty and simulate notes andome of the identified odour-active compounds and peptides rang-
ng from 200 to 1000 Da. Sample BPF5 covaried with roasted notend the identified odour-active compounds 2-acetyl-1-pyroline,-ethyl-3,6-dimethylpyrazine and 3-methylbutanal and peptidesower 200 Da. The above presented results are in accordance withhat of Mussinan et al. [33] who proposed that pyrazines con-
nued ).
tributed to characteristics of cooked foods due to the fundamentalroasted aroma. These results are also similar with the findings ofSpecht et al. [34] who found that 3-methylbutanal was probablyone of the compounds responsible for roast beef flavour.
To further investigate that which odour-active compoundshave the significant contribution to sensory attributes of BPFs,PLS1 regression analysis was carried out. In addition, the sig-nificant variables for each sensory attributes were inspected bycalculating estimated regression coefficients from the jack-knifeuncertainty test (Fig. 2). All aroma-active compounds positivelycorrelated to beefy and meaty notes (Fig. 2A and B). Beefynote was significantly correlated to hexanal, nonanal, decanal,1-octen-3-ol, 2-methyl-3-(methylthio)furan, 2-MF, 2-pentylfuran,2-pentylpyridine and unknown compound A14, and they explained78.22% of the variation in beefy attribute. The compounds 2-undecenal, 2-methyl-3-(methylthio) furan, 2-MF, 2-pentylfuran,2-pentylpyridine, �-nonalactone and A14 showed a significantinfluence and also explained 72.61% of the variation in meatyattribute. Except for 3-methylbutanal, 2-acetyl-1-pyroline and 2-ethyl-3,6-dimethylpyrazine, the other aroma-active compoundsshowed positive correlation to simulate note, however, only2-methyl-3-(methylthio) furan and 2-MF have significantly corre-lated to simulate note (Fig. 2C). These results are consistent withthe findings of many researchers that the above compounds arethe key aroma compounds in beef due to their low odour detec-tion threshold value, e.g. 2-MF would display intensive aromaeven present only in trace concentration due to the lower odour-perception threshold (0.005–0.01 �g/kg). In addition, all detectedaroma-active compounds in this study showed non significance andsome negative correlation with mouthful and roasted attributes(Fig. 2D and E) and only 2.27% and 16.26% of the variation wereexplained respectively. An explanation for the lacks of confidence
of these models was that the mouthful perception was probablycaused by non-volatile derivatives of nucleotides and peptides aswell as minerals and roasted note imparted by other key aromacompounds which were not detected in this study. Another reasonis probably caused by the error of panelists’ evaluations.
ogr. A
tacaatsfn1pcprfmcwd1iB
4
ttodfawcasiobtabc
A
S
[[[[[
[
[
[
[
[
[
[
[[[
[[[[
[
S. Song et al. / J. Chromat
Similarly, further studies on the relationships between pep-ides with different molecular weight distribution to the sensoryttributes were carried out by calculating estimated regressionoefficients from the jack-knife uncertainty test (Fig. 3). Peptidesbove 5000 Da had negative impact on beefy, meaty and simulatettributes (Fig. 3A–C), and showed to be significantly correlatedo beefy and meaty notes. The above three attributes also showedtatistically significant and positively related to peptides rangingrom 500 to 1000 Da (Fig. 3A–C), while other peptides had no sig-ificant influences, indicating that peptides ranging from 500 to000 Da might participate in the formation of aroma-active com-ounds of beeflike flavour or intensify the perception of theseompounds associated with beefy, meaty and roasted aroma. Alleptides have been found positively associated with mouthful andoasted attributes; however, there was no significant influenceor the two attributes (Fig. 3D and E). It further explained that
outhful note was indirectly imparted by peptides. Based on theorrelation analysis, it can be noted that beef base with DH 29.13%hich has the lowest contents of peptides above 5000 Da (notetected) and highest contents of peptides ranging from 500 to000 Da (21.04 mg/mL) (Table 1) is a desirable precursor for impart-
ng aroma characteristics of beeflike process flavour, correspondingPF2.
. Conclusions
Beef base is proved to be useful in accentuating or extendinghe basic meat flavour character. Experimental results suggestedhat beef base with five different DH showed significant impactn aroma characteristics of BPF compared with control throughescriptive sensory analysis. Beeflike process flavours preparedrom different beef base showed superiority in one or morettributes, respectively. In particular, sample added beef baseith DH 29.13% showed the strongest beefy, meaty and simulate
haracteristics. Further investigation for six BPFs based on aroma-ctive compounds assessed by GC–O. Twenty six compounds wereelected as specific compounds to represent beef odour. Resultsndicated that beef base with DH 29.13% gives the developmentf a wider range of odour-active compounds compared with othereef base, while sample without beef base seemed to miss most ofhem. Meanwhile, PLSR analysis between MW of peptides, odour-ctive compounds and sensory attributes clearly showed that beefase with DH 29.13% was a desirable precursor for imparting aromaharacteristics of BPF.
cknowledgments
The research was supported in part by National Naturalcience Foundation of China 31071602, Innovation Fund for
[[[[[
1217 (2010) 7788–7799 7799
Technology Based Firms 10C26213200976 and a grant fromSKLF-TS-200813.
Appendix A. Supplementary data
Supplementary data associated with this article can be found, inthe online version, at doi:10.1016/j.chroma.2010.10.046.
References
[1] M.H. Hill, Flavour Ind. 4 (1973) 164.[2] F. Shahidi, L.J. Rubin, L.A. D’Souza, Crit. Rev. Food Sci. Nutr. 24 (1986) 141.[3] Y.F. Wu, K.R. Cadwallader, J. Agric. Food Chem. 50 (2002) 2900.[4] X.F. Gao, S.J. Tian, D.M. Small, Food Chem. 119 (2010) 167.[5] R. Zamora, F.J. Hidalgo, Crit. Rev. Food Sci. Nutr. 45 (2005) 49.[6] S.N. Ko, S.H. Yoon, S.K. Yoon, W.J. Kim, Korean J. Food Sci. Technol. 29 (1997)
827.[7] H.H. Baek, C.J. Kim, B.H. Ahn, H.S. Nam, K.R. Cadwallader, J. Agric. Food Chem.
49 (2001) 790.[8] K. Pommer, Cereal Foods World 40 (1995) 745.[9] J. Scheide, Germ. Pat. DE-OS 2335464, 1973.10] L.C. Chhuy, A.E. Day, US-PS 4081565, 1974.11] H.L. Song, L.J. Xia, Flavour Fragr. J. 23 (2008) 185.12] B. Lieske, G. Konrad, Food Rev. Int. 10 (1994) 287.13] S. Rochat, A. Chaintreau, J. Agric. Food Chem. 53 (2005) 9578.14] B. D’Acampora Zellner, P. Dugo, G. Dugo, L. Mondello, J. Chromatogr. A 1186
(2008) 123.15] S.Q. Song, X.M. Zhang, K. Hayat, C.S. Jia, S.Q. Xia, F. Zhong, Z.B. Xiao, H.X. Tian,
Y.W. Niu, Food Chem. Food Chem. 124 (2011) 203.16] A.O.A.C., Official Methods of Analysis, 16th ed., Horowitz, Washington DC, USA,
1995, Ch. 12, p. 7.17] X.H. Lan, P. Liu, S.Q. Xia, C.S. Jia, D. Kunzi, X.M. Zhang, W.S. Xia, Z.B. Xiao, H.X.
Tian, Food Chem. 120 (2010) 967.18] ISO-8586-1, International Standard 8586-1, Sensory Analysis-Methodology-
Feneral Guidance for the Selection, Training and Monitoring of Assessors[Ref. no. ISO 8586-1:1993(E)], International Organisation for Standardisation,Geneva, Switzerland, 1993.
19] ISO-8589, International Standard 8589, Sensory Analysis-General Guidance forthe Design of Test Rooms [Ref. no. ISO 8589:2007(E)], International Organisa-tion for Standardisation, Geneva, Switzerland, 2007.
20] M. O’Mahony, S.R. Tannenbaum, P. Walstra, Fixed-and Random-Effects Models.Sensory Evaluation of Food-Statistical Methods and Procedures, Marcel Dekker,Inc., New York and Basel, 1986, pp. 247–257.
21] S.Q. Song, X.M. Zhang, K. Hayat, C.S. Jia, S.Q. Xia, F. Zhong, Z.B. Xiao, H.X. Tian,Y.W. Niu, Sens. Actuators B 147 (2010) 660.
22] T. Hofmann, P. Munch, P. Schieberle, J. Agric. Food Chem. 48 (2000) 434.23] R. Griffith, E.G. Hammond, J. Dairy Sci. 72 (1989) 604.24] Y.G. Zhang, B. Dorjpalam, Chi-Tang Ho, J. Agric. Food Chem. 40 (1992)
2467.25] S.Y. Moon, M.A. Cliff, E.C.Y. Li-Chan, Food Res. Int. 39 (2006) 294.26] S.Y. Moon, E.C.Y. Li-Chan, Food Res. Int. 40 (2007) 1239.27] S. Rochat, J-Y.S. Laumer, A. Chaintreau, J. Chromatogr. A 1147 (2007) 85.28] D. Machiels, S.M. van Ruth, M.A. Posthumus, L. Istasse, Talanta 60 (2003)
755.29] F.B. Whitfield, D.S. Mottram, S. Brock, D.J. Puckey, L.J. Salter, J. Sci. Food Chem.
42 (1988) 261.30] D.S. Mottram, F.B. Whitfield, J. Agric. Food Chem. 43 (1995) 1302.31] R. Zamora, M. Alaiz, F.J. Hidalgo, J. Agric. Food Chem. 48 (2000) 3152.32] R. Kerscher, W. Grosch, Z. Lebensm, Unters. Forsch. 204 (1997) 3.33] C.J. Mussinan, R.A. Wilson, I. Katz, J. Agric. Food Chem. 21 (1973) 871.34] K. Specht, W. Baltes, J. Agric. Food Chem. 42 (1994) 2246.
Related Documents