1 CONTRACTILE PROPERTIES, STRUCTURE AND PHENOTYPE OF INTACT AND REGENERATING SLOW-TWITCH MUSCLES OF MICE TREATED WITH CYCLOSPORIN A A. Irintchev, M. Zweyer, R. N. Cooper*, G. S. Butler-Browne* and A. Wernig Department of Physiology, Neurophysiology, University of Bonn, Wilhelmstraße 31, D-53111 Bonn, Germany and * CNRS UMR 7000, Cytosquelette et Développement, Hôpital Pitié-Salpêtrière, 105, Blvd. de hôpital, 75013 Paris, France Running title: Cyclosporine effects on muscle Key words: Skeletal muscle, Cyclosporin A, Regeneration Correspondence and proofs to: Prof. Dr. Anton Wernig, Physiologisches Institut der Universität Bonn, Wilhelmstraße 31, D-53111 Bonn, FRG Tel.: +49 228 287 2274 Fax: +49 228 287 2208 E-mail: [email protected]

Welcome message from author
This document is posted to help you gain knowledge. Please leave a comment to let me know what you think about it! Share it to your friends and learn new things together.
Transcript
1
CONTRACTILE PROPERTIES, STRUCTURE AND PHENOTYPE
OF INTACT AND REGENERATING SLOW-TWITCH MUSCLES
OF MICE TREATED WITH CYCLOSPORIN A
A. Irintchev, M. Zweyer, R. N. Cooper*, G. S. Butler-Browne* and A. Wernig
Department of Physiology, Neurophysiology, University of Bonn,
Wilhelmstraße 31, D-53111 Bonn, Germany
and
* CNRS UMR 7000, Cytosquelette et Développement,
Hôpital Pitié-Salpêtrière, 105, Blvd. de µhôpital, 75013 Paris, France
Running title: Cyclosporine effects on muscle
Key words: Skeletal muscle, Cyclosporin A, Regeneration
Correspondence and proofs to:
Prof. Dr. Anton Wernig,
Physiologisches Institut der Universität Bonn,
Wilhelmstraße 31, D-53111 Bonn, FRG
Tel.: +49 228 287 2274
Fax: +49 228 287 2208
E-mail: [email protected]
2
SUMMARY
1. We have studied the contractile properties, structure, fibre type composition and myosin heavy
chain (MyHC) expression pattern of regenerating and intact soleus muscles of adult CBA/J mice
treated with Cyclosporin A (CsA, 50 mg kg-1 day-1 s.c.) or vehicle solutions (Cremophor, saline).
2. After 4-7 weeks of drug application, as compared to vehicle treatment, the isometric contractile
force of intact muscles was reduced (tetanus, -21%, twitch, -34%) despite normal mass and
muscle cross-sectional area. The frequency of fast-twitch fibres was increased whereas innervation
deficits, histopathological alterations or changes in fibre numbers were not observed.
3. Regeneration after cryolesion of the contralateral soleus appeared to proceed more slowly, as
estimated from histological sections, in CsA- than in vehicle-treated animals. Despite this, when
muscle properties reached mature levels (4-7 weeks) muscle mass recovery was better (30%
higher weight, 50% more fibre profiles in cross-sections). Deficient was force production per unit
cross-sectional area but not maximum tension. Twitch time to peak and half-relaxation time were
shorter than control correlating with a predominancy of fast-twitch fibres (98% type II fibres
versus 16-18% in control muscles) and fast MyHC isoforms.
4. Partial reversal of this fast phenotype, as well as an increase in muscle force, were observed when
the animals were left to recover without treatment for 5-8 weeks after CsA application over 7
weeks. The high numbers of fibre profiles in CsA-treated regenerated muscles and increased mass
remained unchanged after withdrawal.
5. The results show that CsA treatment has a hyperplastic effect on regenerating muscles. The
increase in the proportions of fast fibres, much more prominent in regenerated muscles, is most
likely due to direct drug influence on signal transduction mechanisms. The reason for impairment
of force production during drug application have to be elucidated.
3
INTRODUCTION
During the last two decades Cyclosporin A (CsA) has been one of the most important
immunosupressive drugs used for clinical prevention of transplant rejection as well as therapy of
various diseases. Despite the rapid progress which has been made in the discovery of new
immunosuppressive strategies and drugs in the last years, its clinical significance has not apparently
diminished (Weinblatt, 1999; Linden & Weinstein, 1999; Ponticelli & Tarantino, 1999; Billaud,
2000). Major mechanisms of action of CsA have been identified, which have helped explain both
desired (immunosuppressive) and undesired (adverse) tissue effects (Ruhlmann & Nordheim,
1997; Resch & Szamel, 1997; Olyaei et al., 1999; Matsuda & Koyasu, 2000). Research on the
action of this drug on skeletal muscle has however remained in the background for a considerable
period of time most likely because the side effects of CsA administration have rarely been
associated with skeletal muscle. In a limited number of cases myopathic complications were
attributed to CsA, however this assumption was difficult to prove clinically because of the usual
multi-drug management of the patients (Breil & Chariot, 1999). A more common clinical
observation was the decreased exercise performance of transplant patients (Savin et al., 1980;
Kavanagh et al., 1988; Jensen et al., 1991). This deficit was thought to be related to the skeletal
muscles response to the immunosuppressive treatment since mitochondrial respiration is impaired,
and muscle capillary density and endurance are reduced in CsA-treated individuals (Hokanson et
al., 1995; Mercier et al., 1995; Lampert et al., 1996; Biring et al., 1998). Another interesting
clinical observation is that, for unknown reasons, muscle force improves transiently in Duchenne
muscular dystrophy patients during CsA administration (Sharma et al., 1993; Miller et al., 1997).
Also in cases of inflammatory myopathies (polymyositis or dermatomyositis) CsA, in combination
with corticosteroids, appears to be beneficial (Vencovsky et al., 2000).
Apart from its clinical value, CsA is also useful as a pharmacological agent in studies on
4
signal transduction pathways. It inhibits transcriptional activation mediated through the calcineurin
/ nuclear factor of activated T lymphocytes (NFAT) pathway (Guerini, 1997; Rao et al., 1997;
Matsuda & Koyasu, 2000). Recently, it was found that NFAT is present and functional in skeletal
muscle (Abbott et al., 1998). In addition, inhibition of its nuclear translocation by CsA leads to
an impairment of myogenic differentiation (Abbott et al., 1998). Other investigations have
identified a role of the calcineurin / NFAT-dependent pathway in controlling MyHC expression
(Chin et al., 1998). CsA application in vivo induces a slow-to-fast transformation of muscle fibres
indicating that calcineurin activation is required for slow MyHC expression. Control of the slow
muscle phenotype through the calcineurin pathway is not restricted to MyHC but involves
phenotype-specific expression of other proteins such as sarcoplasmic reticulum ATPase and
cytosolic creatine kinase (Bigard et al., 2000). Furthermore, CsA has been found to inhibit skeletal
muscle hypertrophy caused by overload through calcineurin inhibition (Musaro et al., 1999; Dunn
et al., 1999; Semsarian et al., 1999). However, muscles of transgenic mice which express activated
calcineurin are not hypertrophic even though the number of slow muscle fibres is increased
(Musaro et al., 1999; Naya et al., 2000). This finding indicates that activation of additional
pathways is required for hypertrophy but not for phenotype control.
These previous studies indicate the skeletal muscle-specific effects of CsA in vivo. This
warrants, both from a clinical and cell biological point of view, studies designed to evaluate and
correlate the consequences of CsA treatment on skeletal muscle at the level of function, structure
and fibre diversity, aims of the work reported in this article. We have restricted our observations
to one muscle, the slow-twitch soleus, but have extended our study to both intact and regenerating
adult muscles. The effects of chronic CsA administration were studied during regeneration /
treatment periods ranging from 1 to 7 weeks. The results presented here show significant CsA
effects on muscle contractility and MyHC expression, as well as time course and efficiency of

5
muscle regeneration. A preliminary report of this work has been publshed as an abstract (Irintchev
et al., 1999).
6
MATERIAL AND METHODS
Animals
Female CBA/J mice aged 2 months were purchased from Charles River Deutschland
(Sultzfeld, Germany) and kept in a conventional animal unit. Upon arrival, the animals were
allowed to recover from transportation and adapt to the conditions in the unit for 2-3 days. After
that they were divided at random into three groups, one receiving CsA and two - vehicle solutions
(see below). A total of 90 animals was used in these experiments.
Drug treatment
In one group of animals, CsA (SandimmunR, Sandoz, Nürnberg, Germany, diluted 1:9 with
physiologic saline) was administered once a day subcutaneously at a dose of 50 mg kg-1 body
weight (10 µl diluted SandimmunR per g body weight). This dosage is immunosuppressive in the
mouse and we have used it successfully in previous experiments (Irintchev et al., 1995; Wernig
et al., 1995). Another experimental group received injections of saline solution containing the
vehicles in SandimmunR, polyoxyethylated castor oil (Cremophor EL, Sigma, Deisenhofen,
Germany) and ethanol. The concentrations of Cremophor and ethanol were similar to those
present in the diluted SandimmunR solution (650 and 278 mg ml-1, respectively). The mice
received 10 µl of this solution per gram body weight. The third group of animals were injected
with physiologic saline (10 µl g-1). All animals were weighed prior to each injection.
Treatment with CsA, but not with vehicle solutions, had visible side effects. There was loss
of body mass (see Results). The excrements were often, especially in the first days of treatment,
yellowish and had soft consistency. The pelt gradually acquired a shaggy appearance and pelt
colour changed from agouty to white in circumscribed areas. Although most animals tolerated the
immune suppression without special care some died (mortality rate about 10%). The reason(s) for
the lethality were not investigated.
7
Experimental design
In one set of experiments, the aim was to evaluate the effects of continuous CsA treatment
over several weeks on the physiological properties and morphological features of intact and
regenerating muscles. For this purpose, left (intact) and right soleus muscles (regenerated after
cryolesion) were studied 4 - 7 weeks after injury, a time period sufficient for muscle recovery and
manifestation of drug effects. CsA application was initiated 8 days prior to surgery to achieve
intracellular drug accumulation and presumably steady-state levels during the recovery period
(Irintchev et al., 1995; Wernig et al., 1995). To dissociate CsA effects, other animals were treated
with a saline solution containing the vehicles of the CsA preparation used (see above). Finally, to
control for vehicle effects, some of the animals were treated with physiologic saline alone. In view
of initial results, and in order to the study the dynamics of the induced effects, this experimental
set was later supplemented with animals studied after recovery period of 1 - 4 weeks.
The goal in the second experimental set was to evaluate the reversibility of the drug-
induced functional and structural alterations after discontinuation of treatment. In this case, the
animals were systemically treated as above for 1 week prior to and 7 weeks following surgery after
which application of CsA, vehicles or saline was discontinued. Muscles were studied 12 - 15
weeks after muscle injury, i.e. 5 - 8 weeks after withdrawal.
Surgery for induction of muscle regeneration
The animals were anaesthetised by intraperitoneal injections of 0.4 mg kg-1 fentanyl
(Fentanyl-Janssen, Janssen, Neuss, Germany), 10 mg kg-1 droperidol (Dehydrobenzperidol,
Janssen) and 5 mg kg-1 diazepam (Valium 10 Roche, Roche, Grenzach-Wyhlen, Germany) and the
right soleus muscles were surgically exposed. The injury consisted of a single freeze-thaw cycle
of the muscle in situ. Freezing was performed by applying the flat end (3 x 0.7 mm) of a copper
rod precooled in liquid nitrogen to the surface of the mid-portion of the muscle and maintaning
8
it in this position for 10 s. After thawing of the muscles, the wounds were closed with polyamide
threads (7-0 Ethilon, Ethicon, Norderstedt, Germany) and thereafter the animals were kept for
several hours on a warm plate (37°C) to prevent hypothermia. Previous work has shown that
spontaneous recovery of muscle structure and function after this injury is good (Wernig &
Irintchev, 1995; Wernig et al. 1995; , Irintchev et al. 1995, 1997a).
Isometric force measurements
The isometric contractile properties of the regenerated and intact contralateral soleus
muscles were studied in vitro according to an established protocol (for a recent description see
Wernig et al., 2000). Briefly, the muscles with the intact nerve supply were surgically removed
from anaesthesised animals (see above) after which the mice were killed by cervical dislocation.
The nerve-muscle preparations were mounted in a horizontal LuciteR chamber containing Tyrode’s
solution (composition in mM: NaCl, 125; MgCl2, 1; CaCl2, 1.8; KCl, 5.4; NaHCO3, 24; and
glucose, 10). The chamber was continuously perfused with the aerated (95% v/v O2, 5% v/v CO2)
and heated (25°C) physiologic solution. Tension was recorded with a transducer carrying two
strain gauges (DMS LY41 1,5/350, Hottinger Baldwin Messtechnik, Darmstadt, Germany).
Force measurements were performed at optimal muscle length. Muscles were stimulated
directly with suprathreshold electrical pulses via silver electrodes in the bath (direct stimulation,
pulses of 0.5 ms duration, typically 20-25 V) or via nerve with a suction electrode (indirect
stimulation, 0.1 ms pulse duration, 3-6 V). The variables measured were isometric twitch and
tetanic (20, 50 and 100 Hz for 2 seconds) force, twitch time to peak (contraction time) and twitch
half-relaxation time. For each stimulation frequency, muscles were stimulated first directly and
then indirectly. Between two stimulations, muscles were allowed to recover for three minutes.
After these recordings, acetylcholine (ACh) sensitivity was tested by rapid exchange of the normal
perfusion solution with Tyrode’s solution containing 0.2 mM ACh perchlorate. The amplitude of
9
the ACh-evoked contracture was expressed as a fraction of the amplitude of the preceding direct
100-Hz tetanus.
After the force recordings, the muscles were weighed and frozen at resting length on pieces
of liver as described previously (Irintchev et al., 1997a). Twitch-tetanus ratio was calculated from
the twitch and maximum tetanic force. Tetanic force was normalised per unit wet muscle weight
(P0/muscle weight) or unit muscle cross-sectional area. The mean rate of rise of the twitch was
calculated from twitch force and twitch contraction time.
Histology
Stainings were performed on transverse sections (6 µm) from the mid-portion (end-plate
region) of the muscles. Unfixed sections were stained with aqueous Toluidine blue-borax solution
(both at 1% w/v) to reveal the general morphology. Calcium accumulations were visualised using
glyoxal-bis-(hydroxyanyl) and Alizarine Red S stains. For muscle fibre typing (see quantitative
analysis below), histochemical stainings for myofibrillar ATPase activity were performed after acid
(pH 4.3 or 4.65) or alkaline preincubation (pH 10.3) of the sections (modified after Guth &
Samaha, 1970; Irintchev et al., 1990; Wernig et al., 1990). Macrophages were visualised by
histochemical detection of lysosomal acid phosphatase activity according to the modified
azocoupling method of Lojda using naphthol-AS-TR-phosphate (Sigma) as substrate (Lojda et
al., 1976). Existence of immature muscle cells (myoblasts, myotubes, immature fibres) in
regenerated muscles beyond 4 weeks post-injury was monitored by immunostainings of two
developmentally regulated molecules, the neural cell adhesion molecule (NCAM, mouse
monoclonal antibody, clone H-28, Hirn et al., 1981) and the embryonic form of myosin heavy
chain molecule (MyHC, mouse monoclonal antibody F1.652, CRL-2039, American Type Culture
Collection, ATCC, Manassas, Virginia, USA), in conjunction with morphological criteria like cell
diameter and basophilia (Toluidine blue staining). Expression of mature isoforms of MyHC was
10
studied by monoclonal mouse antibodies against slow (clone A 4.951, CRL-2046, ATCC), fast
IIA (clone A4.74, CRL-2041, ATCC) and fast/neonatal isoforms (N 3-36, CRL 2042, ATCC).
For immunofluorescence stainings, methanol-fixed sections were overlaid with normal goat
serum (20 % v/v in PBS) for 30 min and then incubated overnight at 4°C with primary antibodies
diluted in PBS containing 0.7% w/v lambda-carrageenan (Sigma) and 0.02% w/v sodium azide.
After washing in PBS, the first antibody was visualised with 5-((dichlorotriazin-2-yl)amino)-
fluorescein (DTAF)-IgG raised against the appropriate species, or with biotinylated IgG and
DTAF- or rhodamine-conjugated streptavidin. Secondary antibodies and conjugates were
purchased from Jackson ImmunoResearch Laboratories (Dianova, Hamburg, Germany).
Electrophoretic analysis of myosin isoform expression
Proteins were extracted from muscle samples using four volumes of 0.3 M NaCl, 0.1M
NaH2PO4, 0.01 M sodium pyrophosphate, 1 mM MgCl2, 10 mM EDTA and 1.4 mM 2-
mercaptoethanol, adjusted to pH 6.5. Separation of MyHC isoforms was performed in 8%
polyacrylamide gels containing 30% glycerol as previously described (Agbulut et al., 1996).
Muscle extracts (20µl per lane) were loaded into minigels fixed in Mini-PROTEAN II dual slab
cell (Bio-Rad, München, Germany). The electrophoresis buffer was composed of 20 mM sodium
pyrophosphate (pH 8.5), 1 mM EDTA and 1.4 mM 2-mercaptoethanol. During electrophoresis
the temperature of the buffer was maintained at 5°C in a refrigerator. For protein separation,
current (72 V) was applied for 30-31 hours. The gels were then stained with silver nitrate solution
(0.2% w/v).
Quantitative procedures
Total numbers of muscle fibre profiles, numbers of different fibre type, muscle cross-
sectional area and muscle fibre diameters were evaluated on videoprint reconstructions of
complete muscle cross-sections stained for myofibrillar ATPase activity after acid (pH 4.3) pre-
11
incubation of the sections (final magnification 244x for total cross-sectional area, 610x for the
other parameters) as described previously (Irintchev et al., 1990; Wernig et al., 1990). For fibre
type analysis, the staining pattern in the print reconstruction (Type I fibres dark, Type II fibres
pale) was compared with the reversed staining pattern (Type I pale, Type II dark) in a section
stained for myofibrillar ATPase after alkaline preiincubation (pH 10.3). In addition to Type I and
II fibres, Type IIc fibres were identified by their intermediate staining intensity after both pre-
incubations. Mean orthogonal diameters (mean of the longest axis and a short one passing through
the middle of the longest at right angle) were measured using a digitizing tablet. All fibres in a
muscle section were evaluated, except for diameter measurements of occasional mechanically
damaged muscle fibres.
Statistical analysis
Multiple comparisons of group mean values were performed with ONEWAY analysis of
variance and a subsequent Tukey's test to compare mean values of more than two experimental
groups using SigmaStat 2.0 statistical software package (SPSS Europe, Erkrath, Germany). Mean
values of two groups were compared with Student´s t test. The accepted level of significance was
0.05 or less. Unless otherwise indicated, mean group values are given with standard deviations.
12
RESULTS
Body weight
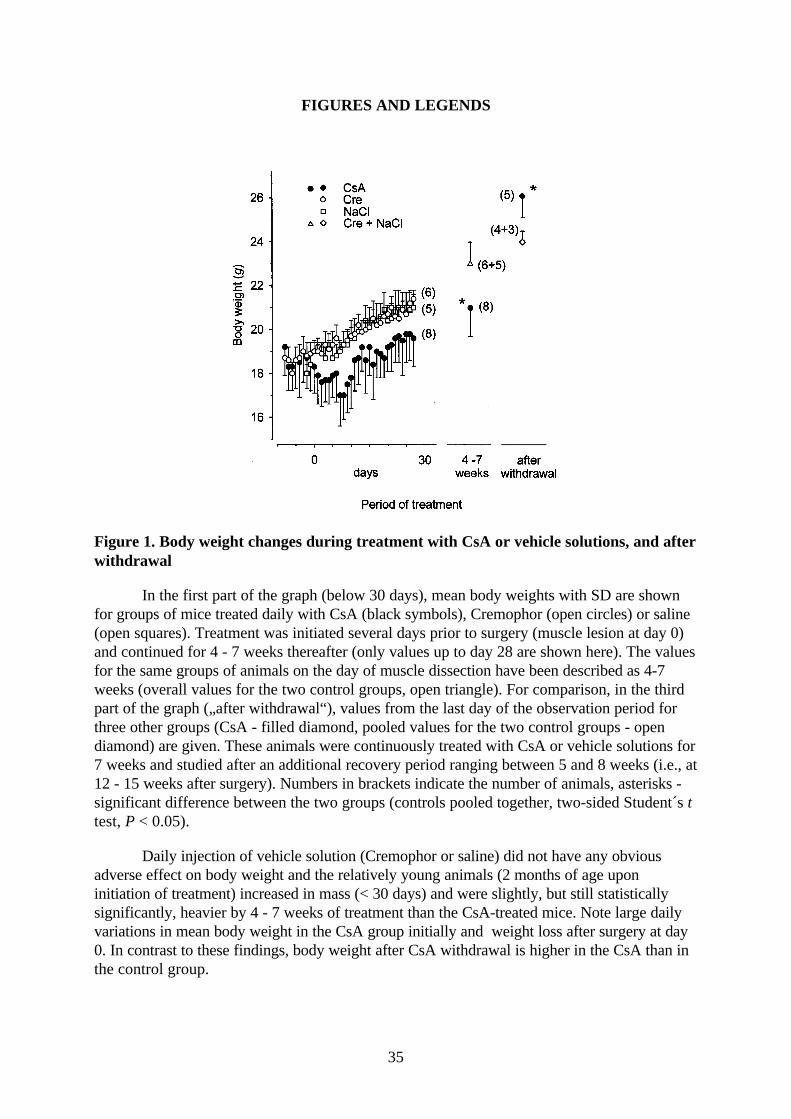
CsA- but not saline- or Cremophor-treated animals lost body weight during the first two
and a half weeks of treatment (Fig. 1, drug or vehicle treatment initiated 8 days before surgery at
day 0). Following this initial loss, body weight increased at a rate similar to control mice (Fig. 1,
left half < 30 days). The daily fluctuations in mean body weight and coefficients of variation were
larger in the immunosuppressed than in the control groups (Fig. 1). At the time when muscle
contractile properties were evaluated (4 - 7 weeks, Fig. 1), the mean body weight of CsA-treated
animals was about 10% lower than in the control groups (P < 0.05, Student´s t test). Reduced
body weight gain has been previously observed in rats treated with a high dose of CsA (25 mg kg-1
day-1 per os, Richter-Reichhelm & Schulte, 1998). This effect of CsA on body weight can be
attributed to a systemic toxicity (see Materials and Methods).
In another group of mice studied after CsA treatment (7 weeks) and withdrawal period of
5 - 8 weeks (Fig. 1, “after withdrawal”) mean body weight was, in contrast to the previous group,
10% higher than in control animals (P < 0.05, Student´s t test). The reason for this difference is
not known.
Isometric contractile properties during drug application
Intact muscles
Soleus muscle mass was not affected by the CsA treatment (Table 1, upper half). The mean
ratio of muscle weight / body weight (0.49 ± 0.12 mg g-1, n = 8) was similar to that of the control
groups (overall mean 0.42 ± 0.03, n = 11, n.s., Mann-Whitney rank sum test). Despite normal
muscle mass, the maximum force produced following twitch or tetanic stimulation were
significantly lower (-21%) than in control muscles (Table 1). Force generation per unit cross-
sectional area (Specific force in Table 1) or wet muscle weight (P0 / muscle weight in Table 1)
13
were, on average, 25% lower than control values (P < 0.05 for both parameters, t test, CsA-
treated versus pooled control group). The twitch time-to-peak was shortened proportionally to
the reduction in twitch amplitude and the mean rate of rise of the twitch was not different from
that in control animals (Table 1). Twitch half-relaxation time was also unchanged. Tetanic and
twitch forces developed upon nerve stimulation (not shown) were similar in amplitude to those
upon direct stimulation (Table 1) in all three animal groups. This was further supplemented by the
finding of weak muscle contractures upon ACh application (Table 1), an indication for low
numbers of extrasynaptic ACh receptors characteristic for normally innervated muscle.
Regenerated muscles
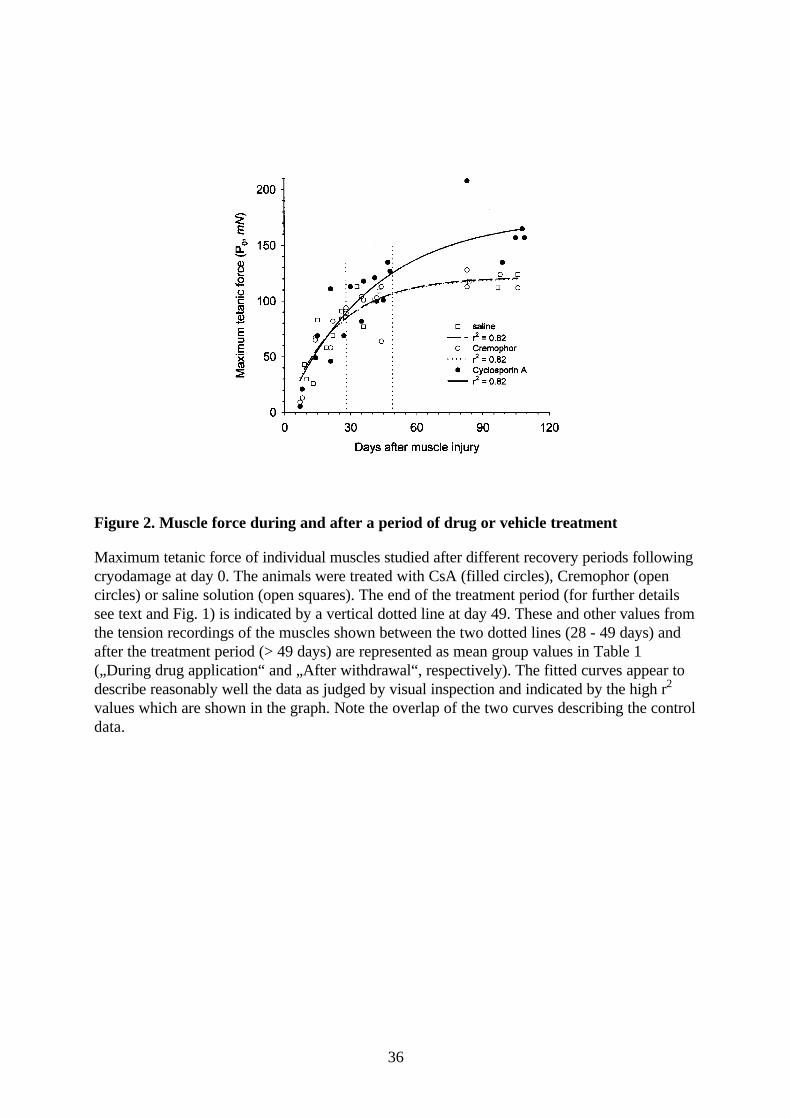
As judged from maximum force, 4 to 7 weeks after operation the injured muscles of drug-
treated mice behaved as well as control muscles (Table 1, Fig. 2). Muscle mass at 4-7 weeks of
regeneration was on average 40% higher than control values but specific force was low (Table 1).
Regenerated muscles of immunosuppressed animals had shorter twitch time to peak than any other
group of muscles (Table 1). This was due to an increased rate of rise of the twitch and not simply
to reduced twitch force, as compared to intact muscles, which was the case in the regenerated
control muscles (Table 1). This finding correlates with the observed slow-to-fast transformation
in CsA-treated muscles (see below). Half-relaxation time of CsA-treated and control regenerated
muscles did not differ. Both ACh sensitivity (Table 1) and nerve-evoked muscle contractions (data
not shown) were normal.
Contractile properties after transient immunosuppression
Five to eight weeks after discontinuation of drug application force generation in the intact
muscles of immunosuppressed animals was largely improved, as compared to continuously treated
muscles and no difference was present between the solei of the treated and untreated animals any
more (Table 1). These findings indicate that the drug-induced changes in the function of intact
14
muscles are reversible. A similar improvement in the tetanic force was observed in regenerated
muscles after CsA withdrawal (Table 1, Fig. 2). Maximum tetanic tension was now similar to
intact control muscles and exceeded by nearly 40% that of regenerated control muscles. Similar
to the period of drug application, the mass of the CsA-treated muscles was approximately one-
third higher than that of control regenerated muscles (Table 1, significant in t test). Contraction
time was prolonged when compared to the period of drug application but it was still significantly
shorter than in the other groups (Table 1). This correlates with the partial reversal of the drug-
induced fibre type transformation (see below). Thus, as estimated in vitro, the transient treatment
with CsA was beneficial in eliminating functional deficits consistently observed after cryodamage
(Table 1, regenerated versus intact control muscles, see also Wernig et al., 1995; Wernig &
Irintchev, 1995; Irintchev et al., 1997a; 1997b).
Histological features and analysis of MyHC isoforms
Muscle cross-sectional area
In the 4 control groups of animals regenerated muscles had, on average, smaller cross-
sectional areas than the intact contralateral solei (15 - 44% deficit, Cremophor and saline, during
application and after withdrawal, Table 2). Force production correlated well with these deficits
(see specific force in Table 1). In contrast, cross-sectional areas of CsA-treated muscles were
larger than that in both control regenerated and contralateral muscles (Table 2). However, this was
associated with an increased force production only after CsA withdrawal (Table 1). Increase in
muscle girth was obviously due to the formation of larger numbers of fibres and/or more extensive
branching in the regenerated fibres (see Numbers of fibre profiles) as well as persistence of dead
muscle fibre remnants (see Other histological observations). It should be noted that, intact
muscles treated continuously with CsA had cross-sectional areas similar to the control intact
muscles (Table 2, during application) but produced lower forces (Table 1).
15
Numbers of fibre profiles
Muscle cross-sections from the endplate regions of intact muscles contained similar
numbers of fibre profiles irrespective of the type of treatment or the period of observation (Table
2). In accordance with previous results, the number of fibre profiles in regenerated control muscles
were higher than in intact muscles (Table 2, Wernig et al., 1990; 1991a). This is obviously due to
abnormalities in muscle fibre architecture (split and branched fibres) commonly present in
regenerated muscles (Irintchev & Wernig, 1987; Wernig et al., 1990). The number of profiles in
regenerated muscles of immunosuppressed animals by far exceeded those in all other groups
(Table 2). No distinction has been made between true and/or pseuso-hyperplasia (increase in
number of profiles as a result of new fibre formation and due to the presence of split/branched
fibres, respectively).
Histochemical analysis of fibre phenotypes
Fibre type composition of intact control muscles were similar to those previously reported
for soleus muscles of untreated CBA/J mice (Table 2, upper and lower part, Wernig et al., 1990).
In regenerated control muscles there was a significant increase in the percentage of Type I fibres
when compared to intact controls, and, initially (at 4-7 weeks post-injury), of intermediate (Type
IIc) fibres; accordingly the numbers of Type II fibres were reduced (Fig. 3C, Table 2). Such
changes in fibre type frequencies after muscle injury and regeneration have been previously
observed in both mouse (Irintchev & Wernig, 1987; Wernig et al., 1990; 1991b) and rat (Whalen
et al., 1990) soleus muscles. In regenerated muscles of immunosuppressed animals a nearly
complete transformation in the opposite direction was present at 4-7 weeks after injury with 98%
of the profiles staining histochemically as Type II fibres (Fig. 3A, Table 2, upper part). A moderate
increase in the percentage of Type II fibres was also found in the intact CsA-treated muscles
(Table 2, upper half, Fig. 3B). These changes were reversed to a large extent after drug
16
withdrawal but regenerated muscles still contained many more Type II profiles than regenerated
control muscles (Fig. 3D, Table 2, lower half). The increased frequency of undifferentiated (Type
IIc) fibres in regenerated control muscles 4 - 7 weeks after injury, and in regenerated CsA-treated
muscles after drug withdrawal (Table 2) is probably due to ongoing fibre type transformation.
Sections from regenerated and intact muscles of CsA-treated animals (4-7 weeks after
injury, n = 4) and appropriate control animals (Cremophor treatment, n = 4) were also stained with
monoclonal antibodies against MyHC isoforms (Fig. 4A-D). Observations on these muscles
confirmed the results from the histochemical typing (Table 2). Sections of the regenerated muscles
from the CsA group (4 sections/muscle approximately 100 µm apart) contained exclusively fibers
reacting with an antibody against fast/neonatal MyHC isoforms (Fig. 4C). Between 0 and 15 fibre
profiles per section were stained for slow MyHC (Fig. 4A, compare with the contralateral muscle
shown in Fig. 4B) and 8 - 23 profiles were positive for the embryonic isoform (Fig. 4D).
Electrophoretic analysis of MyHC isoform expression
The results of the histological analysis of fibre type composition were verified by
electrophoretic separation of MyHCs extracted from muscles of Cremophor- or saline-treated (n
= 14, 4-7 weeks after unilateral injury) and of CsA-treated animals (n = 11). The electrophoretic
patterns obtained from extracts of intact and regenerated muscles are shown in Figure 5. The most
significant observation in these experiments was the apparent phenotypic transformation, as
compared to control muscles. In regenerated CsA-treated muscles the band corresponding to the
slow (I) myosin heavy chain was either absent or faint. This resulted in a shift to a faster phenotype
with the appearance of fast IIB myosin, not present in intact and control regenerated solei, and an
enhanced signal at the level of migration of fast IIA/IIX isoforms (Fig. 5, lanes 1r, 2r, 3r and 4r).
An important finding was that regenerated muscles, irrespective of treatment, did not contain
detectable levels of developmental (embryonic, neonatal) isoforms of MyHC indicating high level
17
of maturation. These two observations are consistent with the physiological and histological data
presented above.
Other histological observations
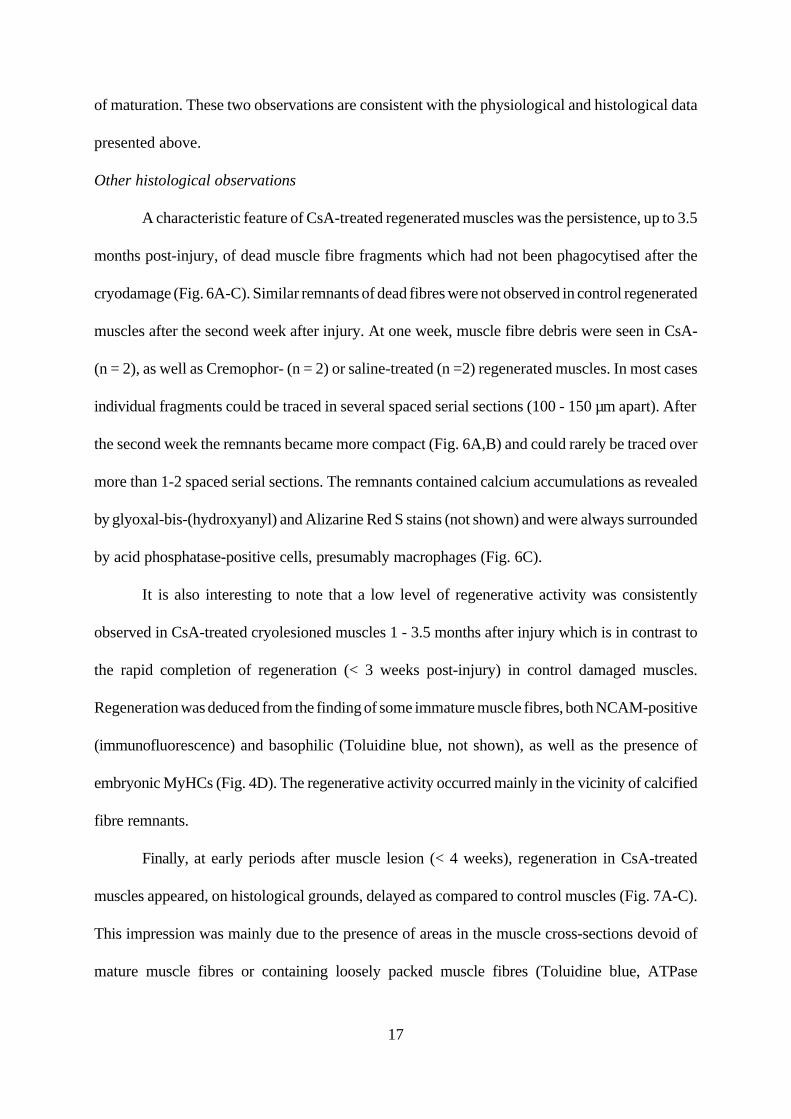
A characteristic feature of CsA-treated regenerated muscles was the persistence, up to 3.5
months post-injury, of dead muscle fibre fragments which had not been phagocytised after the
cryodamage (Fig. 6A-C). Similar remnants of dead fibres were not observed in control regenerated
muscles after the second week after injury. At one week, muscle fibre debris were seen in CsA-
(n = 2), as well as Cremophor- (n = 2) or saline-treated (n =2) regenerated muscles. In most cases
individual fragments could be traced in several spaced serial sections (100 - 150 µm apart). After
the second week the remnants became more compact (Fig. 6A,B) and could rarely be traced over
more than 1-2 spaced serial sections. The remnants contained calcium accumulations as revealed
by glyoxal-bis-(hydroxyanyl) and Alizarine Red S stains (not shown) and were always surrounded
by acid phosphatase-positive cells, presumably macrophages (Fig. 6C).
It is also interesting to note that a low level of regenerative activity was consistently
observed in CsA-treated cryolesioned muscles 1 - 3.5 months after injury which is in contrast to
the rapid completion of regeneration (< 3 weeks post-injury) in control damaged muscles.
Regeneration was deduced from the finding of some immature muscle fibres, both NCAM-positive
(immunofluorescence) and basophilic (Toluidine blue, not shown), as well as the presence of
embryonic MyHCs (Fig. 4D). The regenerative activity occurred mainly in the vicinity of calcified
fibre remnants.
Finally, at early periods after muscle lesion (< 4 weeks), regeneration in CsA-treated
muscles appeared, on histological grounds, delayed as compared to control muscles (Fig. 7A-C).
This impression was mainly due to the presence of areas in the muscle cross-sections devoid of
mature muscle fibres or containing loosely packed muscle fibres (Toluidine blue, ATPase
18
stainings). Such areas varied largely in individual CsA-treated solei (Fig. 7A,B) and were not
observed in control regenerated muscles which consisted of densely arranged fibres already by 2
weeks (Fig. 7A). Despite this deficit, some solei of immunosuppressed animals studied at 8 - 21
days contained large numbers of fibre profiles (949 - 1735, n = 3) comparable with the numbers
at later periods (Table 2). Sections of other CsA-treated muscles, however, contained apparently
low numbers of fibre profiles (not quantified, compare the muscle sections shown in Fig. 7 A and
B). In agreement with the variability described here is the variability in the functional performance
of the same muscles as illustrated by the maximum force measurments in Figure 2 (black symbols
to the left of the vertical dotted line at 28 days). Taken as a whole, however, regeneration during
CsA application was, in functional terms, not impared (Fig. 2, see also Discussion).
19
DISCUSSION
The results of this study show that chronic CsA treatment in mice leads to considerable
alterations in muscle physiology, structure and phenotype. We cannot, and did not aim to,
dissociate whether these changes result from direct, tissue specific, drug effects or represent
epiphenomena. Although existing evidence for direct influences on transduction pathways in
skeletal muscle (see Introduction and the following Discussion) suggests direct mechanisms, the
results have to be cautiously interpreted in view of the signs of drug toxicity observed in this
study. Irrespective of this, the present findings have relevance to the clinical situation firstly since
treatment was performed at immunosuppressive dosage for the species used and secondly, CsA
toxicity is common in patients despite therapeutic drug monitoring (Shaw et al., 1999).
The results of previous investigations have indicated that Cremophor, the vehicle of CsA,
may be responsible for some of the toxic effects of the drug treatment (Windebank et al., 1994;
Tatou et al., 1996; Sanches et al., 1994). Therefore, a group of control animals have been
included in the experiment (saline treatment) to control for the possible adverse effects of the
vehicle. No differences were found in the results obtained from both groups (Cremophor versus
saline treatment) which indicates that, under our experimental conditions, Cremophor was not
toxic.
CsA effects on intact skeletal muscles
One significant effect of the treatment was a reduction in muscle force. This deficit was
neither due to a smaller muscle mass or cross-sectional area, nor to histopathological alterations
or decreased fibre number. The moderate (10%) slow-to-fast fibre transformation (see below) is
also not a plausible explanation (20-30% force deficit) even if we speculatively assume that there
is a difference in force generation per unit cross-sectional area in fast- and slow-twitch fibres of
the soleus muscle. It seems more likely that the force deficits arise from muscle mitochondrial
20
malfunctions (Mercier et al., 1995; Lampert et al., 1996; Biring et al., 1998). However, such
adverse effects, in conjunction with reduced capillary density, may provide a plausible explanation
of motor performance deficits in CsA-treated humans but not for impaired force generation of
isolated muscle preparations studied in vitro at 25°C. The possibility that CsA directly impairs
muscle contractility has also to be considered. In cardiac muscle, CsA has a direct adverse effect
on contractile function most likely due to its effect on Ca2+ handling (Janssen et al., 2000).
Tacrolimus (FK506), another drug with an immunosuppressive action similar to CsA, has a direct
effect on excitation-contraction coupling in skeletal muscle exerted via its binding to the FK
binding protein (FKBP) associated with the ryanodine receptor (Lamb & Stephenson, 1996). The
question as to whether CsA has a direct influence on force generation in skeletal muscle is of
interest, both from a physiological and a clinical point of view, and has to be further investigated.
A second major effect of CsA treatment on normal muscles was a change in fibre type
composition. The total number of muscle fibre profiles in CsA-treated solei was similar to the
numbers found in the control groups but less Type I and more Type II fibres were found (roughly
10% difference for both types). Apparently, a slow-to-fast fibre type transformation had occurred
in a proportion of the existing fibres. As indicated by the electrophoretic data, this phenotypic
transition was restricted to mature MyHC isoforms normally expressed in mouse soleus muscle
(I, IIA/X). Such a slow-to-fast transformation has been previously reported and explained by
inhibition of calcineurin activity (Chin et al., 1998; Bigard et al., 2000; Naya et al., 2000).
The alterations induced by CsA in the soleus muscles were reversible. After a prolonged
period of drug application (7 weeks) and withdrawal (5-8 weeks) all muscle properties studied
were comparable to those of the control groups. Therefore, drug treatment does not induce any
permanent functional or structural deficits in intact skeletal muscles.
21
Influences on muscle regeneration
Regenerating muscles were more profoundly influenced by the treatment. At 4 to 7 weeks
after injury, regenerated solei were composed exclusively of Type II fibres as demonstrated using
histochemical and immunocytochemical approaches. This phenotype was verified by the MyHC
electrophoretic patterns obtained from treated muscles. In addition, the assay showed that
treatment could lead to quantitatively new expression profiles including that of the MyHC IIB
isoform which is not detected normally in intact or regenerating mouse solei (Whalen et al.,
1990). The degree of phenotypic maturation was high as revealed by the apparent absence of
developmental MyHC isoforms. In accordance with the predominantly fast fibre phenotype was
the finding of a shorter contraction and half-relaxation time.
After one month, no obvious histological signs of regeneration deficits were found in CsA-
treated solei. On the contrary, muscle cross-sectional areas, number of profiles per section as well
as muscle mass by far exceeded those of control muscles. In contrast, structural deficits were
found in muscles studied 1-3 weeks after cryodamage (see also Abbott et al., 1998 for deficits by
10 days of regeneration). These two findings are apparently contradictory: it appears that muscle
repair during CsA application is initially delayed or defective but finally more efficient. This
paradox can be explained if we assume that CsA inhibits myoblast differentiation and
simultaneously enhances cell proliferation. In this way, the period of myoblast proliferation will
be longer than normal ("impaired regeneration") and the "gain" of myogenic cells greater before
maturation and fusion. Experimental evidence supports this notion in regard to inhibition of
differentiation (Hardiman et al., 1993; Abbott et al., 1998; Friday et al., 2000) but no significant
effects on cell proliferation in vitro have been reported (Abbott et al., 1998). Nevertherless, may
be the influences on cell replication in vivo, direct or indirect, differ from those in vitro.
Despite tissue defects, the functional performance of regenerated CsA-treated muscles
22
studied at time periods shorter than 4 weeks was comparable to control solei (see Fig. 2). This
finding indicates the limitations of any "one-methodology" approach used to evaluate muscle
recovery after injury. If histology alone had been used, the conclusion in this particular case would
have been "impaired regeneration". The functional assay alone would have indicated "normal
recovery". These considerations are important but do not explain the disparity in the findings
obtained with the two methods. The most simple explanation is that CsA-treated and control
muscles initially contain similar amounts of contractile tissue but treated and not control muscles -
considerable additional (due to enhanced myoblast proliferation, see above), volume of
differentiating, still non-contractile muscle tissue. As soon as this additional compartment matures
(> 4 weeks of regeneration), treated muscles become superior in function as compared to control
(Fig. 2). In this way, permanent functional deficits present after regeneration of cryodamaged
muscles (Wernig et al., 1991; Wernig et al., 1995; Wernig & Irintchev, 1995; Irintchev et al.,
1997a) were compensated at the organ (whole muscle) level. Similar mechanisms may account for
the observed improvement of muscle performance in CsA-treated Duchenne patients (Sharma et
al., 1993; Miller et al., 1997).
During CsA treatment force generation in regenerated muscles, in relation to muscle cross-
sectional area, was impaired to the same extent as in the contralateral intact muscles. This may be
explained by the direct effects on the contractile mechanisms which were proposed above. An
additional explanation was the presence of non-contractile tissue (calcified fibre remnants, see
Results and following Discussion). Irrespective of the exact reason(s), it is important to note that
the force production per unit cross-sectional area in regenerated muscles did not improve after
drug withdrawal as was the case in the contralateral solei. This indicates that there is a long-lasting
or permanent deficit. In addition, expression of the fast MyHC isoforms was above control level
after withdrawal. It is probable that the restoration of a "normal" pattern requires more than 2
23
months.
An interesting observation was that dead fibre remnants persisted in the regenerated solei
throughout the period of observation, even after drug withdrawal (for time periods up to 3 months
after cryodamage). We speculate that a possible reason is the inhibition of phagocytic activity in
regenerating muscles. The resulting delay in removing cell debris after injury may result in the
deposition of calcium which hampers subsequent phagocytosis. Although the evidence concerning
CsA effects on macrophages is not always consistent (for a review see Lose Garcia et al., 1996)
observations such as inhibition of macrophage activation and of cytokine production by these cells,
as well as reduced phagocytosis (see e.g. Thorat et al., 1994; Holschermann et al., 1996; Wasaki
et al., 1997; Garcia et al., 1999) support our speculation.
Concluding remarks
Effects of CsA treatment on fibre phenotype, muscle hypertrophy and muscle
differentiation have been reported previously. By combining physiological recordings and
subsequent morphological and biochemical analyses of the same muscles in this study we could
reveal new aspects. Important are the findings of impaired function of normal muscle during CsA
treatment, profound influence on fibre phenotype in regenerated muscles and the hyperplastic
effects on regenerating muscle, among others. These findings raised questions, as discussed above,
the answers to which will contribute to better understanding of drug influences, muscle function
and muscle regeneration.
REFERENCES
24
Abbott, K. L., Friday, B. B., Thaloor, D., Murphy, T. J., & Pavlath, G. K. (1998). Activation and
cellular localization of the cyclosporine A- sensitive transcription factor NF-AT in skeletal muscle
cells. Molecular Biology of the Cell 9, 2905-2916.
Agbulut, O., Li, Z., Mouly, V., & Butler-Browne, G. S. (1996). Analysis of skeletal and cardiac
muscle from desmin knock-out and normal mice by high resolution separation of myosin heavy-
chain isoforms. Biology of the Cell 88, 131-135.
Bigard, X., Sanchez, H., Zoll, J., Mateo, P., Rousseau, V., Veksler, V., & Ventura-Clapier, R.
(2000). Calcineurin co-regulates contractile and metabolic components of slow muscle phenotype.
Journal of Biological Chemistry 275, 19653-19660.
Billaud, E. M. (2000). Clinical pharmacology of immunosuppressive drugs: year 2000--time for
alternatives. Therapie 55, 177-183.
Biring, M. S., Fournier, M., Ross, D. J., & Lewis, M. I. (1998). Cellular adaptations of skeletal
muscles to cyclosporine. Journal of Applied Physiology 84, 1967-1975.
Breil, M. & Chariot, P. (1999). Muscle disorders associated with cyclosporine treatment. Muscle
and Nerve 22, 1631-1636.
Chin, E. R., Olson, E. N., Richardson, J. A., Yang, Q., Humphries, C., Shelton, J. M., Wu, H.,
Zhu, W., Bassel Duby, R., & Williams, R. S. (1998). A calcineurin-dependent transcriptional
25
pathway controls skeletal muscle fiber type. Genes and Development 12, 2499-2509.
Dunn, S. E., Burns, J. L., & Michel, R. N. (1999). Calcineurin is required for skeletal muscle
hypertrophy. Journal of Biological Chemistry 274, 21908-21912.
Friday, B.B., Horsley, V., & Pavlath, G.K. (2000). Calcineurin activity is required for the initiation
of skeletal muscle differentiation. Journal of Cell Biology 149, 657-665.
Garcia, J. E., Lopez, A. M., de Cabo, M. R., Rodriguez, F. M., Losada, J. P., Sarmiento, R. G.,
Lopez, A. J., & Arellano, J. L. (1999). Cyclosporin A decreases human macrophage interleukin-6
synthesis at post-transcriptional level. Mediators of Inflammation 8, 253-259.
Guerini, D. (1997). Calcineurin: not just a simple protein phosphatase. Biochemistry and
Biophysics Research Communications 235, 271-275.
Guth, L. & Samaha, F. J. (1970). Procedure for the histochemical demonstration of actomyosin
ATPase. Experimental Neurology 28, 365-367.
Hardiman, O., Sklar, R. M., & Brown, R. H., Jr. (1993). Direct effects of cyclosporin A and
cyclophosphamide on differentiation of normal human myoblasts in culture. Neurology 43 , 1432-
1434.
Hirn, M., Pierres, M., Deagostini-Bazin, H., Hirsch, M., & Goridis, C. (1981). Monoclonal
antibody against cell surface protein of neurons. Brain Research 214, 433-439.
26
Hokanson, J. F., Mercier, J. G., & Brooks, G. A. (1995). Cyclosporine A decreases rat skeletal
muscle mitochondrial respiration in vitro. American Journal of Respiratory and Critical Care
Medicine 151, 1848-1851.
Holschermann, H., Durfeld, F., Maus, U., Bierhaus, A., Heidinger, K., Lohmeyer, J., Nawroth,
P. P., Tillmanns, H., & Haberbosch, W. (1996). Cyclosporine A inhibits tissue factor expression
in monocytes/macrophages. Blood 88, 3837-3845.
Irintchev, A., Draguhn, A., & Wernig, A. (1990). Reinnervation and recovery of mouse soleus
muscle after long- term denervation. Neuroscience 39, 231-243.
Irintchev, A., Langer, M., Zweyer, M., Theisen, R., & Wernig, A. (1997a). Functional
improvement of damaged adult mouse muscle by implantation of primary myoblasts. Journal of
Physiology 500, 775-785.
Irintchev, A. & Wernig, A. (1987). Muscle damage and repair in voluntarily running mice: strain
and muscle differences. Cell and Tissue Research 249, 509-521.
Irintchev, A., Zweyer, M., & Wernig, A. (1995). Cellular and molecular reactions in mouse
muscles after myoblast implantation. Journal of Neurocytology 24, 319-331.
Irintchev, A., Zweyer, M., & Wernig, A. (1997b). Impaired functional and structural recovery
after muscle injury in dystrophic mdx mice. Neuromuscular Disorders 7, 117-125.
27
Irintchev, A., Zweyer, M., & Wernig, A. (1999). Effects of cyclosporin A on intact and
regenerating skeletal muscles of the mouse. Pflügers Archiv European Journal of Physiology 437,
Suppl., R145. (Abstract)
Janssen, P. M.L., Zeitz, O., Keweloh, B., Siegel, U., Maier, L. S., Barckhausen, P., Pieske, B.,
Prestle, J., Lehnart, S. E., & Hasenfuss, G. (2000). Influence of cyclosporine A on contractile
function, calcium handling, and energetics in isolated human and rabbit myocardium.
Cardiovascular Research 47, 99-107.
Jensen, R. L., Yanowitz, F. G., & Crapo, R. O. (1991). Exercise hemodynamics and oxygen
delivery measurements using rebreathing techniques in heart transplant patients. American Journal
of Cardiology 68, 129-133.
Kavanagh, T., Yacoub, M. H., Mertens, D. J., Kennedy, J., Campbell, R. B., & Sawyer, P. (1988).
Cardiorespiratory responses to exercise training after orthotopic cardiac transplantation.
Circulation 77, 162-171.
Lamb, G.D. & Stephenson, D.G. (1996). Effects of FK506 and rapamycin on excitation-
contraction coupling in skeletal muscle fibres of the rat. Journal of Physiology 494, 569-576.
Lampert, E., Mettauer, B., Hoppeler, H., Charloux, A., Charpentier, A., & Lonsdorfer, J. (1996).
Structure of skeletal muscle in heart transplant recipients. Journal of the American College of
Cardiology 28, 980-984.
28
Linden, K. G. & Weinstein, G. D. (1999). Psoriasis: current perspectives with an emphasis on
treatment. American Journal of Medicine 107, 595-605.
Lojda, Z., Gossrau, R., & Schiebler, T. H. (1976). Enzymhistochemische Methoden. Springer-
Verlag, Berlin, Heidelberg, New York.
Losa Garcia, J. E., Mateos Rodriguez, F., Jimenez Lopez, A., & Perez Arellano, J. L. (1996).
Action of cyclosporin A on mononuclear phagocytes. Journal of Investigational Allergology and
Clinical Immunology 6, 222-231.
Matsuda, S. & Koyasu, S. (2000). Mechanisms of action of cyclosporine. Immunopharmacology
47, 119-125.
Mercier, J. G., Hokanson, J. F., & Brooks, G. A. (1995). Effects of cyclosporine A on skeletal
muscle mitochondrial respiration and endurance time in rats. American Journal of Respiratory and
Critical Care Medicine 151, 1532-1536.
Miller, R. G., Sharma, K. R., Pavlath, G. K., Gussoni, E., Mynhier, M., Lanctot, A. M., Greco,
C. M., Steinman, L., & Blau, H. M. (1997). Myoblast implantation in Duchenne muscular
dystrophy: the San Francisco study. Muscle and Nerve 20, 469-478.
Musaro, A., McCullagh, K. J., Naya, F. J., Olson, E. N., & Rosenthal, N. (1999). IGF-1 induces
skeletal myocyte hypertrophy through calcineurin in association with GATA-2 and NF-ATc1.
Nature 400, 581-585.
29
Naya, F. J., Mercer, B., Shelton, J., Richardson, J. A., Williams, R. S., & Olson, E. N. (2000).
Stimulation of slow skeletal muscle fiber gene expression by calcineurin in vivo. Journal of
Biological Chemistry 275, 4545-4548.
Olyaei, A. J., de Mattos, A. M., & Bennett, W. M. (1999). Immunosuppressant-induced
nephropathy: pathophysiology, incidence and management. Drug Safety 21, 471-488.
Ponticelli, C. & Tarantino, A. (1999). Promising new agents in the prevention of transplant
rejection. Drugs in Research and Development 1, 55-60.
Rao, A., Luo, C., & Hogan, P. G. (1997). Transcription factors of the NFAT family: regulation
and function. Annual Review of Immunology 15, 707-747.
Resch, K. & Szamel, M. (1997). Molecular mechanisms of the immunosuppressive action of
cyclosporin A. International Journal of Immunopharmacology 19, 579-585.
Richter-Reichhelm, H. B. & Schulte, A. E. (1998). Results of a cyclosporin A ringstudy.
Toxicology 129, 91-94.
Ruhlmann, A. & Nordheim, A. (1997). Effects of the immunosuppressive drugs CsA and FK506
on intracellular signalling and gene regulation. Immunobiology 198, 192-206.
Sanchez, H., Bigard, X., Veksler, V., Mettauer, B., Lampert, E., Lonsdorfer, J., & Ventura-
Clapier, R. (2000). Immunosuppressive treatment affects cardiac and skeletal muscle mitochondria
by the toxic effect of vehicle. Jorurnal of Molecular and Cellular Cardiology 32, 323-331.
30
Savin, W. M., Haskell, W. L., Schroeder, J. S., & Stinson, E. B. (1980). Cardiorespiratory
responses of cardiac transplant patients to graded, symptom-limited exercise. Circulation 62, 55-
60.
Semsarian, C., Wu, M. J., Ju, Y. K., Marciniec, T., Yeoh, T., Allen, D. G., Harvey, R. P., &
Graham, R. M. (1999). Skeletal muscle hypertrophy is mediated by a Ca2+-dependent calcineurin
signalling pathway. Nature 400, 576-581.
Sharma, K. R., Mynhier, M. A., & Miller, R. G. (1993). Cyclosporine increases muscular force
generation in Duchenne muscular dystrophy. Neurology 43, 527-532.
Shaw, L. M., Holt, D. W., Keown, P., Venkataramanan, R., & Yatscoff, R. W. (1999). Current
opinions on therapeutic drug monitoring of immunosuppressive drugs. Clinical Therapeutics 21,
1632-1652.
Tatou, E., Mossiat, C., Maupoil, V., Gabrielle, F., David, M., & Rochette, L. (1996). Effects of
cyclosporin and cremophor on working rat heart and incidence of myocardial lipid peroxidation.
Pharmacology 52, 1-7.
Thorat, S. P., Thatte, U. M., Pai, N., & Dahanukar, S. A. (1994). Inhibition of phagocytes by
cyclosporin in vitro. Quarterly Journal of Medicine 87, 311-314.
Vencovsky, J., Jarosova, K., Machacek, S., Studynkova, J., Kafkova, J., Bartunkova, J.,
Nemcova, D., & Charvat, F. (2000). Cyclosporine A versus methotrexate in the treatment of
31
polymyositis and dermatomyositis. Scandinavian Journal of Rheumatology 29, 95-102.
Wasaki, S., Sakaida, I., Uchida, K., Kimura, T., Kayano, K., & Okita, K. (1997). Preventive effect
of cyclosporin A on experimentally induced acute liver injury in rats. Liver 17 , 107-114.
Weinblatt, M. E. (1999). The role of current strategies in the future treatment of rheumatoid
arthritis. Rheumatology (Oxford) 38 Suppl 2:19-23, 19-23.
Wernig, A. & Irintchev, A. (1995). "Bystander" damage of host muscle caused by implantation
of MHC-compatible myogenic cells. Journal of the Neurological Sciences 130, 190-196.
Wernig, A., Irintchev, A., Härtling, A., Stephan, G., Zimmermann, K., & Starzinski-Powitz, A.
(1991a). Formation of new muscle fibres and tumours after injection of cultured myogenic cells.
Journal of Neurocytology 20, 982-997.
Wernig, A., Irintchev, A., & Lange, G. (1995). Functional effects of myoblast implantation into
histoincompatible mice with or without immunosuppression. Journal of Physiology 484, 493-503.
32
Wernig, A., Irintchev, A., & Weisshaupt, P. (1990). Muscle injury, cross-sectional area and fibre
type distribution in mouse soleus after intermittent wheel-running. Journal of Physiology 428,
639-652.
Wernig, A., Salvini, T. F., & Irintchev, A. (1991b). Axonal sprouting and changes in fibre types
after running- induced muscle damage. Journal of Neurocytology 20, 903-913.
Wernig, A., Zweyer, M., & Irintchev, A. (2000). Function of skeletal muscle tissue formed after
myoblast transplantation into irradiated mouse muscles. Journal of Physiology 522, 333-345.
Whalen, R.G., Harris, J.B., Butler-Browne, G.S., & Sesodia, S. (1990). Expression of myosin
isoforms during notexin-induced regeneration of rat soleus muscles. Developmental Biology 141,
24-40.
Windebank, A. J., Blexrud, M. D., & de Groen, P. C. (1994). Potential neurotoxicity of the
solvent vehicle for Cyclosporine. Journal of Pharmacology and Experimental Therapeutics 268,
1051-1056.
Acknowledgements
Stefanie Briel, Jennifer Heckroth and Karin Müller-Using provided technical assistance.
Gunnar Lange was helpful with fibre type quantifications and physiological recordings. The work
was supported by grants from the Deutsche Forschungsgemeinschaft (We859) and European
Commission (BMH4-97-2767 to A.W. and QLK6-1999-02034 to G.B.B. and A.W.), and by the
CNRS (G.B.B.), the Association Française contre les Myopathies (G.B.B, R.N.C.) and the
Association pour la Recherche contre les Cancers (G.B.B.).
33
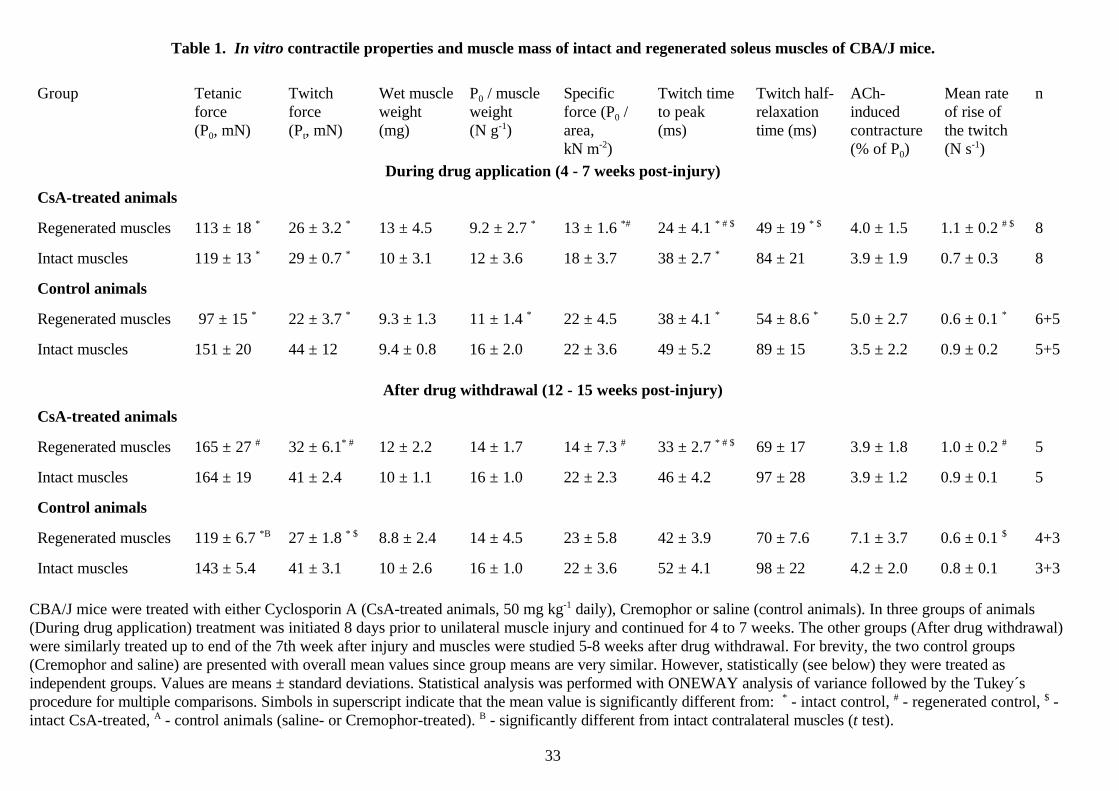
Table 1. In vitro contractile properties and muscle mass of intact and regenerated soleus muscles of CBA/J mice.
Group Tetanicforce(P0, mN)
Twitchforce(Pt, mN)
Wet muscleweight(mg)
P0 / muscleweight (N g-1)
Specificforce (P0 /area,kN m-2)
Twitch timeto peak (ms)
Twitch half-relaxationtime (ms)
ACh-inducedcontracture(% of P0)
Mean rateof rise ofthe twitch(N s-1)
n
During drug application (4 - 7 weeks post-injury)
CsA-treated animals
Regenerated muscles 113 ± 18 * 26 ± 3.2 * 13 ± 4.5 9.2 ± 2.7 * 13 ± 1.6 *# 24 ± 4.1 * # $ 49 ± 19 * $ 4.0 ± 1.5 1.1 ± 0.2 # $ 8
Intact muscles 119 ± 13 * 29 ± 0.7 * 10 ± 3.1 12 ± 3.6 18 ± 3.7 38 ± 2.7 * 84 ± 21 3.9 ± 1.9 0.7 ± 0.3 8
Control animals
Regenerated muscles 97 ± 15 * 22 ± 3.7 * 9.3 ± 1.3 11 ± 1.4 * 22 ± 4.5 38 ± 4.1 * 54 ± 8.6 * 5.0 ± 2.7 0.6 ± 0.1 * 6+5
Intact muscles 151 ± 20 44 ± 12 9.4 ± 0.8 16 ± 2.0 22 ± 3.6 49 ± 5.2 89 ± 15 3.5 ± 2.2 0.9 ± 0.2 5+5
After drug withdrawal (12 - 15 weeks post-injury)
CsA-treated animals
Regenerated muscles 165 ± 27 # 32 ± 6.1* # 12 ± 2.2 14 ± 1.7 14 ± 7.3 # 33 ± 2.7 * # $ 69 ± 17 3.9 ± 1.8 1.0 ± 0.2 # 5
Intact muscles 164 ± 19 41 ± 2.4 10 ± 1.1 16 ± 1.0 22 ± 2.3 46 ± 4.2 97 ± 28 3.9 ± 1.2 0.9 ± 0.1 5
Control animals
Regenerated muscles 119 ± 6.7 *B 27 ± 1.8 * $ 8.8 ± 2.4 14 ± 4.5 23 ± 5.8 42 ± 3.9 70 ± 7.6 7.1 ± 3.7 0.6 ± 0.1 $ 4+3
Intact muscles 143 ± 5.4 41 ± 3.1 10 ± 2.6 16 ± 1.0 22 ± 3.6 52 ± 4.1 98 ± 22 4.2 ± 2.0 0.8 ± 0.1 3+3
CBA/J mice were treated with either Cyclosporin A (CsA-treated animals, 50 mg kg-1 daily), Cremophor or saline (control animals). In three groups of animals(During drug application) treatment was initiated 8 days prior to unilateral muscle injury and continued for 4 to 7 weeks. The other groups (After drug withdrawal)were similarly treated up to end of the 7th week after injury and muscles were studied 5-8 weeks after drug withdrawal. For brevity, the two control groups(Cremophor and saline) are presented with overall mean values since group means are very similar. However, statistically (see below) they were treated asindependent groups. Values are means ± standard deviations. Statistical analysis was performed with ONEWAY analysis of variance followed by the Tukey´sprocedure for multiple comparisons. Simbols in superscript indicate that the mean value is significantly different from: * - intact control, # - regenerated control, $ -intact CsA-treated, A - control animals (saline- or Cremophor-treated). B - significantly different from intact contralateral muscles (t test).
34
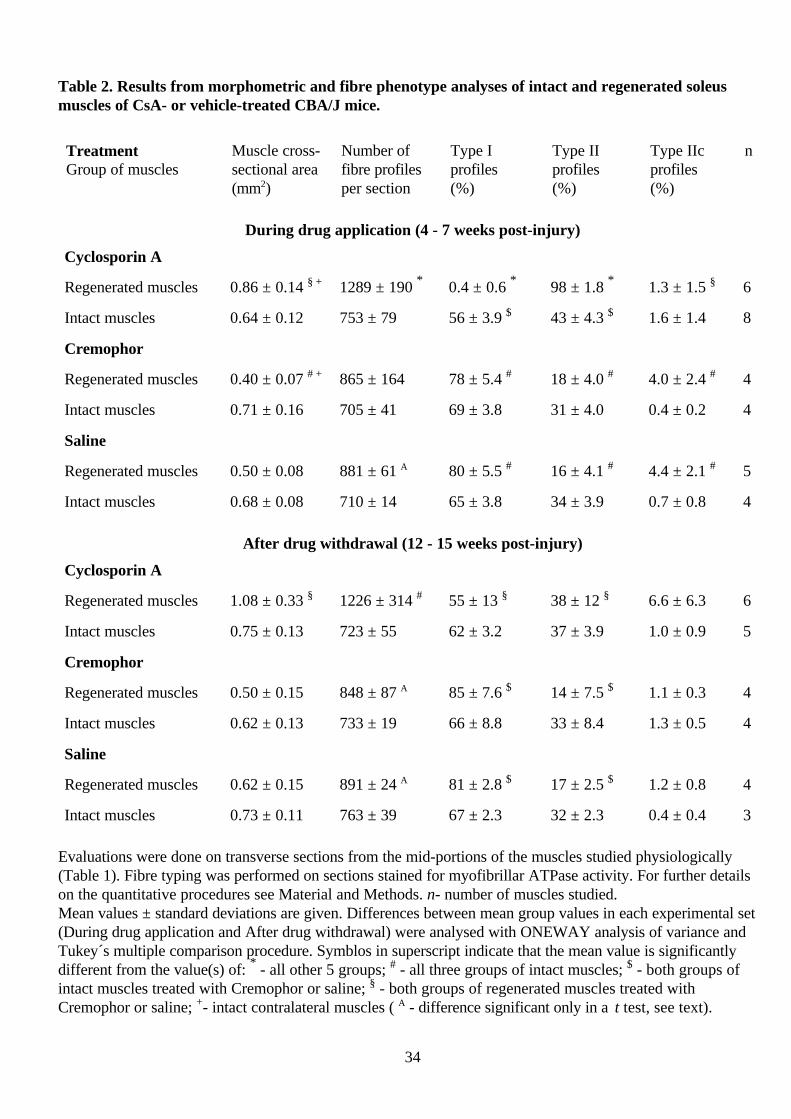
Table 2. Results from morphometric and fibre phenotype analyses of intact and regenerated soleusmuscles of CsA- or vehicle-treated CBA/J mice.
TreatmentGroup of muscles
Muscle cross-sectional area(mm2)
Number offibre profilesper section
Type Iprofiles(%)
Type IIprofiles(%)
Type IIcprofiles(%)
n
During drug application (4 - 7 weeks post-injury)
Cyclosporin A
Regenerated muscles 0.86 ± 0.14 § + 1289 ± 190 * 0.4 ± 0.6 * 98 ± 1.8 * 1.3 ± 1.5 § 6
Intact muscles 0.64 ± 0.12 753 ± 79 56 ± 3.9 $ 43 ± 4.3 $ 1.6 ± 1.4 8
Cremophor
Regenerated muscles 0.40 ± 0.07 # + 865 ± 164 78 ± 5.4 # 18 ± 4.0 # 4.0 ± 2.4 # 4
Intact muscles 0.71 ± 0.16 705 ± 41 69 ± 3.8 31 ± 4.0 0.4 ± 0.2 4
Saline
Regenerated muscles 0.50 ± 0.08 881 ± 61 A 80 ± 5.5 # 16 ± 4.1 # 4.4 ± 2.1 # 5
Intact muscles 0.68 ± 0.08 710 ± 14 65 ± 3.8 34 ± 3.9 0.7 ± 0.8 4
After drug withdrawal (12 - 15 weeks post-injury)
Cyclosporin A
Regenerated muscles 1.08 ± 0.33 § 1226 ± 314 # 55 ± 13 § 38 ± 12 § 6.6 ± 6.3 6
Intact muscles 0.75 ± 0.13 723 ± 55 62 ± 3.2 37 ± 3.9 1.0 ± 0.9 5
Cremophor
Regenerated muscles 0.50 ± 0.15 848 ± 87 A 85 ± 7.6 $ 14 ± 7.5 $ 1.1 ± 0.3 4
Intact muscles 0.62 ± 0.13 733 ± 19 66 ± 8.8 33 ± 8.4 1.3 ± 0.5 4
Saline
Regenerated muscles 0.62 ± 0.15 891 ± 24 A 81 ± 2.8 $ 17 ± 2.5 $ 1.2 ± 0.8 4
Intact muscles 0.73 ± 0.11 763 ± 39 67 ± 2.3 32 ± 2.3 0.4 ± 0.4 3
Evaluations were done on transverse sections from the mid-portions of the muscles studied physiologically(Table 1). Fibre typing was performed on sections stained for myofibrillar ATPase activity. For further detailson the quantitative procedures see Material and Methods. n- number of muscles studied.Mean values ± standard deviations are given. Differences between mean group values in each experimental set(During drug application and After drug withdrawal) were analysed with ONEWAY analysis of variance andTukey´s multiple comparison procedure. Symblos in superscript indicate that the mean value is significantlydifferent from the value(s) of: * - all other 5 groups; # - all three groups of intact muscles; $ - both groups ofintact muscles treated with Cremophor or saline; § - both groups of regenerated muscles treated withCremophor or saline; +- intact contralateral muscles ( A - difference significant only in a t test, see text).
35
FIGURES AND LEGENDS
Figure 1. Body weight changes during treatment with CsA or vehicle solutions, and afterwithdrawal
In the first part of the graph (below 30 days), mean body weights with SD are shownfor groups of mice treated daily with CsA (black symbols), Cremophor (open circles) or saline(open squares). Treatment was initiated several days prior to surgery (muscle lesion at day 0)and continued for 4 - 7 weeks thereafter (only values up to day 28 are shown here). The valuesfor the same groups of animals on the day of muscle dissection have been described as 4-7weeks (overall values for the two control groups, open triangle). For comparison, in the thirdpart of the graph („after withdrawal“), values from the last day of the observation period forthree other groups (CsA - filled diamond, pooled values for the two control groups - opendiamond) are given. These animals were continuously treated with CsA or vehicle solutions for7 weeks and studied after an additional recovery period ranging between 5 and 8 weeks (i.e., at12 - 15 weeks after surgery). Numbers in brackets indicate the number of animals, asterisks -significant difference between the two groups (controls pooled together, two-sided Student´s ttest, P < 0.05).
Daily injection of vehicle solution (Cremophor or saline) did not have any obviousadverse effect on body weight and the relatively young animals (2 months of age uponinitiation of treatment) increased in mass (< 30 days) and were slightly, but still statisticallysignificantly, heavier by 4 - 7 weeks of treatment than the CsA-treated mice. Note large dailyvariations in mean body weight in the CsA group initially and weight loss after surgery at day0. In contrast to these findings, body weight after CsA withdrawal is higher in the CsA than inthe control group.
36
Figure 2. Muscle force during and after a period of drug or vehicle treatment
Maximum tetanic force of individual muscles studied after different recovery periods followingcryodamage at day 0. The animals were treated with CsA (filled circles), Cremophor (opencircles) or saline solution (open squares). The end of the treatment period (for further detailssee text and Fig. 1) is indicated by a vertical dotted line at day 49. These and other values fromthe tension recordings of the muscles shown between the two dotted lines (28 - 49 days) andafter the treatment period (> 49 days) are represented as mean group values in Table 1(„During drug application“ and „After withdrawal“, respectively). The fitted curves appear todescribe reasonably well the data as judged by visual inspection and indicated by the high r2
values which are shown in the graph. Note the overlap of the two curves describing the controldata.
37
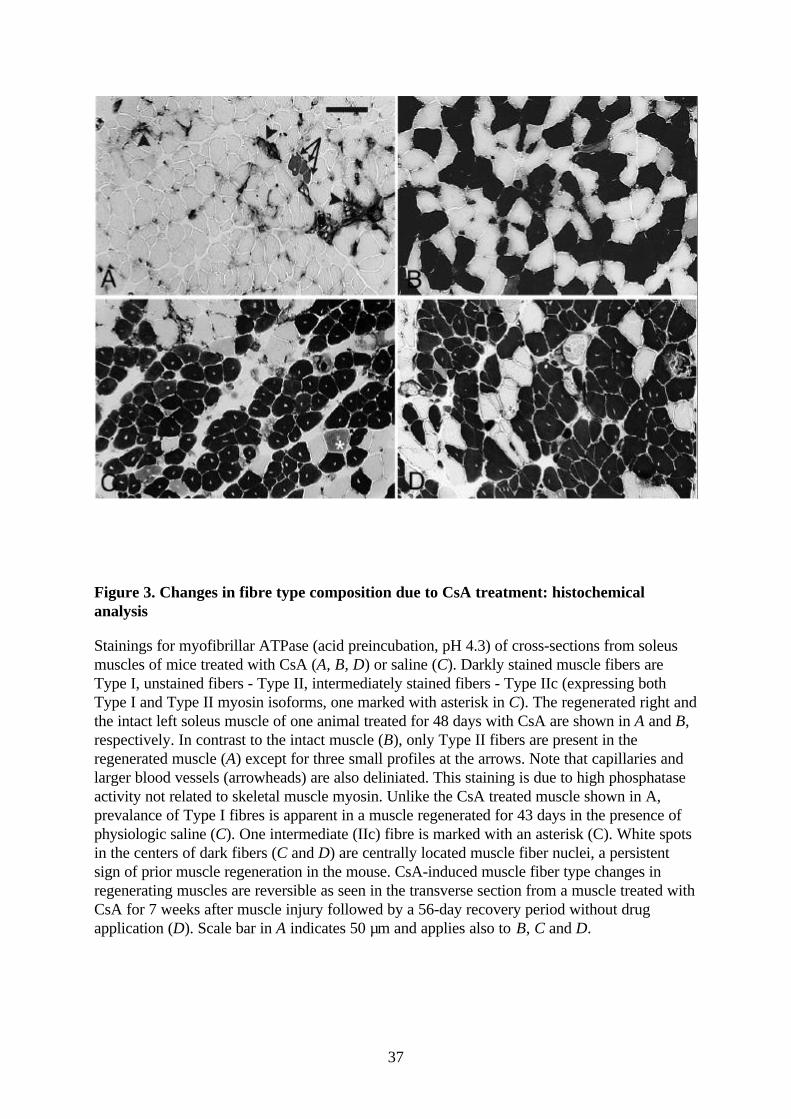
Figure 3. Changes in fibre type composition due to CsA treatment: histochemicalanalysis
Stainings for myofibrillar ATPase (acid preincubation, pH 4.3) of cross-sections from soleusmuscles of mice treated with CsA (A, B, D) or saline (C). Darkly stained muscle fibers areType I, unstained fibers - Type II, intermediately stained fibers - Type IIc (expressing bothType I and Type II myosin isoforms, one marked with asterisk in C). The regenerated right andthe intact left soleus muscle of one animal treated for 48 days with CsA are shown in A and B,respectively. In contrast to the intact muscle (B), only Type II fibers are present in theregenerated muscle (A) except for three small profiles at the arrows. Note that capillaries andlarger blood vessels (arrowheads) are also deliniated. This staining is due to high phosphataseactivity not related to skeletal muscle myosin. Unlike the CsA treated muscle shown in A,prevalance of Type I fibres is apparent in a muscle regenerated for 43 days in the presence ofphysiologic saline (C). One intermediate (IIc) fibre is marked with an asterisk (C). White spotsin the centers of dark fibers (C and D) are centrally located muscle fiber nuclei, a persistentsign of prior muscle regeneration in the mouse. CsA-induced muscle fiber type changes inregenerating muscles are reversible as seen in the transverse section from a muscle treated withCsA for 7 weeks after muscle injury followed by a 56-day recovery period without drugapplication (D). Scale bar in A indicates 50 µm and applies also to B, C and D.
38
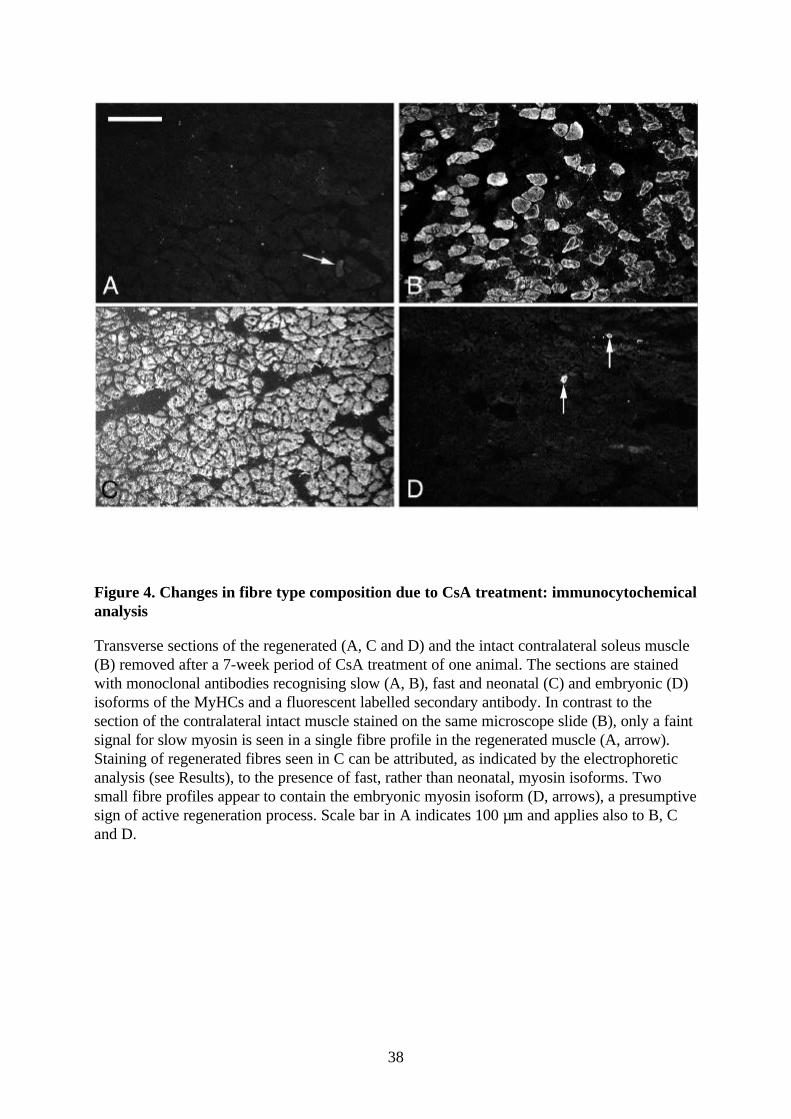
Figure 4. Changes in fibre type composition due to CsA treatment: immunocytochemicalanalysis
Transverse sections of the regenerated (A, C and D) and the intact contralateral soleus muscle(B) removed after a 7-week period of CsA treatment of one animal. The sections are stainedwith monoclonal antibodies recognising slow (A, B), fast and neonatal (C) and embryonic (D)isoforms of the MyHCs and a fluorescent labelled secondary antibody. In contrast to thesection of the contralateral intact muscle stained on the same microscope slide (B), only a faintsignal for slow myosin is seen in a single fibre profile in the regenerated muscle (A, arrow).Staining of regenerated fibres seen in C can be attributed, as indicated by the electrophoreticanalysis (see Results), to the presence of fast, rather than neonatal, myosin isoforms. Twosmall fibre profiles appear to contain the embryonic myosin isoform (D, arrows), a presumptivesign of active regeneration process. Scale bar in A indicates 100 µm and applies also to B, Cand D.
39
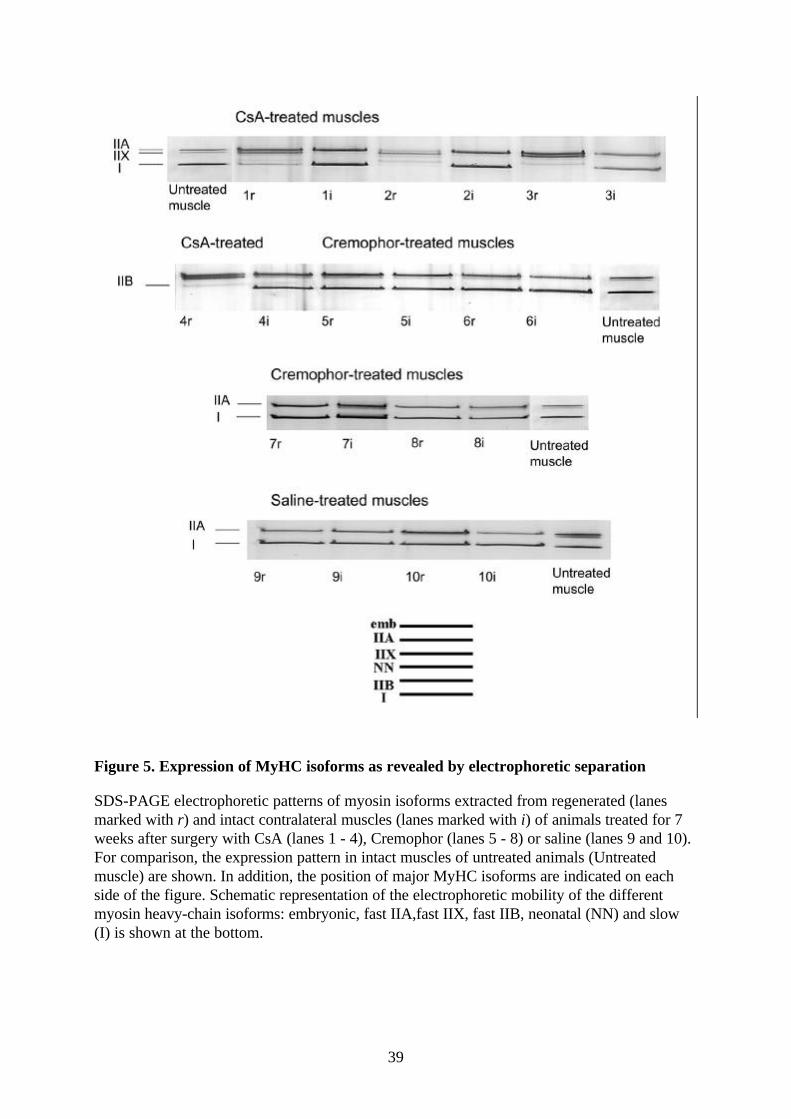
Figure 5. Expression of MyHC isoforms as revealed by electrophoretic separation
SDS-PAGE electrophoretic patterns of myosin isoforms extracted from regenerated (lanesmarked with r) and intact contralateral muscles (lanes marked with i) of animals treated for 7weeks after surgery with CsA (lanes 1 - 4), Cremophor (lanes 5 - 8) or saline (lanes 9 and 10).For comparison, the expression pattern in intact muscles of untreated animals (Untreatedmuscle) are shown. In addition, the position of major MyHC isoforms are indicated on eachside of the figure. Schematic representation of the electrophoretic mobility of the differentmyosin heavy-chain isoforms: embryonic, fast IIA,fast IIX, fast IIB, neonatal (NN) and slow(I) is shown at the bottom.
40
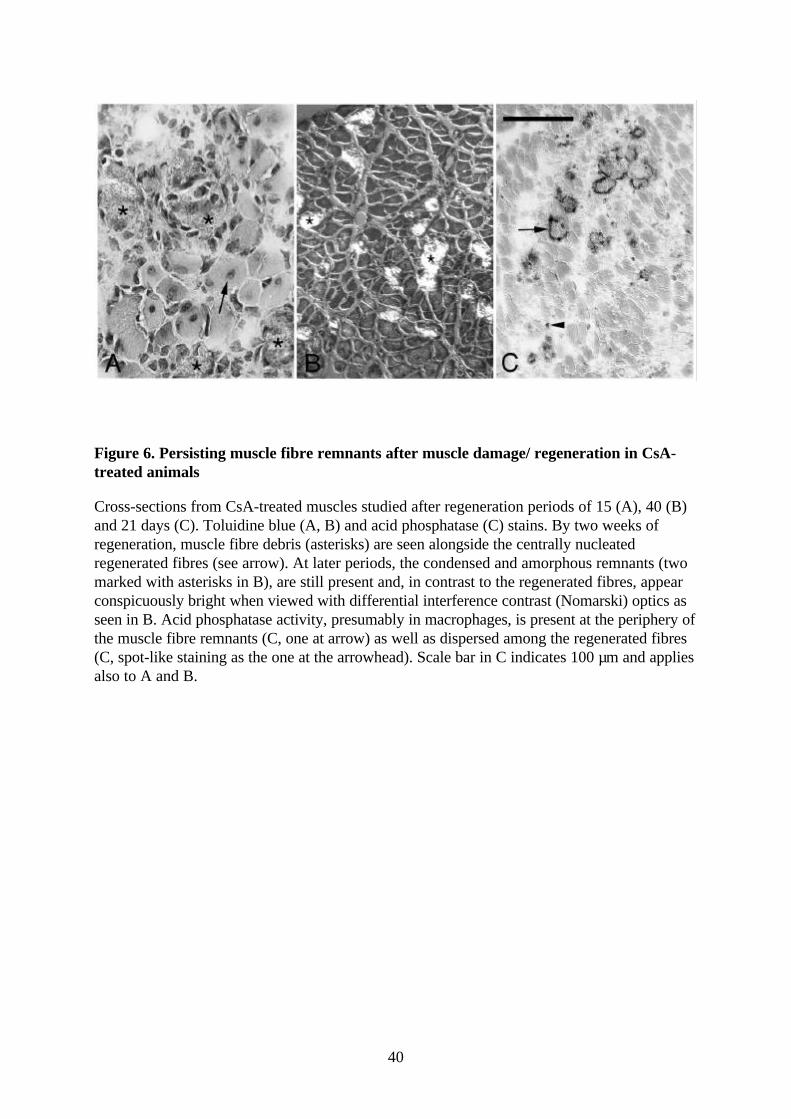
Figure 6. Persisting muscle fibre remnants after muscle damage/ regeneration in CsA-treated animals
Cross-sections from CsA-treated muscles studied after regeneration periods of 15 (A), 40 (B)and 21 days (C). Toluidine blue (A, B) and acid phosphatase (C) stains. By two weeks ofregeneration, muscle fibre debris (asterisks) are seen alongside the centrally nucleatedregenerated fibres (see arrow). At later periods, the condensed and amorphous remnants (twomarked with asterisks in B), are still present and, in contrast to the regenerated fibres, appearconspicuously bright when viewed with differential interference contrast (Nomarski) optics asseen in B. Acid phosphatase activity, presumably in macrophages, is present at the periphery ofthe muscle fibre remnants (C, one at arrow) as well as dispersed among the regenerated fibres(C, spot-like staining as the one at the arrowhead). Scale bar in C indicates 100 µm and appliesalso to A and B.
41
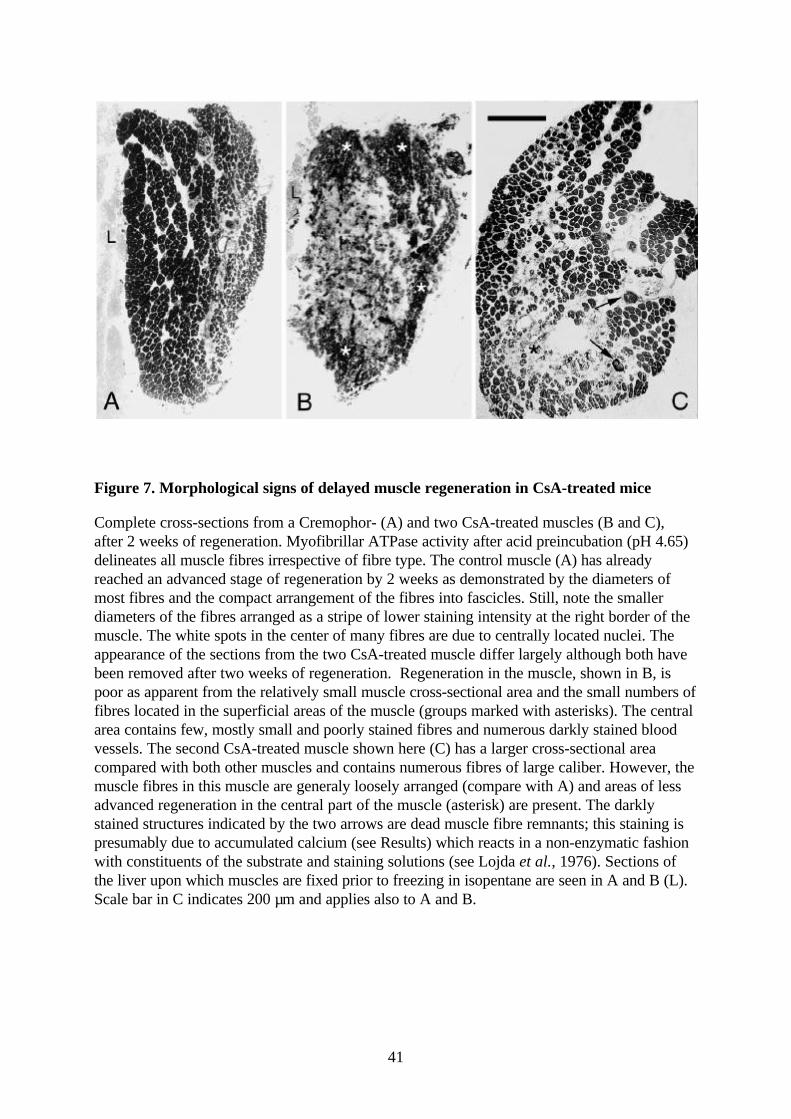
Figure 7. Morphological signs of delayed muscle regeneration in CsA-treated mice
Complete cross-sections from a Cremophor- (A) and two CsA-treated muscles (B and C),after 2 weeks of regeneration. Myofibrillar ATPase activity after acid preincubation (pH 4.65)delineates all muscle fibres irrespective of fibre type. The control muscle (A) has alreadyreached an advanced stage of regeneration by 2 weeks as demonstrated by the diameters ofmost fibres and the compact arrangement of the fibres into fascicles. Still, note the smallerdiameters of the fibres arranged as a stripe of lower staining intensity at the right border of themuscle. The white spots in the center of many fibres are due to centrally located nuclei. Theappearance of the sections from the two CsA-treated muscle differ largely although both havebeen removed after two weeks of regeneration. Regeneration in the muscle, shown in B, ispoor as apparent from the relatively small muscle cross-sectional area and the small numbers offibres located in the superficial areas of the muscle (groups marked with asterisks). The centralarea contains few, mostly small and poorly stained fibres and numerous darkly stained bloodvessels. The second CsA-treated muscle shown here (C) has a larger cross-sectional areacompared with both other muscles and contains numerous fibres of large caliber. However, themuscle fibres in this muscle are generaly loosely arranged (compare with A) and areas of lessadvanced regeneration in the central part of the muscle (asterisk) are present. The darklystained structures indicated by the two arrows are dead muscle fibre remnants; this staining ispresumably due to accumulated calcium (see Results) which reacts in a non-enzymatic fashionwith constituents of the substrate and staining solutions (see Lojda et al., 1976). Sections ofthe liver upon which muscles are fixed prior to freezing in isopentane are seen in A and B (L).Scale bar in C indicates 200 µm and applies also to A and B.
Related Documents