BSEM Program Bedugul Green Fresh Mart By: Umi Nur Cholifah & Sri Weni

Welcome message from author
This document is posted to help you gain knowledge. Please leave a comment to let me know what you think about it! Share it to your friends and learn new things together.
Transcript

BSEM Program
Bedugul Green Fresh Mart
By:Umi Nur Cholifah
&Sri Weni

Executive Summary of BGFM
Vision:1) To be a vegetable supplier and determined to develop a business in systematic and planned into a formidable company and position themselves strategically in the business of trade and production in agriculture.2) Raised the value of selling local farm produce International.3) Being a major supplier of vegetables to Denpasar area, Kuta, and Nusa Dua.

Mission:1) Strive to increase the quality of service and production to match the high standards that can fulfill consumer demand.2) Continually improve guidance to customers in order as business partner.3) And expanding network of infinite market. Objective:1) Management based on the principles of efficient and effective, so as top and a high income to develop the business and improve the welfare of employees.2) Improve the quality of human resources in accordance with the culture and the culture of the company, so it can deliver a high work ethic and sense of creative.
Goals:1) Government programs to help create a healthy society by providing fresh vegetables and hygienic.2) Provide our customers with high quality product and excellent service at the reasonable price.3) We maintain quality and product quality.
Project Background The Meaning of this name is supplied we started this business from Bedugul area as the Largest vegetables producting in Bali which become the main supplier of vegetables at the same time supporting us. The Green Fresh Mart has the intention that we are the supplier of fresh vegetables. Our project will be located at Bay Pass Ngurah Rai Street, Sumbatan Kendal No.18x Denpasar, Bali, Indonesia.

Management Feasibility
BGFM apply the Six Sigma System to support running the business.DMAIC:(Define, Measure, Analyze, Improve, & Control)There are three major groups in which each held by our members:1. Sri Weni: Responsible in the division of
Define and Measure system.2. Umi Nur Cholifah: Responsible in the
division of Analyze system and Improve.3. Sri Weni: For Control system.

Marketing Feasibility We will give examples for free as a way to promote our products to consumers in addition to promoting products through the current growing media .
We will also continue to maintain good relationships and communicate with all consumers.
We noticed is that will attempt delivery of products to consumers in order to quickly and no defects.
Our marketing system that will be run to start our business is after wards will start from explaining the products.

Production Feasibility
Our products which we seek is the result of a local farm where the farmer is still relatively little use of modern methods. The advantages of our products is to be the sole supplier of organic vegetables

Financing and Financial FeasibilityTotal of our Capital is HK$ 450,000.00
Share Capital
HK$300,000.00
67%
Loan HK$150,000.0
033%
Share of Capital
Social & Economic Feasibility
With a concept~~~~Corporate Social Resposibility.
As a company we have a responsibility to the various forms of the entire user interests include consumers, employees, shareholders, communities and the environment in all aspects of company operations that Include : Social, economic, and environment. (wikipedia.co.id)

SWOT AnalysisSTRENGTH: 1. Organic vegetables have a sweeter taste compared to non-organic vegetables. 2. Organic vegetables have a higher sale value (more expensive) compared to non-organic. 3. Can be a source of food that is safe and nutritious as it contains no toxins to be able to improve public health. 4. Organic vegetables containing Vitamin C, Potassium, and higher Beta Carotene.
WEAKNESSES: 1. Organic vegetables look less attractive, such as smaller size and the leaves with holes. 2. Prices are quite expensive 3. Results products organic vegetables is lower than in conventional vegetables.
OPPORTUNITIES: 1. Has a very good prospect because it can support capital from foreign investors. 2. Eventually the whole world will drive the economy into the concept of the Green Economy as a concept that will support sustainable development. ( Consept Economy , Davit Darmawan, 2009)
THREAT: 1. Low organic vegetable production makes little supply shortage. 2. Constraint is the least fertile land area. 3. Products of high quality and has a market segment, the top layer of society. 4. Prices are set much higher than conventional agricultural products. 5. Companies can not charge a higher price compared to competitors.

SWOT Position
y (Opportunity)
X(Weakness) x(Strength)
III II
y(Threat)
4,5
3,5
IIV
SWOT Position is in Quadrant I it is mean strategy of our company available to use for marketing are Aggressive Strategy.

Planning Phase Strategy

SWOT Analysis of Main Competitor
Strength Weakness
1. Popularly2. Brand
Awareness3. Large
Offer4. Good
Packing5. Good
Quality6. Many of
cooperation network
1. Expensive2. Location3. Expedition4. Service5. Only seal
at retail prices
Attribute
Weight Rating ( Scale=1-5; 1- Poor, 5-Excellent
Must total 100%
BGFM RFT BOA BROF WM
Customer Awareness 20% 4,0 4,0 5,0 3,0 3,0
Product Quality 40% 5,0 3,0 5,0 3,0 3,0Product
Availability 25% 4,0 4,0 5,0 4,0 3,0
Technical Assistance 5% 3,0 4,0 4,0 3,0 1,0
Selling Staff 10% 4,0 4,0 4,0 2,5 2,0
Total 100% 20,0 19,0 23 18,5 12,0
Score Average 4 3,8 4,6 3,7 2,4

Competitive Advantage
Service
Quality Product
Promotion
Efford able Price
Large selection of product

Brand Positioning Chart
Quality Design Price Service Warrant Credibility0
10
20
30
40
50
60
70
80
90
Bedugul Green FreshMart Rumah Fair TradeBali Organic Assosiation Bali Rungu Organic FarmWet Market

Distribution Flow
Distribution Channel
Bedugul Green
FreshMart
Reatail
Consumers
• Carrefour Bali• Makro Bali
Supermarket
• Surya Husada Hospital• Balimed hospitalHospital• gateway of India Authentic Indian Food
• Harmony Vegetarian• The Oberoi
Restaurant• The Royal Beach Seminyak
• Devine Earth BaliHotel

Our Product

Product Benefit
Organic Produce contains fewer pesticides Organic food is often fresher. Organic farming is better for the environment. Organically raised animals are not given antibiotics,
growth harmonic, or fed animal by products. Organic produce may also increase the body’s
immunity and prevent the growth of cancer cells.

Capital and ContributionNo Category Total(HK$)
1 Building and Transportation 208,1952 Machine & Equipment 18,7203 Other civil work 16,1454 Pre Operating Expenses 206,940 Total Project Cost 450,000
No Category Debit(equity) Contribution%
1Umi Nur Cholifah 160,000 53
2 Sri Weni 140,000 47Total 300,000 100

Capital and Loan
Category Percentage Amount
Share/ Capital 67 300,000
Loan 33 150,000Total Capital And Loan 100 450,000

Machine and Equipment
No Machine & Equipment
Price(HK$)
Unit
Total (HK$)
1Packing Press Machine 2,000 1 2,000
2 Labeling Machine 500 2 1,0003 Numbering/Code 350 2 7004 Calculator 70 2 1405 Packing Box 90 9 8106 Refrigerator 5,500 1 5,5007 Basket 50 9 4508 Knife 10 4 409 Scissors 10 4 4010 Cutter 10 4 4011 Table 750 2 1,50012 Scales 1,000 2 2,00013 Air Condition 4,500 1 4,500 Total 18,720

Materials
No Items Price(HK$)
Daily(HK$)
Monthly
(HK$)
Yearly(HK$)
1 Spinach $20 x20 kg 400 12,000 144,0002 Green
Cabbage$21 x 30
kg 630 18,900 226,8003
Kale$10 x 25
kg 250 7,500 90,0004
Cucumber$20 x 20
kg 400 12,000 144,0005
Salary$16 x 10
kg 160 4,800 57,6006 Cassava
Leaves$18 x 15
kg 270 8,100 97,2007 Bitter
Cucumber $8 x 13 kg 104 3,120 37,4408 Cabbage $8 x 20 kg 160 4,800 57,6009
Bok Choy$15 x 15
kg 225 6,750 81,00010 Beans $8 x 15 kg 120 3,600 43,20011 Plastic
Wrapping$10 x 1
Roll 10 300 3,60012 Rubber Band $10 10 300 3,60013
Plastic Bag$10 x 1
Pack 10 300 3,60014 Other $100 100 3,000 36,000
Total Materials 85,470
1,025,640
Direct & Indirect Labour Salary
No CategoryPerson
inCharge
Monthly (HK$)
Yearly (HK$)
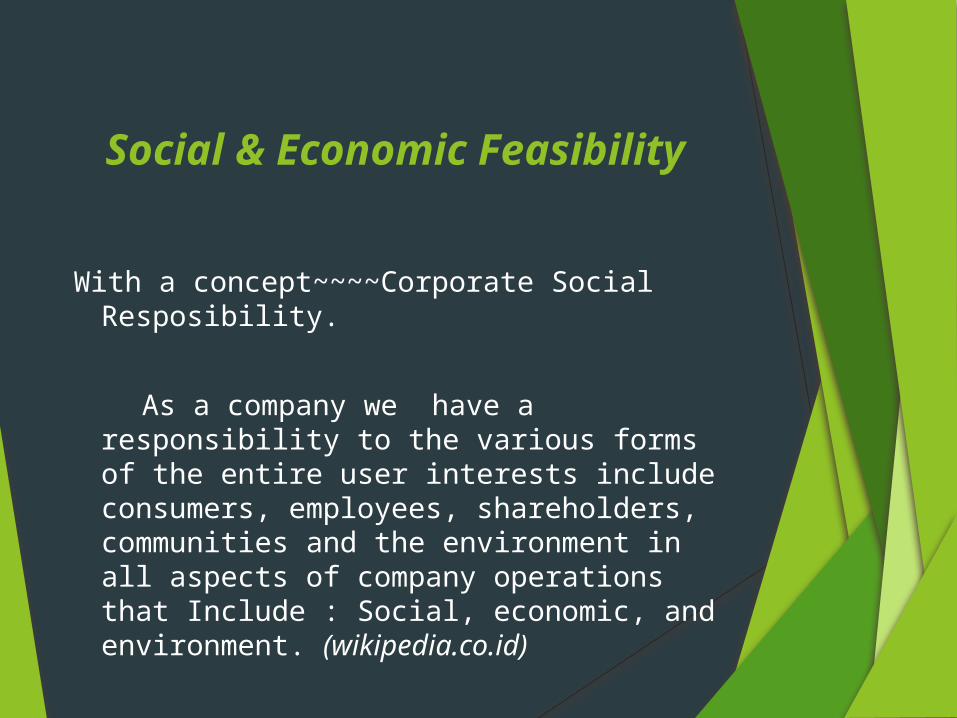
1Head Production & QC 1 1,000 12,000
2PPC & Designer Product 1 1,000 12,000
3 Sales 1 792 9,5004 Expedition 1 792 9,5005 Workers @750 x 4 4 3,000 36,000
Total Direct Labor
Salary 8 6,600 79,000
No Category Monthly Yearly
1 General Manager 3,000 36,0002 Production & HRD Manager 2,000 24,000
3Marketing & Financial Manager 2,000 24,000
Total Indirect Labor Salary 7,000 84,000

Office Depreciation
No Category Unit
Price
(HK$)
Cost (HK$)
Expected
Life
Depreciation (HK$)
1 Computer 33,20
0 9600 5 1,123
2 Photo Copy 1 350 350 5 41
3 Type Writer 1 450 450 5 53
4 Telephone 1 425 425 7 50
5 Table 31,00
0 3000 7 351
6 Chair 9 100 900 5 1057 Locker 1 850 850 7 100
8Water Dispenser 1 350 350 3 41
9 Rabbis Bin 1 70 70 3 810 Calculator 3 50 150 5 18
Total 16,1
45 1,890
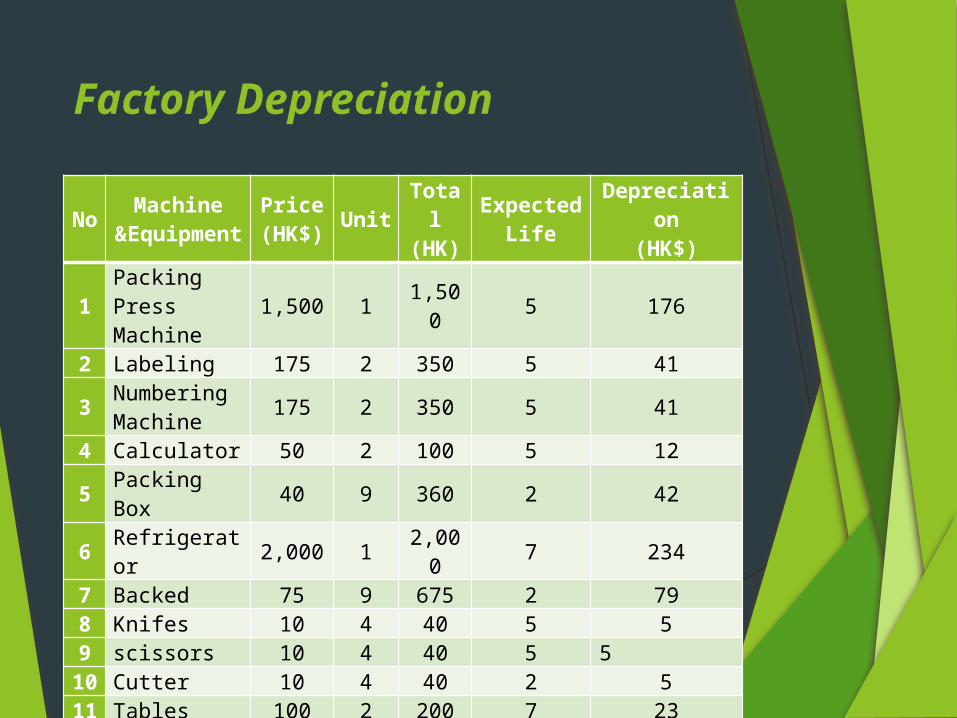
Factory Depreciation
No Machine &Equipment
Price(HK$) Unit
Total
(HK)
ExpectedLife
Depreciation
(HK$)
1Packing Press Machine
1,500 1 1,500 5 176
2 Labeling 175 2 350 5 41
3 Numbering Machine 175 2 350 5 41
4 Calculator 50 2 100 5 12
5 Packing Box 40 9 360 2 42
6 Refrigerator 2,000 1 2,00
0 7 234
7 Backed 75 9 675 2 798 Knifes 10 4 40 5 59 scissors 10 4 40 5 510 Cutter 10 4 40 2 511 Tables 100 2 200 7 2312 Scales 450 2 900 5 105
13 Air condition 1,500 1 1,50
0 5 176
Total8,055 944

Projected Sales
No Items Kg Price(HK$)
Daily(HK$)
Monthly(HK$)
Yearly(HK$)
1 Spinach 18 35 630 18,900 266,800
2Green Cabbage 28 36 1,008 30,240 362,880
3 Kale 18 18 324 9,720 116,6404 Cucumber 10 35 350 10,500 126,0005 Salary 13 30 390 11,700 140,400
6Cassava Leaves 18 32 576 17,280 207,360
7Bitter Cucumber 13 18 234 7,020 84,240
8 Broccoli 18 18 324 9,720 116,6409 Bok Choy 12 25 300 9,000 108,000
10 Beans 13 18 234 7,020 84,240
Total161 265 4,370 131,100 1,573,200

Amortization & Operating Expenses Amortization
Operating Expenses
Year Loan Interest
Expense
Payment ofPrinciple
Loan
Total Amortization
0 150,000 0 0 0
1 127,680 22,500 22,320 44,820
2 102,012 19,152 25,668 44,820
3 72,494 15,302 29,518 44,8204 38,548 10,874 33,946 44,8205 0 5,782 39,038 44,820
Items Monthly(HK$) Yearly(HK$)
Salaries (Indirect Labor ) 7,000 84,000Rent 1,500 18,000Utilities 300 3,600Telephone 500 6,000Promotion 500 6,000Depreciation 1,890Insurance 250 3,000Office Supplies 250 3,000Total Supplies 10,300 125,490
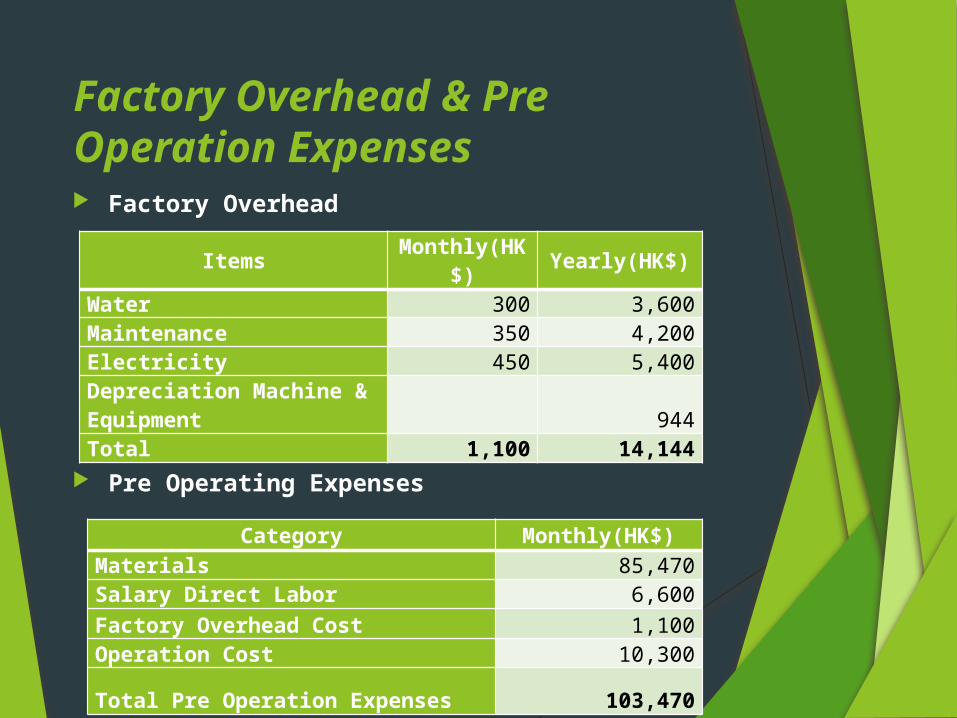
Factory Overhead & Pre Operation Expenses Factory Overhead
Pre Operating Expenses
Items Monthly(HK$) Yearly(HK$)
Water 300 3,600Maintenance 350 4,200Electricity 450 5,400Depreciation Machine & Equipment 944Total 1,100 14,144
Category Monthly(HK$)Materials 85,470Salary Direct Labor 6,600Factory Overhead Cost 1,100Operation Cost 10,300
Total Pre Operation Expenses 103,470

Cash Flow for Pre Operating Expenses
Month 1 2 3 4 5
Cash In 165,6
60165,6
60165,6
60165,66
0
Cash out103,47
0103,4
70103,4
70103,4
70103,47
0
Net Cash
-103,47
062,19
062,19
062,19
0 62,190
Cumulative Cash
-103,47
0
-41,28
020,91
083,10
0145,29
0

Cost of Good Sold Year 1 Year 2 Year 3 Year 4 Year 5Direct Material Used
Purchase, January 1,025,6401,076,92
21,130,76
81,187,30
61,246,67
1Total Available for Uses 1,025,640
1,076,922
1,130,768
1,187,306
1,246,671
Less: Material Inventory 51,282 53,846 56,538 59,365Direct Material Used 1,025,640
1,025,640
1,076,922
1,130,768
1,187,306
Direct Labor 79,000 82,950 87,096 91,451 96,024Factory Overhead 14,144 14,851 15,594 16,374 17,193Total Manufacturing Cost 1,118,784
1,123,441
1,179,612
1,238,593
1,300,523
Add: Work In Process, January 55,939 56,172 58,981 61,930Cost of Goods Put Into Process 1,118,784
1,179,380
1,235,780
1,297,574
1,362,453
Less: Work In Process, December 55,939 58,969 61,789 64,879Cost of Goods Manufacturing 1,118,784
1,123,441
1,176,811
1,235,785
1,297,574
Add: Finish Goods, January 55,939 56,172 58,841 61,789Total Goods Available for Sale 1,118,784
1,179,380
1,232,987
1,294,626
1,359,363
Less: Finish Goods, 55,939 58,969 61,649 64,731
Cost of Goods Sold 1,118,7841,123,44
11,174,01
81,232,97
71,294,63
2

Projected Income Statement Year 1 Year 2 Year 3 Year 4 Year 5
Projected Sales 1,573,200 1,651,860 1,734,453 1,821,176 1,912,235Less: Cost Goods Sold 1,118,784 1,123,441 1,174,018 1,232,977 1,294,632 Gross Profit 454,416 528,419 560,435 588,199 617,603 Operating Expenses Salaries (Indirect Labor) 84,000 92,400 101,640 111,804 122,984Rent 18,000 19,800 21,780 23,958 26,354Utilities 3,600 3,960 4,356 4,792 5,271Telephone 6,000 6,600 7,260 7,986 8,785Promotion 6,000 6,600 7,260 7,986 8,785Depreciation 1,890 2,079 2,287 2,516 2,768Insurance 3,000 3,300 3,630 3,993 4,392Office Supplies 3,000 3,300 3,630 3,993 4,392Interest Rate 22,500 19,152 15,302 10,874 5,782Total Operating Expenses 147,990 157,191 167,145 177,902 189,514 Net Profit Before Tax 306,426 371,228 393,290 410,290 428,089Tax (5%) 15,321 18,561 19,665 20,515 21,405 Net Profit 291,105 352,667 373,625 389,782 406,684 Return On Sales 18% 21% 22% 22% 21%Return On Investment 65% 78% 83% 87% 90%
Gross Profit Margin 29% 32% 32% 32% 32%

Net Profit Chart
1 2 3 4 5
291,105352,667 373,625 389,782 406,684
Net Profit

Cash Flows Year 0 Year 1 Year2 Year 3 Year 4 Year 5In Flow
Loan150,00
0
Capital300,00
0 Net Profit+ Depreciation
293,939
355,737 376,953 393,391
410,600
Total In flow450,00
0293,93
9355,73
7 376,953 393,391410,60
0Out Flow Building &Transport
208,195
Machine & Equipment 18,720 Other Civil Work 16,145 Payment of Principle Loan 22,320 25,668 29,518 33,946 39,038Pre Operating Expenses
206,940
Total Out Flow450,00
0 22,320 25,668 29,518 33,946 39,038 Net Cash In Flow-Out Flow 0
271,619
330,069 347,435 359,445
371,562
Cash Balance Beginning 0
271,619 601,688 949,123
1,308,568
Cash Balance End 0271,61
9601,68
8 949,1231,308,5
681,680,
130
Annual Cash Flow 271,61
9330,06
9 347,435 359,445371,56
2Average Cash Flow 336,026
Pay Back Period 9 Months

Break Event Point
Percentage Projection of SalesProduct Code Daily Kg Percentage
BY 18 11%SW 28 18%CC 18 11%TM 10 6.5%S1 13 8%DS 18 11%PR 13 8%BK 18 11%BC 12 7.5%BE 13 8%Total 161 100%
Year 1 Year 2 Year 3 Year 4 Year 5
Sales1,573,20
01,651,8
601,734,4
531,821,1
761,912,
235
Fixed Cost 103,470 113,817 125,199 133,719147,49
1
Variable Cost1,118,78
41,123,4
411,174,0
181,232,9
771,294,
632Contribution Margin Ratio 0.3 0.3 0.3 0.3 0.3
BEP-Sales 344,900 379,390 417,330 445,730491,63
7 BEP-Units 1,302 1,434 1,575 1,682 1,855
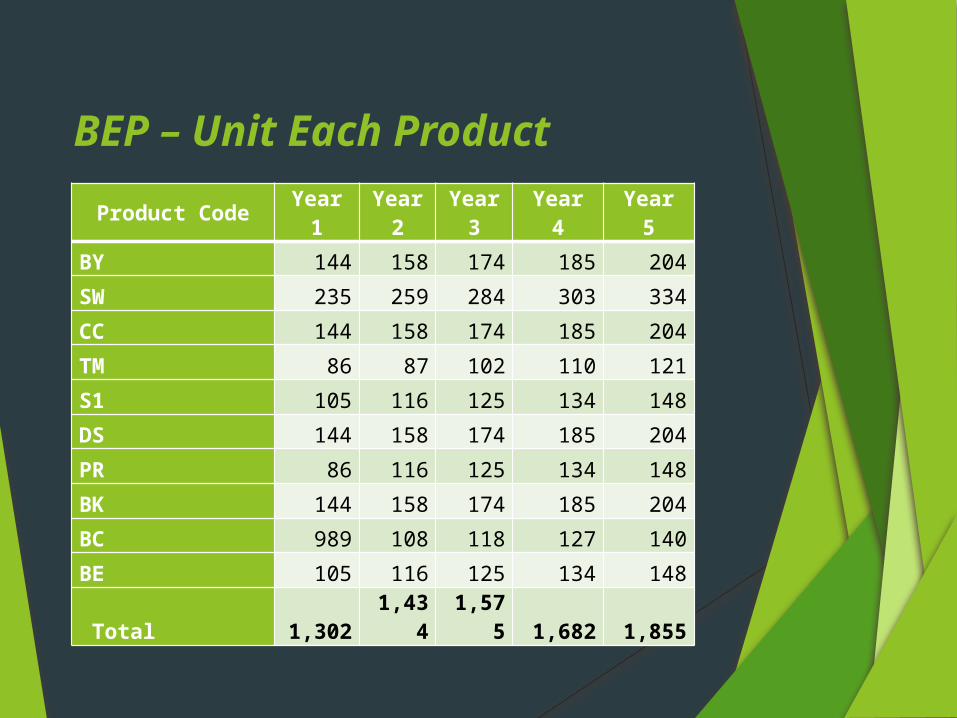
BEP – Unit Each ProductProduct Code Year
1Year 2
Year 3
Year 4
Year 5
BY 144 158 174 185 204SW 235 259 284 303 334CC 144 158 174 185 204TM 86 87 102 110 121S1 105 116 125 134 148DS 144 158 174 185 204PR 86 116 125 134 148BK 144 158 174 185 204BC 989 108 118 127 140BE 105 116 125 134 148
Total 1,3021,43
41,57
5 1,682 1,855
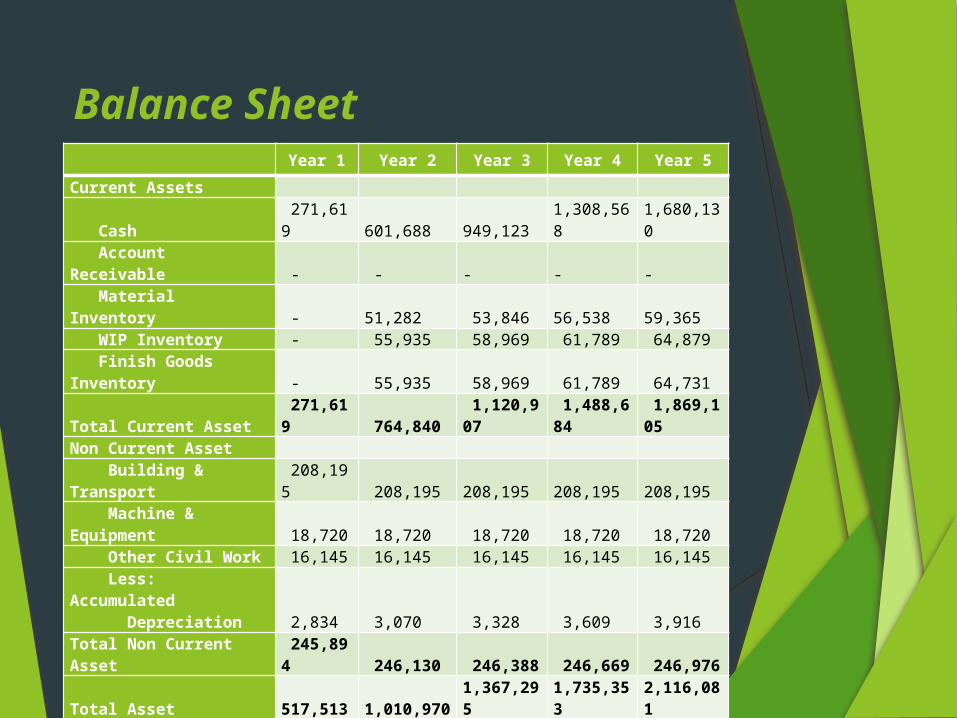
Balance SheetYear 1 Year 2 Year 3 Year 4 Year 5
Current Assets
Cash 271,619 601,688 949,123
1,308,568
1,680,130
Account Receivable - - - - - Material Inventory - 51,282 53,846 56,538 59,365 WIP Inventory - 55,935 58,969 61,789 64,879 Finish Goods Inventory - 55,935 58,969 61,789 64,731
Total Current Asset 271,619 764,840
1,120,907
1,488,684
1,869,105
Non Current Asset Building & Transport
208,195 208,195 208,195 208,195 208,195
Machine & Equipment 18,720 18,720 18,720 18,720 18,720 Other Civil Work 16,145 16,145 16,145 16,145 16,145 Less: Accumulated Depreciation 2,834 3,070 3,328 3,609 3,916Total Non Current Asset
245,894 246,130 246,388 246,669 246,976
Total Asset 517,513 1,010,9701,367,295
1,735,353
2,116,081
Liabilities
Account Payable 127,680 102,012 72,494 38,548 -
Total Liabilities 127,680 102,012 72,494 38,548 -
Capital Capital Beginning 98,728 556,291 921,176
1,307,023
1,709,941
Net Income 291,105 352,667 373,625 389,782 406,680
Capital at the end of the year
389,833 908,958
1,294,801
1,696,805
2,116,621
Total Liabilities & Capital
517,513 1,010,970
1,367,295
1,735,353
2,116,621
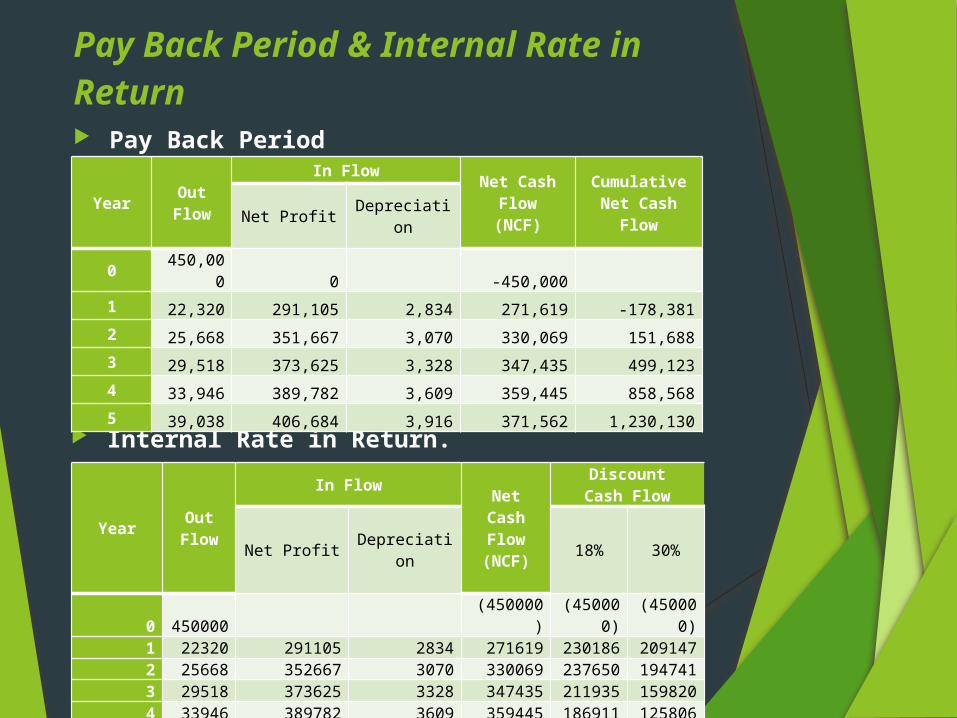
Pay Back Period & Internal Rate in Return Pay Back Period
Internal Rate in Return.
Year Out Flow
In Flow Net Cash Flow(NCF)
CumulativeNet Cash
FlowNet Profit Depreciation
0 450,000 0 -450,000
1 22,320 291,105 2,834 271,619 -178,3812 25,668 351,667 3,070 330,069 151,6883 29,518 373,625 3,328 347,435 499,1234 33,946 389,782 3,609 359,445 858,5685 39,038 406,684 3,916 371,562 1,230,130
Year Out Flow
In Flow Net Cash Flow(NCF)
DiscountCash Flow
Net Profit Depreciation 18% 30%
0 450000 (450000
)(45000
0)(45000
0)1 22320 291105 2834 271619 230186 2091472 25668 352667 3070 330069 237650 1947413 29518 373625 3328 347435 211935 1598204 33946 389782 3609 359445 186911 1258065 39038 406684 3916 371562 163487 100322
Total 580169 339836

Net Present Value & Profitability/Benefit Cost Ratio Net Present Value
Profitability Index/Benefit Cost RatioNPV : 977,113
Total Project: 450,000
PI : 2,17
Year Net Cash Flow Factor of PV Present Value
1 271619 0.833 2262592 330069 0.694 2290683 347435 0.579 2011654 359445 0.482 1732535 371562 0.402 147368
NPV 977113
Analyze Project FeasiblePI > 1PI < 1
Project FeasibleProject non Feasible

Feasibility Analysis Gross Profit Margin : 29% Return on Sales : 20% IRR : 26% MARR : 20% ROR : 1 = 20% Pay Back Period : 9 Months Current Ratio :2,13 Quick Ratio : 1 Cash Ratio :2,127 Interest Coverage Ratio : 20,2 Times Inventory Turnover : 21 Times Net Profit Margin : 2% Return on Investment : 88% Return on Equity : 64% Benefit Cosh Ratio : 2,2

Other BeneficiaryBGFM will accommodate vegetables from the farmers to be processed into organic fertilizer and will be re-distributed to farmer BGFM, With price affordable and very cheap.
Source: www.pupukkaltim.com

Project Time Table
ActivitiesDec
2014
Jan
2015
Feb
2015
Mar
2015
Apri
l
20151.Analyse the type of business and draft
2. Prepare the feasibility study for the
project.
3.Prepare Company Legal Registration.
4.Negotiation with farmers, Lobbying
potential customers, and the owner of
the land to the place of project.
5.Determination, Management,
Engineering, and Marketing Contract.
6.Arrangement for management ;
Selection, Recruitment, and Training of
Staff.
7. Arrangement for operation
Preparing ; Construction, Installation
of land, Building, Machineries, and the
Equipment.
8. Arrangement for marketing ;
Advertising, and Promotion.
9.Opening and project starts.
10.The project was able to run normally.

Conclusion
Based on some feasibility analysis we have done that; Management Feasibility, Marketing Feasibility, Feasibility Production, Socio Economy Feasibility, and Financial Feasibility and after careful consideration of all factors, it can be prudently concluded that project of Bedugul Green Fresh Mart is indeed feasible.

Thank You For This
Moment.Hong Kong, 29 November 2014
Related Documents