1 Continuous Continuous- Wave (CW) Wave (CW) Spectrometers Spectrometers The spectrometer scans through a range of frequencies The sample is interrogated with one frequency at a time. As the frequency range is scanned, a plot of signal intensity vs. frequency is generated. Fourier Transform (FT) Fourier Transform (FT) Spectrometers Spectrometers The sample is interrogated with a range of freqencies, “all frequencies at once.” The decay of the signal over time is observed as a Free Induction Decay (FID) A Fourier transform changes the signal vs. time plot into a signal vs. frequency plot. A typical FID

Welcome message from author
This document is posted to help you gain knowledge. Please leave a comment to let me know what you think about it! Share it to your friends and learn new things together.
Transcript

1
ContinuousContinuous--Wave (CW) Wave (CW) SpectrometersSpectrometers
The spectrometer scans through a range of frequenciesThe sample is interrogated with one frequency at a time.As the frequency range is scanned, a plot of signal intensity vs. frequency is generated.
Fourier Transform (FT) Fourier Transform (FT) SpectrometersSpectrometers
The sample is interrogated with a range of freqencies, “all frequencies at once.”The decay of the signal over time is observed as a FFree IInduction DDecay (FID)A Fourier transform changes the signal vs. time plot into a signal vs. frequency plot.
A typical FID

2
FT SpectrometersFT SpectrometersA Fourier-transform instrument� Irradiates the sample with a specified range of
frequencies (sweep widthsweep width) for a specified period of time (pulse widthpulse width).
�Observes the FID (observation timeobservation time) and waits for sample to “relax” to its ground state before irradiating again (relaxation delayrelaxation delay).
� Transforms the FID into a signal/frequency plot.Relaxation times: needed to make sure signal is reproducible�Short for IR spectroscopy (several microseconds)� Long for NMR (several seconds)
Advantages of FT over Advantages of FT over CW SpectrometersCW Spectrometers
If a signal is weak, many scans must be averaged to enhance the signal/noise ratio.�Signal/noise ratio rises as the square rootsquare root of
number of scans�Only FT instruments can obtain a large number of
scans in a reasonable time.A scan can be performed much more quickly.�CW-IR: 7 minutes; FT-IR: 1-3 seconds.�CW-NMR: 5 minutes; FT-NMR: 5 seconds.

3
Infrared SpectroscopyInfrared SpectroscopyThe IR region covers � 7.8 x 10⁻⁷ m (just above the visible region) to� 2.0 x 10⁻³ m (just below the microwave region)
Organic chemistry uses mainly the vibrationalIR, which covers� 2.5 x 10⁻⁶ m (2.5 μm) to 2.5 x 10⁻⁵ m (25 μm)
Absorption of IR radiation in this region causes molecules to transition from a lower vibrational energy level to a higher one
Infrared SpectroscopyInfrared SpectroscopyThe frequency of IR radiation is commonly expressed in wavenumbersWavenumber: the number of waves per centimeter, cm-1 (“reciprocal centimeters”)Expressed in wavenumbers, the vibrational IR extends from 4000 cm-1 to 400 cm -1
2.50 μm10,000 μm• cm-1
= 4000 cm-1
25.0 μm10,000 μm• cm-1
= 400 cm-1
(ν)-

4
Infrared SpectroscopyInfrared Spectroscopy
Standard IR spectra are recorded on the following scale:
4000 400
2.5 20
0
100 Micrometers
Wavenumber (cm -1)Tra
nsm
ittan
ce (%
)
Molecular VibrationsMolecular VibrationsAtoms joined by covalent bonds undergo continual vibrations relative to each other
The energies associated with these vibrations are quantized; within a molecule, only specific vibrational energy levels are allowed
The energies associated with transitions between vibrational energy levels for most covalent bonds are from 2 to 10 kcal/mol (8.4 to 42 kJ/mol)

5
Molecular VibrationsMolecular VibrationsFor a molecule to absorb IR radiation, the bond undergoing vibration�must be polar and� its vibration must cause a periodic change in the
bond moment
Covalent bonds which do not meet these criteria are said to be IR inactive � the C-C double and triple bonds of symmetrically
substituted alkenes and alkynes, for example, do not absorb IR radiation because they are not polar bonds
Molecular VibrationsMolecular VibrationsFor a nonlinear molecule containing n atoms, there are 3n -6 allowed fundamental vibrations
For even a relatively small molecule, a large number of vibrational energy levels exist and patterns of IR absorption can be very complex
The simplest vibrational motions are bending and stretching

6
Molecular VibrationsMolecular VibrationsConsider two covalently bonded atoms as two vibrating masses connected by a spring
As the bond vibrates, its energy continually changes from kinetic to potential and vice versa
The total energy (KE + PE) is proportional to the frequency of vibration

7
Molecular VibrationsMolecular VibrationsFor a simple harmonic oscillator, the frequency of a stretching vibration is given by an equation derived from Hooke’s law for a vibrating spring
N = Avogadro’s numberc = velocity of lightK = a force constant, which
is a measure of thebonds’ strength
μ = the reduced mass
ν = 12 πc
NKμinverse frequency →
(wavenumbers)
21
21
mmmm+
=μ
Molecular VibrationsMolecular VibrationsFrom this equation, we see that the position of absorption of a stretching vibration depends on� the strength of the vibrating bond and� the masses of the atoms connected by the bond
The stronger the bond and the lighter the atoms connected by the bond, the higher the wavenumber of the vibration
The intensity of absorption depends primarily on the polarity of the vibrating bond

8
OvertonesOvertonesEspecially strong peaks will show “overtones”These appear at twice the base frequencyInexperienced interpreters often interpret overtones as separate peaks!!
Base peak →
overtone →
Correlation TablesCorrelation TablesCharacteristic IR absorptions for the types of bonds and functional groups we deal with most often
1050-1250 strongweak1600-1680
1630-1810 strong2850-3300 medium to strong
strong and broad3200-3650medium3100-3500
IntensityFrequency (cm-1)Bond
C-HN-HO-H
C=OC=CC-O

9
C-Hstretches
C=Ostretch

10
HydrocarbonsHydrocarbons
stretching 3300 medium to strongstretching 2100-2250 weak
weak to medium1600 - 1680stretchingweak to medium3000 - 3100stretching
Alkyne
Alkene
AlkaneVibration
stretching
Hydro- carbon
Frequency (cm-1) Intensity
2850 - 3000 strongbending 1450 mediumbending 1375 and 1450 weak to medium
C C
CH2
C-H
CH3
C=CC-H
C-H

11

12
Conjugated HydrocarbonsConjugated Hydrocarbons
Conjugation lowers a double-bond stretch by about 40 cm-1.�Conjugated carbonyls also show a strong C=C
stretch at about 1650-1.
Aromatic rings have two or three peaks in the range 1600-1500 cm-1.

13
Alcohols & EthersAlcohols & Ethers
Bond IntensityFrequency , cm-1
medium1050 - 1250medium, broad3200 - 3500
3600-3650 weakO-H (free)O-H (hydrogen bonded)C-O

14

15

16
11--Hexyne, 1Hexyne, 1--HexeneHexene
C CH
CH CH2
17
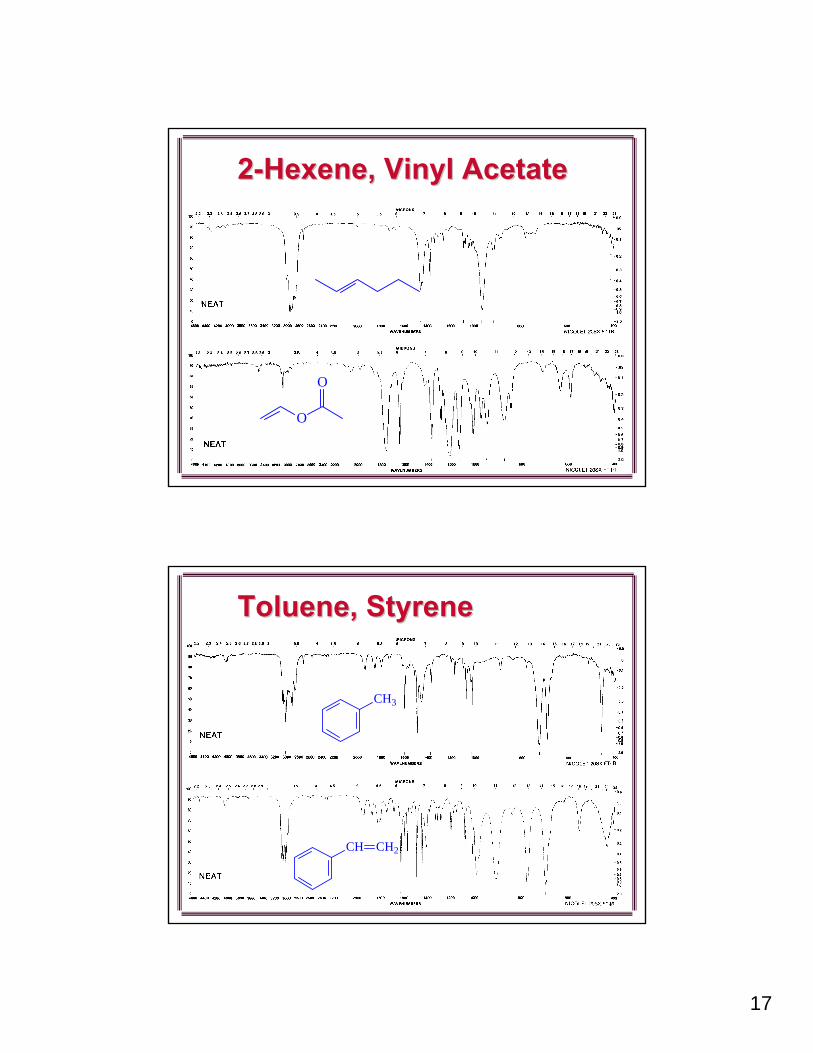
22--Hexene, Vinyl AcetateHexene, Vinyl Acetate
O
O
Toluene, StyreneToluene, Styrene
CH CH2
CH3

18
ButanamineButanamine, , DiethylamineDiethylamine
H2N
HN
TriethylamineTriethylamine, , AcetonitrileAcetonitrile
CH3C N
N

19
Acetaldehyde, AcetoneAcetaldehyde, Acetone
CH3CH
O
CH3CCH3
O
Ethyl Acetate, Acetic AcidEthyl Acetate, Acetic Acid
CH3COCH2CH3
O
CH3COH
O
Related Documents