Continuous BioManufacturing of Mabs by QbD Maurizio Cattaneo, PhD, CPIP President BioVolutions Inc. Woburn, Massachusetts, USA

Welcome message from author
This document is posted to help you gain knowledge. Please leave a comment to let me know what you think about it! Share it to your friends and learn new things together.
Transcript
Continuous BioManufacturing of Mabs by QbD
Maurizio Cattaneo, PhD, CPIP President
BioVolutions Inc. Woburn, Massachusetts, USA
Continuous Biomanufacturing
of Therapeutic Mabs Smaller equipment and facilities � More flexible operation � Reduced inventory � Lower capital costs, less work-in-progress materials � Smaller ecological footprint Integrated processing with fewer steps. � No manual handling, increased safety � Shorter processing times � Increased efficiency
On-line monitoring and control for increased product quality assurance in real-time (PAT) � Amenable to Real Time Release Testing approaches � Consistent quality
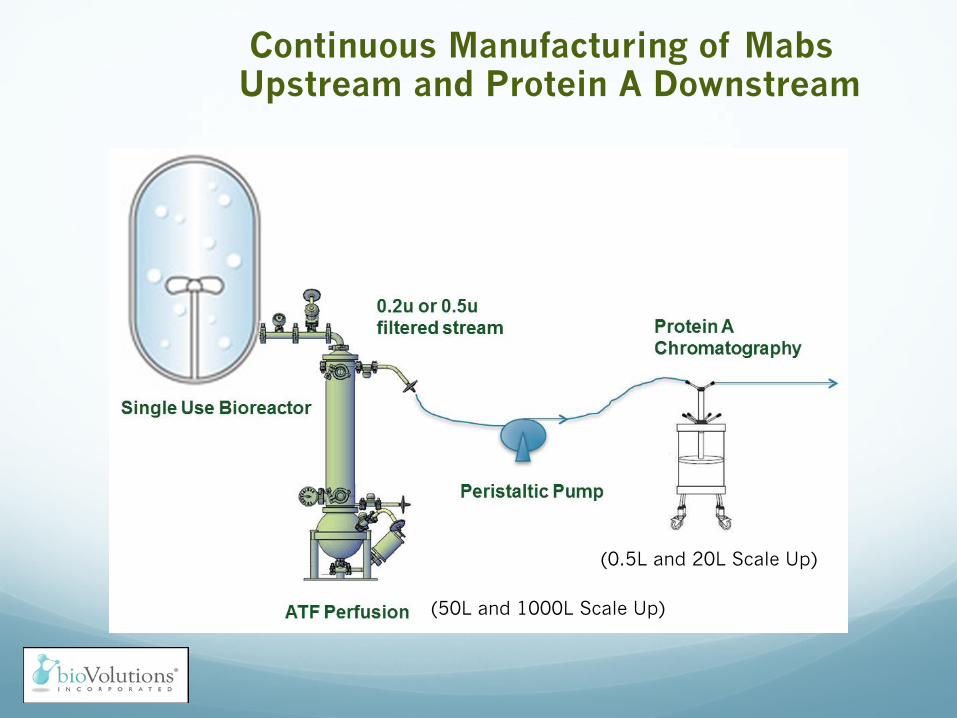
Continuous Manufacturing of Mabs Upstream and Protein A Downstream
(50L and 1000L Scale Up)
(0.5L and 20L Scale Up)
CONFIDENTIAL 4
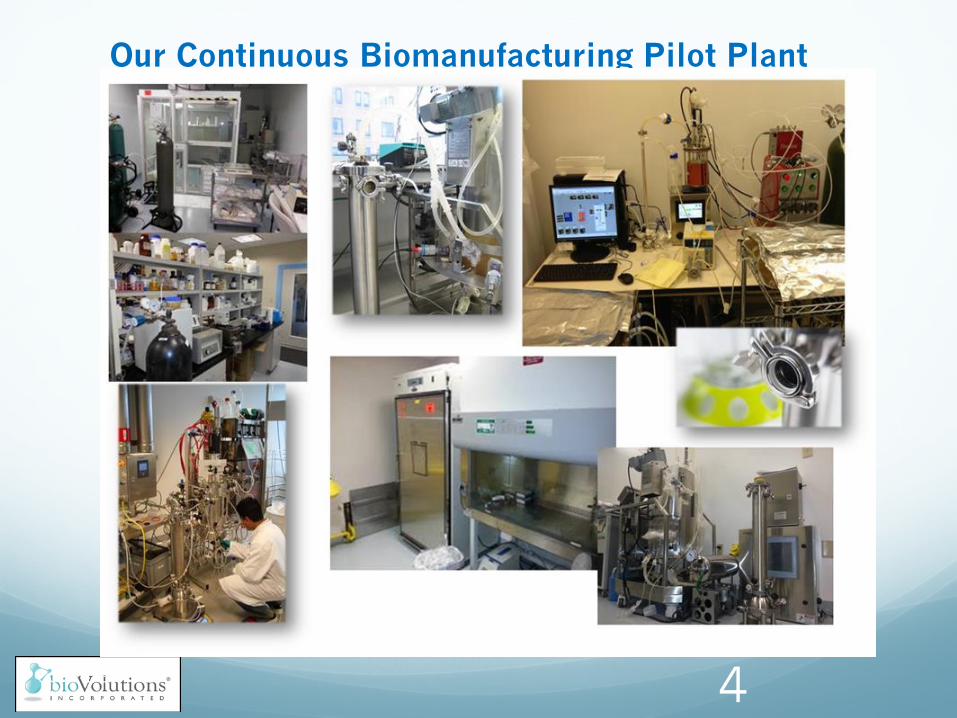
Our Continuous Biomanufacturing Pilot Plant
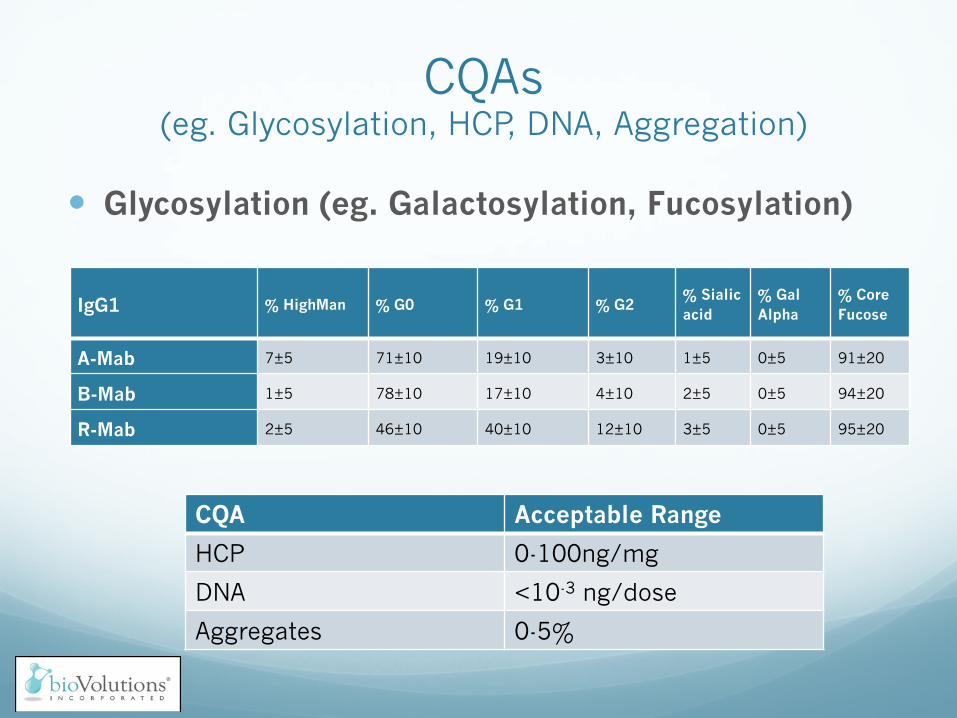
CQAs (eg. Glycosylation, HCP, DNA, Aggregation)
� Glycosylation (eg. Galactosylation, Fucosylation)
IgG1 % HighMan % G0 % G1 % G2 % Sialic acid
% Gal Alpha
% Core Fucose
A-Mab 7±5 71±10 19±10 3±10 1±5 0±5 91±20
B-Mab 1±5 78±10 17±10 4±10 2±5 0±5 94±20
R-Mab 2±5 46±10 40±10 12±10 3±5 0±5 95±20
CQA Acceptable Range
HCP 0-100ng/mg
DNA <10-3 ng/dose
Aggregates 0-5%
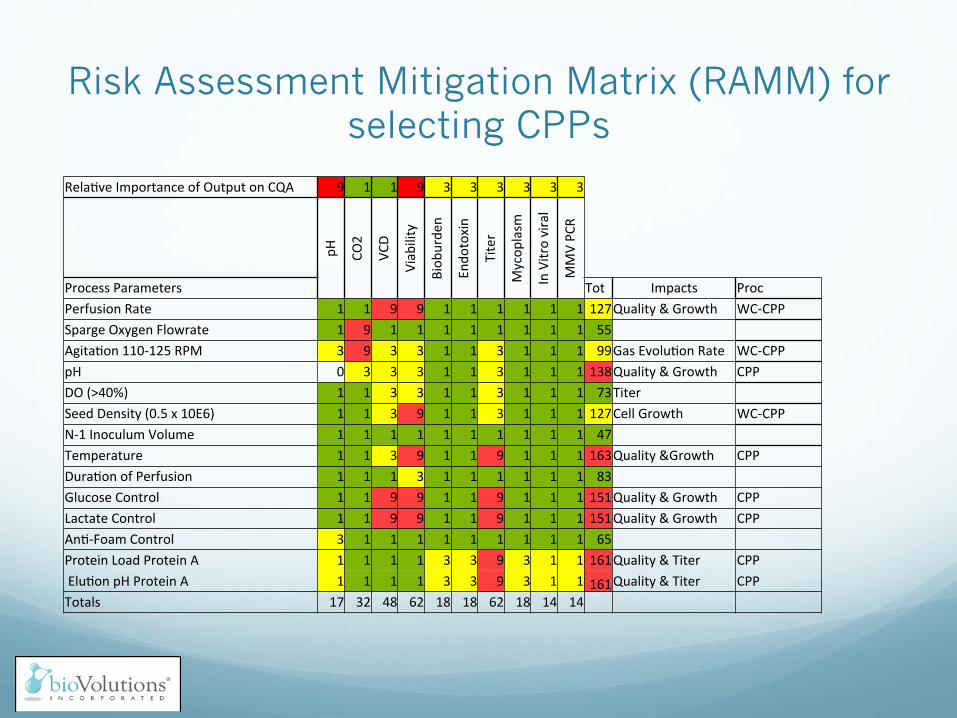
Risk Assessment Mitigation Matrix (RAMM) for selecting CPPs
Rela&ve Importance of Output on CQA 9 1 1 9 3 3 3 3 3 3
pH
CO2
VCD
Viability
Biob
urde
n
Endo
toxin
Titer
Mycop
lasm
In Vitro viral
MMV PC
R
Process Parameters Tot Impacts Proc Perfusion Rate 1 1 9 9 1 1 1 1 1 1 127 Quality & Growth WC-‐CPP Sparge Oxygen Flowrate 1 9 1 1 1 1 1 1 1 1 55 Agita&on 110-‐125 RPM 3 9 3 3 1 1 3 1 1 1 99 Gas Evolu&on Rate WC-‐CPP pH 0 3 3 3 1 1 3 1 1 1 138 Quality & Growth CPP DO (>40%) 1 1 3 3 1 1 3 1 1 1 73 Titer Seed Density (0.5 x 10E6) 1 1 3 9 1 1 3 1 1 1 127 Cell Growth WC-‐CPP N-‐1 Inoculum Volume 1 1 1 1 1 1 1 1 1 1 47 Temperature 1 1 3 9 1 1 9 1 1 1 163 Quality &Growth CPP Dura&on of Perfusion 1 1 1 3 1 1 1 1 1 1 83 Glucose Control 1 1 9 9 1 1 9 1 1 1 151 Quality & Growth CPP Lactate Control 1 1 9 9 1 1 9 1 1 1 151 Quality & Growth CPP An&-‐Foam Control 3 1 1 1 1 1 1 1 1 1 65 Protein Load Protein A 1 1 1 1 3 3 9 3 1 1 161 Quality & Titer CPP Elu&on pH Protein A 1 1 1 1 3 3 9 3 1 1 161 Quality & Titer CPP Totals 17 32 48 62 18 18 62 18 14 14
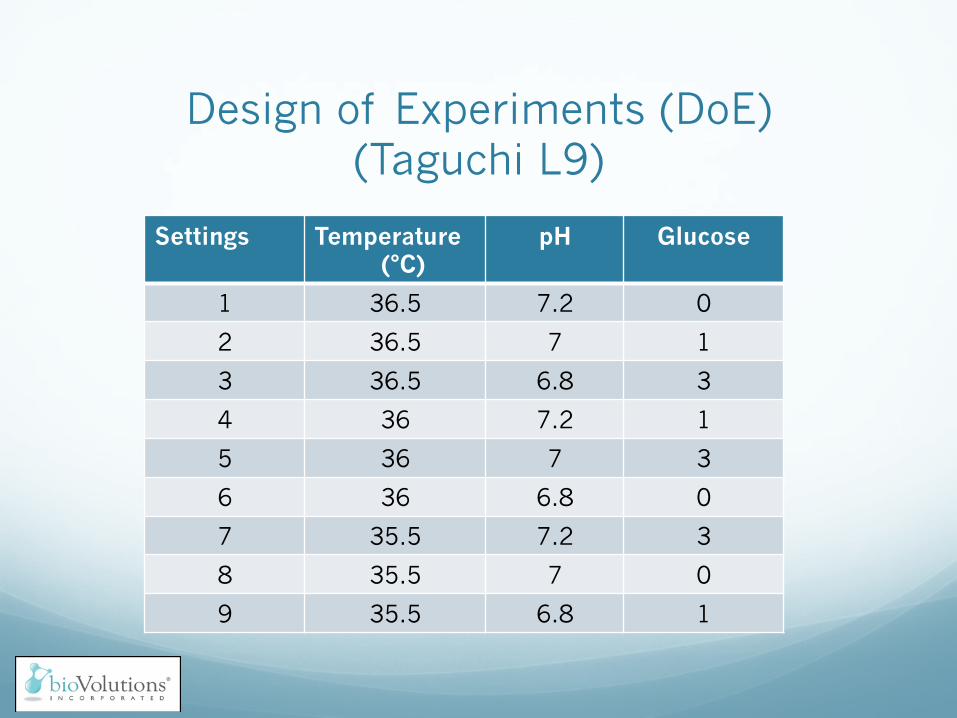
Design of Experiments (DoE) (Taguchi L9)
Settings Temperature (°C)
pH Glucose
1 36.5 7.2 0
2 36.5 7 1
3 36.5 6.8 3
4 36 7.2 1
5 36 7 3
6 36 6.8 0
7 35.5 7.2 3
8 35.5 7 0
9 35.5 6.8 1
Continuous Culture Overview
• It can produce high titers and good quality product
• Equipment is utilized more efficiently and the equipment footprint is much smaller
• The Continous System pushes productivity to
the next level, ~10x higher cell densities
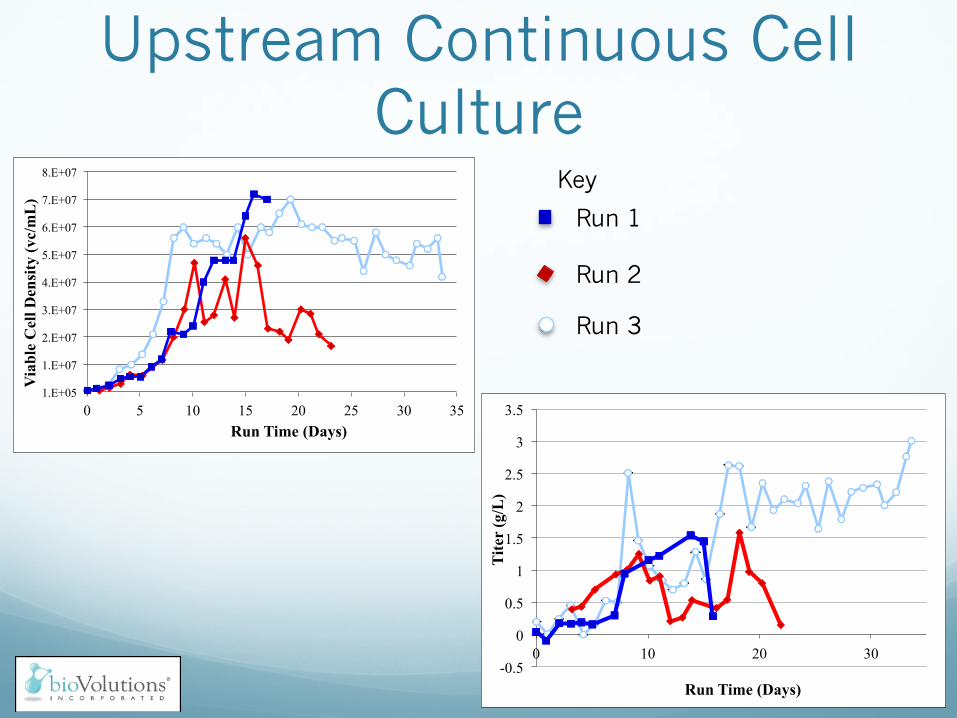
Upstream Continuous Cell Culture
1.E+05
1.E+07
2.E+07
3.E+07
4.E+07
5.E+07
6.E+07
7.E+07
8.E+07
0 5 10 15 20 25 30 35
Via
ble
Cel
l Den
sity
(vc/
mL
)
Run Time (Days)
-0.5
0
0.5
1
1.5
2
2.5
3
3.5
0 10 20 30
Tite
r (g
/L)
Run Time (Days)
Run 1
Run 2
Run 3
Key
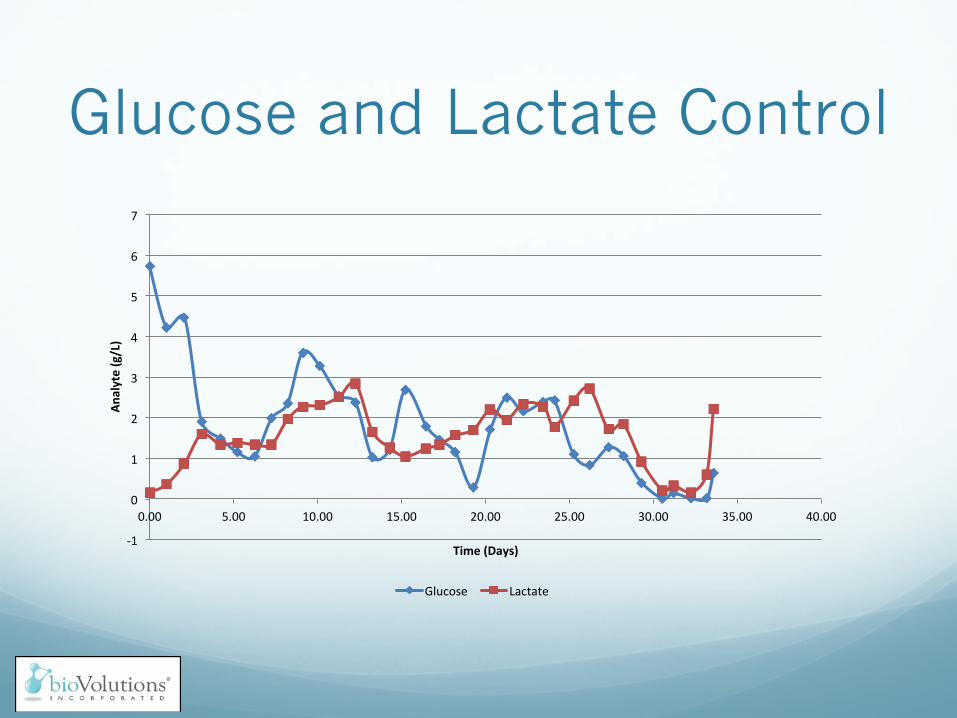
Glucose and Lactate Control
-‐1
0
1
2
3
4
5
6
7
0.00 5.00 10.00 15.00 20.00 25.00 30.00 35.00 40.00
Analyte (g/L)
Time (Days)
Glucose Lactate
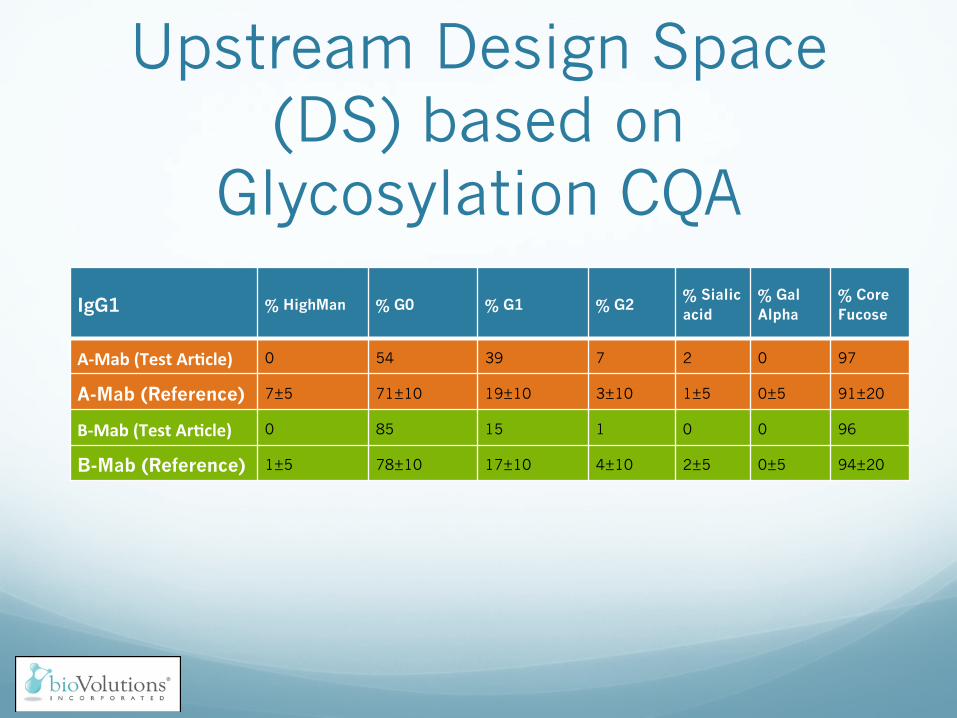
Upstream Design Space (DS) based on
Glycosylation CQA
IgG1 % HighMan % G0 % G1 % G2 % Sialic acid
% Gal Alpha
% Core Fucose
A-‐Mab (Test Ar7cle) 0 54 39 7 2 0 97
A-Mab (Reference) 7±5 71±10 19±10 3±10 1±5 0±5 91±20
B-‐Mab (Test Ar7cle) 0 85 15 1 0 0 96
B-Mab (Reference) 1±5 78±10 17±10 4±10 2±5 0±5 94±20
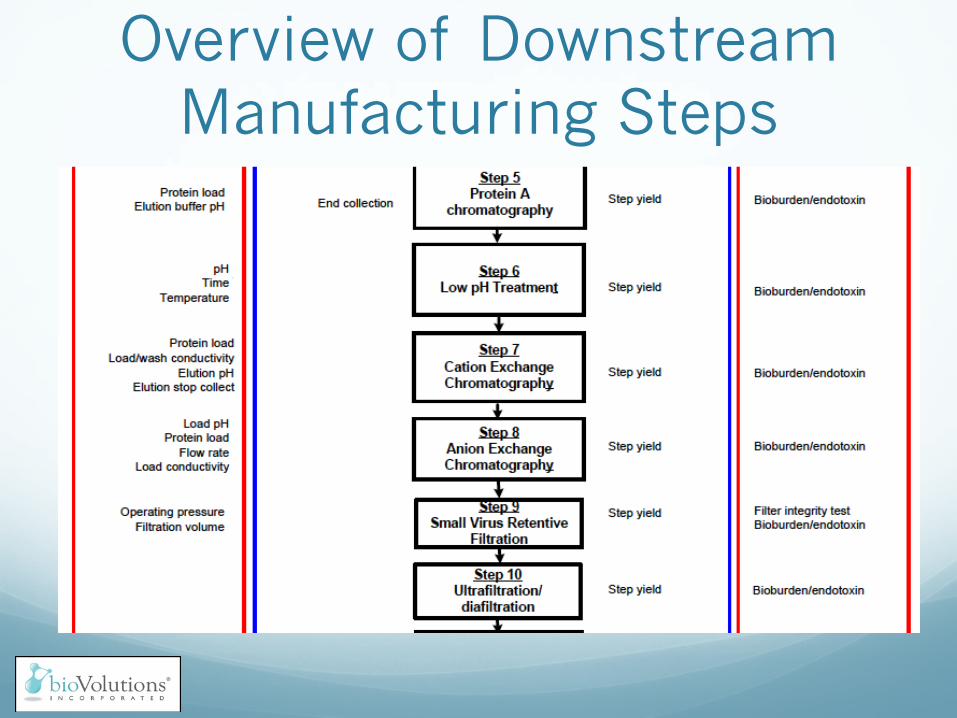
Overview of Downstream Manufacturing Steps
Downstream Continuous Purification Strategy
� Synchronize the protein load (g/mL of resin) with the upstream rate of perfusion
� Replace interim holding tanks with peristaltic pumps to perform continuous downstream purification
� Reduce the amount of Protein A resin by ~ 20-fold
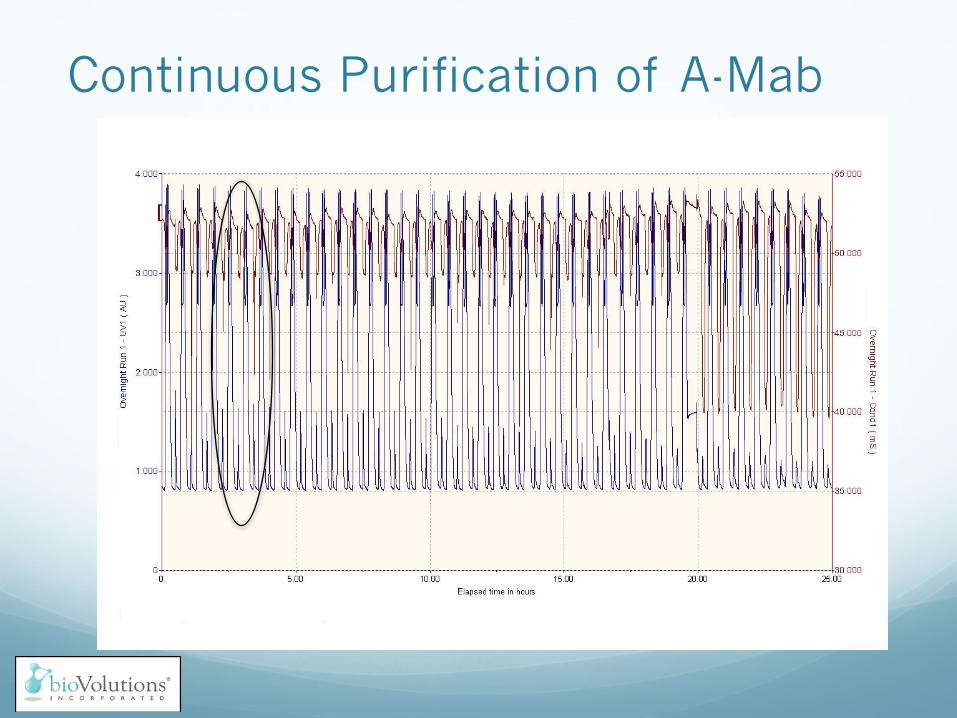
Continuous Purification of A-Mab
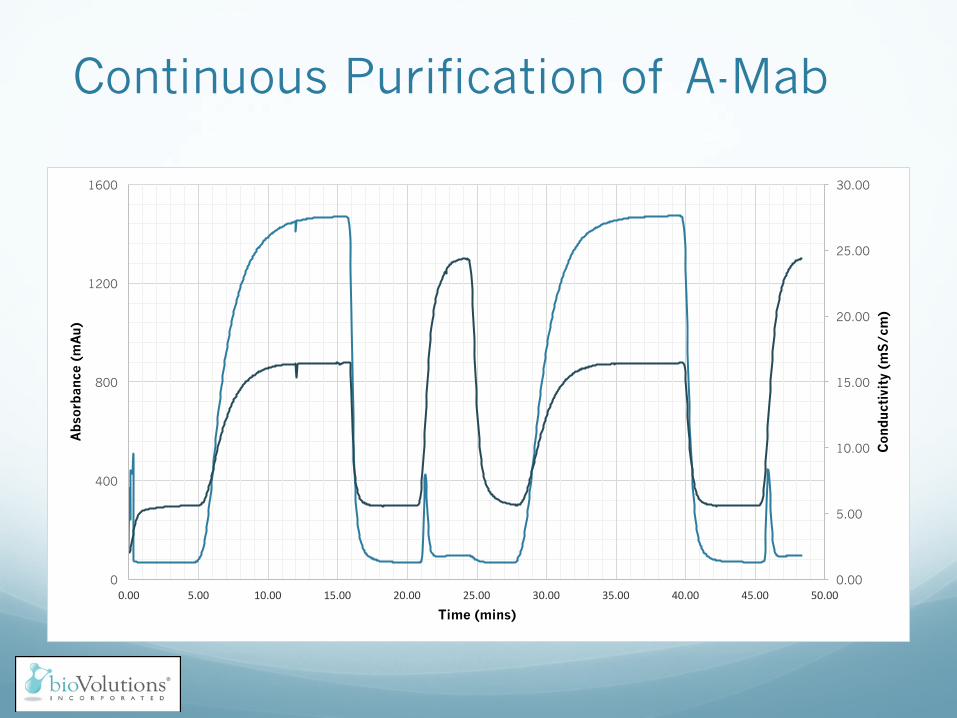
Continuous Purification of A-Mab
0.00
5.00
10.00
15.00
20.00
25.00
30.00
0
400
800
1200
1600
0.00 5.00 10.00 15.00 20.00 25.00 30.00 35.00 40.00 45.00 50.00
Con
duc
tivi
ty (
mS
/cm
)
Abso
rban
ce (
mA
u)
Time (mins)
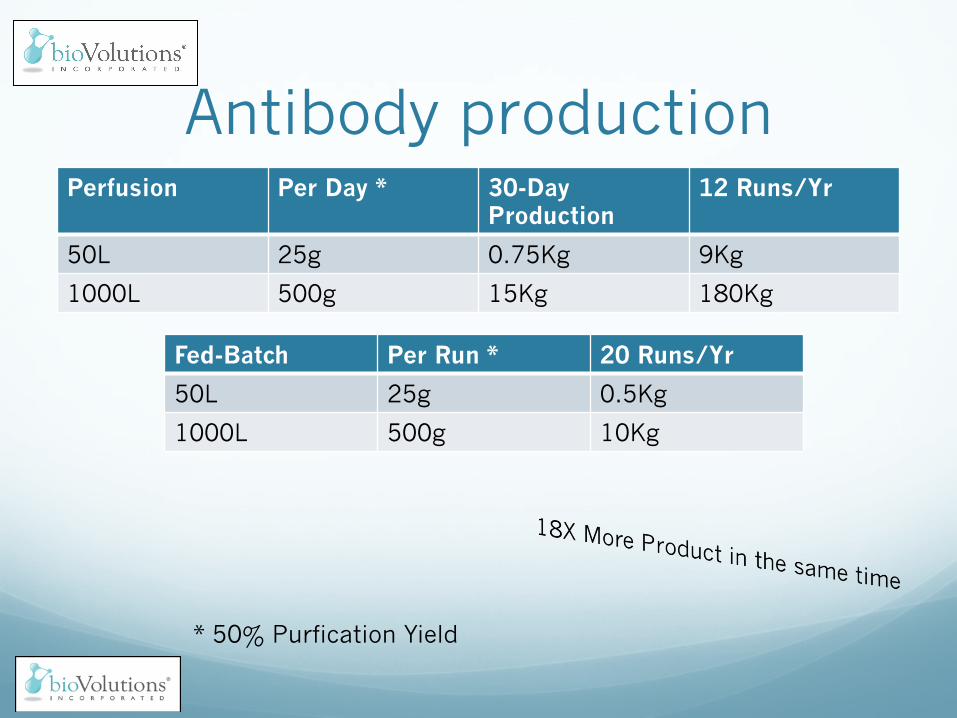
Antibody production Perfusion Per Day * 30-Day
Production 12 Runs/Yr
50L 25g 0.75Kg 9Kg
1000L 500g 15Kg 180Kg
Fed-Batch Per Run * 20 Runs/Yr
50L 25g 0.5Kg
1000L 500g 10Kg
* 50% Purfication Yield
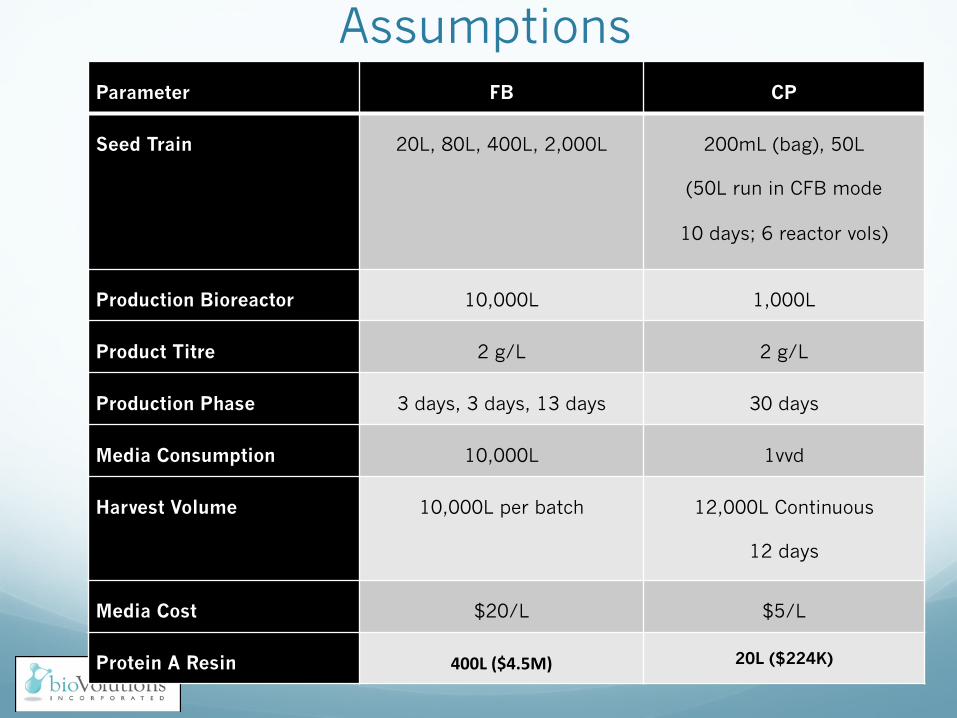
Assumptions Parameter FB CP
Seed Train 20L, 80L, 400L, 2,000L 200mL (bag), 50L
(50L run in CFB mode
10 days; 6 reactor vols)
Production Bioreactor 10,000L 1,000L
Product Titre 2 g/L 2 g/L
Production Phase 3 days, 3 days, 13 days 30 days
Media Consumption 10,000L 1vvd
Harvest Volume 10,000L per batch 12,000L Continuous
12 days
Media Cost $20/L $5/L
Protein A Resin 400L ($4.5M) 20L ($224K)
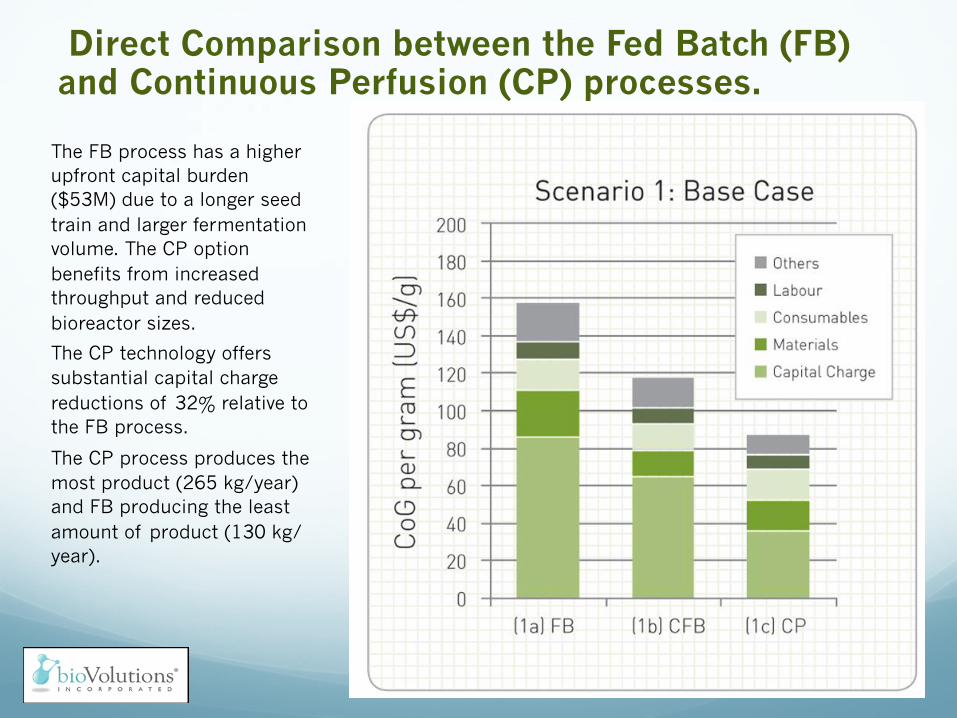
Direct Comparison between the Fed Batch (FB) and Continuous Perfusion (CP) processes.
The FB process has a higher upfront capital burden ($53M) due to a longer seed train and larger fermentation volume. The CP option benefits from increased throughput and reduced bioreactor sizes.
The CP technology offers substantial capital charge reductions of 32% relative to the FB process.
The CP process produces the most product (265 kg/year) and FB producing the least amount of product (130 kg/year).
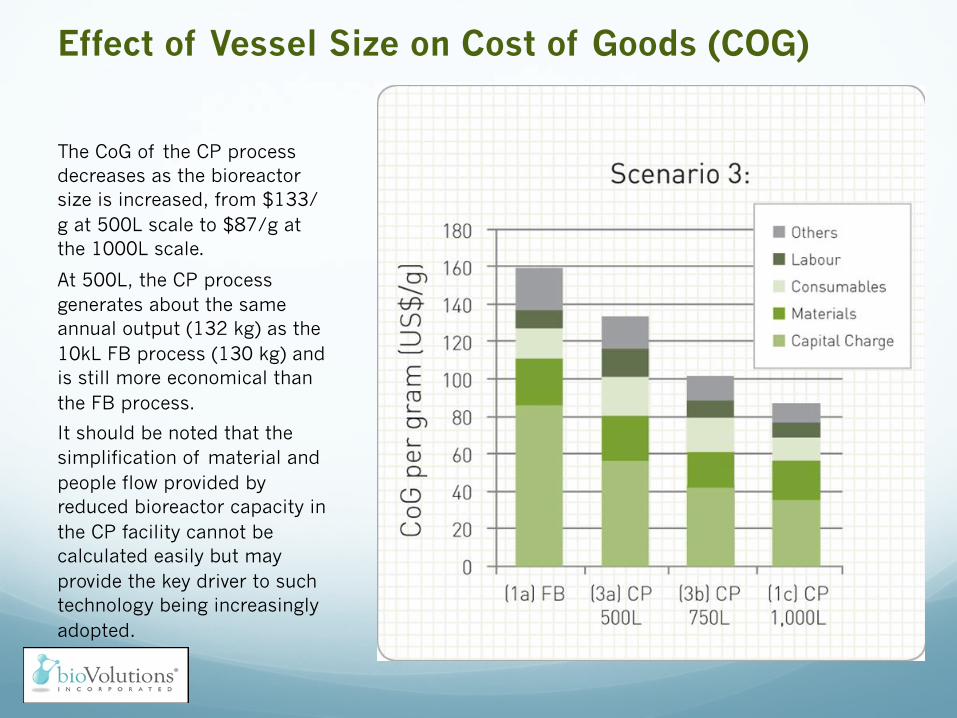
Effect of Vessel Size on Cost of Goods (COG)
The CoG of the CP process decreases as the bioreactor size is increased, from $133/g at 500L scale to $87/g at the 1000L scale.
At 500L, the CP process generates about the same annual output (132 kg) as the 10kL FB process (130 kg) and is still more economical than the FB process.
It should be noted that the simplification of material and people flow provided by reduced bioreactor capacity in the CP facility cannot be calculated easily but may provide the key driver to such technology being increasingly adopted.
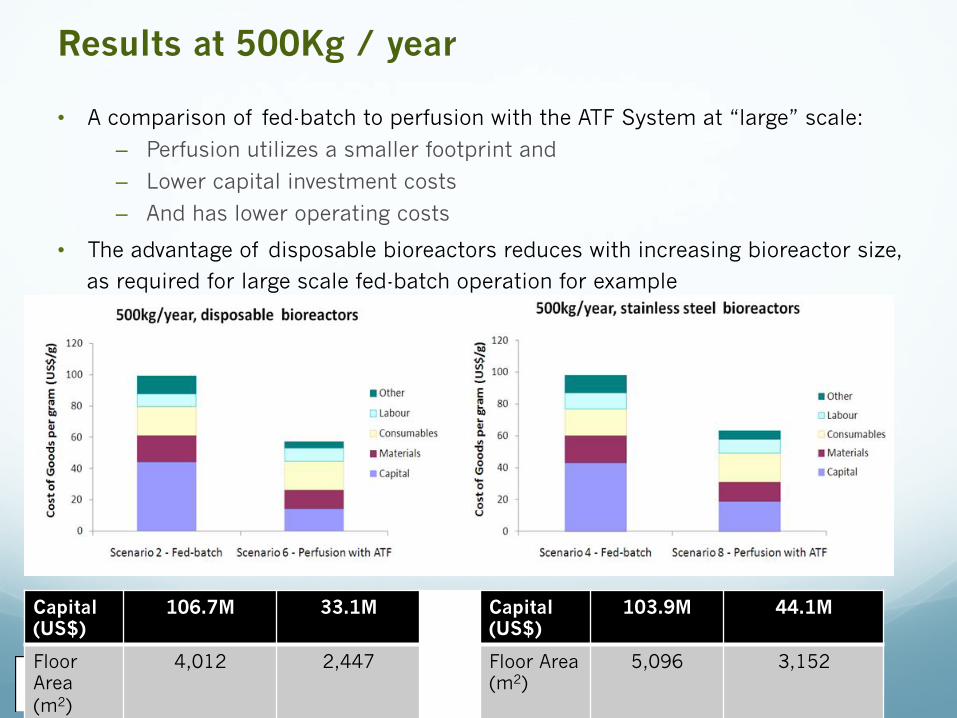
Capital (US$)
106.7M 33.1M Capital (US$)
103.9M 44.1M
Floor Area (m2)
4,012 2,447 Floor Area (m2)
5,096 3,152
Results at 500Kg / year
• A comparison of fed-batch to perfusion with the ATF System at “large” scale:
– Perfusion utilizes a smaller footprint and
– Lower capital investment costs
– And has lower operating costs
• The advantage of disposable bioreactors reduces with increasing bioreactor size,
as required for large scale fed-batch operation for example
21
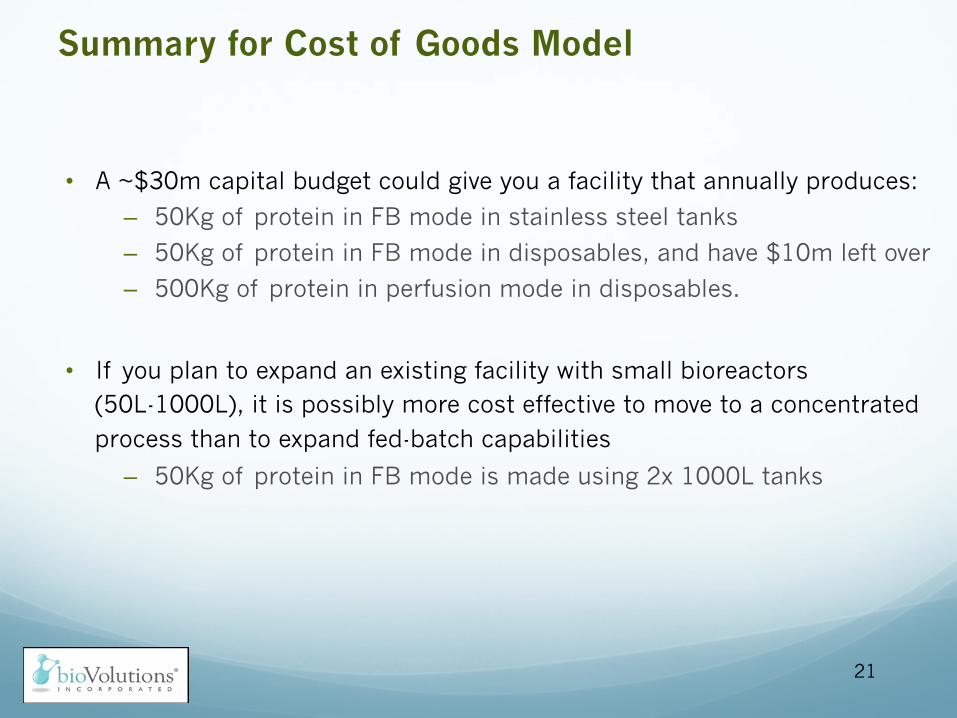
Summary for Cost of Goods Model
• A ~$30m capital budget could give you a facility that annually produces:
– 50Kg of protein in FB mode in stainless steel tanks
– 50Kg of protein in FB mode in disposables, and have $10m left over
– 500Kg of protein in perfusion mode in disposables.
• If you plan to expand an existing facility with small bioreactors (50L-1000L), it is possibly more cost effective to move to a concentrated process than to expand fed-batch capabilities
– 50Kg of protein in FB mode is made using 2x 1000L tanks
22
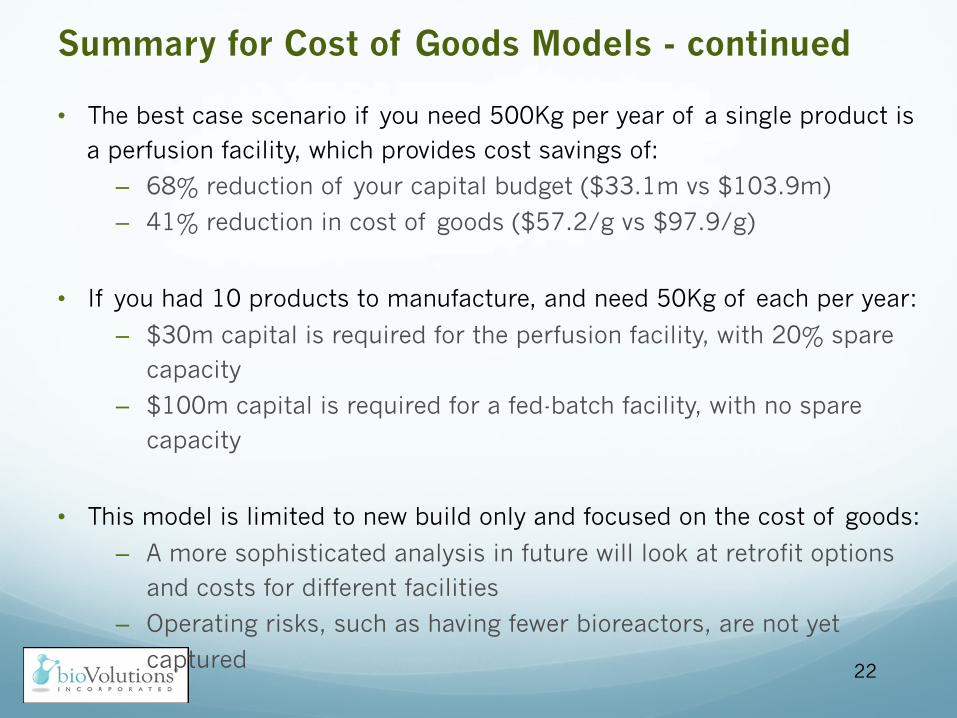
Summary for Cost of Goods Models - continued
• The best case scenario if you need 500Kg per year of a single product is a perfusion facility, which provides cost savings of:
– 68% reduction of your capital budget ($33.1m vs $103.9m)
– 41% reduction in cost of goods ($57.2/g vs $97.9/g)
• If you had 10 products to manufacture, and need 50Kg of each per year:
– $30m capital is required for the perfusion facility, with 20% spare capacity
– $100m capital is required for a fed-batch facility, with no spare capacity
• This model is limited to new build only and focused on the cost of goods:
– A more sophisticated analysis in future will look at retrofit options and costs for different facilities
– Operating risks, such as having fewer bioreactors, are not yet
captured
KEY POINTS
• Making therapeutic antibodies can benefit from new advances in continuous biomanufacturing such as
Continuous Perfusion (CP) and Continuous
Chromatography (CC).
• The Capex for a new facility is significantly lower than
conventional batch facilities
CONFIDENTIAL 23
Related Documents


