energies Article Continuous Battery Health Diagnosis by On-Line Internal Resistance Measuring Jaime de la Peña Llerandi * , Carlos Sancho de Mingo and José Carpio Ibáñez Dpto. Ingeniería Eléctrica, Electrónica, Control, Telemática y Química Aplicada a la Ingeniería, Universidad Nacional de Educación a Distancia (UNED), E.T.S. de Ingenieros Industriales, cl/Juan del Rosal, 12, 28040 Madrid, Spain * Correspondence: [email protected] Received: 28 June 2019; Accepted: 19 July 2019; Published: 23 July 2019 Abstract: Energy storage in an uninterruptible power supply (UPS) is one of the most frequent applications of batteries. This can be found in hospitals, communication centers, public centers, ships, trains, etc. Most frequent industrial methods for battery state-of health estimation require a technician to move to the battery’s location and, in some cases, require the use of heavy equipment and disconnection of the battery from the UPS. For example, in railway applications, trains must stop at the maintenance depot producing significant total costs. This article proposes a new method to assess a battery’s health by measuring the battery’s internal resistance, based on the measurement of its voltage ripple in response to the current ripple imposed by the charger which in most UPS applications is permanently connected to the battery. Unlike most traditional methods, this system makes it possible a continuous on-line and on-board monitoring, and, therefore, it eases condition-based maintenance (CBM). To verify its viability, a low cost measuring prototype has been built and measurements in a railway battery with its charger have been carried out. Keywords: battery; internal resistance; state of health (SOH); on-board; on-line; condition-based maintenance (CBM) 1. Introduction Power plants, substations, communication centers and all fundamental services in general have uninterruptible power supply (UPS) systems to keep critical equipment operational in the event of a failure in the alternating current (AC) input power supply [1,2]. In the case of both marine and rail transport, UPS systems must also maintain the minimum comfort conditions in case of loss of the main power source. The first UPS systems were based on generators powered by combustion engines. It was in the decade of the 1960s when the first UPS based on thyristors appeared. For example, in 1967 Toshiba built a 200 kVA UPS with lead-acid batteries for the air traffic control system of Tokyo International Airport [3]. In the 1970s, with the evolution of power semiconductors, the use of batteries in power plants became commonplace. It was a decade of a large number of scientific studies, publications and patents in the fields of measurement, diagnosis and modeling of batteries. For instance, [4] in May 1975, researchers from Bell Telephone Laboratories developed the idea of an international conference on telephone power energy systems, and three years later launched the International Telecommunications Energy Conference (INTELEC), which throughout its history has published a large number of technical articles about batteries. In a UPS based on power semiconductors, batteries are the most critical components because they have to provide their stored energy promptly when required by the system, even when the battery has Energies 2019, 12, 2836; doi:10.3390/en12142836 www.mdpi.com/journal/energies

Welcome message from author
This document is posted to help you gain knowledge. Please leave a comment to let me know what you think about it! Share it to your friends and learn new things together.
Transcript
energies
Article
Continuous Battery Health Diagnosis by On-LineInternal Resistance Measuring
Jaime de la Peña Llerandi * , Carlos Sancho de Mingo and José Carpio Ibáñez
Dpto. Ingeniería Eléctrica, Electrónica, Control, Telemática y Química Aplicada a la Ingeniería,Universidad Nacional de Educación a Distancia (UNED), E.T.S. de Ingenieros Industriales, cl/Juan del Rosal, 12,28040 Madrid, Spain* Correspondence: [email protected]
Received: 28 June 2019; Accepted: 19 July 2019; Published: 23 July 2019
Abstract: Energy storage in an uninterruptible power supply (UPS) is one of the most frequentapplications of batteries. This can be found in hospitals, communication centers, public centers,ships, trains, etc. Most frequent industrial methods for battery state-of health estimation require atechnician to move to the battery’s location and, in some cases, require the use of heavy equipment anddisconnection of the battery from the UPS. For example, in railway applications, trains must stop at themaintenance depot producing significant total costs. This article proposes a new method to assess abattery’s health by measuring the battery’s internal resistance, based on the measurement of its voltageripple in response to the current ripple imposed by the charger which in most UPS applications ispermanently connected to the battery. Unlike most traditional methods, this system makes it possiblea continuous on-line and on-board monitoring, and, therefore, it eases condition-based maintenance(CBM). To verify its viability, a low cost measuring prototype has been built and measurements in arailway battery with its charger have been carried out.
Keywords: battery; internal resistance; state of health (SOH); on-board; on-line; condition-basedmaintenance (CBM)
1. Introduction
Power plants, substations, communication centers and all fundamental services in general haveuninterruptible power supply (UPS) systems to keep critical equipment operational in the event of afailure in the alternating current (AC) input power supply [1,2]. In the case of both marine and railtransport, UPS systems must also maintain the minimum comfort conditions in case of loss of the mainpower source.
The first UPS systems were based on generators powered by combustion engines. It was in thedecade of the 1960s when the first UPS based on thyristors appeared. For example, in 1967 Toshibabuilt a 200 kVA UPS with lead-acid batteries for the air traffic control system of Tokyo InternationalAirport [3].
In the 1970s, with the evolution of power semiconductors, the use of batteries in power plantsbecame commonplace. It was a decade of a large number of scientific studies, publications and patentsin the fields of measurement, diagnosis and modeling of batteries. For instance, [4] in May 1975,researchers from Bell Telephone Laboratories developed the idea of an international conference ontelephone power energy systems, and three years later launched the International TelecommunicationsEnergy Conference (INTELEC), which throughout its history has published a large number of technicalarticles about batteries.
In a UPS based on power semiconductors, batteries are the most critical components because theyhave to provide their stored energy promptly when required by the system, even when the battery has
Energies 2019, 12, 2836; doi:10.3390/en12142836 www.mdpi.com/journal/energies
Energies 2019, 12, 2836 2 of 13
spent long periods of time floating without activity. Therefore, it is crucial to know aspects such as theprocess of battery degradation, how much energy they actually store, how much energy they will beable to provide, and how much time they have left before a failure in order to carry out an optimizedpreventive maintenance. These characteristics are summarized by the state of charge (SOC) and thestate of health (SOH) of the battery [5–10].
State-prediction techniques (prognostics and health management, PHM) have evolved in linewith the knowledge of the internal operation of batteries, their chemical reactions and the process ofdegradation of their components. The existing methods to determine the state of health and the chargeof a battery can be divided into direct methods and computational methods.
Direct methods are based on tests, which usually require the intervention of a technician; that bydirect measurements of a physical parameter of the battery can give directly or can estimate the batterystate of charge SOC and state of health SOH. Some of these methods are:
a. Discharge test [5–7].b. Acid density measurements [8,11].c. Battery open circuit voltage [6,7,10].d. Battery float charging current [6,7,12,13].e. Internal resistance measurement [5–7,10,11,14–18].f. Electrochemical Impedance Spectroscopy (EIS) [14,19].g. Hybrid pulse power characterization (HPPC) [20,21].
Computational methods are those that, by measuring battery parameters stored in historicalrecords or by adaptive calculation algorithms, can estimate the state of charge and battery status (SOCand SOH) [22–33]. Some of these methods are:
h. Coulomb counting [22–24].i. Modified coulomb counting [23].j. Adaptive systems and neural networks [23,24].
• EBP, Error back propagation neural network [23,25,26].• RBF, Radial basis function network [27].• SVM, Support vector machine [28,29].• FNN, Fuzzy neural network [30,31].• Kalman filter [32,33].• Hybrid methods [22,23].
Battery maintenance in the industry is programmed according to battery manufacturers’recommendations and international standards [6–10]. Generally, monthly, quarterly and yearlyconsistencies are used, which include tests (b), (c) and (d) above. Test (a) is only used to confirm thestatus of a dubious battery, since it takes a long time and needs specific equipment. Methods (f) and(g) require introducing disturbances in the battery which are only possible using power electronics.Methods (h), (i) and (j) cannot be used in UPS batteries because the battery is floating and they requiremeasurements of the discharge and charge currents as inputs.
The measurement of the battery internal resistance (e) (widespread in industry), is recommendedby several battery manufacturers for maintenance as a method to estimate battery SOH and, in fact,several commercial equipment sets are available [8,34,35]. Dr. Damlumd [11] studied the influenceof different physical/chemical phenomena on the value of internal resistance, impedance and batterycapacity. He concluded that internal resistance increases with the degradation of the battery, except inthe case of internal short circuits or a temperature increase.
It is now generally accepted that the value of the battery internal resistance depends on thebattery conditions, namely, its SOC, its temperature (resistance decreases as the battery temperature
Energies 2019, 12, 2836 3 of 13
increases [16–18]), etc. and indicates the battery SOH [5,11,15]. In fact the use of the internal resistance,as an alternated inspection method, is proposed by the IEEE standard 450_2010 [7] for vented lead-acid(VLA) batteries and is also recommended by the IEEE standard 1188_2005 [10] for valve-regulatelead-acid (VRLA) batteries, specifying a quarterly measure and record of the internal resistance. Thesestandard enphasizes that the internal ohmic values are useful as a trend characterization tool. To usethese readings effectively, accurate baseline readings should be taken after about six months of batteryoperation. Notice that all methods (a–e) require a technician to move to the battery’s location; whilst(e) also requires the use of heavy equipment and disconnection of the UPS battery. In the case ofrailways, trains must be stopped at the maintenance depot bringing very important cost and, veryoften, preventing an appropriate maintenance program.
In this paper, a new non-invasive method is proposed to measure battery’s internal resistancecontinuously during its normal operation connected to a UPS, reducing human and operation costswhich, eventually, should facilitate monitoring and maintenance programs. The proposed method isbased on the fact that, in a UPS, the battery is usually connected permanently to the UPS charger [19],which imposes the current ripple of its output filter inductor on the battery (usually 10% of its averagedirect current (DC) output current value). By measuring this current ripple and the voltage ripple ofthe battery cells, the value of the internal resistance can be obtained and, therefore, the SOH can bedetermined. Although voltage and current ripples are very small and are surrounded by a very noisyenvironment, the main voltage and current harmonics of the rectification can be extracted using theFourier Transform to calculate the battery’s internal resistance.
On-line battery monitoring systems have already been proposed in the literature [19,36,37].However, unlike in the proposed system, in all the cases spotted the authors had to introducedisturbances in the normal operation of the battery. For example, [37], based on (g) (HPPC), perturbingthe battery with power pulses while [19,36], based on (f) (EIS), uses an electronic power converter tointroduce disturbances with different frequencies.
To verify the feasibility of the proposed method, measurements have been carried out in thebattery-charger unit of a metropolitan train of “Metro de Madrid”. It will be shown that reliable resultscan be obtained, without perturbing the normal operation of the battery + charger system, using alow cost set-up based on a simple micro-controller. Since most modern micro-controllers can be easilyinterfaced with wireless communication systems, the proposed solution could transmit its informationto a central maintenance system to make a continuous maintenance program possible. This feature is aclear advantage with respect to all “direct methods” listed above. “Computational methods” aboveare seldom used in practice in UPS batteries because they are not subject to charge–discharge cycles.
2. Description of the Method Proposed and Its Application
A typical battery-charger unit for a metropolitan train of “Metro de Madrid” is depicted inFigure 1.
Energies 2019, 12, x 3 of 13
vented lead‐acid (VLA) batteries and is also recommended by the IEEE standard 1188_2005 [10] for
valve‐regulate lead‐acid (VRLA) batteries, specifying a quarterly measure and record of the internal
resistance. These standard enphasizes that the internal ohmic values are useful as a trend
characterization tool. To use these readings effectively, accurate baseline readings should be taken
after about six months of battery operation. Notice that all methods (a–e) require a technician to
move to the battery´s location; whilst (e) also requires the use of heavy equipment and disconnection
of the UPS battery. In the case of railways, trains must be stopped at the maintenance depot bringing
very important cost and, very often, preventing an appropriate maintenance program.
In this paper, a new non‐invasive method is proposed to measure battery´s internal resistance
continuously during its normal operation connected to a UPS, reducing human and operation costs
which, eventually, should facilitate monitoring and maintenance programs. The proposed method is
based on the fact that, in a UPS, the battery is usually connected permanently to the UPS charger
[19], which imposes the current ripple of its output filter inductor on the battery (usually 10% of its
average direct current (DC) output current value). By measuring this current ripple and the voltage
ripple of the battery cells, the value of the internal resistance can be obtained and, therefore, the SOH
can be determined. Although voltage and current ripples are very small and are surrounded by a
very noisy environment, the main voltage and current harmonics of the rectification can be extracted
using the Fourier Transform to calculate the battery´s internal resistance.
On‐line battery monitoring systems have already been proposed in the literature [19,36,37].
However, unlike in the proposed system, in all the cases spotted the authors had to introduce
disturbances in the normal operation of the battery. For example, [37], based on (g) (HPPC),
perturbing the battery with power pulses while [19] and [36], based on (f) (EIS), uses an electronic
power converter to introduce disturbances with different frequencies.
To verify the feasibility of the proposed method, measurements have been carried out in the
battery‐charger unit of a metropolitan train of “Metro de Madrid”. It will be shown that reliable
results can be obtained, without perturbing the normal operation of the battery + charger system,
using a low cost set‐up based on a simple micro‐controller. Since most modern micro‐controllers can
be easily interfaced with wireless communication systems, the proposed solution could transmit its
information to a central maintenance system to make a continuous maintenance program possible.
This feature is a clear advantage with respect to all “direct methods” listed above. “Computational
methods” above are seldom used in practice in UPS batteries because they are not subject to charge–
discharge cycles.
2. Description of the Method Proposed and Its Application
A typical battery‐charger unit for a metropolitan train of “Metro de Madrid” is depicted in
Figure 1.
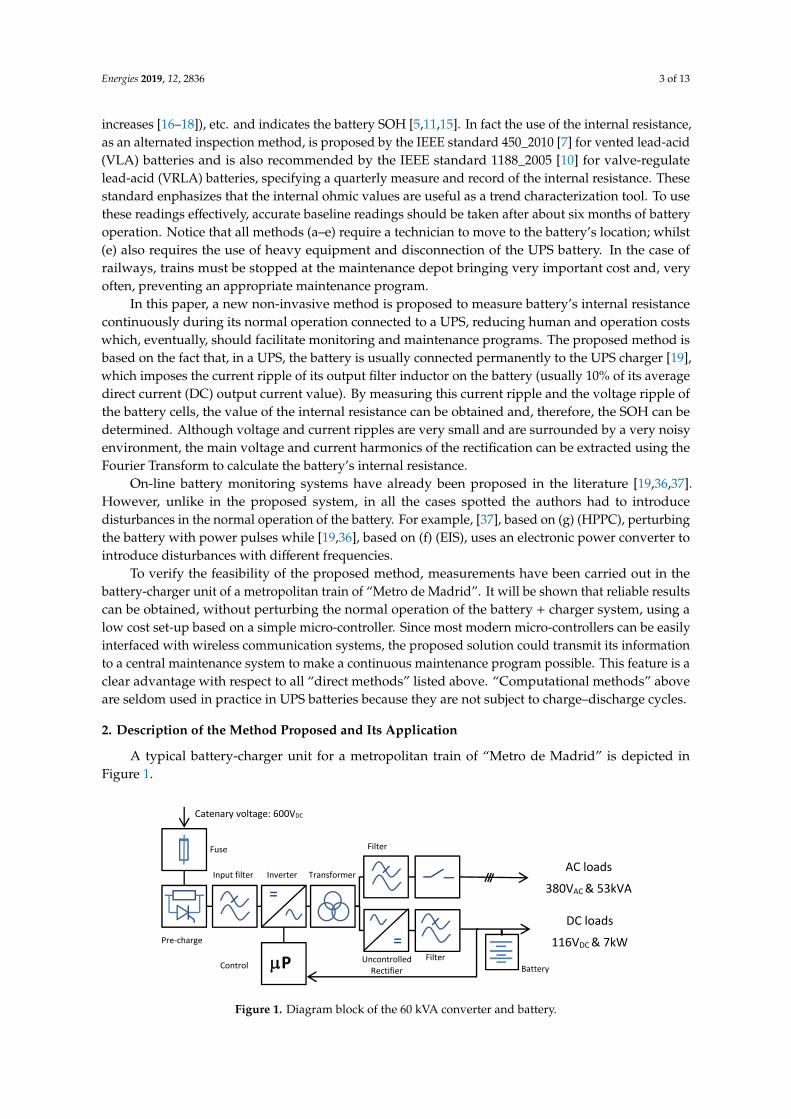
Figure 1. Diagram block of the 60 kVA converter and battery.
The catenary feeds an inverter which supplies a three‐phase transformer, with two output
windings, one supplies the 380 Vac and 53 kVA and 50 Hz three‐phase output to the train’s AC
AC loads
380VAC & 53kVA
DC loads
116VDC & 7kW
Catenary voltage: 600VDC
P
Fuse
Pre‐charge
Input filter Inverter Transformer
Battery
Filter
Filter Uncontrolled Rectifier
Control
Figure 1. Diagram block of the 60 kVA converter and battery.
Energies 2019, 12, 2836 4 of 13
The catenary feeds an inverter which supplies a three-phase transformer, with two outputwindings, one supplies the 380 Vac and 53 kVA and 50 Hz three-phase output to the train’s AC auxiliaryloads and the other output winding is rectified in order to obtain a 116 V and 7 kWDC output wherethe battery is connected.
The charger is a 60 kVA converter from the manufacturer SEPSA The battery is a vented leadacid (VLA) type, of 116 V and (C5) 120 Ah. It consists of 52 cells grouped in 9 containers and itis manufactured by EXIDE (type CLASSIC 52, 02EPZSQ0120S). The battery used to carry out themeasurements was taken from a train due to its poor condition: it showed signs of sulfation and mostof its cells had not passed the discharge test.
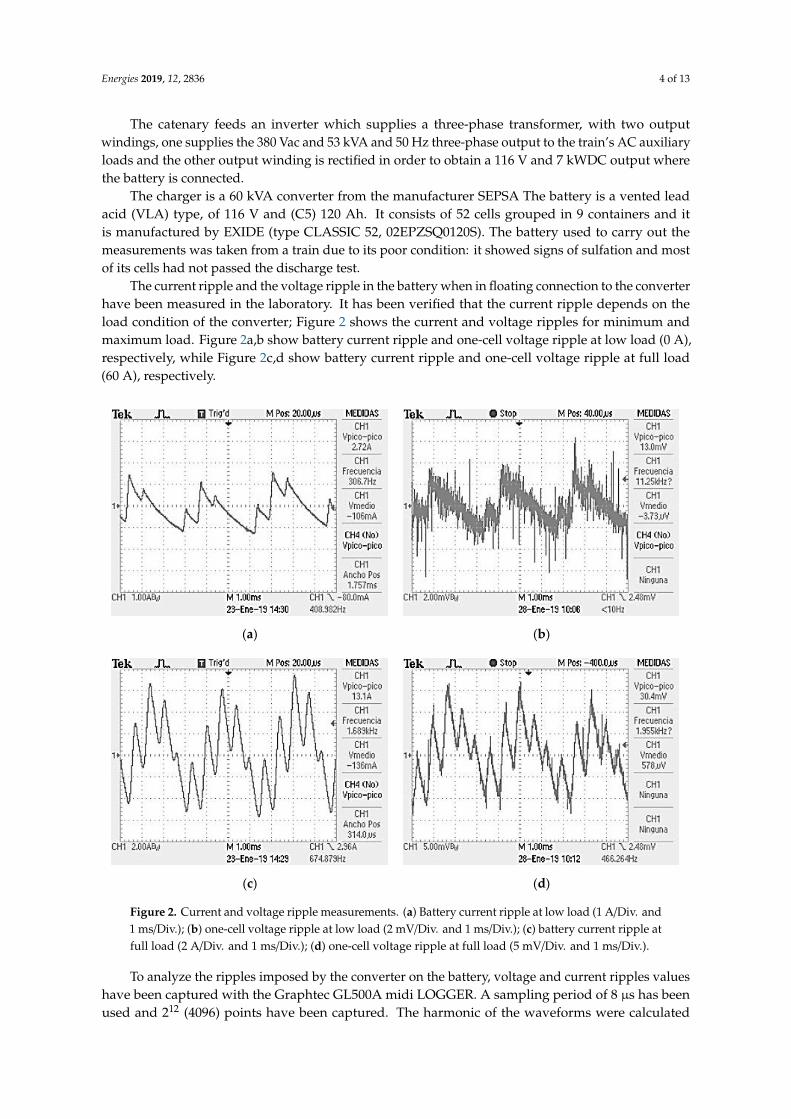
The current ripple and the voltage ripple in the battery when in floating connection to the converterhave been measured in the laboratory. It has been verified that the current ripple depends on theload condition of the converter; Figure 2 shows the current and voltage ripples for minimum andmaximum load. Figure 2a,b show battery current ripple and one-cell voltage ripple at low load (0 A),respectively, while Figure 2c,d show battery current ripple and one-cell voltage ripple at full load(60 A), respectively.
Energies 2019, 12, x 4 of 13
auxiliary loads and the other output winding is rectified in order to obtain a 116 V and 7 kWDC
output where the battery is connected.
The charger is a 60 kVA converter from the manufacturer SEPSA The battery is a vented lead
acid (VLA) type, of 116 V and (C5) 120 Ah. It consists of 52 cells grouped in 9 containers and it is
manufactured by EXIDE (type CLASSIC 52, 02EPZSQ0120S). The battery used to carry out the
measurements was taken from a train due to its poor condition: it showed signs of sulfation and
most of its cells had not passed the discharge test.
The current ripple and the voltage ripple in the battery when in floating connection to the
converter have been measured in the laboratory. It has been verified that the current ripple depends
on the load condition of the converter; Figure 2 shows the current and voltage ripples for minimum
and maximum load. Figure 2a,b show battery current ripple and one‐cell voltage ripple at low load
(0 A), respectively, while Figure 2c,d show battery current ripple and one‐cell voltage ripple at full
load (60 A), respectively.
To analyze the ripples imposed by the converter on the battery, voltage and current ripples
values have been captured with the Graphtec GL500A midi LOGGER. A sampling period of 8 μs has
been used and 212 (4096) points have been captured. The harmonic of the waveforms were calculated
using the fast Fourier transform (FFT), verifying that the main harmonic has a frequency of 300 Hz,
corresponding to the three‐phase uncontrolled rectification of a 50 Hz system.
(a)
(b)
(c)
(d)
Figure 2. Current and voltage ripple measurements. (a) Battery current ripple at low load (1 A/Div.
and 1 ms/Div.); (b) one‐cell voltage ripple at low load (2 mV/Div. and 1 ms/Div.); (c) battery current
ripple at full load (2 A/Div. and 1 ms/Div.); (d) one‐cell voltage ripple at full load (5 mV/Div. and
1 ms/Div.).
Figure 2. Current and voltage ripple measurements. (a) Battery current ripple at low load (1 A/Div. and1 ms/Div.); (b) one-cell voltage ripple at low load (2 mV/Div. and 1 ms/Div.); (c) battery current ripple atfull load (2 A/Div. and 1 ms/Div.); (d) one-cell voltage ripple at full load (5 mV/Div. and 1 ms/Div.).
To analyze the ripples imposed by the converter on the battery, voltage and current ripples valueshave been captured with the Graphtec GL500A midi LOGGER. A sampling period of 8 µs has beenused and 212 (4096) points have been captured. The harmonic of the waveforms were calculated
Energies 2019, 12, 2836 5 of 13
using the fast Fourier transform (FFT), verifying that the main harmonic has a frequency of 300 Hz,corresponding to the three-phase uncontrolled rectification of a 50 Hz system.
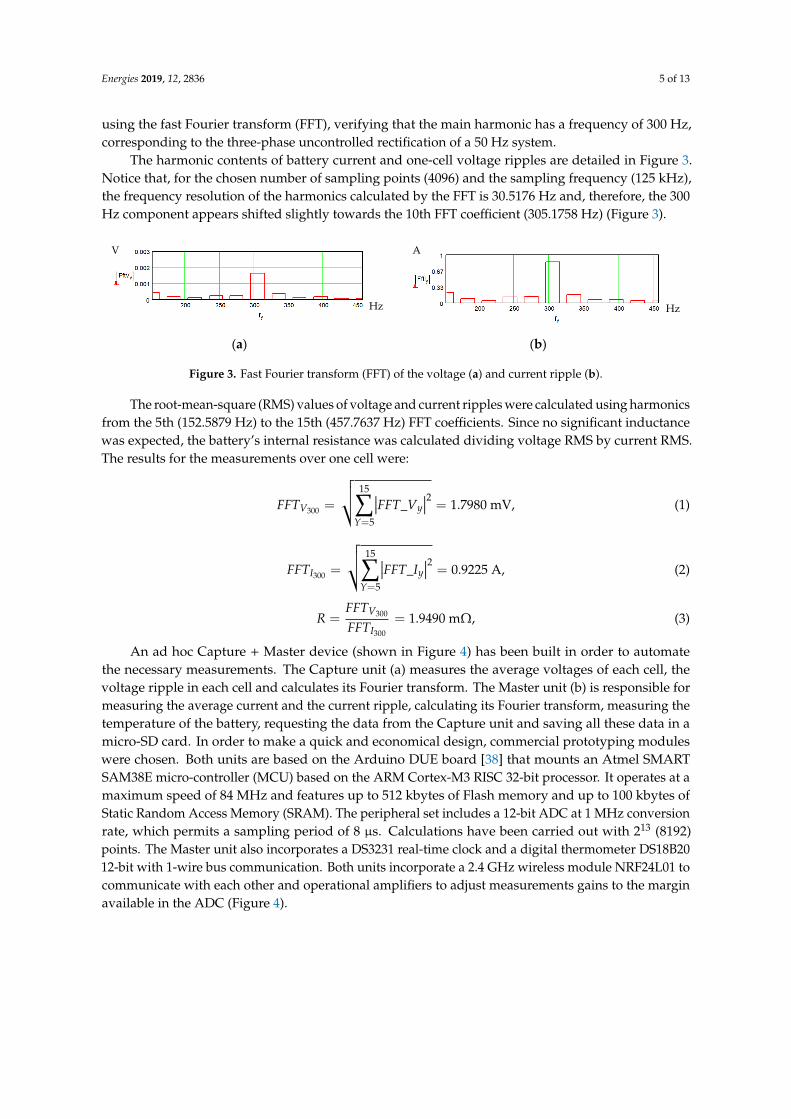
The harmonic contents of battery current and one-cell voltage ripples are detailed in Figure 3.Notice that, for the chosen number of sampling points (4096) and the sampling frequency (125 kHz),the frequency resolution of the harmonics calculated by the FFT is 30.5176 Hz and, therefore, the 300Hz component appears shifted slightly towards the 10th FFT coefficient (305.1758 Hz) (Figure 3).
Energies 2019, 12, x 5 of 13
The harmonic contents of battery current and one‐cell voltage ripples are detailed in Figure 3.
Notice that, for the chosen number of sampling points (4096) and the sampling frequency (125 kHz),
the frequency resolution of the harmonics calculated by the FFT is 30.5176 Hz and, therefore, the
300 Hz component appears shifted slightly towards the 10th FFT coefficient (305.1758 Hz) (Figure 3).
(a) (b)
Figure 3. Fast Fourier transform (FFT) of the voltage (a) and current ripple (b).
The root‐mean‐square (RMS) values of voltage and current ripples were calculated using
harmonics from the 5th (152.5879 Hz) to the 15th (457.7637 Hz) FFT coefficients. Since no significant
inductance was expected, the battery’s internal resistance was calculated dividing voltage RMS by
current RMS. The results for the measurements over one cell were:
𝐹𝐹𝑇 ∑ 𝐹𝐹𝑇_𝑉 1.7980 mV, (1)
𝐹𝐹𝑇 ∑ 𝐹𝐹𝑇_𝐼 0.9225 A, (2)
𝑅 1.9490 mΩ, (3)
An ad hoc Capture + Master device (shown in Figure 4) has been built in order to automate the
necessary measurements. The Capture unit (a) measures the average voltages of each cell, the
voltage ripple in each cell and calculates its Fourier transform. The Master unit (b) is responsible for
measuring the average current and the current ripple, calculating its Fourier transform, measuring
the temperature of the battery, requesting the data from the Capture unit and saving all these data in
a micro‐SD card. In order to make a quick and economical design, commercial prototyping modules
were chosen. Both units are based on the Arduino DUE board [38] that mounts an Atmel SMART
SAM38E micro‐controller (MCU) based on the ARM Cortex‐M3 RISC 32‐bit processor. It operates at
a maximum speed of 84 MHz and features up to 512 kbytes of Flash memory and up to 100 kbytes of
Static Random Access Memory (SRAM). The peripheral set includes a 12‐bit ADC at 1 MHz
conversion rate, which permits a sampling period of 8 μs. Calculations have been carried out with 213
(8192) points. The Master unit also incorporates a DS3231 real‐time clock and a digital thermometer
DS18B20 12‐bit with 1‐wire bus communication. Both units incorporate a 2.4 GHz wireless module
NRF24L01 to communicate with each other and operational amplifiers to adjust measurements gains
to the margin available in the ADC (Figure 4).
(a) (b)
V A
Hz Hz
Figure 3. Fast Fourier transform (FFT) of the voltage (a) and current ripple (b).
The root-mean-square (RMS) values of voltage and current ripples were calculated using harmonicsfrom the 5th (152.5879 Hz) to the 15th (457.7637 Hz) FFT coefficients. Since no significant inductancewas expected, the battery’s internal resistance was calculated dividing voltage RMS by current RMS.The results for the measurements over one cell were:
FFTV300 =
√√√ 15∑Y=5
∣∣∣FFT_Vy∣∣∣2 = 1.7980 mV, (1)
FFTI300 =
√√√ 15∑Y=5
∣∣∣FFT_Iy∣∣∣2 = 0.9225 A, (2)
R =FFTV300
FFTI300
= 1.9490 mΩ, (3)
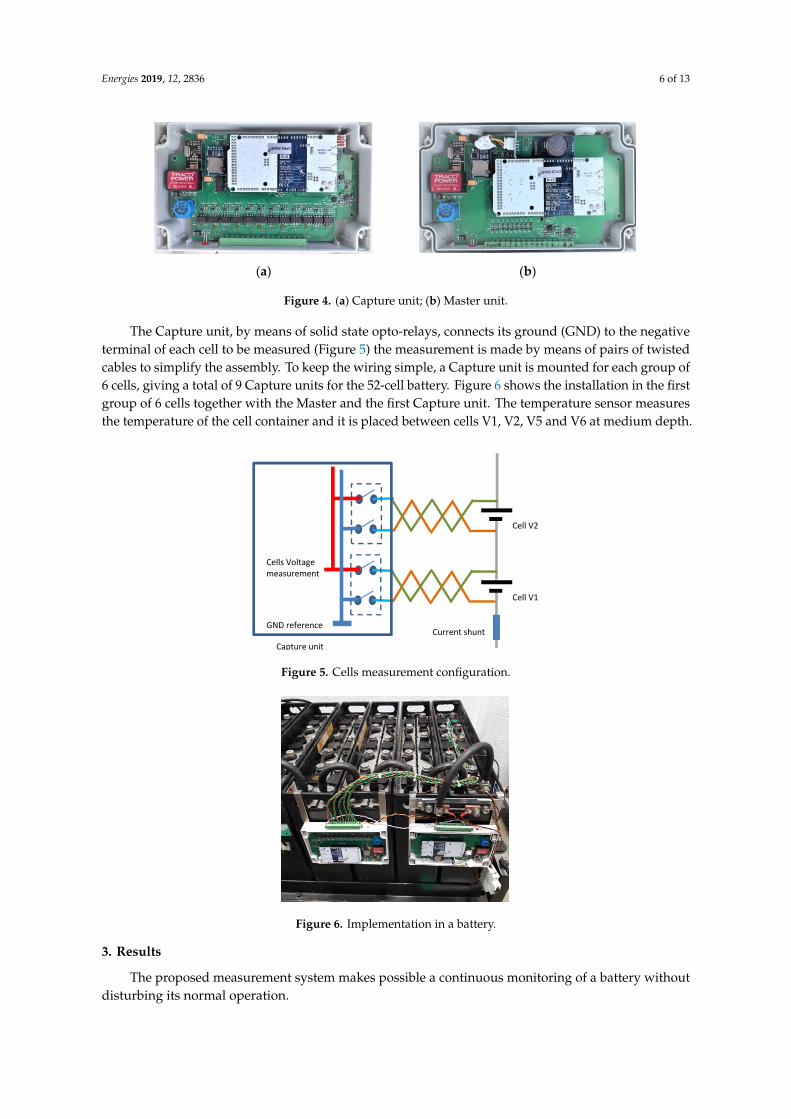
An ad hoc Capture + Master device (shown in Figure 4) has been built in order to automatethe necessary measurements. The Capture unit (a) measures the average voltages of each cell, thevoltage ripple in each cell and calculates its Fourier transform. The Master unit (b) is responsible formeasuring the average current and the current ripple, calculating its Fourier transform, measuring thetemperature of the battery, requesting the data from the Capture unit and saving all these data in amicro-SD card. In order to make a quick and economical design, commercial prototyping moduleswere chosen. Both units are based on the Arduino DUE board [38] that mounts an Atmel SMARTSAM38E micro-controller (MCU) based on the ARM Cortex-M3 RISC 32-bit processor. It operates at amaximum speed of 84 MHz and features up to 512 kbytes of Flash memory and up to 100 kbytes ofStatic Random Access Memory (SRAM). The peripheral set includes a 12-bit ADC at 1 MHz conversionrate, which permits a sampling period of 8 µs. Calculations have been carried out with 213 (8192)points. The Master unit also incorporates a DS3231 real-time clock and a digital thermometer DS18B2012-bit with 1-wire bus communication. Both units incorporate a 2.4 GHz wireless module NRF24L01 tocommunicate with each other and operational amplifiers to adjust measurements gains to the marginavailable in the ADC (Figure 4).
Energies 2019, 12, 2836 6 of 13
Energies 2019, 12, x 5 of 13
The harmonic contents of battery current and one‐cell voltage ripples are detailed in Figure 3.
Notice that, for the chosen number of sampling points (4096) and the sampling frequency (125 kHz),
the frequency resolution of the harmonics calculated by the FFT is 30.5176 Hz and, therefore, the
300 Hz component appears shifted slightly towards the 10th FFT coefficient (305.1758 Hz) (Figure 3).
(a) (b)
Figure 3. Fast Fourier transform (FFT) of the voltage (a) and current ripple (b).
The root‐mean‐square (RMS) values of voltage and current ripples were calculated using
harmonics from the 5th (152.5879 Hz) to the 15th (457.7637 Hz) FFT coefficients. Since no significant
inductance was expected, the battery’s internal resistance was calculated dividing voltage RMS by
current RMS. The results for the measurements over one cell were:
𝐹𝐹𝑇 ∑ 𝐹𝐹𝑇_𝑉 1.7980 mV, (1)
𝐹𝐹𝑇 ∑ 𝐹𝐹𝑇_𝐼 0.9225 A, (2)
𝑅 1.9490 mΩ, (3)
An ad hoc Capture + Master device (shown in Figure 4) has been built in order to automate the
necessary measurements. The Capture unit (a) measures the average voltages of each cell, the
voltage ripple in each cell and calculates its Fourier transform. The Master unit (b) is responsible for
measuring the average current and the current ripple, calculating its Fourier transform, measuring
the temperature of the battery, requesting the data from the Capture unit and saving all these data in
a micro‐SD card. In order to make a quick and economical design, commercial prototyping modules
were chosen. Both units are based on the Arduino DUE board [38] that mounts an Atmel SMART
SAM38E micro‐controller (MCU) based on the ARM Cortex‐M3 RISC 32‐bit processor. It operates at
a maximum speed of 84 MHz and features up to 512 kbytes of Flash memory and up to 100 kbytes of
Static Random Access Memory (SRAM). The peripheral set includes a 12‐bit ADC at 1 MHz
conversion rate, which permits a sampling period of 8 μs. Calculations have been carried out with 213
(8192) points. The Master unit also incorporates a DS3231 real‐time clock and a digital thermometer
DS18B20 12‐bit with 1‐wire bus communication. Both units incorporate a 2.4 GHz wireless module
NRF24L01 to communicate with each other and operational amplifiers to adjust measurements gains
to the margin available in the ADC (Figure 4).
(a) (b)
V A
Hz Hz
Figure 4. (a) Capture unit; (b) Master unit.
The Capture unit, by means of solid state opto-relays, connects its ground (GND) to the negativeterminal of each cell to be measured (Figure 5) the measurement is made by means of pairs of twistedcables to simplify the assembly. To keep the wiring simple, a Capture unit is mounted for each group of6 cells, giving a total of 9 Capture units for the 52-cell battery. Figure 6 shows the installation in the firstgroup of 6 cells together with the Master and the first Capture unit. The temperature sensor measuresthe temperature of the cell container and it is placed between cells V1, V2, V5 and V6 at medium depth.
Energies 2019, 12, x 6 of 13
Figure 4. (a) Capture unit; (b) Master unit.
The Capture unit, by means of solid state opto‐relays, connects its ground (GND) to the
negative terminal of each cell to be measured (Figure 5) the measurement is made by means of pairs
of twisted cables to simplify the assembly. To keep the wiring simple, a Capture unit is mounted for
each group of 6 cells, giving a total of 9 Capture units for the 52‐cell battery. Figure 6 shows the
installation in the first group of 6 cells together with the Master and the first Capture unit. The
temperature sensor measures the temperature of the cell container and it is placed between cells V1,
V2, V5 and V6 at medium depth.
Figure 5. Cells measurement configuration.
Figure 6. Implementation in a battery.
3. Results
The proposed measurement system makes possible a continuous monitoring of a battery
without disturbing its normal operation.
In the prototype built, a measurement time span of around 5 min has been set, and measured
data are recorded in a micro‐SD card. In a future design, the time span will be programmable and
the data will be sent by radio or by wireless modules (Wi‐Fi, 4G, etc.) for remote and continuous
condition‐based maintenance (CBM) while batteries are on board of the trains.
The measurements made in the laboratory began on 15 February 2019 with a load of 10 A in the
UPS. The tests were stopped at 19:00 and the battery was disconnected during the weekend. On
Monday 18, the battery was reconnected without load in the UPS (load 0 A); at 10:30, the load in the
UPS was changed from 0 A to 45 A, and at 12:00 the load was reduced to 10 A. Figure 7 shows the
variation of the internal resistance of each cell (RV1 to RV6) together with the battery temperature,
the sharp temperature drop is due to the fact that the test was stopped during the weekend, as well
as the effect of the laboratory’s heating system.
Cell V2
Cells Voltage measurement
GND reference
Cell V1
Capture unit
Current shunt
Figure 5. Cells measurement configuration.
Energies 2019, 12, x 6 of 13
Figure 4. (a) Capture unit; (b) Master unit.
The Capture unit, by means of solid state opto‐relays, connects its ground (GND) to the
negative terminal of each cell to be measured (Figure 5) the measurement is made by means of pairs
of twisted cables to simplify the assembly. To keep the wiring simple, a Capture unit is mounted for
each group of 6 cells, giving a total of 9 Capture units for the 52‐cell battery. Figure 6 shows the
installation in the first group of 6 cells together with the Master and the first Capture unit. The
temperature sensor measures the temperature of the cell container and it is placed between cells V1,
V2, V5 and V6 at medium depth.
Figure 5. Cells measurement configuration.
Figure 6. Implementation in a battery.
3. Results
The proposed measurement system makes possible a continuous monitoring of a battery
without disturbing its normal operation.
In the prototype built, a measurement time span of around 5 min has been set, and measured
data are recorded in a micro‐SD card. In a future design, the time span will be programmable and
the data will be sent by radio or by wireless modules (Wi‐Fi, 4G, etc.) for remote and continuous
condition‐based maintenance (CBM) while batteries are on board of the trains.
The measurements made in the laboratory began on 15 February 2019 with a load of 10 A in the
UPS. The tests were stopped at 19:00 and the battery was disconnected during the weekend. On
Monday 18, the battery was reconnected without load in the UPS (load 0 A); at 10:30, the load in the
UPS was changed from 0 A to 45 A, and at 12:00 the load was reduced to 10 A. Figure 7 shows the
variation of the internal resistance of each cell (RV1 to RV6) together with the battery temperature,
the sharp temperature drop is due to the fact that the test was stopped during the weekend, as well
as the effect of the laboratory’s heating system.
Cell V2
Cells Voltage measurement
GND reference
Cell V1
Capture unit
Current shunt
Figure 6. Implementation in a battery.
3. Results
The proposed measurement system makes possible a continuous monitoring of a battery withoutdisturbing its normal operation.
Energies 2019, 12, 2836 7 of 13
In the prototype built, a measurement time span of around 5 min has been set, and measureddata are recorded in a micro-SD card. In a future design, the time span will be programmable andthe data will be sent by radio or by wireless modules (Wi-Fi, 4G, etc.) for remote and continuouscondition-based maintenance (CBM) while batteries are on board of the trains.
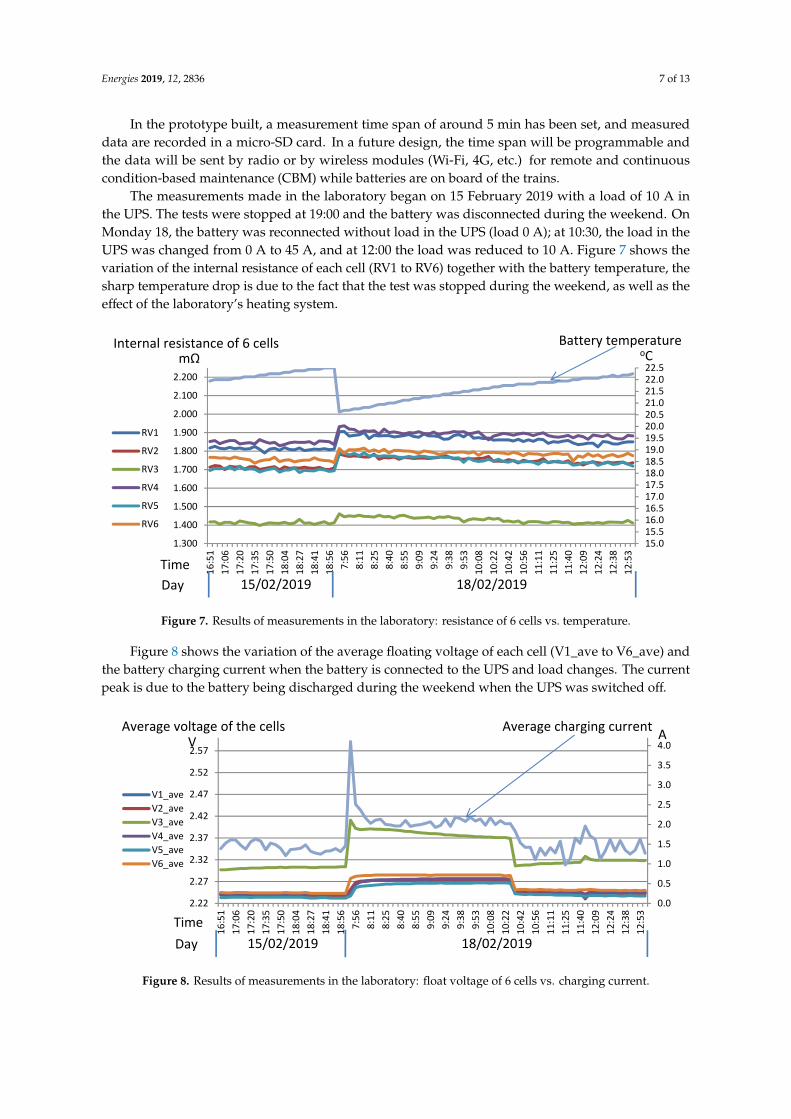
The measurements made in the laboratory began on 15 February 2019 with a load of 10 A inthe UPS. The tests were stopped at 19:00 and the battery was disconnected during the weekend. OnMonday 18, the battery was reconnected without load in the UPS (load 0 A); at 10:30, the load in theUPS was changed from 0 A to 45 A, and at 12:00 the load was reduced to 10 A. Figure 7 shows thevariation of the internal resistance of each cell (RV1 to RV6) together with the battery temperature, thesharp temperature drop is due to the fact that the test was stopped during the weekend, as well as theeffect of the laboratory’s heating system.
Energies 2019, 12, x 7 of 13
Figure 8 shows the variation of the average floating voltage of each cell (V1_ave to V6_ave) and
the battery charging current when the battery is connected to the UPS and load changes. The current
peak is due to the battery being discharged during the weekend when the UPS was switched off.
Figure 7. Results of measurements in the laboratory: resistance of 6 cells vs. temperature.
Figure 8. Results of measurements in the laboratory: float voltage of 6 cells vs. charging current.
The data stored should allow maintenance personal to carry out a number of statistical studies
of the variation of the battery parameters when a condition varies or when the battery status
changes. For example, with data of Figure 7, it is possible to calculate the variation of the internal
average resistance of each cell (RV1 to RV6) with temperature, its regression line, its prediction
errors and its Pearson coefficient (Figures 9 and 10). It is verified that the internal resistance presents
a strong linear correlation with temperature, with values of the Pearson coefficient (R2) greater than
0.93 and a maximum prediction error less than ±38.7 μΩ (±2.1%) (in RV4 at 22 °C).
15.015.516.016.517.017.518.018.519.019.520.020.521.021.522.022.5
1.300
1.400
1.500
1.600
1.700
1.800
1.900
2.000
2.100
2.200
16:51
17:06
17:20
17:35
17:50
18:04
18:27
18:41
18:56
7:56
8:11
8:25
8:40
8:55
9:09
9:24
9:38
9:53
10:08
10:22
10:42
10:56
11:11
11:25
11:40
12:09
12:24
12:38
12:53
RV1
RV2
RV3
RV4
RV5
RV6
Time
Day 15/02/2019 18/02/2019
mΩInternal resistance of 6 cells
oCBattery temperature
0.0
0.5
1.0
1.5
2.0
2.5
3.0
3.5
4.0
2.22
2.27
2.32
2.37
2.42
2.47
2.52
2.57
16:51
17:06
17:20
17:35
17:50
18:04
18:27
18:41
18:56
7:56
8:11
8:25
8:40
8:55
9:09
9:24
9:38
9:53
10:08
10:22
10:42
10:56
11:11
11:25
11:40
12:09
12:24
12:38
12:53
V1_ave
V2_ave
V3_ave
V4_ave
V5_ave
V6_ave
18/02/2019
AV
Time
Day 15/02/2019
Average voltage of the cells Average charging current
Figure 7. Results of measurements in the laboratory: resistance of 6 cells vs. temperature.
Figure 8 shows the variation of the average floating voltage of each cell (V1_ave to V6_ave) andthe battery charging current when the battery is connected to the UPS and load changes. The currentpeak is due to the battery being discharged during the weekend when the UPS was switched off.
Energies 2019, 12, x 7 of 13
Figure 8 shows the variation of the average floating voltage of each cell (V1_ave to V6_ave) and
the battery charging current when the battery is connected to the UPS and load changes. The current
peak is due to the battery being discharged during the weekend when the UPS was switched off.
Figure 7. Results of measurements in the laboratory: resistance of 6 cells vs. temperature.
Figure 8. Results of measurements in the laboratory: float voltage of 6 cells vs. charging current.
The data stored should allow maintenance personal to carry out a number of statistical studies
of the variation of the battery parameters when a condition varies or when the battery status
changes. For example, with data of Figure 7, it is possible to calculate the variation of the internal
average resistance of each cell (RV1 to RV6) with temperature, its regression line, its prediction
errors and its Pearson coefficient (Figures 9 and 10). It is verified that the internal resistance presents
a strong linear correlation with temperature, with values of the Pearson coefficient (R2) greater than
0.93 and a maximum prediction error less than ±38.7 μΩ (±2.1%) (in RV4 at 22 °C).
15.015.516.016.517.017.518.018.519.019.520.020.521.021.522.022.5
1.300
1.400
1.500
1.600
1.700
1.800
1.900
2.000
2.100
2.200
16:51
17:06
17:20
17:35
17:50
18:04
18:27
18:41
18:56
7:56
8:11
8:25
8:40
8:55
9:09
9:24
9:38
9:53
10:08
10:22
10:42
10:56
11:11
11:25
11:40
12:09
12:24
12:38
12:53
RV1
RV2
RV3
RV4
RV5
RV6
Time
Day 15/02/2019 18/02/2019
mΩInternal resistance of 6 cells
oCBattery temperature
0.0
0.5
1.0
1.5
2.0
2.5
3.0
3.5
4.0
2.22
2.27
2.32
2.37
2.42
2.47
2.52
2.57
16:51
17:06
17:20
17:35
17:50
18:04
18:27
18:41
18:56
7:56
8:11
8:25
8:40
8:55
9:09
9:24
9:38
9:53
10:08
10:22
10:42
10:56
11:11
11:25
11:40
12:09
12:24
12:38
12:53
V1_ave
V2_ave
V3_ave
V4_ave
V5_ave
V6_ave
18/02/2019
AV
Time
Day 15/02/2019
Average voltage of the cells Average charging current
Figure 8. Results of measurements in the laboratory: float voltage of 6 cells vs. charging current.
Energies 2019, 12, 2836 8 of 13
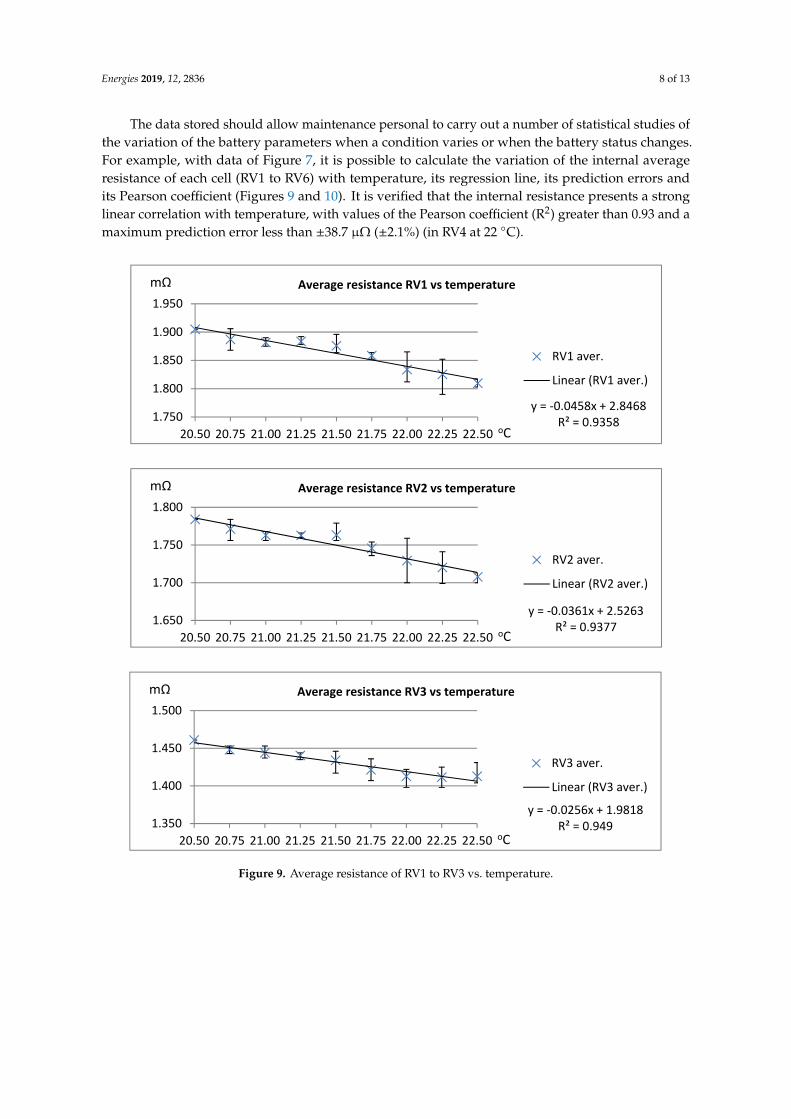
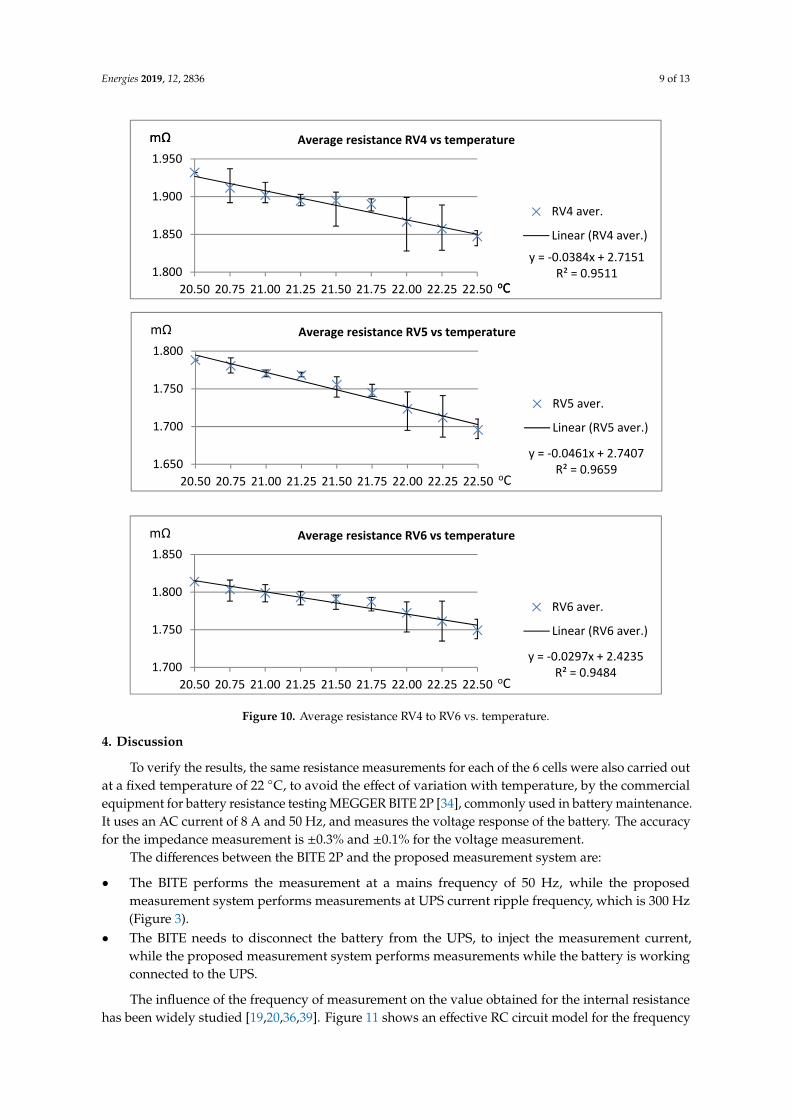
The data stored should allow maintenance personal to carry out a number of statistical studies ofthe variation of the battery parameters when a condition varies or when the battery status changes.For example, with data of Figure 7, it is possible to calculate the variation of the internal averageresistance of each cell (RV1 to RV6) with temperature, its regression line, its prediction errors andits Pearson coefficient (Figures 9 and 10). It is verified that the internal resistance presents a stronglinear correlation with temperature, with values of the Pearson coefficient (R2) greater than 0.93 and amaximum prediction error less than ±38.7 µΩ (±2.1%) (in RV4 at 22 C).Energies 2019, 12, x 8 of 13
Figure 9. Average resistance of RV1 to RV3 vs. temperature.
y = ‐0.0458x + 2.8468R² = 0.93581.750
1.800
1.850
1.900
1.950
20.50 20.75 21.00 21.25 21.50 21.75 22.00 22.25 22.50
Average resistance RV1 vs temperature
RV1 aver.
Linear (RV1 aver.)
mΩ
oC
y = ‐0.0361x + 2.5263R² = 0.9377
1.650
1.700
1.750
1.800
20.50 20.75 21.00 21.25 21.50 21.75 22.00 22.25 22.50
Average resistance RV2 vs temperature
RV2 aver.
Linear (RV2 aver.)
mΩ
oC
y = ‐0.0256x + 1.9818R² = 0.9491.350
1.400
1.450
1.500
20.50 20.75 21.00 21.25 21.50 21.75 22.00 22.25 22.50
Average resistance RV3 vs temperature
RV3 aver.
Linear (RV3 aver.)
mΩ
oC
y = ‐0.0384x + 2.7151R² = 0.95111.800
1.850
1.900
1.950
20.50 20.75 21.00 21.25 21.50 21.75 22.00 22.25 22.50
Average resistance RV4 vs temperature
RV4 aver.
Linear (RV4 aver.)
mΩ
oC
mΩ
oC
Figure 9. Average resistance of RV1 to RV3 vs. temperature.
Energies 2019, 12, 2836 9 of 13
Energies 2019, 12, x 8 of 13
Figure 9. Average resistance of RV1 to RV3 vs. temperature.
y = ‐0.0458x + 2.8468R² = 0.93581.750
1.800
1.850
1.900
1.950
20.50 20.75 21.00 21.25 21.50 21.75 22.00 22.25 22.50
Average resistance RV1 vs temperature
RV1 aver.
Linear (RV1 aver.)
mΩ
oC
y = ‐0.0361x + 2.5263R² = 0.9377
1.650
1.700
1.750
1.800
20.50 20.75 21.00 21.25 21.50 21.75 22.00 22.25 22.50
Average resistance RV2 vs temperature
RV2 aver.
Linear (RV2 aver.)
mΩ
oC
y = ‐0.0256x + 1.9818R² = 0.9491.350
1.400
1.450
1.500
20.50 20.75 21.00 21.25 21.50 21.75 22.00 22.25 22.50
Average resistance RV3 vs temperature
RV3 aver.
Linear (RV3 aver.)
mΩ
oC
y = ‐0.0384x + 2.7151R² = 0.95111.800
1.850
1.900
1.950
20.50 20.75 21.00 21.25 21.50 21.75 22.00 22.25 22.50
Average resistance RV4 vs temperature
RV4 aver.
Linear (RV4 aver.)
mΩ
oC
mΩ
oCEnergies 2019, 12, x 9 of 13
Figure 10. Average resistance RV4 to RV6 vs. temperature.
4. Discussion
To verify the results, the same resistance measurements for each of the 6 cells were also carried
out at a fixed temperature of 22 °C, to avoid the effect of variation with temperature, by the
commercial equipment for battery resistance testing MEGGER BITE 2P [34], commonly used in
battery maintenance. It uses an AC current of 8 A and 50 Hz, and measures the voltage response of
the battery. The accuracy for the impedance measurement is ±0.3% and ±0.1% for the voltage
measurement.
The differences between the BITE 2P and the proposed measurement system are:
The BITE performs the measurement at a mains frequency of 50 Hz, while the proposed
measurement system performs measurements at UPS current ripple frequency, which is 300 Hz
(Figure 3).
The BITE needs to disconnect the battery from the UPS, to inject the measurement current,
while the proposed measurement system performs measurements while the battery is working
connected to the UPS.
The influence of the frequency of measurement on the value obtained for the internal resistance
has been widely studied [19,20,36,39]. Figure 11 shows an effective RC circuit model for the
frequency range of 10−1 Hz to 1 kHz where Rs models all conductive effects of the battery, Rct is the
plate charge transfer resistance and Cdl is the electro‐chemical double layer capacitance [19]. For
example, [39] shows that above 100 Hz the measurement corresponds to the internal series resistance
because the capacitor has a low resistance, negligible compared to the series resistance Rs.
Figure 11. Cell equivalent circuit model [7, 19, 39].
y = ‐0.0461x + 2.7407R² = 0.96591.650
1.700
1.750
1.800
20.50 20.75 21.00 21.25 21.50 21.75 22.00 22.25 22.50
Average resistance RV5 vs temperature
RV5 aver.
Linear (RV5 aver.)
mΩ
oC
y = ‐0.0297x + 2.4235R² = 0.94841.700
1.750
1.800
1.850
20.50 20.75 21.00 21.25 21.50 21.75 22.00 22.25 22.50
Average resistance RV6 vs temperature
RV6 aver.
Linear (RV6 aver.)
mΩ
oC
Rct
Cdl
RS
Figure 10. Average resistance RV4 to RV6 vs. temperature.
4. Discussion
To verify the results, the same resistance measurements for each of the 6 cells were also carried outat a fixed temperature of 22 C, to avoid the effect of variation with temperature, by the commercialequipment for battery resistance testing MEGGER BITE 2P [34], commonly used in battery maintenance.It uses an AC current of 8 A and 50 Hz, and measures the voltage response of the battery. The accuracyfor the impedance measurement is ±0.3% and ±0.1% for the voltage measurement.
The differences between the BITE 2P and the proposed measurement system are:
• The BITE performs the measurement at a mains frequency of 50 Hz, while the proposedmeasurement system performs measurements at UPS current ripple frequency, which is 300 Hz(Figure 3).
• The BITE needs to disconnect the battery from the UPS, to inject the measurement current,while the proposed measurement system performs measurements while the battery is workingconnected to the UPS.
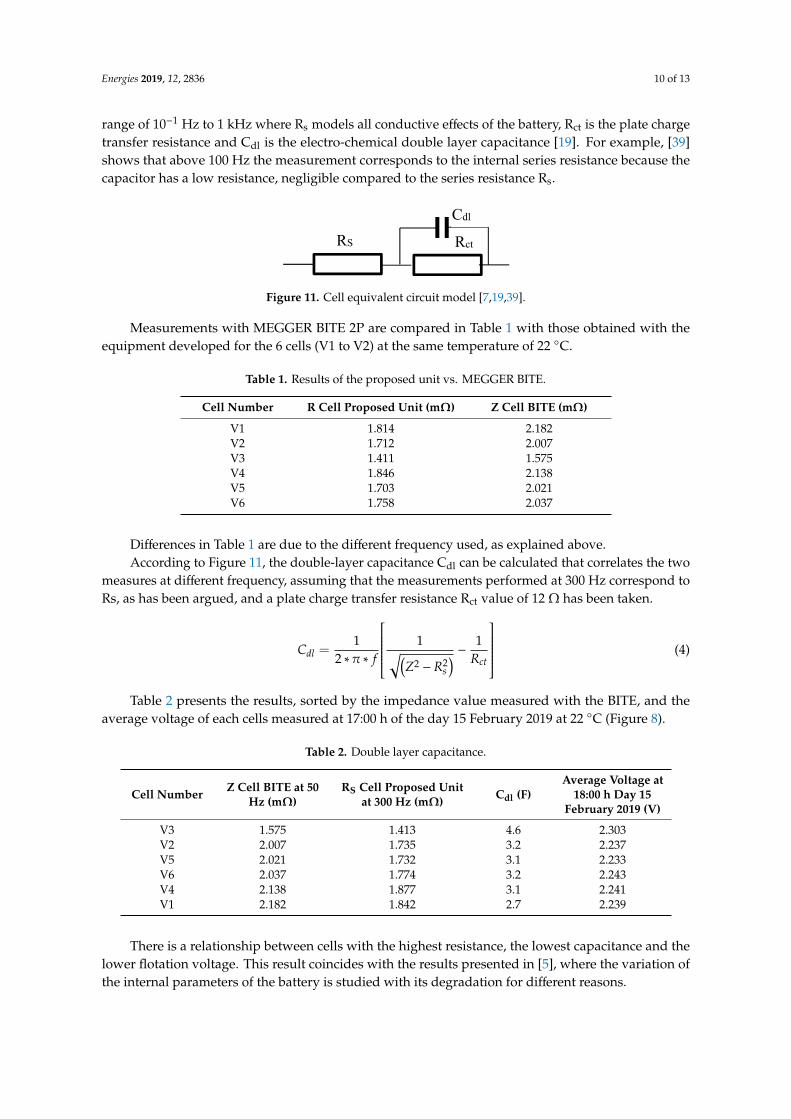
The influence of the frequency of measurement on the value obtained for the internal resistancehas been widely studied [19,20,36,39]. Figure 11 shows an effective RC circuit model for the frequency
Energies 2019, 12, 2836 10 of 13
range of 10−1 Hz to 1 kHz where Rs models all conductive effects of the battery, Rct is the plate chargetransfer resistance and Cdl is the electro-chemical double layer capacitance [19]. For example, [39]shows that above 100 Hz the measurement corresponds to the internal series resistance because thecapacitor has a low resistance, negligible compared to the series resistance Rs.
Energies 2019, 12, x 9 of 13
Figure 10. Average resistance RV4 to RV6 vs. temperature.
4. Discussion
To verify the results, the same resistance measurements for each of the 6 cells were also carried
out at a fixed temperature of 22 °C, to avoid the effect of variation with temperature, by the
commercial equipment for battery resistance testing MEGGER BITE 2P [34], commonly used in
battery maintenance. It uses an AC current of 8 A and 50 Hz, and measures the voltage response of
the battery. The accuracy for the impedance measurement is ±0.3% and ±0.1% for the voltage
measurement.
The differences between the BITE 2P and the proposed measurement system are:
The BITE performs the measurement at a mains frequency of 50 Hz, while the proposed
measurement system performs measurements at UPS current ripple frequency, which is 300 Hz
(Figure 3).
The BITE needs to disconnect the battery from the UPS, to inject the measurement current,
while the proposed measurement system performs measurements while the battery is working
connected to the UPS.
The influence of the frequency of measurement on the value obtained for the internal resistance
has been widely studied [19,20,36,39]. Figure 11 shows an effective RC circuit model for the
frequency range of 10−1 Hz to 1 kHz where Rs models all conductive effects of the battery, Rct is the
plate charge transfer resistance and Cdl is the electro‐chemical double layer capacitance [19]. For
example, [39] shows that above 100 Hz the measurement corresponds to the internal series resistance
because the capacitor has a low resistance, negligible compared to the series resistance Rs.
Figure 11. Cell equivalent circuit model [7, 19, 39].
y = ‐0.0461x + 2.7407R² = 0.96591.650
1.700
1.750
1.800
20.50 20.75 21.00 21.25 21.50 21.75 22.00 22.25 22.50
Average resistance RV5 vs temperature
RV5 aver.
Linear (RV5 aver.)
mΩ
oC
y = ‐0.0297x + 2.4235R² = 0.94841.700
1.750
1.800
1.850
20.50 20.75 21.00 21.25 21.50 21.75 22.00 22.25 22.50
Average resistance RV6 vs temperature
RV6 aver.
Linear (RV6 aver.)
mΩ
oC
Rct
Cdl
RS
Figure 11. Cell equivalent circuit model [7,19,39].
Measurements with MEGGER BITE 2P are compared in Table 1 with those obtained with theequipment developed for the 6 cells (V1 to V2) at the same temperature of 22 C.
Table 1. Results of the proposed unit vs. MEGGER BITE.
Cell Number R Cell Proposed Unit (mΩ) Z Cell BITE (mΩ)
V1 1.814 2.182V2 1.712 2.007V3 1.411 1.575V4 1.846 2.138V5 1.703 2.021V6 1.758 2.037
Differences in Table 1 are due to the different frequency used, as explained above.According to Figure 11, the double-layer capacitance Cdl can be calculated that correlates the two
measures at different frequency, assuming that the measurements performed at 300 Hz correspond toRs, as has been argued, and a plate charge transfer resistance Rct value of 12 Ω has been taken.
Cdl =1
2 ∗π ∗ f
1√(Z2 −R2
s
) − 1Rct
(4)
Table 2 presents the results, sorted by the impedance value measured with the BITE, and theaverage voltage of each cells measured at 17:00 h of the day 15 February 2019 at 22 C (Figure 8).
Table 2. Double layer capacitance.
Cell Number Z Cell BITE at 50Hz (mΩ)
RS Cell Proposed Unitat 300 Hz (mΩ) Cdl (F)
Average Voltage at18:00 h Day 15
February 2019 (V)
V3 1.575 1.413 4.6 2.303V2 2.007 1.735 3.2 2.237V5 2.021 1.732 3.1 2.233V6 2.037 1.774 3.2 2.243V4 2.138 1.877 3.1 2.241V1 2.182 1.842 2.7 2.239
There is a relationship between cells with the highest resistance, the lowest capacitance and thelower flotation voltage. This result coincides with the results presented in [5], where the variation ofthe internal parameters of the battery is studied with its degradation for different reasons.
Energies 2019, 12, 2836 11 of 13
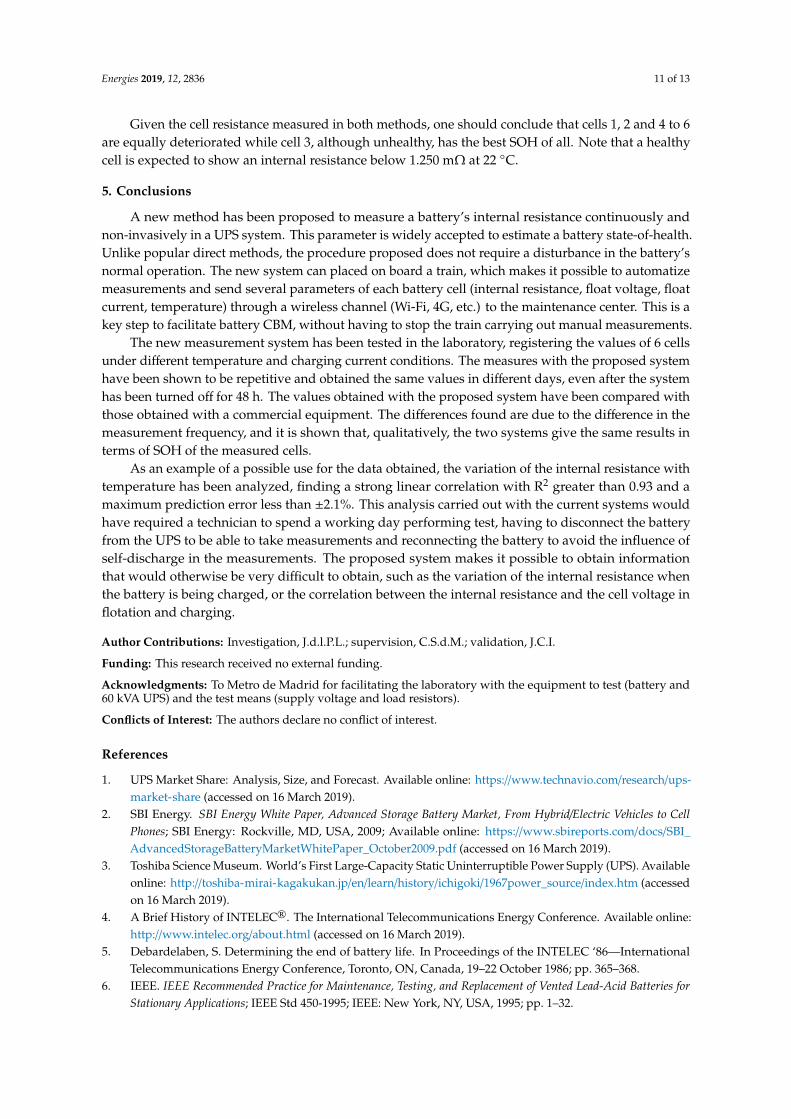
Given the cell resistance measured in both methods, one should conclude that cells 1, 2 and 4 to 6are equally deteriorated while cell 3, although unhealthy, has the best SOH of all. Note that a healthycell is expected to show an internal resistance below 1.250 mΩ at 22 C.
5. Conclusions
A new method has been proposed to measure a battery’s internal resistance continuously andnon-invasively in a UPS system. This parameter is widely accepted to estimate a battery state-of-health.Unlike popular direct methods, the procedure proposed does not require a disturbance in the battery’snormal operation. The new system can placed on board a train, which makes it possible to automatizemeasurements and send several parameters of each battery cell (internal resistance, float voltage, floatcurrent, temperature) through a wireless channel (Wi-Fi, 4G, etc.) to the maintenance center. This is akey step to facilitate battery CBM, without having to stop the train carrying out manual measurements.
The new measurement system has been tested in the laboratory, registering the values of 6 cellsunder different temperature and charging current conditions. The measures with the proposed systemhave been shown to be repetitive and obtained the same values in different days, even after the systemhas been turned off for 48 h. The values obtained with the proposed system have been compared withthose obtained with a commercial equipment. The differences found are due to the difference in themeasurement frequency, and it is shown that, qualitatively, the two systems give the same results interms of SOH of the measured cells.
As an example of a possible use for the data obtained, the variation of the internal resistance withtemperature has been analyzed, finding a strong linear correlation with R2 greater than 0.93 and amaximum prediction error less than ±2.1%. This analysis carried out with the current systems wouldhave required a technician to spend a working day performing test, having to disconnect the batteryfrom the UPS to be able to take measurements and reconnecting the battery to avoid the influence ofself-discharge in the measurements. The proposed system makes it possible to obtain informationthat would otherwise be very difficult to obtain, such as the variation of the internal resistance whenthe battery is being charged, or the correlation between the internal resistance and the cell voltage inflotation and charging.
Author Contributions: Investigation, J.d.l.P.L.; supervision, C.S.d.M.; validation, J.C.I.
Funding: This research received no external funding.
Acknowledgments: To Metro de Madrid for facilitating the laboratory with the equipment to test (battery and60 kVA UPS) and the test means (supply voltage and load resistors).
Conflicts of Interest: The authors declare no conflict of interest.
References
1. UPS Market Share: Analysis, Size, and Forecast. Available online: https://www.technavio.com/research/ups-market-share (accessed on 16 March 2019).
2. SBI Energy. SBI Energy White Paper, Advanced Storage Battery Market, From Hybrid/Electric Vehicles to CellPhones; SBI Energy: Rockville, MD, USA, 2009; Available online: https://www.sbireports.com/docs/SBI_AdvancedStorageBatteryMarketWhitePaper_October2009.pdf (accessed on 16 March 2019).
3. Toshiba Science Museum. World’s First Large-Capacity Static Uninterruptible Power Supply (UPS). Availableonline: http://toshiba-mirai-kagakukan.jp/en/learn/history/ichigoki/1967power_source/index.htm (accessedon 16 March 2019).
4. A Brief History of INTELEC®. The International Telecommunications Energy Conference. Available online:http://www.intelec.org/about.html (accessed on 16 March 2019).
5. Debardelaben, S. Determining the end of battery life. In Proceedings of the INTELEC ‘86—InternationalTelecommunications Energy Conference, Toronto, ON, Canada, 19–22 October 1986; pp. 365–368.
6. IEEE. IEEE Recommended Practice for Maintenance, Testing, and Replacement of Vented Lead-Acid Batteries forStationary Applications; IEEE Std 450-1995; IEEE: New York, NY, USA, 1995; pp. 1–32.

Energies 2019, 12, 2836 12 of 13
7. IEEE. IEEE Recommended Practice for Maintenance, Testing, and Replacement of Vented Lead-Acid Batteries forStationary Applications; IEEE Std 450-2010 (Revision of IEEE Std 450-2002); IEEE: New York, NY, USA, 2011;pp. 1–71.
8. BatteryTestingGuide_AG_es_V04; Megger GmbH; Obere Zeil 2; DE-61440 Oberursel. Availableonline: https://uk.megger.com/login?returnurl=%2fsupport%2ftechnical-library%2ftechnical-guides%2fbattery-testing-guide (accessed on 16 March 2019).
9. GNB Industrial Power. Instrucciones de Instalación y Operación; Section 93.10TS2012-07; GNB IndustrialPower: Aurora, IL, USA, 2012; Available online: http://www2.exide.com/Media/files/Downloads/IndustAmer/Section%2093_10TS%202012-07%20GNB%20Flooded%20Classic%20TCX%20Batteries%20I%26O%20Manual%20in%20Spanish.pdf (accessed on 16 March 2019).
10. IEEE. IEEE Recommended Practice for Maintenance, Testing, and Replacement of Valve-Regulated Lead-Acid (VRLA)Batteries for Stationary Applications; IEEE Std 1188-2005 (Revision of IEEE Std 1188-1996); IEEE: New York, NY,USA, 2006; pp. 1–44.
11. Damlund, I. Analysis and interpretation of AC-measurements on batteries used to assess state-of-healthand capacity-condition. In Proceedings of the 17th International Telecommunications Energy Conference(INTELEC 95), The Hague, The Netherlands, 29 October–1 November 1995; pp. 828–833.
12. Boisvert, T. Using float charging current measurements to prevent thermal runaway on VRLA batteries. InProceedings of the 2001 Twenty-Third International Telecommunications Energy Conference (INTELEC2001), Edinburgh, UK, 14–18 October 2001; pp. 126–131.
13. Floyd, K.D.; Noworolski, Z.; Noworolski, J.M.; Sokolski, W. Assessment of lead-acid battery state of charge bymonitoring float charging current. In Proceedings of Intelec 94; IEEE: New York, NY, USA, 1994; pp. 602–608.
14. Vaccaro, F.J.; Casson, P. Internal resistance: Harbinger of capacity loss in starved electrolyte sealed lead acidbatteries. In Proceedings of the Ninth International Telecommunications Energy Conference, Stockholm,Sweden, 14–17 June 1987; pp. 128–131.
15. Johnson, W. Stationary Battery Monitoring by Internal Ohmic Measurements; Final Report, December 2002; EPRI:Palo Alto, CA, USA, 2002; Product ID: 1002925; Available online: https://www.epri.com/#/pages/product/000000000001002925/?lang=en-US (accessed on 16 March 2019).
16. Munoz-Condes, P.; Gomez-Parra, M.; Sancho, C.; San Andres, M.A.G.; Gonzalez-Fernandez, F.J.; Carpio, J.;Guirado, R. On Condition Maintenance Based on the Impedance Measurement for Traction Batteries:Development and Industrial Implementation. IEEE Trans. Ind. Electron. 2013, 60, 2750–2759. [CrossRef]
17. Markle, G.J. Variables that influence results of impedance testing for valve regulated cells. In Proceedings ofthe 15th International Telecommunications Energy Conference (Intelec 93), Paris, France, 27–30 September1993; Volume 1, pp. 444–448.
18. Alber, G.; Migliaro, M.W. Impedance testing-is it a substitute for capacity tests? In Proceedings of Intelec 94;IEEE: New York, NY, USA, 1994; pp. 245–249.
19. Saponara, S. Distributed Measuring System for Predictive Diagnosis of Uninterruptible Power Supplies inSafety-Critical Applications. Energies 2016, 9, 327. [CrossRef]
20. Willihnganz, E.; Rohner, P. Battery Impedance: Farads, Milliohms, Microhenrys. Electr. Eng. 1959, 78,922–925. [CrossRef]
21. PNGV Battery Test Manual; DOE/ID-10597; Rev. 3; February 2001; Idaho Operations Office., Idaho, USA.Available online: https://avt.inl.gov/sites/default/files/pdf/battery/pngv_manual_rev3b.pdf (accessed on 16March 2019).
22. Rezvanizaniani, S.M.; Liu, Z.; Chen, Y.; Lee, J. Review and recent advances in battery health monitoring andprognostics technologies for electric vehicle (EV) safety and mobility. J. Power Sources 2014, 256, 110–124.[CrossRef]
23. Chang, W. The State of Charge Estimating Methods for Battery: A Review. ISRN Appl. Math. 2013, 2013,953792. [CrossRef]
24. Ng, K.S.; Moo, C.S.; Chen, Y.P.; Hsieh, Y.C. Enhanced coulomb counting method for estimating state-of-chargeand state-of-health of lithium-ion batteries. Appl. Energy 2009, 86, 1506–1511. [CrossRef]
25. Weigert, T.; Tian, Q.; Lian, K. State-of-charge prediction of batteries and battery-supercapacitor hybrids usingartificial neural networks. J. Power Sources 2011, 196, 4061–4066. [CrossRef]
Energies 2019, 12, 2836 13 of 13
26. Linda, O.; William, E.J.; Huff, M.; Manic, M.; Gupta, V.; Nance, J.; Hess, H.; Rufus, F.; Thakker, A.; Govar, J.Intelligent neural network implementation for SOCI development of Li/CFx batteries. In Proceedings of the2nd International Symposium on Resilient Control Systems (ISRCS ‘09), Idaho Falls, ID, USA, 11–13 August2009; pp. 57–62.
27. Chang, W.Y. State of charge estimation for LiFePO4 battery using artificial neural network. Int. Rev. Electr.Eng. 2012, 7, 5800–5874.
28. Álvarez, J.C.; García, P.J.; Blanco, C. Support Vector Machines Used to Estimate the Battery State of Charge.IEEE Trans. Power Electr. 2013, 28, 5919–5926. [CrossRef]
29. Carmona Suárez, E.J. Tutorial sobre Máquinas de Vectores Soporte (SVM); Dpto. de Inteligencia Artificial,ETS de Ingeniería Informática, Universidad Nacional de Educación a Distancia (UNED). 2014. Availableonline: http://www.ia.uned.es/~ejcarmona/publicaciones/%5B2013-Carmona%5D%20SVM.pdf, (accessedon 21 July 2019).
30. Li, I.H.; Wang, W.Y.; Su, S.F.; Lee, Y.S. A merged fuzzy neural network and its applications in batterystate-of-charge estimation. IEEE Trans. Energy Convers. 2007, 22, 697–708. [CrossRef]
31. Lee, Y.S.; Wang, W.Y.; Kuo, T.Y. Soft computing for battery state-of-charge (BSOC) estimation in battery stringsystems. IEEE Trans. Ind. Electron. 2008, 55, 229–239. [CrossRef]
32. Juang, L.W.; Kollmeyer, P.J.; Jahns, T.M.; Lorenz, R.D. Implementation of online battery state-of-powerand state-of-function estimation in electric vehicle applications. In Proceedings of the Energy ConversionCongress and Exposition (ECCE), Raleigh, NC, USA, 15–20 September 2012. [CrossRef]
33. Plett, G.L. Extended Kalman filtering for battery management systems of LiPB-based HEV battery packs.J. Power Sources 2004, 134, 277–292. [CrossRef]
34. Megger Battery Testing. Available online: https://megger.com/products/cable-fault-test-and-diagnostics/telecom-testing/battery-testing (accessed on 16 March 2019).
35. Wurst, J.W.; Garron, S.A.; Dob, A.M. Apparatus for Measuring Internal Resistance of Wet Cell StorageBatteries Having Non-Removable Cell Caps. U.S. Patent 5047722A, 10 September 1991.
36. Lee, Y.D.; Park, S.Y.; Han, S.B. Online Embedded Impedance Measurement Using High-Power BatteryCharger. IEEE Trans. Ind. Appl. 2015, 51, 498–508. [CrossRef]
37. Stefanakos, E.K.; Thexton, A.S. Remote battery monitoring and management field trial. In Proceedingsof the Power and Energy Systems in Converging Markets, Melbourne, Australia, 23 October 1997;ISBN 0-7803-3996-7.
38. ARDUINO DUE. Available online: https://store.arduino.cc/due (accessed on 16 March 2019).39. Huet, F. A review of impedance measurements for determination of the state-of-charge or state-of-health of
secondary batteries. J. Power Sources 1998, 70, 59–69. [CrossRef]
© 2019 by the authors. Licensee MDPI, Basel, Switzerland. This article is an open accessarticle distributed under the terms and conditions of the Creative Commons Attribution(CC BY) license (http://creativecommons.org/licenses/by/4.0/).
Related Documents