This article was originally published in a journal published by Elsevier, and the attached copy is provided by Elsevier for the author’s benefit and for the benefit of the author’s institution, for non-commercial research and educational use including without limitation use in instruction at your institution, sending it to specific colleagues that you know, and providing a copy to your institution’s administrator. All other uses, reproduction and distribution, including without limitation commercial reprints, selling or licensing copies or access, or posting on open internet sites, your personal or institution’s website or repository, are prohibited. For exceptions, permission may be sought for such use through Elsevier’s permissions site at: http://www.elsevier.com/locate/permissionusematerial

Welcome message from author
This document is posted to help you gain knowledge. Please leave a comment to let me know what you think about it! Share it to your friends and learn new things together.
Transcript

This article was originally published in a journal published byElsevier, and the attached copy is provided by Elsevier for the
author’s benefit and for the benefit of the author’s institution, fornon-commercial research and educational use including without
limitation use in instruction at your institution, sending it to specificcolleagues that you know, and providing a copy to your institution’s
administrator.
All other uses, reproduction and distribution, including withoutlimitation commercial reprints, selling or licensing copies or access,
or posting on open internet sites, your personal or institution’swebsite or repository, are prohibited. For exceptions, permission
may be sought for such use through Elsevier’s permissions site at:
http://www.elsevier.com/locate/permissionusematerial

Autho
r's
pers
onal
co
py
Continental Shelf Research 27 (2007) 1002–1016
Changes of macrobenthos composition under different ENSOcycle conditions on the continental shelf off central Chile
Javier Sellanesa,b,�, Eduardo Quirogac, Carlos Neirad, Dimitri Gutierreze
aUniversidad Catolica del Norte, Facultad de Ciencias del Mar, Larrondo 1281, Coquimbo, ChilebCentro de Investigacion Oceanografica en el Pacıfico Sur Oriental (COPAS), Universidad de Concepcion, Chile
cCentro de Investigacion en Ecosistemas de la Patagonia (CIEP), Bilbao 449, Coyhaique, ChiledIntegrative Oceanography Division, Scripps Institution of Oceanography, 9500 Gilman Drive, La Jolla, CA 92093-0218, USA
eDireccion de Investigaciones Oceanograficas, Instituto del Mar del Peru, P.O. Box 22, Callao, Peru
Received 14 December 2005; received in revised form 23 November 2006; accepted 3 January 2007
Available online 16 January 2007
Abstract
The course of environmental conditions and shelf macrobenthic communities off Central Chile (�361S) during the
strong 1997–98 El Nino (EN) event is compared with a subsequent and basically ‘‘normal’’ period (2002–2003). Changes in
macrofaunal community, feeding mode structure, and biomass size spectra are contrasted over time with changes in
oceanographic and sediment settings, in order to assess intra- and inter-annual changes in faunal composition during both
ENSO periods.
During EN, there was a decrease in biomass and abundance of species known to be well adapted to organic-rich,
oxygen-deficient environments, such as the interface-feeding polychaete Paraprionospio pinnata. On the other hand the
abundance of highly mobile, burrowing polychaetes remained unaffected, or even increased in biomass. The decline of
P. pinnata lasted several years after the demise of warm conditions, possibly due to negative interactions with those more
mobile burrowing polychaetes. The percent contribution of subsurface-deposit feeders to total biomass increased during
EN (49.3712.4% during summer) and declined only in the summer-fall period of 2002–03 (11.174.1%). An opposite
trend was observed for interface and surface-deposit feeders. From EN to summer-fall 2002–03 (i.e., normal to low oxygen
conditions) the size-structure of the macrobenthos switched from a larger to a smaller-sized assemblage. However, biomass
was maintained due to successful recruitment and high abundance of both P. pinnata and the squat lobster, Pleuroncodes
monodon.
Our results suggest that the shelf macrofaunal community structure exhibit fluctuations at various time scales, and that
these changes are more pronounced during and after a strong EN event. In such cases, the effects of such an event may be
recorded at latitudes as far south as 361S, with consequences in the biota lasting for many years after the demise of warm
conditions.
r 2007 Elsevier Ltd. All rights reserved.
Keywords: Macrobenthos; Feeding modes; Deposit-feeders; Biomass size spectra; ENSO; Central Chile
ARTICLE IN PRESS
www.elsevier.com/locate/csr
0278-4343/$ - see front matter r 2007 Elsevier Ltd. All rights reserved.
doi:10.1016/j.csr.2007.01.001
�Corresponding author. Universidad Catolica del Norte, Facultad de Ciencias del Mar, Larrondo 1281, Coquimbo, Chile.
Tel.: +56 51 209802.
E-mail address: [email protected] (J. Sellanes).

Autho
r's
pers
onal
co
py
1. Introduction
The coastal zone off central Chile (�361S),strongly influenced by seasonal wind-driven upwel-ling, is one of the areas with the highest knownprimary production rates worldwide (Fossing et al.,1995; Daneri et al., 2000). Furthermore, a pro-nounced oxygen minimum zone (OMZ), located atdepths between 50 and 250m and associated withthe Equatorial Subsurface Water (ESSW), partiallycovers the continental shelf. When upwelling pre-vails during summer, the OMZ can be found only afew meters from the surface within Concepcion Bay(Ahumada et al., 1983). As a result, high accumula-tion rates of undegraded organic carbon occur(Munoz et al., 2004a).
A peculiarity of the biota thriving in theseorganic-rich sediments is indicated by the presenceof an important prokariotic community, mostlycomposed of the filamentous, gliding bacteriaThioploca spp., which sometimes has greater bio-mass than the eukaryotic fauna (Gallardo, 1977;Schulz et al., 2000). The metazoan fauna is small(body sizeso1.0mm); dominated both in biomassand abundance by polychaetes, while other groupslike mollusks, crustaceans and cnidarians areunusual (Gallardo, 1985; Gallardo et al., 1995).Meiofauna is abundant and dominated by nema-todes (Sellanes et al., 2003). It has been alsoreported that during non-El Nino years, the benthicfauna attains their maximum abundance andbiomass during fall and winter, probably due tofavorable environmental conditions (i.e., absence ofhypoxic bottom waters, less reduced sediments)(Carrasco and Arcos, 1984).
Studies indicate that most of the more abundantpolychaete species are well adapted to cope withoxygen-deficient conditions, by having enzymaticmechanisms related with anaerobic pathways(Gonzalez and Quinones, 2000); among them,Paraprionospio pinnata and Nephtys ferruginea arethe best adapted. These two species displayed highactivities of four pyruvate oxidoreductases, suggest-ing a high metabolic plasticity to thrive even inanoxic conditions. Consistently, P. pinnata is thedominant species among the eukaryotic benthos inthe study area (Gallardo et al., 1972, 1995; Carrascoand Carbajal, 1998; Gutierrez et al., 2000).
Continental shelf benthic communities are oftenstrongly influenced by El Nino (EN), the warmphase of the ENSO cycle, in the Eastern Pacific(Tomicic, 1985; Arntz and Fahrbach, 1996). Off
central Chile, seasonal and inter-annual changes inupwelling intensity can lead to changes in bottom-water dissolved oxygen (DO) concentration, in theamount of organic matter reaching the bottom(Gutierrez et al., 2000), in the quality and lability ofdeposited organic matter (Neira et al., 2001a;Sellanes and Neira, 2006), and in the sedimentnitrogen fluxes (Munoz et al., 2004b). It is knownthat the impacts of EN on environmental conditionsmay last from a few months to several years(Gallardo, 1985; Tarazona et al., 1996). However,very little is known about its effects on benthiccommunities beyond 231S (i.e., Antofagasta, Chile),which usually has been considered the southernlimit of the most impacted area by strong EN events(Arntz et al., 1991).
During the last strong EN event (1997–98), welearned that at the shelf the most noticeable effects ofEN on the macroinfauna were a switch in theircomposition, the deepening of its distribution withinthe sediment and an increase in their bioturbationpotential, associated with a decrease of the sedimentorganic matter reactivity (Gutierrez, 2000; Gutierrezet al., 2000). However, these studies were carried outduring the event, and no comparison was made withnon-EN conditions. In the present paper, we fill thisgap by comparing macrofaunal community responseto changing environmental conditions during twokey phases of the ENSO cycle: a warm (EN) phaseand a subsequent non-EN phase. The EN phase isthe period May 1997–March 1998, one of thestrongest warm events of the last decades (McPhaden, 1999), and the non-EN phase was theperiod April 2002–June 2003. In both phases, weexamine the structure of the benthic macrofauna, interms of composition, density, biomass size-spectra,and feeding modes, with the aim to link it withseasonal- and ENSO-related variability of the watercolumn and sediment habitat conditions. Samplingwas carried out at a site representing typical shelfconditions for central Chile (i.e., a site where under‘‘normal’’ conditions, higher fluxes of phytodetritusfrom the water column to the seafloor occur duringsummer, and hypoxic bottom water occurs yearround). We also identified key species structuring themacrobenthic community, which in turn, may serveas indicators of the prevalent ENSO cycle phase.
We test the hypotheses that (i) EN conditionstrigger community changes due to disturbances inthe annual oxygen and organic matter flux regime,favoring the dominance of larger-bodied, burrowingorganisms instead of smaller-bodied, tube-dwelling
ARTICLE IN PRESSJ. Sellanes et al. / Continental Shelf Research 27 (2007) 1002–1016 1003

Autho
r's
pers
onal
co
py
interface feeding organisms (e.g., the polychaeteP. pinnata), and (ii) time responses of key speciesand/or ecological interactions retard the return to apre-EN community for a period longer than theevent itself.
2. Material and methods
2.1. Field sampling
The study site is located on the continental shelf(88m depth) off Concepcion, central Chile (36130.80
S; 73107.70 W; Fig. 1). Sampling was conductedaboard the R.V. Kay Kay (University of Concep-cion), during two periods: (a) from May 1997 toFebruary 2000, and (b) from May 2002 to June2003. The first sampling (May 1997) took placeshortly after the onset of the 1997–98 EN, and afterthe initial sampling, samples were taken, in general,on a seasonal basis.
Water column temperature, salinity and DO weremeasured using a CTDO. In addition, DO measure-ments were made by a modified, semi-automaticWinkler method using a photometric end-pointdetector, a Dosimat 665 (Metrohom), and a chart
recorder (Williams and Jenkinson, 1982). Theanalytical procedures were conducted as suggestedby Knap et al. (1993).
2.2. Sediment parameters
Sediment cores were retrieved using a minimultiple-corer (tube i.d. 95mm) (Barnett et al.,1984). Concurrently with the biological sampling, aset of sediment environmental parameters wasmeasured during the August 1997–May 1998(strong EN conditions) and the September2002–June 2003 (non-EN conditions) sub-periods(Table 1, Fig. 2 doted-line rectangles). From theoriginal cores, sub-samples for chemical analysiswere taken using plexiglas liners (i.d. 36mm). Sub-samples were kept cool and in the dark until furtherprocessing in the laboratory (in general within 12 h).Sediment (top 0–1 cm) for Chlorophyll-a (Chl-a)and phaeopigments (Phaeop) as well as totalorganic carbon (TOC) and total nitrogen (TN)content was kept frozen (�20 1C) until analysis.Two additional cores were sub-sampled for dis-solved sulfide at each opportunity. Pore water wasextracted under N2 atmosphere with a pneumatic
ARTICLE IN PRESS
36° 20'
South
America
0°
20°
40°
Concepcion Bay
CONCEPCION
PACIFIC OCEAN
Bio-Bio River
Mid-Shelf
(88 m)
CH
ILE
40’
200 m
N
100m
Fig. 1. Study site, located at the mid-shelf (88m) off Concepcion, central Chile.
J. Sellanes et al. / Continental Shelf Research 27 (2007) 1002–10161004

Autho
r's
pers
onal
co
py
squeezer at 1 and 2 cm sections down to 15 cmsediment. Water content and porosity were deter-mined at 1 cm intervals down to 15 cm in order toestimate sulfide inventories.
Chloroplastic pigments (Chl-a and Phaeop) weredetermined fluorometrically according to the meth-od of Lorenzen and Jeffrey (1980). Pigments wereextracted from ca. 0.3 g of sediment with 90%
ARTICLE IN PRESS
Table 1
Sediment environmental conditions during the 1997–98 and 2002–03 sampling periods
Variables 1997–98 2002–03
August November March May September November March June
TOC (mg g�1) 27.9 33.5 37.5 36.1 45.9 30.7 51.8 42.6
TN (mgg�1) 3.9 4.5 5.5 4.9 4.7 3.9 7.2 5.3
C:N (molar) 8.43 8.68 7.95 8.60 11.30 9.21 8.48 9.49
TOM (%) 16.57 16.58 14.38 14.83 14.24 14.91 14.27 16.26
CPE (mg g�1) 309.5 293.0 264.6 195.8 225.7 231.6 794.6 460.6
RPD (cm) 2 3 9 7 20 20 10 11.5
DO (mlL�1) 0.85 0.52 0.31 1.11 0.68 0.35 0.08 1.22
SH2S (mmolm�2) nd 1.00 2.70 3.15 nd nd 23.11 1.21
TOC ¼ total organic carbon, TN ¼ total nitrogen, C:N ¼ carbon to nitrogen ratio, TOM ¼ total organic matter, CPE ¼ chloroplastic
pigment equivalent (i.e., sum of Chla and phaeopigments), RPD ¼ redox potential discontinuity depth, DO ¼ bottom-water dissolved
oxygen, SH2S ¼ sulphide inventories integrated for the upper 15 cm.
Fig. 2. Contour graphs showing the time course of: (A) Water column temperature (1C), (B) Dissolved oxygen (ml L�1) and (C)
Abundance of the six most representative species of the macrobenthos. The study period covers a strong El Nino (May 1997–May 1998)
and post-El Nino conditions (May 1998–March 2000/April 2002–July 2003) at the mid-shelf site off Concepcion. The superimposed
dotted-line rectangles indicate the periods used to compare environmental conditions during EN and a subsequent non-EN period.
J. Sellanes et al. / Continental Shelf Research 27 (2007) 1002–1016 1005

Autho
r's
pers
onal
co
py
acetone on a vortex stirrer, sonicated for 10minand then centrifuged (at 1500g), for 5min. Thisextraction was done twice. The supernatantwas used to determine the Chl-a concentration,and then, acidified with 0.1N HCl to estimatePhaeop using a Turner AU-10 fluorometer. Thesum of Chl-a and phaeop was operationallydefined as chloroplastic pigments equivalent (CPE)and was used as a measure of the input ofphytodetrital material to the sediments (Pfannkucheand Soltwedel, 1998). TOC and TN were deter-mined after acidification with 1N HCl (to removecarbonates) using a Heraeus-CHN elemental analy-zer. Porewater sulfide was determined colorimetri-cally at 670 nm using the methylene blue technique(Cline, 1969). Sediment redox potential was mea-sured at intervals of 1 cm using a platinum standardcombination electrode with a calomel internalreference. The depth at which the transition ofpositive to negative redox values occurred wasconsidered the redox potential discontinuity depth(RPD).
2.3. Macrofauna
For macrofaunal analysis, four indepen-dent replicates (each replicate consisting of twopooled cores from independent multicore drops;total area 0.0142m2) were taken at eachsampling date. In order to examine the verticaldistribution of the fauna, cores were sliced at0–2, 2–5, 5–10, 10–15, and 15–20 cm. Each sectionwas preserved unsieved in 10% buffered formalinuntil further analysis. In the laboratory, macro-benthic animals (40.5mm) were sorted and identi-fied to the lowest taxon possible under a dissectingmicroscope (up to 50� magnification). Biomasswas determined for each taxon in terms of wetweight with a precision of 0.1mg.
Taxa were assigned to feeding modes basedon the literature (Fauchald and Jumars, 1979)and previous work in the area (Carrasco andCarbajal, 1998; Gutierrez et al., 2000). Thefeeding modes considered here were: interfacefeeders (IF), surface deposit-feeders (SDF), subsur-face deposit-feeders (SSDF), suspension-feeders(SF), and omnivores/predators (OP). Here weshould note that IF includes those species that areable to switch from suspension-feeding to surfacedeposit-feeding, as explained in Gutierrez et al.(2000).
2.4. Data analysis
Density and biomass data from each replicate werefirst standardized by area (m2) and then used todetermine the means and standard deviations permonth. To assess temporal changes during contrast-ing ENSO cycle phases (i.e., the 1997–98 and the2002–03 periods), changes in abundance and inbiomass of the total assemblage and of the mostrepresentative species were assessed by a one-wayAnalysis of Variance (ANOVA; a ¼ 0.05). The rawdata were fourth-root transformed and the homo-scedasticity (Bartlett’s test), as well as the normalityof residuals were checked (Zar, 1974). Whensignificant differences were observed, contrasts wereperformed by a posteriori Tukey’s HSD test (Zar,1974). To compare the community structure of the1997–98 versus the 2002–03 periods, multivariableanalyses of macrofaunal communities were con-ducted using PRIMER software (PRIMER version5; Clarke and Gorley, 2001). The species density datamatrix was transformed according to Y ¼ OOX
(Clarke and Warwick, 1994). The ordination methodused was non-metric multidimensional scaling(NMDS) analysis (Field et al., 1982), and thesignificance of differences between sampling dateswas examined by the randomization test ANOSIM(Clarke, 1993). Canonical correspondence analysis(CCA) was performed with the software MVSP(version 3.13). CCA was applied to relate the set ofenvironmental parameters to both (i) species and (ii)feeding mode composition among sampling dates, assuggested by Jongman et al. (1987).
In order to explore seasonal and EN effects onthe size structure of the macrobenthic communities,normalized biomass size-spectra (NBSS) were con-structed as described by Platt and Denman (1977,1978). The intercept of NBSS is an indicator of totalbiomass of the system (Sprules and Munawar, 1986;Quiroga et al., 2005). Mean individual wet weight(W) was estimated as total macrofauna communitybiomass divided by total macrofauna communitydensity. The parameters of the NBSS were deter-mined by regressing the log2 (normalized biomass)against log2 (individual weight). Differences amongthe slopes of NBSS were assessed by an analysis ofcovariance according to Zar (1974). The spectrawere constructed using a maximum of 11 sizeclasses, and pooling data in order to cover thefollowing periods: (i) winter/spring and (ii) summer/fall of 1997–98 and (iii) winter/spring and (iv)summer/fall of 2002–03.
ARTICLE IN PRESSJ. Sellanes et al. / Continental Shelf Research 27 (2007) 1002–10161006

Autho
r's
pers
onal
co
py
3. Results
3.1. Water column temperature and DO
A notable deepening of the 12 1C isothermoccurred from May 1997 to November 1998, whichwas located beyond 80m depth during August 1997and May 1998. In contrast, the 12 1C isothermremained above 40m from November 1998 to June2003 (Fig. 2A). The highest bottom water DOconcentration was recorded in May 1997(1.11ml L�1). During following non-EN summers,DO was very low (o0.2ml L�1). Remarkablystrong oxygen-deficient conditions were observedduring 2003, with hypoxic waters ascending up to30m depth (Fig. 2B).
3.2. Sediment conditions
TOC ranged from 27.9mg g–1 in August 1997 to51.8mg g–1 in March 2003 (Table 1). TN rangedfrom 3.9mg g�1 in August 1997 to 7.2mg g�1, inMarch 2003. The C/N molar ratio did not showmajor changes, varying between 8.43 and 11.30. TheCPE content in sediments of the study site was morevariable, ranging from 195.84 mg g�1 in May 1998 to794.63 mg g–1 in March 2003. A major increase inCPE was observed in March and June 2003. Theredox RPD ranged from 2 cm (August 1997) to 3 cm(November 1997), while the thickest layers ofoxidized sediments were observed in Septemberand November 2002. Inventories of sulfide (upper15 cm) were low in November 1997 and in May1998, ranging from 1.00 to 3.15mMm�2, respec-tively. High pore water sulfide concentrations werefound only in March 2003, with 23.11mMm�2,coinciding with the severe hypoxia and organicallyenriched sediments.
3.3. Macrofaunal community structure, feeding
modes and vertical distribution
A total of 45 species of macrofauna were recordedduring the whole period of study (Table 2).Polychaetes were the dominant group (30 species),followed by crustaceans (11 species including twolarval stages) and mollusks (three species, includingtwo bivalves and one gastropod). One species ofnemertean and one species of sipunculid were alsofound in some samples.
On average for the whole study period, fivespecies of polychaetes (P. pinnata, Mediomastus
ARTICLE IN PRESS
Table 2
Pooled data of species composition, mean density, standard
deviation (SD), and percent of total macrofauna for the whole
study period
Species Mean
density
(ind. m�2)
SD %
Annelida (Polychaeta)
Paraprionospio pinnata 9580.9 11,162.2 33.77
Mediomastus
branchiferus
6154.8 6879.9 21.7
Cossura chilensis 5905.2 1576.1 20.82
Aricidea pigmentata 1740.0 1704.9 6.13
Nephtys ferruginea 1317.2 1735.2 4.64
Magelona phyllisae 368.9 197.3 1.3
Sigambra bassi 229.1 319.3 0.81
Isolda viridis 183.2 508.7 0.65
Polydora sp. 87.3 370.2 0.31
Protodorvillea sp. 81.4 134.3 0.29
Spionid sp. 72.4 298.9 0.26
Megalomma monoculata 66.8 129.5 0.24
Ninoe chilensis 37.1 56.6 0.13
Nereis dorsolobata 18.8 53.4 0.07
Glycera americana 12.9 23.5 0.05
Lumbrinerid sp. 12.4 19.9 0.04
Harmothoe brevipalpa 6.1 25.9 0.02
Pectinaria chilensis 6.1 25.9 0.02
Typosyllis sp. 5.3 13.1 0.02
Cirratulid sp. 4.6 11.8 0.02
Orbinid sp. 4.0 9.7 0.01
Hesionid sp. 3.7 12.2 0.01
Syllid sp. 3.7 15.7 0.01
Podarke sp. 3.7 15.7 0.01
Haploscoloplos
kerguelensis chilensis
2.8 8.6 0.01
Maldanid sp. 1.2 5.2 a
Oweniid sp. 1.2 5.2 a
Exogone sp. 1.2 5.2 a
Prionospio peruana 0.9 3.9 a
Goniada uncinigera 0.9 3.9 a
Crustacea
Ampelisca araucana 2329.5 2575.6 8.21
Pleuroncodes monodon 41.4 115.3 0.15
Cumacea 29.7 65.0 0.1
Pinnixia sp. 4.6 11.2 0.02
Oedicerotid sp. 3.7 10.8 0.01
Zoea n.i. 3.7 15.7 0.01
Gammarid sp. 1.8 7.8 0.01
Heterocarpus reedi 1.8 7.8 0.01
Megalopa n.i. 1.8 7.8 0.01
Ostracoda 0.9 3.9 a
Mollusca
Nuculana cuneata 30.0 54.8 0.11
Vitrinella kaykayae 2.8 8.6 0.01
Thyasira tomeana 0.9 3.9 a
Others
Nemertea 1.8 7.9 0.01
Sipunculida 0.9 3.9 0.00
n.i. ¼ not identified.aPercentage less than 0.01.
J. Sellanes et al. / Continental Shelf Research 27 (2007) 1002–1016 1007
Autho
r's
pers
onal
co
py
branchiferus, Cossura chilensis, Aricidea pigmentata
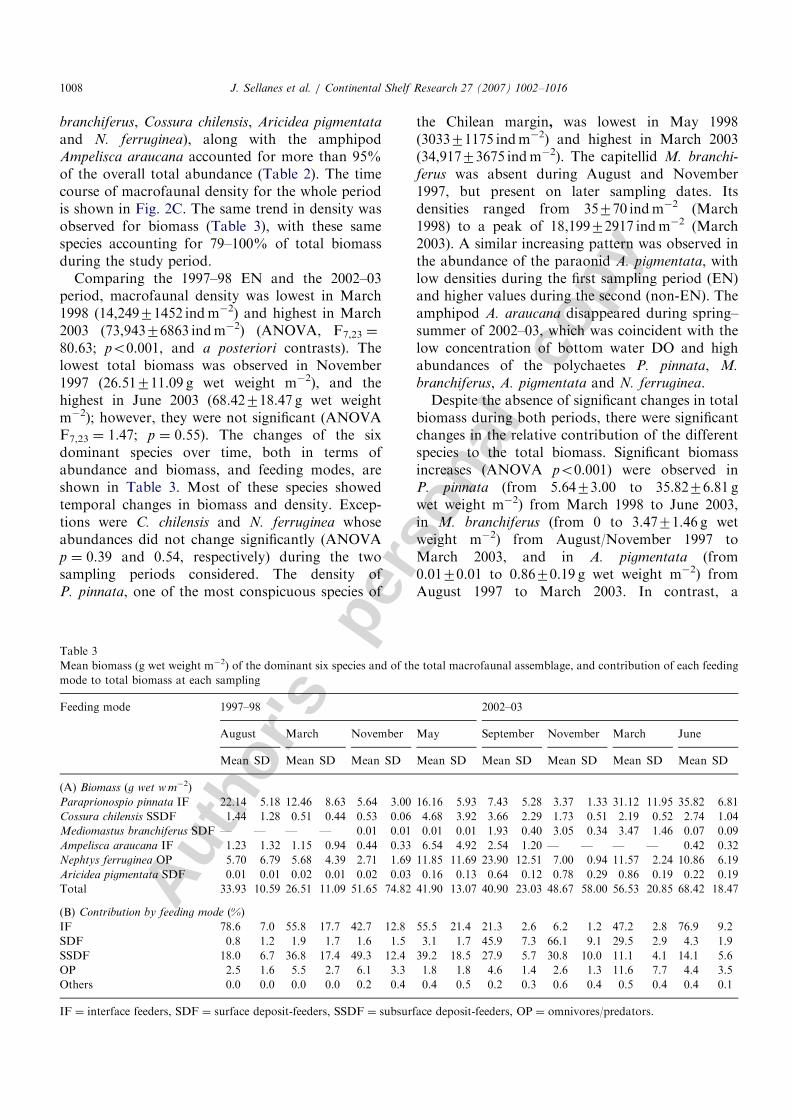
and N. ferruginea), along with the amphipodAmpelisca araucana accounted for more than 95%of the overall total abundance (Table 2). The timecourse of macrofaunal density for the whole periodis shown in Fig. 2C. The same trend in density wasobserved for biomass (Table 3), with these samespecies accounting for 79–100% of total biomassduring the study period.
Comparing the 1997–98 EN and the 2002–03period, macrofaunal density was lowest in March1998 (14,24971452 indm�2) and highest in March2003 (73,94376863 indm�2) (ANOVA, F7,23 ¼
80.63; po0.001, and a posteriori contrasts). Thelowest total biomass was observed in November1997 (26.51711.09 g wet weight m�2), and thehighest in June 2003 (68.42718.47 g wet weightm�2); however, they were not significant (ANOVAF7,23 ¼ 1.47; p ¼ 0.55). The changes of the sixdominant species over time, both in terms ofabundance and biomass, and feeding modes, areshown in Table 3. Most of these species showedtemporal changes in biomass and density. Excep-tions were C. chilensis and N. ferruginea whoseabundances did not change significantly (ANOVAp ¼ 0.39 and 0.54, respectively) during the twosampling periods considered. The density ofP. pinnata, one of the most conspicuous species of
the Chilean margin, was lowest in May 1998(303371175 indm�2) and highest in March 2003(34,91773675 indm�2). The capitellid M. branchi-
ferus was absent during August and November1997, but present on later sampling dates. Itsdensities ranged from 35770 indm�2 (March1998) to a peak of 18,19972917 indm�2 (March2003). A similar increasing pattern was observed inthe abundance of the paraonid A. pigmentata, withlow densities during the first sampling period (EN)and higher values during the second (non-EN). Theamphipod A. araucana disappeared during spring–summer of 2002–03, which was coincident with thelow concentration of bottom water DO and highabundances of the polychaetes P. pinnata, M.
branchiferus, A. pigmentata and N. ferruginea.Despite the absence of significant changes in total
biomass during both periods, there were significantchanges in the relative contribution of the differentspecies to the total biomass. Significant biomassincreases (ANOVA po0.001) were observed inP. pinnata (from 5.6473.00 to 35.8276.81 gwet weight m�2) from March 1998 to June 2003,in M. branchiferus (from 0 to 3.4771.46 g wetweight m�2) from August/November 1997 toMarch 2003, and in A. pigmentata (from0.0170.01 to 0.8670.19 g wet weight m�2) fromAugust 1997 to March 2003. In contrast, a
ARTICLE IN PRESS
Table 3
Mean biomass (g wet weight m�2) of the dominant six species and of the total macrofaunal assemblage, and contribution of each feeding
mode to total biomass at each sampling
Feeding mode 1997–98 2002–03
August March November May September November March June
Mean SD Mean SD Mean SD Mean SD Mean SD Mean SD Mean SD Mean SD
(A) Biomass (g wet w m�2)
Paraprionospio pinnata IF 22.14 5.18 12.46 8.63 5.64 3.00 16.16 5.93 7.43 5.28 3.37 1.33 31.12 11.95 35.82 6.81
Cossura chilensis SSDF 1.44 1.28 0.51 0.44 0.53 0.06 4.68 3.92 3.66 2.29 1.73 0.51 2.19 0.52 2.74 1.04
Mediomastus branchiferus SDF — — — — 0.01 0.01 0.01 0.01 1.93 0.40 3.05 0.34 3.47 1.46 0.07 0.09
Ampelisca araucana IF 1.23 1.32 1.15 0.94 0.44 0.33 6.54 4.92 2.54 1.20 — — — — 0.42 0.32
Nephtys ferruginea OP 5.70 6.79 5.68 4.39 2.71 1.69 11.85 11.69 23.90 12.51 7.00 0.94 11.57 2.24 10.86 6.19
Aricidea pigmentata SDF 0.01 0.01 0.02 0.01 0.02 0.03 0.16 0.13 0.64 0.12 0.78 0.29 0.86 0.19 0.22 0.19
Total 33.93 10.59 26.51 11.09 51.65 74.82 41.90 13.07 40.90 23.03 48.67 58.00 56.53 20.85 68.42 18.47
(B) Contribution by feeding mode (%)
IF 78.6 7.0 55.8 17.7 42.7 12.8 55.5 21.4 21.3 2.6 6.2 1.2 47.2 2.8 76.9 9.2
SDF 0.8 1.2 1.9 1.7 1.6 1.5 3.1 1.7 45.9 7.3 66.1 9.1 29.5 2.9 4.3 1.9
SSDF 18.0 6.7 36.8 17.4 49.3 12.4 39.2 18.5 27.9 5.7 30.8 10.0 11.1 4.1 14.1 5.6
OP 2.5 1.6 5.5 2.7 6.1 3.3 1.8 1.8 4.6 1.4 2.6 1.3 11.6 7.7 4.4 3.5
Others 0.0 0.0 0.0 0.0 0.2 0.4 0.4 0.5 0.2 0.3 0.6 0.4 0.5 0.4 0.4 0.1
IF ¼ interface feeders, SDF ¼ surface deposit-feeders, SSDF ¼ subsurface deposit-feeders, OP ¼ omnivores/predators.
J. Sellanes et al. / Continental Shelf Research 27 (2007) 1002–10161008

Autho
r's
pers
onal
co
py
significant decrease in biomass (ANOVA po0.001)of the amphipod A. araucana (from 6.5374.92 to0 g wet weight m�2) was observed from May 1998 toMarch 2003.
Regarding the feeding modes, IF and subsurfacedeposit feeders were the most common feedinghabits observed among shelf macrofauna, followed,on average, by surface deposit feeders (Table 3). Theproportional representation of each feeding modevaried between periods. The proportional represen-tation of IF was higher prior to EN conditions andat the end of the summer 2003 (�70%), while lowercontributions were observed at the end of EN and atthe beginning of the 2002–03 period (�21%, Table 3).The proportional representation of subsurfacedeposit feeders decreased from 50% to 10.4%(March 1998 to March 2003). The contribution ofsurface deposit feeders was low during the ENphase. The contribution of opportunistic andpredator species did not show a clear pattern duringthe study period.
The vertical distribution of the macrofaunaspecies (i.e., depth at which 50% and 95% of totalnumber occurred) is shown in Fig. 3. In the ENphase (1997–98) a larger proportion of the macro-fauna (mostly polychaetes) was found at the deeperlayers of the sediment during the whole period,whereas there was an upward migration (450% ofmacrofauna thriving in the upper 2 cm) during thesummer/fall 2002–2003 (non-EN).
3.4. Normalized biomass size spectra
The slopes of the normalized biomass size spectra(NBSS) significantly differed from 0 (po0.05), withslopes ranging from �0.633 (summer/fall 1997–98)to �1.066 (summer/fall 2002–03) (Fig. 4). A lessnegative slope at the end of EN suggests a highercontribution of larger-sized organisms. However,when comparing different periods (i.e., winter/spring and summer/fall 1997–98 (Fig. 4A and B),and winter/spring and summer/fall 2002–03(Fig. 4C and D) the differences were not significant(p40.05). However, the intercepts of the NBSS, anindicator of total biomass of the system, rangedbetween 3.304 (summer/fall 1997–98) and 4.975(summer/fall 2003–03), showing significant differ-ences between them (po0.05), pointing to higherbiomass during non-EN conditions.
3.5. Ordination analyses
The results of the CCA are shown in Fig. 5. Onlythe five environmental variables that explained mostof the variance were included in the analysis (i.e.,CPE, RPD, TOC, DO and bottom water tempera-ture). When the abundance of the dominantmacrofaunal species is related to the environmentalvariables (Fig. 5A) the first two CCA axis eigenva-lues accounted for 83.3% of the total variance.When feeding mode composition was used(Fig. 5B), the first two CCA axis accounted for85.2% of the explained variance. This suggests arelatively good dispersal of the biological data alongthe different axis in both analyses (Kroncke andTurkay, 2003; Narayanaswany et al., 2003). For themacrofauna specific composition, the first axisreveals gradients influenced by temperature(r ¼ �0.85), RPD (r ¼ 0.79) and DO (r ¼ �0.58),while the second axis reflects a gradient influencedby TOC (r ¼ 0.73) and CPE (r ¼ �0.60) (Fig. 5A).For the functional composition (i.e., feedingmodes), the first axis indicates that temperature(r ¼ �0.78) and RPD (r ¼ 0.89) were the mostimportant variables, while CPE (r ¼ 0.88) and TOC(r ¼ 0.57) best explained the variance along thesecond axis.
Multivariate analyses (NMDS) based on alldensity data collected in each sampling date,showed distinct assemblages, forming a clockwisetemporal gradient (Fig. 6). The ANOSIM testrevealed five different period-groups (po0.05),(i) August 1997, November 1997 and March 1998,
ARTICLE IN PRESS
0
2
4
6
8
10
12
14
16
Aug. Nov. Mar. May Sept. Nov. Mar. Jun.
Dep
th (
cm)
95%
50%
1997-1998 2002-2003
Fig. 3. Vertical distribution of macrofaunal biomass in the upper
20 cm of the sediment during winter/spring and summer/fall
1997–1998 and winter/spring and summer/fall 2002–2003. Bars
indicate the location of the accumulative 50% and 95% of total
biomass.
J. Sellanes et al. / Continental Shelf Research 27 (2007) 1002–1016 1009

Autho
r's
pers
onal
co
py
(ii) May 1998, (iii) September and November 2002,(iv) March 2003, and (v) June 2003.
4. Discussion
4.1. Water column and sediment conditions,
intra- and inter-annual variability
During the 1997–98 EN phase, the water columnwas, in general, warmer (412 1C) and moreoxygenated (bottom water oxygen 40.5ml L�1)than the following summers. In contrast, anextended hypoxia during late summer 2002–03 wasobserved (bottom water oxygen �0.08ml L�1). Infact, under normal spring and summer conditions,upwelled Equatorial Sub-surface Water, rich in
nutrients and low in oxygen, covers large areas ofthe continental shelf. In contrast, during winter orEN conditions, upwelling is unusual or non-existent, and the shelf is covered by Sub-AntarcticWater rich in oxygen (Strub et al., 1998). In thisway, during an EN period, most important seasonaleffects over shelf hydrographic conditions, like theascent of colder, nutrient-rich and oxygen deficientwater during summer, are suppressed or at least,smoothed. The overall result is that winter-likeconditions (i.e., absence of bottom water oxygendeficiency and low organic input) persist for a wholeyear over the shelf. Indeed, a recent study showedthat although seasonal timing of the upwellingperiod was similar for both periods (1997–98 EN vs.2002–03 non-EN), the strength of the upwelling
ARTICLE IN PRESS
Fig. 4. Normalized biomass size-spectra of the macrofauna in: (A) winter/spring and (B) summer/fall, of the 1997–98 period; and (C)
winter/spring and (D) summer/fall of the 2002–03 periods. The squared correlation coefficient (r2), the Standard Error of the slope
(SEslope) and the p-values are indicated for each regression.
J. Sellanes et al. / Continental Shelf Research 27 (2007) 1002–10161010

Autho
r's
pers
onal
co
py
during EN was about three times lower. This wasattributed to the effects of EN on the thermoclinedepth (S. Contreras, unpublished data).
Differences in sediment settings between bothperiods were also evident. The year after EN, coldor ‘‘La Nina’’ conditions developed (Sellanes, 2002;Escribano et al., 2004), and in subsequent yearsnormal or non-EN conditions prevailed, i.e., en-vironmental settings returned to the condition ofoxygen-depleted bottom water, high content ofTOC and fresh phytodetritus (CPE) in the sedi-ments, with high concentrations of porewatersulfide. These characteristics were most evident in
March 2003 (Fig. 2, Table 1). As an example, TOCvalues at this month were 52mg g�1, while duringthe whole EN year values never surpassed 38mg g�1
(Table 1). Typical values TOC for non-EN years forthis site are always over 40mg g�1, as reported byprevious studies (e.g., Thamdrup and Canfield,1996; Gutierrez, 2000).
The apparent discordance between the oxidationstate of the sediment (deeper RPD) and thereturning of oxygen-deficient conditions after EN(Table 1), could be explained by the associatedreturn of bottom waters rich in nitrate, animportant electron acceptor whose concentrations
ARTICLE IN PRESS
08/97
11/97
03/98
5/98
09/02
11/02
03/0306/03
Paraprionospio
CossuraMediomastus
Ampelisca
Nephtys
AricideaMagelona
Sigambra
Temp
OC
CPE
RPD
DO
08/97
11/97
03/98
5/98
09/02
11/02
03/03
06/03
IF SDF
SSDF
OP
Temp
OC
CPE
RPDDO
Axis 1
Axis 1
Axis
2A
xis
2
A
B
Fig. 5. Canonical correspondence analyses (CCA) ordination plot of the macrofaunal species (A) and the feeding mode groups (B),
including sampling periods and environmental variables. The feeding modes were: IF ¼ interface feeders, SDF ¼ surface deposit-feeders,
SSDF ¼ sub-surface deposit feeders, OP ¼ omnivores-predators. Abbreviations for environmental variables as in Table 1,
Temp ¼ bottom water temperature.
J. Sellanes et al. / Continental Shelf Research 27 (2007) 1002–1016 1011

Autho
r's
pers
onal
co
py
usually exceed 25 mM during non-EN periods (e.g.,Thamdrup and Canfield, 1996). Alternatively, thedeepening of the RPD layer during the 2002–03winter/spring could be the result of the highabundances of the burrowing polychaete M.
branchiferus, which dominated the community priorto the following summer/fall period. Burrowingactivity can enhance the sediment oxidation bymixing and subducting oxidized solutes and Fe+3-rich particles that remove free sulfide (Dıaz et al.,1994).
4.2. Response of the fauna to environmental changes
A decreasing trend in macrofaunal density anddeepening into the sediment evolved towards theend of the 1997–98 EN, mainly due to the decreaseof the interface-feeder polychaete P. pinnata
(Gutierrez et al., 2000), an opportunistic polychaetethat has metabolic adaptations to cope with hypoxicconditions (Gonzalez and Quinones, 2000). Severalobservations indicated that P. pinnata was thedominant macrofaunal organism in these sediments,at least until the previous 2 years before the 1997–98EN (Gallardo et al., 1995; Huettel et al., 1996;Vasquez, 1999). It appears that more oxygenatedbottom water and oxidized sediment during ENcaused P. pinnata to fail in its summer recruitment.In addition, it is probable that increased competi-tion and predation by other species have contrib-uted to its decline. Indeed, it has been reported that
during EN, many subtropical predators invade thecoastal areas, or even local predators change theirdepth zonation (Arntz et al., 1991), negativelyaffecting the surface-feeding polychaetes (Tarazonaet al., 1996). Off Peru, during EN 1992–93, thesepredators consisted mainly in highly motile mega-faunal species such as decapod crabs and shrimps,and fishes (Arntz et al., 1991). Since no data onmegafaunal or demersal fishes assemblages exist forour benthic study, this factor still remains spec-ulative for the shelf off Concepcion. On the otherhand, Levin and Gage (1998) suggested that whilethe dominance patterns of polychaete communitiescorrelate with the organic matter content, thespecies richness was modulated by oxygen avail-ability. This model fits well with what we observedfor the whole polychaetes assemblage. During ENthe decrease in abundance of P. pinnata related wellwith the lower organic matter quality (mainly interms of CPE) and higher oxygen. However,P. pinnata recovered its numerical dominance onlyin summer 2003, i.e., 5 years after the end of EN.Following the 1997–98 EN, a rapid switch to LaNina conditions occurred, and high fluxes oforganic matter and strong reducing conditions weredetected in summer 1999 (Gutierrez, 2000; Gracoet al., 2006). Notwithstanding with these conditions,P. pinnata failed to recruit in the shelf and in the bayof Concepcion (Gutierrez, 2000). This lack ofpopulation response suggests that the recruitmentfailure was not due to habitat selectivity but was
ARTICLE IN PRESS
Aug 1997
Nov 1997
Mar 1998
May 1998
Sep 2002
Nov 2002
Mar 2003
Jun 2003
Stress = 0.10
Axis 1
Axis
2I
II
V
IV
III
Fig. 6. Non-metric multidimensional scaling (NMDS) ordination plot based on macrofaunal species density, at the different sampling
dates and during the study period. The ellipses indicate the five groups formed by the ANOSIM test (po0.05).
J. Sellanes et al. / Continental Shelf Research 27 (2007) 1002–10161012

Autho
r's
pers
onal
co
py
more likely due to reduced larvae supply by theweakened adult population. The following succes-sion of dominant burrowing deposit-feeders(M. branchiferus; Fig. 2C) and the delayed postEN recovery of P. pinnata can be explained by thecombination of the prevailing environmental con-ditions and the negative mobility-mode interactionsbetween burrowing and tube-dwelling infauna(Posey, 1990; Hall, 1994). In this sense, thesuccessful recruitment of surface and subsurface-deposit feeders in 1999 coincided with the absenceof tube mats in the sediment surface. Onceestablished, the predominantly burrowing commu-nity could have precluded the successful recruitmentof P. pinnata until severe hypoxic and sulfidicconditions were developed during summer 2003. Itis possible that the large organic fluxes to thebottom (Munoz et al., 2004b) contributed to a rapidreturn to reducing conditions in the sediment/waterinterface. Under these conditions dominant burrow-ing polychaetes (M. branchiferus, C. chilensis, A.
pigmentata) were inhibited or displaced. Free ofthese burrowing competitors, P. pinnata recruitedsuccessfully, and the population increased explo-sively.
The results of the multivariate analyses revealedsignificant effects of changing temperature, DO andsediment-related parameters on macrofaunal com-munity structure. Effects were also reflected inchanges in feeding modes, in the vertical distribu-tion of animals in the sediment and in the sizespectra. Two clear groupings were formed (CCAanalysis), one related to the 1997–98 period,associated with higher bottom oxygen and tempera-ture, and the other (2002–03) related to higher TOCand CPE loadings, in particular during March 2003.It is remarkable that at species- and feeding-modelevel the first two axes (Fig. 5) explained most of thevariance, suggesting with a high degree of con-fidence that the selected variables (temperature,RPD, oxygen, CPE and TOC) were responsible forthe observed patterns of macrofaunal communitystructure and feeding modes. The NMDS analysis,based on macrofaunal species densities at eachsampling date, agreed with the separation of twodistinct groups, each related to the differentseasons/ENSO phases.
An important consequence of the deepening ofthe OMZ during EN is the contact of oxygenatedwaters with sub-oxic sediments on the shelf(Gutierrez et al., 2000). This led to changes in thesediment biogeochemistry influencing the commu-
nity structure, distribution, and the relative con-tribution of functional groups (Gutierrez et al.,2000; Neira et al., 2001a, b). Higher rates ofreworking and extensive irrigation of surface sedi-ments were observed during the EN period com-pared with the 2002–03 non-EN period (Munozet al., in press), consistent with the observedpatterns of macrofaunal vertical distribution anddensity. Particle-mixing coefficients (Db) estimatedfor the study site by Gutierrez (2000) using excess234Th concentrations, ranged from 47 to188 cm2 yr�1 during EN. Moreover, excess 234Th(half-life ¼ 24.1 d), which tracks particles input tothe seabed, penetrated as deep as 10 cm. Similarestimates made from Chl-a distribution in thesediments ranged from 11 to 286 cm2 yr�1, indicat-ing higher bioturbation rates at the end of EN(Gutierrez, 2000). Although no excess 234Th mea-surements in the study site were available for the2002–03 period, the presence of more macroinfaunaliving near the sediment surface (Fig. 3) and lowbioturbation coefficients estimated by Chl-a profilessuggest that re-working was considerably dimin-ished (4 cm2 yr�1) in March 2003 (Munoz et al., inpress).
4.3. Normalized biomass-size spectra
The results suggest that the body size of themacrobenthic community tended to be larger duringthe EN period, compared with the subsequentperiod when low oxygen concentrations prevailed.NBSS have been used to describe and comparebenthic communities (e.g., Drgas et al., 1998; Saiz-Salinas and Ramos, 1999). In the study area, lowoxygen conditions greatly influence the size struc-ture of macrobenthic communities (Quiroga et al.,2005). Although not significantly different, the slopeof the NBSS for macrofauna was less negativeduring the 1997–98 EN (slope ¼ �0.633) (Fig. 4B)compared with the same period under non-ENconditions (�1066) (Fig. 4D). This evidence, togetherwith the measured biomass values, suggests theoccurrence of a higher biomass during non-ENconditions, particularly during summer–fall2002–03. The biomass decrease during EN could beexplained by the population crash of P. pinnata,which alone was able to represent more than 50% ofthe total density prior to the 1997–98 EN (Vasquez,1999; Gutierrez, 2000). This is also consistent withthe macrofaunal biomass drop reported by Gallardo(1985) during the previous EN (1982–83) for the
ARTICLE IN PRESSJ. Sellanes et al. / Continental Shelf Research 27 (2007) 1002–1016 1013

Autho
r's
pers
onal
co
py
shelf off Concepcion, who found values 4.4 timeslower than previous measurements in 1975 (a non-EN year). However, off Peru, during the 1982–83 ENa significant increase in macrofaunal biomass wasreported at a shallow (34m) shelf site in the Bay ofAncon (Tarazona et al., 1996), but at deeper sites(40–110m), these changes were not evident (Arntzet al., 1991).
5. Concluding remarks
Based on oceanographic and sediment para-meters, we conclude that the environmental condi-tions at the study site are highly variable, at bothseasonal and inter-annual scales. However, sup-ported also by the limited data available for thestudy area, we attribute these changes to differentphases of the ENSO cycle. The primary effectinduced by its warm phase seems to be anattenuation in seasonal differences (i.e., inter-annualvariability), between the winter/spring and summer/fall periods. Indeed, winter-like conditions prevailedthe whole 1997–98 EN period (i.e., higher bottomtemperature, oxygenated bottom water, lower or-ganic matter, and oxidized sediments). The biotaresponded to this apparent lack of seasonal varia-tion during EN period with an absence of majorchanges in size spectra as well as in verticaldistribution of the fauna. In contrast, during the2002–03 period, smaller, more abundant and near-surface living animals tended to dominate towardsthe end of the austral summer. This was most likelycaused by a successful recruitment of P. pinnata. Toour knowledge the present study is the first tosuggest an inter-annual variability in size structureof macrobenthic communities in the region, whichwe relate with changes in environmental conditionsduring the two contrasting phases of the ENSOcycle.
The environmental and biological data alsosuggest that a strong EN can trigger a complexcascade of biogeochemical and ecological processesin the surface sediment, that begin with a decreaseof sediment organic loading of the shelf area duringthe event. However, the effects on the benthiccommunity last longer than the period of theoceanographic disturbance, most probably due tothe response lag of the populations (e.g., P. pinnata),as well as other ecological interactions. In this case,it took 5 years before P. pinnata, an oppurt-unistic polychaete well fit to cope with anoxic orsulphidic conditions, recovered its dominance in the
macrofauna (Fig. 2). However, to assert how manyof these observed changes repeat, and how muchvariation could be effectively attributed to theENSO cycle, we need longer-term studies followingseveral cycles.
Acknowledgments
We specially thank the captain and crew of theR.V. Kay Kay, as well as the technical staff of theMarine Biology Station of the University ofConcepcion at Dichato. We also thank T. Hopner(ICBM, University of Oldenburg) for support andlaboratory facilities. Special thanks to L. Levin,C. Whitcraft and two external anonymous reviewersfor helpful comments on earlier versions of thismanuscript. This research was funded byCONICYT, Chile (FONDECYT project #1971336and FONDAP program) and the Center forOceanographic Research in the Eastern SouthPacific (COPAS). Additional support was providedto J.S. by the Deutscher Akademischer Austausch-dienst (DAAD).
References
Ahumada, R., Rudolph, A., Martinez, V., 1983. Circulation and
fertility of waters in Concepcion Bay. Estuarine, Coastal and
Shelf Science 16, 95–105.
Arntz, W.E., Fahrbach, E., 1996. El Nino: experimento climatico
de la naturaleza. Causas fısicas y efectos biologicos. Fondo de
Cultura Economica, Mexico DF.
Arntz, W., Tarazona, J., Gallardo, V.A., Flores, L.A., Salzwedel,
H., 1991. Benthos communities in oxygen deficient shelf and
upper slope areas of the Peruvian and Chilean Pacific coast,
and changes caused by El Nino. In: Tyson, R.V., Pearson,
T.H. (Eds.), Modern and Ancient Continental Shelf Anoxia,
Geological Society Special Publications, vol. 58, 1991,
pp. 131–154.
Barnett, P.R., Watson, J., Connelly, D., 1984. A multiple corer
for taking virtually undisturbed samples from shelf, bathyal
and abyssal sediments. Oceanologica Acta 7, 399–408.
Carrasco, F., Arcos, D., 1984. Life history and production of a
cold-temperate population of the sublittoral amphipod
Ampelisca araucana. Marine Ecology Progress Series 14,
245–252.
Carrasco, F., Carbajal, W., 1998. The distribution of polychaetes
feeding guilds in organics enriched sediments of San Vicente
bay, Central Chile. International Review of Hydrobiologia
83, 233–249.
Clarke, K., 1993. Non-parametric multivariable analysis of
changes in community structure. Australian Journal of
Ecology 18, 117–143.
Clarke, K., Gorley, R., 2001. User Manual/Tutorial, Primer
version 5. Primer-E, Plymouth.
ARTICLE IN PRESSJ. Sellanes et al. / Continental Shelf Research 27 (2007) 1002–10161014

Autho
r's
pers
onal
co
py
Clarke, K., Warwick, R., 1994. Changes in marine communities:
an approach to statistical analysis and interpretation. Bourne
Press Ltd, Plymouth.
Cline, J.D., 1969. Spectrophotometric determination of hydrogen
sulfide in natural waters. Limnology and Oceanography 14,
454–458.
Daneri, G., Dellarossa, V., Quinones, R., Jacob, B., Montero, P.,
Ulloa, O., 2000. Primary production and community respira-
tion in the Humboldt Current System off Chile and associated
oceanic areas. Marine Ecology Progress Series 197, 41–49.
Dıaz, R.J., Cutter, G.R., Rhoads, D.C., 1994. The importance of
bioturbation to continental slope sediment structure and
benthic processes off Cape Hatteras, North Carolina. Deep-
Sea Research II 41, 719–734.
Drgas, A., Radziejewska, T., Warzocha, J., 1998. Biomass size
spectra of near-shore shallow-water benthic communities in
the Gulf of Gdansk (Southern Baltic Sea). Marine Ecology
19, 209–228.
Escribano, R., Daneri, G., Farıas, L., Gallardo, V.A., Gonzalez,
H., Gutierrez, D., Lange, C., Morales, C., Pizarro, O., Ulloa,
O., Braun, M., 2004. Biological and chemical consequences of
the 1997–1998 El Nino in the Chilean coastal upwelling
system: a synthesis. Deep-Sea Research II 51, 2389–2411.
Fauchald, K., Jumars, P.A., 1979. The diet of worms: a study of
polychaete feeding guilds. Oceanography and Marine Biol-
ogy: An Annual Review 17, 191–284.
Field, J., Clarke, K., Warwick, R., 1982. A practical strategy for
analyzing multispecies distribution patterns. Marine Ecology
Progress Series 8, 37–52.
Fossing, H., Gallardo, V.A., Jørgensen, B.B., Huttel, M.,
Nielsen, L.P., Schulz, H.N., Canfield, D.E., Forster, S.E.,
Glud, R.N., Gundersen, J.K., Kuver, J., Ramsing, N.B.,
Teske, A., Thamdrup, B., Ulloa, O., 1995. Concentration and
transport of nitrate by the mat-forming sulfur bacterium
Thioploca. Nature 374, 713–715.
Gallardo, V.A., 1977. Large benthic microbial communities in
sulphide biota under the Peru-Chile subsurface counter-
current. Nature 268, 331–332.
Gallardo, V.A., 1985. Efectos del fenomeno de ‘‘el Nino’’ sobre el
bentos sublitoral frente a Concepcion, Chile. In: Arntz, W.A.,
Landa, A., Tarazona, J. (Eds.), ‘‘El Nino’’: su Impacto en la
Fauna Marina. Boletın Instituto del Mar del Peru (edicion
especial) Callao, Peru, pp. 79–85.
Gallardo, V.A., Castillo, J.G., Yanez, L.A., 1972. Algunas
consideraciones preliminares sobre ecologıa bentonica de los
fondos sublitorales blandos en la Bahıa Concepcion. Boletın
de la Sociedad de Biologıa de Concepcion, Chile 44, 169–190.
Gallardo, V.A., Carrasco, F.D., Roa, R., Canete, J.I., 1995.
Ecological patterns in the benthic macrobiota across the
continental shelf off central Chile. Ophelia 40, 167–188.
Gonzalez, R.R., Quinones, R.A., 2000. Pyruvate oxidoreductase
involved in glycolitic anaerobic metabolism on polychaetes
from the continental shelf off central-south Chile. Estuarine
Coastal and Shelf Science 51, 507–519.
Graco, M., Gutierrez, D., Farıas, L., 2006. Inter-annual
variability of the pelagic–benthic coupling in the upwelling
system off central Chile. Advances in Geosciences 6, 127–132.
Gutierrez, D., 2000. Bioperturbacion y macrofauna en fondos
sublitorales de un area de Surgencias frente a Chile central
(361 300 S): variacion espacial y temporal en el perıodo
1997–1999. Ph.D. Thesis, Universidad de Concepcion, Chile,
unpublished.
Gutierrez, D., Gallardo, V.A., Mayor, S., Neira, C., Vasquez, C.,
Sellanes, J., Rivas, M., Soto, A., Carrasco, F.D., Baltazar,
M., 2000. Effects of dissolved oxygen and fresh organic
matter on macrofaunal bioturbation potential in sublittoral
bottoms off central Chile, during the 1997–1998 El Nino.
Marine Ecology Progress Series 202, 81–99.
Hall, S.J., 1994. Physical disturbance and marine benthic
communities: life in unconsolidated sediments. Oceanography
and Marine Biology: An Annual Review 32, 179–239.
Huettel, M., Forster, S., Klosser, S., Fossing, H., 1995. Vertical
migration in the sediment-dwelling sulfur bacteria Thioploca
spp. in overcoming diffusion limitations. Applied and
Environmental Microbiology 62, 1863–1872.
Jongman, R., Ter Braak, C., van Tongeren, O., 1987. Data
Analysis in Community and Landscape Ecology. PUDOC,
Wageningen, 299pp.
Knap, A., Michaels, A., Dow, R., Johnson, R., Gundersen, K.,
Sorensen, J., Close, A., Howse, A., Hammer, F., Bates, N.,
Doyle, A., Waterhouse, T., 1993. Bermuda Atlantic Time
Series Study Methods Manual (Version 3). Bermuda Biolo-
gical Station for Research, Inc., US JGOFS.
Kroncke, I., Turkay, M., 2003. Structural and functional aspects
of the benthic communities in the deep Angola Basin. Marine
Ecology Progress Series 260, 43–53.
Levin, L., Gage, J., 1998. Relationships between oxygen, organic
matter and diversity of bathyal macrofauna. Deep-sea
Research II 45, 129–163.
Lorenzen, C., Jeffrey, J., 1980. Determination of chlorophyll in
sea water. UNESCO Technical Papers in Marine Sciences 35,
1–20.
Mc Phaden, M.J., 1999. Genesis and evolution of the 1997–1998
El Nino. Science 283, 950–954.
Munoz, P., Lange, C., Gutierrez, D., Hebbeln, D., Salamanca,
M., Dezileau, L., Reyss, J., Benninger, L., 2004a. Recent
sedimentation and mass accumulation rates based on 210Pb
along the Peru–Chile continental margin. Deep-Sea Research
II 51, 2523–2541.
Munoz, P., Salamanca, M., Neira, C., Sellanes, J., 2004b.
Nitrogen sediment fluxes in an upwelling system off central
Chile (Concepcion bay and adjacent shelf) during the 1997–98
El Nino. Revista Chilena de Historia Natural 77, 305–318.
Munoz, P., Sellanes, J., Lange, C., Palma, M., Salamanca, M.A.
Temporal variability of 210Pb fluxes in shelf sediments
beneath a high primary production area of central southern
Chile (361S). Progress in Oceanography, in press.
Narayanaswany, B., Nickell, T., Gage, J., 2003. Appropriate
levels of taxonomic discrimination in deep-sea studies: species
vs. family. Marine Ecology Progress Series 257, 59–69.
Neira, C., Sellanes, J., Soto, A., Gutierrez, D., Gallardo, V.A.,
2001a. Meiofauna and sedimentary organic matter off central
Chile: response to changes caused by the 1997–1998 El Nino.
Oceanologica Acta 24, 313–328.
Neira, C., Sellanes, J., Levin, L.A., Arntz, W.E., 2001b.
Meiofaunal distributions on the Peru margin: relationship
to oxygen and organic matter availability. Deep-Sea Research
I 48, 2453–2472.
Pfannkuche, O., Soltwedel, T., 1998. Small benthic size classes
along the N.W. European continental margin: spatial and
temporal variability in activity and biomass. Progress in
Oceanography 42, 189–207.
ARTICLE IN PRESSJ. Sellanes et al. / Continental Shelf Research 27 (2007) 1002–1016 1015

Autho
r's
pers
onal
co
py
Platt, T., Denman, K., 1977. Organization in the pelagic
ecosystem. Helgolaender Wissenschaftliche Meeresuntersu-
chungen 30, 575–581.
Platt, T., Denman, K., 1978. The structure of pelagic ecosystems.
Rapports et Proces-Verbaux des Reunions du Conseil
International pour l’Exploration de la Mer 173, 60–65.
Posey, M.H., 1990. Functional approaches to soft–substrate
communities: how useful are they? Aquatic Sciences 2 (3–4),
343–356.
Quiroga, E., Quinones, R., Palma, M., Sellanes, J., Gallardo,
V.A., Gerdes, D., Rowe, G., 2005. Biomass size-spectra of
macrobenthic communities in the oxygen minimum zone off
Chile. Estuarine, Coastal and Shelf Science 62, 217–231.
Saiz-Salinas, J., Ramos, A., 1999. Biomass size-spectra of
macrobenthic assemblages along water depth in Antartic.
Marine Ecology Progress Series 178, 221–227.
Schulz, H.N., Strotmann, B., Gallardo, V.A., Jørgensen, B.B.,
2000. Population study of the filamentous sulfur bacteria
Thioploca spp. off the bay of Concepcion. Marine Ecology
Progress Series 200, 117–126.
Sellanes, J., 2002. Efectos de El Nino 1997-1998 sobre los
indicadores bioquımicos de la calidad de la material organica
sedimentaria y la meiofauna en un area de surgencia costera
de Chile central. Ph. D. Thesis, Department of Oceanogra-
phy, University of Concepcion, Chile, unpublished.
Sellanes, J., Neira, C., 2006. ENSO as a natural experiment to
understand environmental control of meiofaunal community
structure. Marine Ecology 27, 31–43.
Sellanes, J., Neira, C., Quiroga, E., 2003. Composition, structure
and energy flux of the meiobenthos off central Chile. Revista
Chilena de Historia Natural 76, 401–415.
Sprules, W., Munawar, M., 1986. Plankton size spectra in
relation to ecosystem productivity, size, and perturbation.
Canadian Journal of Fisheries and Aquatics Sciences 43,
1789–1794.
Strub, P.T., Mesıas, J.M., Montecinos, V., Rutllant, J., Salinas,
S., 1998. Coastal ocean circulation off western South
America. In: Robinson, A.R., Brink, K.H. (Eds.), The Sea,
vol. 11, pp. 273–313.
Tarazona, J., Arntz, W.E., Canahuire, E., 1996. Impact of two
‘‘El Nino’’ events of different intensity on the hypoxic soft
bottom macrobenthos off the central Peruvian coast. Marine
Ecology 17, 425–446.
Thamdrup, B., Canfield, D.E., 1996. Pathways of carbon
oxidation in the continental margin off central Chile.
Limnology and Oceanography 41, 1629–1650.
Tomicic, J., 1985. Efectos del fenomeno El Nino 1982–83 en las
comunidades litorales de la penınsula de Mejillones. Investi-
gaciones Pesqueras 32, 209–213.
Vasquez, C., 1999. Variacion temporal y espacial de la macro-
infauna bentonica de Bahıa Concepcion y plataforma
continental adyacente (361400S, 731020W). Undergraduate
Thesis, Department of Oceanography, University of Concep-
cion, Chile, unpublished.
Williams, P., Jenkinson, N.W., 1982. A transportable micro-
processor controlled precise Winkler titration suitable for
field station and shipboard use. Limnology and Oceanogra-
phy 27, 576–584.
Zar, J., 1974. Biostatistical Analysis, second ed. Prentice-Hall,
Englewood Cliffs, NJ.
ARTICLE IN PRESSJ. Sellanes et al. / Continental Shelf Research 27 (2007) 1002–10161016
Related Documents