Contextuality within Activity Systems and Sustainability of Competitive Advantage Michael E. Porter Ludcke House Harvard Business School Boston, MA 02163 tel: (617) 495 6309 fax: (617) 547 8543 [email protected] Nicolaj Siggelkow 2211 Steinberg Hall – Dietrich Hall Wharton School University of Pennsylvania Philadelphia, PA 19104 tel: (215) 573 7137 fax: (215) 898 0401 [email protected] ___________________________________________________________________________ * We would like to thank Dan Levinthal and Jan Rivkin for helpful discussions. Financial support by Harvard Business School and the Mack Center for Technological Innovation at the University of Pennsylvania is gratefully acknowledged.

Welcome message from author
This document is posted to help you gain knowledge. Please leave a comment to let me know what you think about it! Share it to your friends and learn new things together.
Transcript

Contextuality within Activity Systems and Sustainability of Competitive Advantage
Michael E. Porter Ludcke House
Harvard Business School Boston, MA 02163 tel: (617) 495 6309 fax: (617) 547 8543 [email protected]
Nicolaj Siggelkow 2211 Steinberg Hall – Dietrich Hall
Wharton School University of Pennsylvania
Philadelphia, PA 19104 tel: (215) 573 7137 fax: (215) 898 0401
___________________________________________________________________________ *We would like to thank Dan Levinthal and Jan Rivkin for helpful discussions. Financial support by Harvard Business School and the Mack Center for Technological Innovation at the University of Pennsylvania is gratefully acknowledged.

Contextuality within Activity Systems and Sustainability of Competitive Advantage
Executive Overview: Research on the interactions among activities and the consequences of these interactions on the creation and sustainability of competitive advantage has rapidly expanded in recent years. In this research, the two most common approaches have been the complementarity framework, as developed by Milgrom and Roberts (1990), and the NK-model (Kauffman, 1993) for simulation studies. This paper provides an introduction to these approaches, summarizes key results, and points to an aspect of interactions that has not found much attention because neither of the two main approaches is well-suited to address it: contextual interactions, i.e., interactions that are influenced by other activity choices made by a firm. We provide a number of examples of contextual interactions drawn from in-depth studies of individual firms and outline suggestions for future research.

Introduction
The importance of fit and consistency among a firm’s activities is one of strategy’s longest-standing
notions (Learned, Christensen, Andrews, & Guth, 1961; Khandwalla, 1973; Drazin & Van de Ven, 1985).
While earlier work stressed the consistency among higher-level concepts such as “strategy” and
“structure” (Chandler, 1962) more recent work has emphasized interdependencies at a lower-level, among
the various activities a firm is engaged in (Milgrom & Roberts, 1990; Porter, 1996).
Consider the example of Urban Outfitter, a $1.1 billion specialty retail store chain whose sales and
profits have been growing at about 30% a year for the last 15 years. It has adopted a set of activities and
practices that are highly interdependent and quite distinctive (Bhakta et al., 2006). Its stores create a
bazaar-like ambience with eclectic and non-standardized merchandise including clothes and home
accessories. Each store has a unique design; some occupy buildings previously used as movie theaters,
banks, or stock exchanges. Store managers have considerable authority to, for instance, change the store
layout, or to experiment with the music being played. The assortment in each store is broad but shallow,
underscoring the bazaar-like ambience. Strengthening this shopping experience is a substantial investment
of 2-3 percent of annual revenue into visual display teams who change the layout of each store every two
weeks, creating a new shopping experience whenever customers return. As a result, customers spend
considerably more time (3 - 4x) in Urban Outfitter stores than in other specialty stores. To finance this
investment, traditional forms of advertising such as print, radio and television are shunned.
Urban Outfitter’s choices are clearly interdependent. For instance, the unique real estate plays well
with the non-standardized merchandise mix; both, in turn, make it more beneficial to grant more authority
to store managers, as standardized approaches are unlikely to work well. Similarly, frequent changes in
store layout are particularly beneficial given the quick turnover of merchandise. Lastly, Urban Outfitter
can afford not to use traditional media outlets given the substantial word-of-mouth that its unusual stores
generate.
1

While such interdependencies among a firm’s activities are widespread, the strategy field has
struggled for many years to find a structured way to analyze the consequences of such interactions. Two
fairly recent advances have made it possible to be more systematic in the analysis of the strategic and
organizational implications of interdependencies among a firm’s activities. One is agent-based simulation
modeling using the NK model (Kauffman, 1993). The other is the complementarity framework developed
by Milgrom and Roberts (1990). In this paper, we provide an introduction to each of these approaches,
summarize a range of research findings that have emerged from them, and discuss an important feature of
interdependencies among activities that neither approach is well-suited to address.
Both approaches have focused on the contextuality of activities – the fact that the value of individual
activities is influenced by other activity choices made by a firm. Using large samples of firms, the
empirical work based on the complementarity framework has concentrated on identifying precisely which
activities affect each other in many firms, i.e., on understanding where contextual interactions tend to
arise. The focus of the agent-based simulation work has been on analyzing the consequences that arise as
contextuality of activities, i.e., the number of interdependencies among activities, increases.
While contextuality of activities is an important phenomenon, our research conducted at the level of
individual firms suggests that a second type of contextuality is important to further our understanding of
the sustainability of competitive advantage: the contextuality of interactions. Whether and how activities
interact – for instance, whether they are complements and reinforce each other, or whether they are
substitutes – can also depend on other activity choices made by a firm. Thus, the nature of the interaction
between activities may not be an inherent property of the activities, but a function of the other choices
made by a firm.
As an example, consider a firm such as The Gap that operates a distribution system linking
warehouses and stores. Assume the firm’s ordering system is configured to allow stores to order goods
once a week. In this case, the benefit of increasing delivery frequency of ordered goods from weekly to
daily delivery is quite low. If stores were to order daily, though, the benefit of increasing the delivery
2

frequency from once a week to daily would be higher. Thus, the marginal benefit of increasing the
ordering frequency is increasing in the delivery frequency, that is, ordering frequency and delivery
frequency are complementary. However, this complementarity is contextual to the firm’s in-store
information system. It only exists if the firm has relevant information needed for ordering on a daily
basis, for instance through a point-of-sales (POS) system. It is the presence of the POS system that makes
the relationship complementary.
The rest of this paper is organized as follows. In the next section, we provide more detail on the issue
of contextuality of activities. We continue with an overview of existing work that has focused on
contextuality of activities with simulation models and with empirical investigations. Using the
complementarity framework as a starting point, we show several ways in which contextual interactions
can arise and provide examples of contextual interactions drawn from detailed firm-level analyses. In
subsequent sections, we discuss the effect of contextuality on the difficulty of imitation and adaptation
and explore the implications of contextuality for research using simulations and for empirical
investigations.
Contextuality of activities
One important dimension on which activities differ from each other is the degree to which their value
is affected by other activities, i.e., the extent to which they interact. Accordingly, activities can be arrayed
along a continuum of increasing interdependence (see the horizontal dimension in Figure 1). At one
extreme lie activities that are not affected by any other activity choices. Since their value is context
independent, these activities have the same optimal configuration for all firms in the economy. In other
words, they are generic. For instance, the use of computers for accounting is an optimal activity choice
for (practically) all firms in the economy.1
1 Even at the extreme end of genericity one can have gradations. For instance, the use of computers presumes some computer literacy of employees in the accounting department of a firm. For some parts of the world this assumption may not hold, making the use of computers in those areas not a generic activity.
3

At the other extreme are activities whose value is affected by many other firm choices, and
consequently have firm- or strategy-specific optimal configurations.2 For instance, the U.S. mutual fund
provider Vanguard configured its employee incentive system so that pay was based on the extent of cost
savings for fund shareholders. This configuration was only optimal given many of Vanguard’s other
choices, such as its mutual organizational structure, its emphasis on funds for which low costs were
competitively important, and its pervading emphasis on low cost in all of its operations (Siggelkow,
2002b). Between these two extremes lie activities that have generically optimal configurations within
particular industries, or that are specific to a particular strategic group within an industry (Caves & Porter,
1977; Hatten & Schendel, 1977).
Generic activities are not unimportant – quite to the contrary. They set the bar for competition. A firm
that does not attain parity on such activities is at a competitive disadvantage. Yet, at the same time, other
firms have the same incentive to pursue such activities. As a result, competitive advantage is more likely
to be sustainable if it arises from activities that have more than one optimal configuration, i.e., from
strategy-specific activities. Since these activities are more beneficial to the firm than they are to its rivals,
incentives for imitation are muted.
More generally, interactions among activities can create a number of different and profitable
positionings, implemented by different activity sets. The notion of a performance landscape (Wright,
1931; Kauffman, 1993; Levinthal, 1997) provides a useful tool for illustrating the effects of interactions
on positioning. A performance landscape is a mapping from activity configurations onto performance
values. In a simple case with two activities, the choices for one activity would be depicted along the x-
axis and the choices for the other activity along the y-axis. The ensuing performance of each combination
of activities given environmental conditions is represented on the vertical z-axis. “Environmental
conditions” encompass all factors that affect the value of activity configurations and hence a firm’s
profitability, such as customer preferences, available technologies, and competitors’ current positionings.
2 We use the term “strategy” here as a shorthand for “many other activity choices a firm has taken.” “Strategy” by itself is not a special activity, but it arises from the set of activities that a firm has put in place.
4
Consistency, or “internal fit” within a set of activities is represented by a peak in the landscape
(Siggelkow, 2001).3
The more interactions are present among the activities of firms, the more rugged does the
performance landscape become. In contrast, generic activities lead to smooth plateaus, to “mesas” in the
landscape. In the extreme, if all activities are generic, the landscape contains only a single peak (see
Figure 2a), and strategy devolves to a race towards this peak. At the other extreme, with many strategy-
specific activities, i.e., activities that are highly interdependent with each other, many peaks arise (see
Figure 2b). In this case, firms need not race towards one ideal set of optimally configured activity
choices, but can profitably pursue different strategies which imply different sets of activity
configurations. Lastly, the presence of generic activities reduces the number of dimensions on which
firms can differentiate. Figure 2c depicts the case in which Activity 2 is generic. Regardless of the level of
Activity 1, the highest performance is achieved for a medium level of Activity 2. Thus, a medium level of
Activity 2 constitutes a best practice for all firms and does not provide an opportunity for differentiation.
As further illustration of contextual activities, we offer two short examples of how different sets of
activity configurations can lead to different strategic positionings within an industry.
In the wine industry, Robert Mondavi and E. & J. Gallo compete successfully with very different
systems of activities. Mondavi, the leading premium wine producer, produces high quality wine
employing premium grapes, many grown in its own vineyards. Grapes sourced from outside growers are
purchased under long-term contracts from suppliers with whom the company has deep relationships,
sharing knowledge and technology extensively. Grapes are handled with great care in Mondavi’s
sophisticated production process, which involves extensive use of hand methods and batch technologies
to ensure the highest quality. Wine is fermented in redwood casks and extensively aged in small oak
3 A set of activities is said to be consistent if changing any single activity (and not changing any other activity) leads to a performance decline. Thus, consistency of fit among activities is represented by a peak in the landscape: any incremental move leads the firm to a lower elevation, i.e., to lower performance.
5

barrels. Mondavi makes heavy use of wine tastings, public relations, and wine tours in marketing relative
to media advertising.
Gallo, in contrast, produces large volumes of popularly priced wine using highly automated
production methods. The company purchases the majority of its grapes via arms-length relationships
from outside growers and is also a major importer of bulk wine for use in blending. Gallo’s production
facilities look more like oil refineries than wineries. Bulk aging takes place in stainless steel tank farms.
Gallo spends heavily on media advertising and is the leading advertiser among California wineries. These
two very different systems of activities reflect Mondavi and Gallo’s different positionings.
A second example of different activity sets within the same industry can be found in the automobile
insurance industry. There are two broad types of insurance providers: those serving standard (low-risk)
drivers, such as State Farm, and providers serving mainly non-standard (high-risk) drivers, such as
Progressive Corporation. As a consequence of their different target customers, these companies have
pursued two different systems of activity configurations. Here, we highlight a subset of the firms’ activity
systems, the settlement of claims. The activity design followed by most standard insurers is to investigate
and settle claims deliberately in order to hold down costs and earn further returns on the invested
premium. Most standard auto insurers register operating losses in their insurance business, i.e., claims and
operating expenses exceed premiums, and profitability depends on the returns earned on the float before
claims are settled.
A different set of activity configurations, put into practice by Progressive, is to pay as quickly as
possible. Progressive makes personal contact with over 75% of claimants within 24 hours and settles over
55% of all claims within 7 days. In many cases, a Progressive adjuster will come to the accident scene
and issue a check on the spot. The rationale behind this choice is to reduce the number of lawsuits which
tend to escalate costs but do not ultimately benefit the insured.4 Many other activities influence the time
between an accident and the final issuing of a check. Activity configurations that lead to quicker
6
responses include: education of the customer to call an 1-800 number right after an accident; staffing such
telephone support system; equipping adjusters with vans and having them on call around the clock;
extensive training of adjusters and allowing them to write a check on the scene; contacting policy holders
very quickly after accidents; and improving back-office processes that allow rapid settlement.
While both approaches to claims settlement represent coherent sets of activity configurations, the
profitability of each approach depends on the type of customers served. For Progressive, which
concentrates on non-standard customers who are more likely to be involved in an accident and who
generally choose only the smallest coverage levels required by law, a fast settlement process is optimal
because the margin for error by adjusters is limited. Moreover, facing less competition to insure high-risk
drivers, Progressive can earn operating income on the underwriting and is thus less dependent on the float
to become profitable. In contrast, for standard insurers, whose customers choose much larger coverages,
this response approach tends not to be optimal.
In sum, the value of individual activities can be dependent on the configuration of other activity
choices of a firm – the benefit of activities is contextual. While some activities might be generically
beneficial, and thereby form the competitive bedrock of an industry, strategy-specific activities allow
firms to create and implement different strategic positionings in the market.
Contextuality of activities – here illustrated with examples derived from in-depth studies of individual
firms – has been the focus of two current streams of research. First, agent-based simulation work based on
the NK model has sought to analyze the consequences that arise as the degree of interdependence among
the activities of a firm increase. Second, the empirical work on complementarities has focused on
providing evidence for interaction effects among activities in larger samples of firms. In the next two
sections, we review each research stream.
Agent-based simulation work based on the NK model
4 A study conducted by the independent Insurance Research Council showed that after paying lawyer fees, policy-holders who hire an attorney end up on average with less compensation than those who do not involve a lawyer (Fierman, 1995).
7

While the organization literature has a long tradition of recognizing the importance of interactions
(e.g., Thompson, 1967), formal studies have only recently come to the fore. A large number of studies
have employed simulation techniques based on the NK framework developed by Kauffman (1993), to
study the consequences of interaction effects (for an overview, see Sorenson, 2002). If firms are
conceptualized as systems of interdependent activity choices, the challenge arises how to
(parsimoniously) model the payoffs in such a high-dimensional choice space. A similar problem arose in
the field of theoretical biology. The fitness of an organism is to a large extent determined by its genetic
makeup. At the same time, an organism’s genome contains many genes that interact with each other.
Building on prior work by Wright (1931) that had visualized organisms as trying to achieve high
locations on fitness landscapes, Kauffman (1993) proposed a mechanism to represent possible payoffs to
various combinations of genes. Work by Levinthal (1997) and Rivkin (2000) imported this technique to
the field of organizational studies.
In short, in the organizational work using the NK model, each firm is assumed to make choices with
respect to N activities (a1a2…aN), each contributing to firm performance. For instance, firms need to
decide whether to introduce a new product, whether to provide more sales force training, or whether to
upgrade production facilities. The contribution of each activity, ci(ai, a-i), is assumed to depend on how
activity ai is configured and how K related activities (a-i) are configured. Thus, the notion of contextual
activities – the value of an activity is dependent on how other activities are configured – is a central
aspect of this type of modeling. Which K activities interact with any activity ai is specified either by the
modeler (e.g., Ghemawat & Levinthal, 2000) or randomly by the computer (e.g., Rivkin, 2000). For each
possible combination of activity ai and its K related activities, value contributions ci are drawn randomly
from a uniform distribution over the unit interval. The resulting value of each activity combination is then
given by the average of the contributions, i.e., V(a1a2…aN) = ∑=
−
N
1iii ),a(c
N1
ia .
This procedure, thus, generates performance landscapes – i.e., mappings from combinations of
activities onto performance values. Each of the N activities and its possible configurations correspond to a
8

“horizontal” dimension, while the value of each activity combination is represented on the “vertical” axis.
Firms are thought of as searching this performance landscape for high peaks, i.e., combinations of activity
choices that generate high performance.
Considerable modeling advances have been made on how to represent the agents, i.e., the firms that
are “released” on these landscapes. While early work assumed that firms explore performance landscapes
by randomly changing (“mutating”) individual activities (Levinthal, 1997), more recent work has put
significantly more organizational structure on the firms, modeling, for instance, hierarchy, vertical
information flow, and incentives (Rivkin & Siggelkow, 2003; Siggelkow & Rivkin, 2005, 2006), or
different cognitive representations of managers (Gavetti & Levinthal, 2000).
The key focus of this work has been on examining the effects of different degrees of interaction
(different levels of K). For instance, Levinthal (1997) found that firms operating on high-K landscapes are
subject to high rates of failure in changing environments. Similarly, Rivkin (2000) showed that as K
increases, the probability of a firm reaching the global peak decreases dramatically. As a result, the
imitation of a firm that occupies the global peak within a landscape is very unlikely to succeed if the
leading firm’s strategy is based on a large set of interdependent activity choices. In an extension of this
work, Rivkin (2001) analyzed the problem faced by firms (e.g., franchise operations) that, after finding
the global peak, might want to replicate this performance. If a firm’s strategy is complex, a firm that tries
to replicate itself might encounter similar obstacles than other firms that try to imitate. Assuming that a
replicator has a higher probability of duplicating correctly each individual activity than an imitator,
Rivkin (2001) found that the gap between replicability by the same firm and imitability by other firms
tends to be greatest at moderate levels of K.5
An attractive feature of the NK model is that the degree of interdependence can be controlled by only
5 Further studies employing the NK methodology include McKelvey (1999) and Lenox, Rockart and Lewin (2006) whose models includes interactions between different firms; Levinthal and Warglien (1999), who included interactions among different decision makers; Marengo, Dosi, Legrenzi, and Pasquali (2000), who examined the effects various decomposition schemes; Siggelkow and Levinthal (2003; 2005) who analyzed different sequences of organizational structures; and Ethiraj and Levinthal (2004a; 2004b) who focus on the effects of different degrees of
9

one parameter, K. The downside of this simplicity is that the modeler has no control over which types of
interactions arise. In any given simulation involving a significant degree of interaction, a broad
distribution of different types of interactions is present, rendering the study of the effects of particular
types of interactions, and of contextual interactions, impossible. This limitation of the NK model arises
from the random assignment of contributions to activities (see Appendix 1 for more details).
In sum, while the studies of the effects of different degrees of interaction have produced a number of
interesting insights, it is important to note that these results are mean tendencies across a wide range of
different types of interactions, potentially hiding important phenomena. For instance, as Siggelkow
(2002a) showed using a closed-form approach, the consequences of misperceiving interactions between
activities are markedly different when interactions are between substitutes than when they are between
complements. With the NK approach, such distinctions relating to the types of interactions cannot be
explored.
Research based on the complementarity framework
Besides the simulation work in the organization literature, a large stream of the recent work on
interaction effects among firms’ activities – both empirical and theoretical – has built on the work of
Milgrom and Roberts (1990; 1995). Guided by the observation that many firms in the American economy
were shifting from mass production to lean manufacturing, Milgrom and Roberts (1990) proposed an
optimizing model of the firm that generated many of the observed patterns in the transition from one
system to the other. In particular, the model accounted for the observation that a successful transformation
from one system to the other required substantial changes in a wide range of a firm’s activities.
Milgrom and Roberts’ work contained two key insights, one conceptual, one mathematical. First, they
observed that many activities within a given production system were complementary to each other. They
defined two activities to be complementary if the marginal benefit of one activity was increased by the
modularity among the activity choices. Empirical studies testing the NK-framework are few. Notable exceptions are Sorenson (1997), Fleming and Sorenson (2001), and Sorenson, Rivkin and Fleming (2006).
10

level of the other activity. Second, they developed mathematical methods building on the supermodularity
work by Topkis (1978) that allowed a particular but exact formulation of the notion of complementarities
involving a large set of choices. With these methods, models with an unusually large number of variables
and relatively weak assumptions (by economics standards) were amenable to tractable analysis. (We will
return to these assumptions at the end of this section.)
The complementarity framework has spurred both theoretical and empirical research. A growing
literature has continued to develop and apply the mathematical apparatus of supermodularity in a wide
variety of formal models, addressing issues such as investments in product and process flexibility, optimal
partitioning of design problems, and convergence to equilibria in learning games (e.g., Milgrom, Qian, &
Roberts, 1991; Bagwell & Ramey, 1994; Holmström & Milgrom, 1994; Milgrom & Shannon, 1994;
Athey & Schmutzler, 1995; Topkis, 1995; Schaefer, 1999; Chen & Gazzale, 2004; Vives, 2005).
Empirical work in this line of research has mainly pursued two directions: finding support for
complementarity among various activities by studying the performance implications of adopting
individual activities versus entire sets of activities; and inferring complementarities by studying adoption
patterns of new technologies and practices. For a thorough exposition of the inherent econometric
problems involved in identifying complementarities, see Athey and Stern (1998). For a testing strategy to
detect supermodularity given discrete choices, see Mohnen and Röller (2005).
A notable example of the first type of empirical study is Ichniowski, Shaw, and Prennushi (1997),
who studied the effect of adopting individual human resource management (HRM) practices versus entire
sets of HRM practices on the productivity of steel finishing lines. They found “consistent support for the
conclusion that groups or clusters of complementary HRM practices have large effects on productivity,
while changes in individual work practices have little or no effect on productivity” (p. 291). Ichniowski
and Shaw (1999) reported a similar finding using an expanded sample including both U.S. and Japanese
steel finishing lines. Likewise, MacDuffie and Krafcik (1992) found for firms in the U.S. automobile
industry a synergistic payoff between the adoption of “lean” production processes and a set of HRM
11

practices, including shop floor work organization and incentive clauses in employment contracts.
MacDuffie (1995) extended this work to a larger set of automobile assembly plants located worldwide,
finding a complementary relationship between team-based work systems, high-commitment HRM
practices, and low inventory and repair buffers.
Focusing on investments in information technology, Bresnahan, Brynjolfsson and Hitt (2002) found
in a sample of 300 large U.S. manufacturing and service firms that the benefits to information technology
investments increase in the level of worker human capital, and vice versa, indicating complementarity.
Likewise, the relationship between workers’ skill level and organizational changes, such as
decentralization of authority and delayering of managerial functions, was shown to be complementary in
a sample of French manufacturing plants (Caroli & Van Reenen, 2001).
On a broader organizational level, Whittington et al. (1999) studied the performance implications of
ten distinct changes in organizational structure, processes and firm boundaries using a survey of 383
European firms. Consistent with complementarities, they found that piecemeal changes (with the exception
of investments in information technology) delivered little performance benefit, while exploitation of the
full set of innovations was associated with high performance. In particular, a positive performance effect
arose only if changes to structures, processes, and firm boundaries were combined. No performance effect,
or even a negative effect, was found when changes addressed only two of these areas. For a broader
exposition of these results, see Pettigrew et al. (2003).
One should note that not every empirical test of complementarity has yielded confirming results. For
instance, Cappelli and Neumark (2001), using Bureau of Census survey data and covering the time frame
1977-1996, found very few complementarities among work practices. In addition, they made the
interesting observation that complementarity does not necessarily imply that joint adoption is better than
no adoption. While it may be true that adopting practice A alone is worse than adopting practices A and B
together, the net benefit of practices A and B may still be zero if the direct effects (e.g., costs) of A and B
are negative. They found such a relationship for the practices of job rotation and self managed teams.
12
These two practices do benefit from each other, yet both have individual negative effects on performance
(measured by labor productivity), creating an overall insignificant performance effect.
Similarly, Black and Lynch (2001), studying the effects of work practices in a broad sample of U.S.
manufacturing businesses over the period 1987-1993, only found a significant interaction effect between
unionization and profit sharing for non-managerial workers, yet no interaction effects among any of the
workplace practices themselves. Lastly, in a detailed study of the effects of improved information
technology in emergency response systems (“911”), Athey and Stern (2002) did not find evidence for
complementarity between information technology investments and investments in the human skills of the
call-takers.
Empirical studies in the second stream of literature, examining adoption patterns of new practices and
technologies, include Colombo and Mosconi (1995), who investigated the adoption patterns of flexible
manufacturing systems, new design/engineering technologies, and new management techniques such as
JIT and total quality procedures in the Italian metalworking industry. They observed that all of these
innovations tended to be adopted together, providing an indication of complementarity among them. Hitt
and Brynjolfsson (1997), in a study of 273 firms from the Fortune 1000 list, found that firms that were
extensive users of information technology tended to adopt a complementary set of organizational
practices that included decentralization of decision authority, emphasis on subjective incentives, and a
greater reliance on skills and human capital.
In sum, studies have generally explored activity configurations that are beneficial for many firms and
activities that are complementary in the same manner for all firms within an industry or across industries.
(For a recent counterexample, see Cassiman and Veugelers (2006) to be discussed in more detail later.)
While these are important situations to study, they represent, however, only a subset of the ways in which
activity choices can interact and how these interactions affect competition. Moreover, an explanation for
sustainable competitive advantage, i.e., for long-term superior profitability, may not be found in such
cases. If a particular activity configuration is beneficial for all firms within a given industry, competitors
13

will have strong incentives to adopt this configuration sooner or later.
Similar to the NK model, the complementarity framework is not well-suited to deal with contextual
interactions. While in the NK model any and all types of interactions can arise, the complementarity
framework, as the name implies, constrains itself to a single and very specific type of interaction. In
particular, in the formal analyses, which form the background for the empirical studies, two activities A
and B are said to be complements if and only if three conditions hold (see Appendix 2 for a more general
and formal statement of these conditions):
(1) The marginal benefit of A has to increase in the level of B, and vice versa.
(2) Relationship (1) has to hold for all levels of A and B.
(3) Relationship (1) has to hold regardless of how a firm configures its remaining activities.
The above definition of complementarity is convenient because it yields robust comparative statics
properties: any exogenous decrease in the marginal cost of any element in a system of complements will
(weakly) increase the optimal level of all elements in the system (for more details see, e.g., Milgrom &
Roberts, 1990; Milgrom & Shannon, 1994; Topkis, 1995). The above formulation also holds
mathematical interest because the relationships (1)–(3) describe the weakest sufficient conditions to yield
these comparative statics result (Milgrom, Roberts, & Athey, 1996). However, for the central question of
strategy – how firms can distinguish themselves and achieve above-average performance – the restrictive
definition of complementarities is less satisfying for three reasons.
First, complementarity is but one case of how activities interact. Activities within firms can interact as
substitutes as well.6 For instance, as a firm increases its investment in quality control leading to fewer
defects in its products, the marginal benefits of increasing after-sale service support dealing with faulty
products is likely to decrease.
Second, the type of interaction among activities may not be constant for all levels of these activities,
14
i.e., condition (2) may be violated. Two activities might be complementary over a range of their values,
but not complementary outside the range.
Third, interactions among activities are not always independent of other activity choices as condition
(3) in the definition of complementarities requires. As a result, two activities might be complementary in
one firm and substitutes in another. (For an illustration of how restrictive the complementarity conditions
are, see Appendix 3.) Similarly, as a firm changes some of its activities, the nature of the interactions
among its activities might change over time.
The following sections illustrate contextual interactions in its various forms. First, violations of
condition (2) are described, i.e., contextuality that is caused by the level of the activities. Second, examples
of violations of condition (3) are explored; in one case we describe how the same activities can have
different interactions in different firms because the activities are embedded in different activity systems; in
the other case we describe how contextuality can lead to interactions that change their nature over time. 7
Contextuality created by different activity levels
To illustrate a situation in which activities may be complementary only over certain ranges of their
levels (violation of condition 2), we continue with the example of Progressive Corporation. Progressive’s
quick response approach in the automobile insurance industry allows the company to lower total costs by
reducing the frequency of litigation in serving high-risk customers. Let T = t1 + .... + tN be the total time
between accident and issuing a check, i.e., the time required for the N activities that lie between accident
and the issuing of a check. Let P(T) be the net benefit function of having a response time T. Since shorter
6 The complementarity framework can incorporate only a limited amount of substitutes. If an activity ai is a substitute to all other activities of a firm, it can be formally replaced by -ai, thereby making it complementary (de Groote, 1994). 7 In contrast to the studies of complementarities and the work using the NK approach, explicit discussions of interactions have not featured centrally in the research based on the resource-based view of the firm. This is not to say that interactions have been completely ignored; e.g., the notions of complementary assets (Teece, 1986; Tripsas, 1997) and of “interconnectedness of assets stocks” (Dierickx & Cool, 1989) clearly involve issues of interaction. Likewise, the often-invoked path dependency of capabilities reflects interdependencies through time. At the same time, though, the thrust of the resource-based view has been on characterizing individual resources (e.g., as rare, inimitable, etc.), rather than on the interdependencies among activities that lead to these resources and perhaps their characteristics.
15
response times are beneficial for Progressive, P(T) is decreasing. Depending on the shape of P(T),
investments in activities that shorten the total time to settlement are complementary, or not. Strict
complementarity requires that P(T) is convex over the entire range of T. While an argument can be made
that P(T) may be convex within a certain range of T, the convexity of P(T) is unlikely to hold over all
possible levels of T. For instance, if it takes adjusters a relatively long time to settle claims (two weeks
are not uncommon in the industry), a reduction in processing time by a few days is likely to go unnoticed
with customers and creates no benefit for the insurance company (the investments are not
complementary). If, however, the adjuster contacts the person within a day, the same reduction in
processing time may have considerable benefit to the insurance company (both in terms of customer
satisfaction and likelihood of involving a lawyer), as the insured party may respond positively to the
noticeable reduction of total processing time. (In other words, the efficiency improvement is not swamped
by large delays introduced by other parts of the settlement process.) Thus, the investment in one activity
increases the marginal benefit of investing in the other activity – the activities are complementary.
Finally, once both contact and processing time have been reduced to very short levels, the marginal
benefit of decreasing one even further is likely to decline again, i.e., the investments cease being
complementary.
This example also illustrates the empirical challenge of choosing the correct level at which the effects
of complementarity are measured. Using the previous notation, a common question would be whether
investments that reduce, say, t1 and t2 are complementary. Assume that an investment that reduces t1 does
not lead to a reduction in t2, and vice versa, i.e., reductions in T through investments in t1 and t2 are
strictly additive. In this case, if the efficiency of the process is measured by T, no complementarity
between the investments will be detected. At the same time, if P(T) is used to measure the effects and
P(T) is convex, one would detect a complementarity between the investments.
16

Contextuality leading to different interactions in different firms An even more interesting departure from the strict complementarity assumptions for company strategy
is the case when the type of interaction is affected by other choices (violation of condition (3)). A firm’s
existing set of activities can transform the relationship between activities from one of complements to one
of substitutes and vice versa. For example, in the automobile insurance setting, we described two different
kinds of strategies with respect to response times. Given a strategy of postponing payments (up to the point
when regulators step in), all activities that lead to a reduction in response times are substitutes. Any
investment that reduces the time of one activity would lead to a decrease of the marginal benefit of
speeding up another activity. However, with a strategy of decreasing total response time, these choices are
complementary (at least over a certain range, as discussed in the previous section).
A more elaborate example of contextuality can be found in the mutual fund industry. In 1974, the
mutual fund provider Vanguard was formed. Originally, Vanguard, in common with other mutual fund
providers, outsourced investment management to an investment management company, Wellington
Management (WM). As was industry practice in the 1970s, Vanguard distributed its funds using the same
investment management company that managed the funds.
Vanguard differed from its competitors, however, in various ways. First, administrative services were
not contracted out, but were provided at cost by The Vanguard Group itself. Second, The Vanguard
Group was owned by the fund shareholders rather than by a separate set of shareholders. Lastly,
Vanguard differed from its competitors in its overarching investment philosophy and the type of funds it
promoted. John Bogle, Vanguard’s CEO, believed that high and fairly predictable long-run investment
returns could be achieved by incurring very low expenses and not attempting to outperform the market
but to match it. Thus, Bogle introduced the industry’s first index fund (based on the S&P 500) in 1976
and increased Vanguard’s offering of bond funds. In 1977, Vanguard decided to bring the distribution
function in-house, and to market its funds as no-loads, i.e., not to charge any sales fees. In the following
years, Vanguard also started to bring investment management for all bond funds in-house.
17

The interplay between the in-sourcing of investment management and the no-load, direct distribution
system reveals the effect of contextuality. For Vanguard, bringing both investment management and
distribution in-house was complementary, yet for other fund providers it was not. The benefit of
internalizing investment management was much greater after Vanguard had gained control over
distribution. It would have been unwise for Vanguard to take away the (very lucrative) investment
management business from WM, while still relying on WM to distribute its funds. WM would have been
much less motivated to sell the funds. If in-sourcing investment management and direct distribution are
complementary, the reverse is also true, i.e., changing from load-distribution to direct, no-load
distribution is more valuable in the presence of internal investment management than with external
investment management. This reverse argument holds for Vanguard, but only in the context of its low-
cost strategy, organizational structure, and fund portfolio. Internalization of investment management and
distribution each decreased costs. By virtue of Vanguard’s mutual structure these cost savings were
passed through to the funds which therefore recorded higher net returns. It has been shown that fund
inflows, in turn, respond in a convex manner to higher relative returns (Sirri & Tufano, 1998). Thus, the
benefit to Vanguard – in terms of asset growth – from decreasing its costs of investment management
became larger when the costs of distribution were also reduced. Moreover, this effect was most
pronounced for fund types for which small changes in expenses translated into large relative performance
differences and were not swamped by large performance fluctuations. Thus, the complementary
relationship arose strongly for the types of funds Vanguard was focusing on and for which it was in-
sourcing the investment management, i.e., low-risk and index funds. Consistent with this contextual
complementarity argument, Vanguard did not in-source the investment management for actively traded
equity funds.
This contextuality can also be inferred from the following observation. Were in-sourcing investment
management and distribution complementary for all firms, regardless of the firms’ other choices, then we
should always see the choices of in-house investment management and in-house distribution go together.
18

However, we can observe quite a number of “mixed cases,” i.e., mutual fund providers who either only
focus on asset management and outsource distribution, and a number of providers who specialize in
distribution and outsource investment management. Thus, in-sourcing investment management and in-
sourcing distribution do not seem to be context-free complements.
Contextuality leading to changes in activity interactions over time
Violations of condition (3) can manifest themselves not only across firms but also over time in the
same firm. Two activities that were substitutes can become complements, and vice versa, as a firm adapts
its activity system to changing industry conditions.
An example of how the relationship among activities can change over time can be found at Liz
Claiborne, the largest fashion apparel manufacturer in the U.S. In the 1980s, Liz Claiborne focused on the
apparel needs of the then rapidly growing professional women segment. Its collection provided high value
to customers who looked to the brand to provide guidance about what constituted acceptable professional
women’s apparel and to assemble an array of items that were fashion coordinated. In its early years, Liz
Claiborne was able to easily sell all of its output to its department store customers and required them to
place binding orders at the beginning of the season.
Consider the subset of activities that influences the lead time between design and final delivery of the
product. Each of these activities, from design itself to the management of contract manufacturers,
involves configuration choices: e.g., conventional design vs. computer-aided design, physical delivery of
design and fabric samples to manufacturers vs. using on-line technology, etc.
When Liz Claiborne set fashion trends and could always sell its entire output, the benefits of
decreasing its lead time were small. As long as Liz Claiborne was able to ship its merchandise at the
beginning of the respective season, lead-time did not matter much. (For firms that were not able to
“define” the market, shorter lead times were beneficial since they allowed the gathering of more
information about the upcoming fashion trends.) Hence for Liz Claiborne, improvements in activities that
led to a shortening of the total lead time were substitutes. More formally, let T = t1 + t2 + … tN be the total
19
lead time, with t1, …, tN, the time of the various activities from design to delivery. If there is no benefit in
decreasing T (under the constraint that T is sufficiently small to guarantee shipment at the beginning of the
season), then a decrease, for instance, in t1, would lead to a reduction of the benefit of reducing t2, i.e.,
investments that reduce t1 and t2 are substitutes. As the general quality of IT increased over time, making
communication with suppliers faster, the marginal benefit of investing in design technology (e.g., CAD
systems) that would reduce lead time even further decreased for Liz Claiborne. Consistent with this
relationship, Liz Claiborne invested very little in upgrading design technology (Henricks, 1995).
In the 1990s, however, Liz Claiborne’s competitive environment changed. First, the assurance of the
Liz Claiborne brand became less important, leading to decreased consumer loyalty. With this change,
shorter lead-times became valuable to Liz Claiborne, since shorter lead-times allowed it to wait longer
and discern emerging fashion trends. Second, department stores experienced cash-flow problems as many
chains had been involved in leveraged buy-outs or mergers involving high levels of debt. As a
consequence, department stores sought to reduce inventories to free up cash, and increasingly demanded
the delivery of merchandise in small lots and the option of reordering items during a season. To allow
reordering efficiently, manufacturers had to move to at least partial production-to-order (Hammond,
1993). Production-to-order, in turn, was more effective with shorter overall lead times. Investments that
sped up the design process were made more valuable by concurrent investments in information
technology. For Liz Claiborne, upgrading design technology and upgrading information transmission
technology had become complementary.
The effects of contextuality on imitation and adaptation
Contextuality has a number of implications for management practice. Here, we focus on the effect of
contextuality on the ease of imitation and adaptation. The imitation of systems of interactive activities is
generally challenging because interactions among activities require that entire systems rather than
individual activities be replicated (Porter & Rivkin, 1998). Put differently, interactions cause the
imitation-benefit relationship to be convex: if only a few elements of a system are copied, no benefits (or
20

even negative results because of inconsistencies) are generated. This effect even holds in systems
composed entirely of complements. (See for instance, the illustration of Lincoln Electric as provided by
Milgrom and Roberts (1995).)
Contextuality further adds to the difficulty of imitating a competitor’s activity system. First, strategy-
specific activities, as compared to generic activities, are inherently more difficult and costly to imitate
because their configurations are observable in fewer firms and matching them often requires imitators to
suboptimize their current activity configurations (Porter, 1996).
Second, and more subtle, contextuality of interaction effects can lead to misguided imitation and search
behavior. Contextual interactions require imitators to learn not only about new activity configurations but
also about new activity interactions. In the presence of contextual interactions, managers who observe that
two activities are complementary (or substitutes) for a competitor cannot conclude that the same two
choices are complementary (or substitutes) for their firm. As a result, imitating the investment behavior of
competitors can backfire. For instance, a competitor for whom two activities are complementary would tend
to co-invest in both activities. Imitating this co-investment could be harmful to the imitator if the two
activities, due to other activity choices, are actually substitutes in the imitating firm.
Similarly, contextuality of interactions implies that the relationship between existing activities can
change as new activity configurations are adopted. This means that established strategic heuristics or
adjustment routines (Nelson & Winter, 1982) may fail. Consider a firm that is trying to imitate a leading
firm. If the imitator could observe the entire set of activity choices taken by the leading firm, and if the
imitator were capable of duplicating all these choices, the imitator could imitate perfectly. However, in
most cases, the imitator cannot observe the entire set of the leader’s activity configurations. Hence, the
imitator can only duplicate the observable activity configurations and subsequently attempt to deduce the
remaining set of choices, hoping that its system of routines and traditional operating procedures, i.e., its
knowledge about how the new activity configurations interact with its old activities, will bring about
optimal readjustments. Yet, if the nature of the relationship between existing activities has changed after
21

the adoption of new activities, either no or even counterproductive adjustments will be made. What used
to be good habits have turned into bad habits.
The fact that interactions can change their type when other activity configurations are altered, has
consequences not only for imitation but also for the ability of firms to adapt their activity system, e.g., in
response to an environmental change. As a firm starts to incrementally change its activity system, it may
not be aware that interactions among its other activities have changed and operate with mistaken beliefs
about interactions, relying on their old, outdated mental maps. For instance, Liz Claiborne’s existing
management did not fully realize that interactions had changed within its activity system after reordering
activities had been adopted, contributing to its performance decline (Siggelkow, 2001).
Further examples of such consequences of contextual interactions on imitation and adaptation are
revealed in the innovation literature (Henderson & Clark, 1990; Henderson, 1993). Incumbent firms have
been found to experience severe difficulties in responding to “architectural” innovations that are
characterized not by new parts of a system, but by new ways in which the parts of a system interact with
each other. The interactions among the components of a product, or more generally, among activities of a
firm, leave organizational imprints, such as who communicates with whom, what type of information is
gathered and shared, and what heuristics are used to solve problems or to make investment decisions. If
relevant interactions change, the existing organizational structures and processes that arose in the context
of the old set of interactions can become very misleading.
Recall the example of firms like The Gap that operate distribution systems linking warehouses and
stores. For such firms ordering frequency and delivery frequency are complementary, yet only if relevant
information for ordering on a daily basis is available, e.g., through a POS system. Existing investment
routines that were formed in the old regime (i.e., in the absence of a POS system), will not have
incorporated a relationship between ordering and delivery frequency. With these old routines in place, the
installation of a POS system (e.g., a salient feature of a competitor that was replicated) may not be
accompanied by increased investment in ordering and distribution frequency. Moreover, even if the firm
22
increased investment in one of these activities, the old routines would not lead to a self-adjusting increase
in the investment of the other activity.
In sum, the extent of contextual interactions is an important dimension that characterizes systems of
activities. While considerable research effort has been extended on the horizontal axis of Figure 1, the
“contextuality of activities,” much less attention has been spent on the vertical dimension, the
“contextuality of interactions.” Combining the distinction between generic and strategy-specific activities
and between interactions that are contextual, or not, creates the typology shown in Figure 1. When no
interactions are present, activities are de-contextualized, and optimal configurations can be found that are
not different across firms. In other words, these activity configurations represent universal best practices.
As interactions become more pervasive, i.e., the value of activities more dependent on other activity
choices, the optimal configuration of activities becomes a function of industry, strategic group, or even
firm-level strategy. At each of these levels of contextuality, interactions themselves can be either
contextual or similar within all firms at the respective level. Given that contextuality of interactions has
not been a focus of past research, in the next two sections, we will spell out implications for both
simulation and empirical work.
Implications of contextuality for simulation studies
Formal modeling can be very useful in trying to understand the often complex effects of activity
interactions. Traditional closed-form modeling approaches, however, become quickly intractable when
dealing with interactions unless restrictions are imposed such as the Milgrom and Roberts definition of
complementarities. Agent-based simulations building on the NK model can address this challenge. Yet, as
noted before, the NK simulation framework is limited because it does not provide control over which types
of interactions can arise in a performance landscape.
To study the effects of contextual interactions directly, such control would be very useful. One way to
achieve such control would be to start with a performance function, rather than to assign contributions to
individual activities. Consider a case of N = 4, where each activity ai can take on two values, 1 and 0. The
23

following function includes all possible interactions among the activities:
V(a1, a2, a3, a4) = α1a1 + α2a2 + α3a3 + α4a4 + β1a1a2 + β2a1a3 + β3a1a4 + β4a2a3 + β5a2a4 + β6a3a4 +
γ1a1a2a3 + γ2a1a2a4 + γ3a1a3a4 + γ4a2a3a4 + θa1a2a3a4
By choosing appropriate values, or distributions, for the parameters αi, βi, γi, and θ, different types of
interactions can be created. For example, if βi = γi = θ = 0, all activities are independent; in this case,
landscapes that are generated by drawing random values for αi have similar properties to K = 0
landscapes created by the NK model. If βi > 0, γi ≥ 0 and θ ≥ 0, all interactions among activities satisfy
the Milgrom and Roberts definition of complementarity, as all cross-partial derivatives are positive. If 1
> βi > 0, γi ≤ -1 and θ = 0, all activities have contextual interaction effects.8
First exploratory characterizations of performance landscapes created with this methodology show
that having control over the types of interactions can create new insights. For instance, one of the main
findings of NK models is that as K increases – often interpreted as an increase in interaction intensity
(e.g., Levinthal, 1997) – performance landscapes become more rugged (Kauffman, 1993), making
imitation more difficult (Rivkin, 2000). Yet, if landscapes are composed entirely of complementary
activities, stronger interactions can actually lead to smoother landscapes, making imitation potentially
easier (results available from the authors).
Implications of contextuality for empirical research
Contextuality of both activity configurations and of interactions poses significant challenges for
empirical work because identifying contextuality often requires an in-depth knowledge of the activity
systems of each firm or “data point.” Such in-depth knowledge is difficult to obtain for large samples.
However, our framework suggests practical directions for large-sample research. For instance, assume
8 To see that all activities have contextual interaction effects when 1 > βi > 0, γi ≤ -1 and θ = 0, consider, e.g., the cross-partial derivative of a1 and a2, β1+γ1a3+γ2a4. It equals β1 if a3 = 0 and a4 = 0. Since β1 > 0, a1 and a2 are in this case complements. Yet, if a3 = 1 and a4 = 0, the cross- partial derivative equals β1 + γ1 < 0; thus, in this case, a1 and a3 are substitutes. Likewise for a3 = 0 and a4 = 1. In other words, the type of the interaction between a1 and a2 is contextually determined by the configurations of a3 and a4.
24

that the benefit of adopting a bundle of production practices (say, A, B and C) has been found to yield
higher labor efficiency for a sample of firms than adopting the practices separately. Our framework
suggests the additional question whether the configuration is particularly beneficial (or detrimental) for
firms with specific strategies, i.e., for firms with certain sets of other activity choices. By pooling across
all observations, we only know that the bundle of practices is beneficial on average. However, it may be
that A, B and C are beneficial (and/or mutually reinforcing) only for companies that produce standardized
outputs, while they are detrimental (and/or mutually independent or even substitutes) for companies that
produce highly customized outputs (or vice versa).
Contextuality of interactions can be explored by testing whether interaction effects are constant over
entire samples, including firms with significant differences. Interaction effects are frequently studied by
including the product of two variables in a regression model. Thus, if the interaction between A and B is
tested, the regression model would include a term such as β*A*B. Contextuality due to the level of
activities could be tested by exploring whether β is a function of the level of A and B. This could be
explored by splitting the sample into groups depending on their levels of A and B and testing whether β is
different across the groups.
Contextuality due to other activities could be tested by exploring whether β is a function of other
variables C. Dividing the sample into subgroups using C and testing for differences in β, or including
higher-order interaction terms such as A*B*C, would be a first step to explore this type of contextuality.
Similarly, if A and B are shown to complementary on average, finding variables C that drive the joint
adoption of A and B, but not of A or B alone, can point to sources of contextuality. For an interesting test
along these lines, see Cassiman and Veugelers (2006). Investigating whether internal R&D and external
knowledge acquisition are complementary for firms, they “identify reliance on basic R&D – the
importance of universities and research centers as an information source for the innovation process – as
an important contextual variable affecting complementarity between internal and external innovation
25
activities” (p. 68).
If no such contextuality effects among a particular set of performance-enhancing activities can be
detected, then the range of firms included in the sample speaks to the degree to which these activities are
generic. For instance, if the sample includes firms from a broad swath of industries, the set of activities
would be universal best practices. If firms from only one industry are included, the set of activities would
be (at the minimum) industry best practices. If contextuality effects are detected, the degree of specificity
of the contextual variable determines the degree of specificity of this effect. For instance, if the contextual
variable is constant for firms within a strategic group, yet differs across strategic groups, the identified
activities are strategic-group best practices with or without contextual interactions, depending on the
presence of contextual interactions.
As an illustration of how taking contextuality into account can refine empirical findings, we re-
analyzed the data from MacDuffie’s (1995) study of automobile assembly plants. MacDuffie (1995)
investigates the productivity and quality effects of innovative human resource practices, work policies
that govern shop floor production activity, and the use of inventory buffers in production. In particular,
both the direct effects and interaction effects of these practices were analyzed. MacDuffie concluded that
“plants using flexible production systems, which bundle human resource practices into a system that is
integrated with production/business strategy, outperform plants using more traditional mass production
systems in both productivity and quality” (p. 218). The results implied that the identified practices were
generically beneficial and interacted similarly in all firms, i.e., a case of industry best-practices.
Our subsequent analysis of the data reveals, however, that only the work practices, such as the degree
to which workers are in formal work teams, were truly industry best-practices, showing no contextual
effects. The human resource and inventory buffer practices prove to have both contextual benefits and
contextual interactions. For instance, the benefit of the human resource practices, such as the level of on-
going training, was higher for plants that assembled relatively new models, i.e., for firms that had shorter
product life-cycles. Similarly, the complementary interaction between human resource and inventory
26

buffer practices was found to be influenced by the degree of variation among parts that were required for
all models that were assembled in a plant (MacDuffie & Siggelkow, 2002).
A further important avenue for empirical work is to examine a broader array of measures of
performance, especially measures of overall performance. Many studies of complementarities employs
narrow efficiency measures such as labor input per unit of output (i.e., labor productivity). These
measures offer comparability across processes, but have differing relevance for firms with different
strategies. Ideally, performance measures should incorporate both the cost and the price elements of the
business, i.e., some form of margin or profit contribution measure. For instance, a firm that produces
highly customized products may not want to adopt the bundle A, B and C, if adoption of this bundle
hampers the ability to customize products and thereby command higher prices. In this case, the firm
would be pursuing a differentiation strategy (Porter, 1985). While a different optimal bundle might result
in lower (labor) efficiency in producing standardized outputs, the price premium for the customized
products can outweigh the efficiency loss. A focus only on narrow measures of efficiency, then, implicitly
suppresses strategy differences by assuming that all firms value the measure similarly, i.e., that all firms
follow the same strategy. This neglects important dimensions of competition and can create misleading
interpretations of empirical results.
Conclusion
In recent years, the conceptualization of firms as systems of interdependent activities has found
renewed interest. Both the NK model and the complementarity framework have allowed researchers to
approach this topic in a more systematic manner. For future research, we would suggest to increase focus
on sets of activities whose interaction effects are contextual, because these activities are more difficult to
imitate and, thus, more likely to represent sources of competitive advantage. More generally, as our
examples show, to gain a richer understanding of the role played by interactions among activities in
creating and sustaining competitive advantage, research needs to encompass a wider range of interactions
than the strictly defined complementarities that have served as the theoretical model underlying many
27

empirical analyses. Similarly, simulation research will need to be extended. To study the effects of
different types of interactions and of contextuality, simulation models will have to allow more control than
the frequently used NK model grants.
Empirical support for the existence of contextual interactions is so far mainly derived from in-depth
field-research. Future research in larger samples is needed. Re-analyzing prior studies to look explicitly
for contextualities might be a first step. A more ambitious approach would be to assemble data sets in
which fuller interaction structures of the activities of firms are documented. Due to the high cost involved
of assembling such data, research treading a middle ground between individual case studies and large-
sample research may prove to be the most feasible next step. Incorporating the possibility of contextual
relationship in future research is certainly no small task, but will be essential to further our understanding
of the role of interactions in competitive advantage.
28
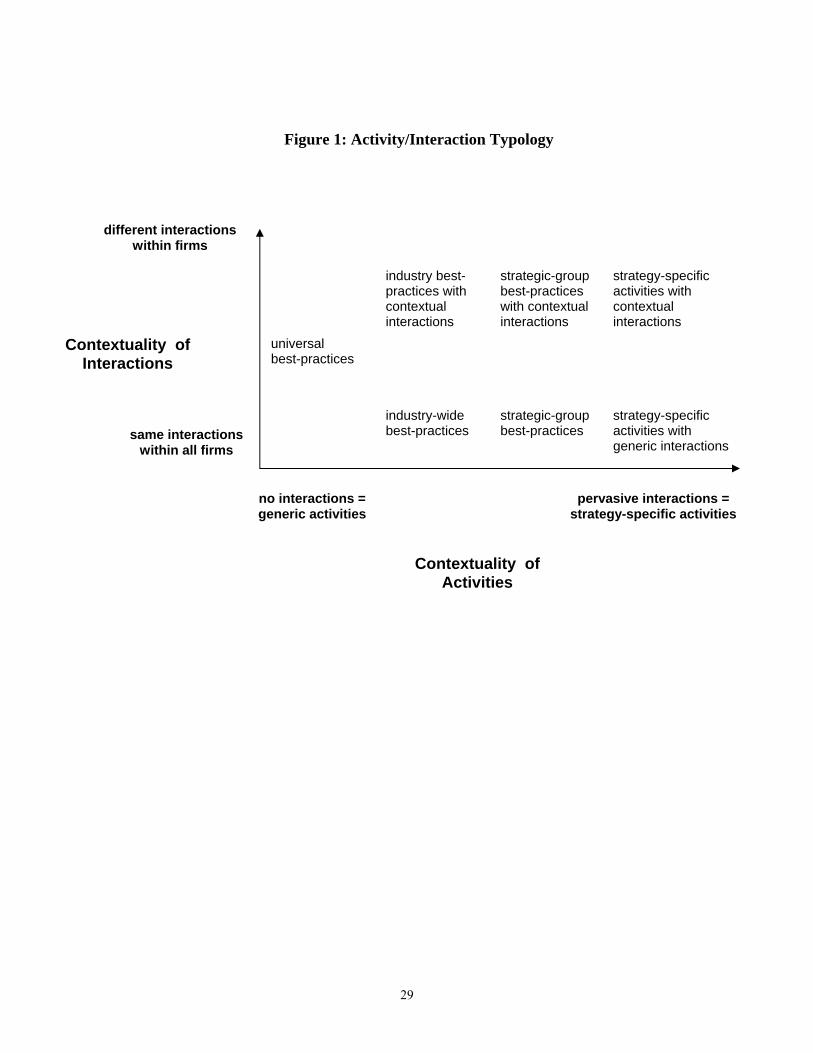
Figure 1: Activity/Interaction Typology
different interactions
within firms
industry best-practices with contextual interactions
strategic-group best-practices with contextual interactions
strategy-specific activities with contextual interactions
universal best-practices
industry-wide best-practices
strategic-group best-practices
strategy-specific activities with generic interactions
Contextuality of Interactions
same interactions within all firms
no interactions = generic activities
pervasive interactions = strategy-specific activities
Contextuality of Activities
29
Figure 2: Performance Landscapes
F
igure 2a:
Two generic activities
Performance
high
high low
Activity 2 low
Activity 1 high low
Figure 2b: Two strategy-specific activities
Performance
high
high low
Activity 2 low
Activity 1 high low
30

medium
Activity 2
high
low
low
low
Performance
Activity 1
Figure 2c: One strategy-specific and one generic activity
high
high
31
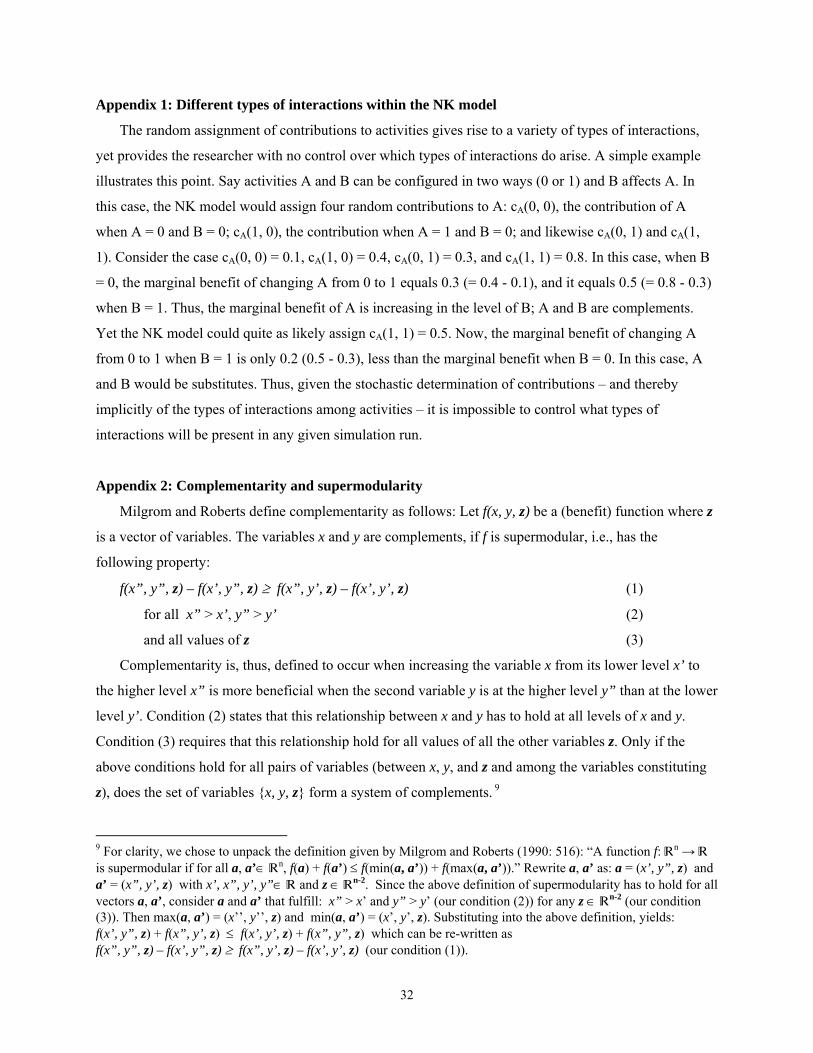
Appendix 1: Different types of interactions within the NK model
The random assignment of contributions to activities gives rise to a variety of types of interactions,
yet provides the researcher with no control over which types of interactions do arise. A simple example
illustrates this point. Say activities A and B can be configured in two ways (0 or 1) and B affects A. In
this case, the NK model would assign four random contributions to A: cA(0, 0), the contribution of A
when A = 0 and B = 0; cA(1, 0), the contribution when A = 1 and B = 0; and likewise cA(0, 1) and cA(1,
1). Consider the case cA(0, 0) = 0.1, cA(1, 0) = 0.4, cA(0, 1) = 0.3, and cA(1, 1) = 0.8. In this case, when B
= 0, the marginal benefit of changing A from 0 to 1 equals 0.3 (= 0.4 - 0.1), and it equals 0.5 (= 0.8 - 0.3)
when B = 1. Thus, the marginal benefit of A is increasing in the level of B; A and B are complements.
Yet the NK model could quite as likely assign cA(1, 1) = 0.5. Now, the marginal benefit of changing A
from 0 to 1 when B = 1 is only 0.2 (0.5 - 0.3), less than the marginal benefit when B = 0. In this case, A
and B would be substitutes. Thus, given the stochastic determination of contributions – and thereby
implicitly of the types of interactions among activities – it is impossible to control what types of
interactions will be present in any given simulation run.
Appendix 2: Complementarity and supermodularity
Milgrom and Roberts define complementarity as follows: Let f(x, y, z) be a (benefit) function where z
is a vector of variables. The variables x and y are complements, if f is supermodular, i.e., has the
following property:
f(x”, y”, z) – f(x’, y”, z) ≥ f(x”, y’, z) – f(x’, y’, z) (1)
for all x” > x’, y” > y’ (2)
and all values of z (3)
Complementarity is, thus, defined to occur when increasing the variable x from its lower level x’ to
the higher level x” is more beneficial when the second variable y is at the higher level y” than at the lower
level y’. Condition (2) states that this relationship between x and y has to hold at all levels of x and y.
Condition (3) requires that this relationship hold for all values of all the other variables z. Only if the
above conditions hold for all pairs of variables (between x, y, and z and among the variables constituting
z), does the set of variables {x, y, z} form a system of complements. 9
9 For clarity, we chose to unpack the definition given by Milgrom and Roberts (1990: 516): “A function f: —n → — is supermodular if for all a, a’∈ —n, f(a) + f(a’) ≤ f(min(a, a’)) + f(max(a, a’)).” Rewrite a, a’ as: a = (x’, y”, z) and a’ = (x”, y’, z) with x’, x”, y’, y”∈ — and z ∈ —n-2. Since the above definition of supermodularity has to hold for all vectors a, a’, consider a and a’ that fulfill: x” > x’ and y” > y’ (our condition (2)) for any z ∈ —n-2 (our condition (3)). Then max(a, a’) = (x’’, y’’, z) and min(a, a’) = (x’, y’, z). Substituting into the above definition, yields: f(x’, y”, z) + f(x”, y’, z) ≤ f(x’, y’, z) + f(x”, y”, z) which can be re-written as f(x”, y”, z) – f(x’, y”, z) ≥ f(x”, y’, z) – f(x’, y’, z) (our condition (1)).
32

Translated into our activity terminology, each variable corresponds to an activity, while x’, x”, etc.
are different configurations of activity x. Note that the Milgrom and Roberts framework requires that the
possible choices for each activity can be ordered, e.g., small vs. large investments in flexible machinery.
All statements of activity “levels” are thus to be understood with respect to such an order.
Appendix 3: Complementarity and contextual interactions
The following example illustrates the concept of contextuality while revealing the restrictiveness of
the complementarity conditions. Consider the case of three activities A, B and C. Each activity can be
configured in two ways, which we denote by 0 and 1. Hence, the firm can consider eight possible
combinations of ABC: 000, 001, … , 111. We normalize the payoff of the combination 000 to be zero.
Figure A1 displays a case in which A, B and C are complements. In this case, changing one and only one
activity from 0 to 1 yields a benefit of 1, changing two activities yields a benefit of 3, and changing all
three activities yields a benefit of 6. Thus, the payoffs of the eight combinations are given as follows:
Π(000) = 0; Π(100) = Π(010) = Π(001) = 1; Π(110) = Π(101) = Π(011) = 3; Π(111) = 6. To check the
complementarity between A and B, for instance, note that changing A from 0 to 1 is more beneficial if B
is at its higher level 1 rather than at 0. Similarly, changing B from 0 to 1 is more beneficial if A is at its
higher level of 1 rather than at 0. Moreover, note that these relationships hold regardless of the level of C.
For C = 0:
A’s marginal benefit is larger at the higher level of B:
2 = Π(110) – Π(010) > Π(100) – Π(000) = 1
B’s marginal benefit is larger at the higher level of A:
2 = Π(110) – Π(100) > Π(010) – Π(000) = 1
Similarly for C = 1: 3 = Π(111) – Π(011) > Π(101) – Π(001) = 2
3 = Π(111) – Π(101) > Π(011) – Π(001) = 2
Similar calculations reveal that the interactions between activities A and C as well as between B and
C are always complementary. Now consider a single modification to the payoff structure: Assume that
changing all three activities yields a benefit of 4 rather than 6, i.e., Π(111) = 4; changing all three
activities is still more beneficial than changing any two, but less so than previously. With this single
modification, all three interactions between A, B, and C become contextual. Consider, for instance, A and
B. When C is at 0, A and B are still complements, yet when C is at 1, A and B are now substitutes.
For C = 0: payoffs are as given above.
33

For C = 1:
A’s marginal benefit is smaller at the higher level of B:
1 = Π(111) – Π(011) < Π(101) – Π(001) = 2
B’s marginal benefit is smaller at the higher level of A:
1 = Π(111) – Π(101) < Π(011) – Π(001) = 2
The same relationships are found between A and C (both are complements if B = 0 and substitutes if B =
1) and between B and C (complements if A = 0 and substitutes if A = 1). Similar results are achieved for
other modifications of the payoff structure (e.g., changing Π(001) from 1 to 3 creates contextual
interactions between A and C, and B and C, while retaining the unconditional complementarity between
A and B). While not every modification to the payoff structure eliminates the generic complementarity
among A, B and C (e.g., increasing Π(111) to 7 leaves the unconditional complementarity intact), the
strict conditions required by complementarity are easily violated, creating contextual interactions.
Figure A1. Complementary interactions
Π = 1
000 100
001 101
010 110
011 111
A
B
C
Π = 0 Π = 1
Π = 1 Π = 3
Π = 3
Π = 3
Π = 6
Each activity A, B, and C can be configured in two ways, 0 and 1. Each vertex of the cube represents one of the eight different possible combinations. The payoff associated with each combination is given next to each vertex.
34

References
Athey, S. & Schmutzler, A. 1995. Product and process flexibility in an innovative environment. RAND Journal of Economics, 26: 557-574.
Athey, S. & Stern, S. 1998. An empirical framework for testing theories about complementarity in organizational design. NBER, Cambridge, MA.
Athey, S. & Stern, S. 2002. The impact of information technology on emergency health care outcomes. RAND Journal of Economics, 33: 399-432.
Bagwell, K. & Ramey, G. 1994. Coordination economies, advertising, and search behavior in retail markets. American Economic Review, 84: 498-517.
Bhakta, M., Bhattacharjee, D., Dogra, D., Halady, P., Mudbhary, P., & Thohan, S. 2006. Urban Outfitters Inc. Evolution of Fit. Wharton School, Philadelphia.
Black, S. E. & Lynch, L. M. 2001. How to compete: The impact of workplace practices and information technology on productivity. Review of Economics and Statistics, 83: 434-445.
Bresnahan, T. F., Brynjolfsson, E., & Hitt, L. M. 2002. Information technology, workplace organization, and the demand for skilled labor: Firm-level evidence. Quarterly Journal of Economics, 117: 339-376.
Cappelli, P. & Neumark, D. 2001. Do "high-performance" work practices improve establishment-level outcomes? Industrial and Labor Relations Review, 54: 737-775.
Caroli, E. & Van Reenen, J. 2001. Skill-biased organizational change? Evidence from a panel of British and French establishments. Quarterly Journal of Economics, 116: 1449-1492.
Cassiman, B. & Veugelers, R. 2006. In search of complementarity in innovation strategy: Internal R&D and external knowledge acquisition. Management Science, 52: 68-82.
Caves, R. E. & Porter, M. E. 1977. From entry barriers to mobility barriers. Quarterly Journal of Economics, 91: 241-261.
Chandler, A. D., Jr. 1962. Strategy and Structure: Chapters in the History of Industrial Enterprise. Cambridge, MA: MIT Press.
Chen, Y. & Gazzale, R. 2004. When does learning in games generate convergence to Nash equilibria? The role of supermodularity in an experimental setting. American Economic Review, 94: 1505-1535.
Colombo, M. G. & Mosconi, R. 1995. Complementarity and cumulative learning effects in the early diffusion of multiple technologies. Journal of Industrial Economics, 43: 13-48.
de Groote, X. 1994. Flexibility and marketing/manufacturing coordination. International Journal of Production Economics, 36: 153-167.
Dierickx, I. & Cool, K. 1989. Asset stock accumulation and sustainability of competitive advantage. Management Science, 35: 1504-1513.
Drazin, R. & Van de Ven, A. H. 1985. Alternative forms of fit in contingency theory. Administrative Science Quarterly, 30: 514-539.
Ethiraj, S. K. & Levinthal, D. A. 2004a. Bounded rationality and the search for organizational architecture: An evolutionary perspective on the emergence of organizational forms and their evolvability. Administrative Science Quarterly, 49: 404-437.
35

Ethiraj, S. K. & Levinthal, D. A. 2004b. Modularity and innovation in complex systems. Management Science, 50: 159-173.
Fierman, J. 1995. It's 2 a.m., let's go to work. Fortune: 82.
Fleming, L. & Sorenson, O. 2001. Technology as a complex adaptive system: Evidence from patent data. Research Policy, 30: 1019-1039.
Gavetti, G. & Levinthal, D. 2000. Looking forward and looking backward: Cognitive and experiential search. Administrative Science Quarterly, 45: 113-137.
Ghemawat, P. & Levinthal, D. 2000. Choice structures and business strategy. Harvard Business School, Boston.
Hammond, J. H. 1993. Quick response in retail/manufacturing channels. In J. Hausman & R. Nolan (Eds.), Globalization, Technology, and Competition: 185-214. Boston: Harvard Business School Press.
Hatten, K. J. & Schendel, D. E. 1977. Heterogeneity within an industry: Firm conduct in the U.S. brewing industry, 1952-1971. Journal of Industrial Economics, 26: 97-113.
Henderson, R. M. & Clark, K. B. 1990. Architectural innovation: The reconfiguration of existing product technologies and the failure of established firms. Administrative Science Quarterly, 35: 9-30.
Henderson, R. M. 1993. Underinvestment and incompetence as responses to radical innovation: Evidence from the photolithographic alignment equipment industry. RAND Journal of Economics, 24: 248-270.
Henricks, M. 1995. Making Liz first. Apparel Industry Magazine, 56(9): 28.
Hitt, L. M. & Brynjolfsson, E. 1997. Information technology and internal firm organization: An exploratory analysis. Journal of Management Information Systems, 14: 81-101.
Holmström, B. & Milgrom, P. R. 1994. The firm as an incentive system. American Economic Review, 84: 972-991.
Ichniowski, C., Shaw, K., & Prennushi, G. 1997. The effects of human resource management practices on productivity: A study of steel finishing lines. American Economic Review, 87: 291-313.
Ichniowski, C. & Shaw, K. 1999. The effects of human resource management systems on economic performance: An international comparison of U.S. and Japanese plants. Management Science, 45: 704-721.
Kauffman, S. A. 1993. The Origins of Order: Self-Organization and Selection in Evolution. New York: Oxford University Press.
Khandwalla, P. N. 1973. Viable and effective organizational designs of firms. Academy of Management Journal, 16: 481-495.
Learned, E. P., Christensen, C. R., Andrews, K. R., & Guth, W. D. 1961. Business Policy: Text and Cases. Homewood, IL: Irwin.
Lenox, M., Rockart, S., & Lewin, A. 2006. Interdependency, competition and the distribution of firm and industry profits. Management Science, 52: 757-772.
Levinthal, D. A. 1997. Adaptation on rugged landscapes. Management Science, 43: 934-950.
Levinthal, D. A. & Warglien, M. 1999. Landscape design: Designing for local action in complex worlds. Organization Science, 10: 342-357.
36

MacDuffie, J. P. & Krafcik, J. F. 1992. Integrating technology and human resources for high-performance manufacturing: Evidence from the international auto industry. In T. Kochan & M. Useem (Eds.), Transforming Organizations: 209-226. New York: Oxford University Press.
MacDuffie, J. P. 1995. Human resource bundles and manufacturing performance: Organizational logic and flexible production systems in the world automobile industry. Industrial and Labor Relations Review, 48: 197-221.
MacDuffie, J. P. & Siggelkow, N. 2002. Contextuality within flexible production systems: Evidence from automobile assembly. Wharton School, University of Pennsylvania, Philadelphia, PA.
Marengo, L., Dosi, G., Legrenzi, P., & Pasquali, C. 2000. The structure of problem-solving knowledge and the structure of organizations. Industrial and Corporate Change, 9: 757-788.
McKelvey, B. 1999. Avoiding complexity catastrophe in coevolutionary pockets: Strategies for rugged landscapes. Organization Science, 10: 294-321.
Milgrom, P. R. & Roberts, J. 1990. The economics of modern manufacturing: Technology, strategy, and organization. American Economic Review, 80: 511-528.
Milgrom, P. R., Qian, Y., & Roberts, J. 1991. Complementarities, momentum, and the evolution of modern manufacturing. American Economic Review, 81: 84-88.
Milgrom, P. R. & Shannon, C. 1994. Monotone comparative statics. Econometrica, 62: 157-180.
Milgrom, P. R. & Roberts, J. 1995. Complementarities and fit: Strategy, structure, and organizational change in manufacturing. Journal of Accounting and Economics, 19: 179-208.
Milgrom, P. R., Roberts, J., & Athey, S. 1996. Monotone methods for comparative statics analysis. Stanford University.
Mohnen, P. & Röller, L.-H. 2005. Complementarities in innovation policy. European Economic Review, 49: 1431-1450.
Nelson, R. R. & Winter, S. G. 1982. An Evolutionary Theory of Economic Change. Cambridge, MA: Harvard University Press.
Pettigrew, A. M., Whittington, R., Melin, L., Sanchez-Runde, C., Van den Bosch, F. A. J., Ruigrok, W., & Numagami, T. (Eds.). 2003. Innovative forms of organizing. London: Sage.
Porter, M. E. 1985. Competitive Advantage. New York: Free Press.
Porter, M. E. 1996. What is strategy? Harvard Business Review, 74(6): 61-78.
Porter, M. E. & Rivkin, J. W. 1998. Activity systems as barriers to imitation. Harvard Business School, Boston, MA.
Rivkin, J. W. 2000. Imitation of complex strategies. Management Science, 46: 824-844.
Rivkin, J. W. 2001. Reproducing knowledge: Replication without imitation at moderate complexity. Organization Science, 12: 274-293.
Rivkin, J. W. & Siggelkow, N. 2003. Balancing search and stability: Interdependencies among elements of organizational design. Management Science, 49: 290-311.
Schaefer, S. 1999. Product design partitions with complementary components. Journal of Economic Behavior and Organization, 38: 311-330.
Siggelkow, N. 2001. Change in the presence of fit: The rise, the fall, and the renaissance of Liz Claiborne. Academy of Management Journal, 44: 838-857.
37
Siggelkow, N. 2002a. Misperceiving interactions among complements and substitutes: Organizational consequences. Management Science, 48: 900-916.
Siggelkow, N. 2002b. Evolution toward fit. Administrative Science Quarterly, 47: 125-159.
Siggelkow, N. & Levinthal, D. A. 2003. Temporarily divide to conquer: Centralized, decentralized, and reintegrated organizational approaches to exploration and adaptation. Organization Science, 14: 650-669.
Siggelkow, N. & Levinthal, D. A. 2005. Escaping real (non-benign) competency traps: Linking the dynamics of organizational structure to the dynamics of search. Strategic Organization, 3: 85-115.
Siggelkow, N. & Rivkin, J. W. 2005. Speed and search: Designing organizations for turbulence and complexity. Organization Science, 16: 101-122.
Siggelkow, N. & Rivkin, J. W. 2006. When exploration backfires: Unintended consequences of multi-level organizational search. Academy of Management Journal, 49: 779-795.
Sirri, E. & Tufano, P. 1998. Costly search and mutual fund flows. Journal of Finance, 53: 1589-1622.
Sorenson, O. 1997. The complexity catastrophe in the computer industry: Interdependence and adaptability in organizational evolution. Stanford University, Stanford.
Sorenson, O. 2002. Interorganizational complexity and computation. In J. A. C. Baum (Ed.), Companion to Organizations: 664-685. Oxford: Blackwell.
Sorenson, O., Rivkin, J. W., & Fleming, L. 2006. Complexity, networks and knowledge flow. Research Policy, 35: 994-1017.
Teece, D. J. 1986. Profiting from technological innovation: Implications for integration, collaboration, licensing and public policy. Research Policy, 15: 285-305.
Thompson, J. D. 1967. Organizations in Action. New York: McGraw-Hill.
Topkis, D. M. 1978. Minimizing a submodular function on a lattice. Operations Research, 26: 305-321.
Topkis, D. M. 1995. Comparative statics of the firm. Journal of Economic Theory, 67: 370-401.
Tripsas, M. 1997. Unraveling the process of creative destruction: Complementary assets and incumbent survival in the typesetter industry. Strategic Management Journal, 18(Summer Special Issue): 119-142.
Vives, X. 2005. Complementarities and games: New developments. Journal of Economic Literature, 43: 437-479.
Whittington, R., Pettigrew, A., Peck, S., Fenton, E., & Conyon, M. 1999. Change and complementarities in the new competitive landscape: A European panel study, 1992-1996. Organization Science, 10: 583-600.
Wright, S. 1931. Evolution in Mendelian populations. Genetics, 16: 97-159.
38
Related Documents