Statistics Context Data Variation

Context Data Variation. Max Min Median Q1 Q3 Range Mean Mode IQR Sum n.
Dec 26, 2015
Welcome message from author
This document is posted to help you gain knowledge. Please leave a comment to let me know what you think about it! Share it to your friends and learn new things together.
Transcript

StatisticsContext
DataVariation

Max Min Median Q1 Q3 Range Mean Mode IQR Sum n
5 number summary

Write the data in sentences Write the explanation in paragraph format Context, use it before or after the
explanation. CUSS- Center, Unusual, shape, spread.
Write up

Box and Whiskers

Box and Whiskers

Pair up

Find the mean, median, and mode of the following collection.
15, 11, 19, 15, 14, 13, 17, 11, 12, 17, 15, 14, 15

1. Find the mean, median, mode, and range of the following collection of scores on a test.
32, 72, 81, 95, 98, 58, 77, 75, 83, 97, 45, 89, 93, 57, 82, 97, 52, 75, 79, 78, 99, 98, 54, 75, 85, 61, 55, 86

Find the first, second, and third quartiles of the collection of data in Exercise 1.
32, 72, 81, 95, 98, 58, 77, 75, 83, 97, 45, 89, 93, 57, 82, 97, 52, 75, 79, 78, 99, 98, 54, 75, 85, 61, 55, 86

Construct a box-and-whisker plot of the collection of data

Complete #1-3 for the following set of data. The weights (in pounds) of eleven children are as follows: 39, 52, 40, 45, 46, 55, 48, 40, 43, 47, 44
With a partner

At a car dealership, the number of new cars sold in a week by each salesperson was as follows: 5, 8, 2, 0, 2, 4, 7, 4, 1, 1, 2, 2, 0, 1, 2, 0, 1, 3, 3, 2
Organizing Data

5, 8, 2, 0, 2, 4, 7, 4, 1, 1, 2, 2, 0, 1, 2, 0, 1, 3, 3, 2
Number, Tally, Frequency
a. Construct a frequency distribution for this data.

5, 8, 2, 0, 2, 4, 7, 4, 1, 1, 2, 2, 0, 1, 2, 0, 1, 3, 3, 2
Construct a line plot for this data

5, 8, 2, 0, 2, 4, 7, 4, 1, 1, 2, 2, 0, 1, 2, 0, 1, 3, 3, 2
Construct a bar graph that shows the number of salespeople who sold 0-8 cars.

Twenty-eight students in a class were asked how many cars their family owned. The results were as follows:
2, 2, 3, 2, 1, 2, 2, 4, 3, 2, 0, 1, 0, 1, 1, 2, 2, 3, 2, 3, 3, 5, 1, 1, 3, 0, 1, 2
Construct a frequency distribution and a line plot for this data.
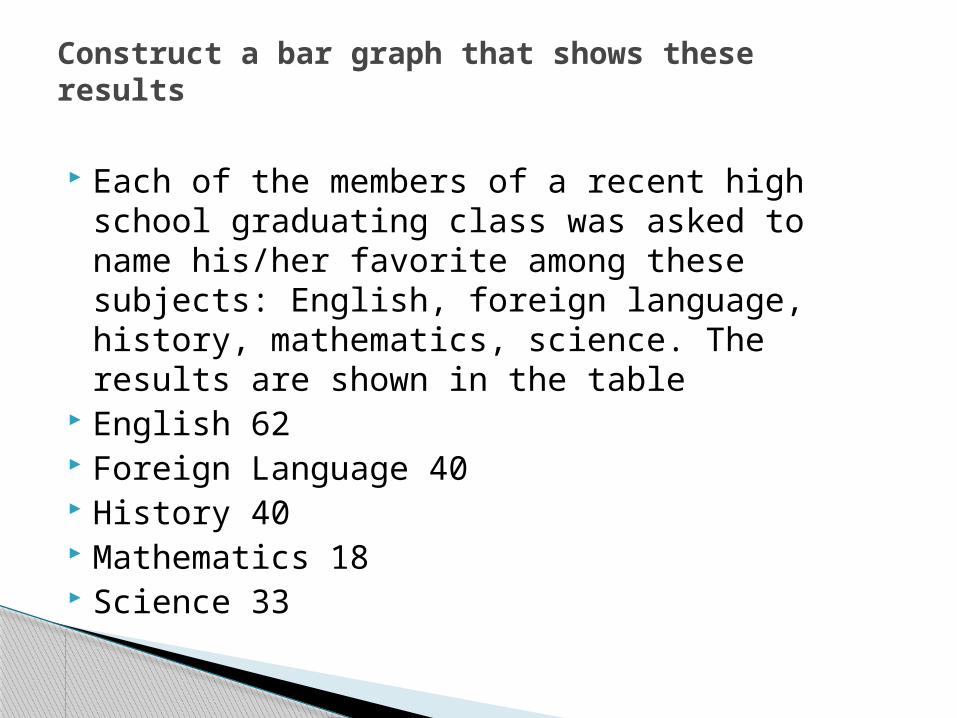
Each of the members of a recent high school graduating class was asked to name his/her favorite among these subjects: English, foreign language, history, mathematics, science. The results are shown in the table
English 62 Foreign Language 40 History 40 Mathematics 18 Science 33
Construct a bar graph that shows these results

63, 52, 84, 83, 51, 32, 58, 35, 45, 41, 65, 75, 59, 67, 25, 46
A stem-and-leaf plot orders data in increasing or decreasing order.
Construct a stem-and-leaf plot for the unordered data

1.Construct and label a horizontal number line that is scaled to contain all of the values of the variable of interest.2. Construct and label a vertical axis so that the greatest frequency can be represented.
3. Construct the bars of equal width that are centered above each value. The heights of the bars represent the frequencies of the values.
Histograms

15, 59, 66, 42, 48, 23, 70, 81, 35, 51, 68, 29, 77, 92, 85, 16, 37, 59, 61, 76, 40, 25, 86, 11, 34, 52, 16, 22, 89, 55, 47, 39, 27, 42, 46, 51, 24, 69, 78, 91, 90, 65
Construct a stem-and-leaf plot for the data

15, 59, 66, 42, 48, 23, 70, 81, 35, 51, 68, 29, 77, 92, 85, 16, 37, 59, 61, 76, 40, 25, 86, 11, 34, 52, 16, 22, 89, 55, 47, 39, 27, 42, 46, 51, 24, 69, 78, 91, 90, 65
Construct a histogram for the above data.

Graph a box plot for the following test scores: {90, 80, 96, 54, 80, 95, 100, 75, 87, 62, 65, 85, 92, 87, 74, 89}
Draw a stem and leaf plot for the data
Box plot and stem and leaf plot

Explain the shape in the context of the problem! For example, consider a distribution of grades which is skewed to the right and has a median score of 70. Do not write "The distribution is skewed to the right." Instead write "Many students had scores close to 70, but a few students scored much higher."
Write up with Context
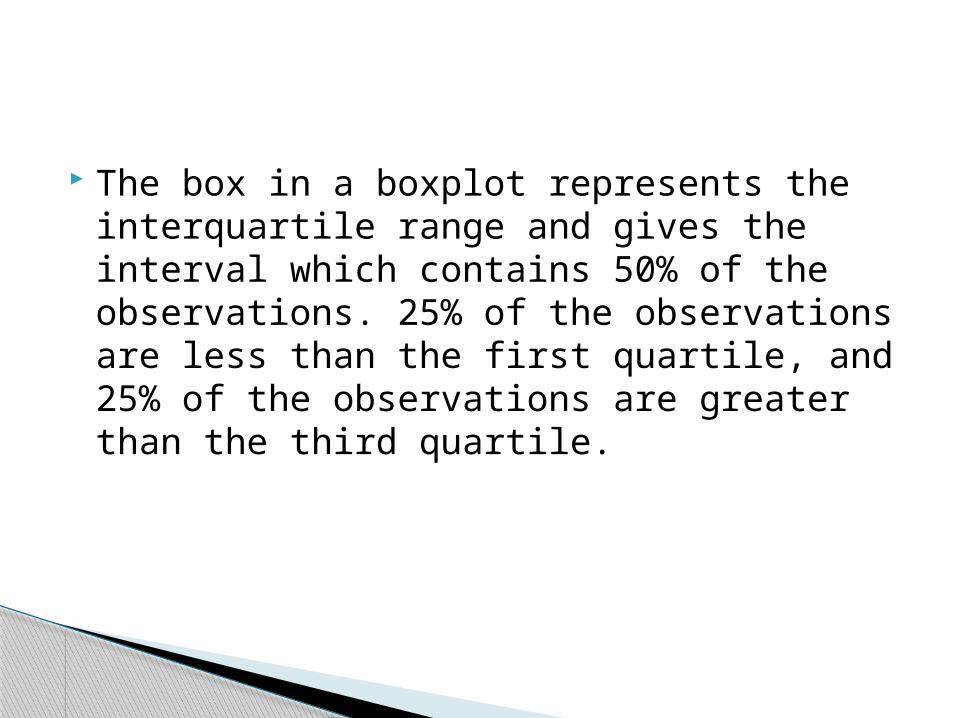
The box in a boxplot represents the interquartile range and gives the interval which contains 50% of the observations. 25% of the observations are less than the first quartile, and 25% of the observations are greater than the third quartile.

at a school field day, 50 students and 50 faculty members each completed an obstacle course.
Descriptive statistics for the completion times (in minutes) for the two groups are shown below:

Use the same scale to draw boxplots for the completion times for students and for faculty members.
(b) Write a few sentences comparing the variability of the two distributions.
(c) You have been asked to report on this event for the school newspaper. Write a few sentences describing student and faculty performances in this competition for the paper.
Task

Five hundred randomly selected middle-aged men and five hundred randomly selected young adult men were rated on a scale from 1 to lO on their physical flexibility, with 10 being the most flexible. Their ratings appear in the frequency table below. For example, 17 middle-aged men had a flexibility rating of 1
TASK


Display these data graphically so that the flexibility of middle-aged men and young adult men can be easily compared.
Based on an examination of your graphical display, write a few sentences comparing the flexibility of middle-aged men with the flexibility of young adult men
Related Documents