I » .1 CONTENTS Units Page No. 1. Capital-Market; Securities Markets 1 \ 2, Risk and Return 35 3. An Introduction to Portfolio Management 93 \ 4. Evaluation of Portfolio Performance ' 156 4 /

Welcome message from author
This document is posted to help you gain knowledge. Please leave a comment to let me know what you think about it! Share it to your friends and learn new things together.
Transcript

I
»
.1
CONTENTSUnits Page No.
1. Capital-Market; Securities Markets 1\
2, Risk and Return 35
3. An Introduction to Portfolio Management 93\
4. Evaluation of Portfolio Performance ' 156
4
/

Securily Analysis and . Investment Management
• differentiate between stock exchange and new issue markets.• describe the structure, functioning and limitations.• discuss about the SEBI and its guidelines.• define what is regulatory mechanism.NOTES
\
1.1 INTRODUCTIONI
_^This section provides the necessary background for understanding different securities markets around the world and the changes that are occurring. The first part considers the general concept of a market and its function. The second part describes the characteristics that determine the quality of a particular market. The third part of the section describes primary and secondary capital markets and how they interact and depend on one another.A market is the means through which buyers and sellers are brought together to aid in the transfer of goods and/or services. Several aspects of this general definition seem worthy of emphasis. First, a market need not have a physical location. It is only necessary that the buyers and sellers can communicate regarding the relevant aspects of the transaction. Second, the market does not necessarily own the goods or services involved. For a good market, ownership is not involved; the important criterion is the smooth, cheap transfer of goods and services. In most financial markets, those who establish and administer the market- do not own the assets but simply provide a physical location or an electronic system that allows potential buyers and sellers to interact. They help the market function by providing information and facilities to aid in the transfer of ownership.
^Finally, a market can deal in any variety of goods and services. For any commodity or service with a diverse clientele, a market should evolve to aid in the transfer of that commodity or service. Both buyers and sellers will benefit from the existence of a smooth functioning market. ^
A.2 primary capital markets\.
^The primary market is where new issues of bonds, preferred stock, or common stock are sold by government units, municipalities, or companies to acquire new capital.
Government Bond IssuesAll U.S, government bond issues are subdivided into three segments based on their original maturities. Treasury bills are negotiable, non-interest-bearing
Self-Instructional 'Material2

securities with original maturities of one year or less. Treasury notes have original maturities of 2 to 10 years. Finally, Treasury bonds have original maturities of more than 10 years. To sell bills, notes, and bonds, the Treasury relies on Federal Reserve System auctions.
Capital Market: Securities Markets
NOTESMunicipal Bond IssuesNew municipal bond issues are sold by one of three methods: competitive bid, negotiation, or private placement. Competitive bid sales typically involve sealed bids. The bond issue is sold to the bidding syndicate of underwriters that submits the bid with the lowest interest cost in accordance with the stipulations set forth by the issuer. Negotiated sales involve contractual arrangements between underwriters and issuers wherein the underwriter helps the issuer prepare the bond issue and set the price and has the exclusive right to sell the issue. Private placements involve the sale of a bond issue by the issuer directly to an investor or a small group of investors (usually institutions).
Note that two of the three methods require an underwriting function. Specifically, in a competitive bid or a negotiated transaction, the investment banker typically underwrites the issue, which me:..is the investment firm purchases the entire issue at a specified price, relieving the issuer from the risk and responsibility of selling and distributing the bonds. Subsequently, the underwriter sells the issue to the investing public. For municipal bonds, this underwriting function is performed by both investment banking firms and commercial banks.
The underwriting function can involve three services: origination, risk bearing, and distribution. Origination involves the design of the bond issue and initial planning. To fulfill the riskbearing function, the underwriter acquires the total issue at a price dictated by the competitive bid or through negotiation and accepts the responsibility and risk of reselling it for more than the purchase price. Distribution means selling it to investors, typically with the help of a selling syndicate that includes other investment banking firms and/ or commercial banks.
In a negotiated bid, the underwriter will carry out all three services. In a competitive bid, the issuer specifies the amount, maturities, coupons, and call features of the issue and the competing syndicates submit a bid for the entire issue that reflects the jdelds they estimate for the bonds. The issuer may have received advice from an investment firm on the • desirable characteristics for a forthcoming issue, but this advice would have been on a fee basis and would not necessarily involve the ultimate underwriter who is responsible for risk bearing and distribution. Finally, a private placement involves no risk bearing, but an investment banker could assist in locating potential buyers and negotiating the characteristics of the issue.'" .
Self-Instructional Material 3

Security Analynie and Investment Management
Corporate Bond IssuesCorporate bond issues are almost always sold through a negotiated arrangement with an investment banking firm that maintains a relationship with the issuing firm. In a global capital market that involves an explosion of new instruments, the origination function, which involves the design of the security in terms of characteristics and currency, is becoming more important because the corporate chief financial officer (CFO) will, probably not be completely familiar with the availability and issuing requirements of many new instruments and the alternative capital markets around the world. Investment banking firms compete for underwriting business by creating new instruments that appeal to existing investors and by advising issuers regarding desirable countries and currencies. As a result, the expertise" of the investment banker can help reduce the issuer’s cost of new capital.
NOTES
Corporate Stock IssuesIn addition to the ability to issue fixed-income securities to get new capital, corporations can also issue equity securities—generally common stock. For corporations, new. stock issues are typically divided into two groups:(1) seasoned equity issues and (2) initial public offerings (IPOs).
Seasoned equity issues are new shares offered by firms that already have stock outstanding. An example would be General Electric, which is a large, well-regarded firm that has had public stock trading on the NYSE for over 50 years. If General Electric decided that it needed new capital, it could sell additional shares of its common stock to the public at a price very close to the current price of the firm’s stock.
Initial public offerings (IPOs) involve a firm selling its common stock to the public for the first time. At the time of an IPO offering, there is no existing public market for the stock, that is, the company has been closely held. An example would be an IPO by Polo Ralph Lauren in 1997, at $26 per ' share. The company is a leading manufacturer and distributor of men’s clothing. The purpose of the offering was to get additional capital to expand its operations.
New issues (seasoned or IPOs) are typically underwritten by investment bankers, who acquire the total issue from the company and sell the securities to interested investors. The underwriter gives advice to the corporation on the general characteristics of the issue, its pricing, and the timing of the offering. The underwriter also accepts the risk of selling the new issue after acquiring it from the corporation.
r
Self-Instructional Material4

Capital Market: Securities Markets1.3 SECONDARY FINANCIAL MARKETS
In this section, we consider the purpose and importance of secondary markets and provide an overview of the secondary markets for bonds, financial futures, and stocks. Next, we consider national stock markets around the world. Finally, we discuss regional and over-the-counter stock markets and provide a detailed presentation on the functioning of stock exchanges.Secondary markets permit trading in outstanding issues; that .is, stocks or bonds already sold to the public are traded between current and potential owners. The proceeds from a sale in the secondary market do not go to the issuing unit (the government, municipality, or company) but, rather, to the current owner of the security.
A -
Why Secondary Markets are Important?Before discussing the- various segments of the secondary market, we must consider its overall importance. Because the secondary market involves the trading of securities initially sold in the primary market, it provides liquidity to the individuals who acquired these securities. After acquiring securities in the prim^ary market, investors want the ability to sell them again to acquire other securities, buy a house, or go on a vacation. The primary market benefits greatly from the liquidity provided by the secondary market because investors would hesitate to acquire securities in the primary market if they thought they could not subsequently sell them in the secondary market. That is, without an active secondary market, potential issuers of stocks or bonds in the primary market would have to provide a much higher rate of return to compensate investors for the substantial liquidity risk.Secondary markets are also important to those selling seasoned Securities because the prevailing market price of the securities is determined by transactions in the secondary market. New issues of outstanding stocks or bonds to be sold in the primary market are based on prices and yields in the secondary market. Even forthcoming IPOs are priced based on the prices and values of comparable stocks or bonds in the public secondary market.
NOTES
Secondary Bond MarketsThe secondary market for bonds distinguishes among those issued by the federal government, municipalities, or corporations.• Secondary Markets for U.S. Government and Municipal Bonds U.S.
government bonds are traded by bond dealers that specialize in either Treasviry bonds or agency bonds^Treasury issues are bought or sold through a set of 35 primary dealers, including large banks in New York and Chicago and some of the large investment banking firms (for example, Merrill
\ • v*
Self-Instructional Material 5

Lynch, Goldman Sachs, Morgan Stanley). These institutions and other firms also make markets for government agency issues, but there is no formal set of dealers for agency securities. The major market makers in the secondary municipal bond market are banks and investment firms. Banks are active in municipal bond trading and underwriting of general obligation issues'since they invest heavily in these securities. Also, many large investment firms have municipal bond departments that underwrite and trade these issues.
. • Secondary Corporate Bond Markets Historically, the secondary market for corporate bonds included two major segments; security exchanges and
■ an Over-the-Counter (OTC) market. The major exchange for corporate bonds was the NYSE Fixed-Income Market where about 10 percent of the trading took place. In contrast, about 90 percent of trading, including all large transactions, took place on the over-the-counter market. This mix of • trading changed in early 2001 when the NYSE announced that it was shutting down its Automated Bond System (ABS), which had been a fully
. automated trading and information system for small bond trades—that is, the exchange,^ market for bonds was considered the “odd-lot” bond market. As a result, currently all corporate bonds are traded over the
■ counter by dealers who buy and sell for their own accounts.
The major bond 'dealers are the large investment banking firms that underwrite the issues such as Merrill Lynch, Goldman Sachs, Salomon Brothers, Lehman Brothers, and Morgan Stanley. Because of the limited trading in corporate bonds compared to the fairly active trading in government bonds, corporate bond dealers do not carry extensive inventories of specific issues. Instead, they hold a limited .number of bonds desired by their clients and, when someone wants to do a trade, they work more like brokers than dealers.
Security Analysta and Investment Management
NOTES
Third MarketAs mentioned, the term third market describes OTC trading of,shares listed on an exchange. Although most transactions in listed stocks take place on an exchange, an investment firm that is not a member of an exchange can make a market in a listed stock. Most of the trading on the third market is in well-known stocks such as General Electric, IBM, and Merck. The success or failure of the third market depends on whether the OTC market in these stocks is as good as the exchange market ahd whether the relative cost of the OTC transaction compares favourably with the cost on the exchange. This market is critical during the relatively few periods when trading is not available on the NYSE either because trading is suspended or the exchange is closed.
Self-Instructional Material6

Capilal Market: Securities Markets
Fourth Marketv"
... ■ The term fourth market describes direct trading of securities between two parties with no broker intermediary. In almost all cases, both parties involved are institutu-us. When you think about it, a direct transaction is really not that un”::v-al. If you own 100 shares of AT&T Corp. and decide to sell it, there is nothing wrong with simply offering it to your friends or associates at a mutually agreeable price (for example, based on exchange transactions) and making the transaction directly.
NOTES
1.4 COMMON STOCK VERSUS PREFERRED STOCK
Common stocks are also called equity securities. Equity securities represent an ownership interest in a corporation. Holders of equity securities are entitled to the earnings of the corporation when those,earnings are distributed in the form of dividends', they are also entitled to a pro rata share of the remaining equity in case of liquidation.
Common stock is only one type of-^quity security. Another type is preferred stock. The key distinction between the two forms of equity securities is the degree to which their holders may participate in any distribution of earnings and capital and the priority given to each class in the distribution of earnings. Typically, preferred stockholders are entitled to a fixed dividend, which they receive before common stockholders may receive any dividends. Therefore, we refer to preferred stock as a senior corporate security, in the sense that preferred stock interests are senior to the interests of common stockholders.
1.5 WHERE STOCK TRADING OCCURS?
Investors express their opinions about the economic prospects of a company through the trades they make in the market for common stock. The aggregate of these trades provides the market consensus opinion of the price of the stock. In the United States, secondary market trading in common stocks occurs in two different ways. The first is on organized exchanges, which are specific geographical locations called trading floors, where representatives of buyers and sellers physically meet. The trading mechanism on exchanges is the auction system, characterized by the presence of many competing buyers and sellers assembled in one place.
The second type is via Over-the-Counter (OTC) trading, which results' from geographically dispersed traders or market-makers linked to one another via telecommunication systems. That is, there is no trading floor. This trading
Self-Instructional Material 7

Sec-urity Analysis and ' mechanism IS a negotiated system whereby individual buyers negotiate with individual sellers.
Exchange markets are called central auction specialist systems and OTC markets are called multiple market maker systems. In recent years a new method of trading common stocks via independently owned and operated Electronic Communications Networks (ECNs) has developed and is growing quickly.
In the United States there are two national stock exchanges: (1) the New York Stock Exchange (NYSE), commonly called the “Big Board,” and (2) the American Stock Exchange (AMEX or ASE); called the “Curb,” National stock exchanges trade stocks of both U.S. and non- U.S. corporations. In addition to the national exchanges, there are regional stock exchanges in Boston, Chicago (called the Midwest Exchange), Cincinnati, San Francisco (called the Pacific Coast Exchange) and Philadelphia. Regional exchanges primarily trade stocks from corporations based within their geographic region.
The major OTC market in the U.S. is Nasdaq (the National Association of Securities Dealers Automated Quotation System), which is owned and operated by the NASD (the National Association of Securities Dealers), although it is in the process of becoming independent. The NASD is a securities industry Self-Regulatory Organization (SRO) that operates subject to the oversight of the Securities and Exchange Commission (SEC). Nasdaq is a national market. During 1998, Nasdaq and AMEX merged to form the Nasdaq-AMEX Market Group, Inc. The NYSE is the largest exchange in the world with the sh^es of approximately 3,000 companies listed. The AMEX is the second largest national stock exchange in the U.S., with over 750 issues listed for trading.
Nasdaq has a greater number of listed stocks but with much lower market capitalization than the NYSE. According to. the Securities Act of 1934, there are two categories of traded stocks. The first is exchange traded stocks (also called “listed” stocks). The second is OTC stocks which are non-exchange traded stocks and are, thus, by inference, “non-listed.” However, as we describe later in this chapter, Nasdaq stocks have listing requirements (the Nasdaq National Market and the Nasdaq Small Capitalization Market). Thus, a • more useful and practical categorization of these categories is as follows:
1. Exchange listed stocks (national and regional exchanges)
2. Nasdaq listed OTC stocks
3. Non-Nasdaq OTC stocks
We focus on each of these markets later in this section. The four major types of markets on which stocks' are traded are referred to as follows:
• First Market—trading on exchanges of stocks listed on an exchange
• Second Market—trading in the OTC market of stocks not listed on an ' exchange
Investment Management
NOTES
Self-Instructional Material8

• Third Market—trading in the OTC market of stocks listed on an exchange,
• Fourth Market—private transactions between institutional investors who deal directly with each other without utilizing the services of a broker- dealer. inteirnediary
These types'of markets are discussed below.
Capital Market: Securities Markets
NOTES
^Exchanges ^ ^
Stock exchanges are formal organizations, approved and regulated by the SEC. They are comprised of “members” that use the exchange facilities and systems to exchange or trade “listed” stocks. These exchanges are physical locations where members assemble to trade. Stocks that are traded on an exchange are said to. be listed stocks, which means they are individually approved by the exchange for trading on the exchange. To be listed, a company must apply for and satisfy requirements established by the exchange for minimum capitalization, shareholder equity, average closing share price, and other criteria. Even after being listed, exchanges may delist a stock if it no longer meets the exchange requirements, j
To have the right to trade securities or m^e markets on an exchange floor, firms or individuals must become a member of the exchange, which is accomplished by buying a,seat on the exchange.
he NYSEe NYSE is organized as a centralized continuous auction market at a
designated location on the trading floor, called a “post,” with brokers representing the buy and sell orders of their customers. A single specialist is the market maker for each stock. A member firm may be designated as a specialist for the common stock of more than one company. While several stocks can trade at the same post, only one specialist is designated for the common stock of each listed company
/The Over-the-Counter MarketThe OTC market is called the market for “unlisted stocks”. As explained earlier, while there are listing requirements for exchanges, there are also “listing requirements” for the Nasdaq National and Small Capitalization OTC markets, discussed below. Nevertheless, exchange traded stocks are called “listed,” and stocks traded on the OTC markets are referred to as “unlisted”. ^
There ar^hree parts of the OTC market—two under the aegis of NASD (the
Nasdaq markets) and a third market for truly unlisted stocks, the non- Nasdaq OTC markets.
Self-Instructional Material 9

1-^asdaq Stock MarketSecurity Analysis and Inveatment Management
Nasdaq is essentially a telecommunication network linking thousands of geographically-disp’ersed market making participants. Nasdaq is an electronic quotation system providing price quotations to market participants on Nasdaq listed stocks. While there is no central trading floor, Nasdaq has become an electronic “virtual trading floor”!Vrhere are more than 4,700 common stocks with a total market value of ove^^3.5 trillion included in the Nasdaq system. Some 535 dealers, known as market makers, representing some of the world’s largest securities firms, provide competing bids to buy and offers to sell Nasdaq stocks to investors. The Nasdaq stock market has two broad tiers of •securities: (1) the Nasdaq National Market (NNM) and the Small Capitalization Market. Newspapers have separate sections for these two tiers of stocks (sections labeled the “Nasdaq National Market” and the “Nasdaq Small Capitalization Market”). The Nasdaq NMS is the dominant OTC market . in the U.S.
NOTES
kbird MarketA stock may be both listed on an exchange and also traded in the OTC market, called the third market. Like Nasdaq, the third market is a network of broker-dealers that aggregates quotation information and provides interparticipant order routing tools, but leaves order execution to market participants.toealers that make markets in the third market operate under the regulati^ jurisdiction of the NASD. While the third market is not owned
by the NASD, market makers in the third market use some of the facilities provided by Nasdaq. When the NASD created Nasdaq in 1971, it included substantially similar functionality for third market listed trading.
^Alternative Trading Systems
It is not necessary for the two parties to a transaction to use an intermediary, That is, the services of a broker or a dealer are not required to execute a trade. The direct trading of stocks between two customers without the use of a broker is called the fourth market. This market grew for the same reasons as the third market—excessively high minimum commissions established by exchanges. )
A number of proprietarymternative trading systems (ATSs), which comprise the fourth market, are operated by the NASD members or member affiliates. These fourth market ATSs are for-profit “broker’s brokers” that match investor orders and report trading activity to the marketplace via Nasdaq or the third market. In a sense, ATSs are similar to exchanges because they are designed to allow two participants to meet directly on the system and are maintained by a third party who also serves a limited regulatory function by imposing, requirements on subscribers. Broadly, there are two types of ATSs: electronic communications networks and crossing networks.
The Fourth Market
10 Self-Instructional Material

Capital Market: Securities Markets1.6 TRADING MECHANICS
Next we describe the key features involved in trading stocks. Later in the unit, we discuss trading arrangements {block trades and program trades) that developed specifically for coping with the needs of institutional investors.
NOTES
Types of Orders and Trading Priority RulesWhen an investor wants to buy or sell a share of common stock, the price and conditions under which the order is to be executed must be communicated to a broker. The simplest type of order is the market order, an order to be executed at the best price available in the market. If the stock is listed and traded on an organized exchange, the best price is assured by the exchange
, rule that when more than one order on the same side of the buy/sell transaction reaches the market at the same time, the order with the best price is given priority. Thus, buyers offering a higher price are given priority over those offering a lower price; sellers asking a lower price are given priority over those asking a higher price.
Another priority rule of exchange trading is needed to handle receipt of more than one order at the same price. Most often, the priority in executing such orders is based on the time of arrival of the order—first orders in are the first orders executed—although there may be a rule that gives higher priority to certain types of market participants over other types of market participants seeking to transact at the same price. For example, on exchanges, orders can be classified as either public orders or orders of those member firms'dealing for their own account (both nonspecialists and specialists). Exchange rules require that public orders be given priority over orders of member firms dealing for their own account.
The danger of a market order is that an adverse move may take place between the time the investor places the order and the time the order is executed. To avoid this danger, the investor can place a limit order that designates a price threshold for the execution of the trade. A buy limit order indicates that the stock may be purchased only at . the designated price or lower. A sell limit order indicates that the stock niay be sold only at the designated price or higher, 'fhe key disadvantage of a limit order is that there is no guarantee that it will be executed at all; the designated price may simply not be obtainable. A limit order that is not executable-at the time it reaches the market is recorded in the limit order book described earlier in this unit.
The limit order is a. conditional order. It is executed only if the limit price or a better price can be obtained. Another type of conditional order is the stop order, which specifies that the order is not to be executed until the
Self-Instructinnal Material 11

market moves to a designated price, at which time it becomes a market order, A buy stop order specifies that the order is not to be executed until the market rises to a designated price,- that is, until it trades at or above, or is bid at or above, the designated price. A sell stop order specifies that the order is not to be executed until the market price falls below a designated price— that is, until it trades at or below, or is offered at or below, the designated price. A stop order is useful when an investor .cannot constantly monitor the market. Profits can be preserved or losses minimized on a stock position by allowing market movements to trigger a trade. In a sell (buy) stop order, the designated price is lower (higher) than the current market price of the stock. In a sell (buy) limit order, the designated price is higher (lower) than the' current market price of the stock.
Security AnalysiK and Investment Management
NOTES
Short SellingShort selling involves the sale of a security not owned by the investor at the time of sale. The investor can arrange to have her broker borrow the stock from someone else, and the borrowed stock is delivered to implement the sale. To cover her short position, the investor must eventually purchase the stock and return it to the party that lent the stock.
Margin TransactionsInvestors can borrow cash to buy securities and use the securities themselves as collateral. For example, suppose Mr. Boxer has $10,000 to invest and is considering buying Wilson Steel, which is currently selling for $20 per share. With his $10,000, Mr. Boxer can buy 500 shares. Suppose his broker can arrange for him to borrow an additional $10,000 so that Mr. Boxer can buy an additional 500 shares. Thus, with a $20,000 investment, he can purchase a total of 1,000 shares. The 1,000 shares will be used as collateral for the $10,000 borrowed, and Mr. Boxer will have to pay interest on the amount borrowed.
A transaction in which ah investor borrows to buy shares using the shares themselves as collateral is called buying on margin. By borrowing funds, an investor creates financial leverage. Note that Mr. Boxer, for a $10,000 investment, realizes the consequences associated with a price change of 1,000 shares rather than 500 shares. Compared to borrowing no funds, he will • benefit if the price rises but be worse off if the price falls.
The funds borrowed to buy the additional stock w'ill be provided by the broker, who gets the money from a bank. The interest rate that banks charge brokers for these funds is the call money rate (also referred to as the broker- loan rate). The broker charges the borrower the call money rate plus a . service charge.
Self-Instructional Material12

Capital MarkH: Sevuritii'^ Markets
Margin RequirementsThe brokerage firm is not allowed to lend as much as it wishes to investors to buy securities. The Securities Exchange Act of 1934 prohibits brokers from lending more than a specified percentage of the market value of the securities. The initial margin requirement is the proportion of the total market value of the securities that the investor must pay as an equity share, and the remainder is borrowed from the broker. The 1934 act gives the Board of Governors of the Federal Reserve (the Fed) the responsibility to set initial margin requirements. The initial margin requirement is 50% as of this writing, but has been below 40%.
The Fed also establishes a maintenance margin requirement. This is the minimum proportion of (1) the equity in the investor’s margin account to (2) the total market value. If the investor’s margin account falls below the minimum maintenance margin (which may happen if the share price .fell substantially), the investor is required to put up additional cash. The investor receives a margin call from the broker specifying the additional cash to be put into ,the investor’s margin account. If the investor fails to put up the additional cash, the broker has. the authority to sell the securities in the investor’s account.
NOTES
Price Limits and CollarsTrading or price limits specify a minimum price below which the market index level may not decline due to an institutionally mandated termination of trading, at least at prices below the specified price (the price limit) for a specified period of time. For example, if the DJIA was trading at 11,000 and its price limit was 500 points below that, then no trades could occur below 10,500. This pause in trading is intended to “give the market a breather” to at least calm emotions. Trading limits had previously been used in the futures markets but not in the stock market. These price limits have been modified several times since their implementation soon after the stock market crash of 1987.
1.7 TRADING COSTS
A critical element in investment management is controlling the trading costs necessary to implement a strategy. While important, the measurement of trading, costs is very difficult.
We begin by defining trading costs. Trading costs can be decomposed into two major components; explicit cosis and implicit costs. Explicit costs are the' direct costs of trading, such as broker commissions, fees, and taxes. Implicit
■ ;Self-InstriK-tioiial Material 13

costs represent such indirect costs as the price impact of the trade and'the opportunity costs of failing, to execute in a timely manner or at all. Whereas explicit costs are associated with identifiable charges, no such reporting of implicit costs occurs.
Explicit CostsThe main explicit cost is the commission paid to the broker for execution. Commission costs are fully negotiable and vary systematically by broker type and market mechanism. The commission may depend on both the price per share and the number of shares in the transaction. In addition to commissions, there may be other explicit costs. These explicit costs include custodial fees (the fees charged by an institution holding securities in safekeeping. for an investor) and transfer fees (the fees associated with transferring an asset from one owner to another),
Security Analysis and Investment Management
NOTES
Implicit CostsImplicit trading costs include impact costs, timing costs, and opportunity costs.
Impact CostsThe impact cost of a transaction is the change in market price due to supply/ demand imbalances as a result of the trade. Bid-ask spread estimates,- although informative, fail to capture the fact that large trades—those that exceed the number of shares the market maker is willing to trade at the quoted bid and ask prices—may move prices in the direction of the trade. That is, large trades may increase the price for buy orders and decrease the price for sell orders. The resulting market impact or price impact of the transaction can be thought of as the deviation of the transaction price from the “unperturbed price” that would have prevailed had the trade not occurred. As discussed above, crossing networks are designed to minimize impact costs.
Timing CostThe timing cost is measured as the price change between the time the parties to the implementation process assume responsibility for the trade and the time they complete the responsibility. Timing costs occur when orders are on the trading desk of a buy side firm (e.g., an investment management firm), but have not been released to the broker because the trader fears that the trade may swamp the market.
Opportunity CostsThe opportunity cost is the “cost” of securities not traded. This cost results from missed or only partially completed trades. These costs are the natural
Self-Instructional Material14

consequence of the release delays. For example, if the price moves too much before the trade can be completed, the manager will not make the trade. In, practice, this cost is measured on shares not traded based on the difference between the market price at the time of. decision and the closing price 30 days later.
While commissions and impact costs are actual and visible out-of pocket costs, opportunity costs and timing costs are the costs of foregone opportunities and are invisible. Opportunity costs can arise for two reasons. First, some orders are executed with a delay, during which the price may move against the investor. Second, some orders incur an opportunity cost because they are only partially filled or are not executed at all.
Capital Market: Srcurilii'i Markeln
NOTES
Classilication of Trading CostsThus far we have classified four main trading costs—commissions, impact costs, timing costs, and opportunity costs-—as explicit or implicit trading costs. This categorization is based on whether or not the costs are identifiable accounting costs. Another categorization of these costs is execution costs versus opportunity costs. This categorization is based on whether or not the trades are completed. A schematic diagram of trading costs using this categorization is shown in Figure 1.1, The categorization of the four costs according to the two criteria is as follows.
Explicit vs. Implicit
Explicit
Commission
Execution vs. Opportunity
Execution
Commission
Impact
Opportunity.
Timing
Opportunity
Implicit
Impace
Timing
Opportunity
Measuring Transaction CostsThe measurement of transaction costs is critical for portfolio managers in formulating investment strategies and for clients in assessing the performance of managers. There are three dimensions to measuring trading costs: commissions for a particular stock or .trading style, determination of a benchmark for execution costs and opportunity costs, and separation of the influence of the trade from other factors. Commission rates, taxes, and fees are readily observable and fixed for a. transaction. This component, of costs is negotiated on a pre-trade basis and is known and measufable.
Se.lf-httttrui.tiunal Material \T,

Security Analysis and Innestinc.nl Manageine.nt Trading Costs
NOTES opportunity Gain/Loss (Uncompleted Trades)
Execution GaitVLoss (Completed Traders)
CommissionLoss
TimingGain/Loss
ImpactLoss-
Fig. 1.3. Diagram of Types of Trading Costs
The measurement of other components of transaction costs, particularly the impact component, has no unique solution. Impact cost arises when a trade induces a temporary price movem.ent. This is the result of either immediate liquidity demands or the actions of a market maker who perceives that an investor’s trade contains useful information. There are alternative approaches to measuring execution costs that capture useful information about the transaction process. In general, the cost of transacting is the difference between the execution price ii.e., the actual price at which the trade was executed) and a fair market benchmark. That is, •.
Costs = Execution price - Fair price
The fair price of a security is the price that would have prevailed had an investor’s trade not taken place. However, since that price is not observable, the fair price must be estimated or inferred. There are several working definitions of a fair price benchmark among practitioners. The choice of a benchmark, may involve choosing either a price that represents the fair value of a stock in the absence of the investor from the market or a price that represents the consequence of the investor’s presence in the market. We present three different approaches to measuring impact cost, which are referred to as pre-trade benchmarks, post-trade benchmarks, and average benchmarks.
Ere-trade benchmarks are prices occurring before or at the decision to trade, while post-trade benchmarks are prices occurring after the decision to trade. Average bencktnarks, also referred to as across-day benchmarks, use the average or I’eprosentative price of a large number .of trades. Essentially, all three benchmarks are attempts to measure the fair value of a stock at a point in time. Transaction costs emerge when the execution price deviates from the fair price. To the extent that any price represents an unbiased estimate of a fair price, the concept is valid. It does, however, assume that markets are price efficient.
Self-Inst' ui tional MaterialIG

Capital Marki-t: Securilii’if Markets1.8 TRADING ARRANGEMENTS FOR RETAIL AND
INSTITUTIONAL INVESTORS
Trades are executed by both individuals, called retail investors, and institutions. There are several differences in the way each group trades. The first is size: Institutions typically transact much larger orders than individuals. The second is commissions: Consistent with their larger size, institutions typically pay lower commissions than individuals. While institutional commissions have declined since 1975, some retail commissions have also declined significantly recently as a result of the advent of discount brokers.
The third difference is the method of order execution. While both an individual and an institution may trade through a broker-dealer, the manner in which their orders are entered and executed may be considerably different, even if the trades are through the same broker-dealer. An individual trading through a broker-dealer typically goes through a stockbroker (financial consultant). These orders go to a retail exchange execution desk and from there to the NYSE (usually through SuperDot) or to the OTC execution desk where they will'be transacted with another market maker on Nasdaq.
Retail investors receive a “confirm” (confirmation) the trade, typically in the mail. Institutional investors generally give their order directly to the institutional broker-dealer execution desk for both exchange and OTC orders. Exchange orders may be sent to the broker-dealer’s floor broker, and OTC orders may be transacted with another broker-dealer or internalized at a competitive bid-offer. Competing bids or offers are typically obtained in all cases.
NOTES
Retail Stock TradingHistorically, there has been a decline in the direct household ownership of common stock. This decline does not necessarily lead to the conclusion that households have decreased their common stock holdings. Rather, it means that households are holding more common stock through intermediaries such as mutual funds rather than'directly. While households hold more total common stock than before, they hold less common stock directly, and, thus, increasingly the stock executions are done by institutions, such as mutual funds, rather than by individuals.
One of the reasons for individuals owning stock through mutual funds rather than directly involves transaction costs; that is, institutions can transact stocks more cheaply than individuals. While this advantage for institutions remains, transaction costs for individuals have declined significantly during the last decade.
Self-Instnii-tiiiaal Material 17

Since May Day 1975, stock trading commissions have declined both for institutions and individuals. However, prior to 1990, individuals traded stocks mainly through so-called “full service brokers,” where commissions reflected not only the stock trade execution, but also the counsel of a stockbroker and perhaps research. The largest full service broker-dealers are. also known as “wirehouses”. These firms typically do institutional trading and investment banking as well as retail business. The commissions for these full service brokers have declined since 1975.
In addition, a “discount broker” industry developed in which the stockbroker provided no advice and no research. Individuals entered their orders via a telephone. More recently, individuals could enter their orders via their personal computer—these are called “online” or “Web based” brokerage firms. Consistent with the lower provision of service by discount brokers and online brokers, stock trading commissions decreased significantly.
Thus, individuals could trade and own stocks more efficiently. To remain competitive to a wide range of clients in this environment, the traditional full service brokerage firms responded by offering customers alternative means of transacting common stock. For example, many full service brokerage firms offer the traditional services of a stockbroker and research at a high commission, and, in addition, offer direct order entry only at a lower
' commission. Conversely, some discount brokers have begun to offer more service at a higher commission.
Thus, there continue to be ebbs and flows in the balance between more service and low commissions in the retail trading of common stock. Both online brokers, who offer no service and low commissions, and managers of segregated accounts, who offer enhanced services for a large fee, are growing along with full service stock brokerages and mutual funds. Despite paying higher commissions than institutions, individual investors may have some advantages over institutions. Because individuals usually transact smaller orders, they will incur smaller impact costs. In addition, if individual investors transact online, they may have shorter time lags. It is for these and other reasons that “packaged products” of individual stocks such as “folios” and exchange-traded funds are becoming more attractive.
Security Analysis and Investment Management
NOTES
Institutional TradingWith the increase in trading by institutional investors, trading arrangements more suitable for these investors were developed. Institutional needs include trading in large size and trading groups of stocks, both at a low commission and with low market impact. This has resulted in the evolution of special arrangements for the execution of certain types of orders commonly sought by institutional investors: (1) orders requiring the execution of a trade of a
Self-Instructional Material18

Capital Market: Securities Markets
large number of shares of a given stock and (2) orders requiring the execution of trades in a large number of different stocks at as near the same time as possible. The former types of trades are called block trades', the latter are called program trades. An example of a block trade would be a mutual fund seeking to buy 15,000 shares of IBM stock. An example of a program trade would be a pension fund wanting to buy shares of 200 names (companies) at the end of a trading day (“at the close”).
The institutional arrangement that has evolved to accommodate these two types of institutional trades is the development of a network of trading desks of the major securities firms and other institutional investors that communicate with each other by means of electronic display systems and telephones. This network is referred to as the upstairs market. Participants in the upstairs market play a key role by (1) providing liquidity to the market so that such institutional trades can be executed, and (2) by arbitrage activities that help to integrate the fragmented stock market.
NOTES
Block TradesOn the NYSE, block trades are defined as either trades of at least 10,000 shares of a given stock, or trades of shares with a market value of at least $200,000, whichever is less. Since the execution of large numbers of block orders places strains on the specialist system in the NYSE, special procedures have been developed to handle them. Typically, an institutional customer contacts its salesperson at a brokerage firm, indicating that it wishes to place a block order. The salesperson then gives the order to the block execution department of the brokerage firm. Note that the salesperson does not submit the order to be executed to the exchange where the stock might be traded or, in the case of an unlisted stock, try to execute the order on the Nasdaq system. The sales traders in the block execution department contact other institutions to attempt to find one or more institutions that would be willing to take the other side of the order. That is, they use the upstairs market in
' their search to fill the block trade order. If this can be accomplished, the execution of the order is completed.
Program TradesProgram trades involve the buying and/of selling of a large number of names simultaneously. Such trades are also called basket trades because effectively a “basket” of stocks is being traded. The NYSE defines a program trade as any trade involving the purchase or sale of a basket of at least 15 stocks with a total value of $1,million or more. The rationale for treating a portfolio or basket of stocks as a single asset is that it diversifies the risk of trading and thus reduces costs. Brokers can offer a much lower commission rate if the portfolio is submitted as a single asset rather than submitting each individual name.
Self-lnstractional Material 19
y

In addition, the trades are typically motivated by an investor’s desire for broad market exposure and are therefore “informationless,” which should not result in large price concessions. The two major applications of program trades are asset allocation and index arbitrage. With respect to asset allocation trades, some examples of why an institutional investor may want to use a program trade are deployment of new cash into the stock market; implementation of a decision to move funds invested in the bond market to the stock market (or vice versa); and rebalancing the composition of a stock portfolio due to a change in investment strategy. For example, a mutual fund money manager can move funds quickly into or out of the stock market for
. an entire portfolio of stocks through a single program trade. All these strategies are related to asset allocation.The growth of mutual fund sales and massive equity investments by pension funds and insurance companies during the 1990s have all given an impetus - to such methods to trade baskets or bundles of stocks efficiently. Other reasons for which an institutional investor may have a need to execute a program trade should be apparent when an investment strategy called indexing.There are several commission arrangements available to an institution for a program trade, and each arrangement has numerous variants. Considerations
. in selecting one (in addition to commission costs] are the risk of failing to realize the best execution price, and the risk that the brokerage,firms to be solicited about executing the program trade will use their knowledge of the program trade to benefit from the anticipated price movement that might result—in other words, that they will frontrun the transaction (for example, buying'a stock for their own account before filling the customer buy order).
From a dealer’s perspective, program trades can be conducted in two basic _,ways, namely on an agency basis or on a principal basis. An intermediate
type of program trade, the agency incentive arrangement, is a third alternative. A program trade executed on an agency basis involves the selection by the investor of a brokerage firm solely on the basis of commission bids (cents, per share) submitted by various brokerage firms. The brokerage firm selected uses its best efforts as an agent of the institution to obtain the best price. Such trades have low explicit commissions.
Security Aiialysiy and Invculmcnt Management
NOTES
1.9 MEANING OF INVESTMENT OPPORTUNITIES
Investors are investing their money in company like in terms of equity, preference shares and debentures, fixed deposit in companies, government or gilt edged securities, bonds, post office saving deposits, public provident schemes, Unit Trust of India, bank deposits, LIC, real estate, chit funds, money market instruments, precious objects and mutual funds. These investment avenues is known as investment opportunities.
Self-1 nylruitional Material20

CapUo{ Market: Securities Markets1.10 NON-MARKETABLE FINANCIAL ASSETS
Non-Marketable Financial AssetsExhibit 1.1_NOTES
Non-r'r.rketable financial assets are listed below:• Bank Deposits• Post Ofiice Time Deposits• Monthly Income Scheme of the Post OfTice• Kisan Vikas Patra• National Saving Certificates• National Saying Schemes• Company Deposits• Employees Provident Fund Schemes• Public IVovidentrFund Scheme
Bonds or Fixed Income Securities
Bonds or Fixed Income SecuritiesExhibit 1.2
Bonds or fixed income securities are listed below:• Government Securities• RBI Relief Bonds• Private Sector Debentures• Public Sector Undertaking Bonds• Preference Shares . ,
Above are the import bonds or fixed income securities.
1.11 EQUITY SHARES
Equity shares are also called common shares and are from the point of view of investment more risky than both bonds and preference shares. Equity capital represents ownership capital. Equity shareholders are real owners of the company. They bear the risk and enjoy the rewards of ownership.
Equity Capital TerminologyAn important terms used in equity capital are mentioned below; • Authorised capital
Self-/nstriiriiona{ Material 21

Security Analysi:< and Inuestnent Management
• Issued capital
• Paidup capital
Authorised Capital: Means “the amount of capital that a company, issues as per its memorandum represents the authorised capital”.
Issued Capital: Issued capital means that “the amount offered by the company to the investors is called the issued capital”.
Paidup Capital: Paid up capital means that “part of the issued capital has been subscribed to buy the investors is called the paid up capital”.
NOTES
Characteristics of Equity SharesAn important characteristics of equity shares as listed below: -
• Voting right
• Ownership rights
• Par value
• Right shares
• Tax benefits •
Voting rights: This is the fundamental characteristics of the shareholders. Equity shareholders having a special right to cast their vote and elect Board of Directors, Managing Directors in the every annual general meeting.
Ownership rights: This is the second characteristics of the equity shareholders. When investors buy equity shares, they receive ownership certificate i.e., share certificate from particular company where they are invested. When the case equity shares are purchased from the market, the
. new owner and the number of shares bought are noted in the record book of the transfer agent.
Par value: Par value means the face value of the shares. It indicates from the amount of capital originally subscribed by the shareholders. New shares cannot be sold for less than par value. As regards the equity shares they are sold for more than par, the .excess is transferred to “Share Premium Account”.
Rights share: The shareholder has a right to receive additional shares when they are issued'by the company. Company offeres shares to existing shareholders and then only on their refusal can be o'ffered to others. Sometimes, some amount is reserved for the existing shareholders and then an issue is made by thd company. These right shares are also known as subscription rights. An.equity shareholder also receives the right of bonus as well as receiving discount coupons and sometimes receive more stock in the company in the form of an additional dividend.
Tax benefits: Upto 18,000 can be deducted under Section SOL while . computing total income of a person.
22 Se.lf-lnstructional Material
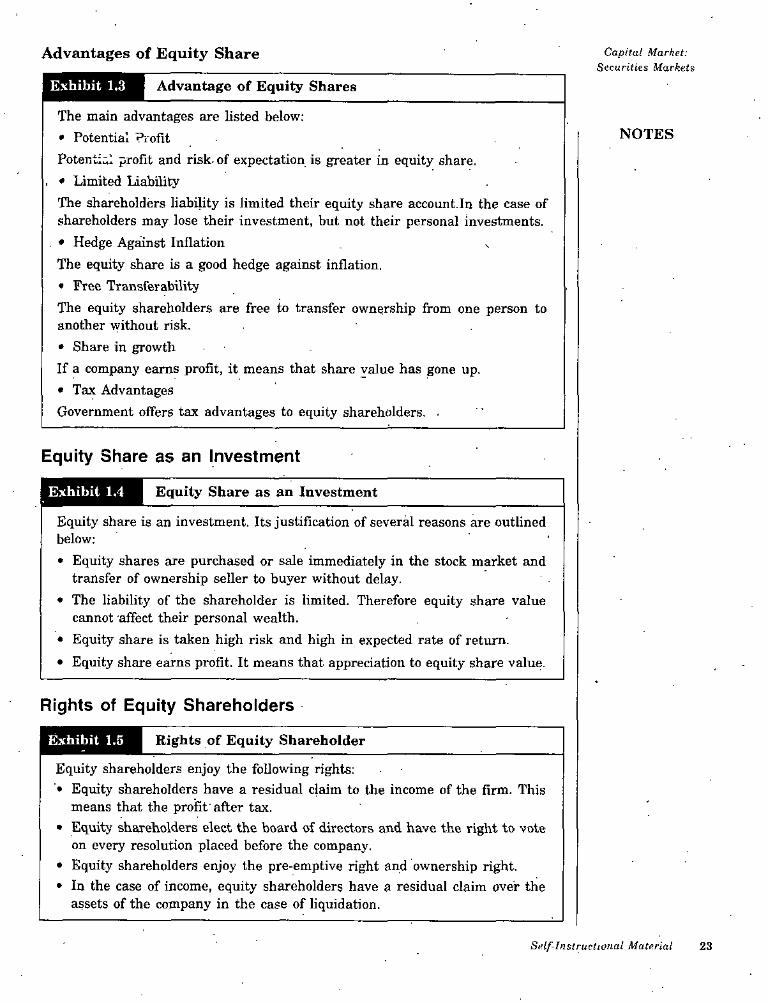
Advantages of Equity Share Capital Market: Securities Markets
Exhibit 1.3 Advantage of Equity Shares
The main advantages are listed below:• Potential ProfitPotent::.! profit and risk-of expectation is greater in equity share.
. • Limited LiabilityThe shareholders liability is limited their equity share account.In the case of shareholders may lose their investment, but not their personal investments.
. • Hedge Against Inflation The equity share is a good hedge against inflation.• Free TransferabilityThe equity shareholders are free to transfer ownership from one person to another without risk.• Share in growthIf a company earns profit, it means that share value has gone up.• Tax AdvantagesGovernment offers tax advantages to equity shareholders. •
NOTES
Equity Share as an Investment
Exhibit 1.4 Equity Share as an Investment
Equity share is an investment. Its justification of several reasons are outlined below:• Equity shares are purchased or sale immediately in the stock market and
transfer of ownership seller to buyer without delay.• The liability of the shareholder is limited. Therefore equity share value
cannot affect their personal wealth.• Equity share is taken high risk and high in expected rate of return.• Equity share earns profit. It means that appreciation to equity share value.
Rights of Equity Shareholders
Exhibit 1.5 Rights of Equity Shareholder
Equity shareholders enjoy the following rights:'• Equity shareholders have a residual claim to the income of the firm. This
means that the profit'after tax.• Equity shareholders elect the board of directors and have the right to vote
on every resolution placed before the company.• Equity shareholders enjoy the pre-emptive right and ownership right.• In the case of income, equity shareholders have a residual claim over the
assets of the company in the case of liquidation.
Self-Instructional Material 23

Seranty Analysi.': and Inui'stment Managi'in<'nt
Classification of Equity SharesEquity shares have been classified on the basis of:
• According to stock market.
• According to Peter Lynch’s.
According to Stock Market
Stock market has classified equity shares as follows:
• Blue chip shares
• Growth shares
• Income shares
• Cyclical shares
• Defensive shares
• Speculative shares
NOTES
. /
1.12 DEBENTURES
According to Indian Company’s Act, 1956, defined the term ‘Debentures’. Debentures includes debenture stock, bonds and any other securities of a company, whether constituting a charge on the assets of the company or not, in common paralance, debenture is an instrument issued by a company under its common seal, acknowledging its debt to the holder, and containing, an undertaking to repay the debt on or after a specified period and to pay interest on the debt at a fixed rate at regular intervals, usually, half yearly, until the debt is repaid.
The person to whom the debentures are issued are called debenture holders. The debenture holders are not the owners of the company. They are just the loan creditors of the company.
Classification of DebenturesDebentures may be classified on the basis of:
• On the basis of transferability point of view
• On the basis of security, point of view
■ • On the basis of priority point of view
• On the basis of period of redemption or repayment
• • On the basis of convertibility
Si’tf-Iiistrurtinrtal Material24

Capital Market: Securitien Markets
On the basis of transferability point of view:
On the basis of transferability point of view, debentures can be classified into two categories, namely;
• Registered debentures.
• Bearer debentures or unregistered debentures.
Registered debentures: Registered debentures are those in respect of which the names and the addresses of the debenture holders and the particulars of the debentures held by them are entered in the Register of Debenture Holders maintained by the company, i.e., Registered Debentures.
Bearer debentures or unregistered d^entures: Bearer debentures are those in respect of which the names and the addresses of the debenture holders and the particulars of the debentures held by them are not entered
' in the Register of Debenture holders maintained by the company.
On the Basis of Security Point of View
Debentures further classified on the basis of security point of view. They are, namely:
• Simple, naked or unsecured debentures
• Mortgage or secured debentures
Simple, naked or unsecured debentures: Simple debentures are debentures which are not secured by any assets of the company in respect of interest or principal. In this case, the company does not offer any security to the holders either in respect of the payment of interest or the pajmient of the loan.
Mortgage or secured debentures; Mortgage debentures are debentures which are secured by a charge on the assets of the company. The charge on the assets of the company may be a fixed charge or a floating charge. If the charge is on some specified assets of the company, it is called a fixed charge. On the other hand, if the charge is not on any particular asset of the company, but on the assets in general, it is called a floating charge.
On the Basis of Property Point of View
Debentures may be classified into two types;
• First debentures
• Second debentures
First debentures: First debentures are those which have priority over the other debentures as regarded the repayment of the amount of debentures. In other words, these are debentures which are repaid before other debentures are repaid.
NOTES
Self-Instrurliniial Material 25
Second debentures: Second debentures are those which are repaid only after the repayment of the first debentures.
On the basis of Period of Redemption or Repayment:
Debentures may be classified into two types namely:
• Redeemable debentures
• Irredeemable debentures
Redeemable debentures: Redeemable debentures are those which are repayable in a lumpsum at the end of a specified period or instalments . during the existence of the company.
Irredeemable debentures: Irredeemable debentures are not be repaid. It only means that there is no fixed time for the repayment of these debentures. As such, these debentures are not repaid during the existence of the company. They are repaid only, when the company goes into liquidation.
On the Basis of ConvertibilityThere are two types of debentures, namely:
• Convertible debentures
• Non-convertible debentures. T
Convertible-debentures: Convertible debentures are debentures.the holders pf which are given the-option of converting their debentures into shares after a specified period in- accordance with terms of conversion given in the prospectus.
Non-convertible debentures: Non-convertible debentures are debentures the holders of which are not given the right to convert their debentures into shares.
Security Analysis and Investment Management ■
NOTES
r": I' 1.13 REGULATION\ •
' -V Scattered and small beginning in the century, India’s securities market has risen to great heights by the beginning of the decade of the 90s. The mobilization from primary market has exceeded ? 27,000 crore in 1992. The , market capitalization of outstanding issues have exceeded ? 1,00,000 crore. Starting their operations from under a Banyan Tree and Neem Tree, the Bombay Stock Exchange in 1875 and Calcutta Stock Exchange in 1908 respectively, today we have 24 stock exchanges. The history of growth of primary and secondary markets in India have witnessed spells of non-
- regulation, self-regulation, half-hearted government regulation and close-set regulation^ In this Unit we shall discuss the legal framework of securities
market in India. What has been the history of securities mafKet regulation
A ' ’
2G Self-Instructional Material

Capital Market: Securities Markets
in India? What are different Acts, Rules and Regulations which affect securities market? What is the nature, role and functions of Securities and Exchange Board of India? What is the international perspective on securities market regulation? What promises does self-regulation hold in the present environment? These are some of the questions we shall address one by one in the unit. Let us begin by discussing the history of securities market regulation in India.
NOTES
1.14 TYPES OF REGULATION
The regulatory framework relating to financial services can be broadly classified into three main types. One set of regulations determine the types of activities that different forms of institution are permitted to engage in. These regulations can be called as structural regulations. For example, the Securities and Exchange Board of India (SEBI) insists that merchant bankers and stock broking institutions' to separate all their fund-based activities. Similarly, the Reserve Bank of India (RBI) has prescribed the •activities that commercial banks can provide to the investors. Structural regulation thus involves demarcation lines between the activities of financial institutions but many of them have in fact been eroding in recent years. Banks are now providing various services like leasing, term loan, credit cards, etc., in addition to their traditional service of working capital lending. • The rationale behind the expanding the activities that can be provided by the financial-service companies is the desire of regulatory authorities to create greater competition.
There are regulations that cover the internal management of financial institutions and other financial service organisations in relation to capital adequacy, liquidity aiid solvency. The SEBI for instance has prescribed minimum net worth requirement for various financial service firms that come under its jurisdiction. The objective of these regulation is to restrict the firms without adequate resources enter into this field.
Recently, the RBI has regulated the non-banking finance companies in raising public deposits. These regulations are known as prudential regulations as they aim to evolve certain prudential norms for the operation of the industry. There are number of investor protection regulations. All regulatory agencies in the financial sector claim that the primary objective of the regulation by them is to protect the interest of investors. It is generally perceived that investors are the weakest participants of the financial markets and hence need protection from malpractice, fraud and collapse. The information asymmetry between the investors and financial intermediary or institution affects the investors and thus regulatory agencies step-in to protect
Sitlf’-lnstruclwtial Material 27

the interest of the investors. Thus, investor protection regulations are often in the nature of demanding larger disclosure of information.
Tka regulations can also be classified on their scope. There are regulations which deal with the macro aspects of the system. For example, legislation enacted in the Parliament like Banking Regulation Act, Securities Contracts Regulation Act, etc., to deal with the macro aspects of respective institutions. The regulatory authorities under the legislation evolve rules, guidelines and regulations that govern the micro aspects and operational issues. In addition to the regulations passed under formal statue and regulators, there are selfregulations from the industry association. For example, the foreign exchange dealers have their own self-regulation in addition to several other statues and guidelines that govern their activities. Similarly, the merchant bankers association is developing self-regulation that will govern their members in addition to SEBI regulation. In the US and other developed markets, there are associations for financial analysts which admit the members after they pass examination and evolve code of conducts when they desire to practice as financial analyst.
The regulations in general aim to ensure the soundness and safety of financial institutions, maintain the integrity of the transmission mechanism and protect the consumers of financial services. The regulations also ensure freedom of operation to improve the efficiency and provide adequate scope for innovation that benefit the investors and other participants. The success of the regulation thus not only depends on its ability to ensure investors protection but also deteiTTiined by the level of advancement and sophistication the system has achieved. In other words, regulation should not block the development of financial service industry.
Security Analysis and liive.stmcnl Miincigeinent
NOTES
1.15 SECURITIES CONTRACTS (REGULATION) ACT, 1956
As noted above Securities Contracts (Regulation) Act 1956 and the rules made there under, namely in Securities Contracts (Regulation) Rules, 1957 are the main laws governing stock exchanges in India. The preamble to the Securities Contracts (Regulation) Act states that it is “an act to prevent undesirable transactions in securities by regulating the business of dealing therein, by prohibiting options and by providing certain other matters connected therewith . This Act provides for the direct and indirect control of virtually all aspects of securities trading and the running of the stock exchanges^^he Act makes every transaction in securities in any notified State or area illegal and punishable by fine and 1 or imprisonment if it is not entered into between or with members of a recognized stock exchange in the state or area. It also makes every such securities contracts void.
Sclf-Inxtructional Material28

The Act thus prohibits the existence of other than recognized stock.exchanges and provides the mechanism of recognizing stock exchanges. Application to the Central Government for recognition must include a copy of the rules relating, in general, to the constitution of the stock exchange and in particular to, among other things, the admission into the stock exchange of various classes of members, the exclusion, suspension, expulsion and readmission of members, and the procedure for registration of partnership as members. In determining whether to grant recognition, the Central Government may make whatever inquiry is necessary and impose in the rules and bye-laws of the stock exchanges whatever conditions are required to ensure “fair dealing” and to “protect investors”. These conditions concern, inter alia, the qualifications for members, the manner in which contracts are to be entered into and enforced, the representation .of not more than three Central Government nominees on the board of the stock exchange, and the maintenance of books and records by members and their audit by chartered accountants. The Central Government has the power to impose further conditions, other than in the rules, such as limiting the number of members. Finally, the Central Government has the power unilaterally to withdraw recognition.
After it recognizes a stock exchange, the Central Government exerts regulatory control over it. Periodic reports are furnished to the Central Government. Certain books and records are maintained for a period of five years. The Central Government can make an inquiry itself, or through an appointed third party, into the affairs of a stock exchange or any of its members. All officers, directors, members and others who have had dealings in the matter under inquiry are required to produce requested documents, statements, or information. The Central Government retains control over the stock exchange’s bye-laws and its rule amendments. A stock exchange, subject to previous Central Government approval, has the authority to make bye-laws for the regulation and control of contracts and the regulation of trading. Similarly, no rule amendments have effect until they are approved by the Central Government. The Central Government, furthermore, has the power to direct stock exchange to amend its rules; and if it fails to do so, the Government may directly amend such rules. The Securities Contract (Regulation) Act grants the Central Government power to supercede governing body of a recognized exchange. The suspension of business may be complete or subject to conditions. Suspensions may not last more than seven days initially but may be extended from time to time. The Central Government may supercede the governing body of any exchange by declaration and then appoint any person or group of persons to exercise and perform all the power and duties of the governing body. Other powers giunted to the Central Government include the ability to stop further trading in specified securities for the purpose of preventing undesirable speculation, and the power to compel a
Capital Markft: SiH urities Marketn
NOTES
Sulf-hiKtructionnl MahTutl 2!)

public company “ in the interest of the trade or in the public interest” to list its securities on any of the recognized exchanges.
Security Analy!-is and Inuestine.nt Manaf^ement
1.16 SECURltlES AND EXCHANGE BOARD OF INDIA (SEBI)NOTES
' Many developed countries like U.K. and U.S.A. had long back created separate Boards for the regulation of the securities market. While U.K. has the
"Securities and Investment Board (SIBl and U.S. has the Securities and Exchange Commission (SEC). The Indian Government’s intention to set up a .separate Board for the regulation and orderly functioning of the capital market was first declared in the Budget Speech by Shri Rajiv Gandhi, the then Prime Minister and Ministervof Finance, while presenting the Budget for the year 1987-88. He stated: )
“The capital markets in India have shown tremendous growth in the last few years. Approvals for capital issues have exceeded ? 5,000 crores in 1986-87. They were only about Ra.5O0cnureuiol 08B’81. For a healthy growth of a capital markets, investors must be fully protected. Trading malpractices must be prevented. Government have decided to set up a separate board for the regulation and orderly functioning of Stock Exchange and the securities industry”.
Origin\By a Notification issued on 12^^ April, 1988, Securities and Exchange Board
of India (SERI), was constituted as an interim administrative body to function under the overall administrative control of the Ministry of Finance, Government of India.
In July 1988, the SEBI, constituted as aforesaid, published an approach paper on comprehensive legislation for securities market. In the Budget Speech for the year 1990-91, then the Finance Minister stated:
“The previous Government had announced the formation of the Securities and Exchange Board of India (SEBI) in 1988. Three years have passed and the legislation for giving statutory authority to 8BB{bam not been introduced. We will ensure that this is done in this budget session”. ]In the Budget Speech for 1991-92, the Finance Ministep^aid:
“While presenting the budget for 1987-80,our former Prime Minister the late Shri Rajiv Gandhi had assured this House that for a healthy growth of capital markets, for protecting the rights of investors and for preventing trading malpractices the Government would set up a separate Board for the regulation and orderly functioning of the stock exchanges and the securities industry. Although the Board was set up, legislation to give the Board
30 Self-Instructional Material

adequate powers was unfortunately not enacted. This shall now be done forthwith and full statutory powers will be given to the Securities and Exchange Board of India for administrating the relevant provisions of the Securities contracts (Regulation) Act and the Companies Act. Transferring these powers from the Controller of Capital Issues and the Government to an independent body would enable it to effectively regulate, promote and monitor the working of the stock exchanges in the country. A comprehensive package of reforms relating to trading on the stock exchange, including a system of national clearing and settlement and setting up of a central depository, is also under active consideration”.
Finally, in the budget Speech for 1992-93, the Finance Minister said; “Financial sector reform also includes reform i.f the capital market, which will increasingly play a vital role in mobilizing and allocating resources from the public. Several initiatives announced in my budget speech last year have since been implemented. The Securities and Exchange Board of India (SEBI), has now been established on a statutory basis. As we gain experience, additional powers will be given to SEBI to strengthen. its capability”. ITie SEBI was given a statutory status on January, 1992 by an Ordinance to provide for the establishment of SEBI. A Bill to replace the Ordinance was introduced in Parliament on 3’’*^ March, 1992 and was passed by both houses of Parliament on April, 1992. 'fhe Bill became an Act on 4^^ April 1992 the date on which it received the Presidents assent. However, as provided for in section (3), this Act is to be deemed to have come into force on 30^^ January, 1992, i.e., the date on which the SEBI Ordinance was promulgated.
Capital Market: Securities Markets
NOTES
-5FunctionsXTnder Section 11 of the SEBI Act it is provided that subject to the provisions of this Act, it shall be the duty of the Board to protect the interest of investors in securities and to promote the development of and to regulate the securities market, by such measures as it thinks fit. It is further provided that without prejudice to the generality of the foregoing provisions, the measures referred to therein may provide for:
• regulating the business in stock exchanges and any other securities markets;
• registering and regulating the working of stock brokers, sub-brokers, share, transfer agents, bankers to an issue, trustees of trust deeds, registrars to an issue, merchant bankers, underwriters, portfolio managers, investment advisers and s.uch other intermediaries who may be associated with securities markets in any manner;.
• registering and regulating the working of collective investment schemes, including mutual funds;'
• promoting and regulating self-regulatory organisations;/
Self-lustruclwnat Material 31

• prohibiting fraudulent and unfair trade practice relating to securities markets;
• promoting investors education and training of intermediaries of securities markets;
• prohibiting insider trading in securities;
• regulating substantial acquisition of shares and take-over of companies;
• calling for information from, undertaking inspection, conducting inquiriesand audit of the stock exchanges and intermediaries and self-regulatory organisations in the securities market; - .
• performing such functions and exercising such powers under the provisions of the Capital Issue (Control) Act, 1947 (29 of 1947) and the Securities Contracts (Reflation) Act, 1956 (42 of 1956), as may be delegated to it by the Central Government;
• levying fees or other charges for carrying out the purpose of this section;
• conducting research for the above purpose;
• performing such other functions as may be prescribed.In sum and substance, Securities and Exchange Board^^India has been
constituted to promote orderly and healthy development of the securities market and; to provide adequate investor protection. It aims to remove the unhealthy practices prevalent in the Indian capital market and create an environment to facilitate mobilisation of resources through the securities market. Thus the Board plays a dual role by adopting regulatory functions as well as playing an important developmental role. Its functions include:
1. To deal with all matters relating to development and regulation of the securities market.
2. To administer various legislations affecting securities market.
3. Regulation of the market intermediaries viz: stock exchanges, stock brokers, merchant bankers, mutual funds, etc,
4. To provide adequate investor protection.
Security AnalyUR and hnn’sttniKHt Management
NOTES
1.17 SUMMARY
• A market is the means through which buyers and sellers are brought together to aid in the transfer of goods and/or services.
• The primary market is where new issues of bonds, preferred stock, or common stock are sold by government units, municipalities, or companies to acquire new capital.
St’lf-Int^tructionai Material■ 32

• Corporate bond issues are almost always sold through a negotiated arrangement with an investment banking firm that maintains a relationship with the issuing firm.
• The term fourth market describes direct trading of securities between two parties with no broker intermediary,
• Common stocks are also called equity securities. Equity securities represent an ownership interest in a corporation.
• A stock may be both listed on an exchange and also traded in the OTC market, called the third market.
• The direct trading of stocks between two customers without the use of a broker is called the fourth market.
• The initial margin requirement is the proportion of the total market value - of the securities that the investor must pay as an equity share, and the
remainder is borrowed from the broker.
• A critical element in investment management is controlling the trading costs necessary to implement a strategy. While important, the measurement of trading costs is very difficult.
• In addition, a “discount broker” industry de*. .sloped in which the stockbroker provided no advice and no research. Individuals entered their orders via a telephone.
• Equity shares are also called common shares and are from the point of view of investment more risky than both bonds and preference shares.
Capital Market: . Si'i urilii's Markets
NOTES
1.18 REVIEW QUESTIONS
1. Define market and briefly discuss the characteristics of a good market2. You own 100 shares of General Electric stock and you want to sell it because
you need the money to make a down payment on a stereo. Assume there is absolutely no secondary market system in common stocks. How would you go about selling the stock? Discuss what you would have to do to find a buyer, how long it might take, and the price you might receive.
3. Define liquidity and discuss the factors that contribute to it. Give examples of a liquid asset and an illiquid asset, and discuss why they are considered liquid and illiquid.
4. Define a primary and secondary market for securities and discuss how they • differ. Discuss why the primary market is dependent on the secondary market.
5. Give an example of an initial public offering (IPO) in the primary market.6. Give an example of a seasoned equity issue in the primary market. Discuss
which would involve greater risk to -the buyer.
Self-lnstructinnal Material 33

SL’iiirily Analysis and inv-f'suncnl Managonent
7. What is stock exchange?
8. Discuss about the structure of shave Market.
9. Wiiat is Electronic Communications Networks?
10. Discuss about trading arrangenients for retail and institutional investors.
11. Discuss different heading methods in stock Exchange.
12. What do you mean by investment opportunities?
13. Explain equity shares.
14. Explain debentures.
15. Effective regulation is an e.ssential condition for oi'derly growth of securities market* Discuss.
16. Write a brief note on the history of regulation of securities market in India.
17. Between self-regulation and legislative regulation, which is more relevant forIndia and why? •
18. Discuss the objectives and functions of Securities and Exchange Board of India.
19. ‘SEBI is an independent Board:’ Do you agree? Why?
20. Who can be a Member of a Stock Exchange in India?
21. In a short span of its existence, SEBI has been able to fully meet its objectives.’ Critically comment.
22. What measures have been adopted in India to protect investors’ interest in the securities market?
NOTES
1.19 FURTHER READINGS
1. Inve.stment Management: B.L. Mathur, Mohit Pub, 2002.
2. Investment Management: Performance Evaluation of Different Schemes of Mutual Funds: Martina R Noronha and Samta Trivedi, ABD Pub, 2008.
3. Investment Management and Security Analysis: Text and Cases:Dhanesh Kumar Khatri, Macmillan, 2006.
4. Investment Management and Stock Market; Edited by A.K. Vashisht and - R.K. Gupta, Deep arid Deep, 2005,
5. Security Analysis and Investment Management: O.P. Agarwal, Himalaya Publishing House, 2011.
□□□
Salf-Instructional Material

Risk and Return
UNIT 2 RISK AND RETURN\
NOTES
★ STRUCTURE ★
2.0 Learning Objectives2.1 Introduction2.2 Concept of Risk2.3 Concept of Return
2.4 Systematic and Unsystematic Risk2.5 Measures of 'Risk2.6 Risk-return Relationships2.7 Meaning and Definition of Stock Exchange2.8 Dealings on Stock Exchange2.9 Service of Stock Exchange
f
2.10 Natiorial Stock Exchange of India
2.11 Efficient Capital Markets2.12 Why should Capital Markets be Efficient?2.13 Alternative Efficient Market Hypotheses2.14 Tests and Results of Efficient Market Hypotheses2.15 Equity: Features and Valuation
2.16 Equity Derivatives Market2.17 Equality Valuation Model2.18 Approaches to Equality Valuation2.19 Technical Approach2.20 Basic Features of a Bond2.21 General Principles of Bond Valuation: Bond Theorem2.22 Term Structure of Interest Rates2.23 Duration2.24 Overview of Derivative Markets
2.25 Trading with Derivative Securities2.26 Valuation2.27 Summary
2.28 Review Questions
2.29 Further Readings
Self-lnstruv.tional Material 35

SMurity Analysif: and!nvest?nenl Manasemi'nt 2.0 LEARNING OBJECTIVES
After going through this unit, you will be able to:
• define what is concept of risk?
• explain the measures of risk and return.• differentiate between systematic and unsystematic risk components.
• discuss about the nature of equity instruments and equity valuation model.
• describe the term structure of interest rates.
• know about the economy industry and company analysis valuation of debentures/bonds.
NOTES
2.1 INTRODUCTION
The whole gamut of financial decision-making centres around the trade-off between risk and return. Decision-making of any kind involves both positive and negative aspects. A Farmer tills the land, sows the. seeds with an expectation of better yield. Till the crop is ripe and he actually reaps the harvest, he rarely knows whether his expectations have come true. In between expectation and reality, there is the interplay of many variables. Continuing the example of the farmer, there are key variables such as weather, seeds,, fertilizers, farm management techniques that make the expectations turn into reality. There is the possibility of adverse happening in any of the variables widening the gap between the expectation and reality. The analogy applies equally to a company, to an investment manager and every individual or institution that is faced with a decision-making situation. ■.
2.2 CONCEPT OF RISK
Risk may be understood as the possibility of adverse happening. We consider • those situations as risky, if they involve larger deviations from the expectations. Whether a particular situation involves risk or not depends on with what precision we can estimate the possibility of occurrence of a particular event. This gives raise to the following three states of possibilities;
• Certainty
• Uncertainty
• Risk
Certainty is a situation reflecting the happening of a particular event as expected with zero deviation. In case of certain ‘All Truths’, there will be no
Self-Instructional Material36

deviation. Like the sun rising in the east and inevitability of death, Similarly, there may be some business situations involving near certainty. Expecting to sell a certain number of bags of rice in a locality, when you are a monopolitist and rice is the staple food of the people of the locality.
Uncertainty is a situation that makes prediction difficult. One may not be sure of the occurrence of a particular event with any degree of precision. People find it often difficult to make predictions pertaining to weather. So also, the meteorological department, sometimes. To attempt to define uncertainty with any rigor presents extremely complex and hazardous conceptual and mathematical problems. In practice also, it is difficult to deal with the situations of uncertainty, since nothing stands to prediction.
The third state of possibility, i.e., risk, is said to be a situation lying in between the above two states, viz., certainty and uncertainty. This can be best understood in the form of a continuum with certainty and uncertainty on the two ends and risk covering the middle ground.
Risk and Return
NOTES
Continuum Reflecting the possibility of occurrence of an Event
RiskCertainty (100%) ■
Uncertainty ' (0%)
In statistical terminology, Risk is referred to be a situation in which future outcomes, together with their associated probabilities are known. In other words, it is said to be as dispersion in a subjective probability distribution.
As a matter of fact, a businessman can face confidently, the situation of risk ■ only. There will be no difficulty in making decisions under the situation of
certainty; and he will not be precise with any amount of sophistication of tools under uncertainty. Therefore, what can a manager reasonably perform are the situations of risk only. The theory of finance, therefore, realizes the significance of risk in final decision-making.
Ex-ante and Ex-pbst Risk: Risk, as a concept, has both ex-ante and ex- 'post meaning. Ex-ante risk refers to a decision variable reflecting the probability of realizing unfavourable outcomes in the future as a result of a decision made currently. Ex post risk refers to observed variation in outcomes during prior periods. This risk is historical. The estimation and evaluation of future outcomes, based on current information, is the most difficult exercise involved in financial decision-making. Finance literature considers the ex- ante concept of risk as having greater value than the ex-post concept of risk, since it is the former that a finance manager confronts.
Self-Instructional Material 37

. Security Analynifi andInuentment Management 2i3 CONCEPT OP RETURN
Return is something received back. In the field of financial decision-making the manager invests the company’s money on diverse fixed and current assets and hopes to receive something back on his investment.-This can be said to be the meaning of return. Nevertheless, the term ‘return’ has several dimensions, as of the following;
1. Book Vs. Market Return
2. Single period Vs. Multi Period Return
3. Ex-ante (Expected) Vs. Ex-post (Realized) Return
4. Security Vs. Portfolio Return.
NOTES
Book Vs. Market ReturnBook return is the return calculated from the books of the company using' profits and assets. Normallj', the return on assets (RoA) is taken as the indicator of book return. Several other return calculations can also be made using other variables like capital employed, networth, capital invested, earnings per share and dividends per share. In all these cases, these returns reflect historical performance. Whereas, market return is based on the market values of the assets. Suppose, X buys the stock of ABC company for ?100, whose face value is ?10 and the company earning per share, his book return is 10%; while his market return is 1 per cent.
Single Period Vs. Muifi Period ReturnReturn is always computed with reference to a particular period. If an investment of ?100 earns an income of ?3 over a three month period, the rate of return is 3 per cent. If another investment earns an income of ^3 over a 12-month period, then also the return is 3 per cent. But the measures appear to be illogical, iinless they are related to a specific time period. Normally, rates of return are computed on an annual basis. As such, the rates of return of the above two investments would be 12 per cent and 3 per cent respectively. Return on investment will be earned during a calendar interval, which may or may not be the same as the time period used to specify the rate of return. Investors would be normally curious to know, what rate of return they were able to make, irrespective whether they made it during the calendar interval or otherwise. As-such, the following analogy may be resorted to compute the return on an asset for a specific holding period. Return on investment is the excess, cash flow generated form an investment. If Cq is the amount, our investnient to buy an asset, at the beginning of the period, and is the amount that can be recovered through its sale, return on investment (R) in
38 Setf-Instructinnal Material

Risk and Returnabsolute terms can be specified as:
R = Cl - Cq .
If we want it in relative terms, (i.e., in per cent or otherwise) ‘r’ can be computed as: NOTES
Cj -Cq
Cq Cf,
Total return for a given holding period can also be derived using the following equation:
R =
Cl1 + r = Co
Normally, total return on a given asset comprises of the following two components:
• Income received on the asset for the holding period; and
• Value received at the end of the holding period. This may be due to sale or maturity.
Given the above, equation can be rewritten as:
Dj +Ci1 + r = Co
Di+C 1 - 1rCo
Suppose, an investor purchased the common stock of ABC company for ? 100 and held it for three years. After three years, he sold it for ? 125 and in the meantime, he received ? 20 as dividends for three years. His total return (r) would be:
20 + 125 - 1r = 100
145 -1100
= ,0.45 = 45%
Now this is a return for the entire holding period of three years. Normally, investors are interested in knowing annual return. The same can be arrived at using the following equation:
r = rJ(l + ri)(l + r2)...(l + rj.) - 1
Self-Instructional Material 39

. Security Analysis and changes in the economic, political and social conditions. The effect of these Investment Management
changes would be near uniform on the assets dealt in the market. It is common that when economic conditions are bright, indicating a steep growth in the GDP, falling inflation and rising incomes, the prices of the securities also go high reflecting the sentiments of the economy. Reverse occurs when . the economy shows signs of recession. It has been held by Fisher and Jordan that firms with high systematic risk tend to be those whose sales, profits and share prices follow' the level of economic activity and the level of the securities markets closely. These companies include most firms that deal in basic industrial goods and raw materials.
NOTES
The individual components of systematic risk are the following;
• Market risk
• Interest rate risk
• Purchasing power risk
2.5 MEASURES OF RISK
Since risk is variability in the expectations, there are many statistical tools that can be employed to measure risk. The following are the usual statistical techniques that are relied upon.
1. Standard Deviation (SD)
2. Variance (V)
3. ’ Coefficient of Variation (CV)
'4. Skewness (Sk)
5. Probability Distribution
Standard Deviation (a): SD provides a measure of the spread of the probability distribution. The larger the SD, the greater would be the dispersion of the distribution. ,This is denoted by the s5rmbol (a) sigma. This is commonly used to measure variability in a given distribution. The following equation is used to find out the value of SD:
^------ L. ; ora = ,\ N
a1 N N• v
Self-Instructional Material42

Risk and RpturnWhere x is the variable under consideration
is the .square of deviations from the mean of x
‘f is the frequency distributionVariance (a^): The square of SD is called variance. This measures the dispersion around the mean.
Co-efficient of Variation (CV): This is yet another frequently used measure . of variation.
NOTES
CV = ^ X 100X
The interpretation of this measure is that the lesser the variation in data, the more consistent it is.
Skewness (Sk): Skewness tells us about the symmetry of the data. Sometimes, a given data of two distributions may produce same mean and the same standard deviation. But the data may differ in terms of the shape of distribution. If a given data are not symmetrical, it is called asymmetrical or skewed. Higher skewness implies higher dispersion. In skewness, there are two possibilities, of data being; (i) positively skewed and; (ii) negatively skewed. .Positive skewness implies that there is less likelihood of returns being lower than the mean. V^ereas, negative skewness implies higher deviations from the mean. Therefore, positive skewness is considered less risky.
Probability Distribution: Probability distribution is a measure of someone’s opinion about the likelihood that an event will occur. In other words, a probability distribution is'a statement of the different potential outcomes for an uncertain variable together with the probability of each potential outcome. Typically, probability distributions of returns are estimated using actual historical data. By studying the behaviour of stock returns over the recent past, it is possible to come up with a subjective probability assessment for future returns. While assessing risks and returns related to an investment, . the expected return from an investment is taken as the average, of return from the investment and is calculated as the probability weighted sum of all potential returns. Thus:
E (R) = I [P (r) X H ,
Where: E (R) = Expected return
p (r) = .Probability of a particular value of return
r = Return
S = Sum of all possible outcomes
As per the above equation, each potential return be multiplied by its probability occurrence and then all these products are to be added together.
Self-Instructional Material 43

Security Analysis andhiuestment Management 2.6 RISK-RETURN RELATIONSHIPS
Though the literature on Finance has recognized the relationship between risk and return since the early nineteen hundreds, and made these relationships as the sine die of the financial decision-making, their precise direction was not known till, the contribution of capital asset pricing model. This model has attempted to outline the nature of exact relationships that may prevail between risk and return.
NOTES
Capital Asset Pricing Model (CAPM)The following two articles written by William F. Sharpe and John Lintner provided the basic concept of the CAPM.
1. W.F. Sharpe: Capital Asset Prices—A Theory of Market Equilibrium under conditions of risk. Journal of Finance, Vol.l9, September, 1969, pp.425-42.
2. John Lintner: The Valuation of Risk Assets and the Selection of Risky Investments in Stock portfolios and Capital Budgets, Review of Economics and Statistics, Vol.47, February, 1965, pp.13-37.'
According to .CAPM, there is an implied equilibrium relationship between risk and return for each security. Under the conditions of market equilibrium, a security is expected to provide a return commensurate with its unavoidable risk. The greater the unavoidable risk of a security, the greater the return that investors will expect from the security. The relationship between the expected return and unavoidable risk and the valuation of securities is the essence of CAPM. Stated in other words, “the risk averse investors will not hold risky assets, unless they are adequately compensated for the risks, they bear”.
Assumptions of the.Model: The following are the important assumptions of the model.
1. Investors make their decisions only on the basis of the expected return, risk associated with the security.
2. An individual investor cannot influence the price of a stock in the market.
3. Investors can lend or borrow funds at the riskless rate of interest.
4. Assets are infinitely divisible.
5. There are no transaction costs involved on buying and selling of stocks.
6. There is no personal income Tax, It implies that the investor is indifferent between capital gain and dividend.
The Model:According to CAPM, the expected return on asset ‘N’, is related to the risk of the asset (pp as follows: ,
Self-Instructional Material44

E (R,) = R^+ [E(R„,) - R^]
E (Rj) = expected rate of return on asset T
R^ = risk free rate
Pj = beta co-efficient of, stock ‘i’
E (R^) = expected return of the market
This model believes that the expected rate of return of an asset has the following two components:
• Risk-free rate ■
• Risk premium •
The notation p^'[E(R^) - R^] is the risk premium required for a given risk undertaken. Whereas the beta of asset ‘i’ is computed as follows:
RUk and Return
Where,
NOTES
Where, Pj,^ ,'= Correlation co-efficient between the returns on the stock ‘i’ and the returns on the market portfolio
Oj = Standard deviation of returns oh asset ‘i’
= Standard deviation of returns on the market portfolio
= Variance of the market returns.
Bower’s Model of the Investment Decision-making ProcessBower provided an interesting model of the investment decision-making process. Let' us briefly review it in this section. Bower found that the investment process is typically initiated by a discrepancy between desired results and actual results with regard to a performance variable. For example, information from the production planning and control system might indicate that orders exceed or will soon exceed plant capacity, or perhaps, from the cost accounting system, infonnation that unfavourable labour variances are appearing that seem to have their origin in an uneconomic-size plant for existing volume. Another discrepancy might be from the profit planning system, which might indicate an unfavourable price variance on an exis'ting product line, which could reflect a deterioration in the competitive position of the company. Still another discrepancy may be due to planning gap, which is identified as a result of long-term planning.
A discrepancy, produced by the information systems of the organization, initiates search for a solution that may result in the definition of a capital expenditure project. Such a project requires both technical and economic analysis which is carried out in the initiating phase of the resource allocation process. The focus in the initiating phase is on a discrepancy between the
Self ■Instructional Material 45
Security Analysis and ■ actual versus desired value of a key variable such as size of market, profit margin, price, operating cost, quality, and technological competitiveness. The discrepancy is often first noted at a low level of management, and the type of discrepancy depends both on the key success factors hat have been communicated through the organization as well as the information systems present in the organization. Definition of a project, then, often begins at a fairly low level within the organization, ^vhere technical expertise is most likely to be found. Once a project, defined at low levels of the organization, usually is proposed for approved by upfier-level division managers.
The next sub-process of the resource allocation decision-making process involves selling the project, and it is in this second sub-process where the greatest discrepancy exists between the projects actually selected and those that would be selected if a formal selection procedure alone led to the choice. Normally, approval for major investment decisions lies at top levels of a firm; that is, it is vested in corporate managers of investment centres. Projects, defined at low levels of the organization, usually are proposed for approval by upper-level division managers.
Iniiestment Management
NOTES
Arbitrage Pricing TheoryArbitrage pricing theory is one of the tools used by the investors and portfolio managers. The capital asset pricing theory explains the returns of the securities on the basis of their respective betas. According to the previous models, the investor chooses the investment on the basis of expected return and variance. The alternative model developed in asset pricing by Stephen Ross is known as Arbitrage Pricing Theory. The APT theory explains the nature of equilibrium in the asset pricing in a less complicated manner with fewer assumptions compared to CAPM.
Arbitrage: Arbitrage is a process of earning profit by taking advantage of differential pricing for the same asset. The process generates riskless profit. In the security market, it is of selling security, at a high price and the simultaneous purchase of the same security at relatively lower price. Since the profit earned through arbitrage is riskless, the investors have the incentive to undertake this whenever an opportunity arises. In general, some investors indulge more in this type of activities than others. However, the buying and selling activities of the arbitrager reduces and eliminates the profit margin, bringing the market price to the equilibrium level.
The assumptions:
• The investors have homogeneous expectations.
• The investors are risk averse and utility maximisers.
• Perfect competition prevails in the market and there is no transaction cost.
46 Self-Instructional Material

Risk and ReturnThe APT theory does not assume (1) single period investment horizon, (2) no taxes, (3) investors can borrow and lend at risk free rate of interest, and (4) the selection of the portfolio is based on the mean and variance analysis. These assumptions are present in the CAPM theory.
The APT Model: According to Stephen Ross, returns of the securities are influenced by a number of macro economic factors. They are; growth rate of industrial production, rate of inflation, spread between long term and short term interest rates and spread between lowgrade and high grade bonds. The arbitrage theory is represented by the equation:
NOTES
R,- = average expected return
^2 = sensitivity expected return to (3ij
pij = the beta co-efficient relevant to the particular factor.
Whatever be the number of factors built into the model, two securities with the same factor betas, should provide the same expected return. If not, arbitrage (i.e., the process of buying the cheaper and selling the expensive) will take place and security prices adjust themselves. The investors will try . to realise arbitrage profits, if there is disequilibriurn and adjust their portfolios and the security prices are driven to equilibrium.
Canying further their piece of research work, Richard Roll and Stephen Ross believed that there are five specific factors that capture systematic risk of a portfolio of securities. They are;
• Changes in the expected inflation.
• Unanticipated changes in inflation.
• unanticipated changes in industrial production.
• unanticipated changes in the yield differential between low and high gnad securities {known to be default risk premium).
• unanticipated changes in the yield differential between long term and short term bonds (known to be the term structure of interest rates).
2.7 MEANING AND DEFINITION OF STOCK EXCHANGE
A stock exchange is an organization of brokers and investment bankers which has the purpose of providing the facilities for trade of company stocks and other financial instruments-usually a central location and record keeping. Trade on exchange is by members only. One is said to “have a seat” on the
. exchange. In Europe, stock exchanges are often called bourses. The trading of stock on stock exchanges is called the stock' market. Generally, stock
Self-Instructwiinl Material 47

Sreui-ity Analysis and exchangc is a market in which securities are bought and sold and it is anInvestment Manaetment , . x » ? j -x i xessential component ot a developed capital market.
According to the Securities Contracts (Regulation) Act 1956Stock exchange means anybody of individuals, whether incorporated or not, constituted for the purpose of assisting, regulating or controlling the business of buying, selling or dealing in securities. According to this Act, securities include the following:
• Sharps, scripts, stocks, bonds, debentures, stock or other marketable securities of any incorporated company or corporate
• Government securities
• Right or interest securities
NOTES
Exhibit 2.t Role and importance of stock exchangc
• The stock exchange will play an important role in the success of the economyof the country. j
• The stock exchange is one of the basic financial tools for stimulating the economy by attracting capital for investment in the projects.
• The stock exchange also helps to revive other sectors of the economy such as commerce, industry and service.
• The stock exchange is attracting foreign capital to the country (India)’ particularly at present time, when the international companies have shown serious interest in the country as an important place for their investment.
• Shares, scrips, stocks, debentures stock and government securities are traded in stock exchange.
• Stock exchanges are provided appropriate advice to their clients. ■• Stock exchange will list public private and foreign companies.• Stock exchange wish to join the linkage system between the region’s stock
c:{changes and at a latter stage, with international stock exchanges.• Stock exchange is providing a market that mobilises and distributes the
nation’s savings utilized for the best purpose of the country.• Stock exchange is.a market in which securities are bought and sold.• The opportunity for stock exchanges to render the services of stimulating
private savings and channellising such savings into productive investment.
Exhibit 2.2 Functions of stock exchange
• A stock exchange is a very important financial market.• Stock exchange is a highly efficient and visible instrument of financing.• Stock exchange is used to finance the most of the needs of corporations;
way of above financing available from banks.
48 Scif-lnstructional Material

Risk and RfturnIndividuals and firms save some of their income and invest it.The stock exchange is a meeting ground for savers wishing to invest their savings—and firms looking for itivestments.Another function of stock exchanges is to assist government in financing their internal borrowing requirements.Government sell obligations (called bonds) to investors through the stock exchanges in their countries.Stock exchange is an indispensable tool for refinancing national debt.Stock exchange is a market in which securities are bought and sold.Shares, scrips, stocks, debenture stocks and government securities are traded in stock exchange.
NOTES
2.8 DEALINGS ON STOCK EXCHANGE
De.aling on the stock exchange are subject to the byelaws and rules of the stock exchange. Stock exchange dealings in India are regulated by the Securities Contracts (Regulation) Act. Stock exchange is permitted only in the listed securities through the members or their authorized clerks during the fixed working hours.There are two important types of trading in the stock exchange:• Ready Delivery Contract• Forward Delivery Contract
Ready Delivery ContractReady delivery contract is also known as cash trading or cash transactions. These transactions are to be settled either on the same date or within a short period that may extend at the best up to seven-days (If the payment and delivery of securities is on the same day or on the next day, it may be called spot delivery contract). Ready delivery contracts must be settled witliin the specified limit and they cannot be carried over to an extended period. Contracts can be made in respect of all securities.
Forward Delivery ContractThe forward delivery contracts are discharged on fixed settlement days occurring at fortnightly intervals. Forward delivery contracts enjoy the facility of ‘carry-over’. Forward delivery contracts are confined to those securities which are planned on the forward list.
Sflf-lnstruetiunal Malrrial 49

Difference between the Ready Delivery Contract and the Forward
Delivery ContractSecurity Analy.^is and
Investment Management
Difference between the ready delivery contract and forward delivery contractsExhibit 2.3NOTES
Forward Delivery Contract
• Ready-delivery contract also known • The Forward delivery contracts are as cash trading or- cash transactions these are to' be settled either on the same date or within a short period that may extend at the best up to seven days.
Ready Delivery Contract
discharged on fixed settlement days • accruing fortnightly intervals.
• Ready delivery contracts must be • Forward delivery contracts enjoy thefacility of ‘carry over’ to an extended period.
settled within the specified limit and they cannot be carried over to an extended period.
• Ready delivery contracts can be made • Forward delivery contracts areconfined to those securities which are. placed on the forward list.
in respect of all securities.
2.9 SERVICE OF STOCK EXCHANGE
The stock market occupies a pivotal position in the financial system. It performs several economic functions and renders invaluable services to the investors, companies, and to the economy. The following are the services provided by the stock exchange.
• Liquidity and Marketability of Securities
• Safety of Funds
• Supply of Long Term Funds
• Flow of Capital to Profitable Ventures
• Motivation for Improved Performance
• Promotion of Investment
• Reflection of Business Cycle
• Marketing of New Issues* ✓
• - Miscellaneous Services.
Liquidity and Marketability of SecuritiesStock exchanges provide buying and selling of securities. Stock exchange provide liquidity to securities since securities can be converted into cash at
50 Self-Instructional Material

any time according to the discretion of investor by selling them at the listed price. This facility is providing continuous marketability to the investors in respect of securities they hold or intend to hold.
• Rink and Return
Safety of Funds NOTES
Over trading, illegitimate speculation etc., are prevented through carefully designed set of rules, regulations and the byelaws art meant to ensure safety of investible funds. Therefore, stock exchange is protected investors fund.
Supply of Long Term FundsIn security market, securities are transferable from one person to another with minimum formalities. When security is sold, one investor is substituted by another. However, the company is assured availability of long term funds.
Flow of Capital to Profitable VentureThe profitability and popularity of companies are reflected in terms of hike in stocks. According to Husband and Dockeray “Stock exchanges function like a traffic signal, indicating a green light when certain fields offer the necessary inducement to attract capital blazing a red fight when the outlook for new investments is not attractive”.
Motivation for Improved PerformanceThe performance of a company is reflected in terms of prices quoted in the stock market. Stock exchange always encourages to improve performance of companies. Because public can expect to invest in growth companies.
Promotion of InvestmentStock exchanges mobilize the savings from the public into effective production purpose. In this way, stock exchange can promote investment through capital formation.
Reflection of Business CycleThe changing economic and business conditions are immediately reflected on the stock exchanges. Stock exchange identifies the booms and depressions of the economy. The government can take suitable monetary and fiscal policies which can help to investors.
Marketing of New IssuesIf the new issues are listed in stock exchange. Stock exchanges ready to accept and their evaluation by concerned stock exchange authorities. Stock market always helps in marketing of new issues.
Self-Instructional Material 51

^ .*
Security Analysis and Investment Management
Miscellaneous IssuesStock exchange encourages public to mobilize their savings. It guides investors in choosing securities by suppljnng the daily quotation of list of securities. It exhibits recent trends of the companies in the business.NOTES
History of Stock ExchangeIn India, the only stock exchanges operated in the 19th century were those of Mumbai in 1875 and Ahmedabad setup in 1894. Both stock exchanges were organized as voluntary nonprofit making associations of brokers. The main intention and objectives is to regulate and protect their interests. Bombay Securities Control Act 1925, which was recognized the Bombay Stock Exchange in 1937 and Ahmedabad in 1937. During the war period, a number of stock exchanges were organized even in Mumbai, Ahmedabad and other centers, therefore, they were not recognized. After the Independence the Central Government was passed the Securities Contracts Regulation Act in 1956 in Parliament.
Exhibit 2.4 Powers of Central Government
Power of Central Government under Securities Contracts Regulation Act 1956, as outlined below:
• Grant and withdraw of recognition of stock exchanges, approval or change of byelaws.
• Call for periodical yield from the stock exchange.• Direct enquiries is relating .to the members of the stock exchange.• Stock exchanges are submitted annual reports to Government.• Central Government is making certain rules which relating to stock
exchange operation.• .Supersede and suspend the Governing Board of Exchange.• Government ready to impose any other conditions or regulations for trading.
2.10 NATIONAL STOCK EXCHANGE OF INDIA
The National Stock Exchange of India (NSEI) was established in 1994 to encourage stock exchange reform through system modernization and competition. It is an electronic screen based system where members have equal access and equal opportunity of business irrespective of their location' in different parts of the country as they,are connected through a satellite network. The National Stock Exchange is to operate in two segments as outlined below:
52 Self Instructional Material

Risk and Return• Wholesale Debt Market.
• Capital Market
Wholesale Debt Market is concerned with trading instruments such, as Gilt . edge securities, commercial papers, PSU Bonds, units, and certificate of Deposits. The Capital Market is concerned with equity and; corporate debt instruments.
NOTES
Objectives of National Stock ExchangeThe NSE objectives as outlined below:
• It establishes nation wide trading facility for equity debt and hybrid.
• It facilitates equal access to investors across the country.
• It provides fairness, efficiency and. transparency. to the securities trading.
• .It enables shorter settlement cycles.
• It meets international securities market standard.
Features of NSE• It set up a fully automated screen based trading system.
• ' It has consists of three segments: The capital market segment, wholesaledebt market segment and derivatives market.
• It market is a fully automated screen based environment.
• It own’s satellite network bythrough market operates with all participants stationed at their office and making use of their computer terminals, to receive market information, to enter orders and execute to trade.
• The NSE has opted for an order driven system. This system provides enormous flexibility to trading members. A trading member can place • various conditions on the order in terms of price, time or size when an order .is placed by a trading member, an order confirmation slip is generated. All orders received are staked in price and time priority. The computer system automatically reaches for a match and no sooner to the - same is found the deal is struck.
• When a trade take place, a trade confirmation slip is printed at the trading member’s work station. It gives detail like price/quantity, code number of the party and so on.
• It pending orders is delayed, the identity of the trading is not revealed to others.
• On the eighth day of trading, each member get a statement showing his net position'as the clearing house of the securities. •
Self-Instructional Material 53

• Members are required to deliver securities and cash by the thirteenth and fourteenth day respectively, the fifteenth day is the payout day.
• It automated trade matching system secures the best prices available in the-market to the investor.
Security Analysis and Inre^tment Manafiement
NOTES
2.11 EFFICIENT CAPITAL MARKETS
An efficient capital market is one in which security prices adjust rapidly to the arrival of new information and, therefore, the current prices of securities reflect all information about the security. Some of the most interesting and- important academic research during the past 20 years has analyzedwhether our capital markets are efficient. This extensive research is import^t b its results have significant real-world implications for investors and portfolio managers. In addition, the question of whether capital markets are efficient is one of the most controversial areas in investment research. Recently, a new dimension has been added to the controversy because of the rapidly
' expanding research in behavioral finance that likewise has major implications regarding' the concept of efficient capital markets.
Because of its importance and controversy, you need to understand the meaning of the terms efficient capital markets and the Efficient Market Hypothesis (EMH). You should understand the analysis performed to test the EMH and' the result's of studies that either support or contradict the hypothesis. Finally, you should be aware of the implications of these results when you analyze alternative investments and work to construct a portfolio.
We are considering the topic of efficient capital markets at this point for two reasons. First, the prior discussion indicated how the capital markets function, so now it seems natural to consider the efficiency of the market in terms of how security prices react to new information. Second, the overall evidence on capital market efficiency is best described as mixed; some -studies support the hypothesis, and others do not. The implications of these diverse results are important for you as an investor involved in analyzing securities and
. building a portfolio.
ecause
2.12 WHY SHOULD CAPITAL MARKETS BE EFFICIENT?
This unit contains five major sections. The first discusses why we would expect capital markets to be efficient and the factors that contribute to an
'"efficient market where the prices of securities reflect available information;
Self-Instniclional Material ■54
'3Risk and ReturnThe efficient market hypothesis has been divided into three subhypotheses
to facilitate testing. The second section describes these three subhypotheses and the implications of each of them. The third section is the largest section, because it cg*'tains a discussion of the results of numerous studies. This review cf tne research reveals that a large body of evidence supports the EMH, but a growing number of other studies do not support the hypotheses. 1
In the fourth section, we discuss the concept of behavioural finance, the studies that have been done in this area related to efficient markets, and the ' conclusions as they relate to the EMH. The final section discusses what these results imply for an investor who uses either technical analysis or fundamental analysis or what they mean for a portfolio .'manager who has access to superior or inferior analysts. We conclude with a brief discussion of the evidence for markets in foreign countries.
/As noted earlier, in an efficient capital market, security prices adjust rapidly xo the infusion of new information, and, therefore, current security prices fully reflect all available information. To be absolutely correct, this is referred to as an informationally efficient market. Although the idea of an efficient capital market is relatively straightforward, we often fail 'to consider why
. capital markets should be efficient. 'What set of assumptions imply an efficient capital market?
An initial and important premise of an efficient market requires that a large number of profitmaximizing participants analyze and value securities, each independently of the others. A second assumption is that new information regarding securities comes to^ the market in a random fashion, and the timing of one announcement is generally independent of'others^
The third assumption is especially crucial: profit-maximizing investors adjust security prices rapidly to reflect the effect of new information. Although the price adjustment may be imperfect, it is unbiased. This means that sometimes the market will overadjust and other times it will underadjust, but you cannot predict which will occur at any given time. Security prices adjust rapidly because of the many profit-maximizing investors competing against one another. The combined effect of (1) information coming in a random, independent, unpredictable fashion and (2) numerous competing investors adjusting stock prices rapidly to reflect this new information means that one would expect price changes to be independent and random. You can see that the adjustment process requires a large number of investors following the
■ movements of the security, analyzing the impact of new information on its value, and buying or selling the security until its price adjusts to reflect the
■ new information. This scenario implies that informationally efficient markets
NOTES
Self-Instructional Material 5S

Security Analysia and IitveNlinenl Mcnageiiiciit
require some minimum amount of trading and that more trading by numerous competing investors should cause a faster price adjustment, making the market more efficient. We will return to this need for trading and investor attention when we discuss some anomalies of the EMH.
finally, because security prices adjust to all new information, these security
prices should reflect all information that is publicly available at any point in time. Therefore, the security prices that prevail at any time should be an unbiased reflection of all currently available information, including the risk involved in owning the security. Therefore, in an efficient market, the expected returns implicit in the current price of the security should reflect its risk, which means that investors who buy at these informationally efficient prices should receive a rate of return that is consistent with the perceived risk of the stock. Put another way, in terms of the CAPM, all stocks should lie on the SML such that theii- expected rates of return are consistent with their perceived risk. \
NOTES
2.13 ALTERNATIVE EFFICIENT MARKET HYPOTHESES
Most of the early work related to efficient capital markets was based on the random walk hypothesis, which contended that changes in stock prices occurred randomly. This early academic work contained extensive empirical analysis without much theory behind it. An article by Fama attempted to formalize the. theory and organize the growing empirical evidence. Fama presented the efficient market theory in terms of a fair game model, contending that investors can be confident that a current market price fully reflects all available information about a security and the expected return based upon this price is consistent with its risk.
In his original article, Fama divided the overall Efficient Market Hypothesis (EMH) and the empirical tests of the hypothesis into three subhypotheses depending on the information set involved; (1) weak-form EMH, (2) semistrong-form EMH, and (3) strong-form EMH. In a subsequent review article, Fama again divided the empirical results into three groups but shifted empirical results between the prior categories.3 Therefore, the following discussion uses the original categories but organizes the presentation of results using the new categories. In the remainder of this section, we describe the three subhypotheses and the implications of each of them. As will be noted, the three subhypotheses are based on alternative information sets. In the following section, we briefly describe how researchers have tested these hypotheses and summarize the results of these tests.
56 Self-Inrtrurtwnal Material

Rigk and RrturaWeak-Form Efficient Market HypothesisThe weak-form EMH assumes that current stock prices fully reflect all
■ security market information, including the historical sequence of prices, rates of return, trading volume data, and other market-generated information, such as odd-lot transactions, block trades, and transactions by exchange specialists. Because it assumes that current market prices already reflect all past returns and any other security market information, this hypothesis implies that past, rates of return and other historical market data should have no relationship with future rates of return (that is, rates of return
should be independent). Therefore, this hypothesis contends that you should gain little from using any trading rule that decides whether to buy or sell a security based on past rates of return or any other past market data.
NOTES
Semistrong-Form Efficient Market HypothesisThe semistrong-form EMH asserts that security prices adjust rapidly to the release of all public information; that is, current security prices fully reflect all public information. The semistrong hypothesis encompasses the weak-form hypothesis, because all the market information considered by the weak-form hypothesis, such as stock prices, rates of return, and trading volume, is public. Public information also includes all nonmarket information, such as earnings and dividend announcements, price-to-earnings fP/E) ratios, dividend-yield (D/P) ratios, pricebook value (P/BV) ratios, stock splits, news about the economy, and political news. This hypothesis implies that investors who base their decisions on any important new information after it is public should not derive above-average risk-adjusted profits from their transactions, considering the cost of trading because the security price already reflects all such new public information.
Strong-Form Efficient Market HypothesisThe strong-form EMH contends that stock prices fully reflect all information from public and private sources. This means that no group of investors has monopolistic access to information relevant to the formation of prices. Therefore, this hypothesis contends that no group of investors sho'uld be able to consistently derive above-average risk-adjusted rates of return. The strongform EMH encompasses both the weak-form and the semistrong-form EMH. Further, the strongform EMH extends the assumption of efficient markets, in which prices adjust rapidly to the release of new public information, to assume perfect markets, in which all information is eostfree • and available to everyone at the same time.
Sflf-IuHtrurtional Material 57

Security Analysis andInvesUnent Management 2.14 TESTS AND RESULTS OF EFFICIENT MARKET
HYPOTHESES
Now that you understand th'e three components of the EMH and what each of them implies regarding the effect on security prices of different sets of information, we can consider the tests used to see whether the data support the hypotheses. Therefore, in this section we discuss the specific tests and summarize the results of these tests.
Like most hypotheses in finance and economics', the evidence on the EMH is mixed. Some studies have supported the hypotheses and indicate that capital markets are efficient. Results of other studies have revealed some anomalies related to these hypotheses, indicating results that do not support the hypotheses.
NOTES
Weak-Form Hypothesis: Tests and ResultsResearchers have formulated two groups of tests of the weak-fonh EMH. The first category involves statistical tests of independence between rates of return. • The second entails a comparison of risk-return results for trading rules that make investment decisions based on past market information relative to the results from a simple buy-and-hold policy, which assumes that you buy stock at the beginning of a test period and hold it to the end.
Statistical Tests of Independence. As discussed earlier, the EMH contends that security returns over time should be independent of one another because new information comes to the market in a random, independent fashion and security prices adjust rapidly to this new information. Two major statistical tests have been employed to verify this independence. First, autocorrelation tests of independence measure the significance of positive or negative correlation in returns over time. Does the rate of return on day t correlate with the rate of return on day t - 1, t -.2, or t - 2,1 Those who believe that capital markets are efficient would expect insignificant correlations for all such combinations. Several researchers have examined the serial correlations among stock returns for several relatively short time horizons including 1 day, 4 days, 9 days, and 16 days. The results typically indicated insignificant correlation in stock returns over time. Some recent studies that considered portfolios of stocks of different market size have indicated that the autocorrelation is stronger for portfolios of small market size stocks. Therefore, although the older results tend to support the hypothesis, the more recent studies cast doubt on it for portfolios of small firms, although these results could be affected by transaction costs of small-cap stocks and nonsynchronous trading for small-firm stocks.
Self-Inntructional Material58

-Risk and ReturnThe second statistical test of independence is the runs test. Given a series of price changes, each price change is either designated a plus (+) if it is an increase in price or a minus (-) if it is a decrease in price. The result is a set of pluses and minuses as follows; +++-+—++—++. A run occurs when two consecutive changes are the same; two or more consecutive positive or negative price changes constitute one run. When the price changes in a different direction, such as when a negative price change is followed by a
- positive price change, the run ends and a new run may begin. To test for independence, you would compare the number of runs for a given series to the number in a table of expected values for the number of runs that should occur in a random series.
- Studies that have examined stock price runs have confirmed the independence of stock price changes over time. The actual number of runs for stock price series consistently fell into the range expected for a random series. Therefore, these statistical tests of stocks bn the NYSE and on the OTC market have likewise confirmed the independence of stock price changes over time. Although short-horizon stock returns have generally supported the weak- form EMH, several studies that examined price changes for individual transactions on the NYSE found significant serial correlations. Notably, none of these studies attempted to show that the dependence of transaction price movements could be used to earn above-average risk-adjusted returns after considering the trading rule’s substantial transactions costs.
Tests of Trading Rules The second group of tests of the weak-form EMH were developed in response to the assertion that the prior statistical tests of independence were too rigid to identify the intricate price patterns examined by technical analysts. Technical analysts do not expect a set number of positive or negative price changes as a signal of a move to a new equilibrium in the market. They typically look for a general consistency in the price trends over time. Such a trend might include both positive and negative changes. For this reason, technical analysts believed that their trading rules were too sophisticated and complicated co be properly tested by rigid statistical tests.
In response to this objection, investigators attempted to examine alternative technical trading rules through simulation. Advocates of an efficient market hypothesized that investors could not derive abnormal profits above a - buy-and-hold policy using any trading rule that depended solely on past market information.
The trading rule studies compared the risk-return results derived from trading-rule simulations, including transactions costs, to the results from a simple buy-and-hold policy. Three major pitfalls can negate-the results of a trading-rule study:
NOTES
Se.lf-Instructionai Material 5D

1. The investigator should use only publicly available data when . iihplementing the trading rule. As an example, the trading activities ofspecialists as of December 31 may not be publicly available until February 1, so you should not factor in information about specialisftrading activity until then,
2. When computing the returns from a trading rule, you should include all transactions costs involved in implementing the trading strategy because most trading rules involve many more transactions than a simple buy- and-hold policy.
3. You must adjust the results for risk because a trading rule might simply select a portfolio of high-risk securities that should experience higher returns.
Researchers have encountered two operational problems in carrying out these tests of specific trading rules. First, some trading rules require too much subjective interpretation of data to simulate mechanically. Second, the almost infinite number of potential trading rules makes it impossible to test all of them. As a result, only the better-known technical trading rules have been examined.
Another factor that you should recognize is that the studies have typically been restricted to relatively simple trading rules, which many technicians
. contend are rather naive. In addition, many of these studies employed readily available data from the NYSE, which is biased toward well-known, heavily traded stocks that certainly should trade in efficient markets. Recall that markets should be more efficient when there are numerous aggressive, profit- maximizing investors attempting to adjust stock prices to reflect new information, so market efficiency will be related to trading volume. Specifically, more trading in a security should promote market efficiency.
Alternatively, for securities with relatively few stockholders and little trading activity, the market could be inefficient simply because fewer investors would be analyzing the effect of new information, and this limited interest would result in insufficient trading activity to move the price of the security quickly to a new equilibrium value that would reflect the new information. Therefore, using only active, heavily traded stocks when testing a trading rule could . bias the results toward finding efficiency.
Security Analysis and Investment Management
NOTES
2.15 EQUITYvFEATURES AND VALUATION
Derivative instruments, or simply derivatives, are contracts that essentially derive their value from the behaviour of cash market instruments such as stocks, stock indexes, bonds, currencies, and commodities that underlie the contract. When the underlying for a derivative is, a stock or stock index,
60 Self-Instructional Material

the contract is called an equity derivative. The purpose of this chapter is to explain these instruments, their investment characteristics, and to provide an overview as to how they are priced. In the next chapter we look at how equity derivatives can be used in the management of equity portfolios.
Risk and Return
NOTES
2.16 EQUITY DERIVATIVES MARKET
The three general categories of derivatives are (1) futures and forwards, (2) options, and (3) swaps. The basic derivative securities are futures/ forward contracts and' options. Swaps and other derivative structures with more complicated payoffs are regarded as hybrid securities, which can be shown to be nothing more than portfolios of forwards, options, and cash instruments in varying combinations.
Equity derivatives can also be divided into two categories according to whether they are listed or OTC. The listed market consists of options, warrants, and futures contracts. The principal listed options market consists of exchange- traded options with standardized strike prices, expirations, and payout terms traded on individual stocks, equity indexes, and futures contracts on equity indexes. A FLexible EXchange (FLEX) Option was introduced by the CBOE in 1993 that provides the customization feature of the OTC market, but with the guarantee of the exchange. The listed futures market consists of exchange- traded equity index futures and single stock futures with standardized settlement dates and settlement returns. Other equity derivatives might include Exchange Traded Funds (ETFs), which are index investment products listed and traded on an exchange.
OTC equity derivatives are not traded on an exchange and have an advantage over listed derivatives because they provide complete flexibility and can be tailored to fit an investment strategy. Tlie OTC equity derivatives market can be divided into three components: OTC options and warrants, equity- linked debt investments, and equity swaps. OTC equity options are customized option contracts that can be applied to any equity index, basket of stocks or an individual stock. OTC options are privately negotiated agreements between an investor and an issuing dealer. The structure of the option is completely flexible in terms of strike price, expiration, and payout features.
A fundamental difference between listed and OTC derivatives, however, is that listed options and futures contracts are guaranteed by the exchange, while in the OTC market the derivative is the obligation of a non-exchange entity that is the counterparty. Thus, the investor is subject to credit risk or counterparty risk.
Sidf-l'istrui-tional MalrruLl G1

Sfrurity Analysis andInvestment Manai’cinent 2.17 EQUALITY VALUATION MODEL
Equity derivative products are either exchange-traded listed derivatives or . over-the-counter derivatives. In this section we will look at listed equity
options.
An option is a contract in which-the option seller grants the option buyer the right to enter into a transaction with the seller to either buy or sell ^
. underl)ang asset at a specified price on or before a specified date. The specified price is called the strike price or exercise price and the specified date is called the expiration date. The option seller grants this right in exchange for a. certain amount of money called the option premium or option price. The option seller is also known as the option writer, while the option buyer is the option holder. The asset that is the subject of the option is called the underlying. The'underlying can be an individual stock, a stock index, or another derivative instrument such as a futures contract or an ETF. The option writer can grant the option holder one of two rights. If the right is to purchase the underl3ang, the option is a call option. If the right is to sell the underlying, the option is a put option. An option can also be categorized according to when it may be exercised by the buyer. This is referred to as the' exercise style. A European option can only be exercised at the expiration date of the contract. An American option can be exercised any time on or before the expiration date. A Bermudan option is in between an American and a European and can only be exercised on certain dates over the life of the option. The terms of exchange are represented by the contract unit, which is typically 100 shares for an individual stock and a multiple times an index value for a stock index. The terms of exchange are standard for most contracts. The contract terms for a FLEX option can be customized along four dimensions: underlying, strike price, expiration date, and settlement style. These options are discussed further below. The option holder enters into the contract with an opening transaction. Subsequently, the option holder then has the choice to exercise or to sell the option. The sale of an existing option by the holder is a closing sale.
NOTES
Basic Features of Listed OptionsTlie basic features of listed options are summarized in Exhibit 2.5. The exhibit is grouped into four categories with each option' category presented in terms of its basic features. These include the type of option, underlying, strike price, settlement information, expiration cycle, exercise style, and some trading rules.
Sett'-Instrurtioiial MaU'rinlG2

Stock options refer to listed options on individual stocks or American Depository Receipts (ADRs). The underlying is 100 shares of the designated stock. All listed stock options in the United States may be exercised any time before the expiration date; that is, they are American style options. Index options are options where the underl5dng is a stock index rather than an individual stock. An index call option gives the option buyer the right to buy the underlying stock index, while a put option gives the option buyer the right to sell the underlying stock index. Unlike stock options where a stock can be delivered if the option is exercised by the option holder, it would be extremely complicated to settle an index option by delivering all the stocks that constitute the index. Instead, index options are cash settlement contracts. This means that if the option is exercised by the option holder, the option writer pays cash to the option buyer. There is no delivery of any stocks.
The most liquid index options are those on the S&P 100 index (OEX) and the S&P 500 index. Both trade on the CBOE. Index options can be listed as American or European, The S&P 500 index option contract is European, while the OEX is American. Both index option contracts have specific standardized features and contract terms. Moreover, both have short expiration cycles. There are almost 100 stock index option contracts listed across 26 separate exchanges and 20 countries. Among the latest arrivals are options traded on the Dow Jones STOXX 50 and the Dow Jones EURO •50 stock indexes. The indexes are comprised of 50 industrial, commercial, and financial European blue chip companies. The following mechanics should be noted for index options. The dollar value of the stock' index underlying an. index option is equal to the current cash index value multiplied by the contract’s multiple. That is,
Dollar value of the underlying index = Cash index value x Contract multiple
For example, if the cash index value for the S&P 100 is 530, then the dollar value of the S&P 100 contract is 530 x$100 = $53,000. For a stock option, the price at which the buyer of the option can buy or sell the stock is the strike price. For an index option, the strike index is the index value at which the buyer of the option can buy or sell the underl3dng stock index.- The strike index is converted into a dollar value by multiplying the strike index by the multiple for the contract. For example, if the strike index is 510, the dollar value is $51,000 (510 x $100). If an investor purchases a call option on the S&P 100 with a strike index of 510, and exercises the option when the index value is 530, then the investor has the right to purchase the index for $51,000 when the market value of the index is $53,000. The buyer of the call option would then receive $2,000 from the option writer.
Risk and Return
NOTES
Self-Instructional Material G3
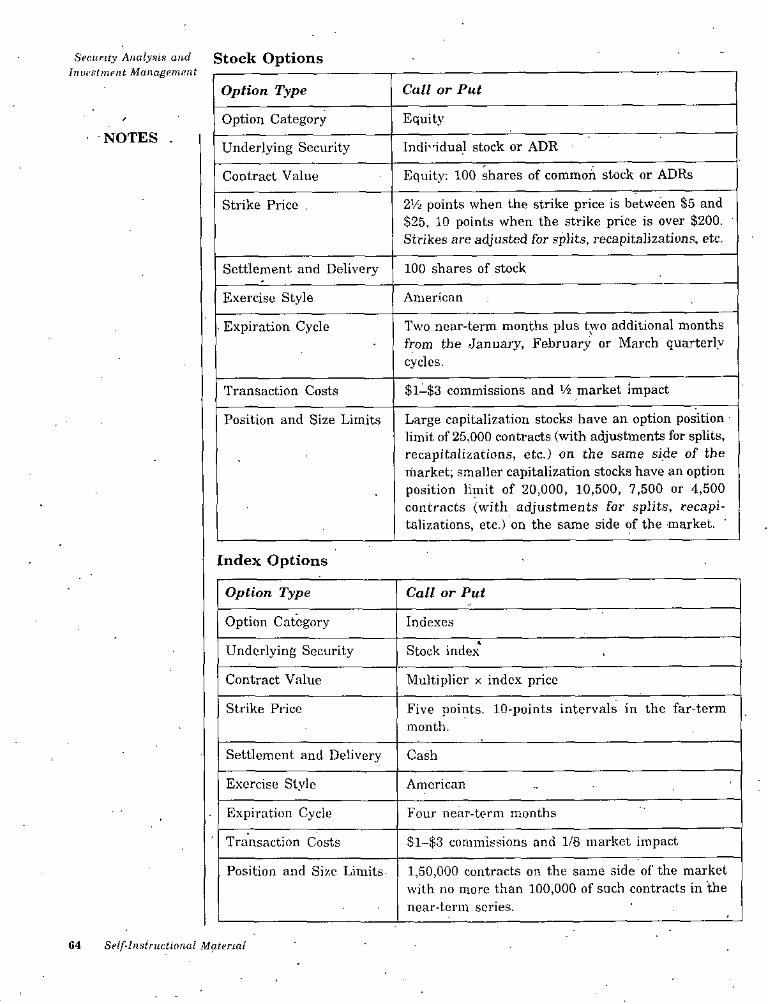
Security Analynie and StOCk OptXOns Inueslment Management .----------------------------
Call or PutOption Type
EquityOption CategoryNOTES . Individual stock or ADRUnderlying Security
Equity; 100 shares of common stock or ADRsContract Value
2Vi points when the strike price is between $5 and $25, 10 points when the strike price is over $200. Strikes are adjusted for splits, recapitalizations, etc.
Strike Price ,
100 shares of stockSettlement and Delivery
Exercise Style American
Two near-term months plus two additional months from the January, February or March quarterly cycles.
• Expiration Cycle
$l-$3 commissions and Vi market impactTransaction Costs
Large capitalization stocks have an option position limit of 25,000 contracts (with adjustments for splits, recapitalizations, etc.) on the same side of the riiarket; smaller capitalization stocks have an option position limit of 20,000, 10,500, 7,500 or 4,500 contracts (with adjustments for splits, recapitalizations, etc.) on the same side of the market.
Position and Size Limits
Index Options
Option Type Call or Put
Option Category Indexes
Stock indexUnderlying Security
Contract Value Multiplier x index price
Five points. 10-points intervals in the far-term month.
Strike Price
Settlement and Delivery Cash
Exercise Style American
Expiration Cycle Four near-term months
$l-$3 commissions and 1/8 market impactTransaction Costs
1,50,000 contracts on the same side of the market with no more than 100,000 of such contracts in the near-term scries.
Position and Size Limits-
Self-Instructional MaterialG4
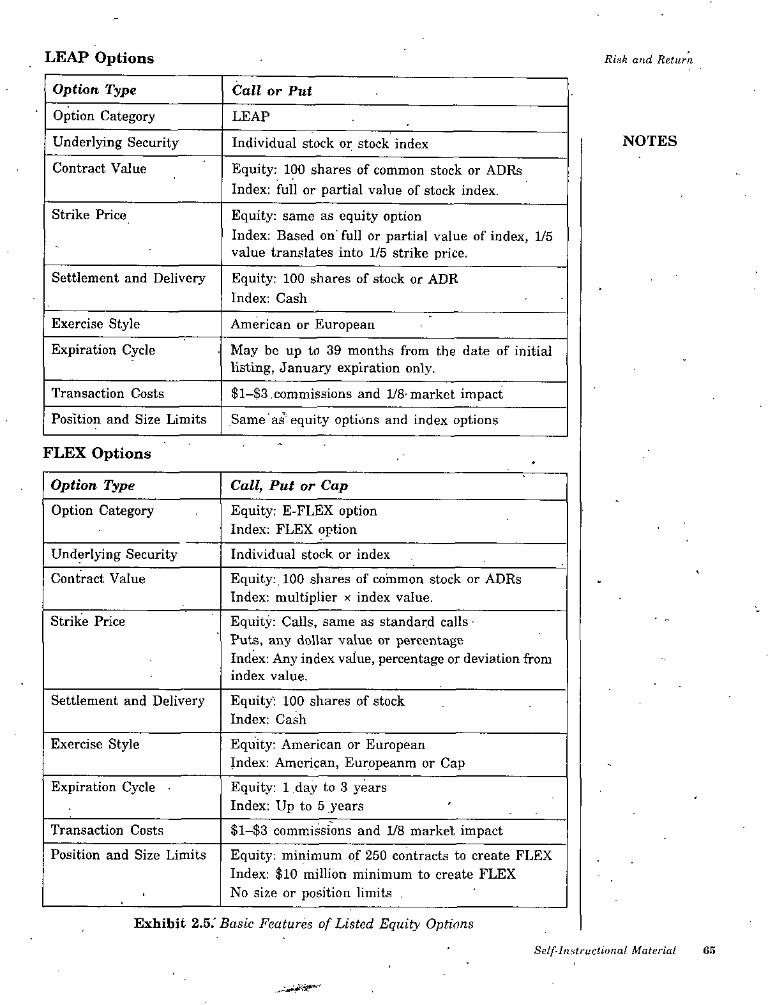
LEAP Options RUk and Return
Option Type Call or Put
Option Category LEAP
NOTESUnderlying Security Individual stock or stock index
Contract Value Equity: 100 shares of common stock or ADRs Index; full or partial value of stock index.
Strike Price Equity: same as equity optionIndex: Based on'full or partial value of index, 1/5value translates into 1/5 strike price.
Settlement and Delivery Equity: 100 shares of stock or ADR Index: Cash
Exercise Style American or European
Expiration Cycle May be up to 39 months from the date of initial listing, January expiration only.
$l-$3 commissions and 1/8’market impactTransaction Costs
Same as^' equity options and index optionsPosition and Size Limits
FLEX Options
Option Type Call, Put or Cap
Option Category Equity: E-FLEX option Index: FLEX option
Underlying Security Individual stock or indexContract Value Equity; 100 shares of common stock or ADRs
Index: multiplier x index value.Equity; Calls, same as standard calls •Puts, any dollar value or percentageIndex: Any index value, percentage or deviation fromindex value.
Strike Price
Settlement and Delivery Equity': 100 shares of stock Index; Cash
Exercise Style Equity; American or European Index: American, Europeanm or Cap
Expiration Cycle • Equity: 1 day to 3 years Index: Up to 5 years
$l-$3 commissions and 1/8 market impactTransaction Costs
Position and Size Limits Equity; minimum of 250 contracts to create FLEX Index: $10 million minimum to create FLEX No size or position limits .
Exhibit 2.5.'Baste Features of Listed Equity Options
Self-Instructi(inal Material 6.'>

The other two categories listed in Exhibit 2.5, LEAPS and FLEX options, essentially modify an existing feature of either a stock option, an index option, or both. For example, stock option and index option contracts have short expiration cycles. Long-Term Equity Anticipation Securities (LEAPS) are designed to offer options with longer maturities.
These contracts are available on individual stocks and some indexes. Stock option LEAPS are comparable to standard stock options except the maturities can range up to 39 months from the origination date. Index options LEAPS differ in size compared with standard index options having a multiplier of 10 rather than 100. FLEX options allow users to specify the terms of the option contract for either a stock option or an index option. The value of FLEX options is the ability to customize the terms of the contract along four dimensions: underlying, strike price, expiration date, and settlement style. Moreover, the exchange provides a secondary market to offset or alter positions and an independent daily marking of prices. The development of the FLEX option is a response to the growing OTC market. The exchanges seek to make the FLEX option attractive by providing price discovery through a competitive auction market, an active secondary market, daily price valuations, and the virtual elimination of counterparty risk. The FLEX option represents a link between listed options and OTC products.
Securily Analysis and Investment Managemetit
NOTES
2.18 APPROACHES TO EQUALITY VALUATION
A futures contract is an agreement between two parties, a buyer and -a seller, where the parties agree to transact with respect to the underlying at a predetermined price at a specified date. Both parties are obligated to perform over the life of the contract, and neither party charges a fee.
Once the two parties have consummated the trade, the exchange where the , futures contract is traded becomes the counterparty to the trade, thereby
severing the relationship between the initial parties. Each futures contract is accompanied by an exact description of the terms of the contract, including a description of the underl3nng, the contract size, settlement cycles, trading specifications, and position limits. The fact is that in the case of futures contracts, delivery is not the objective of either party because the contracts are used primarily to manage risk or costs.
The nature of the futures contract specifies a buyer and a seller who agree to buy or sell a standard quantity of the underlying at a designated future date. However, when we speak of buyers and sellers, we are simply adopting the language of the futures market, which refers to parties of the contract in terms of the future obligation they are committing themselves to. The buyer of a futures contract agrees to take delivery of the underlying and is
Self-Instructional Material6S

Risk and Returnsaid to be long futures. Long futures positions benefit when the price of the underlyir^ rises. Since futures can be considered a substitute for a subsequent transaction in the cash market, a long futures position is comparable to holding the underlying without the financial cost of purchasing the underlying or the income that comes from holding the underlying. The seller, on, the other hand, is said to be short futures and benefits when the price of the underlying declines.
The designated price at which the parties agree to transact is called the futures price. The designated date at which the parties must transact is the
■ settlement date or delivery date. Unlike options, no money changes hands between buyer and seller at the contract’s inception. However, the futures, broker and the futures exchange require initial margin as a “good faith” deposit. In addition, a minimum amount of funds referred to as maintenance margin is required to be maintained in the corresponding futures account. The initial margin and the maintenance margin can be held in the form of short-term credit instruments. Futures are marked-to-the-market on a daily basis. This means that daily gains or losses in the investor’s position are accounted for immediately and reflected in his or her account. The daily cash flow from a futures position is called variation margin and essentially means that the futures contract is settled daily. Thus, the buyer of the futures contract pays when the price of the underlying falls and the seller pays when the price of the underlying rises. Variation margin differs from other forms of margin because outflows must be met with cash.
Futures contracts have a settlement cycle and there may be several contracts trading simultaneously. The contract with the closest settlement is call the nearby futures contract and is usually the most liquid. The next futures contract is the one that settles just after the near contract. The contract with the furthest away settlement is called the most distant futures contract.
NOTES
Differences between Options and FuturesThe fundamental difference between futures and options is that buyer of an option (the long position) has the right but not the obligation to enter into a transaction; The option writer is obligated to transact if the buyer so desires. In contrast, both parties are obligated to perform in the case of a futures contract. In addition, to establish a position, the party who is long futures does not pay the party who is short futures. In contrast, the party long an option must make a payment to the party who is short the option in order to establish the position. The price paid is the'option price. The payout structure also differs between a futures contract and an options contract. The price of an option contract represents the cost of eliminating or modifying the risk/reward relationship of the underlying.
Se.lf-lnstructional Material 67

In contrast, the payout for a futures contract is a dollar-for-dollar gain or loss for the buyer and seller. When the futures price rises, the buyer gains at the expense of the seller, while the buyer suffers a dollar-for dollar loss when the futures price drops.Thus, futures payout is s>mmetrical, while the payout for options is skewed. The maximum loss for the option buyer is the option price. The loss to the futures buyer is the full value of the contract. The option buyer has limited . downside losses but retains the benefits of an increase in the value in the
' position of the underlying. The maximum,profit that can be realized by the option writer is the option price, which is. offset by significant downside exposure. The losses or gains to the buyer and seller of a futures contract are completely symmetrical. Consequently, futures can be used as a hedge against symmetric risk, while options can be used to hedge as5Tnmetric risk.
Security Analysis and Inurstinent Management
NOTES
Features of FuturesThe key elements of a futures contract include the futures price, the amount or quantity of the underlying, and the settlement or delivery date.
Stock Index FuturesThe underlying asset of a stock index futures contract is the portfolio of stocks represented by the index. The value of the underlying portfolio is the value of the index in a specified currency times a number called a multiplier. For example, if the current value of the S&P 500 index is 1100, then the seller of a December S&P 500 futures contract is theoretically obligated to deliver in December a portfolio of the 500 stocks that comprise the index. The multiplier for this contract is 500; The portfolio would have to exactly replicate the index with the weights of the stocks equal to their index weights. The current value of one futures contract is $275,000, However, because of the problems associated with delivering a portfolio of 500 stocks that exactly replicate the underlying index, stock index futures substitute cash delivery for physical delivery. At final settlement, the futures price equals the spot price and the value of a futures contract is the actual market value of the underlying replicating portfolio that represents the stock index. The contract is marked-to-market based on the settlement price, which is the^pot price, and the contract settles.
Single Stock FuturesA Single Stock Futures (SSF) contract is an agreement between two parties to buy or sell shares of individual companies (as opposed to a stock index in the case of a stock index futures contract) at sometime in the future with the terms agreed upon today. The value of traditional futures contracts is captured by SSFs as well because the agreement requires a low capital commitment
Self-Instructional Material68

upfront in the form of initial margin. Two key benefits to investors are that shorting is not constrained by the up tick rule or complicated by stock loans and a simple long or short strategy in the underlying stock can be created.
SSFs currently trade on numerous exchanges around the world including those in Australia, Denmark, Finland, Hong Kong, Hungary, Portugal, South Africa, Sweden, and, most recently, Canada and the UK. As of this writing, there has been modest success for these products. In January 2001 the London International Financial Futures Exchange (LIFFE) introduced SSFs on 30 stocks including seven U.S. companies and the Bourse de Montreal began trading a SSF contract on Nortel Networks. In May, LIFFE expanded the number by 25 contracts to a total of 65 listed SSF contracts on global stocks.
The importance of the LIFFE development is that it is the first time SSFs have been listed on a major global exchange. The contracts are referred to as Universal Stock Futures (USF) and are standardized futures contracts based on shares of European and U.S. companies. In May 2001, Nasdaq and LIFFE announced a partnership, Nasdaq Life Markets LLC, to offer SSF contracts on global stocks.
The standardized features of the contracts for the Nasdaq LIFFE market and the emerging U.S. market include a contract size of 100 shares with quotes in dollars or euros. The minimum tick increment is $0.01 per share or $1 dollar per contract. Settlement calls for the physical delivery of 100 shares (adjusted for corporate events). There is no daily price limits imposed on the contracts, but a position limit of 1,000 contracts or the equivalent to 100,000 shares of the underl3dng common stock or American Depository Receipt (ADR).
Risfe and Return
NOTES
Pricing Stock Index FuturesFutures contracts are priced based on the spot price and cost of carry considerations. For equity contracts these include the cost of financing a position in the underlying asset, the dividend yield on the underlying stocks, and the time to settlement of the futures contract. The theoretical futures price is derived from the spot price adjusted for the cost of carry. This can be confirmed using risk-free arbitrage arguments. The logic of the pricing model is that the purchase of a futures contract can be looked at as a temporary substitute for a transaction in the cash market at a later date. Moreover, futures contracts are not assets to be purchased and no money changes hands when the agreement is made.
Futures contracts are agreements between two parties that establish the terms of a later transaction. It is these facts that lead us to a pricing relationship between futures contracts and the underlying. The seller of a futures contract is ultimately responsible for delivering the .underl3dng and will demand compensation for incurring the cost of holding it. Thus, the
Self-Instructional Material 69

futures price will reflect the cost of financing the underl5dng. However, the buyer of the futures contract does not hold the underljdng and therefore does not receive the dividend. The futures price must be adjusted downward to take this into consideration. The adjustment of the yield for the cost of financing is what is called the net cost of carry.
The futures price is then based on the net cost of carry, which is the cost of financing adjusted for the yield on the underlying. That is,
Futures price = Spot price + Cost of financing dividend yield
The borrowing or financing rate is' an interest rate on a money market instrument and the yield in the case of equity futures is the dividend yield on an individual stock or a portfolio of stocks that represent the stock index. The theoretical futures price derived from this process is a model of the fair value of the futures contract. It is the price that defines a no-arbitrage condition. The no-arbitrage condition is the futures price at which sellers are prepared to sell and buyers are prepared to buy, but no risk-free profit is possible.
The theoretical futures price expressed mathematically depends on the treatment of dividends. For individual equities with quarterly dividend payout, the theoretical futures price can be expressed as the spot price adjusted for the present value of expected dividends over the life of the contract and the cost of financing. The expression is given below as:
Fit, T) = IS(f) - D] X [1 + Rit, T)]
Security Analysis and Investment Managenient
NOTES
Where:
F{t,D = futures price at time t for a contract that settles in the future at time T
S{t) = current spot price
D =. present value of dividends expected to be received over the life of the contract
R{t,T) = borrowing rate for a loan with the same time to maturity as the futures settlement date.
For example, if the current price of the S&P 500 stock index is 1175, the borrowing rate is 6%, the time to settlement is 60 days, and the index is expected to yield 2.071%. An annualized dividend yield of 2.071% corresponds to 4 index points when the S&P 500 stock index is 1175: '
1175 X [0.02071 X (60/365)1 = 4 index points
The theoretical futures price can be calculated as follows:D = 4/(1 + 0.06)®'’^2®'5 = 3.96
i? = (1 -t- 0.06)®°^^®” - 1 = 0.009624 or 0.9624%
Fit, 60) = [11765 - 3.96] x 1.009624 = 1182.31.
70 Self-Instructional Material✓

Risk and ReturnIf the actual futures price is above or below 1182.31, then risk-free arbitrage is possible. For actual futures prices greater than fair value, the futures contract is overvalued. Arbitrageurs will sell the futures contract, borrow enough funds to purchase the underlying-stock index, and hold the position until fair value is restored or until the settlement date of the futures contract.If, for example, we assume the actual futures price is 1188, then the following positions would lead to risk-free arbitrage:
• Sell the overvalued futures at 1188.
• Borrow an amount equivalent to 1175.
• Purchase a stock portfolio that replicates the index for the equivalent of 1175.
The position can be unwound at the settlement date in 60 days at no risk to the arbitrageur. At the settlement date, the futures settlement price equals the spot price. Assume the spot price is unchanged at 1175. Then,*
• Collect 4 in dividends.
• Settle the short futures position by delivering the index to the buyer for 1175.
• Repay 1186.31 (1175 1.009624) to satisfy the loan (remember the interest rate for the 60 days is 0.9624%).
The net gain is [1188 + 4] - 1186.31 = 5.69. That is, the arbitrageur “earned” 5.69 index points or 48 basis points (5.69/1175) without risk or without making any investment. This activity would continue until the price of the futures converged on fair value. It does not matter what the settlement price for the index is at the settlement date. This can be clearly shown by treating the futures position and stock position separately. The futures position delivers the difference between the original futures price and the settlement price or 1188 - 1175, which equals 13 index points. The long stock position earned only the dividends and no capital gain. The cost of financing the position in the stock is 11.31 and the net return to the combined short futures and long stock position is 13(futures) + 4(stock) less the 11.31 cost of financing, which is a net return of 5.69. Now consider what happens if the spot price is at any other level at the settlement date. Exhibit 8.10 shows the cash flows associated with the arbitrage. We can see from the results that regardless of the . movement of the spot price, the. arbitrage profit is preserved.
For actual futures prices less than fair value, the futures contract is undervalued. Arbitrageurs will buy the futures contract, short or sell the ' underlying, lend the proceeds, and hold the position until fair value is restored or until settlement date of the futures contract. If, for example, we assume the actual futures price is 1180, then the following positions would lead to risk-free arbitrage:
NOTES
Self-Instructional Material 71

• Buy the undervalued futures at 1180.
• Sell or short the stock index at 1175 and collect the proceeds.
• Lend the .proceeds from the stock transaction at 6%.
Once again the position can be unwound at the settlement date at no risk to the arbitrageur. At that time the futures settlement price equals the spot' price. Regardless of the settlement price of the index, the arbitrage is ■preserved in this case as well. Exhibit 2.6 presents a- sample of settlement price outcomes. The following process applies to the arbitrage regardless of the direction of the stock market;
• Settle the short stock position by taking futures delivery of the stock index.
• Pay the 4 index points in dividends due the index.
• Receive the proceeds from the loan (remember the term interest rate is 0.9624%).
Overvalued Futures"'
SecuriSy Analysis: and /nLiestme?it Management
NOTES
Futures Stock Index Settlement Price
StockCash Flows
Futures Cash Flows ProfitCosts
5.6925 + 4 = 29 11.311188 - 1200 = -12120015 + 4 = 19 11.31 5.691188 - 1190 = ^21190
5.6913 + 4 = 17 11.311188 - 1188 = 011885.695 + 4 = 9 11.311188 - 1180 = 81180
11.31 5-.691188 - 1175 = 13 0 + 4 = 4117511.31 5.691188 - 1160 = 28 -15 + 4 = -111160
"Short futures at 1188
Undervalued Futures"
StockCash Flows
InterestIncome
Futures Cash Flows
Futures Stock Index Settlement Price Profit
2.31-25 - 4 = -29 11.311200 - 1180 = 20
1190 - 1180 = 101200
2.31-15 - 4 = -19 11.31119011.31 2.31-13 - 4 = -171188 - 1180 = 8118811.31 2.311180 - 1180 = 0 -5 - 4 = -91180
2.310 - 4 = -4 11.311175 - 1180 = -5117511.31 2.3115-4= 111160 - 1180 = -20'1160
"Buy futures at 1180Exhibit 2.6. Arbitrage Cash Flows
Self-Instructional Material72

In this example, the arbitrageur “earned” 20 basis points {2.31/1175) or 2.31 index points without risk or without making any investment. This activity would continue until the price of the futures converged on'fair value.
The theoretical futures price can also be expressed mathematically based on a security with a known dividend yield. For equities that pay out a constant dividend over the life of a futures contract, this rendition of the model is- appropriate. This ,may apply to stock index futures contracts where the underlying is an equity index of a large number of stocks. Rather than calculating every dividend, the cumulative dividend pay out or the weighted- average dividend produces a constant and known dividend yield. The cost of carry valuation model is modified to reflect the behaviour of dividends. This is expressed in the following equation:
Fit, T) = Sit) X [1 + Rit; D - Yit, T)]
Risk and Return
. NOTES.
where Yit,7^ is the dividend yield on the underlying over the life of the futures contract and Fit,T^, Sit), and Rit,7^ are as defined earlier. For example, if the current price of a stock is 1175, the borrowing rate is 6%, the time to settlement is 60 days, and the annualized dividend yield is 1.38%, the theoretical futures price can be calculated as follows:
y = (1 + 0.0138)®'^^^®^ - 1 = 0.002256 or 0.2256%60/365R = (1 + 0.06)
Fit, 60) = 1175 X [1 -I- (0.009624 - 0.002256J = 1183.66.
In practice,- it is important to remember to use the borrowing rate and dividend yield for the term of the contract and not the annual rates. The arbitrage conditions outlined above still hold in this case. The model is specified differently, but the same outcome is possible. When the actual futures price deviates from the theoretical price suggested by the futures pricing model, arbitrage would be possible and likely. The existence of risk-free arbitrage profits will attract arbitrageurs.
In practice, there are several factors that may violate the assumptions of the futures valuation model. Because of these factors, arbitrage must be carried out with-some degree of uncertainty and the fair value futures price is not a single price, but actually a range of prices where the upper and lower prices act as boundaries around an arbitrage-free zone. Furthermore, the violation of various assumptions can produce mispricing and risk that reduce arbitrage opportunities.
The futures price ought to gravitate toward fair value when there is a viable and active arbitrage mechanism. Arbitrage activity will only take place beyond
■ the upper and lower limits established by transaction and other costs, uncertain cash flows, and divergent borrowing and lending rates among participants. The variability of the spread between the spot price and futures price, known as the basis, is a consequence of mispricing due to changes in
- 1 = 0.009624 or 0.9624%
Self-Instructional Material 73

the variables that influence the fair value. The practical aspects of pricing produce a range of prices. This means that the basis can move around without offering a profit motive for arbitrageurs. The perspective of arbitrageurs in the equity futures markets is based on dollar profit but can be viewed in terms of an interest rate. The borrowing or financing rate found in the cost of carry valuation formula assumes borrowing and lending rates are the same. In practice, however, borrowing rates are almost always higher than lending rates. Thus, the model will yield different values depending on the respective borrowing and lending rates facing the user. Every futures price corresponds to an interest rate. We can manipulate the formula and solve for the rate implied by. the futures price, which is called the implied futures rate. For each market participant there is a theoretical fair value range defined by its respective borrowing and lending rates and transaction costs.
Senirifjy Analysis! and Inuentment Management
NOTES
2.19 TECHNICAL APPROACH
An OTC equity derivative can be delivered on a stand-alone basis or as part of a structured product. Structured products involve packa^ng standard or exotic options, equity swaps, or equity-linked debt into a single product in
• any combination to meet the risk/return objectives of the investor and may represent an alternative to the cash market even when cash instruments are available.
The three basic components of OTC equity derivatives are OTC options, equity swaps, and equity-linked debt. These components offer an array of product structures that can assist investors in developing and implementing investment strategies that respond to a changing financial world. The rapidly changing investment climate has fundamentally changed investor attitudes toward the use of derivative products. It is no longer a question of what can an investor gain from the use of OTC derivatives, but how much is sacrificed by avoiding this marketplace. OTC derivatives can assist the investor with cost minimization, diversification, hedging, asset allocation, and risk management.
Before we provide a product overview, let’s look at counterparty risk. For exchange listed derivative products counterparty-or credit risk is minimal because of the clearing house associated with the exchange. However, for OTC products there is counterparty risk. For parties taking a position where performance of both parties is required, both parties are exposed to counterparty risk. The OTC market has incorporated a variety of terms into
. the contractual agreement between counterparties to address the issue of credit risk. These include netting arrangements, position limits, the use of collateral, recouponing, credit triggers, and the establishment of Derivatives Product Companies (DPCs).
74 Self-Instruclional Material

Risk and ReturnNetting arrangements between counterparties are used in master agreements specifying that in the event of default, the bottom line is the net payment owed across all contractual agreements between the two counterparties. Position limits may be imposed on a particular counterparty according to the cumulative nature of their positions and credit worthiness.
As the OTC market has grown, the credit worthiness of customers has become more diverse. Consequently, dealers are requiring some counterparties to furnish collateral in the form of a liquid short term credit instrument. Recouponing involves periodically changing the coupon such that the marked- to-mafket value of the position is zero. For long-term OTC agreements, a- credit trigger provision allows the dealer to have the positiori cash settled if the counterparty’s credit rating falls below investment grade. Finally, dealers are establishing DPCs as separate business entities to maintain high credit ratings that are crucial in competitively pricing OTC products.
NOTES
2.20 BASIC FEATURES OF A BONDV
'Public bonds are long-term, fixed-obligation debt securities packaged in convenient, affordable denominations for sale to individuals and financial institutions. They differ from other debt, such as individual mortgages and privately placed debt obligations, because they are sold to the public rather than channeled directly to a single lender. Bond issues are considered fixed- income securities because they,impose fixed financial obligations on the issuers. Specifically, the issuer agrees to:
1. Pay a fixed amount of interest periodically to the holder of record.
■2. Repay a fixed amount of principal at the date of maturity,-
, Normeilly, interest on bonds is paid every six months, although some bond issues pay in intervals as short as a month or as long as a year. The principal is due at maturity; this par value of the issue is rarely less than $1,000. A bond has a specified term to maturity, which defines the life of the issue. The public debt market typically is divided into three time segments based on an issue’s original maturity;
• Short-term issues with maturities of one year or less. The market for these instruments is commonly known as the money market,
• Intermediate-term issues with maturities in excess of 1 year but less than 10 years. These instruments are known as notes,
• Long-term'obligations with maturities in excess of 10 years, called bonds.
The lives of debt obligations change constantly as the issues progress toward maturity. Thus, issues that have been outstanding in the secondary market
Seif-lnstructional Materiat 76

for any period of time eventually move from long-term to intermediate to short-term. This change in maturity is important because a major determinant of the price v^latJuty of bonds is the remaining life (maturity) of the issue.
Security Analysis and Investment Manageme/it
Bona CharacteristicsNOTES
A bond can be characterized based on (1) its intrinsic features, (2) its type, ■(3) its indenture provisions, or (4) the features that affect its cash flows and/ or-its maturity.
Intrinsic FeaturesThe coupon, maturity, principal value, and the type of ownership are important intrinsic features of a bond. The coupon of a bond indicates the • income that the bond investor will receive over the life (or holding period) of the issue. This is known as interest income, coupon income, or nominal yield.
The term to maturity specifies the date or the number of years before a bond matures (or expires). There are two'different types of maturity. The most common is a term bond, which has a single maturity date. Alternatively,
• a serial obligation bond issue has a series of maturity dates, perhaps 20 or 25. Each maturity, although a subset of the total issue, is really a small bond issue with generally a different coupon. Municipalities issue most serial bonds.
The principal, or par value, of an issue represents the original value of the obligation. This is generally stated in $1,000 increments from $1,000 to $25,000 or more. Principal value is not the same as the bond's market value. The market prices of many issues rise above or fall below their principal values because of differences between their coupons and the prevailing market rate of interest. If the market interest rate is above the coupon rate, the bond will sell at a discount to par. If the market rate is below the bond’s coupon, it will sell at a premium above par.
If the coupon is comparable to the prevailing market interest rate, the market value of the bond will be close to its original principal value. Finally, bonds differ in terms of ownership. With a bearer bond, the holder, or bearer, is the owner, so the issuer keeps no record of ownership. Interest from a bearer bond IS. obtained by clipping coupons attached to the bonds and sending them to the issuer for payment. In contrast, the issuers of registered bonds maintain records of owners and pay'the interest directly to them. Types of issues in contrast to common stock, companies can have many different bond issues outstanding at the same time. Bonds can have different types of collateral and be either senior, unsecured, or subordinated (junior) securities. Secured (senior) bonds are backed by a legal claim on some specified property of the issuer in the case of default. For example, mortgage bonds are secured by real estate assets; equipment trust certificates, which are
Self-Instructional Material76

used by railroads and airlines, provide a senior claim on the firm’s equipment. Unsecured bonds (debentures) are backed only by the promise of the issuer to pay interest and principal on a timely basis. As such, they are secured by the general credit of the issuer. Subordinate (junior) debentures possess a claim on income and assets that is subordinated to other debentures. Income issues are the most junior type because interest them is paid only if it is earned. Although income bonds are unusual in the corporate sector, they are very popular municipal issues, where they are referred to as revenue bonds. Finally, refunding issues provide funds to prematurely retire another issue. The type of issue has only a marginal effect on comparative yield because it is the credibility of the issuer that determines bond quality. A study of corporate bond price behaviour found that whether the issuer pledged collateral did not become important until the bond issue approached default. The collateral and security characteristics of a bond influence yield differentials only when these factors affect the bond’s quality ratings.
Risk and Return
NOTESon
Indenture ProvisionsThe indenture is the contract between the issuer and the bondholder specifying the issuer’s legal requirements. A trustee (usually a bank) acting on behalf of the bondholders ensures that all the indenture provisions are met, including the timely payment of interest and principal. AH the factors' that dictate a bond’s features, its type, and its maturity are set forth in the indenture.
Features Affecting Bond’s MaturityInvestors should be aware of the three alternative call option features that can affect the life (maturity) of a bond. One extreme is a freely callable provision that allows the issuer to retire the bond at any time with a typical notification period of 30 to 60'days. The other extreme is a noncallable provision wherein the issuer cannot retire the bond prior to its maturity.3 Intermediate between these is a deferred call provision, which means the issue cannot be called for a certain period of time after the date of issue (e.g., 5 to 10 years). At the end of the deferred call period, the issue becomes freely callable. Callable bonds have a call premium, which is the amount above maturity value that the issuer must pay to the bondholder for prematurely retiring the bond. A nonrefunding provision prohibits a call and premature retirement of an issue from the proceeds of a lower-coupon refunding bond. This is meant to protect the bondholder from a typical refunding, but it is not fool proof. An issue with a nonrefunding provision ■ can be called and retired prior to maturity using other sources of funds, such as excess cash
. from operations, the sale of assets, or proceeds from a sale of common stock. This occurred on several occasions'during the 1980s and 1990s when many
Self-Instrudtonal Material 77

issuers retired nonrefundable high-coupon issues-early because they could get the cash from one of these other sources and felt that this was a good financing decision.
Another important indenture provision that can affect a bond’s maturity is the sinking fund, which specifies that a bond must be paid off systematically over its life rather than only at maturity. There are numerous sinking-fund arrangements, and the bondholder should recognize this as a feature that can change the stated maturity of a bond. The size of the sinking fund can be a percentage of a given issue or a percentage of the total debt outstanding, or it can be a fixed or variable sum stated on a dollar or percentage basis. Similar to a call feature, sinking fund payments may commence at the end of the first year or may be deferred for 5 or 10 years from date of the issue. The amount of the issue that must be repaid before maturity from a sinking fund can range from a nominal sum to 100 per cent. Like a call, the sinking- fund feature typically carries a nominal premium but . is generally smaller than the straight call premium 1 per cent). For example, a bond issue with a 20-year maturity might have a sinking fund that requires that 5 per cent of the issue be retired every year beginning in year 10. By year 20, half of the issue has been retired and the rest is paid off at maturity. Sinking-fund provisions have a small effect on comparative yields at the time of issue but have little subsequent impact on price behaviour. A sinking- fund provision is an obligation and must be carried out regardless of market conditions. Although a sinking fund allows the issuer to call bonds on a random basis, most bonds are retired for sinking-fund purposes through direct negotiations with institutional holders. Essentially, the trustee negotiates with an institution to buy back the necessary amount of bonds at a price slightly above the current market price.
SsciiT-Uy andInvP.ntmenl Management
NOTES
Rates^of Return on Bonds
.The rate of return on a bond is computed in the same way as the rate of return on stock or any asset. It is determined by the beginning and ending price and the cash flows during the holding period. The major difference between stocks and bonds is that the interim cash flow on bonds (i.e., the interest) is contractual and accrues over time as discussed subsequently, whereas the dividends on stock may vary. Therefore, the holding period return (HPR) for a bond will be:
^u+1 + Ml.t. HPR l.t Pl.t
where:
HPR.. = the holding period return for bond i during period t
= the market price of bond i at the end of period tI. t
P. if
78 Self-Instructional Material

= the market price of bond i at the beginning of period t
= the interest paid or accrued .on bond i during period t. Because the interest payment is contractual, it accrues over time and if a bond owner sells the bond between interest payments, the sale price includes accrued interest.
. The holding period yield (HPY) is:
P. Risk and Returni, t
Intt. t
NOTES
HPY = HPR ~ 1.
Note that the only contractual factor is the amount of interest payments. The beginning and ending bond prices are determined by market forces. Notably, the ending price is determined by market forces unless the bond is held to maturity, in which case the investor will receive the par value. These price variations in bonds mean that investors in bonds can experience capital gains or losses. Interest rate volatility has increased substantially since the
; 1960s, and this has caused large price fluctuations in bonds. As a result, capital gains or losses have become a major component of the rates of return on bonds. - .
Valuation is the process of determining the fair value of a financial asset. In this chapter, we will explain the general principles of bond valuation. Our focus will be on how to value option-free bonds.
2.21 GENERAL PRINCIPLES OF BOND VALUATION: BOND
THEOREM
The fundamental principle of valuation is that the value of any financial asset is equal to the present value of its expected future cash flows. This principle holds for any financial asset from zero-coupon bonds to interest rate swaps. Thus, the valuation of a financial asset involves the following three steps;
Step 1: Estimate the expected future cash flows.
Step 2: Determine the appropriate interest rate or interest rates that should ■ be used to discount the cash flows.
Step 3: Calculate the present value of the expected future cash flows found in Step .l by the appropriate interest rate or interest rates determined in Step 2. ■
Estimating Cash FlowsCash flow is simply the cash that is expected to be received in the future from owning a financial asset. For a fixed-income security, it does not matter whether the cash flow is interest income or repayment of principal.
Self-Instructional Material' 79

A security’s cash flows represent the sum of each period’s expected cash flow.. Even if we disregard default, the cash flows for only a few fixed-income securities are simple to forecast accurately. Noncallable U.S. Treasury securities.possess this feature since they have known cash flows. For Treasury coupon securities, the cash flows consist of the coupon interest payments every six months up to and including the maturity date and the principal repayment at the maturity date. Many fixed-income securities have features that make estimating their cash flows problematic. These features may include one or more of the following:
1. The issuer or the investor has th option to change the contractual due • date of the repayment of the principal.
2. The coupon and/or principal payment is reset periodically based on a formula that depends on one or more market variables interest rates, inflation rates, exchange rates, etc.).
3. The investor has the choice to convert or exchange the security into common stock or some other financial asset.
Callable bonds, putable bonds, mortgage-backed securities, and assetbacked securities are examples of (1). Floating-rate securities and Treasury Inflation Protected Securities (TIPs) are examples of (2). Convertible bonds and exchangeable bonds are examples of (3).
For securities that fall into the first category, a key factor detemiining whether the owner of the option (either the issuer of the security or the investor) will exercise the option to alter the security’s cash flows is the level of interest rates in the future relative to the security’s coupon rate. In order to estimate the cash flows for these types of securities^ we must determine how the size and timing of their expected cash flows will change in the future. For example, when estimating the future cash flows of a callable bond, we must account for the fact that when interest rates change,.the expected cash flows change. This introduces an additional layer of complexity to the valuation process. For bonds with embedded options, estimating cash flows is accomplished by introducing a parameter that reflects the expected volatility of interest rates.
Sei-urily Analyms and . Investment Manaf’enient
NOTES
2.22 TERM STRUCTURE OF INTEREST RATES
Once we estimate the cash flows for .a fixed-income security, the next step is to determine the appropriate interest rate for discounting each cash flow. Before proceeding, we pause here to note that we will once again use the terms “interest rate,” “discount rate,” and “required yield” interchangeably throughout the chapter. The interest' rate used to discount a particular security’s cash flows will depend on three basic factors; (1) the level of
Self-Instructional Material80

benchmark interest rates {i.e., U.S. Treasury rates); (2) the risks that the market perceives the security holder is exposed to; and (3) the compensation the market expects to receive for these risks.The minimum interest rate that an investor should require is the yield available in the marketplace on a default-free cash flow. For bonds with dollar-denominated cash flows, yields on U.S. Treasury securities benchmarks for default-free interest rates. For now, we can think of the minimum interest rate that investors require as the 3aeld on a comparable maturity Treasury security.The additional compensation-or spread over the yield on the Treasury issue that investors will require reflects the additional risks the investor faces by acquiring a security that is not issued by the U.S. government. These risks include default risk, liquidity risk, and tlje risks associated with any embedded options. These rield spreads will'depend not only on the risks an individual issue is exposed to but also on the level of Treasury yields, the market’s risk aversion, the business cycle, and so forth.For each cash flow estimated, the same interest rate can be used to calculate the present value. This is the traditional approach to valuation and it serves as a useful starting point for our discussion. We discuss the traditional approach in the next section and use a single interest rate to determine present values. By doing this, however, we are implicitly assuming that the yield curve is flat. Since the yield curve is almost never flat and a coupon bond can be thought of as a package of zero-coupon bonds, it is more appropriate to value each cash flow using an interest rate specific to that cash flow. After the traditional approach to valuation is discussed, we,will explain the proper approach to valuation using multiple interest rates and demonstrate why this must be the case.
Rixk and Return
NOTES
serve as
Discounting the Expected Cash FlowsOnce the expected (estimated) cash flows and the appropriate interest rate or interest rates that should be used to discount the cash flows are determined, the flnal step in the valuation process is to value the cash flows. The present value of an expected cash flow to be received t years from now using a discount rate i is: '
expected cash flow in period tpresent value^ =(1 + 0'
The value of a flnancial asset is then the sum of the present value of all the - expected cash flows. Specifically, assuming that there are N expected cash flows:
, value = present value^ + present valueg + ... + present value^
Self-Inutruitionat Material 81
.>

Security Analysis and Investment Management
Determining a Bond’s ValueDetermining a bond’s value involves computing the present value of the expected future cash flows using a discount rate that reflects market interest rates and the bond’s risks. A bond’s cash flows come in two forms-TCOupon interest payments and the repayment of principal at maturity. In practice, many bonds deliver semiannual cash flows. Fortunately, this does not introduce any complexities into the calculation.Two simple adjustments are needed. First, we adjust the coupon payments
by dividing the annual coupon payment by 2. Second, we adjust the discount rate by dividing the annual discount rate by 2. The time period t in the present value expression is treated in terms of 6-month periods as opposed to years.
NOTES
2.23 DURATION
As a bond moves towards its maturity date, its value changes. More specificall}', assuming that the discount rate does not change, a bond’s value:1. Decreases over time if the bond is selling at a premium.2. Increases over time if the bond' is selling at a discount.3. Is unchanged if the bond is selling at par value;At the maturity date, the bond’s value is equal to its par or maturity value. So, as a bond’s maturity approaches, the price of a discount bond will rise to its par value and a premium bond will fall to its par value— a characteristic sometimes referred to as “pull to par value”.
2.24 OVERVfEW OF DERIVATIVE MARKETS
As with any financial product, derivative transactions have a specific terminology that must be understood in order to use these instruments effectively. Unlike, many other securities, however, the language used to describe forward, futures, and option contracts is often a confusing blend^f jargon drawn fi'om the equity, debt, and insurance markets with some unique expressions thrown in for good measure. Thus, we begin by summarizing the most important aspects of these products and the markets in which they trade.
82 Self-Instructional Material

Risk and ReturnTypes of Derivative Positions
NOTESOption ContractsForward/Fuiures Contracts
1. Long Position2. Short Position Cails Puts
3. Long Position4. Short Position
Exhibit 2.7. Basic Types of Derivative Positions.
Before we examine the relevant details of each contract,.it is useful to first consider the basic ,t5rpes of positions that an investor can hold in these markets. Exhibit 2.7 illustrates the possibilities. The chart reinforces the point made earlier that, at the broadest level, there are only two kinds of derivatives available: (1) forward and futures contracts, and (2) option contracts.. Further, as we will explain shortly, while there need be only one forward contract for any particular maturity date and underlying asset, there must be two types of options—calls and .puts—in order.
5. Long PosiUon6. -Short Position
The Language and Structure of Forward and Futures MarketsTo most investors; the forward contract is the most basic derivative product available. Generally, a fonyard contract gives its holder both the right and the full obligation to conduct a transaction involving another security or commodity—the underlying asset—at a predetermined future date and at a predetermined price. The future date on which the transaction is to be consummated is called the contract’s maturity (or expiration) date, while the . predetermined price at which the trade takes place is the forward contract price. Notice there must always be two parties (sometimes called counterparties) to a forward transaction: the eventual buyer (or long position), who pays the contract price and receives tire underlying security,
’and the eventual seller (or short position), who delivers the security for the fixed price.
Forward and Spot Markets Forward contracts are not securities in the traditional sense; they are more appropriately viewed as trade agreements negotiated directly between two parties for a transaction that is scheduled to take place in the future. Suppose, for example, that two investors agree at Date 0 (the present) to transfer a bond from one party to the other at the future Date T. To specify the full terms of this agreement, the two parties must agree on which bond and how much of it is to be exchanged, the date.
Self-Instructional Material 83

Security Analysis and and location at which this exchange will take place, and the price at which the bond will be bought and sold. Consequently, the terms that must be considered in forming a forward contract are the same as those that would be necessary for a bond transaction that settled immediately {i.e., a spot market transaction) but with two exceptions.First, the settlement date agreed to in the contract is purposefully set to be in the future. Second, the contract price—which we will represent as F, meaning a forward price set at Date 0 for'a contract that matures at Date T—is usually different from the prevailing spot price (Sq) because of the different time frames involved. Typically, j is chosen so that neither party needs to make an upfront payment to the other.
One important way in which spot and forward market transactions are similar is the conditions under which the long and short positions will profit. To illustrate this idea, suppose that at Date T, the, long position in a bond forward contract is obligated to pay $1,000 (= Fq j-) for a bond that is worth ST = $1,050 {i.e., the spot price at Date T). Since Fgj, < this will result in a profitable settlement for the long position in the contract since he will be able to acquire the bond for $50 less than its current market value. On the other hand, the short position must deliver the bond at Date T and will lose $50 on her forward position; she would have profited if Sj. had been below the contract price of $1,000. Thus, just as if the bond had been purchased at Date 0, the long position benefits when bond prices rise, at least relative to'the contract price Fg y. Conversely, the short position to the forward contract will gain from falling bond prices, just as if she had short sold the bond at Date 0. Even though the timing of the trade’s settlement has shifted, “buy low, sell high” is still the way to make a profit in the forward market.
Forward and Futures Markets Forward contracts are negotiated in the over- the-counter market. This means that forward contracts are agreements between two private parties—one of which is often a derivatives intermediary, such as a commercial or an investment bank—rather than traded through a formal security or commodity exchange, One advantage of this private arrangement is that the terms of the contract are completely flexible; they can be whatever any two mutually consenting counterparties agree to. Another desirable feature to many counterparties is that these arrangements may not require collateral; instead, the long and short positions sometimes trust each other to honor their respective commitments at Date T. This lack of
■ collateral means that forward contracts involve credit (or default) risk, which is one reason why commercial banks are often market makers in these instruments.
One disadvantage of a forward contract is that it is quite often illiquid, meaning that it might be difficult or costly for a counterparty to exit the contract before it matures. Illiquidity is really a by-product of the contract’s flexibility because the more specifically tailored an agreement is to the needs of a particular individual, the less marketable it will be to someone else.
Investment Management
NOTES
O.T,
Siplf Instructional Material84

Futures contracts solve this problem by standardizing .the terms of the agreement {eig., expiration ’date, identity and amount of the underlying asset) to the extent that it can be exchange traded. In contrast to the forward ' market, both parties in a futures contract trade through a centralized market, called a futur^d exchange. Although the standardization of contracts reduces the abili^'y '^f the ultimate end users to select the most desirable terms, it does create contract homogeneity, whereby the counterparties can always unwind a previous commitment prior to expiration by simply trading their existing position back to the exchange at the prevailing market price.
The futures price is analogous to the forward contract price and, at any time during the life of a contract, is set at a level such that a brand-new long- or
• short positioh would not have to pay a premium to enter the agreement. However, the futures exchange will require both counterparties to post collateral, or margin, to protect itself against the possibility of default. (A futures exchange is not a credit-granting institution.) These margin accounts are held by the exchange’s clearinghouse' ai.n6. are marked to market (i.e., adjusted for contract price movements) on a daily basis to ensure that both end users always maintain sufficient collateral to guarantee their eventual participation. A list of some of the more popular futures contracts, along with the markets where they trade, is shown in Exhibit 2.8. Although generally quite diverse, all of these underlying assets have two things in common: volatile price movements and strong interest from both buyers and sellers.
Risk and Return
C.
NOTES
Underlying Asset Exchange
A. Physical CommoditiesCorn, soybeans, soybean meal, soybean oil, wheat Cattle—feeder, cattle—live, hogs, pork bellies
Lumber Dairy
Cocoa, coffee, sugar—world, sugar—domestic Copper, gold, silverCrude oil, heating oil, gasoline, natural gas
PlatinumB. Financial SecuritiesYen, Euro, Canadian dollar, Swiss franc,British pound, Mexican peso, Australian dollar, Treasury bills, Eurodollar (LIBOR), S&P 500 Index, Nikkei 225 Index, Russell 2000 Index Treasury bonds. Treasury notes. Municipal bond index, federal funds
Dow Jones Industrials Average ...Euro LIBOR, British gilt, German Euro govt, bond
Canadian Bankers Acceptance, Canadian Bond FT-SE 100 Index
Chicago Board of Trade Chicago Mercantile Exchange
Cocoa, Sugar and Coffee Exchange Now Yok Commodity Exchange New York Mercantile Exchange
International Monetary Market (Chicago Mercantile Exchange)
Chicago Board of Trade
London International Financial Futures and Options Exchange
Exhibit 2.8. Popular Futures Contracts and Exchanges.
Self-Instructional Material 85

Security Analysis andInvestment Management 2.25 TRADING WITH DERIVATIVE SECURITIES
Although the preceding section highlighted many of the differences between forward and option agreements, the two types of derivatives are quite similar in terms of the benefits they produce for investors. The ultimate difference • between forwards and options lies in the way the investor must pay to
' acquire those benefits. This concept, along with an examination of the basic payoff structures that exist in these markets, is described in the following sections.
NOTES
The Basic Nature of Derivative InvestingConsider an investor—call him Investor 1—who has decided to purchase a share of stock in SAS Corporation six months from now, a time frame that coincides with an anticipated receipt of funds. We will assume that both SAS stock forward contracts and call options are available with the 'market prices of Fq j. and (where T = 0.50 year) and that the exercise price of the call option, X, is equal to j-. Thus, if the investor wants to secure the price now at which the stock purchase will eventually take place, he has two alternatives; a long position in the forward or the purchase of the call option. Exhibit 2.8 compares the Date 0 and Date T cash flow exchanges for both possibilities.
The clear difference between these strategies at the time of origination is that the forward position requires no pajroent or receipt by either party to the transaction whereas the investor {i.e., the call buyer) must pay a cash premium to the seller of the option. As noted earlier, this front-end option payment releases the investor from the obligation to purchase SAS stock at Date f if the terms of the contract turn out to be unfavourable (i.e., Sj, < X). This is shown in the lower panel of Exhibit 11.2. 'When the expiration date price of SAS stock exceeds the exercise price, the investor will exercise the call and purchase the share of stock. Notice however, that this leads to exactly the same exchange as did the long forward contract. It is only when the stock price falls below X (and Fq j,) on Date T that there is a difference between the two positions; under this condition, the right provided by the option not to purchase SAS stock is valuable since the investor will be required to execute his forward contract at a loss. In this sense, the call option can be viewed as the “good half ” of the long forward position because it allows for the future acquisition of SAS stock at a fixed price but doesn’t require the transaction to take place. This is the critical distinction between forward and option contracts. Both the long forward and the long call positions have been structured to provide the investor with exactly the same amount of “insurance” against the price of SAS stock rising over the next six months. That is, both contracts provide a payoff of [S,. — X\ = [S-p - ^1 whenever Sp exceeds X,which reduces the effective purchase price for the stock back down to X. The
• Self-Instructional Material86

Risk and Returndifference in contract design can then be viewed in terms of how the investor is required to pay for that price insurance. With a forward contract, no money is paid up front, but the investor will have to make a payment at the- expiration date even if the stock price falls below Fq Conversely, the call option will never require a future settlement payment, but the investor will have to pay. the premium at origination. Thus, for the same Date T benefit, the investor’s decision between these two “insurance policies” comes down to choosing the certainty of a present premium payment {i.e., long call) versus the possibility of a future payment {i.e., long forward) that could potentially . be much larger.
NOTES
A. Exchange at Origination (i.e., Date 0) Forward; Call Option:
Investor 1 (i.e.. Call Buyer)
Investor 1 (i.e., Long Forward)
CallShortFonward ♦ SellerPremium
Initial Cost: Premium > 0• Initial Cost: 0B. Exchange at Contract Expiration (i.e., Date 7)
Forward: Call Option:())lf Sr>X(= Fo,):
Stock StockInvestor 1 (i.e., Call
Buyer)
investor 1 (i.e.. Long Fon^ard)
♦ ♦ShortForward
CallSeller-*
^O.T X
Net Contract Receipt: IS7—X] > 0Net.Contract Receipt: (Sr-Fj, j-] > 0(2) If Sr<X(=Fo,r);
StockInvestor 1 (i.e., Call Buyer)
Investor 1 (i.e.. Long Fonward)
CallShortForward Seller♦
^o.r
Net Contract Receipt: [S7—Fo 7] < 0 Net Contract Receipt: 0
Exhibit 2.9. Exchanges for Long Forward and Long Call Transactions
To see this distinction more clearly, suppose that Investor 1 plans to buy SAS stock in six months when some of the bonds in his portfolio mature. He is concerned that share values could rise substantially between now and the time he receives his investment funds, and so to'hedge that risk he considers two “insurance” strategies to lock in the eventual purchase price: (1) pay'
• nothing now to take the long position in a six-month SAS stock forward contract with a contract price of Fqj,= $45, or (2) pay a premium of Cqj. = $3.24 for a six-month, European-style call option with an exercise price of X = $45. Assuming that at the time of his decision the price of SAS stock is Sq = $40, the call option is out of the money, meaning that its intrinsic value is zero and the entire $3.24 is time premium. As mentioned earlier, an obvious difference between these two strategies is that the option entails a front-end expense while the forward position does not. '
Self-Instructional Material 87

;
The other difference occurs at the expiration date, depending on whether the SAS stock price is above or below $45. If, for instance, = $51, both the long forward position and the call option will be worth $6 (i.e., 51 - 45) to the investor, reducing his net purchase price for SAS shares to $45 (= 51 - 6). That is, when the stock settled above $45 (i.e., the common value for Fg j. and X), both the long forward and long call positions provided the same protection against rising prices. On the other hand, if Sj, = $40.75, the forward contract would have required that the investor pay $4.25 (= 40.75 - 45) to his counterparty, which would have once again raised the net cost of his shares to $45. With the call .option, however, he could have let the contract expire without exercising it and purchased-his SAS shares in the market for only $40.75. Thus, in exchange for the option’s front-end expense of $3.24, the investor retains the possibility of pa3dng less than $45 for his eventual stock purchase.
The connection between forward contracts and put options can be made in a similar fashion. Suppose a different investor—call her Investor 2—has decided to liquidate a share of SAS stock from her portfolio in six months’ time. Rather than risk k falling stock price over that period, she could arrange now to sell the share at that future date for a predetermined fixed price in one of two ways: a short forward position or the purchase of a put option. Exhibit 2.9 illustrates the exchanges for these alternatives. Once again, for the same insurance against SAS stock price declines, the choice comes down to the certainty of paying the put option premium versus the possibility of
A. Exchange at Origination [i.e., Date 0)
'Forward:
Security Analysis and Investment Management
NOTES
Put Option:
investor 2 [i.e., Put Buyer)
investor 2 [i.e., Short Forward)
PutLongForward SetterPremium
Initial Cost: Premium > 0initial Cost: 0B. Exchange at Contract Expiration (i.e., Date T)
Put Option:Forward:
(f) It Sr>X(=Fo,r):
StockInvestor 2 (i.e., Put Buyer)
Investor 2 (i.e., Short Forward)
> PutLongForward Seller
^o.rNet Contract Receipt: 0Net Contract Receipt. [Fj,^r- S,| < 0
(2) It Sr<X(=faj):StockStock Investor 2
(i.e.. Put Buyer)
Investor 2 (i.e., Short Fonward)
♦ PutLongForward Seller*♦
XF3 T ---------------
Net Contract Receipt. [F^j—S,-] > 0
Exhibit 2.10. Exchanges for short forward and long put transactions
Net Contract Receipt: [X - S^) > 0
Self-lnstructioiiat Materia!88

.Risk and Returnmaking a potentially larger payment with the forward contract by having to sell her stock for X (= F0,7^ when that value is considerably less than the stock’s Date T market price, importantly, notice once again that the put option allows the investor to walk away from her obligation under the short forward position to sell her stock on the expiration date under disadvantageous conditions. Thus, in exchange for a front-end premium payment, the put option enables the investor to acquire the “good hair of the short position in a forward contract. ^
NOTES
2.26 VALUATION
Beyond the unique risk-reward profiles they offer as stand-alone investments, derivatives also are used widely in investment management to restructure the fundamental nature of an existing portfolio of assets. Typically, the intent of this sort of restructuring is to modify the portfolio’s risk. In this section, we review three prominent derivative applications in the management of equity positions: shorting forward contracts, purchasing protective pu^, and purchasing equity collars.
Restructuring Asset Portfolios with Forward ContractsSuppose the manager of a small corporate pension fund currently has all of
, her investable funds committed to a well-diversified portfolio of equity securities designed to reflect the movements of a broad indicator of the stock market’s performance, such as Standard & Poor’s 500 index.
Implicit in this investment approach is the manager’s belief that she cannot “add value” by trying to select superior individual securities. She does, however, feel that it is possible to take advantage of perceived trends at a macroeconomic level by switching her funds between her current equity holding' and any of several other portfolios mimicking different asset classed ie.g., fixed-income, cash equivalents), depending on her forecast of future events. Switching a portfolio’s composition in an attempt to time general market movements instead of company-specific trends is known as tactical asset allocation.The stock market has increased steadily over the past several months, and the pension fund has a present market value of $100 million. At this time, though, the manager has become concerned about the possibility that inflationary pressures will dampen corporate earnings and drive stock prices down. Although it is unclear now whether this concern will be realized, she feels confident that the uncertainty will be resolved in 'the coming quarter. Accordingly, she would like to shift her allocation from 100 percent equity to 100 percent T-bills for the next three months. There are two ways she can
89Self-Instructional Material

Security Analysis and Investment Manage?}ient
make this change. The most direct method would be to sell her stock portfolio and buy $100 million (less the transaction costs) of 90-day T-bills. When the T-bills mature in three months, she could then repurchase her original equity holdings. ' ' '
The second approach would be to maintain her current stock holdings but convert them into a synthetic risk-free position with a three-month forward contract specifying $100 million of the stock index as the underlying asset. As we will see later, the primary benefit of this approach is that it is often more cost-effective and quicker to implement. This is a classic example of a hedge position, wherein the price risk of the underlying asset is offset (rather than eliminated) by a supplementary derivative transaction. The following table captures the dynamics of this hedge at a basic level.
NOTES
Desired Forward ExposureEconomic Event Actual Stock Exposure
GainStock prices fall
Stock prices rise
Loss
LossGain
To neutralize the risk of falling stock prices, the fund manager will need to adopt a forward position'that benefits from that potential movement. Said differently, the manager requires a hedge position with payoffs that are negatively correlated with those of the existing exposure. This requires committing to the short side of the contract. This hedging ailment is identical to the point we made in the portfolio formation analysis that it is always possible to combine two perfectly negatively correlated assets to create a risk-free position.
United Kingdom
<FT-SE 100)
Germany HongKong,(HangSeng)
United States
(S&P 500)
Japan France
Cost Factor (Nikkei 225) (CAC 40) (DAX)
A. Stock
Commissions Market impact Taxes
o.m 0.20% 0.25% 0.25% 0.50%0.20%
- 0.30 0.70 0.50 0.500.70 0.50
0.00 0.50 0.00 0.340.21 0.00
1.40%. 1.34%Total 0.42%r 1.11%. 0.75%. • 0.75%.
B. Futures
Commissions Market impact Taxes
0.01%. 0.02% 0.03%. 0.02%. 0.05%.0.05%f
0.10 0.100.05 0.10 0.10 0.10
0.000.00 0.00 •0.00 0.000.00
Total 0.12% 0.12% 0.15%0.06% 0.15% 0.13%
Exhibit 2.11. Comparative Stock and Stock Futures Trading Costs
90 Self-Instructional Material

Risk and ReturnThe primary benefit of converting the pension fund’s asset allocation using this approach is that it is far more cost-effective than the physical transformations demanded by the first solution. For instance, Exhibit 2.11 shows that when all of the costs of transaction are considered {e.g., trading
. commissions, market impact, taxes), the average expense of actually rebalancing a U.S. equity portfolio is about 42 basis points of the position’s value, while the same trade with an equity forward contract would cost just 6 basis points. Trading expenses in other countries, though different in absolute level, reflect this same general trend.
NOTES
2.27 SUMMARY
• Risk may be understood as the possibility of adverse happening. Weconsider those situations as risky, if they involve larger deviations from the expectations. -
• Return is something received back. In the field of financial decision-making the manager invests the company’s money on diverse fixed and current assets and hopes to receive something back on his investment.
• Arbitrage pricing theory is one of the tools used by the investors and portfolio managers.
• Dealing on the stock exchange are subject to the byelaws and rules of the . stock exchange.
• Ready delivery contract is also known as cash trading or cash transactions.
• The nature of the futures contract specifies a buyer and a seller who agree to buy or sell a standard quantity of the underlying at a designated
future date.
• The contract with the closest settlement is call the nearby futures contract and is usually the most liquid.
• Public bonds are long-term, fixed-obligation debt securities packaged in convenient, affordable denominations for sale to individuals and financial institutions.
• A bond’s maturity is the sinking fund, which specifies that a bond must . be paid off systeinatically. over its life rather than only at maturity.
• The rate of return on a bond is computed in the same way as the rate of return on stock or any asset.
Self-Instructional Material 91
Si’ciirity Aiialy>iis andInfcslriKait Management 2.28 REVIEW QUESTIONS
1. Define the concept of Return.2. Define the concept of Risk.3. What factors to cause variations in Return and risk?4. What ai'e the various statistical techniques available to measure risk?5. Explain with suitable illustrations the contribution of CAPM.6. Explain in brief the ideas of Arbitrage Pricing Theory.7. Discuss the role and importance of stock exchange,8. Briefly explain the function and dealing of stock exchange.9. Discuss the rationale for expecting an efficient capital market. What factor
would you look for to differentiate the market efficiency for two alternative stocks?
10. Define and discuss the weak-forra EMH. Describe the two sets of tests used to examine the weakform EMH.
11. Define and discuss the semistrong-form EMH. Describe the two sets of tests used to examine the semistrong-form EMH.
12. What is the role of derivatives in the market?13. Explain equity derivatives market.14. Explain Listed versus OTC Equity Options.15. What are the basic features of bond?16. What are basic characteristics of bond?17. What is the general principle of bond valuation?18. What is the process to determine the appropriate interest rate or rates ?19. Discuss the derivative markels'T
20. Di.scuss Language and Structure of Forward and Futures Markets.21. What is Basic Nature of Derivative Investing?.
NOTES
2.29 FURTHER READINGS
1. Investment Management: B.L. Mathur, Mohit Pub, 2002.
2. Investment Management: Performance Evaluation of Different Schemes of Mutual Funds: Martina R Noronha and Samta Trivedi, ABD Pub, 2008.
3. Investment Management and Security Analysis: Text and Cases: •Dhanesh Kumar Kliatri, Macmillan, 2006. .
4. Investment Management and Stock Market: Edited by A.K. Vashisht and K.K. Gupta, Deep and Deep, 2005.
5. Security Analysis and Investment Management: O.P. Agarwal, Himalaya Publishing House, 2011.
□□□Selfln.^trurtional Material92

An Introduction to Portfolio ManagementUNIT 3 AN INTRODUCTION
TO PORTFOLIO
MANAGEMENT NOTES
★ STRUCTURE ★
3.0 Learning Objectives
3.1 'Introduction
3.2 Portfolio Concept
3.3 Markowitz Portfolio Theory
3.4 Portfolio Risk and Return
3.5 Selection of Portfolio
3.6 Capital Market Theory: An Overview
3.7 The Capital Asset Pricing Model: Expected Return and Risk
3.8 Empirical Tests of the CAPM
3.9 Relationship-betw.een.SystematiC-Risk-and Return
3.10 The Market Portfolio: Theory versus Practice
S.ll^Multifactor-Models of Risk and Return
3.12 Arbitrage Pricing Theory
3.13 Summary
3.14 Review Questions
■ 3.15 Fuither Readings
3.0 LEARNING OBJECTIVES
. After going through this unit, you ivill'be able to:• explain the portfolio concept.• discuss about the portfolio risk and return.• differentiate between beta as a measure of risk and calculation of beta.• define what is capital market theorem.• describe the CAPM and arbiti-age pricing theory.• know about the selection of portfolio.
Solf-Inatniilional Mnler:,,! 03

Security Analysis andIiiueslmenl Mana^ernenl. 3.1 INTRODUCTION
' One of the majoi' advances in the investment field during the past few decades has been the recognition that the creation of an optimum investment portfolio is not simply a matter of combining a lot of unique individual securities that have desirable risk-return characteristics. Specifically, it has been shown that you must consider the relationship among the investments if you are going to build an optimum portfolio that will meet your investment objectives. The recognition of what is important in creating a portfolio was demonstrated in the derivation of portfolio theory.
This chapter explains portfolio theory step by step. It introduces you to the basic portfolio risk formula-that you must understand when you are combining different assets. When j'ou undei*stand thi.s formula and its implications, you will increase your understanding of not only why you should diversify your portfolio but also how you should diversify. Tlie subsequent chapters introduce asset pricing models including capital market theory and multifactor models with an emphasis on determining the appropriate risk measure for individual assets.
NOTES
3.2 PORTFOLIO CONCEPT
Before presenting portfolio theory, we need to clarify some general assumptions of the theory. This includes not only what we mean by an optimum portfolio but also what, we mean by the terms risk aversion and risk.
One basic assumption of portfolio theory is that as an investor you want to maximize the returns from your investments for a given level of risk. To adequately deal with such an assumption, certain ground rules must be laid. First, your portfolio should include all of your assets and liabilities, not onlj' your stocks or even your marketable securities but also such items as your car, house, and less-marketabie investments, such as coins, stamps, art, antiques, and furniture. The full spectrum of investments must be considered because the returns from all these investments interact, and this relationship
. between the returns for assets in the portfolio is important. Hence, a good portfolio is not simply a collection of individually good investments. ■
Risk AversionPortfolio theory also assumes that investors are basically risk averse, meaning that, given, a choice between two assets with equal rates of return, the}' will select the asset w:th the lower level of risk] Evidence that most investors are risk averse is that they purchase various types of insurance.
!I4 Self-Instructional Material

including life insurance, car insurance, and health insurance. Buying insurance basically involves an outlay of a given amount to guard against an
■ uncertain, possibly larger outlay in the future. When you buy insurance, this implies that you are willing to pay the current known cost of the insurance policy to avoid the uncertainty of a potentially large future cost related to a car accident or a major illness. Further evidence of risk aversion is the difference in promised jrield (the required rate of return) for different grades of bonds that supposedly have different degrees of credit risk. Specifically, the promised yield on bonds increases as you go from AAA (the lowest-risk ' class) to AA to A, and so on—that is, investors require a higher rate of return to accept higher risk.
This does not imply that everybody is risk averse or that investors are completely risk averse regarding all financial commitments. The fact is, not everybody buys insurance for ever3dhing. Some people have no insurance against anything, either by choice or because they cannot afford it. In addition, some individuals.buy insurance related to some risks such as auto accidents
. or illness, but they also buy lottery tickets and gamble at race tracks or in casinos, where it is known that the expected returns are negative, which means that participants are willing to pay for the excitement of the risk involved. This combination of risk preference and risk aversion can be explained by an attitude toward risk that depends on the amount of money involved. Friedman and Savage speculate that this is the case for people who like to gamble for small amounts (in lotteries or slot machines) but buy insurance to protect themselves against large potential losses, such as fire or accidents.
While recognizing this diversity of attitudes, our basic assumption is that most investors committing large sums of money to developing an investment portfolio are risk averse. Therefore, we expect a positive relationship between expected return and expected risk.
An Intrtidiu'tinn to Portfolio Mniiaficinrnl
NOTES
ion of RiskAlthough there is a difference in the specific definitions of .' /.v/i’, and uncai'taitiiy. for our purposes and in most financial literature the two terms are used interchangeably. In fact, one way to define risk is the. uncertainty of future ■ outcomes. An alternative definition might be the probability of an adverse outcome. Subsequently, in our discussion of portfolio theory, we will consider several measures of risk that are used when developing the theory.
3.3 MARKOWITZ PORTFOLIO THEORY
In the early 1960s, the investment community talked about risk, hv was no specific measure for the term. To build a portfolio '
• M.'. ii'rii'i.

Security Analysts and investors had to quantify their risk variable. The basic portfolio model was Investment Management Harry Markowitz, who derived the expected rate of return for
a portfolio of assets and an expected risk measure. Markowitz showed that the variance of the rate of return was a meaningful measure of portfolio risk under a reasonable set of assumptions, and he derived the formula for computing the variance of a portfolio. This portfolio variance formula indicated the importance of diversifying your investments to reduce the total risk of a portfolio but also shoxved how to effectively diversify. The Markowitz model is based on several assumptions regarding investor behaviour:
• Investors consider each investment alternative as being represented by a probability distribution of expected returns over some holding period.
• Investors maximize one-period expected utility, and their utility curves demonstrate diminishing marginal utility of wealth.
• Investors estimate the risk of the portfolio on the basis of the variabilriy of expected returns.
• Investors base decisions solely on expected return and risk, so their utility curves are a function of expected return and the expected variance (or standard deviation) of returns only.
• For a given risk level, investors prefer higher returns to lower returns. ■ Similarly, for a given level of expected return, investors prefer less risk
to more risk.
Under these assumptions, a single asset or portfolio of assets is considered to be efficient if no other asset or portfolio of assets offers higher expected return with the. same (or lower) risk, or lower risk with the same (or higher)
'expected return:
NOTES
3.4 PORTFOLIO RISK AND RETURN
One of the best-known measures of risk is the variance, or standard deviation of expected, returns. It is a statistical measure of the dispersion of returns around the exj^ected value whereby a larger variance or standard deviation indicates greater dispersion. The idea is that the more disperse the expected returns, the greater the uncertainty of future retuims.
Another measure of risk is the range, of returns. It is assumed that a larger range of expected returns, from the lowest to the highest return, means greater uncertainty and risk regarding future expected returns. Instead of using measures that, analyze all deviations from expectations, some observers believe that when you invest you should be concerned only with returns below expectations, which means ihat you only consider deviations below the mean value, A measure that only considers deviations below the mean is the
9G Sflf-Instrut-lnynnl Mats rial

semivariance. Extensions of the semivariance measure only computed expected returns below zero (that is, negative returns), or returns below some specific asset such as T-bills, the rate of irifiation, or a benchmark. These measures of risk implicitly assume that investors want to minimize the damage from • returns less than some target rate.
Assuming that investors would welcome returns above some target rate, the returns above a target return are not considered when measuring risk. Although there are numerous potential measures of risk, we will use the variance or standard deviation of returns because (1) this measure is somewhat intuitive, (2) it is a correct and widely recognized risk measure, and (3) it has been used in most of the theoretical asset pricing models.
Expected Rates of ReturnThe expected rate of return for an individual investment is computed as shown in Exhibit 3.1. The expected return for an individual risky asset with the set of potential returns and an assumption of equal probabilities used in the example would be 11 per cent. The expected rate of return for a portfolio
. of investments is simply, the weighted average of the expected rates of return for the individual investments in the portfolio. The weights are the proportion of total value for the investment.
The expected rate of return for a hypothetical portfolio with four risky assets is shown in Exhibit 3.2. The expected return for this portfolio of investments would be 11,5 per cent. The effect of adding or dropping any investment from the portfolio would be easy to determine because you would use the new weights based on value and the expected returns for each of the investments. This computation of the expected return for the portfolio generalized as follows:
An Introduction to Portfolio Manaf’e.mi'.nt
NOTES
E{R ) =port1 = 1
where:
W. = the per cent of the portfolio in asset i
E {Rf = the expected rate of return for asset i
Possible Rate of Return (Per cent)
Expected Return (Per cent)Probability
.25 ,08 .0200,25 .10 .0250
. .25 .12 ,0300 •.25 .14 .0350
E(R) = .1100
Exhibit 3.1. Computation of Expected Return for an Individual Risky Asset.
Self-Instructional Material 97

- Sccwi’y Analyyii^ andExpected Security
Return E (r^)Expected Portfolio Return [w^ x e (r^)}
Weight (W^)(Per cent of Portfolio)
.0200.20 .10NOTES .0330.30 .11
.0360.30 .12
.0260.13.20
E(i?P„,,) = .1150
Exhibit 3.2. Computation of the Expected Return for a Portfolio of Risky Assets
Variance (Standard Deviation) of Returns for an Individual InvestmentAs noted, we will be using the variance or the standard deviation of returns as the measure of risk (recall that the standard deviation is the square root of the variance). Therefore, at this point, we will demonstrate how you would compute the standard deviation of returns for an individual investment. Subsequently, after discussing some other statistical concepts, we will consider the determination of the standard deviation for a portfolio of investments. The variance, or standard deviation, is a measure of the variation of possible rates of return, Ri, from the expected rate of return [E{Ri)] as follows:
(o2)VarianceI = 1
where
is the probability of the possible rate of return,
Standard Deviation (o) =\tT,
\The computation of the variance and standard deviation of the expected rate of return for the individual risky asset in Exhibit 3.1 is set forth in Exhibit 3.3.
Variance (Standard Deviation) of Returns for a PortfolioTwo basic-concepts in statistics, covariance and correlation, must be understood before we discuss the formula for the variance of the rate of return for a portfolio. Covariance of returns in this section, we discuss what the covariance of returns is intended to measure, give the formula for computing.it, and present an example of the computation.
Covariance is a measure of the degree to which two variables “move together” relative to their individual mean values over time. In portfolio analysis, we
•S'e//I iii’y:! 'dmr - mi98

An Introduction to Portfolio Managemcat
usually are concerned with the covariance of rates of return rather than prices or some other variable. A positive covariance means that the rates of return for two investments tend to move in the same direction relative to their individual means during the same time period. In contrast, a negative covariance indicates that the rates of return for two investments tend to move in different directions relative to their means during specified time intervals over time. The magnitude of the covariance depends on the variances of the individual return series, as well as on the relationship between the series.
Exhibit 3.4 contains the monthly closing prices and dividends for Coca-Cola and Home Depot. You can use these data to compute monthly rates of return for these two stocks during 2001. Exhibit 3.5 and Exhibit 3.6 contain a time- series plot of the monthly rates of return for the two stocks during 2001. Although the rates of return for the two stocks moved together during some months, in,other months they moved in opposite directions. The covariance statistic provides an absolute measure of how they moved together over time. For two assets, i and./', the covariance of rates of return is defined as;
NOTES
ExpectedPossible Rate Return of Return (Rj) E (R^)
R.-E(R.) [Ri-E(Ri)]'^ Pi (Ri-E(R/Pi
-.03 .0009 .25 .000225.08 .11.25.11 -.01 .0001
' .0001.000025.10
.25 .000025.12 .11 .01-25 .000225.11 .03 .0009.14
.000500
Variance (o^.i = .00050
Standard Deviation (o) = .02236
Exhibit 3.3. Computation of the Variance of the Expected Rate, of Return for an Individual Risky Asset'
Coca-Cola Home Depot
Rete of Dividend Return (%)
Rate of Return (%)
Closing Price
ClosingPrice ■ DividendDate
45-688Dec-00 60.9385.50-4.82 48.200Jan-01 58.000
-11.83-8.57 42.500Feb-01 ,53.0300.04 1.51-14.50 43.100Mar-01 46-160
Apr-01 46.1900.18 .
9.282.28 47.100
Sclf-loslnictional Material 99

Security.Ancilyf.in and I'lI'es-tmenI ManagenienI 4.652.62 49.290May-01 47.400
Jun-01 45.000
Jul-01 44.600
Aug-01 • 48.670 Sep-01 46.850
Oct-01 47.880
-4.080.18 -4.68 47.240 0.04
6.6850.370-0.89
-8.709.13 45.950 0.04NOTES-16.500.18 -3.37 38.370
-0.362.20 38.230
22.160.18 46.650 0.05Nov-01 46.960 -1.55
9.350.40 51.010Dec-01 47.150
) = 1.47E(R E‘R} = -1.81 liomc-dc‘ptitcDL*a*i:i)tn
. Exhibit 3.4. Computation of Monthly Rates of Return: 2001.
Cov.j ^Em,-E (Je,)l [Rj - E (Je,)]}When we apply this formula to the monthly rates of return for Coca-Cola and Home Depot during 2001, it becomes:
As can be seen, if the rates of return for one stock are above (below) its mean rate of return during a given period and the returns for the other stock are likewise above (below) its mean-rate of return during this same period, then the product of these deviations from the mean is positive.
ts.oo
a? lO ODa
c 5.00o
t 0.00ca -5.00CDcn> -10.00£cI -15.00
-20.00Jan Feb Mar Apr May Jun Jul Aug Sep Oct Nov Dec
Months
Exhibit 3.5. Time Series of Monthly Rates of Return for Coca-Cola: 2001
100 Sclf-lii.'<lrurlional Material

■Ai) IntrodiirUoi) In Portfolio Maiiane.mioxl25.00
20.00 I* 15.00
S 10.00C
NOTES-5a s.oo(0c
0.00=o. CEt -500 f -10.00O^ -15.00
-20.00 T
Feb, Mar Apr May Jun Jul Aug Sep Oct Nov DecMonths
Jan*
Exhibit 3.6. Time Series of Monthly Rates of Return for Home Depot: 2001
■ If this happens consistently, the covariance of returns between these two stocks will be some large positive value. If, however, the rate of return for one of the securities is above its mean return while the return on the other security is below its mean return, the product will be negative. If this contran^ movement happened consistently, the covariance between the rates of return for the two stocks would be a large negative value.
Monthly ReturnHome Depot-------------------------------------------------- Coca-Cola Home Depot Coca-Cola
Coca-Cola (R^ Home Depot (R.^ R,. - EtRi) R^ - E(R^ [R^ - E(RJ} x /R, - E(R^}Date
-12.13-3.01 4.035.50-4.82Jan-0189.81-13.29-11.83 -6.76-8.57Feb-01-0.490.041.51 • -12.69-14.50Mar-01
V 31.987.819.28 4.092.28Apr-01
May-01
Jun-01
14.113.184.65 4.43-2.6215.92-5.54-4.08 -2.87^.684.760.92 5.160.63Jul-01 -0.89
-111.16-10.16-8.70 10.949.13Aug-01
Sep-01
Oct-01
Nov-01
27.97-1.56 -17.96-16.50-3.37
-7.35-1.83-0.36 4.012.205.520.27 20.6922.16-1.55
17.477.889.35 2.220.40Dec-01
Sum = 76-42E(R^.) = 1.47ElRf) = -1.81
Covy = 76.42/12 = 6-37
Exhibit 3.7. Computation of Covariance of keturns for Coca-Cola and
Home Depot: 2001
V
Self-Iiistrurtioiia! Material 101

Exhibit 3.7 contains the monthly rates of return during 2001 for Coca-Cola and Home Depot as computed in Exhibit 3.4. One might expect the returns for the two stocks to have reasonably low covariance because of the differences in the products of these firms. The expected returns E(i?) were the arithmetic mean of the monthly returns: -
Security Anatyfiis and ■Managemenl
NOTES
And
1-12;
All figures {except those in the last column) were rounded to the nearest hundredth of 1 per cent. As shown in Exhibit 3.4, the average monthly return was -1.81 per cent for Coca-Cola and 1.47 per cent for Home Depot stock. The results in Exhibit 3.7 show that the covariance between the rates of return for these two stocks was:
• EiRd =j
= 1
1Coo,, =‘J 12
■ = 6.37
Interpretation of a number such as 6.37 is difficult; is ,it high or low for covariance? We know the relationship between the two stocks is generally positive, but it is not possible to be more specific. Exhibit 3.8 contains a scatter diagram with paired values of R-j and Rjf plotted against each other. This plot demonstrates the linear nature and strength of the relationship and show's several instances during 2001 when Coca-Cola experienced negative returns relative to its mean return when Home Depot had positive rates of return relative to its mean.
X 76.42
\I
/
25
•20■ ID 15Q
E 10oX
5SV)c 02 -20 5 • 10 15-5 0-15 -10
-5c:>.£ -10o <5 -15
' -20Monthly Returns for Coca-Cola
• Exhibit 3.8. Scatter Plot of Monthly Rates of Return for Coca-Colaand Home Depot: 2001
102 Self-Instructional Material

Covariance and Correlation: Covariance is affected by the variability of the two individual return series. Therefore, a number such as the 6.37 in our example might indicate a weak positive relationship if the two individual series were volatile but would reflect a strong positive relationship if the two series were very stable. Obviously, you want to “standardize” this covariance measure ^vMng into consideration the variability of the two individual return series, as follows:
An Introduction to Portfolio Management
NOTES
Cov,..'■-7 = a,a;I j
where;Ty = The correlation coefficient of returns
= The standard deviation of R-^= The standard deviation of R■jt
Standardizing the covariance by the individual standard deviations yields the correlation coefficient {r-p, which can vary only in the range -1 to +1. A value of +1 would indicate a perfect positive linear relationship between R- and Rj, meaning the returns for the two stocks move together in a completely linear manner. A value of -1 indicates a perfect negative relationship between the two return series such that when one stock’s rate of return is above its mean, the other stock’s rate of return will be below its mean by the comparable amount.
Home DepotCoca-Cola
[Rj - E(Rpf[Ri - E(R^f Rj - E(RpRi - E(Rf)Date
16.264.039.05Jan-01 -3.01176.69-13.2945.65 •Feb-01
Mar-01 Apr-01 May-01
- Jun-01 Jul-01 Aug-01 Sep-01 6ct-01
-6.760.04 0.00-12.69 161.01
61.067.814.09 16.75
10.133.1819.644.4330.74-5.548.24-2.87 '26.61
103.28
.322.67
5.160.850.92
-10.16119.6410.94
-17.962.42-1.56
-1.83 3.3616.094.01
428.0120.690.27 0.07Nov-0162.087.884.92Dec-01 2.22
Sum = 1240.90Sum = 404.34
Variance^ = 404.34/12 =
Standard Deviation^ = (33.69)^^^ = 5.80
Variancey = 240.90/12 =
Standard Deviation^ = (103.41)*^^ = 10.17
103.4133.69
Exhibit 3.9. Computation of Standard Deviation of Returns for Coca-Colaand Home Depot: 2001
Self-Instructional Material 103

To- calculate this standardized measure of the relationship, you need to compute the standard deviation for the two individual return series. We already have the values for R/^ - E{Rj) and Rji - EiRj) in Exhibit 3.7. We can square each of these values and sum them as shown in Exhibit 3.9 to calculate
■ the variance of each return series. . ■
Senirity Analysis and Inneslinent Management
NOTES
1o = •—(404..34) = 33.69 -12
And
1(1240.90) = 103.41<7 12
The standard deviation for each series is the square root of the variance for each, as follows:
= 5.80C:
Oy = V103.41 =
Thus, based on the covariance between the two series and the individual standard deviations, we can calculate the correlation coefficient bfetween returns for Coca-Cola and Home Depot as:
Cov,^. 6,376.37 = 0.108r-(5.80) (10,17) 58.99
•Obviously, this formula also implies that
Cov,^ = Ty o, o^-(.108) (5.80) (10.17),=. 6.37
0 (5:Q :J
as-computed in Exhibit 3.7-
3.5 SELECTION OF PORTFOLIO
As noted, a correlation of -i-1.0 would indicate perfect positive correlation, and a value of -1.0 would mean that the returns moved in a completely opposite direction. A value of zero would mean that the returns had no linear relationship, that is, they were uncorrelated statistically. That does not mean that they are independent. The value of r^j = 0.108 is quite low. This relatively low correlation is not unusual for stocks in diverse industries (i.e., beverages and building materials). Correlation between stocks of companies within some industries approaches 0.85.
Portfolio Standard Deviation formula now that we have discussed the concepts of covariance and correlation, we can consider the formula'for computing the standard deviation of returns for a portfolio of assets, our measure of risk for a portfolio. As noted, Harry Markowitz derived the formula
104 Self-lnKtruftio?ial Material

An Introduction to Portfolio Managt'.ment
for computing the standard deviation of a portfolio of assets. In Exhibit 3.2, we showed that the expected rate of return of the portfolio was the weighted average of the expected returns for the individual assets in the portfolio; the weights were the percentage of value of the portfolio. One might assume it is possible to derive the standard deviation of the portfolio in the same manner, that is, by computing the weighted average of the standard deviations for the individual assets. This would be a mistake. Markowitz derived the
• general formula for the standard deviation of a portfolio as follows:
NOTES
Open = + X Cov,;,i ^ 11 = 11 = 1
where:
' = The standard deviation of the portfolio
= The weights' of the individuals assets in the portfolio, where weights are determined by' the proportion of value in the portfolio
= The variance of rates of return for assets i
Cov^j = The covariance between the rates of return for assets i and j, where Cov-j = ' - .
This formula indicates that the standard deviation for a portfolio of assetsis a function of the weighted average of the individual variances (where the weights are squared), plus the weighted covariances between, all the assets in the portfolio. The standard deyiation for a portfolio of assets encompasses not only, the variances of the individual assets but also includes the covariances between pairs of individual assets in the portfolio. Further, it can be shown that, in a portfolio with a large number of securities, this formula reduces to the sum of the weighted covariances. Although most of the subsequent demonstration will consider portfolios with only two assets because it is possible to show the effect in two dimensions, we will demonstrate the computations for a three-asset portfolio. Still, it is important at this point to. consider what happens in a large portfolio with many assets. Specifically, what happens to the portfolio’s standard deviation, when you add a new security to such a portfolio? As shown by the formula, we see two effects.
The first is the asset’s own variance of returns, and the second is the covariance between the returns of this new asset and the returns of every other asset that is already in the portfolio. ■ The relative weight of these numerous covariances is substantially greater than the asset’s unique variance; and-the more assets in the portfolio, the more this is true. This means that the important factor to consider when adding an investment to a portfolio that contains a number of other investments is not the investment’s
Self-Instructional Material 105
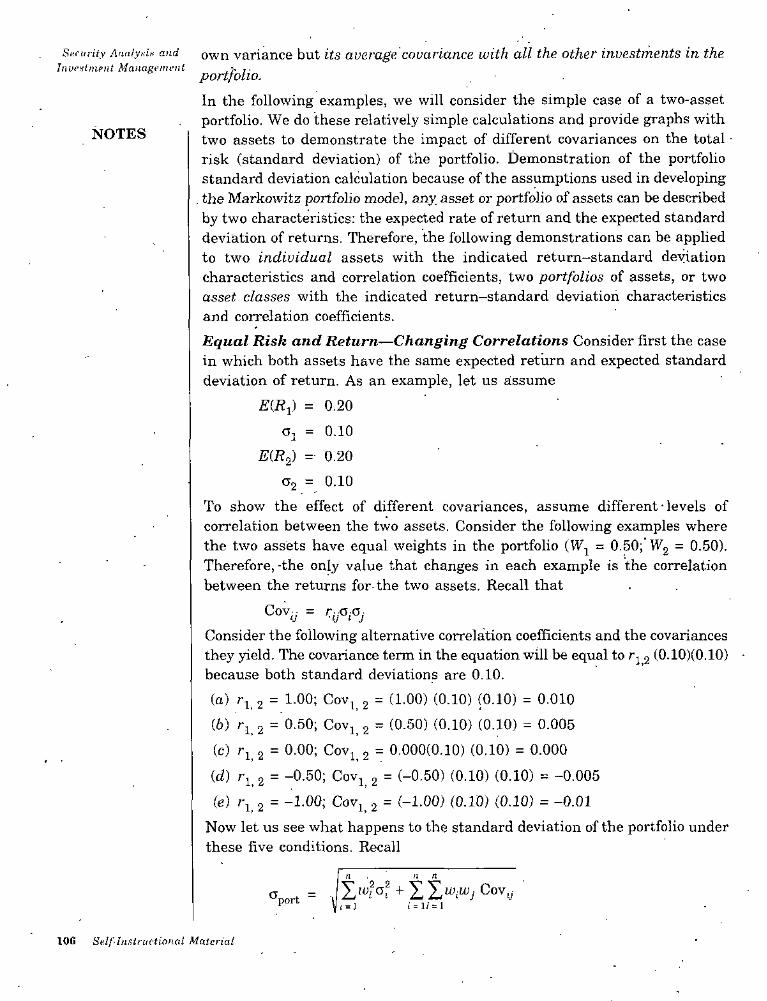
own variance but its average, covariance, with all the other investments in the portfolio.
In the following examples, we will consider the simple case of a two-asset portfolio. We do these relatively simple calculations and provide graphs with two assets to demonstrate the impact of different covariances on the total • risk (standard deviation) of the portfolio. Demonstration of the portfolio standard deviation calculation because of the assumptions used in developing the Markowitz portfolio model, any. asset or portfolio of assets can be described by two characteristics: the expected rate of return and the expected standard deviation of returns. Therefore, the following demonstrations can be applied to two individual assets with the indicated return-standard deviation characteristics and correlation coefficients, two portfolios of assets, or two asset classes with the indicated return-standard deviation characteristics and correlation coefficients.Equal Risk and Return—Changing Correlations Consider first the case in which both assets have the same expected return and expected standard deviation of return. As an example, let us assume
= 0.20
Cj = 0.10
E(R2) = 0.20
O2 = 0.10
To show the effect of different covariances, assume different • levels of correlation between the two assets. Consider the following examples where the two assets have equal weights in the portfolio (W^ = 0.50; Wg = 0.50). Therefore, -the only value that changes in each example is the correlation between the returns for-the two assets. Recall that
Cov.^ = r^^jConsider the following alternative correlation coefficients and the covariances they yield. The covariance term in the equation will be equal to g (0.10)(0.10) - because both standard deviations are 0.10.
(а) 2 = 1-00; Cov^ g = ^hOO) (0.10) (0.10) = 0.010
(б) 2 = 0.50; Covj g = (0-50) (0.10) (0.10) = 0.005
(c) rj 2 = O’OO; Cov^ 2 = 0.000(0.10) (0.10) = 0.000
id) r^ 2 = -0-50; Covj 2 = (-0’50) (0.10) (0.10) = -0.005
(e) /-j 2 = -1-00; Cov
Now let us see what happens to the standard deviation of the portfolio under these five conditions. Recall
security .'\nnlysis and Invfilinent Managemi-iit
NOTES
= (-1.00) (0.10) (0.10) = -0.011. 2
+ Cov,j*^port 'V i = l/ = li = J
106 Se.lf lnatruitional Material

An Inlroduc.lion to Portfolio Muaai’rmrnt
When this general formula is applied to a two-asset portfolio, it is
'+ w^csl + 2w^W2r^_2^j^G2*^port
orNOTES
<Jport = ■jx^al+wlGl+2w^W2Cov 1,2
Thus, in Case a.
^(0.5)^(0.10)^ +(0.5)^(0.10)" + 2(0,5)(0.5)(0.01)^port(a) “
= J(0.25)(0.01) -t- (0.25)(0.01) + 2(0.25j(0.01)
=
= 0.10
In this case, where the returns for the two assets are perfectly positively correlated (r^ 2 “ standard deviation for the portfolio is, in fact, theweighted average of the individual standard deviations. The important' point is that we get no real benefit from combining two assets that are perfectly correlated; they are like one asset already because their returns move together. Now consider.Case 6, where Tj 2 equals 0.50:
^(0.5)^(0.10)^ -(-(0.5)^(0.10)^ +2(0.5){0.5)(0.005)'^port(&)
J(0.0025)(0.0025) + 2(0.25)(0.005)
= V0.0075
= 0.0868
The only term that changed from Case a is the last term, Cov^^g which changed from 0.01 to 0.005. As a result, the standard deviation of the portfolio ' declined by about 13 per cent, from 0.10 to 0.0868. Note that the expected return did not change because it'is simply the’ weighted average of the individual expected returns; it is equal to 0.20 in both cases. You should be able to confirm through your'own calculations that the standard deviations for Portfolios c and d are as follows:
1. 0.0707
2. 0.05
The final case where the correlation between the two assets is -1.00 indicates the ultimate benefits of diversification:
.J(0.5)^(0.10)^ + (0.5)^{0,10)^.+ 2(0.5)(0.5)(-0.01)^porKp)■ L..
Self-Instructional Material 107

Security Analyais and Inupatineiii Managp'neiit = J(0.0050) + (-0.0050)
= Vo0NOTES
' Here,, the negative covariance term exactly offsets the individual variance terms, leaving an overall standard deviation of the portfolio of zero. This would be a risk-free portfolio. Exhibit 3.10 illustrates a graph of such a pattern. Perfect negative correlation gives a mean combined return for the two securities over time equal to the mean for each of them, so the returns for the portfolio show no variability. Any returns above and below the mean for each of the assets are completely offset by the return for the other asset, so there is no variability in total returns, that is, no risk, for the portfolio. This combination of two assets that are completely negatively correlated provides the maximum benefits of diversification—it completely eliminates risk.
Return
Returns from Asset A over Time
Mean Return from Portfolio of Assets A and B
Returns from Asset B overtime
Time
Exhibit 3.10. Time Patterns of Returns for Two Assets with PerfectNegative Correlation
The graph in Exhibit 3,11 shows the difference in the risk-return posture for these five cases. As noted, the only effect of the change in correlation is the change in the standard deviation of this two-asset portfolio. Combining assets that are not perfectly correlated does not affect the expected return of the portfolio, but it does reduce the risk of the portfolio (as measured by its standard deviation). When we eventually reach the ultimate combination of ■perfect negative correlation, risk is eliminated.
Combining Stocks with Different Returns and Risk The previous discussion indicated what happens when only the correlation coefficient (covariance) differs between the assets. We now consider two assets (or portfolios)' with different expected rates of return and individual standard deviations. We will show what happens when we vary the correlations between -them. We will assume two assets with the following characteristics;
108 Self-lustrucCional Material

An Introduction to Portfolio ManagenicntAsset ■ E (R^ Wi
1 ,10 ,50 ,0049 ,07
2 ,20 ,-50 .0100 ,10NOTES
The previous set of correlation coefficients gives a different set of covariances because the standard deviations are different. For example, the covariance in Case b where rj2 = 0-50 would be (0.50)(0.07)(6.10) = 0.0035.
£(R).25
.ZQiV ♦ mE D C B A
.15
.10
;05
I I
.00 .01 .02 .03 .04 .05 .06 .07 .08 .09 '.10. Standard Deviation o1 Return (o)
Exhibit 3.11. Risk-return Plot for Portfolios with Equal Returns and Standard Deviations but Different Correlations.
Case Correlation Coefficient Covariance
+ 1.00
+0.50. .0070a
b ,0035
0.00 ,0000c
d -0.50 0035
-1.00 -.0070e
Because we are assuming the same weights in all cases (0.50 - 0.50), the - expected return in every instance will be
‘£:(iep„rt) = 0.50(0.10) + 0.50(0.20).* = 0.15
The standard deviation for Case a will be
.J(0.5)^(0.07)V{0.5)^(0.10)%2(0,5)(0.5){0.0070)^port(a)
Self-Instructional Material 100

ScvAirity Analysis and Iiwe^tmenl Management = J{0,001225) + (0,0025) + (0.5)(0,0070)
= >/0,007225 • '= 0.085
Again, with perfect positive cori'elation, the standard deviation of the portfolio is the weighted average of the standard deviations of the individual assets:
(0.5X0.071 + (0.5X0.10) = 0.085
As you might envision, changing the weights with perfect positive correlation causes the standard deviation for the portfolio to change in a linear fashion. This is an important point to remember when we discuss the Capital Asset Pricing Model (CAPM) in the next chapter. For Cases 6, c, d, and e, the • standard deviation/or the portfolio would be as follows:
NOTES
7(0.00122^+ (0.0025) + (0.5){0.0035}®port(Z,)
7(0.005475)
0.07399
7(0.001225) + (0.0025) + (0.5)(0.00)
0.0610
7(0.001225) + (0.0025) + (0.5)(-0.0035)*^port(rf)
0.0444
7(^.00372^+ (0.5)(-0.0070)^porKf?)
= 0.015
Note that, in this example, with perfect negative correlation the standard deviation of the portfolio is not zero. This is because the different examples have equal weights, but the individual standard deviations are not equal.
Exhibit 3.12 shows the results for the two individual assets and the portfolio of the two assets assuming the correlation coefficients vary as set forth in Cases a through e. As before, the expected return does not change because the proportions are always set at 0.50 - 0,.50, so all the portfolios lie along the horizontal line at the return, EiR) = 0.15.
Constant Correlation with Changing Weights If we changed the weights ' of the two assets while holding the correlation coefficient constant, we would ■ derive a set of combinations that trace an ellipse starting at Asset 2, going through the 0.50 - 0,50 point, and ending at Asset l.We can demonstrate
110 Self-InUruetional Material
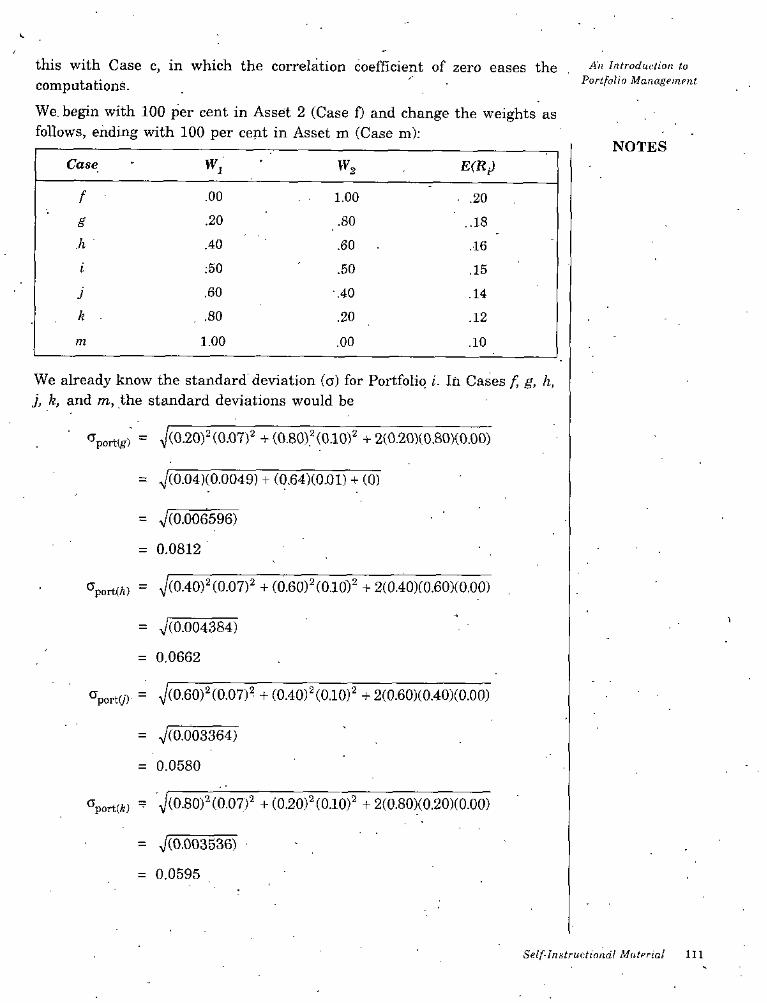
this with Case c, in which the correlation coefficient of zero eases the computations.
We. begin with 100 per cent in Asset 2 (Case f) and change the weights as follows, ending with 100 per cent in Asset m (Case m);
An Introduction to Portfolio Management
NOTESCase
f .00 1.00 • .20.20 .80 ..18g
.h .40 .60 .16
;50 .50 .15i
.60 -.40 .14Jk .80 .20 .12
1.00 .00 .10m
We already know the standard deviation (o) for Portfolio i. In Cases f, g, h, j, k, and m, the standard deviations would be
Tportig) = >/(0.20)H0.07)2T{0.80).^(0.10)^ + 2(0.20X0.80X0.00)
= .J(0.04)(0.0049) + (0,64)(0.01) + (0)
= VCO-006596)
= 0.0812
<7port(ft) = ^(0A0)H0.07)^^0.6^(0.10Y + 2(0.40)(0.60)(0.00)
= V(0.004384)
= 0.0662
(3port(j) = 7(0.60)2(0.07)2 +(0.40)^(0.10)^ +2(0.60)(0.40)(0.00)
= V^-003364)
= 0.0580
<5port(*) - '7(0-80)2(0.07)2 + (0.20)2(0.10)2 + 2(0.80)(0.20)(0.00)
= V(0.003536)
= 0.0595
Selfintitructiondl Material in

Security Analysis and liwe.stmcnl Management
£(H)
.20 2
NOTES .15 AC B£ 0
.10 1
.05
.00 .01 .02 .03 .04 .05 .06 .07 .08 .09 .10 .11 12Standard Deviation of Return (o)
Exhibit 3.12. Risk-return Plot for Portfolios with.Different Returns, Standard Deviations, and Correlations
These alternative weights with a constant correlation would yield the following risk-return combinations:
E(R.)Case • •W'i ^port
0,20 0,10001,00f 0.000,08120.180.20 0.80g ■
0.06620.60 -0.16h ■ 0.400.06100.150.50 0.501
0.14 0.05800.400.60J0.05950.20 0.12k 0.80
0,07000.101.00 0.00m
A graph of these combinations appears in Exhibit 3.13 for the curve with 2 = +0,00. You could derive a complete curve'by simply varying the weighting by smaller increments, A notable result is that with low, zero, or negative correlations, it is possible to derive portfolios that have lower risk than either single asset. In our set of examples where r^j = 0.00, this occurs in Cases h, i,j, and k. This ability to reduce risk is the essence of diversification. As shown in Exhibit 3.13, assuming the normal risk-return relationship where assets with higher risk (larger standard deviation of returns) provide high rates of return, it is possible for a conservative investor to experience both lower risk and higher return by diversifying into a higher risk—higher- return asset assuming the correlation between the two assets is fairly low. As shown in Exhibit 3.13, in the case where it is assumed that the correlation was zero (0.00), the low-risk investor at Point 1 who would receive a return of 10 per cent and risk of 7 per cent could increase his/her return to 14 per cent and expeiience a decline in risk to 5.8 per cent by investing (diversifying)
112 Sdf-lnstrucliunal Material

40 per cent of the portfolio in riskier Asset 2,-As noted, the benefits of diversification are critically dependent on the correlation between assets; but, even if the correlation is not zero, you still derive some benefit as shown in Exhibit 3.13 when the correlation is 0.50.
As shown in Exhibit 3.13, the curvature in the graph depends on the correlation between the two assets or portfolios. With = +1.00, the combinations lie along a straight line between the two assets. When r- - 0.50, the curve is to the right of ouf r-j = 0.00 curve, while the = -0.50 is to the left. Finally, when = -1.00, the'gra-ph would be two straight lines ' that would touch at the vertical line (zero risk) with some combination.lt is possible to solve for the specified set of weights that would give a portfolio with zero risk. In this case, it is Wj = 0.412 and = 0.588.
An Intrnduvlion to Portfolio Management
NOTES
E[R)
f.20
.15N,_ ' r, = +0.50
k
rj, = -0.50.10 ' 1r, = +0.00
.06
I I J.00 .01 .02 .03 .04 .05 .06 .07 ,08 .09 .10 .11 .12
- Standard Deviation ot Return (n)
Exhibit 3.13. Portfolio Risk-return Plots for Different Weights when = + 1.00; +0.50; 0.00; -0.50; -1.00
3.6 CAPITAL MARKET THEORY: AN OVERVIEW
Because capital market theory builds on portfolio theory, this unit begins where the discussion of the Markowitz efficient frontier-ended. We assume
I
that you have examined the set of risky assets and derived the aggregate elTicient frontier. Further, we assume that you and. all other investors want to maximize your utility in terms of risk and return, so you will choose portfolios of risky assets on the efficient frontier at point. When you make your investment decision in this manner, you are referred to as a Markowitz efficient investor.
Se.lf-lnatruclional Material 113

Capital market theory .extends portfolio theory and develops a model for pricing all risky assets. The final product, the Capital Asset Pricing Model (CAPM), will allow you to determine the required rate of return for any risky asset.We begin with the background of capital market theory that includes the underljdng assumptions of the theory and a discussion of the factors that led to its development following the Markowitz portfolio theory. This includes analysis of the effect of assuming the existence of a risk-free asset.
NotaUy, assuming the existence of a risk-free rate has significant implications for the potential return and risk and alternative risk-return combinations. This discussion implies a central portfolio of risky assets on the efficient frontier, which we call the market portfolio. We discuss the market portfolio in the third section and what it implies regarding different types of risk.
The fourth section considers which types of risk are relevant to an investor who believes in capital market theory. Having defined a measure of risk, we consider how you determine your required rate of return on an investment. You can then compare this required rate of return to your estimate of the asset’s expected rate of return during your investment horizon to determine - whether the asset is undervalued or overvalued. The section ends with a demonstration of how to calculate the risk measure implied by capital market theory. . •
Security Analyst and Investment Management
NOTES
an
Background for Capital Market TheoryWhen dealing with any theory in science, economics, or finance, it is necessary to articulate a set of assumptions that specify how the world is expected to act. This allows the theoretician to concentrate on developing a theory that explains how some facet of the world will respond to changes in the environment. In this section, we consider the main assumptions that underlie the development of capital market theory.
Assumptions of Capital MarketTheory because capital market theory builds on the Markowitz portfoliomodel, it requires the same assumptions, along with some additional ones:
1. All investors are Markowitz efficient investors who want to target points on the efficient frontier. The exact location on the efficient frontier and, therefore, the specific portfolio selected will depend on the individual investor’s risk-return utility function.
2. Investors can borrow or lend any amount of money at the Risk-Free Rate of Return (RFR). Clearly, it is always possible to lend money at the nominal risk-free rate by buying riskfree securities such as government T-bills. It
114 Self-Instructional Material

is not always possible to borrow at this riskfree rate, but we will see that assuming a higher borrowing rate does not change the general results.
3. All investors have homogeneous expectations; that is, they estimate identical probability distributions for future rates of return. Again, this assumption can be relaxed. As long as the differences in expectations are not vast, their effects are minor.
4. All investors have the same one-period time horizon such as one month, six months, or one year. The model will be developed for a single hypothetical period, and its results- could be affected by a different assumption. A difference in the time horizon would require investors to derive risk measures and risk-free assets that are consistent with their investment horizons.
5. All investments are infinitely divisible, which means that it is possible to buy or sell fractional 'shares of any asset or portfolio. This assumption allows us to discuss investment alternatives as continuous curves. Changing it would have little impact on the theory.
6. There are no taxes or transaction costs involved in bujdng or selling assets. This is a reasonable assumption in many instances. Neither pension funds nor religious groups have to pay taxes, and th: transaction costs for most financial institutions are less than 1 per cent on most financial instruments. Again, relaxing this assumption modifies the results, but it does not change the basic thrust.
7. There is no inflation or any change in interest rates, or inflation is fully anticipated. This is a reasonable initial assumption,* and if can be modified.
8. Capital markets are in equilibrium. This means that we begin with all investments properly priced in line with their risk levels.
You may consider some of these assumptions unrealistic and wonder how useful a theory we can derive .with these assumptions. In this regard, two points are important. First, as mentioned, rela^ng many of these assumptions would have only a minor effect on the model and would not change its main implications or conclusions. Second, a theory should never be judged on the basis of its assumptions but, rather, on how well it explains and helps us predict behaviour in the real-world. If this theory and the model it implies help us explain the rates of return on a wide variety of risky assets, it is useful, even if some of its assumptions are unrealistic. Such success implies that the questionable assumptions must be unimportant to the ultimate objective of the model, which is to explain asset pricing and rates of return on assets..
Development of capital market theory the major factor that allowed portfolio theory to develop into capital market theory is the concept of a risk-free asset. Following the development of the Markowitz portfolio model, several
An Introduv.tion to Portfolio Management
NOTES
Self-Instructional Material 115
authors considered the implications of assuming the existence of a risk-free asset, that is, an asset with zero variance. As we will show, such an asset would have zero correlation with all other risky assets and would provide the, Risk-Free Rate of Return (RFR). It would lie on the vertical axis of a portfolio graph. This assumption allows'us to derive a generalized theory of capital . asset pricing under conditions of uncertainty from the Markowitz portfolio theory. This achievement is generally attributed to William Sharpe, for which he received the Nobel Prize, but Lintner and Mossin derived similar theories independently.! Consequently, you may see references to the Sharpe-Lintner- Mossin (SLM) capital.asset pricing'model.
• Security Analyma'aiid Inuestment Management
NOTES
Risk-Rree AssetAs noted, the assumption of a risk-free asset in the economy is critical to asset pricing theory. Therefore, this section explains the meaning of a riskfree asset and shows the effect on the risk and return measures when this risk-free asset is combined with a portfolio on the Markowitz efficient frontier.
We have defined a risky asset as one from which future returns are uncertain, and we have measured this uncertainty by the variance, or standard deviation, of expected returns. Because the expected return on a risk-free asset is entirely certain, the standard deviation of its expected return is zero(OrpRate of Return (RFR) should equal the expected long-run growth rate of the economy with an adjustment for short-run liquidity. The next sections show what happens when we introduce this risk-free asset into the risky world of the Markowitz portfolio model. Covariance with a Risk-Free Asset Recall that the covariance between two sets of returns is
= 0). The rate of return earned on such an asset should be the Risk-Free
Cov..=I = 1
Because the returns for the risk-free asset are certain, o thatR^ = E{Rf during all periods. Thus, R^ - E{Rf will also equal zero, and the product of this expression with any other expression will equal zero. Consequently, the covariance of the risk-free asset with any risky asset or - portfolio of assets will always equal zero. Similarly, the correlation between any risky asset i, and the risk-free asset, RF, would be zero because it is equal to
= 0, which meansRF
'"rF. t ~ J^RF^jCombining a Risk-Free Asset with a Risky Portfolio What happens to the average rate of return and the standard deviation of returns when you combine a risk-free asset with a portfolio of risky assets, such as those that exist on the Markowitz efficient frontier?
116 Self-lnsirtictional Material

Expected Return Like the expected return for a portfolio of two risky assets, the expected rate of return for a portfolio that includes a risk-free asset is the weighted average of the two returns:
+ (1 - ^RpRiRi)
An Introduction to Portfolio Management
NOTESwhere,.
■Wffp = The proportion of the portfolio invested in the risk-free asset
EiR) = The expected rate of return on risky Portfolio i
Standard Deviation The expected variance, for a two-asset portfolio is
+ £^202 -I-2UJiU)2ri 2^102
We know that the variance of the risk-free asset is zero, that is, = 0.RFBecause the correlation between the risk-free asset and any risky asset, i, is also zero, the factor r in the preceding equation also equals zero. Therefore, any component of the variance formula that has either of these terms will equal zero. When you make these adjustments, the formula becomes
RF,i
‘^port - (1 ^Rf) *^1
The standard deviation is
*^port “
- (1 - Oi
Therefore, the standard deviation of a portfolio that combines the risk-free asset with risky assets is the linear proportion of the standard deviation of
^jRe risky asset portfolio.(^^heJti^-Retum ComA)^nt^>on Because both the expected return
andard deviation of return for subh a portfolio are linear combinations, agraph of possible portfolio returns and risks looks like a straight line between the two assets. Exhibit 3.14 shows a graph depicting portfolio possibilities when a risk-free asset is combined with alternative risky portfolios on the Markowitz efficient frontier.
You can attain any point along the straight line RFR-A by investing some portion of your portfolio in the risk-free asset loRF and the remainder (1 - in the risky asset portfolio at Point A on the efficient frontier. This set of portfolio possibilities dominates all the risky asset portfolios on the efficient frontier below Point A because some portfolio along Line RFR-A has equal variance with a higher rate of return than the portfolio on the original efficient frontier. Likewise, you can attain any point along the Line RFR-B by investing in some combination of the risk-free asset and the risky asset
' portfolio at Point B. Again, these potential combinations dominate all portfolio
Self-Instructional Material 117

possibilities on the original efficient frontier below Point B (including Line RFR-A).
You can draw further lines from the RFR to the efficient frontier at higher and higher pPints until you'reach the point where the line is tangent to the frontier, which occurs in Exhibit 3.14 at Point M. The set of portfolio possibilities along Line RFR-M dominates all portfolios below Point M. For example, you could attain a risk and return combination between the RFR and Point M (Point C) by investing one-half of your portfolio in the risk-free asset (that is, lending money at the RFR) and the other half in the risky portfolio at Point M.
Security Analysin and Investment Management
NOTES
Exhibit 3.14. Portfolio Possibilities Combining the Risk-free Asset and Risky Portfolios on the Efficient Frontier
Risk-Return Possibilities with Leverage An investor may want to attain a higher expected return than is available at Point M in exchange for accepting higher risk. One alternative would be to invest in one of the risky asset, portfolios on the efficient frontier beyond Point M such as the portfolio at- Point D, A second alternative is to add leverage to the portfolio by borrowing money at the risk-free rate and investing the proceeds in the risky asset portfolio at Point M.
What effect would this have on the return and risk for your portfolio? If you borrow an amount equal to 50 per cent of your original wealth at the riskfree rate, will not be a positive fraction but, rather, a negative 50 per cent (wRY = -0.50), The effect on the expected return for your portfolio is:
^^■^port^ “ '^lifiRFR) +.(1 ~= -0.50(f^p^) -H [1 - (-0.50)!E(%)
= -0.50(f?p^) -h 1.50E(R^)
Self-Instrucltonal Material118
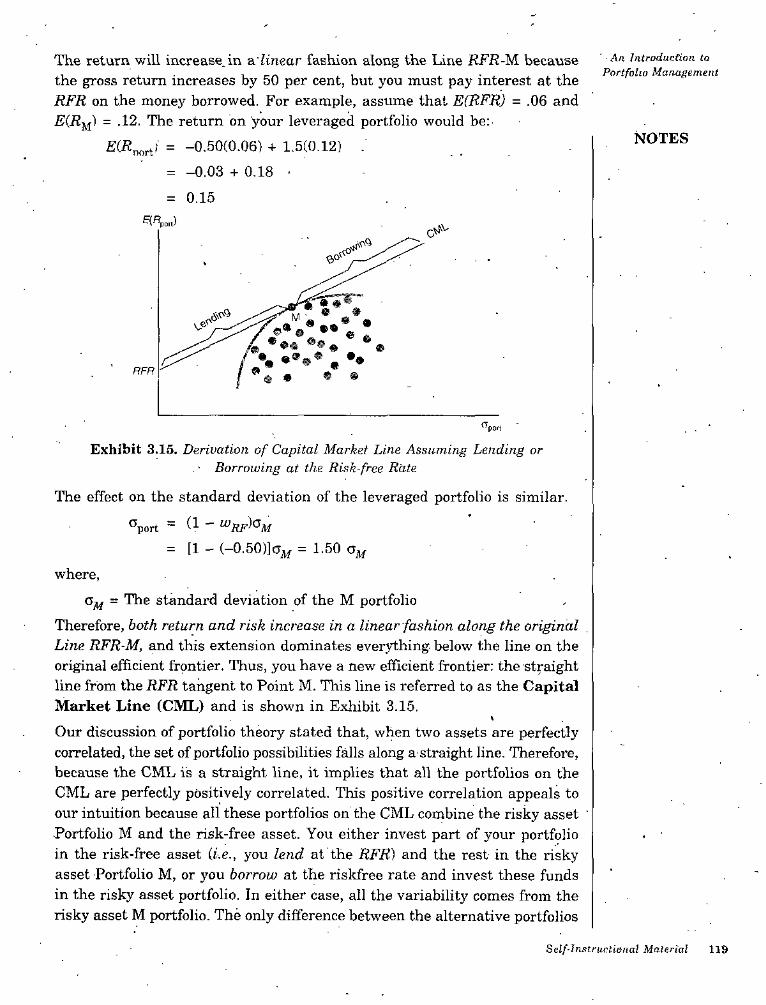
An Introduction to Portfolio Management
The return will increase, in & linear fashion along the Line RFR-M. because the gross return increases by 50 per cent, but you must pay interest at the RFR on the money borrowed. For example, assume that E(RFR) = .06 and EiRf^if) = .12. The return on your leveraged portfolio would be:
E(R^on'' = -0.50(0.06) + 1,5(0.12)= -0.03 + 0.18 •
= 0.15
NOTES
RFR
'^pOtl
Exhibit 3.15. Derivation of Capital Market Line Assuming Lending or ■ Borrowing at the Risk-free Rate
The effect on the standard deviation of the leveraged portfolio is similar.
®port = (1 - ^RF^'^M
= [1 - (-0.50)]a^ = 1.50
where,
= The standard deviation of the M portfolio
Therefore, both return and risk increase in a linear fashion along the original Line RFR-M, and this extension dominates everything below the line on the original efficient frontier. Thus, you have a new efficient frontier: the straight line from the RFR tangent to Point M. This line is referred to as the Capital Market Line (CML) and is shown in Exhibit 3.15.
Our discussion of portfolio theory stated that, when two assets are perfectly correlated, the set of portfolio possibilities falls along a straight line. Therefore, because the CML is a straight line, it implies that all the portfolios on the CML are perfectly positively correlated. This positive correlation appeals to our intuition because all these portfolios on the CML combine the risky asset ' •Portfolio M and the risk-free asset. You either invest part of your portfolio in the risk-free asset {i.e., you lend at the RFR) and the rest in the risky asset Portfolio M, or you borrow at the riskfree rate and invest these funds in the risky asset portfolio. In either case, all the variability comes from the risky asset M portfolio. The only difference between the alternative portfolios
Self-Instructional Material 119

on the CML is the magnitude of the variability, which is caused by the proportion of the risky asset portfolio in the-total portfolio.
Security Analysis and Investment Management
The Market PortfolioNOTES Because Portfolio M lies at the point of tangency, it has the highest portfolio
possibility line, and everybody will want to invest in Portfolio M and borrow or lend to be somewhere on the CML. This portfolio must, therefore, include all risky assets. If a risky asset were not in this portfolio in which everyone wants to invest, there would be no demand for it and therefore it would have no value. Because the market is in equilibrium, it is also necessary that all assets are included in this portfolio in proportion to their market value. If, for example, an asset accounts for a higher proportion of the M portfolio than its market value justifies, excess demand for this asset will increase its price until its relative market value becomes consistent with its proportion in the M portfolio.
This portfolio that includes all risky assets is referred to as the market portfolio. It includes not only U.S. common stocks but all risky assets, such as non-U.S. stocks, U.S. and non-U.S. bonds, options, real estate, coins, stamps, art, or antiques.,Because the market portfolio contains all risky assets, it is a completely diversified portfolio, which means that all the risk unique to individual assets in the portfolio is diversified away. Specifically, the unique risk of any single asset is offset by the unique variability of all the other assets in the portfolio.
This unique (diversifiable) risk is- also referred to as unsystematic risk. This implies that only systematic risk, which is defined as the variability in all risky assets caused by macroeconomic variables, remains in the market portfolio. This systematic risk, measured by the standard deviation of returns of the market portfolio, can change over time if and when there are changes in the macroeconomic variables that affect the valuation of all risky assets. Examples of such macroeconomic variables would be variability of growth in the money supply, interest rate volatility, and variability in such factors as industrial production, corporate earnings, and corporate cash flow.
How to Measure Diversification?As noted earlier, all portfolios on the CML are perfectly positively correlated, which means that all portfolios on the CML are perfectly correlated with the completely diversified market Portfolio M. This implies a measure of complete diversification. Specifically, a completely diversified portfolio would have a correlation with the market portfolio of +1.00. This is logical because complete diversification means the elimination of all the unsystematic or unique risk. Once you have eliminated all unsystematic risk, only systematic risk is left, which cannot be diversified away. Therefore, completely diversified portfolios
Self-Instructional Material120

would correlate perfectly with the market portfolio because it has only systematic risk.
An Introduction to Portfolio Management
Diversification and the Eiimination of Unsystematic RiskThe purpose of diversification is to reduce the standard deviation of the total portfolio. This assumes imperfect correlations among securities. Ideally, as you add securities, the average covariance for the portfolio declines. An important question is, about how many securities must be included to arrive at a completely diversified portfolio? To discover the answer, you must observe what happens as you increase the sample size of the portfolio by adding securities that have some positive correlation. The typical correlation among U.S. securities is about 0.5 to 0.6. One set of studies examined the average standard deviation for numerous portfolios of randomly selected stocks of different sample sizes. Specifically, the authors computed the standard deviation for portfolios of increasing numbers up to 20 stocks. The results indicated a large initial impact wherein the major benefits of diversification were achieved rather quickly. Specifically, about 90 per cent of the maximum benefit of diversification was derived from portfolios of 12 to 18 stocks. Exhibit 3.16 shows a graph of the effect.
A subsequent study compared the benefits of lower risk from diversification to the added transaction costs with more securities. It concluded that a well- diversified stock portfolio must include at least 30 stocks for a borrowing investor and 40 stocks for a lending investor.
Standard Deviation of Return
NOTES
Unsystematic(Diversifiable)Risk
TotalRisk Standard Deviation of
the Market Portfolio (Systematic Risk) ,t
SystematicRisk
INumber of Stock in the Portfolio
Exhibit 3.16. Number of Stocks in a Portfolio and the Standard Deviationof Portfolio Return
An important point to remember is that, by adding stocks to the portfolio . that are not perfectly correlated with stocks in the portfolio, you can reduce
the overall standard deviation of the portfolio but you cannot eliminate variability. The standard deviation of your portfolio will eventually reach the level of the market portfolio, where you will have diversified away all
Self-Instructional Material 121

Security Analysis and unsystematic risk, but you.Still have market or systematic risk. You cannot eliminate the variability and uncertainty of macroeconomic factors that affect, ah risky assets. At the same time, you will recall that you can attain a lower level of systematic risk by diversifying globally versus only investing in the United States because some of the systematic risk factors in the U.S. market (such as U.S. monetary policy) are not correlated with systematic risk variables in other countries such as Germany and Japan. As a result, if you diversify globally you eventually get down to a world systematic risk level.
Inueetmeiit Maiiafiement
NOTES
The CWIL and the Separation TheoremThe CML leads all investors to invest in the same risky asset portfolio, the M portfolio. Individual investors should only differ regarding their position on the CML, which depends on their risk preferences. In turn, how they get to a point on the CML is based on their financing decisions. If. you are relatively risk averse, you' will lend some part of your portfolio at the RFR by buying some riskfree securities and investing the remainder in the market portfolio of risky assets. For example, you might invest in the portfolio combination at Point A in Exhibit 3.17. In contrast, if you prefer'more risk, you might borrow funds at the RFR and invest everything (all of yoxir capital plus what you borrowed) in the market portfolio, building the portfolio at Point B. This financing decision provides more risk but greater returns than the market portfolio. As discussed earlier, because portfolios on the CML dominate other portfolio possibilities, the CML becomes the efficient frontier of portfolios, and investors decide where they want to be along this efficient frontier. Tobin called this division of the investment decision from the financing decision the separation theorem. Specifically, to be somewhere on the CML efficient frontier, you initially decide to invest in the market
CML
RFR
•^pofl
Exhibit 3.17. Choice of Optimal Portfolio Combinations on the CML
122 Self-Instructional Material
Portfolio M, which means that you will be on the CML. This is your investment decision. Subsequently, based on your risk preferences, you make a separate financing decision either to borrow or to lend to attain your preferred risk position on the CML.
A Risk Measure for the CML: In this section, we show that the relevant risk measure for risky assets is their covariance with the M portfolio, which is referred to as their systematic risk. The importance of this apparent from two points of view. First, in discussing the Markowitz portfolio
• model, we noted that the relevant risk to consider when adding a security to a portfolio is its average covariance with all other assets in the portfolio.
In this unit, we have' shown that the only relevant portfolio is the Mportfolio. Together, these two findings mean that the only important consideration for any individual risky asset is its average covariance with all the risky assets in the M portfolio or, simply, the asset’s covariance with the market portfolio. This covariance, then, is the relevant risk measure for an individual risky asset.
Second, because all individual risky assets are a part of the M portfolio, one . can describe their rates of return in relation to the returns for the M portfolio using the following linear model:-
An Introduction to Portfolio Management
NOTES
covariance is
+ ^i^Mt + e •
where,
= Return for asset i during period t
Oj = Constant term for asset i .
= Slope coefficient for asset i
= Return for the M portfolio during period t
e = Random error term
The variance of returns for a risky asset could be described as
.■ Var(R-,) = VarCu; + b^R^^.+ e)
= Var(ap_ + + VarCe)
= 0 + Var(6,R^p + VarCe)
Note that Yar(b^R-^f) is the variance of return for ah asset related to the variance of the market return, or the systematic variance or risk. Also, Varle) is the residual variance of return for the individual asset that is not related to the market portfolio. This residual variance is the variability that we have referred to as the unsystematic or unique risk or variance because it arises from the unique features of the asset. Therefore:
Var{i?^j) = Systematic Variance + Unsystematic Variance
Self-Instructional Material 123

We know that a completely diversified portfolio such as the market portfolio has had all the unsystematic variance eliminated. Therefore, the unsystematic variance of an asset is not relevant'to investors, because they can and do eliminate it when making an asset part of the market portfolio. Therefore, investors should not expect to receive added returns for assuming this unique risk. Only the systematic variance is relevant because it cannot be diversified away, because it is'caused by macroeconomic factors that affect all risky assets.
Security Analysis and Investment Management
NOTES
3.7 THE CAPITAL ASSET PRICING MODEL: EXPECTED
RETURN AND RISK
Up to this point, we have considered how investors make their portfolio decisions, including the significant effects of a risk-free asset. The existence ■ of this risk-free asset resulted in the derivation of a Capital Market Line (CML) that became the relevant efficient frontier. Because all investors want to be'on the CML, an asset’s covariance with the market portfolio of risky assets emerged as the relevant risk measure.
Now that we understand this relevant measure of risk, we can proceed to use -it to determine an appropriate expected rate of return on a risky asset. This step takes us into the Capital Asset Pricing Model (CAPM), which is a model that indicates what should be the expected or required rates of return on risky assets. This transition is important because it helps you to value an asset by providing an appropriate discount rate to use in any valuation model. Alternatively, if you have already estimated the rate of return that you think you will earn on an investment, you can compare this estimated rate of return to the required rate of return implied by the CAPM and determine whether the asset is. undervalued, overvalued, or properly valued.
To accomplish the foregoing, we demonstrate the creation of a Security Market Line (SML) that visually represents the relationship between risk and the expected or the required rate of return on an asset. The equatiori of this SML, together with estimates for the return on a risk-free asset and on the market portfolio, can generate expected or required rates of return for any asset based on its systematic risk. You compare this required rate of return to the rate of return that you estimate that you will earn on the investment to" determine if the investment is undervalued or overvalued. After demonstrating this procedure, we finish the section with a demonstration of how to calculate the systematic risk variable for a risky asset.
124 Self Instructional Material

The Security Market Line (SML) An !nln.idurliiin to Portfolio Manaffenuoit-
We know that the relevant risk measure for an individual risky asset is its covariance with the market portfolio (C ). Thei-efore, we can draw theov/, Mrisk-return relationship as shown in Exhibit 3.18 with the systematic covariance variable (C NOTES.) as the risk measure.ovi, M
RFR
COViM
Exhibit 3.18. Graph of Security Market Line
The return for the market portfolio should be consistent with its own risk, which is the covariance of the market with itself If you recall theformula for covariance, you will see that the covariance of any asset with itself is its variance, Cov^^ = In turn, the covariance of the market with itself is the variance of the market rate of return CovMM = Therefore,the equation for the risk-return line in Exhibit 3.18 is:
Rm - RFR= BFR + „2
Cov I. A/ {Rm-RFR)RFR^
Defining as beta, (pp, this equation can be stated:
E{R^ = RFR + - RFR)
Beta can be viewed as a standardized measure of systematic risk. Specifically, we already know that the covariance of any asset i with the market portfolio (CoVj- j^) is the relevant risk measure. Beta is a standardized measure of risk because it relates this covariance to the variance ofthe market portfolio. As a result, the market portfolio has a beta of 1. Tlierefore, if the P, for an asset is above 1.0, the asset has higher normalized systematic risk than the market, which means that it is more volatile than the overall market portfolio. ■
Given this standardized measure of systematic risk, the SML graph can’be expressed as shown in Exhibit 3.19. This is the same graph as in
Self-Instructional Material 125

Exhibit 3.18, except there is a different measure of risk. Specifically, the graph in Exhibit 3.19 replaces the covariance of an asset’s returns with the market portfolio as the risk measure with the standardized measure of systematic risk (beta), which is the covariance of an asset with the market portfolio divided by the variance of the market portfolio.
Set-iirity Analysin and Investment Management
NOTESSML
Negative Beta ■
\ RFR
S'
. Seta (Cov.M/a^)Exhibit 3.19. Graph of SML with Normalized Systematic Risk
Determining the expected rate of return for a risky asset the last equation and the graph in Exhibit 3.19 tell us that the expected (required) rate of return for a risky asset is determined by the RFR plus a risk premium for the individual asset. In turn, the risk premium is determined by the systematic risk of the asset (pp, and the prevailing market risk premium (R-^ -RFR). To demonstrate how you would compute the expected or required rates of return, consider the following example stocks assuming you have already computed betas:
0 1.0
BetaStock
■ A 0.70
B 1.00
c 1.15
D 1.40.
E -0.30
Assume that we expect the economy’s RFR to be 6 per cent (0.06) and the return on the market portfolio (i?j^,j) to be'12 per cent (0.12). This implies a market risk premium of 6 per cent (0.06). With these inputs, the SML equation would yield the following 'expected (required) rates' of return for these five stocks: • ,
I2C ' Self-Instructional Material

I
£{«P = HFH + - FFF)
E(R^) = 0.06 + 0.70 (0,12 - 0.06)
= 0.102 = 10,2%
E(Rs) = 0.06 + 1.00 (0.12 - 0,06)
= 0.12 = 12%
E(Bf.) = 0.06 + 1.15 (0.12 - 0.06)
= 0.129 = 12.9%
E(Rjj) = 0.06 + 1.40 (0.12 - 0.06)
= 0.144 = 14.4%
E(R^) = 0.06 + (-0.30) (0.12 - 0.06)
= 0.06-0.018
= 0.042 = 4.2%
A/i Introduction to Portfolio Management
NOTES
Current Price Expected Price Expected Estimated FutureDividend Rate of Return
(Per cent).Stock (P,) (Pt *
A 25 27 0,50 10.0%B 40 42 0.50 6.2C 33 39 1.00 21.2D 64 65 1.10 3,3E 50 54 8.0
Exhibit 3.20. Price, Dividend, and Rate of Return Estimates
As stated, these are the expected (required) rates of return that these stocks should provide based on their systematic risks and the prevailing SML. Stock A has lower risk than the aggregate market, so you should not expect (require) its return to be as high as the return on the market portfolio of risky assets..You should expect (require) Stock A to return 10.2 per cent. Stock B has systematic risk equal to the market’s (beta = 1.00), so its required rate of return should likewise-be equal to the expected market return (12 per cent). Stocks C and D have systematic risk greater than the market’s, so they should provide returns consistent with their risk. Finally, Stock E has a negative beta (which is quite rare in practice), so its required rate of return, if such a stock could be found, would be below the RFR.
In equilibrium, all assets and all portfolios of assets should plot on the SML. That is, all assets should be priced so that their estimated rates of return, which are the actual holding period rates of return that you anticipate, are consistent with their levels of systematic risk. Any security with an estimated rate of return that plots above the SML would be considered underpriced
Self-Inutructinnal Material 127

because it implies that you estimated you would- receive a: rate of return the security that is above its required rate of return based on its systematic risk. In contrast, assets with estimated rates of return that plot below the SML would be considered overpriced. This position relative to the SML implies that your estimated rate of return is below what you should require based
the asset’s systematic risk. In an efficient market in equilibrium, you would not expect any assets to plot off the SML because, in equilibrium, all stocks should provide holding period returns that are equal to their required rates of return. Alternatively, a market that is “fairly efficient” but not completely efficient may mispi-ice certain assets because not everyone will be aware'of all the relevant information for an asset.
As we already discussed on the topic of efficient markets, a superior investor has the ability to derive value estimates, for assets that are consistently superior to the consensus market evaluation. As a result, such an investor will earn better rates of return than the average investor on a risk-adjusted basis.
Identifjdng Undervalued and Overvalued Assets Now that we understand how to compute the rate of return one should expect or require for a specific risky asset using the SML, we can compare this required rate of return to the asset’s estimated rate of return over a specific investment horizon to determine whether it would be an appropriate investment. To make this comparison, you need an independent estimate of the return outlook for the security based on either fundamental or technical analysis techniques. Let us continue the example for the five assets discussed in the previous section. Assume that analysts in a major trust department have been following these five stocks. Based on extensive fundamental analysis, the analysts provide the expected price and dividend estimates contained in Exhibit 3.20. Given these projections, you can compute the estimated rates of return the analysts would anticipate during this holding period. .
on:i('( urity AncityMfi and IniH'.atini'iit Manaf-inni'nt
NOTESon
RequiredReturn
Estimated Estimated Return Return
Minus E(Rj)Stock Beta Evaluation
E(Ri)
■ Properly valued
Overvalued ' Undervalued
Overvalued
A • 0.70 ' 10.010.2 -0.2
B 1.00 12.0 6.2 -5.8
. C 1.15 12.9 21.2 8.3
D 1.40 14.4 3.3 -11.1E Undervalued-0,30 4.2 8.0 . 3.S
Exhibit 3.21. Comparison of Required Rate of Return to Estimated Rateof Return
128 S<df-In>itrui:lional nr,•rial

An Introduction to Portfolio Manascme.nt
# C.22
SMLNOTES.18
.14
.10 AE9 9 B
•06..
.02
J L I i I-.80 .60 -.40 -.20 0.0 .20 .40 .60 .80 1.00 1.20 1.40 1.60 1.80 2.00 2.20 2.40
Beta
Exhibit 3.22. Plot of Estimated Returns on SML Graph
Exhibit 3.21 summarizes the relationship between the required rate of return for each stock based on its systematic risk as computed earlier, and its estimated rate, of return (from Exhibit 3.20) based on the current and future prices, and its dividend outlook. This difference betw-on estimated return and expected (required) return is sometimes referred to as a stock’s alpha or its excess return. This alpha can be positive (the stock is undervalued) or negative (the stock is overvalued).
If the alpha is zero, the stock is on the SML and is properly valued in line with its systematic risk. Plotting these estimated rates of return and stock betas on the SML we specified earlier gives tne graph shown in Exhibit 13.9. Stock A is almost exactly on the line, so it is considered properly valued because its estimated rate of. return is almost equal to its required rate of return. Stocks B and .D are considered overvalued because their estimated rates of return during the coming period are below what an investor should expect (require) for the risk involved. As a result, they plot below the SML. In contrast. Stocks C and E are expected to provide rates of return greater than we would require based on their systematic risk. Therefore, both stocks plot above the SML, indicating that they are undervalued stocks.
Assuming that you trusted your analyst to forecast estimated returns, you would take no action regarding Stock A, but you would buy Stocks C and E and sell Stocks B and D. You might even sell Stocks B and D short if you favoured such aggressive tactics.
Calculating Systematic Risk: The characteristic line the systematic risk input for bn individual asset is derived from a regression model, referred to as the asset’s characteristic line with the market portfolio:
t
Saif-Instructional Alateno! 129

Security Analysis and wh6re, Investment Management
R- , = The rate of return for asset i during period t
= The rate of return for the market portfolio M during period t
ttj = The constant term or intercept, of the regression, which equals
. pj = The systematic risk (beta) of asset i equal to Cov^
e = The random error term.
The characteristic line is the regression line of best fit through a scatter plot of rates of return for the individual risky asset and for the market portfolio of risky assets over some designated past period, as shown in Exhibit 3.23.
The Impact of the Time Interval: In practice, the number of observations and the time interval used in the regression vary. Value Line Investment Services derives characteristic lines for common stocks using weekly rates of return for the most recent five years (260 weekly observations). •
Merrill Lynch, Pierce, Fenner &' Smith uses monthly rates of return for the most recent five years (60 monthly observations). Because there is no theoretically correct time interval for analysis, we must make a trade-off between enough observations to eliminate the impact of random rates of return and an excessive length of tirhe, such as 15 or 20 years, over which the subject company may have changed dramatically.. Remember that what you really want is the ex/iecteci-systematic risk for the potential investment. In this analysis, you are analyzing historical data to help you derive a reasonable estimate of the asset’s expected systematic, risk. ,
A couple of studies have considered the effect of the time interval used to compute-betas (weekly versus monthly). Statman examined the relationship between Value Line (VL) betas and Merrill Lynch (ML) betas and found a relatively weak relationship. Reilly and Wright analyzed the differential effects of return computation, market index, and the time interval-and showed that the major cause of the differences in beta was the use of monthly versus weekly return intervals. Also, the interval effect depended on the sizes of the firms. The shorter weekly interval caused a larger beta for large firms and a smaller beta for small firms. For example, the average beta for the smallest decile of firms using monthly data was 1.682, but the average beta for these small firms using weekly data was only 1.080. The authors concluded that the return time interval makes a difference, and its impact increases as the firm size declines.
^M. t
NOTES
ISO Self-lnstrurtional Material
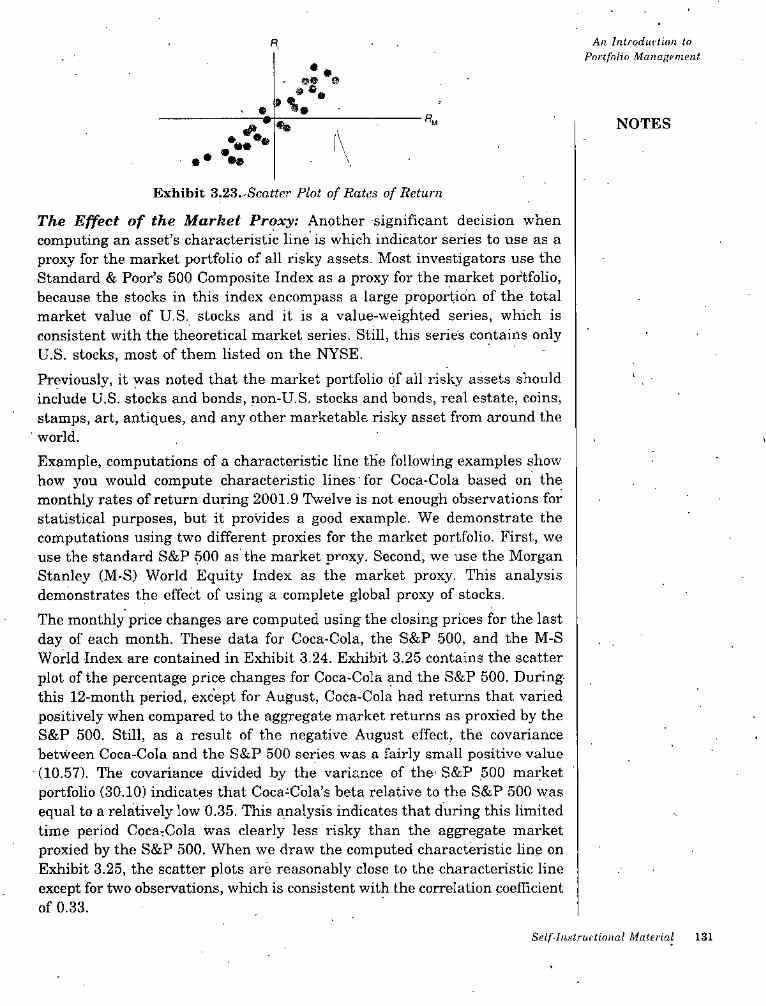
A/1 Iniroduvtinn to Portfolio Management
R,
••«•
NOTES•#••
• • %®
Exhibit 3.2S.-Scatter Plot of Rates of Return
The Effect of the Market Proxy: Another significant decision when computing an asset’s characteristic line is which indicator series to use as a proxy for the market portfolio of all risky assets. Most investigators use the Standard & Poor’s 500 Composite Index as a proxy for the market portfolio, because the stocks in this index encompass a large proportion of the total market value of U.S. stocks and it is a value-weighted series, which is consistent with the theoretical market series. Still, this series contains only U.S. stocks, most of them listed on the NYSE.
Previously, it was noted that the market portfolio of all risky assets should include U.S. stocks and bonds, non-U.S. stocks and bonds, real estate, coins, stamps, art, antiques, and any other marketable risky asset from around the
■ world.Example, computations of a characteristic line the following examples show how you would compute characteristic lines for Coca-Cola based on the monthly rates of return during 2001.9 Twelve is not enough observations for statistical purposes, but it provides a good example. We demonstrate the computations using two different proxies for the market portfolio. First, we use the standard S&P 500 as the market proxy. Second, we use the Morgan Stanley (M-S) World Equity Index as the market proxy. This analysis demonstrates the effect of using a complete global proxy of stocks.
The monthly price changes are computed using the closing prices for the last day of each month. These data for Coca-Cola, the S&P 500, and the M-S World Index are contained in Exhibit 3.24. Exhibit 3.25 contains the scatter plot of the percentage price changes for Coca-Cola and the S&P 500. During this 12-month period, except for August, Coca-Cola had returns that varied positively when compared to the aggregate market returns as proxied by the S&P 500. Still, as a result of the negative August effect, the covariance between Coca-Cola and the S&P 500 series was a fairly small positive value (10.57). The covariance divided .by the variance of the-S&P 500 market portfolio (30.10) indicates that Coca-Cola’s beta relative to the S&P 500 was equal to a relatively low 0.35. This analysis indicates that during this limited time period CocaTCola was clearly less risky than the aggregate market proxied by the S&P 500. When we draw the computed characteristic line on Exhibit 3.25, the scatter plots are reasonably close to the characteristic line except for two observations, which is consistent with the correlation coefficient of 0.33.
Self-lnstruitional Material 131

? ^yS 2.Co z 2 '?o
if11
Hi; PI•*: 0}7rs
S’2 \a
a.ft INDEX RETURN
MS World ^ ^M S ” ^RO “ ^^^RO '̂
CiHia-ColaS&P 500 ^S&P - S&P n(4)^' (5)(2) (3)S&P 500 M-S World ■ S&P 500 M-S World Coca-Cola (1}Date
Dec-00 i;i20.28 1221.253
4.47' -13.44 ■ -10.15'1244.222 -.3.01-1.82 3.383.46 1.88Jan-01 13GG.0155.56 47.04-7.05 -6 76-8.55 -8.57 -8.22Feb-01 1239.94 1137.879 -9.23
68 70 66.46-12.69-14;50 -5.41 -5.241061.262 -6.42 -6.73M'ar-01 1160.333n..56 35.748.69 8.73 4.097 68 7.24 2.28Apr-01
May-01
Jun-01
1249.46 1138.0870.005. 6.712.62 0.00 . 4 43• 0.51 -1.49 1.511255.8,2
1224.38
1121.0884.30 5.00-1.50 -1.74 -2.87-3.24 -4.681084.788 -2.50
0.090.10 0.92 -0.06-0.89 -0.071069.669 -1.07 -1.39Jul-01 1211.23-37.7710.94 -59.129.13 -5.40 -3.451016.732 -6.41 -4.95Aug-Ol
Sep-OI
Oct-OI
1133.5811 5611.16-7.43 -1.56-8.92 -3.37 -7-171040.94 .926.023 -8.17
4'.01 11.29 13.43■ 1.85 2.20 2.82 3.351.811059.78 943.22.27 1.947.30 0.275.80 -1.55 8.52997.928 7.52Nov-01 1139.453.91 4.552.22. 0.40 1.76 2.05. 0.76 0.56Dec-01 1148.08 1003.516
138.54Total = 126.85-1.01 -1.49 -1.81Average
Standard Deviation 5.03 5.805.49
= 5.49^ = 30.10' = 6.03^ = 25.31
Alpha^-o = -1.81 - (0.35“ - 1.01) = -1.46 Alpha
Beta = 10.57/30.10 = 0.35Var = St. DevCOV = 126.85/12 = 10.58 KO.f^&P -S&P S&PKO.S&P
= -1.81 - (0.46' - 1.49) = -1.13C6\ = 11.54/25.31 = 0.46= St. Dev. Beta= 138-54/12 = 11.54 Var KO..\l-S ~M-S KO.MSM-SKO.M-S
= 11.54/(5.03 " 5.80) = 0.40Correlation coef.= 10.57/(5.49 “ 5.80) = 0.33 .Correlation cocf. KO..M-S.'•KO.S&P\
“Column 4 is equal to Column 1 multiplied by Column 3
''Column 5 is equal to Column 2 multiplied by Column 3Exhibit 3.24. Computation of Beta for Coca-cola with Selected Indexes

All Introduction to Portfolio Management
15
•10o ♦Uw 5oU ♦ ♦
NOTES-8 -6 -4 • 8 10
c »3HIa: «
-10>.
o -15
-20Monthly Returns for S&P 500
Exhibit 3.25. Scatter Plot of Coca-Cola and the S&P 500 with Characteristic ' . Line for Coca-Cola: 2001
15
10{Q
O «oS 5oo *
•|-o -8 -6 -4 -2i 4 8 10
-52a>a: ♦ •-10n
o2 -15
-20Monthly Returns (or M-S World
Exhibit 3.26. Scatter Plot of Coca-Cola and the M-S World with CharacteristicLine for Coca-Cola: 2002
The computation of the characteristic line for Coca-Cola using the M-S World Index as the proxy for the market is contained in Exhibit 3.24, and the
.scatter plots are in Exhibit 3.26. At this point, it is important to consider what one might expect to be the relationship between the beta relative to the S&P 500 versus the betas with the M-S World Index. This requires aconsideration of the two components that go into the computation of beta: (1) the covariance between the stock and the benchmark and (2) the varianceof returns for the benchmark series. Notably, there is no obvious answer regarding what will happen for either series because one would expect both components to change. Specifically, the covariance of Coca-Cola with the S&P 500 will probably be higher than the covariance with the global series because you are matching a U.S. stock with a U.S. market index rather than a world index. Thus, one would expect the covariance with the global index to be smaller. At the same time, the variance of returns for. the world Stock index should also be smaller than the variance for the S&P 500 because it is a more diversified stock portfolio.
Self-Instructional Material 133

Therefore, the direction of change for the beta will depend on the relative change in the two components. Empirically, the beta is typically smaller with the world stock index because the covariance is definitely lower, but the variance is only slighter smaller. The results of this example were not consistent with expectations. The beta of Coca-Cola with the world stock index was larger (0.46 versus 0.35) because the covariance with the global index was unexpectedly larger (11.54 versus 10.57), whereas the variance of the global market proxy was smaller as hypothesized (25.31 versus 30.10). The fact that the betas with the alternative market proxies differed is significant and reflects the potential problem in, a global investment environment, which involves selecting the appropriate proxy for the market portfolio.
Security Analysis and Investment Management
NOTES
3.8 EMPIRICAL TESTS OF THE CAPM
When we discussed the assumptions of capital market theory, we pointed out' that a theory should not be judged on the basis of its assumptions, but on how well it explains the relationships that exist in the real world. When testing the CAPM, there are' two major questions. First, How stable is the • measure of systematic risk (beta)? Because beta is our principal risk measure, it is important to know whether past betas can be used as estimates of future betas. Also, how do the alternative published estimates of beta compare? Second, Is there a positive linear relationship as hypothesized between beta and the rate of return on risky assets? More specifically, how well do returns conform to the following SML equation:
EiRf) = RFR + - RFR)
Some specific questions might include:
• Does the intercept approximate the prevailing RFR?
• Was the slope of the line positive and was it consistent with the slope implied by the prevailing risk premium (J?j^ - RFR?)
We consider these two major questions in the following section.
Stability of BetaNumerous studies have examined the stability of beta and generally concluded that the risk measure was not stable for individual stocks but the stability of the beta for portfolios of stocks increased dramatically. Further, the larger the portfolio of stocks {e.g., over 50 stocks) and the longer the period (over 26 weeks), the more stable the beta of the portfolio. Also, the betas tended to regress toward the mean. Specifically, high-beta portfolios tended to decline
134 Self-Instructional Material
An Introduction to Portfolio Management
over time toward unity (1.00), whereas low-beta portfolios tended to increase over time toward unity.Another factor that affects the stability of beta is how many months are used to estimate the original beta and the test beta, Roenfeldt, Griepentrog, and Pfiamm (RGP) compared betas'derived from 48 months of data to subsequent betas for 12, 24, 36, and 48 months. The 48- month betas were not good for estimating subsequent 12-month betas but were quite good for estimating 2-13G-, and 48-month betas.Chon concluded that portfolio betas would be biased if individual betas were un.<table. so he suggested a Bayesian approach to estimating these time- varying betas. Carpenter and Upton considered the influence of the trading volume on beta .stability and contended that the predictions of betas were slightly better using the volume-adjusted betas. This impact of volume on' beta estimates is related to small-firm effect which noted that the beta for low-volume securities was biased downward as confirmed by Ibbotson, Kaplan, and I’ctcrson, To summarize, individual betas were generally volatile over time whereas large portfolio betas were stable. Also, it is. important to use at least 36 months of data to estimate beta and be conscious of the stock’s trading volume and size.
NOTES.
Comparability of Published Estimates of BetaIn contrast to deriving your own estimate of beta for a stock, you may want to use a published source f'oi- speed or convenience, such as Merrill Ljmeh’s Security Risk Evaluation Report (published monthly) and the weekly Value Line Investment Survey. Both services use the following market model equation:
(R, ,) = RFR + + E^Notably, they differ in the data used. Specifically, Merrill Lynch uses 60 Diomhiy ohservalions and the S&P 500 as the mai'ket proxy, whereas the Value Line estimates beta using 260 weekly observations and the NYSE composite series as the market proxy. They both use an adjustment process because of the regression tendencies. •Given these relatively minor differences, one would probably expect the published betas to be quite comparable. In fact, Statinan found a small but significant difference between the betas for both individual and portfolios of stocks. Reilly and 'Wright examined over 1,100 securities for three nonoverlapping periods and confirmed the difference in beta found by Statman.22 They also indicated that the reason for the difference was the alternative time inten-als (Le., weekly versus monthly observations) and the .security's market.value affected both the size and the direction of the interval effect. ‘Therefore, when estimating beta or using a published source, you must consider the return interval used and the firm’s relative size.
Self-Instructional Material 135

security Analy^^is and _ _ _ ^Investment Management 3.9 RELATIONSHIP BETWEEN SYSTEMATIC RISK AND
RETURN
The ultimate question regarding the CAPM is whether it is useful in, explaining the return on risky assets. Specifically, is there a positive linear relationship between the systematic risk and the rates of return on these risky assets? Sharpe and Cooper found a positive relationship between return and risk, although it was not completely linear.
Douglas examined the relationship, and his results indicated intercepts that were larger than the prevailing risk-free rates and the coefficients for the systematic risk variables Were typically not significant. Because of the statistical problems with individual stocks. Black, Jensen, and Scholes examined the risk and return for portfolios of stocks and found a positive linear relationship between monthly excess return and portfolio beta, although the intercept was higher than the zero value expected. Exhibit 3.27contains charts from this study, which show that (1) most of the measured SMLs had a positive slope, (2) the slopes change between periods, (3) the intercepts are not zero, and (4) the intercepts likewise change between periods.
NOTES
Effect of Skewness on the RelationshipBeyond the analysis of return and beta, several authors also have considered the impact of skewness on expected returns. You will recall from your statistics course that skewness reflects the presence of too many large positive or negative obseiwations in a distribution. A normal distribution is S3Tnmetric, which means that balance exists between positive and negative observations.
In contrast, positive skewness indicates an abnormal number of large positive price changes. Investigators considered skewness as a means to possibly explain the prior results wherein the model appeared to underprice low-beta stocks (so investors received returns above expectations) and overprice high- beta stocks (so investors received returns lower than expected). Some early results confirmed these expectations, but also found that high-beta stocks had high-positive skewness, which implied that investors prefer stocks with high-positive skewness that provide an opportunity for very large returns. Kraus and Litzenberger tested a CAPM with a skewness term and confirmed that investors are willing to pay for positive skewness. They concluded that their three-moment CAPM corrects for the apparent mispricing of high- and low-risk stocks encountered with the standard CAPM. The importance of skewness was supported in studies by Sears and Wei and subsequently by Lim.
136 Setf-lnstrur.tional Material

Effect of Size, P/E, and LeverageIn the Efficient Markets Hypothesis (EMH), there was extensive analysis of the size effect {the small-firm anomaly) and the P/E effect. Both of these variables were shown to have an inverse impact on returns after considering the CAPM. These results imply that these • variables (size and P/E) are additional risk factors that need to be considered along with beta (similar to the skewness argument). Specifically, expected returns are a positive function of beta, but investors also require higher returns from relatively small firms and for stocks with relatively low P/E ratios.
Bhandari found that financial leverage (measured by the debt/equity ratio) also helps explain the cross section of average returns after both beta and size are considered. This implies a multivariate CAPM with three risk variables: beta, size, and financial leverage.
An Introdurtion to Portfolio Managf .ne.nt
NOTES
Effect of Book to-Market Value: The Fama-French StudyA study by Fama and French attempted to evaluate the joint roles of market beta, size, E/P, financial leverage, and the book-to-market equity ratio in the cross section of average returns on the NYSE, AMEX, and Nasdaq stocks. While some earlier studies found a significant positive relationship between returns and beta, this study finds that the relationship between beta and the average rate of return disappears during the recent period 1963 to 1990, even when beta is used alone to explain average returns. In contrast, univariate tests between average returns and size, leverage, E/P, and book- to-market equity (BE/ME) indicate that all of these variables are significant and have the expected si^.
In the multivariate tests, the results contained in Exhibit 3.28'show that the negative relationship between size [In (ME)] and average returns is robust to the inclusion of other variables. Further, the positive relation between BE/ ME and average returns also persists when the other variables are included. Interestingly, when both of these variables are included, the book-to-market value ratio (BE/ME) has the consistently stronger role in explaining average returns. The joint effect of size and BE/ME is shown in Exhibit 3.28. The top row confirms the positive relationship between return versus the book-to- market ratio—that is, as the book-to-market ratio increases, the returns go from 0.64 to 1.63. The left-hand column shows the negative relationship between return and size—that is, as the size declines, the returns increase from 0.89 to 1.47.
Even within a size class, the returns increase with the BE/ME ratio. Similarly, within a BE/ME decile, there is generally a negative relationship for size. Hence, it is not surprising that the single highest average return is in the upper, right-hand corner (1.92), which is the portfolio with the smallest size and highest BE/ME stocks.
Self-Instructional Material 137

B.-October 1939-June 1948 Average Excess Monthly-Returns
. InterceptStandard Errors 0.001
Security Analysifi and Investment Management
A. January 1931 - September 1939Average Excess Monthly Returns
0.11 r ■0.10
0.11 0.004= -0.008 Standard Error = 0.002Intercept 0.10
0.08 0.011Standard Error = 0.001
0.08 Slope0.030 ■SlopeStandard Error = 0.002NOTES
' 0.060 06
0.040.04
0.020.02
0.000.00
-0.02-0.02 0.0 0.5 1.0 1.5. 2.0Systematic Risk
D. April 1957 - December 1965 Average Excess Monthly Returns
InterceptStandard Error = 0.001
0.0 0.5 10 '1.5 2.0-Systematic Risk
C. July 1948-March 1957
Average Excess Monthly Returns
Intercept = 0.008 Standard Error = 0.001
0.110.11 0.0100.100.10
0.08'0.08 = -0.001 Standard Error = 0.0005
0.003Standard Error = O.OOI
SlopeSlope
r0.060.06
0.040.04
0.020.02
0.00-0.00
-0.02-0.02 0.0 0.5 1.0 1.5 2.0Systematic Risk
0.0 0.5 1.0 1.5 2.0Systematic Risk
Exhibit 3.27. Average Excess Monthly Rates of Return Compared to Systematic Risk During Alternative Time Periods
The authors conclude that between 1963 and 1990., size and book-to-market equity capture the cross-sectional variation in average stock returns associated with size, E/P, book-to-market equity, and leverage; Moreover, of the two • variables, the book-to-market equity ratio appears to subsume E/P and leverage. Following these results, Fama-French suggested the use of a three factor CAPM model and used this model in a subsequent study to explain a number of the anomalies from prior studies.
s3.>0 THE MARKET PORTFOLIO: THEORY VERSUS
PRACTICEI
Throughout our presentation of the CAPM, we noted that the market portfolio included all the risky assets in the economy. Further, in equilibrium, the various assets would be included in the portfolio in proportion to their market value. Therefore, this market portfolio should contain not only U.S. stocks and bonds but also real estate, options, art, stamps, coins, foreign stocks and bonds, and so on, with weights equal to their relative market valye^
138 Selfrlnstructional Material

Although this concept of a market portfolio is reasonable in theory, it is difficult—if not impossible—to implement when testing or using the CAPM. The easy part is getting a stock series for the NYSE, the AMEX, and major world stock exchanges, such as Tokyo, London, and Germany. There are
. stock series for the OTC market, too, but these series generally are incomplete.
Also, there is a growing number of world stock indexes. There also are some well-regarded U.S. bond series available {e.g., from Lehman Brothers, Merrill Lynch, Ryan Labs, and Salomon Brothers) and several world bond series ie.g., from J. P. Morgan, Salomon Brothers, and Merrill Lynch). Because of the difficulty in deriving series that are available monthly in a timely fashion for the numerous other assets mentioned, most studies have limited themselves to using a stock or bond series alone. In fact, the vast majority of studies have chosen the S&P 500 series or some other NYSE stock series that is obviously limited to only U.S. stocks, which constitutes less than 20 per cent of a truly global risky asset portfolio. At best, it was assumed that the particular series used as a proxy for the market portfolio was highly correlated with the true market portfolio. Most academicians recognize this potential problem but assume that the deficiency is not serious. Several articles by Roll, however, concluded that, on the contrary, the use of these indexes as a proxy for the market portfolio had very serious implications for tests of the model and especially for using the model when evaluating portfolio performance. Roll referred to it as a benchmark error because the practice is to compare the performance of a portfolio manager to the return of an unmanaged portfolio of equal risk—that is, the market portfolio adjusted for risk would be the benchmark. Roll’s point is that, if the benchmark is mistakenly specified, you cannot measure the performance of a portfolio manager properly. A mistakenly specified market portfolio can have two effects. First, the beta computed for alternative portfolios would be wrong because the market portfolio used to compute the portfolio’s systematic risk is inappropriate. Second, the SML derived would be wrong because it goes from the RFR through the improperly specified M portfolio. Exhibit 3.29 shows an example where the true portfolio risk ((3^.) is underestimated (pg) possibly because of the proxy market portfolio used in computing the estimated beta. As shown, the portfolio being evaluated may appear to be above the SML using pg, which would imply superior management. If, in fact, the true risk (pj,) is greater, the portfolio will shift to the right and be below the SML, which would indicate inferior performance.Exhibit 3.30 indicates that the intercept ailtf slope will differ if (1) there is
an error in selecting a proper risk-free asset and (2) if the market portfolio selected is not the correct mean-variance efficient portfolio. Obviously, it is very possible that under these conditions, a portfolio judged to be superior relative to the first SML (i.e., the portfolio plotted above the measured SML) could be inferior relative to the true SML (i.e., the portfolio would plot below the true SML). Roll contends that a test of the CAPM requires an analysis of whether the proxy used to represent the market portfolio is mean-variance
An Introduction to Portfolio Management
NOTES
X
Self-Instructional Material 139
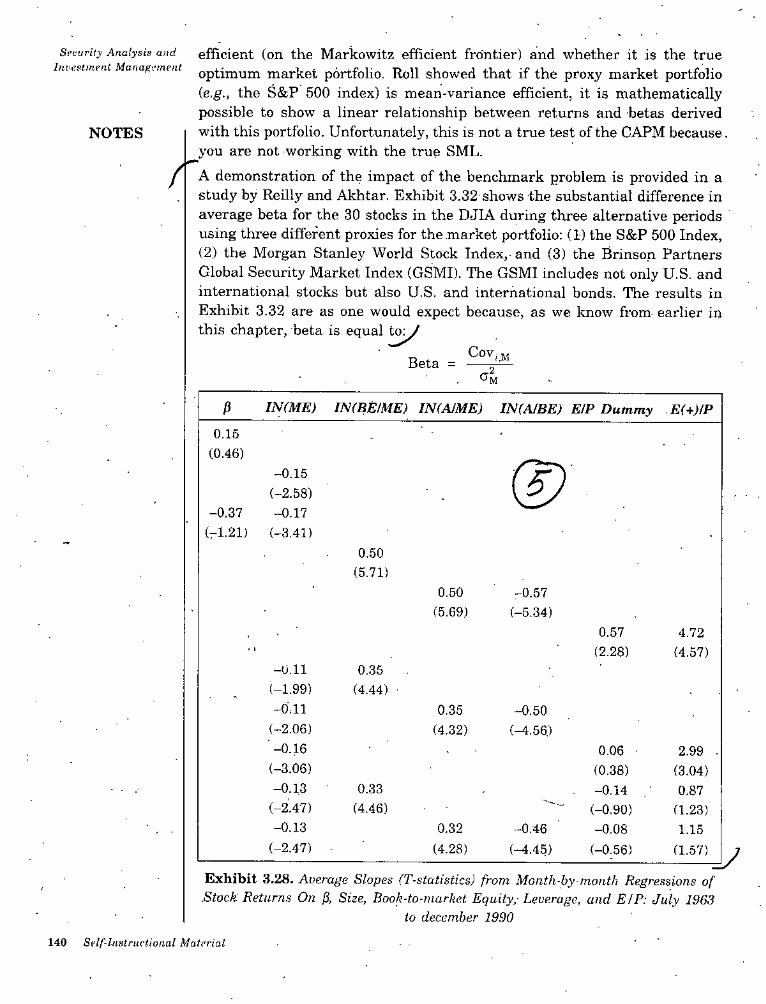
Si’vurity Analysis and Investment Management
efficient (on the Markowitz efficient frontier) and whether it is the true optimum market portfolio. Roll showed that if the proxy market portfolio (e.g., the S&P 500 index) is mean-variance efficient, it is mathematically possible to show a linear relationship between returns and betas derived with this portfolio. Unfortunately, this is not a true test of the CAPM because. you are not working with the true SML.
^ A demonstration of the impact of the benchmark problem is provided in a
study by Reilly and Akhtar. Exhibit 3.32 shows the substantial difference in average beta for the 30 stocks in the DJIA during three alternative periods using three different proxies for the market portfolio: (I) the S&P 500 Index, (2) the Morgan Stanley World Stock Index, and (3) the Brinson Partners Global Security Market Index (GSMI). The GSMI includes not only U.S. and international stocks but also U.S. and international bonds. The results in Exhibit 3.32 are as one would expect because, as we know from- earlier in this chapter, beta is equal to^
NOTES
CovBeta =
IN(ME} IN(BEIME) IN(A]ME) IN(AIBE) EIP Dummy .E(+)IP
0.15(0.46)
-0.15(-2.58)-0.17
(-3.41)-0.37
0.50(5.71)
0.50 -0.57(-5.34)(5.69)
0.57 4.72(2.28) (4.57)
-0.11(-1.99)-0)11
(-2.06)-0.16
(-3.06)-0.13
(-2.47)-0.13
(-2.47)
0.35(4.44)
0.35 -0.50(-4.56.)(4.32)
0.06 • (0.38) -0.14
(-0.90) -0.08
(-0.56)
2.99 . (3.04)
0.33 0.87(4.46) (1.23)
0.32 -0.46(^.45)
1.15(4.28) (1.57)
Exhibit 3.28. Average Slopes (T-statistics) from Month-by-month Regressions of .Stock Returns On p. Size, Book-to-market Equity,- Leverage, and E/P: July 1963
to december 1990
140 Self-Instructional Material

iAn Introduction to ’
Portfolio Management
SML NOTES
a
RFR
Be Risk
Exhibit 3.29. Differential, Performance based on an Error in EstimatingSystematic Risk
E{R) True SML ,
True M PortkslioMeasured SML
PortfolioBeingEvaluated
Proxy M Portfolio
RFR^ i'
RFRr I,
Risk (Beta)1.0
Exhibit 3.30. Differential SML based on Measured Risk-free.Asset and ProxyMarket Portfolio
Sn/f-Inslriictional Material )41

Security Analysis and Invef^tmenl Management
E(fl)
True SWL
.■ Efficient' / Frontie'rTrue M Portfolio
NOTES Estimated SML
Proxy M Portfolio
RFR
Risk
Exhibit 3.31. Differential SML Using Market Proxy that is Mean-varianceEfficient.
where:
= the covariance between, asset i and the M portfolio
<5^^ = the variance of the M portfolio
COV;I, M
Alternative Market Proxies
S&P 500 M-S World BrinsonGSMI
Time Period
1983-19881.2150.820 0,565Average beta
Mean index return 0.0140.0170.0140,0310,043Standard deviation of index returns 0,049
1989-19941.2640.991 0,581Average beta '
Mean index return 0.0080.010 0.0040.0260.043Standard deviation of index returns 0.036
1983-19941,2230.606Average beta
Mean index return0,880
0.011. 0,0110.0120.029Standard deviation of index returns 0.0430,043
Exhibit 3.32. Average Beta for the. SO Stocks in the Dow Jones Industrial Average during Alternative Time Periods using Different Proxies for
the Market Portfolios
142 Self-Instructional Materiaf

As we change from an all-U.S. stock index to a world stock index (M-S World) or a world stock and bond index (GSMI), we would expect the covariance with U.S. stocks to decline. The other component of beta is the standard deviation for the market portfolio. As shown in Exhibit 13.22, typically the M-S World Stock Index has a smaller variance than the S&P 500 because it is more diversified with international stocks. Therefore, while both covariance and market variance decline, the covariance effect dominates, so the beta is smaller with the M-S World Stock Index.
In contrast, although the covariance between the U.S. stocks and the, GSMI also is lower, the variance of the GSMI market portfolio, which is highly diversified with stocks and bonds from around the world, is. substantially lower (about 25 to 33 per cent). As a result, the beta is substantially larger (about 27 to 412 per cent larger) when the Brinson Partners Index is used rather than the S&P 500 Index. Notably, the Brinson Index has a composition of assets that is substantially closer to the “tnae” M portfolio than either of the other proxies that contain- only U.S. stocks or global stocks.
An Inlroduction to Portfolio Manaftcmi’iit
NOTES
1983-1988 1989-1994 1983-1994
RFR (Rn, - RFR) RFR (R„ - RFR) RFR (R^-RFR)
S&P 500 18.20 8.31 9.90 13.07 5.71 7.36 15.01 7.01 8.60
Nikkei 26.05 5.35 -3.62 4.70 -8.3220.70 10.30 5.02 5.28
FAZ 16.36 5.01 7.97 7.8311.35 0.14 1'2.09 6.42 5.67
FT AllShare 18.01 10.00 8.01 10.09 10.07 0.02 13.99 10.03 3.95
M-S World 22.64 8.31 14.33 5.18 5.71 -0.52 13.60 7.01 6.60
BrinsonGSMI
18.53 8.31 10.22 10.18 5.71 14.28 7.014.48 7.28
RFR = risk-free return
Exhibit 3.33. Components of Security Market Lines Using AlternativeMarket Proxies
Mean Expected Rate of Return
Time Period S&P 500 M-S World Brinson GSMI
1983-1988 16.41 17.72 20.751989-1994 13.00 5.40 11.36
Exhibit 3.34. The Average Expected Returns for Stocks in the DJia based on Different Betas and Security Market Lines Derived with Alternative. Benchmarks
There also was a difference in the SMLs implied by each of the market proxies. Exhibit 3.33 contains the average RFR, the market returns, and the slope of the SML duhng the three time periods for the three indexes and for market series from Japan (Nikkei), Germany (FAZ), and the United Kingdom
Self-lnstriiilional Material 143

(FT All-Share). Clearly, the slopes differ dramatically among the alternative indexes and over time. Needless to say, the benchmark used does make a difference.Finally, it is necessary to combine the estimate of systematic risk (beta) with the estimated SML to determine the combined effect on the required rate of return for an asset. Exhibit 3.34 shows that during specific time periods the difference between the highest and the lowest expected (required) return ranges from about 4 per cent to 7.5 per cent, with the highest expected returns when the market pro.xy was the Brinson GSMI because of the high betas. There were also large differences in the expected (required) returns for individual stocks (i.e., a range of about 4 to 5 per cent); which can have a substantial impact on valuation. In summary, an incorrect market proxy will affect both the beta risk measures and the position and slope of the SML that is used to evaluate portfolio performance.
In general, the errors will tend to overestimate the performance of portfolio managers because the proxy used for the market portfolio is probably not as efficient as the true market portfolio, so the slope of the SML will be underestimated. Also, the beta measure generally will be underestimated because the true market portfolio will have a lower variance than the typical market proxy due to greater diversification. Roll’s benchmark problems, however, do not invalidate the value of the CAPM as a normative model of asset pricing; they only indicate a problem in measurement when attempting, to test the theory and when using this model for evaluating portfolio performance. Therefore, it is necessary to develop a better market portfolio proxy similar to the Brinson GSMI and/or adjust the portfolio performance measures to reflect this measurement problem.
Scriirity Analyfiif! and /iioi’sf'ni'nt Managp.mcnl
NOTES
3.11 MULTIFACTOR MODELS OF RISK AND RETURN
Introduced in detail the Markowitz'portfolio theory and the Capital Asset Pricing Model (CAPM), which collectively represent the foundation for understanding the connection between risk and expected return in financial markets. This chapter considers several important extensions of this framework. Specifically, whereas the CAPM designated a single risk factor to account for the volatilitj' inherent in an individual security or portfolio of securities, in this chapter we develop the intuition and application of muhifactor explanations of risk and return. In particular, we begin with an explanation of the leading alternative to the CAPM—the Arbitrage Pricing Theory (APT), which was developed by Stephen Ross. The chief difference between the CAPM and the APT i.s that the latter specifies several risk factors, thereby allowing for a more , expansive definition of systematic
1'14 Sdf-lnstruiUional Matenal

investment risk than that implied by the CAPM’s single market portfolio. After developing the conceptual basis for the APT in the next section and contrasting its major assumptions with those of the CAPM, we also examine the empiiical evidence supporting the theory. Despite several appealing features, one of the practical challenges that an investor faces' when attempting to implement the APT is that the risk factors in the model are not defined in terms of their quantity (i.e., how many there are) or their identity (i.e., what they are). We conclude the unit by discussing how investors use multifactor models, which can be viewed as attempts to convert the APT into a tractable working tool in the area of security analysis, .thus turning theory into practice. A wide variety of factor models are .currently in use.
These models differ primarily in how, they define the risk factors and can be grouped broadly into those models that use macroeconomic factor definitions and those that specify microeconomic factors. Several examples of the different approaches that have been taken in developing multifactor explanations of risk and return are given to illustrate the myriad forms these important models can assume.
An Introduction to Portfolio Management
NOTES
3.12 ARBITRAGE PRICING THEORY
The last unit highlighted many of the ways, in which the CAPM has contributed to the investment management field. Indeed, in many respects, the CAPM has been one of the most useful— and frequently used—financial economic theories ever developed. However, many of the empirical studies cited also point out some of the deficiencies in the model as an explanation of the link between risk and return. For example, tests of the CAPM indicated that the beta coefficients for individual securities were pot stable but that portfolio betas generally were stable assuming long enough sample periods and adequate trading volume. There was mixed support for a positive linear relationship between rates of return and systematic risk for portfolios of stock, with some recent evidence indicating the need to consider additional risk variables or a need for different risk proxies. In addition, several papers criticized the tests of the model and the usefulness of the model in portfolio evaluation because of its dependence on a market portfolio of risky assets that is not currently available.
One especially compelling challenge to the efficacy of the CAPM was the set of results suggesting that it is possible to use knowledge of certain firm or security characteristics to develop profitable trading strategies, even after adjusting for investment risk as measured by beta. Typical of this work were the findings of Banz, who showed that portfolios of stocks with low market
Sf'i/'-IiTSln/rtionoi Malfriul . 145

Security Anaiy^in and capitalizations {i.e., “small” stocks) outperformed “large” stock portfolios onInvestment Manaf’einenl a risk-adjusted basis, and Basu, who documented that stocks with low price-
earnings (P-E) ratios similarly outperformed high P-E stocks.1 More recent work by Fama and French also demonstrates that “value” stocks {i.e., those with high book value-to-market price ratios) tend to produce larger risk- adjusted returns than “growth” stocks {i.e., those with low book-to-market ratios). Of course, in an efficient market, these return differentials should
NOTES
not occur, which in turn leads to one of two conclusions; (1) markets are not particularly efficient for extended periods of time {i.e., investors have been ignoring profitable investment opportunities for decades), or (2) market prices are efficient but there is something wrong with the way the single-factor models such as the CAPM measure risk.
Given the implausibility of the first possibility, in the early 1970s, financial economists began to consider in earnest the implications of the second. In particular, the academic community searched for an alternative asset pricing theory to the CAPM that was reasonably intuitive, required only limited assumptions, and allowed for multiple dimensions- of investment risk. The result was the Arbitrage Pricing Theory (APT), which was developed by Ross in the mid-1970s and has three major assumptions:
1. Capital markets are perfectly competitive.
2. Investors always prefer more wealth to less wealth with certainty.
3. The stochastic process generating asset returns can be expressed as a linear function of a set of K risk factors (or indexes).
Equally important, the following major assumptions—which were used in the development of the CAPM—are not required: (1) Investors possess quadratic utility functions, (2) normally distributed security returns, and (3) a market portfolio that contains all risky assets and is meanvariance efficient. Obviously, if such a model is both simpler and can explain differential security prices, it will be considered a superior theory to the CAPM.
Prior to discussing the empirical tests of the APT, we provide a brief review of the basics of the model. As noted, the theory assumes that the stochastic process generating asset returns can be represented as a /if factor model of the form:
= £ (i?,) + 6,1 8i -H 6^2 4 + 8^ -n for i = 1 to nwhere:
= The actual return on asset i during a specified time period, i = 1, 2, 3...... n
. E (£j) = The expected return for asset i if all the risk factors have zero changes
6,y = The reaction in asset f’s returns to movements in a common risk factor j '
146 ■ Self-Instructional Material

5^ = A set of common factors or indexes with a zero mean that influences the returns on all assets
= A unique effect on asset i’s return ii.e., a random error term that,’ by assumption, is completely diversifiable in large portfolios and has a mean of zero)
n = Number of assets
Two terms require elaboration: 5j and 6-. As indicated, 5 terms are the multiple risk factors expected to have an impact on the returns of all assets. Examples of these factors might include inflation, growth in Gross Domestic Product (GDP), major political upheavals, or changes in interest rates. The APT contends that there are many such factors that affect returns, in contrast to the CAPM, where the only relevant risk to measure is the covariance of' the asset with the market portfolio {i.e., the asset’s beta). Given these common factors, the 6^ terms determine how each asset reacts to the particular common factor. To extend the earlier intuition, although all assets may be affected by growth in GDP, the impact (i.e., reaction) to a factor will differ. For example, stocks of cyclical firms will have larger terms for the “growth in GDP” factor than will noncyclical firms, such as grocery'store chains. Likewise, you will hear discussions about interest-senritive stocks. All stocks are affected by changes in interest rates; however, some experience larger impacts. For example, an interest-sensitive stock would have a bj interest of 2.0 or more, whereas a stock that is relatively insensitive to interest rates would have a bj of 0.5. Other examples of common factors include changes in unemplo3ment rates, exchange rates, and yield curve shifts. It is important to note, however, that when we apply the theory, the factors are not identified. That is, when we discuss the empirical studies of the APT, the investigators will note that they found three, four, or five factors that affect security returns, but they will give no indication of what these factors represent.
Similar to the CAPM model, the APT assumes that the unique effects (e^ are independent and will be diversified away in a large portfolio. Specifically, the APT requires-that in equilibrium the return on a zero-investment, zero- systematic-risk portfolio is zero when the unique effects are diversified away.
An Introdmlion to ■ Portfolio Manaf’e/nent
NOTES
CAPM APT
Form of Equation
Number of Risk Factors
Factor Risk Premium
Factor Risk Sensitivity
“Zero-Beta” Return
Linear LinearK(> 1)1
IE(RJ-RFR]j
P.RFR ^0
Exhibit 3.35. Comparing the. Capital Asset Pricing Model (Capm) and the Arbitrage Pricing Theory (Apt)
Self-Instruitional Material 147

Security Analysis and Investment Management
This assumption (and some theoretical manipulation using linear algebra) implies that the expected return on any asset i ii.e., E{R^)), can be expressedas:
E(R^) = Xo + b., + X2 6,2 + .... + X, b,, (APT)NOTEIS
where:
Xq = The expected return on an asset with zero systematic risk
Xj = The risk premium related to the yth common risk factor
= The pricing relationship between the risk premium and the asset; that is, how responsive asset i is to the yth common factor. (These are called factor betas or factor loadings.)
This equation represents the fundamental result of the APT, It is useful to compare the form of the APT’s specification of the expected return-risk relationship with that of the CAPM. The comparable result for the CAPM is:
E (i?,.) = RFR + p, [E {R,^) - RFR] (CAPM)
Exhibit 3.35 compares the relevant features of the two models. From this summary, it should be clear that the ultiniate difference between these two theories lies in the way systematic investment risk is defined: a single, market-wide risk factor for the CAPM versus a few (or several) factors in the APT that capture the salient nuances of that market-wide risk. It is important to recognize, though, that both theories specify linear models based on the common belief that investors are compensated for performing two functions: committing capital and bearing risk.
Finally, notice that the equation for the APT suggests a relationship that is analogous to the security market line associated with the CAPM. However, instead of a line connecting risk and expected return, the APT implies a security market plane with {K -f- 1) dimensions—K risk factors and additional dimension for the security’s expected return. Exhibit 3.35 illustrates this relationship for two risk factors (i.e., K = 2).
one
Using the APTAs noted earlier, the primary challenge in using the APT in security valuation involves the identification of the risk factors. The complexities of this issue are addressed later, so in order to illustrate how the model works we will assume that there are two common factors: one related to unexpected changes in the level of inflation and another related to unanticipated changes in the real level of GDP. If we further assume that the risk premium related to GDP sensitivity is 0.03 and a stock that is sensitive to GDP has a 6^ (where j represents the GDP factor) of 1.5, this means that this factor would cause the stock’s expected return to increase by 4.5 per cent (= 1.5 x 0.03).
148 Self-Instructional Material

V
An Introduction to Portfolio Management
ExpectedReturn
18.0 -1
16.0 -
NOTES14.0 ■
12.0 -
10.0 -
8.0 -
6.0 -
4.0 -^ I
I: '2.0 - I 2.5
2.0 ./1.5✓
0.0 1.0 Factor 2 Beta .T 1—t /^ o
. rFactor 1 Beta
Exhibit 3.36. The Relationship between Expected Return cvid Two CommonRisk Factors
To develop this notion further, consider the following example of two stocks and a two factor model. First, -consider these risk factor definitions and sensitivities:
5^ =. Unanticipated changes in the rate of inflation. The risk premium related to this factor is 2 per cent for every 1 per cent change in the rate = 0.02)
Sg = Unexpected changes in the growth rate of real GDP. The average risk prerhium related to this, factor is 3 percent for every 1 per cent change in the rate of growth (X2 = 0.03)
Xq = The rate of return on a zero-systematic risk asset {i.e., zero beta) is 4 per cent (kg = 0.04)
Assume also that there are two assets (x and y) that have the following- response coefficients to these common risk factors:
= The response of asset x to changes iii the inflation factor is 0.50 (&^i = 0.50) '
6^2 = The response of asset x to changes in the GDP factor is 1.50 (6^2 = 1-50)
6^1 = The response of asset y to changes in the inflation factor is 2.00 = 2.00)
0.5/0.0
I
Self-Instructional Material 149

Sl'curity Ajiatysis and Inventment Management
Net Initial Investment;
+70Short 2 shares of A:
■-35Purchase 1 share of B;
Purchase 1 share of C; -35NOTES
0Net investment:
Net Exposure to Risk Factors;
Factor 2Factor 1
(-1.0) (0.8) (-1.0) (0.9)
(0.5) (-0.2) (0.5) (1.3)
(0.5) (1.8) • (0.5) (0;5)
Weighted exposure from Stock A;
Weighted exposure from Stock B;
Weighted exposure from Stock C:
Net risk exposure:
Assuming prices in one year actually rise to the levels that you initially “knew” they would, your net profit from covering the short position and liquidating the two long holdings will be:
0 0
Net Profit:
[2(35) - 2(37.20)] + [37.80 - 35] + .[38.50 - 35] = $1.90
Thus, from a portfolio in which you invested no net wealth and assumed no net risk, you have realized a positive profit. This is the essence of arbitrage investing and is an example of the “long-short” trading strategies often employed by hedge funds.
Finally, if everyone else in the market today begins to believe the way you do about the future price levels of A, B, and C—but do not revise their forecasts about the expected factor return's or factor betas for the individual stocks—then the current prices for the three stocks will be adjusted by the resulting volume of arbitrage trading to:
• = ($37.20) - (1.077) = $34.54Pq = ($37.80) - (1.057) = $35.76Pc = ($38.50) - (1.097) = $35.10
Empirical Tests of the APTAlthough the APT is considerably newer than the CAPM, it has undergone numerous empirical studies. Before we begin discussing the empirical tests, remember the crucial earlier caveat that when applying the theory, we do not know what the factors generated by the formal model actually represent. This becomes a major point in some discussions of test results.
Roll-Ross Study: Roll and Ross produced one of the first large-scale empirical tests of the APT. Their methodology followed a two-step procedure:
152 Self-Inslructiiinal Material

1. Estimate the expected returns and the factor coefficients from time-series data on individual asset returns.
2. Use these estimates to test the basic cross-sectional pricing conclusion implied by the APT.' Specifically, are the expected returns for these assets consistent with the common factors derived in Step 1?
In particular, the authors tested the following pricing relationship:
Hq. There exist nonzero constants (a,q, a,, ... such that for any asset i\
[E - A-g] = 6,1 -H ^i2 + ■■■ + \ ^ikThe specific 6,- coefficients were estimated using the statistical technique of factor analysis. The authors pointed out that the estimation procedure was generally appropriate for the model involved, but there is very little known about the small sample properties of the results. Therefore, they emphasized the tentative nature of the conclusions.
Their database consisted of daily returns for the period from 1962 through 1972. Stocks were put .into 42 portfolios of 30 stocks each (1,260 stocks) by alphabetical order. The initial estimation of the factor model indicated that the maximum reasonable number of factors was five. The factors derived were applied to all 42 portfolios, with the understanding that the importance of the various factors might differ among portfolios ie.g., the first factor in Portfolio A might not be first in Portfolio EO. Assuming a risk-free rate of 6 per cent (Xq = 0.06), the . subsequent analysis revealed the existence of at least three meaningful factors but probably not more than four. However, when they allowed the model to estimate the risk-free rate (Xq), only two factors were consistently significant.
A subsequent test related returns to a security’s own-standard deviation, which should not affect expected return if the APT is valid because a security’s unsystematic component would be eliminated by diversification, and the nondiversifiable components should be explained by the factor sensitivities {or “loadings”.). The test analyzed returns against the five factors plus the' security’s own standard deviation. The primary results showed that - the security’s own standard deviation was statistically significant, which provided evidence against the APT. Subsequently, they adjusted the results for skewness and found that the security’s own standard deviation was insignificant, which supports the APT.
Finally, Roll and Ross tested whether the three or four factors that affect Group. A were the same as the factors that affect Group B. The analysis involved testing for cross-sectional consistency by examining whether the Xq terms for .the 42 groups are similar. The results yielded no evidence that the intercept terms were different, although the test was admittedly weak. The authors concluded that the evidence generally supported the APT but acknowledged that their tests were not conclusive.
An Intrudiic.tion to Portfolio Manageme.nt
NOTES
Sflf-ln.vtructitinal Material 153

Security Analysis and Inuestmeni Management 3.13 SUMMARY
• Portfolio theory also assumes that investors are basically risk averse, . meaning that, given a choice between two assets with equal rates of return, they will select the asset with the lower level of risk. ,
• Investors consider each investment alternative as being represented by a probability distribution of expected'returns over some holding period.
• One of the best-known measures of risk is the variance, or standard ■ deviation of expected returns.
• Two basic concepts in statistics, covariance and correlation, must be understood before we discuss the formula for the variance of the rate of return for a portfolio.
• We can consider the formula' for computing the standard deviation of returns for a portfolio of assets, our measure of risk for a portfolio.
• Because capital market theory builds on portfolio theory, this unit begins •where the discussion of the Markowitz efficient-frontier ended.
• This discussion implies a central portfolio of risky assets on the efficient frontier, which we call the market portfolio.
• As noted, the assumption of a risk-free asset in the economy is critical to asset pricing theory.
• We have defined a risky asset as one from which future returns are uncertain, and we have measured this uncertainty by the variance, or standard deviation, of expected returns.
• Calculating Systematic Risk: The characteristic line the systematic risk input for an individual asset is derived from a regression model, referred to as the asset’s characteristic line with the market portfolio.
• Throughout our presentation of the CAPM, we noted that the market portfolio included all the risky assets in the economy.
• These models differ primarily in how they define the risk factors and can be grouped broadly into those models that use macroeconomic factor definitions and those that specify microeconomic factors.
NOTES
3.14 REVIEW QUESTIONS
1. Why do most investors hold diversified portfolios?2. What is covariance, and why is it important in portfolio theory?3. Why do most'assets of the same type show positive covariances of returns
with each other? Would you expect positive covariances of returns between different types of assets such as returns on Treasury bills. General Electric common stock, and commercial real estate? Why or why not?
Self-Instructional Material154

4. What is the relationship between covariance and the correlation coefficient?5. Explain the shape of the efficient frontier.6. Draw a properly labeled graph of the Markowitz efficient frontier. Describe
the efficient fi'ontier in exact terms. Discuss the concept of dominant portfolios and show, an example of one on your graph.
7. Assume you want to run a computer program to derive the efficient frontier for your feasible set of stocks. What information must you input to the progi'am?
8. Wffiy are investors' utility curves important in portfolio theory?9. Explain why the set of points between the risk-free asset and a portfolio on
the Markowitz efficient frontier is a straight line.10. ' Draw a graph that shows what happens to the Markowitz efficient frontier
when you combine a riskfree asset with alternative risky asset portfolios on tJie Markowitz efficient frontier. Explain this graph.
11. Draw and explain why the line from-the RFR that is tangent to the efficient frontier defines the dominant sot of portfolio possibilities.
12. Discuss what risky assets are in Portfolio M and why they are in it.13. Discuss leverage and its effect on the CML.
•14. Discuss and justify a measure of diversification for a portfolio in terms of capital market theory. , . •
15. What changes would you expect in the standard deviation for a portfolio of between 4 and 10 stocks, between 10 and 20 stocks, and between 50 and 100 stocks?
16. Capital market theory divides the variance of returns for a security into systematic variance and unsystematic or unique variance. Describe each of these terms.
17. The capital asset pricing model (CAPM) contends that there is systematic and unsystematic risk for an individual security. Which is the relevant risk variable and why is it relevant? Why is the other risk variable not relevant?
18. Boih the capital asset pricing model and the arbitrage pricing theory rely on the proposition that a no-risk, no-wealth investment should earn, on average, no return. Explain why this should be the case, being sure to describe briefly the similarities and differences between the CAPM and the APT. Also, using either of these theories; explain how superior investment performance can be established. .
All Introduction to Portfolio Management
NOTES
3.15 FURTHER READINGS
Investment Management: B.L. Mathur, Mohit Pub, 2002.Investment Management: Performance Evaluation of Different Schemes of Mutual Funds: Martina R Noronha and Samta Trivedi, ABD Pub, 2008. Investment Management and Security Analysis: Text and Cases:Dhanesh Kumar Kliatri, Macmillan, 2006.Investment Management and Stock Market: Edited by A.K. Vashisht and R.K. Gupta, Deep and Deep, 2005.
1.2.
. 3.
4.
Security Analysis and Investment Management: O.P. Agarwal, Himalaya Publi.shmg House, 2011,
5.
Self-Instructional Material 155

I
Seriirily Anolynia and Investment Management UNIT 4 EVALUATION OF
PORTFOLIO
PERFORMANCENOTES
★ STRUCTURE ★
4.0 Learning Objectives
4.1 Introduction
4.2 Portfolio Management
4.3 Performance Evaluation
4.4 Treynor Portfolio Performance Measure
4.5 Sharpe Portfolio Performance Measure
4.6 Portfolio Management and Mutual Funds
4.7 Types of Investment Companies
4.8 Meaning of Portfolio Revision
4.9 Need for Portfolio Revision
4.10 Portfolio Revision Strategies
4.11 Portfolio Revision Practices
4.12 Summary
4.13 Review Questions
4.14 Further Readings
4.0 LEARNING OBJECTIVES
After going through this unit, you will be able to:
• define what is performance evaluation of existing portfolio?
• know about the sharpe and treynor measures.
• • describe the finding alternatives.• differentiate between the portfolio management and mutual fund industry.
• discuss about the revision of portfolio.
• explain the portfolio management.
156 Self-Instructional Material

Evaluation of Portfolio Performance4.1 INTRODUCTION
Investors always are interested in evaluating the performance of their portfolios. It is both expensive and time consuming to analyze and select securities for a portfolio, so an individual, company, or institution must' determine whether this effort is worth the time and money invested in it. Investors managing their own portfolios should evaluate their performance as should those who pay one or several professional money managers. In the latter case, it is imperative to determine whether the investment performance justifies the service’s cost.
NOTES
4.2 PORTFOLIO MANAGEMENT
There are two major requirements of a portfolio manager:1. The ability to derive above-average returns for a given risk class
2. The ability to diversify the portfolio completely to eliminate all unsystematic risk, relative to the portfolio’s benchmark.
In terms of return, the first requirement is'obvious, but the need to consider risk in this context was generally not apparent before the 1960s, when work in portfolio theory showed its significance. In modern theory, superior risk- adjusted returns can be derived through either superior timing or superior security selection.
An equity portfolio manager svho can do a superior job of predicting the peaks or troughs of the equity market can adjust the portfolio’s composition to anticipate market trends, holding a completely diversified portfolio of high-beta stocks through rising markets and favouring lowbeta stocks and money market insti-uments during declining markets. Bigger gains in rising markets and smaller losses in declining markets give the portfolio manager above-average risk-adjusted returns.A fixed-income portfolio manager with superior timing ability changes the portfolio’s duration in anticipation of interest rate changes by increasing the
- duration of the portfolio in anticipation of failing interest rates and reducing the .duration of the portfolio when rates are expected to rise. If properly executed,- this bond portfolio management strategy likewise .provides superior risk-adjusted returns.
Self-Instructional Ma!

Security Analysis and alternative Strategy, a portfolio manager and his or her analysts maytry consistently to select undervalued stocks or bonds for a given risk class. Even without superior market timing, such a portfolio would likely experience above-average risk-adjusted returns. The second factor to consider in evaluating a portfolio manager is the ability to diversify completely. On. average the market rewards investors only for bearing systema,tic (market) , risk. Unsystematic risk is not considered when determining required returns because it can be eliminated in a diversified market portfolio. Because they can expect no reward for bearing this uncertainty, investors often want their portfolios completely diversified, which means they want the portfolio manager to eliminate most or all unsystematic risk. The level of diversification can be judged on the basis of the correlation between the portfolio returns and the returns for a market portfolio or some other benchmark index. A completely diversified portfolio is perfectly correlated with the fully diversified benchmark portfolio.
These two requirements of a portfolio manager are important because some portfolio evaluation techniques take into account one requirement but not the other. Other techniques implicitly consider both factors but do not differentiate between them.
Investment Management
NOTES
^rS^ERFORMANCE EVALUATION
Portfolio Evaluation Before 1960
\
At one time, investors evaluated portfolio performance almost entirely on' the basis of the rate of return. They were aware of the concept of risk but did not know how to quantify or measure it, so the^’ could hot consider it explicitly. Developments in portfolio theory in the early 1960s showed investors how to quantify and measure risk in terms of the variability of returns. Still, because no single measure combined both return and risk, the two factors had to be considered separately as researchers had done in several early studies.1 Specifically, the investigators grouped portfolios into similar risk classes based on a measure of risk (such as the variance of return) and then compared the rates of return for alternative portfolios directly within these risk classes.
- 158 Sflf-!nslructic>nal Material

I
H ^ 2. iri » 2- 5 ^ ^^ era ~& S’ ^ °
w •• Return Ouartiles
Period Ending June 30, 1996S?» to
CO
S § I g I^ -o p S §^ S' ^ 3 S'
^ a ^ «r^' Q. “ 2 ^I s i i I s^ ^ ti: S ^
5? 5- -:? p »
Annualized Rate of Return %CO
23
21
5 19
17r“*
«15 ■*• -r 3 o ” '■« «■
o- ^tt> . ~
♦♦*mT3 13
g-f-l I r ?v: -5 g (D^ ^ ^ ^
2 I
S:: <■•\c 11<r.
9
S' “'< r^
7(/>, a •31 >-■ p
S 2 =3. o Cu o
5P <-■
?r- o “•; ?
10YR 9YR 8YR • 7YR“I 6YR SYRPeriodsS cp■o P O 13
c+ O3“15 o
3 ^ ° IP r“
p ^ 3 2 ^£ ET Cu i H. ■P P P g -
g 3 p<< tc
®. O 3 o g P
’.o' 3M “3
5th percentile 25th percentile Median
75thperceniile , 95th percentile ' Russell 1000
• Russell 3000-
♦ S&P 500 index . ■ 0 U S. equity with
cash portfolio
n 16.8 '15 9 18.8 18.7 18.8 21.214.8 13.9 16.7 16.0 16.0 17.713.8 15213.0 14.6 14.8 16.2
2. 125 12.0 14.0 ■ 13.4 . 13.5 14.8 .Bt ^ o 10.8 10.1 12.0 11.5 11 3 11.913.5 12.7 15.3 14.6 14.6 16.1
/ 3 13.2 12.5 15.1 14.5 14,S 16.2P "p 3- ^
13.8 12.6 15.3 14.6 14.3 15.7“ M -
oto• coi . 16.6 16.5 16.4 . 15.6 156 17.03 3 o a:P c“to P P O
“r>
r ■c2 .
GN3
3 ' Izs i-l- 2 '
o3
HB ^I?
2 13Q_ cc§
«)<d

Security Analysi/s andInveetmcnlManaftcrnent. 4.4 TREYNOR PORTFOLIO PERFORMANCE MEASURE
>■
Treynor developed the first composite measure of portfolio performance Vthat included risk. He postulated two components of risk; (1) risk produced
by general market fluctuations and (2) risk resulting from unique fluctuations in the portfolio securities. To identify nsk due to market fluctuations, he introduced the characteristic line, which defines the relationship between the rates of return for a portfolio over time and the rates of return for an appropriate market portfolio. He noted that the characteristic line’s slope measures the relative volatility of the portfolio’s returns in relation to returns for the aggregate market. As we also know, this slope is the portfolio’s beta coefficient. A higher slope (beta) characterizes a portfolio that is more sensitive to market returns and that has greater market risk. •'
Deviations from the characteristic line indicate unique returns for the portfolio relative to the market. These differences arise from the returns on individual stocks in the portfolio.. In a completely diversified portfolio, these unique returns for individual stocks should cancel out. As the correlation of the portfolio with the market increases, unique risk declines and diversification improves. Because Treynor was not concerned about this aspect of portfolio performance, he gave no further consideration to the diversification measure.
NOTES
Treynor’s Composite Performance Measure^Treynor was interested in a measure of performance that would apply to all
investors—^regardless of their risk preferences. Building on developments in capital market theory, he introduced a risk-free asset that could be combined with different portfolios to form a straight portfolio possibility line. He showed that rational, risk-averse investors would always prefer portfolio possibility lines with larger slopes because such high-slope lines would place investors on higher indifference curves. The slope of this portfolio possibility line (designated T) is equal to
Ri RFRT =P,
where, '
Ri = The average rate of return for portfolio i during a specified time
period
RFR = The average rate of return on a risk-free investment during the same time period
• = The slope of the fund’s characteristic line during that time period(this indicates the portfolio’s relative volatility)
160 Self-Instructional Material

As noted, a larger T value indicates a larger slope and a better portfolio for Evaluation of Portfolio all investors (regardless of their risk preferences). Because the numerator of
this ratio - HFR'j is the risk premium and the denominator is a measure
of risk, the total expression indicates the portfolio’s risk premium return per unit of risk. All risk-averse investors would prefer to maximize this value.Note that the risk variable beta measures systematic risk and tells us nothing about the diversification of the portfolio. It implicitly assumes a completely diversified portfolio, which means that systematic risk is the relevant risk measure.
Comparing a portfolio’s T value to a similar measure for the market portfolio indicates whether the portfolio would plot above the SML, Calculate the T value for the aggregate market as follows:
Performanoe
NOTES
. Rm - RFR'^M =
Pm
In this expression, equals 1.0 (the market’s beta) and indicates the slope . of the SML. Therefore, a portfolio with a higher T value than the market
portfolio plots above the SML, indicating superior risk-adjusted performance./
4.5 SHARPE PORTFOLIO PERFORMANCE MEASURESharpe likewise conceived of a composite measure to evaluate the performance of mutual funds. The measure followecf^closely his earlier work on the Capited Asset Pricing Model (CAPM), dealing specifically with the Capital Market Line (CML).
The Sharpe measui’e of portfolio performance (designated S) is stated as follows: ''
Ri - RFRS,. =
where.
Ri = The average rate of return for portfolio i during a specified time period
RFR = The average rate of return on risk-free assets during the same time period
= The standard deviation of the rate of return for portfolio i during the time period.
This composite measure of portfolio performance clearly is similar to the Treynor measure; however,' it seeks to measure the total risk of the portfolio
Self-Instructional Material 161

Security Analysis and by including the Standard deviation of returns rather than considering only the systematic risk summarized by beta. Because the numerator is the portfolio’s risk premium, this measure indicates the risk premium return, earned per unit of total risk. In terms of capital market theory, this portfolio performance measure uses total risk to compare portfolios to'the CML, whereas the Treynor measure examines portfolio performance in relation to the- SML, Finally, notice that in practice the standard deviation can be calculated using either total portfolio returns or portfolio returns in excess of the risk-free rate.
liwcatment Management
NOTES
4.6 PORTFOLIO MANAGEMENT AND MUTUAL FUNDS
Investment companies are entities that sell shares 'to the public and invest the proceeds in a diversified portfolio of securities. Each share sold represents a proportional interest in the portfolio of securities managed by the investment company on behalf of its shareholders. The, type of securities purchased depends on the company’s investment objective.
4.7 TYPES OF INVESTMENT COMPANIES
There are three types of investment companies: open-end funds, closed-end . funds, and unit trusts.
Open-End Funds (Mutual Funds)\
Open-end funds, commonly referred to simply as mutual funds, are portfolios of securities, mainly stocks, bonds, and money market instruments. There are several important aspects of mutual funds. First, investors in mutual funds own a pro rata share of the overall portfolio. Second, the investment manager of the mutual fund actively manages the portfolio, that is buys some securities and sells others (this chatacteristic is unlike unit investment trusts, discussed later).
Third, the value or price of each share of the portfolio, called the net asset value (NAV), equals the market value of the portfolio minus the liabilities of the mutual fund divided by the nurnber of shares owned by the mutual fund investors. That is.
/^ '.A/•
K.-4-
Market value of portfolio - LiabilitiesNAV =
Number of shares outstanding
For example, suppose that a mutual fund with 10 million shares outstanding has a portfolio with a market value of $215 million and liabilities of $15
162 Self-Instructional Material

million. The NAV is: Evaluation of Portfolio Performance
$215,000,000 - $15,000,000= $20NAV =
$10,000,000NOTES
Fourth, the NAV or price of the fund is determined only once each day, at the close of the day. For example, the NAV for a stock mutual fund is determined from the closing stock prices for the day. Business publications provide the NAV each day in their mutual fund tables. The published NAV’s are the closing NAV’s. Fifth, and very importantly, all new investments into the fund or withdrawals from the fund during a day are priced at the closing NAV (investments after the end of the day or on a non-business day are priced at the next day’s closing NAV).
The total number of shares in the fund increases if there zire more investments than withdrawals during the day, and vice versa. For example, assume that at the beginning of a. day a,mutual fund portfolio has a value of $1 million, there are no liabilities, and there are 10,000 shares outstanding. Thus, the. NAV of the fund is $100. Assume that during the day $5,000 is deposited into the fund, $1,000 is withdrawn, and the prices of all the securities in the portfolio remain constant. This means that 50 shai’co were issued for the $5,000 deposited (since each share is $100) and 10 shares redeemed for $1,000 (again, since each share is $100). The net number of new shares issued is then 40. Therefore, at the end of the day there will be 10,040 shares and the total value of the fund will be $1,004,000. The NAV will remain at $100.
If, instead, the prices of the securities in the portfolio change, both the total size of the portfolio and, therefore, the NAV will change. In the previous example, assume that during the day the value of the portfolio doubles to $2 million. Since deposits and withdrawals are priced at the end-of-day NAV,' which is now $200 after the doublihg of the portfolio’s value, the $5,000 deposit will be credited with 25 shares ($5,000/$200) and the $1,000 withdrawn will reduce the number of shares by 5 shares ($1,000/$200). Thus, at the end of the day there will be 10,020 shares (25 - 5) in the fund with an NAV of $200, and the value of the fund will be $2,004,000. (Note that 10,020 shares X $200 NAV equals $2,004,000, the portfolio value).
Overall, the NAV of a mutual fund will increase or decrease due to an increase or decrease in the prices of the securitie's in the portfolio. The number of shares in the fund will increase or decrease due to the net deposits into or withdrawals from the fund. And the total value of the fund will increase or decrease for both reasons.
Self-Instructional Material 163

Security Analysis and Investment Management
Closed-End FundsThe shares of a closed-end fund are very similar to the' shares of common stock of a corporation. The new shares of a closed-end fund are initially issued by an underwriter for the fund. And after the new issue, the number of shares remains constant. After the initial issue, there are no sales or purchases of fund shares by the fund company as there are for open-end funds. The shares are traded on a secondary market, either on an exchange or in the over-the-counter market. Investors can buy shares either at the time of the initial issue (as discussed below), or in the secondary market. Shares are sold only on the secondary market. The price of the shares of a- closedrend fund are determined by the supply and demand in the market in which these funds are traded. Thus, investors who transact closed-end fund shares must pay a brokerage commission at the time of purchase and at the time of sale.
The NAV of closed-end funds is calculated in the same way as for open-end funds. However, the price of a share in a closed-end fund is determined by
' supply and demand, so the price can fall below or rise above the net asset value per share. Shares selling below NAV are said to be “trading at .a discount,” while shares trading above NAV are “trading at a premium”. Newspapers list quotations of the prices of these shares under the heading “Closed-End Funds”.
Consequently, there are two important differences between open-end funds and closed-end funds. First, the number of shares of an open-end fund varies because the fund sponsor will sell new shares to investors and buy existing shares from shareholders. Second, by doing so, the share price is always the NAV of the fund. In contrast, closed-end funds have a constant number of shares outstanding because the fund sponsor does not redeem shares and sell new shares to investors (except at the time of a new underwriting). Thus, the price of the fund shares will be determined by supply and demand in the market and may be above or below NAV, as discussed above.
Although the divergence of the price from NAV is often puzzling, in some cases the reasons for the premium or discount are easily understood. For' • example, a share’s price may be-below the NAV because the fund has a large built-in tax liabilities and investors are discounting the share’s price for that future tax liability. A fund’s leverage and resulting risk may be ,another reason for the share’s price trading below NAV. A fund’s shares may trade at a premium to the NAV because the fund offers relatively cheap access to, and professional management of, stocks in another country about which information is not readily available to small investors.
Under the Investment Company Act'of 1940, closed-end funds are capitalized only once. They make an initial IPO (initial public offering) and then their
NOTES
1
164 Self-Instructional Material
shares are traded on the secondary market, just like any corporate stock, as discussed previously. The number of shai-es is fixed'Nat the IPO; closed-end funds cannot issue more shares. In fact, many closed-end funds become leveraged to raise more funds without issuing more shares. An important feature of closed-end funds is that the initial investors bear the substantial cost of uii.Jt-1 writing the issuance of the funds’ sheires. The proceeds that the managers of the fund have to invest equals .the total paid by initial buyers of the shares minus all costs of issuance. These costs, which average around 7.5% of the total amount paid for the issue, normally include selling fees or commissions paid to the retail brokerage firms that distribute them to the public. The high commissions are strong incentives for retail brokers to recommend these shares to their retail customers, and also for investors to avoid buying these shares^ on their initial offering.
The relatively new Exchange Traded Funds (EFTs) pose a threat to both mutual funds and closed-end funds. ETFs are essentially hybrid closed-end vehicles, which trade on exchanges but which typically trade very close to NAV. Since closed-end funds are traded like stocks, .the cost to any investor
■ of buying or selling a closed-end fund is the same as that of a stock. The obvious charge is the stock broker’s commission. The bid/offer spread of the market on which the stock is traded is also a cost.
Evaluation^ of Portfolio Performance
NOTES
Unit TrustsA unit trust is similar to a closed-end fund in that ‘the number of unit certificates is fixed. Unit trusts typically invest in bonds. They differ in several ways from both mutual funds and closed-end funds that specialize in bonds. First, there is no active trading of the bonds in the portfolio of the unit trust. Once the unit trust is assembled by the sponsor (usually a brokerage firm or bond underwriter) and turned over to a 'trustee, the trustee holds all the bonds until they are redeemed by the issuer. Typically, the only time the trustee can sell an issue in the portfolio is if there is a dramatic decline in the issuer’s credit quality. As a result, the cost of operating the trust will be considerably less than costs incurred by'either a mutual fund or a closed-end fund. Second, unit trusts have a fixed termination date, while mutual funds and closed-end funds do not. Third, urdike the mutual fund and closed-end fund investor, the unit trust investor knows that the portfolio consists of a specific portfolio of bonds and has no concern that the trustee will alter the portfolio. While unit trusts are common in Europe, they are not common in the United States.
All unit trusts charge a sales commission. The initial sales charge for a unit trust ranges from 3.5% to 5.5%. In addition to these costs, there is the cost
. incurred by the sponsor to purchase the bonds for the trust that an investor indirectly pays. That is, when the brokerage firm or bond-underwriting firm
Self-Instructional Material 165
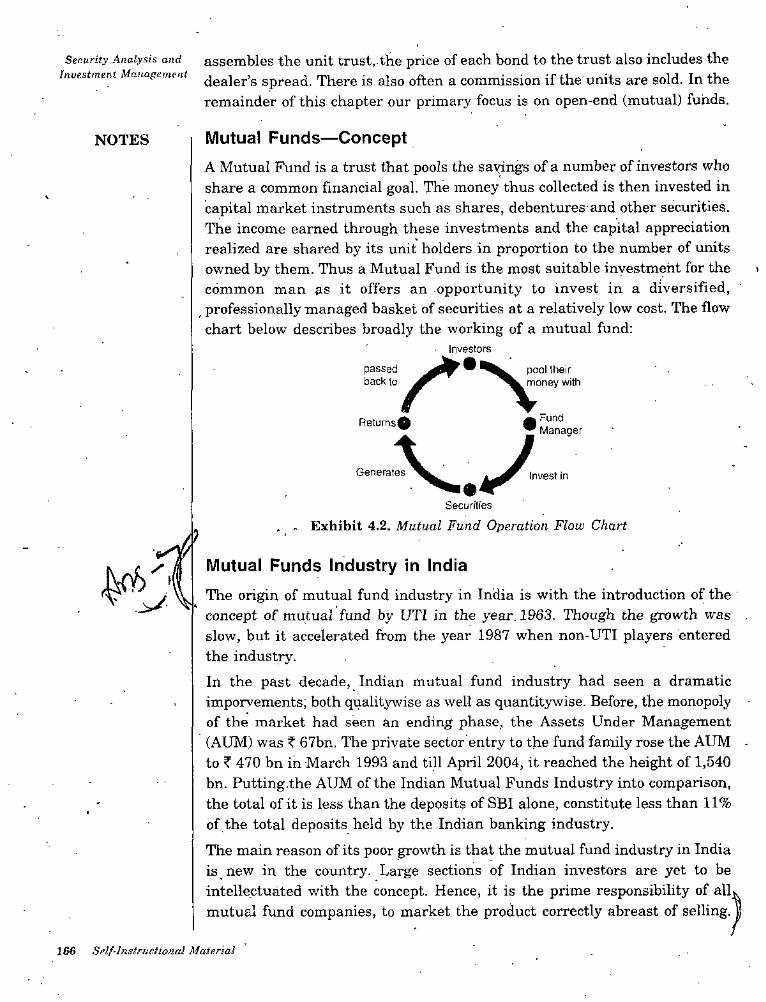
assembles the unit trust, the price of each bond to the trust also includes the dealer’s spread. There is also often a commission if the units are sold. In the remainder of this chapter our primary focus is on open-end (mutual) funds.
Set:urity Analysis and Investment Manapement
Mutual Funds—ConceptA Mutual Fund is a trust that pools the sayings of a number of investors who share a common financial goal. The money thus collected is then invested in capital market instruments such as shares, debentures and other securities.The income earned through these investments and the capital appreciation realized are shared by its unit holders in proportion to the number of units owned by them. Thus a Mutual Fund is the most suitable investment for the > common man as it offers an opportunity to invest in a diversified, professionally managed basket of securities at a relatively low cost. The flow chart below describes broadly the working of a mutual fund:
Investors
NOTES
passed back to
pool their money with
gk Fund " Manager
Returns^
Generates Invest in
Securities
Exhibit 4.2. Mutual Fund Operation Flow Chart}
/Mutual Funds Industry in IndiaThe origin of mutual fund industry in India is with the introduction of the concept of mutual fund by UTI in the year. 1963. Though the growth was slow, but it accelerated from the year 1987 when non-UTI players entered the industry.
In the past decade, Indian mutual fund industry had seen a dramatic imporvements, both qualitywise as well as quantitywise. Before, the monopoly of the market had seen an ending phase, the Assets Under Management (AUM) was ? 67bn. The private sector entry to the fund family rose the AUM - to f 470 bn in March 1993 and till April 2004, it reached the height of 1,540 bn. Putting.the AUM of the Indian Mutual Funds Industry into comparison, the total of it is less than the deposits of SBI alone, constitute less than 11% of the total deposits held by the Indian banking industry.
The main reason of its poor growth is that the mutual fund industry in India is new in the country. Large sections of Indian investors are yet to be intellectuated with the concept. Hence, it is the prime responsibility of alk mutual fund companies, to market the product correctly abreast of selling. W
y
166 Splf-lnstriictional Material

The mutual fund industry can be'broadly put into four phases according to the development of the sector. Each phase is briefly described as under.
Evaluation of Portfolio Performance
First Phase-1964-87NOTESUnit Trust cf India (UTI) was established dii'i963 by an Act of Parliament.
It was set up by the Reserve Bank of India and functioned under the Regulatory and administrative control of the Reserve Bank of IndiaJ In 1978 UTI was de-linked from the RBI and the Industrial Development Bank of India (IDBI) took over the regulatory and administrative control in place of RBI. The first scheme launched by UTI was Unit Scheme 1964. At the end of 1988 UTI had ? 6,700 crores of assets under management./Second Phase-1987-1993 (Entry of Public Sector Funds)Entry of non-UTI mutual funds. SBI Mutual Fund was the first followed by Canbank Mutual Fund (Dec 87), Punjab National Bank Mutual Fund (Aug 89), Indian Bank Mutual Fund (Nov 89), Bank of India (Jun 90), Bank of Baroda Mutual Fund (Oct 92). LIC in 1989 and GIG in 1990. The end of 1993 marked ? 47,004 as assets under managemeiit.
i/Third Phase-:1993-2003 (Entry of Private Sector Funds)'^With the entry of private sector funds in 1993, a new era started in the Indian mutual fund industry, giving the Indian investors a wider choice of fund families. Also, 1993 was the year in which the first Mutual Fund Regulations came into being, under wliich all mutual funds, except UTI were to be registered and governed. The erstwhile Kothari Pioneer (now merged with Franklin Templeton) wa^the first private sector mutual fund registered in July 1993. The 1993 SEBI^Mutual Fund) Regulations'were substituted by a more comprehensive and revised Mutual Fund Regulations in 1996. The industry now functions under the SEBI (Mutual Fund) Regulations 1996.
The number of mutual fund houses went on increasing, with many foreign mutual- funds setting up funds in India and also the industry has witnessed several mergers and acquisitions. As at the end of January 2003, there were 33 mutual funds with total assets of? 1,21,805 crores. The Unit Trust of In'dia with ? 44,541 crores of .assets under management was way ahead of other mutual funds.
Fourth Phase-since February 2003^This phase had bitter experience for UTI. It was bifurcated into two separate entities. One is the Specified Undertaking of the Unit Trust of India with AUM of? 29,835 crores (as on January 2003). The Specified Undertaking of Unit Trust of India, functioning under an administrator and under the rules
Self-Instructional Material 167

framed by Government of Isdia and does not come.under the purview of the Mutual Fund Regulations. A ,
Security Aiialy»ix and Investment Management
al Fund Ltd, sponsored by SBI, PNB, BOB and Lie. It is registered with SEBI and functions under' the Mutual Fund Regulations. With the bifurcation of the erstwhile UTI which had in March 2000 more than ? 76,000 crores of AUM and with the setting up of a UTI Mutual Fund, conforming to the SEBI Mutual Fund Regulations, and with recent mergers taking place among different private sector funds, the mutual fund industry has entered its current phase of consolidation and growth. As at the end of September, 2004, there were 29 funds, which manage assets of ? 153108 crores'under 421 schemes. The major players in the Indian Mutual Fund Industry are:
180000-■
160000■•
The second is the UTI M
NOTES
155845 153108140000-•
121005 139616■ 120000--
87190100000"01 794642 80000"
- <^47000e 60000'-
40000
20000•• .. 4564^25 . /
/
0 8 S S .COCO- .fe - fo —— 0^ —a> w olA fO
OO oCLs s I c CO CO 0)35 COLL
n. CLQ. Phase IV Since Feb 03YEARS
Exhibit 4.3. Groujth in Assets Under Management
Mutual Fund Companies in IndiaThe concept of mutual funds in India dates back to the year 1963. The era between 1963 and 1987 marked the existence of only one mutual fund company in India with ? 67bh Assets Under Management (AUM), by the end of its monopoly era, the Unit Trust of India (UTI). By the end of the 80s decade, few other mutual fund companies in India took their position in mutual fund market.
The new entries of mutual fund companies in India were SBI Mutual Fund, Canbank Mutual Fund, Punjab National Bank Mutual Fund, Indian Bank Mutual Fund, Bank of India Mutual Fund. The succeeding decade showed a new horizon-in indian mutual fund industry. By the end of 1993, the total AUDI of the industry was ?,470.04 bn. The private sector funds started penetrating the fund families. In the same year the first- Mutual Fund
168 Self-Instructional Material
Regulations came into existance with re-registering all mutual funds except ,UTL The regulations were further given a revised shape in'1996.
Kothari Pioneer was the first private sector mutual fund company in India which has now merged with Franklin Templeton. Just after ten years with private sector players penetration, the total assets rose up to ? 1218.05 bn. Today there are 33 mutual fund companies in India.
Evaluation of Portfolio Performance
NOTES
Major Mutual Fund Companies in India1. ABN AMRO Mutual Fund.
2. Birla Sun Life Mutual Fund
3. Bank of Baroda Mutual Fund (BOB Mutual Fund).
4. HDFC Mutual Fund.
5. HSBC Mutual Fund.
6. ING Vysya Mutual Fund.
7. Prudential ICICI Mutual Fund.
8. Sahara Mutual Fund.
9. State Bank of India Mutual Fund.
•iO. Tata Mutual Fund.
11. Kotak Mahindra Mutual Fund.
12. Unit Trust .of India Mutual Fund.
13. Reliance Mutual Fund.
14. Standard Chartered Mutual Fund.
T5. Franklin Templeton India Mutual Fund.
16. Morgan Stanley Mutual Fund India.
17. Escorts Mutual Fund.
18. Alliance Capital Mutual Fund.
19'. Benchmark Mutual Fund.
20. Canbank Mutual Fund.
21. Chola Mutual Fund.
,22. Lie Mutual Fund.
23. GIC Mutual Fund.
Advantages of Mutual FundsThe advantages of investing in a Mutual Fund are:
• Diversification: The best mutual funds design their portfolios so individual investments will react differently to the same economic conditions. For
/•Self-Instructional Material 169

example, economic conditions like a rise in interest rates may cause certain securities in a diversified portfolio to decrease in value. Other securities in the portfolio will respond to the same economic conditions by increasing in value. When a portfolio is balanced in this way, the value of the overall portfolio should gradually increase over time, even if some securities lose value.
• Professional Management: Most mutual funds pay topflight professionals to manage their investments. These managers decide what securities the fund will buy and sell.
• Regulatory Oversight: Mutual funds are subject to many government regulations that protect investors from fraud. .
• Liquidity: It’s easy to get your money out of a mutual fund. Write a check, make a call, and you've got the cash.
• Convenience: You can usually buy mutual fund shares by mail, phone, or over the Internet.
• Low Cost: Mutual fund expenses are often no more than 1.5 per cent of your investment. Expenses for Index Funds are less than that, because index funds are not actively managed. Instead, they automatically buy stock in companies that are listed on a specific index
• Transparency
• Flexibility
• Choice of schemes
• Tax benefits
• Well regulated.
Security Analysis and Investment Management
NOTES
Drawbacks of Mutual FundsMutual funds have their drawbacks and may not be for everyone:
• No Guarantees: No investment is risk free. If the entire stock market declines in value, the value of mutual fund Shares will go down as well, no matter how^,balanced' the portfolio. Investors encounter fewer risks when they invest in mutual funds than when they buy and sell stocks on their own. However, anyone who invests through a mutual fund runs the risk of losing money.
• Fets and Commissions: All funds charge administrative fees to coyer their day-to-day expenses. Some funds also charge sales commissions or “loads” to compensate brokers, financial consultants, or financial planners. Even if you don’t use a broker or other financial adviser, you will pay a sales commission if you buy shares in a Load Fund.
170 Self-Instructional Material

• Taxes: During a typical year, most actively managed mutual funds sell Evaluation of Portfolioanywhere from 20 to 70 percent of the securities in their portfolios. If Performance
your fund makes a profit on its sales, you will pay taxes on the income you receive, even if you reinvest the money you made.
• Management Risk: When you invest in a mutual fund, you depend on the fund’s manager to make the right decisions regarding the fund’s portfolio.If the manager does hot perform as well as you had hoped, you might not make as much money on your investment as you expected. Of course, if you invest in Index Pxmds, you forego management risk, because these
, funds do not employ managers.
NOTES
4.8 MEANING OF PORTFOLIO REVISION
■ Most investors are comfortable with buying securities but spend little effort in revising portfolio or selling stocks. In that process they lose opportunities to earn good return. In the entire process of portfolio management, portfolio revision is as important as portfolio analysis and selection. Keeping in mind the risk-return objective, an investor selects a mix of securities from the . given investment universe.In a dynamic world of investment, it is only natural that the portfolio may not perform as desired or opportunities might arise turning the desired into less than desired. Further, some of the risk and return estimation might change over a period of time. In every such situation, a portfolio revision is warranted. Portfolio revision involves changing the existing mix of securities. The objective of portfolio revision is similar to the objective of portfolio selection i.e., maximizing the return for a given level of risk or minimizing the risk for a given level of return. The process of portfolio revision is also similar to the process of portfolio selection. This is particularly true where active portfolio revision strategy is followed. It calls for reallocation of funds between bond and stock market through economic analysis, reallocation of funds among different industries through industry analysis and finally selling and buying of stocks within the industry through company analysis. Where passive portfolio revision strategy is followed, use of mechanical formula plans may be made. What are these formula plans? We shall discuss these and other aspects of portfolio revision in this Unit. Let us begin by highlighting the need for portfolio revision.
4,9 NEED FOR PORTFOLIO REVISION
No plan can be perfect to the extent that it would not need revision sooner or later. Investment Plans are certainly not. In the context of portfolio
Self-Instructional Material 171

management the need for revision is even more because the financial markets are continually changing. Thus the need for portfolio revision might simply arise because market witnessed some significant changes since the creation of the portfolio..Further, the need for portfolio revision may arise because of some investor-related factors such as (i) availability of additional wealth, Hi) change in the risk attitude and the utility function of the investor, iiii) change in the investment goals, of the investors and {iu) the need to liquidate a part of the portfolio to provide funds for some alternative uses. The other valid reasons for portfolio revision such as short-term price fluctuations in the market do also exist. There are thus numerous factors, which may be broadly called market related and investor related.
Security Analysis and Investment Management
NOTES
4.10 PORTFOLIO REVISION STRATEGIES
Broadly speaking investors may, depending on their investment objectives skill and resources, follow ‘active’ or ‘passive’ strategies for portfolio revision. Active strategy of portfolio revision involves a process similar to portfolio
, analysis and selection which is based on an analysis of fundamental factors covering economy, industries and companies as well as technical factors. As against this, under passive strategy some kind of formula plans are followed for revision. Active revision strategy seeks ‘beating the market by anticipating’ or reacting to the perceived events or information. Passive revision strategy, on the other hand, seeks ‘performing as the market’. The followers of active revision strategy are found among believers in the “market inefficiency” whereas passive revision strategy is the choice of believers in the ‘market efficiency’. However, some of the formula strategies are on the premise of market inefficiency. The frequency of trading transactions, as is obvious, will be more under active revision strategy than under passive revision strategy and so will be the time, money and resources required for implementing active revision strategy than for passive revision' strategy. In other words, active and passive revision strategies differ in terms of purpose, process and cost involved. The choice between the two strategies is certainly not very straight forward. One has to compare relevant costs and benefits. On the face of it, active revision strategy might appear quite appealing but in actual practice, there exist a number of constraints in undertaking portfolio revision itself
4.11 PORTFOLIO-REVISION PRACTICES
Investors follow both active and .passive portfolio revision strategies. Studies about portfolio revision strategies show that the efficient market hypothesis
172 Self-Instructional Material

is slowly but continuously gaining and investors revise their portfolio much less often than they were doing previously because of their rising faith in market efficiency.' Institutional investors on the other hand have shown definite tendency in.the recent past for active revision of their portfolios and most often to correct their past mistakes. For instance, Morgan Stanely mutual funds in India has made major reidsion in the last few years to reduce the size of the portfolio since the fund invested initially in about 500 stocks. In a volatile market, many funds feel that without such revision, it would be difficult to show better performance.- This is said to be motivated by their desire to achieve superior performance by frequent trading to take advantage of their supposedly superior investment skills.Some research studies undertaken in U.S. about the market timing and portfolio revision suggested as follows:• F. Black (1973) found that ‘monthly and weekly revision could be a
rewarding strategy though when transactions costs were considered theresults were less impressive, but, of course, still significantly positive.
^ *• H.A. Latane, et. Al. (1974) concluded that complete portfolio revision every
six months would have been a rewarding strategy.• Sharpe (1975) contradicts some of the earlier notions on active portfoho
revision.According to Sharpe, a rnanager, who attempts to time the market must be right roughly three times out of four, in order to outperform the buy-and- hold portfolio. If the manager is right less often, the relative performance will be inferior because of transaction costs and the manager will often have • funds in cash equivalents when they could be earning the higher returns available from common stock.Many private sector mutual funds in Indian market have become very active in portfolio re-vision.
Eualiiation of Portfolio Performance
NOTES
4.12 SUMMARY
• Investors always are interested in evaluating the performance of their portfolios.
• In terms ■ f i-etuin, the first requirement is obvious, but the need to consider risk in this context was generally not apparent before the 1960s, when
. work in portfolio theory showed its significance.• Investment companies are entities that sell shares to the public and invest
the proceeds in a diversified portfolio of securities.• The shares of a closed-end fund are very similar to the shares of common
stock of a corporation.
Self-Instructional Material 173

• A unit trust is similar to a closed-end fund in that the number of unit certificates is fixed. Unit trusts typically invest in bonds.
•. A Mutual Fund is a trust that pools the savings of a number of investors H'ho share a common financial goal. The money thus collected- is then invested in capital market instruments such as shares, debentures andother securities.,
• Most investors are comfortable with buying securities but spend little ’ effort in revising portfolio or. selling stocks.
• In a dynamic world of investment, it is only natural that the portfoliomay not perform as desired or opportunities might arise turning the desired into less than desired. '
• No plan can be perfect to the extent that it would not need . revision sooner or later. Investment Elans are certainly not.
• According to Sharpe, a manager, who attempts to time the market must be right roughly three times out of four, in order to outperform the buy-and-hold portfolio.
SiXMity Analysis and Munagems.nf
NOTES
4.13 REVIEW QUESTIONS
1. Explain the evaluation'the performance of their portfolios. 2- What is required of a portfolio manager?3. Explain Trejuror poi-tfolio performance measure.4. Explain sharps portfolio performance measure.5. What, are different types of investment companies?6. What is the basic concept of mutual funds?7. Write the short notes on the mutual funds in India.
/ . •8. 'Discuss the portfolio revision.
4.14 FURTHER READINGS
1. Investment Management: B.L. Mathur, Mohit Pub, 2002.2. Investment Management: Performance Evaluation of Different Schemes
of Mutual Funds: Martina R Noronha and Samta Trivedi, ABD Pub, 2008.3. Investment Management and Security Analysis: Text' and Cases:
Dhanesh Kumar Khatri, Macmillan, 2006.4. Investment Management and Stock Market: Edited by A.K. Vashisht and
R.K Gupta, Deep and Deep, 2005.5. Security Analysis and Investment Management: O.P. Agarwal, Himalaya
Publishing House, 2011.
□□□J 74 Self-in.nructional Molerial
Related Documents