Welcome message from author
This document is posted to help you gain knowledge. Please leave a comment to let me know what you think about it! Share it to your friends and learn new things together.
Transcript

2
Contents Foreword ................................................................................................................... 4
1 Background ........................................................................................................ 5
1.1 PHARMAC’s Role and Functions in the New Zealand Health System ......... 5
1.2 Purpose of the Prescription for Pharmacoeconomic Analysis ...................... 5
1.3 History of the PFPA ..................................................................................... 6
1.4 PFPA Version 2.2 ........................................................................................ 6
1.5 Decision making and the PFPA ................................................................... 6
2 Health Economic Analysis at PHARMAC ........................................................... 8
2.1 What is Economic Analysis? ....................................................................... 8
2.2 Why Does PHARMAC Use Economic Analysis? ......................................... 8
2.3 Types of Economic Analysis........................................................................ 8
2.4 What is the Process for Undertaking and Reviewing Cost-Utility Analyses at PHARMAC? ........................................................................................................... 9
2.5 When is a Pharmaceutical Considered to be ‘Cost-Effective’? .................. 12
3 Economic Modelling and Scope of Analysis ..................................................... 13
3.1 Models ...................................................................................................... 14
3.2 Time Horizon and Cycle Length ................................................................ 15
3.3 Perspective and Decision Problem ............................................................ 16
3.4 Target Population ...................................................................................... 16
3.5 Comparator(s) ........................................................................................... 17
4 Evidence for Relative Clinical Effect ................................................................. 18
4.1 Data Sources ............................................................................................ 18
4.2 Obtaining Data .......................................................................................... 20
4.3 Presentation of Evidence .......................................................................... 21
4.4 Assessing Data Quality ............................................................................. 21
5 Transformation of Evidence .............................................................................. 25
5.1 Transformation of Clinical Evidence .......................................................... 25
5.2 Extrapolation of Data ................................................................................. 28
5.3 Subgroup Analyses ................................................................................... 31
5.4 Assessment of Vaccines ........................................................................... 32
5.5 Transition Probabilities .............................................................................. 35
5.6 Mortality Rates .......................................................................................... 35
6 Estimating Health Benefits ............................................................................... 36
6.1 Measures of Health-Related Benefit .......................................................... 36
6.2 Health-Related Quality of Life Instruments ................................................ 38
7 Estimating Costs .............................................................................................. 41
7.1 Costs Included in PHARMAC Analyses ..................................................... 41

3
7.2 Pharmaceutical Costs ............................................................................... 42
7.3 Hospital Inpatient Costs ............................................................................ 44
7.4 Other Health System Costs ....................................................................... 45
7.5 Direct Patient Health Care Costs ............................................................... 46
7.6 Direct Non-Health Care Costs ................................................................... 47
7.7 Indirect Health Care Costs ........................................................................ 47
7.8 Indirect Patient Costs ................................................................................ 48
7.9 Sourcing and Reporting of Cost Data ........................................................ 49
8 Discounting ...................................................................................................... 51
8.1 Approaches to Determining the Discount Rate .......................................... 51
8.2 Recommended Discount Rate ................................................................... 51
8.3 Discount Rate for Budget Impact Analysis................................................. 52
9 Results of Cost-Utility Analysis ......................................................................... 53
9.1 Cost-utility and utility-cost ratios ................................................................ 53
9.2 Weighting of results from multiple models ................................................. 54
9.3 Interpretation of Results ............................................................................ 54
9.4 Presentation of Results ............................................................................. 54
10 Sensitivity Analysis ....................................................................................... 56
10.1 Parameter Uncertainty .............................................................................. 56
10.2 Model Structure Uncertainty ...................................................................... 58
11 Presentation of Data and Results ................................................................. 59
11.1 Checklist ................................................................................................... 62
Appendix 1 – PHARMAC Guidelines for Reviewing CUAs ...................................... 63
Appendix 2 – Discounting ........................................................................................ 65
Discounting Costs and Benefits at the Same Rate ............................................... 65
Approaches to Determining the Discount Rate .................................................... 65
Formula to adjust nominal discount rate for inflation ............................................ 66
References .............................................................................................................. 67
4
Foreword The Prescription for Pharmacoeconomic Analysis (PFPA) is a guide for anyone assessing the value for money of pharmaceuticals in New Zealand.
The intention is that funding proposals can be assessed to common standards, to support the best possible comparison between proposals. The PFPA may be useful for applicants submitting funding applications to PHARMAC, whether for medicines (which includes vaccines and some haemophilia treatments) or medical devices. PHARMAC follows the PFPA’s recommendations when reviewing applications or undertaking its own assessments. While it forms an important part of PHARMAC’s decision making processes the PFPA is only a guide – PHARMAC is not bound to adhere to it in every detail, or in every case.
The PFPA was first developed in 1999, when PHARMAC published its internal guidelines for cost-utility analysis for valuing medicines. The PFPA has grown and developed along with PHARMAC’s expanding role. At its foundation, PHARMAC was responsible for community medicines. PHARMAC’s scope has since broadened to include hospital medical devices, hospital medicines, some haemophilia treatments, and vaccines.
This version 2.2 of the PFPA includes explicit guidance for assessing medical devices and vaccines. The Pharmaceutical Schedule has always included some medical devices, and now includes the National Immunisation Schedule. In 2013 and 2014, PHARMAC consulted on its management of hospital medical devices. Stakeholders gave a clear message that while devices and medicines have much in common, there are also important differences in how they are researched, developed, and used. As a result, there may be differences in the availability of good quality evidence, and in the range and type of costs that should be routinely considered. Assessment methodologies need to be flexible enough so they can be applied to the full range of health interventions that PHARMAC considers.
The second important difference between this version 2.2 and the previous version 2.1 of the PFPA is that it supports PHARMAC’s move from Decision Criteria to Factors For Consideration. The economic assessments described in this Prescription for Pharmacoeconomic Analysis can help to inform PHARMAC’s consideration of many, but not all, of the Factors.
PHARMAC will continue to review and update its methods for assessing pharmaceuticals, and the Prescription for Pharmacoeconomic Analysis will continue to be updated to remain a useful resource for the New Zealand health system.

5
1 Background
1.1 PHARMAC’s Role and Functions in the New Zealand Health System PHARMAC, the Pharmaceutical Management Agency, is a Crown entity that is directly accountable to the Minister of Health. Our functions are set out in section 48 of the New Zealand Public Health and Disability Act 2000 (NZPHD Act).
One of PHARMAC’s functions is to manage the Pharmaceutical Schedule (the Schedule), which is the list of pharmaceuticals that are publicly funded. Funding may be for either or both the community or hospital setting. The definition of ‘pharmaceuticals’ is broad: as well as medicines, it includes vaccines, medical devices, and related products and things(1).
PHARMAC’s statutory objective is: to secure for eligible people in need of pharmaceuticals, the best health outcomes that are reasonably achievable from pharmaceutical treatment and from within the amount of funding provided.(1, Section 47(a))
Further information on PHARMAC can be found at www.pharmac.health.nz.
1.2 Purpose of the Prescription for Pharmacoeconomic Analysis This document is intended as guidance for use by anyone preparing economic analyses for PHARMAC, including PHARMAC staff, pharmaceutical companies, and other health economists. It provides guidance on methods for any economic assessment that will help to inform a PHARMAC funding decision.
Assessment of a proposal against the Factors for Consideration is supported by the use of economic analyses as described in this document. PHARMAC’s preferred method is ‘cost-utility analysis’ as defined in this document; although cost-minimisation analyses may be sufficient for some proposals.
As all proposals are considered and prioritised against all other possible uses of available funds at any time, it is important that common methods are used for all assessments wherever possible. A consistent approach to economic analyses as recommended in this document will help ensure proposals can be fairly compared with one another.
The focus of cost-utility analysis is on benefits as formally measured by Health-Related Quality of Life (Chapter 6) and on costs as defined in Chapter 7. Many other aspects are important to any funding decision. PHARMAC’s Factors for Consideration provide a framework to ensure that all relevant aspects and issues are taken into account. The economic assessments described in the Prescription for Pharmacoeconomic Analysis (PFPA) can help inform consideration of many but not all of the Factors.
The PFPA does not in any way attempt to be a comprehensive academic document or to describe all the technical details of cost-utility analysis. It also does not attempt to provide a thorough description of PHARMAC’s prioritisation process or to provide detailed guidance for assessing technologies that are beyond PHARMAC’s scope. Rather, it describes the process involved and methods used when conducting health economic analyses, in particular cost-utility analyses. It includes specific guidance on how PHARMAC measures costs (Chapter 7) and benefits (Chapter 6), and how it allows for time preference (Chapter 8 and Appendix 2) and uncertainty (Chapter 10).
6
1.3 History of the PFPA The idea of standardising and documenting the methods PHARMAC uses for economic analyses started in 1997. At that time, PHARMAC had undertaken a number of cost-utility analyses and considered it would be useful to formalise and standardise its approach.
PHARMAC consulted widely on the draft manual, and comments were received from leading national and international health economists, clinicians, the pharmaceutical industry, and the then Health Funding Authority. Following amendments to the draft version, the manual was finalised and published on the PHARMAC website as the Prescription for Pharmacoeconomic Analysis in September 1999.
In 2004, PHARMAC decided to review and revise the PFPA. A literature search was undertaken and internal sessions were held to review each section. The draft new version of the PFPA was subsequently reviewed by international and New Zealand experts in cost-utility analysis. PHARMAC staff then consulted widely on the new draft, considered all consultation responses, and as a result made a number of amendments to the document. Version 2 of the PFPA was approved by the PHARMAC Board in April 2007 and published in June 2007.
Version 2.1 was published in 2012. The changes from version 2.0 were various technical amendments and clarifications to reflect PHARMAC’s current practice.
1.4 PFPA Version 2.2 This update of the PFPA supports the introduction of Factors for Consideration and changes to PHARMAC’s role.
PHARMAC’s scope in the health system has developed over time. In 2012/13, PHARMAC was given responsibility for the National Immunisation Schedule, which has now been incorporated in to the Pharmaceutical Schedule. In 2013/14, PHARMAC added hospital medicines and also listed national contracts for hospital medical devices.
Version 2.2 of the PFPA specifically takes account of responses to consultation on the expansion of PHARMAC’s scope to products including hospital medical devices, vaccines, and some haemophilia products.
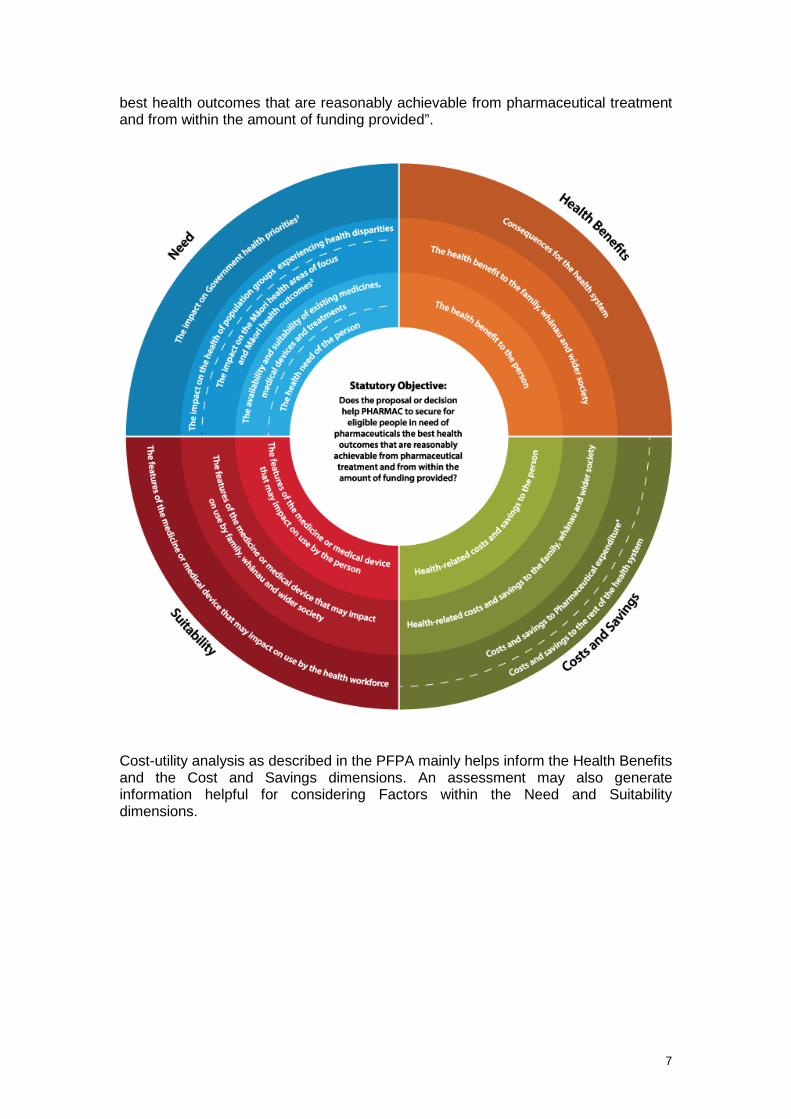
1.5 Decision making and the PFPA This version 2.2 of the PFPA gives guidance for analyses that support PHARMAC decisions that take account of the Factors for Consideration. Analyses intended to take account of the earlier nine Decision Criteria should be guided by version 2.1 of the PFPA. Detailed information on the move from Decision Criteria to Factors for Consideration can be found at www.pharmac.health.nz/medicines/how-medicines-are-funded/factors-for-consideration/ The Factors for Consideration are shown in the following diagram. The circular diagram represents the four different dimensions/quadrants that PHARMAC will generally consider when making funding decisions (Need1, Health Benefits, Costs and Savings, and Suitability), and the three levels of impact that we will usually take into account (to the person; to the person’s family, whānau and wider society; and to the broader health system). Ultimately, these Factors help to ensure we meet our Statutory Objective: “to secure for eligible people in need of pharmaceuticals, the
1 Please note that, although not explicit on this diagram, the health needs of the family or whānau of the person receiving the treatment, and of wider society will be taken into consideration during our decision making process. This Factor is detailed in the Supporting Information that can be found on the PHARMAC website at http://www.pharmac.health.nz/medicines/how-medicines-are-funded/factors-for-consideration/supporting-information/.
7
best health outcomes that are reasonably achievable from pharmaceutical treatment and from within the amount of funding provided”.
Cost-utility analysis as described in the PFPA mainly helps inform the Health Benefits and the Cost and Savings dimensions. An assessment may also generate information helpful for considering Factors within the Need and Suitability dimensions.

8
2 Health Economic Analysis at PHARMAC
2.1 What is Economic Analysis? Economic analysis is the explicit consideration of the costs and benefits of a proposed course of action. Economics is based on three fundamental concepts that summarise the issues PHARMAC faces daily:
• Scarcity – resources will always be insufficient to support all possible activities. • Choices – due to scarce resources, decisions must be made about how best to
use them. • Opportunity cost – by choosing to use resources one way, we forgo other
opportunities to use the same resources. Based on these concepts, resources are only used efficiently if the value of what is gained from their use is greater than the value of alternative options that could have been funded.
For further information on the purpose of, and techniques for, undertaking economic analysis in health care, please refer to standard health economics texts (eg, 2).
2.2 Why Does PHARMAC Use Economic Analysis? PHARMAC’s objective is to secure the best health outcomes reasonably achievable from within the funding provided. As PHARMAC must work within a fixed budget, it is impossible to fund every new pharmaceutical that may potentially benefit someone. The demand for pharmaceuticals will always exceed our ability to pay for these pharmaceuticals. In short, choices are inevitable.
Economic analysis provides information on the health gains and costs associated with various funding options It is a valid, replicable and scientific tool for PHARMAC to use to help identify proposals that would provide the best health outcomes if funded.
Economic analysis is not a technical fix for complex decisions, but merely a tool designed to bring greater objectivity and consistency to often complex decisions, and shed light on the logic behind choices. It is used to inform decision making rather than replace it.
2.3 Types of Economic Analysis
Key Recommendations: Most analyses undertaken by PHARMAC staff are in the form of cost-utility analysis (CUA), as it is practical and enables comparisons across different pharmaceuticals and opportunities for health funding. Cost-utility analysis help PHARMAC prioritise pharmaceuticals for investment decisions.
Several forms of economic analysis are available including:
• Cost-minimisation analysis (CMA)
CMA assumes that there is no net health change involved in moving from one treatment to another; hence the decision can be made on the basis of the difference in total cost alone. CMA is appropriate when the clinical outcomes of the drug and the comparator are equivalent.
• Cost-effectiveness analysis (CEA)
In CEA, the incremental costs are compared with the incremental outcomes, as measured in physical units such as life years saved or heart attacks prevented. A
9
disadvantage of CEA is that it does not enable direct comparison of interventions treating different conditions.
• Cost-utility analysis (CUA)
CUA is a variation of CEA in which outcomes are weighted in common currency, usually quality-adjusted life years (QALYs). QALYs combine changes in quantity and quality of life (mortality and morbidity) into one composite measure. CUA enables comparison between the cost-effectiveness of interventions treating different conditions, and also takes into account benefits resulting from both decreases in mortality and decreases in morbidity.
• Cost-benefit analysis (CBA)
In CBA, incremental outcomes are expressed in monetary terms, usually using the willingness-to-pay approach. The results of CBA are expressed as one figure, representing the difference between benefits and costs (B-C>0), or as a ratio (B/C). Disadvantages of CBA include the difficulty in comparing treatments that improve quality of life with those that save lives, and the difficulty associated with placing a dollar value on health benefits. There are also ethical objections to placing a monetary value on health, particularly with respect to valuing a human life.
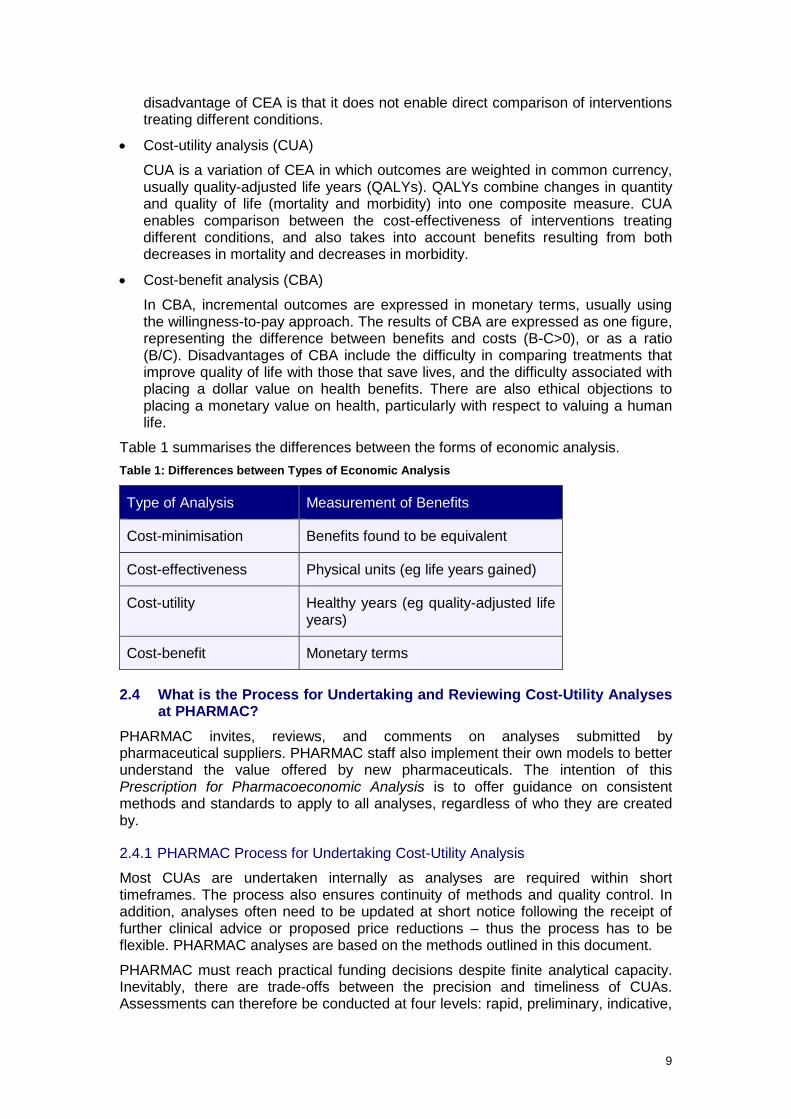
Table 1 summarises the differences between the forms of economic analysis. Table 1: Differences between Types of Economic Analysis
Type of Analysis Measurement of Benefits
Cost-minimisation Benefits found to be equivalent
Cost-effectiveness Physical units (eg life years gained)
Cost-utility Healthy years (eg quality-adjusted life years)
Cost-benefit Monetary terms
2.4 What is the Process for Undertaking and Reviewing Cost-Utility Analyses at PHARMAC?
PHARMAC invites, reviews, and comments on analyses submitted by pharmaceutical suppliers. PHARMAC staff also implement their own models to better understand the value offered by new pharmaceuticals. The intention of this Prescription for Pharmacoeconomic Analysis is to offer guidance on consistent methods and standards to apply to all analyses, regardless of who they are created by.
2.4.1 PHARMAC Process for Undertaking Cost-Utility Analysis
Most CUAs are undertaken internally as analyses are required within short timeframes. The process also ensures continuity of methods and quality control. In addition, analyses often need to be updated at short notice following the receipt of further clinical advice or proposed price reductions – thus the process has to be flexible. PHARMAC analyses are based on the methods outlined in this document.
PHARMAC must reach practical funding decisions despite finite analytical capacity. Inevitably, there are trade-offs between the precision and timeliness of CUAs. Assessments can therefore be conducted at four levels: rapid, preliminary, indicative,

10
and detailed. A summary of what may be included at each of the levels of analysis is given in Table 2. Any given analysis may include or exclude any of the criteria listed. Table 2: Levels of PHARMAC Analyses
Type General Description FTE Required
Rapid Basic economic model constructed, largely based on opportunistic data. The analysis is undertaken over a time horizon that sufficiently captures the majority of incremental costs and benefits. Testing undertaken to ensure extent of analysis is sufficient. Brief documentation of CUA (but still detailed enough to allow reproduction of the CUA by others). Reviewed internally. May include reviews and basic amendments to external analyses.
<2 weeks
Preliminary Assessment largely conducted using opportunistic data. Rapid systematic review of evidence undertaken. May require further modelling compared with a rapid CUA (due to disease complexity, risk, or uncertainty of results). Reviewed internally.
2-4 weeks
Indicative An interim assessment using some opportunistic data, but more detailed than a preliminary analysis. Evidence critically appraised. Often involves more complex economic modelling. Full assessment undertaken on whether statistically insignificant events are likely to be clinically significant, or vice-versa. Further investigation into health-related quality of life scores, including a systematic review of the literature. Full multivariate sensitivity analysis may be undertaken, with detailed discussion of results. Detailed documentation of critical appraisal and economic analysis. Reviewed internally and by the Pharmacology and Therapeutic Advisory Committee (PTAC).
1-2 months
Detailed Includes a detailed and systematic identification and synthesis of relative clinical effectiveness, prognosis, health-related quality of life, and cost data. Evidence critically appraised using the Graphic Appraisal Tool for Epidemiology (GATE) framework (or other similar tools). Detailed Markov model. All potential health states and clinical events included. The use of probability distributions considered. Detailed extrapolation of the clinical evidence, and statistically non-significant events tested. Further validation of utility mapping exercise, including obtaining expert clinical input. Probabilistic sensitivity analysis may be undertaken. Reviewed internally and externally (clinical assumptions reviewed by PTAC).
>2 months
FTE = Full-Time Equivalent. Note that these are indicative timeframes. Actual timeframes vary depending on experience and workload.
Very few proposals receive a detailed assessment as these take between two and six months to complete, which can be too slow and resource intensive for a purchasing environment. While detailed analysis may improve the academic rigour of the assessment, we have found that increased levels of complexity do not often further inform the funding decision or impact the relative cost-effectiveness of the pharmaceutical. Undertaking detailed CUAs when not strictly needed also ties up resources, limiting the ability to undertake other analyses or funding work generally. In addition, at PHARMAC the CUA result is not critical to the setting of a subsidy level, so perfecting the CUA is seldom necessary. What is most important is that the

11
CUA is sufficient to help inform PHARMAC of where the pharmaceutical should be placed on the priority list and to inform any funding decisions.
The assessment process is usually iterative. Further analysis will be undertaken if a rapid assessment indicates there is very large uncertainty in the result of the analysis, to the extent that the relative priority of the pharmaceutical is uncertain. The level of analysis generally aims to be sufficient to prioritise a proposal with enough certainty. Assessments can be updated as more information becomes available, or as he proposal changes during assessment and negotiation.
The level of analysis undertaken depends on the factors outlined in Table 3. Table 3: Determinants of Level of Analysis Undertaken by PHARMAC
Determinants of level of analysis
Details
Timeframes In some cases a CUA result may be required within a week; hence a more detailed analysis cannot be undertaken.
Impact on pharmaceutical budget
A proposal with high expenditure or a large plausible range of costs is more likely to require a more detailed CUA, especially if the pharmaceutical is highly effective.
Reliability of results If the results of a CUA are very sensitive to key assumptions, a higher level of analysis may be required.
Extent of information available for analysis
Pharmaceuticals for rare conditions are more likely to undergo rapid analysis due to unavailability of data. More detailed analysis may not resolve key uncertainties.
Impact of CUA on funding decision
In some cases the main reasons for funding a pharmaceutical may be due to Factors for Consideration that do not fall within Health Benefits and Cost and Savings dimensions, and therefore a detailed CUA may not be required.
Availability of analyst resources
Given limited analyst resources, it may not be cost-effective to undertake a detailed analysis when a number of other CUAs are also required.
Most CUAs are written up as Technology Assessment Reports following a set template. CUAs are then peer-reviewed by colleagues, who examine the economic methodology. Analyses may also be clinically reviewed by the Pharmacology and Therapeutic Advisory Committee (PTAC) (3), a specialist PTAC subcommittee, or clinical experts.
Appendix 1 includes guidelines for reviewing a cost-utility analysis.
2.4.2 PHARMAC Process for Reviewing Supplier Cost-Utility Analyses The Guidelines for Funding Applications to PHARMAC, available on PHARMAC’s website, specify all the information that PHARMAC requests in support of a funding proposal. The information that PHARMAC requests to support the economic analysis of a proposal is summarised at www.pharmac.health.nz/medicines/how-medicines-are-funded/new-funding-applications/.
PHARMAC encourages pharmaceutical suppliers to provide an economic analysis when submitting a significant funding proposal. The provision of a good-quality analysis, following the methods outlined in the PFPA, helps PHARMAC assess and prioritise a proposal more swiftly.
Economic analyses should be in the form of a cost-utility analysis, with benefits measured in terms of QALYs. In cases where the clinical outcomes of the drug and the comparator have been shown to be equivalent, a cost-minimisation analysis may
12
be appropriate. Other forms of cost-effectiveness or cost-benefit analyses should not be provided.
PHARMAC’s preferred software packages are TreeAge(4) and Microsoft Excel. Models provided in other software packages will not be assessed unless by prior agreement. Excel models should minimise the use of Visual Basic code and similar complex features.
Economic models should not be unnecessarily complex, and should always be transparent, well described and reproducible. The structure, data and process of building the model should be detailed enough to enable competent analysts who are not familiar with the model to vary key parameters, and to reproduce it in other software.
If a CUA has been submitted to Australia’s Pharmaceutical Benefits Advisory Committee (PBAC) or Medical Services Advisory Committee (MSAC), PHARMAC will accept the same CUA in the application to PHARMAC, providing an electronic copy of the TreeAge model and/or Excel spreadsheet are included. This ensures that PHARMAC can amend the costs and any other relevant inputs so the model is applicable to the New Zealand clinical and funding environment. A copy of any reviews undertaken by PBAC-contracted reviewers should also be provided.
When PHARMAC receives an economic model and assessment from an applicant, our health economists review it and amend it if required. The guidelines PHARMAC uses to review analyses are attached in Appendix 1.
If PHARMAC staff amend the analysis supplied, PTAC will usually review both the supplier CUA and PHARMAC’s amended version, with any differences clearly explained.
2.5 When is a Pharmaceutical Considered to be ‘Cost-Effective’? A proposal to invest in a pharmaceutical can be considered ‘cost-effective’ only in comparison with another proposal. At PHARMAC, there is no threshold for when a pharmaceutical is considered ‘cost-effective’. Proposals are only considered in relation to other funding proposals at the time. Also, PHARMAC’s Factors for Consideration are broader than cost-effectiveness alone. One proposal may be more cost-effective than another but rate less well on other Factors and therefore may not be funded.
Another reason for not having a threshold value is that the spending on pharmaceuticals is required to be kept within a fixed budget. Given the binding nature of this constraint, and all things being equal, what is and is not considered ‘cost-effective’ will vary with the amount of funding available. This is in terms of not just the total budget each year, but also the available budget that we anticipate in the future.
What may be considered ‘cost-effective’ therefore changes over time, with wide variations both in any year and between years(5). For example, between the 1998 and 2015 financial years, individual new investments made by PHARMAC varied between 25 QALYs gained for every $1 million saved by the NZ health system (ie decisions that both reduced costs and improved health) and less than 5 QALYs gained for every $1 million spent. Expressed as costs per QALY gained, investments varied between saving $40,000 per QALY gained ($-40,000/QALY) and spending over $+200,000 per QALY. Investments varied widely each year, reflecting the mix of investment opportunities, the funding available at the time, and the impacts of other Decision Criteria.(6)
13
3 Economic Modelling and Scope of Analysis
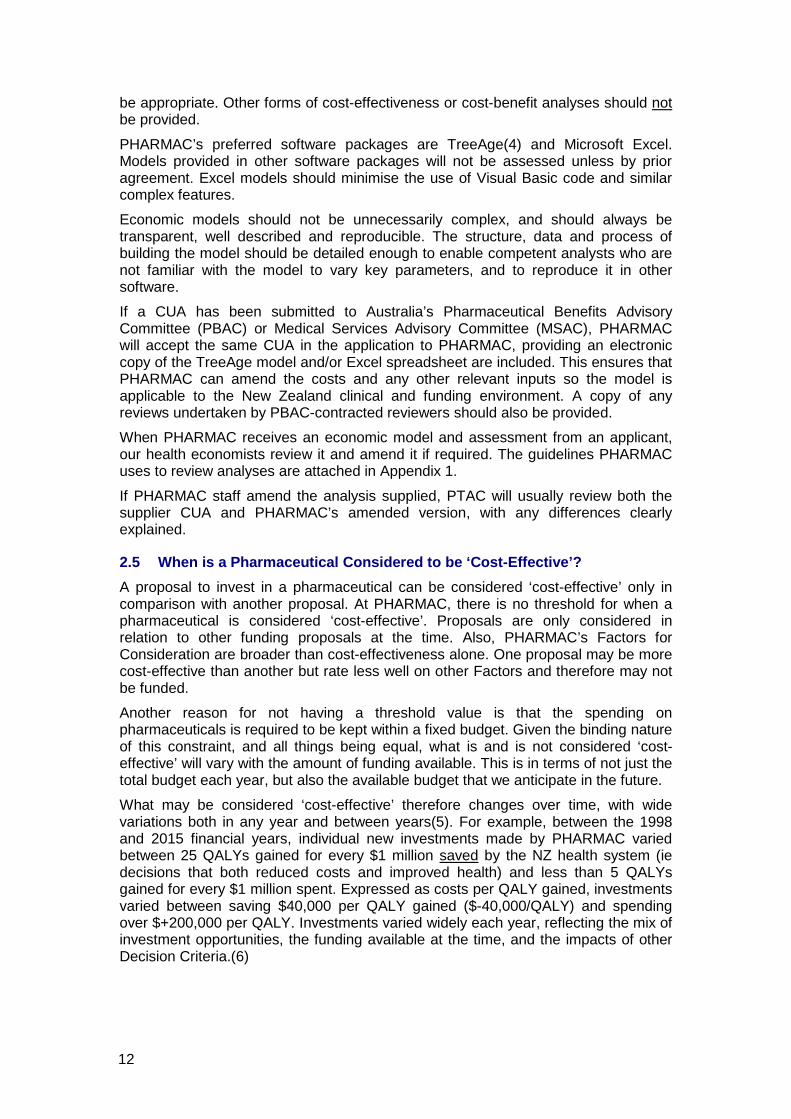
Economic modelling at PHARMAC has two distinct phases.
Decisions have to be made regardless of data availability. Modelling in economic analysis extrapolates from available data to best inform decision making at a particular point in time (7).
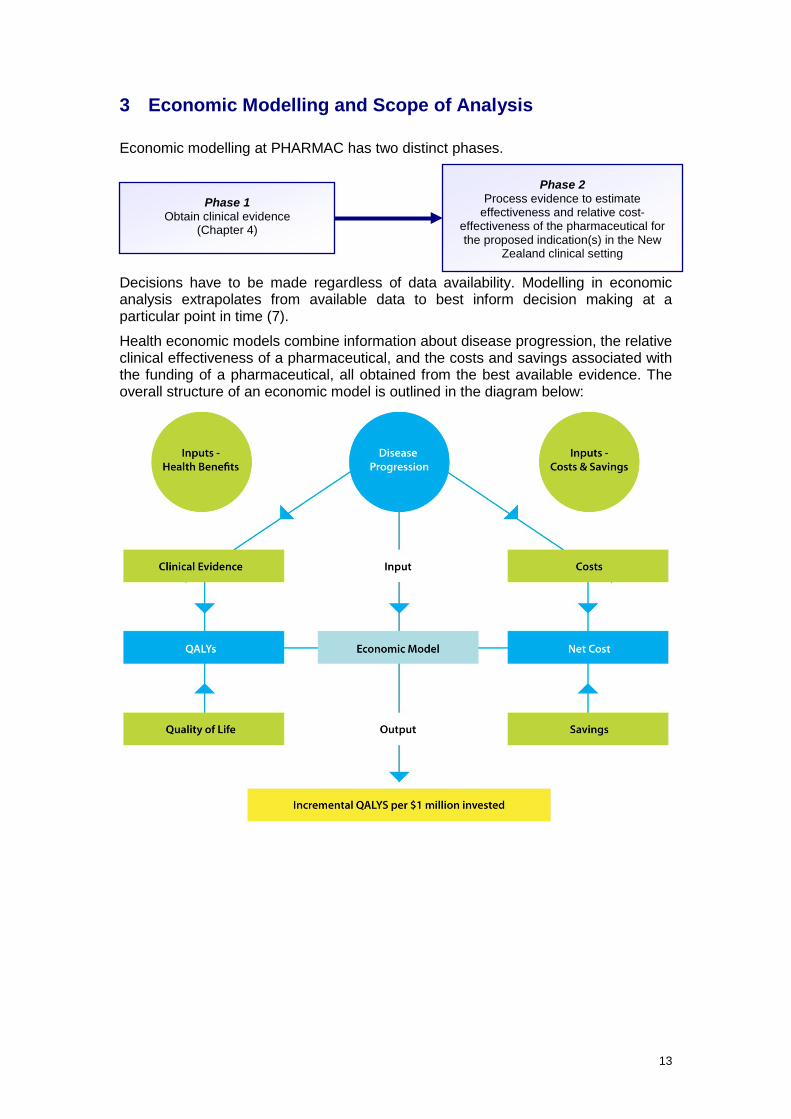
Health economic models combine information about disease progression, the relative clinical effectiveness of a pharmaceutical, and the costs and savings associated with the funding of a pharmaceutical, all obtained from the best available evidence. The overall structure of an economic model is outlined in the diagram below:
Phase 1 Obtain clinical evidence
(Chapter 4)
Phase 2 Process evidence to estimate
effectiveness and relative cost-effectiveness of the pharmaceutical for the proposed indication(s) in the New
Zealand clinical setting
14
3.1 Models
Key Recommendation: Models should avoid unnecessary complexity and should be transparent, well described and reproducible.
Models consist of a series of branches, representing the expected health outcomes of different treatments. It is important these models capture all the appropriate additional benefits and costs.
3.1.1 Model Transparency
Model inputs and assumptions need to be clearly stated and the rationale for the inputs and assumptions documented and explained. Models should be transparent and the structure, data and process of building the model should be detailed enough to enable competent analysts who are not familiar with the model to confirm that it functions correctly and to reproduce it. Unnecessary complexity in economic models should be avoided.
3.1.2 Scope of Model
The simplest model type should be chosen, providing it captures the essential features of the disease and interventions, and all relevant data are incorporated.
The models PHARMAC prefers are either simple decision trees or Markov models (8-12)
Simple Decision Trees Simple decision trees can be used in cases where an event may happen only once, during a discrete period, and the patients are not at continuous risk of recurrence. For example, a simple decision tree could be used to model an acute episode of illness leading to either full recovery or death.
Markov Models Markov models assume that a person is always in one of a finite number of health states. The model is usually started with a cohort assigned to an initial health state (or Markov state). People then move between states at defined recurring intervals (Markov cycles), as determined by the transition probabilities.
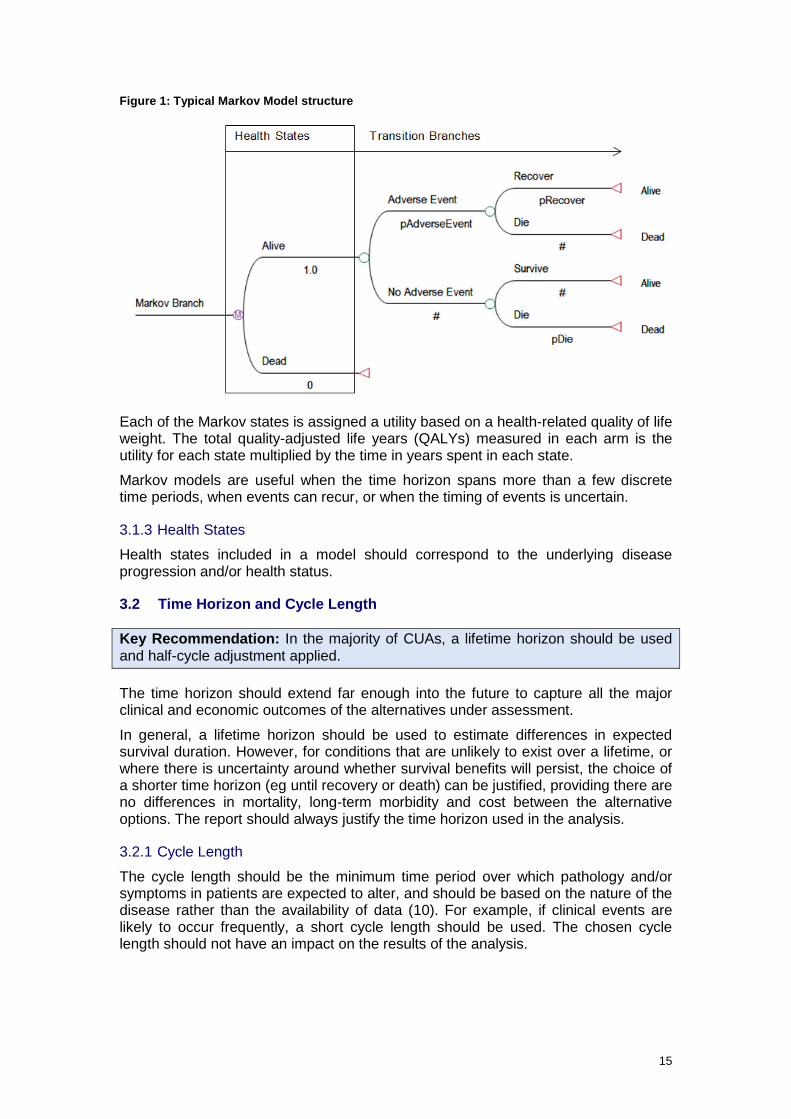
A branch of a Markov model is shown below. In this example, all patients begin in the ‘Alive’ health state, and are then at risk of having an adverse event, which they may recover or die from. The model would also incorporate the disease-specific mortality rate of the target population. The model is usually run for enough cycles that all of the cohort moves through to the ‘Dead’ state: in other words, a lifetime horizon.
15
Figure 1: Typical Markov Model structure
Each of the Markov states is assigned a utility based on a health-related quality of life weight. The total quality-adjusted life years (QALYs) measured in each arm is the utility for each state multiplied by the time in years spent in each state.
Markov models are useful when the time horizon spans more than a few discrete time periods, when events can recur, or when the timing of events is uncertain.
3.1.3 Health States
Health states included in a model should correspond to the underlying disease progression and/or health status.
3.2 Time Horizon and Cycle Length
Key Recommendation: In the majority of CUAs, a lifetime horizon should be used and half-cycle adjustment applied.
The time horizon should extend far enough into the future to capture all the major clinical and economic outcomes of the alternatives under assessment.
In general, a lifetime horizon should be used to estimate differences in expected survival duration. However, for conditions that are unlikely to exist over a lifetime, or where there is uncertainty around whether survival benefits will persist, the choice of a shorter time horizon (eg until recovery or death) can be justified, providing there are no differences in mortality, long-term morbidity and cost between the alternative options. The report should always justify the time horizon used in the analysis.
3.2.1 Cycle Length
The cycle length should be the minimum time period over which pathology and/or symptoms in patients are expected to alter, and should be based on the nature of the disease rather than the availability of data (10). For example, if clinical events are likely to occur frequently, a short cycle length should be used. The chosen cycle length should not have an impact on the results of the analysis.
16
3.2.2 Half-Cycle Correction
Markov models assume that a patient’s time in a state is constant for the duration of the cycle, and that transitions between states occur at discrete points of time at the beginning or end of the cycle. However, transition probabilities that are derived from a continuous rate, such as mortality, effectively assume that transitions occur on average halfway through the cycle. These unaligned transitions and mean probabilities may result in over- or under-estimating health outcomes. Therefore an unbiased estimate should ensure that, on average, patients move between states halfway through the cycle. A half-cycle correction can achieve this adjustment (10, 11).
If a half-cycle correction is not applied, an explanation needs to be provided for why the model does not require it.
3.3 Perspective and Decision Problem
Key Recommendation: Undertake analyses from the perspective of the funder, with regard to PHARMAC’s Factors for Consideration. Always clearly state the decision problem.
3.3.1 Perspective
PHARMAC base-case cost-utility analyses are undertaken from the perspective of the funder. The key reason is that PHARMAC’s statutory objective requires it to achieve “the best health outcomes” “for eligible people”, and to do so “within the funding provided”.
PHARMAC’s Factors for Consideration are a framework for ensuring that relevant benefits, costs, savings, and other aspects are taken into account. The economic assessments described in this Prescription for Pharmacoeconomic Analysis can help to inform consideration of many, but not all of the Factors.
3.3.2 Decision Problem
All analyses should include a clear statement about the decision problem that prompted the analysis. This should include information about the disease, patient population, and treatment options available2.
3.4 Target Population
Key Recommendation: The target population is the New Zealand population most likely to receive treatment. It may be necessary to use subgroup analyses if treatment can be targeted to those most likely to benefit. However, subgroup analyses should not be used when there is no overall treatment effect in the intention-to-treat population or primary endpoint. In cases where the subgroup was defined retrospectively in the clinical trial(s), the data should be used cautiously and evidence of statistical heterogeneity reported.
The target population is the New Zealand population most likely to receive treatment. Any differences between the population in the key clinical trials and the target population should be discussed in the report.
Analyses for population subgroups should be used if value for money can be improved by targeting funding to those who are most likely to benefit, for example 2 Refer to Table 12: Reporting of Cost-Utility Analysis Results in Chapter 11 for further details on information to include in a CUA report when describing the disease, patient population and treatment options.
17
through the use of Special Authority criteria. Please refer to Chapter 4 for subgroup analysis methods.
3.5 Comparator(s)
Key Recommendation: The comparator(s) used in analyses should be the funded treatment (available on the Pharmaceutical Schedule or by DHB hospitals) that most prescribers or clinicians would replace in New Zealand clinical practice, and the treatment prescribed to the largest number of patients (if this differs from the treatment most prescribers would replace).
The comparator(s) used in PHARMAC analyses should be funded in New Zealand and be:
1. the funded treatment that most prescribers or clinicians would replace in New Zealand clinical practice; and/or
2. the treatment given to the largest number of patients, if this differs from the treatment most prescribers or clinicians would replace.
The analysis should consider both current clinical practice and likely future practice (ie the treatment regimen at the time the pharmaceutical is likely to be funded). This allows for any changes that may occur in treatment regimens over time.
The comparator used in the model should not be constrained by data availability. It is acceptable and often appropriate to use a comparator even if there are no direct studies between that comparator and the proposed intervention. Further details on making such comparisons are given in the modelling section.
In cases where treatment regimens differ substantially throughout New Zealand, it is recommended that a range of comparators be used in the analysis. The results of the analysis using the different comparators should be reported separately, as well as reporting a weighted average of the QALYs per $1 million invested result. The result should be weighted by the estimated patient numbers prescribed the comparator treatments, as described in section Weighting of results from multiple models9.2.
If there is any uncertainty about the most appropriate comparator to use in the CUA, it is recommended that expert clinical advice be sought. The Pharmacology and Therapeutic Advisory Committee (PTAC) often performs this role for analyses conducted by PHARMAC.
18
4 Evidence for Relative Clinical Effect
This chapter outlines what sources of evidence are preferred when calculating relative clinical effect (treatment efficacy and adverse effects) for inclusion in an economic model. This chapter does not cover sources of evidence for estimating baseline risk of disease; health-related quality of life; or resource use.
All appropriate evidence relating to the pharmaceutical(s) and population under assessment should be identified, described and quality-assessed. The level of clinical evidence may vary depending on the level of analysis and time available to systematically review the evidence – for less detailed analyses, more opportunistic data may need to be used and less comprehensive critical appraisal undertaken.
For further details on how relevant clinical inputs are systematically identified and synthesised, please refer to the Guidelines for Funding Applications to PHARMAC, available at www.pharmac.health.nz/medicines/how-medicines-are-funded/new-funding-applications/.
4.1 Data Sources
Key Recommendations: All appropriate levels of evidence should be identified; however, well-conducted randomised controlled trials (RCTs) and meta-analyses are the preferred data sources when estimating relative treatment effects. In the absence of valid RCTs, evidence from the highest available level of study design should be considered with reference to the limitations of the study design.
4.1.1 Key Data Sources
Key clinical data sources to be used when estimating relative treatment effects include published randomised controlled trials (RCTs), meta-analyses, and observational studies. Other possible sources include unpublished trial data, expert opinion, post-surveillance studies, and case reports (8, 13-15).
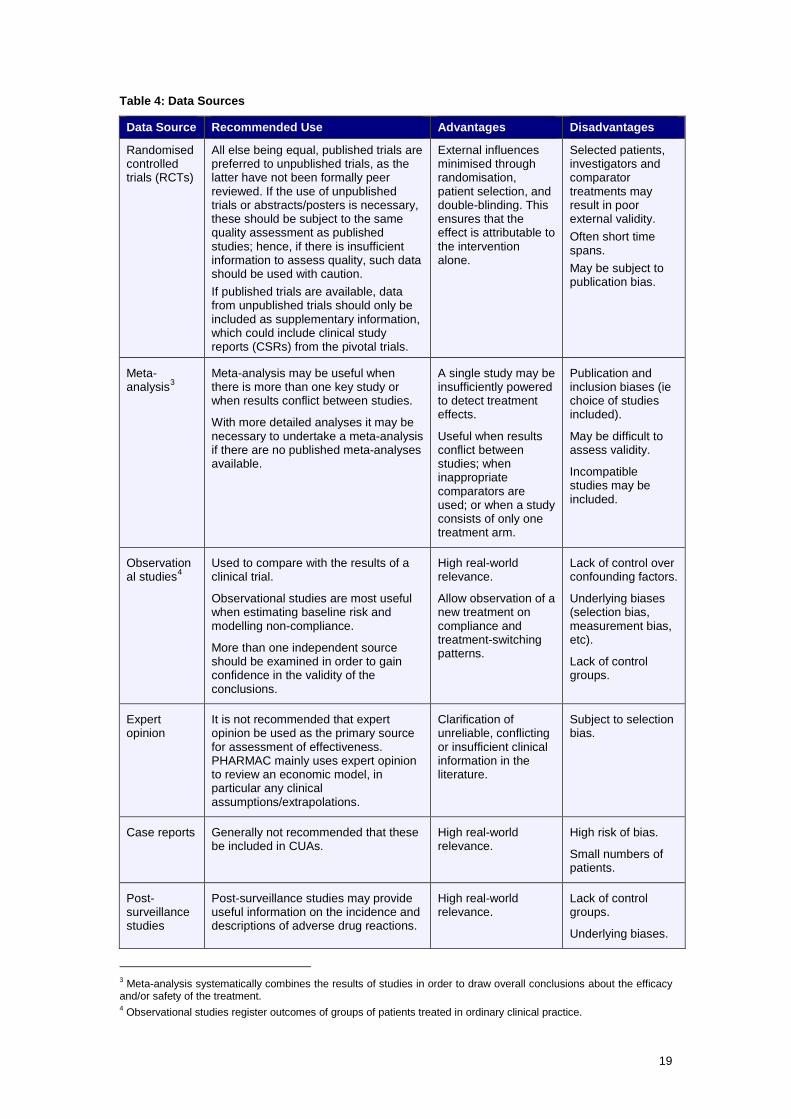
Details of the advantages and disadvantages of these data sources, including their recommended use, are outlined in Table 4.
19
Table 4: Data Sources
Data Source Recommended Use Advantages Disadvantages
Randomised controlled trials (RCTs)
All else being equal, published trials are preferred to unpublished trials, as the latter have not been formally peer reviewed. If the use of unpublished trials or abstracts/posters is necessary, these should be subject to the same quality assessment as published studies; hence, if there is insufficient information to assess quality, such data should be used with caution. If published trials are available, data from unpublished trials should only be included as supplementary information, which could include clinical study reports (CSRs) from the pivotal trials.
External influences minimised through randomisation, patient selection, and double-blinding. This ensures that the effect is attributable to the intervention alone.
Selected patients, investigators and comparator treatments may result in poor external validity. Often short time spans. May be subject to publication bias.
Meta-analysis3
Meta-analysis may be useful when there is more than one key study or when results conflict between studies.
With more detailed analyses it may be necessary to undertake a meta-analysis if there are no published meta-analyses available.
A single study may be insufficiently powered to detect treatment effects.
Useful when results conflict between studies; when inappropriate comparators are used; or when a study consists of only one treatment arm.
Publication and inclusion biases (ie choice of studies included).
May be difficult to assess validity.
Incompatible studies may be included.
Observational studies4
Used to compare with the results of a clinical trial.
Observational studies are most useful when estimating baseline risk and modelling non-compliance.
More than one independent source should be examined in order to gain confidence in the validity of the conclusions.
High real-world relevance.
Allow observation of a new treatment on compliance and treatment-switching patterns.
Lack of control over confounding factors.
Underlying biases (selection bias, measurement bias, etc).
Lack of control groups.
Expert opinion
It is not recommended that expert opinion be used as the primary source for assessment of effectiveness. PHARMAC mainly uses expert opinion to review an economic model, in particular any clinical assumptions/extrapolations.
Clarification of unreliable, conflicting or insufficient clinical information in the literature.
Subject to selection bias.
Case reports Generally not recommended that these be included in CUAs.
High real-world relevance.
High risk of bias.
Small numbers of patients.
Post-surveillance studies
Post-surveillance studies may provide useful information on the incidence and descriptions of adverse drug reactions.
High real-world relevance.
Lack of control groups.
Underlying biases.
3 Meta-analysis systematically combines the results of studies in order to draw overall conclusions about the efficacy and/or safety of the treatment. 4 Observational studies register outcomes of groups of patients treated in ordinary clinical practice.
20
4.2 Obtaining Data
4.2.1 Data Sources
Potentially useful information sources on clinical efficacy and event rates include:
• MEDLINE: http://www.ncbi.nlm.nih.gov/pubmed/ • Trip: http://www.tripdatabase.com/ • Embase: http://www.embase.com/ • Cochrane: http://www.cochrane.org/ • UK Medicines Information http://www.ukmi.nhs.uk/default.asp • Evidence-Based Medicine (BMJ Journals): http://ebm.bmj.com/ • BMJ Clinical Evidence:
http://www.clinicalevidence.com/ceweb/conditions/index.jsp/ • Prescrire International: http://www.prescrire.org/.
Database searches should be supplemented by scanning references in articles and hand searching key journals.
Information on drug safety and international regulatory authorities can be found at:
• Medsafe: http://www.medsafe.govt.nz/ • FDA: http://www.fda.com/ • European Medicines Agency: http://www.ema.europa.eu/ .
Information on international registries of clinical trials can be found at:
• ClinicalTrial.gov: www.clinicaltrial.gov/.
It may also be useful to check the reviews of clinical evidence undertaken by international health technology assessment organisations. These include (but are not limited to):
• National Institute for Health and Care Excellence (UK): http://www.nice.org.uk/ • NIHR Health Technology Assessment Programme (UK): http://www.hta.ac.uk/ • Canadian Agency for Drugs and Technologies in Health: http://www.cadth.ca/ • Scottish Medicines Consortium: http://www.scottishmedicines.org.uk/ • Australian Pharmaceutical Benefits Scheme: http://pbs.gov.au/ • Belgian Health Care Knowledge Centre: http://kce.fgov.be/ • Swedish Agency for Health Technology Assessment and Assessment of Social
Services: http://www.sbu.se/en/ • All Wales Medicines Strategy Group:
http://www.wales.nhs.uk/sites3/home.cfm?orgid=371 • CEA Registry: https://research.tufts-nemc.org/cear4/.
4.2.2 Search Strategy
All evidence should be obtained systematically. Details of the search strategy used to retrieve clinical studies should be described, including the:
• medium used to conduct the search and who conducted it • databases searched • when the search was undertaken • search strategy, keywords or MeSH headings used.
Published errata, corrections, retractions, editorials, commentaries, and journal correspondence relating to individual trials should be included in the search strategy.
21
The pre-defined inclusion and exclusion criteria used for selecting relevant studies should be clearly specified. The report should clearly state the reasons for excluding any studies.
4.3 Presentation of Evidence For key trials, the following details should be included in the report:
(i) Objective of trial.
(ii) Study design including eligibility criteria, sample size, interventions (including dose and treatment duration), methods for randomisation and blinding, duration of follow-up, and outcomes measures and methods.
(iii) Results including number of withdrawals and dropouts; and results for prospectively defined primary outcomes, secondary outcomes and adverse effects for the Intent To Treat (ITT) population.
Further details on analysing clinical trial data are included in section 5.1 (Transformation of Clinical Evidence).
4.4 Assessing Data Quality
Key Recommendation: Trials should be critically appraised using the Graphic Appraisal Tool for Epidemiology (GATE) framework (or other similar frameworks), with consideration given to the internal and external validity of the trials. Grades of evidence should be assigned, and assessment undertaken on the applicability of the trials to the New Zealand health sector. PHARMAC recommends that when high-quality studies are available, these should be the preferred data source when estimating relative treatment effects.
4.4.1 Critical Appraisal of Trials
PHARMAC recommends that clinical trials be critically appraised using the Graphic Appraisal Tool for Epidemiology (GATE) framework (16) or other similar frameworks.
The GATE framework involves the following five steps:
1. Asking focused questions based on PECOT (Population, Exposure, Comparison, Outcome, Time) and RAMMbo (fair Recruitment, fair Allocation, fair Maintenance, fair Measurement of Outcomes).
2. Searching the literature for best available evidence.
3. Appraising the study by ‘hanging’ on the GATE frame.
4. Assessing study quality.
5. Applying the evidence in practice.
Details on the GATE framework, including critical appraisal spreadsheets, are available at: https://www.fmhs.auckland.ac.nz/en/soph/about/our-departments/ epidemiology-and-biostatistics/research/epiq/evidence-based-practice-and-cats.html.
The following table outlines key factors to consider when critically appraising a clinical trial.
22
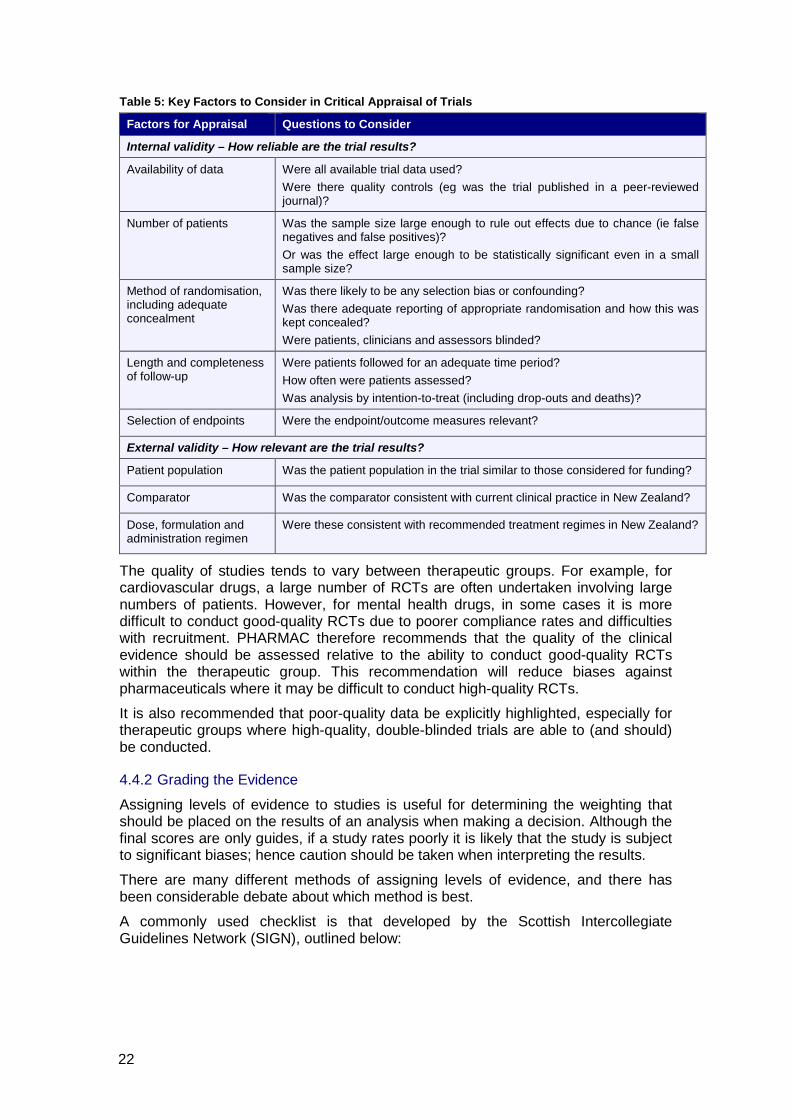
Table 5: Key Factors to Consider in Critical Appraisal of Trials
Factors for Appraisal Questions to Consider
Internal validity – How reliable are the trial results?
Availability of data Were all available trial data used? Were there quality controls (eg was the trial published in a peer-reviewed journal)?
Number of patients Was the sample size large enough to rule out effects due to chance (ie false negatives and false positives)? Or was the effect large enough to be statistically significant even in a small sample size?
Method of randomisation, including adequate concealment
Was there likely to be any selection bias or confounding? Was there adequate reporting of appropriate randomisation and how this was kept concealed? Were patients, clinicians and assessors blinded?
Length and completeness of follow-up
Were patients followed for an adequate time period? How often were patients assessed? Was analysis by intention-to-treat (including drop-outs and deaths)?
Selection of endpoints Were the endpoint/outcome measures relevant?
External validity – How relevant are the trial results?
Patient population Was the patient population in the trial similar to those considered for funding?
Comparator Was the comparator consistent with current clinical practice in New Zealand?
Dose, formulation and administration regimen
Were these consistent with recommended treatment regimes in New Zealand?
The quality of studies tends to vary between therapeutic groups. For example, for cardiovascular drugs, a large number of RCTs are often undertaken involving large numbers of patients. However, for mental health drugs, in some cases it is more difficult to conduct good-quality RCTs due to poorer compliance rates and difficulties with recruitment. PHARMAC therefore recommends that the quality of the clinical evidence should be assessed relative to the ability to conduct good-quality RCTs within the therapeutic group. This recommendation will reduce biases against pharmaceuticals where it may be difficult to conduct high-quality RCTs.
It is also recommended that poor-quality data be explicitly highlighted, especially for therapeutic groups where high-quality, double-blinded trials are able to (and should) be conducted.
4.4.2 Grading the Evidence
Assigning levels of evidence to studies is useful for determining the weighting that should be placed on the results of an analysis when making a decision. Although the final scores are only guides, if a study rates poorly it is likely that the study is subject to significant biases; hence caution should be taken when interpreting the results.
There are many different methods of assigning levels of evidence, and there has been considerable debate about which method is best.
A commonly used checklist is that developed by the Scottish Intercollegiate Guidelines Network (SIGN), outlined below:
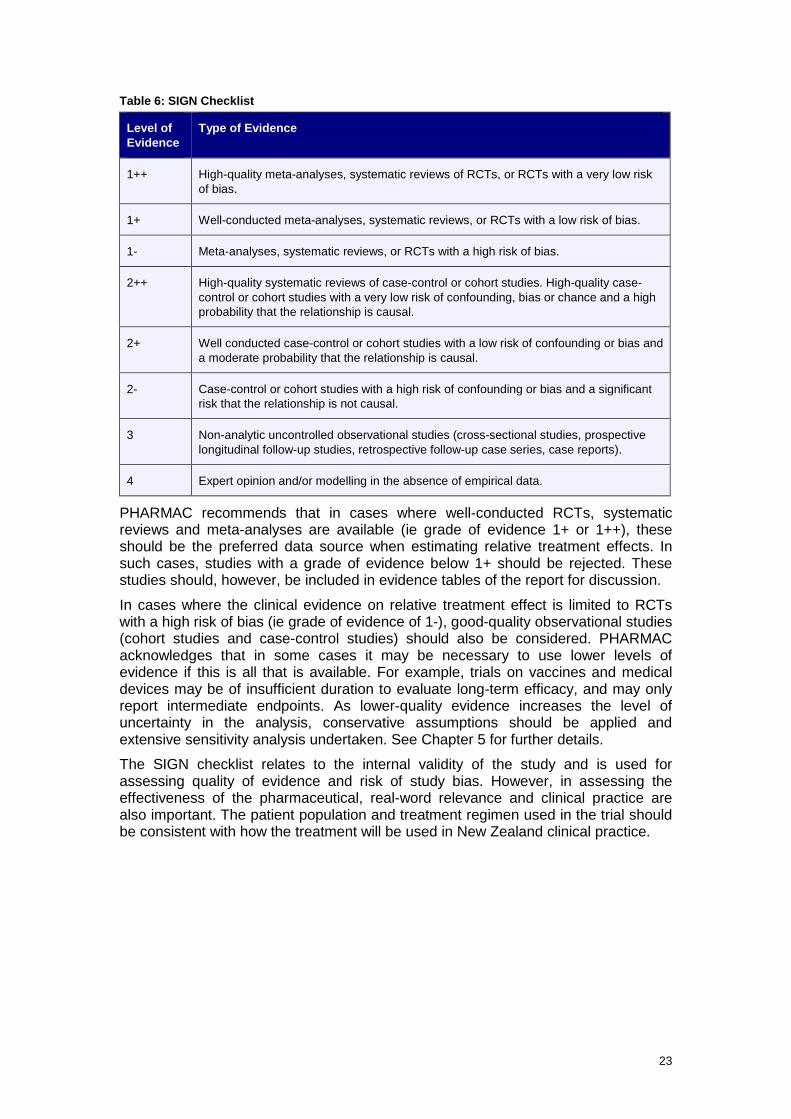
23
Table 6: SIGN Checklist
Level of Evidence
Type of Evidence
1++ High-quality meta-analyses, systematic reviews of RCTs, or RCTs with a very low risk of bias.
1+ Well-conducted meta-analyses, systematic reviews, or RCTs with a low risk of bias.
1- Meta-analyses, systematic reviews, or RCTs with a high risk of bias.
2++ High-quality systematic reviews of case-control or cohort studies. High-quality case-control or cohort studies with a very low risk of confounding, bias or chance and a high probability that the relationship is causal.
2+ Well conducted case-control or cohort studies with a low risk of confounding or bias and a moderate probability that the relationship is causal.
2- Case-control or cohort studies with a high risk of confounding or bias and a significant risk that the relationship is not causal.
3 Non-analytic uncontrolled observational studies (cross-sectional studies, prospective longitudinal follow-up studies, retrospective follow-up case series, case reports).
4 Expert opinion and/or modelling in the absence of empirical data.
PHARMAC recommends that in cases where well-conducted RCTs, systematic reviews and meta-analyses are available (ie grade of evidence 1+ or 1++), these should be the preferred data source when estimating relative treatment effects. In such cases, studies with a grade of evidence below 1+ should be rejected. These studies should, however, be included in evidence tables of the report for discussion.
In cases where the clinical evidence on relative treatment effect is limited to RCTs with a high risk of bias (ie grade of evidence of 1-), good-quality observational studies (cohort studies and case-control studies) should also be considered. PHARMAC acknowledges that in some cases it may be necessary to use lower levels of evidence if this is all that is available. For example, trials on vaccines and medical devices may be of insufficient duration to evaluate long-term efficacy, and may only report intermediate endpoints. As lower-quality evidence increases the level of uncertainty in the analysis, conservative assumptions should be applied and extensive sensitivity analysis undertaken. See Chapter 5 for further details.
The SIGN checklist relates to the internal validity of the study and is used for assessing quality of evidence and risk of study bias. However, in assessing the effectiveness of the pharmaceutical, real-word relevance and clinical practice are also important. The patient population and treatment regimen used in the trial should be consistent with how the treatment will be used in New Zealand clinical practice.

24
4.4.3 Application of evidence to the New Zealand context
The following questions should be considered when assessing the applicability of the studies to the New Zealand health sector:
1. Are there any known biological factors that may alter the effect of the pharmaceutical?
2. What effects does the time of taking the pharmaceutical have?
3. What effects do variations in the nature and severity of the disease have?
4. Does the effectiveness of the pharmaceutical depend on the way it is administered and/or by whom (eg by a nurse rather than by the patients)?
5. Is the giving or taking of the pharmaceutical part of a complex procedure with many components?
6. Is any infrastructure required/available, such as monitoring with regular blood tests?
7. Are there any other factors that may affect transferability of study results to the New Zealand setting?

25
5 Transformation of Evidence
5.1 Transformation of Clinical Evidence
Key Recommendation: Clinical trials should be analysed using data from the intention-to-treat (ITT) population. All statistically significant clinical events should be included in base-case analyses. For clinical events with a p value close to 0.05, consideration should be given to the magnitude of effect; whether the results are likely to be clinically significant; the relevance and validity of composite measures; and whether statistical significance has been demonstrated in an independent study. The exclusion of any event from an analysis should be justified.
It is important to make sure the outcomes most relevant to the condition are included in the CUA and that they reflect the perspective and scope of the model. This will often require incorporating information on relative treatment effects (usually obtained from clinical trials) with baseline health events.
Outcomes included in the model may include (but are not limited to):
• probability of success or failure • relapse • adverse events • discontinuation/loss to follow-up • death.
These outcomes should be well defined, mutually exclusive, and generally long-term or final outcomes.
5.1.1 Use of Surrogate versus Clinically Important Outcome Measures
Economic analysis should ideally be based on studies that report clinically important outcome measures. These are valid outcomes that are important to the health of the patient.
In some cases, only surrogate outcomes may be available. These are a substitute for a clinically meaningful endpoint, and measure how a patient feels, functions or survives.
Surrogate measures should only be used in CUAs where no alternative health outcome data are available. Caution must be used when using surrogate measures, as these may not necessarily translate into clinically relevant and effective outcomes.
5.1.2 Analysing Data from Clinical Trials
Clinical trials should be analysed using data from the intention-to-treat (ITT) population, rather than per protocol (PP), in order to take into account outcomes of all patients irrespective of whether they received treatment. For further information on data sources to be used when estimating relative treatment effects, refer to Chapter 4.
Where ITT analysis has not been reported, the effectiveness rates should ideally be recalculated by adding to the ‘on treatment’ participant population for the group (ie the denominator) all of the patients who withdrew, dropped out, or were otherwise lost to follow-up. This is the group’s true ITT starting participant population.
CUAs should not include last-observation-carried-forward (LOCF) analysis due to the large bias this incorporates in economic models. LOCF assumes that a patient who drops out of the study will continue to be in the same state as the last time they were
26
assessed. In studies where patients’ health is deteriorating, this may overestimate the effects of a treatment (17).
5.1.3 Relative Clinical Effectiveness Data to Include
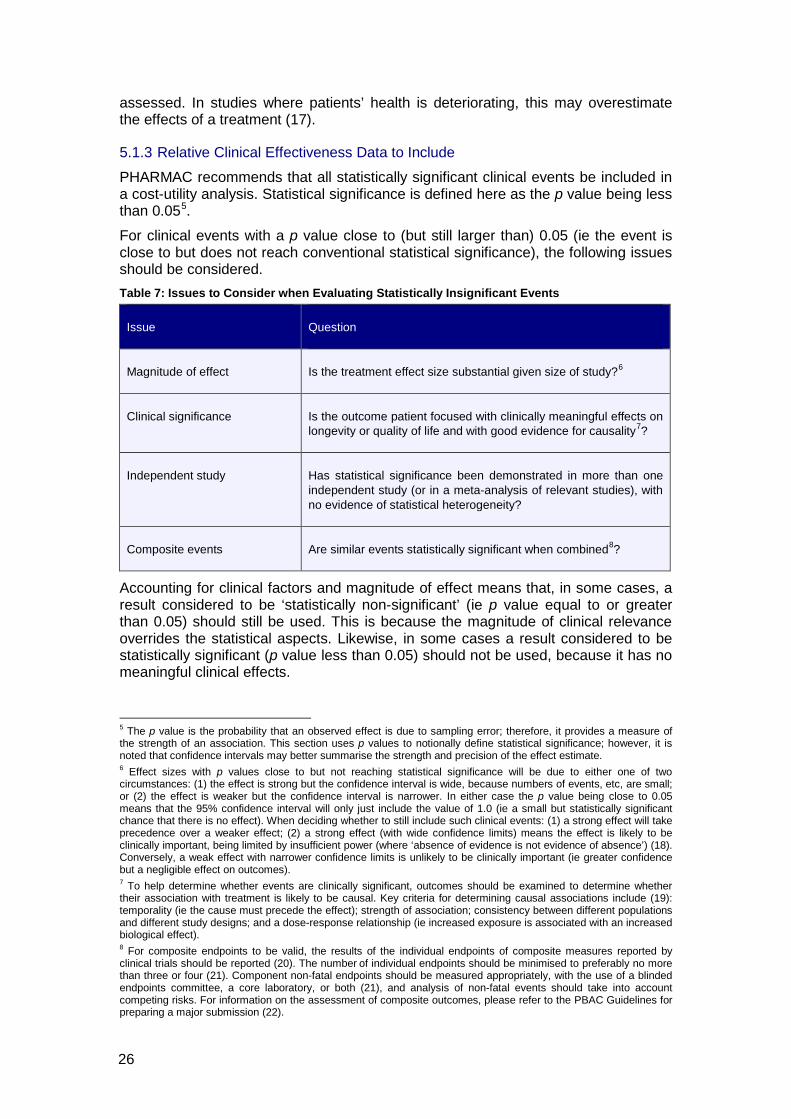
PHARMAC recommends that all statistically significant clinical events be included in a cost-utility analysis. Statistical significance is defined here as the p value being less than 0.055.
For clinical events with a p value close to (but still larger than) 0.05 (ie the event is close to but does not reach conventional statistical significance), the following issues should be considered. Table 7: Issues to Consider when Evaluating Statistically Insignificant Events
Issue
Question
Magnitude of effect
Is the treatment effect size substantial given size of study?6
Clinical significance
Is the outcome patient focused with clinically meaningful effects on longevity or quality of life and with good evidence for causality7?
Independent study
Has statistical significance been demonstrated in more than one independent study (or in a meta-analysis of relevant studies), with no evidence of statistical heterogeneity?
Composite events
Are similar events statistically significant when combined8?
Accounting for clinical factors and magnitude of effect means that, in some cases, a result considered to be ‘statistically non-significant’ (ie p value equal to or greater than 0.05) should still be used. This is because the magnitude of clinical relevance overrides the statistical aspects. Likewise, in some cases a result considered to be statistically significant (p value less than 0.05) should not be used, because it has no meaningful clinical effects.
5 The p value is the probability that an observed effect is due to sampling error; therefore, it provides a measure of the strength of an association. This section uses p values to notionally define statistical significance; however, it is noted that confidence intervals may better summarise the strength and precision of the effect estimate. 6 Effect sizes with p values close to but not reaching statistical significance will be due to either one of two circumstances: (1) the effect is strong but the confidence interval is wide, because numbers of events, etc, are small; or (2) the effect is weaker but the confidence interval is narrower. In either case the p value being close to 0.05 means that the 95% confidence interval will only just include the value of 1.0 (ie a small but statistically significant chance that there is no effect). When deciding whether to still include such clinical events: (1) a strong effect will take precedence over a weaker effect; (2) a strong effect (with wide confidence limits) means the effect is likely to be clinically important, being limited by insufficient power (where ‘absence of evidence is not evidence of absence’) (18). Conversely, a weak effect with narrower confidence limits is unlikely to be clinically important (ie greater confidence but a negligible effect on outcomes). 7 To help determine whether events are clinically significant, outcomes should be examined to determine whether their association with treatment is likely to be causal. Key criteria for determining causal associations include (19): temporality (ie the cause must precede the effect); strength of association; consistency between different populations and different study designs; and a dose-response relationship (ie increased exposure is associated with an increased biological effect). 8 For composite endpoints to be valid, the results of the individual endpoints of composite measures reported by clinical trials should be reported (20). The number of individual endpoints should be minimised to preferably no more than three or four (21). Component non-fatal endpoints should be measured appropriately, with the use of a blinded endpoints committee, a core laboratory, or both (21), and analysis of non-fatal events should take into account competing risks. For information on the assessment of composite outcomes, please refer to the PBAC Guidelines for preparing a major submission (22).
27
When analysing multiple events without significant effects individually, it is preferable to use raw data and conduct suitable statistical tests (eg F-test). When only summary data are available, it is important to also take into account the likelihood of the same patient being included in multiple groups.
A clear exception, where events that are not significantly different between groups can be omitted, is when there is no difference in survival and any difference in the mean (point estimate) of events favours the comparator (eg if the new intervention has fewer adverse events but statistical significance is not reached).
In general, the exclusion of any statistically significant event from an analysis should be justified, and the impact of a decision to include or exclude certain parameters should be included and tested in the sensitivity analysis. However, for rapid analyses, statistically non-significant events should only be included if they are likely to change the results of the analysis.
5.1.4 Incorporation of Relative Treatment Effects with Baseline Events
A common approach is to model risk factors or interventions as having an additive or multiplicative effect on baseline probabilities, mortality or disease incidence. This is done by deriving relative risks (or hazard or odds ratios) between treatment options in clinical trials, and then ‘superimposing’ these estimates onto baseline probabilities derived from other sources (usually population based) (9, 23).
Once the baseline probabilities have been determined, a relative risk can be applied to the proposed treatment group. This may include a relative risk reduction if the proposed treatment reduces the risk of exacerbation, relapse, mortality, etc.
For example, disease-specific mortality can be used with all-cause mortality. All-cause mortality should be derived from New Zealand life tables (24), unless an alternative source can be justified. In general, it is not necessary to correct for the fact that all-cause mortality includes disease-specific mortality in the general population, unless the disease represents a major cause of death in the population (23). The choice of functional form for disease-specific mortality should be specified and justified.
More detailed information on the incorporation of relative treatment effects can be found at http://www.pbs.gov.au/info/industry/listing/elements/pbac-guidelines.

28
5.2 Extrapolation of Data
Key Recommendation: The methodology, limitations, and any possible bias associated with extrapolating data should be clearly described in the report and explored through sensitivity analysis. This includes extrapolating data from clinical trials to the longer term (or to final outcomes); generalising results from clinical trials to the New Zealand clinical setting by taking into account non-compliance; and undertaking indirect comparisons of trials. It is recommended that in the absence of conclusive data, conservative assumptions be used in the analysis.
Data from clinical trials and other sources need to be translated into an appropriate form for incorporation into a model.
Modelling may require:
• extrapolating data to the longer term • translating surrogate (intermediate) endpoints to obtain final outcomes affecting
disease progression, overall survival and/or quality of life • generalising results from clinical trials to the New Zealand clinical setting • using indirect comparisons where the relevant trials do not exist.
The methodology, limitations, and any possible biases associated with extrapolating and incorporating data should be clearly described in the report and explored through sensitivity analysis.
In the absence of conclusive data, conservative assumptions should be applied in the analysis. This may include cases where there is uncertainty about the:
• long-term benefit of treatment (ie beyond the period of the trial(s)) • correlation between surrogate measure and clinical outcomes • effectiveness of treatment (ie if evidence is of low-quality, such as non-
randomised trials) • relevance of evidence to New Zealand clinical practice (ie poor external validity of
trials) • incremental effectiveness of treatment (ie if indirect treatment comparison data
are used).
5.2.1 Extrapolation to Longer Terms
Many trials have endpoints that may be too early to show the full impact of the treatment. Therefore, it may be necessary to use intermediate outcomes to obtain final endpoints by extrapolating data beyond the period observed in the clinical trials, and comparing the extrapolated outcomes with expected long-term outcomes from observational studies (or any clinical trials in other settings with long-term outcomes that are relevant). This often requires explicit assumptions about the continuation of treatment effect once treatment has ceased (8, 25).
If there is any uncertainty about long-term benefit, it is recommended that conservative assumptions are applied in the analysis (eg it may be assumed that the benefit reduces or wanes entirely over time). Alternative scenarios should also be included to compare the implications of different assumptions around extrapolation beyond the clinical trial, for example scenarios where the treatment benefit in the extrapolated phase is nil, is the same as during treatment phase, or diminishes in the long term.
29
5.2.2 Translating Surrogate Endpoints to Final Outcomes
Available evidence may be limited to surrogate endpoints rather than clinically important outcome measures that affect disease progression, overall survival and quality of life. Therefore, it may be necessary to translate surrogate endpoints to clinically important outcomes, using data from observational studies that relate the surrogate outcome to the clinically important endpoints (or any clinical trials in other settings with clinically important outcomes that are relevant).
If there is uncertainty about the clinical significance of endpoints or the correlation between surrogate measure and clinical outcomes, conservative assumptions should be applied in the analysis regarding their impact (short and/or long term) on survival and/or health-related quality of life. In the absence of conclusive data, conservative assumptions should be included in the analysis.
5.2.3 Impact of Operator Skills and Experience: External Validity of Trials
The benefit of some pharmaceuticals, in particular many medical devices, is linked to how that pharmaceutical is applied. The efficacy of such a medicine or device in clinical practice may therefore differ from trials, due to the experience and skill of the operator. For example, if only experienced operators take part in the trial, the efficacy of the pharmaceutical in clinical practice may be lower in the first few years as operators gain the necessary experience and skills. During this ‘learning curve’, errors and adverse outcomes are potentially more likely (26-28).
In cases where there is evidence of reduced efficacy or safety in clinical practice compared with the trial, the analysis should adjust the efficacy/safety of a pharmaceutical in the first few years, and assume increased efficacy/safety over time as operators gain experience.
5.2.4 Product Modifications: Relevance of Trial Data over Time
Medical devices9 frequently undergo product modifications, some of which may impact on efficacy. Modifications are often incremental, based on emerging clinical evidence or use in clinical practice. Clinical trial data may become less relevant over time as the pivotal clinical trials may have been undertaken at an early stage in the technology’s evolution (27, 28).
In cases where products have been modified since the reported clinical trials, it is recommended that the assessment be based on a synthesis of the trial data (to evaluate overall efficacy of product group) and any further evidence available on the impact of product modifications on the efficacy of the device.
Any reported improvements in efficacy and safety should be assessed according to the grades of evidence. For example, any improvements reported by observational studies should be modelled conservatively because observational studies are a lower grade of evidence. If there is no evidence available on the efficacy of the modification, the assessment should be based solely on the initial trial evidence and should not assume any improvements to efficacy and/or safety due to modifications.
9 Due to the differences in regulatory approval processes, this section applies mainly to medical devices.
30
5.2.5 Extrapolation of Clinical Trial Data to the New Zealand Clinical Setting
It is important that the effectiveness and cost data included in the economic model are applicable to the New Zealand health sector. Clinical practice in New Zealand may differ from that in clinical trials in terms of the level of resources available (eg staffing), patient management (eg frequency of consultation), and type of patient. These may in turn impact on compliance rates and therefore change the effectiveness of treatment in clinical practice (8, 10, 25).
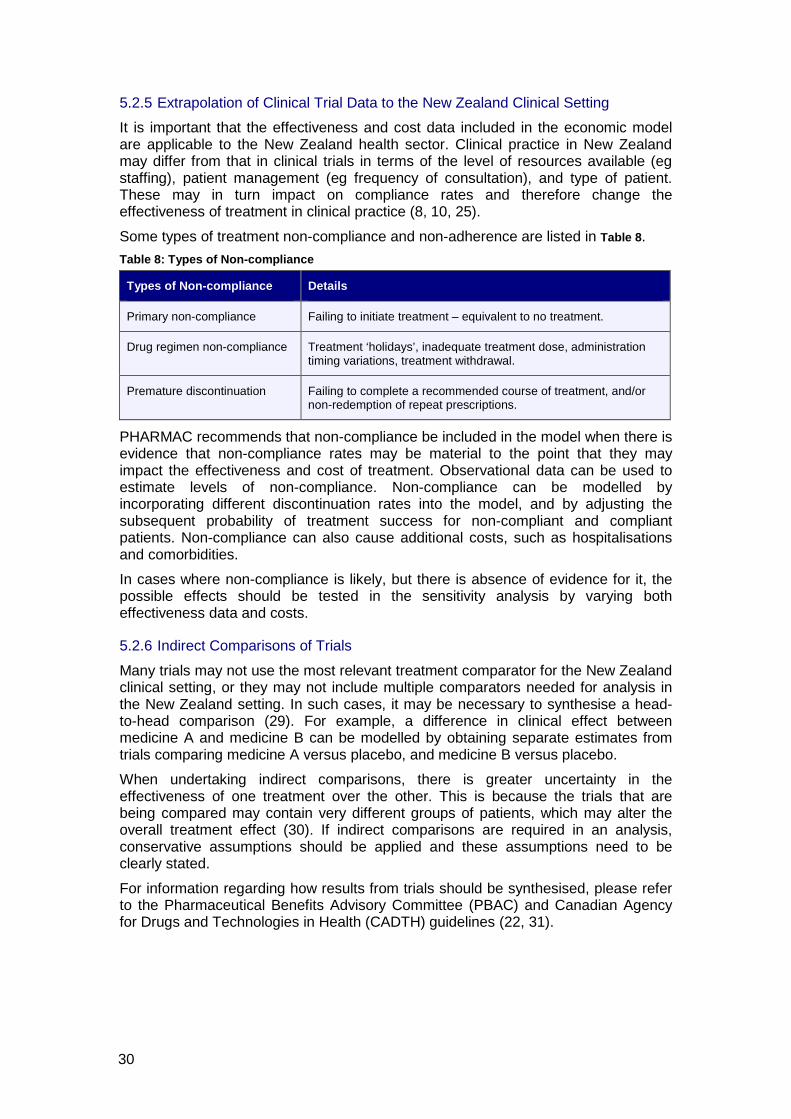
Some types of treatment non-compliance and non-adherence are listed in Table 8. Table 8: Types of Non-compliance
Types of Non-compliance Details
Primary non-compliance Failing to initiate treatment – equivalent to no treatment.
Drug regimen non-compliance Treatment ‘holidays’, inadequate treatment dose, administration timing variations, treatment withdrawal.
Premature discontinuation Failing to complete a recommended course of treatment, and/or non-redemption of repeat prescriptions.
PHARMAC recommends that non-compliance be included in the model when there is evidence that non-compliance rates may be material to the point that they may impact the effectiveness and cost of treatment. Observational data can be used to estimate levels of non-compliance. Non-compliance can be modelled by incorporating different discontinuation rates into the model, and by adjusting the subsequent probability of treatment success for non-compliant and compliant patients. Non-compliance can also cause additional costs, such as hospitalisations and comorbidities.
In cases where non-compliance is likely, but there is absence of evidence for it, the possible effects should be tested in the sensitivity analysis by varying both effectiveness data and costs.
5.2.6 Indirect Comparisons of Trials
Many trials may not use the most relevant treatment comparator for the New Zealand clinical setting, or they may not include multiple comparators needed for analysis in the New Zealand setting. In such cases, it may be necessary to synthesise a head-to-head comparison (29). For example, a difference in clinical effect between medicine A and medicine B can be modelled by obtaining separate estimates from trials comparing medicine A versus placebo, and medicine B versus placebo.
When undertaking indirect comparisons, there is greater uncertainty in the effectiveness of one treatment over the other. This is because the trials that are being compared may contain very different groups of patients, which may alter the overall treatment effect (30). If indirect comparisons are required in an analysis, conservative assumptions should be applied and these assumptions need to be clearly stated.
For information regarding how results from trials should be synthesised, please refer to the Pharmaceutical Benefits Advisory Committee (PBAC) and Canadian Agency for Drugs and Technologies in Health (CADTH) guidelines (22, 31).
31
5.3 Subgroup Analyses If treatment can be targeted to those who are most likely to benefit, subgroup analyses may be necessary10.
Subgroup analyses comprise two inter-related elements:
5.3.1 Variability in absolute baseline risk
Variability in baseline risk occurs when differences between patients in aspects such as disease severity cause differences in treatment outcomes. This relatively common effect is best summarised as a constant relative reduction in treatment effects across the trial population of varying baseline (expected) risks. This enables application of the overall trial data to specific subgroups with greater expected absolute risks of future events (ie poorer prognosis) and hence greater likelihood of benefiting from a new treatment. The absolute or incremental treatment effect can then be calculated by multiplying the expected absolute risks across the eligible population by the estimated overall relative treatment effect (22).
5.3.2 2. Variability in relative treatment effects
Variability in relative treatment effects occurs due to differing characteristics of the patient, the intervention(s), or the disease, causing varying relative reductions in the risk of clinical outcomes across the trial population. The population may also include sub-groups with different absolute baseline risks. In this case, which is far less common, analysis is required to identify statistically significant heterogeneity (variation) in the treatment effects across the subgroups. Such evidence is needed to help justify any calculations of absolute treatment effect that apply the estimated relative treatment effect for the subgroup to the expected risk for the subgroup (22).
When examining variability in treatment effects, in order for the results of subgroup analyses to be reliable, the subgroups in the clinical trial (or meta-analysis of clinical trials) should be defined a priori on the basis of known biological mechanisms or in response to findings in previous studies. The choice of subgroup and expected direction of difference should ideally have been justified in the trial protocol (32).
Where subgroups are defined retrospectively, information should be interpreted cautiously. This is because it is more likely that differences in effect in subgroups of patients are due to chance, given the smaller patient numbers. There is also an increased probability of either falsely ascribing ‘significant differences’ as a result of over-testing or producing false-negative results (33). Because of these concerns, it may be more appropriate to use data from a retrospective subgroup of patients in the sensitivity analysis rather than the base-case analysis.
In addition, statistical tests of interaction (34, 35)11 should be used to assess whether a treatment effect differs among subgroups (ie evidence of heterogeneity)12. However, even when there is heterogeneity between subgroups, results of subgroup analyses should still be interpreted with caution. The outcomes of subgroup analyses should be checked to ensure that they were pre-specified and that treatment effects
10 Patient subgroups may have different responses to treatment or magnitudes of benefit. These subgroups may be defined by age, gender, other demographic factors, disease-related factors (symptom complexes, severities), comorbidities, or intractability and factors affecting treatment effectiveness. The degree of breakdown depends upon the complexity of the targeting decisions to be made. Some situations will require many subgroups, others just the overall group. 11 Relevant statistical tests of interaction include the chi-square test using the Q statistic in an individual trial or the Cochran Q statistic across the pooled result, and the I2 statistic with its 95% uncertainty interval. 12 Statistical tests of interaction are preferred to individual tests within each subgroup – individual tests often overestimate the extent of true differences. (32)
32
are both statistically strong and pharmacologically, biologically and clinically plausible (33).
When examining variability in treatment effects, subgroup analysis in the CUA can be acceptable if justified by a formal and reliable subgroup analysis of the trial data (22) that adequately considers the above elements of plausibility, timing of the underlying hypothesis (a priori), and statistical heterogeneity (22, 32). Otherwise, subgroup analysis should generally not be used when a trial reports statistically significant treatment effect(s) in subgroup(s) or secondary endpoint(s) yet there is no overall treatment effect in the intention-to-treat (ITT) population13 or primary endpoint (33, 36).
5.4 Assessment of Vaccines
5.4.1 Adjustments to Vaccine Trial Efficacy Data
The following points should be considered when modelling vaccine efficacy (37):
• Proportion of vaccinated people who will be protected – a proportion of vaccinated people experience the intended effects, and the remainder of vaccinated people do not. For example, a vaccine with 90% ‘take’ would then produce the intended effect in 90% of vaccinated people, and not in the remaining 10%.
• Degree of protection – vaccinated people in whom the vaccine ‘takes’ may experience the intended effects to a certain degree (ie not 100% protection). For example, a vaccine with 90% ‘degree’ would produce the intended effect in 90% of vaccinated people in whom the vaccine ‘takes hold’.
• Length of protection – efficacy may remain constant over lifetime or wane as a function of time.
• Age at administration – the immune system shows different responsiveness based on the vaccinated person’s age.
• Adherence with the vaccination schedule (compliance and time between doses) – this especially needs to be considered for vaccines where compliance with a full schedule is problematic.
• Adverse reactions – some people have adverse reactions to a vaccine, which should be taken into account if significant.
• Potential loss of potency – this can be due to heat and cold exposure; however, it only needs to be considered if relevant data are available.
• Herd immunity – whether the vaccine is likely to provide indirect protection to unvaccinated people through appropriate coverage, as in section 5.4.2 below (further details provided below).
13 Subgroup treatment effects in a trial with no overall treatment effect are said to be usually superfluous subgroup salvages of otherwise indeterminate (negative) trials (33).
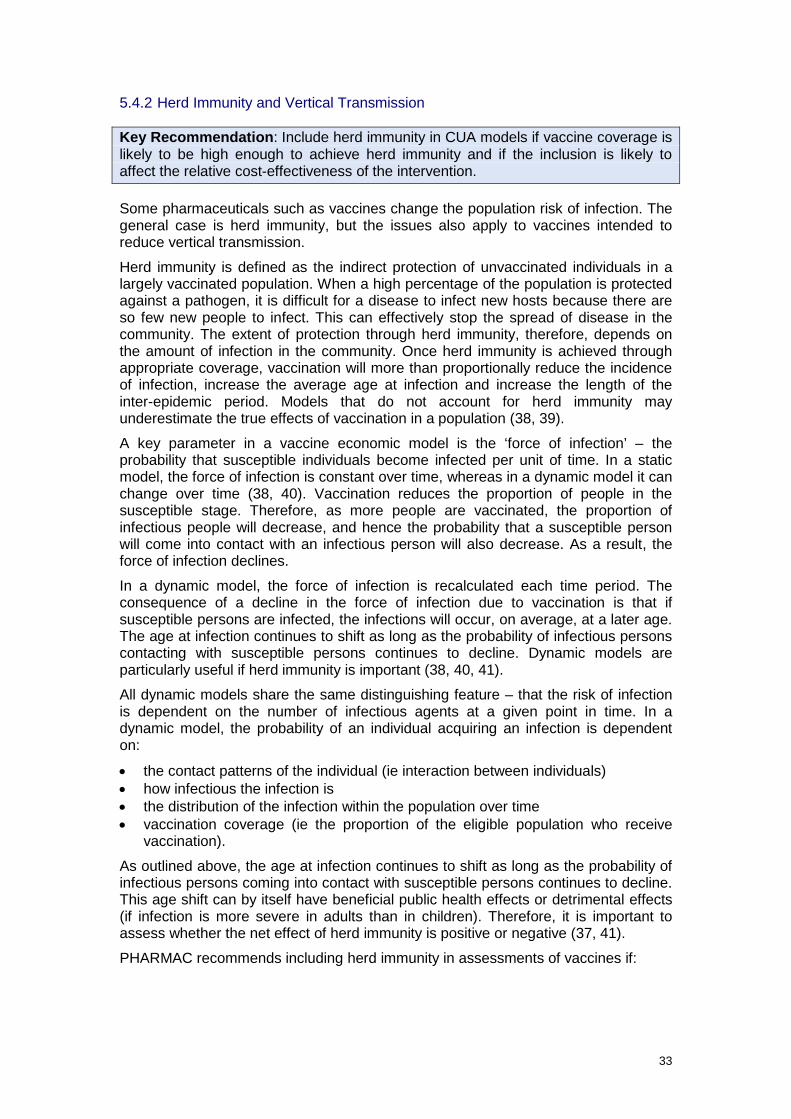
33
5.4.2 Herd Immunity and Vertical Transmission
Key Recommendation: Include herd immunity in CUA models if vaccine coverage is likely to be high enough to achieve herd immunity and if the inclusion is likely to affect the relative cost-effectiveness of the intervention.
Some pharmaceuticals such as vaccines change the population risk of infection. The general case is herd immunity, but the issues also apply to vaccines intended to reduce vertical transmission.
Herd immunity is defined as the indirect protection of unvaccinated individuals in a largely vaccinated population. When a high percentage of the population is protected against a pathogen, it is difficult for a disease to infect new hosts because there are so few new people to infect. This can effectively stop the spread of disease in the community. The extent of protection through herd immunity, therefore, depends on the amount of infection in the community. Once herd immunity is achieved through appropriate coverage, vaccination will more than proportionally reduce the incidence of infection, increase the average age at infection and increase the length of the inter-epidemic period. Models that do not account for herd immunity may underestimate the true effects of vaccination in a population (38, 39).
A key parameter in a vaccine economic model is the ‘force of infection’ – the probability that susceptible individuals become infected per unit of time. In a static model, the force of infection is constant over time, whereas in a dynamic model it can change over time (38, 40). Vaccination reduces the proportion of people in the susceptible stage. Therefore, as more people are vaccinated, the proportion of infectious people will decrease, and hence the probability that a susceptible person will come into contact with an infectious person will also decrease. As a result, the force of infection declines.
In a dynamic model, the force of infection is recalculated each time period. The consequence of a decline in the force of infection due to vaccination is that if susceptible persons are infected, the infections will occur, on average, at a later age. The age at infection continues to shift as long as the probability of infectious persons contacting with susceptible persons continues to decline. Dynamic models are particularly useful if herd immunity is important (38, 40, 41).
All dynamic models share the same distinguishing feature – that the risk of infection is dependent on the number of infectious agents at a given point in time. In a dynamic model, the probability of an individual acquiring an infection is dependent on:
• the contact patterns of the individual (ie interaction between individuals) • how infectious the infection is • the distribution of the infection within the population over time • vaccination coverage (ie the proportion of the eligible population who receive
vaccination).
As outlined above, the age at infection continues to shift as long as the probability of infectious persons coming into contact with susceptible persons continues to decline. This age shift can by itself have beneficial public health effects or detrimental effects (if infection is more severe in adults than in children). Therefore, it is important to assess whether the net effect of herd immunity is positive or negative (37, 41).
PHARMAC recommends including herd immunity in assessments of vaccines if:

34
• vaccine coverage is likely to be high, and therefore herd immunity is likely to occur. The level of coverage required for herd immunity, which will vary across antigens, therefore needs to be assessed prior to economic modelling
• the inclusion of herd immunity is likely to have an impact on the relative cost-effectiveness of the vaccine.
Static models may be appropriate if:
• herd immunity does not play an important role (ie the additional effectiveness per additional person vaccinated is constant).

35
5.5 Transition Probabilities
Key Recommendation: Convert rates to transition probabilities for use in assessments.
5.5.1 Point Estimates versus Probability Distributions
In most assessments, the use of point estimates is sufficient. It is currently recommended that probability distributions be used only in detailed analyses.
5.5.2 Converting Rates to Probabilities to Transition Probabilities
A rate is defined as an instantaneous likelihood of transition at any point in time, whereas a probability is the proportion of the population at risk that makes a transition over a specified period of time. As Markov models track transitions at discrete time intervals, rates should be converted to transition probabilities (42).
A rate can be converted to a probability using the following formula:
p = 1 – e –rt
where p = probability of an event; r = constant rate; t = time
The probabilities included in the model must correspond to the model’s cycle length. If the Markov cycle length is changed (eg from yearly to monthly), the probability should not simply be divided by the number of cycles (eg 12) to obtain the transition probability for the shorter cycle. Rather, the above formula should be used (ie p = 1-e–r/12).
Transition probabilities can also be converted to rates using the inverse formula below. A common use is to adjust transition probabilities for a change in cycle length, for example from yearly to monthly. The yearly transition probability should be converted to the corresponding rate, which is then converted back to a monthly probability.
ln (1 – p) r = -
t where r = constant rate; p = probability of an event; t = time
5.6 Mortality Rates Life-expectancy estimates should be based on the age and gender-specific life expectancy of the patient population in New Zealand, taking into account disease-specific mortality. Life expectancy should not be adjusted for potential changes in life expectancy in the future or for possible comorbidities.

36
6 Estimating Health Benefits
In 1948, the World Health Organization defined health as being not only the absence of disease and infirmity, but also the presence of physical, mental and social wellbeing (43). Quality of life issues have become increasingly recognised as important in health care, particularly with the treatment of chronic conditions with long-term effects on quality of life.
6.1 Measures of Health-Related Benefit
Key Recommendation: Health benefits should be measured using quality-adjusted life years (QALYs). QALYs take into account patients’ health-related quality of life as well as duration of survival. Only the QALYs of the individual patient being treated should be included in the base-case analysis.
Health measures that incorporate both the quality and the length of life into a common currency include quality-adjusted life years (QALYs), disability-adjusted life years (DALYs)14 and healthy year equivalents (HYEs)15.
6.1.1 Quality-Adjusted Life Years
QALYs have been used since the 1960s and remain the most widely used measure for integrating effects of treatments on length and quality of life.
Under the QALY framework, one QALY is equivalent to living one year in perfect health, or two years at half of perfect health, and so on. This is illustrated in the following figure. Here, life expectancy (the number of years left before death) is 6.00. Quality-adjusted life expectancy (the number of QALYs left before death) is 4.75. This is calculated by multiplying each life year by the average quality of life experienced in that year ((4×1)+(1×0.5)+(1×0.25)). This is equivalent to the area under the curve. Figure 2: QALYs combine quality of life and life expectancy
14 DALYs are expressed in terms of years of life lost due to premature death and years lived with a disability of specific severity and duration. 15 HYEs incorporate individual preference structures over a complete path of health states (rather than discrete health states).
00.10.20.30.40.50.60.70.80.9
1
1 2 3 4 5 6
Heal
th-r
elat
ed q
ualit
y of
Life
Years in health state
Life expectancy = 6.00 Quality adjusted life expectancy = 4.75
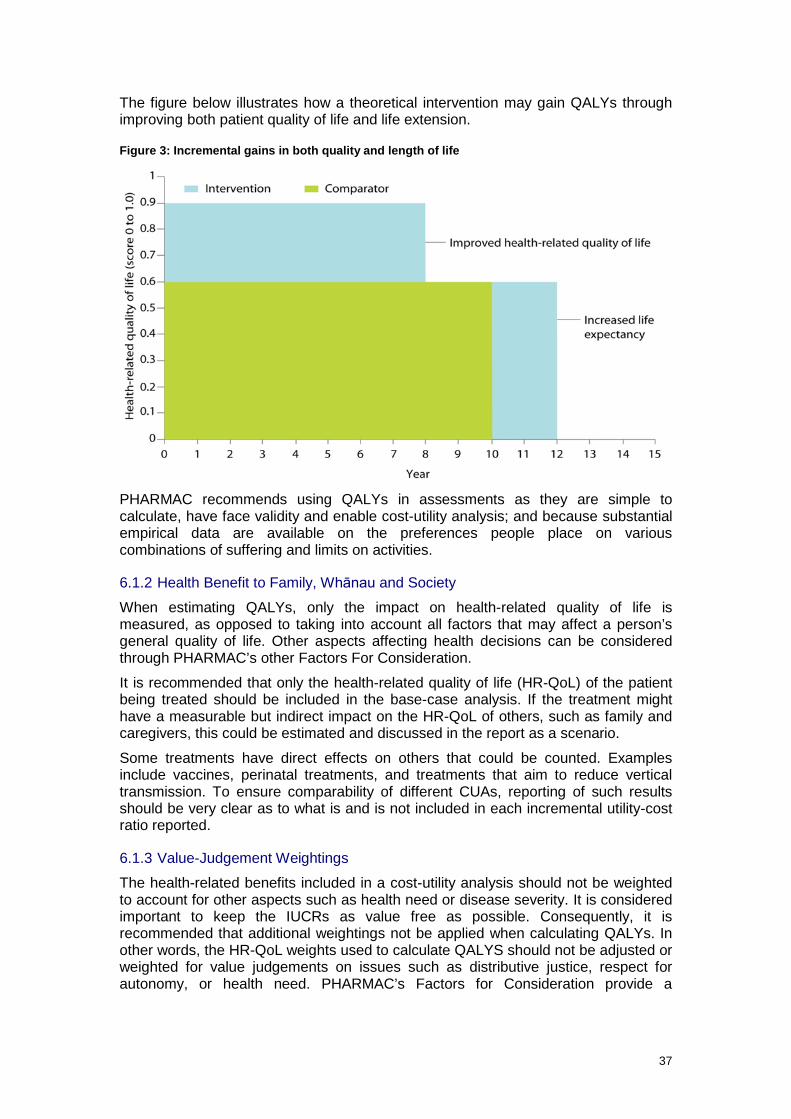
37
The figure below illustrates how a theoretical intervention may gain QALYs through improving both patient quality of life and life extension.
Figure 3: Incremental gains in both quality and length of life
PHARMAC recommends using QALYs in assessments as they are simple to calculate, have face validity and enable cost-utility analysis; and because substantial empirical data are available on the preferences people place on various combinations of suffering and limits on activities.
6.1.2 Health Benefit to Family, Whānau and Society
When estimating QALYs, only the impact on health-related quality of life is measured, as opposed to taking into account all factors that may affect a person’s general quality of life. Other aspects affecting health decisions can be considered through PHARMAC’s other Factors For Consideration.
It is recommended that only the health-related quality of life (HR-QoL) of the patient being treated should be included in the base-case analysis. If the treatment might have a measurable but indirect impact on the HR-QoL of others, such as family and caregivers, this could be estimated and discussed in the report as a scenario.
Some treatments have direct effects on others that could be counted. Examples include vaccines, perinatal treatments, and treatments that aim to reduce vertical transmission. To ensure comparability of different CUAs, reporting of such results should be very clear as to what is and is not included in each incremental utility-cost ratio reported.
6.1.3 Value-Judgement Weightings
The health-related benefits included in a cost-utility analysis should not be weighted to account for other aspects such as health need or disease severity. It is considered important to keep the IUCRs as value free as possible. Consequently, it is recommended that additional weightings not be applied when calculating QALYs. In other words, the HR-QoL weights used to calculate QALYS should not be adjusted or weighted for value judgements on issues such as distributive justice, respect for autonomy, or health need. PHARMAC’s Factors for Consideration provide a

38
framework to ensure that all relevant aspects and issues are taken into account in an overall decision.
6.2 Health-Related Quality of Life Instruments
Key Recommendations: The New Zealand EQ-5D Tariff 2 should be referred to first when measuring health-related quality of life, and should be used to describe the health states. The Global Burden of Disease disability weights and published literature should be used to check for consistency with the estimated EQ-5D values.
A number of instruments have been developed to measure health state preferences (44). These instruments provide a utility rating in the form of a single number representing the net aggregate impact of physical, emotional and social functioning on quality of life.
There has been much debate in the literature about the most appropriate tool for measuring preferences in health gains. Given the multidimensional nature of HR-QoL, it seems that no single measure has been (or is likely to be) accepted as the gold standard (45). The Washington Panel on Cost-Effectiveness in Health and Medicine reviewed these instruments in 1996, and chose not to endorse one instrument above another (14). They note that each instrument has different properties, and each member of the Panel valued these properties differently. However, it is recommended that decision makers such as PHARMAC adopt a reference case instrument.
Instruments available include (but are not limited to) the Health Utility Index (HUI); the EuroQol 5D (EQ-5D); 15D; the Assessment of Quality of Life instrument (AQoL); the Short-Form 6D (SF-6D); and the Quality of Well Being index (QWB) (2, Chapter 6).
6.2.1 EQ-5D
The recommended Health-Related Quality of Life instrument is the EuroQol 5D with the New Zealand Tariff 2.
The EQ-5D is one of the most widely used and adapted instruments internationally. It consists of five dimensions (mobility, self-care, usual activities, pain/discomfort, and anxiety/depression) and three levels (no problems, some problems and extreme problems), resulting in 245 unique health states (including Unconscious and Dead).
In order to derive generic utility weights specific to the New Zealand population, Devlin et al undertook a survey of the New Zealand population in 1999 using the EuroQol Group’s EQ-5D questionnaire (46). The survey was mailed to 3000 randomly selected New Zealanders, and was completed by 1360, giving an approximately 45% response rate. Each respondent rated their health on the five EQ-5D dimensions and assigned a global score to their profile. Valuations for a subset of the 245 EQ-5D states were collected from respondents using the Visual Analogue Scale (VAS). Regression analysis was used to interpolate values over the 245 possible EQ-5D states (46)16.
Almost two-thirds of the survey responses had to be rejected due to missing, implausible or otherwise unusable valuations (46). This resulted in two tariffs being produced – one (Tariff 1) that included the ‘logical inconsistencies’17 and so may be 16 This included negative values for health states considered to be worse than death (47). Survey results indicated that respondents can and do evaluate some health states as worse than death, and the study authors recommended the systematic inclusion of these states to describe a more complete range of preference values (48). 17 Logical inconsistency was defined as “when a state that ‘in logical terms’ is unambiguously less severe than another is assigned a lower value” (46).
39
more representative of the population’s views, and the other (Tariff 2) that excluded these inconsistencies may more accurately reflect underlying preferences) (46).
The validity and reliability of the EQ-5D health state valuations have also been examined in the Māori population. Perkins et al (49) surveyed 66 Māori people to investigate the content validity and reliability of the EQ-5D in this population. They reported that approximately three-quarters of respondents considered the EQ-5D representation of health to be adequate, suggesting the instrument has content validity. However, a high prevalence of missing valuations (particularly for the health state ‘Dead’) and logical inconsistencies suggests that it lacks construct validity in this population.
The EQ-5D is widely used internationally and utility weights have been derived from the New Zealand population. Therefore, PHARMAC recommends referring to the EQ-5D Tariff 2 first and using it to describe the health states. Other instruments can be used, however, their use should be well justified.
6.2.2 Obtaining Utility Values
Key Recommendation: If subjective judgement is used to map health states, these health states should be validated through either published literature or expert clinical input. The report should provide a detailed description of the health state and impact on HR-QoL.
Utility values can be obtained directly or indirectly. Obtaining direct health utilities may require face-to-face interviews where people are asked to assign value to specific health states. Indirect health utilities use population-assigned weights to calculate utility scores for particular health states from health status instruments (eg the EQ-5D) (50).
Three common methods used to evaluate health states are the standard gamble (SG), time trade-off (TTO) or visual analogue scale (VAS).
6.2.3 Mapping
Mapping health states to health status classification instruments requires subjective judgements; however, the estimates can be further validated by input from clinicians and the literature.
Mapping can involve both relating the baseline characteristics of the target patient population to relevant generic health states in the quality of life instrument(s) used for the CUA, and then estimating the extent to which treatment alters baseline health status.
It is essential that the symptoms patients experience in each of the health states are described in detail in the report. This will assist with the mapping process.
Further information on mapping can be found in Appendix 6: Utility valuation of health outcomes of the PBAC Guidelines (22).
6.2.4 Literature
Existing utility values available in the literature can be used to check for consistency with the EQ-5D weights, providing similar health states and patients are used and the measurement instrument is credible.
Existing utility values can be sourced from published cost-utility analyses (refer to section 4.2 for website links) or studies that estimate HR-QoL scores, such as the Global Burden of Disease (GBD) study discussed in the next section.

40
6.2.5 Disability Weights – the Global Burden of Disease Study (GBDS)
The Global Burden of Disease Study (GBDS) (51, 52) estimated the burden of 1160 separate sequelae of 220 health states. DALYs were used to measure the impact of mortality and non-fatal health outcomes for a wide range of diseases and illnesses. In order to estimate DALYs, a multicountry household survey and an open-access web-based survey were conducted. There was a significant degree of concordance between countries.
PHARMAC recommends using the GBDS weights to check for consistency and face validity with the EQ-5D weights, but they should not be used as the main source of utility values.
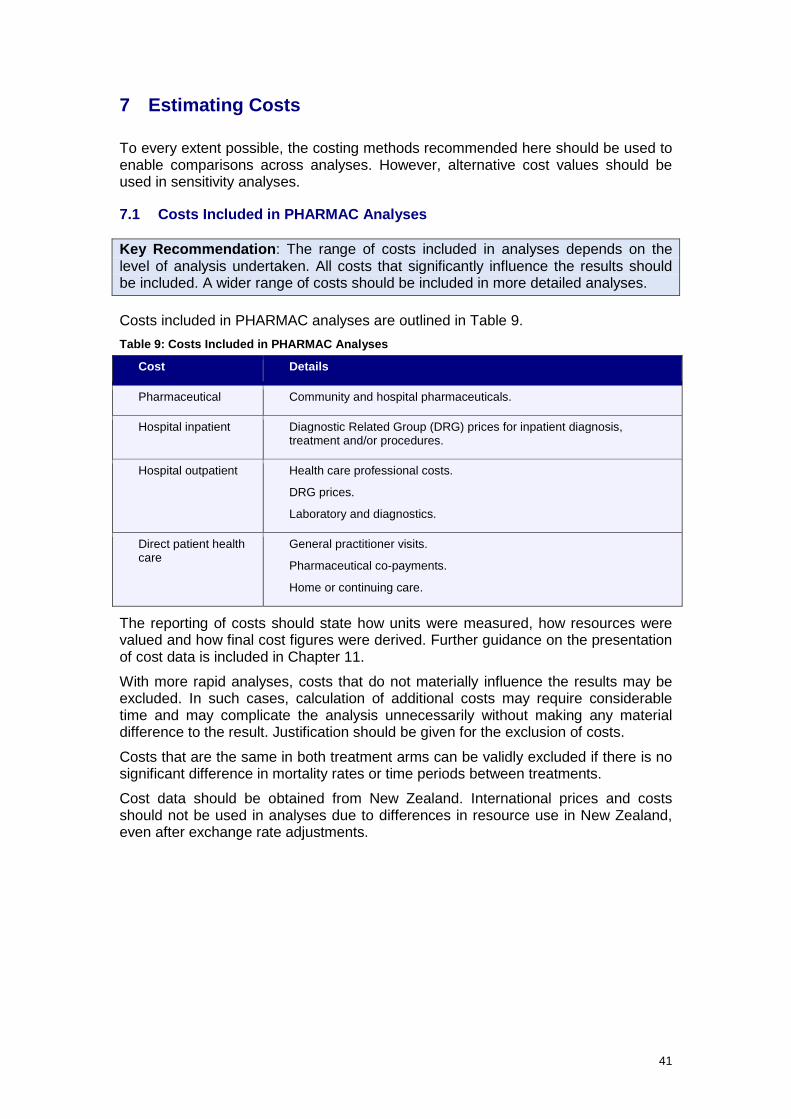
41
7 Estimating Costs
To every extent possible, the costing methods recommended here should be used to enable comparisons across analyses. However, alternative cost values should be used in sensitivity analyses.
7.1 Costs Included in PHARMAC Analyses
Key Recommendation: The range of costs included in analyses depends on the level of analysis undertaken. All costs that significantly influence the results should be included. A wider range of costs should be included in more detailed analyses.
Costs included in PHARMAC analyses are outlined in Table 9. Table 9: Costs Included in PHARMAC Analyses
Cost Details
Pharmaceutical Community and hospital pharmaceuticals.
Hospital inpatient Diagnostic Related Group (DRG) prices for inpatient diagnosis, treatment and/or procedures.
Hospital outpatient Health care professional costs.
DRG prices.
Laboratory and diagnostics.
Direct patient health care
General practitioner visits.
Pharmaceutical co-payments.
Home or continuing care.
The reporting of costs should state how units were measured, how resources were valued and how final cost figures were derived. Further guidance on the presentation of cost data is included in Chapter 11.
With more rapid analyses, costs that do not materially influence the results may be excluded. In such cases, calculation of additional costs may require considerable time and may complicate the analysis unnecessarily without making any material difference to the result. Justification should be given for the exclusion of costs.
Costs that are the same in both treatment arms can be validly excluded if there is no significant difference in mortality rates or time periods between treatments.
Cost data should be obtained from New Zealand. International prices and costs should not be used in analyses due to differences in resource use in New Zealand, even after exchange rate adjustments.

42
7.2 Pharmaceutical Costs
Key Recommendations: Pharmaceutical costs should use net pricing from the pharmaceutical supplier, be based on the dose used in the key clinical trials (unless there is evidence of efficacy for different doses in clinical practice) and take into account the lower price of a future generic pharmaceutical. Dispensing fees and pharmacy mark-up should be included. The cost of co-administered pharmaceuticals and any significant costs with administering the pharmaceutical should also be taken into account.
7.2.1 Price of Pharmaceutical(s)
Pharmaceutical costs should be restricted to pharmaceuticals listed or considered for listing on the Pharmaceutical Schedule (53). For cost-utility analyses, the goal is to assess the value of the proposed pharmaceutical as a possible use of health system funds. Therefore in cost-utility analyses, the total pharmaceutical cost should be included regardless of whether it is paid partly by the patient or entirely by the government.
For pharmaceuticals listed on the Pharmaceutical Schedule (53), the net price of the pharmaceutical should be used, as negotiated with the supplier. The analysis should state whether the price is confidential. If the net price of the proposed intervention or the comparator is unknown at the time of analysis, include a wide range of prices in the sensitivity analysis.
When calculating the cost of a pharmaceutical intervention and comparator pharmaceutical(s), consideration should also be given to the length of the pharmaceutical patent and the time until a generic pharmaceutical is likely to become available. It is recommended that in cases where the patent expiry is within 10 years from expected date of pharmaceutical funding, the expected time and price reduction from a likely generic pharmaceutical should be included in the analysis. If the patent expiry is after 10 years from expected date of funding, a conservative proxy should be used for the estimated time until the introduction of a generic pharmaceutical and subsequent price reduction (eg 25 years until expiry and 70% price reduction with introduction of generic). This should be varied in the sensitivity analysis.
Pharmaceutical costs included in the analysis should include not only the cost of pharmaceuticals used to treat the disease or condition, but also the cost of pharmaceuticals used to treat any significant side-effects of treatment.
It is recommended that pharmaceutical prices be deflated by 2% per year in the sensitivity analysis (not the base-case analysis) as a proxy for inflation in other prices. The impact of this amendment should be discussed in the report.
7.2.2 Medical Devices
Medical devices have costs that may differ to those for medicines and which need to be taken into account. These costs include, but are not limited to: • one-off costs:
- capital - disposal of current device(s) - costs of switching out devices already in use
- implementation

43
• fixed costs: - hiring additional staff - overheads - training
• costs associated with use: - operating costs - maintenance and repair - consumables.
Further information on measuring medical device costs in New Zealand is included in the Cost Resource Manual, available on the PHARMAC website.
7.2.3 Dose of Pharmaceutical(s)
The dose of the pharmaceutical should be the dose used in the key clinical trials, providing this reflects clinical practice in New Zealand. In cases where the dose in the clinical trials does not reflect current clinical practice or expected clinical practice upon introduction, the dose should be based on that used in clinical practice, providing there is some evidence of efficacy at the proposed dose. In cases where there is no evidence available, analyses should consider different scenarios where the dose (but not the effectiveness) is varied.
Any dose adjustments over time should also be taken into account.
The dose of the pharmaceutical may depend on the weight or surface area of the patient. The average weight of adults in New Zealand is currently approximately 79.6 kg(54); however, it may be necessary to adjust this according to the age and/or gender of the population treated.
In some cases, it is necessary to take into account any drug wastage that may occur due to inappropriate vial size; non-compliance; or if infusions cannot be stored once prepared.
7.2.4 Dispensing Fees and Pharmacy Mark-Up
The cost of dispensing community pharmaceuticals (the ‘dispensing fee’) and the pharmacy mark-up should be included in analyses. Note that for pharmaceuticals dispensed from hospital pharmacies, a dispensing fee should only be included if the pharmaceuticals are dispensed for outpatient use.
Details on the current dispensing fee and pharmacy mark-up are provided in the Cost Resource Manual, available on the PHARMAC website.
7.2.5 Administration of Pharmaceutical(s)
The cost of administering a pharmaceutical should be included in the analysis.
Pharmaceutical administration costs may include:
• laboratory/diagnostic tests or procedures required prior to the initial administration or each administration
• pre-medication to prevent any potential side-effects • pharmacist time to prepare infusion (this cost only needs to be included in
cases where the preparation of the infusion has a relatively significant impact on pharmacist time)
• material costs required to deliver infusion (eg infusion line, saline, filter, alcohol swabs, etc)
• nurse and/or specialist time required to administer treatment
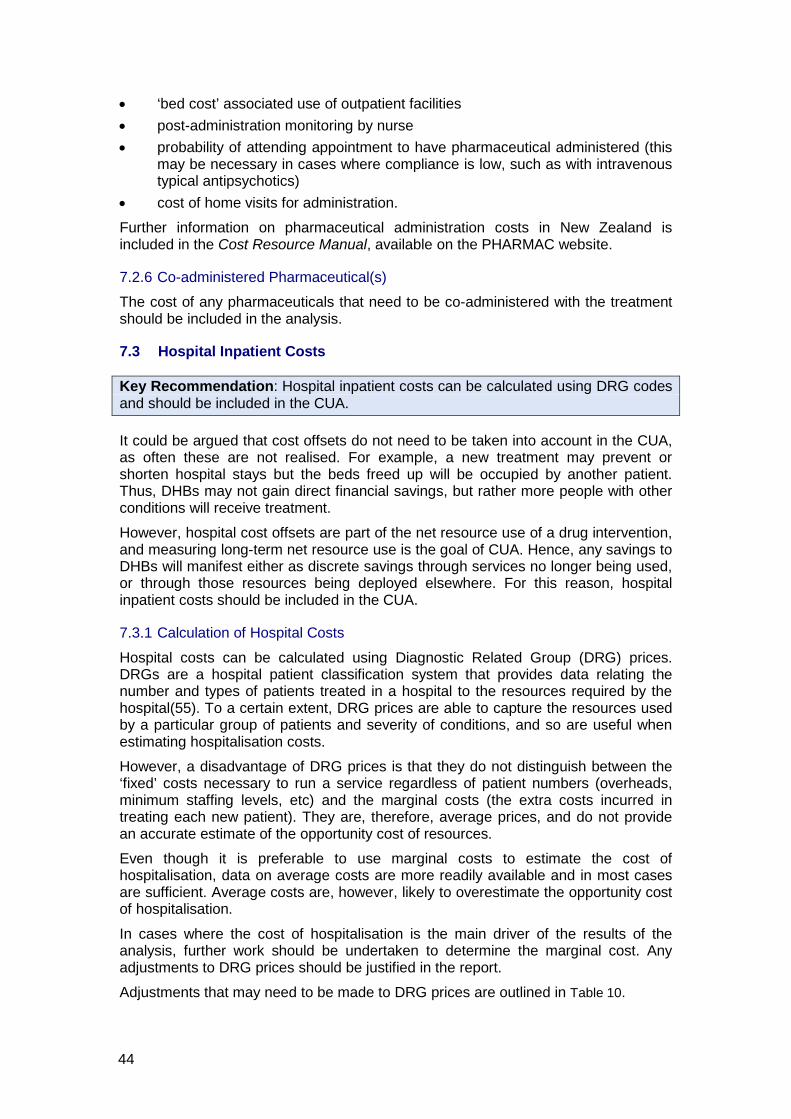
44
• ‘bed cost’ associated use of outpatient facilities • post-administration monitoring by nurse • probability of attending appointment to have pharmaceutical administered (this
may be necessary in cases where compliance is low, such as with intravenous typical antipsychotics)
• cost of home visits for administration.
Further information on pharmaceutical administration costs in New Zealand is included in the Cost Resource Manual, available on the PHARMAC website.
7.2.6 Co-administered Pharmaceutical(s)
The cost of any pharmaceuticals that need to be co-administered with the treatment should be included in the analysis.
7.3 Hospital Inpatient Costs
Key Recommendation: Hospital inpatient costs can be calculated using DRG codes and should be included in the CUA.
It could be argued that cost offsets do not need to be taken into account in the CUA, as often these are not realised. For example, a new treatment may prevent or shorten hospital stays but the beds freed up will be occupied by another patient. Thus, DHBs may not gain direct financial savings, but rather more people with other conditions will receive treatment.
However, hospital cost offsets are part of the net resource use of a drug intervention, and measuring long-term net resource use is the goal of CUA. Hence, any savings to DHBs will manifest either as discrete savings through services no longer being used, or through those resources being deployed elsewhere. For this reason, hospital inpatient costs should be included in the CUA.
7.3.1 Calculation of Hospital Costs
Hospital costs can be calculated using Diagnostic Related Group (DRG) prices. DRGs are a hospital patient classification system that provides data relating the number and types of patients treated in a hospital to the resources required by the hospital(55). To a certain extent, DRG prices are able to capture the resources used by a particular group of patients and severity of conditions, and so are useful when estimating hospitalisation costs.
However, a disadvantage of DRG prices is that they do not distinguish between the ‘fixed’ costs necessary to run a service regardless of patient numbers (overheads, minimum staffing levels, etc) and the marginal costs (the extra costs incurred in treating each new patient). They are, therefore, average prices, and do not provide an accurate estimate of the opportunity cost of resources.
Even though it is preferable to use marginal costs to estimate the cost of hospitalisation, data on average costs are more readily available and in most cases are sufficient. Average costs are, however, likely to overestimate the opportunity cost of hospitalisation.
In cases where the cost of hospitalisation is the main driver of the results of the analysis, further work should be undertaken to determine the marginal cost. Any adjustments to DRG prices should be justified in the report.
Adjustments that may need to be made to DRG prices are outlined in Table 10.
45
Table 10: DRG Adjustments
DRG Adjustment Details
Complexity DRG prices should be adjusted for more severe conditions.
Volume of patients In cases where more than one DRG code needs to be used, the cost per admission should be weighted by the number of discharges under each DRG code.
Mechanical ventilation DRG prices should be adjusted for mechanical ventilation co-payments when relevant.
7.3.2 Capital Costs, Depreciation, and Hospital Overhead Costs
Capital and overhead costs are generally included in DRG prices, and do not need to be estimated separately in the majority of CUAs. However, these costs should be included if significant.
7.4 Other Health System Costs
Key Recommendation: CUAs should include hospital outpatient costs. Terminal costs associated with the primary condition being treated should be included in CUAs if these costs are likely to be significantly different between treatment arms or if they occur at significantly different times.
7.4.1 Hospital Outpatient Costs
Hospital outpatient costs may include:
• hospital outpatient or community-based services required for administration of the pharmaceutical (eg nurse and specialist time required for infusions)
• laboratory and diagnostic tests • emergency department visits • specialist visits and primary care services • community based services (eg nurse home visits, residential care, home help,
hospice care).
The cost of outpatient hospital visits should be estimated using the specialist consultation cost or same-day DRG costs. This cost is particularly relevant when subsidies for pharmaceuticals are only available when prescribed by specialists.
Laboratory and diagnostic tests can be costed as per test/procedure. Care should be taken to ensure that these costs are not included in the DRG costs, to avoid double-counting.
7.4.2 Terminal Care Costs
A large proportion of costs are incurred in the last few months of a person’s life, which can affect the cost-effectiveness of a treatment. These costs should be included in CUAs if they are likely to significantly impact the results. This is most likely to occur in cases where patients are receiving palliative care in their final few months of life and a new treatment improves survival, or if the costs occur at significantly different times.
In cases where patients die in hospital, terminal care costs can be calculated from DRG prices. In cases where patients receive palliative care in the community (eg terminal cancer patients), terminal care costs can be calculated as the cost of home visits (nurse and specialist), hospice care, and/or hospital care. Due to uncertainty, a range of costs should be included.

46
The cost of terminal care should, however, be restricted to the terminal costs associated with the primary condition being treated.
7.5 Direct Patient Health Care Costs
Key Recommendations: Include direct patient health care costs in CUAs. These should be restricted to health care costs that government partially subsidises, and should be based on the cost to government plus the additional cost to the patient. These costs include general practitioner visits, pharmaceutical co-payments, and home or continuing care.
Direct patient health care costs included in CUAs should be restricted to health care costs that the government partially subsidises through Vote:Health. The cost included in the CUA should be the cost to government plus any additional cost to the patient.
Direct patient health care costs include:
• general practitioner visits • pharmaceutical co-payments • home or continuing care.
Direct patient health care costs do not include:
• lost wages as a result of sickness • cost of premature mortality • non-government-subsidised costs such as private hospital, physiotherapy, or
unsubsidised pharmaceuticals.
7.5.1 GP Visits
The cost of a general practitioner (GP) visit should be based on the average cost to the patient plus any government subsidy (if applicable). Details are provided in the Cost Resource Manual, available on the PHARMAC website.
7.5.2 Pharmaceutical Co-payments
For CUAs, it is recommended that the total pharmaceutical cost be included, irrespective of whether it is paid partly by the patient or entirely by the government. As outlined above, pharmaceutical costs included in CUAs should be restricted to pharmaceuticals listed (or considered for listing) on the Pharmaceutical Schedule or funded by DHB hospitals.
7.5.3 Cost of Home or Continuing Care
The cost of home care or continuing care (rest home or private geriatric/ psychogeriatric care) should be included in CUAs, regardless of who is paying for these services (ie the family, DHB, Accident Compensation Corporation (ACC), or Ministry of Social Development). The inclusion of these costs also provides a proxy for the disutility associated with the requirement for additional care. Cost details are provided in the Cost Resource Manual, available on the PHARMAC website.
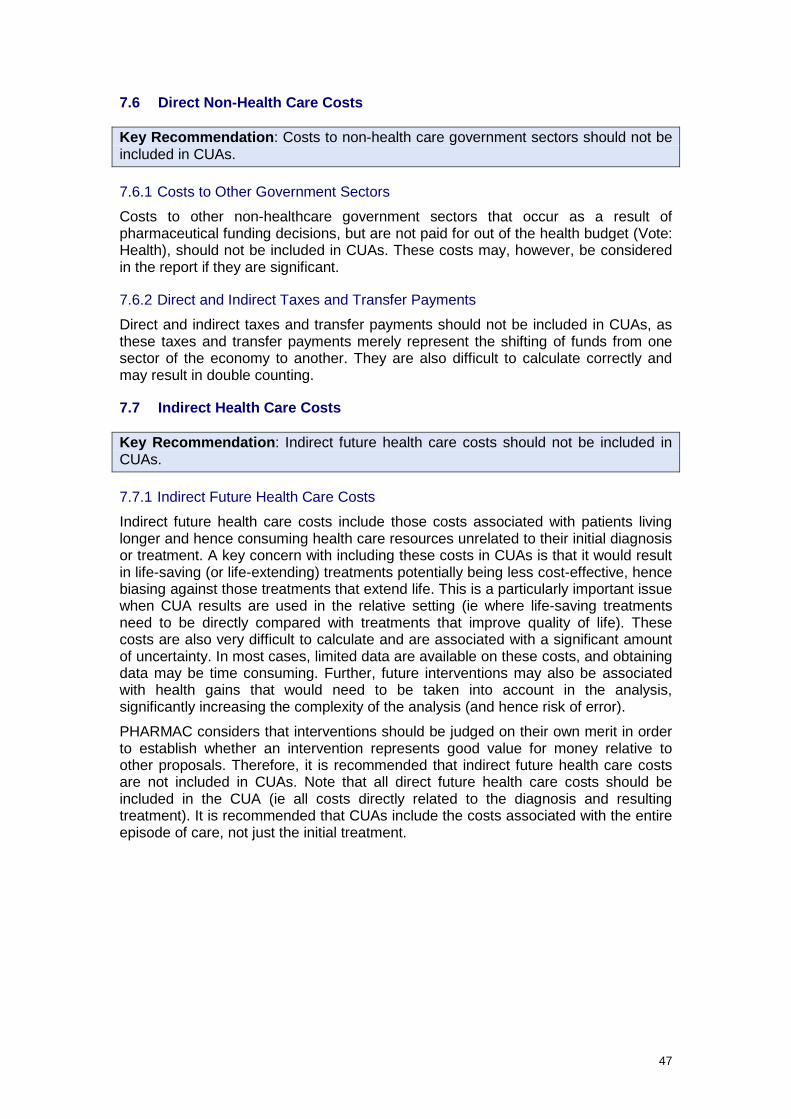
47
7.6 Direct Non-Health Care Costs
Key Recommendation: Costs to non-health care government sectors should not be included in CUAs.
7.6.1 Costs to Other Government Sectors
Costs to other non-healthcare government sectors that occur as a result of pharmaceutical funding decisions, but are not paid for out of the health budget (Vote: Health), should not be included in CUAs. These costs may, however, be considered in the report if they are significant.
7.6.2 Direct and Indirect Taxes and Transfer Payments
Direct and indirect taxes and transfer payments should not be included in CUAs, as these taxes and transfer payments merely represent the shifting of funds from one sector of the economy to another. They are also difficult to calculate correctly and may result in double counting.
7.7 Indirect Health Care Costs
Key Recommendation: Indirect future health care costs should not be included in CUAs.
7.7.1 Indirect Future Health Care Costs
Indirect future health care costs include those costs associated with patients living longer and hence consuming health care resources unrelated to their initial diagnosis or treatment. A key concern with including these costs in CUAs is that it would result in life-saving (or life-extending) treatments potentially being less cost-effective, hence biasing against those treatments that extend life. This is a particularly important issue when CUA results are used in the relative setting (ie where life-saving treatments need to be directly compared with treatments that improve quality of life). These costs are also very difficult to calculate and are associated with a significant amount of uncertainty. In most cases, limited data are available on these costs, and obtaining data may be time consuming. Further, future interventions may also be associated with health gains that would need to be taken into account in the analysis, significantly increasing the complexity of the analysis (and hence risk of error).
PHARMAC considers that interventions should be judged on their own merit in order to establish whether an intervention represents good value for money relative to other proposals. Therefore, it is recommended that indirect future health care costs are not included in CUAs. Note that all direct future health care costs should be included in the CUA (ie all costs directly related to the diagnosis and resulting treatment). It is recommended that CUAs include the costs associated with the entire episode of care, not just the initial treatment.

48
7.8 Indirect Patient Costs
Key Recommendations: Indirect patient costs should not be included in cost-utility analyses as costs. Reductions in such costs may be included as health benefits.
Indirect costs are those costs relating to lost productivity of a patient due to treatment, illness or death, or that of family members if they attend to patients. Many of these effects are counted as health benefits.
Examples of indirect patient costs that should be excluded from costs are:
• cost of patient or caregiver time off work (ie lost wages) and reduced productivity costs
• cost of premature mortality • intangible costs (eg pain and suffering experienced as a result of a
treatment)(56).
Arguments and counter-arguments for including indirect costs which have been considered by PHARMAC when coming to the view that these effects should not be included in CUAs as costs are outlined in Table 11.
Table 11: Arguments (and Counter-Arguments) for the Inclusion of Indirect Costs
Arguments for Inclusion of Indirect Costs Counter-Arguments
Sickness or treatment that results in inability for the patient or caregiver to work incurs a cost to individuals and employers in terms of replacement of sick workers, training the replacement, and lower levels of productivity.
The actual production loss for society from sickness is likely to be much smaller than the estimated value of potential production lost. For short-term absences, a person’s work may be covered by others or made up by the sick person on their return to work. For long-term absences, an individual’s work can be covered by someone drawn from the unemployed, albeit with friction costs (hiring, induction, upskilling costs, etc). Therefore, while absence from work may cost the individual or employer, it may not cost society very much.
There are also ethical concerns with including lost productivity in analyses as costs rather than reductions in quality of life, as these costs tend to bias against those who are not in the paid labour force – particularly children, homemakers, retired people, the unemployed, and those unable to work because of disability, frailty or disease, including cognitive and psychological impairment. Incorporating differential earning levels will also result in valuing one group of individuals more than another, which is politically and ethically contrary to egalitarian values. It would also result in health care interventions being more likely to be directed towards well-paid working people.
There are costs associated with premature mortality in terms of loss of potential income; and savings in terms of future health care spending that would likely have occurred if the patient survived.
Similar ethical issues as with the inclusion of lost productivity costs (ie biases against those not working).
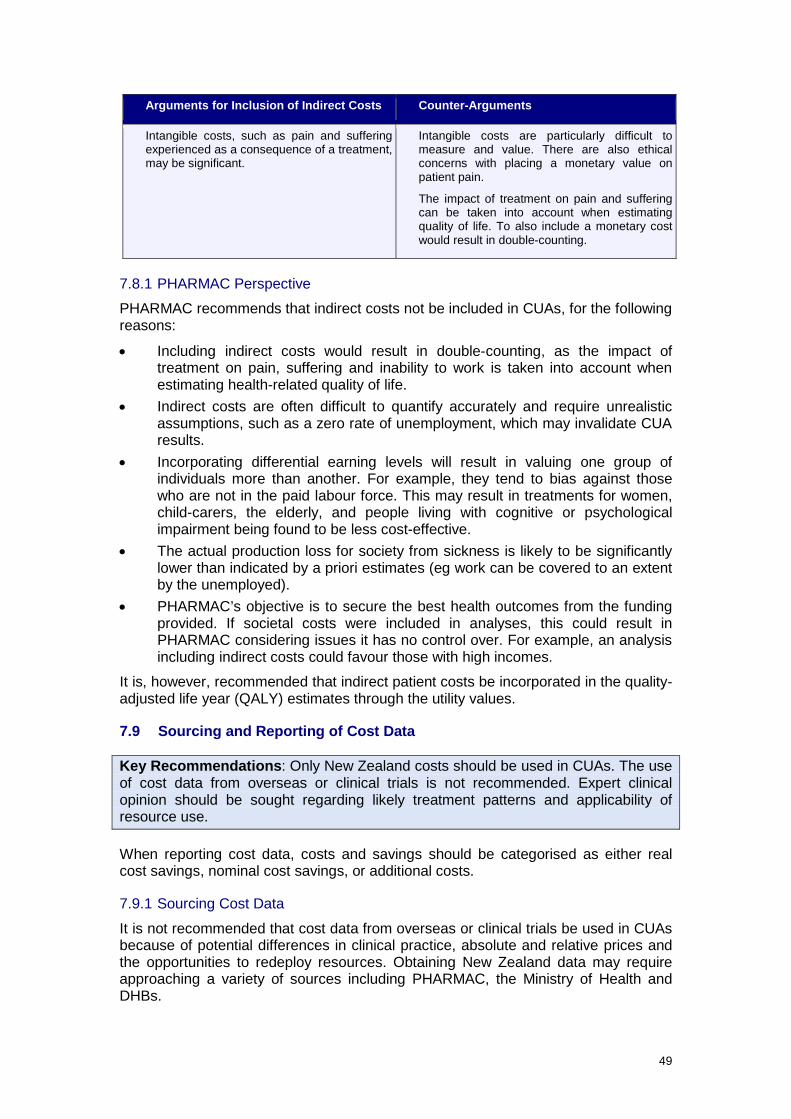
49
Arguments for Inclusion of Indirect Costs Counter-Arguments
Intangible costs, such as pain and suffering experienced as a consequence of a treatment, may be significant.
Intangible costs are particularly difficult to measure and value. There are also ethical concerns with placing a monetary value on patient pain.
The impact of treatment on pain and suffering can be taken into account when estimating quality of life. To also include a monetary cost would result in double-counting.
7.8.1 PHARMAC Perspective
PHARMAC recommends that indirect costs not be included in CUAs, for the following reasons:
• Including indirect costs would result in double-counting, as the impact of treatment on pain, suffering and inability to work is taken into account when estimating health-related quality of life.
• Indirect costs are often difficult to quantify accurately and require unrealistic assumptions, such as a zero rate of unemployment, which may invalidate CUA results.
• Incorporating differential earning levels will result in valuing one group of individuals more than another. For example, they tend to bias against those who are not in the paid labour force. This may result in treatments for women, child-carers, the elderly, and people living with cognitive or psychological impairment being found to be less cost-effective.
• The actual production loss for society from sickness is likely to be significantly lower than indicated by a priori estimates (eg work can be covered to an extent by the unemployed).
• PHARMAC’s objective is to secure the best health outcomes from the funding provided. If societal costs were included in analyses, this could result in PHARMAC considering issues it has no control over. For example, an analysis including indirect costs could favour those with high incomes.
It is, however, recommended that indirect patient costs be incorporated in the quality-adjusted life year (QALY) estimates through the utility values.
7.9 Sourcing and Reporting of Cost Data
Key Recommendations: Only New Zealand costs should be used in CUAs. The use of cost data from overseas or clinical trials is not recommended. Expert clinical opinion should be sought regarding likely treatment patterns and applicability of resource use.
When reporting cost data, costs and savings should be categorised as either real cost savings, nominal cost savings, or additional costs.
7.9.1 Sourcing Cost Data
It is not recommended that cost data from overseas or clinical trials be used in CUAs because of potential differences in clinical practice, absolute and relative prices and the opportunities to redeploy resources. Obtaining New Zealand data may require approaching a variety of sources including PHARMAC, the Ministry of Health and DHBs.
50
Expert clinical opinion should be sought regarding likely treatment patterns and applicability of resource use.
7.9.2 Reporting Cost Data
When reporting cost data, it is recommended that costs and savings be separated into the following categories:
1. Real cost savings (ie cases where the funding of a new pharmaceutical will result in actual cost savings).
2. Nominal cost savings (ie cases where the funding of a new pharmaceutical is likely to result in reducing waiting lists and other non-monetary or non-tradable benefits).
3. Additional costs (ie where the funding of a new pharmaceutical results in additional tests, specialist consultations, hospitalisations, etc).

51
8 Discounting
Key Recommendations: Costs and benefits included in cost-utility analyses (CUAs) should be discounted at a rate of 3.5%. Rates of 0% and 5% should be used in sensitivity analyses.
Discounting is used to compare treatments that have costs and benefits that occur at different times.
The extent to which future benefits and costs are discounted in comparison with the present is reflected in the discount rate. As the discount rate increases, future benefits and costs become less important when compared with benefits and costs occurring in the present.
PHARMAC recommends that both costs and benefits be discounted at the same rate. The rationale is outlined in Appendix 2.
8.1 Approaches to Determining the Discount Rate The appropriate rate of discount is controversial, and no precise gold standard exists. Most countries base their discount rate on the long-term rate of government bonds or a rate recommended by other countries in order to allow comparisons in the results of analyses.
There are six key approaches to determining a discount rate:
• The rate used in other countries. • The social rate of time preference. • The social opportunity cost. • A weighted average social discount rate. • The shadow price of capital. • A ‘bottom-up’ approach.
Each is further discussed in Appendix 2.
8.2 Recommended Discount Rate PHARMAC considers that the social rate of time preference is the most relevant approach for PHARMAC to use when determining the discount rate, as it reflects society preferences. This requires the use of the long-term government bond rate. The following issues also need to be considered.
8.2.1 Should the Risk-Free or Risk-Adjusted Rate Be Used?
The risk-free rate of return is the rate at which the New Zealand Government can borrow (government bond rate). However, some argue that this rate should be adjusted for the risk of the investment and the compensation for covering this risk (eg risk of uncertain future). Others argue that this risk could be taken into account by including higher costs and/or lower benefits in the sensitivity analysis, and that it is inappropriate to use the discount rate to compensate for this risk.
PHARMAC does not incorporate risk into the discount rate for cost-utility analyses. Discounting represents an individual’s time preference and any risk (or future uncertainty) is taken into account elsewhere in the model (eg in the extrapolation of benefits).
52
8.2.2 Should the Discount Rate Be Adjusted for Inflation?
In order to ensure consistency, the use of a real or nominal discount rate should depend on whether costs included in the analysis have been adjusted for inflation. In general it is simpler to adjust the discount rate. As PHARMAC uses real costs, the long-term cost of capital rate should be adjusted for inflation. See Appendix 2 for the appropriate formula to adjust for inflation.
8.2.3 Should Long-Term or Short-Term Government Bond Rates Be Used?
As it is preferable to use a stable long-term government bond rate, the rate used should be long enough to avoid fluctuations (eg five years).
8.2.4 Recommendations
All costs and benefits in CUAs should be discounted at 3.5%. This is based on the five-year average real risk-free long-term government bond rate.
Rates of 0% and 5% must be included (without exception) in sensitivity analyses.
8.3 Discount Rate for Budget Impact Analysis The discount rate above does not apply when undertaking budget impact analysis (BIA), which serves a very different purpose. BIA focuses on the financial aspects of proposals within a limited timeframe (usually 1-5 years) and is used to determine if PHARMAC can afford to fund a treatment given the current budget. Investment decisions are often associated with substantial uncertainty even in the short term – within the next few years pharmaceutical prices may decrease, or PHARMAC’s budget may change. With an uncertain future (and the associated risks), therefore, it is reasonable to use a higher discount rate. This is particularly the case when forecasts indicate that PHARMAC has very tight budget constraints.
Cost-utility analysis differs in that it is not used to make an investment decision, but rather to help determine the relative ranking of pharmaceuticals. Therefore, it is not considered necessary to capture the budget risk in the discount rate. In addition, CUA is not purely a financial analysis, but also involves the quantification of health benefits. In some cases, significant health benefits occur in the far future (eg with childhood immunisation), in which case a lower discount rate ensures that they are valued.
Equally, while CUA evaluates real costs and benefits, BIA focuses on actual (nominal) expenditure. In practice, this would mean that, while the investment ranking would be decided by a discount rate of 3.5%, the impact on the budget would be evaluated using a discount rate of 8%. Assuming that no other factors for consideration were relevant, this method would ensure that the investments that offer the highest health gain within the available funding path would then be funded.
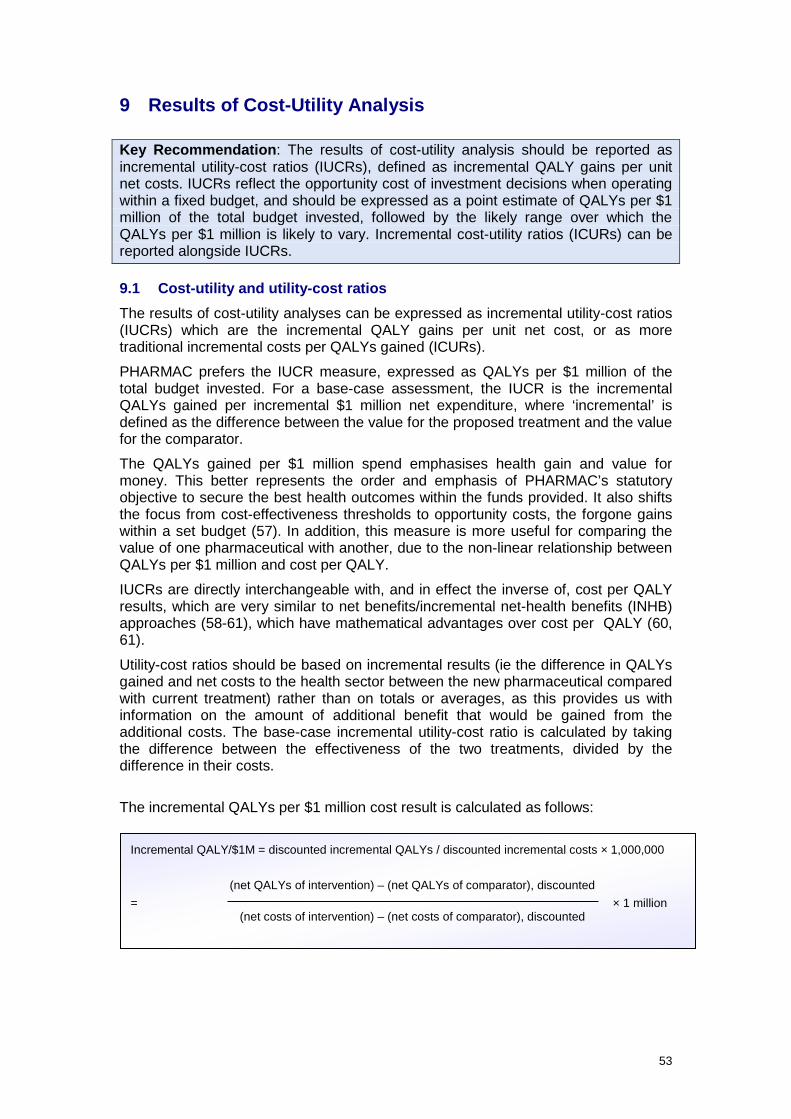
53
9 Results of Cost-Utility Analysis
Key Recommendation: The results of cost-utility analysis should be reported as incremental utility-cost ratios (IUCRs), defined as incremental QALY gains per unit net costs. IUCRs reflect the opportunity cost of investment decisions when operating within a fixed budget, and should be expressed as a point estimate of QALYs per $1 million of the total budget invested, followed by the likely range over which the QALYs per $1 million is likely to vary. Incremental cost-utility ratios (ICURs) can be reported alongside IUCRs.
9.1 Cost-utility and utility-cost ratios The results of cost-utility analyses can be expressed as incremental utility-cost ratios (IUCRs) which are the incremental QALY gains per unit net cost, or as more traditional incremental costs per QALYs gained (ICURs).
PHARMAC prefers the IUCR measure, expressed as QALYs per $1 million of the total budget invested. For a base-case assessment, the IUCR is the incremental QALYs gained per incremental $1 million net expenditure, where ‘incremental’ is defined as the difference between the value for the proposed treatment and the value for the comparator.
The QALYs gained per $1 million spend emphasises health gain and value for money. This better represents the order and emphasis of PHARMAC’s statutory objective to secure the best health outcomes within the funds provided. It also shifts the focus from cost-effectiveness thresholds to opportunity costs, the forgone gains within a set budget (57). In addition, this measure is more useful for comparing the value of one pharmaceutical with another, due to the non-linear relationship between QALYs per $1 million and cost per QALY.
IUCRs are directly interchangeable with, and in effect the inverse of, cost per QALY results, which are very similar to net benefits/incremental net-health benefits (INHB) approaches (58-61), which have mathematical advantages over cost per QALY (60, 61).
Utility-cost ratios should be based on incremental results (ie the difference in QALYs gained and net costs to the health sector between the new pharmaceutical compared with current treatment) rather than on totals or averages, as this provides us with information on the amount of additional benefit that would be gained from the additional costs. The base-case incremental utility-cost ratio is calculated by taking the difference between the effectiveness of the two treatments, divided by the difference in their costs.
The incremental QALYs per $1 million cost result is calculated as follows:
Incremental QALY/$1M = discounted incremental QALYs / discounted incremental costs × 1,000,000 (net QALYs of intervention) – (net QALYs of comparator), discounted = × 1 million
(net costs of intervention) – (net costs of comparator), discounted

54
9.2 Weighting of results from multiple models Cost-utility results can be aggregated across multiple subgroups, such as different indications or different comparators. However, directly weighting the cost-effectiveness estimates for each sub-group is not appropriate. Instead, the aggregate cost-effectiveness should be calculated by separately weighting the average net cost and the weighted average net QALY gain, then dividing one by the other.
9.3 Interpretation of Results The results of a cost-utility analysis fall into one of four categories, defined by the incremental gain in effectiveness E and the incremental change in costs C.(62)
In general if:
∆ E > 0; ∆ C < 0 proposal is dominant: more effective and less costly than comparator
∆ E < 0; ∆ C > 0 proposal is dominated: proposal is less effective and more costly
∆ E < 0; ∆ C < 0 trade-off
∆ E > 0; ∆ C > 0 trade-off
where: ∆ = change; E = effectiveness; C = costs.
In the two cases where the cost-utility ratio is positive, its value can inform choices between the two alternatives.
9.4 Presentation of Results When presenting the results of the analysis, the overall incremental QALYs per $1 million cost result should be reported as a point estimate, followed by a likely range over which the QALYs per cost could vary.
It is important that the key sources of uncertainty that have the greatest impact on the results of the analysis are clearly identified when reporting the QALYs per cost result. For further details on testing for uncertainty in the analysis, please refer to Chapter 10 on sensitivity analysis.
The method traditionally used when calculating and presenting the results of an analysis is ICURs or ICERs, the incremental cost per QALY. This long-established metric was reported by PHARMAC in the past and is still the unit typically reported for most cost-utility analyses internationally. ICURs are in effect the inverse of IUCR results. To make the results easier to read, ICUR results should be reported alongside the IUCR QALYs per $1 million results.
QALY and cost information should be reported as outlined in Table 12. Costs and savings should be reported separately, and estimates should be based on the time horizon of the analysis.
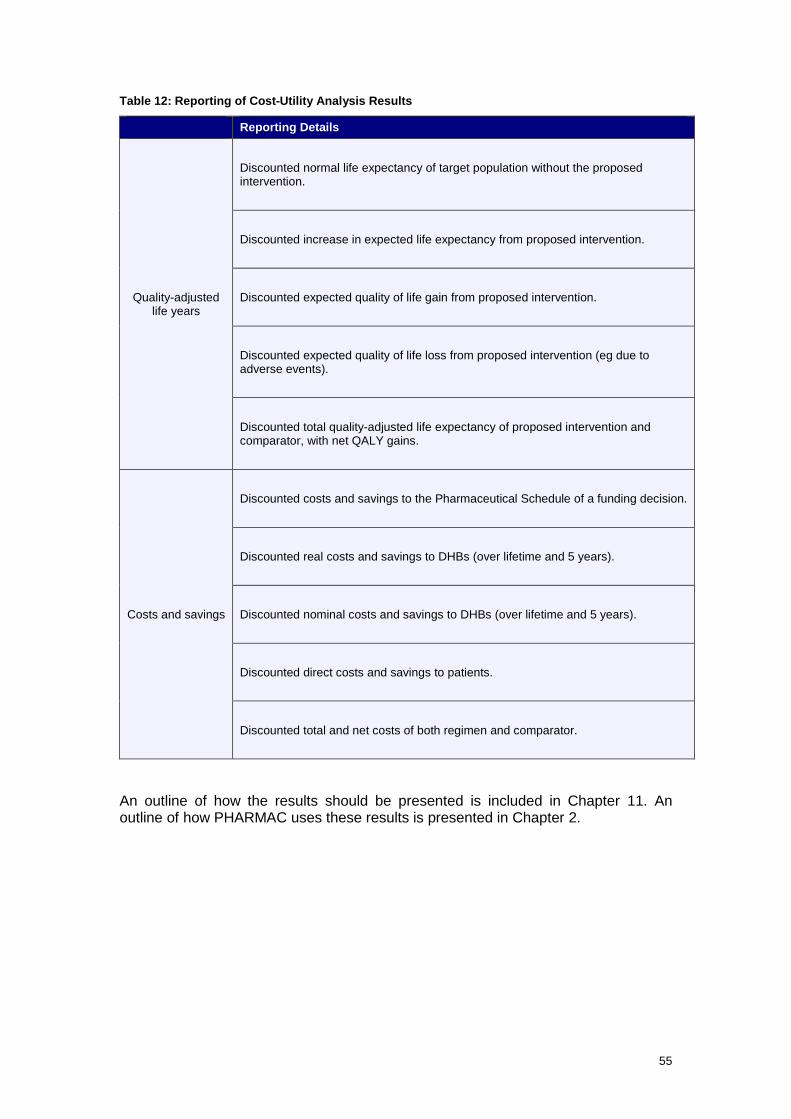
55
Table 12: Reporting of Cost-Utility Analysis Results
Reporting Details
Quality-adjusted life years
Discounted normal life expectancy of target population without the proposed intervention.
Discounted increase in expected life expectancy from proposed intervention.
Discounted expected quality of life gain from proposed intervention.
Discounted expected quality of life loss from proposed intervention (eg due to adverse events).
Discounted total quality-adjusted life expectancy of proposed intervention and comparator, with net QALY gains.
Costs and savings
Discounted costs and savings to the Pharmaceutical Schedule of a funding decision.
Discounted real costs and savings to DHBs (over lifetime and 5 years).
Discounted nominal costs and savings to DHBs (over lifetime and 5 years).
Discounted direct costs and savings to patients.
Discounted total and net costs of both regimen and comparator.
An outline of how the results should be presented is included in Chapter 11. An outline of how PHARMAC uses these results is presented in Chapter 2.
56
10 Sensitivity Analysis
Sensitivity analysis is the process by which the robustness of a cost-utility analysis (CUA) is assessed by examining the changes in the results of the analysis when key variables are varied.
In general, uncertainty can be characterised as either parameter-related or modelling-related.
10.1 Parameter Uncertainty
Key Recommendations: Sensitivity analysis should include univariate (simple) analysis and multivariate analysis. When undertaking detailed analysis, probabilistic sensitivity analysis may be necessary. Any uncertainty in the analysis should be fully tested and described in the report.
The following steps should be undertaken to test the level of uncertainty of a parameter (9, 63):
10.1.1 Identify the Parameters
Parameters to consider include those with the greatest level of uncertainty (eg those derived from opinion), and those with the greatest influence on model outcomes (eg key clinical variables and costs).
10.1.2 Specify the Plausible Range over which the parameters may vary
The range over which parameters should be varied in the sensitivity analyses should be based on the available scientific literature, expert opinions, or a scale that is regarded as plausible.
10.1.3 Calculate Results
The level of sensitivity analysis undertaken should be determined by:
• the impact the results of the analysis could have on the funding decision – if a pharmaceutical is considered to be relatively cost-effective compared with other funding options, but is sensitive to several parameters, more extensive sensitivity analysis should be undertaken than for a pharmaceutical considered likely not to be relatively cost-effective
• certainty in inputs – if there is significant uncertainty in inputs, for example if surrogate endpoints are used or long-term extrapolation of data is required, more extensive testing needs to be undertaken
• quality of clinical trials – if the clinical inputs in the analysis were based on trials with a low grade of evidence (eg open-label, high risk of bias, allowed crossover of treatments), more extensive testing should be undertaken
• risk – further testing is required for high-expenditure pharmaceuticals due to the higher opportunity cost of funding
• results of sensitivity analysis – if the initial results of a sensitivity analysis indicate some uncertainty in inputs, further testing should be undertaken
• level of analysis – rapid CUAs are often based on a number of assumptions that require extensive testing.
PHARMAC recommends considering the approaches described in the table below when undertaking sensitivity analysis (64-66).
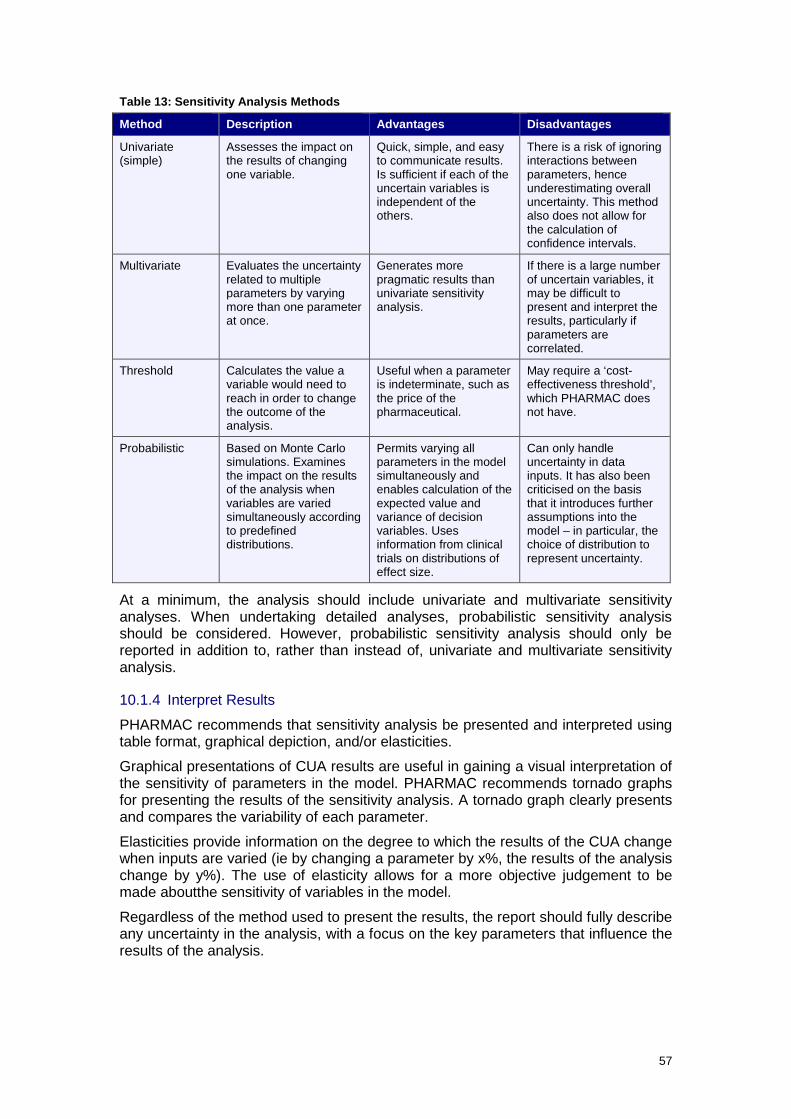
57
Table 13: Sensitivity Analysis Methods
Method Description Advantages Disadvantages
Univariate (simple)
Assesses the impact on the results of changing one variable.
Quick, simple, and easy to communicate results. Is sufficient if each of the uncertain variables is independent of the others.
There is a risk of ignoring interactions between parameters, hence underestimating overall uncertainty. This method also does not allow for the calculation of confidence intervals.
Multivariate Evaluates the uncertainty related to multiple parameters by varying more than one parameter at once.
Generates more pragmatic results than univariate sensitivity analysis.
If there is a large number of uncertain variables, it may be difficult to present and interpret the results, particularly if parameters are correlated.
Threshold Calculates the value a variable would need to reach in order to change the outcome of the analysis.
Useful when a parameter is indeterminate, such as the price of the pharmaceutical.
May require a ‘cost-effectiveness threshold’, which PHARMAC does not have.
Probabilistic Based on Monte Carlo simulations. Examines the impact on the results of the analysis when variables are varied simultaneously according to predefined distributions.
Permits varying all parameters in the model simultaneously and enables calculation of the expected value and variance of decision variables. Uses information from clinical trials on distributions of effect size.
Can only handle uncertainty in data inputs. It has also been criticised on the basis that it introduces further assumptions into the model – in particular, the choice of distribution to represent uncertainty.
At a minimum, the analysis should include univariate and multivariate sensitivity analyses. When undertaking detailed analyses, probabilistic sensitivity analysis should be considered. However, probabilistic sensitivity analysis should only be reported in addition to, rather than instead of, univariate and multivariate sensitivity analysis.
10.1.4 Interpret Results
PHARMAC recommends that sensitivity analysis be presented and interpreted using table format, graphical depiction, and/or elasticities.
Graphical presentations of CUA results are useful in gaining a visual interpretation of the sensitivity of parameters in the model. PHARMAC recommends tornado graphs for presenting the results of the sensitivity analysis. A tornado graph clearly presents and compares the variability of each parameter.
Elasticities provide information on the degree to which the results of the CUA change when inputs are varied (ie by changing a parameter by x%, the results of the analysis change by y%). The use of elasticity allows for a more objective judgement to be made aboutthe sensitivity of variables in the model.
Regardless of the method used to present the results, the report should fully describe any uncertainty in the analysis, with a focus on the key parameters that influence the results of the analysis.

58
10.2 Model Structure Uncertainty Modelling-related uncertainty is uncertainty that depends on the chosen structure of the model, or is related to the overall process for modelling. Model uncertainty can be tested by running different analyses using alternative model structures, and reviewing the appropriateness of the results (9, 67).
Modelling-related uncertainty includes (9, 67):
• choice of functional forms for extrapolating outcomes (eg constant benefits, linear extrapolation, etc)
• choice of health states.
It is recommended that structural uncertainty be formally examined in sensitivity analysis. When testing the model, PHARMAC recommends using extreme sensitivity analysis to verify that the model generates logical results.
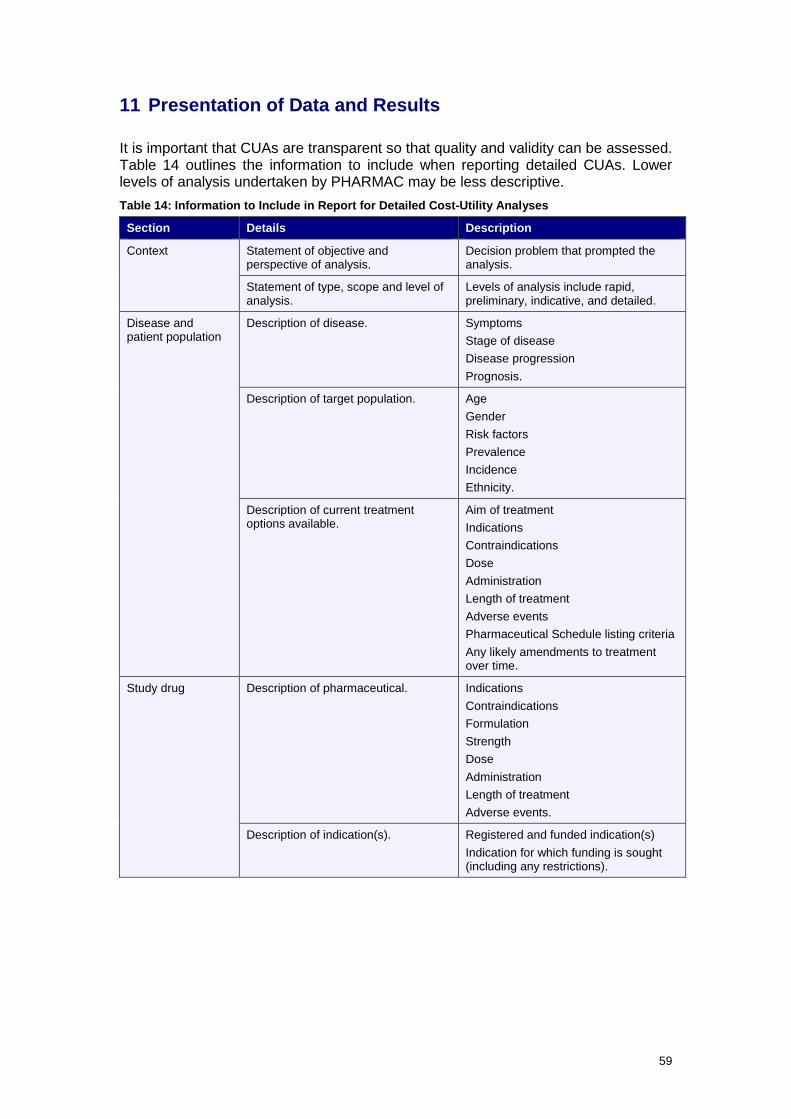
59
11 Presentation of Data and Results
It is important that CUAs are transparent so that quality and validity can be assessed. Table 14 outlines the information to include when reporting detailed CUAs. Lower levels of analysis undertaken by PHARMAC may be less descriptive. Table 14: Information to Include in Report for Detailed Cost-Utility Analyses
Section Details Description
Context Statement of objective and perspective of analysis.
Decision problem that prompted the analysis.
Statement of type, scope and level of analysis.
Levels of analysis include rapid, preliminary, indicative, and detailed.
Disease and patient population
Description of disease.
Symptoms Stage of disease Disease progression Prognosis.
Description of target population. Age Gender Risk factors Prevalence Incidence Ethnicity.
Description of current treatment options available.
Aim of treatment Indications Contraindications Dose Administration Length of treatment Adverse events Pharmaceutical Schedule listing criteria Any likely amendments to treatment over time.
Study drug Description of pharmaceutical. Indications Contraindications Formulation Strength Dose Administration Length of treatment Adverse events.
Description of indication(s). Registered and funded indication(s) Indication for which funding is sought (including any restrictions).
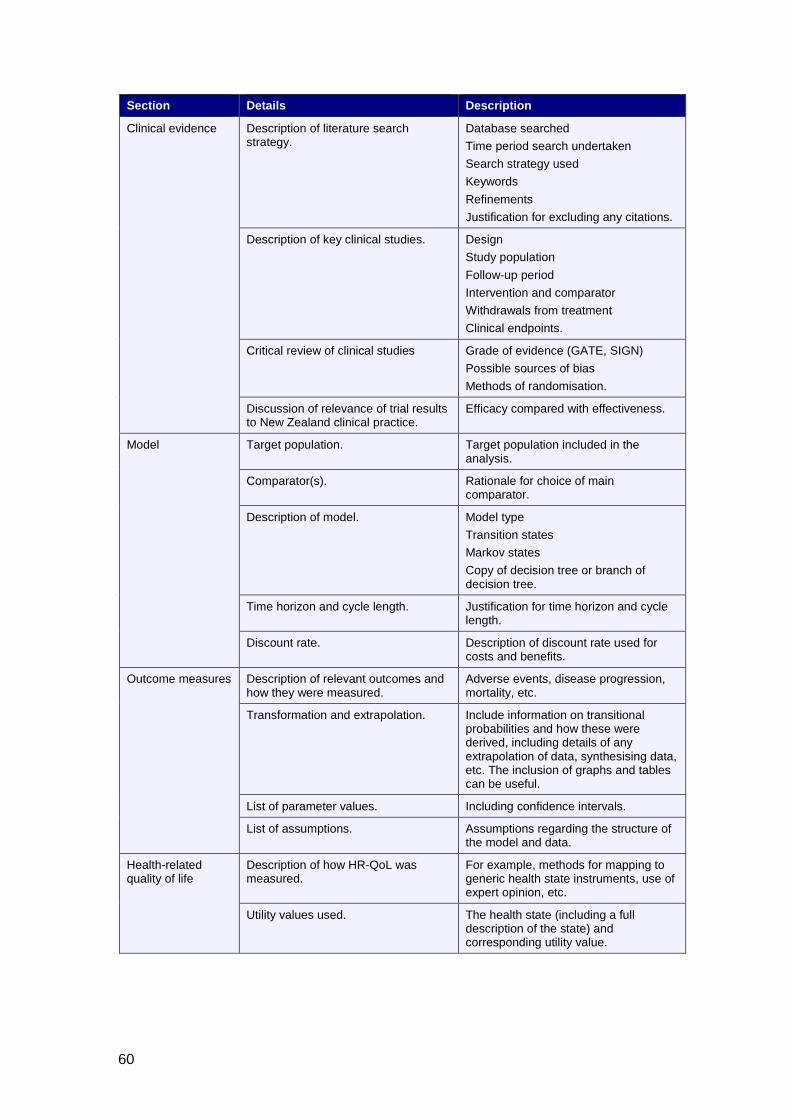
60
Section Details Description
Clinical evidence Description of literature search strategy.
Database searched Time period search undertaken Search strategy used Keywords Refinements Justification for excluding any citations.
Description of key clinical studies. Design Study population Follow-up period Intervention and comparator Withdrawals from treatment Clinical endpoints.
Critical review of clinical studies Grade of evidence (GATE, SIGN) Possible sources of bias Methods of randomisation.
Discussion of relevance of trial results to New Zealand clinical practice.
Efficacy compared with effectiveness.
Model Target population. Target population included in the analysis.
Comparator(s). Rationale for choice of main comparator.
Description of model. Model type Transition states Markov states Copy of decision tree or branch of decision tree.
Time horizon and cycle length. Justification for time horizon and cycle length.
Discount rate. Description of discount rate used for costs and benefits.
Outcome measures Description of relevant outcomes and how they were measured.
Adverse events, disease progression, mortality, etc.
Transformation and extrapolation. Include information on transitional probabilities and how these were derived, including details of any extrapolation of data, synthesising data, etc. The inclusion of graphs and tables can be useful.
List of parameter values. Including confidence intervals.
List of assumptions. Assumptions regarding the structure of the model and data.
Health-related quality of life
Description of how HR-QoL was measured.
For example, methods for mapping to generic health state instruments, use of expert opinion, etc.
Utility values used. The health state (including a full description of the state) and corresponding utility value.
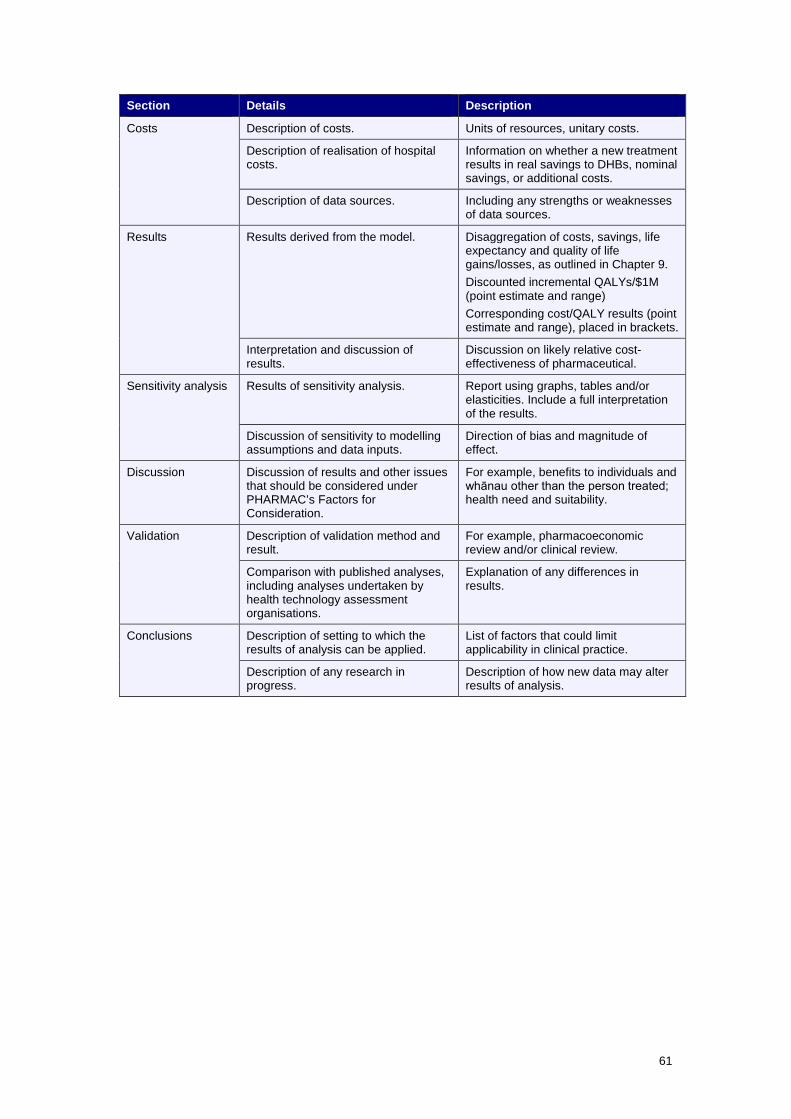
61
Section Details Description
Costs Description of costs. Units of resources, unitary costs.
Description of realisation of hospital costs.
Information on whether a new treatment results in real savings to DHBs, nominal savings, or additional costs.
Description of data sources. Including any strengths or weaknesses of data sources.
Results Results derived from the model. Disaggregation of costs, savings, life expectancy and quality of life gains/losses, as outlined in Chapter 9. Discounted incremental QALYs/$1M (point estimate and range) Corresponding cost/QALY results (point estimate and range), placed in brackets.
Interpretation and discussion of results.
Discussion on likely relative cost-effectiveness of pharmaceutical.
Sensitivity analysis Results of sensitivity analysis. Report using graphs, tables and/or elasticities. Include a full interpretation of the results.
Discussion of sensitivity to modelling assumptions and data inputs.
Direction of bias and magnitude of effect.
Discussion Discussion of results and other issues that should be considered under PHARMAC’s Factors for Consideration.
For example, benefits to individuals and whānau other than the person treated; health need and suitability.
Validation Description of validation method and result.
For example, pharmacoeconomic review and/or clinical review.
Comparison with published analyses, including analyses undertaken by health technology assessment organisations.
Explanation of any differences in results.
Conclusions Description of setting to which the results of analysis can be applied.
List of factors that could limit applicability in clinical practice.
Description of any research in progress.
Description of how new data may alter results of analysis.

62
11.1 Checklist Table 15 is a checklist of information to include in PHARMAC base-case analyses and sensitivity analyses. Table 15: Checklist of Information to Include in Base-Case Analyses and Sensitivity Analyses
Section Base-Case Analysis Sensitivity Analysis
Perspective
Funder (health sector) and individual, taking into account PHARMAC’s Factors for Consideration.
Perspectives that include costs and health benefits to others, and costs falling outside the health sector.
Target population
Population most likely to receive treatment.
May consider inclusion of retrospective subgroup analyses if these data were of inadequate quality to include in base-case analysis.
Comparator
Current clinical practice in New Zealand.
May consider inclusion of placebo and/or most effective treatment (if different from current clinical practice).
Clinical outcomes
Statistically and clinically significant outcomes obtained from high-quality RCTs, systematic reviews or meta-analyses (grade of evidence of 1+ or 1++). Include impact of non-compliance if significant.
Include statistically insignificant outcomes. May consider impact of including additional sources of clinical evidence (eg unpublished trials). Test all modelling assumptions, including any extrapolation of data.
HR-QoL
Base of NZ EQ-5D Tariff 2. Use GBD weights to check for consistency.
Alternative sources of utility values.
Pharmaceutical costs
Proposed price of pharmaceutical.
Deflate price by 2% per year as a proxy for inflation in other costs.
Other costs
Hospital, outpatient and patient costs.
Vary costs over likely ranges.
Discount rate
3.5%
0% and 5%
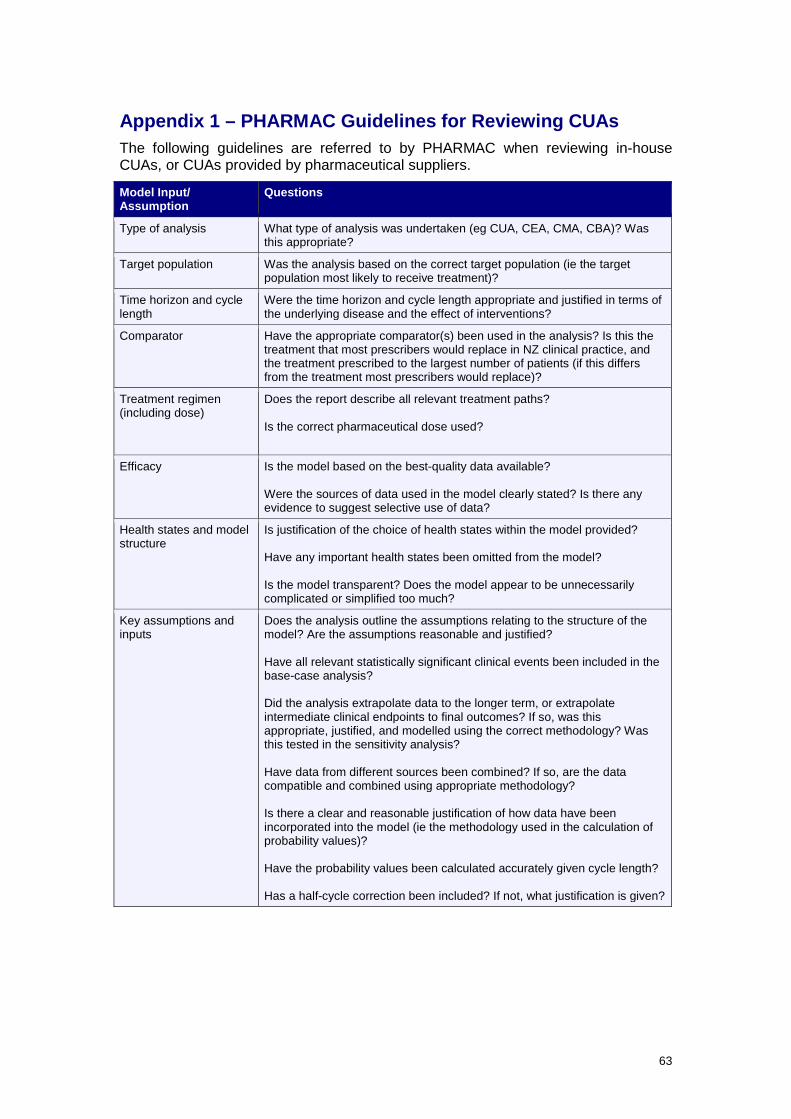
63
Appendix 1 – PHARMAC Guidelines for Reviewing CUAs The following guidelines are referred to by PHARMAC when reviewing in-house CUAs, or CUAs provided by pharmaceutical suppliers.
Model Input/ Assumption
Questions
Type of analysis What type of analysis was undertaken (eg CUA, CEA, CMA, CBA)? Was this appropriate?
Target population Was the analysis based on the correct target population (ie the target population most likely to receive treatment)?
Time horizon and cycle length
Were the time horizon and cycle length appropriate and justified in terms of the underlying disease and the effect of interventions?
Comparator Have the appropriate comparator(s) been used in the analysis? Is this the treatment that most prescribers would replace in NZ clinical practice, and the treatment prescribed to the largest number of patients (if this differs from the treatment most prescribers would replace)?
Treatment regimen (including dose)
Does the report describe all relevant treatment paths? Is the correct pharmaceutical dose used?
Efficacy Is the model based on the best-quality data available? Were the sources of data used in the model clearly stated? Is there any evidence to suggest selective use of data?
Health states and model structure
Is justification of the choice of health states within the model provided? Have any important health states been omitted from the model? Is the model transparent? Does the model appear to be unnecessarily complicated or simplified too much?
Key assumptions and inputs
Does the analysis outline the assumptions relating to the structure of the model? Are the assumptions reasonable and justified? Have all relevant statistically significant clinical events been included in the base-case analysis? Did the analysis extrapolate data to the longer term, or extrapolate intermediate clinical endpoints to final outcomes? If so, was this appropriate, justified, and modelled using the correct methodology? Was this tested in the sensitivity analysis? Have data from different sources been combined? If so, are the data compatible and combined using appropriate methodology? Is there a clear and reasonable justification of how data have been incorporated into the model (ie the methodology used in the calculation of probability values)? Have the probability values been calculated accurately given cycle length? Has a half-cycle correction been included? If not, what justification is given?

64
Model Input/ Assumption
Questions
Quality of life How was quality of life measured? Was this method justified? If subjective values were used, were these validated and tested in the sensitivity analysis? Were the estimated utility values reasonable? Were utility values adjusted for cycle length? Were utility values discounted?
Pharmaceutical cost Were pharmaceutical costs calculated correctly? Were there any rebates that have not been included? Is a generic pharmaceutical likely to become available in the near future? What dose was used in the cost calculations and where was this information sourced? (Note that the dose should be based on the dose used in the key clinical trials unless there is evidence of efficacy for different doses in clinical practice.) Are there likely to be dose adjustments over time? If relevant, was the correct bodyweight used in the calculation of pharmaceutical cost? Were dispensing fees included?
Non-pharmaceutical cost How is the pharmaceutical administered? Have all costs associated with administration been taken into account? Have hospital costs been calculated correctly using NZ DRG cost weights? Were these volume-adjusted? Are you aware of any costs that appear to be inaccurate? Have any important and relevant costs been excluded? Were costs discounted?
Discount rate Was the correct discount rate used?
Results Was the cost per QALY reported as a range as well as a point estimate? Were there any important factors that have been excluded from the analysis that could have an impact on the results? In your opinion, are the conclusions of the analysis justified?
Sensitivity analysis Were all key inputs and assumptions varied in the sensitivity analysis? Were the range and choice of variables used in the sensitivity analysis justified? Were the results of the sensitivity analysis interpreted correctly?
Report Did the report list any factors that could limit the applicability of the results (eg differences in patient population)? How could the analysis be improved? Describe the overall quality of the report.

65
Appendix 2 – Discounting
Discounting Costs and Benefits at the Same Rate PHARMAC recommends that both costs and benefits be discounted at the same rate, for the following reasons:
• Health and money can be exchanged at the margin at a rate that remains constant over time. If different rates are used for costs and benefits, inconsistencies may appear over time in the relativity of money and health.
• If benefits are discounted at a lower rate than costs, future programmes always look better (high benefit, low cost) than current programmes, and the cost-effectiveness ratio will always improve on delay (as the cost numerator decreases more quickly than the benefit denominator).
• Individuals can only be treated equally over time if the same discount rate is used for benefits and costs. If health benefits are not discounted, benefits for future patients would be considered better.
• If a lower rate was used for benefits compared with costs, a treatment with high annual payments but minimal benefits per year would appear highly cost-effective because costs are discounted more broadly than future benefits.
Approaches to Determining the Discount Rate
Discount Rate used in Other Countries Some argue that the discount rate used in New Zealand should be more consistent with that used in other countries. However, there are several reasons why this argument does not hold.
• New Zealand’s economic performance is not identical to other economies. Hence the use of an international discount rate may not reflect societal or individual preferences in New Zealand.
• Economic analyses cannot be directly transferred and compared between countries.
• The risk-free bond rate and resources available in New Zealand are not identical to those in other countries.
Social Rate of Time Preference
The social rate of time preference is the rate at which society is willing to exchange present for future consumption.
It is frequently argued that the after-tax interest rate of a risk-free investment (eg long-term government bonds) represents an individual investor’s willingness to forgo present consumption for the future, and that this rate reflects the individual’s rate of time preference. Then if society’s collective rate of time preference is an aggregate of individual rates, the required rate is given by the rate of return on long-term government bonds.
Social Opportunity Cost Rate
The social opportunity cost rate of discount is the real rate of return forgone in the private sector (ie the cost in financial market terms if government projects were undertaken in the private sector). The basic notion behind this is that public investments can displace or crowd out private investments or consumption. This can

66
be estimated using a number of different models which aim to work out what the market would expect to receive for a particular project. However, it is likely that the discount rate in the public sector is lower than that in the private sector. (If it was not, there would be no need for government provision of health care, and private health insurance markets would be more dominant.)
Weighted Average Social Discount Rates
The social discount rate is a weighted average of the social rate of time preference and social opportunity cost rate, hence reflecting both the loss in private investment and the costs of forgone consumption. This is based on the risk-free rate of capital, a market risk premium, and an adjustment for risk.
Shadow Price of Capital
The shadow price of capital seeks to establish the loss to society that occurs when a dollar that would otherwise have gone to private investment is displaced. This is based on the principle that the ultimate purpose of investment is consumption; hence, if money is not spent on new pharmaceuticals, the funds would remain in the economy for private consumption or investment.
Funds that would otherwise have been used for consumption are discounted at the consumption (or market) rate of interest – the rate at which individuals are willing to exchange present for future consumption. As consumer preferences should dictate government policy, the consumption (or market) rate should equal the social rate of time preference (68, 69).
‘Bottom-Up’ Approach
In the ‘bottom-up’ approach, it is assumed that government spending should finance projects with the highest rate of return first and then in order of return rankings. Therefore, the opportunity cost is the rate of return of the last project funded (ie rate of return of the marginal project). Problems with this approach relate to the problems with Internal Rate of Return (IRR) calculations, and the level at which government spending is scrutinised.
Formula to adjust nominal discount rate for inflation
Real cost of capital = [(1+nominal rate) / (1+inflation)] – 1
This can be approximated as the nominal rate minus inflation.
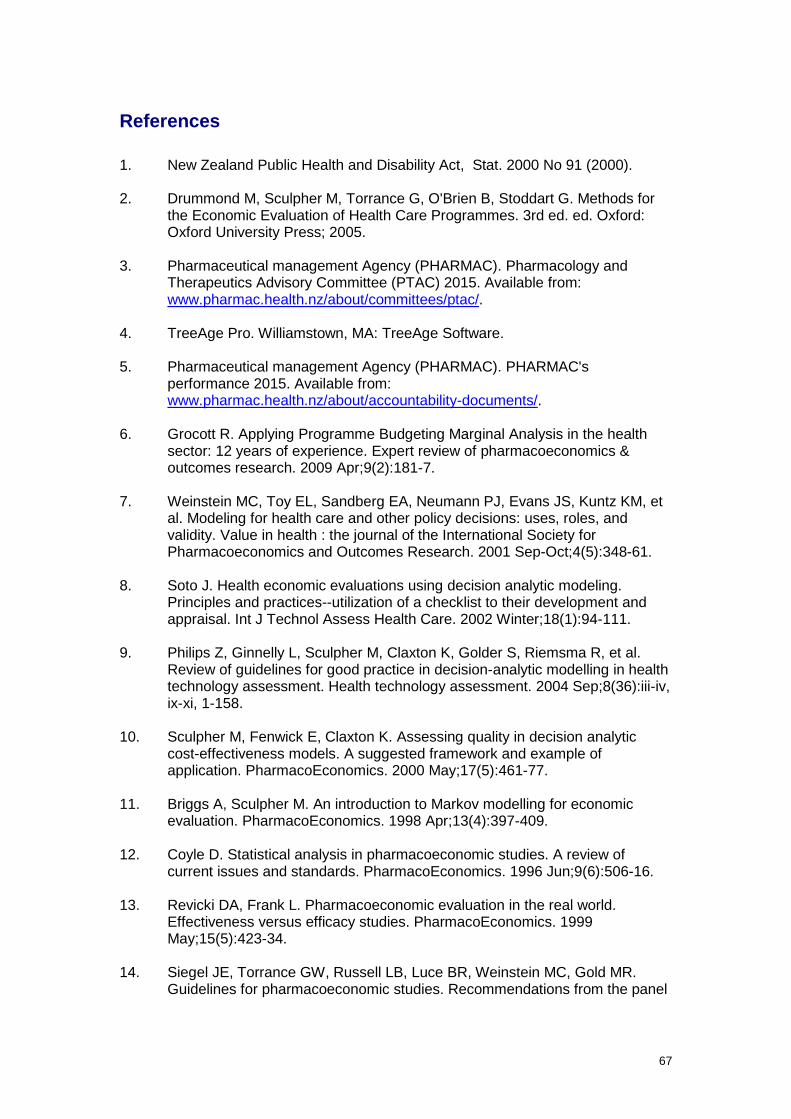
67
References 1. New Zealand Public Health and Disability Act, Stat. 2000 No 91 (2000). 2. Drummond M, Sculpher M, Torrance G, O'Brien B, Stoddart G. Methods for
the Economic Evaluation of Health Care Programmes. 3rd ed. ed. Oxford: Oxford University Press; 2005.
3. Pharmaceutical management Agency (PHARMAC). Pharmacology and
Therapeutics Advisory Committee (PTAC) 2015. Available from: www.pharmac.health.nz/about/committees/ptac/.
4. TreeAge Pro. Williamstown, MA: TreeAge Software. 5. Pharmaceutical management Agency (PHARMAC). PHARMAC's
performance 2015. Available from: www.pharmac.health.nz/about/accountability-documents/.
6. Grocott R. Applying Programme Budgeting Marginal Analysis in the health
sector: 12 years of experience. Expert review of pharmacoeconomics & outcomes research. 2009 Apr;9(2):181-7.
7. Weinstein MC, Toy EL, Sandberg EA, Neumann PJ, Evans JS, Kuntz KM, et
al. Modeling for health care and other policy decisions: uses, roles, and validity. Value in health : the journal of the International Society for Pharmacoeconomics and Outcomes Research. 2001 Sep-Oct;4(5):348-61.
8. Soto J. Health economic evaluations using decision analytic modeling.
Principles and practices--utilization of a checklist to their development and appraisal. Int J Technol Assess Health Care. 2002 Winter;18(1):94-111.
9. Philips Z, Ginnelly L, Sculpher M, Claxton K, Golder S, Riemsma R, et al.
Review of guidelines for good practice in decision-analytic modelling in health technology assessment. Health technology assessment. 2004 Sep;8(36):iii-iv, ix-xi, 1-158.
10. Sculpher M, Fenwick E, Claxton K. Assessing quality in decision analytic
cost-effectiveness models. A suggested framework and example of application. PharmacoEconomics. 2000 May;17(5):461-77.
11. Briggs A, Sculpher M. An introduction to Markov modelling for economic
evaluation. PharmacoEconomics. 1998 Apr;13(4):397-409. 12. Coyle D. Statistical analysis in pharmacoeconomic studies. A review of
current issues and standards. PharmacoEconomics. 1996 Jun;9(6):506-16. 13. Revicki DA, Frank L. Pharmacoeconomic evaluation in the real world.
Effectiveness versus efficacy studies. PharmacoEconomics. 1999 May;15(5):423-34.
14. Siegel JE, Torrance GW, Russell LB, Luce BR, Weinstein MC, Gold MR.
Guidelines for pharmacoeconomic studies. Recommendations from the panel
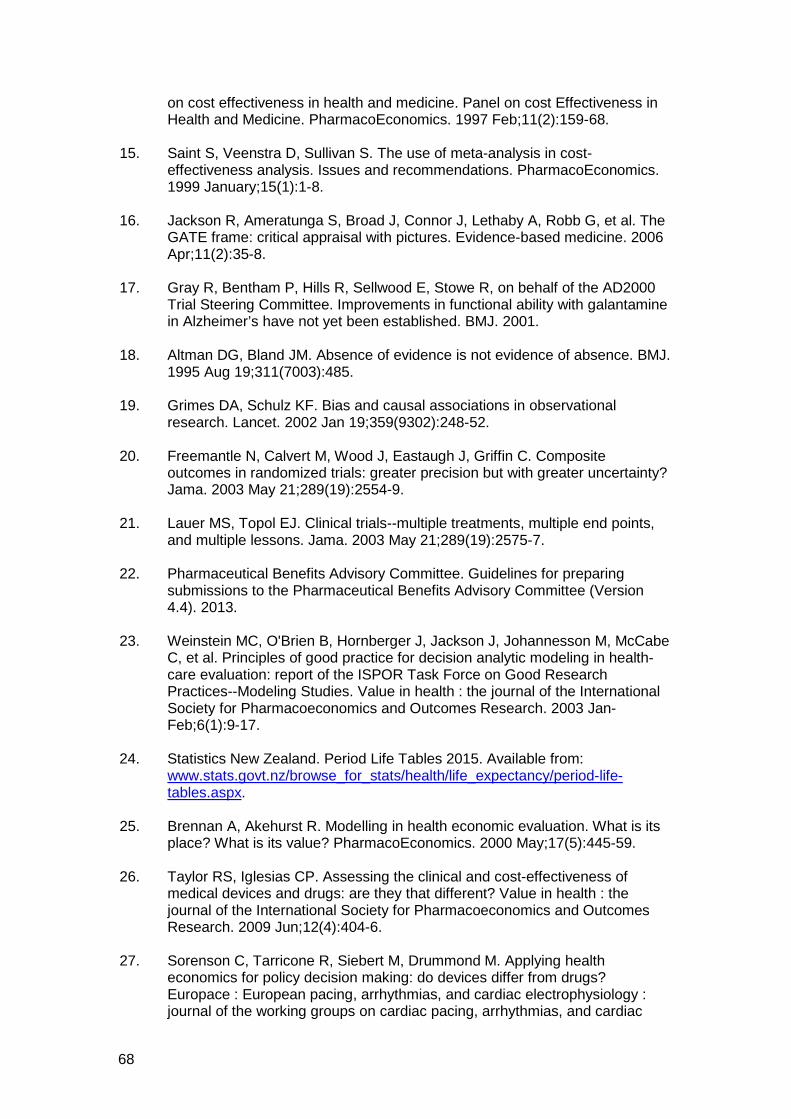
68
on cost effectiveness in health and medicine. Panel on cost Effectiveness in Health and Medicine. PharmacoEconomics. 1997 Feb;11(2):159-68.
15. Saint S, Veenstra D, Sullivan S. The use of meta-analysis in cost-
effectiveness analysis. Issues and recommendations. PharmacoEconomics. 1999 January;15(1):1-8.
16. Jackson R, Ameratunga S, Broad J, Connor J, Lethaby A, Robb G, et al. The
GATE frame: critical appraisal with pictures. Evidence-based medicine. 2006 Apr;11(2):35-8.
17. Gray R, Bentham P, Hills R, Sellwood E, Stowe R, on behalf of the AD2000
Trial Steering Committee. Improvements in functional ability with galantamine in Alzheimer’s have not yet been established. BMJ. 2001.
18. Altman DG, Bland JM. Absence of evidence is not evidence of absence. BMJ.
1995 Aug 19;311(7003):485. 19. Grimes DA, Schulz KF. Bias and causal associations in observational
research. Lancet. 2002 Jan 19;359(9302):248-52. 20. Freemantle N, Calvert M, Wood J, Eastaugh J, Griffin C. Composite
outcomes in randomized trials: greater precision but with greater uncertainty? Jama. 2003 May 21;289(19):2554-9.
21. Lauer MS, Topol EJ. Clinical trials--multiple treatments, multiple end points,
and multiple lessons. Jama. 2003 May 21;289(19):2575-7. 22. Pharmaceutical Benefits Advisory Committee. Guidelines for preparing
submissions to the Pharmaceutical Benefits Advisory Committee (Version 4.4). 2013.
23. Weinstein MC, O'Brien B, Hornberger J, Jackson J, Johannesson M, McCabe
C, et al. Principles of good practice for decision analytic modeling in health-care evaluation: report of the ISPOR Task Force on Good Research Practices--Modeling Studies. Value in health : the journal of the International Society for Pharmacoeconomics and Outcomes Research. 2003 Jan-Feb;6(1):9-17.
24. Statistics New Zealand. Period Life Tables 2015. Available from:
www.stats.govt.nz/browse_for_stats/health/life_expectancy/period-life-tables.aspx.
25. Brennan A, Akehurst R. Modelling in health economic evaluation. What is its
place? What is its value? PharmacoEconomics. 2000 May;17(5):445-59. 26. Taylor RS, Iglesias CP. Assessing the clinical and cost-effectiveness of
medical devices and drugs: are they that different? Value in health : the journal of the International Society for Pharmacoeconomics and Outcomes Research. 2009 Jun;12(4):404-6.
27. Sorenson C, Tarricone R, Siebert M, Drummond M. Applying health
economics for policy decision making: do devices differ from drugs? Europace : European pacing, arrhythmias, and cardiac electrophysiology : journal of the working groups on cardiac pacing, arrhythmias, and cardiac

69
cellular electrophysiology of the European Society of Cardiology. 2011 May;13 Suppl 2:ii54-8.
28. Drummond M, Griffin A, Tarricone R. Economic evaluation for devices and
drugs--same or different? Value in health : the journal of the International Society for Pharmacoeconomics and Outcomes Research. 2009 Jun;12(4):402-4.
29. Buxton MJ, Drummond MF, Van Hout BA, Prince RL, Sheldon TA, Szucs T,
et al. Modelling in economic evaluation: an unavoidable fact of life. Health economics. 1997 May-Jun;6(3):217-27.
30. Glenny AM, Altman DG, Song F, Sakarovitch C, Deeks JJ, D'Amico R, et al.
Indirect comparisons of competing interventions. Health technology assessment. 2005 Jul;9(26):1-134, iii-iv.
31. Wells G, Sultan S, Chen L, Khan M, Coyle D. Indirect evidence: indirect
treatment comparisons in meta-analysis. In: Health CAfDaTi, editor. Ottawa2009.
32. Cook DI, Gebski VJ, Keech AC. Subgroup analysis in clinical trials. The
Medical journal of Australia. 2004 Mar 15;180(6):289-91. 33. Schulz K, Grimes D. Multiplicity in randomised trials II: subgroup and interim
analyses. The Lancet. 2005;365(9471):1657-61. 34. Altman DG, Bland JM. Interaction revisited: the difference between two
estimates. BMJ. 2003 Jan 25;326(7382):219. 35. Higgins JP, Thompson SG, Deeks JJ, Altman DG. Measuring inconsistency in
meta-analyses. BMJ. 2003 Sep 6;327(7414):557-60. 36. Freemantle N. Interpreting the results of secondary end points and subgroup
analyses in clinical trials: should we lock the crazy aunt in the attic? BMJ. 2001 Apr 21;322(7292):989-91.
37. World Health Organization. WHO guide for standardisation of economic
evaluations of immunisation programmes. 2008. 38. Drummond M, Chevat C, Lothgren M. Do we fully understand the economic
value of vaccines? Vaccine. 2007 Aug 10;25(32):5945-57. 39. Beutels P, Van Doorslaer E, Van Damme P, Hall J. Methodological issues
and new developments in the economic evaluation of vaccines. Expert review of vaccines. 2003 Oct;2(5):649-60.
40. Kim SY, Goldie SJ. Cost-effectiveness analyses of vaccination programmes :
a focused review of modelling approaches. PharmacoEconomics. 2008;26(3):191-215.
41. Beutels P, Edmunds WJ, Antonanzas F, De Wit GA, Evans D, Feilden R, et
al. Economic evaluation of vaccination programmes: a consensus statement focusing on viral hepatitis. PharmacoEconomics. 2002;20(1):1-7.
70
42. Sonnenberg FA, Beck JR. Markov models in medical decision making: a practical guide. Medical decision making : an international journal of the Society for Medical Decision Making. 1993 Oct-Dec;13(4):322-38.
43. World Health Organization. Constitution of the World Health Organization.
World Health Organization Handbook of basic documents. 5th ed ed. Geneva: Palais des Nations; 1952.
44. Nord E. A review of synthetic health indicators. Background paper prepared
for the OECD Directorate for Education, Employment, Labour, and Social Affairs. In: OECD Directorate for Education E, Labour, and Social Affairs, editor. 1997.
45. Coons SJ, Rao S, Keininger DL, Hays RD. A comparative review of generic
quality-of-life instruments. PharmacoEconomics. 2000 Jan;17(1):13-35. 46. Devlin NJ, Hansen P, Kind P, Williams A. Logical inconsistencies in survey
respondents' health state valuations -- a methodological challenge for estimating social tariffs. Health economics. 2003 Jul;12(7):529-44.
47. Lamers LM, McDonnell J, Stalmeier PF, Krabbe PF, Busschbach JJ. The
Dutch tariff: results and arguments for an effective design for national EQ-5D valuation studies. Health economics. 2006 Oct;15(10):1121-32.
48. Patrick DL, Starks HE, Cain KC, Uhlmann RF, Pearlman RA. Measuring
preferences for health states worse than death. Medical decision making : an international journal of the Society for Medical Decision Making. 1994 Jan-Mar;14(1):9-18.
49. Perkins MR, Devlin NJ, Hansen P. The validity and reliability of EQ-5D health
state valuations in a survey of Maori. Quality of life research : an international journal of quality of life aspects of treatment, care and rehabilitation. 2004 Feb;13(1):271-4.
50. Khanna D, Tsevat J. Health-related quality of life--an introduction. The
American journal of managed care. 2007 Dec;13 Suppl 9:S218-23. 51. Murray C. Rethinking DALYs. The global burden of disease A
comprehensive assessment of mortality and disability from diseases, injuries, and risk factors in 1990 and projected to 2020: Harvard School of Public Health, on behalf of the World Health Organisation and the World Bank; 1996.
52. Salomon JA, Vos T, Hogan DR, Gagnon M, Naghavi M, Mokdad A, et al.
Common values in assessing health outcomes from disease and injury: disability weights measurement study for the Global Burden of Disease Study 2010. Lancet. 2012 Dec 15;380(9859):2129-43.
53. Pharmaceutical Management Agency (PHARMAC). Pharmaceutical Schedule
2015. Available from: www.pharmac.health.nz/tools-resources/pharmaceutical-schedule/.
54. New Zealand Ministry of Health. New Zealand Health Survey: Annual update
of key findings 2012/13. In: Health Mo, editor. Wellington: Ministry of Health; 2013.
71
55. New Zealand Ministry of Health. New Zealand Health Statistics 2014. Available from: www.health.govt.nz/nz-health-statistics.
56. Xie F, Thumboo J, Fong KY, Lo NN, Yeo SJ, Yang KY, et al. A study on
indirect and intangible costs for patients with knee osteoarthritis in Singapore. Value in health : the journal of the International Society for Pharmacoeconomics and Outcomes Research. 2008 Mar;11 Suppl 1:S84-90.
57. Metcalfe S, Grocott R. Comments on "Simoens, S. Health economic
assessment: a methodological primer. Int. J. Environ. Res. Public Health 2009, 6, 2950-2966"-New Zealand in fact has no cost-effectiveness threshold. International journal of environmental research and public health. 2010 Apr;7(4):1831-4.
58. Stinnett AA, Mullahy J. Net health benefits: a new framework for the analysis
of uncertainty in cost-effectiveness analysis. Medical decision making : an international journal of the Society for Medical Decision Making. 1998 Apr-Jun;18(2 Suppl):S68-80.
59. Lynd L. Quantitative Methods for Therapeutic Risk-Benefit Analysis. Issues
Panel: Health outcomes approaches to risk-benefit analysis: how ready are they? 11th International Meetings of the International Society for Pharmacoeconomics and Outcomes Research; May 2006; Philadelphia, PA. 2006.
60. Craig BA, Black MA. Incremental cost-effectiveness ratio and incremental net-
health benefit: two sides of the same coin. Expert review of pharmacoeconomics & outcomes research. 2001 Oct;1(1):37-46.
61. Zethraeus N, Johannesson M, Jonsson B, Lothgren M, Tambour M.
Advantages of using the net-benefit approach for analysing uncertainty in economic evaluation studies. PharmacoEconomics. 2003;21(1):39-48.
62. Garber A, Weinstein M, Torrance G, Kamlet M. Theoretical foundations of
cost-effectiveness analysis. In: Gold M, Siegel J, Russell L, Weinstein M, editors. Cost-effectiveness in health and medicine. New York: Oxford University Press; 1996.
63. Hughes DA, Bagust A, Haycox A, Walley T. Accounting for noncompliance in
pharmacoeconomic evaluations. PharmacoEconomics. 2001;19(12):1185-97. 64. Briggs A, Sculpher M, Buxton M. Uncertainty in the economic evaluation of
health care technologies: the role of sensitivity analysis. Health economics. 1994 Mar-Apr;3(2):95-104.
65. Claxton K, Sculpher M, McCabe C, Briggs A, Akehurst R, Buxton M, et al.
Probabilistic sensitivity analysis for NICE technology assessment: not an optional extra. Health economics. 2005 Apr;14(4):339-47.
66. Agro KE, Bradley CA, Mittmann N, Iskedjian M, Ilersich AL, Einarson TR.
Sensitivity analysis in health economic and pharmacoeconomic studies. An appraisal of the literature. PharmacoEconomics. 1997 Jan;11(1):75-88.
67. Briggs AH. Handling uncertainty in cost-effectiveness models.
PharmacoEconomics. 2000 May;17(5):479-500.

72
68. Cohen BJ. Discounting in cost-utility analysis of healthcare interventions:
reassessing current practice. PharmacoEconomics. 2003;21(2):75-87. 69. Bos JM, Postma MJ, Annemans L. Discounting health effects in
pharmacoeconomic evaluations: current controversies. PharmacoEconomics. 2005;23(7):639-49.
Related Documents