Colloids and Surfaces A: Physicochem. Eng. Aspects 457 (2014) 169–179 Contents lists available at ScienceDirect Colloids and Surfaces A: Physicochemical and Engineering Aspects journa l h om epage: www.elsevier.com/locate/colsurfa Coupled effects of hydrodynamic and solution chemistry on long-term nanoparticle transport and deposition in saturated porous media Salini Sasidharan a,b , Saeed Torkzaban a,∗ , Scott A. Bradford c , Peter J. Dillon a , Peter G. Cook a,b a CSIRO Water for a Healthy Country Flagship Program and CSIRO Land and Water, Glen Osmond, SA 5064, Australia b National Centre for Groundwater Research and Training, Flinders University, Adelaide, SA 5001, Australia c USDA, ARS, Salinity Laboratory, Riverside, CA 92507, United States h i g h l i g h t s • The breakthrough curves of the NPs exhibited a bimodal shape with increasing solution ionic strength. • Deposition dynamics of the NPs was simulated using a two-site kinetic model. • NP deposition is controlled by the coupled effects of flow velocity, solu- tion chemistry, and particle size. • NP interactions with the collector tend to strengthen with increasing contact time. g r a p h i c a l a b s t r a c t a r t i c l e i n f o Article history: Received 17 March 2014 Received in revised form 28 May 2014 Accepted 29 May 2014 Available online 5 June 2014 Keywords: Breakthrough curves Nanoparticle Column studies Hydrodynamic Solution chemistry Two-site kinetic model a b s t r a c t This study aims to systematically explore the coupled effects of hydrodynamic and solution chemistry conditions on the long-term transport and deposition kinetics of nanoparticles (NPs) in saturated porous media. Column transport experiments were carried out at various solution ionic strengths (IS), ionic composition, and flow velocities utilizing negatively charged carboxyl-modified latex NPs of two different sizes (50 and 100 nm). These experiments were designed to obtain the long-term breakthrough curves (BTCs) in order to unambiguously determine the full deposition kinetics and the fraction of the solid surface area (S f ) that was available for NP deposition. The BTCs exhibited a bimodal shape with increasing solution IS; i.e., BTCs were initially delayed, next they rapidly increased, and then they slowly approached the influent particle concentration. NP deposition was much more pronounced in the presence of Ca 2+ than Na + at any given solution IS. Deposition kinetic of NPs was successfully simulated using a two- site kinetic model that accounted for irreversible deposition and blocking on each site, i.e., a decreasing deposition rate as the site filled. Results showed that S f values were controlled by the coupled effects of flow velocity, solution chemistry, and particle size. Data analyses further demonstrated that only a small fraction of sand surface area contributed in NP deposition even at the highest IS (60 mM) and lowest flow velocity (1 m/day) tested. Consistent with previous studies, our results imply that NP deposition is controlled by physicochemical interactions between the NPs and nanoscale physical and/or chemical heterogeneities on the sand surfaces that produce localized nanoscale favorable sites for deposition. Furthermore, our results suggest that the NP interactions with the collector surfaces tended to strengthen with increasing contact time. © 2014 Elsevier B.V. All rights reserved. ∗ Corresponding author. Tel.: +61 883038491. E-mail address: [email protected] (S. Torkzaban). http://dx.doi.org/10.1016/j.colsurfa.2014.05.075 0927-7757/© 2014 Elsevier B.V. All rights reserved.

Welcome message from author
This document is posted to help you gain knowledge. Please leave a comment to let me know what you think about it! Share it to your friends and learn new things together.
Transcript

Cn
SPa
b
c
h
•
•
•
•
a
ARRAA
KBNCHST
h0
Colloids and Surfaces A: Physicochem. Eng. Aspects 457 (2014) 169–179
Contents lists available at ScienceDirect
Colloids and Surfaces A: Physicochemical andEngineering Aspects
journa l h om epage: www.elsev ier .com/ locate /co lsur fa
oupled effects of hydrodynamic and solution chemistry on long-termanoparticle transport and deposition in saturated porous media
alini Sasidharana,b, Saeed Torkzabana,∗, Scott A. Bradfordc,eter J. Dillona, Peter G. Cooka,b
CSIRO Water for a Healthy Country Flagship Program and CSIRO Land and Water, Glen Osmond, SA 5064, AustraliaNational Centre for Groundwater Research and Training, Flinders University, Adelaide, SA 5001, AustraliaUSDA, ARS, Salinity Laboratory, Riverside, CA 92507, United States
i g h l i g h t s
The breakthrough curves of the NPsexhibited a bimodal shape withincreasing solution ionic strength.Deposition dynamics of the NPs wassimulated using a two-site kineticmodel.NP deposition is controlled by thecoupled effects of flow velocity, solu-tion chemistry, and particle size.NP interactions with the collectortend to strengthen with increasingcontact time.
g r a p h i c a l a b s t r a c t
r t i c l e i n f o
rticle history:eceived 17 March 2014eceived in revised form 28 May 2014ccepted 29 May 2014vailable online 5 June 2014
eywords:reakthrough curvesanoparticleolumn studiesydrodynamicolution chemistrywo-site kinetic model
a b s t r a c t
This study aims to systematically explore the coupled effects of hydrodynamic and solution chemistryconditions on the long-term transport and deposition kinetics of nanoparticles (NPs) in saturated porousmedia. Column transport experiments were carried out at various solution ionic strengths (IS), ioniccomposition, and flow velocities utilizing negatively charged carboxyl-modified latex NPs of two differentsizes (50 and 100 nm). These experiments were designed to obtain the long-term breakthrough curves(BTCs) in order to unambiguously determine the full deposition kinetics and the fraction of the solidsurface area (Sf) that was available for NP deposition. The BTCs exhibited a bimodal shape with increasingsolution IS; i.e., BTCs were initially delayed, next they rapidly increased, and then they slowly approachedthe influent particle concentration. NP deposition was much more pronounced in the presence of Ca2+
than Na+ at any given solution IS. Deposition kinetic of NPs was successfully simulated using a two-site kinetic model that accounted for irreversible deposition and blocking on each site, i.e., a decreasingdeposition rate as the site filled. Results showed that Sf values were controlled by the coupled effects offlow velocity, solution chemistry, and particle size. Data analyses further demonstrated that only a smallfraction of sand surface area contributed in NP deposition even at the highest IS (60 mM) and lowest
flow velocity (1 m/day) tested. Consistent with previous studies, our results imply that NP depositionis controlled by physicochemical interactions between the NPs and nanoscale physical and/or chemicalheterogeneities on the sand surfaces that produce localized nanoscale favorable sites for deposition. Furthermore, our results suggewith increasing contact time.∗ Corresponding author. Tel.: +61 883038491.E-mail address: [email protected] (S. Torkzaban).
ttp://dx.doi.org/10.1016/j.colsurfa.2014.05.075927-7757/© 2014 Elsevier B.V. All rights reserved.
st that the NP interactions with the collector surfaces tended to strengthen
© 2014 Elsevier B.V. All rights reserved.
patricia.gonzalez
Typewritten Text
2462

1 : Phys
1
tapawdbotm[aiurifniewtNm[
tttafiiidtoLaa
ppflwcta[scaisteseb[thto
70 S. Sasidharan et al. / Colloids and Surfaces A
. Introduction
An understanding of nanoparticle (NP) transport and deposi-ion in porous media is important in a range of processes in naturalnd engineered systems. These processes may include the trans-ort and fate of pathogenic viruses and engineered NPs in soilsnd aquifers [1–4], and deep bed filtration in water and waste-ater treatment systems [5,6]. Most experimental studies of NPeposition in porous media have focused on the initial, clean-ed, deposition behavior when the collector surfaces are devoidr only contain small amounts of deposited particles [4,7,8]. Inhis case, the deposition rate is constant and a first-order kinetic
odel is commonly employed to describe the deposition behavior9,10]. However, as NP deposition on collector surfaces proceeds,
decrease in the deposition rate occurs due to blocking (fill-ng) of the available sites [3,11–14]. This blocking phenomenonsually occurs when a considerable net-repulsive energy bar-ier exists between the NPs and collector surfaces. Therefore,n most natural systems only a small fraction of the solid sur-ace contributes to NP deposition because of the prevalence ofet-repulsive electrostatic conditions [3,15–18]. Consequently, it
s imperative that theoretical models are able to describe thentire dynamics of deposition from the initial to later stageshen a decline in deposition rates occurs. An understanding of
he dynamics of NP deposition is especially important becauseP deposition is essentially irreversible (insignificant detach-ent) during steady-state chemical and hydrodynamic conditions
3,19–22].Two different blocking models have been developed to describe
he declining rate of deposition during the filling process, namely:he Langmuirian model [23,24] and the random sequential adsorp-ion (RSA) model [25,26]. The Langmuirian and RSA models assume
linear and a nonlinear decrease in the deposition rate duringlling of deposition sites, respectively. The Langmuirian approach
s commonly employed in short-term colloid deposition model-ng studies [2,22]. However, the RSA model provides a superiorescription of deposition dynamics when the coverage of collec-or surfaces approaches the maximum attainable coverage (∼54%),ften referred to as the hard sphere jamming limit [24,27–29]. Bothangmuirian and RSA models assume that deposited NPs eventu-lly achieve monolayer coverage on the fraction of the solid surfacerea that is favorable for deposition (Sf).
Previous studies have reported that Sf is influenced by a range ofhysicochemical factors such as particle size, the amount and size ofhysical and/or chemical heterogeneities, solution chemistry, andow rate [11,30–32]. In particular, Sf has been reported to increaseith increasing ionic strength (IS) under net-repulsive electrostatic
onditions, suggesting that deposition locations on the collec-or surfaces are largely determined by nano-scale heterogeneitiesnd/or increasing the depth of the secondary energy minimum33–36]. Furthermore, increasing the flow velocity and/or particleize has been shown to decrease Sf, suggesting that hydrodynamiconditions are also important in determining deposition kineticsnd blocking [2,37,38]. Several explanations have been proposedn the literature to explain the role of flow velocity or particleize on the deposition behavior. Some researchers have attributedhe decrease in Sf at higher velocities to the “shadow effect” [37],.g., the excluded region created down gradient of micro-scaleurface roughness or deposited particles. More recently, the influ-nce of hydrodynamic conditions on Sf has been explained by thealance of applied hydrodynamic and resisting adhesive torques39–43]. Only limited experimental information is available in
he literature on the dependence of Sf on physicochemical andydrodynamic factors, especially for NPs. In this paper, we will sys-ematically explore the coupled effects of these factors on the valuef Sf. This information is required to better deduce the underlyingicochem. Eng. Aspects 457 (2014) 169–179
mechanisms and theoretical description of NP deposition kineticsunder net-unfavorable conditions.
The overall deposition rate of NPs in porous media depends notonly on Sf, but also on the mass transfer of NPs to favorable sites onthe solid surfaces where deposition can occur. Mass transfer of NPsto favorable sites occurs by two means: (1) aqueous phase masstransfer from the bulk aqueous phase to the solid surface [44,45]and (2) solid phase mass transfer on unfavorable regions of the solidsurface to favorable sites [30,33,46]. Aqueous phase mass transferof NPs to the solid surface has been the subject of much research[10] and colloid filtration theory [47] is commonly used to quantifythis process. Conversely, the role of solid phase mass transfer hasreceived less research attention [30]. It has been shown that par-ticles colliding with unfavorable regions of the solid surface maybecome weakly associated with the solid surface via a shallow sec-ondary energy minimum. These particles can be translated alongthe collector surface by tangential hydrodynamic forces to favor-able deposition sites [48]. It is expected that nano- and micro-scalesurface roughness and the pore-space topography should influencethe solid phase mass transfer of the NPs. Furthermore, the amountof colloid transfer on the solid surface is expected to increase withincreasing IS and decreasing flow velocity [33,35]. The solid phasemass transfer rate of NPs is likely to decrease during the fillingprocesses, but little research has been conducted to address thisissue.
The objective of this study is to develop a more thorough under-standing of the combined effects of hydrodynamics and solutionchemistry on the long-term kinetics of NP deposition in saturatedporous media. Specifically, a series of laboratory experiments wascarried out in saturated sand columns to investigate the coupledeffects of solution IS, cation type, particle size, and flow velocityon the deposition rate constants and the fraction of the sold sur-face area available for NP deposition. A two-site kinetic model wasfound to satisfactorily simulate and describe the long-term dynam-ics of the deposition process. Fitted values of Sf and depositionrate constants over a wide range of physicochemical conditionsincreased our understanding of the dynamics of long-term NPdeposition in porous media. This information is needed to improveour theoretical description of these processes and to improve con-tinuum scale models for predicting the long-term fate and mobilityof NPs in the subsurface environment.
2. Materials and methods
2.1. NPs
Carboxylate-modified latex (CML) microspheres have oftenbeen used as model NPs in transport studies due to their spher-ical shape, well-defined size and surface charge, and ease indetection at low concentration [2]. Two sizes (50 and 100 nm) ofFluoresbrite®Yellow-Green CML microspheres (Polysciences, Inc),that have an excitation wavelength at 441 nm and an emissionwavelength at 486 nm, were used in this research. Stock solutionsof CML NPs were diluted in selected electrolyte solutions to achievea desired initial concentration (C0). All solutions were preparedusing analytical graded reagents and Milli-Q water with its unad-justed pH 5.8. A near neutral pH and negatively charged NPs werechosen in order to understand the NP transport mechanism undermost unfavorable condition. The initial concentration for 50 and100 nm CML NPs was typically 4.55 × 10¹⁰ mL−1. NP aqueous phaseconcentrations were determined using a fluorescence spectropho-
tometer (Synergy HT, BioTek Instruments, Inc., Winooski, VT, USA)and a calibration curve. The CML NPs have carboxylate groups ontheir surfaces that are highly negatively charged. The zeta potentialand size uniformity of the CML microspheres in various electrolyte
S. Sasidharan et al. / Colloids and Surfaces A: Physicochem. Eng. Aspects 457 (2014) 169–179 171
Table 1The average of zeta potentials of NPs and sand as well as calculated DLVO interaction parameters in the indicated solution chemistries.
NP size (nm) Solution chemistry IS (mM) Zeta potential(NP) (mV)
Zeta potential(sand) (mV)
Energy barrierheight (kT)
Secondary minimumdepth (kT)
50 10 mM NaCl 10 −51 −29 57 ∼050 20 mM NaCl 20 −48 −30 52 ∼050 50 mM NaCl 50 −31 −26 24 −0.0850 0.5 mM CaCl2 1.5 −43 −21 28 ∼050 2 mM CaCl2 6 −32 −19 16 ∼0100 40 mM NaCl 40 −41 −15 47 −0.2
aNtwr
2
gartrHotpNprfoew4tds
2
gputfitdfioflrcqgp
100 60 mM NaCl 60 −30
100 2 mM CaCl2 6 −35
100 3 mM CaCl2 9 −27
nd pH solutions were determined using a Malvern, Zetasizerano Series, Nano-ZS. It was confirmed that the CML suspension at
he highest tested concentrations of 60 mM NaCl and 3 mM CaCl2as stable and did not show any aggregation. The manufacturer
eported that the CML NPs had a density of 1.05 g cm−3.
.2. Porous media
Natural graded river sand (River sand pty Ltd) was used as theranular porous media for the transport experiments. The aver-ge grain diameter of the sand was 255 �m, and the grain sizeanged between 106 and 300 �m. The sand was cleaned prioro use to remove the impurities from the sand surface and toeduce the surface heterogeneity. Sieved sand was soaked in 37%Cl for three days to remove dissolved organic matter and metalxides. After discarding the excess acid, the sand was alterna-ively rinsed with 0.1 M NaOH and deionized (DI) water until theH reached 7. The sand was subsequently soaked in boiling 1 MaCl for 3 h, and then washed with boiling DI water for 3 h. Theserocesses (boiling alternatively in 1 M NaCl and DI water) wereepeated eight times to remove the clay particles on the sand sur-ace by the combined influence of cation exchange and expansionf the double layer. Finally the sand was rinsed with DI water sev-ral times until the effluent turbidity and UV–visible absorbanceas virtually zero. Scanning electron microscopy (SEM) (Quanta
50, Adelaide microscopy, The University of Adelaide, Australia) ofhe sand before and after cleaning demonstrated that this proce-ure removed most of the surface impurities and clays from theand.
.3. Electrokinetic characterization and DLVO calculations
The electrophoretic mobility of the colloids and crushed sandrains was measured in various NaCl electrolyte solutions atH 5.8 using a Zetasizer. The Smoluchowski equation [49] wassed to convert the measured electrophoretic mobility valueso zeta potentials. The measurements were repeated five timesor each colloid suspension and the average values are reportedn Table 1. Classical DLVO theory [50,51] was used to calculatehe total interaction energy, that is, the sum of the London–vaner Waals attraction and the electrostatic double-layer repulsion,or the colloids upon close approach to quartz surfaces (assum-ng sphere–plate interactions) for the various solution IS used inur experiments. The retarded London–van der Waals interactionorce was determined from the expression of Gregory [52] uti-izing a value of 4.04 × 10⁻²¹ J for the Hamaker constant [53] toepresent the latex–water–quartz system. In these calculations,
onstant-potential electrostatic double layer interactions wereuantified using the linear superposition approximation modeliven in Gregory [54], with zeta potentials in place of surfaceotentials.−15 19 −0.3−19 34 ∼0−17 20 −0.22
2.4. Column studies
Column experiments were conducted using 11 cm long poly-carbonate chromatography columns with a 1.9 cm internaldiameter and a total inner volume of 31.19 cm2. Tubing to and fromthe columns, fittings, and column O-rings were composed of chem-ically inert material such as Teflon and viton. The columns wereset-up vertically and wet packed with the cleaned river sand, usingvibration to minimize air entrapment and to ensure the uniformityof packing. A sodium nitrate (NaNO3) tracer test was conductedto obtain the parameter values for the transport modeling. Eachcolumn was packed with ∼50 g of sand and the porosity was cal-culated gravimetrically to be 0.40. One pore volume (PV), which isthe amount of solution required to fill in the void space of the sandin the column was determined to be 14 mL. The packed columnswere flushed with several pore volumes of a selected electrolytesolution to equilibrate the system before injecting a NP suspensionat a constant velocity with a syringe pump (Harvard apparatus 22).Effluent samples (every 3 mL) were continuously collected usinga Spectra/Chrom® CF-1 Fraction Collector. In order to calculatethe amount of surface area that contributed in NP deposition, theinjection of the NPs was continued until the effluent concentra-tion (C) approached C0 or a stable concentration level. The columnswere then flushed with several PV of the same electrolyte solution,but without NPs. Table 1 summarizes the experimental conditions.Table 2 contains the number of injected PV at which the influentwas switched to the NP-free electrolyte solution.
A few sand grains were collected carefully from the column afterthe deposition phase. The samples were analyzed using SEM toobserve the distribution of NPs on the sand surfaces. Sand grainswere placed on the top of a carbon tape mounted on a stub, with a3 nm thickness platinum coating and imaged at 10 kV using Quanta450 SEM. It was visually confirmed that the platinum coating forceand the vacuum in the SEM chamber were not enough to detachthe deposited NPs.
2.5. Modeling
Major processes controlling the transport and deposition of NPsin porous media are advection, dispersion, and attachment causedby particle interactions with the collector surfaces. The detachmentprocess is often negligible under steady-state chemical and hydro-dynamic conditions [2] and will be neglected in this work. Theadvection–dispersion equation (ADE) with irreversible attachmentis given for uniform and one-dimensional flow as
∂C
∂t= �v
∂2C
∂z2− v∂C
∂z− ratt (1)
where t (T) is time, z (L) is the direction of mean water flow, C (NL−3)is the number of NPs per unit volume of the aqueous phase, � is thedispersivity (L), v is the average pore water velocity (LT−1), and ratt
is the NP attachment rate to the solid surfaces (NL−3 T−1). The mean

172 S. Sasidharan et al. / Colloids and Surfaces A: PhysTa
ble
2Ex
per
imen
tal c
ond
itio
ns
and
fitt
ed
mod
el
par
amet
ers
for
colu
mn
exp
erim
ents
show
n
in
Figs
. 1–4
.
NP
size
(nm
)Po
e
wat
er
flow
velo
city
(m/d
ay)
NaC
l or
CaC
l 2(m
M)
Puls
e
du
rati
on(P
V)
K1
(min
−1)
K2
(min
−1)
S max
1/C
0(m
3/k
g)
S max
2/C
0(m
3/k
g)
S f(fi
tted
)a(%
)
S f(B
TC)b
(%)
50
1
10
Na+
41.5
(7.3
±
0.4)
×
10−3
(3.2
±
0.6)
×
10−3
(4.2
±
0.3)
×
10−5
(9.8
±
0.6)
×
10−4
0.04
0.03
50
1
20
Na+
41.2
(4.8
±
0.1)
×
10−2
(5.8
±
0.3)
×
10−3
(1.1
±
0.4)
×
10−3
(5.4
±
0.8)
×
10−3
0.95
ND
c
50
1
30
Na+
35.5
(1.1
±
0.5)
×
10−1
(6.4
±
0.6)
×
10−3
(1.4
±
0.2)
×
10−3
(7.2
±
0.5)
×
10−3
1.24
ND
50
1
40
Na+
35.1
(1.5
±
0.4)
×
10−1
(7.7
±
0.3)
×
10−3
(1.6
±
0.6)
×
10−3
(9.1
±
0.7)
×
10−3
1.46
ND
50
1
50
Na+
41
(1.7
±
0.5)
×
10−1
(1.5
±
0.6)
×
10−2
(1.7
±
0.2)
×
10−3
(1.0
±
0.5)
×
10−2
1.78
ND
50
5
50
Na+
29.7
(3.7
±
0.2)
×
10−1
(2.3
±
0.3)
×
10−2
(1.8
±
0.3)
×
10−3
(3.6
±
0.6)
×
10−3
1.54
ND
50
20
50
Na+
38.9
(1.1
±
0.6)
(6.9
±
0.5)
×
10−2
(1.6
±
0.4)
×
10−3
(2.3
±
0.7)
×
10−3
1.33
ND
100
1
40
Na+
25.2
(6.3
±
0.3)
×
10−3
(4.3
±
0.4)
×
10−3
(7.8
±
0.6)
×
10−5
(3.5
±
0.2)
×
10−4
1.45
1.7
100
1
50
Na+
27.6
(4.7
±
0.2)
×
10−2
(2.6
±
0.3)
×
10−3
(6.5
±
0.3)
×
10−4
(6.3
±
0.7)
×
10−4
4.32
4.9
100
1
60
Na+
24.7
(6.6
±
0.5)
×
10−2
(2.3
±
0.1)
×
10−3
(1.2
±
0.1)
×
10−3
(1.2
±
0.3)
×
10−3
8.16
ND
100
5
50
Na+
26.8
(1.1
±
0.2)
×
10−1
(2.0
±
0.2)
×
10−2
(2.7
±
0.5)
×
10−4
(7.9
±
0.8)
×
10−4
2.57
2.3
100
20
50
Na+
21
(6.0
±
0.4)
×
10−2
(4.7
±
0.3)
×
10−2
(9.7
±
0.6)
×
10−5
(2.9
±
0.3)
×
10−4
1.30
1.2
50
1
0.5
Ca2+
58.4
(3.6
±
0.2)
×
10−2
(3.7
±
0.3)
×
10−3
(1.4
±
0.1)
×
10−3
(1.2
±
0.2)
× 10
−21.
29
0.03
50
1
2
Ca2+
83.8
(5.2
±
0.6)
×
10−2
(6.0
±
0.5)
×
10−3
(3.5
±
0.4)
×
10−3
(4.1
±
0.5)
× 10
−23.
28
ND
50
5
2
Ca2+
57.1
(1.1
±
0.2)
×
10−1
(1.7
±
0.4)
×
10−2
(3.9
±
0.2)
×
10−3
(1.8
± 0.
3)
× 10
−33.
34
ND
50
25
2
Ca2+
14.4
(1.9
±
0.3)
×
10−1
(1.7
±
0.5)
×
10−1
(7.8
±
0.6)
×
10−5
(6.8
± 0.
5)
× 10
−40.
07
0.05
100
1
2
Ca2+
32.5
(8.2
±
0.6)
×
10−2
(3.4
±
0.2)
×
10−3
(1.3
±
0.2)
×
10−3
(1.6
± 0.
1)
×
10−3
4.57
5.3
100
5
2
Ca2+
22.7
(7.6
±
0.5)
×
10−2
(6.8
±
0.7)
×
10−3
(2.3
±
0.3)
×
10−4
(4.7
± 0.
6)
×
10−4
0.79
0.62
100
1
3
Ca2+
33.1
(1.2
±
0.1)
×
10−1
(2.7
±
0.2)
×
10−3
(2.5
±
0.2)
×
10−3
(3.3
±
0.5)
×
10−3
8.51
ND
aD
eter
min
ed
by
the
sum
of
fitt
ed
valu
es
of
S max
1an
d
S max
2an
d
usi
ng
Eq. (
4).
bD
eter
min
ed
from
a
mas
s
bala
nce
calc
ula
tion
of
the
BTC
s
and
usi
ng
Eq. (
5).
cN
ot
det
erm
ined
.
icochem. Eng. Aspects 457 (2014) 169–179
pore-water velocity and dispersivity used in NP simulations wereobtained by fitting to the tracer (NaNO3) BTCs.
Typically, the BTCs could be simulated reasonably well dur-ing the first few PV using Eq. (1) in conjunction with a one-site,irreversible attachment model that included a Langmurian block-ing function. However, as it will be discussed later, this model doesnot provide an adequate description of the deposition dynamicsat later times. To investigate whether multiple kinetic depositionsites could account for this discrepancy, a two-site kinetic modelwas used for analyzing the BTCs. In this case, the value of ratt isgiven as
ratt = �b∂(S1 + S2)
∂t= �k1 1C + �k2 2C (2)
where �b is the soil bulk density (ML−3), � is the water content, S1 isthe solid phase NP concentration on site 1(NM−1), k1 is the attach-ment rate coefficient for site 1 (T−1), and �1 is a dimensionlessLangmuirian blocking function for site 1 that is given as [23]
�1 =(
1 − S1
Smax 1
)(3)
Here Smax1 (NM−1) is the maximum solid phase concentration ofattached NPs on site 1. Corresponding values of S2, Smax2, k2, and�2 are defined for site 2. When the value of Smax1 and Smax2 arelarge, the blocking function approaches a value of 1 and time-dependent deposition behavior becomes irrelevant. A modifiedversion of HYDRUS-1D [55] was used to solve Eqs. (1)–(3).
The fraction of the solid surface area that is available for deposi-tion (Sf) may be determined from the sum of fitted values of Smax1and Smax2 using the following equation [56]:
Sf = Ac�bSmax
(1 − �)As(4)
where Ac (L2 N−1) is the cross section area per colloid, As (L−1) is thesolid surface area per unit volume, Smax (NM−1) is the maximumsolid phase concentration of attached NPs on both sites, and � isthe porosity of a monolayer packing of colloids on the solid surface.In this work we assume a value of � = 0.5 in all simulations basedon information presented by Johnson and Elimelech [25]. For thoseexperiments where C/C0 reached unity during the deposition phase,the value of Sf can also be estimated from the effluent BTCs basedon the following mass balance equation [37]:
Sf =�r2p rcqw(CoTpulse
∫ Ttotal0
C dt)
3L(1 − n)(5)
where rp (L) is the radius of the NP, rc (L) is the radius of the sandgrain, qw (L T−1) is the Darcy velocity, Tpulse (T) is the injection time,and Ttotal (T) is the entire time of the experiment, L (L) is the lengthof the packed column and n is the porosity of the porous media. Asit will be shown later in the paper, Eqs. (4) and (5) were found toyield comparable values of Sf.
3. Results and discussion
3.1. Surface charge of NPs and sand grains
Zeta potentials of the NPs and colloidal particles collected fromcrushed sand grains over the range of solution chemistries usedin the column experiments are presented in Table 1. As expected,the absolute value of the zeta potential of the NPs and sand grainsdecreased with increasing the concentration of Na+ and Ca2+ due
to compression of the electrostatic double layer [49]. Increasingthe Ca2+ concentration was more effective in decreasing themagnitude of zeta potential than similar changes in Na+ due to thecombined effects of charge screening of the divalent cations and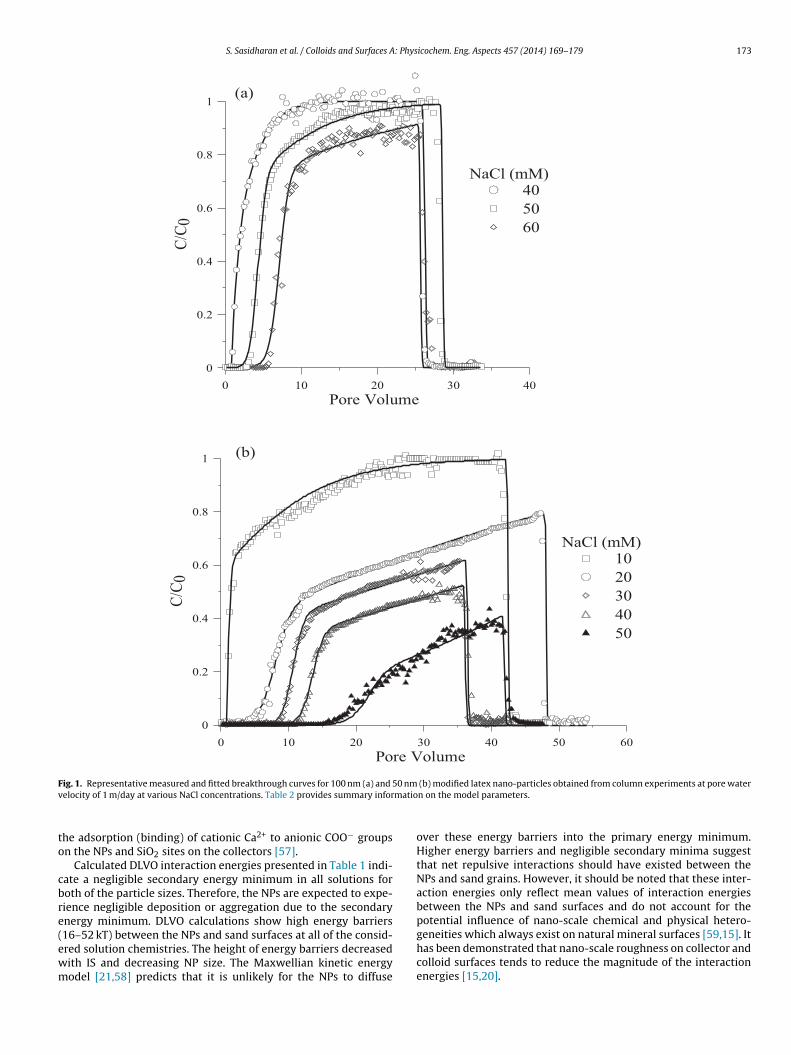
S. Sasidharan et al. / Colloids and Surfaces A: Physicochem. Eng. Aspects 457 (2014) 169–179 173
0 10 20 30 40
Pore Volume
0
0.2
0.4
0.6
0.8
1
C/C
0NaCl (mM)
40
50
60
(a)
0 10 20 30 40 50 60
Pore Volume
0
0.2
0.4
0.6
0.8
1
C/C
0
NaCl (mM)10
20
30
40
50
(b)
F 0 nmv matio
to
cbre(ewm
ig. 1. Representative measured and fitted breakthrough curves for 100 nm (a) and 5elocity of 1 m/day at various NaCl concentrations. Table 2 provides summary infor
he adsorption (binding) of cationic Ca2+ to anionic COO− groupsn the NPs and SiO2 sites on the collectors [57].
Calculated DLVO interaction energies presented in Table 1 indi-ate a negligible secondary energy minimum in all solutions foroth of the particle sizes. Therefore, the NPs are expected to expe-ience negligible deposition or aggregation due to the secondarynergy minimum. DLVO calculations show high energy barriers
16–52 kT) between the NPs and sand surfaces at all of the consid-red solution chemistries. The height of energy barriers decreasedith IS and decreasing NP size. The Maxwellian kinetic energyodel [21,58] predicts that it is unlikely for the NPs to diffuse(b) modified latex nano-particles obtained from column experiments at pore watern on the model parameters.
over these energy barriers into the primary energy minimum.Higher energy barriers and negligible secondary minima suggestthat net repulsive interactions should have existed between theNPs and sand grains. However, it should be noted that these inter-action energies only reflect mean values of interaction energiesbetween the NPs and sand surfaces and do not account for thepotential influence of nano-scale chemical and physical hetero-
geneities which always exist on natural mineral surfaces [59,15]. Ithas been demonstrated that nano-scale roughness on collector andcolloid surfaces tends to reduce the magnitude of the interactionenergies [15,20].
174 S. Sasidharan et al. / Colloids and Surfaces A: Physicochem. Eng. Aspects 457 (2014) 169–179
0 10 20 30 40
Pore Volume
0
0.2
0.4
0.6
0.8
1
C/C
0
CaCl2 (mM)
2
3
(a)
0 10 20 30 40 50 60 70 80 90 100
Pore Volume
0
0.2
0.4
0.6
0.8
1
C/C
0
CaCl2 (mM)
0.5
2
(b)
Fig. 2. Representative measured and fitted breakthrough curves for 100 nm (a) and50 nm (b) modified latex nano-particles obtained from column experiments at porewi
3
rNdp(pmNarpvmvfiTfi
paepi
0 10 20 30
Pore Volume
0
0.2
0.4
0.6
0.8
1
C/C
0
Flow velocity(m/d)
1
5
20
(a)
0 10 20 30 40 50
Pore Volume
0
0.2
0.4
0.6
0.8
1
C/C
0
Flow velocity(m/d)
1
5
20
(b)
Fig. 3. Representative measured and fitted breakthrough curves for 100 nm (a)
ater velocity of 1 m/day at various CaCl2 concentrations. Table 2 provides summarynformation on the model parameters.
.2. Deposition kinetics of NPs
In contrast with most previous studies on NP deposition,eviews of which may be found in [4], long-term injections of thePs were carried out in order to determine the full dynamics ofeposition and the associated blocking model parameters. Fig. 1resents measured and simulated BTCs for 100 (Fig. 1a) and 50 nmFig. 1b) NPs in various concentrations of NaCl solutions when theore-water velocity was 1 m/day. Fig. 2 presents similar BTC infor-ation for different concentrations of CaCl2 solutions and the twoP sizes at 1 m/day pore water velocity. Fig. 3 shows measurednd simulated BTCs for the two NP sizes at various flow velocitiesanging from 1 to 20 m/day when the IS was 50 mM NaCl. Fig. 4resents similar BTC information for the two NP sizes at differentelocities, but for 2 mM CaCl2. The BTCs are plotted herein as nor-alized effluent concentrations (C/C0) versus the number of pore
olumes that passed through the column. Table 2 summarizes thetted model parameters, along with their 95% confidence intervals.he fitted deposition parameters were found to be unique, as thenal fitted values were not affected by the initial guess.
In general, the BTCs were initially delayed (arriving after 1ore volume), next they rapidly increased, and then they slowly
pproached the influent particle concentration. These trends can bexplained by considering the simulated kinetics of the depositionrocess using Eqs. (1)–(3). The one-site kinetic model incorporat-ng the Langmurian or RSA blocking function failed to fit the entire
and 50 nm (b) modified latex nano-particles obtained from column experimentsat 50 mM NaCl and various flow velocities. Table 2 provides summary informationon the model parameters.
BTC obtained at various chemical and physical conditions (data notshown). Conversely, the two-site kinetic model with a Langmurianblocking function for each site provided an excellent descriptionfor all the BTCs shown in Figs. 1–4 (R2 > 94%). In general, the valueof k1 was around one order of magnitude greater than k2, and Smax1was much smaller than Smax2. The time delay of the breakthroughcurve was mainly determined by the values of k1 and Smax1. A highvalue of k1 results in complete deposition until the solid phase con-centration of NPs in site 1 approaches Smax1. Consequently, moredelay is expected for higher values of k1 and Smax1. Other stud-ies on NP transport in porous media have observed a similar delayin their BTCs (e.g., [3,22,32]). After the BTCs begin their sharp risedue to filling of site 1, the shape of the BTCs is mainly controlledby site 2. In particular, the skewness of the rising portions of theBTCs is strongly affected by the values of k2 and Smax2. Neglectingdetachment in the model is justified by the negligible tailing in theBTCs.
Two-site kinetic models have previously been employed incolloid and NP transport studies [60–62]. There are a variety ofpotential explanations for the need to a multiple deposition sitemodel. Macro-scale patch-wise charge heterogeneities have beendemonstrated to cause two types of kinetic rates [63]. Primary andsecondary minimum interactions may also produce irreversibleand reversible deposition sites, respectively [63]. Nanoscale physi-cal and chemical heterogeneity may affect the amount and strengthof these primary and secondary minimum interactions [34,64–66].
Differences in the rate and extent of deposition can also occur onflat surfaces, at surface roughness locations, and grain-grain con-tacts due to changes in the adhesive and hydrodynamics torques[35]. Fig. 5 presents typical SEM images of the NP deposition on
S. Sasidharan et al. / Colloids and Surfaces A: Phys
0 10 20 30 40
Pore Volume
0
0.2
0.4
0.6
0.8
1
C/C
0
Flow velocity(m/d)
1
5
(a)
0 10 20 30 40 50 60 70 80 90 100
Pore Volume
0
0.2
0.4
0.6
0.8
1
C/C
0
Flow velocity(m/d)
1
5
25
(b)
Fig. 4. Representative measured and fitted breakthrough curves for 100 nm (a) and5Cm
tamasm
stastoCfsisirfi
oscs
0 nm (b) modified latex nano-particles obtained from column experiments at 2 mMaCl2 and various flow velocities. Table 2 provides summary information on theodel parameters.
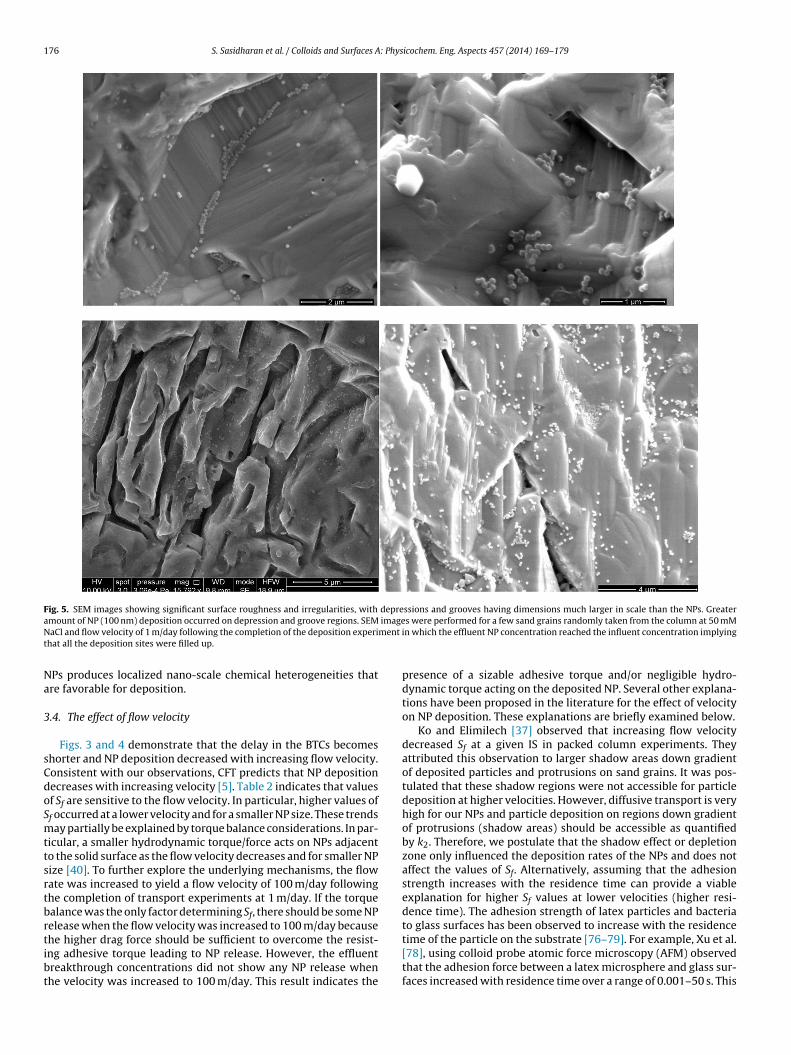
he sand surfaces. SEM images reveal significant surface roughnessnd irregularities, with depressions and grooves having dimensionsuch larger in scale than the NPs used in the experiments. Greater
mount of NP deposition occurred on microscopically rough thanmooth regions on the sand grains in further support of our two-siteodeling approach.Variations of mass transfer rates of NPs to deposition sites on
and grains may also contribute to the need for a model with mul-iple deposition sites. Colloid filtration theory (CFT) predicts thatqueous phase mass transfer of colloidal particles to the collectorurface occurs by Brownian diffusion, interception, and sedimen-ation [47]. In general, the mass transfer rate varies with distancever the collector surface [67]. Brownian diffusion is predicted byFT to be the dominant process of the aqueous phase mass transferor the NPs, and it is more uniformly distributed over the collectorurface than sedimentation or interception. In addition, variationsn the sand surface topography affect the rates of mass transfer topecific locations on a sand grain [35,67]. These spatial variationsn mass transfer have less of an influence on the overall depositionate under clean-bed conditions than when the selected sites arelled.
In addition, CFT does not account for the potential contribution
f solid phase mass transfer and the shadow effect on NP depo-ition kinetics. Experimental and theoretical results indicate thatolloids that are weakly associated with the solid surface via ahallow secondary minimum may translate over the solid surfaceicochem. Eng. Aspects 457 (2014) 169–179 175
by hydrodynamic forces to regions where deposition is favor-able [11,48]; e.g., regions with greater adhesive forces (chemicalheterogeneity) or lower hydrodynamic forces (large scale sur-face roughness or grain–grain contact). Malysa et al. [68] and Koand Elimelech [37] reported that micro-scale surface roughness ordeposited particles can create excluded zones for colloid depositionimmediately behind physical barriers. Indeed, Meinders et al. [69]and Van de Ven et al. [70] microscopically studied colloid attach-ment on glass surfaces in a parallel flow chamber and observedthat particle deposition was less probable on areas down gradi-ent of already deposited particles. It is important to recognize thatshadow regions can only be filled up by diffusive transport of NPsfrom the bulk solution, and not by rolling or translating colloidson unfavorable regions of the collector surface. Fig. 6 schematicallyillustrates a shadow region created down gradient of a surface pro-trusion due to the combined effects of weak interaction energieson the up-gradient unfavorable regions and hydrodynamic shearforces. It is therefore logical to anticipate that solid phase NP trans-port will contribute to higher values of k1 than k2, and that k2 willbe impacted by the shadow effect.
3.3. The effect of solution chemistry
Inspection of Fig. 1 reveals that the deposition behavior is highlydependent on the NP size and IS. In particular, greater amounts ofdeposition occurred at a higher IS and for the smaller NP (at a givenIS). The BTCs were delayed longer and the rising limb approachedunity much slower at a higher IS and for the smaller NP size (50 nm).Consistent with this blocking behavior, Table 2 indicates that Sfincreased in a linear manner with IS, and that larger values of Sfwere associated with the smaller NP. It is interesting to note thatonly a small fraction of the solid surface contributed to NP deposi-tion even at the highest IS (60 mM).
These results are in agreement with experimental and theoreti-cal findings that indicate that colloid deposition is highly dependenton the size and amount of nanoscale heterogeneity [64,71,72].Kozlova and Santore [64] experimentally demonstrated that0.5 �m silica particles attached to net-negative and net-repulsivesubstrates on which nano-textured positive patches (11 nm) wererandomly distributed. Transport experiments and simulationsrevealed that negative colloids (500–2000 nm) attached to posi-tive patches on negative surfaces at high IS, but not at low IS [72].Theoretical calculations further demonstrated that the nano-scalephysical and/or chemical heterogeneities exerted a greater effecton interaction energies at higher IS and for smaller colloid sizes, andthat the energy barrier can be completely eliminated to producefinite primary minimum interactions depending on the relative sizeof heterogeneity to the NP, density of heterogeneity, and solutionIS [15,66,71,73]. The aforementioned results indicate that the sizeand density of nanoscale heterogeneity plays a critical role on theamount and rate of NP deposition. It should be noted that neg-ligible deposition of NPs was observed when the solution IS was1 mM NaCl (data not shown), ruling out the importance of micro-and macro-scale positively charged heterogeneities (e.g., patches ofmetal oxides on the sand surfaces) on the NP deposition at higherIS.
Fig. 2 exhibits similar trends to Fig. 1 with regard to the effects ofIS and NP size. In contrast, greater amounts of deposition occurredin the presence of Ca2+ (Fig. 2) than Na+ (Fig. 1) at a smaller solutionIS. This also produced correspondingly higher values of Sf pre-sented in Table 2. The higher deposition in the presence of Ca2+
can be explained by the formation of divalent cation (Ca2+) bridg-ing as described by previous studies [3,74,75]. These studies havereported that complexation of Ca2+ ions to the silanol groups on themineral surfaces and carboxylic acid groups on the surface of the
176 S. Sasidharan et al. / Colloids and Surfaces A: Physicochem. Eng. Aspects 457 (2014) 169–179
Fig. 5. SEM images showing significant surface roughness and irregularities, with depressions and grooves having dimensions much larger in scale than the NPs. Greatera imageN ment
t
Na
3
sCdoSmttsrtbrtibt
mount of NP (100 nm) deposition occurred on depression and groove regions. SEMaCl and flow velocity of 1 m/day following the completion of the deposition experi
hat all the deposition sites were filled up.
Ps produces localized nano-scale chemical heterogeneities thatre favorable for deposition.
.4. The effect of flow velocity
Figs. 3 and 4 demonstrate that the delay in the BTCs becomeshorter and NP deposition decreased with increasing flow velocity.onsistent with our observations, CFT predicts that NP depositionecreases with increasing velocity [5]. Table 2 indicates that valuesf Sf are sensitive to the flow velocity. In particular, higher values off occurred at a lower velocity and for a smaller NP size. These trendsay partially be explained by torque balance considerations. In par-
icular, a smaller hydrodynamic torque/force acts on NPs adjacento the solid surface as the flow velocity decreases and for smaller NPize [40]. To further explore the underlying mechanisms, the flowate was increased to yield a flow velocity of 100 m/day followinghe completion of transport experiments at 1 m/day. If the torquealance was the only factor determining Sf, there should be some NPelease when the flow velocity was increased to 100 m/day because
he higher drag force should be sufficient to overcome the resist-ng adhesive torque leading to NP release. However, the effluentreakthrough concentrations did not show any NP release whenhe velocity was increased to 100 m/day. This result indicates thes were performed for a few sand grains randomly taken from the column at 50 mMin which the effluent NP concentration reached the influent concentration implying
presence of a sizable adhesive torque and/or negligible hydro-dynamic torque acting on the deposited NP. Several other explana-tions have been proposed in the literature for the effect of velocityon NP deposition. These explanations are briefly examined below.
Ko and Elimilech [37] observed that increasing flow velocitydecreased Sf at a given IS in packed column experiments. Theyattributed this observation to larger shadow areas down gradientof deposited particles and protrusions on sand grains. It was pos-tulated that these shadow regions were not accessible for particledeposition at higher velocities. However, diffusive transport is veryhigh for our NPs and particle deposition on regions down gradientof protrusions (shadow areas) should be accessible as quantifiedby k2. Therefore, we postulate that the shadow effect or depletionzone only influenced the deposition rates of the NPs and does notaffect the values of Sf. Alternatively, assuming that the adhesionstrength increases with the residence time can provide a viableexplanation for higher Sf values at lower velocities (higher resi-dence time). The adhesion strength of latex particles and bacteriato glass surfaces has been observed to increase with the residence
time of the particle on the substrate [76–79]. For example, Xu et al.[78], using colloid probe atomic force microscopy (AFM) observedthat the adhesion force between a latex microsphere and glass sur-faces increased with residence time over a range of 0.001–50 s. This
S. Sasidharan et al. / Colloids and Surfaces A: Physicochem. Eng. Aspects 457 (2014) 169–179 177
Fig. 6. Schematic of the NP attachment process on a sand grain illustrating the process of mass transfer of NPs over the unfavorable regions and NP attachment on thefavorable regions (red area); and a favorable site for attachment located in the “shadow region” down gradient of a surface protrusion. Note that the NPs transferred from theu ent mt n of th
ocsiohoa
4
oeltrbfioB1u
fitNtsapb
p-gradient unfavorable regions cannot land on the favorable region and NP attachmhe references to color in this figure legend, the reader is referred to the web versio
bservation has been ascribed to progressive removal of interfa-ial water and/or rearrangement of the functional groups on theurface of latex particles to bridge and then bind to the oppos-ng surface until all bonds reach the lowest energy state. Agingf the bond between adhering microorganisms and solid surfacesas been documented [80,81], and attributed to possible collapsef surface appendages, biosurfactant release, and the metabolicctivity of the organisms.
. Conclusions
Spatial and temporal variations in the rate of NP deposition mayccur in porous media for a variety of reasons, including: differ-nt strengths of interaction energy; enhanced retention in specificocations; spatial variations in NP mass transfer rates to reten-ion locations; and the shadow effect. The influence of multipleates of deposition may not be apparent on NP BTCs under clean-ed conditions because the retention locations are far from beinglled. Conversely, as retention locations are filled, the influencef multiple deposition rates becomes more apparent. Long-termTCs (25–85 pore volumes) were therefore obtained for (50 and00 nm) NPs in order to determine their full deposition kineticsnder various physicochemical conditions.
The long-term BTCs exhibited a bimodal shape that was success-ully simulated using a two-site kinetic model that accounted forrreversible deposition and blocking on each site. Results showedhat Sf values (related to the maximum solid concentration of thePs) were small (<9%) in an acid-washed sand and controlled by
he coupled effects of flow velocity, solution chemistry, and particle
ize; e.g., increasing with decreasing particle size and flow velocity,nd increasing IS. NP deposition was much more pronounced in theresence of Ca2+ than Na+, implying that NP deposition occurredecause of physicochemical interactions between the negativelyay only occur due to direct diffusion from the bulk solution. (For interpretation ofe article.)
charged COOH groups on the NPs and nanoscale heterogeneities onthe sand surface. Our results suggest these NP interactions tendedto strengthen with increasing contact time.
Acknowledgments
Funding for this research was provided by the National Centrefor Groundwater Research and Training, an Australian Governmentinitiative, supported by the Australian Research Council and theNational Water Commission, and by CSIRO Water for a HealthyCountry Flagship research program. The work was conducted in theCSIRO Land and Water Laboratory on the Waite Campus, Adelaide,South Australia.
References
[1] Y. Jin, M. Flury, Fate and transport of viruses in porous media, Adv. Agron. 77(2002) 39–102.
[2] S.A. Bradford, S. Torkzaban, H. Kim, J. Simunek, Modeling colloid and microor-ganism transport and release with transients in solution ionic strength, WaterResour. Res. 48 (2012).
[3] S. Torkzaban, J. Wan, T.K. Tokunaga, S.A. Bradford, Impacts of bridging complex-ation on the transport of surface-modified nanoparticles in saturated sand, J.Contam. Hydrol. 136–137 (2012) 86–95.
[4] A.R. Petosa, D.P. Jaisi, I.R. Quevedo, M. Elimelech, N. Tufenkji, Aggregationand deposition of engineered nanomaterials in aquatic environments: role ofphysicochemical interactions, Environ. Sci. Technol. 44 (2010) 6532–6549.
[5] J.F. Schijven, S.M. Hassanizadeh, Removal of viruses by soil passage: overview ofmodeling, processes, and parameters, Crit. Rev. Environ. Sci. Technol. 30 (2000)49–127.
[6] R. Anders, C.V. Chrysikopoulos, Virus fate and transport during artificialrecharge with recycled water, Water Resour. Res. 41 (2005) W10415,http://dx.doi.org/10.1029/2004WR003419.
[7] N. Solovitch, J. Labille, J. Rose, P. Chaurand, D. Borschneck, M.R. Wiesner, J.Y.Bottero, Concurrent aggregation and deposition of TiO2 nanoparticles in a sandyporous media, Environ. Sci. Technol. 44 (2010) 4897–4902.
[8] D.P. Jaisi, M. Elimelech, Single-walled carbon nanotubes exhibit limited trans-port in soil columns, Environ. Sci. Technol. 43 (2009) 9161–9166.

1 : Phys
[
[
[
[
[
[
[
[
[
[
[
[
[
[
[
[
[
[
[
[
[
[
[
[
[
[
[
[
[
[
[
[
[
[
[
[
[
[
[
[
[
[
[
[
[
[
[
[
[
[
[
[
[
[
[
[
[
[
[
[
78 S. Sasidharan et al. / Colloids and Surfaces A
[9] A.J. Pelley, N. Tufenkji, Effect of particle size and natural organic matter on themigration of nano- and microscale latex particles in saturated porous media, J.Colloid Interface Sci. 321 (2008) 74–83.
10] S.A. Bradford, Y. Wang, H. Kim, S. Torkzaban, J. Simunek, Modeling microor-ganism transport and survival in the subsurface, J. Environ. Qual. 43 (2014)421–440.
11] S. Torkzaban, Y. Kim, M. Mulvihill, J. Wan, T.K. Tokunaga, Transport and deposi-tion of functionalized CdTe nanoparticles in saturated porous media, J. Contam.Hydrol. 118 (2010) 208–217.
12] Y. Li, Y. Wang, K.D. Pennell, L.M.A. Briola, Investigation of the transport anddeposition of fullerene (C60) nanoparticles in quartz sands under varying flowconditions, Environ. Sci. Technol. 42 (2008) 7174–7180.
13] J. Virkutyte, S.R. Al-Abed, H. Choi, C. Bennett-Stamper, Distinct structuralbehavior and transport of TiO2 nano- and nanostructured particles in sand,Colloids Surf. A 443 (2014) 188–194.
14] Z. Adamczyk, A. Bratek, E. Szelag, A. Bastrzyk, A. Michna, J. Barbasz, Colloidparticle deposition on heterogeneous surfaces produced by polyelectrolyteadsorption, Colloids Surf. A 343 (2009) 111–117.
15] S.A. Bradford, S. Torkzaban, Colloid interaction energies for physically andchemically heterogeneous porous media, Langmuir 29 (2013) 3668–3676.
16] Y. Wang, Y. Li, J.D. Fortner, J.B. Hughes, L.M. Abriola, K.D. Pennell, Transportand retention of nanoscale C60 aggregates in water-saturated porous media,Environ. Sci. Technol. 42 (2008) 3588–3594.
17] J. Shang, C. Liu, Z. Wang, Transport and retention of engineered nanoporousparticles in porous media: effects of concentration and flow dynamics, ColloidsSurf. A 417 (2013) 89–98.
18] Y. Jin, Y. Chu, Y. Li, Virus removal and transport in saturated and unsaturatedsand columns, J. Contam. Hydrol. 43 (2000) 111–128.
19] S. Torkzaban, S.A. Bradford, J. Wan, T. Tokunaga, A. Masoudih, Release of quan-tum dot nanoparticles in porous media: role of cation exchange and aging time,Environ. Sci. Technol. 47 (2013) 11528–11536.
20] C. Shen, L.-P. Wang, B. Li, Y. Huang, Y. Jin, Role of surface roughness in chemicaldetachment of colloids deposited at primary energy minima, Vadose Zone J. 11(2012).
21] C. Shen, B. Li, Y. Huang, Y. Jin, Kinetics of coupled primary- and secondary-minimum deposition of colloids under unfavorable chemical conditions,Environ. Sci. Technol. 41 (2007) 6976–6982.
22] Y. Liang, S.A. Bradford, J. Simunek, M. Heggen, H. Vereecken, E. Klumpp, Reten-tion and remobilization of stabilized silver nanoparticles in an undisturbedloamy sand soil, Environ. Sci. Technol. 47 (2013) 12229–12237.
23] Z. Adamczyk, M. Nattich-Rak, M. Sadowska, A. Michna, K. Szczepaniak, Mech-anisms of nanoparticle and bioparticle deposition – kinetic aspects, ColloidsSurf. A 439 (2013) 3–22.
24] Z. Adamczyk, B. Siwek, M. Zembala, P. Belouschek, Kinetics of local-ized adsorption of colloid particles, Adv. Colloid Interface Sci. 48 (1994)151–280.
25] P.R. Johnson, M. Elimelech, Dynamics of colloid deposition in porous media:blocking based on random sequential adsorption, Langmuir 11 (1995)801–812.
26] J. Talbot, P. Schaaf, Random sequential adsorption of mixtures, Phys. Rev. A 40(1989) 422–427.
27] Z. Adamczyk, B. Siwek, E. Musiał, Latex particle adsorption at heterogeneoussurfaces, Colloids Surf. A 214 (2003) 219–229.
28] M.T.J. van Loenhout, E. Stefan Kooij, H. Wormeester, B. Poelsema, Hydro-dynamic flow induced anisotropy in colloid adsorption, Colloids Surf. A 342(2009) 46–52.
29] A. Massoudieh, N. Lu, X. Liang, T.H. Nguyen, T.R. Ginn, Bayesian process-identification in bacteria transport in porous media, J. Contam. Hydrol. 153(2013) 78–91.
30] S.A. Bradford, S. Torkzaban, J. Simunek, Modeling colloid transport and reten-tion in saturated porous media under unfavorable attachment conditions,Water Resour. Res. 47 (2011).
31] S.S. Tazehkand, S. Torkzaban, S.A. Bradford, S.L. Walker, Cell preparation meth-ods influence Escherichia coli D21g surface chemistry and transport in saturatedsand, J. Environ. Qual. 37 (2008) 2108–2115.
32] I.R. Quevedo, N. Tufenkji, Influence of solution chemistry on the deposition anddetachment kinetics of a CdTe quantum dot examined using a quartz crystalmicrobalance, Environ. Sci. Technol. 43 (2009) 3176–3182.
33] C. Shani, N. Weisbrod, A. Yakirevich, Colloid transport through saturated sandcolumns: influence of physical and chemical surface properties on deposition,Colloids Surf. A 316 (2008) 142–150.
34] S. Torkzaban, S.A. Bradford, M.T. van Genuchten, S.L. Walker, Colloid transportin unsaturated porous media: the role of water content and ionic strength onparticle straining, J. Contam. Hydrol. 96 (2008) 113–127.
35] S. Kalasin, S. Martwiset, E. Bryan Coughlin, M.M. Santore, Particle cap-ture via discrete binding elements: systematic variations in binding energyfor randomly distributed nanoscale surface features, Langmuir 26 (2010)16865–16870.
36] T. Rizwan, S. Bhattacharjee, Particle deposition onto charge-heterogeneoussubstrates, Langmuir 25 (2009) 4907–4918.
37] C.H. Ko, M. Elimelech, The ‘shadow effect’ in colloid transport and deposition
dynamics in granular porous media: measurements and mechanisms, Environ.Sci. Technol. 34 (2000) 3681–3689.38] L. Song, M. Elimelech, Calculation of particle deposition rate underunfavourable particle–surface interactions, J. Chem. Soc. Faraday Trans. 89(1993) 3443–3452.
[
[
icochem. Eng. Aspects 457 (2014) 169–179
39] S. Torkzaban, S.A. Bradford, S.L. Walker, Resolving the coupled effects of hydro-dynamics and DLVO forces on colloid attachment in porous media, Langmuir23 (2007) 9652–9660.
40] S.A. Bradford, S. Torkzaban, A. Shapiro, A theoretical analysis of colloid attach-ment and straining in chemically heterogeneous porous media, Langmuir 29(2013) 6944–6952.
41] S.A. Bradford, S. Torkzaban, F. Leij, J. Simunek, M.T. van Genuchten, Modelingthe coupled effects of pore space geometry and velocity on colloid transportand retention, Water Resour. Res. 45 (2009).
42] A. Kalantariasl, P. Bedrikovetsky, Stabilization of external filter cake by colloidalforces in a well-reservoir system, Ind. Eng. Chem. Res. 53 (2013) 930–944.
43] P. Bedrikovetsky, F.D. Siqueira, C.A. Furtado, A.L.S. Souza, Modified particledetachment model for colloidal transport in porous media, Transp. Porous Med.86 (2011) 353–383.
44] N. Tufenkji, M. Elimelech, Spatial distributions of Cryptosporidium oocysts inporous media: evidence for dual mode deposition, Environ. Sci. Technol. 39(2005) 3620–3629.
45] K.E. Nelson, T.R. Ginn, New collector efficiency equation for colloid filtration inboth natural and engineered flow conditions, Water Resour. Res. 47 (2011).
46] H. Yuan, A.A. Shapiro, A mathematical model for non-monotonic depositionprofiles in deep bed filtration systems, Chem. Eng. J. 166 (2011) 105–115.
47] K.-M. Yao, M.T. Habibian, C.R. O’Melia, Water and waste water filtration. Con-cepts and applications, Environ. Sci. Technol. 5 (1971) 1105–1112.
48] Z.A. Kuznar, M. Elimelech, Direct microscopic observation of particle depositionin porous media: role of the secondary energy minimum, Colloids Surf. A 294(2007) 156–162.
49] M. Elimelech, Effect of particle size on the kinetics of particle deposition underattractive double layer interactions, J. Colloid Interface Sci. 164 (1994) 190–199.
50] B.V. Derjaguin, L. Landau, Theory of the stability of stongly charged lyophobicsols and the adhesion of strongly charged particles in solution of electrolytes,Acta Physiochim. URS (1941) 633–662.
51] E.J.W. Verwey, Theory of the stability of lyophobic colloids, J. Phys. ColloidChem. 51 (1947) 631–636.
52] J. Gregory, A.J. Wishart, Deposition of latex particles on alumina fibers, ColloidsSurf. 1 (1980) 313–334.
53] J. Bergendahl, D. Grasso, Prediction of colloid detachment in a model porousmedia: thermodynamics, AIChE J. 45 (1999) 475–484.
54] J. Gregory, Interaction of unequal double layers at constant charge, J. ColloidInterface Sci. 51 (1975) 44–51.
55] J. Simunek, M.Th. van Genuchten, M. Sejna, The HYDRUS-1D software packagefor simulating the one-dimensional movement of water, heat, and multiplesolutes in variably-saturated media – version 3.0, HYDRUS software series1, Department of Environmental Sciences, University of California Riverside,Riverside, CA, 2005, pp. 240 pp.
56] H.N. Kim, S.A. Bradford, S.L. Walker, Escherichia coli O157:H7 transport in sat-urated porous media: role of solution chemistry and surface macromolecules,Environ. Sci. Technol. 43 (2009) 4340–4347.
57] J.N. Israelachvili, Intermolecular and Surface Forces, Academic Press, London;San Diego, 1991.
58] S.A. Bradford, S. Torkzaban, A. Wiegmann, Pore-scale simulations to determinethe applied hydrodynamic torque and colloid immobilization, Vadose Zone J.10 (2011) 252.
59] E.M.V. Hoek, G.K. Agarwal, Extended DLVO interactions between spherical par-ticles and rough surfaces, J. Colloid Interface Sci. 298 (2006) 50–58.
60] B. Harmand, E. Rodier, M. Sardin, J. Dodds, Transport and capture of submi-cron particles in a natural sand: short column experiments and a linear model,Colloids Surf. A: Physicochem. Eng. Aspects 107 (1996) 233–244.
61] R.C. Bales, S.R. Hinkle, T.W. Kroeger, K. Stocking, C.P. Gerba, Bacteriophageadsorption during transport through porous media: chemical perturbationsand reversibility, Environ. Sci. Technol. 25 (1991) 2088–2095.
62] J.F. Schijven, S.M. Hassanizadeh, R.H.A.M. De Bruin, Two-site kinetic modelingof bacteriophages transport through columns of saturated dune sand, J. Contam.Hydrol. 57 (2002) 259–279.
63] N. Tufenkji, M. Elimelech, Breakdown of colloid filtration theory: role of thesecondary energy minimum and surface charge heterogeneities, Langmuir 21(2005) 841–852.
64] M.M. Santore, N. Kozlova, Micrometer scale adhesion on nanometer-scalepatchy surfaces: adhesion rates, adhesion thresholds, and curvature-basedselectivity, Langmuir 23 (2007) 4782–4791.
65] R.D. Duffadar, J.M. Davis, Interaction of micrometer-scale particles withnanotextured surfaces in shear flow, J. Colloid Interface Sci. 308 (2007)20–29.
66] S.A. Bradford, S. Torkzaban, Colloid adhesive parameters for chemically hetero-geneous porous media, Langmuir 28 (2012) 13643–13651.
67] R. Chatterjee, S.K. Mitra, S. Bhattacharjee, Particle deposition onto Janus andpatchy spherical collectors, Langmuir 27 (2011) 8787–8797.
68] K. Malysa, T. Dabros, T.G.M. Van De Ven, The sedimentation of one sphere pasta second attached to a wall, J. Fluid Mech. 162 (1986) 157–170.
69] J.M. Meinders, J. Noordmans, H.J. Busscher, Simultaneous monitoring of theadsorption and desorption of colloidal particles during deposition in a parallelplate flow chamber, J. Colloid Interface Sci. 152 (1992) 265–280.
70] T.G.M. van de Ven, P. Warszynski, X. Wu, T. Dabros, Colloidal particle scattering.A new method to measure surface forces, Langmuir 10 (1994) 3046–3056.
71] R.D. Duffadar, J.M. Davis, Dynamic adhesion behavior of micrometer-scale par-ticles flowing over patchy surfaces with nanoscale electrostatic heterogeneity,J. Colloid Interface Sci. 326 (2008) 18–27.

: Phys
[
[
[
[
[
[
[
[
[
S. Sasidharan et al. / Colloids and Surfaces A
72] R. Duffadar, S. Kalasin, J.M. Davis, M.M. Santore, The impact of nanoscalechemical features on micron-scale adhesion: crossover from heterogeneity-dominated to mean-field behavior, J. Colloid Interface Sci. 337 (2009)396–407.
73] M. Bendersky, J.M. Davis, DLVO interaction of colloidal particles with topo-graphically and chemically heterogeneous surfaces, J. Colloid Interface Sci. 353(2011) 87–97.
74] D. Janjaroen, Y. Liu, M.S. Kuhlenschmidt, T.B. Kuhlenschmidt, T.H. Nguyen, Roleof divalent cations on deposition of Cryptosporidium parvum oocysts on naturalorganic matter surfaces, Environ. Sci. Technol. 44 (2010) 4519–4524.
75] S.B. Roy, D.A. Dzombak, Na+–Ca2+ exchange effects in the detachment of latexcolloids deposited in glass bead porous media, Colloids Surf. A 119 (1996)133–139.
76] T. Dabros, T.G.M. van de Ven, A direct method for studying particle depositiononto solid surfaces, Colloid Polym. Sci. 261 (1983) 694–707.
[
icochem. Eng. Aspects 457 (2014) 169–179 179
77] J.M. Meinders, H.J. Busscher, Influence of ionic strength and shear rate onthe desorption of polystyrene particles from a glass collector as studied in aparallel-plate flow chamber, Colloids Surf. A 80 (1993) 279–285.
78] L.C. Xu, V. Vadillo-Rodriguez, B.E. Logan, Residence time, loading force, pH, andionic strength affect adhesion forces between colloids and biopolymer-coatedsurfaces, Langmuir 21 (2005) 7491–7500.
79] L.C. Xu, B.E. Logan, Adhesion forces between functionalized latex micro-spheres and protein-coated surfaces evaluated using colloid probe atomic forcemicroscopy, Colloids Surf. B: Biointerfaces 48 (2006) 84–94.
80] K.M. Wiencek, M. Fletcher, Bacterial adhesion to hydroxyl- and methyl-
terminated alkanethiol self-assembled monolayers, J. Bacteriol. 177 (1995)1959–1966.81] J.M. Meinders, H.C. van der Mei, H.J. Busscher, Deposition efficiency andreversibility of bacterial adhesion under flow, J. Colloid Interface Sci. 176 (1995)329–341.
Related Documents


