Contents Foreword....................................................................................................1 Higher Education in India Introduction...................................................................................................3 Institutional Expansion..................................................................................5 Initiatives in Higher Education ....................................................................10 Status of Higher Education in Andhra Pradesh..............................................................17 Arunachal Pradesh.........................................................32 Assam.............................................................................41 Bihar................................................................................56 Chhattisgarh.................................................................... 70 Delhi................................................................................ 80 Goa…………………………………………………………..89 Gujarat…………………………………………………...….97 Haryana…………………………………………………..…110 Himachal Pradesh………………………………………....120 Jammu & Kashmir……………………............................. 134 Jharkhand………………………………………………….. 147 Jharkhand………………………………………………….. 147 Karnataka………………………………………………...…155 Kerala………………………………………………………. 170 Madhya Pradesh…………………………………………...177 Maharashtra………………………………………………...192 Manipur………………………………………………………201 Meghalaya…………………………………………………. 213 Mizoram………………………………………………..……223 Nagaland……………………………………………..……. 235 Odisha………………………………………………………. 246 Puducherry………………………………………..……….. 260 Punjab………………………………………………….……272 Rajasthan……………………………………………………286 Sikkim…………………………………………………..……296 Tamil Nadu…………………………………………………..308 Tripura…………………………………………………….… 318 Uttar Pradesh………………………………………….……330 Uttarakhand...……………………………………………….343 West Bengal….……………………………………………. 351 Brief Note on Certain Union Territories…………………………..…..….364 References…………………………………………………………………….367

Welcome message from author
This document is posted to help you gain knowledge. Please leave a comment to let me know what you think about it! Share it to your friends and learn new things together.
Transcript
ContentsForeword....................................................................................................1
Higher Education in India
Introduction...................................................................................................3
Institutional Expansion..................................................................................5
Initiatives in Higher Education ....................................................................10
Status of Higher Education in
Andhra Pradesh..............................................................17
Arunachal Pradesh.........................................................32
Assam.............................................................................41
Bihar................................................................................56
Chhattisgarh.................................................................... 70
Delhi................................................................................ 80
Goa…………………………………………………………..89
Gujarat…………………………………………………...….97
Haryana…………………………………………………..…110
Himachal Pradesh………………………………………....120
Jammu & Kashmir……………………............................. 134
Jharkhand………………………………………………….. 147Jharkhand………………………………………………….. 147
Karnataka………………………………………………...…155
Kerala………………………………………………………. 170
Madhya Pradesh…………………………………………...177
Maharashtra………………………………………………...192
Manipur………………………………………………………201
Meghalaya…………………………………………………. 213
Mizoram………………………………………………..……223
Nagaland……………………………………………..……. 235
Odisha………………………………………………………. 246
Puducherry………………………………………..……….. 260
Punjab………………………………………………….……272
Rajasthan……………………………………………………286
Sikkim…………………………………………………..……296
Tamil Nadu…………………………………………………..308
Tripura…………………………………………………….… 318
Uttar Pradesh………………………………………….……330
Uttarakhand...……………………………………………….343
West Bengal….……………………………………………. 351
Brief Note on Certain Union Territories…………………………..…..….364
References…………………………………………………………………….367

1 | ASHE - Annual Status of Higher Education in States and UTs, 2012
Pawan Agarwal Adviser, Higher Education Planning Commission
Foreword
With a majority of higher education enrolment in State Universities and Colleges and almost all private-unaided colleges affiliated to State Universities, the States are the key stakeholders in higher education. However, until recently there has been little focus on state universities and colleges. Even the central funding that flows through the University Grants Commission is very small and thinly spread. As a result, its impact on development of higher education in the States and UTs is not very significant. There is also a lack of holistic thinking and integrated planning at state level for higher education. Twelfth Five Year Plan seeks to address these issues. This report is being brought out as an attempt towards this.
This report, Annual Status of Higher Education in States and UTs, 2012 (ASHE, 2012) maps the higher education systems in all State and Union Territories (UTs). The report provides socio-economic profile, institutional and enrolment data, growth trends, key indicators of higher education, and labour market information with a view to create a framework for holistic thinking of the higher education in the States and its linkages with the demographic trends and schooling on one hand and economy and labour markets conditions on the other. Issues of access, equity, infrastructure, staffing and financing are covered where possible.
Since, this report has been brought out in a short time and is entirely based on data from secondary sources; there are gaps and inconsistencies in data. It is hoped that the gaps would be filled up, inconsistencies removed and presentation improved in the subsequent editions of this report.
I am pleased to acknowledge the support received from Eduvisors, an education sector focused research and consulting firm towards collection and compilation of data and the subsequent analysis in this report. Finally, I would like to convey our gratitude to Confederation of Indian Industry (CII), New Delhi for working with the Planning Commission on this report and integrating State Specific Sessions as part of CII’s Fourth Global Higher Education Summit, 2012. Support and guidance received from the Ministry of HRD, UGC and the World Bank is also duly acknowledged.
New Delhi, 1 November 2012
Pawan Agarwal
2
2 | AASHHE
Ca
Tot
Tot
Po
Nu
Nu
Lite
Sex
Gro(In
Pe
- A
pita
tal
tal
pu
umb
umb
era
x R
ossRs
r C
Ann
al
Are
Po
lati
ber
ber
acy
Rati
s Ds. C
Cap
nua
ea
opu
ion
of
of
y Ra
io (
DomCro
ita
l St
(in
ulat
n De
Sta
Un
ate
(pe
mesre)
Inc
tatu
sq
ion
ens
ate
nion
(%
r 1,
stic
com
us o
q. k
n
sity
es
n T
%)
,00
Pr
me,
of H
km.)
y (p
Terr
0 m
rod
, 20
High
)
per
rito
mal
uct
011
her
sq.
orie
es)
t, 2
-12
Ed
. km
es
)
2011
2 (R
duca
m.)
1-1
Rs.)
atio
C
2
)
on i
Cou
in S
In
ntr
Stat
di
ry P
tes
a
Pro
an
ofile
d U
e
UTs
s, 2
012
1,
2
Ne
3,
,21
52
3
ew
287
,01
370
2
7
74
94
2,22
38,0
De
7,26
,93
0.6
28
7
.04
40
2,02
005
elhi
63
3,42
6
4
27
5
22
3 | ASHE - Annual Status of Higher Education in States and UTs, 2012
Introduction
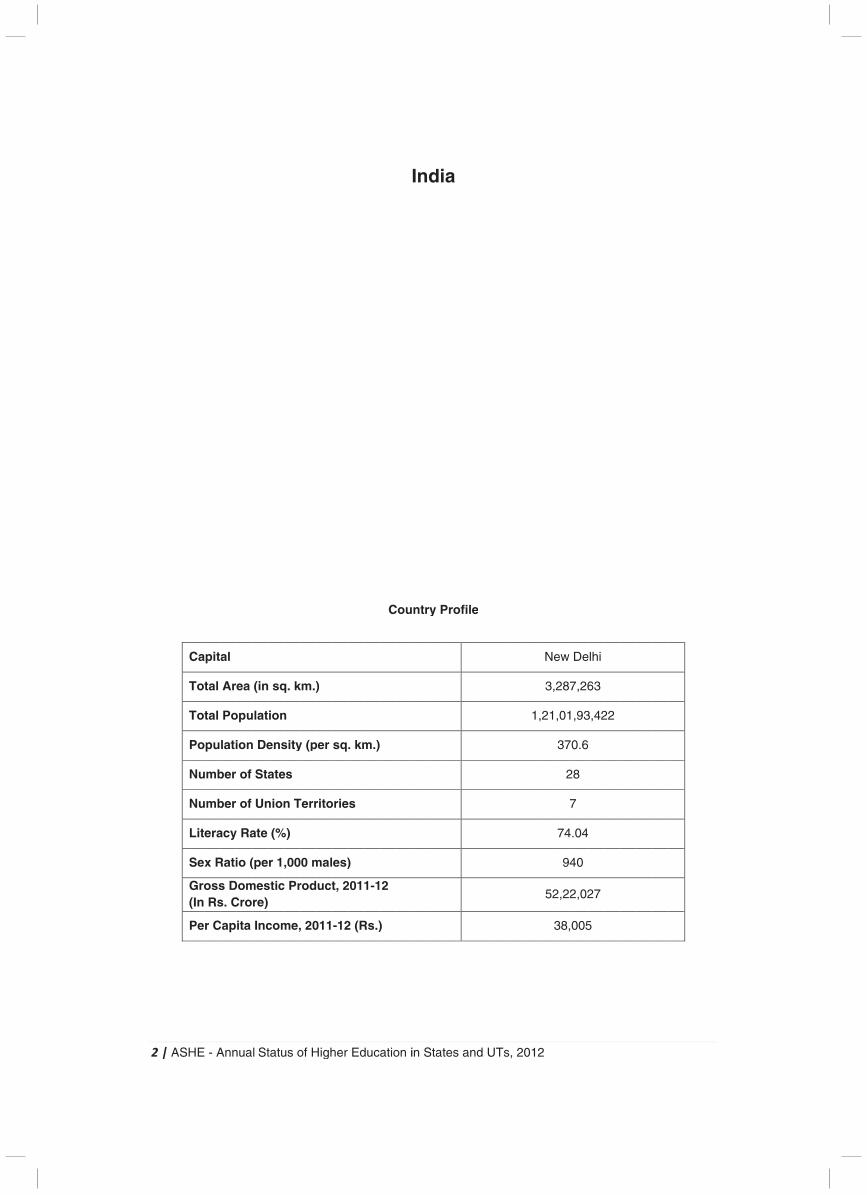
India officially known as the Republic of India is located in South Asia and it came into existence on the 15th of August 1947. The name of the country is derived from ‘Indus’, which in turn originates from the Old Persian word ‘Hindu’. Many Indian languages in various subtle guises use the geographical term Bharat that is recognized by the Constitution of India as an official name for the country1.
Bounded by the Indian Ocean in the south, the Arabian Sea in the south-west, and the Bay of Bengal in the south-east, it shares land borders with Pakistan in the west; China, Nepal, and Bhutan in the north-east; and Burma and Bangladesh in the east. The country is the seventh largest in the world in terms of area and is the second most populous country in the world, only second to China. However, it is the most populous democracy in the world.
The economy of India is the tenth largest in terms of nominal Gross Domestic Product (GDP) and third largest by Purchasing Power Parity (PPP)2 . In 1991, the country witnessed market-based economic reforms in the form of Liberalization, Privatization & Globalization (LPG) and thus began India’s journey to become one of the fastest-growing major economies of the world. However, it continues to face the challenges of poverty, illiteracy, corruption, malnutrition, and inadequate public healthcare. The 48.76 crore worker labour force is the world's second largest, as of 2011.3 The service sector makes up 55.6% of GDP, whereas the industrial and agricultural sector contributes 26.3% and 18.1% respectively. The major agricultural products include rice, wheat, oilseed, cotton, jute, tea, sugarcane, and potatoes4 and the major industries include textiles, telecommunications, chemicals, food processing, steel, transport equipment, cement, mining, petroleum, machinery, and software.
Coming to the higher education scenario in the country we find that despite considerable progress during the Eleventh Five Year Plan i.e. 2006-07 to 2011-12, less than 20% of the estimated 120 million potential students are enrolled in the higher education institutes in India. The Indian higher education system has emerged as one of the largest in the world, with 14.6 million students enrolled in more than 31,000 institutions. The number of institutions has grown at a CAGR of 11% while student enrolment has grown at a CAGR of 6%. However, despite these growth figures, the Gross Enrolment Ratio (GER) of India (15%) is significantly lower than the world average of about 26%. In addition, there is wide disparity in enrolment figures across states, between urban and rural areas and faculties.
It is expected that the number of eligible students will double by the year 2020, thus increasing the pressure to provide access to effective higher education. In addition to quantity, the quality of education currently being delivered is also a key area of concern. Issues like shortage of trained qualified faculty, poor infrastructure and outdated curricula plague several institutes. The employability of the students graduating from the current higher education institutes is also questionable, with the industry still facing concerns of shortage of qualified manpower in India. The standards of research and teaching at Indian universities are also far below the international standards. A testament to this is the fact that no Indian university is currently featured in any of the rankings of the top 200 international universities.
However, during the Eleventh Five Year Plan, considerable momentum has been generated in the establishment of new higher education institutes and increasing enrolment. The nation has been successful in crossing the threshold of 15% GER, thus moving the country from being an ‘elite’ to a ‘mass’ higher education system. Going forward, the focus is on sustaining the momentum by focusing
1 Ministry of Law and Justice 2008 2 GDP (current US$) Data in 2011", World Bank database 3 Ministry of Labour & Employment, Govt. of India 4Central Statistical Organization
4 | ASHE - Annual Status of Higher Education in States and UTs, 2012
on the ‘Three E’s- Expansion, Equity and Excellence’. The focus is necessarily required to be not just on increasing access and increasing enrolments, but also on providing quality education, thus creating skilled manpower. With the current growth being skewed in favour of certain regions, disciplines and sector; it is imperative that greater diversity is achieved through expansion strategies implemented across the states.
Being a large and diverse nation, decentralization in terms of higher education strategy development and implementation is crucial, with a collaborated relationship between the centre and the states; rather than one of control. Synergies have to be established between each of the 35 states and union territories and the central government, in ensuring effective disbursement, sharing and utilization of resources. Only through effective state participation would it be possible to bring about administrative, academic and financial reforms in the state higher education systems.
In the Twelfth Five Year Plan i.e. 2011-12 to 2016-17, one of the key strategies is to recognize the various state education systems as the principal site for expansion and to focus on the average quality of state institutions. A multi-dimensional challenge, this would require simultaneous actions by both the central and the state governments. Such initiatives are essential not only to ensure the growth of the nation into a global powerhouse, but also to meet the social challenges and the rising aspirations of the nation’s youth. A clear articulation of the various current challenges faced by each of the states, and a shared understanding of the solutions, and designing of implementation strategies specifically designed to meet the state’s challenges is necessary to chart the nation’s growth in the coming years.5
As a result of disparity in quality capacities, students with intent to pursue higher education and employment invariably migrate to other states in India or abroad to obtain the same. A trend analysis of reasons for this migration evinces the largest reasons for migration of students from north eastern region is not only to pursue higher education like research and PhDs but also a basic level of higher education like graduation. This migration is a major concern. Statistics reveal 95% of students from the northeast region (NER) do not come back to these states after obtaining higher education elsewhere. During the period 2005 to 2009, maximum number of students had gone abroad for Research & PhD, which is regarded as the most promising talent pool.
Universities and University Level Institutes in India
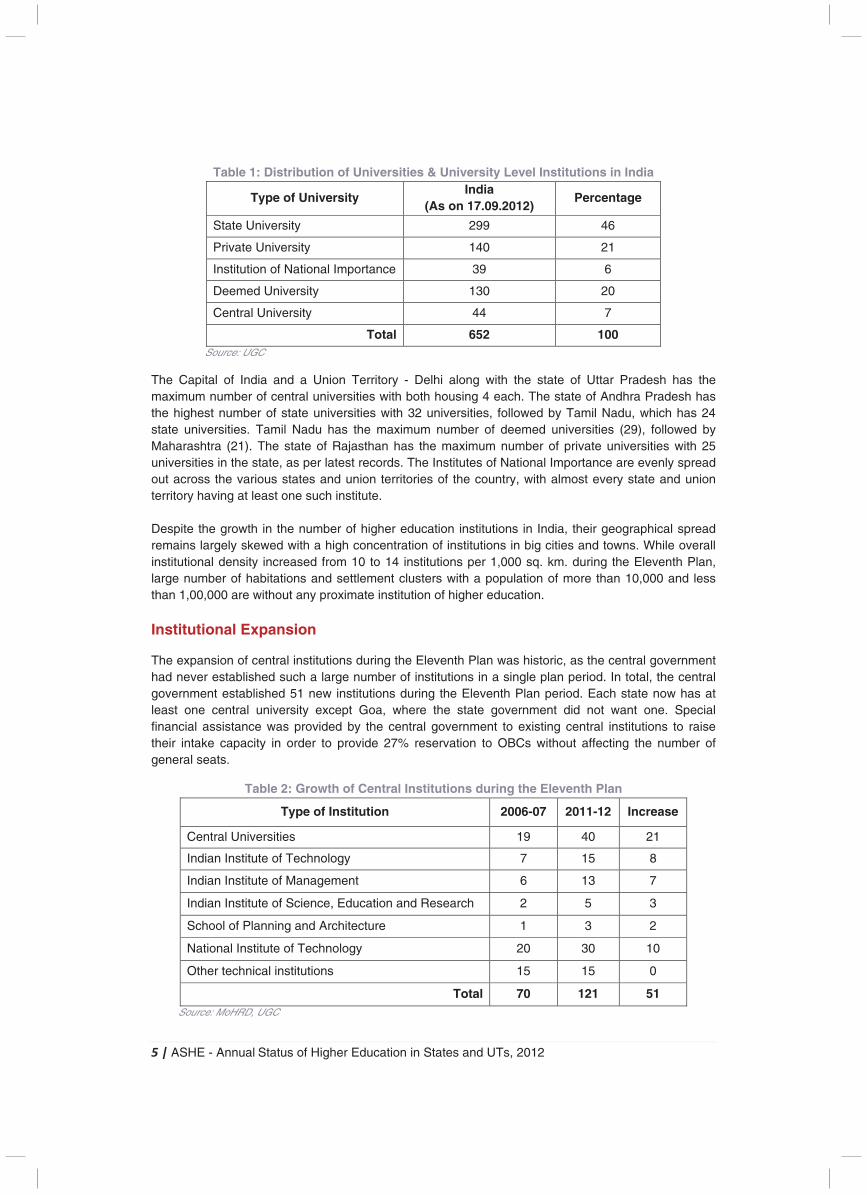
The higher education landscape of the country is characterized by 299 state universities, 140 private universities, 130 deemed universities and 44 central universities (as per the latest records released by Universities Grants Commission in September 2012). Along with these universities, the country houses 39 Institutes of National Importance (INI) that specialize in the fields of engineering & technology, management, medical sciences, languages, information technology, statistical research, pharmaceutical education & research and petroleum studies. In total, the country has 652 universities and university level institutes that impart higher and technical education and provide affiliation to more than 33,000 colleges and institutes in the country.
5Main Plan Document on Higher Education in India, Twelfth Five Year Plan
5 | ASHE - Annual Status of Higher Education in States and UTs, 2012
Table 1: Distribution of Universities & University Level Institutions in India
Type of University India
(As on 17.09.2012) Percentage
State University 299 46
Private University 140 21
Institution of National Importance 39 6
Deemed University 130 20
Central University 44 7
Total 652 100 Source: UGC
The Capital of India and a Union Territory - Delhi along with the state of Uttar Pradesh has the maximum number of central universities with both housing 4 each. The state of Andhra Pradesh has the highest number of state universities with 32 universities, followed by Tamil Nadu, which has 24 state universities. Tamil Nadu has the maximum number of deemed universities (29), followed by Maharashtra (21). The state of Rajasthan has the maximum number of private universities with 25 universities in the state, as per latest records. The Institutes of National Importance are evenly spread out across the various states and union territories of the country, with almost every state and union territory having at least one such institute. Despite the growth in the number of higher education institutions in India, their geographical spread remains largely skewed with a high concentration of institutions in big cities and towns. While overall institutional density increased from 10 to 14 institutions per 1,000 sq. km. during the Eleventh Plan, large number of habitations and settlement clusters with a population of more than 10,000 and less than 1,00,000 are without any proximate institution of higher education.
Institutional Expansion
The expansion of central institutions during the Eleventh Plan was historic, as the central government had never established such a large number of institutions in a single plan period. In total, the central government established 51 new institutions during the Eleventh Plan period. Each state now has at least one central university except Goa, where the state government did not want one. Special financial assistance was provided by the central government to existing central institutions to raise their intake capacity in order to provide 27% reservation to OBCs without affecting the number of general seats.
Table 2: Growth of Central Institutions during the Eleventh Plan
Type of Institution 2006-07 2011-12 Increase
Central Universities 19 40 21
Indian Institute of Technology 7 15 8
Indian Institute of Management 6 13 7
Indian Institute of Science, Education and Research 2 5 3
School of Planning and Architecture 1 3 2
National Institute of Technology 20 30 10
Other technical institutions 15 15 0
Total 70 121 51 Source: MoHRD, UGC
6 | ASHE - Annual Status of Higher Education in States and UTs, 2012
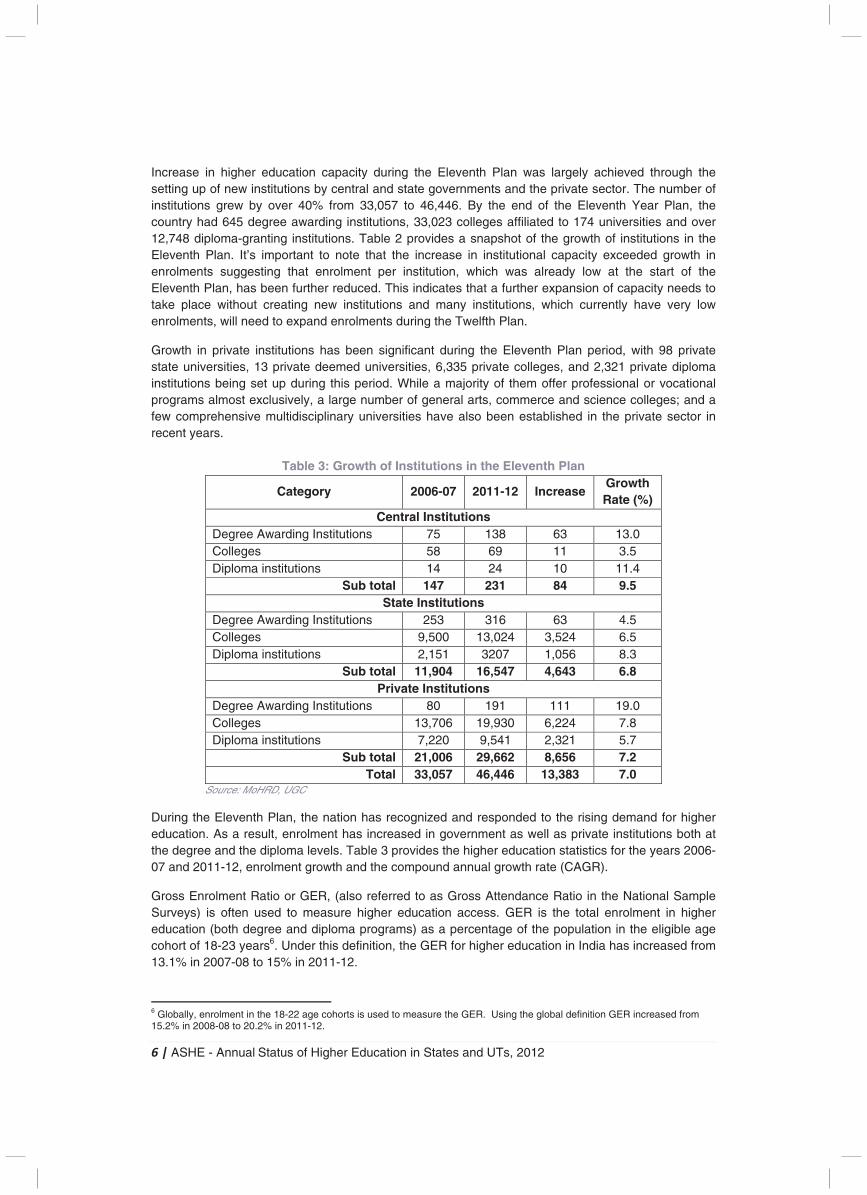
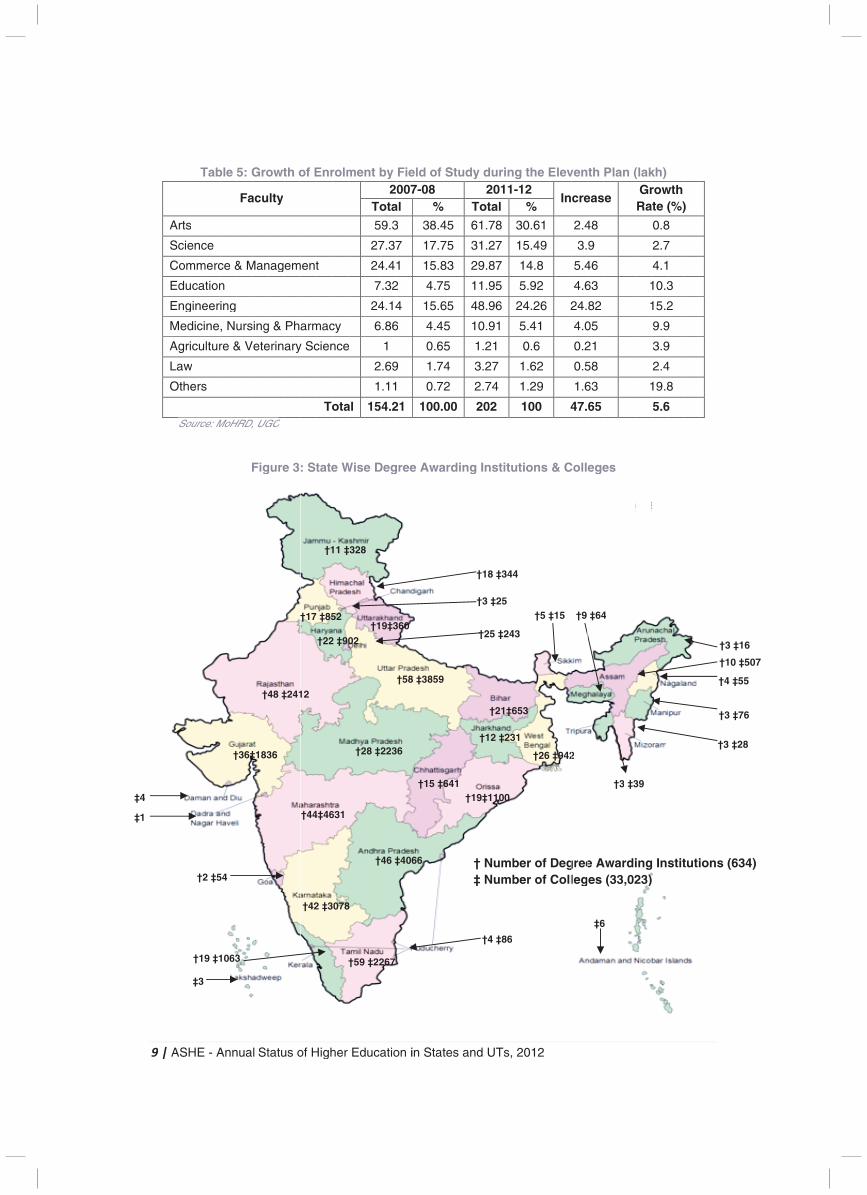
Increase in higher education capacity during the Eleventh Plan was largely achieved through the setting up of new institutions by central and state governments and the private sector. The number of institutions grew by over 40% from 33,057 to 46,446. By the end of the Eleventh Year Plan, the country had 645 degree awarding institutions, 33,023 colleges affiliated to 174 universities and over 12,748 diploma-granting institutions. Table 2 provides a snapshot of the growth of institutions in the Eleventh Plan. It’s important to note that the increase in institutional capacity exceeded growth in enrolments suggesting that enrolment per institution, which was already low at the start of the Eleventh Plan, has been further reduced. This indicates that a further expansion of capacity needs to take place without creating new institutions and many institutions, which currently have very low enrolments, will need to expand enrolments during the Twelfth Plan.
Growth in private institutions has been significant during the Eleventh Plan period, with 98 private state universities, 13 private deemed universities, 6,335 private colleges, and 2,321 private diploma institutions being set up during this period. While a majority of them offer professional or vocational programs almost exclusively, a large number of general arts, commerce and science colleges; and a few comprehensive multidisciplinary universities have also been established in the private sector in recent years.
Table 3: Growth of Institutions in the Eleventh Plan
Category 2006-07 2011-12 Increase Growth Rate (%)
Central Institutions Degree Awarding Institutions 75 138 63 13.0 Colleges 58 69 11 3.5 Diploma institutions 14 24 10 11.4
Sub total 147 231 84 9.5 State Institutions
Degree Awarding Institutions 253 316 63 4.5 Colleges 9,500 13,024 3,524 6.5 Diploma institutions 2,151 3207 1,056 8.3
Sub total 11,904 16,547 4,643 6.8 Private Institutions
Degree Awarding Institutions 80 191 111 19.0 Colleges 13,706 19,930 6,224 7.8 Diploma institutions 7,220 9,541 2,321 5.7
Sub total 21,006 29,662 8,656 7.2 Total 33,057 46,446 13,383 7.0
Source: MoHRD, UGC
During the Eleventh Plan, the nation has recognized and responded to the rising demand for higher education. As a result, enrolment has increased in government as well as private institutions both at the degree and the diploma levels. Table 3 provides the higher education statistics for the years 2006-07 and 2011-12, enrolment growth and the compound annual growth rate (CAGR).
Gross Enrolment Ratio or GER, (also referred to as Gross Attendance Ratio in the National Sample Surveys) is often used to measure higher education access. GER is the total enrolment in higher education (both degree and diploma programs) as a percentage of the population in the eligible age cohort of 18-23 years6. Under this definition, the GER for higher education in India has increased from 13.1% in 2007-08 to 15% in 2011-12.
6 Globally, enrolment in the 18-22 age cohorts is used to measure the GER. Using the global definition GER increased from 15.2% in 2008-08 to 20.2% in 2011-12.
7 | ASHE - Annual Status of Higher Education in States and UTs, 2012
Even though our higher education system is one of the largest in the world, the GER is far below the world average. The national target was to increase the GER to 15% by the end of the Eleventh Five Year period (2011-2012), which has been achieved, and 30% by 2020. While this goal requires higher capacity for intake, it also requires steps to improve access to higher education across gender and different social groups, and to bridge the rural-urban divide in order to ensure more equitable outcomes in educational participation.
Increased enrolments in the Eleventh Plan have enabled Indian higher education to cross the threshold of 15% GER, moving the country from an ‘elite’ to a ‘mass’ higher education system. Despite this growth, the unmet demand for access to higher education remains significant, indicating that a further expansion of access to higher education is required.
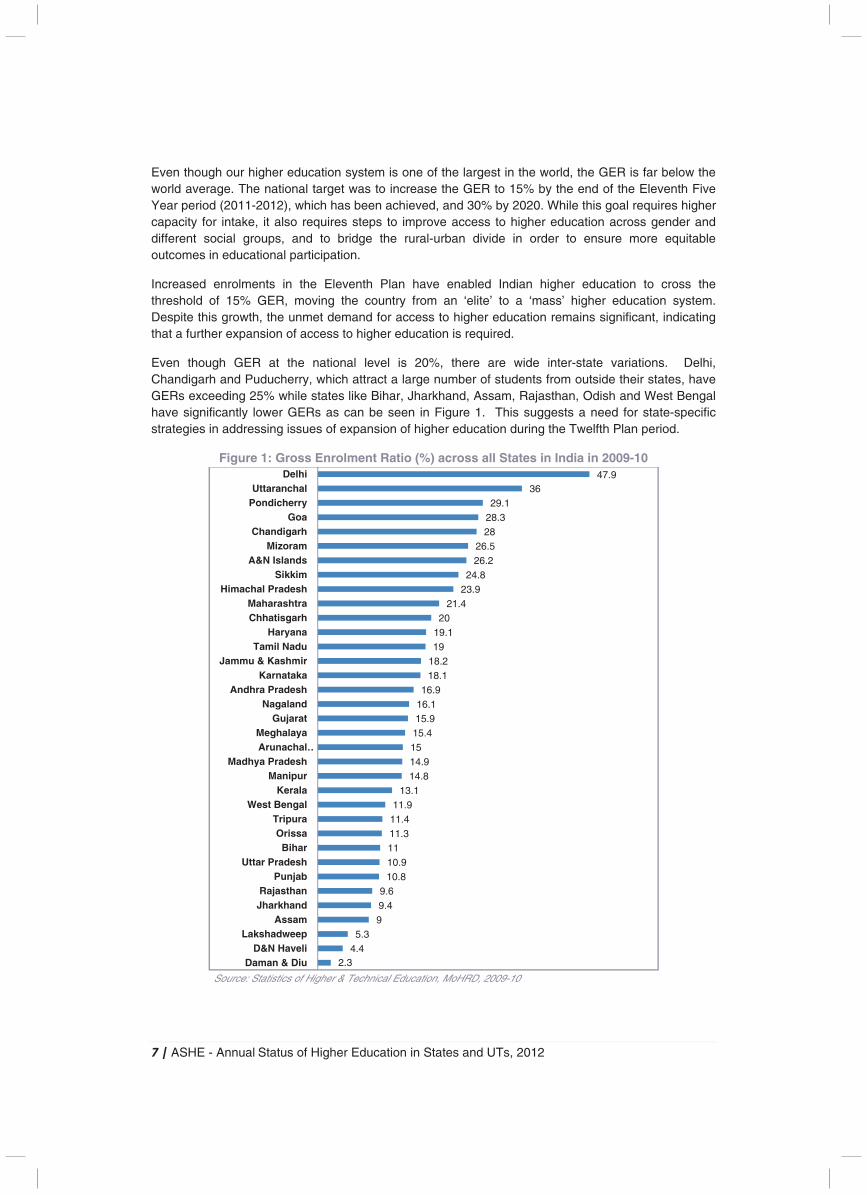
Even though GER at the national level is 20%, there are wide inter-state variations. Delhi, Chandigarh and Puducherry, which attract a large number of students from outside their states, have GERs exceeding 25% while states like Bihar, Jharkhand, Assam, Rajasthan, Odish and West Bengal have significantly lower GERs as can be seen in Figure 1. This suggests a need for state-specific strategies in addressing issues of expansion of higher education during the Twelfth Plan period.
Figure 1: Gross Enrolment Ratio (%) across all States in India in 2009-10
Source: Statistics of Higher & Technical Education, MoHRD, 2009-10
2.34.45.3
99.49.6
10.810.91111.311.411.9
13.114.814.91515.415.916.116.9
18.118.21919.120
21.423.924.8
26.226.5
2828.329.1
3647.9
Daman & DiuD&N Haveli
LakshadweepAssam
JharkhandRajasthan
PunjabUttar Pradesh
BiharOrissa
TripuraWest Bengal
KeralaManipur
Madhya PradeshArunachal …Meghalaya
GujaratNagaland
Andhra PradeshKarnataka
Jammu & KashmirTamil Nadu
HaryanaChhatisgarhMaharashtra
Himachal PradeshSikkim
A&N IslandsMizoram
ChandigarhGoa
PondicherryUttaranchal
Delhi

8 | ASHE - Annual Status of Higher Education in States and UTs, 2012
Table 4: Growth of Enrolment during the Eleventh Year Plan (lakh) Category 2006-07 2011-12 Increase CAGR (%)
By type of institutions Government 68.07 (44.15) 84.90 (42.03) 16.83 4.5 Central 3.46 (2.25) 5.10 (2.52) 1.64 8.1 State 64.61 (41.90) 79.80 (39.51) 15.19 4.3 Private 86.14 (55.86) 117.10 (57.97) 30.97 6.4
By degree / diploma Degree 133.32 (86.46) 169.68 (84.00) 36.36 4.9 Diploma 20.89 (13.55) 32.33 (16.00) 11.32 9.1
Total 154.21 202.00 47.80 5.6 Source: UGC, AICTE, NCTE and INC Note: Figures in parentheses are percentage of total for the year.
The state of Tamil Nadu has the maximum number of degree awarding institutes (9.3%), closely followed by Uttar Pradesh (9.14%) and Maharashtra (6.94%). These three states constitute over half the number of colleges in the country with 53.46% of all colleges situated in these states thereby making them the hubs for higher & technical education. However it must be noted that these states are also among the most populous states in the country with 31.73% of the population residing in these 3 states alone. Although Maharashtra and Tamil Nadu have GERs higher than the national average, at 21.4% and 19% respectively, the number of potential students without access to higher education is still high.
During the academic year 2010-11, among the students enrolled for higher education in India (across undergraduate, postgraduate and doctoral programs), the maximum number of students are enrolled in undergraduate programs (86%). 12% of the total number of students were enrolled in post graduate programs. The lack of focus on research in India is reflected in the fact that only 1% students were pursuing research in various areas as seen in Figure 2 below.
Figure 2: Students Enrolment by Level of Education in Higher Education in 2010-11
Source: Higher Education at Glance, UGC, 2010-11
The total enrolment across the various faculties has increased at a rate of 5.6% between 2007-08 and 2011-12. Among the various faculties, the maximum growth in enrolment has been seen in the faculties of engineering (15.2% growth), followed by teacher education (10.3%) and medicine, nursing & pharmacy (9.9%). As on 2011-12, the maximum students have been enrolled in faculty of arts (30.61%) followed by engineering (25.26%).
86%
12%
1% 1%
Graduate
Postgraduate
Research
Diploma/Certificate
‡1
‡4
9
1
4
9 | A
A
S
C
E
E
M
A
L
O
ASH
Arts
Scie
Com
Edu
Eng
Med
Agr
Law
Oth
So
HE
T
s
enc
mm
uca
gine
dici
ricu
w
hers
ource
‡3
†19
†2
- A
Tab
ce
merc
tion
eeri
ine,
ltur
s
ce: M
9 ‡1
2 ‡5
Ann
ble
ce &
n
ing
, Nu
re &
MoH
1063
54
†
nua
5: G
Fa
& M
urs
& V
HRD,
F
3
†36‡
l St
Gro
acu
Man
ing
Vete
D, UG
Fig
‡183
†4
tatu
owt
lty
nag
g &
erin
GC
gure
36
48 ‡
us o
th o
em
Ph
ary
e 3
†
‡241
of H
of E
ment
arm
y Sc
: St
†17
†42
†44
12
High
Enr
t
mac
cien
To
tate
†22
‡85
2 ‡3
4‡46
†1
her
rolm
cy
nce
ota
e W
2 ‡90
52
3078
631
11 ‡
Ed
me
e
al
Wise
02
†59
8
†2
‡328
duca
nt b
To
5
27
24
7
24
6
2
1
15
e D
9 ‡22
†
28 ‡
†1
8
atio
by 2
ota
59.3
7.37
4.4
7.32
4.14
6.86
1
2.69
.11
54.2
Deg
267
†46 ‡
223
9‡3
on i
Fie007
al
3
7
1
2
4
6
9
21
gree
‡406
36
†58
360
in S
eld 7-0
3
1
1
4
1
4
0
1
0
10
e A
†1
66
8 ‡38
Stat
of 8 %
38.4
7.7
5.8
4.75
5.6
4.45
0.65
1.74
0.72
00.0
Awa
5 ‡6
859
tes
Stu
45
75
83
5
65
5
5
4
2
00
ardi
641
an
udy
T
6
3
2
1
4
1
1
3
2
ing
†‡
†1
d U
y du2
Tota
61.7
31.2
29.8
1.9
48.9
0.9
1.2
3.2
2.7
202
g Ins
† N‡ N
†18
†3 ‡
†25
†4
†12
†
9‡1
UTs
urin2011al
78
27
87
95
96
91
1
7
4
2
stit
NumNum
8 ‡34
‡25
5 ‡2
4 ‡86
2 ‡2
†21‡
100
s, 2
ng 1-1
30
15
1
5
24
5
0
1
1
1
tuti
mbembe
44
243
6
231
‡653
0
012
the2 %
0.6
5.4
4.8
5.92
4.2
5.41
0.6
.62
.29
100
ion
er oer o
†
†2
3
2
e E
1
9
8
2
6
1
2
9
0
ns &
of Dof C
5 ‡1
26 ‡
lev
In
2
4
& C
DegColl
15
‡942
ven
cre
2.4
3.
5.4
4.6
24.
4.0
0.2
0.5
1.6
47.
Coll
greeleg
†9
2
th
eas
48
9
46
63
82
05
21
58
63
65
ege
e Aes
‡64
‡6
Pla
se
es
Awa(33
4
†3
6
an (
ardi3,02
3 ‡3
(lakGrRa
1
1
1
ing23)
39
kh) row
ate (
0.8
2.7
4.1
10.3
15.2
9.9
3.9
2.4
19.8
5.6
g In)
wth (%)
8
7
3
2
9
9
4
8
6
stit
)
tuti
ion
ns (
†10
†3
†3
†4
†3
634
0 ‡5
‡28
‡76
‡55
‡16
4)
507
8
6
5
6
10 | ASHE - Annual Status of Higher Education in States and UTs, 2012
Initiatives in Higher Education During the Eleventh Five Year Plan, several initiatives to address the concerns of quality, equity and access were designed and implemented. These initiatives were related to faculty development, technology usage, academic and governance reforms and accreditation. A brief about these initiatives is given below:
1. Faculty Initiatives: Several measures were taken during the Eleventh Plan to address faculty shortages, including: � Increasing the retirement age for faculty to 65 with provision for further extension to 70. � Institution of several fellowship and scholarship schemes for MPhil and PhD programmes. � A faculty re-charge scheme to enable increased availability of young faculty. � An initiative to enlist professionals and experts from outside academic institutions as
adjunct faculty or scholars-in-residence. � A program for post-doctoral fellowships for Indian scholars to augment faculty resources,
which will begin operations during the Twelfth Plan.
2. Technology Initiatives � The National Mission on Education through ICT (NME-ICT) was launched during the
Eleventh Plan. Under this initiative, 392 universities and 18,374 colleges were provided broadband connectivity.
� On-going initiatives for creation of e-content were strengthened and new initiatives were taken up. Virtual labs were developed for science and engineering and are currently being rolled out. Enterprise resource planning software for administrative and financial management of institutes and learning management system, both using open source software have been developed and are being tested by a number of institutions.
� A low-cost computing cum access device “Aakash” was developed and is being currently tested for large-scale deployment. Overall, an investment of Rs.1,472 crore was made on this mission during the Eleventh Plan.
3. Quality Initiatives
� The first phase of the three-phase “Technical Education Quality Improvement Program (TEQIP)” with World Bank support was conducted from 2002 to 2009. With an investment of Rs.1,378 crore the program covered 127 engineering institutions. Phase-II of TEQIP (2010-2014), which extends into the Twelfth Plan, would cover another 180-190 institutions.
� Evaluation of the first phase has clearly shown a marked improvement in placement of graduates, more capacity in postgraduate and doctorate program and improved research performance.
4. Governance, Regulatory and Financial Initiatives
� In order to promote interdisciplinary teaching and research both at the UG and PG levels, 417 departments of universities/colleges were provided financial support of up to Rs. 60 lakh during the Eleventh Plan.
� A few states adopted the semester system for their institutions and several universities most notably, University of Delhi, have shifted to the semester system. While institutional accreditation through NAAC and program accreditation through NBA gained momentum during the Eleventh Plan, the coverage is still small. Only about one-third (167 out of 516) eligible universities and one-fifth (4,529 out of 22,500) eligible colleges have been accredited so far.
11 | ASHE - Annual Status of Higher Education in States and UTs, 2012
Twelfth Year Plan Expansion Initiatives
While the initiatives taken up during the Eleventh Five Year Plan have been successful to meet the pre-decided goals to an extent, it is imperative that the foundation laid upon is further built during the Twelfth Five Year Plan. The below section details the various proposed initiatives to be taken up during the 12th Five Year Plan.The Twelfth Year Plan initiatives have been designed to implement strategic objectives to meet the various issues and challenges currently plaguing the Indian higher education system. As part of this process, initiatives for enrolment expansion that were taken up during the Eleventh Plan would be reviewed for their impact and continued with necessary modifications as may be required. The specific major Twelfth Plan initiatives are as follows:
1. Development of Central Institutions as Quality-leading Institutions � It has been planned to increase the enrolment in central institutions from Rs 5 lakh to Rs 10
lakh. The central institutions, which have been set-up during the Eleventh five-year plan, would be supported to reach their critical size.
� Old and established central institutes will be given investments for campus redevelopment to increase their capacity and to build state-of-the-art facilities as per international standards. Expansion of institutes through multiple campuses will also be encouraged to enable economies of scale and institutional efficiency.
� Up gradation of several central institutions has been planned. These include the conversion of IT-BHU and ISM Dhanbad to an Indian Institute of Technology, BESU Kolkata to Indian Institute of Science Engineering and Technology. NIFFT Ranchi would also be given the adequate support to upgrade itself into a premier institute for forging and foundry technology.
� New campus development to be done through engineering, procurement and construction (EPC) turnkey contracts at fixed cost and completed in fixed time. Some of the basic infrastructure such as students’ hostels, staff housing, sports facilities, technology infrastructure, convention centre, and guest houses in central institutions will be developed through public-private partnerships.
2. Strategic Support for State Higher Education � Currently, the central level funding for state higher education is small, and its reach is limited
with limited impact, primarily due to poor coordination, excessive bureaucracy, and low levels of monitoring. During the Twelfth five-year plan, it has been decided that state higher education would be provided significantly higher central funding.
� It has been proposed to disburse central government funds on a state specific basis, with system wide planning to gain from the synergies between the state and central spending. Such a move is essential to ensure efficient intervention to the specific needs of each state, and to strategically use central funds as a tool to address equity issues and improve quality at the state level.
� The size of the Indian higher education system necessitates the management of funds at a central level for effective planning and coordination. It has been proposed to link the central funds to academic, administrative and financial reforms of the state higher education.
3. Quality Private Growth � The expansion in higher education during the Eleventh Five Year Plan was led by the private
sector, which currently accounts for nearly 60% of the total enrolment. The private sector will be encouraged to establish larger and higher quality institutions in the Twelfth Plan.
� It has been proposed to re-examine the ‘not-for-profit’ status in higher education, so as to allow the entry of for-profit institutions in select areas, with the necessary vision to ensure quality and equity.
� Innovative methods to infuse more private capital in the higher education sector without changing its ‘non-for-profit’ status will also be evaluated. Some of the proposals are as follows:
12 | ASHE - Annual Status of Higher Education in States and UTs, 2012
� To provide private institutions access to long-term and low-interest rate debt by giving ‘infrastructure’ status to higher education.
� To allow all types of institutions of higher education to be established under section 25 of the Companies Act.
� To permit conversion of educational trusts and societies to Section 25 companies seamlessly.
� To permit educational infrastructure companies to build and lease physical facilities to academic institutions with lease revenues subject to the same tax treatment as housing finance companies.
� To permit educational trusts, societies and companies to raise funds from the capital market by issuing bonds and shares without changing their tax status.
� To relax FCRA provisions for investments by NRIs in not-for-profit education. � To provide education companies tax exemptions in line with those enjoyed by IT
companies. � In addition, support to private institutes would be given by the government in the following
three ways: � Access to public student financial aid would be extended to accredited private institutions � Private institutions would also have access to research funding on an equal footing with
public institutions � Private institutions would benefit from various long-term quality enhancement efforts
including enhanced use of technology and faculty development initiatives that are taken up during the Twelfth Plan.
� New models of Public Private Partnerships (PPP) in higher education will also be encouraged during the Twelfth Five Year Plan, particularly in the establishment of research and innovation institutions. Based on the Eleventh Plan experience of setting up Indian Institutes of Information Technology (IIITs) and polytechnics in PPP mode, a framework will be put in place to encourage the spread and growth of PPP models, increase and improve resource utilization and enhance the quality of education in such institutions.
4. Expansion of Skill-based Programs
� With a view to produce employable talent, special emphasis will be placed n the expansion of skill-based programs in higher education during the Twelfth Five Year Plan. A framework for setting up community colleges is currently under development and has been endorsed in principle by the Central Advisory Body on Education.
� These community colleges would serve multiple needs of the community as follows: � Providing career oriented education and skills to students interested in directly entering
the workforce � Providing contracted training and education programs for local employers � Providing remedial education for high school graduates who are not ready to enrol in
traditional colleges, including providing them a path to transfer to three or four year institutions; offer general interest courses to the community for personal development and interest.
� The on-going UGC initiative that supports career-oriented add-on courses in traditional universities and colleges and the IGNOU’s scheme of community colleges will also be reviewed.
� Technical support of Philanthropic Foundations and the Indian Centre for Research and Development of Community Education (which has 230 community colleges in its fold) would be taken to build on the current initiatives and create a robust framework for skill-based education within the higher education sector in the country.
5. Creation of a Comprehensive Student Financial Aid Programs � To increase the number and scale of scholarships, public spending on student financial aid
would be enhanced. It has been planned to consolidate all the student financial aid schemes
13 | ASHE - Annual Status of Higher Education in States and UTs, 2012
under the Ministry of HRD under a single ‘Student Financial Aid Program’ in order to strengthen the administration of these schemes.
� In addition, a student loan guarantee corpus would be created under the management of a Credit Guarantee Trust to ensure non-defaulting of student loans. This will protect lending institutions from student default, thus encouraging them to participate actively.
6. Launch of a National Initiative on Inclusion of Persons with Disabilities � All the current and future initiatives for inclusion of persons with disabilities will be covered
under a single program ‘National Initiative on Inclusion of Persons with Disabilities’. This initiative would include the following: � Provision of support and policy direction to higher educational institutions and services to
make them disabled-friendly and create model universities and colleges at the State and district levels.
� Usage of new technologies effectively to address challenges of learning for persons with disabilities through various access devices and high quality learning material.
� Creation of curricula, and provide research and training related support to enhance awareness, knowledge and sensitivity about disability issues.
7. Launch of a National Initiative for Quality Higher Education in Indian Languages
� A new national initiative (‘Bhasha' Initiative) has been proposed to increase the quality of education and quality of teaching learning, by conducting classroom delivery in Indian languages.
� Under this initiative, the aim is to promote Indian languages with the aim to enhance the teaching-learning process and to promote research and publication in Indian languages in colleges and universities.
8. Other equity-related Initiatives
� To ensure equity in the higher education system, focused efforts would be executed to increase the enrolment of students from disadvantaged communities by strengthening the current remedial teaching programs with teaching/ coaching modules, preparatory training and special coaching for entrance examinations to highly sought-after courses and institution.
� Model colleges and polytechnic institutes will be established in districts with low Gross Enrolment Ratio, and Fifth Schedule Districts. Targeted schemes will be launched to attract students from vulnerable communities.
� All equity-related schemes in higher education across different ministries under the Central government would be brought under one umbrella, namely “Equal Opportunity for Higher Education Initiatives”. These would be coordinated by the Planning Commission to effectively monitor them and also take into state-level initiatives.
9. National Mission on Use of ICT in Higher Education � There were several initiatives, which were undertaken during the Eleventh Five Year Plan in
the area of ICT in higher education, which will be re-looked at during the Twelfth Five Year Plan, with an objective to make these programs more effective, efficient and sustainable. These include:
� Digital Infrastructure Initiatives: � Up gradation of connectivity for universities and colleges to 10GBPS and 1 GBPS
respectively � Building of computer labs in all institutes as required � Provision of smart classrooms � Setting up of classrooms with interactive video-conferencing facilities linking meta-
universities and affiliating universities
14 | ASHE - Annual Status of Higher Education in States and UTs, 2012
� Setting up of 100 server farms for cloud computing
� Content Initiatives: � Development of virtual labs, to promote creation of user-generated content � Establishment of a single national level consortium for propriety content � Creation of open-access content repositories including interoperable institutional
repositories � Creation of platforms to facilitate user generated content and related networks � Creating of a single portal for access to all content � Continuation of current initiatives of DTH channels to telecast digital educational videos
� Governance Initiatives: � Rollout of institutional ERPs � Computerization of examination wings of all universities � Provision of robust online linkage of all affiliating universities with their affiliated colleges � Creation of online data collection system � Library automation � Automation of grants management
� Training and Capacity Building Initiatives: � Training of faculty in instructional design content creation; � Implementation of massive capacity building efforts for adopting technology-mediated
pedagogy in the classrooms
10. Technical Education Quality Improvement Programme (TEQIP) � The second phase of the TEQIP would be continued during the Twelfth Five Year Plan and
the Phase 3 would be launched. Under Phase 3, the focus would be on supporting state technical universities and scaling-up sector-wide programmes. Architecture and town planning would be included in Phase 3 of TEQIP. Separate and independent initiatives should be taken up for improving quality in other fields like management education, pharmacy education, and hotel management.
11. Strengthening of Accreditation System
� The management of such a large higher education system becomes tougher without the presence of a systematic and efficient accreditation system. While the processes have been initiated, during the Twelfth Five Year Plan, the accreditation system will play a central role in the regulatory arrangements for higher education. Both NAAC and NBA would act as accreditation bodies to order to facilitate student mobility and academic articulation.
� Currently, it is being considered to establish a new accreditation law that provides for accreditation by independent agencies registered with a national accreditation authority. In addition to the national accreditation bodies, Indian institutes would also be encouraged to obtain program specific accreditation from credible international accrediting bodies.
12. Capacity and Capability Building of Faculty
� Development of quality teachers in adequate numbers is a strong concern area across all faculties of higher education. The number of faculty is required to be doubled from the current Rs 8 lakh to Rs 16 lakh during the 12th Five Year Plan to cater to the student demand. This requires an increase in capacity at both the postgraduate and doctoral levels. Competition from other sectors is acting as a strong deterrent for attracting talent for teaching.
� With a view to develop Indian faculty and provide global exposure, it is proposed to launch an International Faculty Development Program, under which Indian universities would

15 | ASHE - Annual Status of Higher Education in States and UTs, 2012
organize 2-4 week summer workshops conducted by leading international teachers and researchers. About 40-50 such workshops would be conducted annually. In addition, Indian faculty would also be sent for 3-6 months to the best international universities for training and mentoring.
13. Improving India’s academic research foundation � The quality of Indian research has gradually improved over the last decade. India’s
publications have accumulated 16,10,511 citations with 5.77 citations per paper. However, the figure is still less as compared to the world average with 10.81 citations per paper. During the year 2009, India stood eleventh in terms of the number of papers published, seventeenth in terms of the number of citations and thirty fourth in terms of number of citations per paper (as per the ISI Web of Science)
� Despite such achievements, Indian higher education continues to have limited research capacity. Low levels of funding and segregation of the country’s research & development institutions from universities and colleges have resulted in large-scale migration of students interested in pursuing research to other developed nations. A reflection of the poor research foundation in India is the fact that none of the Indian universities have figured amongst the top 200 universities in the Times Higher Education Rankings or the Academic Ranking of World Universities for the year 2011.
� To strengthen the research foundation in India, the following initiatives have been proposed to be implemented during the 12th Five Year Plan: � Promotion of multi-disciplinary research universities: Multi-disciplinary universities
engaged in cutting edge research and top quality teaching would be promoted during the 12th Five Year Plan. A legislative framework to set up such universities termed ‘Universities for Research and Innovation’ is currently under consideration. These universities could be either public universities, private universities or could be established as public-private partnerships. It has been targeted to establish 20 such universities by the end of the 12thFive-year Plan.
� Centres of Excellence: During the 12th Five Year Plan, 20 Centres of Excellence (CoE) would be developed into world-class research centres within existing universities and institutions of national repute. These centres would be engaged in conducting world-class research, focusing on areas in alignment with the long-term strategic interests of the country. In addition to these 20 CoEs, 50 centres for training and research in areas of science and technology would also be established.
� Promotion of collaborative research: Research-based Inter University Centres (IUCs) in different areas would be established during the plan period. The areas of focus of these IUCs would be inter-disciplinary in nature and of strategic importance to India, involving both basic and applied research. To foster inter-disciplinary research and enhance research training, it is planned to establish 10 Inter-Institutional Centres (IICs). These centres would be established either as broad partnership between multiple research-oriented institutes or program specific partnership between funding agencies and research institutes.
� Excellence clusters and networks would also be established by creating linkages between national laboratories/ national research centres and the universities. Similarly, local alliances would be created in different cities and interaction across institutions in such hubs would be enhanced through a structured, highly interactive collaborative framework and institutions would be incentivized to collaborate and open their courses to each other’s students.
� Establishment of nodal agency to promote industry-academia linkage: To further enhance the industry-academia interface, a nodal agency would be established to promote and facilitate industry-higher education collaboration. An independent not-for-
16 | ASHE - Annual Status of Higher Education in States and UTs, 2012
profit organization, the nodal agency would be founded by contributions from industry and government and will constitute of business and higher education leaders.
� International research collaborations: During the twelfth plan, efforts will be made to strengthen international research linkages leveraging the 22 million strong India diaspora.
14. Multi-level Governance � New legislative frameworks: To promote institutional autonomy, foster academic reforms
and to provide a boost to cutting edge-research, several new legislative frameworks are being considered currently. These include: � The Prohibition of Unfair Practices in Technical Educational Institutions, Medical
Educational Institutions and Universities Bill aimed at checking unfair practices relating to capitation fees and misleading advertising through mandatory disclosures by academic institutions;
� The National Accreditation Regulatory Authority for Higher Educational Institutions Bill that seeks to make accreditation by independent accreditation agencies mandatory for all higher educational institutions;
� The Education Tribunals Bill to create a central tribunal and state level tribunals for expeditious resolution of disputes relating to institutions, faculty, students and regulatory authorities;
� Foreign Educational Institutions (Regulation of Entry and Operations) Bill to enable quality foreign education institutions to enter and operate in India and regulate operations of foreign education providers; and,
� National Commission for Higher Education and Research (NCHER) Bill to create an umbrella regulatory authority subsuming the UGC, and current regulators, AICTE, NCTE and DEC.
� Standardization of State Level Governance: Currently, there is a wide variance in the legislative frameworks across the states. During the 12th Five Year Plan, all states will be encouraged to review the existent legislative and governance structures to tackle the unique challenges that each of the states face in higher education.
� Institutional Level Governance: For the development of institutes at an individual level, it is imperative that governance and management of HEIs are tied closely to their mission. The current practice of treating all institutions alike needs to be abandoned and standardization of education and processes should be moved away from, to allow for greater diversity. Institutions of higher education would be categorized, with each category of institutions being treated differently.
15. Development of Database on Higher Education: Unlike the developed nations, there is very little credible data for evidence-based policymaking in India currently. It is highly imperative that an efficient database on higher education in the nation is maintained with facts, figures and trends. Currently, the central government is in the process of conducting an All India Survey on higher education, which would provide useful data and help create a comprehensive management information system.
1
S
17 |
Sta
| AS
ate
SHE
e F
E -
Fo
An
oc
C
To
To
Po
N
Li
Se
St(In
Pe
nnu
us
api
ota
ota
opu
um
iter
ex
taten R
er c
al S
s:
ital
al A
al P
ula
mbe
rac
Ra
e DRs.
cap
Stat
An
l
Area
Pop
atio
er o
y R
atio
DomCro
pita
tus
nd
a (i
ula
n D
of D
Rate
(pe
mesore
a in
of
dh
n s
atio
Den
Dist
e (%
er 1
stice)
nco
Hig
ra
sq.
on
nsit
tric
%)
1,0
c Pr
me
ghe
a P
km
ty (
ts
00
rod
e, 2
er E
Pra
m.)
(per
ma
duc
010
Edu
ad
r sq
ales
t, 2
0-1
cat
des
q. k
s)
201
1 (
tion
sh
Sta
km.
0-1
Rs.
n in
h
ate
.)
11
.)
Sta
Pr
ates
ofi
s a
le
nd
UT
Ts, 2
H
8
201
Hyd
2,7
8,46
6
5,1
60
12
dera
75,0
6,65
308
23
67.6
992
10,4
0,4
aba
045
5,53
8
3
66
2
421
58
ad
5
33
1
18 | ASHE - Annual Status of Higher Education in States and UTs, 2012
Introduction
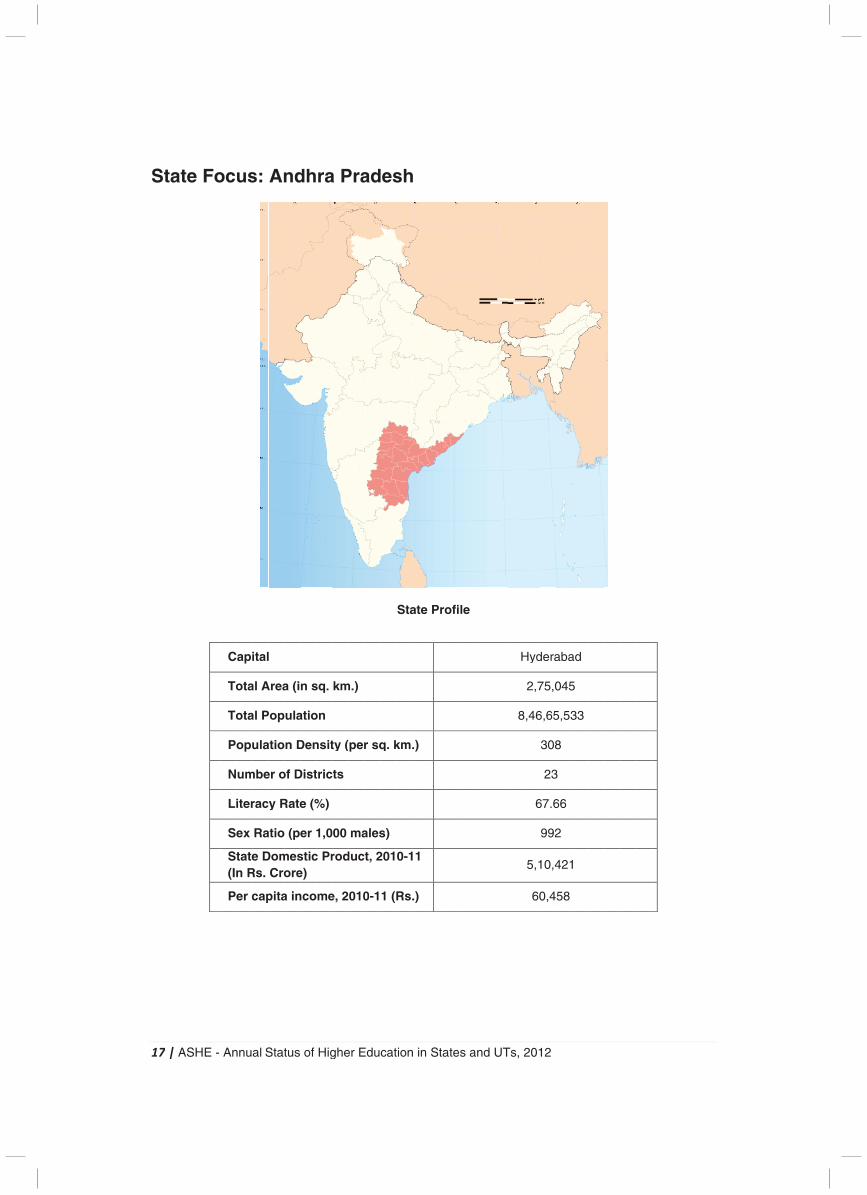
The state of Andhra Pradesh (AP) is located on the south-eastern coast of the country; it is one of the largest states in India in terms of area and population. The state ranks 4th in terms of area and 5th in terms of population among the states of India. The state shares a border with Maharashtra, Chhattisgarh and Odisha in the north, the Bay of Bengal in the east, Tamil Nadu in the south and Karnataka in the west. Historically the state is known as the “Rice Bowl of India”7. Andhra Pradesh has the second-longest coastline of 972 km (604 mi) among the states of India.
Rural Andhra Pradesh is primarily agrarian in nature with more than 3/4th of its workforce engaged directly in agriculture sector. Andhra Pradesh is the 3rd largest economy in India in terms of Gross State Domestic Product. Andhra Pradesh’s economic growth path has been commendable especially during the last 3 decades. Starting from a relatively lower per capita income, Andhra Pradesh has surpassed the national average about a decade ago.
Although the state’s performance is impressive in terms of economic growth, however when compared to the rest of the states in India, its overall development has been moderate. Social sector indicators such as literacy and skills have not been impressive enough on a comparative scale.8
Universities and University Level Institutes
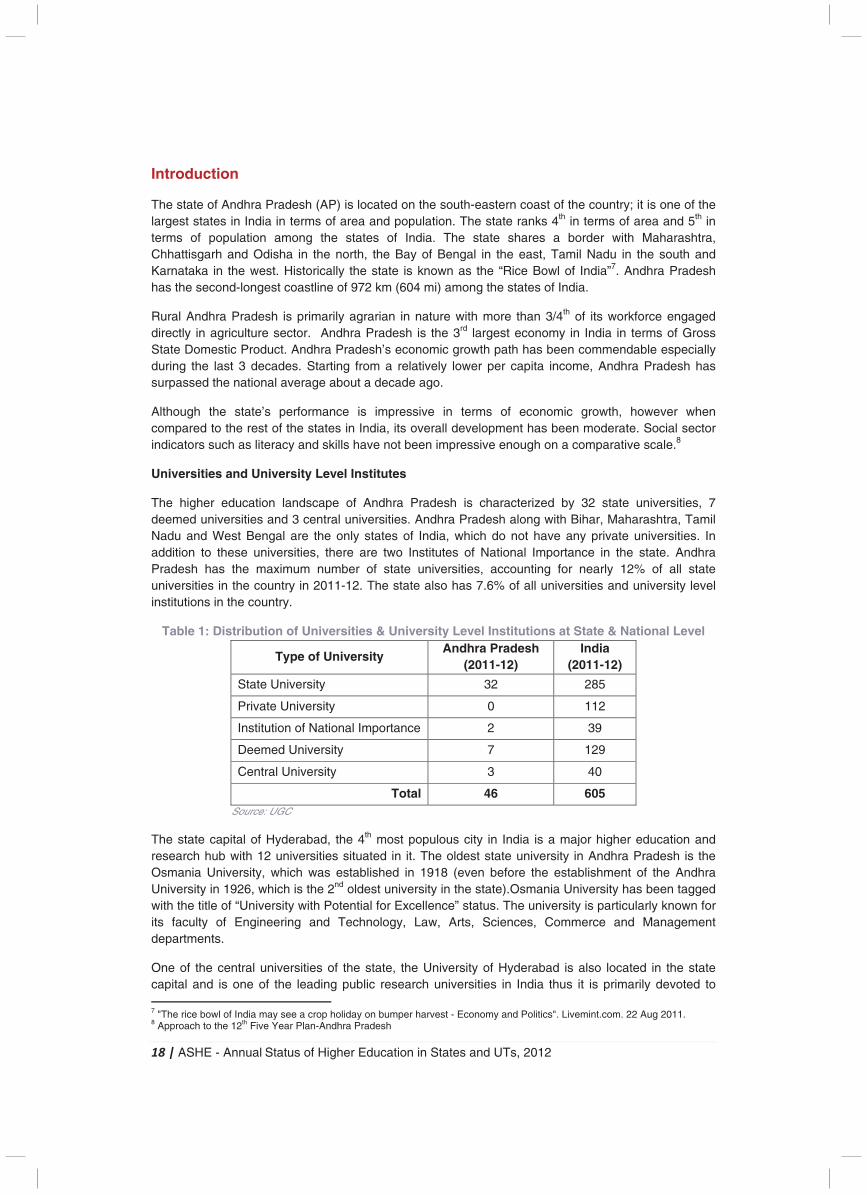
The higher education landscape of Andhra Pradesh is characterized by 32 state universities, 7 deemed universities and 3 central universities. Andhra Pradesh along with Bihar, Maharashtra, Tamil Nadu and West Bengal are the only states of India, which do not have any private universities. In addition to these universities, there are two Institutes of National Importance in the state. Andhra Pradesh has the maximum number of state universities, accounting for nearly 12% of all state universities in the country in 2011-12. The state also has 7.6% of all universities and university level institutions in the country.
Table 1: Distribution of Universities & University Level Institutions at State & National Level
Type of University Andhra Pradesh
(2011-12) India
(2011-12)
State University 32 285
Private University 0 112
Institution of National Importance 2 39
Deemed University 7 129
Central University 3 40
Total 46 605 Source: UGC
The state capital of Hyderabad, the 4th most populous city in India is a major higher education and research hub with 12 universities situated in it. The oldest state university in Andhra Pradesh is the Osmania University, which was established in 1918 (even before the establishment of the Andhra University in 1926, which is the 2nd oldest university in the state).Osmania University has been tagged with the title of “University with Potential for Excellence” status. The university is particularly known for its faculty of Engineering and Technology, Law, Arts, Sciences, Commerce and Management departments.
One of the central universities of the state, the University of Hyderabad is also located in the state capital and is one of the leading public research universities in India thus it is primarily devoted to 7 "The rice bowl of India may see a crop holiday on bumper harvest - Economy and Politics". Livemint.com. 22 Aug 2011. 8 Approach to the 12th Five Year Plan-Andhra Pradesh
19 | ASHE - Annual Status of Higher Education in States and UTs, 2012
postgraduate and doctoral studies. The Indian Institute of Technology (IIT) – a premier engineering and technology institute is located in the capital as well and is one of eight new IITs established by the Ministry of Human Resources & Development (MoHRD). The state also has a National Institute of Technology (NIT) in Warangal and Indian Institute of Information Technology (IIIT) in Hyderabad, which is an Institute of National Importance as well as a deemed university. The first central university of the state was the English and Foreign Languages University (EFL University), which was established in 1958, and the Hyderabad campus of EFL University, is the oldest of its four campuses located in the country.
The National Academy of Legal Research & Study (NALSAR) is located in Shamirpet, Hyderabad. The university is fully residential and conducts teaching in law and allied disciplines. It is considered the Best Law College9 in the country and offers programs at both undergraduate and postgraduate levels.
Warangal is a city with a population of approximately 10 lakh and it has 2 state universities, namely Kakatiya University- a general university established in 1976 and Kakatiya Institute of Technology & Science – a technology and science state university. The National Institute of Technology is located in Warangal and is a leading public engineering institute. It was formerly a Regional Engineering College (REC) and was one of the first seventeen RECs established by the prime minister in 1959. Today it is an Institute of National Importance awarding Bachelor’s, Master’s and Doctoral degrees in engineering, technology, basic sciences and management.
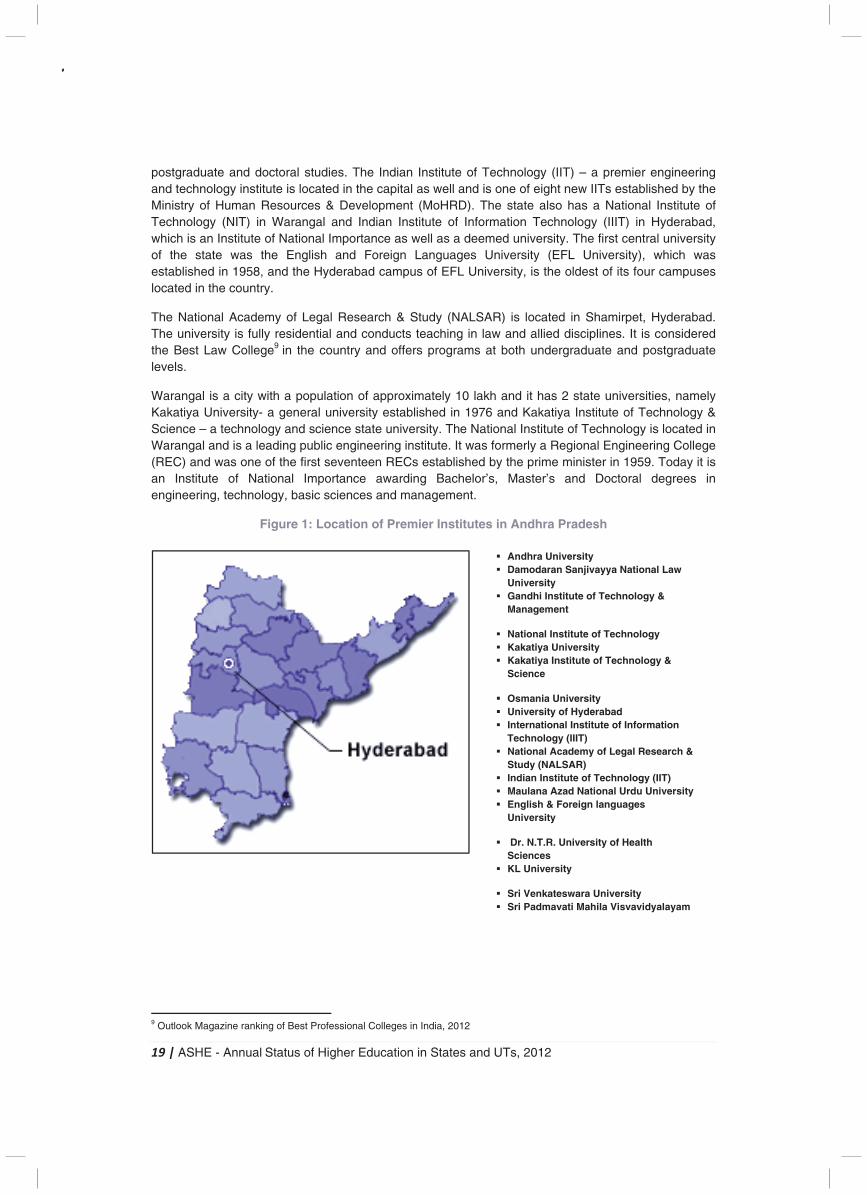
Figure 1: Location of Premier Institutes in Andhra Pradesh
9 Outlook Magazine ranking of Best Professional Colleges in India, 2012
� Andhra University � Damodaran Sanjivayya National Law
University � Gandhi Institute of Technology &
Management
� National Institute of Technology � Kakatiya University � Kakatiya Institute of Technology &
Science
� Osmania University � University of Hyderabad � International Institute of Information
Technology (IIIT) � National Academy of Legal Research &
Study (NALSAR) � Indian Institute of Technology (IIT) � Maulana Azad National Urdu University � English & Foreign languages
University
� Dr. N.T.R. University of Health Sciences
� KL University
� Sri Venkateswara University � Sri Padmavati Mahila Visvavidyalayam
20 | ASHE - Annual Status of Higher Education in States and UTs, 2012
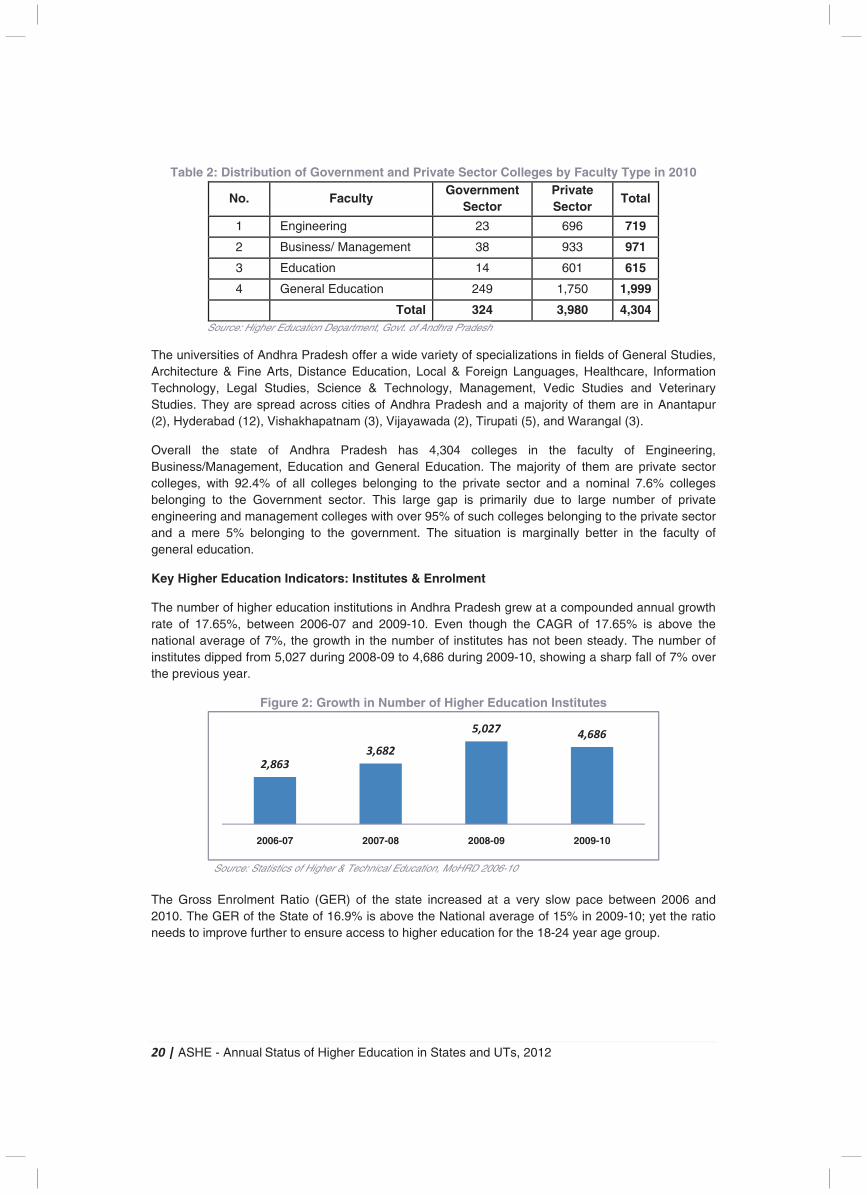
Table 2: Distribution of Government and Private Sector Colleges by Faculty Type in 2010
No. Faculty Government
Sector Private Sector
Total
1 Engineering 23 696 719
2 Business/ Management 38 933 971
3 Education 14 601 615
4 General Education 249 1,750 1,999
Total 324 3,980 4,304 Source: Higher Education Department, Govt. of Andhra Pradesh
The universities of Andhra Pradesh offer a wide variety of specializations in fields of General Studies, Architecture & Fine Arts, Distance Education, Local & Foreign Languages, Healthcare, Information Technology, Legal Studies, Science & Technology, Management, Vedic Studies and Veterinary Studies. They are spread across cities of Andhra Pradesh and a majority of them are in Anantapur (2), Hyderabad (12), Vishakhapatnam (3), Vijayawada (2), Tirupati (5), and Warangal (3).
Overall the state of Andhra Pradesh has 4,304 colleges in the faculty of Engineering, Business/Management, Education and General Education. The majority of them are private sector colleges, with 92.4% of all colleges belonging to the private sector and a nominal 7.6% colleges belonging to the Government sector. This large gap is primarily due to large number of private engineering and management colleges with over 95% of such colleges belonging to the private sector and a mere 5% belonging to the government. The situation is marginally better in the faculty of general education.
Key Higher Education Indicators: Institutes & Enrolment
The number of higher education institutions in Andhra Pradesh grew at a compounded annual growth rate of 17.65%, between 2006-07 and 2009-10. Even though the CAGR of 17.65% is above the national average of 7%, the growth in the number of institutes has not been steady. The number of institutes dipped from 5,027 during 2008-09 to 4,686 during 2009-10, showing a sharp fall of 7% over the previous year.
Figure 2: Growth in Number of Higher Education Institutes
Source: Statistics of Higher & Technical Education, MoHRD 2006-10
The Gross Enrolment Ratio (GER) of the state increased at a very slow pace between 2006 and 2010. The GER of the State of 16.9% is above the National average of 15% in 2009-10; yet the ratio needs to improve further to ensure access to higher education for the 18-24 year age group.
CAGR 17.65%
2,863
3,682
5,0274,686
2006-07 2007-08 2008-09 2009-10
21 | ASHE - Annual Status of Higher Education in States and UTs, 2012
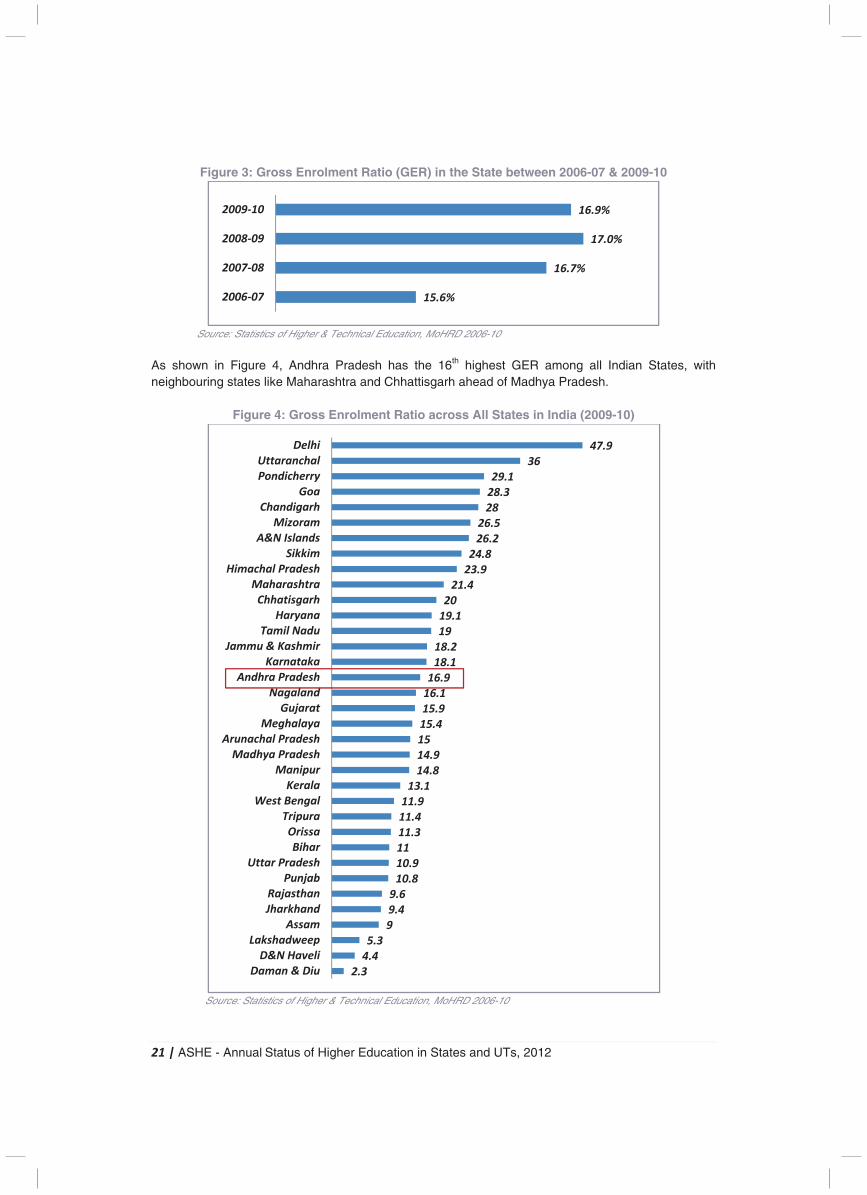
Figure 3: Gross Enrolment Ratio (GER) in the State between 2006-07 & 2009-10
Source: Statistics of Higher & Technical Education, MoHRD 2006-10
As shown in Figure 4, Andhra Pradesh has the 16th highest GER among all Indian States, with neighbouring states like Maharashtra and Chhattisgarh ahead of Madhya Pradesh.
Figure 4: Gross Enrolment Ratio across All States in India (2009-10)
Source: Statistics of Higher & Technical Education, MoHRD 2006-10
15.6%
16.7%
17.0%
16.9%
2006-07
2007-08
2008-09
2009-10
2.3
4.4
5.3
9
9.4
9.6
10.8
10.9
11
11.3
11.4
11.9
13.1
14.8
14.9
15
15.4
15.9
16.1
16.9
18.1
18.2
19
19.1
20
21.4
23.9
24.8
26.2
26.5
28
28.3
29.1
36
47.9
Daman & Diu
D&N Haveli
Lakshadweep
Assam
Jharkhand
Rajasthan
Punjab
Uttar Pradesh
Bihar
Orissa
Tripura
West Bengal
Kerala
Manipur
Madhya Pradesh
Arunachal Pradesh
Meghalaya
Gujarat
Nagaland
Andhra Pradesh
Karnataka
Jammu & Kashmir
Tamil Nadu
Haryana
Chhatisgarh
Maharashtra
Himachal Pradesh
Sikkim
A&N Islands
Mizoram
Chandigarh
Goa
Pondicherry
Uttaranchal
Delhi
22 | ASHE - Annual Status of Higher Education in States and UTs, 2012
The following sections present a description of the current higher and technical education scenario in the state. A brief description is given about the Industry and Employment landscape in the state and its link to higher education. The challenges facing the higher education sector in Andhra Pradesh have been analysed and the report concludes with the initiatives that have been undertaken to improve higher education in the state of Andhra Pradesh.
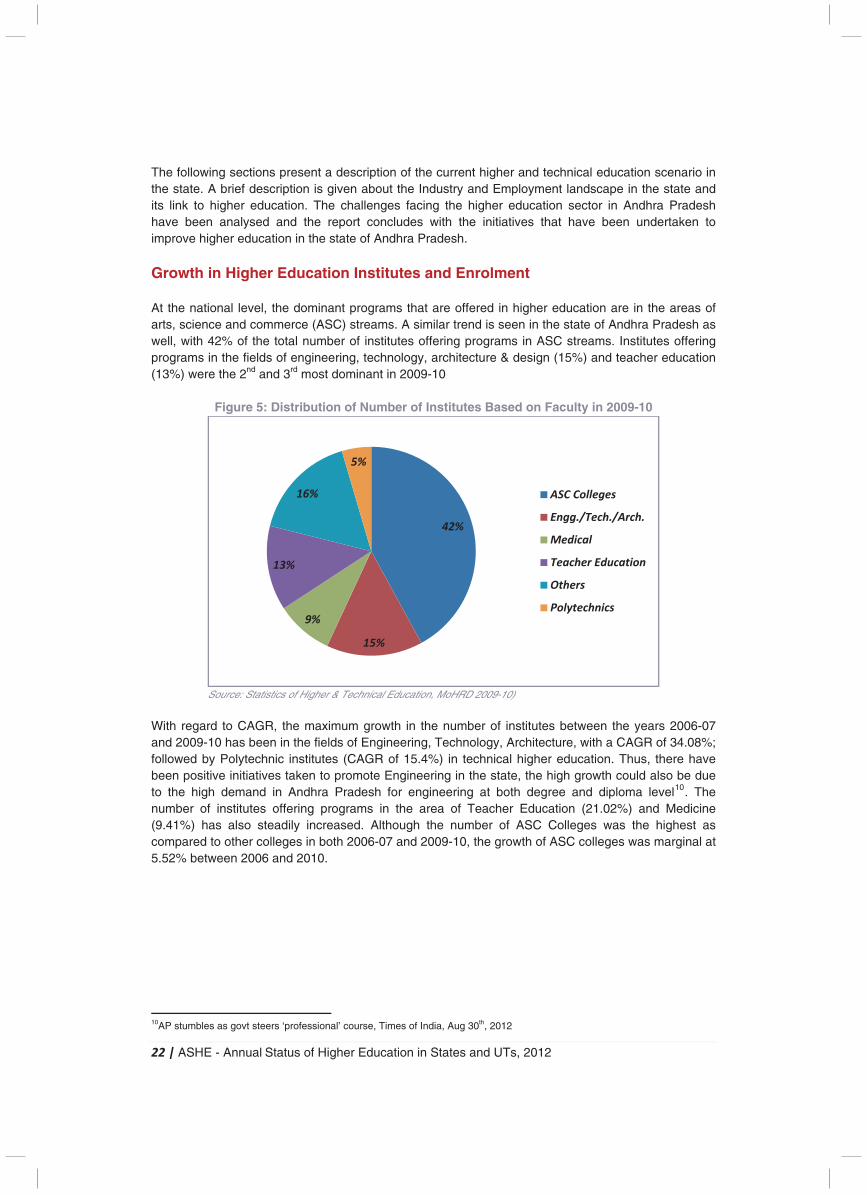
Growth in Higher Education Institutes and Enrolment At the national level, the dominant programs that are offered in higher education are in the areas of arts, science and commerce (ASC) streams. A similar trend is seen in the state of Andhra Pradesh as well, with 42% of the total number of institutes offering programs in ASC streams. Institutes offering programs in the fields of engineering, technology, architecture & design (15%) and teacher education (13%) were the 2nd and 3rd most dominant in 2009-10
Figure 5: Distribution of Number of Institutes Based on Faculty in 2009-10
Source: Statistics of Higher & Technical Education, MoHRD 2009-10)
With regard to CAGR, the maximum growth in the number of institutes between the years 2006-07 and 2009-10 has been in the fields of Engineering, Technology, Architecture, with a CAGR of 34.08%; followed by Polytechnic institutes (CAGR of 15.4%) in technical higher education. Thus, there have been positive initiatives taken to promote Engineering in the state, the high growth could also be due to the high demand in Andhra Pradesh for engineering at both degree and diploma level10. The number of institutes offering programs in the area of Teacher Education (21.02%) and Medicine (9.41%) has also steadily increased. Although the number of ASC Colleges was the highest as compared to other colleges in both 2006-07 and 2009-10, the growth of ASC colleges was marginal at 5.52% between 2006 and 2010.
10AP stumbles as govt steers ‘professional’ course, Times of India, Aug 30th, 2012
42%
15%
9%
13%
16%
5%
ASC Colleges
Engg./Tech./Arch.
Medical
Teacher Education
Others
Polytechnics
23 | ASHE - Annual Status of Higher Education in States and UTs, 2012
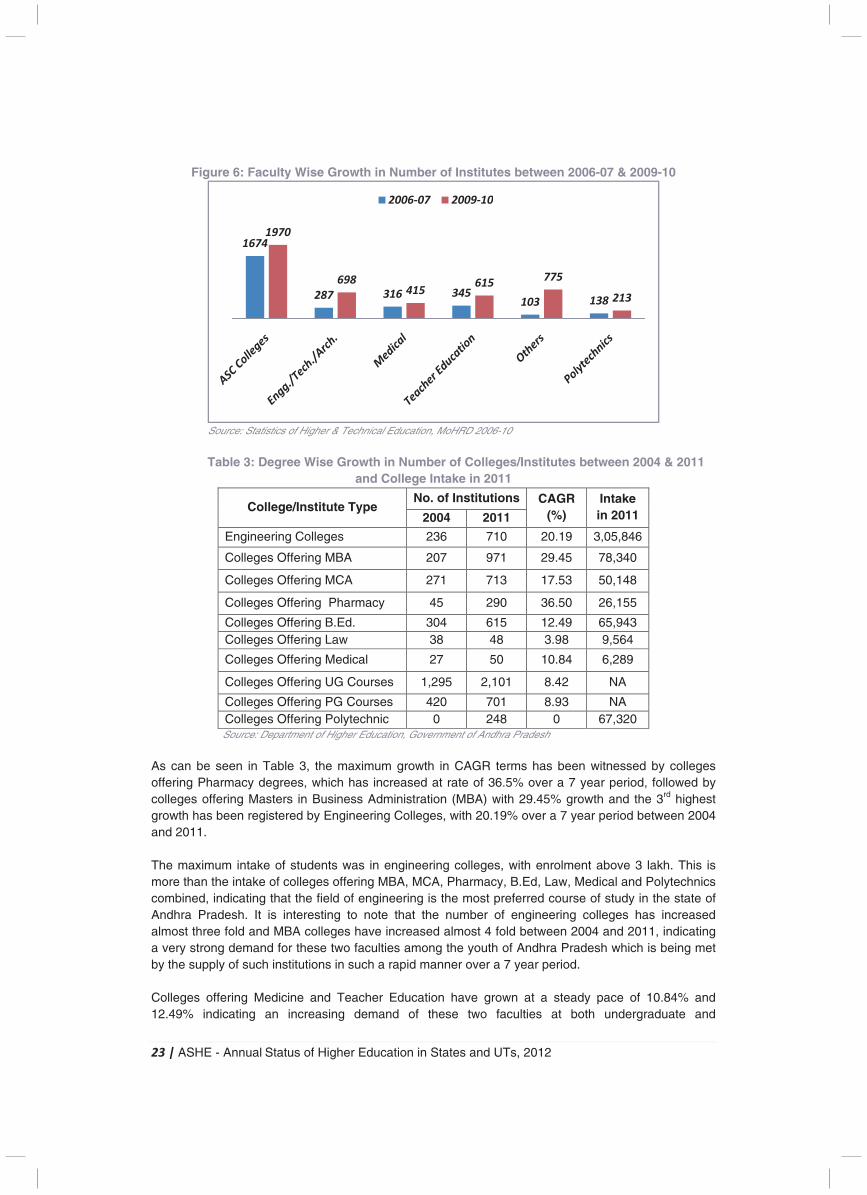
Figure 6: Faculty Wise Growth in Number of Institutes between 2006-07 & 2009-10
Source: Statistics of Higher & Technical Education, MoHRD 2006-10
Table 3: Degree Wise Growth in Number of Colleges/Institutes between 2004 & 2011
and College Intake in 2011
College/Institute Type No. of Institutions CAGR
(%) Intake in 2011 2004 2011
Engineering Colleges 236 710 20.19 3,05,846
Colleges Offering MBA 207 971 29.45 78,340
Colleges Offering MCA 271 713 17.53 50,148
Colleges Offering Pharmacy 45 290 36.50 26,155
Colleges Offering B.Ed. 304 615 12.49 65,943 Colleges Offering Law 38 48 3.98 9,564
Colleges Offering Medical 27 50 10.84 6,289
Colleges Offering UG Courses 1,295 2,101 8.42 NA
Colleges Offering PG Courses 420 701 8.93 NA Colleges Offering Polytechnic 0 248 0 67,320 Source: Department of Higher Education, Government of Andhra Pradesh
As can be seen in Table 3, the maximum growth in CAGR terms has been witnessed by colleges offering Pharmacy degrees, which has increased at rate of 36.5% over a 7 year period, followed by colleges offering Masters in Business Administration (MBA) with 29.45% growth and the 3rd highest growth has been registered by Engineering Colleges, with 20.19% over a 7 year period between 2004 and 2011. The maximum intake of students was in engineering colleges, with enrolment above 3 lakh. This is more than the intake of colleges offering MBA, MCA, Pharmacy, B.Ed, Law, Medical and Polytechnics combined, indicating that the field of engineering is the most preferred course of study in the state of Andhra Pradesh. It is interesting to note that the number of engineering colleges has increased almost three fold and MBA colleges have increased almost 4 fold between 2004 and 2011, indicating a very strong demand for these two faculties among the youth of Andhra Pradesh which is being met by the supply of such institutions in such a rapid manner over a 7 year period. Colleges offering Medicine and Teacher Education have grown at a steady pace of 10.84% and 12.49% indicating an increasing demand of these two faculties at both undergraduate and
(5.52%)
(34.08%)
(9.41%) (21.02%) (94.64%)
(15.4%)
1674
287 316 345103 138
1970
698415
615775
213
2006-07 2009-10
24 | ASHE - Annual Status of Higher Education in States and UTs, 2012
postgraduate level of study. The least amount of growth has been witnessed by institutes offering Law with a marginal growth rate of 3.98%, followed by Colleges offering undergraduate (UG) courses and postgraduate (PG) courses with CAGR of 8.42% and 8.93% respectively.
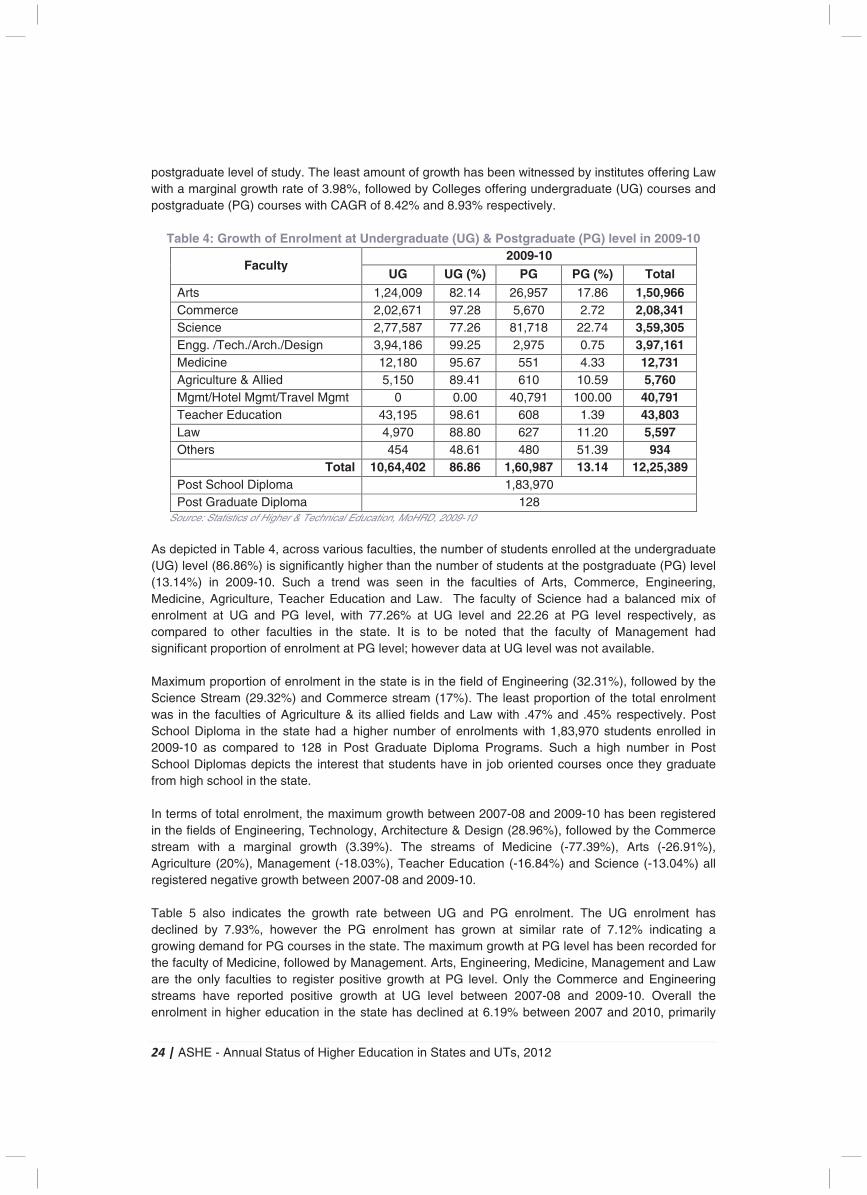
Table 4: Growth of Enrolment at Undergraduate (UG) & Postgraduate (PG) level in 2009-10
Faculty 2009-10
UG UG (%) PG PG (%) Total Arts 1,24,009 82.14 26,957 17.86 1,50,966 Commerce 2,02,671 97.28 5,670 2.72 2,08,341 Science 2,77,587 77.26 81,718 22.74 3,59,305 Engg. /Tech./Arch./Design 3,94,186 99.25 2,975 0.75 3,97,161 Medicine 12,180 95.67 551 4.33 12,731 Agriculture & Allied 5,150 89.41 610 10.59 5,760 Mgmt/Hotel Mgmt/Travel Mgmt 0 0.00 40,791 100.00 40,791 Teacher Education 43,195 98.61 608 1.39 43,803 Law 4,970 88.80 627 11.20 5,597 Others 454 48.61 480 51.39 934
Total 10,64,402 86.86 1,60,987 13.14 12,25,389 Post School Diploma 1,83,970 Post Graduate Diploma 128
Source: Statistics of Higher & Technical Education, MoHRD, 2009-10 As depicted in Table 4, across various faculties, the number of students enrolled at the undergraduate (UG) level (86.86%) is significantly higher than the number of students at the postgraduate (PG) level (13.14%) in 2009-10. Such a trend was seen in the faculties of Arts, Commerce, Engineering, Medicine, Agriculture, Teacher Education and Law. The faculty of Science had a balanced mix of enrolment at UG and PG level, with 77.26% at UG level and 22.26 at PG level respectively, as compared to other faculties in the state. It is to be noted that the faculty of Management had significant proportion of enrolment at PG level; however data at UG level was not available. Maximum proportion of enrolment in the state is in the field of Engineering (32.31%), followed by the Science Stream (29.32%) and Commerce stream (17%). The least proportion of the total enrolment was in the faculties of Agriculture & its allied fields and Law with .47% and .45% respectively. Post School Diploma in the state had a higher number of enrolments with 1,83,970 students enrolled in 2009-10 as compared to 128 in Post Graduate Diploma Programs. Such a high number in Post School Diplomas depicts the interest that students have in job oriented courses once they graduate from high school in the state. In terms of total enrolment, the maximum growth between 2007-08 and 2009-10 has been registered in the fields of Engineering, Technology, Architecture & Design (28.96%), followed by the Commerce stream with a marginal growth (3.39%). The streams of Medicine (-77.39%), Arts (-26.91%), Agriculture (20%), Management (-18.03%), Teacher Education (-16.84%) and Science (-13.04%) all registered negative growth between 2007-08 and 2009-10. Table 5 also indicates the growth rate between UG and PG enrolment. The UG enrolment has declined by 7.93%, however the PG enrolment has grown at similar rate of 7.12% indicating a growing demand for PG courses in the state. The maximum growth at PG level has been recorded for the faculty of Medicine, followed by Management. Arts, Engineering, Medicine, Management and Law are the only faculties to register positive growth at PG level. Only the Commerce and Engineering streams have reported positive growth at UG level between 2007-08 and 2009-10. Overall the enrolment in higher education in the state has declined at 6.19% between 2007 and 2010, primarily
25 | ASHE - Annual Status of Higher Education in States and UTs, 2012
due to reduced enrolment at the UG level, especially in the faculties of Medicine, Management and Law.
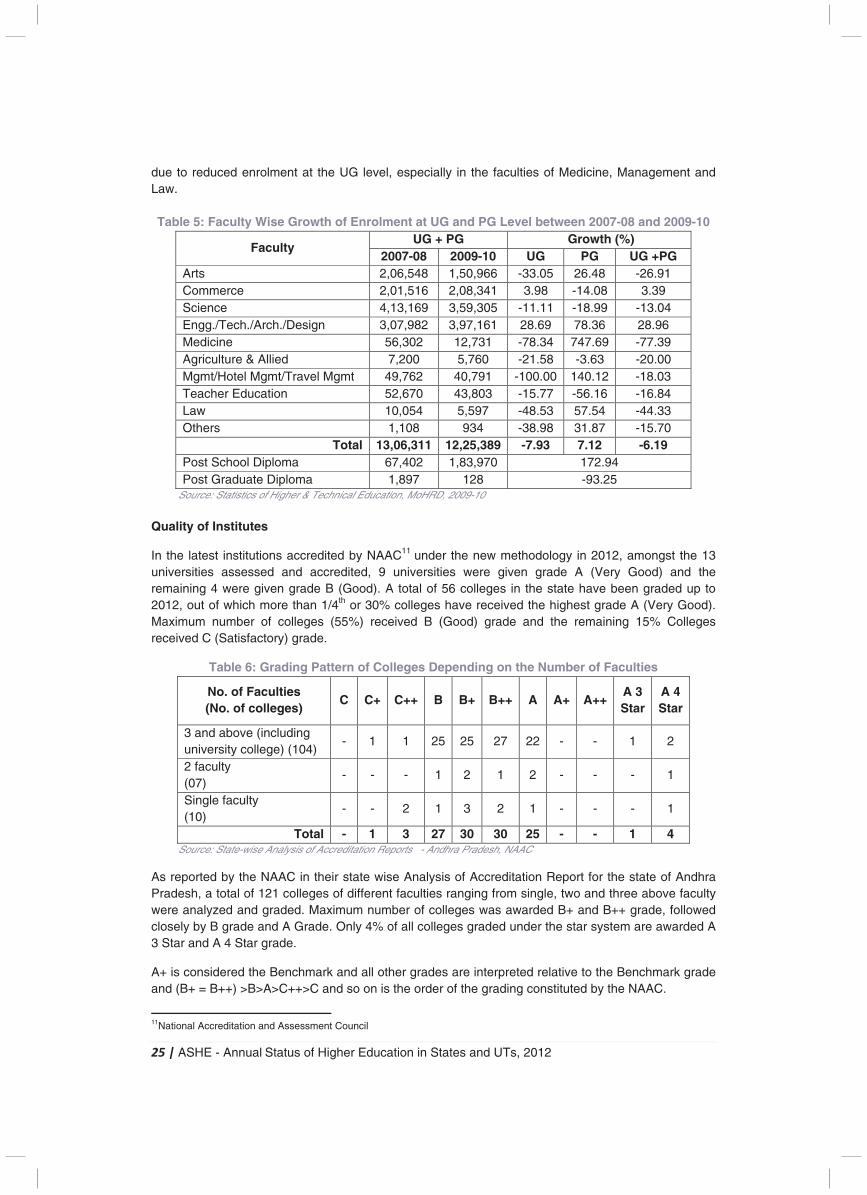
Table 5: Faculty Wise Growth of Enrolment at UG and PG Level between 2007-08 and 2009-10
Faculty UG + PG Growth (%)
2007-08 2009-10 UG PG UG +PG Arts 2,06,548 1,50,966 -33.05 26.48 -26.91 Commerce 2,01,516 2,08,341 3.98 -14.08 3.39 Science 4,13,169 3,59,305 -11.11 -18.99 -13.04 Engg./Tech./Arch./Design 3,07,982 3,97,161 28.69 78.36 28.96 Medicine 56,302 12,731 -78.34 747.69 -77.39 Agriculture & Allied 7,200 5,760 -21.58 -3.63 -20.00 Mgmt/Hotel Mgmt/Travel Mgmt 49,762 40,791 -100.00 140.12 -18.03 Teacher Education 52,670 43,803 -15.77 -56.16 -16.84 Law 10,054 5,597 -48.53 57.54 -44.33 Others 1,108 934 -38.98 31.87 -15.70
Total 13,06,311 12,25,389 -7.93 7.12 -6.19 Post School Diploma 67,402 1,83,970 172.94 Post Graduate Diploma 1,897 128 -93.25
Source: Statistics of Higher & Technical Education, MoHRD, 2009-10 Quality of Institutes
In the latest institutions accredited by NAAC11 under the new methodology in 2012, amongst the 13 universities assessed and accredited, 9 universities were given grade A (Very Good) and the remaining 4 were given grade B (Good). A total of 56 colleges in the state have been graded up to 2012, out of which more than 1/4th or 30% colleges have received the highest grade A (Very Good). Maximum number of colleges (55%) received B (Good) grade and the remaining 15% Colleges received C (Satisfactory) grade.
Table 6: Grading Pattern of Colleges Depending on the Number of Faculties
No. of Faculties (No. of colleges)
C C+ C++ B B+ B++ A A+ A++ A 3 Star
A 4 Star
3 and above (including university college) (104)
- 1 1 25 25 27 22 - - 1 2
2 faculty (07)
- - - 1 2 1 2 - - - 1
Single faculty (10)
- - 2 1 3 2 1 - - - 1
Total - 1 3 27 30 30 25 - - 1 4 Source: State-wise Analysis of Accreditation Reports - Andhra Pradesh, NAAC
As reported by the NAAC in their state wise Analysis of Accreditation Report for the state of Andhra Pradesh, a total of 121 colleges of different faculties ranging from single, two and three above faculty were analyzed and graded. Maximum number of colleges was awarded B+ and B++ grade, followed closely by B grade and A Grade. Only 4% of all colleges graded under the star system are awarded A 3 Star and A 4 Star grade.
A+ is considered the Benchmark and all other grades are interpreted relative to the Benchmark grade and (B+ = B++) >B>A>C++>C and so on is the order of the grading constituted by the NAAC.
11National Accreditation and Assessment Council
26 | ASHE - Annual Status of Higher Education in States and UTs, 2012
Industry and Employment Scenario
Key Industries
Industrial sector in the state has gained momentum in the past few years with the proactive role of state with regard to effective policy implementation including single window clearance and incentives, establishing world class infrastructure and making power available at the cheapest industrial tariff, thereby realizing entrepreneurial energies in private as well as public sector. A positive mindset and increased skilled labour force across the industries played constructive role in this growth process. The natural resources, policy incentives and infrastructure in the state are favourably suited for investments in major sectors such as drugs and pharmaceuticals, biotechnology, IT and ITeS, mines and minerals, textiles, leather and tourism. Andhra Pradesh is one of the foremost states to have developed sector-specific policies. Forming industrial clusters and developing infrastructure has been a key strategy of the state to attract investments in various industries12. The department of Industries was set up with the objective of establishing Cottage and Small Scale Industries, Industrial Cooperatives and extending credit to artisans. The State is committed to provide and promote world-class facilities like ports, airports, expressways, quality power supply, water supply etc. The State has provided a network of Industrial Estate (IEs) and Industrial Development Areas for locating industries at specific growth points. The Gas exploration in the Krishna Godavari basin raised scope for setting up of Petro-Chemical Complexes and a host of gas based industries. The following section gives a brief introduction to some of the key industries in the state.
1. Agri and Food Processing Industry � A variety of agro-climatic conditions in the state make it conducive for growing a variety of
horticulture crops such as fruits, vegetables, spices, tuber crops, plantation crops and floriculture.
� The state is one of the largest producers of rice in India. It is a leading producer of cash crops such as tobacco, groundnut, dry chilly, turmeric, oilseeds, cotton, sugar and jute.
� Prominent players in this sector are Cong Agra Foods, Cargill India Pvt. Ltd., ITC and Andhra Pradesh Dairy Development Cooperative Federation (APDDCF).
2. Bulk Drugs and Pharmaceuticals � Hyderabad is the hub of the bulk-drugs industry, accounting for one-third of the national
production of bulk drugs. The state produces a majority of 500 basic drugs produced in the country.
� The state government has helped in the development of pharmaceutical and biotechnology industry through specific policies, promoting knowledge-based cluster approach with financial incentives and appropriate infrastructure support. Presence of related educational infrastructure has also helped the industry. The biotechnology incubation centre was commissioned in 2008.
� Major players in this field are Albany Molecular Research Inc (AMRI), Novartis, Matrix Laboratories Ltd and Indian Immunologicals Ltd (IIL)
3. IT and ITeS � The share of IT exports from Andhra Pradesh is 15% of the national IT exports. IT sector
contributes to more than 49% of total exports from all sectors in the state. � Some of the key players in the IT sector present in AP are IBM, Mahindra Satyam,
Microsoft, and Cognizant. 12India Brand Equity Foundation – State report on Andhra Pradesh
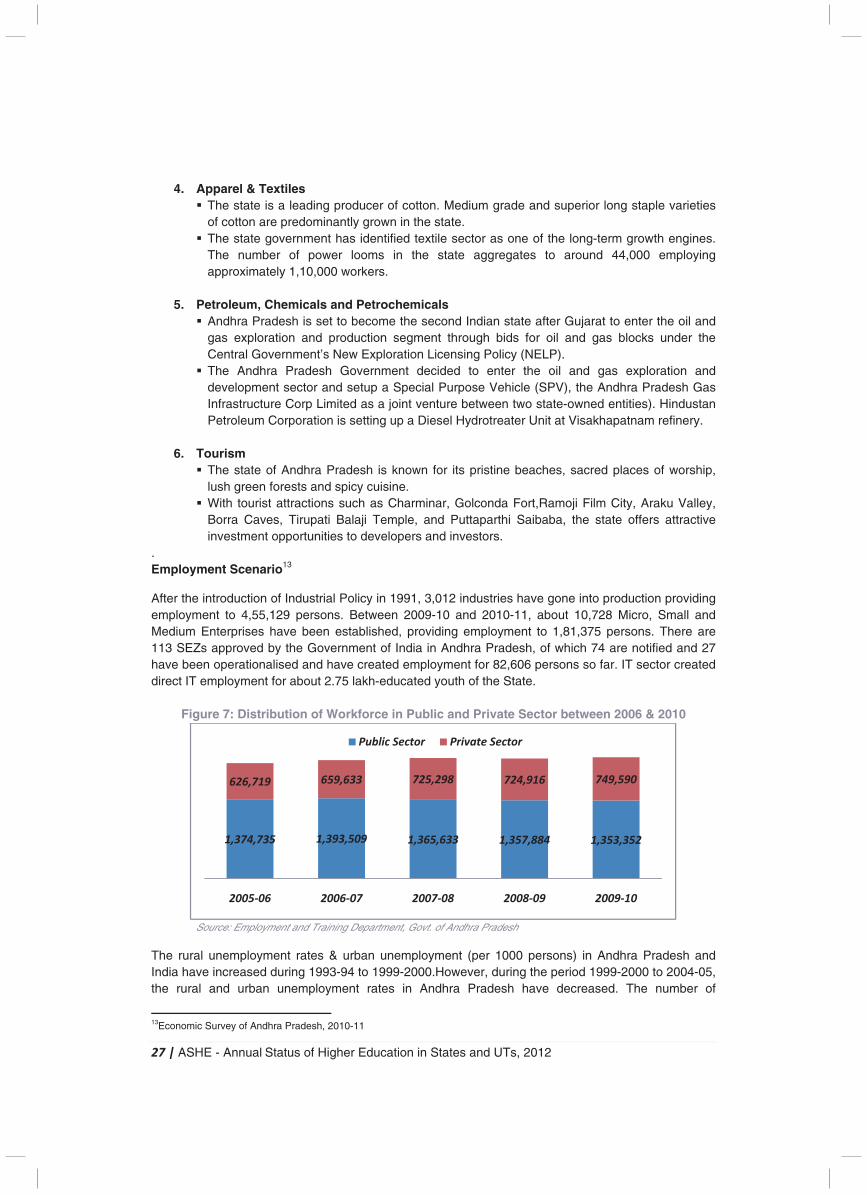
27 | ASHE - Annual Status of Higher Education in States and UTs, 2012
4. Apparel & Textiles
� The state is a leading producer of cotton. Medium grade and superior long staple varieties of cotton are predominantly grown in the state.
� The state government has identified textile sector as one of the long-term growth engines. The number of power looms in the state aggregates to around 44,000 employing approximately 1,10,000 workers.
5. Petroleum, Chemicals and Petrochemicals � Andhra Pradesh is set to become the second Indian state after Gujarat to enter the oil and
gas exploration and production segment through bids for oil and gas blocks under the Central Government’s New Exploration Licensing Policy (NELP).
� The Andhra Pradesh Government decided to enter the oil and gas exploration and development sector and setup a Special Purpose Vehicle (SPV), the Andhra Pradesh Gas Infrastructure Corp Limited as a joint venture between two state-owned entities). Hindustan Petroleum Corporation is setting up a Diesel Hydrotreater Unit at Visakhapatnam refinery.
6. Tourism � The state of Andhra Pradesh is known for its pristine beaches, sacred places of worship,
lush green forests and spicy cuisine. � With tourist attractions such as Charminar, Golconda Fort,Ramoji Film City, Araku Valley,
Borra Caves, Tirupati Balaji Temple, and Puttaparthi Saibaba, the state offers attractive investment opportunities to developers and investors.
. Employment Scenario13
After the introduction of Industrial Policy in 1991, 3,012 industries have gone into production providing employment to 4,55,129 persons. Between 2009-10 and 2010-11, about 10,728 Micro, Small and Medium Enterprises have been established, providing employment to 1,81,375 persons. There are 113 SEZs approved by the Government of India in Andhra Pradesh, of which 74 are notified and 27 have been operationalised and have created employment for 82,606 persons so far. IT sector created direct IT employment for about 2.75 lakh-educated youth of the State.
Figure 7: Distribution of Workforce in Public and Private Sector between 2006 & 2010
Source: Employment and Training Department, Govt. of Andhra Pradesh
The rural unemployment rates & urban unemployment (per 1000 persons) in Andhra Pradesh and India have increased during 1993-94 to 1999-2000.However, during the period 1999-2000 to 2004-05, the rural and urban unemployment rates in Andhra Pradesh have decreased. The number of
13Economic Survey of Andhra Pradesh, 2010-11
1,374,735 1,393,509 1,365,633 1,357,884 1,353,352
626,719 659,633 725,298 724,916 749,590
2005-06 2006-07 2007-08 2008-09 2009-10
Public Sector Private Sector
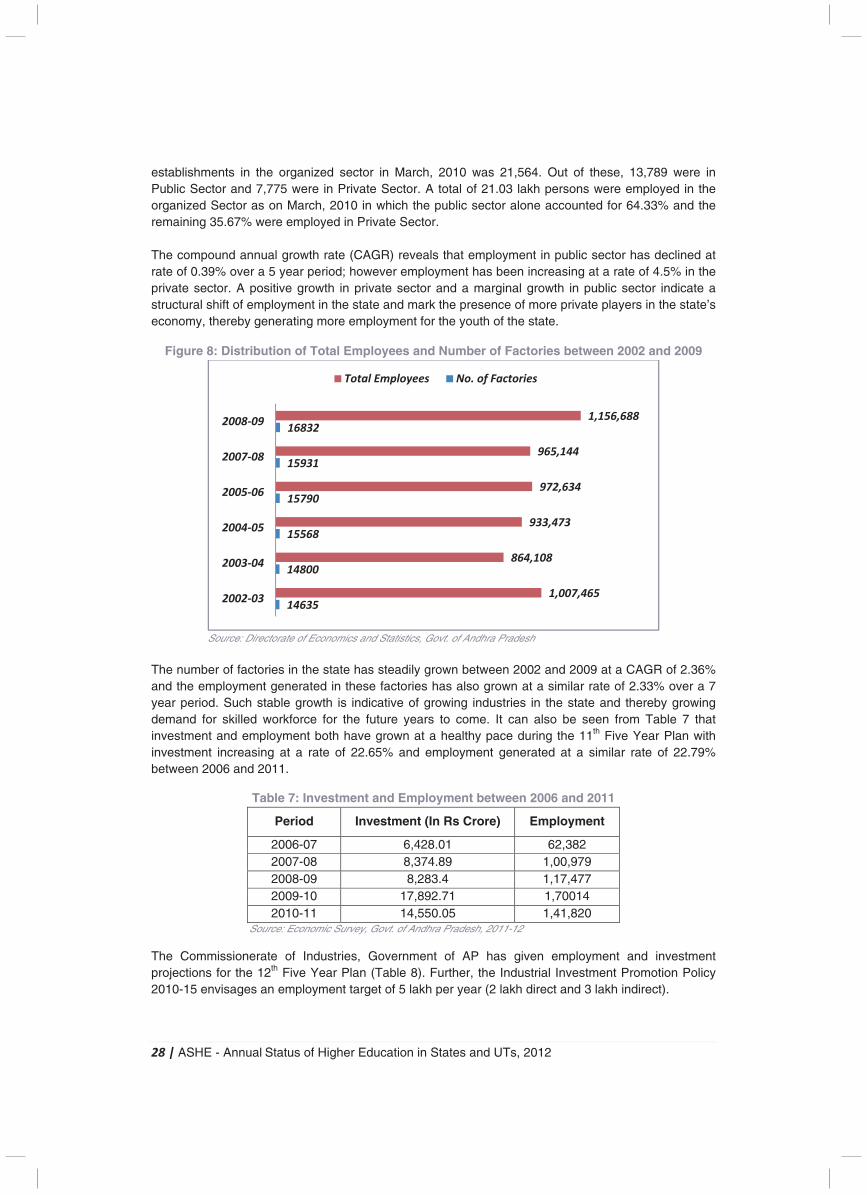
28 | ASHE - Annual Status of Higher Education in States and UTs, 2012
establishments in the organized sector in March, 2010 was 21,564. Out of these, 13,789 were in Public Sector and 7,775 were in Private Sector. A total of 21.03 lakh persons were employed in the organized Sector as on March, 2010 in which the public sector alone accounted for 64.33% and the remaining 35.67% were employed in Private Sector. The compound annual growth rate (CAGR) reveals that employment in public sector has declined at rate of 0.39% over a 5 year period; however employment has been increasing at a rate of 4.5% in the private sector. A positive growth in private sector and a marginal growth in public sector indicate a structural shift of employment in the state and mark the presence of more private players in the state’s economy, thereby generating more employment for the youth of the state.
Figure 8: Distribution of Total Employees and Number of Factories between 2002 and 2009
Source: Directorate of Economics and Statistics, Govt. of Andhra Pradesh
The number of factories in the state has steadily grown between 2002 and 2009 at a CAGR of 2.36% and the employment generated in these factories has also grown at a similar rate of 2.33% over a 7 year period. Such stable growth is indicative of growing industries in the state and thereby growing demand for skilled workforce for the future years to come. It can also be seen from Table 7 that investment and employment both have grown at a healthy pace during the 11th Five Year Plan with investment increasing at a rate of 22.65% and employment generated at a similar rate of 22.79% between 2006 and 2011.
Table 7: Investment and Employment between 2006 and 2011
Period Investment (In Rs Crore) Employment
2006-07 6,428.01 62,382 2007-08 8,374.89 1,00,979 2008-09 8,283.4 1,17,477 2009-10 17,892.71 1,70014 2010-11 14,550.05 1,41,820
Source: Economic Survey, Govt. of Andhra Pradesh, 2011-12
The Commissionerate of Industries, Government of AP has given employment and investment projections for the 12th Five Year Plan (Table 8). Further, the Industrial Investment Promotion Policy 2010-15 envisages an employment target of 5 lakh per year (2 lakh direct and 3 lakh indirect).
14635
14800
15568
15790
15931
16832
1,007,465
864,108
933,473
972,634
965,144
1,156,688
2002-03
2003-04
2004-05
2005-06
2007-08
2008-09
Total Employees No. of Factories
29 | ASHE - Annual Status of Higher Education in States and UTs, 2012
Table 8: Employment and Investment Projections for the 12th Five Year Plan Large Industries MSMEs
Year Nos Investment
(In Rs Crore) Employment Nos
Investment (In Rs Crore)
Employment
2011-12 100 18,302 36,604 10,000 5,500 1,65,000 2012-13 121 20,132 40,264 11,000 6,050 1,51,250 2013-14 133 22,145 44,291 12,100 6,655 1,66,375 2014-15 146 24,360 48,720 13,000 7,321 1,83,013 2015-16 160 26,796 53,592 14,300 8,053 2,01,314
Total 660 1,11,736 2,23,471 60,400 33,578 8,66,951 Source: Commissionerate of Industries in AP, Hyderabad
Given the above scenario, in order to create large employment the priority sectors identified are textile units, chemical industry, electrical machinery, paper products and printing and publishing industry. The sectors, which can create employment under MSMEs, are textiles, wearing apparel, food and beverages and tobacco. These units contribute to around 70% of the total employment of MSME sector.14
Key Challenges & Initiatives in Higher Education
With respect to higher education including professional, technical and general education, the state has shown considerable progress over time. The 1990s was an important period in terms of growth in number of institutions available for higher, technical and professional education.
The state has higher number of engineering colleges than degree colleges. The strength of the state is its intake capacity and outgoing professionals out of these higher educational institutes. Around one fourth of the total pharmacy colleges and one third of engineering colleges in India appear to be located in Andhra Pradesh. These points indicate that technical and professional education institutions in India are highly concentrated in Andhra Pradesh.
Challenges in Higher Education
However, the cause of concern is the quality of higher, professional and technical education provided in the state. Many of the graduates of the higher, technical and professional educational institutions in the state could not get placed in the job market. There is a mismatch between the type of skills that the industry demands and the type of skilled labour that the higher educational institutions are producing. Therefore, there is a need for addressing this mismatch by streamlining the courses, curriculum and the content of these courses. The major concerns for higher education in the state are improving participation, ensuring equity across social, economical and gender groups and then the quality of education.
Some of the specific challenges that need to be looked in to are:
� Infrastructure required for Andhra Pradesh State council of Higher Education (APSCHE) to organize seminars, training programs and orientation programs.
� An amount proposed for implementation of various schemes under Collegiate Education in the Annual Plan.
� Finishing school initiatives and training teachers programs have to be undertaken to reduce the dropout rate at various levels of education in the state.
� English Language labs need to be setup for the improvement of English communication and soft skills training at the UG Level needs to be imparted.
14 Approach to the 12th Five Year Plan Andhra Pradesh
30 | ASHE - Annual Status of Higher Education in States and UTs, 2012
� Access with focus on equity or inclusiveness: The system requires a massive expansion penetrating into rural areas. It also requires identification of areas, regions and social and economic groups which have lower access to higher education.
� Private participation is unavoidable in the field of higher education but this should be done with a balance of equity and quality. Almost all the Private Institutions are for – profit Institutions. The challenge the government faces is to regulate them.
� Quality of higher education in the state needs to move towards excellence in order for the state to become a well established center of knowledge for the country. Provisions should be made with regard to access and relevance so as to ensure quality education is provided to the youth of the state.
� Increased intake at degree Level in Technical Institutions and an Up gradation of equipment through a scheme of Modernization & Removal of Obsolescence (MODROBS) of AICTE.
Higher Education Initiatives Implemented
� The Rajiv Gandhi University of Knowledge Technologies (RGUKT) has shifted from an ICT department to a Technical Education department. Three fully residential IIITs established under RGUKT. The institutes specialize in teaching and research in IT and emerging areas of Engineering and Science.
� The pedagogy followed at RGUKT is based on learning to learn and lifelong learning philosophy. Education is imparted through the use of ICT and each student is given a laptop.
� Apprenticeship Training to Engineering graduates and diploma holders initiated with the guidance of Board of Apprenticeship Training (BOAT), Ministry of Secondary and Higher Education, Govt. of India and other state Level departments.
� Transmission of recorded technical lessons and live interaction between students and lecturers through KU band and teaching students via electronic classrooms done throughout the state with the help of the State Board of Technical Education & Training.
� Online Verification of Degrees: OLIVE database setup in 1999 with the data of students who have qualified professional degree programs from various universities in AP. (This initiative prevents the entry of students with fake certificates and facilitates faster issuance of VISAs to students at the US consulate at Chennai).
� All the universities & IIITs in the state included in the OLIVE database. � The database includes the specimen signature of all the authorized signatories on the degree
certificates of various Universities in the State. � Facilities for Career Guidance and counselling for engineering degree/diploma institutions. � The department and the board, provide academic improvement at Diploma Level for in service
candidates, through correspondence cum contact courses (CCC). � Centrally sponsored schemes such as Teacher Education Quality Improvement Program
(TEQIP) launched in Engineering and government Polytechnic Colleges in the state. (AP was judged the best in implementation of the project in the Joint Review Meeting (JRM)).
� SONET (Society for Networking for Excellence in Technical Education) provides interconnectivity among engineering colleges, to adopt innovative teaching practices, digitize library and video conferencing etc. throughout the state. SONET provides latest International technical journals to its member Colleges.
Strategies proposed for improvement of Higher Education15 1. Creating equal opportunities
� An obligatory principle that needs to be practiced is that no student who is eligible (given the previous academic record) and interested in higher education is deprived of the opportunity for higher education because of economic or non-economic reasons.
15 Approach to the 12th Five Year Plan Andhra Pradesh
31 | ASHE - Annual Status of Higher Education in States and UTs, 2012
� Introducing Scholarships for students bellowing to SC/ST/OBC and minority communities.
2. Quality of education � Ensuring qualified teachers especially private in institutions. � Ensuring required infrastructure. � Implementing Teacher Training programmes – updating subject knowledge and teaching
methods. � Setting up a mechanism for the assessment of teachers and institutions. � Implementing a system of accreditation and ranking of institutions based on the quality of
education.
3. Institutional Reforms � Developing regulatory framework for mechanism for the private and corporate institutions
providing higher, professional and technical education. � Setting up a mechanism for preventing malpractices. � Setting up of monitoring mechanism especially for private institution. (Grading of Institutions
based on their performance and placement)
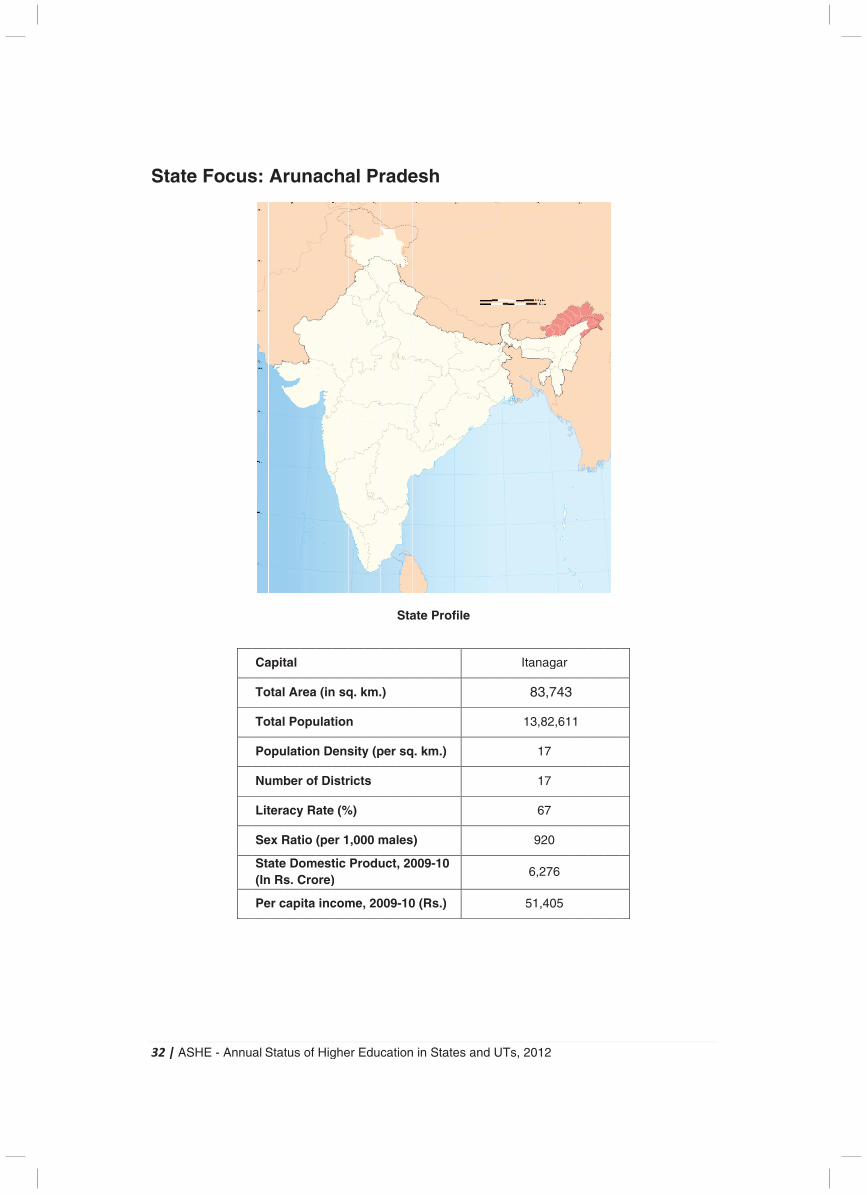
3
S
32 |
Sta
| AS
ate
SHE
e F
E -
Fo
An
oc
nnu
us
al S
s:
Ca
To
To
Po
Nu
Lit
Se
Sta(In
Pe
Stat
Ar
apit
otal
otal
opu
umb
tera
ex R
aten Rs
er c
tus
ru
tal
Ar
Po
ulat
ber
acy
Rat
e Dos. C
cap
of
na
rea
opu
tion
r of
y Ra
tio (
omCro
ita
Hig
ac
(in
ulat
n D
f Di
ate
(pe
mestore)
inc
ghe
cha
n sq
tion
ens
istr
e (%
er 1
tic )
com
er E
al
q. k
n
sity
rict
%)
,00
Pro
me,
Edu
Pr
km.
y (p
s
00 m
odu
, 20
cat
ra
.)
per
ma
uct
009
tion
de
Sta
sq
les
, 20
9-10
n in
es
ate
q. k
s)
009
0 (R
Sta
h
Pr
m.)
9-10
Rs.)
ates
ofi
)
0
)
s a
le
nd
UT
Ts, 2
I
201
tan
83
13,
1
1
6
9
6,2
51
12
nag
3,7
82,
17
17
67
920
276
,40
ar
743
,61
6
05
1

33 | ASHE - Annual Status of Higher Education in States and UTs, 2012
Introduction
Arunachal Pradesh is one the seven sister states, and is located in the north-eastern region of the country. The erstwhile North-East Frontier Agency, the state shares international boundaries with Bhutan, Tibet, China and Myanmar. In terms of state boundaries, Arunachal Pradesh shares it boundaries with Assam and Nagaland. The terrain of the state is largely mountainous, and agriculture and horticulture are the key occupations of the local population. After being constituted as a union territory in 1972, Arunachal Pradesh later became the 24th state of the Indian Union in the year 1987.
The state is spread over 80,000 sq. km., and has a small population of approximately 13 lakh. The state is characterized by its low density of population (17 per sq. km.). In terms of literacy, the state has a poor literacy rate of 66.95% and stands 34th among the 35 states and union territories of India.
Universities and University Level Institutes
The state has only 3 university level institutions, with one central university; one deemed university and one National Institute of Technology. There are plans for two new private universities, which will be soon established – their UGC approval is pending, since the information sought for inspection purpose is yet to be received by the UGC.
The Rajiv Gandhi University (central university) is the premier institution for higher education in the state, and has completed twenty-five years of existence. Functional from the year 1985, the university was converted into a central university during the year 2007.
The only deemed university in Arunachal Pradesh, North Eastern Regional Institute of Science and Technology (NERIST) is a science and technology oriented higher education institution, which was established in 1984 and has student strength of approximately 1,500. The institution offers innovative and unconventional academic programs in the areas of agricultural engineering, civil engineering, computer science, electronics and communications engineering, electrical engineering, mechanical engineering, forestry, physics, mathematics and management. Certificate, diploma and degree programs are offered by the institution with an aim to enhance employability of the students after completion of their Class XII and to develop skills for technician, supervisory and executive levels. Till date, 21 batches have graduated from the institute. In addition to the above two universities, a National Institute of Technology (institute of national importance) was also established in the year 2010.
Table 1: Distribution of Universities & University Level Institutions at State & National Level
Type of University Arunachal Pradesh
(2011-12) India
(2011-12)
State University 0 285
Private University 216 112
Institution of National Importance 1 39
Deemed University 1 129
Central University 1 40
Total 5 605
Source: UGC
16 For the two private universities in Arunachal Pradesh, the information requested by UGC for inspection purpose is yet to be received
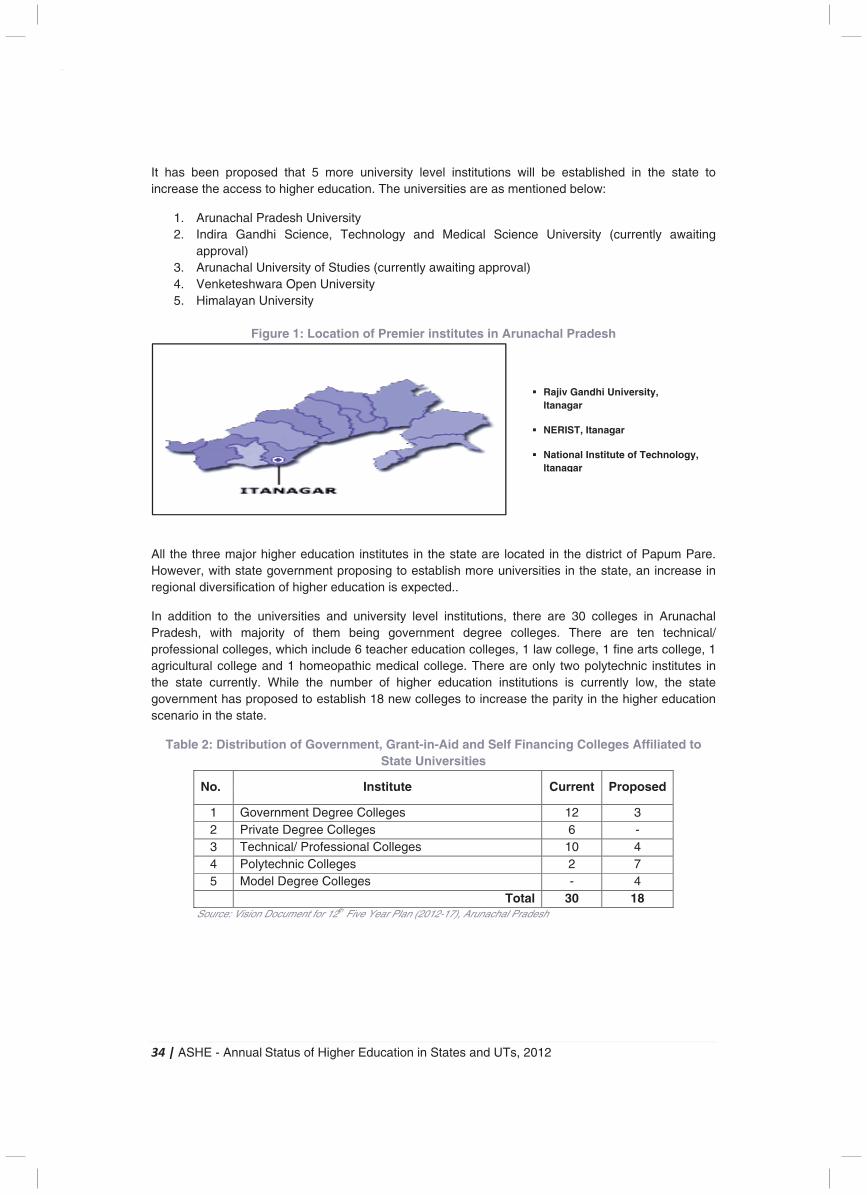
34 | ASHE - Annual Status of Higher Education in States and UTs, 2012
It has been proposed that 5 more university level institutions will be established in the state to increase the access to higher education. The universities are as mentioned below:
1. Arunachal Pradesh University 2. Indira Gandhi Science, Technology and Medical Science University (currently awaiting
approval) 3. Arunachal University of Studies (currently awaiting approval) 4. Venketeshwara Open University 5. Himalayan University
Figure 1: Location of Premier institutes in Arunachal Pradesh
All the three major higher education institutes in the state are located in the district of Papum Pare. However, with state government proposing to establish more universities in the state, an increase in regional diversification of higher education is expected..
In addition to the universities and university level institutions, there are 30 colleges in Arunachal Pradesh, with majority of them being government degree colleges. There are ten technical/ professional colleges, which include 6 teacher education colleges, 1 law college, 1 fine arts college, 1 agricultural college and 1 homeopathic medical college. There are only two polytechnic institutes in the state currently. While the number of higher education institutions is currently low, the state government has proposed to establish 18 new colleges to increase the parity in the higher education scenario in the state.
Table 2: Distribution of Government, Grant-in-Aid and Self Financing Colleges Affiliated to State Universities
No. Institute Current Proposed
1 Government Degree Colleges 12 3 2 Private Degree Colleges 6 - 3 Technical/ Professional Colleges 10 4 4 Polytechnic Colleges 2 7 5 Model Degree Colleges - 4
Total 30 18 Source: Vision Document for 12th Five Year Plan (2012-17), Arunachal Pradesh
� Rajiv Gandhi University, Itanagar
� NERIST, Itanagar � National Institute of Technology,
Itanagar
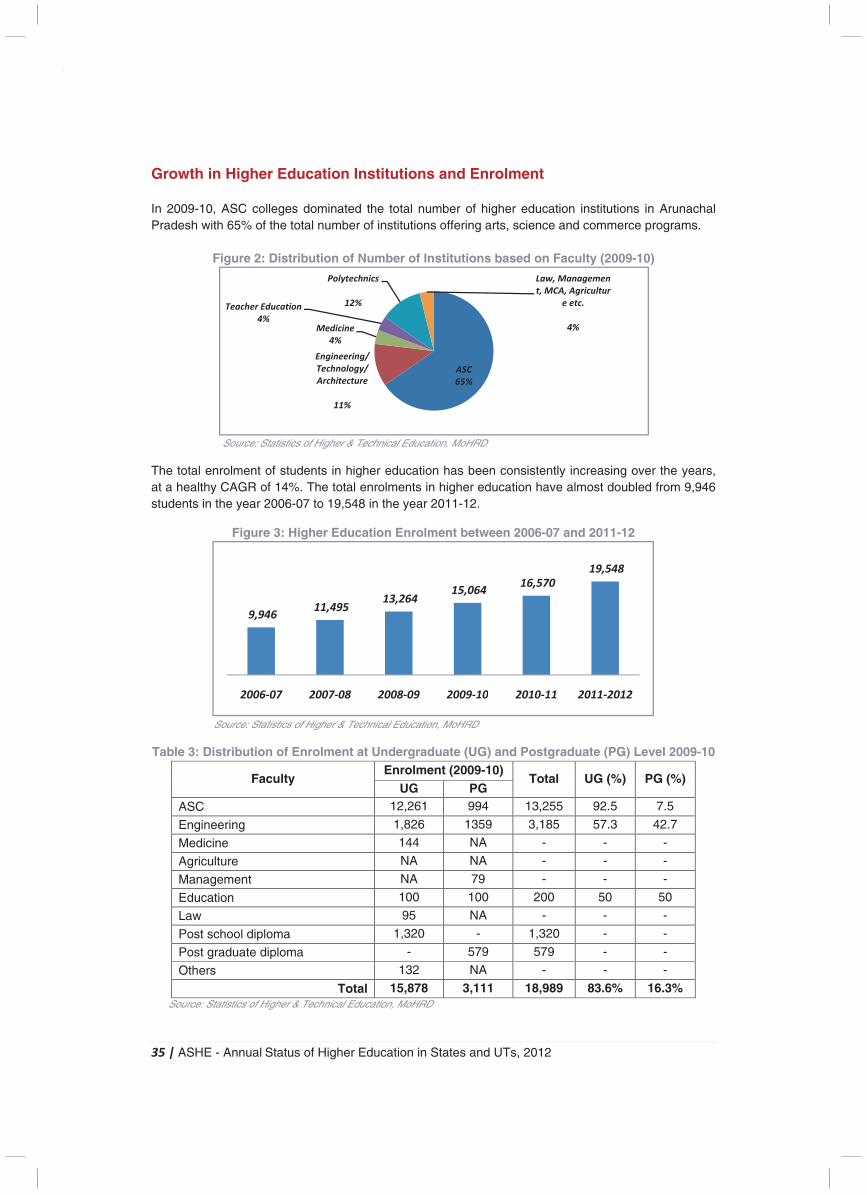
35 | ASHE - Annual Status of Higher Education in States and UTs, 2012
Growth in Higher Education Institutions and Enrolment In 2009-10, ASC colleges dominated the total number of higher education institutions in Arunachal Pradesh with 65% of the total number of institutions offering arts, science and commerce programs.
Figure 2: Distribution of Number of Institutions based on Faculty (2009-10)
Source: Statistics of Higher & Technical Education, MoHRD
The total enrolment of students in higher education has been consistently increasing over the years, at a healthy CAGR of 14%. The total enrolments in higher education have almost doubled from 9,946 students in the year 2006-07 to 19,548 in the year 2011-12.
Figure 3: Higher Education Enrolment between 2006-07 and 2011-12
Source: Statistics of Higher & Technical Education, MoHRD
Table 3: Distribution of Enrolment at Undergraduate (UG) and Postgraduate (PG) Level 2009-10
Faculty Enrolment (2009-10)
Total UG (%) PG (%) UG PG
ASC 12,261 994 13,255 92.5 7.5
Engineering 1,826 1359 3,185 57.3 42.7
Medicine 144 NA - - -
Agriculture NA NA - - -
Management NA 79 - - -
Education 100 100 200 50 50
Law 95 NA - - -
Post school diploma 1,320 - 1,320 - -
Post graduate diploma - 579 579 - -
Others 132 NA - - -
Total 15,878 3,111 18,989 83.6% 16.3% Source: Statistics of Higher & Technical Education, MoHRD
CAGR: 14%
ASC
65%
Engineering/
Technology/
Architecture
11%
Medicine
4%
Teacher Education
4%
Polytechnics
12%
Law, Managemen
t, MCA, Agricultur
e etc.
4%
9,946 11,495
13,264 15,064
16,570
19,548
2006-07 2007-08 2008-09 2009-10 2010-11 2011-2012
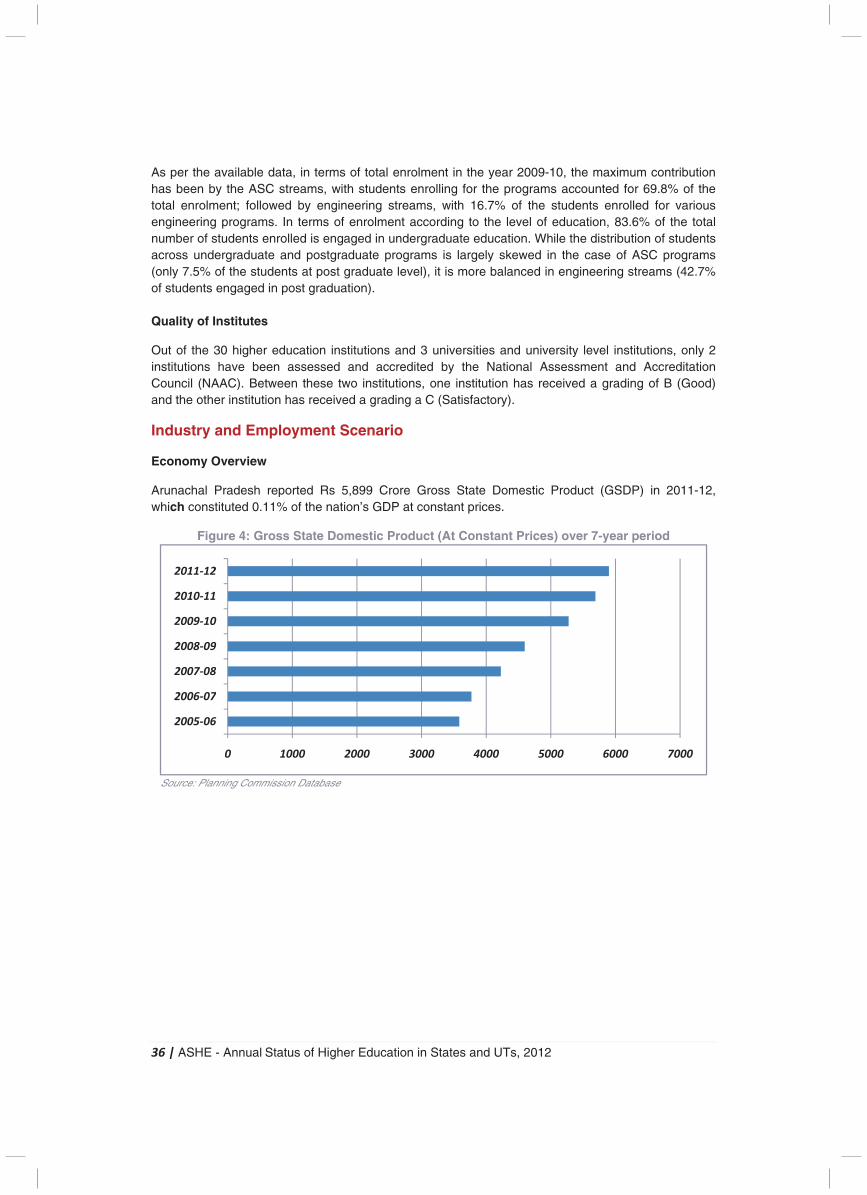
36 | ASHE - Annual Status of Higher Education in States and UTs, 2012
As per the available data, in terms of total enrolment in the year 2009-10, the maximum contribution has been by the ASC streams, with students enrolling for the programs accounted for 69.8% of the total enrolment; followed by engineering streams, with 16.7% of the students enrolled for various engineering programs. In terms of enrolment according to the level of education, 83.6% of the total number of students enrolled is engaged in undergraduate education. While the distribution of students across undergraduate and postgraduate programs is largely skewed in the case of ASC programs (only 7.5% of the students at post graduate level), it is more balanced in engineering streams (42.7% of students engaged in post graduation). Quality of Institutes
Out of the 30 higher education institutions and 3 universities and university level institutions, only 2 institutions have been assessed and accredited by the National Assessment and Accreditation Council (NAAC). Between these two institutions, one institution has received a grading of B (Good) and the other institution has received a grading a C (Satisfactory).
Industry and Employment Scenario
Economy Overview
Arunachal Pradesh reported Rs 5,899 Crore Gross State Domestic Product (GSDP) in 2011-12, which constituted 0.11% of the nation’s GDP at constant prices.
Figure 4: Gross State Domestic Product (At Constant Prices) over 7-year period
Source: Planning Commission Database
CAGR8.6%
0 1000 2000 3000 4000 5000 6000 7000
2005-06
2006-07
2007-08
2008-09
2009-10
2010-11
2011-12
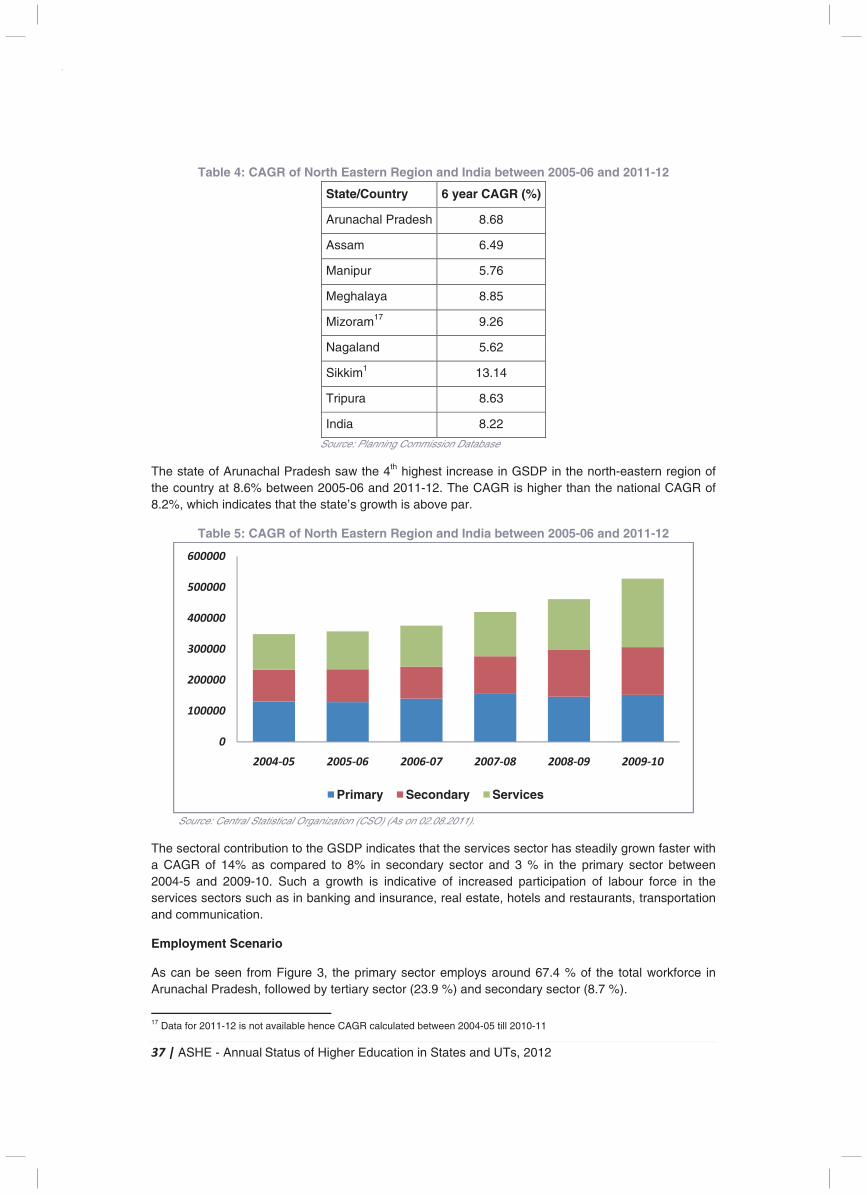
37 | ASHE - Annual Status of Higher Education in States and UTs, 2012
Table 4: CAGR of North Eastern Region and India between 2005-06 and 2011-12
State/Country 6 year CAGR (%)
Arunachal Pradesh 8.68
Assam 6.49
Manipur 5.76
Meghalaya 8.85
Mizoram17 9.26
Nagaland 5.62
Sikkim1 13.14
Tripura 8.63
India 8.22
Source: Planning Commission Database
The state of Arunachal Pradesh saw the 4th highest increase in GSDP in the north-eastern region of the country at 8.6% between 2005-06 and 2011-12. The CAGR is higher than the national CAGR of 8.2%, which indicates that the state’s growth is above par.
Table 5: CAGR of North Eastern Region and India between 2005-06 and 2011-12
Source: Central Statistical Organization (CSO) (As on 02.08.2011).
The sectoral contribution to the GSDP indicates that the services sector has steadily grown faster with a CAGR of 14% as compared to 8% in secondary sector and 3 % in the primary sector between 2004-5 and 2009-10. Such a growth is indicative of increased participation of labour force in the services sectors such as in banking and insurance, real estate, hotels and restaurants, transportation and communication.
Employment Scenario
As can be seen from Figure 3, the primary sector employs around 67.4 % of the total workforce in Arunachal Pradesh, followed by tertiary sector (23.9 %) and secondary sector (8.7 %).
17 Data for 2011-12 is not available hence CAGR calculated between 2004-05 till 2010-11
14%
8%
3%
0
100000
200000
300000
400000
500000
600000
2004-05 2005-06 2006-07 2007-08 2008-09 2009-10
Primary Secondary Services
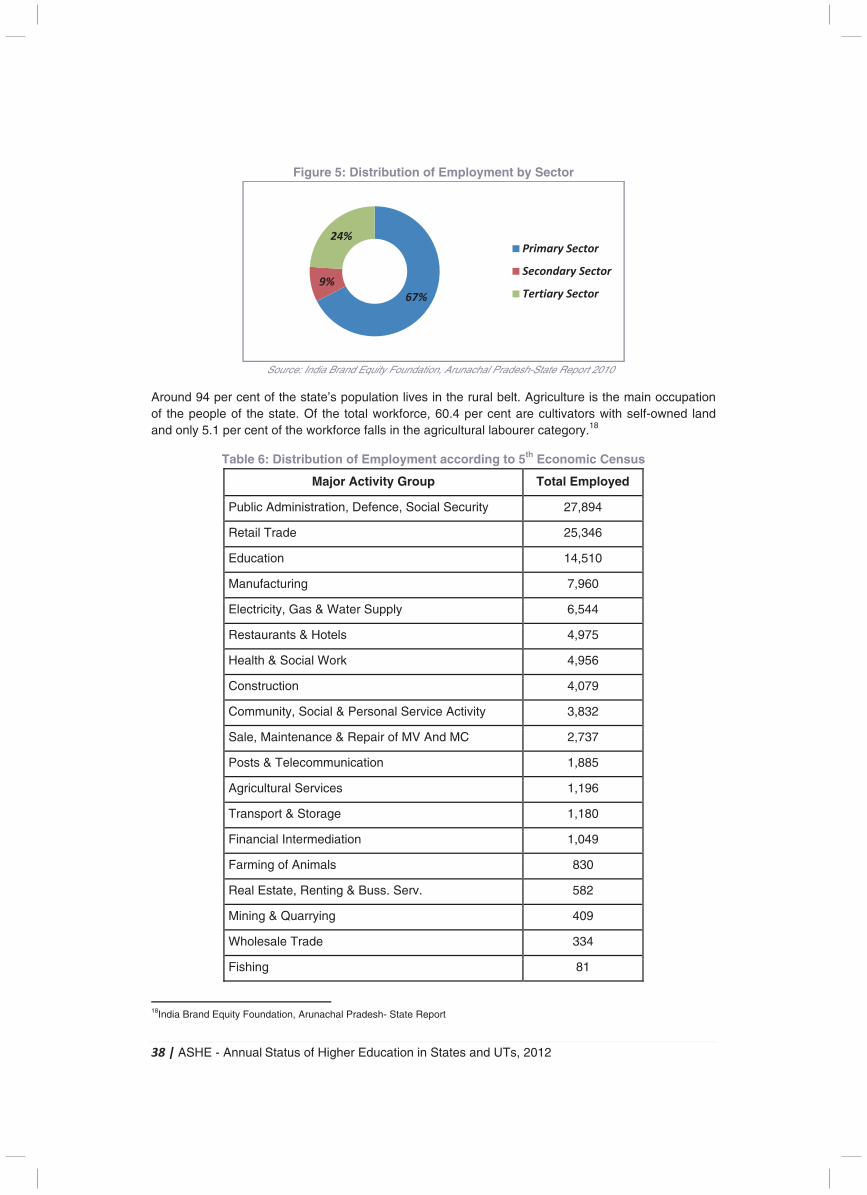
38 | ASHE - Annual Status of Higher Education in States and UTs, 2012
Figure 5: Distribution of Employment by Sector
Source: India Brand Equity Foundation, Arunachal Pradesh-State Report 2010
Around 94 per cent of the state’s population lives in the rural belt. Agriculture is the main occupation of the people of the state. Of the total workforce, 60.4 per cent are cultivators with self-owned land and only 5.1 per cent of the workforce falls in the agricultural labourer category.18
Table 6: Distribution of Employment according to 5th Economic Census
Major Activity Group Total Employed
Public Administration, Defence, Social Security 27,894
Retail Trade 25,346
Education 14,510
Manufacturing 7,960
Electricity, Gas & Water Supply 6,544
Restaurants & Hotels 4,975
Health & Social Work 4,956
Construction 4,079
Community, Social & Personal Service Activity 3,832
Sale, Maintenance & Repair of MV And MC 2,737
Posts & Telecommunication 1,885
Agricultural Services 1,196
Transport & Storage 1,180
Financial Intermediation 1,049
Farming of Animals 830
Real Estate, Renting & Buss. Serv. 582
Mining & Quarrying 409
Wholesale Trade 334
Fishing 81
18India Brand Equity Foundation, Arunachal Pradesh- State Report
67%
9%
24%Primary Sector
Secondary Sector
Tertiary Sector
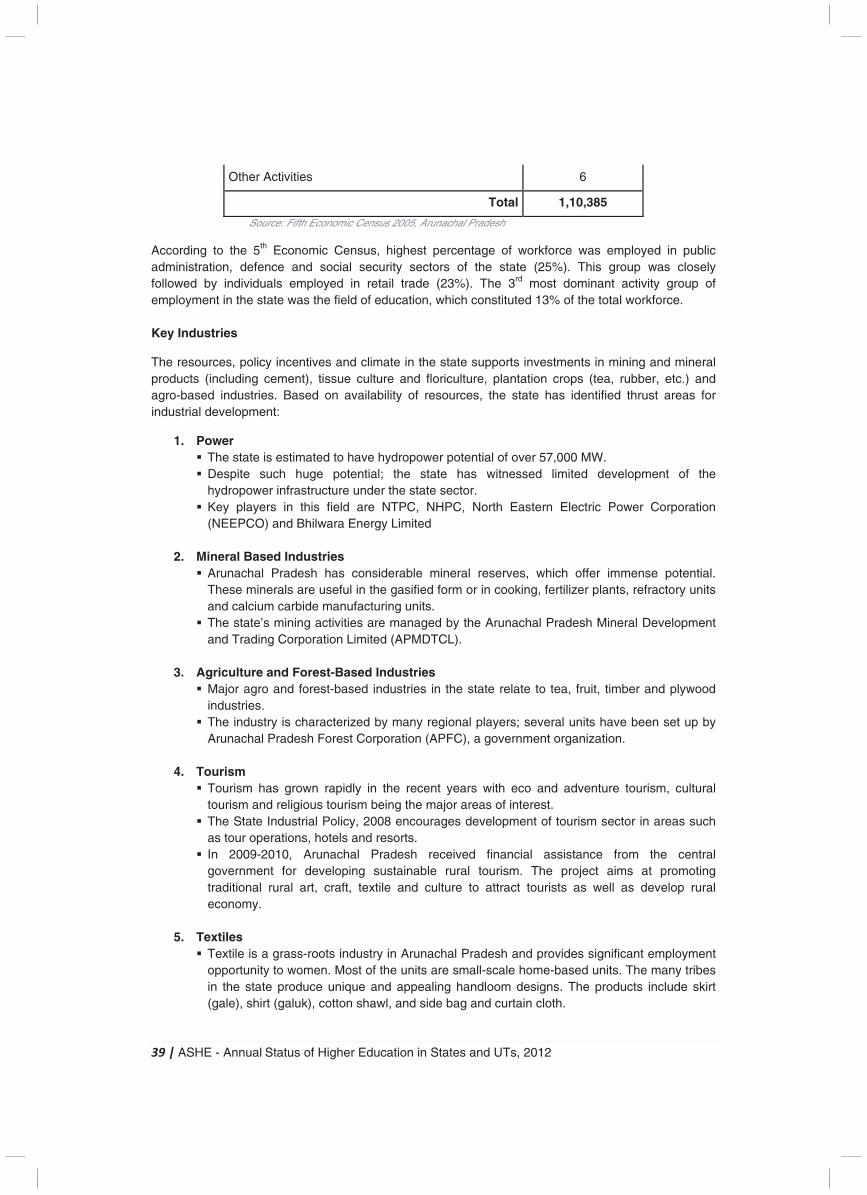
39 | ASHE - Annual Status of Higher Education in States and UTs, 2012
Other Activities 6
Total 1,10,385
Source: Fifth Economic Census 2005, Arunachal Pradesh
According to the 5th Economic Census, highest percentage of workforce was employed in public administration, defence and social security sectors of the state (25%). This group was closely followed by individuals employed in retail trade (23%). The 3rd most dominant activity group of employment in the state was the field of education, which constituted 13% of the total workforce. Key Industries
The resources, policy incentives and climate in the state supports investments in mining and mineral products (including cement), tissue culture and floriculture, plantation crops (tea, rubber, etc.) and agro-based industries. Based on availability of resources, the state has identified thrust areas for industrial development:
1. Power � The state is estimated to have hydropower potential of over 57,000 MW. � Despite such huge potential; the state has witnessed limited development of the
hydropower infrastructure under the state sector. � Key players in this field are NTPC, NHPC, North Eastern Electric Power Corporation
(NEEPCO) and Bhilwara Energy Limited
2. Mineral Based Industries � Arunachal Pradesh has considerable mineral reserves, which offer immense potential.
These minerals are useful in the gasified form or in cooking, fertilizer plants, refractory units and calcium carbide manufacturing units.
� The state’s mining activities are managed by the Arunachal Pradesh Mineral Development and Trading Corporation Limited (APMDTCL).
3. Agriculture and Forest-Based Industries
� Major agro and forest-based industries in the state relate to tea, fruit, timber and plywood industries.
� The industry is characterized by many regional players; several units have been set up by Arunachal Pradesh Forest Corporation (APFC), a government organization.
4. Tourism
� Tourism has grown rapidly in the recent years with eco and adventure tourism, cultural tourism and religious tourism being the major areas of interest.
� The State Industrial Policy, 2008 encourages development of tourism sector in areas such as tour operations, hotels and resorts.
� In 2009-2010, Arunachal Pradesh received financial assistance from the central government for developing sustainable rural tourism. The project aims at promoting traditional rural art, craft, textile and culture to attract tourists as well as develop rural economy.
5. Textiles
� Textile is a grass-roots industry in Arunachal Pradesh and provides significant employment opportunity to women. Most of the units are small-scale home-based units. The many tribes in the state produce unique and appealing handloom designs. The products include skirt (gale), shirt (galuk), cotton shawl, and side bag and curtain cloth.
40 | ASHE - Annual Status of Higher Education in States and UTs, 2012
Initiatives for Skill Development / Employment Generation19
� Skill Development Council and Employment Generation Council were set up under the chairmanship of chief minister.
� Assessment of state requirements and gaps was performed – courses in ITIs to be introduced accordingly.
� 5 govt. ITIs (2 NEEPCO, 2 NHPC) and 1 private ITI are functional in the state; 11 additional ITIs – one in each district has been proposed.
� NEC sponsored trainings for professional courses were initiated. � Sponsorships for students for vocational courses in cities like New Delhi etc. (hospitality
industry etc.) have been initiated. � 9 polytechnics are under construction during 12th Five Year Plan.
Current Initiatives in Higher Education
The state government of Arunachal Pradesh has proposed several initiatives to combat the concerns of equity, regional imbalance and quality in higher education. A brief about these initiatives is given below:
� Establishment of seven model degree colleges. � Starting of academic programs of 9 polytechnic institutes funded under the GoI scheme. � Establishment of law college, with infrastructure being provided by NHPC. � Establishment of six new private teacher education colleges. � Renovation of two government colleges, whose buildings were constructed in the 1970-80
period. � Construction of classroom, libraries, laboratories and staff quarters in all the colleges. � Provision of computer education to all the students across colleges. � Establishment of three polytechnic institutes under the Public Private Partnership model.
19 Arunachal Pradesh, Annual Panel Discussion 2012-13, Planning Commission
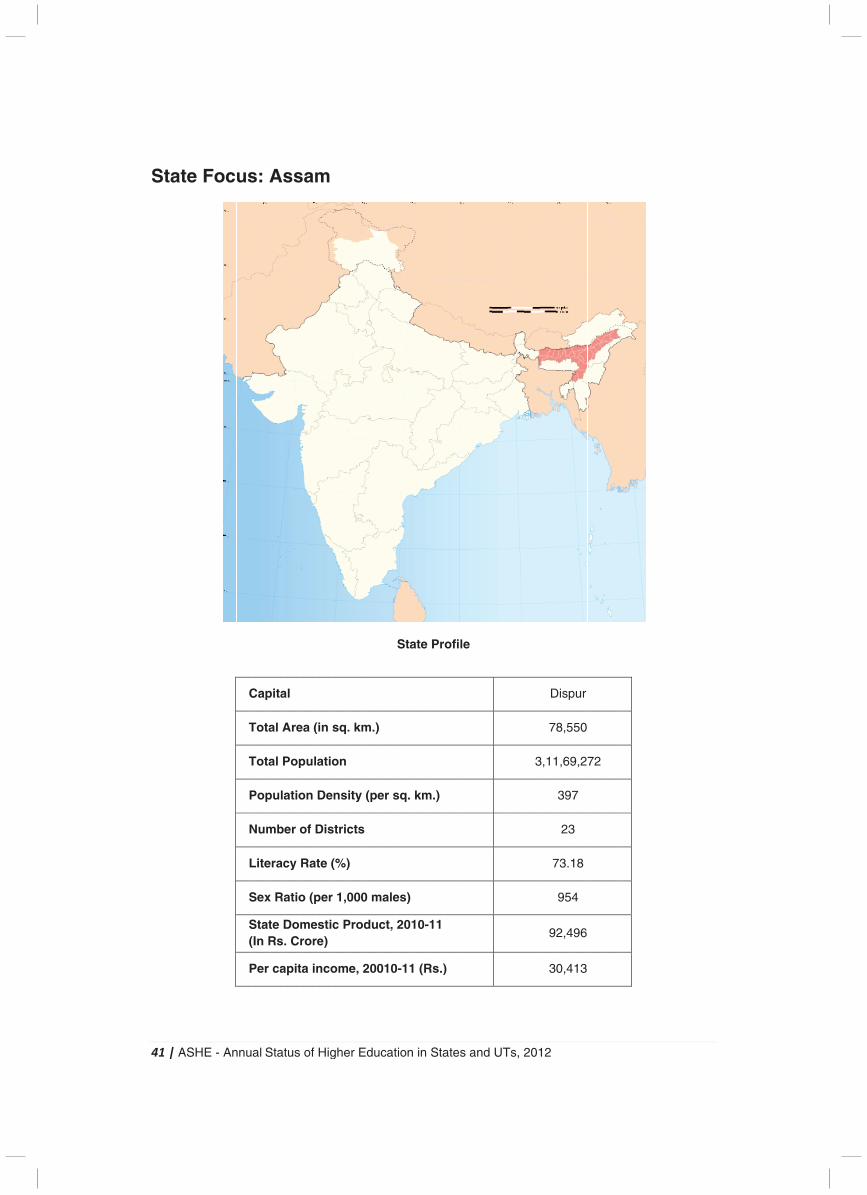
4
S
41 |
Sta
| AS
ate
SHE
e F
E -
Fo
An
oc
nnu
us
C
T
T
P
N
L
S
S(
P
al S
s:
Cap
Tota
Tota
Pop
Num
Lite
Sex
Stat(In R
Per
Stat
As
pita
al A
al P
pula
mbe
erac
x Ra
te DRs.
r ca
tus
ss
al
Are
Pop
atio
er o
cy
atio
Dom. Cr
apit
of
sam
ea (
pul
on
of D
Rat
o (p
meror
ta in
Hig
m
(in
atio
De
Dis
te (
per
estire)
nco
ghe
sq.
on
ensi
stric
(%)
r 1,0
c P
om
er E
. km
ity
cts
)
000
Prod
e, 2
Edu
m.)
(pe
0 m
duc
200
cat
er s
male
ct,
010
tion
Sta
sq.
es)
201
0-11
n in
ate
km
10-
1 (R
Sta
Pr
m.)
-11
Rs.)
ates
ofi
)
s a
le
nd
UT
Ts, 2
201
3
12
D
7
3,11
7
9
3
Disp
8,5
1,69
39
23
73.1
95
2,4
0,4
pur
550
9,27
7
3
18
4
496
413
72
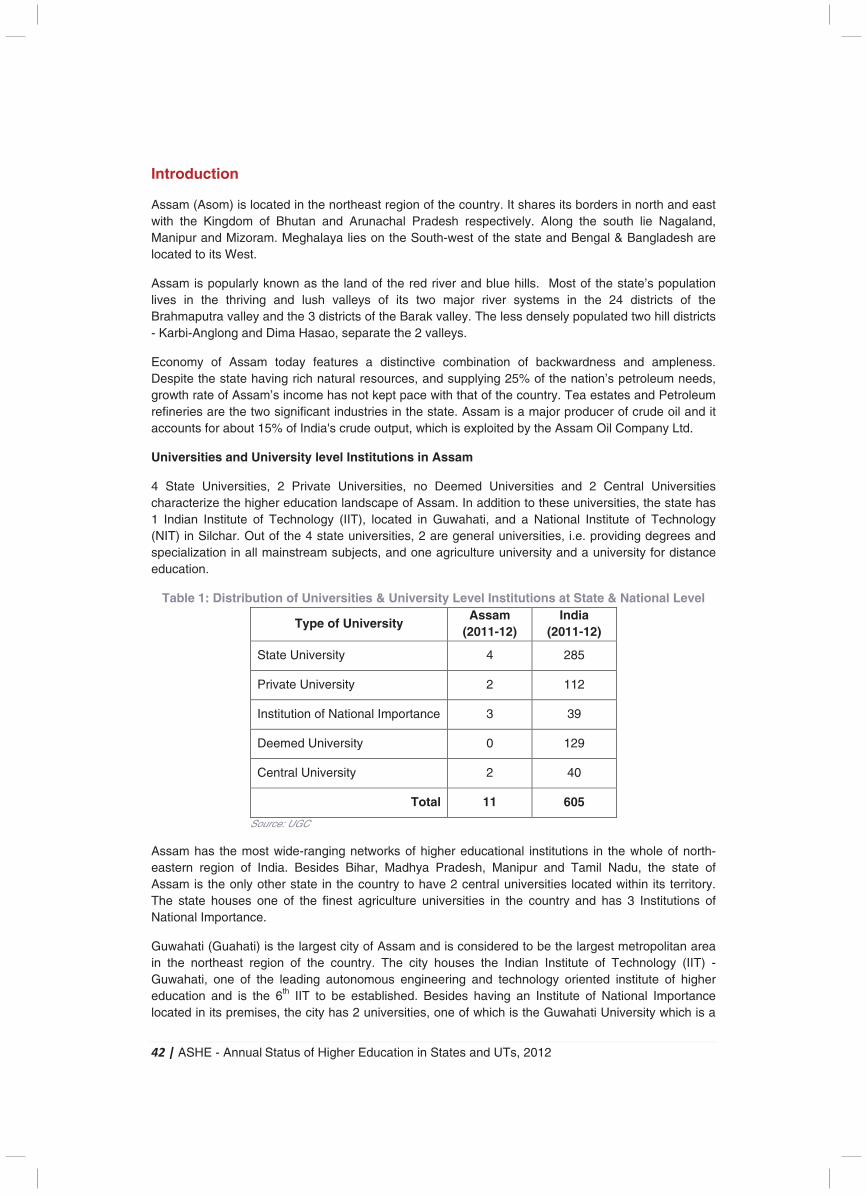
42 | ASHE - Annual Status of Higher Education in States and UTs, 2012
Introduction
Assam (Asom) is located in the northeast region of the country. It shares its borders in north and east with the Kingdom of Bhutan and Arunachal Pradesh respectively. Along the south lie Nagaland, Manipur and Mizoram. Meghalaya lies on the South-west of the state and Bengal & Bangladesh are located to its West.
Assam is popularly known as the land of the red river and blue hills. Most of the state’s population lives in the thriving and lush valleys of its two major river systems in the 24 districts of the Brahmaputra valley and the 3 districts of the Barak valley. The less densely populated two hill districts - Karbi-Anglong and Dima Hasao, separate the 2 valleys.
Economy of Assam today features a distinctive combination of backwardness and ampleness. Despite the state having rich natural resources, and supplying 25% of the nation’s petroleum needs, growth rate of Assam’s income has not kept pace with that of the country. Tea estates and Petroleum refineries are the two significant industries in the state. Assam is a major producer of crude oil and it accounts for about 15% of India's crude output, which is exploited by the Assam Oil Company Ltd.
Universities and University level Institutions in Assam
4 State Universities, 2 Private Universities, no Deemed Universities and 2 Central Universities characterize the higher education landscape of Assam. In addition to these universities, the state has 1 Indian Institute of Technology (IIT), located in Guwahati, and a National Institute of Technology (NIT) in Silchar. Out of the 4 state universities, 2 are general universities, i.e. providing degrees and specialization in all mainstream subjects, and one agriculture university and a university for distance education.
Table 1: Distribution of Universities & University Level Institutions at State & National Level
Type of University Assam
(2011-12) India
(2011-12)
State University 4 285
Private University 2 112
Institution of National Importance 3 39
Deemed University 0 129
Central University 2 40
Total 11 605
Source: UGC
Assam has the most wide-ranging networks of higher educational institutions in the whole of north-eastern region of India. Besides Bihar, Madhya Pradesh, Manipur and Tamil Nadu, the state of Assam is the only other state in the country to have 2 central universities located within its territory. The state houses one of the finest agriculture universities in the country and has 3 Institutions of National Importance.
Guwahati (Guahati) is the largest city of Assam and is considered to be the largest metropolitan area in the northeast region of the country. The city houses the Indian Institute of Technology (IIT) - Guwahati, one of the leading autonomous engineering and technology oriented institute of higher education and is the 6th IIT to be established. Besides having an Institute of National Importance located in its premises, the city has 2 universities, one of which is the Guwahati University which is a
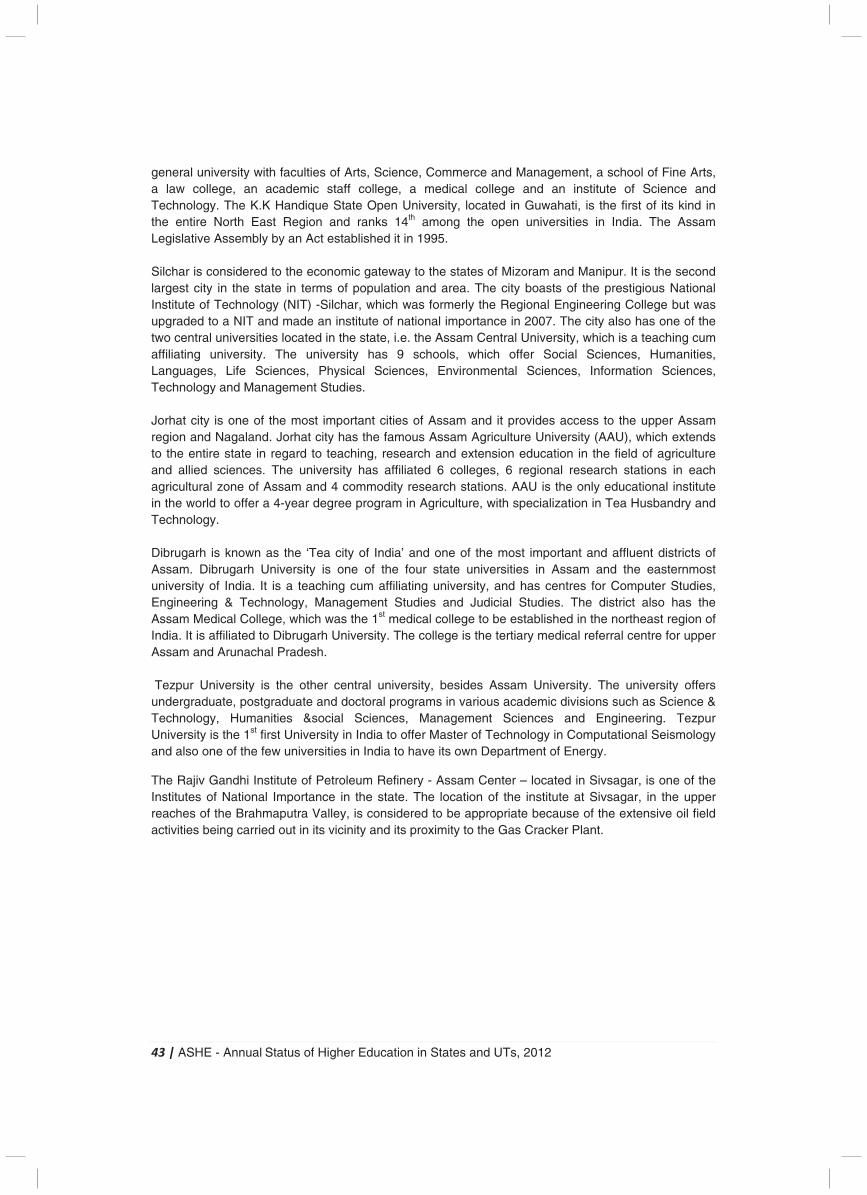
43 | ASHE - Annual Status of Higher Education in States and UTs, 2012
general university with faculties of Arts, Science, Commerce and Management, a school of Fine Arts, a law college, an academic staff college, a medical college and an institute of Science and Technology. The K.K Handique State Open University, located in Guwahati, is the first of its kind in the entire North East Region and ranks 14th among the open universities in India. The Assam Legislative Assembly by an Act established it in 1995. Silchar is considered to the economic gateway to the states of Mizoram and Manipur. It is the second largest city in the state in terms of population and area. The city boasts of the prestigious National Institute of Technology (NIT) -Silchar, which was formerly the Regional Engineering College but was upgraded to a NIT and made an institute of national importance in 2007. The city also has one of the two central universities located in the state, i.e. the Assam Central University, which is a teaching cum affiliating university. The university has 9 schools, which offer Social Sciences, Humanities, Languages, Life Sciences, Physical Sciences, Environmental Sciences, Information Sciences, Technology and Management Studies. Jorhat city is one of the most important cities of Assam and it provides access to the upper Assam region and Nagaland. Jorhat city has the famous Assam Agriculture University (AAU), which extends to the entire state in regard to teaching, research and extension education in the field of agriculture and allied sciences. The university has affiliated 6 colleges, 6 regional research stations in each agricultural zone of Assam and 4 commodity research stations. AAU is the only educational institute in the world to offer a 4-year degree program in Agriculture, with specialization in Tea Husbandry and Technology. Dibrugarh is known as the ‘Tea city of India’ and one of the most important and affluent districts of Assam. Dibrugarh University is one of the four state universities in Assam and the easternmost university of India. It is a teaching cum affiliating university, and has centres for Computer Studies, Engineering & Technology, Management Studies and Judicial Studies. The district also has the Assam Medical College, which was the 1st medical college to be established in the northeast region of India. It is affiliated to Dibrugarh University. The college is the tertiary medical referral centre for upper Assam and Arunachal Pradesh. Tezpur University is the other central university, besides Assam University. The university offers undergraduate, postgraduate and doctoral programs in various academic divisions such as Science & Technology, Humanities &social Sciences, Management Sciences and Engineering. Tezpur University is the 1st first University in India to offer Master of Technology in Computational Seismology and also one of the few universities in India to have its own Department of Energy.
The Rajiv Gandhi Institute of Petroleum Refinery - Assam Center – located in Sivsagar, is one of the Institutes of National Importance in the state. The location of the institute at Sivsagar, in the upper reaches of the Brahmaputra Valley, is considered to be appropriate because of the extensive oil field activities being carried out in its vicinity and its proximity to the Gas Cracker Plant.
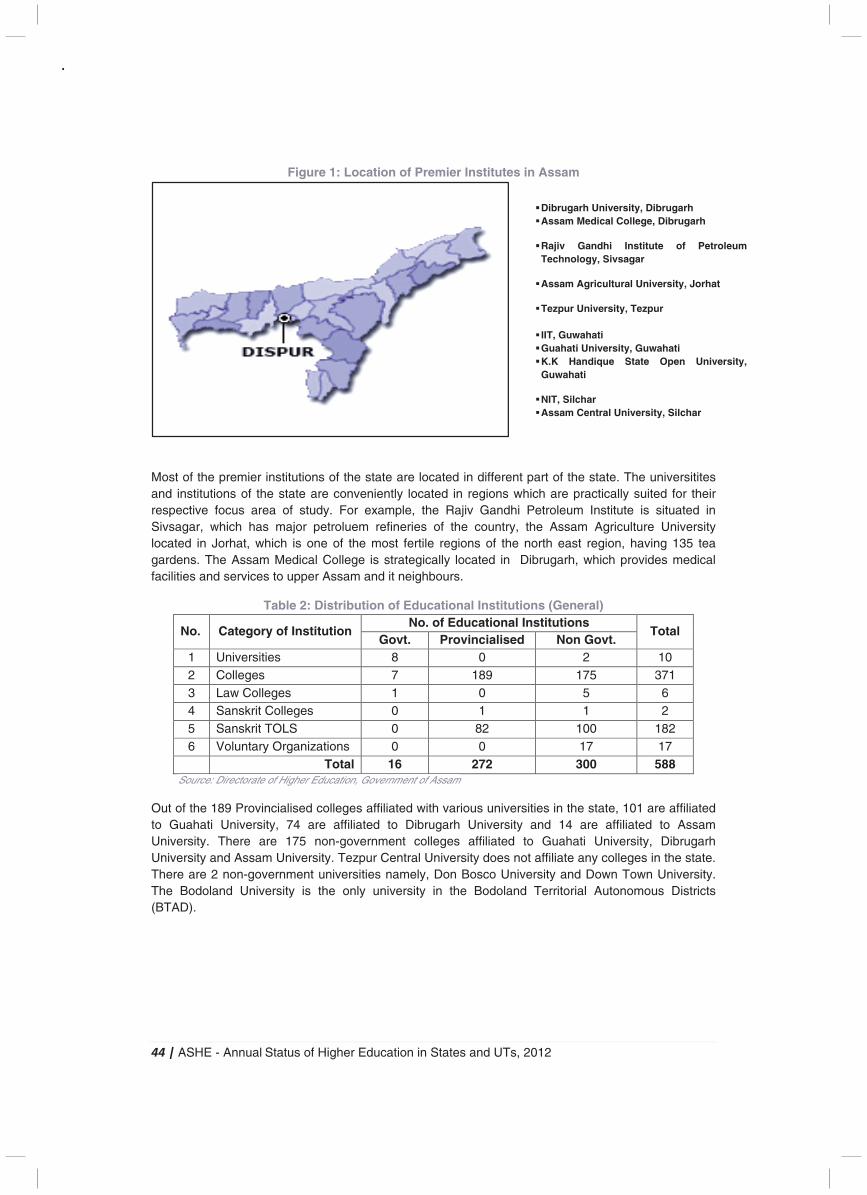
44 | ASHE - Annual Status of Higher Education in States and UTs, 2012
Figure 1: Location of Premier Institutes in Assam
Most of the premier institutions of the state are located in different part of the state. The universitites and institutions of the state are conveniently located in regions which are practically suited for their respective focus area of study. For example, the Rajiv Gandhi Petroleum Institute is situated in Sivsagar, which has major petroluem refineries of the country, the Assam Agriculture University located in Jorhat, which is one of the most fertile regions of the north east region, having 135 tea gardens. The Assam Medical College is strategically located in Dibrugarh, which provides medical facilities and services to upper Assam and it neighbours.
Table 2: Distribution of Educational Institutions (General)
No. Category of Institution No. of Educational Institutions
Total Govt. Provincialised Non Govt.
1 Universities 8 0 2 10 2 Colleges 7 189 175 371 3 Law Colleges 1 0 5 6 4 Sanskrit Colleges 0 1 1 2 5 Sanskrit TOLS 0 82 100 182 6 Voluntary Organizations 0 0 17 17
Total 16 272 300 588 Source: Directorate of Higher Education, Government of Assam
Out of the 189 Provincialised colleges affiliated with various universities in the state, 101 are affiliated to Guahati University, 74 are affiliated to Dibrugarh University and 14 are affiliated to Assam University. There are 175 non-government colleges affiliated to Guahati University, Dibrugarh University and Assam University. Tezpur Central University does not affiliate any colleges in the state. There are 2 non-government universities namely, Don Bosco University and Down Town University. The Bodoland University is the only university in the Bodoland Territorial Autonomous Districts (BTAD).
� Dibrugarh University, Dibrugarh � Assam Medical College, Dibrugarh
� Rajiv Gandhi Institute of Petroleum
Technology, Sivsagar
� Assam Agricultural University, Jorhat
� Tezpur University, Tezpur � IIT, Guwahati � Guahati University, Guwahati � K.K Handique State Open University,
Guwahati
� NIT, Silchar � Assam Central University, Silchar
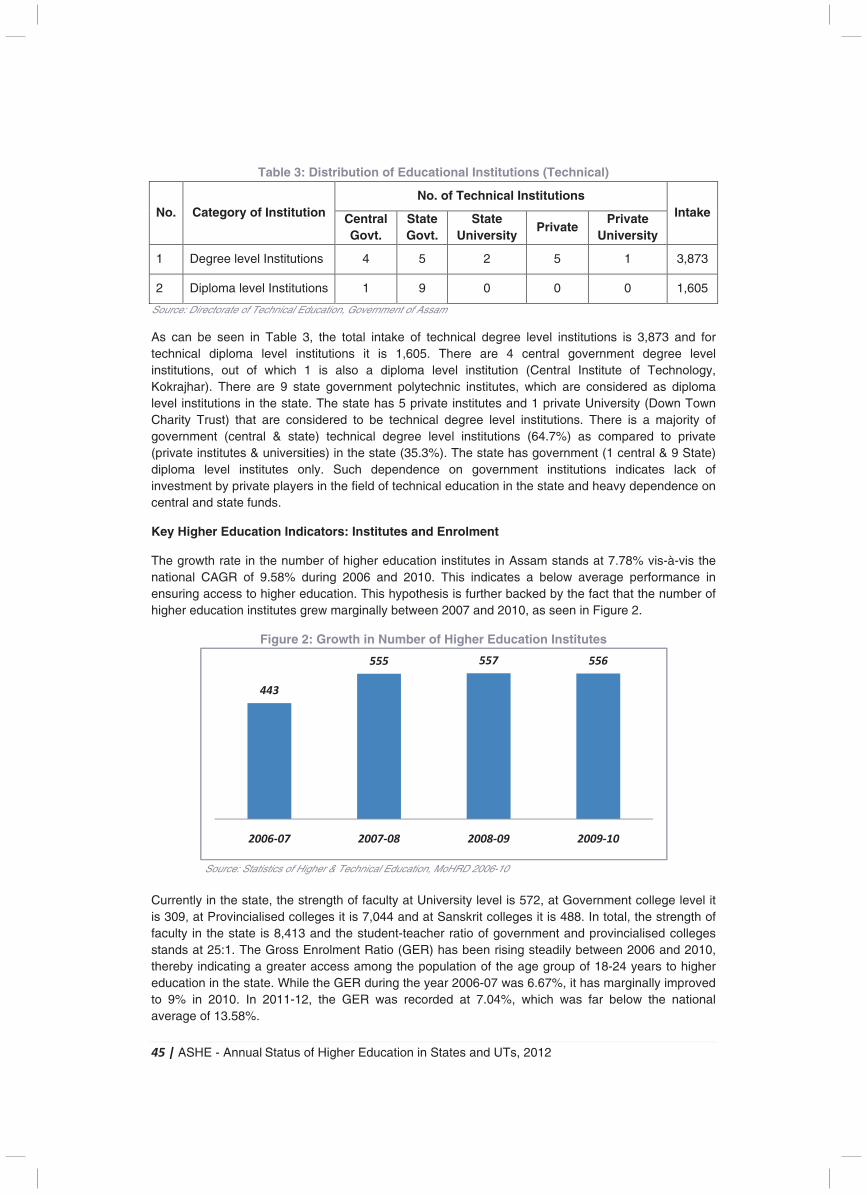
45 | ASHE - Annual Status of Higher Education in States and UTs, 2012
Table 3: Distribution of Educational Institutions (Technical)
No. Category of Institution No. of Technical Institutions
Intake Central Govt.
State Govt.
State University
Private Private
University
1 Degree level Institutions 4 5 2 5 1 3,873
2 Diploma level Institutions 1 9 0 0 0 1,605
Source: Directorate of Technical Education, Government of Assam
As can be seen in Table 3, the total intake of technical degree level institutions is 3,873 and for technical diploma level institutions it is 1,605. There are 4 central government degree level institutions, out of which 1 is also a diploma level institution (Central Institute of Technology, Kokrajhar). There are 9 state government polytechnic institutes, which are considered as diploma level institutions in the state. The state has 5 private institutes and 1 private University (Down Town Charity Trust) that are considered to be technical degree level institutions. There is a majority of government (central & state) technical degree level institutions (64.7%) as compared to private (private institutes & universities) in the state (35.3%). The state has government (1 central & 9 State) diploma level institutes only. Such dependence on government institutions indicates lack of investment by private players in the field of technical education in the state and heavy dependence on central and state funds.
Key Higher Education Indicators: Institutes and Enrolment
The growth rate in the number of higher education institutes in Assam stands at 7.78% vis-à-vis the national CAGR of 9.58% during 2006 and 2010. This indicates a below average performance in ensuring access to higher education. This hypothesis is further backed by the fact that the number of higher education institutes grew marginally between 2007 and 2010, as seen in Figure 2.
Figure 2: Growth in Number of Higher Education Institutes
Source: Statistics of Higher & Technical Education, MoHRD 2006-10
Currently in the state, the strength of faculty at University level is 572, at Government college level it is 309, at Provincialised colleges it is 7,044 and at Sanskrit colleges it is 488. In total, the strength of faculty in the state is 8,413 and the student-teacher ratio of government and provincialised colleges stands at 25:1. The Gross Enrolment Ratio (GER) has been rising steadily between 2006 and 2010, thereby indicating a greater access among the population of the age group of 18-24 years to higher education in the state. While the GER during the year 2006-07 was 6.67%, it has marginally improved to 9% in 2010. In 2011-12, the GER was recorded at 7.04%, which was far below the national average of 13.58%.
443
555 557 556
2006-07 2007-08 2008-09 2009-10
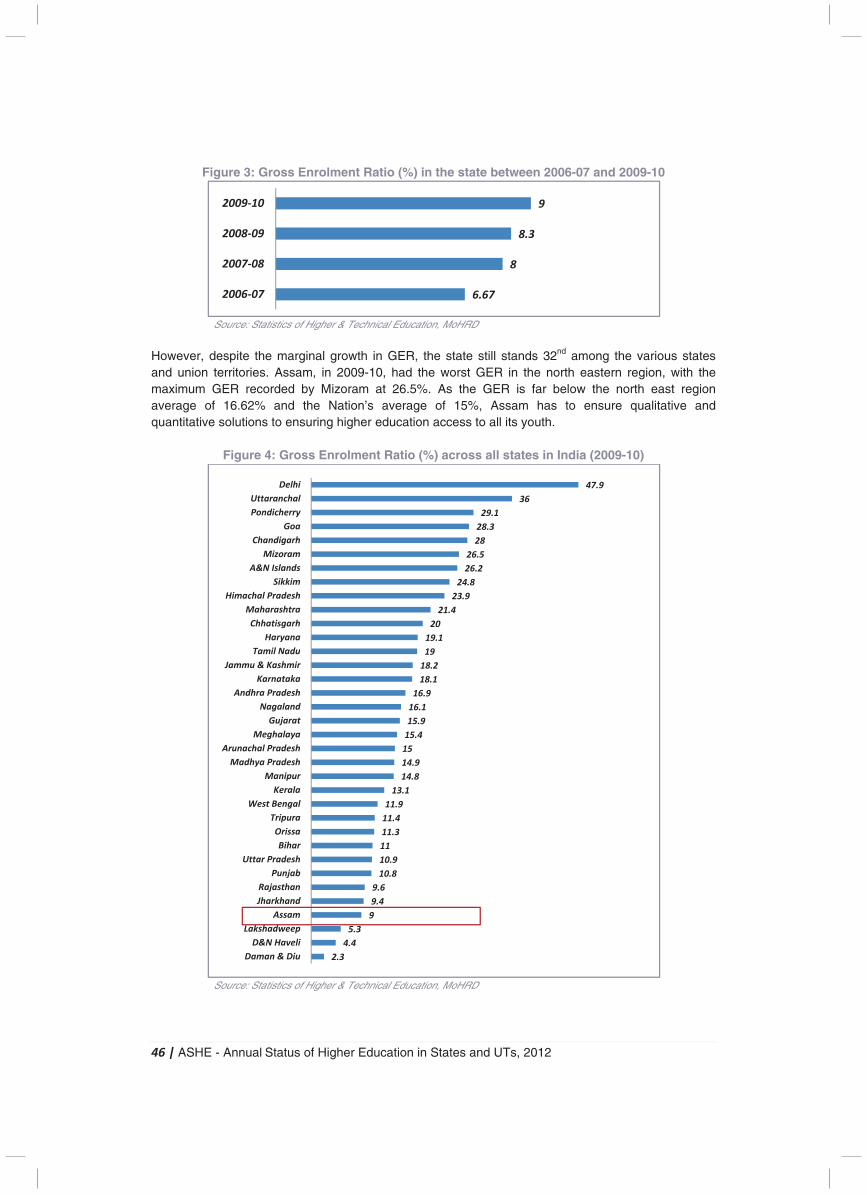
46 | ASHE - Annual Status of Higher Education in States and UTs, 2012
Figure 3: Gross Enrolment Ratio (%) in the state between 2006-07 and 2009-10
Source: Statistics of Higher & Technical Education, MoHRD
However, despite the marginal growth in GER, the state still stands 32nd among the various states and union territories. Assam, in 2009-10, had the worst GER in the north eastern region, with the maximum GER recorded by Mizoram at 26.5%. As the GER is far below the north east region average of 16.62% and the Nation’s average of 15%, Assam has to ensure qualitative and quantitative solutions to ensuring higher education access to all its youth.
Figure 4: Gross Enrolment Ratio (%) across all states in India (2009-10)
Source: Statistics of Higher & Technical Education, MoHRD
6.67
8
8.3
9
2006-07
2007-08
2008-09
2009-10
2.3
4.4
5.3
9
9.4
9.6
10.8
10.9
11
11.3
11.4
11.9
13.1
14.8
14.9
15
15.4
15.9
16.1
16.9
18.1
18.2
19
19.1
20
21.4
23.9
24.8
26.2
26.5
28
28.3
29.1
36
47.9
Daman & Diu
D&N Haveli
Lakshadweep
Assam
Jharkhand
Rajasthan
Punjab
Uttar Pradesh
Bihar
Orissa
Tripura
West Bengal
Kerala
Manipur
Madhya Pradesh
Arunachal Pradesh
Meghalaya
Gujarat
Nagaland
Andhra Pradesh
Karnataka
Jammu & Kashmir
Tamil Nadu
Haryana
Chhatisgarh
Maharashtra
Himachal Pradesh
Sikkim
A&N Islands
Mizoram
Chandigarh
Goa
Pondicherry
Uttaranchal
Delhi
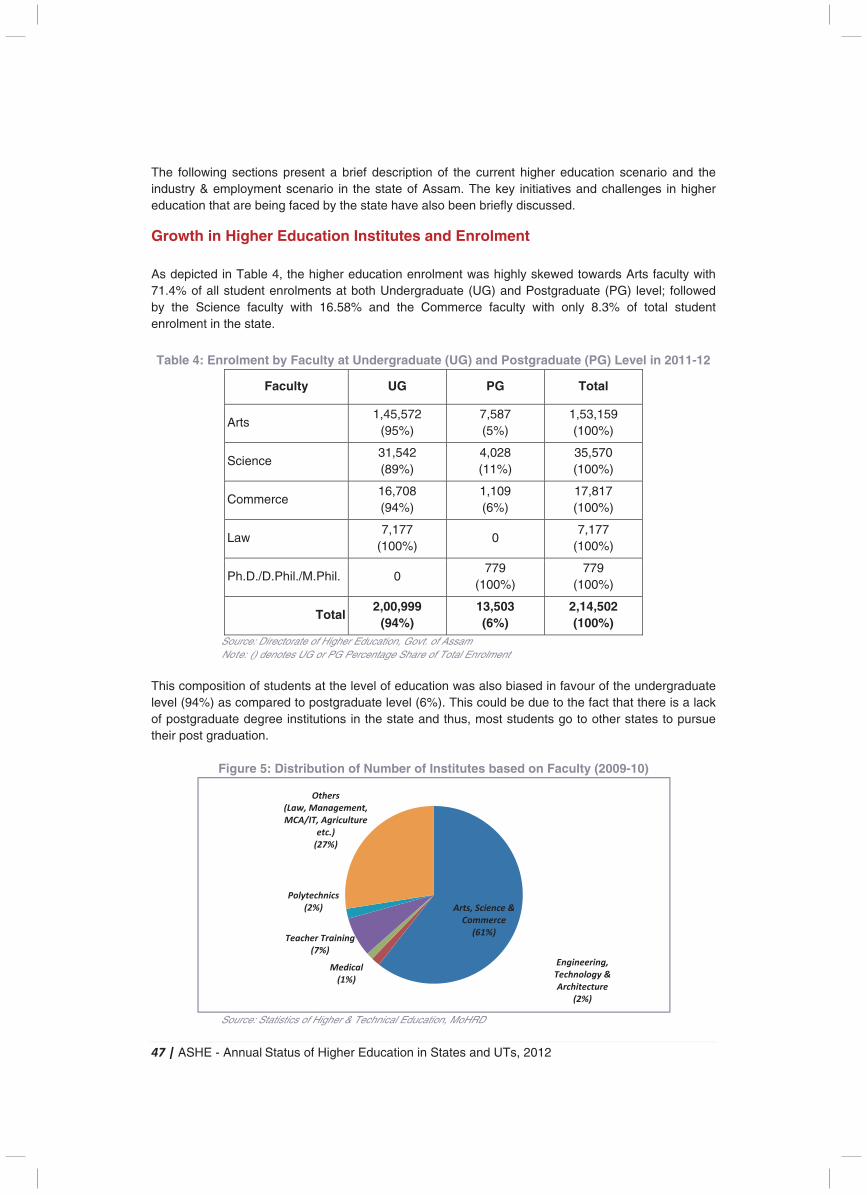
47 | ASHE - Annual Status of Higher Education in States and UTs, 2012
The following sections present a brief description of the current higher education scenario and the industry & employment scenario in the state of Assam. The key initiatives and challenges in higher education that are being faced by the state have also been briefly discussed.
Growth in Higher Education Institutes and Enrolment As depicted in Table 4, the higher education enrolment was highly skewed towards Arts faculty with 71.4% of all student enrolments at both Undergraduate (UG) and Postgraduate (PG) level; followed by the Science faculty with 16.58% and the Commerce faculty with only 8.3% of total student enrolment in the state.
Table 4: Enrolment by Faculty at Undergraduate (UG) and Postgraduate (PG) Level in 2011-12
Faculty UG PG Total
Arts 1,45,572
(95%) 7,587 (5%)
1,53,159 (100%)
Science 31,542 (89%)
4,028 (11%)
35,570 (100%)
Commerce 16,708 (94%)
1,109 (6%)
17,817 (100%)
Law 7,177
(100%) 0
7,177 (100%)
Ph.D./D.Phil./M.Phil. 0 779
(100%) 779
(100%)
Total 2,00,999
(94%) 13,503 (6%)
2,14,502 (100%)
Source: Directorate of Higher Education, Govt. of Assam Note: () denotes UG or PG Percentage Share of Total Enrolment
This composition of students at the level of education was also biased in favour of the undergraduate level (94%) as compared to postgraduate level (6%). This could be due to the fact that there is a lack of postgraduate degree institutions in the state and thus, most students go to other states to pursue their post graduation.
Figure 5: Distribution of Number of Institutes based on Faculty (2009-10)
Source: Statistics of Higher & Technical Education, MoHRD
Arts, Science &
Commerce
(61%)
Engineering,
Technology &
Architecture
(2%)
Medical
(1%)
Teacher Training
(7%)
Polytechnics
(2%)
Others
(Law, Management,
MCA/IT, Agriculture
etc.)
(27%)
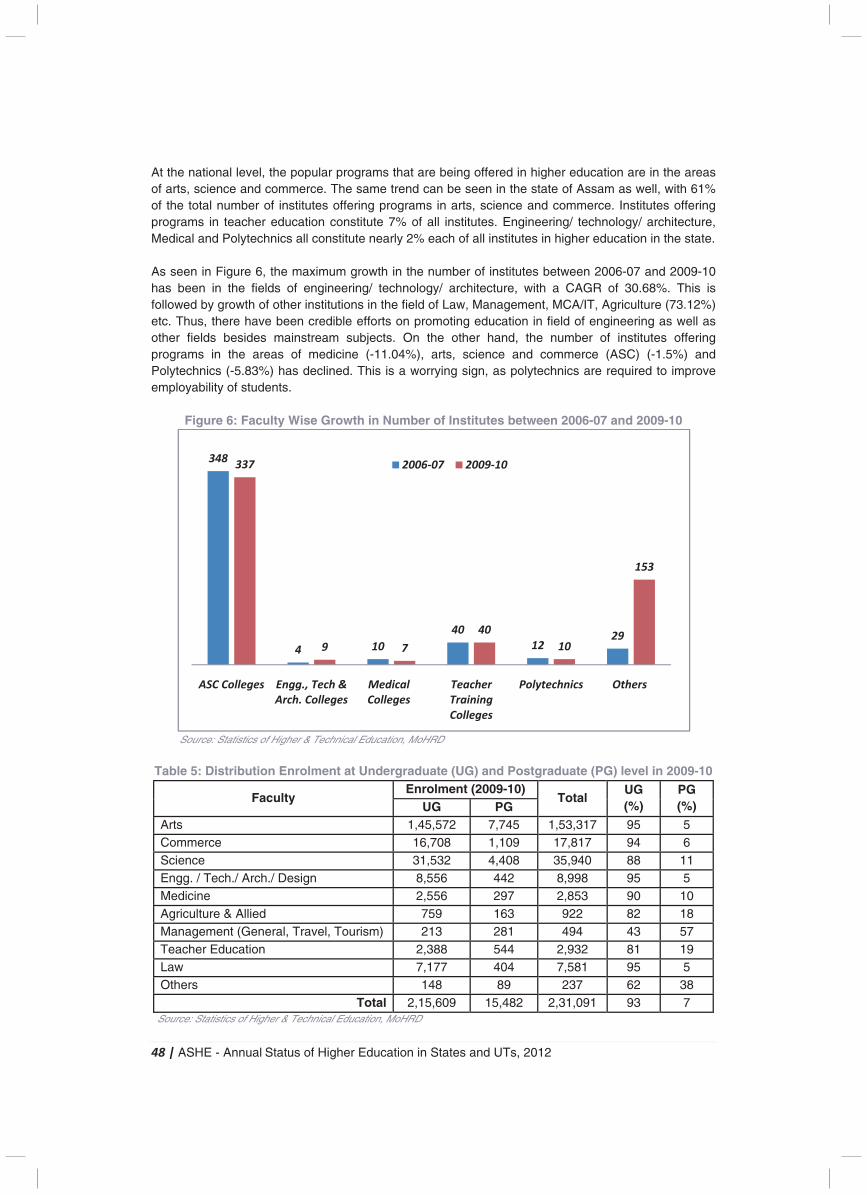
48 | ASHE - Annual Status of Higher Education in States and UTs, 2012
At the national level, the popular programs that are being offered in higher education are in the areas of arts, science and commerce. The same trend can be seen in the state of Assam as well, with 61% of the total number of institutes offering programs in arts, science and commerce. Institutes offering programs in teacher education constitute 7% of all institutes. Engineering/ technology/ architecture, Medical and Polytechnics all constitute nearly 2% each of all institutes in higher education in the state. As seen in Figure 6, the maximum growth in the number of institutes between 2006-07 and 2009-10 has been in the fields of engineering/ technology/ architecture, with a CAGR of 30.68%. This is followed by growth of other institutions in the field of Law, Management, MCA/IT, Agriculture (73.12%) etc. Thus, there have been credible efforts on promoting education in field of engineering as well as other fields besides mainstream subjects. On the other hand, the number of institutes offering programs in the areas of medicine (-11.04%), arts, science and commerce (ASC) (-1.5%) and Polytechnics (-5.83%) has declined. This is a worrying sign, as polytechnics are required to improve employability of students.
Figure 6: Faculty Wise Growth in Number of Institutes between 2006-07 and 2009-10
Source: Statistics of Higher & Technical Education, MoHRD
Table 5: Distribution Enrolment at Undergraduate (UG) and Postgraduate (PG) level in 2009-10
Faculty Enrolment (2009-10)
Total UG (%)
PG (%) UG PG
Arts 1,45,572 7,745 1,53,317 95 5 Commerce 16,708 1,109 17,817 94 6 Science 31,532 4,408 35,940 88 11 Engg. / Tech./ Arch./ Design 8,556 442 8,998 95 5 Medicine 2,556 297 2,853 90 10 Agriculture & Allied 759 163 922 82 18 Management (General, Travel, Tourism) 213 281 494 43 57 Teacher Education 2,388 544 2,932 81 19 Law 7,177 404 7,581 95 5 Others 148 89 237 62 38
Total 2,15,609 15,482 2,31,091 93 7 Source: Statistics of Higher & Technical Education, MoHRD
(-1.05%)
(30.68%) (-11.04%) (0%) (-5.83%)
(73.12%)
348
4 10
40
1229
337
9 7
40
10
153
ASC Colleges Engg., Tech &
Arch. Colleges
Medical
Colleges
Teacher
Training
Colleges
Polytechnics Others
2006-07 2009-10
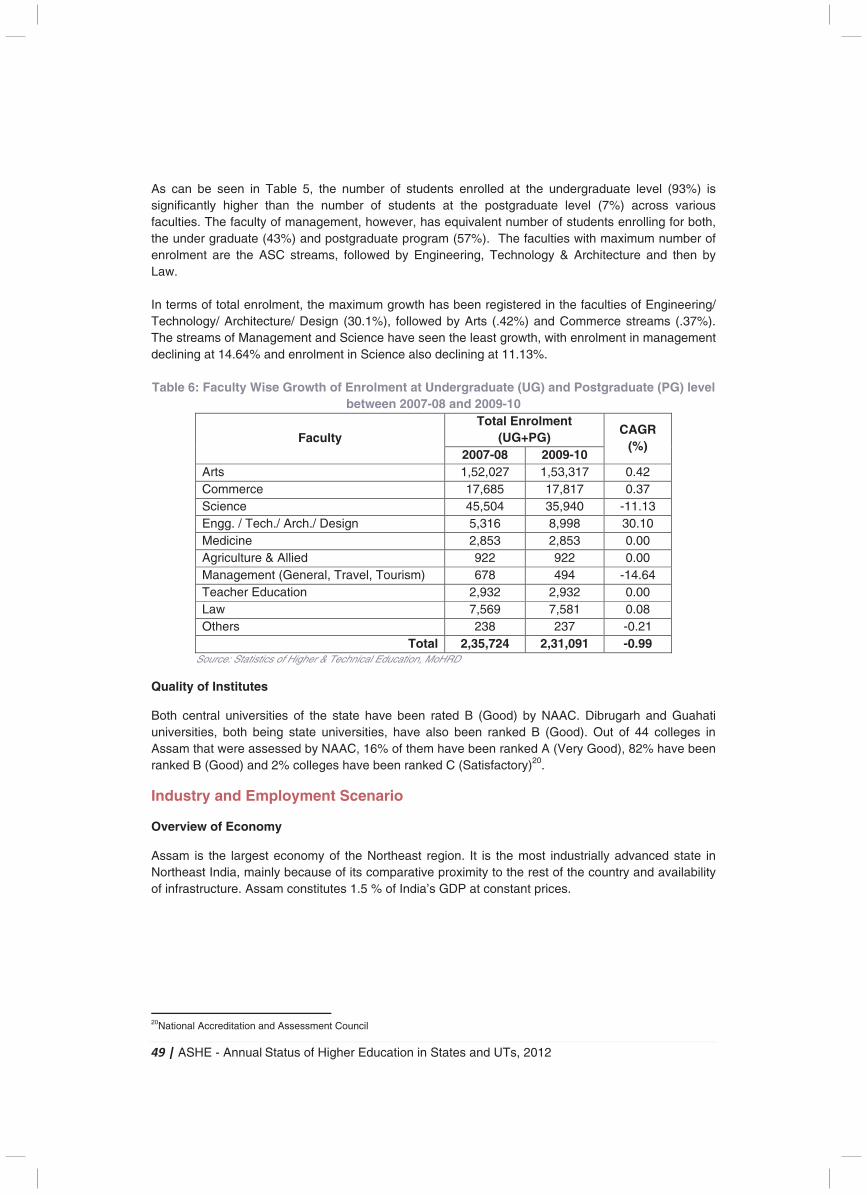
49 | ASHE - Annual Status of Higher Education in States and UTs, 2012
As can be seen in Table 5, the number of students enrolled at the undergraduate level (93%) is significantly higher than the number of students at the postgraduate level (7%) across various faculties. The faculty of management, however, has equivalent number of students enrolling for both, the under graduate (43%) and postgraduate program (57%). The faculties with maximum number of enrolment are the ASC streams, followed by Engineering, Technology & Architecture and then by Law. In terms of total enrolment, the maximum growth has been registered in the faculties of Engineering/ Technology/ Architecture/ Design (30.1%), followed by Arts (.42%) and Commerce streams (.37%). The streams of Management and Science have seen the least growth, with enrolment in management declining at 14.64% and enrolment in Science also declining at 11.13%. Table 6: Faculty Wise Growth of Enrolment at Undergraduate (UG) and Postgraduate (PG) level
between 2007-08 and 2009-10
Faculty Total Enrolment
(UG+PG) CAGR
(%) 2007-08 2009-10
Arts 1,52,027 1,53,317 0.42 Commerce 17,685 17,817 0.37 Science 45,504 35,940 -11.13 Engg. / Tech./ Arch./ Design 5,316 8,998 30.10 Medicine 2,853 2,853 0.00 Agriculture & Allied 922 922 0.00 Management (General, Travel, Tourism) 678 494 -14.64 Teacher Education 2,932 2,932 0.00 Law 7,569 7,581 0.08 Others 238 237 -0.21
Total 2,35,724 2,31,091 -0.99 Source: Statistics of Higher & Technical Education, MoHRD
Quality of Institutes
Both central universities of the state have been rated B (Good) by NAAC. Dibrugarh and Guahati universities, both being state universities, have also been ranked B (Good). Out of 44 colleges in Assam that were assessed by NAAC, 16% of them have been ranked A (Very Good), 82% have been ranked B (Good) and 2% colleges have been ranked C (Satisfactory)20.
Industry and Employment Scenario
Overview of Economy
Assam is the largest economy of the Northeast region. It is the most industrially advanced state in Northeast India, mainly because of its comparative proximity to the rest of the country and availability of infrastructure. Assam constitutes 1.5 % of India’s GDP at constant prices.
20National Accreditation and Assessment Council
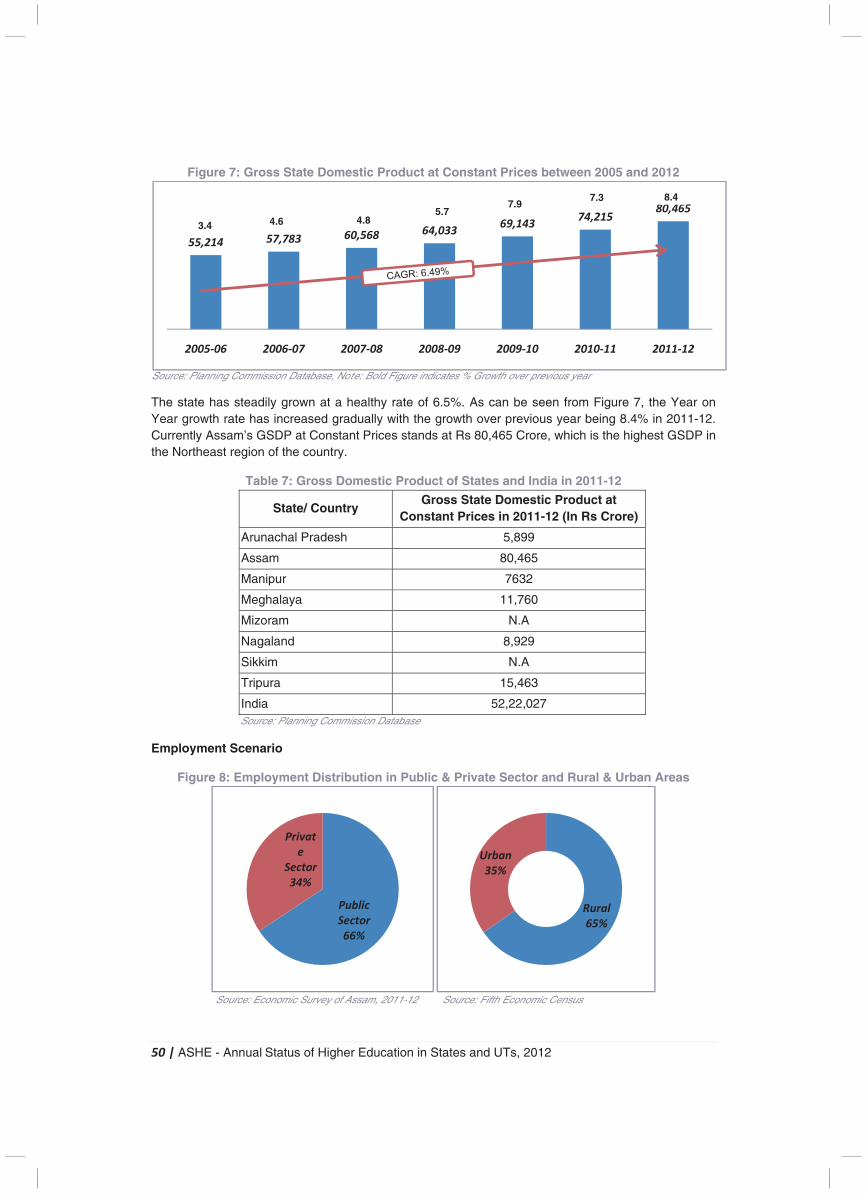
50 | ASHE - Annual Status of Higher Education in States and UTs, 2012
Figure 7: Gross State Domestic Product at Constant Prices between 2005 and 2012
Source: Planning Commission Database, Note: Bold Figure indicates % Growth over previous year
The state has steadily grown at a healthy rate of 6.5%. As can be seen from Figure 7, the Year on Year growth rate has increased gradually with the growth over previous year being 8.4% in 2011-12. Currently Assam’s GSDP at Constant Prices stands at Rs 80,465 Crore, which is the highest GSDP in the Northeast region of the country.
Table 7: Gross Domestic Product of States and India in 2011-12
State/ Country Gross State Domestic Product at
Constant Prices in 2011-12 (In Rs Crore)
Arunachal Pradesh 5,899
Assam 80,465
Manipur 7632
Meghalaya 11,760
Mizoram N.A
Nagaland 8,929
Sikkim N.A
Tripura 15,463
India 52,22,027 Source: Planning Commission Database
Employment Scenario
Figure 8: Employment Distribution in Public & Private Sector and Rural & Urban Areas
Source: Economic Survey of Assam, 2011-12 Source: Fifth Economic Census
55,214 57,783 60,568 64,03369,143
74,21580,465
2005-06 2006-07 2007-08 2008-09 2009-10 2010-11 2011-12
8.4
3.4 4.6 4.85.7
7.97.3
Public
Sector
66%
Privat
e
Sector
34%
Rural
65%
Urban
35%
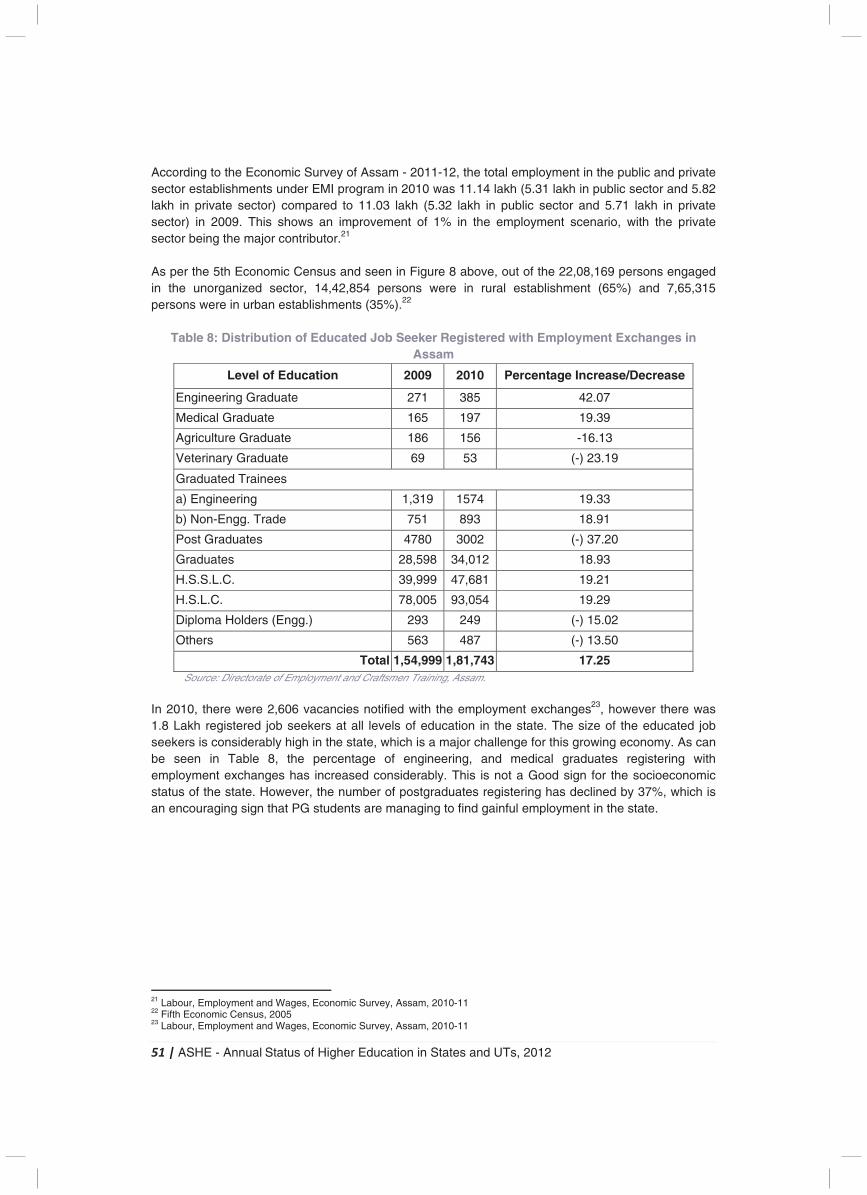
51 | ASHE - Annual Status of Higher Education in States and UTs, 2012
According to the Economic Survey of Assam - 2011-12, the total employment in the public and private sector establishments under EMI program in 2010 was 11.14 lakh (5.31 lakh in public sector and 5.82 lakh in private sector) compared to 11.03 lakh (5.32 lakh in public sector and 5.71 lakh in private sector) in 2009. This shows an improvement of 1% in the employment scenario, with the private sector being the major contributor.21 As per the 5th Economic Census and seen in Figure 8 above, out of the 22,08,169 persons engaged in the unorganized sector, 14,42,854 persons were in rural establishment (65%) and 7,65,315 persons were in urban establishments (35%).22
Table 8: Distribution of Educated Job Seeker Registered with Employment Exchanges in Assam
Level of Education 2009 2010 Percentage Increase/Decrease
Engineering Graduate 271 385 42.07
Medical Graduate 165 197 19.39
Agriculture Graduate 186 156 -16.13
Veterinary Graduate 69 53 (-) 23.19
Graduated Trainees
a) Engineering 1,319 1574 19.33
b) Non-Engg. Trade 751 893 18.91
Post Graduates 4780 3002 (-) 37.20
Graduates 28,598 34,012 18.93
H.S.S.L.C. 39,999 47,681 19.21
H.S.L.C. 78,005 93,054 19.29
Diploma Holders (Engg.) 293 249 (-) 15.02
Others 563 487 (-) 13.50
Total 1,54,999 1,81,743 17.25 Source: Directorate of Employment and Craftsmen Training, Assam.
In 2010, there were 2,606 vacancies notified with the employment exchanges23, however there was 1.8 Lakh registered job seekers at all levels of education in the state. The size of the educated job seekers is considerably high in the state, which is a major challenge for this growing economy. As can be seen in Table 8, the percentage of engineering, and medical graduates registering with employment exchanges has increased considerably. This is not a Good sign for the socioeconomic status of the state. However, the number of postgraduates registering has declined by 37%, which is an encouraging sign that PG students are managing to find gainful employment in the state.
21 Labour, Employment and Wages, Economic Survey, Assam, 2010-11 22 Fifth Economic Census, 2005 23 Labour, Employment and Wages, Economic Survey, Assam, 2010-11
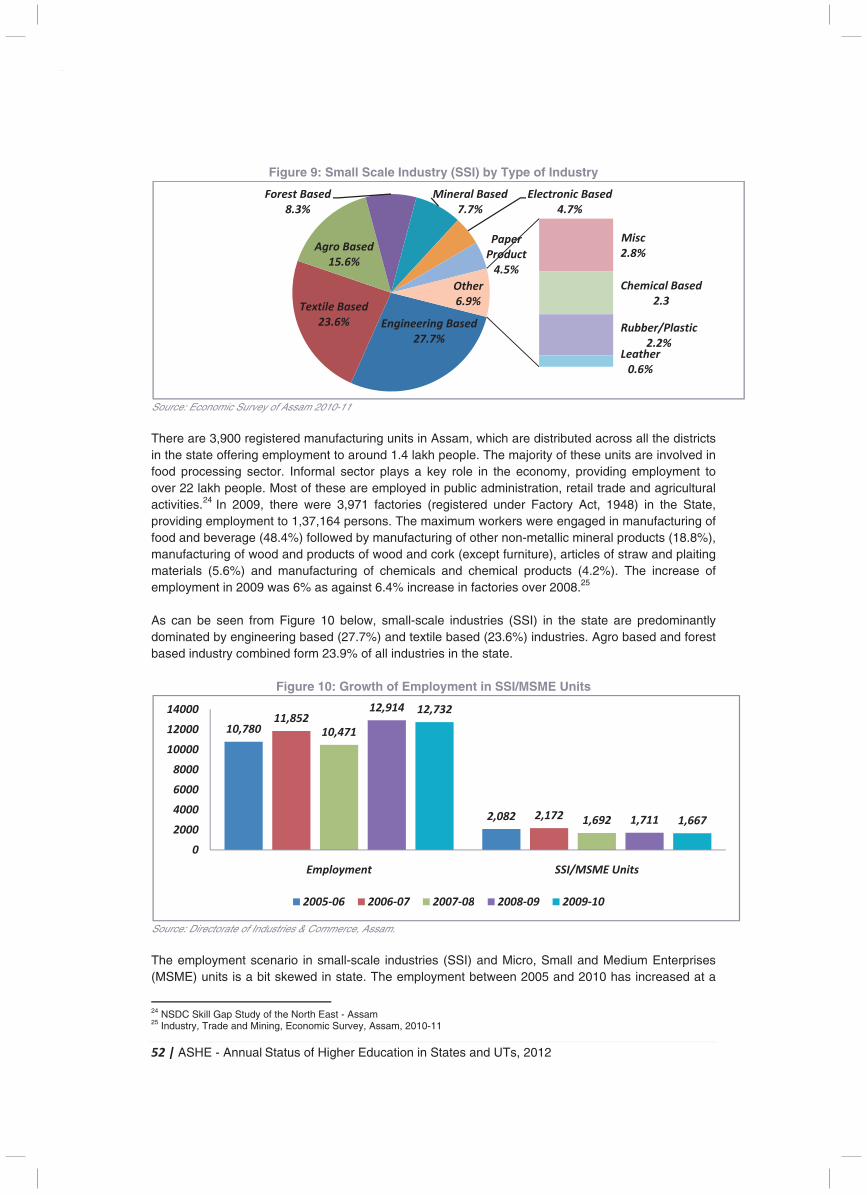
52 | ASHE - Annual Status of Higher Education in States and UTs, 2012
Figure 9: Small Scale Industry (SSI) by Type of Industry
Source: Economic Survey of Assam 2010-11 There are 3,900 registered manufacturing units in Assam, which are distributed across all the districts in the state offering employment to around 1.4 lakh people. The majority of these units are involved in food processing sector. Informal sector plays a key role in the economy, providing employment to over 22 lakh people. Most of these are employed in public administration, retail trade and agricultural activities.24 In 2009, there were 3,971 factories (registered under Factory Act, 1948) in the State, providing employment to 1,37,164 persons. The maximum workers were engaged in manufacturing of food and beverage (48.4%) followed by manufacturing of other non-metallic mineral products (18.8%), manufacturing of wood and products of wood and cork (except furniture), articles of straw and plaiting materials (5.6%) and manufacturing of chemicals and chemical products (4.2%). The increase of employment in 2009 was 6% as against 6.4% increase in factories over 2008.25 As can be seen from Figure 10 below, small-scale industries (SSI) in the state are predominantly dominated by engineering based (27.7%) and textile based (23.6%) industries. Agro based and forest based industry combined form 23.9% of all industries in the state.
Figure 10: Growth of Employment in SSI/MSME Units
Source: Directorate of Industries & Commerce, Assam. The employment scenario in small-scale industries (SSI) and Micro, Small and Medium Enterprises (MSME) units is a bit skewed in state. The employment between 2005 and 2010 has increased at a
24 NSDC Skill Gap Study of the North East - Assam 25 Industry, Trade and Mining, Economic Survey, Assam, 2010-11
CAGR
4.25%
CAGR -5.41%
Engineering Based
27.7%
Textile Based
23.6%
Agro Based
15.6%
Forest Based
8.3%
Mineral Based
7.7%
Electronic Based
4.7%
Paper
Product
4.5%
Misc
2.8%
Chemical Based
2.3
Rubber/Plastic
2.2%Leather
0.6%
Other
6.9%
10,780
2,082
11,852
2,172
10,471
1,692
12,914
1,711
12,732
1,667
0
2000
4000
6000
8000
10000
12000
14000
Employment SSI/MSME Units
2005-06 2006-07 2007-08 2008-09 2009-10
53 | ASHE - Annual Status of Higher Education in States and UTs, 2012
rate of 4.25% but the number of SSI/MSME units has declined at a rate of 5.41% in the same time period. Such an inverted relationship between employment figures and the number of industry units can only be signified by the fact that the average number of employment per unit has increased from 5.2 in 2005-06 to 7.6 in 2009-10, an increase of nearly 50%. There were 34,327 SSI/MSME units in Assam and they provided employment to 1,78,054 persons at the end of 2010-11.26 Key industries27 Assam is rich in natural resources such as natural oil and gas, rubber, tea, and minerals such as granite, limestone and kaolin. Assam tea is a well-recognized product all over the world. Some of the industries and the respective key players are described in the following section:
1. Tea � Tea occupies an important place among all the agriculture-based industries in the state.
About 17%of the workers of Assam are engaged in the tea industry. � Assam produces around 55% of the tea produced in India and about one-sixth of the tea
produced in the world. � Key players in this sector are Assam Tea Corporation Limited, Assam Company India
Limited, Tata Tea Limited, Williamson Magor Group, Apeejay Tea Limited and Mcleod Russel India Limited
2. Energy: Coal, Oil and Gas
� Assam accounts for about 15% of India's crude output. The wells at Digboi, Duliajan, Sivasagar, etc., produce natural gas, which accounts for about 50% of India's total onshore-production.
� Coal occurs mainly in upper Assam districts, the proved reserve of coal in this belt is about 340 million tones.
� Key players are Bongaigaon Refineries and Petrochemicals Limited, Indian Oil Corporation Limited, Oil and Natural Gas Corporation Limited, Oil India Limited, Assam Gas Company Limited.
3. Limestone and Cement
� Limestone is an important mineral, which is used in the manufacturing of cement. Several cement factories have come up in Assam because of availability of high quality limestone in the region.
� Key players are Cement Corporation of India Ltd., Barak Valley Cements Ltd and RCL Cement Private Ltd.
4. Agriculture and Horticulture
� Agriculture accounts for over a third of Assam’s income and employs 69% of workforce. Agriculture and allied activities contribute around 40% to the state's GDP.
� The agro-climatic conditions support cultivation of a wide range of horticultural crops including plantation crops and various fruits and vegetables, flowers, spices, medicinal and aromatic plants, nut crops and tuber crops.
5. Tourism
� According to the Ministry of Tourism, 3.9 million tourists visited Assam during 2009 – the highest among the north-eastern states.
� Assam is a tourist destination for nature lovers, wildlife enthusiasts, leisure tourists, ornithologists and photographers from all over the world.
26Economic Survey of Assam 2010-11 27 India Brand Equity Foundation- Assam, State Report
54 | ASHE - Annual Status of Higher Education in States and UTs, 2012
6. Traditional cottage industry
� Assam is traditionally famous for its cottage industry, especially, spinning, weaving and sericulture. Bell-metal work is another traditional cottage industry of the state. Brass-work is also an important traditional handicraft.
7. Sericulture
� The climate and general environment of the state is well suited for sericulture. Traditional varieties of silk cultured include eri, muga and mulberry. The muga silk, known for its fine sheen and golden colour, is used by the local silk-weaving industry and has contributed to the development of the muga in the state.
� Assam produces about 10% of total natural silks of India. The state contributes 99%and 65% respectively, to the total muga and eri raw silk production in the country.
Current Initiatives and Key Challenges in Higher Education
Current Challenges
Some of the challenges that plague the state of higher and technical education in Assam are:
� The current Gross Enrolment Ratio stands at 7.04%, which is much lower than the national average of 13.58%.
� Due to poor quality of education, many students go out of the state to pursue higher education, that they finance themselves.
� The state does not have enough quality infrastructures with regard to hostels and classrooms. � There is a need to improve quality of education and make provisions for additional capacity in
existing Colleges so as to prevent students from seeking higher education in other states. Provisions need to be undertaken to expand existing institutions for accelerating GER.
� New scheme of higher education, like diploma courses in Engineering Colleges, are needed. � Need for better management of finances for higher education for overall coordinated
development � To maintain a state database of higher education and asses the ‘push factors’ that could help in
policy development. � Higher and technical education departments should provide the latest market driven and job
oriented courses so as to strike a balance between traditional and new subjects. Initiatives Undertaken
� To stop the brain drain of students in the state, existing Universities have been directed to commence at least 2 new job oriented and vocational courses in each of the government colleges.
� Digital classroom and digital libraries have been setup in most of the government institutes. � Introduction of Science and Commerce stream in all the existing provincilised colleges so as to
encourage students to take up such streams. � To act as a nodal agency for standardization of education, a ‘Higher Education Mission’ has
been established, which will look into the bottlenecks of Higher Education in the state and prescribe corrective measures for the same.
55 | ASHE - Annual Status of Higher Education in States and UTs, 2012
Initiatives Proposed28
Assam at present has 2 State engineering colleges along with another 2 Engineering Colleges under Society Act, 9 Polytechnics and 2 Junior Technical School under the Directorate of Technical Education. In comparison to all India the ratio of degree level and Diploma level institutions are very less in the State. To boost technical education in the state, Assam government has decided to establish a Women University, 1 University of Science and Technology, 3 new Engineering colleges and 3 polytechnics in the state. The state government has also proposed to upgrade some branches of the existing two Polytechnics to Degree level and upgrade the two Junior Technical Schools to Diploma level institution during the Eleventh Five Year Plan.
The main objectives of the 11th Five Year Plan were as follows:
� Consolidation and qualitative improvement program. � Infrastructural development. � Improvement of overall institutional efficiency. � Diversification of courses. � Completion of Tezpur Polytechnic. � Release of existing and due liabilities to Dibrugarh University. � To establish three new State Engineering College. � Establishment of a University of Science and Technology.
28Assam Economic Review 2010-11

5
S
56 |
Sta
| AS
ate
SHE
e F
E -
Fo
An
oc
nnu
us
al S
s:
C
T
T
S
S(
Stat
Bi
Ca
Tot
Tot
Po
Nu
Lite
Sex
Sta(In
Per
tus
iha
pita
tal
tal
pul
mb
era
x R
ate Rs
r ca
of
ar
al
Are
Po
lati
ber
acy
Rati
Dos. C
api
Hig
r
ea
opu
ion
of
Ra
io (
omeCror
ta i
ghe
(in
lati
De
Dis
ate
(per
estre)
inc
er E
sq
ion
ens
stri
(%
r 1,
ic P
com
Edu
q. k
n
sity
icts
%)
,00
Pro
me,
cat
m.)
y (p
s
0 m
odu
20
tion
Sta
)
per
male
uct,
09-
n in
ate
sq.
es)
20
-10
Sta
Pr
. km
)
010
(R
ates
ofi
m.)
-11
s.)
s a
le
nd
UT
Ts, 2
10
201
P
99
0,38
1
6
1,9
20
12
Patn
9,2
8,0
,10
38
63.8
916
95,0
0,0
na
00
4,6
02
8
82
6
050
69
637
0
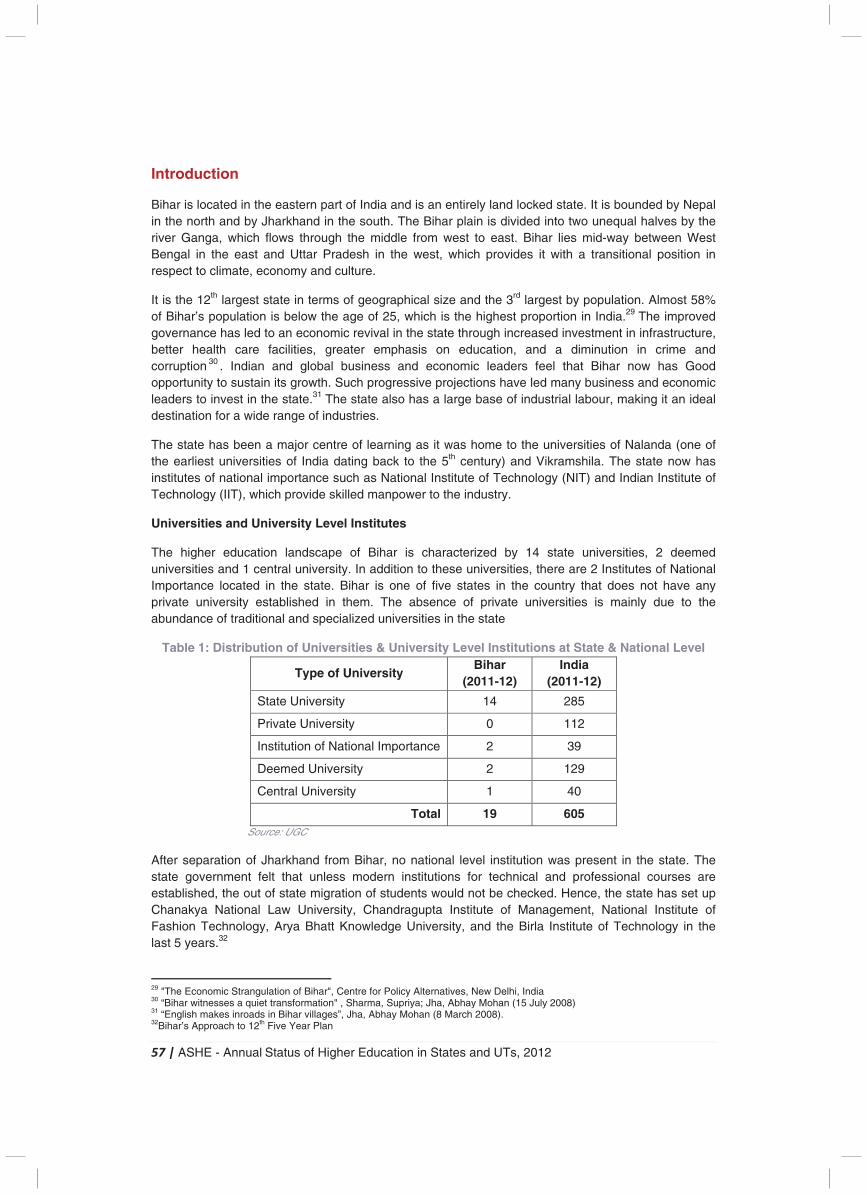
57 | ASHE - Annual Status of Higher Education in States and UTs, 2012
Introduction
Bihar is located in the eastern part of India and is an entirely land locked state. It is bounded by Nepal in the north and by Jharkhand in the south. The Bihar plain is divided into two unequal halves by the river Ganga, which flows through the middle from west to east. Bihar lies mid-way between West Bengal in the east and Uttar Pradesh in the west, which provides it with a transitional position in respect to climate, economy and culture.
It is the 12th largest state in terms of geographical size and the 3rd largest by population. Almost 58% of Bihar’s population is below the age of 25, which is the highest proportion in India.29 The improved governance has led to an economic revival in the state through increased investment in infrastructure, better health care facilities, greater emphasis on education, and a diminution in crime and corruption 30 . Indian and global business and economic leaders feel that Bihar now has Good opportunity to sustain its growth. Such progressive projections have led many business and economic leaders to invest in the state.31 The state also has a large base of industrial labour, making it an ideal destination for a wide range of industries.
The state has been a major centre of learning as it was home to the universities of Nalanda (one of the earliest universities of India dating back to the 5th century) and Vikramshila. The state now has institutes of national importance such as National Institute of Technology (NIT) and Indian Institute of Technology (IIT), which provide skilled manpower to the industry.
Universities and University Level Institutes
The higher education landscape of Bihar is characterized by 14 state universities, 2 deemed universities and 1 central university. In addition to these universities, there are 2 Institutes of National Importance located in the state. Bihar is one of five states in the country that does not have any private university established in them. The absence of private universities is mainly due to the abundance of traditional and specialized universities in the state
Table 1: Distribution of Universities & University Level Institutions at State & National Level
Type of University Bihar
(2011-12) India
(2011-12)
State University 14 285
Private University 0 112
Institution of National Importance 2 39
Deemed University 2 129
Central University 1 40
Total 19 605 Source: UGC
After separation of Jharkhand from Bihar, no national level institution was present in the state. The state government felt that unless modern institutions for technical and professional courses are established, the out of state migration of students would not be checked. Hence, the state has set up Chanakya National Law University, Chandragupta Institute of Management, National Institute of Fashion Technology, Arya Bhatt Knowledge University, and the Birla Institute of Technology in the last 5 years.32
29 "The Economic Strangulation of Bihar", Centre for Policy Alternatives, New Delhi, India 30 “Bihar witnesses a quiet transformation" , Sharma, Supriya; Jha, Abhay Mohan (15 July 2008) 31 “English makes inroads in Bihar villages”, Jha, Abhay Mohan (8 March 2008). 32Bihar’s Approach to 12th Five Year Plan
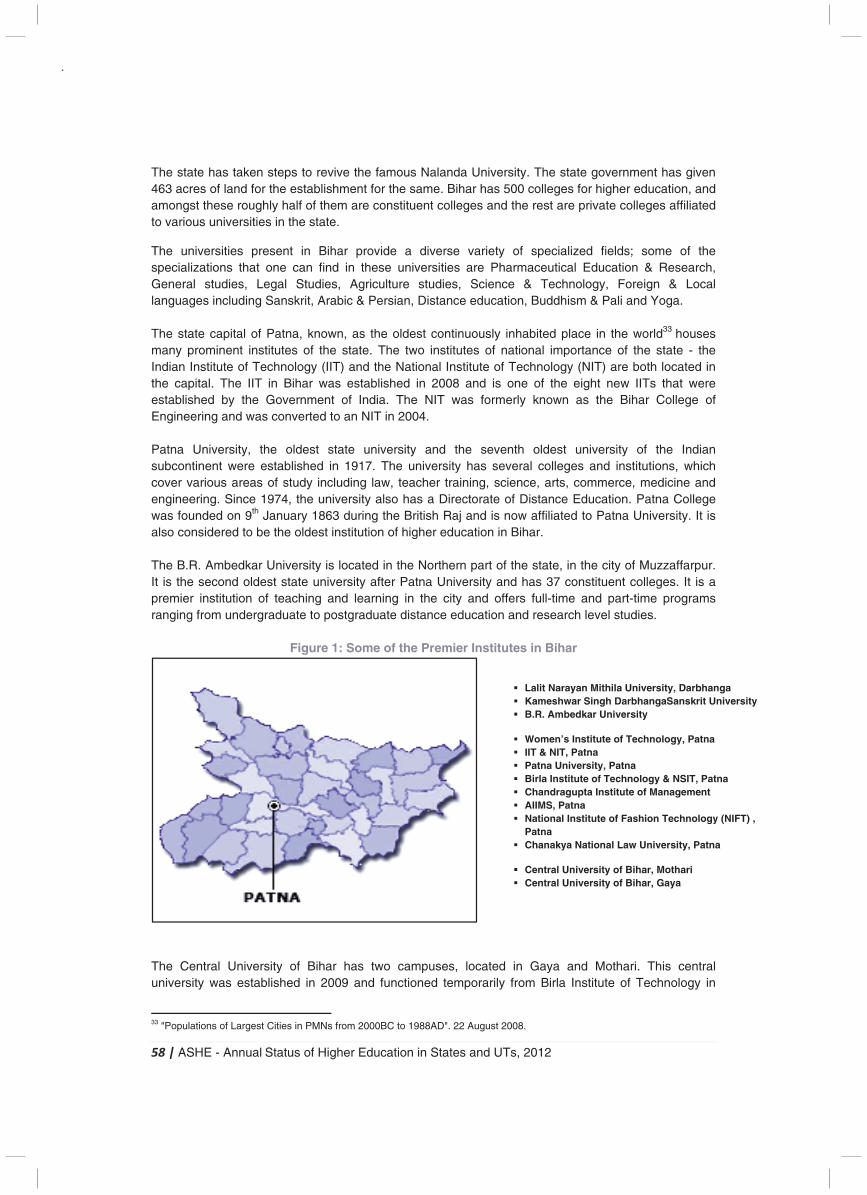
58 | ASHE - Annual Status of Higher Education in States and UTs, 2012
The state has taken steps to revive the famous Nalanda University. The state government has given 463 acres of land for the establishment for the same. Bihar has 500 colleges for higher education, and amongst these roughly half of them are constituent colleges and the rest are private colleges affiliated to various universities in the state.
The universities present in Bihar provide a diverse variety of specialized fields; some of the specializations that one can find in these universities are Pharmaceutical Education & Research, General studies, Legal Studies, Agriculture studies, Science & Technology, Foreign & Local languages including Sanskrit, Arabic & Persian, Distance education, Buddhism & Pali and Yoga. The state capital of Patna, known, as the oldest continuously inhabited place in the world33 houses many prominent institutes of the state. The two institutes of national importance of the state - the Indian Institute of Technology (IIT) and the National Institute of Technology (NIT) are both located in the capital. The IIT in Bihar was established in 2008 and is one of the eight new IITs that were established by the Government of India. The NIT was formerly known as the Bihar College of Engineering and was converted to an NIT in 2004. Patna University, the oldest state university and the seventh oldest university of the Indian subcontinent were established in 1917. The university has several colleges and institutions, which cover various areas of study including law, teacher training, science, arts, commerce, medicine and engineering. Since 1974, the university also has a Directorate of Distance Education. Patna College was founded on 9th January 1863 during the British Raj and is now affiliated to Patna University. It is also considered to be the oldest institution of higher education in Bihar. The B.R. Ambedkar University is located in the Northern part of the state, in the city of Muzzaffarpur. It is the second oldest state university after Patna University and has 37 constituent colleges. It is a premier institution of teaching and learning in the city and offers full-time and part-time programs ranging from undergraduate to postgraduate distance education and research level studies.
Figure 1: Some of the Premier Institutes in Bihar
The Central University of Bihar has two campuses, located in Gaya and Mothari. This central university was established in 2009 and functioned temporarily from Birla Institute of Technology in
33 "Populations of Largest Cities in PMNs from 2000BC to 1988AD". 22 August 2008.
� Lalit Narayan Mithila University, Darbhanga � Kameshwar Singh DarbhangaSanskrit University � B.R. Ambedkar University
� Women’s Institute of Technology, Patna � IIT & NIT, Patna � Patna University, Patna � Birla Institute of Technology & NSIT, Patna � Chandragupta Institute of Management � AIIMS, Patna � National Institute of Fashion Technology (NIFT) ,
Patna � Chanakya National Law University, Patna
� Central University of Bihar, Mothari � Central University of Bihar, Gaya
59 | ASHE - Annual Status of Higher Education in States and UTs, 2012
Patna. However, after 3 years it finally established its own campus at Gaya. The university offers only postgraduate studies in various fields. Prominent engineering institutes in Bihar, besides IIT & NIT, are the Birla Institute of Technology (BIT) in Patna, Muzzaffarpur Institute of Technology (MIT) at Muzzaffarpur, Netaji Subhas Institute of Technology (NSIT) at Patna and Women’s Institute of Technology at Darbangha. Some of the well known medical institutes in the state are Jai Prakash Narayan, All India Institute of Medical Sciences (AIIMS), Patna, Indira Gandhi Institute of Medical Sciences, Patna and Patna Medical College & Hospital. Chandragupta Institute of Management, Patna is one of the leading management schools in the state and was established on the lines of the IIMs. The Chanakya National Law University (CNLU) is an autonomous law schools in India located in Patna. It was established in 2006 by the Government of Bihar as a public university dedicated to the field of legal education. Key Higher Education Indicators: Institutes & Enrolment
The higher education sector in Bihar comprises college and university education, both for general and technical streams. The apex institutions for higher education are the universities in the state. Presently, 15 universities are functional in the state, out of which 13 are traditional universities of which one is a central university and two of them are open universities. There are 817 colleges, which are distributed amongst 13 traditional universities. Out of these colleges, 451 are government colleges and they constitute to more than half of the total number of colleges. Apart from the government colleges, there are 97 local body colleges and 267 colleges of other types. Providing professional training to the prospective school teachers is another component of the higher education system in Bihar. Presently, there are 33 teacher training centres in Bihar. Out of these 33 institutions, 10 were established in 2010, in response to substantial expansion of elementary and secondary education in Bihar. Compared to the number of institutions for general education, the number of institutions for technical education is rather limited in Bihar as there are only 10 colleges for engineering education. Out of these 10 colleges, 2 were established in 2009, widening the opportunity for engineering and technical education in Bihar. All the institutions of higher education mentioned above are managed and financed by the state government. However, these government institutions of education are not enough to meet the entire demand for higher education programs. Consequently, a number of private institutions have come up in recent years in Bihar, offering generally technical and vocational education. There were only 63 such private institutions in 2001, but their number to 164 in 2008 and further to 251 in 2010. According to the Economic Survey of Bihar in 2010-11, there were 15 research institutes covering various disciplines.34 The growth rate in the number of higher education institutes in Bihar stands at a very low rate of 0.67% in comparison to the national Compounded Annual Growth Rate (CAGR) of 7%, which indicates a below average performance in ensuring access to higher education. Bihar is way behind in terms of the number of higher education institutions per million of population. In particular, the availability of engineering colleges, medical colleges, polytechnic colleges and teacher training colleges is very low.
34Economic Survey of Bihar, 2010-11
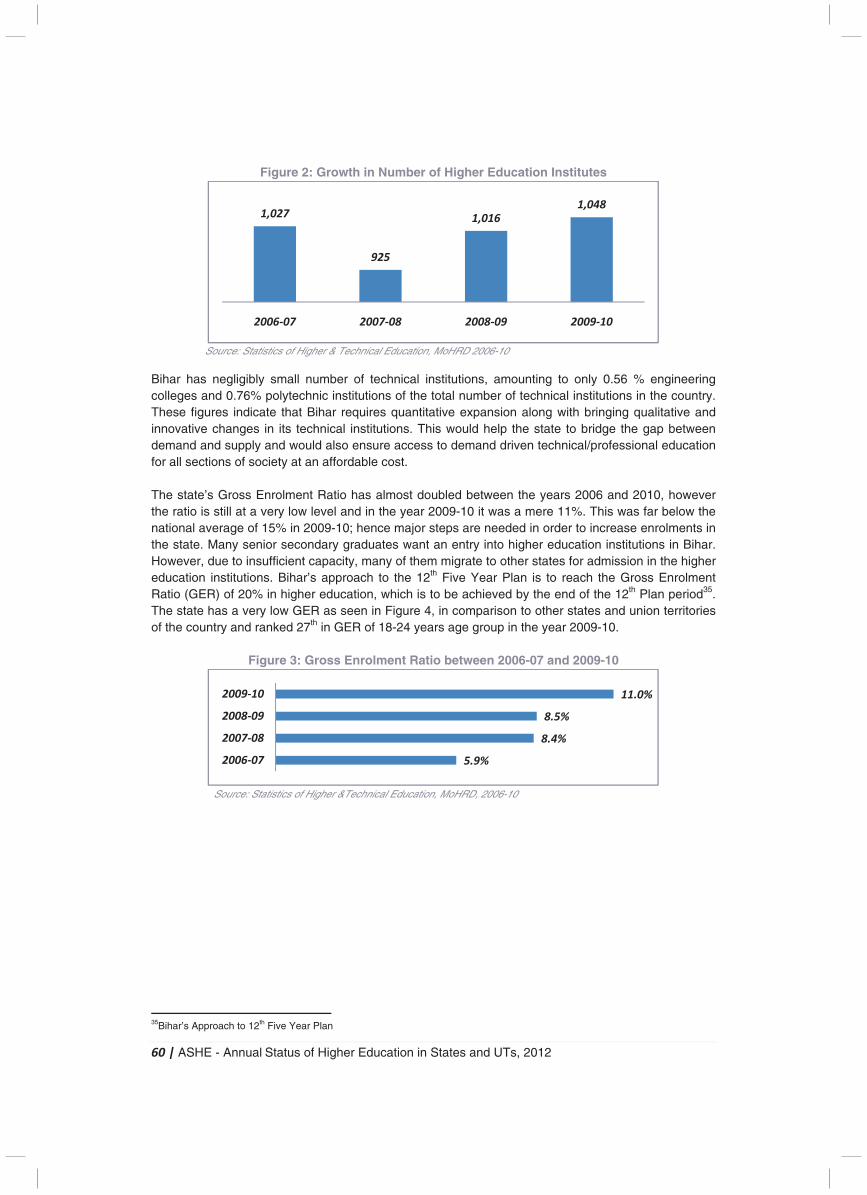
60 | ASHE - Annual Status of Higher Education in States and UTs, 2012
Figure 2: Growth in Number of Higher Education Institutes
Source: Statistics of Higher & Technical Education, MoHRD 2006-10
Bihar has negligibly small number of technical institutions, amounting to only 0.56 % engineering colleges and 0.76% polytechnic institutions of the total number of technical institutions in the country. These figures indicate that Bihar requires quantitative expansion along with bringing qualitative and innovative changes in its technical institutions. This would help the state to bridge the gap between demand and supply and would also ensure access to demand driven technical/professional education for all sections of society at an affordable cost. The state’s Gross Enrolment Ratio has almost doubled between the years 2006 and 2010, however the ratio is still at a very low level and in the year 2009-10 it was a mere 11%. This was far below the national average of 15% in 2009-10; hence major steps are needed in order to increase enrolments in the state. Many senior secondary graduates want an entry into higher education institutions in Bihar. However, due to insufficient capacity, many of them migrate to other states for admission in the higher education institutions. Bihar’s approach to the 12th Five Year Plan is to reach the Gross Enrolment Ratio (GER) of 20% in higher education, which is to be achieved by the end of the 12th Plan period35. The state has a very low GER as seen in Figure 4, in comparison to other states and union territories of the country and ranked 27th in GER of 18-24 years age group in the year 2009-10.
Figure 3: Gross Enrolment Ratio between 2006-07 and 2009-10
Source: Statistics of Higher &Technical Education, MoHRD, 2006-10
35Bihar’s Approach to 12th Five Year Plan
1,027
925
1,0161,048
2006-07 2007-08 2008-09 2009-10
5.9%
8.4%
8.5%
11.0%
2006-07
2007-08
2008-09
2009-10
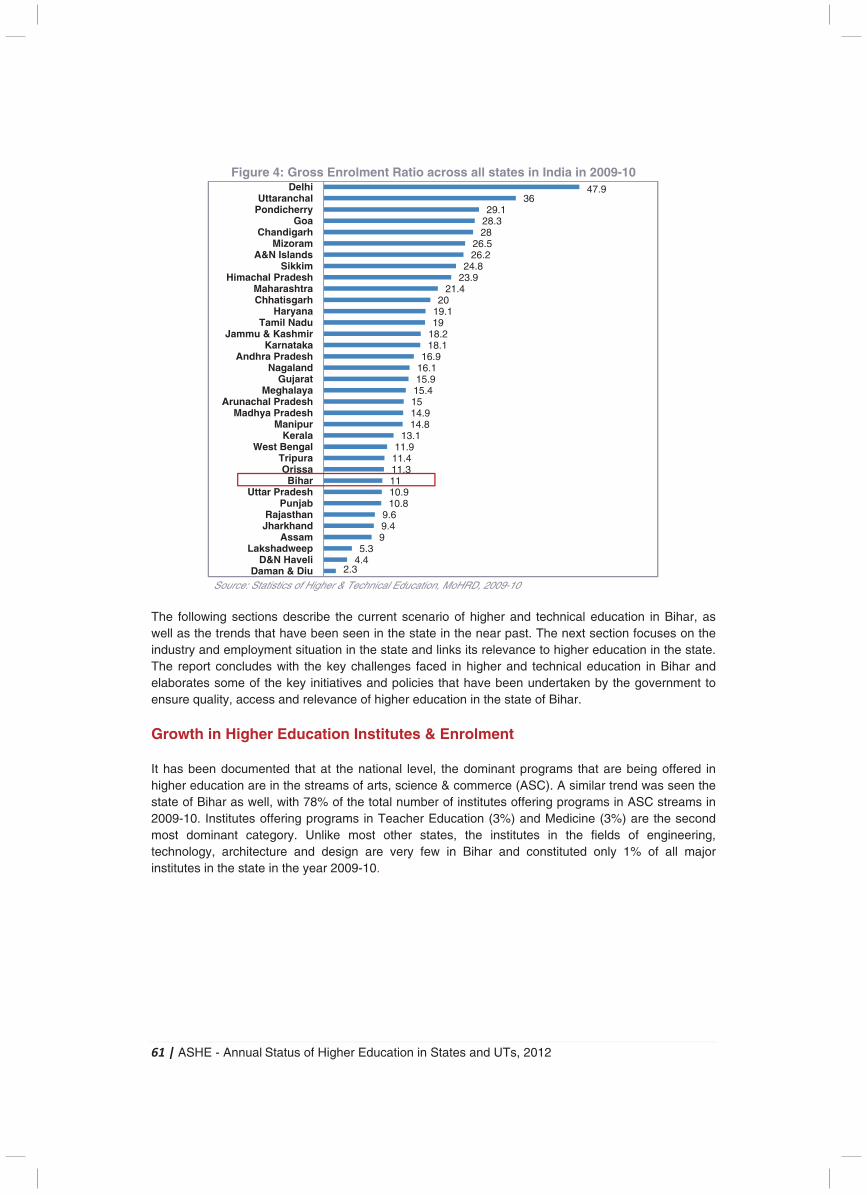
61 | ASHE - Annual Status of Higher Education in States and UTs, 2012
Figure 4: Gross Enrolment Ratio across all states in India in 2009-10
Source: Statistics of Higher & Technical Education, MoHRD, 2009-10
The following sections describe the current scenario of higher and technical education in Bihar, as well as the trends that have been seen in the state in the near past. The next section focuses on the industry and employment situation in the state and links its relevance to higher education in the state. The report concludes with the key challenges faced in higher and technical education in Bihar and elaborates some of the key initiatives and policies that have been undertaken by the government to ensure quality, access and relevance of higher education in the state of Bihar.
Growth in Higher Education Institutes & Enrolment It has been documented that at the national level, the dominant programs that are being offered in higher education are in the streams of arts, science & commerce (ASC). A similar trend was seen the state of Bihar as well, with 78% of the total number of institutes offering programs in ASC streams in 2009-10. Institutes offering programs in Teacher Education (3%) and Medicine (3%) are the second most dominant category. Unlike most other states, the institutes in the fields of engineering, technology, architecture and design are very few in Bihar and constituted only 1% of all major institutes in the state in the year 2009-10.
2.34.45.3
99.49.6
10.810.91111.311.411.9
13.114.814.91515.415.916.116.9
18.118.21919.120
21.423.924.8
26.226.5
2828.329.1
3647.9
Daman & DiuD&N Haveli
LakshadweepAssam
JharkhandRajasthan
PunjabUttar Pradesh
BiharOrissa
TripuraWest Bengal
KeralaManipur
Madhya PradeshArunachal Pradesh
MeghalayaGujarat
NagalandAndhra Pradesh
KarnatakaJammu & Kashmir
Tamil NaduHaryana
ChhatisgarhMaharashtra
Himachal PradeshSikkim
A&N IslandsMizoram
ChandigarhGoa
PondicherryUttaranchal
Delhi
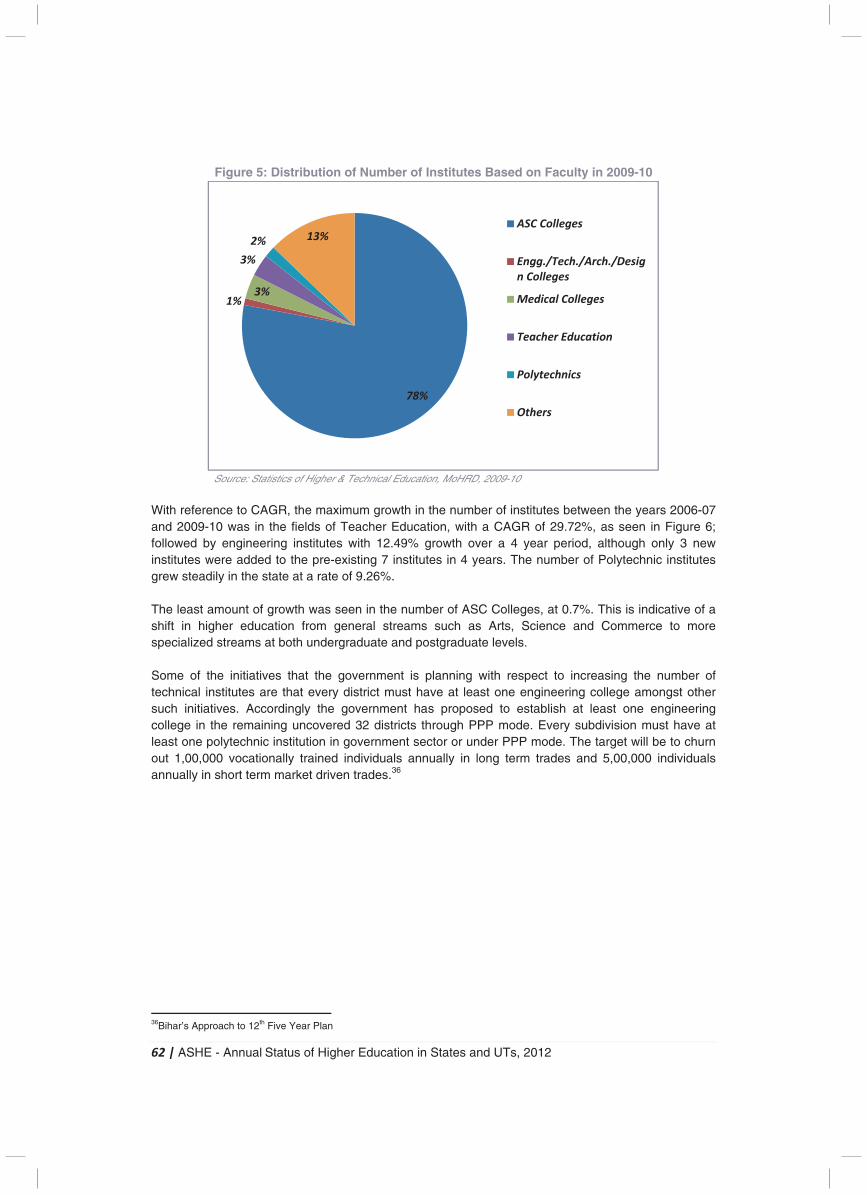
62 | ASHE - Annual Status of Higher Education in States and UTs, 2012
Figure 5: Distribution of Number of Institutes Based on Faculty in 2009-10
Source: Statistics of Higher & Technical Education, MoHRD, 2009-10
With reference to CAGR, the maximum growth in the number of institutes between the years 2006-07 and 2009-10 was in the fields of Teacher Education, with a CAGR of 29.72%, as seen in Figure 6; followed by engineering institutes with 12.49% growth over a 4 year period, although only 3 new institutes were added to the pre-existing 7 institutes in 4 years. The number of Polytechnic institutes grew steadily in the state at a rate of 9.26%. The least amount of growth was seen in the number of ASC Colleges, at 0.7%. This is indicative of a shift in higher education from general streams such as Arts, Science and Commerce to more specialized streams at both undergraduate and postgraduate levels. Some of the initiatives that the government is planning with respect to increasing the number of technical institutes are that every district must have at least one engineering college amongst other such initiatives. Accordingly the government has proposed to establish at least one engineering college in the remaining uncovered 32 districts through PPP mode. Every subdivision must have at least one polytechnic institution in government sector or under PPP mode. The target will be to churn out 1,00,000 vocationally trained individuals annually in long term trades and 5,00,000 individuals annually in short term market driven trades.36
36Bihar’s Approach to 12th Five Year Plan
78%
1%3%
3%
2% 13%ASC Colleges
Engg./Tech./Arch./Desig
n Colleges
Medical Colleges
Teacher Education
Polytechnics
Others
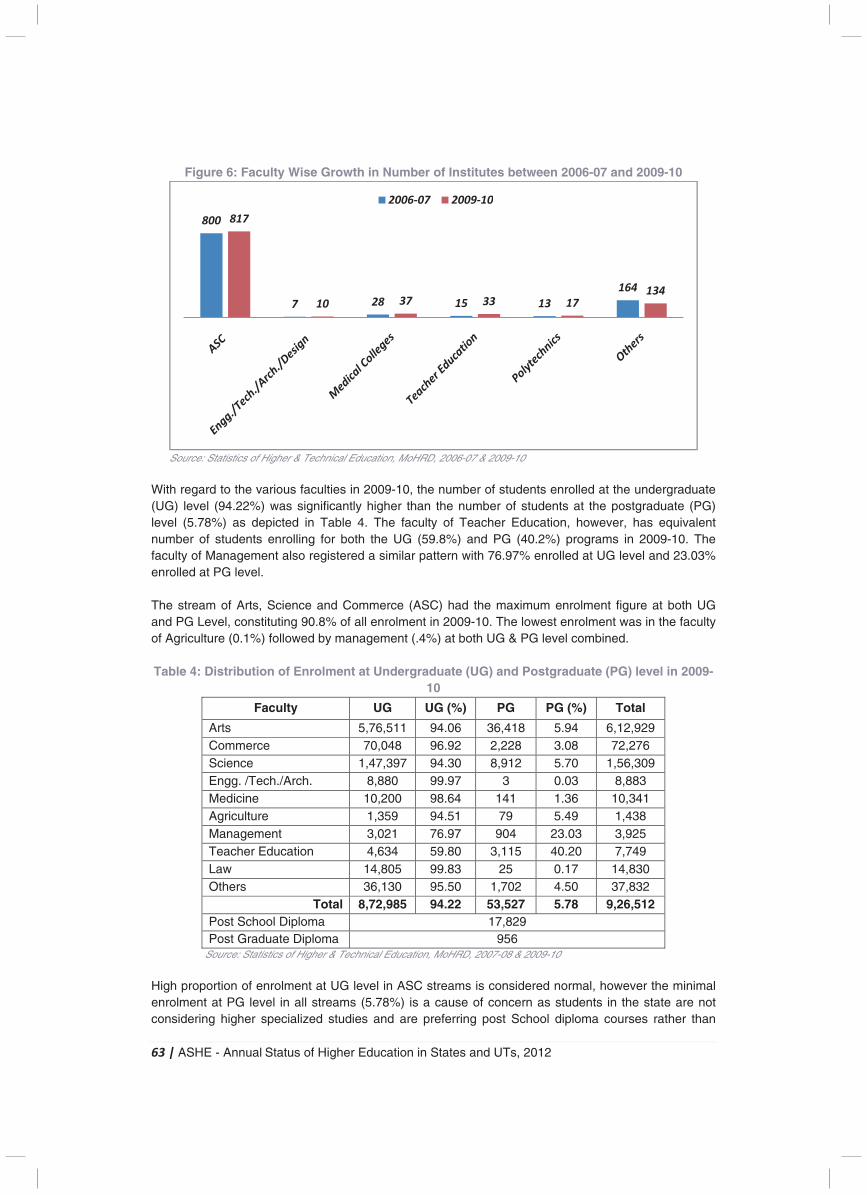
63 | ASHE - Annual Status of Higher Education in States and UTs, 2012
Figure 6: Faculty Wise Growth in Number of Institutes between 2006-07 and 2009-10
Source: Statistics of Higher & Technical Education, MoHRD, 2006-07 & 2009-10
With regard to the various faculties in 2009-10, the number of students enrolled at the undergraduate (UG) level (94.22%) was significantly higher than the number of students at the postgraduate (PG) level (5.78%) as depicted in Table 4. The faculty of Teacher Education, however, has equivalent number of students enrolling for both the UG (59.8%) and PG (40.2%) programs in 2009-10. The faculty of Management also registered a similar pattern with 76.97% enrolled at UG level and 23.03% enrolled at PG level. The stream of Arts, Science and Commerce (ASC) had the maximum enrolment figure at both UG and PG Level, constituting 90.8% of all enrolment in 2009-10. The lowest enrolment was in the faculty of Agriculture (0.1%) followed by management (.4%) at both UG & PG level combined. Table 4: Distribution of Enrolment at Undergraduate (UG) and Postgraduate (PG) level in 2009-
10
Faculty UG UG (%) PG PG (%) Total
Arts 5,76,511 94.06 36,418 5.94 6,12,929 Commerce 70,048 96.92 2,228 3.08 72,276 Science 1,47,397 94.30 8,912 5.70 1,56,309 Engg. /Tech./Arch. 8,880 99.97 3 0.03 8,883 Medicine 10,200 98.64 141 1.36 10,341 Agriculture 1,359 94.51 79 5.49 1,438 Management 3,021 76.97 904 23.03 3,925 Teacher Education 4,634 59.80 3,115 40.20 7,749 Law 14,805 99.83 25 0.17 14,830 Others 36,130 95.50 1,702 4.50 37,832
Total 8,72,985 94.22 53,527 5.78 9,26,512 Post School Diploma 17,829 Post Graduate Diploma 956
Source: Statistics of Higher & Technical Education, MoHRD, 2007-08 & 2009-10 High proportion of enrolment at UG level in ASC streams is considered normal, however the minimal enrolment at PG level in all streams (5.78%) is a cause of concern as students in the state are not considering higher specialized studies and are preferring post School diploma courses rather than
(.7%)
(12.49%) (9.63%) (29.72%)
(-6.45%)
(9.26%)
800
7 28 15 13
164
817
10 37 33 17
134
2006-07 2009-10
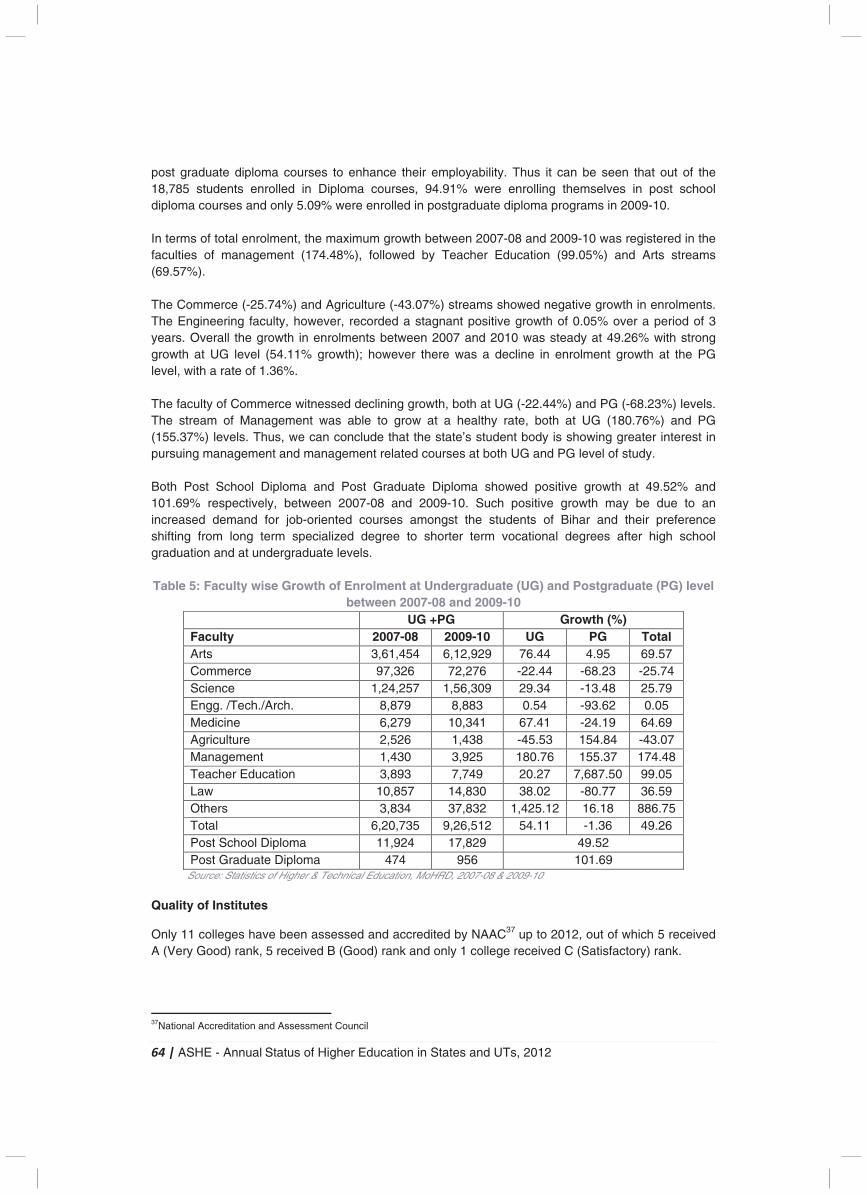
64 | ASHE - Annual Status of Higher Education in States and UTs, 2012
post graduate diploma courses to enhance their employability. Thus it can be seen that out of the 18,785 students enrolled in Diploma courses, 94.91% were enrolling themselves in post school diploma courses and only 5.09% were enrolled in postgraduate diploma programs in 2009-10. In terms of total enrolment, the maximum growth between 2007-08 and 2009-10 was registered in the faculties of management (174.48%), followed by Teacher Education (99.05%) and Arts streams (69.57%). The Commerce (-25.74%) and Agriculture (-43.07%) streams showed negative growth in enrolments. The Engineering faculty, however, recorded a stagnant positive growth of 0.05% over a period of 3 years. Overall the growth in enrolments between 2007 and 2010 was steady at 49.26% with strong growth at UG level (54.11% growth); however there was a decline in enrolment growth at the PG level, with a rate of 1.36%. The faculty of Commerce witnessed declining growth, both at UG (-22.44%) and PG (-68.23%) levels. The stream of Management was able to grow at a healthy rate, both at UG (180.76%) and PG (155.37%) levels. Thus, we can conclude that the state’s student body is showing greater interest in pursuing management and management related courses at both UG and PG level of study. Both Post School Diploma and Post Graduate Diploma showed positive growth at 49.52% and 101.69% respectively, between 2007-08 and 2009-10. Such positive growth may be due to an increased demand for job-oriented courses amongst the students of Bihar and their preference shifting from long term specialized degree to shorter term vocational degrees after high school graduation and at undergraduate levels. Table 5: Faculty wise Growth of Enrolment at Undergraduate (UG) and Postgraduate (PG) level
between 2007-08 and 2009-10 UG +PG Growth (%) Faculty 2007-08 2009-10 UG PG Total Arts 3,61,454 6,12,929 76.44 4.95 69.57 Commerce 97,326 72,276 -22.44 -68.23 -25.74 Science 1,24,257 1,56,309 29.34 -13.48 25.79 Engg. /Tech./Arch. 8,879 8,883 0.54 -93.62 0.05 Medicine 6,279 10,341 67.41 -24.19 64.69 Agriculture 2,526 1,438 -45.53 154.84 -43.07 Management 1,430 3,925 180.76 155.37 174.48 Teacher Education 3,893 7,749 20.27 7,687.50 99.05 Law 10,857 14,830 38.02 -80.77 36.59 Others 3,834 37,832 1,425.12 16.18 886.75 Total 6,20,735 9,26,512 54.11 -1.36 49.26 Post School Diploma 11,924 17,829 49.52 Post Graduate Diploma 474 956 101.69
Source: Statistics of Higher & Technical Education, MoHRD, 2007-08 & 2009-10
Quality of Institutes
Only 11 colleges have been assessed and accredited by NAAC37 up to 2012, out of which 5 received A (Very Good) rank, 5 received B (Good) rank and only 1 college received C (Satisfactory) rank.
37National Accreditation and Assessment Council
65 | ASHE - Annual Status of Higher Education in States and UTs, 2012
Industry and Employment Scenario
Key Industries38
The state provides investment opportunities in sectors such as agro-based industry, food processing, sugar, power, leather, manufacturing and tourism. The natural resources and policy incentives support the agro-based sector. Agro-based industry and petroleum products (primarily, Barauni oil refinery) account for roughly 85% of the total industrial output in the state. Bihar offers a wide range of policy incentives for businesses under the Industrial Incentive Policy, 2011 and also provides incentives for the sugar, renewable energy, food processing and tourism sectors. Due to its unique location-specific advantage because of its proximity to the vast markets of East and North India), access to ports such as Kolkata and Haldia, raw material sources and mineral reserves from the neighboring states, Bihar is a prime destination for investment. A brief overview of the various key industries in Bihar is as given below:
1. Food Processing & Dairy � Bihar is one of the largest producers of vegetables and fruits in the country. The
advantages of the state make it a suitable place for setting up units in the food processing sector.
� The state is one of the leading producers of banana, mango, litchi and vegetables such as onions, tomato, potato and egg-plant in the country.
� Food processing is a priority sector for the State Government. Up to 40% of the project cost for setting up food processing units is subsidized by the State Government.
� Besides food processing, the State Government also promotes cooperative marketing of milk and dairy products. Major players in this sector are Bihar State Cooperative Milk Producers Federation (COMPFED) and Usher Agro Limited.
2. Chemicals, Oil & Gas � The major drivers of chemical, oil and gas industry in Bihar are proximity to sea ports,
availability of labour and the vast market of Eastern India. � Petroleum & allied sectors are large contributors to the state’s industrial value output as
they have one of the largest public sector refineries in the country – Indian Oil Corporation Limited (IOCL).
� Prominent companies in this sector present in the state are Indian Oil Corporation Limited, Graphite India Limited and Krishi Rasayan Exports Private Limited.
3. Sugar � Sugar, the largest agro-based industry in the state plays a prominent role in Bihar’s
economy. � The North of the state is climatically well-suited for producing Good quality sugarcane with
minimum inputs as compared to other states. The State Government offers incentive package to the sugar industry. The Sugarcane Institute in Pusa and Rajendra Agricultural University are engaged in sugarcane-related research activities.
� Major players in the sugar industry are K. K. Birla Group, Riga Sugar Company Limited, Vishnu Sugar Mills Limited and Eastern Sugar & Industries Limited.
4. Tourism � The state has a rich cultural heritage as it is associated with pilgrimages and historical
monuments related to religious gurus such as the Buddha, Mahavir, Guru Gobind Singh.
38India Brand Equity Foundation – State report on Bihar
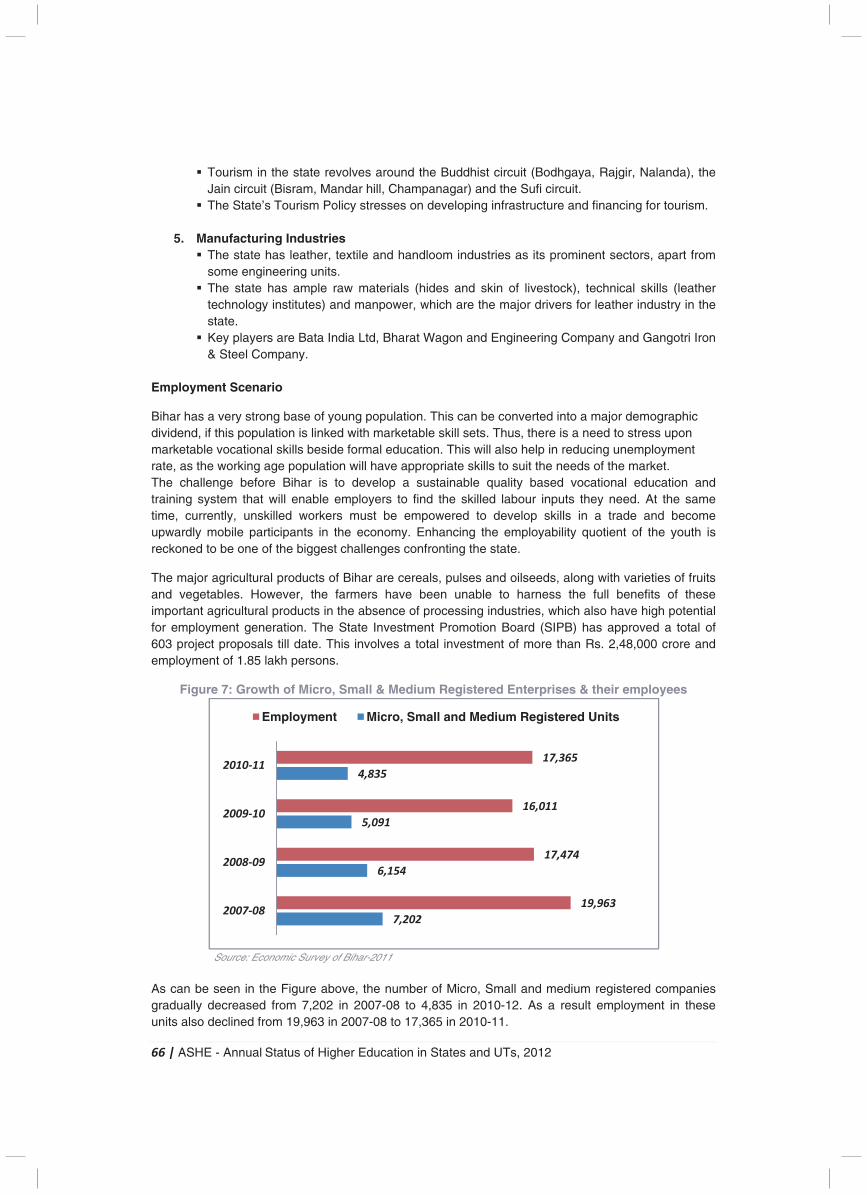
66 | ASHE - Annual Status of Higher Education in States and UTs, 2012
� Tourism in the state revolves around the Buddhist circuit (Bodhgaya, Rajgir, Nalanda), the Jain circuit (Bisram, Mandar hill, Champanagar) and the Sufi circuit.
� The State’s Tourism Policy stresses on developing infrastructure and financing for tourism.
5. Manufacturing Industries � The state has leather, textile and handloom industries as its prominent sectors, apart from
some engineering units. � The state has ample raw materials (hides and skin of livestock), technical skills (leather
technology institutes) and manpower, which are the major drivers for leather industry in the state.
� Key players are Bata India Ltd, Bharat Wagon and Engineering Company and Gangotri Iron & Steel Company.
Employment Scenario
Bihar has a very strong base of young population. This can be converted into a major demographic dividend, if this population is linked with marketable skill sets. Thus, there is a need to stress upon marketable vocational skills beside formal education. This will also help in reducing unemployment rate, as the working age population will have appropriate skills to suit the needs of the market. The challenge before Bihar is to develop a sustainable quality based vocational education and training system that will enable employers to find the skilled labour inputs they need. At the same time, currently, unskilled workers must be empowered to develop skills in a trade and become upwardly mobile participants in the economy. Enhancing the employability quotient of the youth is reckoned to be one of the biggest challenges confronting the state.
The major agricultural products of Bihar are cereals, pulses and oilseeds, along with varieties of fruits and vegetables. However, the farmers have been unable to harness the full benefits of these important agricultural products in the absence of processing industries, which also have high potential for employment generation. The State Investment Promotion Board (SIPB) has approved a total of 603 project proposals till date. This involves a total investment of more than Rs. 2,48,000 crore and employment of 1.85 lakh persons.
Figure 7: Growth of Micro, Small & Medium Registered Enterprises & their employees
Source: Economic Survey of Bihar-2011
As can be seen in the Figure above, the number of Micro, Small and medium registered companies gradually decreased from 7,202 in 2007-08 to 4,835 in 2010-12. As a result employment in these units also declined from 19,963 in 2007-08 to 17,365 in 2010-11.
7,202
6,154
5,091
4,835
19,963
17,474
16,011
17,365
2007-08
2008-09
2009-10
2010-11
Employment Micro, Small and Medium Registered Units
67 | ASHE - Annual Status of Higher Education in States and UTs, 2012
The Economic Census 2005 revealed that the state registered a growth of 17.31 % in the total number of establishments over the previous Economic Census of 1998. Bihar had 12.25 lakh establishments in 2005, of which 68.23% belonged to the rural and 31.77% to urban area. Out of the total number of enterprises, 62% belonged to the Own Account Establishments (OAE) category and 32% were establishments with at least one hired worker.
There were 2.85% Agricultural and 97.15% Non-Agricultural Establishments in the state. Of the total Agricultural Establishments, 25,000 or 72% belonged to the OAE category, while remaining 28% were under the group of Establishments with hired workers (EHW). In the category of Non-Agricultural Establishments, 7.95 lakh belonged to OAE group and 3.94 lakh belonged to Establishments with hired workers (EHW) in the state.
A total 22.69 lakh workers were working in 12.25 lakh establishments of the state. The number of total workers grew by only 1.62% in 2005 over 1998. Out of total workers, 61.9% were in rural areas, while 38.1% were in urban areas. There were 63,000 workers in Agricultural establishments and 22.06 lakh workers in Non-Agricultural establishments.39
As per the Annual Survey of Industries (2008-09), with 1,777 factories in Bihar, its share in Indian factories declined from 1.22% in 2007-08 to 1.14% in 2008-09. The share of Bihar in fixed capital; working capital and persons employed also registered a decline in 2008-09 over 2007-08.40
Key Challenges in Higher Education In order to achieve better access to higher education, Bihar government needs to ensure that all subdivisions have adequate centers for higher learning. The issue of quality in higher education in Bihar and academic reforms, initiated during the 11th Plan at the national level, needs to be firmly addressed during 12th Plan. In the area of higher education, there is a serious need for expanding the infrastructure of higher education to meet the growing demand in the society. During the 12th Plan the government of India will target a GER of 20% or more in higher education, thus it is necessary to raise the GER in higher education in Bihar to a level of 17% to 18% in order to keep parity with the other states. To address the same, large number of institutes should be established in the state. Some of the other challenges plaguing higher and technical education have been elaborated below. Challenges in Higher Education � Students don’t opt for technical, professional and vocational courses in the state due to lack of
quantity and quality. Most students seek technical and vocational programs in states. � The state needs Management institutes and Engineering Colleges to promote technical and
professional education. For such initiatives funding is required from Govt. of India, UGC, and AICTE.
� Infrastructure, recruitment of qualified teachers and laboratory facilities with necessary equipment are the need of the hour for Colleges to improve the quality of education
� GER in Bihar is 11% and needs to be increased to 18% (National Averages). For this purpose, there is a need for more Technical and Professional Institutes with quality infrastructure and qualified and competent teachers.
� The state should setup a State Council for Higher education � All Higher Education initiatives in Bihar need assistance in the ratio 90:10 from the Govt. of India
as the state has limited resources and cannot afford such an expansion.
39 Fifth Economic Census-2005 40Annual Survey of Industries, 2008-09
68 | ASHE - Annual Status of Higher Education in States and UTs, 2012
� The state has 5 districts with no primary teacher training Colleges, 14 districts with 1 primary teacher training Colleges, highlighting a need for 19 new primary teacher training Colleges.
� The state has only 6 Govt. B.Ed. Colleges. However, Government of India mandates 1 Govt. B.Ed. College in every 3 districts hence there is a demand for 13 Govt. B.Ed. Colleges. A proposal has been sent for 7 new Government Colleges in the state.
� The gender parity index in higher education in Bihar is 0.49 whereas at all India level it is 0.70. It shows that the participation of woman in higher education in Bihar is quite low.
Challenges in Technical Education � The Central Government's policies tend to neglect the need for technical institutions both as part
of higher education and for science and technology interventions. Additionally, it is a stark fact that Bihar has negligible numbers of technical institutions (only 0.56% engineering colleges and 0.76% of polytechnic institutions of the total number in India).
� Lack of quality technical education and low availability of seats in Colleges has led to “Brain Drain” in the state. Students of Bihar excel in competitive exams and enter premier institutes across the country and abroad. This leads to an acute lack of quality manpower, which impedes industrial development in the state. Another essential challenge is the Non availability of latest technologies.
� Lack of application based learning for students and no or very little exposure to industry practices and trends. Few employment opportunities after diploma and graduation courses provided to students.
� Currently there is a huge shortage of quality faculties. The quality of training depends upon the quality of trainers. Trainers are needed to be trained regularly to enhance their technical knowledge.
Initiatives in Higher & Technical Education
The Government of Bihar and the Government of India together, try to enhance and improve the quality of higher and technical education in the state of Bihar by prescribing certain initiatives and policies that have been and will be accomplished in the next five years during the 12th Five Year Plan. Some of these initiatives include following best practices, infrastructural up gradation and increasing quality with the use of ICT tools. Some the current and proposed initiatives have been described briefly.
Initiatives undertaken in Higher Education � Establishment of prestigious traditional Universities in the state including: Moulana Mazrul Haque
Arabi Pharsi University, Chanakya National Law University, Aaryabhatt Knowledge University, Nalanda Open University and Chandragupta Management Institute.
� Commencement of opening up of Model degree Colleges in 18 sub division districts having no constituent degree Colleges. 50 Colleges have been selected to be converted into centres of excellence.
� A Bihar State Educational Infrastructural Development Corporation has been established to deal with the huge infrastructure gap in secondary and higher education. A large number of schools, girl's hostels and degree colleges are to be set up. This corporation will create their physical infrastructure. This dedicated Corporation will not only develop physical infrastructure but will also do procurement in the field of education.
� FIST program for promoting quality higher education and research in Science education has been started in 229 constituent Colleges and 114 affiliated Colleges by department of Science and Government of India.
Initiatives Proposed in Higher & Technical Education
69 | ASHE - Annual Status of Higher Education in States and UTs, 2012
� Credit system and semester system that is on the national agenda would also be introduced in the colleges and universities of Bihar. Universities need to evolve a system of annual academic audit for colleges. All colleges and universities would be affiliated under 2F and 12B of UGC in order to attract central planned funding on a large scale.
� All universities and colleges should be accredited by NAAC. � Govt. of India approved a plan to establish Polytechnics in 34 unreserved districts under
submission on Polytechnic. � Department of Science has invited Private promoters for establishing Diploma Level technical
institutes in PPP mode under the guidance of AICTE. � Government of India has given consent to establish IIIT in 11th Five Year Plan � A proposal to establish a science complex-Planetarium in North & South Bihar is under active
consideration in the 12th Five Year Plan so is an International Level Science City in Patna. � Teacher Education Quality Improvement Program (TEQIP)-II will also be implemented in the 12th
Five Year Plan after analysing the work of TEQIP-I. � There is a requirement of quantitative expansion along with qualitative and innovative changes in
technical institutions. This would help the state in bridging the gap between demand and supply of such facilities.
� All premier colleges would be encouraged to prepare for the autonomous college status or college with potential excellence status from UGC. So far, quality in higher learning centers of general education has not been addressed properly.
� Various steps will be taken for modernization and strengthening the laboratories/workshops as per latest technology. New laboratories will be established. Modernization of class rooms/computer centers and libraries will be carried out.
� It is proposed to establish two state-of the art technical teacher's training Institutes; one for ITI instructors and other for polytechnic/engineering teachers training Institute. For improving the quality of faculties of universities, each university should have its own academic staff college with core faculties in addition to UGC academic staff college where regular training/refresher courses will be conducted.
� Creating infrastructure for on the job training encouraging apprenticeships is a major requirement of quality higher education. The enabling infrastructure for large number of formal apprentices needs to be built.
� Providing industry input to curricula development; providing opportunity for students group to undertake problem solving projects; industry exposure for faculty; creating avenues for earning by learning; establishment of industry institute interaction cum placement cell; greater and wider acceptance of the course and institute and other steps deemed necessary for heightening such interactions.
� Giving incentive to take up research projects will reward the University/college faculty. This is necessary to attract Good faculty. To start postgraduate education and demand driven research and development, innovation in collaboration with industry and other knowledge users in existing institution is necessary. Faculties will be encouraged to take up projects from various stakeholders for technological solution.
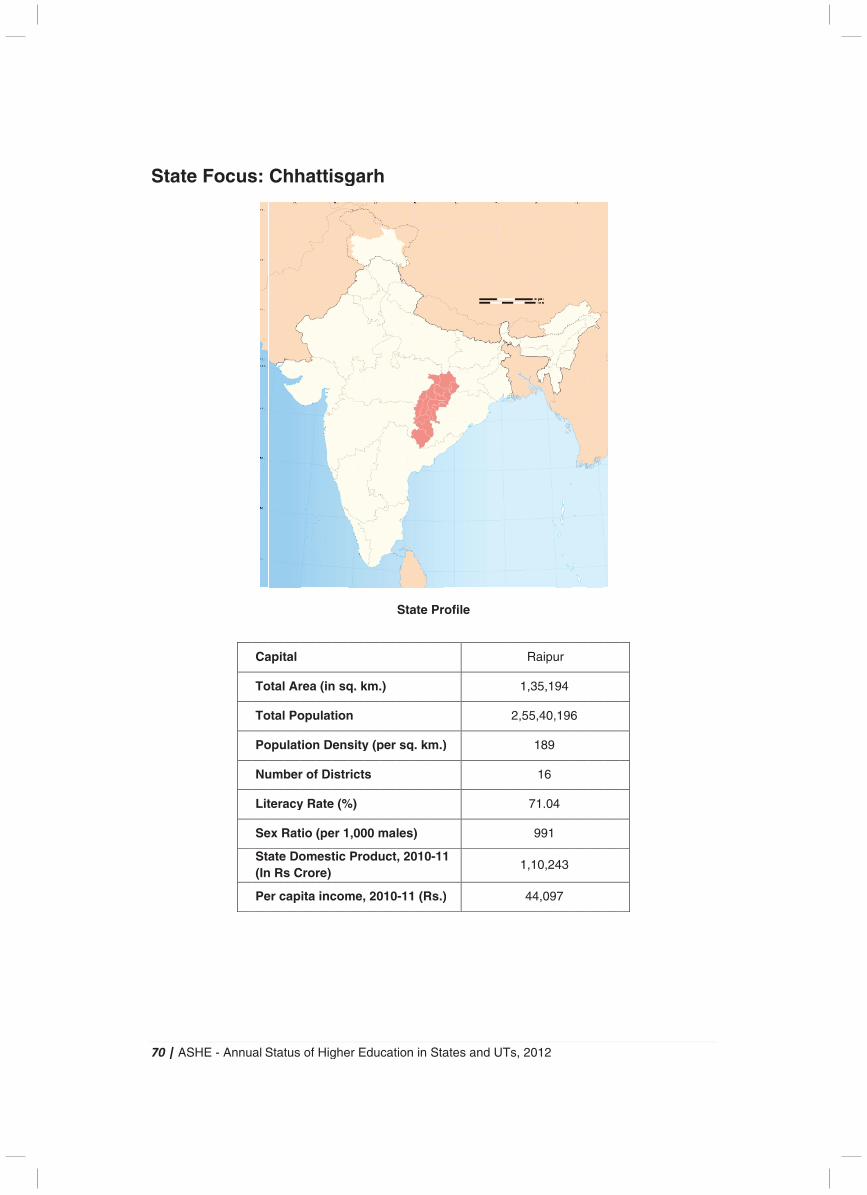
7
S
70 |
Sta
| AS
ate
SHE
e F
E -
Fo
An
oc
nnu
us
al S
s:
Ca
To
To
Po
Nu
Lit
Se
Sta(In
Pe
Stat
Ch
apit
otal
otal
opu
umb
tera
ex R
aten Rs
er c
tus
hh
tal
Ar
Po
ulat
ber
acy
Rat
e Dos C
cap
of
hat
rea
opu
tion
r of
y Ra
tio (
omCror
ita
Hig
tti
(in
ulat
n D
f Di
ate
(pe
mestre)
inc
ghe
sg
n sq
tion
ens
istr
e (%
er 1
tic
com
er E
ga
q. k
n
sity
rict
%)
,00
Pro
me,
Edu
arh
km.
y (p
s
00 m
odu
, 20
cat
h
.)
per
ma
uct
010
tion
Sta
sq
les
, 20
0-11
n in
ate
q. k
s)
010
1 (R
Sta
Pr
m.)
0-11
Rs.)
ates
ofi
)
1
)
s a
le
nd
UT
Ts, 2
1
2,5
1
201
Ra
1,35
55,4
1
1
71
9
1,10
44
12
aipu
5,19
40,
89
16
1.04
991
0,24
,09
ur
94
196
4
43
97
6
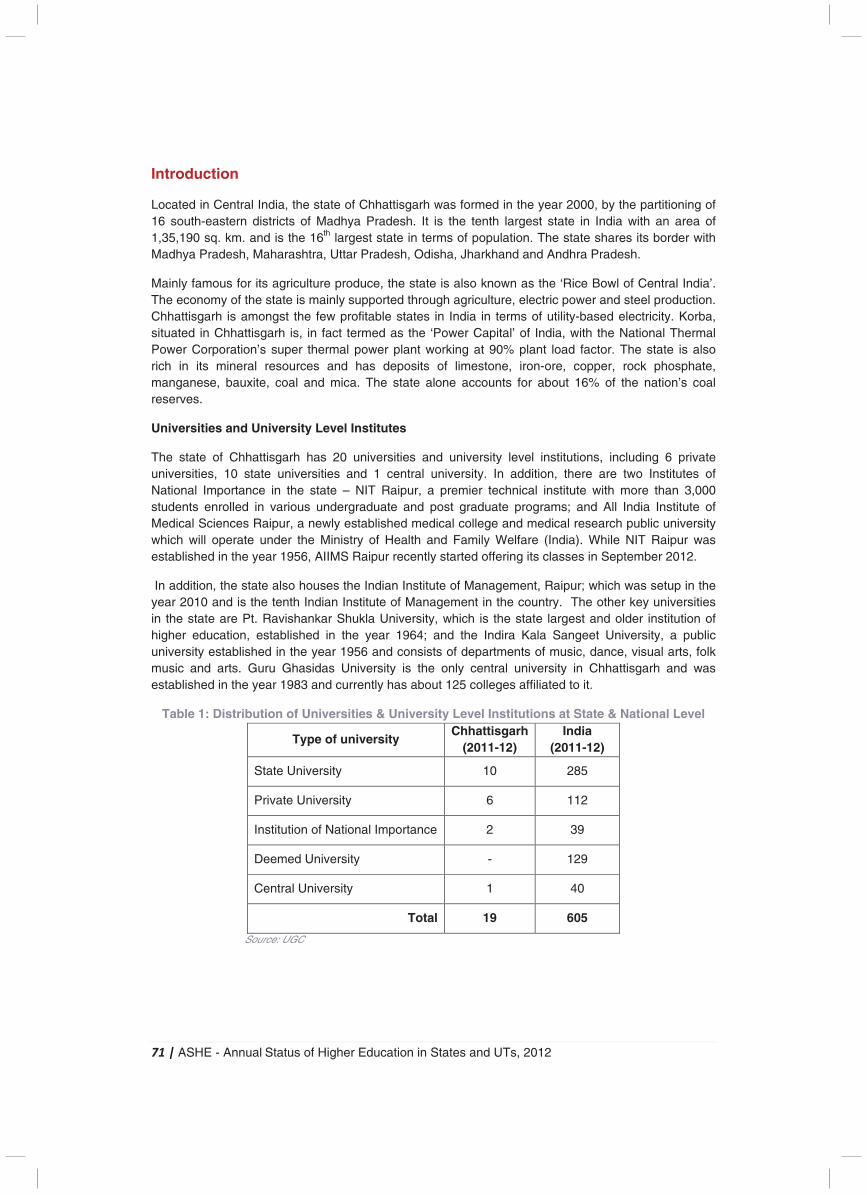
71 | ASHE - Annual Status of Higher Education in States and UTs, 2012
Introduction
Located in Central India, the state of Chhattisgarh was formed in the year 2000, by the partitioning of 16 south-eastern districts of Madhya Pradesh. It is the tenth largest state in India with an area of 1,35,190 sq. km. and is the 16th largest state in terms of population. The state shares its border with Madhya Pradesh, Maharashtra, Uttar Pradesh, Odisha, Jharkhand and Andhra Pradesh.
Mainly famous for its agriculture produce, the state is also known as the ‘Rice Bowl of Central India’. The economy of the state is mainly supported through agriculture, electric power and steel production. Chhattisgarh is amongst the few profitable states in India in terms of utility-based electricity. Korba, situated in Chhattisgarh is, in fact termed as the ‘Power Capital’ of India, with the National Thermal Power Corporation’s super thermal power plant working at 90% plant load factor. The state is also rich in its mineral resources and has deposits of limestone, iron-ore, copper, rock phosphate, manganese, bauxite, coal and mica. The state alone accounts for about 16% of the nation’s coal reserves.
Universities and University Level Institutes
The state of Chhattisgarh has 20 universities and university level institutions, including 6 private universities, 10 state universities and 1 central university. In addition, there are two Institutes of National Importance in the state – NIT Raipur, a premier technical institute with more than 3,000 students enrolled in various undergraduate and post graduate programs; and All India Institute of Medical Sciences Raipur, a newly established medical college and medical research public university which will operate under the Ministry of Health and Family Welfare (India). While NIT Raipur was established in the year 1956, AIIMS Raipur recently started offering its classes in September 2012.
In addition, the state also houses the Indian Institute of Management, Raipur; which was setup in the year 2010 and is the tenth Indian Institute of Management in the country. The other key universities in the state are Pt. Ravishankar Shukla University, which is the state largest and older institution of higher education, established in the year 1964; and the Indira Kala Sangeet University, a public university established in the year 1956 and consists of departments of music, dance, visual arts, folk music and arts. Guru Ghasidas University is the only central university in Chhattisgarh and was established in the year 1983 and currently has about 125 colleges affiliated to it.
Table 1: Distribution of Universities & University Level Institutions at State & National Level
Type of university Chhattisgarh
(2011-12) India
(2011-12)
State University 10 285
Private University 6 112
Institution of National Importance 2 39
Deemed University - 129
Central University 1 40
Total 19 605
Source: UGC

72 | ASHE - Annual Status of Higher Education in States and UTs, 2012
Figure 1: Location of Premier Institutes in Chhattisgarh
Key Higher Education Indicators: Institutes and Enrolment
As per MoHRD data, the growth rate in the total number of higher education institutes in the state stood at 19.7% between the years 2007-08 and 2009-10. The growth rate in the state was higher as compared to the national average growth rate, the national level growth being only 7% in the same period. The total student enrolment in higher education also increased from 2.01 lakh during the year 2007-08 to 4.99 lakh during the year 2009-10.
Figure 2: Growth in Number of Higher Education Institutes between 2007-08 and 2009-10
Source: Statistics of Higher & Technical Education, MoHRD
The Gross Enrolment Ratio (GER) in the state increased from 8.7% during the year 2006-07 to 12% during the year 2009-10. The GER, however, was still much less as compared to the national average of 15% and the state has to make significant investments to meet the national average in the coming future.
Figure 3: Gross Enrolment Ratio (%) in the state (2006-07 to 2009-10)
Source: Statistics of Higher & Technical Education, MoHRD
� Guru Ghasidas University, Bilaspur
� National Institute of Technology,
Raipur � All India Institute of Medical
Sciences, Raipur � Pt. Ravishankar Shukla University � Indira Kala Sangeet University,
Khairagarh
418
548599
2007-08 2008-09 2009-10
8.7 8.7
12 12
2006-07 2007-08 2008-09 2009-10
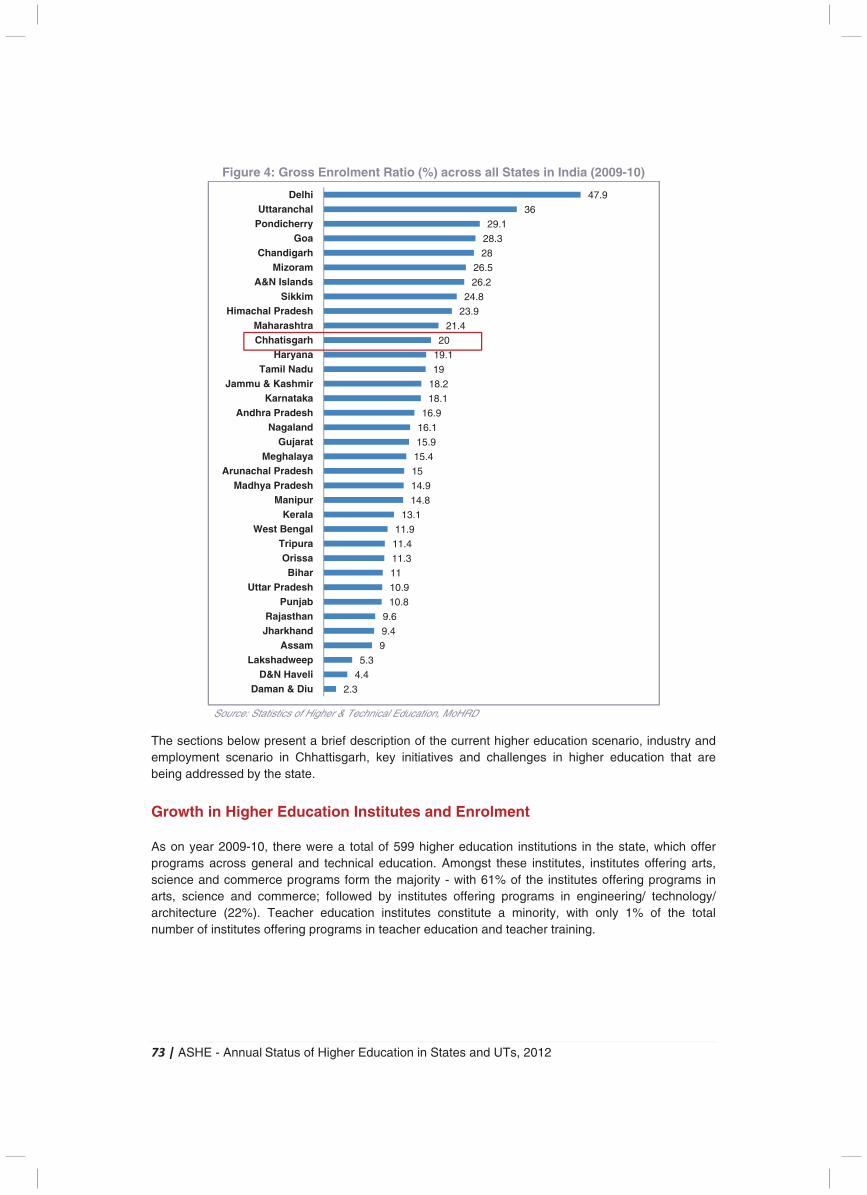
73 | ASHE - Annual Status of Higher Education in States and UTs, 2012
Figure 4: Gross Enrolment Ratio (%) across all States in India (2009-10)
Source: Statistics of Higher & Technical Education, MoHRD
The sections below present a brief description of the current higher education scenario, industry and employment scenario in Chhattisgarh, key initiatives and challenges in higher education that are being addressed by the state. Growth in Higher Education Institutes and Enrolment As on year 2009-10, there were a total of 599 higher education institutions in the state, which offer programs across general and technical education. Amongst these institutes, institutes offering arts, science and commerce programs form the majority - with 61% of the institutes offering programs in arts, science and commerce; followed by institutes offering programs in engineering/ technology/ architecture (22%). Teacher education institutes constitute a minority, with only 1% of the total number of institutes offering programs in teacher education and teacher training.
2.3
4.4
5.3
9
9.4
9.6
10.8
10.9
11
11.3
11.4
11.9
13.1
14.8
14.9
15
15.4
15.9
16.1
16.9
18.1
18.2
19
19.1
20
21.4
23.9
24.8
26.2
26.5
28
28.3
29.1
36
47.9
Daman & DiuD&N Haveli
LakshadweepAssam
JharkhandRajasthan
PunjabUttar Pradesh
BiharOrissa
TripuraWest Bengal
KeralaManipur
Madhya PradeshArunachal Pradesh
MeghalayaGujarat
NagalandAndhra Pradesh
KarnatakaJammu & Kashmir
Tamil NaduHaryana
ChhatisgarhMaharashtra
Himachal PradeshSikkim
A&N IslandsMizoram
ChandigarhGoa
PondicherryUttaranchal
Delhi
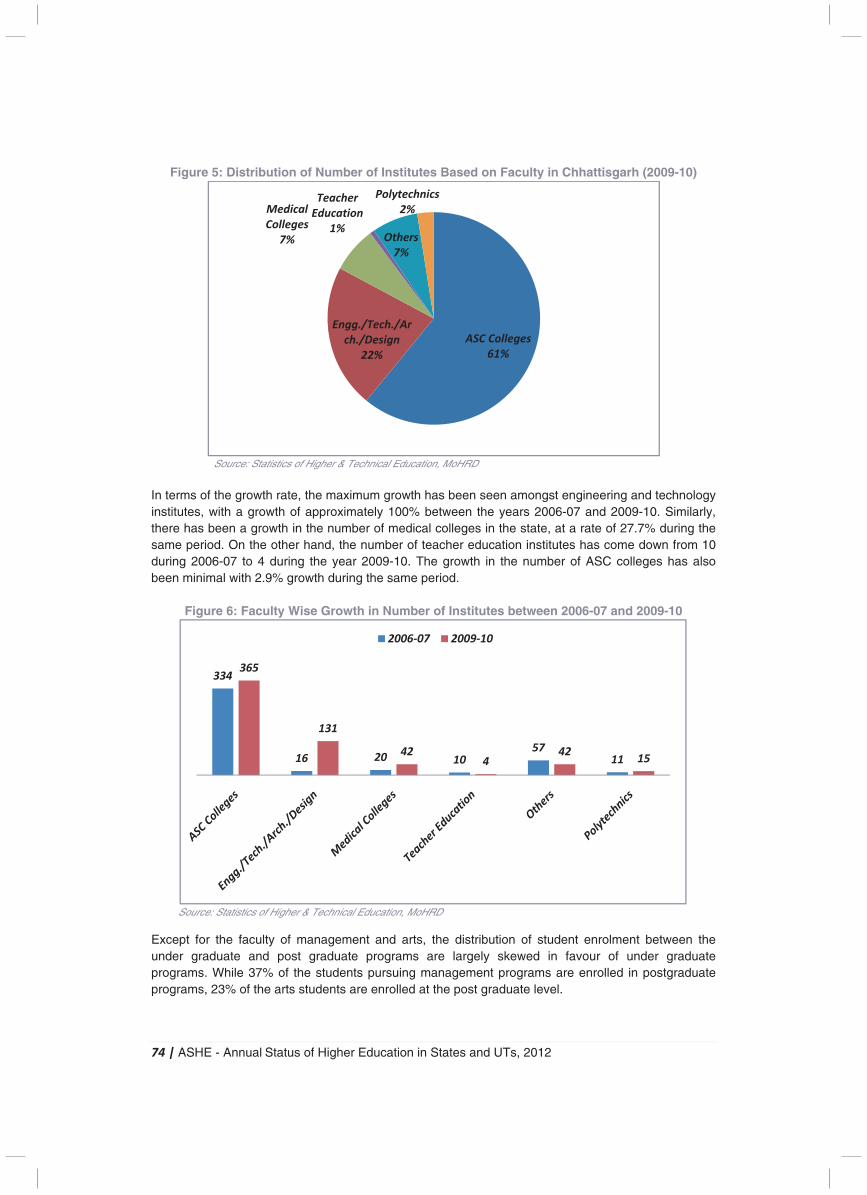
74 | ASHE - Annual Status of Higher Education in States and UTs, 2012
Figure 5: Distribution of Number of Institutes Based on Faculty in Chhattisgarh (2009-10)
Source: Statistics of Higher & Technical Education, MoHRD
In terms of the growth rate, the maximum growth has been seen amongst engineering and technology institutes, with a growth of approximately 100% between the years 2006-07 and 2009-10. Similarly, there has been a growth in the number of medical colleges in the state, at a rate of 27.7% during the same period. On the other hand, the number of teacher education institutes has come down from 10 during 2006-07 to 4 during the year 2009-10. The growth in the number of ASC colleges has also been minimal with 2.9% growth during the same period.
Figure 6: Faculty Wise Growth in Number of Institutes between 2006-07 and 2009-10
Source: Statistics of Higher & Technical Education, MoHRD
Except for the faculty of management and arts, the distribution of student enrolment between the under graduate and post graduate programs are largely skewed in favour of under graduate programs. While 37% of the students pursuing management programs are enrolled in postgraduate programs, 23% of the arts students are enrolled at the post graduate level.
(2.9%)
(100.1%) (27.7%) (-26%) (10.7%)
ASC Colleges
61%
Engg./Tech./Ar
ch./Design
22%
Medical
Colleges
7%
Teacher
Education
1%Others
7%
Polytechnics
2%
334
16 20 1057
11
365
131
424
4215
2006-07 2009-10
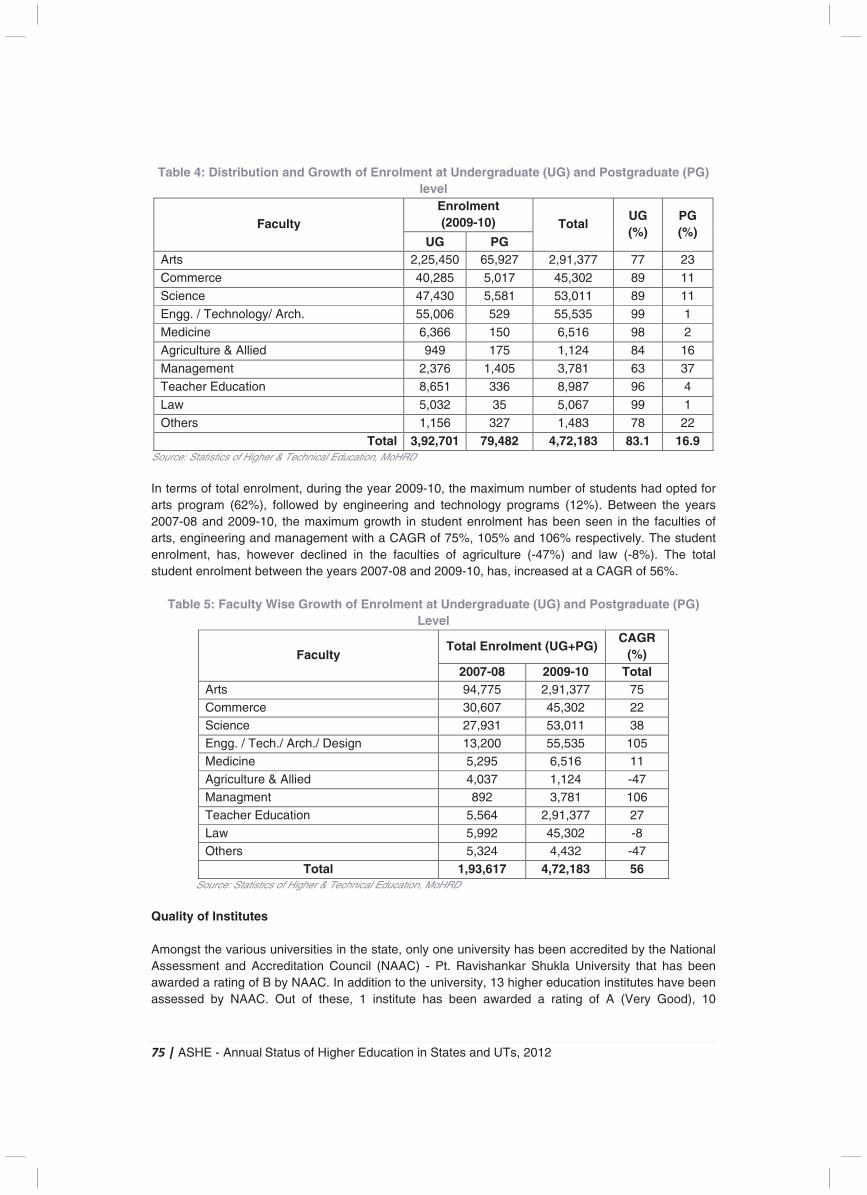
75 | ASHE - Annual Status of Higher Education in States and UTs, 2012
Table 4: Distribution and Growth of Enrolment at Undergraduate (UG) and Postgraduate (PG) level
Faculty Enrolment (2009-10) Total
UG (%)
PG (%)
UG PG Arts 2,25,450 65,927 2,91,377 77 23
Commerce 40,285 5,017 45,302 89 11
Science 47,430 5,581 53,011 89 11
Engg. / Technology/ Arch. 55,006 529 55,535 99 1
Medicine 6,366 150 6,516 98 2
Agriculture & Allied 949 175 1,124 84 16
Management 2,376 1,405 3,781 63 37
Teacher Education 8,651 336 8,987 96 4
Law 5,032 35 5,067 99 1
Others 1,156 327 1,483 78 22
Total 3,92,701 79,482 4,72,183 83.1 16.9 Source: Statistics of Higher & Technical Education, MoHRD In terms of total enrolment, during the year 2009-10, the maximum number of students had opted for arts program (62%), followed by engineering and technology programs (12%). Between the years 2007-08 and 2009-10, the maximum growth in student enrolment has been seen in the faculties of arts, engineering and management with a CAGR of 75%, 105% and 106% respectively. The student enrolment, has, however declined in the faculties of agriculture (-47%) and law (-8%). The total student enrolment between the years 2007-08 and 2009-10, has, increased at a CAGR of 56%.
Table 5: Faculty Wise Growth of Enrolment at Undergraduate (UG) and Postgraduate (PG) Level
Faculty Total Enrolment (UG+PG)
CAGR (%)
2007-08 2009-10 Total Arts 94,775 2,91,377 75 Commerce 30,607 45,302 22 Science 27,931 53,011 38 Engg. / Tech./ Arch./ Design 13,200 55,535 105 Medicine 5,295 6,516 11 Agriculture & Allied 4,037 1,124 -47 Managment 892 3,781 106 Teacher Education 5,564 2,91,377 27 Law 5,992 45,302 -8 Others 5,324 4,432 -47
Total 1,93,617 4,72,183 56 Source: Statistics of Higher & Technical Education, MoHRD
Quality of Institutes Amongst the various universities in the state, only one university has been accredited by the National Assessment and Accreditation Council (NAAC) - Pt. Ravishankar Shukla University that has been awarded a rating of B by NAAC. In addition to the university, 13 higher education institutes have been assessed by NAAC. Out of these, 1 institute has been awarded a rating of A (Very Good), 10
76 | ASHE - Annual Status of Higher Education in States and UTs, 2012
institutes have been awarded a rating of B (Good) and 2 institutes have been awarded a C rating (Satisfactory).
Industry and Employment Scenario
Key Industries41
A brief overview of the various key industries in Chhattisgarh is as given below:
1. Mining � The state is among the richest Indian states in terms of mineral wealth, with 28 varieties of
major minerals including diamonds. The state holds a major share of coal deposits in India and is the only state in the country to have tin ore reserves.
� About one-fifth of the iron ore in the country is mined in the state. Also, rich deposits of bauxite, limestone, dolomite and corundum; makes it the ideal location for production of end products like cement and aluminium.
� During the year 2011-12, the state had generated revenue of from minerals. � Key player(s): NMDC Ltd
2. Iron and steel
� The state is considered as the iron and steel hub of the country. The steel plant of Steel Authority of India Ltd (SAIL) located in Bhilai produces more than 3 million tonnes of saleable steel per year. In addition, there are several establishments by the private sector as well.
� The state contributes around 28% of the nation’s sponge iron production and is one of the leading iron ore producing states in India. In the year 2010-11 alone, the state produced around 31.7 m tonnes of iron-ore.
� Key players: Steel Authority of India Ltd, TATA Steel, Essar Steel, Godawari Power and Ispat Ltd.
3. Cement
� The state has a strong cement sector as a result of its abundant limestone reserves. It accounts for around 5% of the total limestone reserves in India.
� During the year 2010-11, the state accounted for around 8% of the total limestone production in India, amounting to 19.2 million tonnes.
� The state has nine major and 12 minor cement units, with the majority of the cement production units concentrated in the Raipur area.
� Key players: ACC Ltd, Lafarge India, JK Lakshmi Cement Ltd, and UltraTech Cement Ltd.
4. Food processing � The state is considered as the ‘Rice Bowl of Central India’ and its reliance on agriculture
has led to the identification and growth of the food processing industry as a special-focus industry.
� In line with its resources, the government is currently in the process of setting up a food processing park in the state, located in the district of Rajnandgaon.
5. Aluminium and metals
� To utilize the rich natural resources available in the state, initiatives have been proposed to develop the metal sector of the state.
� It has been proposed to establish an aluminium park in Korba district, spreading across 140 hectares of land to promote value addition in the aluminium sector.
41India Brand Equity Foundation – State report on Chhattisgarh
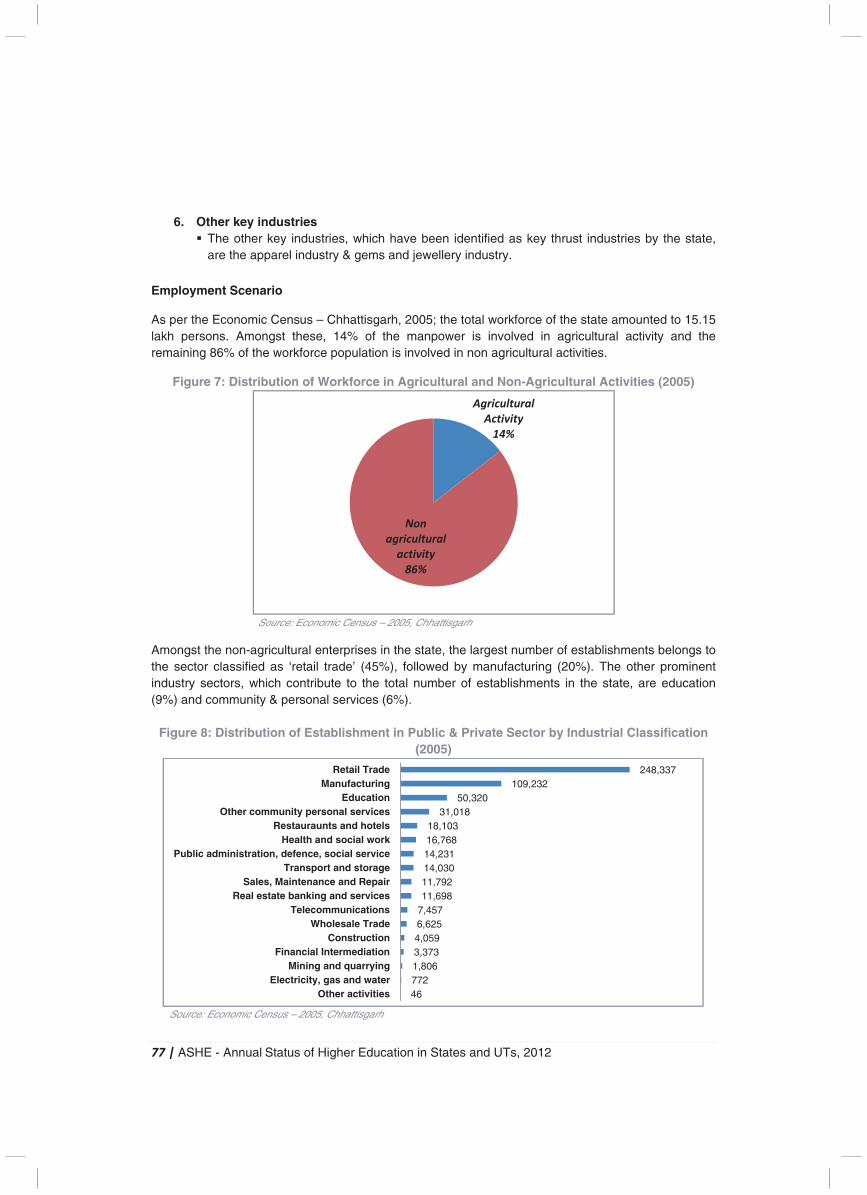
77 | ASHE - Annual Status of Higher Education in States and UTs, 2012
6. Other key industries � The other key industries, which have been identified as key thrust industries by the state,
are the apparel industry & gems and jewellery industry.
Employment Scenario
As per the Economic Census – Chhattisgarh, 2005; the total workforce of the state amounted to 15.15 lakh persons. Amongst these, 14% of the manpower is involved in agricultural activity and the remaining 86% of the workforce population is involved in non agricultural activities.
Figure 7: Distribution of Workforce in Agricultural and Non-Agricultural Activities (2005)
Source: Economic Census – 2005, Chhattisgarh
Amongst the non-agricultural enterprises in the state, the largest number of establishments belongs to the sector classified as ‘retail trade’ (45%), followed by manufacturing (20%). The other prominent industry sectors, which contribute to the total number of establishments in the state, are education (9%) and community & personal services (6%).
Figure 8: Distribution of Establishment in Public & Private Sector by Industrial Classification (2005)
Source: Economic Census – 2005, Chhattisgarh
Agricultural
Activity
14%
Non
agricultural
activity
86%
46 772 1,806 3,373 4,059 6,625 7,457 11,698 11,792 14,030 14,231 16,768 18,103
31,018 50,320
109,232 248,337
Other activitiesElectricity, gas and water
Mining and quarryingFinancial Intermediation
ConstructionWholesale Trade
TelecommunicationsReal estate banking and services
Sales, Maintenance and RepairTransport and storage
Public administration, defence, social serviceHealth and social work
Restauraunts and hotelsOther community personal services
EducationManufacturing
Retail Trade
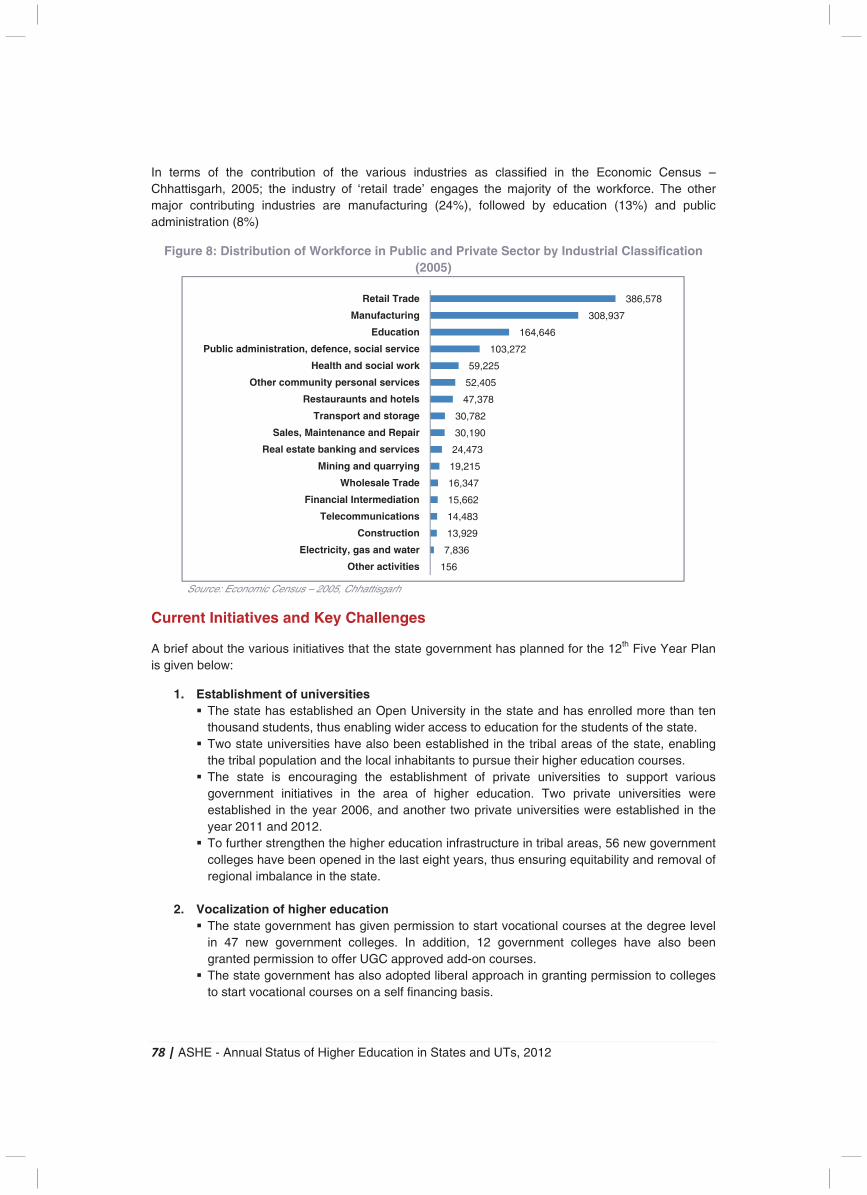
78 | ASHE - Annual Status of Higher Education in States and UTs, 2012
In terms of the contribution of the various industries as classified in the Economic Census – Chhattisgarh, 2005; the industry of ‘retail trade’ engages the majority of the workforce. The other major contributing industries are manufacturing (24%), followed by education (13%) and public administration (8%)
Figure 8: Distribution of Workforce in Public and Private Sector by Industrial Classification (2005)
Source: Economic Census – 2005, Chhattisgarh
Current Initiatives and Key Challenges
A brief about the various initiatives that the state government has planned for the 12th Five Year Plan is given below:
1. Establishment of universities � The state has established an Open University in the state and has enrolled more than ten
thousand students, thus enabling wider access to education for the students of the state. � Two state universities have also been established in the tribal areas of the state, enabling
the tribal population and the local inhabitants to pursue their higher education courses. � The state is encouraging the establishment of private universities to support various
government initiatives in the area of higher education. Two private universities were established in the year 2006, and another two private universities were established in the year 2011 and 2012.
� To further strengthen the higher education infrastructure in tribal areas, 56 new government colleges have been opened in the last eight years, thus ensuring equitability and removal of regional imbalance in the state.
2. Vocalization of higher education
� The state government has given permission to start vocational courses at the degree level in 47 new government colleges. In addition, 12 government colleges have also been granted permission to offer UGC approved add-on courses.
� The state government has also adopted liberal approach in granting permission to colleges to start vocational courses on a self financing basis.
156
7,836
13,929
14,483
15,662
16,347
19,215
24,473
30,190
30,782
47,378
52,405
59,225
103,272
164,646
308,937
386,578
Other activities
Electricity, gas and water
Construction
Telecommunications
Financial Intermediation
Wholesale Trade
Mining and quarrying
Real estate banking and services
Sales, Maintenance and Repair
Transport and storage
Restauraunts and hotels
Other community personal services
Health and social work
Public administration, defence, social service
Education
Manufacturing
Retail Trade

79 | ASHE - Annual Status of Higher Education in States and UTs, 2012
3. Introduction of semester system � The semester system has been introduced at the post graduate level across all higher
education institutes in the state. Assessment of students is conducted on a continuous basis in all government colleges, through unit tests/ half yearly examinations on a regular basis.
4. Other future initiatives: In addition to the above initiatives, the state government has
developed other strategies to tackle the concerns of equity, access and quality in higher education. � Establishment of degree colleges has been planned under the 12th Five Year Plan in
districts where the Gross Enrolment Ratio is lesser than the national average � Setting up of an MIS system in all the government colleges integrating the processes of
library management, e-learning, academic and administration management � Introduction of compulsory spoken English classes in all the government colleges � Establishment of a centre of excellence in job-oriented subjects like bio-technology, space
technology, nano-technology, micro-biology, cell biology, molecular biology, stem-cell technology, management and accounting
� Establishment of a state level quality assurance cell
Current Challenges faced by the state in Higher Education
In improving the higher education scenario in Chhattisgarh, the state is facing several challenges, many of which are common across states in India. Some of these challenges that the state needs to address are:
� Skills mismatch: There is an existent mismatch between the abilities that are developed among the students in higher education institutes in the state and the skills demanded by the industry. It has been estimated that more than 70% of the engineering graduates are unemployable. While there are no shortages in terms of quantity for majority of the sectors, there are steep shortages felt in some of the sectors.
� Outdated curriculum: The curriculum currently being implemented in various higher education institutes in the state is largely outdated and highly theoretical in nature. As a result, students are not able to implement their knowledge in the work environment.
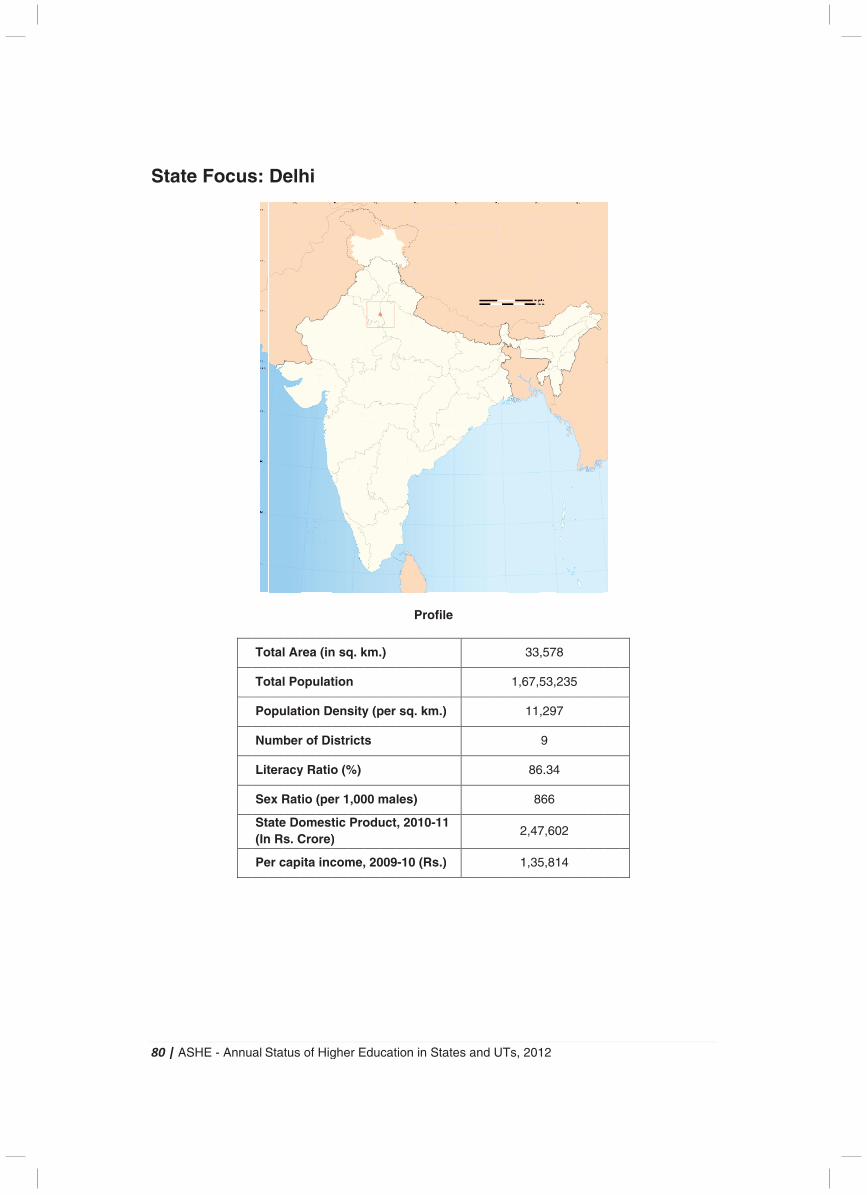
8
S
80 |
Sta
| AS
ate
SHE
e F
E -
Fo
An
oc
nnu
us
al S
s:
To
To
Po
Nu
Lit
Se
Sta(In
Pe
Stat
De
otal
otal
opu
umb
tera
ex R
aten Rs
er c
tus
elh
Ar
Po
ulat
ber
acy
Rat
e Dos. C
cap
of
hi
rea
opu
tion
r of
y Ra
tio (
omCro
ita
Hig
(in
ulat
n D
f Di
atio
(pe
mestore)
inc
ghe
n sq
tion
ens
istr
o (%
er 1
tic )
com
er E
q. k
n
sity
rict
%)
,00
Pro
me,
Edu
km.
y (p
s
00 m
odu
, 20
cat
.)
per
ma
uct
009
tion
sq
les
, 20
9-10
n in
Pro
q. k
s)
010
0 (R
Sta
ofil
m.)
0-11
Rs.)
ates
le
)
1
)
s a
nd
UT
Ts, 2
1,6
2
1
201
33
67,5
11
86
8
2,47
1,35
12
,57
53,
,29
9
6.34
866
7,60
5,8
78
235
97
4
02
14
5
81 | ASHE - Annual Status of Higher Education in States and UTs, 2012
Introduction
Delhi is the capital of India and is the second most populous metropolis-in the nation, with a population of 16.3 million recorded in 2011. The Union Territory shares its border with the states of Uttar Pradesh and Haryana, and it is the centre of international politics, trade, culture and literature in India. Delhi has emerged as a key state with immense scope for development of the services industry. A prominent agri-trade centre of the country, it is an established tourist destination, with several historical monuments. Being the seat of the central government, Delhi has an important position in the country in terms of formulation of policies. It has become an important centre for trade and commerce, with several key industry associations being present.
Universities and University Level Institutes
Delhi is home to 25 universities and university level institutions, including 5 Central Universities, 4 State Universities and 12 Deemed Universities. In addition, there are 4 Institutes of National Importance in Delhi. Some of the most reputed national level universities are located in Delhi. The University of Delhi, established in the year 1922, has grown into one of the largest universities in India, with 16 faculties, 86 academic departments, 77 affiliated colleges and 5 recognized institutes located across the city, with more than 1.3 lakh regular students and 2.6 lakh students in their non-formal education program.
Jamia Millia Islamia, a Central University, was established in 1920 and offers programs in engineering & technology, teacher education, humanities, law, natural sciences, social sciences, architecture & dentistry. The South Asian University – an international university sponsored by the eight member states of the South Asian Association for Regional Cooperation (SAARC) – was also established recently in Delhi, during the year 2010. By the year 2014, it is expected to host a total of 3,000 students in the university.
Table 1: Distribution of Universities & University Level Institutions at State & National Level
Type of University Delhi
(2011-12) India
(2011-12)
State University 10 285
Private University 9 112
Institution of National Importance 2 39
Deemed University 7 129
Central University 1 40
Total 29 605
Source: UGC
Among the state universities, the Delhi Technology University has been consistently ranked among the best engineering colleges in India. Established in 1941, the institute enrols approximately 6,800 students. In addition to these universities, there are four Institutes of National Importance located in Delhi – IIT Delhi, All India Institute of Medical Sciences (AIIMS), National Institute of Technology Delhi, and Indian Statistical Institute. The Indian Institute of Technology (IIT), Delhi, is a premier engineering and technology institute and was ranked 212 in the QS World University Rankings of 2012. Among the engineering colleges in India, it has always been ranked in the top three colleges.
On the other hand, the National Institute of Technology, Delhi has recently been established (in 2010), and is currently operating under the mentorship of NIT-Warangal. The All India Institute of
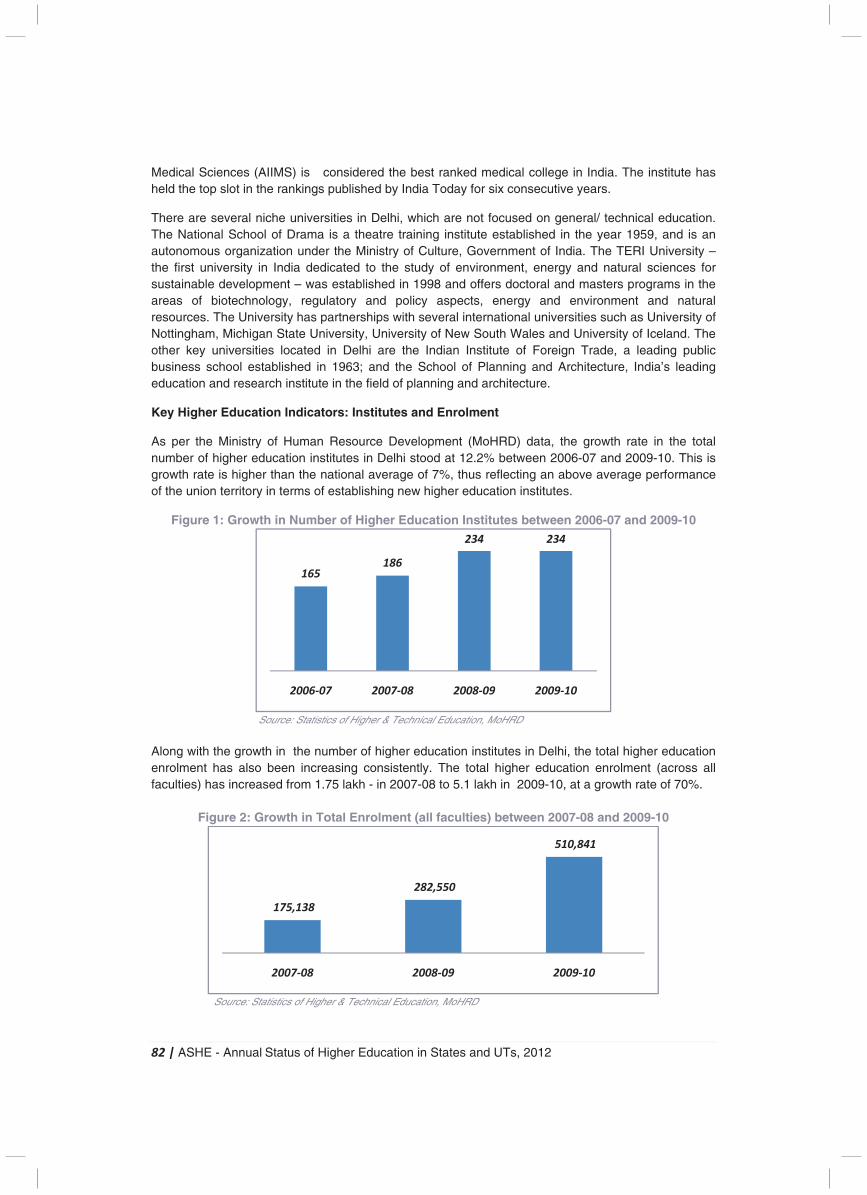
82 | ASHE - Annual Status of Higher Education in States and UTs, 2012
Medical Sciences (AIIMS) is considered the best ranked medical college in India. The institute has held the top slot in the rankings published by India Today for six consecutive years.
There are several niche universities in Delhi, which are not focused on general/ technical education. The National School of Drama is a theatre training institute established in the year 1959, and is an autonomous organization under the Ministry of Culture, Government of India. The TERI University – the first university in India dedicated to the study of environment, energy and natural sciences for sustainable development – was established in 1998 and offers doctoral and masters programs in the areas of biotechnology, regulatory and policy aspects, energy and environment and natural resources. The University has partnerships with several international universities such as University of Nottingham, Michigan State University, University of New South Wales and University of Iceland. The other key universities located in Delhi are the Indian Institute of Foreign Trade, a leading public business school established in 1963; and the School of Planning and Architecture, India’s leading education and research institute in the field of planning and architecture.
Key Higher Education Indicators: Institutes and Enrolment
As per the Ministry of Human Resource Development (MoHRD) data, the growth rate in the total number of higher education institutes in Delhi stood at 12.2% between 2006-07 and 2009-10. This is growth rate is higher than the national average of 7%, thus reflecting an above average performance of the union territory in terms of establishing new higher education institutes.
Figure 1: Growth in Number of Higher Education Institutes between 2006-07 and 2009-10
Source: Statistics of Higher & Technical Education, MoHRD
Along with the growth in the number of higher education institutes in Delhi, the total higher education enrolment has also been increasing consistently. The total higher education enrolment (across all faculties) has increased from 1.75 lakh - in 2007-08 to 5.1 lakh in 2009-10, at a growth rate of 70%.
Figure 2: Growth in Total Enrolment (all faculties) between 2007-08 and 2009-10
Source: Statistics of Higher & Technical Education, MoHRD
165186
234 234
2006-07 2007-08 2008-09 2009-10
175,138
282,550
510,841
2007-08 2008-09 2009-10
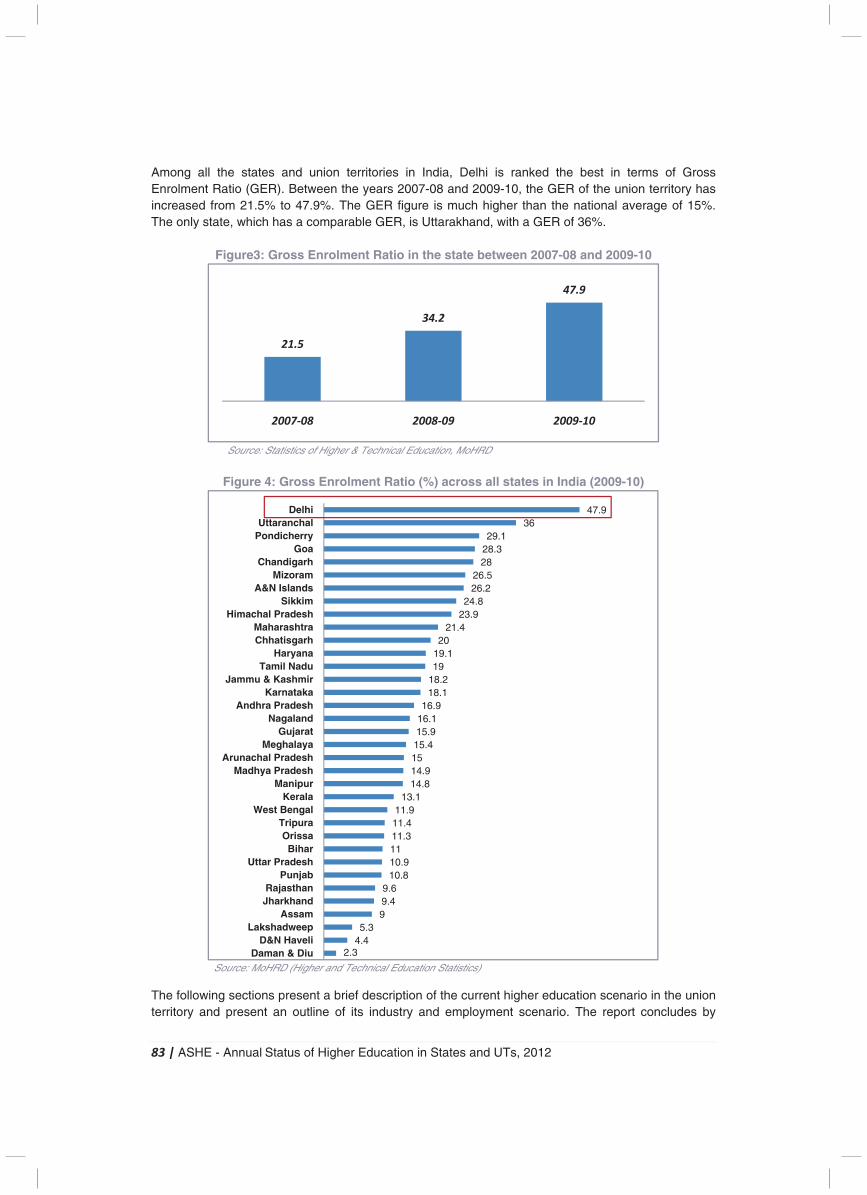
83 | ASHE - Annual Status of Higher Education in States and UTs, 2012
Among all the states and union territories in India, Delhi is ranked the best in terms of Gross Enrolment Ratio (GER). Between the years 2007-08 and 2009-10, the GER of the union territory has increased from 21.5% to 47.9%. The GER figure is much higher than the national average of 15%. The only state, which has a comparable GER, is Uttarakhand, with a GER of 36%.
Figure3: Gross Enrolment Ratio in the state between 2007-08 and 2009-10
Source: Statistics of Higher & Technical Education, MoHRD
Figure 4: Gross Enrolment Ratio (%) across all states in India (2009-10)
Source: MoHRD (Higher and Technical Education Statistics)
The following sections present a brief description of the current higher education scenario in the union territory and present an outline of its industry and employment scenario. The report concludes by
21.5
34.2
47.9
2007-08 2008-09 2009-10
2.34.45.3
99.49.6
10.810.91111.311.411.9
13.114.814.91515.415.916.116.9
18.118.21919.120
21.423.924.8
26.226.5
2828.329.1
3647.9
Daman & DiuD&N Haveli
LakshadweepAssam
JharkhandRajasthan
PunjabUttar Pradesh
BiharOrissa
TripuraWest Bengal
KeralaManipur
Madhya PradeshArunachal Pradesh
MeghalayaGujarat
NagalandAndhra Pradesh
KarnatakaJammu & Kashmir
Tamil NaduHaryana
ChhatisgarhMaharashtra
Himachal PradeshSikkim
A&N IslandsMizoram
ChandigarhGoa
PondicherryUttaranchal
Delhi
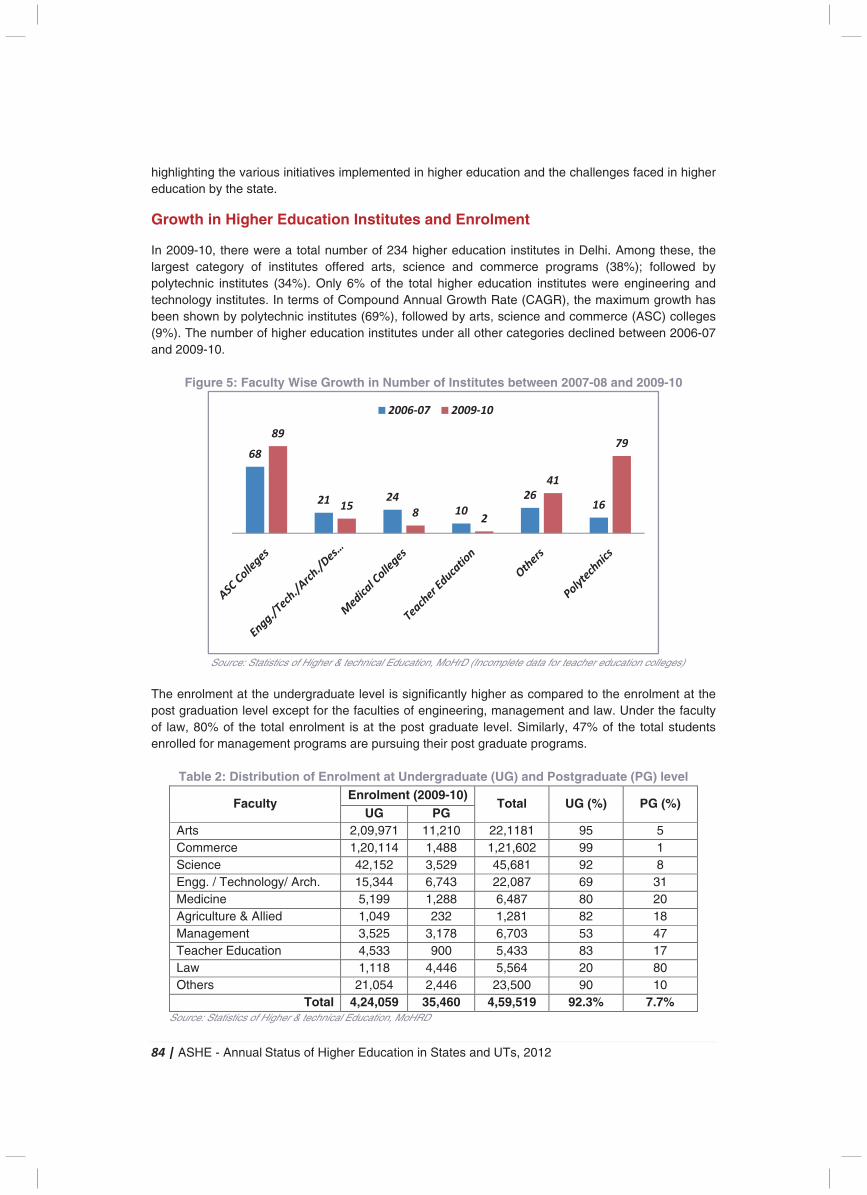
84 | ASHE - Annual Status of Higher Education in States and UTs, 2012
highlighting the various initiatives implemented in higher education and the challenges faced in higher education by the state.
Growth in Higher Education Institutes and Enrolment
In 2009-10, there were a total number of 234 higher education institutes in Delhi. Among these, the largest category of institutes offered arts, science and commerce programs (38%); followed by polytechnic institutes (34%). Only 6% of the total higher education institutes were engineering and technology institutes. In terms of Compound Annual Growth Rate (CAGR), the maximum growth has been shown by polytechnic institutes (69%), followed by arts, science and commerce (ASC) colleges (9%). The number of higher education institutes under all other categories declined between 2006-07 and 2009-10.
Figure 5: Faculty Wise Growth in Number of Institutes between 2007-08 and 2009-10
Source: Statistics of Higher & technical Education, MoHrD (Incomplete data for teacher education colleges)
The enrolment at the undergraduate level is significantly higher as compared to the enrolment at the post graduation level except for the faculties of engineering, management and law. Under the faculty of law, 80% of the total enrolment is at the post graduate level. Similarly, 47% of the total students enrolled for management programs are pursuing their post graduate programs.
Table 2: Distribution of Enrolment at Undergraduate (UG) and Postgraduate (PG) level
Faculty Enrolment (2009-10)
Total UG (%) PG (%) UG PG
Arts 2,09,971 11,210 22,1181 95 5 Commerce 1,20,114 1,488 1,21,602 99 1 Science 42,152 3,529 45,681 92 8 Engg. / Technology/ Arch. 15,344 6,743 22,087 69 31 Medicine 5,199 1,288 6,487 80 20 Agriculture & Allied 1,049 232 1,281 82 18 Management 3,525 3,178 6,703 53 47 Teacher Education 4,533 900 5,433 83 17 Law 1,118 4,446 5,564 20 80 Others 21,054 2,446 23,500 90 10
Total 4,24,059 35,460 4,59,519 92.3% 7.7% Source: Statistics of Higher & technical Education, MoHRD
(9%)
(-11%) (-30%)
(69%)
68
21 24
10
2616
89
158
2
41
79
2006-07 2009-10
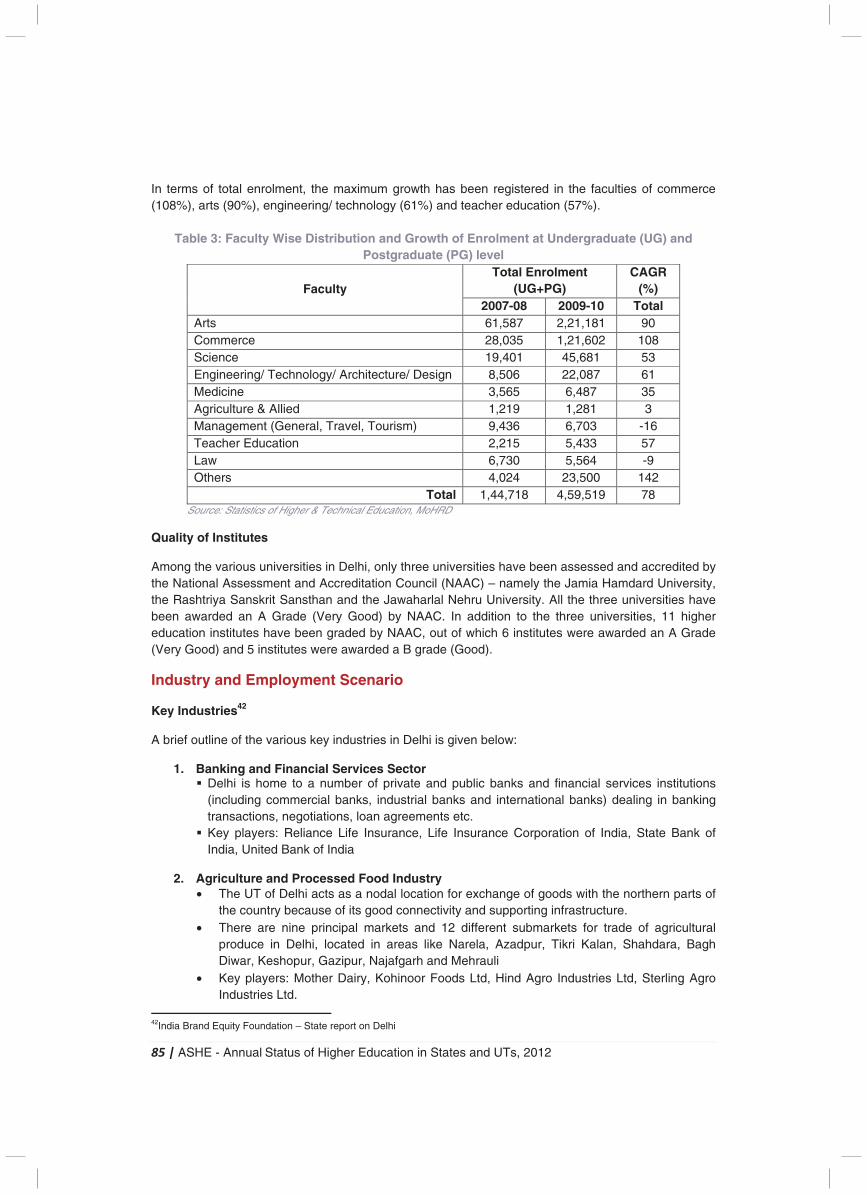
85 | ASHE - Annual Status of Higher Education in States and UTs, 2012
In terms of total enrolment, the maximum growth has been registered in the faculties of commerce (108%), arts (90%), engineering/ technology (61%) and teacher education (57%).
Table 3: Faculty Wise Distribution and Growth of Enrolment at Undergraduate (UG) and Postgraduate (PG) level
Faculty Total Enrolment
(UG+PG) CAGR
(%) 2007-08 2009-10 Total
Arts 61,587 2,21,181 90 Commerce 28,035 1,21,602 108 Science 19,401 45,681 53 Engineering/ Technology/ Architecture/ Design 8,506 22,087 61 Medicine 3,565 6,487 35 Agriculture & Allied 1,219 1,281 3 Management (General, Travel, Tourism) 9,436 6,703 -16 Teacher Education 2,215 5,433 57 Law 6,730 5,564 -9 Others 4,024 23,500 142
Total 1,44,718 4,59,519 78 Source: Statistics of Higher & Technical Education, MoHRD
Quality of Institutes
Among the various universities in Delhi, only three universities have been assessed and accredited by the National Assessment and Accreditation Council (NAAC) – namely the Jamia Hamdard University, the Rashtriya Sanskrit Sansthan and the Jawaharlal Nehru University. All the three universities have been awarded an A Grade (Very Good) by NAAC. In addition to the three universities, 11 higher education institutes have been graded by NAAC, out of which 6 institutes were awarded an A Grade (Very Good) and 5 institutes were awarded a B grade (Good).
Industry and Employment Scenario
Key Industries42
A brief outline of the various key industries in Delhi is given below:
1. Banking and Financial Services Sector � Delhi is home to a number of private and public banks and financial services institutions
(including commercial banks, industrial banks and international banks) dealing in banking transactions, negotiations, loan agreements etc.
� Key players: Reliance Life Insurance, Life Insurance Corporation of India, State Bank of India, United Bank of India
2. Agriculture and Processed Food Industry • The UT of Delhi acts as a nodal location for exchange of goods with the northern parts of
the country because of its good connectivity and supporting infrastructure. • There are nine principal markets and 12 different submarkets for trade of agricultural
produce in Delhi, located in areas like Narela, Azadpur, Tikri Kalan, Shahdara, Bagh Diwar, Keshopur, Gazipur, Najafgarh and Mehrauli
• Key players: Mother Dairy, Kohinoor Foods Ltd, Hind Agro Industries Ltd, Sterling Agro Industries Ltd.
42India Brand Equity Foundation – State report on Delhi
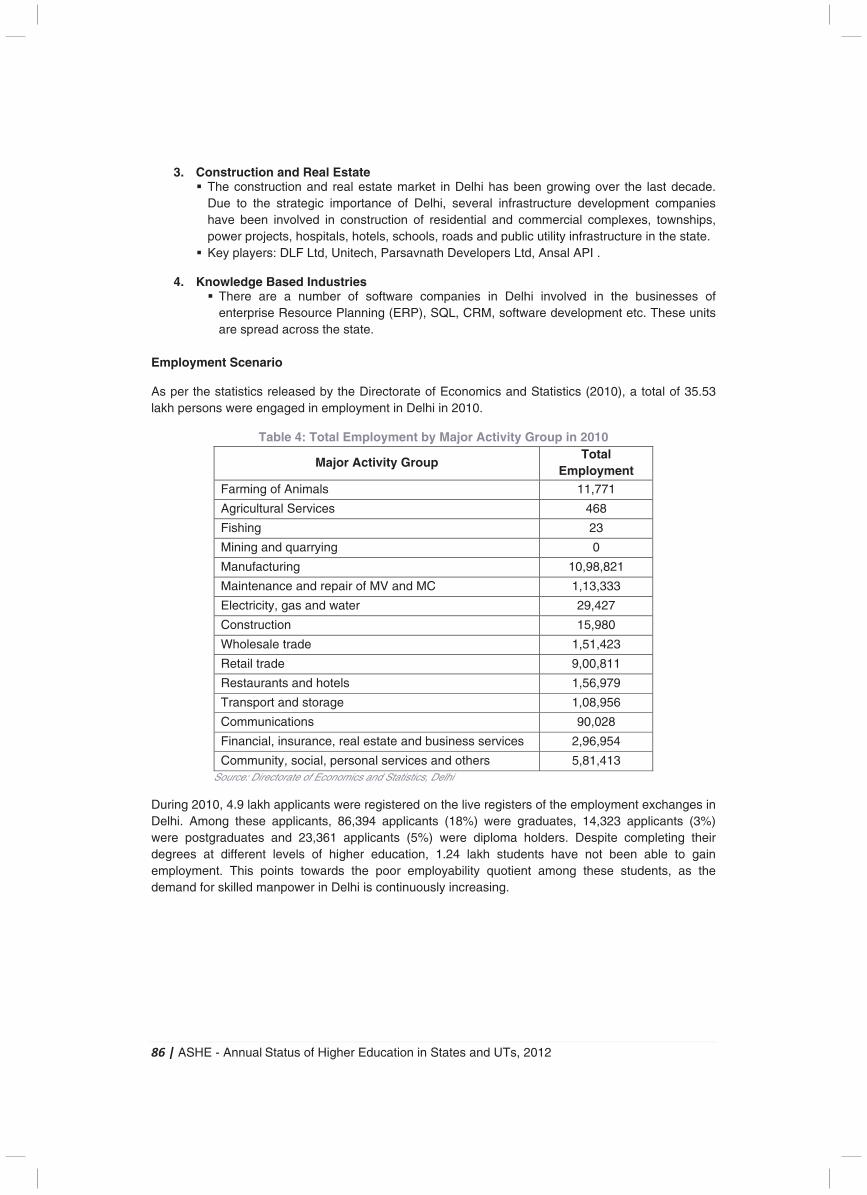
86 | ASHE - Annual Status of Higher Education in States and UTs, 2012
3. Construction and Real Estate � The construction and real estate market in Delhi has been growing over the last decade.
Due to the strategic importance of Delhi, several infrastructure development companies have been involved in construction of residential and commercial complexes, townships, power projects, hospitals, hotels, schools, roads and public utility infrastructure in the state.
� Key players: DLF Ltd, Unitech, Parsavnath Developers Ltd, Ansal API .
4. Knowledge Based Industries � There are a number of software companies in Delhi involved in the businesses of
enterprise Resource Planning (ERP), SQL, CRM, software development etc. These units are spread across the state.
Employment Scenario
As per the statistics released by the Directorate of Economics and Statistics (2010), a total of 35.53 lakh persons were engaged in employment in Delhi in 2010.
Table 4: Total Employment by Major Activity Group in 2010
Major Activity Group Total
Employment Farming of Animals 11,771
Agricultural Services 468
Fishing 23
Mining and quarrying 0
Manufacturing 10,98,821
Maintenance and repair of MV and MC 1,13,333
Electricity, gas and water 29,427
Construction 15,980
Wholesale trade 1,51,423
Retail trade 9,00,811
Restaurants and hotels 1,56,979
Transport and storage 1,08,956
Communications 90,028
Financial, insurance, real estate and business services 2,96,954
Community, social, personal services and others 5,81,413 Source: Directorate of Economics and Statistics, Delhi
During 2010, 4.9 lakh applicants were registered on the live registers of the employment exchanges in Delhi. Among these applicants, 86,394 applicants (18%) were graduates, 14,323 applicants (3%) were postgraduates and 23,361 applicants (5%) were diploma holders. Despite completing their degrees at different levels of higher education, 1.24 lakh students have not been able to gain employment. This points towards the poor employability quotient among these students, as the demand for skilled manpower in Delhi is continuously increasing.
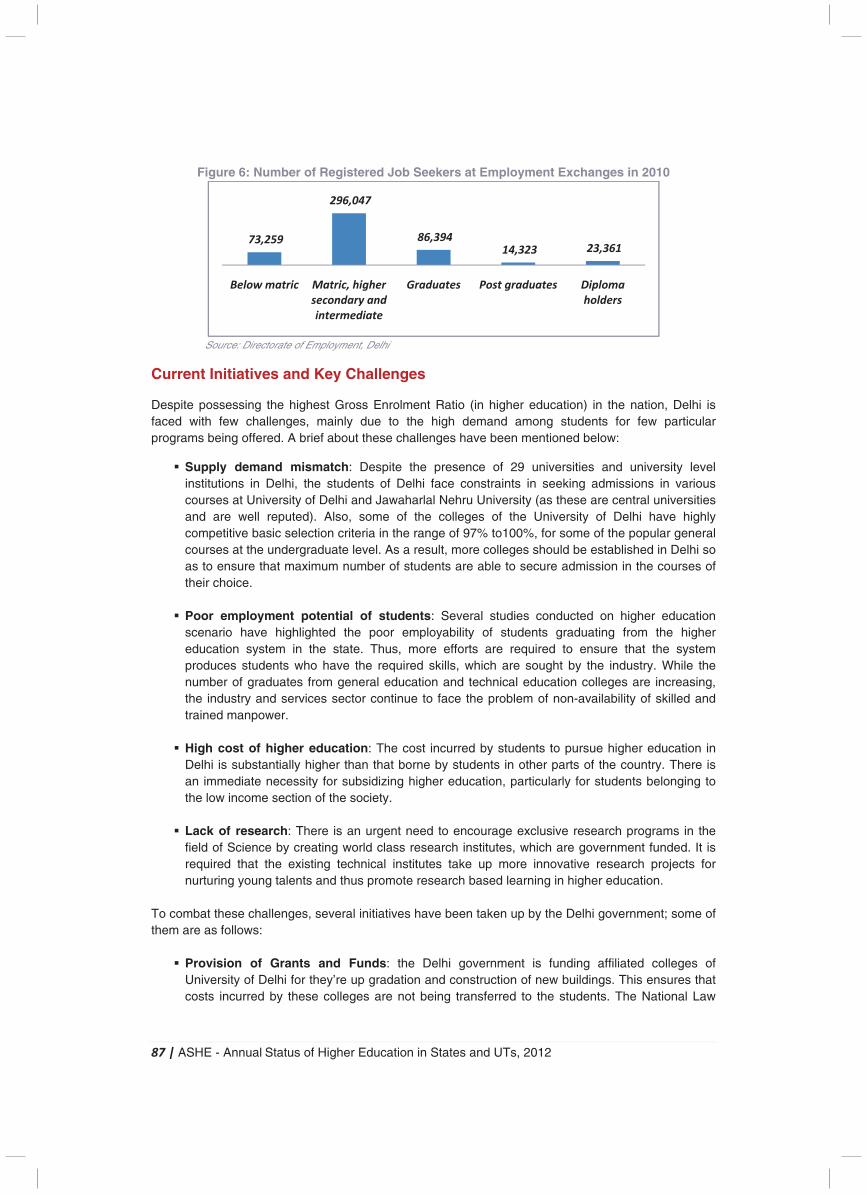
87 | ASHE - Annual Status of Higher Education in States and UTs, 2012
Figure 6: Number of Registered Job Seekers at Employment Exchanges in 2010
Source: Directorate of Employment, Delhi
Current Initiatives and Key Challenges
Despite possessing the highest Gross Enrolment Ratio (in higher education) in the nation, Delhi is faced with few challenges, mainly due to the high demand among students for few particular programs being offered. A brief about these challenges have been mentioned below:
� Supply demand mismatch: Despite the presence of 29 universities and university level institutions in Delhi, the students of Delhi face constraints in seeking admissions in various courses at University of Delhi and Jawaharlal Nehru University (as these are central universities and are well reputed). Also, some of the colleges of the University of Delhi have highly competitive basic selection criteria in the range of 97% to100%, for some of the popular general courses at the undergraduate level. As a result, more colleges should be established in Delhi so as to ensure that maximum number of students are able to secure admission in the courses of their choice.
� Poor employment potential of students: Several studies conducted on higher education
scenario have highlighted the poor employability of students graduating from the higher education system in the state. Thus, more efforts are required to ensure that the system produces students who have the required skills, which are sought by the industry. While the number of graduates from general education and technical education colleges are increasing, the industry and services sector continue to face the problem of non-availability of skilled and trained manpower.
� High cost of higher education: The cost incurred by students to pursue higher education in
Delhi is substantially higher than that borne by students in other parts of the country. There is an immediate necessity for subsidizing higher education, particularly for students belonging to the low income section of the society.
� Lack of research: There is an urgent need to encourage exclusive research programs in the
field of Science by creating world class research institutes, which are government funded. It is required that the existing technical institutes take up more innovative research projects for nurturing young talents and thus promote research based learning in higher education.
To combat these challenges, several initiatives have been taken up by the Delhi government; some of them are as follows:
� Provision of Grants and Funds: the Delhi government is funding affiliated colleges of University of Delhi for they’re up gradation and construction of new buildings. This ensures that costs incurred by these colleges are not being transferred to the students. The National Law
73,259
296,047
86,394 14,323 23,361
Below matric Matric, higher
secondary and
intermediate
Graduates Post graduates Diploma
holders
88 | ASHE - Annual Status of Higher Education in States and UTs, 2012
University, IIIT and Ambedkar University are also being provided with funds for their functioning and construction of their buildings.
� Establishment of Technical University for Women has been proposed in the current
financial year. � Re-organization of ITIs: To combat the problem of employability, the Delhi Skill Development
Mission has been constituted and a number of ITIs have been re-organized as ‘Centres of Excellence’ in various fields like electrical engineering, automobile engineering, mechanical engineering, construction and hospitality. Introduction of skill oriented and professional courses has been advised both in technical education institutes and general education institutes.
� Increase in intake capacity of general and technical colleges in government institutions. � Revitalization of polytechnics and engineering colleges by promoting industry linkages.

8
S
89 |
Sta
| AS
ate
SHE
e F
E -
Fo
An
oc
nnu
us
al S
s:
Ca
To
To
Po
Nu
Lit
Se
Sta(In
Pe
Stat
Go
apit
otal
otal
opu
umb
tera
ex R
aten Rs
er c
tus
oa
tal
Ar
Po
ulat
ber
acy
Rat
e Dos. C
cap
of
a
rea
opu
tion
r of
y Ra
tio (
omCro
ita
Hig
(in
ulat
n D
f Di
ate
(pe
mestore)
inc
ghe
n sq
tion
ens
istr
e (%
er 1
tic )
com
er E
q. k
n
sity
rict
%)
,00
Pro
me,
Edu
km.
y (p
s
00 m
odu
, 20
cat
.)
per
ma
uct
009
tion
Sta
sq
les
, 20
9-10
n in
ate
q. k
s)
009
0 (R
Sta
Pr
m.)
9-10
Rs.)
ates
ofi
)
0
)
s a
le
nd
UT
Ts, 2
14
1
201
Pa
37
4,5
3
87
9
22
1,32
12
ana
702
57,7
394
2
7.4
968
,28
2,7
aji
2
723
4
83
19
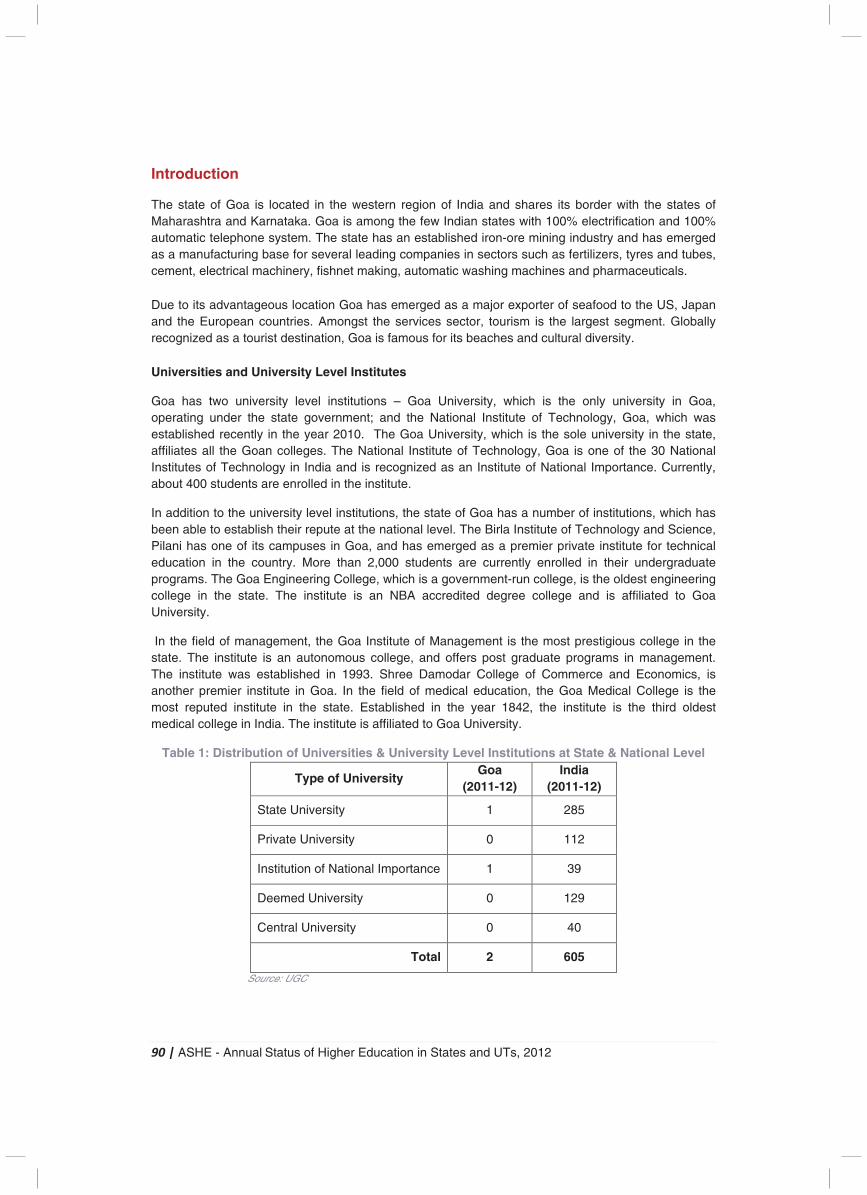
90 | ASHE - Annual Status of Higher Education in States and UTs, 2012
Introduction
The state of Goa is located in the western region of India and shares its border with the states of Maharashtra and Karnataka. Goa is among the few Indian states with 100% electrification and 100% automatic telephone system. The state has an established iron-ore mining industry and has emerged as a manufacturing base for several leading companies in sectors such as fertilizers, tyres and tubes, cement, electrical machinery, fishnet making, automatic washing machines and pharmaceuticals.
Due to its advantageous location Goa has emerged as a major exporter of seafood to the US, Japan and the European countries. Amongst the services sector, tourism is the largest segment. Globally recognized as a tourist destination, Goa is famous for its beaches and cultural diversity.
Universities and University Level Institutes
Goa has two university level institutions – Goa University, which is the only university in Goa, operating under the state government; and the National Institute of Technology, Goa, which was established recently in the year 2010. The Goa University, which is the sole university in the state, affiliates all the Goan colleges. The National Institute of Technology, Goa is one of the 30 National Institutes of Technology in India and is recognized as an Institute of National Importance. Currently, about 400 students are enrolled in the institute.
In addition to the university level institutions, the state of Goa has a number of institutions, which has been able to establish their repute at the national level. The Birla Institute of Technology and Science, Pilani has one of its campuses in Goa, and has emerged as a premier private institute for technical education in the country. More than 2,000 students are currently enrolled in their undergraduate programs. The Goa Engineering College, which is a government-run college, is the oldest engineering college in the state. The institute is an NBA accredited degree college and is affiliated to Goa University.
In the field of management, the Goa Institute of Management is the most prestigious college in the state. The institute is an autonomous college, and offers post graduate programs in management. The institute was established in 1993. Shree Damodar College of Commerce and Economics, is another premier institute in Goa. In the field of medical education, the Goa Medical College is the most reputed institute in the state. Established in the year 1842, the institute is the third oldest medical college in India. The institute is affiliated to Goa University.
Table 1: Distribution of Universities & University Level Institutions at State & National Level
Type of University Goa
(2011-12) India
(2011-12)
State University 1 285
Private University 0 112
Institution of National Importance 1 39
Deemed University 0 129
Central University 0 40
Total 2 605
Source: UGC
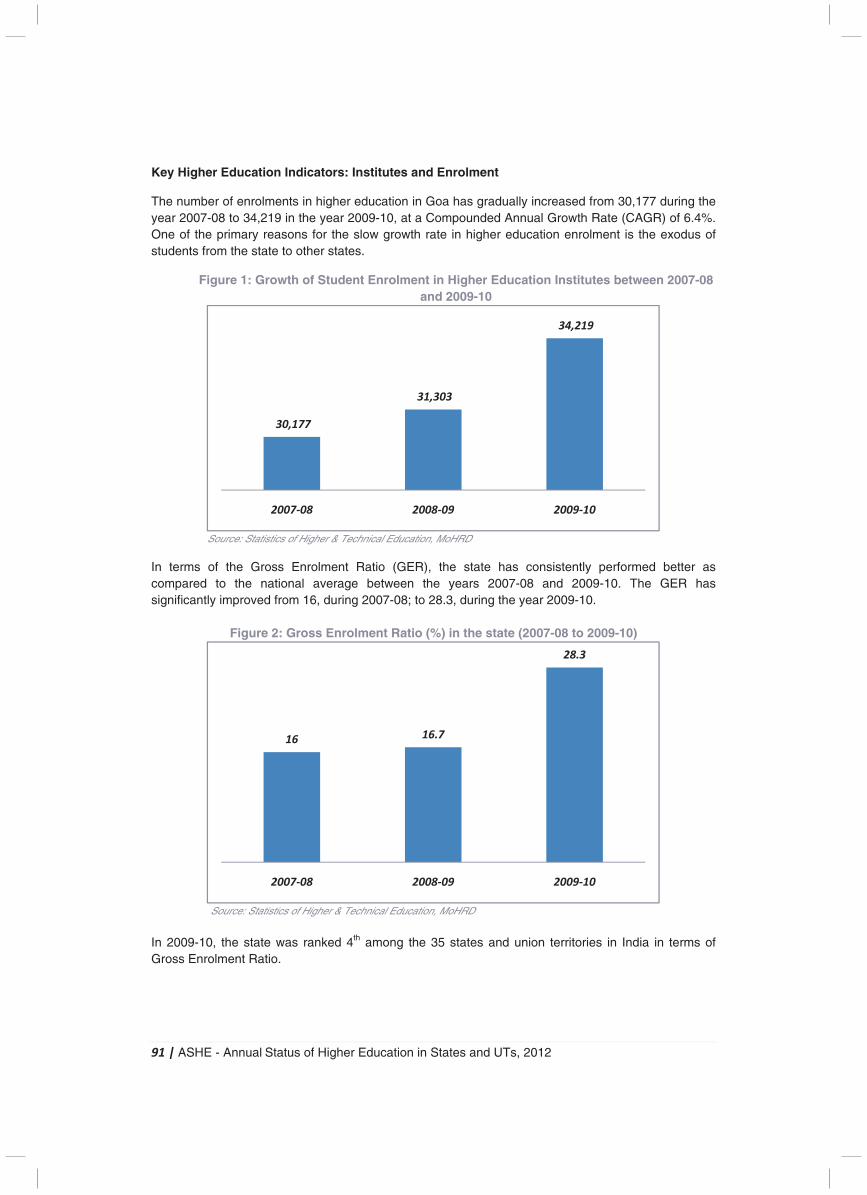
91 | ASHE - Annual Status of Higher Education in States and UTs, 2012
Key Higher Education Indicators: Institutes and Enrolment
The number of enrolments in higher education in Goa has gradually increased from 30,177 during the year 2007-08 to 34,219 in the year 2009-10, at a Compounded Annual Growth Rate (CAGR) of 6.4%. One of the primary reasons for the slow growth rate in higher education enrolment is the exodus of students from the state to other states.
Figure 1: Growth of Student Enrolment in Higher Education Institutes between 2007-08 and 2009-10
Source: Statistics of Higher & Technical Education, MoHRD
In terms of the Gross Enrolment Ratio (GER), the state has consistently performed better as compared to the national average between the years 2007-08 and 2009-10. The GER has significantly improved from 16, during 2007-08; to 28.3, during the year 2009-10.
Figure 2: Gross Enrolment Ratio (%) in the state (2007-08 to 2009-10)
Source: Statistics of Higher & Technical Education, MoHRD
In 2009-10, the state was ranked 4th among the 35 states and union territories in India in terms of Gross Enrolment Ratio.
30,177
31,303
34,219
2007-08 2008-09 2009-10
16 16.7
28.3
2007-08 2008-09 2009-10
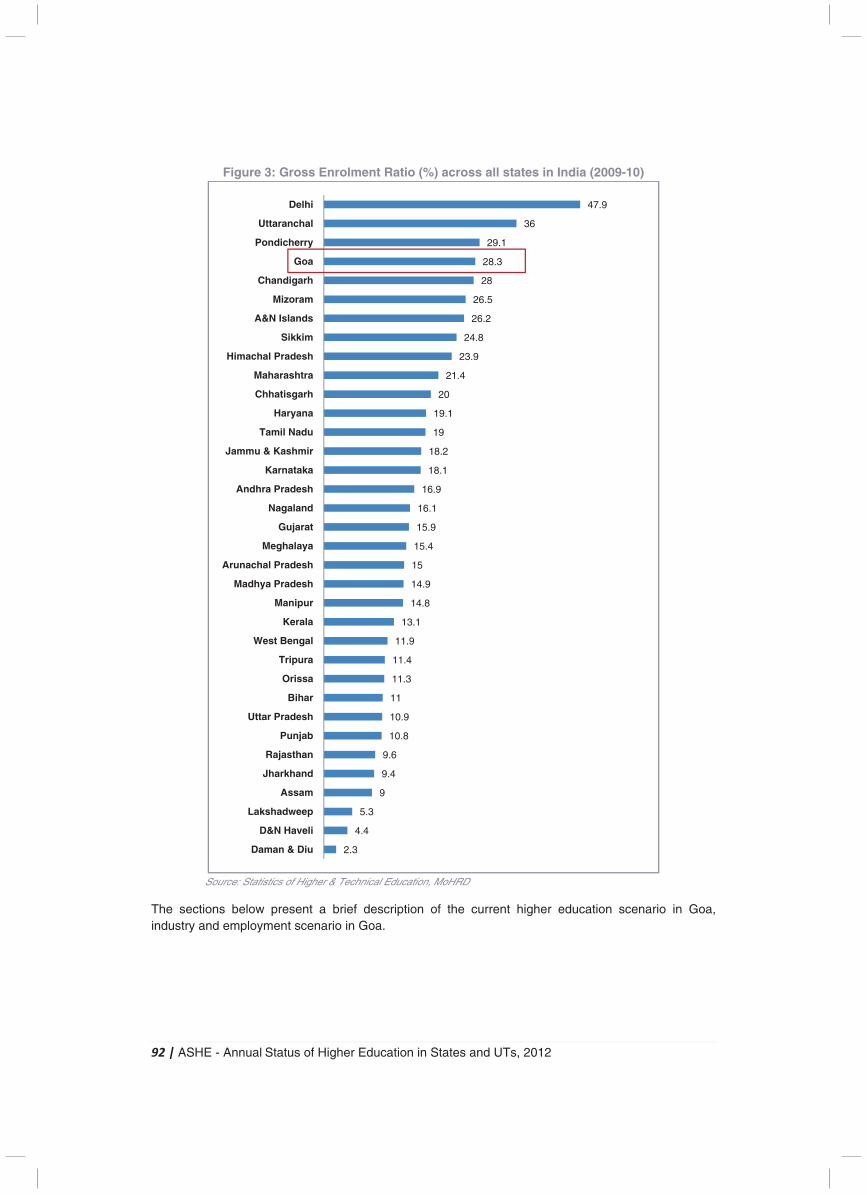
92 | ASHE - Annual Status of Higher Education in States and UTs, 2012
Figure 3: Gross Enrolment Ratio (%) across all states in India (2009-10)
Source: Statistics of Higher & Technical Education, MoHRD
The sections below present a brief description of the current higher education scenario in Goa, industry and employment scenario in Goa.
2.3
4.4
5.3
9
9.4
9.6
10.8
10.9
11
11.3
11.4
11.9
13.1
14.8
14.9
15
15.4
15.9
16.1
16.9
18.1
18.2
19
19.1
20
21.4
23.9
24.8
26.2
26.5
28
28.3
29.1
36
47.9
Daman & Diu
D&N Haveli
Lakshadweep
Assam
Jharkhand
Rajasthan
Punjab
Uttar Pradesh
Bihar
Orissa
Tripura
West Bengal
Kerala
Manipur
Madhya Pradesh
Arunachal Pradesh
Meghalaya
Gujarat
Nagaland
Andhra Pradesh
Karnataka
Jammu & Kashmir
Tamil Nadu
Haryana
Chhatisgarh
Maharashtra
Himachal Pradesh
Sikkim
A&N Islands
Mizoram
Chandigarh
Goa
Pondicherry
Uttaranchal
Delhi
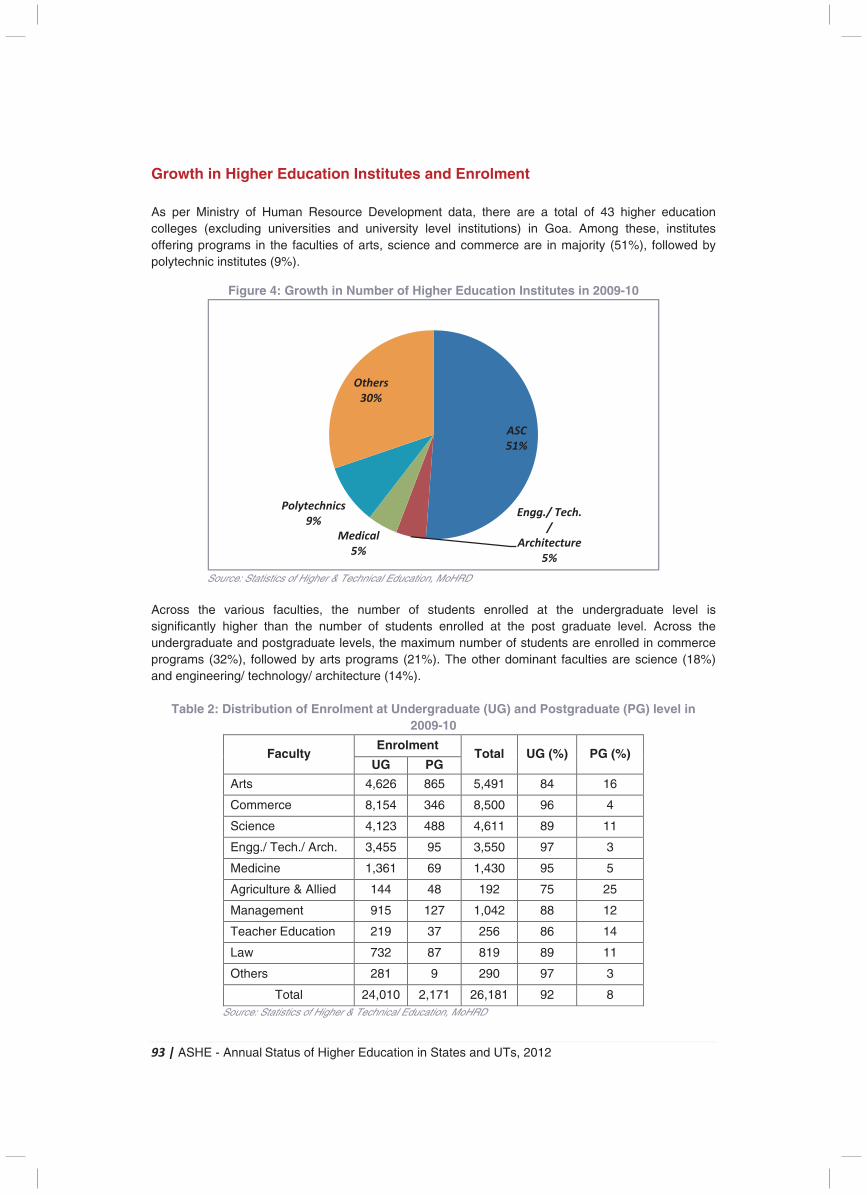
93 | ASHE - Annual Status of Higher Education in States and UTs, 2012
Growth in Higher Education Institutes and Enrolment As per Ministry of Human Resource Development data, there are a total of 43 higher education colleges (excluding universities and university level institutions) in Goa. Among these, institutes offering programs in the faculties of arts, science and commerce are in majority (51%), followed by polytechnic institutes (9%).
Figure 4: Growth in Number of Higher Education Institutes in 2009-10
Source: Statistics of Higher & Technical Education, MoHRD
Across the various faculties, the number of students enrolled at the undergraduate level is significantly higher than the number of students enrolled at the post graduate level. Across the undergraduate and postgraduate levels, the maximum number of students are enrolled in commerce programs (32%), followed by arts programs (21%). The other dominant faculties are science (18%) and engineering/ technology/ architecture (14%).
Table 2: Distribution of Enrolment at Undergraduate (UG) and Postgraduate (PG) level in 2009-10
Faculty Enrolment
Total UG (%) PG (%) UG PG
Arts 4,626 865 5,491 84 16
Commerce 8,154 346 8,500 96 4
Science 4,123 488 4,611 89 11
Engg./ Tech./ Arch. 3,455 95 3,550 97 3
Medicine 1,361 69 1,430 95 5
Agriculture & Allied 144 48 192 75 25
Management 915 127 1,042 88 12
Teacher Education 219 37 256 86 14
Law 732 87 819 89 11
Others 281 9 290 97 3
Total 24,010 2,171 26,181 92 8 Source: Statistics of Higher & Technical Education, MoHRD
ASC
51%
Engg./ Tech.
/
Architecture
5%
Medical
5%
Polytechnics
9%
Others
30%
94 | ASHE - Annual Status of Higher Education in States and UTs, 2012
Quality of Institutes
Goa University has undergone assessment by National Assessment and Accreditation Council (NAAC) and has been awarded a grade of B (Good). Amongst the higher education institutes, 9 institutes have been accredited by NAAC, with 4 institutes being awarded A rating (Very Good) and 4 institutes being awarded a rating of B (Good).
Industry and Employment Scenario
Key Industries43
Goa’s abundant reserves of iron-ore drive the mining industry in the state. Goa’s high rate of literacy has attracted knowledge-based industries such as pharmaceuticals, biotechnology and IT. Apart from having an established iron-ore mining industry, Goa has emerged as a manufacturing base for several leading companies in sectors such as fertilizers, tyres and tubes, cement, electrical machinery, fishnet making machines, automatic washing machines and printed circuit boards.
Tourism is another key revenue generator because of the inflow of international tourists. Moreover, a large percentage of the population can speak English, which helps the state’s tourism and IT enabled Services (ITeS) industries. The following section presents a brief description of the various key industries prevailing in the state currently.
1. IT / ITeS and Electronics Industries � Despite being a small state and a late starter in the IT industry, Goa is ideally placed to
capitalize on the opportunities available in IT. It is one of the most literate states in India, with a literacy rate of over 87 %. Most Goans are English speaking, as a result of which the state is a Good location for the ITeS industry. The state is close to several business centres of the country like Mumbai, Pune and Bangalore, which provides opportunities for growth.
� Some of the major IT players in Goa are Smartlink Network Systems, Zenith Computer, PCS Technology and Crompton Greaves.
2. Mining Industry � The mining belt of Goa covers an area of approximately 700 sq km and is mostly
concentrated in the 4 talukas of Bicholim, Salcete, Sanguem and Quepem. Mining (especially of iron-ore) along with tourism is an important industry. Prominent mining companies in the state are Sesa Goa, Dempo Group, V.M. Salgaocar & Company and V.S. Chowgule.
3. Pharmaceutical Industry � The state accounts for about one-tenth of India's pharmaceutical production. The
pharmaceuticals industry is one of the major employers in the state. � Apart from the incentives and policy thrust, Goa is preferred by leading pharmaceutical
companies because of its ambience and pollution free environment, which is conducive for the pharmaceuticals industry.
� A large number of companies such as Cipla, Aventis, and Blue Cross have set up manufacturing facilities in Goa.
4. Tourism Industry � Goa is a globally recognized tourist destination, famous for its beaches and cultural
diversity. A blend of Eastern and Western culture, friendly and hospitable people and the common use of English as a prominent language makes Goa a veritable tourist paradise.
43 India Brand Equity Foundation- Report on Goa, 2012
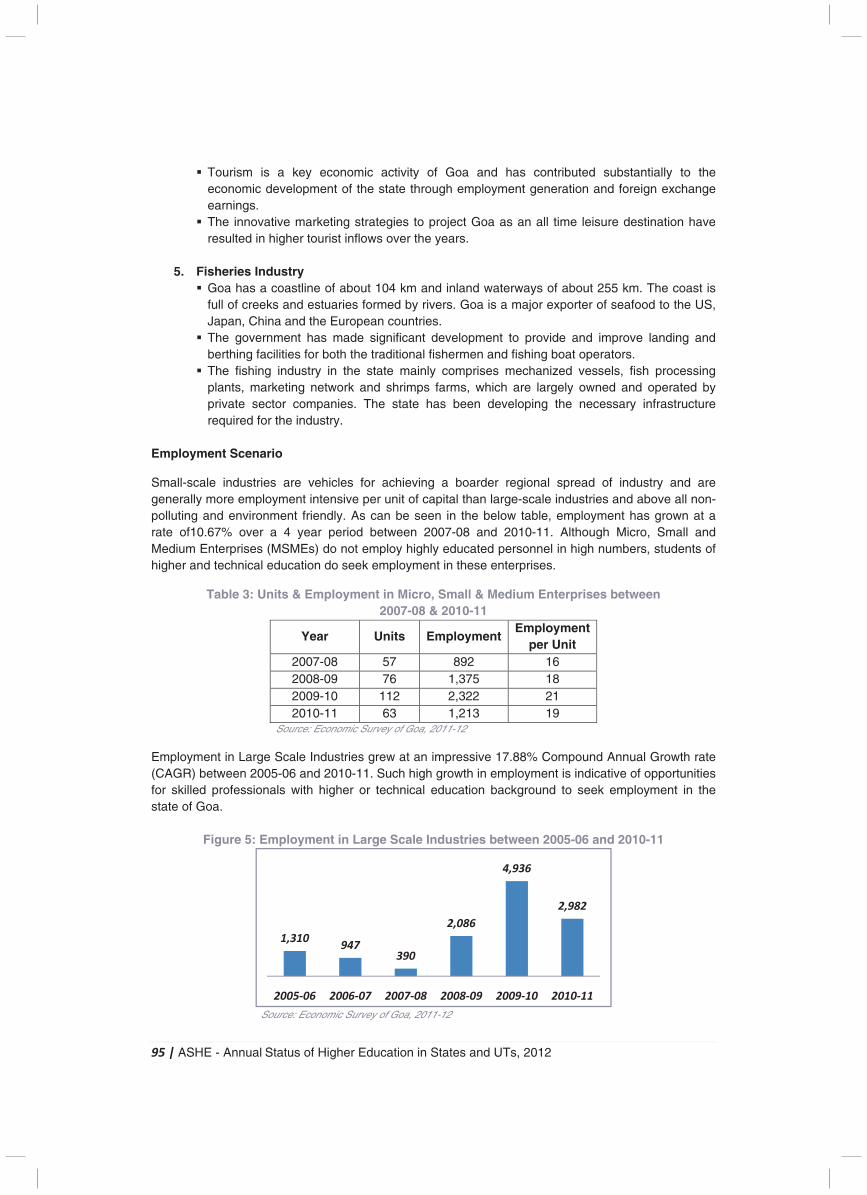
95 | ASHE - Annual Status of Higher Education in States and UTs, 2012
� Tourism is a key economic activity of Goa and has contributed substantially to the economic development of the state through employment generation and foreign exchange earnings.
� The innovative marketing strategies to project Goa as an all time leisure destination have resulted in higher tourist inflows over the years.
5. Fisheries Industry � Goa has a coastline of about 104 km and inland waterways of about 255 km. The coast is
full of creeks and estuaries formed by rivers. Goa is a major exporter of seafood to the US, Japan, China and the European countries.
� The government has made significant development to provide and improve landing and berthing facilities for both the traditional fishermen and fishing boat operators.
� The fishing industry in the state mainly comprises mechanized vessels, fish processing plants, marketing network and shrimps farms, which are largely owned and operated by private sector companies. The state has been developing the necessary infrastructure required for the industry.
Employment Scenario
Small-scale industries are vehicles for achieving a boarder regional spread of industry and are generally more employment intensive per unit of capital than large-scale industries and above all non-polluting and environment friendly. As can be seen in the below table, employment has grown at a rate of10.67% over a 4 year period between 2007-08 and 2010-11. Although Micro, Small and Medium Enterprises (MSMEs) do not employ highly educated personnel in high numbers, students of higher and technical education do seek employment in these enterprises.
Table 3: Units & Employment in Micro, Small & Medium Enterprises between 2007-08 & 2010-11
Year Units EmploymentEmployment
per Unit 2007-08 57 892 16 2008-09 76 1,375 18 2009-10 112 2,322 21 2010-11 63 1,213 19
Source: Economic Survey of Goa, 2011-12 Employment in Large Scale Industries grew at an impressive 17.88% Compound Annual Growth rate (CAGR) between 2005-06 and 2010-11. Such high growth in employment is indicative of opportunities for skilled professionals with higher or technical education background to seek employment in the state of Goa.
Figure 5: Employment in Large Scale Industries between 2005-06 and 2010-11
Source: Economic Survey of Goa, 2011-12
1,310947
390
2,086
4,936
2,982
2005-06 2006-07 2007-08 2008-09 2009-10 2010-11
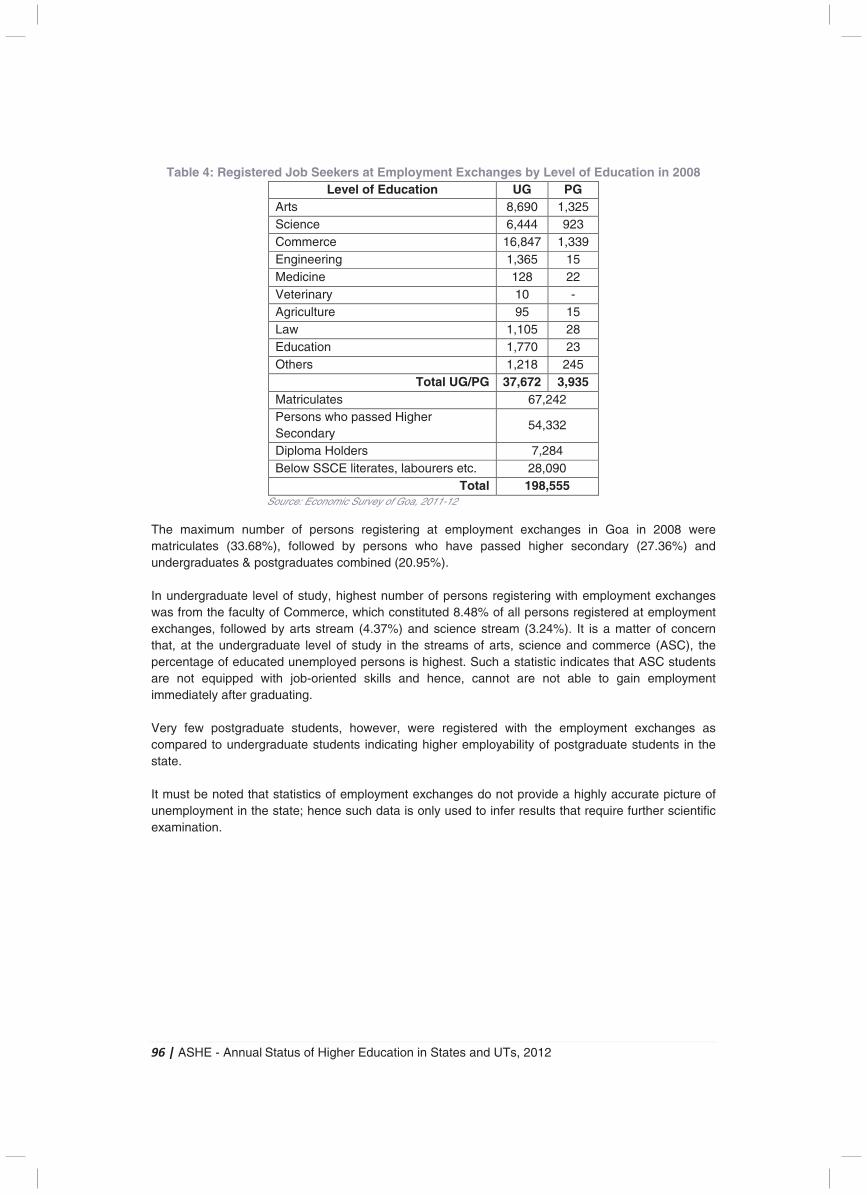
96 | ASHE - Annual Status of Higher Education in States and UTs, 2012
Table 4: Registered Job Seekers at Employment Exchanges by Level of Education in 2008 Level of Education UG PG
Arts 8,690 1,325 Science 6,444 923 Commerce 16,847 1,339 Engineering 1,365 15 Medicine 128 22 Veterinary 10 - Agriculture 95 15 Law 1,105 28 Education 1,770 23 Others 1,218 245
Total UG/PG 37,672 3,935 Matriculates 67,242 Persons who passed Higher Secondary
54,332
Diploma Holders 7,284 Below SSCE literates, labourers etc. 28,090
Total 198,555 Source: Economic Survey of Goa, 2011-12
The maximum number of persons registering at employment exchanges in Goa in 2008 were matriculates (33.68%), followed by persons who have passed higher secondary (27.36%) and undergraduates & postgraduates combined (20.95%). In undergraduate level of study, highest number of persons registering with employment exchanges was from the faculty of Commerce, which constituted 8.48% of all persons registered at employment exchanges, followed by arts stream (4.37%) and science stream (3.24%). It is a matter of concern that, at the undergraduate level of study in the streams of arts, science and commerce (ASC), the percentage of educated unemployed persons is highest. Such a statistic indicates that ASC students are not equipped with job-oriented skills and hence, cannot are not able to gain employment immediately after graduating. Very few postgraduate students, however, were registered with the employment exchanges as compared to undergraduate students indicating higher employability of postgraduate students in the state. It must be noted that statistics of employment exchanges do not provide a highly accurate picture of unemployment in the state; hence such data is only used to infer results that require further scientific examination.
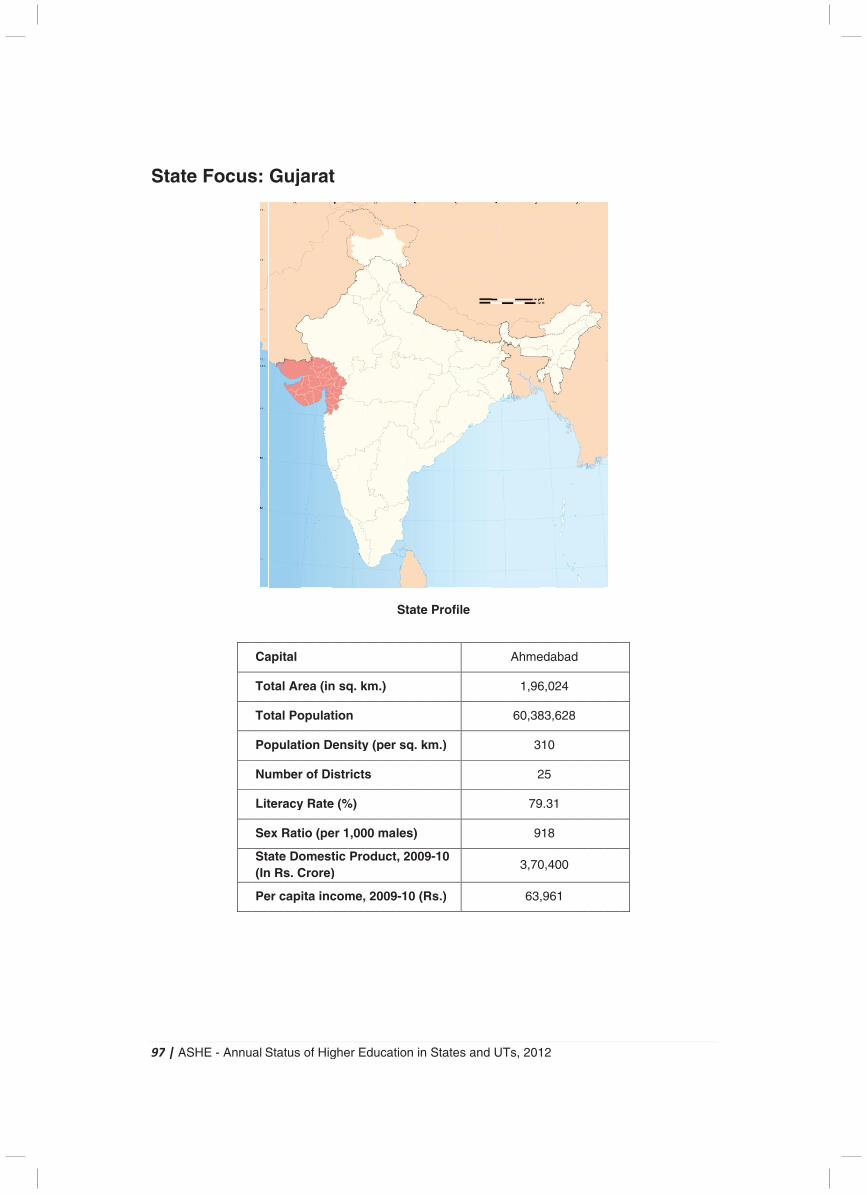
9
S
97 |
Sta
| AS
ate
SHE
e F
E -
Fo
An
oc
nnu
us
al S
s:
Ca
To
To
Po
Nu
Lit
Se
Sta(In
Pe
Stat
G
apit
otal
otal
opu
umb
tera
ex R
aten Rs
er c
tus
uj
tal
Ar
Po
ulat
ber
acy
Rat
e Dos. C
cap
of
ar
rea
opu
tion
r of
y Ra
tio (
omCro
ita
Hig
rat
(in
ulat
n D
f Di
ate
(pe
mestore)
inc
ghe
t
n sq
tion
ens
istr
e (%
er 1
tic )
com
er E
q. k
n
sity
rict
%)
,00
Pro
me,
Edu
km.
y (p
s
00 m
odu
, 20
cat
.)
per
ma
uct
009
tion
Sta
sq
les
, 20
9-10
n in
ate
q. k
s)
009
0 (R
Sta
Pr
m.)
9-10
Rs.)
ates
ofi
)
0
)
s a
le
nd
UT
Ts, 2
Ah
1
60
3
201
hme
1,96
0,38
3
2
79
9
3,70
63
12
eda
6,02
83,6
310
25
9.31
918
0,40
,96
abad
24
628
1
00
61
d
8
98 | ASHE - Annual Status of Higher Education in States and UTs, 2012
Introduction
Strategically located on the west coast of India, Gujarat is the gateway to the rich land-locked northern and centre vicinity of the country. The state of Gujarat accounts for about 30 per cent of India’s stock market capitalisation, 22% of exports and 9.5% of the workforce.
Over the last decade, the state has not only emerged as the hub of industrial and investment development but has also accelerated the pace of development of knowledge by envisioning, initiating and implementing progressive steps and initiatives in higher education. This is reflected in the state’s goal to create a widespread network of educational institutions to make Gujarat a globally recognized knowledge society, as mentioned in the state’s vision document: Blueprint for Infrastructure in Gujarat-2020 (BIG 2020).
Universities and University Level Institutes
20 state universities, 15 private universities, 2 deemed universities and 1 central university characterize the higher education landscape of Gujarat. In addition to these universities, there are 8 institutes of national importance located in the state. Universities like Gujarat University, Veer Narmad South Gujarat University, Maharaja Sayajirao University of Baroda and Sardar Patel University have been existent for more than fifty years. Together, these universities and institutes of national importance constitute 7.6% of the total number of universities and university level institutions in India.
Table 1: Distribution of Universities & University Level Institutions at State & National Level
Type of University Gujarat
(2011-12) India
(2011-12)
State University 20 285
Private University 15 112
Institution of National Importance 8 39
Deemed University 2 129
Central University 1 40
Total 46 605
Source: UGC
Gujarat is home to several reputed institutes across areas of management, fashion and design, engineering, architecture, pharmaceutical studies and petroleum studies. Ahmedabad, which is the former state capital and the largest city of Gujarat, houses several centres of excellence such as the Indian Institute of Management (IIM) – which is considered to be one of the best management schools in India, and the Physics Research Laboratory. The Sardar Vallabhai National Institute of Technology, another premier institute in India for engineering is located in the second largest city of Gujarat, Surat. Premier institutes such as Center of Environmental Planning & Technology (CEPT) – considered to be one of the best architectural schools in India; and the National Institute of Design (NID), which is reputed to be one of the internationally acclaimed multi-disciplinary institutions in the field of design education and research are located in the state capital Gandhinagar.
Leading management schools like Institute of Rural Management, Anand; which is one of the leading institutes in rural management in India and Mudra Institute of Communications, Ahmedabad; which is India’s premier communications management institute are also situated in Gujarat. Other nationally reputed institutes include the National Institute of Pharmaceutical Education and Research (pharmaceutical studies), and Pandit Deendayal Petroleum University (petroleum studies). During the
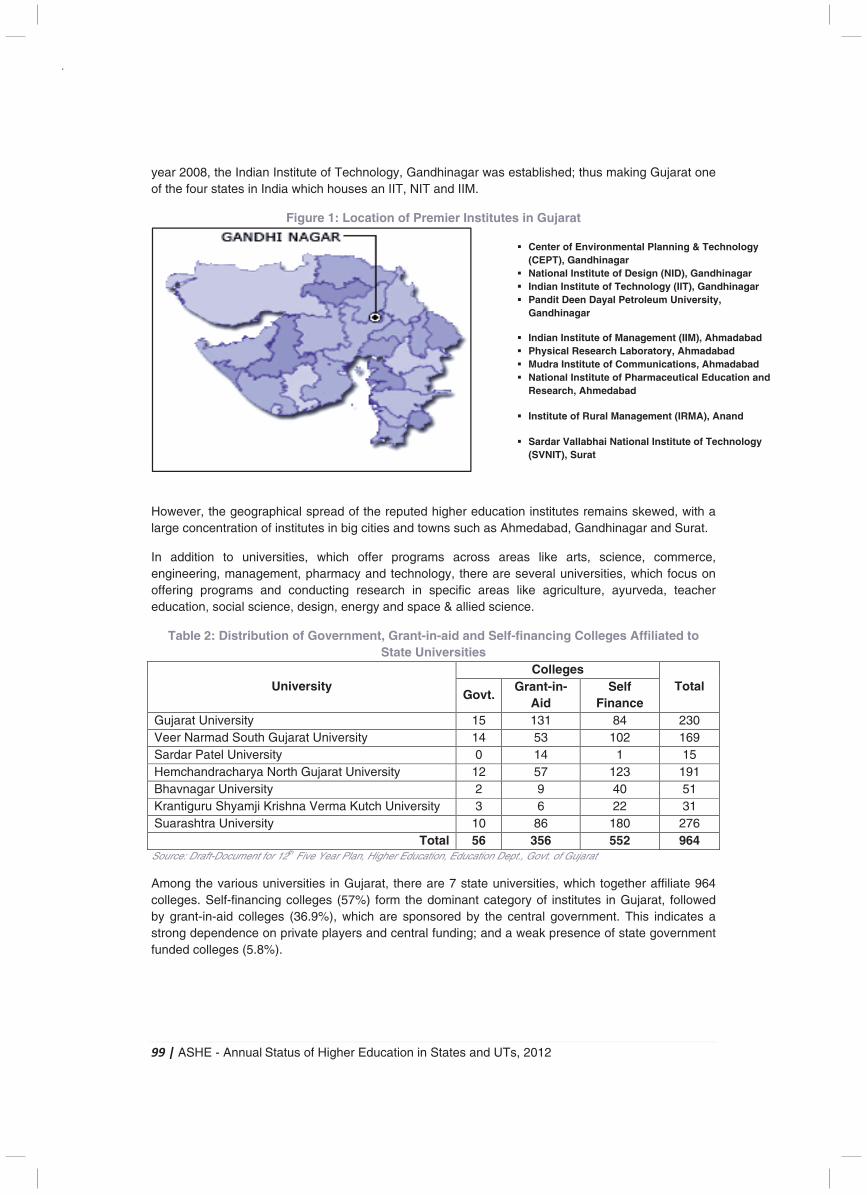
99 | ASHE - Annual Status of Higher Education in States and UTs, 2012
year 2008, the Indian Institute of Technology, Gandhinagar was established; thus making Gujarat one of the four states in India which houses an IIT, NIT and IIM.
Figure 1: Location of Premier Institutes in Gujarat
However, the geographical spread of the reputed higher education institutes remains skewed, with a large concentration of institutes in big cities and towns such as Ahmedabad, Gandhinagar and Surat.
In addition to universities, which offer programs across areas like arts, science, commerce, engineering, management, pharmacy and technology, there are several universities, which focus on offering programs and conducting research in specific areas like agriculture, ayurveda, teacher education, social science, design, energy and space & allied science.
Table 2: Distribution of Government, Grant-in-aid and Self-financing Colleges Affiliated to State Universities
University Colleges
Total Govt.
Grant-in-Aid
Self Finance
Gujarat University 15 131 84 230 Veer Narmad South Gujarat University 14 53 102 169 Sardar Patel University 0 14 1 15 Hemchandracharya North Gujarat University 12 57 123 191 Bhavnagar University 2 9 40 51 Krantiguru Shyamji Krishna Verma Kutch University 3 6 22 31 Suarashtra University 10 86 180 276
Total 56 356 552 964 Source: Draft-Document for 12th Five Year Plan, Higher Education, Education Dept., Govt. of Gujarat
Among the various universities in Gujarat, there are 7 state universities, which together affiliate 964 colleges. Self-financing colleges (57%) form the dominant category of institutes in Gujarat, followed by grant-in-aid colleges (36.9%), which are sponsored by the central government. This indicates a strong dependence on private players and central funding; and a weak presence of state government funded colleges (5.8%).
� Center of Environmental Planning & Technology (CEPT), Gandhinagar
� National Institute of Design (NID), Gandhinagar
� Indian Institute of Technology (IIT), Gandhinagar
� Pandit Deen Dayal Petroleum University, Gandhinagar
� Indian Institute of Management (IIM), Ahmadabad � Physical Research Laboratory, Ahmadabad � Mudra Institute of Communications, Ahmadabad � National Institute of Pharmaceutical Education and
Research, Ahmedabad
� Institute of Rural Management (IRMA), Anand
� Sardar Vallabhai National Institute of Technology (SVNIT), Surat
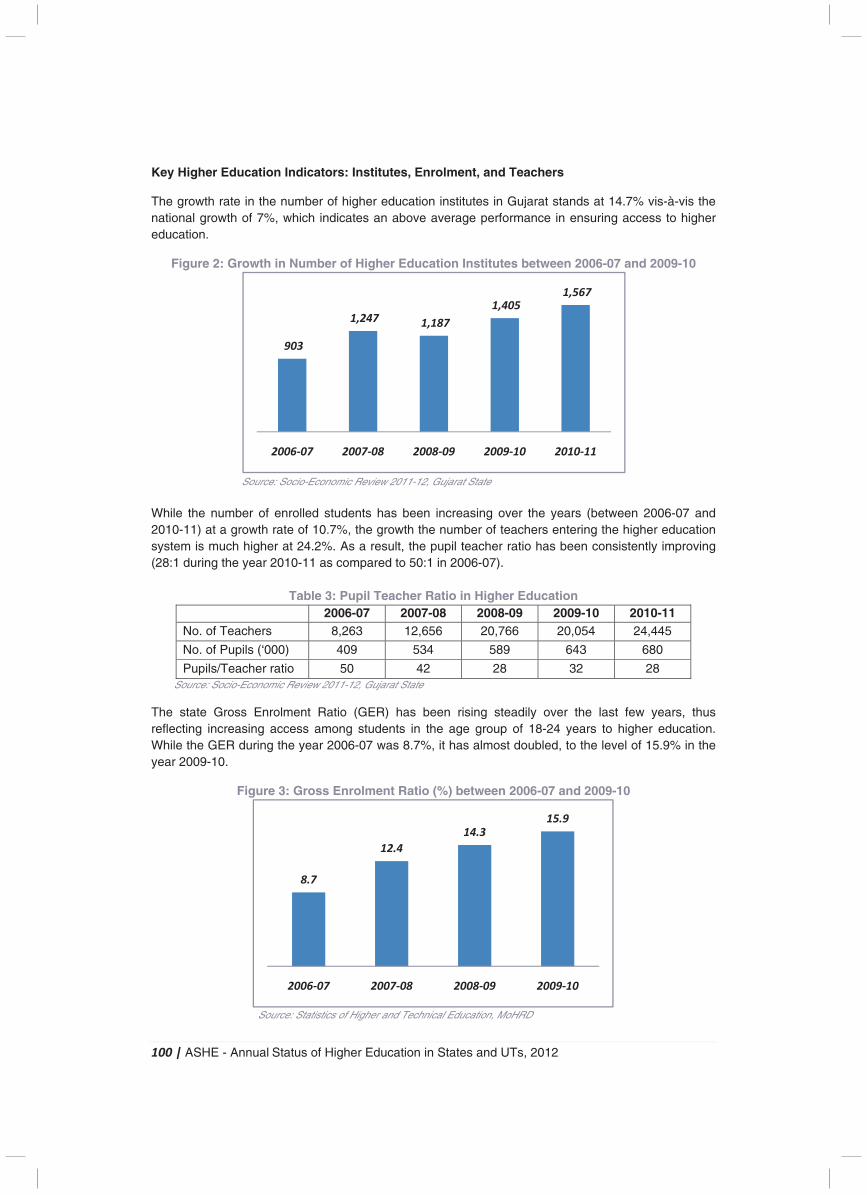
100 | ASHE - Annual Status of Higher Education in States and UTs, 2012
Key Higher Education Indicators: Institutes, Enrolment, and Teachers
The growth rate in the number of higher education institutes in Gujarat stands at 14.7% vis-à-vis the national growth of 7%, which indicates an above average performance in ensuring access to higher education.
Figure 2: Growth in Number of Higher Education Institutes between 2006-07 and 2009-10
Source: Socio-Economic Review 2011-12, Gujarat State
While the number of enrolled students has been increasing over the years (between 2006-07 and 2010-11) at a growth rate of 10.7%, the growth the number of teachers entering the higher education system is much higher at 24.2%. As a result, the pupil teacher ratio has been consistently improving (28:1 during the year 2010-11 as compared to 50:1 in 2006-07).
Table 3: Pupil Teacher Ratio in Higher Education 2006-07 2007-08 2008-09 2009-10 2010-11 No. of Teachers 8,263 12,656 20,766 20,054 24,445
No. of Pupils (‘000) 409 534 589 643 680
Pupils/Teacher ratio 50 42 28 32 28 Source: Socio-Economic Review 2011-12, Gujarat State
The state Gross Enrolment Ratio (GER) has been rising steadily over the last few years, thus reflecting increasing access among students in the age group of 18-24 years to higher education. While the GER during the year 2006-07 was 8.7%, it has almost doubled, to the level of 15.9% in the year 2009-10.
Figure 3: Gross Enrolment Ratio (%) between 2006-07 and 2009-10
Source: Statistics of Higher and Technical Education, MoHRD
903
1,247 1,187
1,405 1,567
2006-07 2007-08 2008-09 2009-10 2010-11
8.7
12.4
14.315.9
2006-07 2007-08 2008-09 2009-10
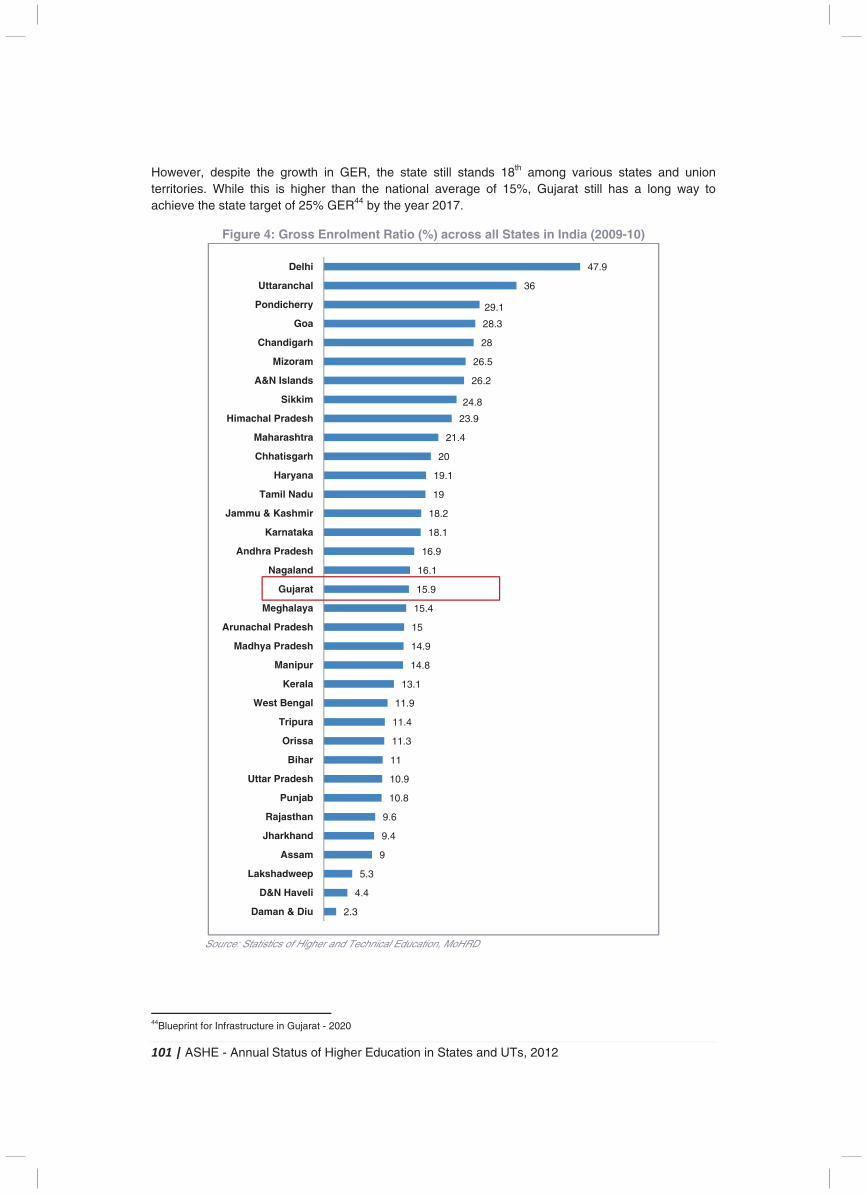
101 | ASHE - Annual Status of Higher Education in States and UTs, 2012
However, despite the growth in GER, the state still stands 18th among various states and union territories. While this is higher than the national average of 15%, Gujarat still has a long way to achieve the state target of 25% GER44 by the year 2017.
Figure 4: Gross Enrolment Ratio (%) across all States in India (2009-10)
Source: Statistics of Higher and Technical Education, MoHRD
44Blueprint for Infrastructure in Gujarat - 2020
2.3
4.4
5.3
9
9.4
9.6
10.8
10.9
11
11.3
11.4
11.9
13.1
14.8
14.9
15
15.4
15.9
16.1
16.9
18.1
18.2
19
19.1
20
21.4
23.9
24.8
26.2
26.5
28
28.3
29.1
36
47.9
Daman & Diu
D&N Haveli
Lakshadweep
Assam
Jharkhand
Rajasthan
Punjab
Uttar Pradesh
Bihar
Orissa
Tripura
West Bengal
Kerala
Manipur
Madhya Pradesh
Arunachal Pradesh
Meghalaya
Gujarat
Nagaland
Andhra Pradesh
Karnataka
Jammu & Kashmir
Tamil Nadu
Haryana
Chhatisgarh
Maharashtra
Himachal Pradesh
Sikkim
A&N Islands
Mizoram
Chandigarh
Goa
Pondicherry
Uttaranchal
Delhi

102 | ASHE - Annual Status of Higher Education in States and UTs, 2012
The below sections present a brief description of the current higher education scenario in Gujarat, the industry and employment scenario in Gujarat, and the key initiatives and challenges in higher education that are being addressed by the state.
Growth in Higher Education Institutes and Enrolment At a national level, the dominant programs that are being offered in higher education are in the areas of arts, science and commerce. The same trend is reflected in Gujarat as well, with 41% of the total number of institutes offering programs in arts, science and commerce. Institutes offering programs in teacher education (18%) and engineering/technology/architecture (8%) fall in the second and third major categories.
Figure 5: Distribution of Number of Institutes Based on Faculty (2009-10)
Source: Statistics of Higher and Technical Education, MoHRD
The maximum growth in the number of institutes between the years 2006-07 and 2009-10 has been in the fields of engineering/technology/architecture, with a CAGR of 22.1%; followed by polytechnic institutes (15.5%). Thus, there has been a strong impetus on promoting education in field of engineering at both degree and diploma level. On the other hand, the number of institutes offering programs in the area of teacher education has declined (-7.96%).
Figure 6: Faculty-wise Growth in Number of Institutes between 2006-07 and 2009-10
Source: Statistics of Higher and Technical Education, MoHRD
(1.9%)
(22.1%) (6.08%)
(-7.96%)
(15.5%)
ASC
41%
Engg./Technolog
y/Architecture
8%Medical
8%
Teacher
education
18%
Polytechnics
8%
Others
17%
535
4990
354
59 73
577
109 114
254
105
244
2006-07 2009-10
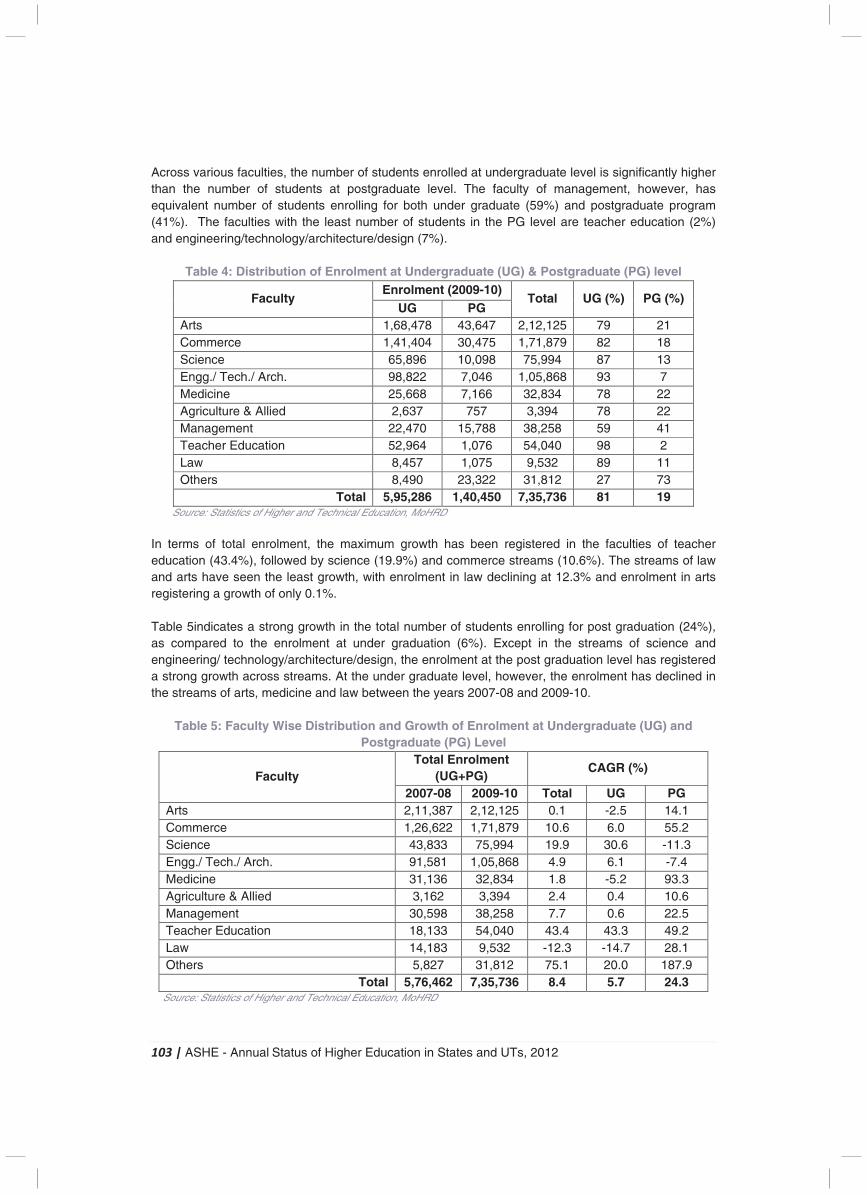
103 | ASHE - Annual Status of Higher Education in States and UTs, 2012
Across various faculties, the number of students enrolled at undergraduate level is significantly higher than the number of students at postgraduate level. The faculty of management, however, has equivalent number of students enrolling for both under graduate (59%) and postgraduate program (41%). The faculties with the least number of students in the PG level are teacher education (2%) and engineering/technology/architecture/design (7%).
Table 4: Distribution of Enrolment at Undergraduate (UG) & Postgraduate (PG) level
Faculty Enrolment (2009-10)
Total UG (%) PG (%) UG PG
Arts 1,68,478 43,647 2,12,125 79 21 Commerce 1,41,404 30,475 1,71,879 82 18 Science 65,896 10,098 75,994 87 13 Engg./ Tech./ Arch. 98,822 7,046 1,05,868 93 7 Medicine 25,668 7,166 32,834 78 22 Agriculture & Allied 2,637 757 3,394 78 22 Management 22,470 15,788 38,258 59 41 Teacher Education 52,964 1,076 54,040 98 2 Law 8,457 1,075 9,532 89 11 Others 8,490 23,322 31,812 27 73
Total 5,95,286 1,40,450 7,35,736 81 19 Source: Statistics of Higher and Technical Education, MoHRD
In terms of total enrolment, the maximum growth has been registered in the faculties of teacher education (43.4%), followed by science (19.9%) and commerce streams (10.6%). The streams of law and arts have seen the least growth, with enrolment in law declining at 12.3% and enrolment in arts registering a growth of only 0.1%. Table 5indicates a strong growth in the total number of students enrolling for post graduation (24%), as compared to the enrolment at under graduation (6%). Except in the streams of science and engineering/ technology/architecture/design, the enrolment at the post graduation level has registered a strong growth across streams. At the under graduate level, however, the enrolment has declined in the streams of arts, medicine and law between the years 2007-08 and 2009-10.
Table 5: Faculty Wise Distribution and Growth of Enrolment at Undergraduate (UG) and Postgraduate (PG) Level
Faculty Total Enrolment
(UG+PG) CAGR (%)
2007-08 2009-10 Total UG PG Arts 2,11,387 2,12,125 0.1 -2.5 14.1 Commerce 1,26,622 1,71,879 10.6 6.0 55.2 Science 43,833 75,994 19.9 30.6 -11.3 Engg./ Tech./ Arch. 91,581 1,05,868 4.9 6.1 -7.4 Medicine 31,136 32,834 1.8 -5.2 93.3 Agriculture & Allied 3,162 3,394 2.4 0.4 10.6 Management 30,598 38,258 7.7 0.6 22.5 Teacher Education 18,133 54,040 43.4 43.3 49.2 Law 14,183 9,532 -12.3 -14.7 28.1 Others 5,827 31,812 75.1 20.0 187.9
Total 5,76,462 7,35,736 8.4 5.7 24.3 Source: Statistics of Higher and Technical Education, MoHRD
104 | ASHE - Annual Status of Higher Education in States and UTs, 2012
Quality of Institutes
Among the 278 higher education colleges, which have been accredited by the National Assessment and Accreditation Council, only 2.5% of the colleges have been rated A (Very Good). 73% of the institutes have been rated B (Good) and 24% of the institutes have been rated C (Satisfactory). 45
Industry and Employment Scenario
Key Industries46
The significance of higher education becomes more prominent in a state like Gujarat, which contributes to roughly 15% of the total industrial output of the country. With a vision to attract an investment of Rs 11.8 lakh crore across 19 sectors by 202047 , it is of utmost importance that employable talent is being churned out in greater quantity than what is currently being produced. At the national level, Gujarat is a leader in several industrial sectors such as chemicals, petrochemicals, dairy, drugs and pharmaceuticals, cement and ceramics, gems and jewellery, textiles and engineering. A brief overview of the various key industries in Gujarat is as given below:
1. Agro and Food Processing � The agro sector including animal husbandry, contributed 13.8% to Gujarat’s GSDP in 2009-
10. � There are around 13,761 milk co-operative societies in the state. � Key players: Amul, Parle Products Pvt Ltd, Vadilal and Rasna.
2. Chemicals and Petrochemicals � Gujarat contributed about 51% to the national production of chemicals in 2010-11. It is the
highest contributor to the national production of petrochemical products. � Key players: Asian Paints Ltd, Tata Chemicals Ltd, Gujarat State Fertilisers and Chemicals
Ltd and Excel Industries Ltd.
3. Textiles and Apparels � Gujarat is the largest producer (35%) and exporter (60%) of cotton in the country. � Over 40% of the country’s art-silk fabric is produced in Surat. Gujarat is the largest producer
of denim in India (65 to 70%) and the third largest in the world. � Textiles account for 21% of total employment in the state. � Key players: Arvind Ltd, Ashima Group, Digjam Ltd and Raymond Ltd.
4. Engineering and Auto
� The state’s engineering and automotive sectors contribute 8% to India’s total industrial production and over 9% to the national engineering output.
� Small-scale industry is a significant contributor to the national production of brass parts, foundry, forging and machine tools, oil engines and electric motors, submersible pumps and industrial valves and bearings.
� Key players: ABB, Larsen & Toubro (L&T), General Motors and Panasonic.
5. Gems and Jewellery � Gujarat accounts for 72% of the world’s share of processed diamonds and 80% of total
diamonds processed in India. � It contributes 90% to the total diamonds processed in India in 10,000 units, located in Surat. � 8 out of 10 diamonds in the world are polished in Surat.
45National Accreditation and Assessment Council 46India Brand Equity Foundation – State report on Gujarat 47Blueprint for Infrastructure in Gujarat - 2020
105 | ASHE - Annual Status of Higher Education in States and UTs, 2012
� The state has the highest labour productivity in the jewellery sector in India. � Renowned institutions such as the Indian Diamond Institute, Gujarat Hira Bourse, and the
Gems and Jewellery Export Promotion Council provide skilled manpower for the industry.
6. Oil and Gas � Gujarat ranks first in the production of crude oil (onshore: 53%) and natural gas (onshore:
31%) in India. � The state has the highest number of oil and gas fields, both onshore and offshore, in India
(31.3%). � Nearly 36.6% of India’s installed refining capacity is in the state of Gujarat. � Key players: Cairn India, IOCL (Indian Oil Corporation Limited), ONGC (Oil and Natural Gas
Corporation Limited) and Shell.
7. Pharmaceuticals and Biotechnology � Gujarat accounted for 35% of the national pharmaceutical production and around 22% of
pharma exports in 2010-11. � It has the largest number of clinical research organisations in India and over 100 companies
with WHO-compliant manufacturing units. � Key players: Sun Pharma, Bayer Crop science, Quintles, Zydus Cadilla.
8. Ports
� The infrastructure available for development of the shipbuilding industry includes: � Availability of raw materials such as ship building plates and engines � Stillness of water and deep draft � Proximity to ancillary industries � Sufficient anchorage space
� There are several shipyards present in Gujarat such as ABG Shipyard, Alcock Ashdown and Vipul Shipyard.
9. Tourism
� 8 tourism hubs have been created for the convenience of tourists visiting Gujarat. � In 2010-11, around 19.8 million tourists visited the state.
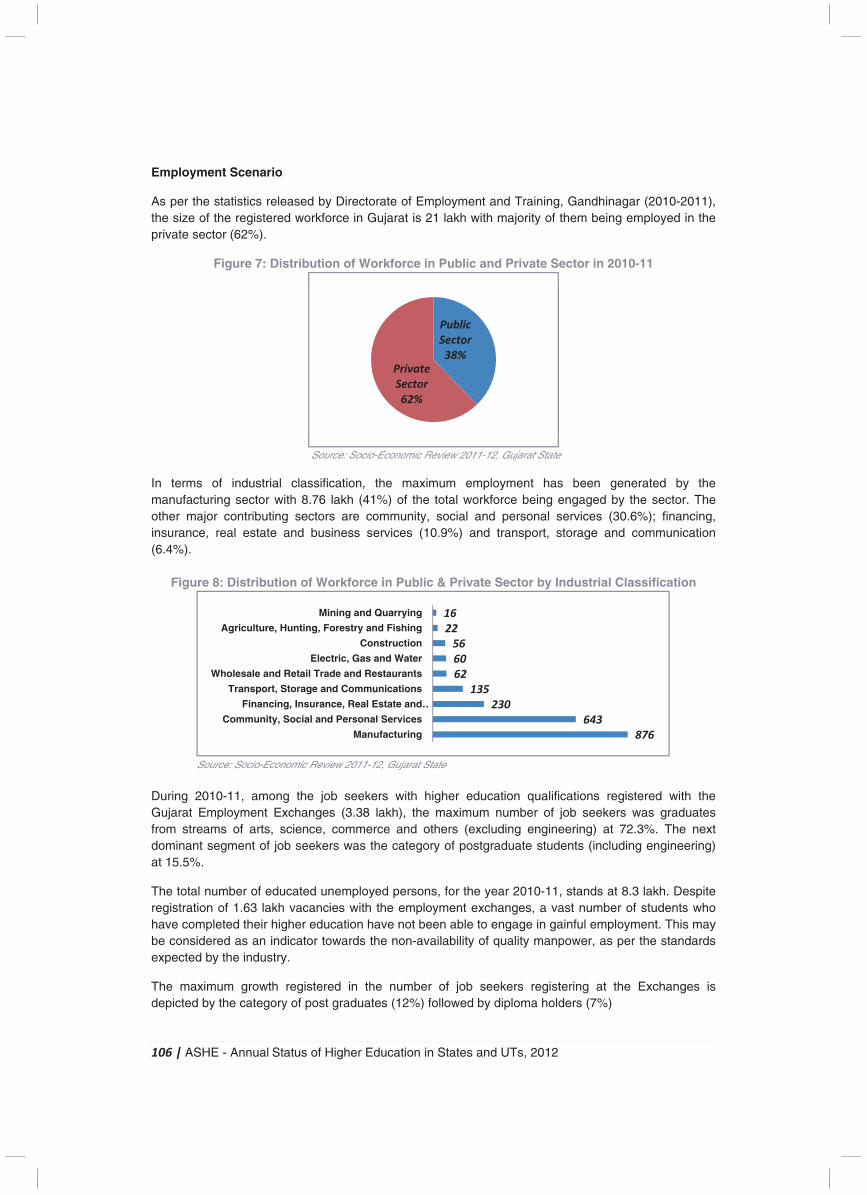
106 | ASHE - Annual Status of Higher Education in States and UTs, 2012
Employment Scenario
As per the statistics released by Directorate of Employment and Training, Gandhinagar (2010-2011), the size of the registered workforce in Gujarat is 21 lakh with majority of them being employed in the private sector (62%).
Figure 7: Distribution of Workforce in Public and Private Sector in 2010-11
Source: Socio-Economic Review 2011-12, Gujarat State
In terms of industrial classification, the maximum employment has been generated by the manufacturing sector with 8.76 lakh (41%) of the total workforce being engaged by the sector. The other major contributing sectors are community, social and personal services (30.6%); financing, insurance, real estate and business services (10.9%) and transport, storage and communication (6.4%).
Figure 8: Distribution of Workforce in Public & Private Sector by Industrial Classification
Source: Socio-Economic Review 2011-12, Gujarat State
During 2010-11, among the job seekers with higher education qualifications registered with the Gujarat Employment Exchanges (3.38 lakh), the maximum number of job seekers was graduates from streams of arts, science, commerce and others (excluding engineering) at 72.3%. The next dominant segment of job seekers was the category of postgraduate students (including engineering) at 15.5%.
The total number of educated unemployed persons, for the year 2010-11, stands at 8.3 lakh. Despite registration of 1.63 lakh vacancies with the employment exchanges, a vast number of students who have completed their higher education have not been able to engage in gainful employment. This may be considered as an indicator towards the non-availability of quality manpower, as per the standards expected by the industry.
The maximum growth registered in the number of job seekers registering at the Exchanges is depicted by the category of post graduates (12%) followed by diploma holders (7%)
Public
Sector
38%Private
Sector
62%
876
643
230
135
62
60
56
22
16
Manufacturing
Community, Social and Personal Services
Financing, Insurance, Real Estate and …
Transport, Storage and Communications
Wholesale and Retail Trade and Restaurants
Electric, Gas and Water
Construction
Agriculture, Hunting, Forestry and Fishing
Mining and Quarrying
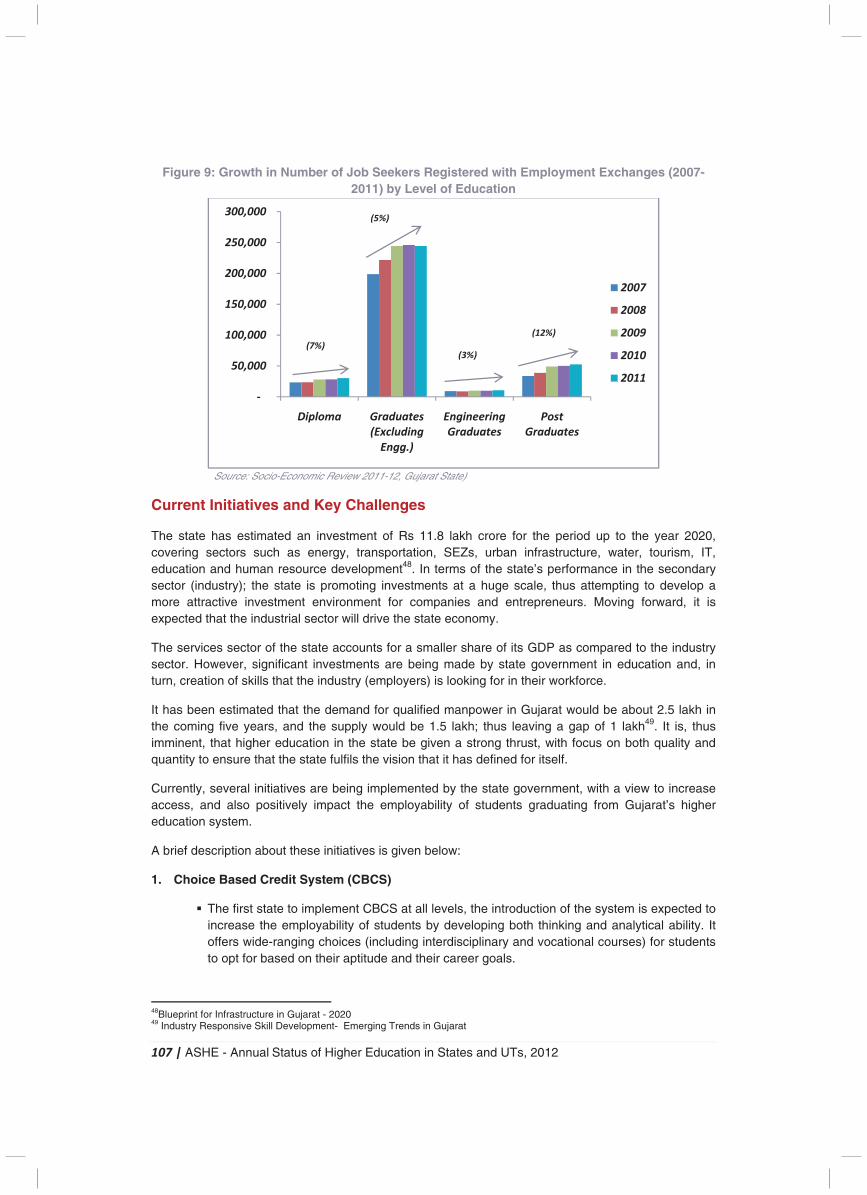
107 | ASHE - Annual Status of Higher Education in States and UTs, 2012
Figure 9: Growth in Number of Job Seekers Registered with Employment Exchanges (2007-2011) by Level of Education
Source: Socio-Economic Review 2011-12, Gujarat State)
Current Initiatives and Key Challenges
The state has estimated an investment of Rs 11.8 lakh crore for the period up to the year 2020, covering sectors such as energy, transportation, SEZs, urban infrastructure, water, tourism, IT, education and human resource development48. In terms of the state’s performance in the secondary sector (industry); the state is promoting investments at a huge scale, thus attempting to develop a more attractive investment environment for companies and entrepreneurs. Moving forward, it is expected that the industrial sector will drive the state economy.
The services sector of the state accounts for a smaller share of its GDP as compared to the industry sector. However, significant investments are being made by state government in education and, in turn, creation of skills that the industry (employers) is looking for in their workforce.
It has been estimated that the demand for qualified manpower in Gujarat would be about 2.5 lakh in the coming five years, and the supply would be 1.5 lakh; thus leaving a gap of 1 lakh49. It is, thus imminent, that higher education in the state be given a strong thrust, with focus on both quality and quantity to ensure that the state fulfils the vision that it has defined for itself.
Currently, several initiatives are being implemented by the state government, with a view to increase access, and also positively impact the employability of students graduating from Gujarat’s higher education system.
A brief description about these initiatives is given below:
1. Choice Based Credit System (CBCS)
� The first state to implement CBCS at all levels, the introduction of the system is expected to increase the employability of students by developing both thinking and analytical ability. It offers wide-ranging choices (including interdisciplinary and vocational courses) for students to opt for based on their aptitude and their career goals.
48Blueprint for Infrastructure in Gujarat - 2020 49 Industry Responsive Skill Development- Emerging Trends in Gujarat
-
50,000
100,000
150,000
200,000
250,000
300,000
Diploma Graduates
(Excluding
Engg.)
Engineering
Graduates
Post
Graduates
2007
2008
2009
2010
2011
(7%)
(5%)
(3%)
(12%)
108 | ASHE - Annual Status of Higher Education in States and UTs, 2012
� The CBCS has been implemented at the under graduate as well as the postgraduate level across all state universities in Gujarat. Till date 34 CBCS orientation workshops have been organized to orient the academic and administrative staff about the system.
� The CBCS is a student centric system, and is expected to benefit more than 8 lakh students and about 13,000 faculties in Gujarat.
2. Universal Development of Integrated Employability Skills through Higher Education Agencies (UDISHA)
� The initiative has been launched by the state government to enhance the employability of graduate and postgraduate students through short term and long term sustained training in developing skills, thus creating broader placement opportunities.
� UDISHA clubs have been setup in all government and grant in aid colleges, and are expected to bridge the gap between the job seekers and job providers. Till date, 436 colleges have been given the basic financial support required to set up clubs, through which student registration, pre-placement training, job fairs and counselling are offered.
3. SANDHAN – All Gujarat Integrated Classroom
� The initiative has been launched with an aim to enable all the students pursuing their higher education to have access to lectures delivered by eminent academicians from across the state, nation and from abroad. Under this initiative, a dedicated room has been setup in every college where the students can attend lectures.
� Till date, more than 1,000 hours of lectures have been telecasted every year since 2009, reaching out to 81,400 students in the year 2009-10 and 1,10,000 students in the year 2010-11.
4. Knowledge Management Programme
� The objective of this program is to build capabilities of faculties of higher education institutes, by integrating ICT and English in their role of creation and dissemination of knowledge. Under this initiative, training for the components of English and ICT training has been delivered to the master trainers at the state and district level.
� It has been planned to deliver training to the faculties at the district, cluster and college level in the next phase.
5. Gujarat Knowledge Society
� The Gujarat Knowledge Society has been instituted by the Government of Gujarat to bridge the gap between the industry and the higher education system. The aim of GKS is to prepare the youth for new knowledge based economy and society to stimulate the creation of world-class knowledge resources by developing new competencies and skills among the students.
� Under the initiative, customized short-term courses are prepared and delivered at nominal rates through private and institute training partners, thus empowering the youth for accessing better employment opportunities.
6. Establishment of an Assessment and Administrative Audit (AAA) wing
� Under this initiative, various higher education institutes are encouraged to undergo an audit and assessment process, which measures the aspects of academic management, academic practices, infrastructural facilities and institutional initiatives.
� The initiative aims to facilitate awareness among the colleges about processes and systems that can ensure quality teaching and research.
109 | ASHE - Annual Status of Higher Education in States and UTs, 2012
7. Training and Capability Building Program � The initiative aims at strengthening the faculty in their respective subjects and also to equip
them to use the necessary tools of new technology, which can be used in classroom delivery. Under this program, training is delivered in the respective subject areas, communication skills and ICT.
8. Building research centres
� To address the concern of poor performance of faculty in research, workshops have been conducted at various universities and higher education institutes for providing support to teachers in preparing proposals of research projects.
� Till data, 659 faculty members have attended these workshops and a total of 582 research proposals have been prepared.
Current Challenges faced in Higher Education
In improving the higher education scenario in Gujarat, the state is facing several challenges, many of which are common across states in India. Some of these challenges currently faced are:
� Access: There needs to be greater access to higher education for all classes in terms of class, income and gender.
� Equity: Currently the state lacks in areas of teacher and student quality, creating an environment for nurturing knowledge building and an open system that can become an agent of change and development. There is a need for greater equity in higher education in the state in terms of diverse backgrounds of students, 1st generation literates, gender, and urban/rural and income groups.
� Research in Higher Education: Enhancement is required both in terms of quantity and quality of research. The state lags behind in cutting edge research and doesn’t provide enough initiatives to promote effective research in various fields of study. Poor faculty orientation towards research and ICT, lower competence in English and subject domain are some of the reason for inadequate research in the state. There is an absence of effective mechanism for industry-institute interface for enhancing research, patents, and product specialization.
� Capacity Building: The state is in dire need to build capabilities of teachers, administrators, management and other stakeholders of higher education. Due to poor English language, communication and written skills, many graduates are not able to meet basic minimum employment standards at the state and national level.
� Governance: The state governance has suffered heavily due to poor transparency, inadequate disclosure of material information and archaic structural mechanisms in areas of legal framework, accountability, training of ICT implementation and work flow management.
� Extension: Extension in the state has been ineffective due to lack of skills absorbed into curriculum, deprived industry linkages and lack of relevance of ground level realities. The state suffers due to poor capabilities of teachers, management, administrator and inadequate interdisciplinary partnerships and sub standards ICT in curriculum.
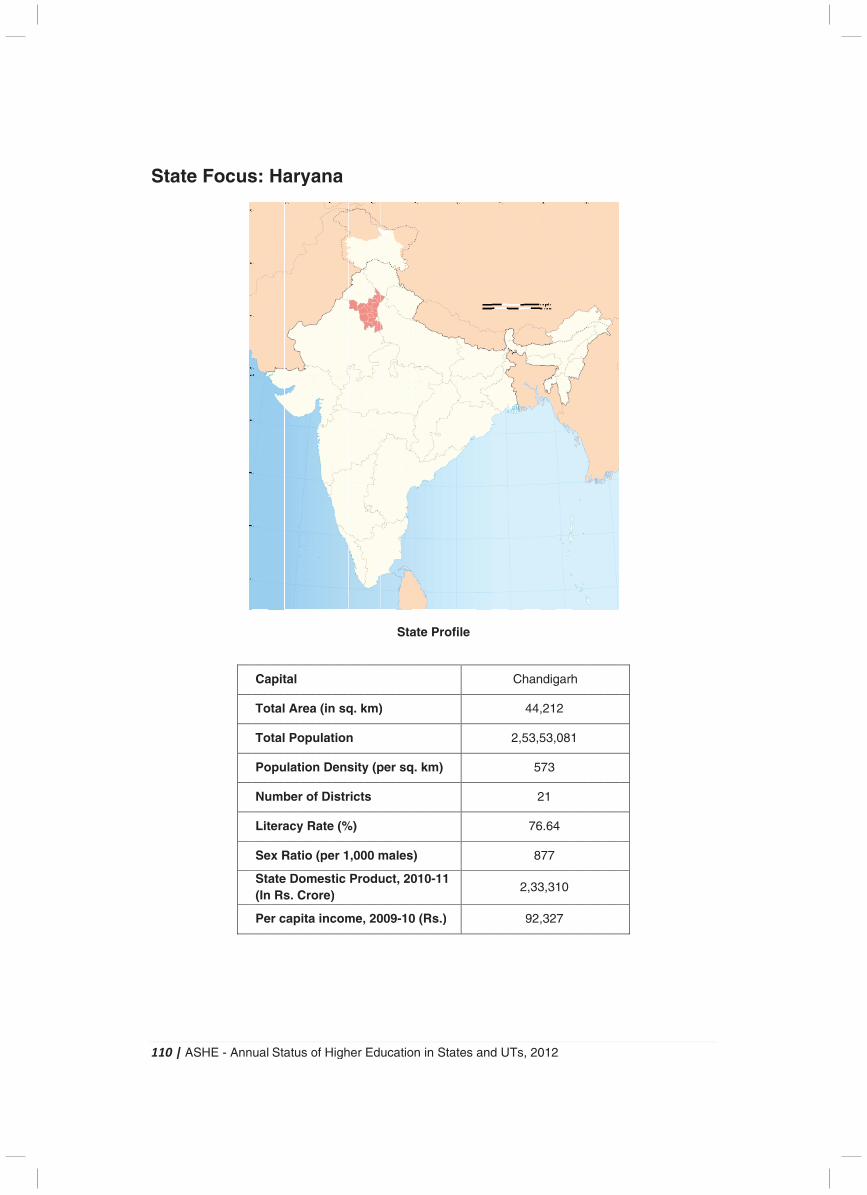
1
S
110
Sta
| A
ate
ASH
e F
HE
Fo
- A
oc
Ann
us
ual
s:
Ca
To
To
Po
Nu
Lit
Se
Sta(In
Pe
Sta
Ha
apit
otal
otal
opu
umb
tera
ex R
aten Rs
er c
atu
ar
tal
Ar
Po
ulat
ber
acy
Rat
e Dos. C
cap
s o
ya
rea
opu
tion
r of
y Ra
tio (
omCro
ita
of H
an
(in
ulat
n D
f Di
ate
(pe
mestore)
inc
High
a
n sq
tion
ens
istr
e (%
er 1
tic )
com
her
q. k
n
sity
rict
%)
,00
Pro
me,
Ed
km)
y (p
s
00 m
odu
, 20
uca
)
per
ma
uct
009
atio
Sta
sq
les
, 20
9-10
on in
ate
q. k
s)
010
0 (R
n S
Pr
m)
0-11
Rs.)
Stat
ofi
1
)
es
le
and
d U
UTs
Ch
2,5
2
, 20
han
44
53,5
5
2
76
8
2,33
92
012
ndig
,21
53,
573
21
6.64
877
3,3
,32
2
garh
2
081
4
10
27
h
1
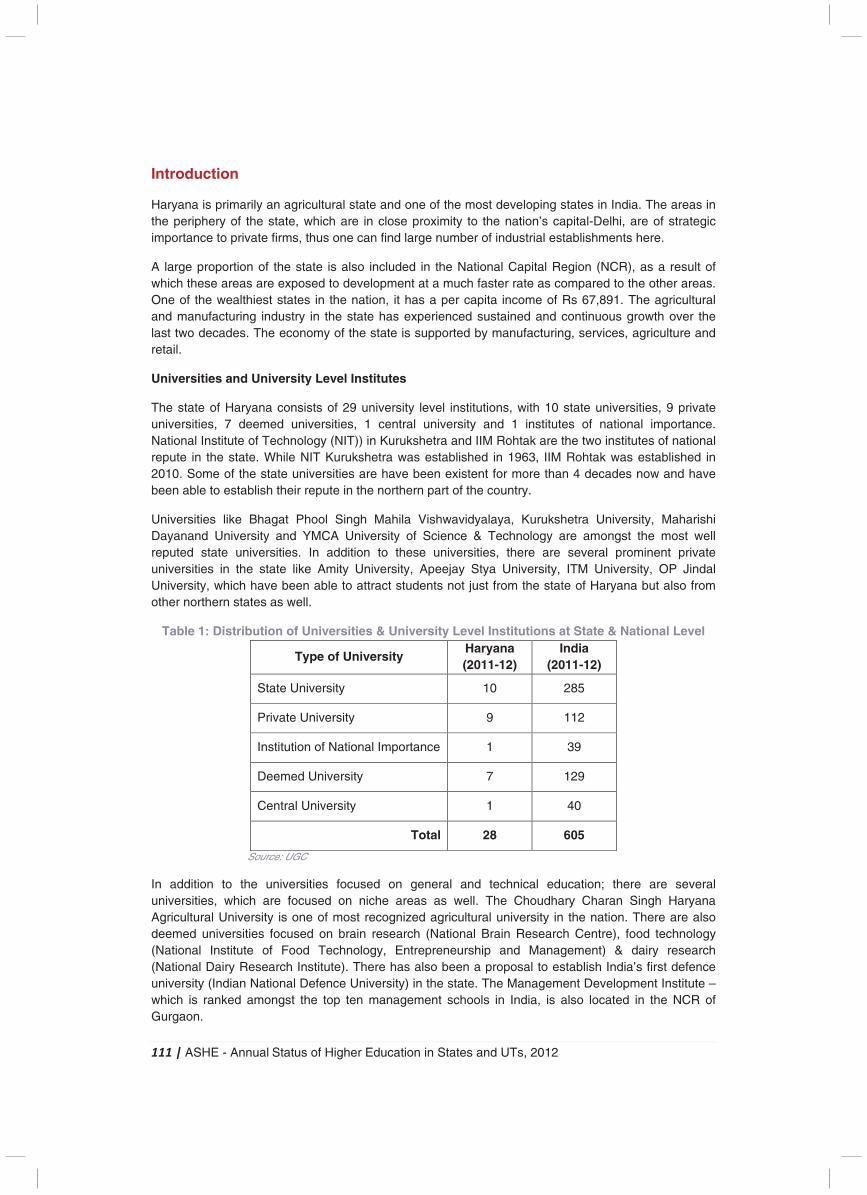
111 | ASHE - Annual Status of Higher Education in States and UTs, 2012
Introduction
Haryana is primarily an agricultural state and one of the most developing states in India. The areas in the periphery of the state, which are in close proximity to the nation’s capital-Delhi, are of strategic importance to private firms, thus one can find large number of industrial establishments here.
A large proportion of the state is also included in the National Capital Region (NCR), as a result of which these areas are exposed to development at a much faster rate as compared to the other areas. One of the wealthiest states in the nation, it has a per capita income of Rs 67,891. The agricultural and manufacturing industry in the state has experienced sustained and continuous growth over the last two decades. The economy of the state is supported by manufacturing, services, agriculture and retail.
Universities and University Level Institutes
The state of Haryana consists of 29 university level institutions, with 10 state universities, 9 private universities, 7 deemed universities, 1 central university and 1 institutes of national importance. National Institute of Technology (NIT)) in Kurukshetra and IIM Rohtak are the two institutes of national repute in the state. While NIT Kurukshetra was established in 1963, IIM Rohtak was established in 2010. Some of the state universities are have been existent for more than 4 decades now and have been able to establish their repute in the northern part of the country.
Universities like Bhagat Phool Singh Mahila Vishwavidyalaya, Kurukshetra University, Maharishi Dayanand University and YMCA University of Science & Technology are amongst the most well reputed state universities. In addition to these universities, there are several prominent private universities in the state like Amity University, Apeejay Stya University, ITM University, OP Jindal University, which have been able to attract students not just from the state of Haryana but also from other northern states as well.
Table 1: Distribution of Universities & University Level Institutions at State & National Level
Type of University Haryana (2011-12)
India (2011-12)
State University 10 285
Private University 9 112
Institution of National Importance 1 39
Deemed University 7 129
Central University 1 40
Total 28 605
Source: UGC
In addition to the universities focused on general and technical education; there are several universities, which are focused on niche areas as well. The Choudhary Charan Singh Haryana Agricultural University is one of most recognized agricultural university in the nation. There are also deemed universities focused on brain research (National Brain Research Centre), food technology (National Institute of Food Technology, Entrepreneurship and Management) & dairy research (National Dairy Research Institute). There has also been a proposal to establish India’s first defence university (Indian National Defence University) in the state. The Management Development Institute – which is ranked amongst the top ten management schools in India, is also located in the NCR of Gurgaon.
112 | ASHE - Annual Status of Higher Education in States and UTs, 2012
Figure 1: Location of Premier Institutes in Haryana
Key Higher Education Indicators: Institutes and Enrolment
As per Ministry of Human Resource Development (MoHRD) data, the growth rate in the total number of higher education institutes in Haryana stands at 27% between 2007-08 and 2009-10. With the national level Compound Annual Growth Rate (CAGR) of higher education institutes being only 7%, the state has performed exceedingly well in comparison.
Figure 2: Growth in Number of Higher Education Institutes
Source: Statistics of Higher & technical Education, MoHRD
Figure 3: Growth of Enrolment in Higher Education between 2005-06 and 2011-12
Source: Higher Education in Haryana during 12th FYP, Approach and Strategies As can be seen in Figure 3, the enrolment figures have also been steadily increasing in Haryana. The total enrolment figure for the year 2011-12 stands at 4.9 lakh as compared to 2.2 lakh in 2005-06 – a
� National Institute of Technology, Kurukshetra � Kurukshetra University, Kurukshetra � Indian Institute of Management, Rohtak � Maharshi Dayanand University, Rohtak � Bhagat Phool Singh Mahila Vishwavidyalaya,
Sonipat � Amity University, Gurgaon � Management Development Institute, Gurgaon � National Brain Research Centre, Gurgaon
781 1,034
1,263
2007-08 2008-09 2009-10
218,170 234,748
335,387 349,400 392,775
445,105 490,276
2005-06 2006-07 2007-08 2008-09 2009-10 2010-11 2011-12
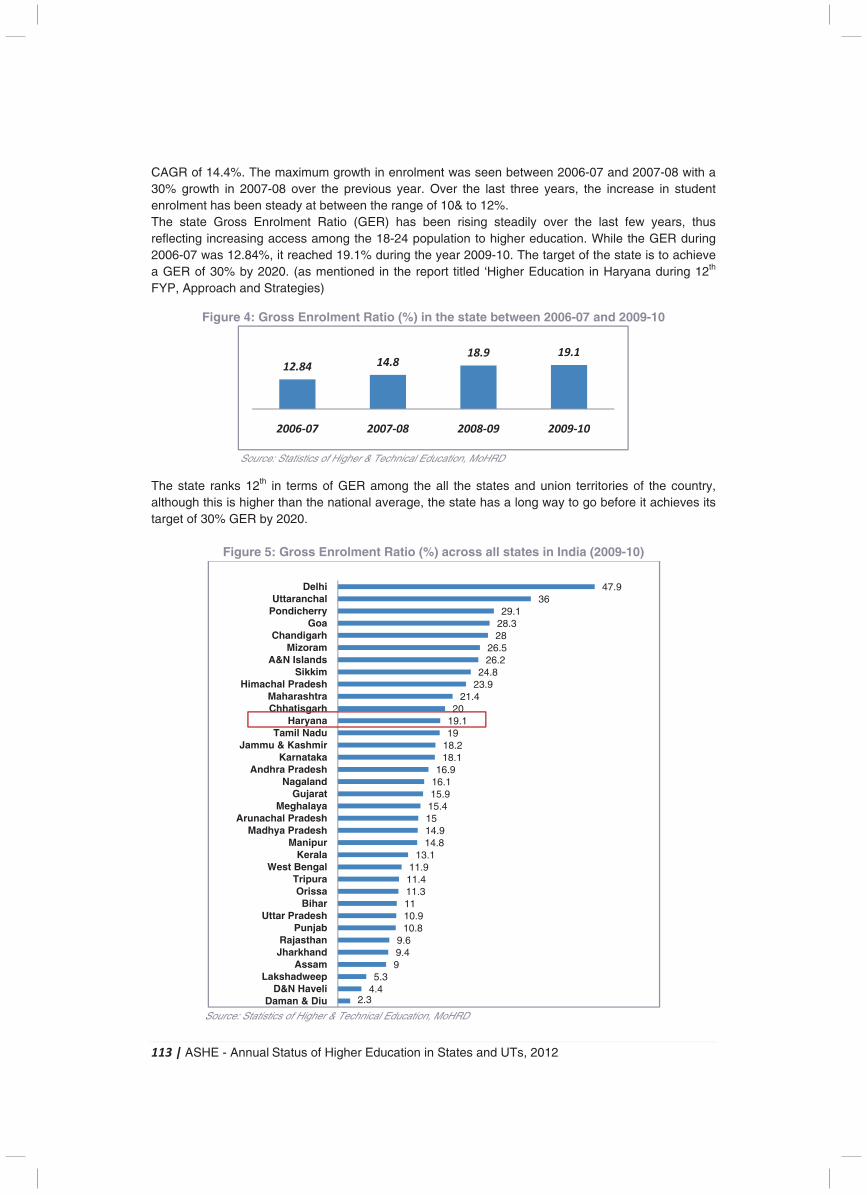
113 | ASHE - Annual Status of Higher Education in States and UTs, 2012
CAGR of 14.4%. The maximum growth in enrolment was seen between 2006-07 and 2007-08 with a 30% growth in 2007-08 over the previous year. Over the last three years, the increase in student enrolment has been steady at between the range of 10& to 12%. The state Gross Enrolment Ratio (GER) has been rising steadily over the last few years, thus reflecting increasing access among the 18-24 population to higher education. While the GER during 2006-07 was 12.84%, it reached 19.1% during the year 2009-10. The target of the state is to achieve a GER of 30% by 2020. (as mentioned in the report titled ‘Higher Education in Haryana during 12th FYP, Approach and Strategies)
Figure 4: Gross Enrolment Ratio (%) in the state between 2006-07 and 2009-10
Source: Statistics of Higher & Technical Education, MoHRD
The state ranks 12th in terms of GER among the all the states and union territories of the country, although this is higher than the national average, the state has a long way to go before it achieves its target of 30% GER by 2020.
Figure 5: Gross Enrolment Ratio (%) across all states in India (2009-10)
Source: Statistics of Higher & Technical Education, MoHRD
12.8414.8
18.9 19.1
2006-07 2007-08 2008-09 2009-10
2.34.45.3
99.49.6
10.810.91111.311.411.9
13.114.814.91515.415.916.116.9
18.118.21919.120
21.423.924.8
26.226.5
2828.329.1
3647.9
Daman & DiuD&N Haveli
LakshadweepAssam
JharkhandRajasthan
PunjabUttar Pradesh
BiharOrissa
TripuraWest Bengal
KeralaManipur
Madhya PradeshArunachal Pradesh
MeghalayaGujarat
NagalandAndhra Pradesh
KarnatakaJammu & Kashmir
Tamil NaduHaryana
ChhatisgarhMaharashtra
Himachal PradeshSikkim
A&N IslandsMizoram
ChandigarhGoa
PondicherryUttaranchal
Delhi
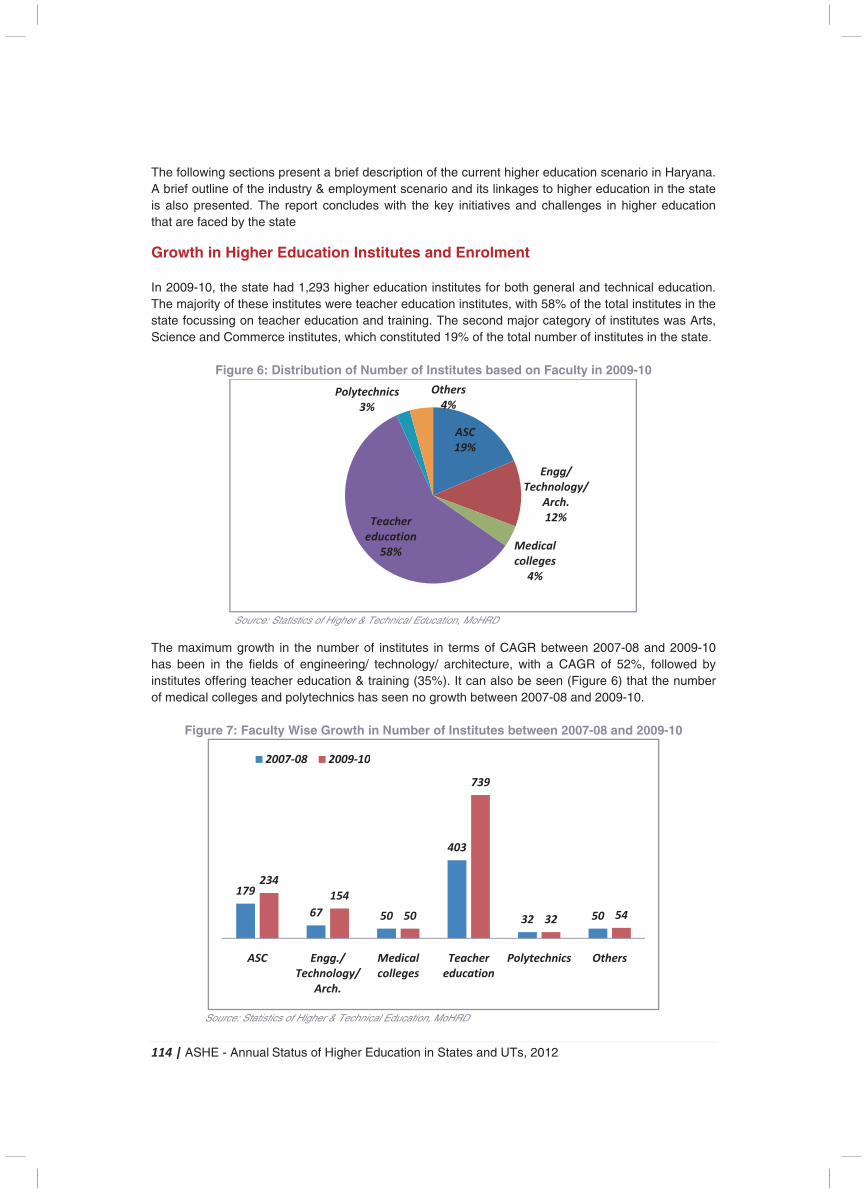
114 | ASHE - Annual Status of Higher Education in States and UTs, 2012
The following sections present a brief description of the current higher education scenario in Haryana. A brief outline of the industry & employment scenario and its linkages to higher education in the state is also presented. The report concludes with the key initiatives and challenges in higher education that are faced by the state
Growth in Higher Education Institutes and Enrolment In 2009-10, the state had 1,293 higher education institutes for both general and technical education. The majority of these institutes were teacher education institutes, with 58% of the total institutes in the state focussing on teacher education and training. The second major category of institutes was Arts, Science and Commerce institutes, which constituted 19% of the total number of institutes in the state.
Figure 6: Distribution of Number of Institutes based on Faculty in 2009-10
Source: Statistics of Higher & Technical Education, MoHRD
The maximum growth in the number of institutes in terms of CAGR between 2007-08 and 2009-10 has been in the fields of engineering/ technology/ architecture, with a CAGR of 52%, followed by institutes offering teacher education & training (35%). It can also be seen (Figure 6) that the number of medical colleges and polytechnics has seen no growth between 2007-08 and 2009-10.
Figure 7: Faculty Wise Growth in Number of Institutes between 2007-08 and 2009-10
Source: Statistics of Higher & Technical Education, MoHRD
(14%) (52%)
(0%)
(35%)
(0%)
ASC
19%
Engg/
Technology/
Arch.
12%
Medical
colleges
4%
Teacher
education
58%
Polytechnics
3%
Others
4%
179
67 50
403
32 50
234
154
50
739
32 54
ASC Engg./
Technology/
Arch.
Medical
colleges
Teacher
education
Polytechnics Others
2007-08 2009-10
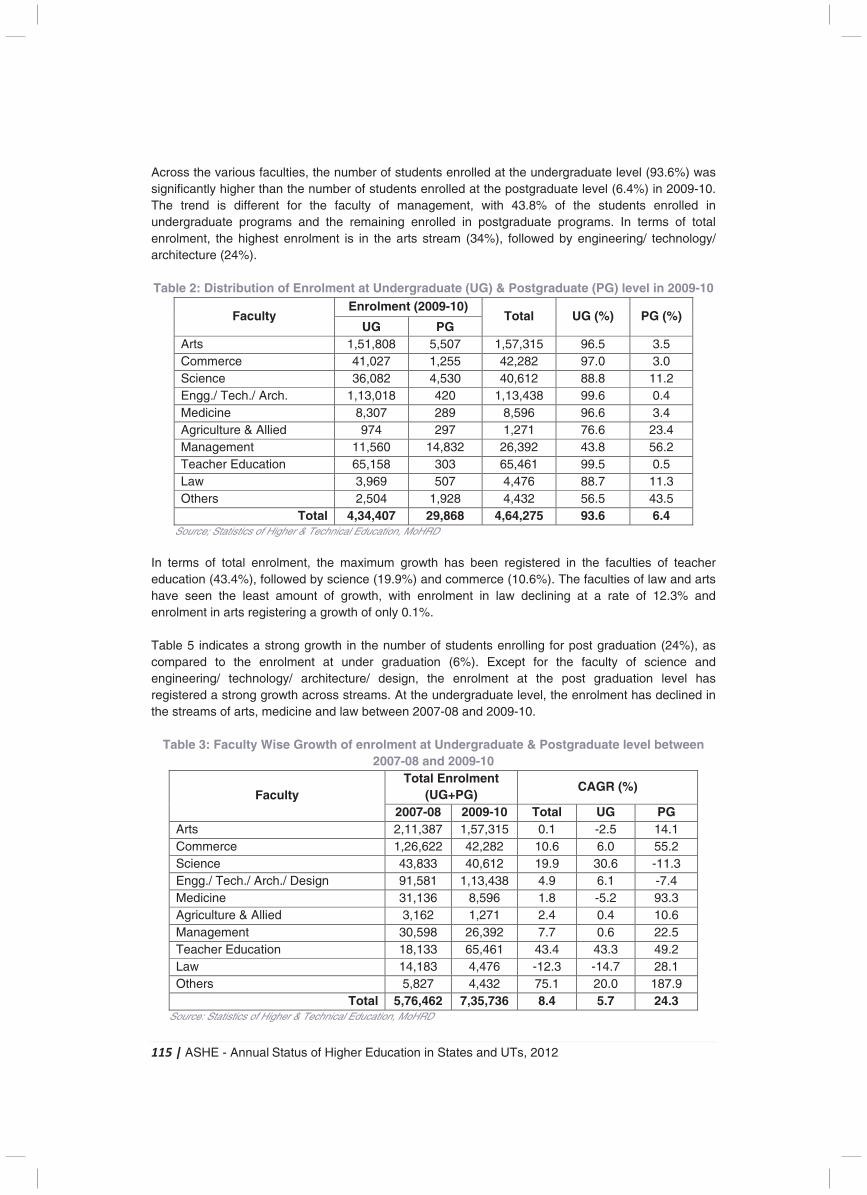
115 | ASHE - Annual Status of Higher Education in States and UTs, 2012
Across the various faculties, the number of students enrolled at the undergraduate level (93.6%) was significantly higher than the number of students enrolled at the postgraduate level (6.4%) in 2009-10. The trend is different for the faculty of management, with 43.8% of the students enrolled in undergraduate programs and the remaining enrolled in postgraduate programs. In terms of total enrolment, the highest enrolment is in the arts stream (34%), followed by engineering/ technology/ architecture (24%). Table 2: Distribution of Enrolment at Undergraduate (UG) & Postgraduate (PG) level in 2009-10
Faculty Enrolment (2009-10)
Total UG (%) PG (%) UG PG
Arts 1,51,808 5,507 1,57,315 96.5 3.5 Commerce 41,027 1,255 42,282 97.0 3.0 Science 36,082 4,530 40,612 88.8 11.2 Engg./ Tech./ Arch. 1,13,018 420 1,13,438 99.6 0.4 Medicine 8,307 289 8,596 96.6 3.4 Agriculture & Allied 974 297 1,271 76.6 23.4 Management 11,560 14,832 26,392 43.8 56.2 Teacher Education 65,158 303 65,461 99.5 0.5 Law 3,969 507 4,476 88.7 11.3 Others 2,504 1,928 4,432 56.5 43.5
Total 4,34,407 29,868 4,64,275 93.6 6.4 Source; Statistics of Higher & Technical Education, MoHRD
In terms of total enrolment, the maximum growth has been registered in the faculties of teacher education (43.4%), followed by science (19.9%) and commerce (10.6%). The faculties of law and arts have seen the least amount of growth, with enrolment in law declining at a rate of 12.3% and enrolment in arts registering a growth of only 0.1%. Table 5 indicates a strong growth in the number of students enrolling for post graduation (24%), as compared to the enrolment at under graduation (6%). Except for the faculty of science and engineering/ technology/ architecture/ design, the enrolment at the post graduation level has registered a strong growth across streams. At the undergraduate level, the enrolment has declined in the streams of arts, medicine and law between 2007-08 and 2009-10.
Table 3: Faculty Wise Growth of enrolment at Undergraduate & Postgraduate level between 2007-08 and 2009-10
Faculty Total Enrolment
(UG+PG) CAGR (%)
2007-08 2009-10 Total UG PG Arts 2,11,387 1,57,315 0.1 -2.5 14.1 Commerce 1,26,622 42,282 10.6 6.0 55.2 Science 43,833 40,612 19.9 30.6 -11.3 Engg./ Tech./ Arch./ Design 91,581 1,13,438 4.9 6.1 -7.4 Medicine 31,136 8,596 1.8 -5.2 93.3 Agriculture & Allied 3,162 1,271 2.4 0.4 10.6 Management 30,598 26,392 7.7 0.6 22.5 Teacher Education 18,133 65,461 43.4 43.3 49.2 Law 14,183 4,476 -12.3 -14.7 28.1 Others 5,827 4,432 75.1 20.0 187.9
Total 5,76,462 7,35,736 8.4 5.7 24.3 Source: Statistics of Higher & Technical Education, MoHRD
116 | ASHE - Annual Status of Higher Education in States and UTs, 2012
Quality of Institutes
Among the various universities in the state, only 3 universities have been assessed and accredited by the National Assessment and Accreditation Council (NAAC). The Guru Jambheshwar University of Science and Technology, Hisar and Kurukshetra University have been awarded grade A (Very Good), the Maharshi Dayanand University, Rohtak has been awarded grade B (Good). Among the colleges in the state, 110 colleges have been assessed by the NAAC, with 18% of these institutes being graded A (Very Good), 75% of the institutes being graded B (Good) and 6.3% of the institutes being graded C (Satisfactory) as per the latest report released by the NAAC in 2012.
Industry and Employment Scenario
Key Industries50
Due to its strategic location, Haryana is gradually becoming a prime industrial hub, with several private firms establishing their factories in this state. The requirement for skilled manpower is going to increase multi-fold in the coming future. A brief overview of the various key industries in Haryana is as given below:
1. IT/ ITeS Industry � Haryana is amongst the leading states in India in terms of IT exports. � Key players: IBM Global Process Services, Tata Consultancy Services, Microsoft
Corporation, Google
2. Agro-Based Industry � One of the biggest employment generators in Haryana is the Agro Based Industries. Dairy
farming is promoted as a key self-employment venture, with the per capita milk availability in Haryana being the second highest in the country
� Key players: Nestle India, GlaxoSmithKline Consumer Healthcare Ltd, Haldiram’s Foods International Ltd, PepsiCo India
3. Textiles and Apparels
� The state boasts of abundant availability of raw materials thus giving it a competitive advantage over the other states.
� Readymade garments worth US $1,316.6 million are exported from Haryana annually, providing employment to around 10 lakh workers
� Key players: DCM Textiles, Benetton India, Orient Craft, Pearl Global
4. Petrochemicals � A 5,000-acre project jointly set up by HSIIDC and IOCL is expected to drive the further
growth of the petrochemicals industry in the region. The new complex would be a dedicated industrial zone for downstream industries.
� Key player(s): Indian Oil Corporation Ltd.
5. Real Estate and Construction � The state has demonstrated rapid growth in the real estate industry across the residential,
commercial and hospitality space. � The city of Gurgaon (located in Haryana) accounts for more than 70% of the new
commercial space coming up in the National Capital Region. � Key players: DLF, Unitech Group, Ansal Housing and Construction Ltd., Emaar MGF Land
Ltd.
50India Brand Equity Foundation – State report on Haryana
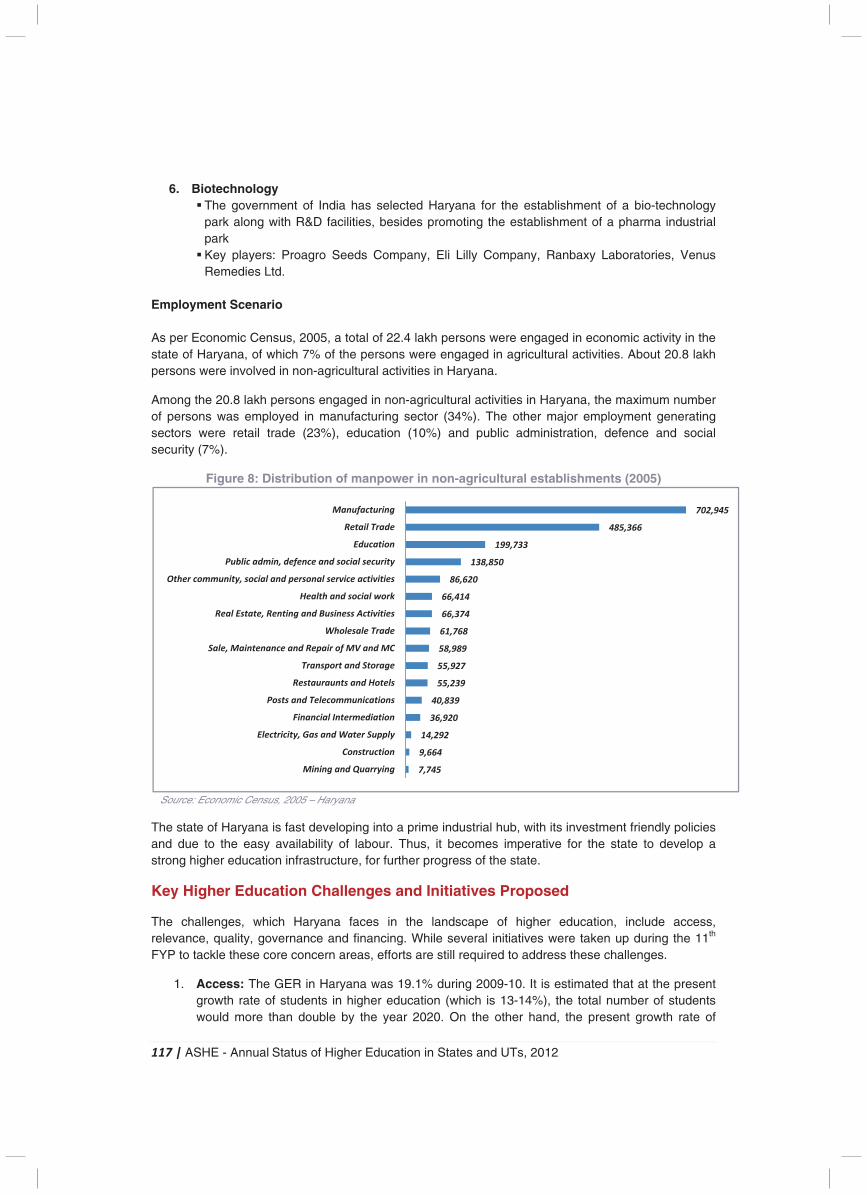
117 | ASHE - Annual Status of Higher Education in States and UTs, 2012
6. Biotechnology
� The government of India has selected Haryana for the establishment of a bio-technology park along with R&D facilities, besides promoting the establishment of a pharma industrial park
� Key players: Proagro Seeds Company, Eli Lilly Company, Ranbaxy Laboratories, Venus Remedies Ltd.
Employment Scenario As per Economic Census, 2005, a total of 22.4 lakh persons were engaged in economic activity in the state of Haryana, of which 7% of the persons were engaged in agricultural activities. About 20.8 lakh persons were involved in non-agricultural activities in Haryana.
Among the 20.8 lakh persons engaged in non-agricultural activities in Haryana, the maximum number of persons was employed in manufacturing sector (34%). The other major employment generating sectors were retail trade (23%), education (10%) and public administration, defence and social security (7%).
Figure 8: Distribution of manpower in non-agricultural establishments (2005)
Source: Economic Census, 2005 – Haryana
The state of Haryana is fast developing into a prime industrial hub, with its investment friendly policies and due to the easy availability of labour. Thus, it becomes imperative for the state to develop a strong higher education infrastructure, for further progress of the state.
Key Higher Education Challenges and Initiatives Proposed
The challenges, which Haryana faces in the landscape of higher education, include access, relevance, quality, governance and financing. While several initiatives were taken up during the 11th FYP to tackle these core concern areas, efforts are still required to address these challenges.
1. Access: The GER in Haryana was 19.1% during 2009-10. It is estimated that at the present growth rate of students in higher education (which is 13-14%), the total number of students would more than double by the year 2020. On the other hand, the present growth rate of
7,745
9,664
14,292
36,920
40,839
55,239
55,927
58,989
61,768
66,374
66,414
86,620
138,850
199,733
485,366
702,945
Mining and Quarrying
Construction
Electricity, Gas and Water Supply
Financial Intermediation
Posts and Telecommunications
Restauraunts and Hotels
Transport and Storage
Sale, Maintenance and Repair of MV and MC
Wholesale Trade
Real Estate, Renting and Business Activities
Health and social work
Other community, social and personal service activities
Public admin, defence and social security
Education
Retail Trade
Manufacturing
118 | ASHE - Annual Status of Higher Education in States and UTs, 2012
government colleges in the state is 2.5%, which is much lesser than the growth rate of student enrolment. To further enhance access to higher education in the state, the following strategies have been proposed:
� Promotion of quality distance education programs through e-content � Offering of flexi-timings in the universities and colleges of the state, thus allowing
efficient utilization of infrastructure � Promotion of public private partnership under various models such as basic
infrastructure model, outsourcing model, equity/ hybrid model, reverse outsourcing model
2. Equity: To ensure that higher education is provided to all segments of society, the following
initiatives have been proposed: � Provision of financial support to girl students and students belonging to SC/ ST,
minority groups and Other Backward Categories (OBC) through scholarships, book banks, fee subsidization
� Strengthening of infrastructure to provide access and to retain women students, differently-abled students and students from socially deprived backgrounds
� Strengthening of the remedial system for students from socially deprived backgrounds � Consolidation and improvement of the capacity and quality of the existing institutes
3. Relevance: While the state focused on the expansion of higher education, adequate attention
was not paid to the quality and relevance of higher education. As a result, the employability of graduates has become a key concern area. To tackle this issue, the following strategies have been proposed:
� Provision of integrated curriculum with greater flexibility in choice of subjects and innovative pedagogic practices
� Focus on development of skills such as critical thinking, communication, collaboration and creativity
� Laying special emphasis on verbal and written communication skills in English � Curriculum revision as per the current industry needs � Updating faculty competencies � Concept of finishing schools to be amalgamated with university education
4. Quality and Excellence: Currently, there is very less emphasis on research in universities.
The number of research papers and patents from academia belonging to Indian universities is limited. This is a strong area of concern for the Indian higher education system. The following strategies have been proposed by the state government to strengthen the research foundation in the universities in Haryana:
� Mandatory accreditation along with supplementary measures to generate pressure on the higher education system to evolve adequate norms and standards
� Multi subject orientation in the higher education system � Implementation of Choice Based Credit System � Strengthening research orientation in the curriculum � Provision of more research funding � Updating teaching pedagogy � Usage of innovative techniques (e.g.: ICT) in teaching learning process � Setting up of Inter-University Centre (IUCs) at the state level to share costly and rare
infrastructure, research equipment etc.
5. Financing: With an increase in salaries, and the number of students enrolling for higher education, it is becoming increasingly difficult for the government to meet the financing
119 | ASHE - Annual Status of Higher Education in States and UTs, 2012
demands of the university considering the budgetary constraints. To tackle this issue, the following strategies have been proposed:
� Increase in budget allocation by 20-30%. There is an urgent need to step up both public and private investment in higher education and to increase the efficiency of the utilization of these funds
� Only 2.1% of the state GDP is being currently allocated for education in the state. It has been suggested to increase the allocation to 6% of the state GDP.
� Supporting private investments in higher education, with state government ensuring measures to keep a check on the quality of education
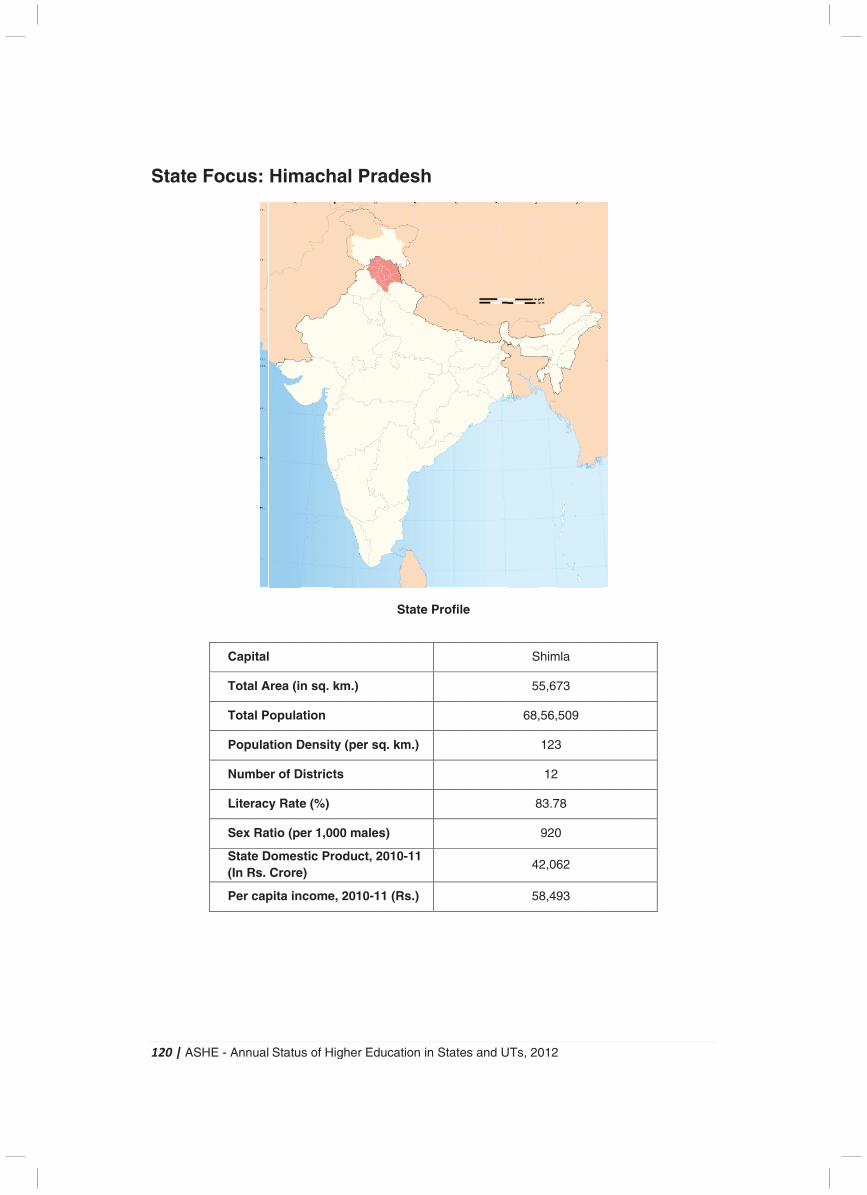
1
S
120
Sta
| A
ate
ASH
e F
HE
Fo
- A
oc
C
To
To
Po
N
Li
Se
St(In
Pe
Ann
us
api
ota
ota
opu
um
iter
ex
taten R
er c
ual
s:
ital
al A
al P
ula
mbe
rac
Ra
e DRs.
cap
Sta
Hi
l
Area
Pop
atio
er o
y R
atio
DomCro
pita
atu
im
a (i
ula
n D
of D
Rate
(pe
mesore
a in
s o
mac
n s
atio
Den
Dist
e (%
er 1
stice)
nco
of H
ch
sq.
on
nsit
tric
%)
1,0
c Pr
me
High
ha
km
ty (
ts
00
rod
e, 2
her
l P
m.)
(per
ma
duc
010
Ed
Pra
r sq
ales
t, 2
0-1
uca
ad
q. k
s)
201
1 (
atio
des
Sta
km.
0-1
Rs.
on in
sh
ate
.)
11
.)
n S
h
Pr
Stat
ofi
es
le
and
d U
UTs
6
, 20
S
55
68,
8
42
58
012
him
5,6
56,
123
12
83.7
920
2,0
8,4
2
mla
73
,50
3
2
78
0
62
93
9
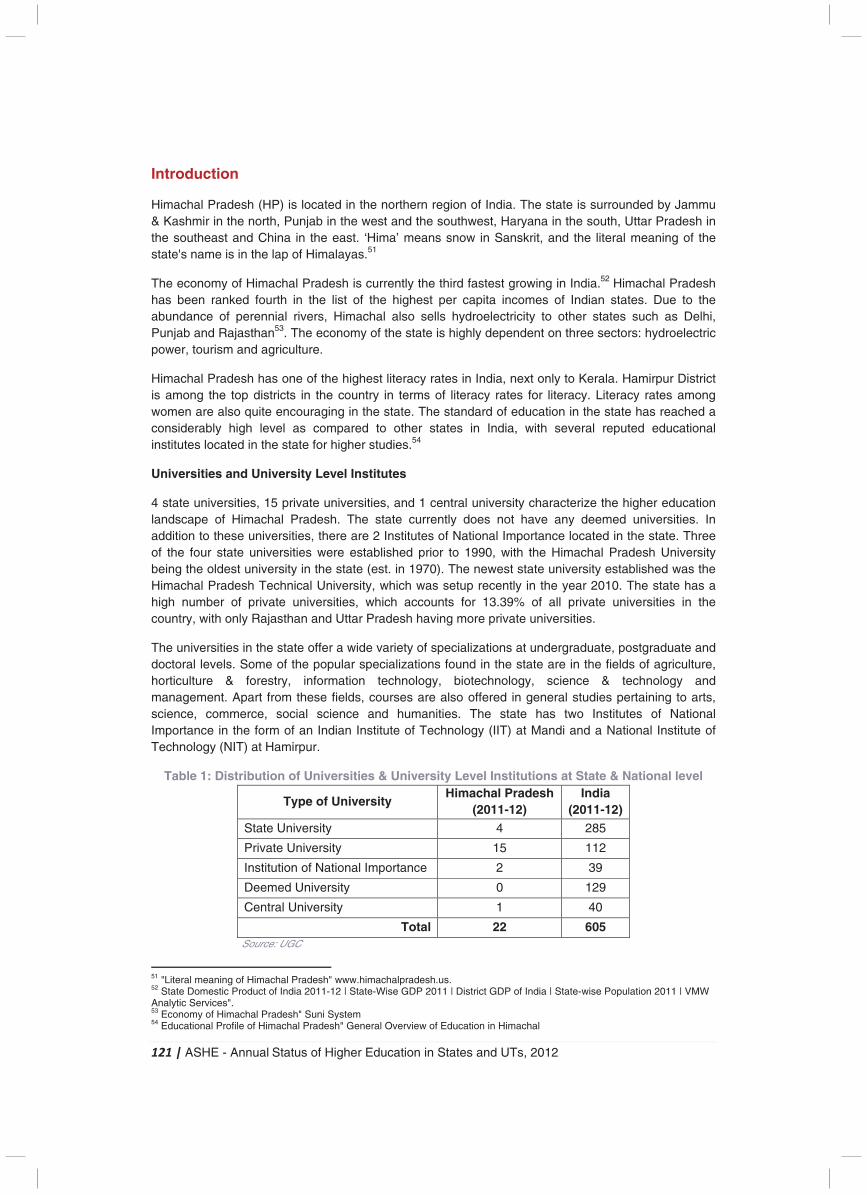
121 | ASHE - Annual Status of Higher Education in States and UTs, 2012
Introduction
Himachal Pradesh (HP) is located in the northern region of India. The state is surrounded by Jammu & Kashmir in the north, Punjab in the west and the southwest, Haryana in the south, Uttar Pradesh in the southeast and China in the east. ‘Hima’ means snow in Sanskrit, and the literal meaning of the state's name is in the lap of Himalayas.51
The economy of Himachal Pradesh is currently the third fastest growing in India.52 Himachal Pradesh has been ranked fourth in the list of the highest per capita incomes of Indian states. Due to the abundance of perennial rivers, Himachal also sells hydroelectricity to other states such as Delhi, Punjab and Rajasthan53. The economy of the state is highly dependent on three sectors: hydroelectric power, tourism and agriculture.
Himachal Pradesh has one of the highest literacy rates in India, next only to Kerala. Hamirpur District is among the top districts in the country in terms of literacy rates for literacy. Literacy rates among women are also quite encouraging in the state. The standard of education in the state has reached a considerably high level as compared to other states in India, with several reputed educational institutes located in the state for higher studies.54
Universities and University Level Institutes
4 state universities, 15 private universities, and 1 central university characterize the higher education landscape of Himachal Pradesh. The state currently does not have any deemed universities. In addition to these universities, there are 2 Institutes of National Importance located in the state. Three of the four state universities were established prior to 1990, with the Himachal Pradesh University being the oldest university in the state (est. in 1970). The newest state university established was the Himachal Pradesh Technical University, which was setup recently in the year 2010. The state has a high number of private universities, which accounts for 13.39% of all private universities in the country, with only Rajasthan and Uttar Pradesh having more private universities.
The universities in the state offer a wide variety of specializations at undergraduate, postgraduate and doctoral levels. Some of the popular specializations found in the state are in the fields of agriculture, horticulture & forestry, information technology, biotechnology, science & technology and management. Apart from these fields, courses are also offered in general studies pertaining to arts, science, commerce, social science and humanities. The state has two Institutes of National Importance in the form of an Indian Institute of Technology (IIT) at Mandi and a National Institute of Technology (NIT) at Hamirpur.
Table 1: Distribution of Universities & University Level Institutions at State & National level
Type of University Himachal Pradesh
(2011-12) India
(2011-12) State University 4 285
Private University 15 112
Institution of National Importance 2 39
Deemed University 0 129
Central University 1 40
Total 22 605 Source: UGC
51 "Literal meaning of Himachal Pradesh" www.himachalpradesh.us. 52 State Domestic Product of India 2011-12 | State-Wise GDP 2011 | District GDP of India | State-wise Population 2011 | VMW Analytic Services". 53 Economy of Himachal Pradesh" Suni System 54 Educational Profile of Himachal Pradesh" General Overview of Education in Himachal
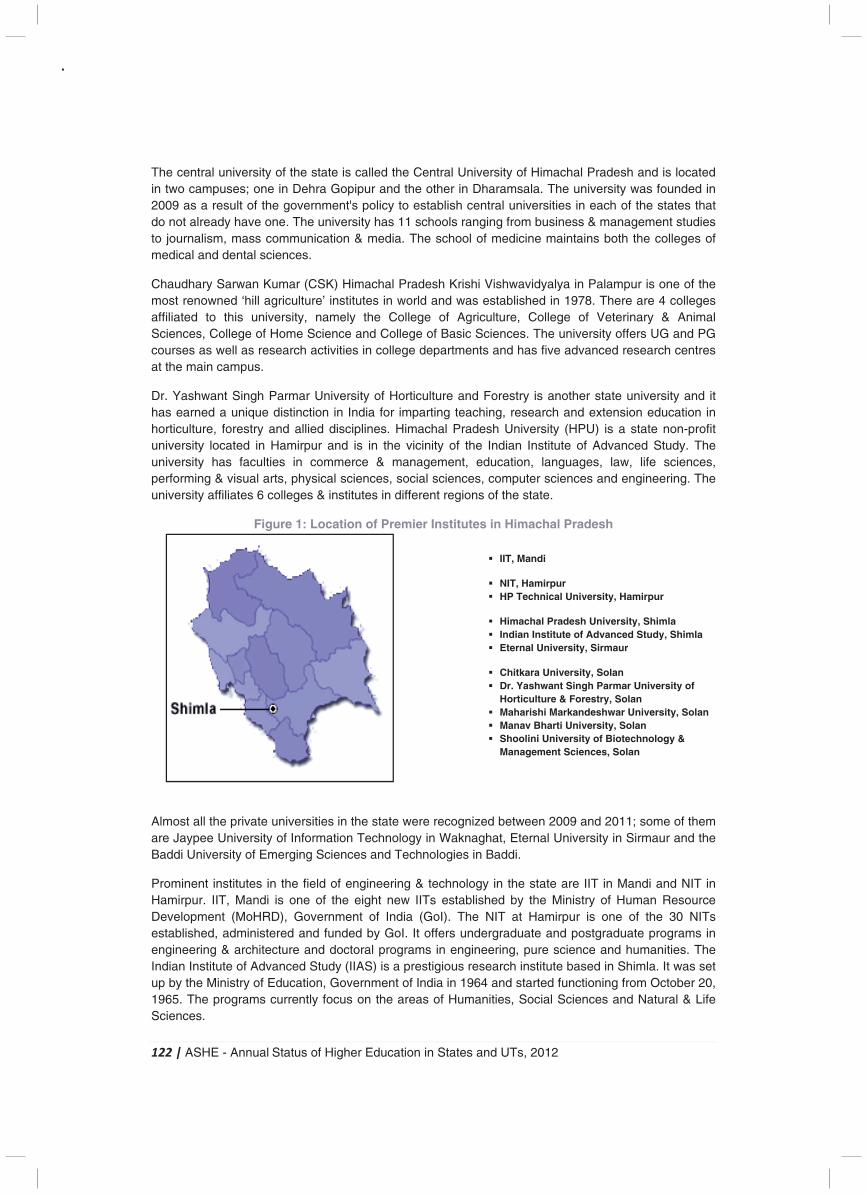
122 | ASHE - Annual Status of Higher Education in States and UTs, 2012
The central university of the state is called the Central University of Himachal Pradesh and is located in two campuses; one in Dehra Gopipur and the other in Dharamsala. The university was founded in 2009 as a result of the government's policy to establish central universities in each of the states that do not already have one. The university has 11 schools ranging from business & management studies to journalism, mass communication & media. The school of medicine maintains both the colleges of medical and dental sciences.
Chaudhary Sarwan Kumar (CSK) Himachal Pradesh Krishi Vishwavidyalya in Palampur is one of the most renowned ‘hill agriculture’ institutes in world and was established in 1978. There are 4 colleges affiliated to this university, namely the College of Agriculture, College of Veterinary & Animal Sciences, College of Home Science and College of Basic Sciences. The university offers UG and PG courses as well as research activities in college departments and has five advanced research centres at the main campus.
Dr. Yashwant Singh Parmar University of Horticulture and Forestry is another state university and it has earned a unique distinction in India for imparting teaching, research and extension education in horticulture, forestry and allied disciplines. Himachal Pradesh University (HPU) is a state non-profit university located in Hamirpur and is in the vicinity of the Indian Institute of Advanced Study. The university has faculties in commerce & management, education, languages, law, life sciences, performing & visual arts, physical sciences, social sciences, computer sciences and engineering. The university affiliates 6 colleges & institutes in different regions of the state.
Figure 1: Location of Premier Institutes in Himachal Pradesh
Almost all the private universities in the state were recognized between 2009 and 2011; some of them are Jaypee University of Information Technology in Waknaghat, Eternal University in Sirmaur and the Baddi University of Emerging Sciences and Technologies in Baddi.
Prominent institutes in the field of engineering & technology in the state are IIT in Mandi and NIT in Hamirpur. IIT, Mandi is one of the eight new IITs established by the Ministry of Human Resource Development (MoHRD), Government of India (GoI). The NIT at Hamirpur is one of the 30 NITs established, administered and funded by GoI. It offers undergraduate and postgraduate programs in engineering & architecture and doctoral programs in engineering, pure science and humanities. The Indian Institute of Advanced Study (IIAS) is a prestigious research institute based in Shimla. It was set up by the Ministry of Education, Government of India in 1964 and started functioning from October 20, 1965. The programs currently focus on the areas of Humanities, Social Sciences and Natural & Life Sciences.
� IIT, Mandi
� NIT, Hamirpur � HP Technical University, Hamirpur
� Himachal Pradesh University, Shimla � Indian Institute of Advanced Study, Shimla � Eternal University, Sirmaur
� Chitkara University, Solan � Dr. Yashwant Singh Parmar University of
Horticulture & Forestry, Solan � Maharishi Markandeshwar University, Solan � Manav Bharti University, Solan � Shoolini University of Biotechnology &
Management Sciences, Solan
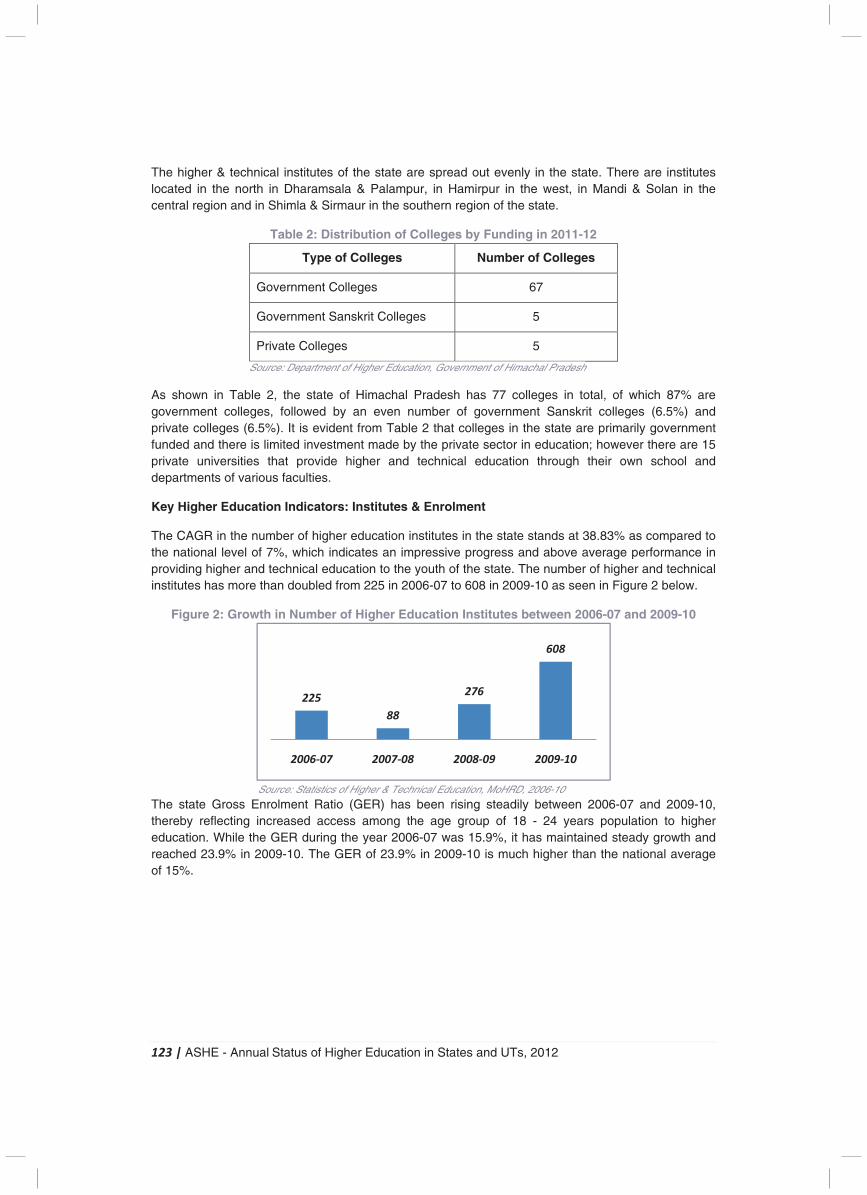
123 | ASHE - Annual Status of Higher Education in States and UTs, 2012
The higher & technical institutes of the state are spread out evenly in the state. There are institutes located in the north in Dharamsala & Palampur, in Hamirpur in the west, in Mandi & Solan in the central region and in Shimla & Sirmaur in the southern region of the state.
Table 2: Distribution of Colleges by Funding in 2011-12
Type of Colleges Number of Colleges
Government Colleges 67
Government Sanskrit Colleges 5
Private Colleges 5
Source: Department of Higher Education, Government of Himachal Pradesh
As shown in Table 2, the state of Himachal Pradesh has 77 colleges in total, of which 87% are government colleges, followed by an even number of government Sanskrit colleges (6.5%) and private colleges (6.5%). It is evident from Table 2 that colleges in the state are primarily government funded and there is limited investment made by the private sector in education; however there are 15 private universities that provide higher and technical education through their own school and departments of various faculties.
Key Higher Education Indicators: Institutes & Enrolment
The CAGR in the number of higher education institutes in the state stands at 38.83% as compared to the national level of 7%, which indicates an impressive progress and above average performance in providing higher and technical education to the youth of the state. The number of higher and technical institutes has more than doubled from 225 in 2006-07 to 608 in 2009-10 as seen in Figure 2 below.
Figure 2: Growth in Number of Higher Education Institutes between 2006-07 and 2009-10
Source: Statistics of Higher & Technical Education, MoHRD, 2006-10
The state Gross Enrolment Ratio (GER) has been rising steadily between 2006-07 and 2009-10, thereby reflecting increased access among the age group of 18 - 24 years population to higher education. While the GER during the year 2006-07 was 15.9%, it has maintained steady growth and reached 23.9% in 2009-10. The GER of 23.9% in 2009-10 is much higher than the national average of 15%.
225
88
276
608
2006-07 2007-08 2008-09 2009-10
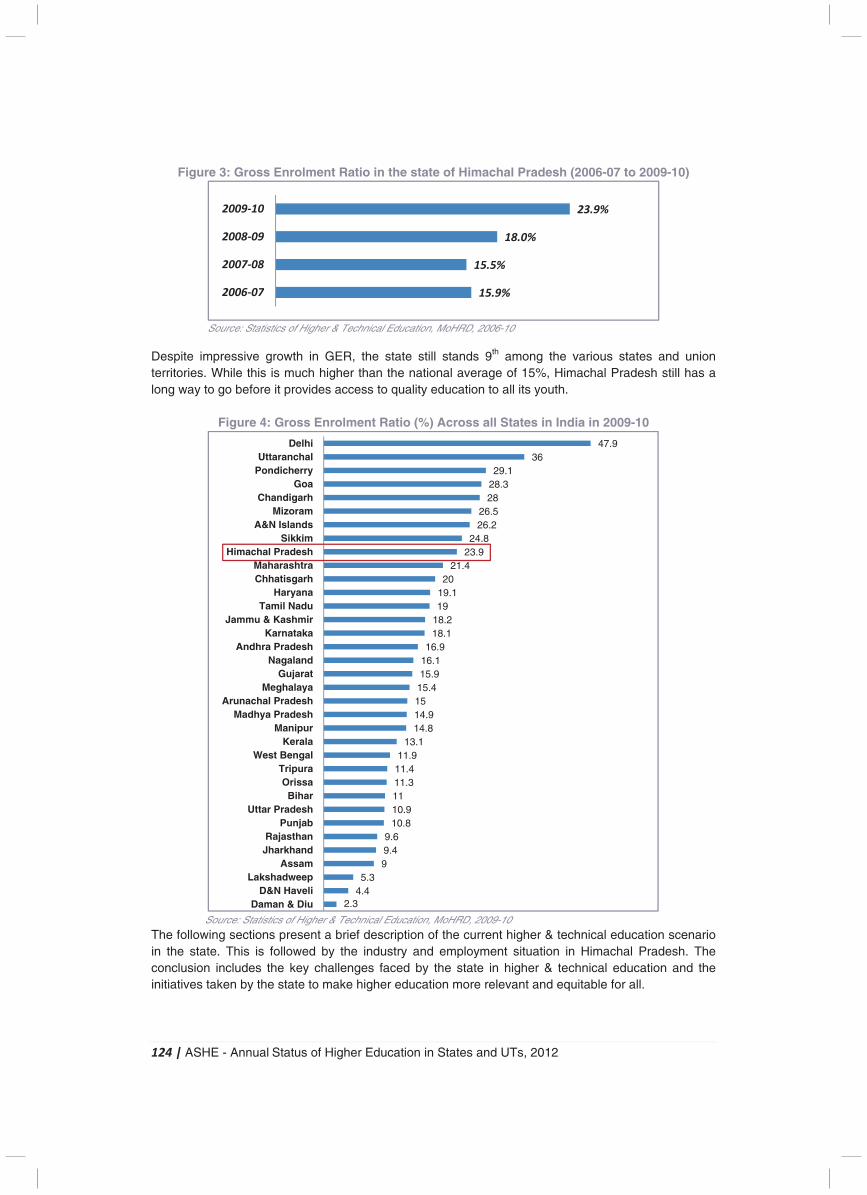
124 | ASHE - Annual Status of Higher Education in States and UTs, 2012
Figure 3: Gross Enrolment Ratio in the state of Himachal Pradesh (2006-07 to 2009-10)
Source: Statistics of Higher & Technical Education, MoHRD, 2006-10
Despite impressive growth in GER, the state still stands 9th among the various states and union territories. While this is much higher than the national average of 15%, Himachal Pradesh still has a long way to go before it provides access to quality education to all its youth.
Figure 4: Gross Enrolment Ratio (%) Across all States in India in 2009-10
Source: Statistics of Higher & Technical Education, MoHRD, 2009-10
The following sections present a brief description of the current higher & technical education scenario in the state. This is followed by the industry and employment situation in Himachal Pradesh. The conclusion includes the key challenges faced by the state in higher & technical education and the initiatives taken by the state to make higher education more relevant and equitable for all.
15.9%
15.5%
18.0%
23.9%
2006-07
2007-08
2008-09
2009-10
2.34.45.3
99.49.6
10.810.91111.311.411.9
13.114.814.91515.415.916.116.9
18.118.21919.120
21.423.924.8
26.226.5
2828.329.1
3647.9
Daman & DiuD&N Haveli
LakshadweepAssam
JharkhandRajasthan
PunjabUttar Pradesh
BiharOrissa
TripuraWest Bengal
KeralaManipur
Madhya PradeshArunachal Pradesh
MeghalayaGujarat
NagalandAndhra Pradesh
KarnatakaJammu & Kashmir
Tamil NaduHaryana
ChhatisgarhMaharashtra
Himachal PradeshSikkim
A&N IslandsMizoram
ChandigarhGoa
PondicherryUttaranchal
Delhi
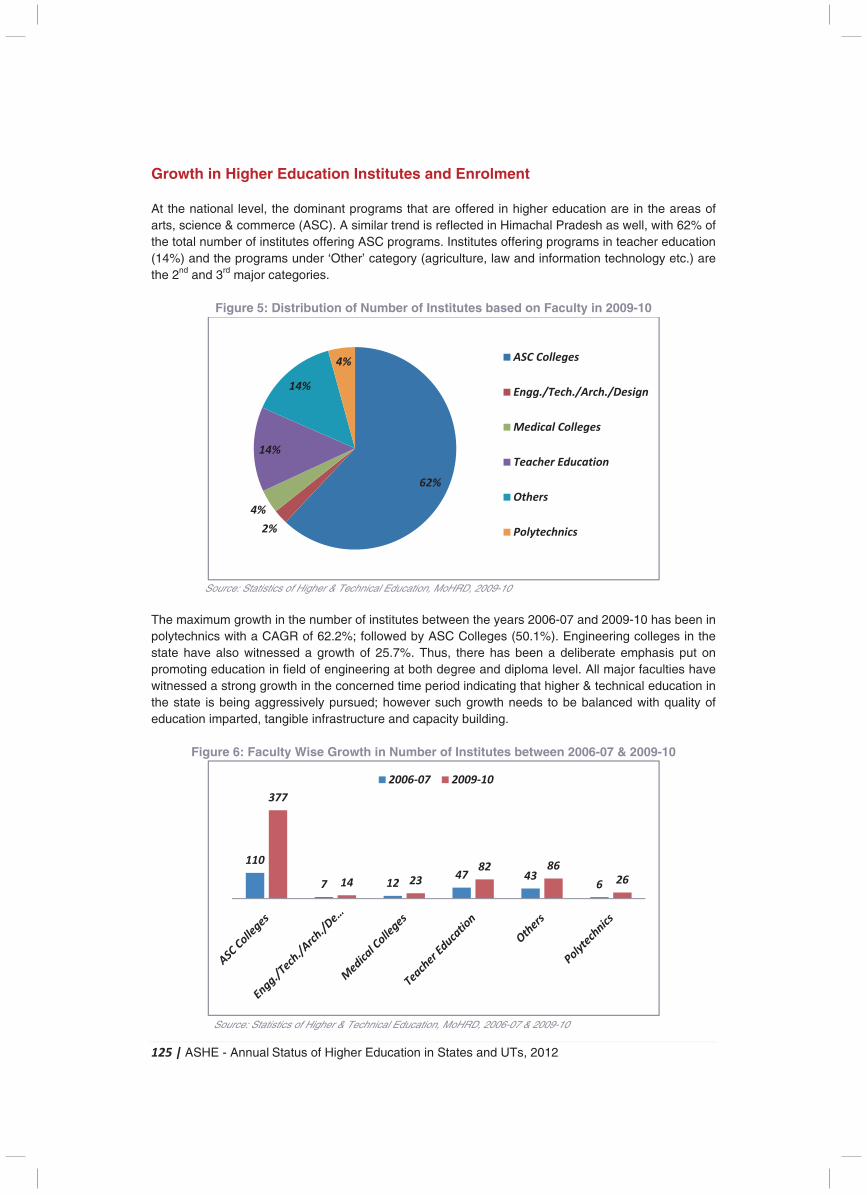
125 | ASHE - Annual Status of Higher Education in States and UTs, 2012
Growth in Higher Education Institutes and Enrolment At the national level, the dominant programs that are offered in higher education are in the areas of arts, science & commerce (ASC). A similar trend is reflected in Himachal Pradesh as well, with 62% of the total number of institutes offering ASC programs. Institutes offering programs in teacher education (14%) and the programs under ‘Other’ category (agriculture, law and information technology etc.) are the 2nd and 3rd major categories.
Figure 5: Distribution of Number of Institutes based on Faculty in 2009-10
Source: Statistics of Higher & Technical Education, MoHRD, 2009-10
The maximum growth in the number of institutes between the years 2006-07 and 2009-10 has been in polytechnics with a CAGR of 62.2%; followed by ASC Colleges (50.1%). Engineering colleges in the state have also witnessed a growth of 25.7%. Thus, there has been a deliberate emphasis put on promoting education in field of engineering at both degree and diploma level. All major faculties have witnessed a strong growth in the concerned time period indicating that higher & technical education in the state is being aggressively pursued; however such growth needs to be balanced with quality of education imparted, tangible infrastructure and capacity building.
Figure 6: Faculty Wise Growth in Number of Institutes between 2006-07 & 2009-10
Source: Statistics of Higher & Technical Education, MoHRD, 2006-07 & 2009-10
(50.1%)
(25.7%) (23.9%) (20.1%) (25.7%) (62.2%)
62%
2%
4%
14%
14%
4% ASC Colleges
Engg./Tech./Arch./Design
Medical Colleges
Teacher Education
Others
Polytechnics
110
7 1247 43
6
377
14 2382 86
26
2006-07 2009-10
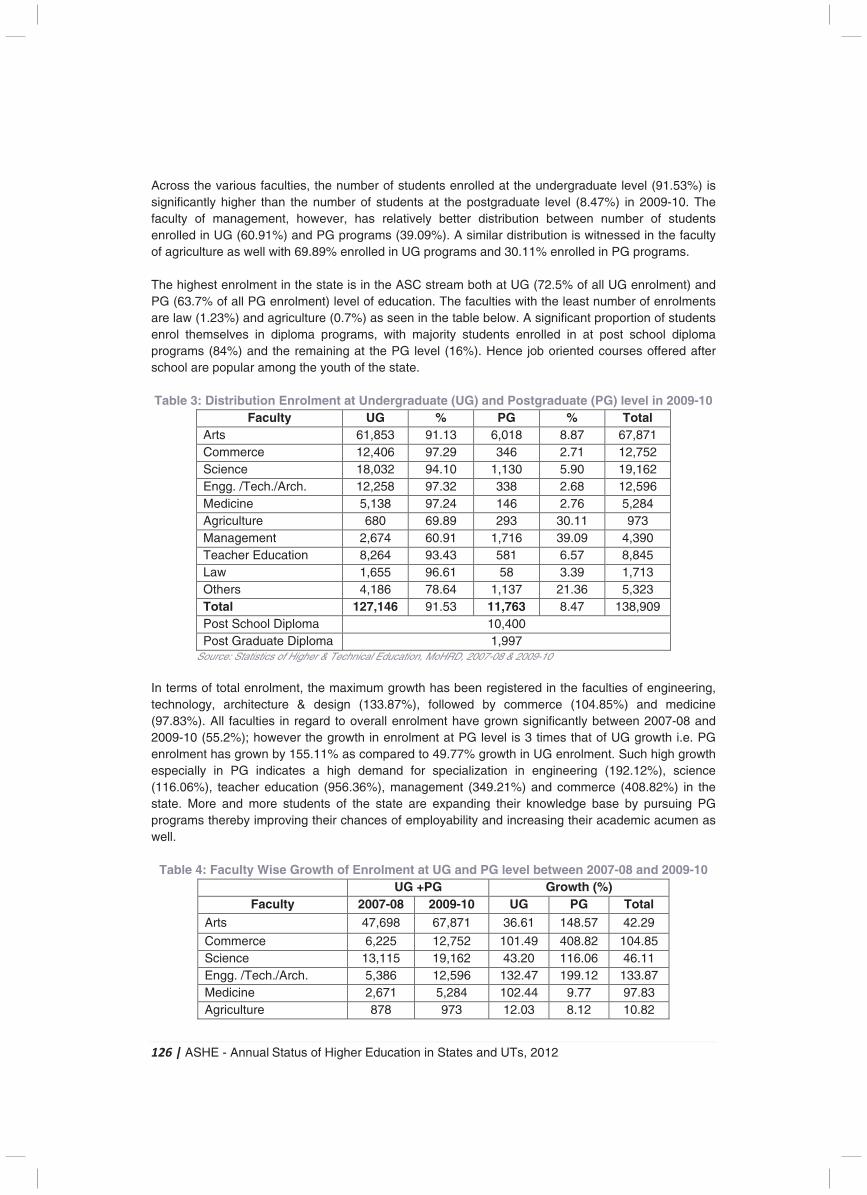
126 | ASHE - Annual Status of Higher Education in States and UTs, 2012
Across the various faculties, the number of students enrolled at the undergraduate level (91.53%) is significantly higher than the number of students at the postgraduate level (8.47%) in 2009-10. The faculty of management, however, has relatively better distribution between number of students enrolled in UG (60.91%) and PG programs (39.09%). A similar distribution is witnessed in the faculty of agriculture as well with 69.89% enrolled in UG programs and 30.11% enrolled in PG programs. The highest enrolment in the state is in the ASC stream both at UG (72.5% of all UG enrolment) and PG (63.7% of all PG enrolment) level of education. The faculties with the least number of enrolments are law (1.23%) and agriculture (0.7%) as seen in the table below. A significant proportion of students enrol themselves in diploma programs, with majority students enrolled in at post school diploma programs (84%) and the remaining at the PG level (16%). Hence job oriented courses offered after school are popular among the youth of the state. Table 3: Distribution Enrolment at Undergraduate (UG) and Postgraduate (PG) level in 2009-10
Faculty UG % PG % Total Arts 61,853 91.13 6,018 8.87 67,871 Commerce 12,406 97.29 346 2.71 12,752 Science 18,032 94.10 1,130 5.90 19,162 Engg. /Tech./Arch. 12,258 97.32 338 2.68 12,596 Medicine 5,138 97.24 146 2.76 5,284 Agriculture 680 69.89 293 30.11 973 Management 2,674 60.91 1,716 39.09 4,390 Teacher Education 8,264 93.43 581 6.57 8,845 Law 1,655 96.61 58 3.39 1,713 Others 4,186 78.64 1,137 21.36 5,323 Total 127,146 91.53 11,763 8.47 138,909 Post School Diploma 10,400 Post Graduate Diploma 1,997
Source: Statistics of Higher & Technical Education, MoHRD, 2007-08 & 2009-10 In terms of total enrolment, the maximum growth has been registered in the faculties of engineering, technology, architecture & design (133.87%), followed by commerce (104.85%) and medicine (97.83%). All faculties in regard to overall enrolment have grown significantly between 2007-08 and 2009-10 (55.2%); however the growth in enrolment at PG level is 3 times that of UG growth i.e. PG enrolment has grown by 155.11% as compared to 49.77% growth in UG enrolment. Such high growth especially in PG indicates a high demand for specialization in engineering (192.12%), science (116.06%), teacher education (956.36%), management (349.21%) and commerce (408.82%) in the state. More and more students of the state are expanding their knowledge base by pursuing PG programs thereby improving their chances of employability and increasing their academic acumen as well.
Table 4: Faculty Wise Growth of Enrolment at UG and PG level between 2007-08 and 2009-10 UG +PG Growth (%)
Faculty 2007-08 2009-10 UG PG Total Arts 47,698 67,871 36.61 148.57 42.29
Commerce 6,225 12,752 101.49 408.82 104.85 Science 13,115 19,162 43.20 116.06 46.11 Engg. /Tech./Arch. 5,386 12,596 132.47 199.12 133.87 Medicine 2,671 5,284 102.44 9.77 97.83 Agriculture 878 973 12.03 8.12 10.82
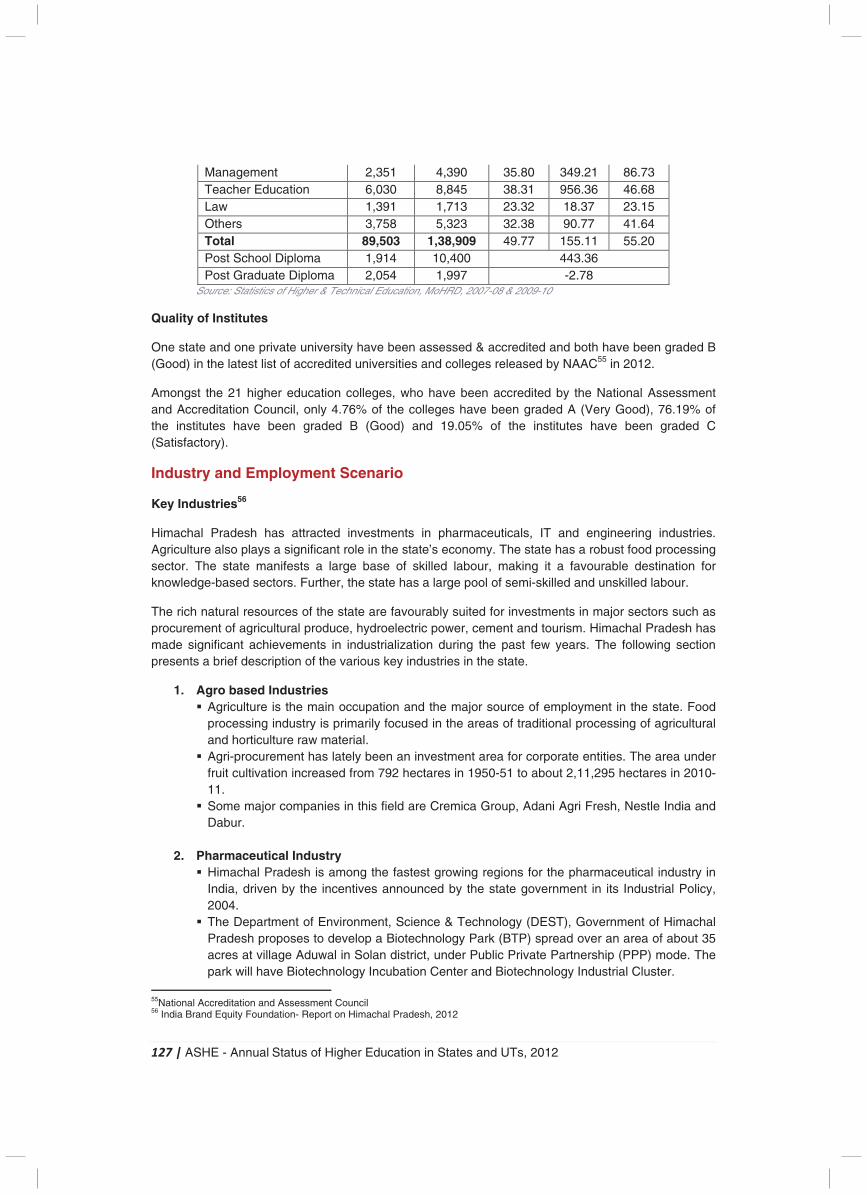
127 | ASHE - Annual Status of Higher Education in States and UTs, 2012
Management 2,351 4,390 35.80 349.21 86.73 Teacher Education 6,030 8,845 38.31 956.36 46.68 Law 1,391 1,713 23.32 18.37 23.15 Others 3,758 5,323 32.38 90.77 41.64 Total 89,503 1,38,909 49.77 155.11 55.20 Post School Diploma 1,914 10,400 443.36 Post Graduate Diploma 2,054 1,997 -2.78
Source: Statistics of Higher & Technical Education, MoHRD, 2007-08 & 2009-10
Quality of Institutes
One state and one private university have been assessed & accredited and both have been graded B (Good) in the latest list of accredited universities and colleges released by NAAC55 in 2012.
Amongst the 21 higher education colleges, who have been accredited by the National Assessment and Accreditation Council, only 4.76% of the colleges have been graded A (Very Good), 76.19% of the institutes have been graded B (Good) and 19.05% of the institutes have been graded C (Satisfactory).
Industry and Employment Scenario
Key Industries56
Himachal Pradesh has attracted investments in pharmaceuticals, IT and engineering industries. Agriculture also plays a significant role in the state’s economy. The state has a robust food processing sector. The state manifests a large base of skilled labour, making it a favourable destination for knowledge-based sectors. Further, the state has a large pool of semi-skilled and unskilled labour.
The rich natural resources of the state are favourably suited for investments in major sectors such as procurement of agricultural produce, hydroelectric power, cement and tourism. Himachal Pradesh has made significant achievements in industrialization during the past few years. The following section presents a brief description of the various key industries in the state.
1. Agro based Industries � Agriculture is the main occupation and the major source of employment in the state. Food
processing industry is primarily focused in the areas of traditional processing of agricultural and horticulture raw material.
� Agri-procurement has lately been an investment area for corporate entities. The area under fruit cultivation increased from 792 hectares in 1950-51 to about 2,11,295 hectares in 2010-11.
� Some major companies in this field are Cremica Group, Adani Agri Fresh, Nestle India and Dabur.
2. Pharmaceutical Industry
� Himachal Pradesh is among the fastest growing regions for the pharmaceutical industry in India, driven by the incentives announced by the state government in its Industrial Policy, 2004.
� The Department of Environment, Science & Technology (DEST), Government of Himachal Pradesh proposes to develop a Biotechnology Park (BTP) spread over an area of about 35 acres at village Aduwal in Solan district, under Public Private Partnership (PPP) mode. The park will have Biotechnology Incubation Center and Biotechnology Industrial Cluster.
55National Accreditation and Assessment Council 56 India Brand Equity Foundation- Report on Himachal Pradesh, 2012
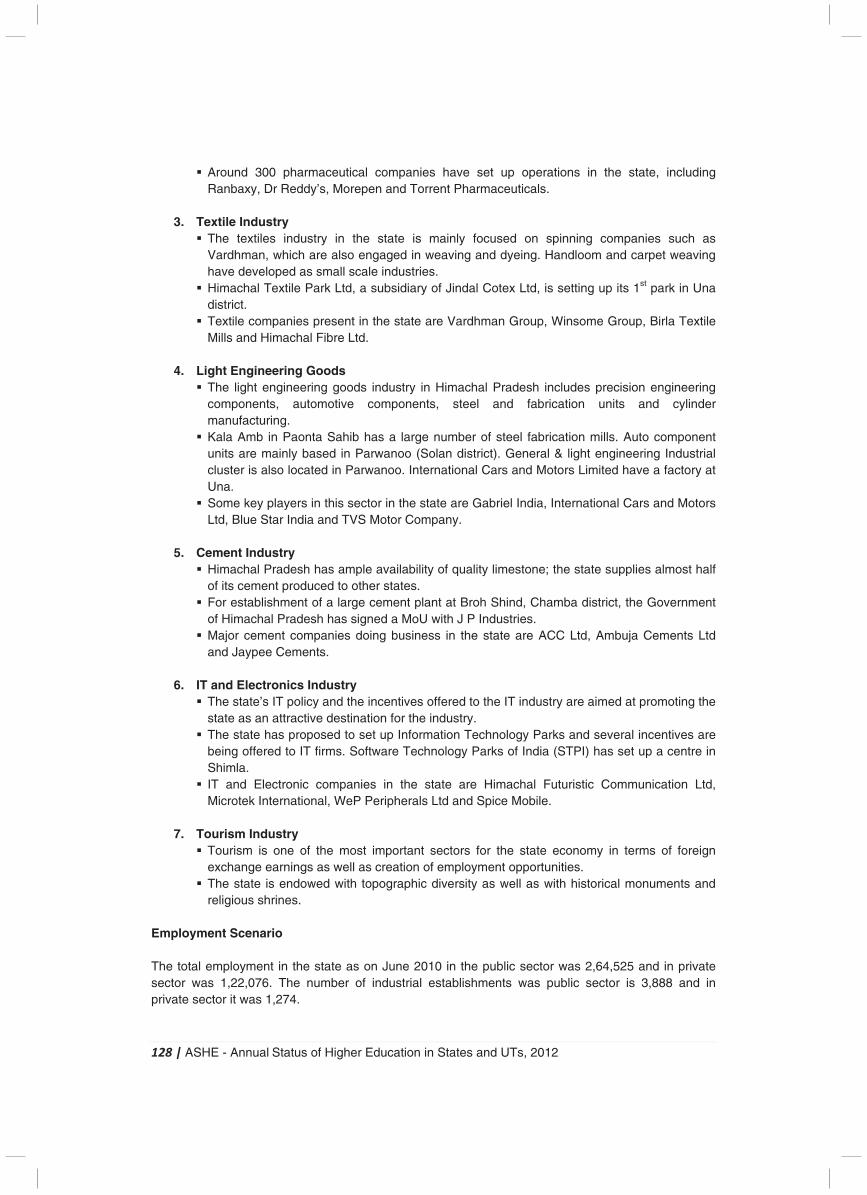
128 | ASHE - Annual Status of Higher Education in States and UTs, 2012
� Around 300 pharmaceutical companies have set up operations in the state, including Ranbaxy, Dr Reddy’s, Morepen and Torrent Pharmaceuticals.
3. Textile Industry � The textiles industry in the state is mainly focused on spinning companies such as
Vardhman, which are also engaged in weaving and dyeing. Handloom and carpet weaving have developed as small scale industries.
� Himachal Textile Park Ltd, a subsidiary of Jindal Cotex Ltd, is setting up its 1st park in Una district.
� Textile companies present in the state are Vardhman Group, Winsome Group, Birla Textile Mills and Himachal Fibre Ltd.
4. Light Engineering Goods
� The light engineering goods industry in Himachal Pradesh includes precision engineering components, automotive components, steel and fabrication units and cylinder manufacturing.
� Kala Amb in Paonta Sahib has a large number of steel fabrication mills. Auto component units are mainly based in Parwanoo (Solan district). General & light engineering Industrial cluster is also located in Parwanoo. International Cars and Motors Limited have a factory at Una.
� Some key players in this sector in the state are Gabriel India, International Cars and Motors Ltd, Blue Star India and TVS Motor Company.
5. Cement Industry
� Himachal Pradesh has ample availability of quality limestone; the state supplies almost half of its cement produced to other states.
� For establishment of a large cement plant at Broh Shind, Chamba district, the Government of Himachal Pradesh has signed a MoU with J P Industries.
� Major cement companies doing business in the state are ACC Ltd, Ambuja Cements Ltd and Jaypee Cements.
6. IT and Electronics Industry
� The state’s IT policy and the incentives offered to the IT industry are aimed at promoting the state as an attractive destination for the industry.
� The state has proposed to set up Information Technology Parks and several incentives are being offered to IT firms. Software Technology Parks of India (STPI) has set up a centre in Shimla.
� IT and Electronic companies in the state are Himachal Futuristic Communication Ltd, Microtek International, WeP Peripherals Ltd and Spice Mobile.
7. Tourism Industry
� Tourism is one of the most important sectors for the state economy in terms of foreign exchange earnings as well as creation of employment opportunities.
� The state is endowed with topographic diversity as well as with historical monuments and religious shrines.
Employment Scenario The total employment in the state as on June 2010 in the public sector was 2,64,525 and in private sector was 1,22,076. The number of industrial establishments was public sector is 3,888 and in private sector it was 1,274.
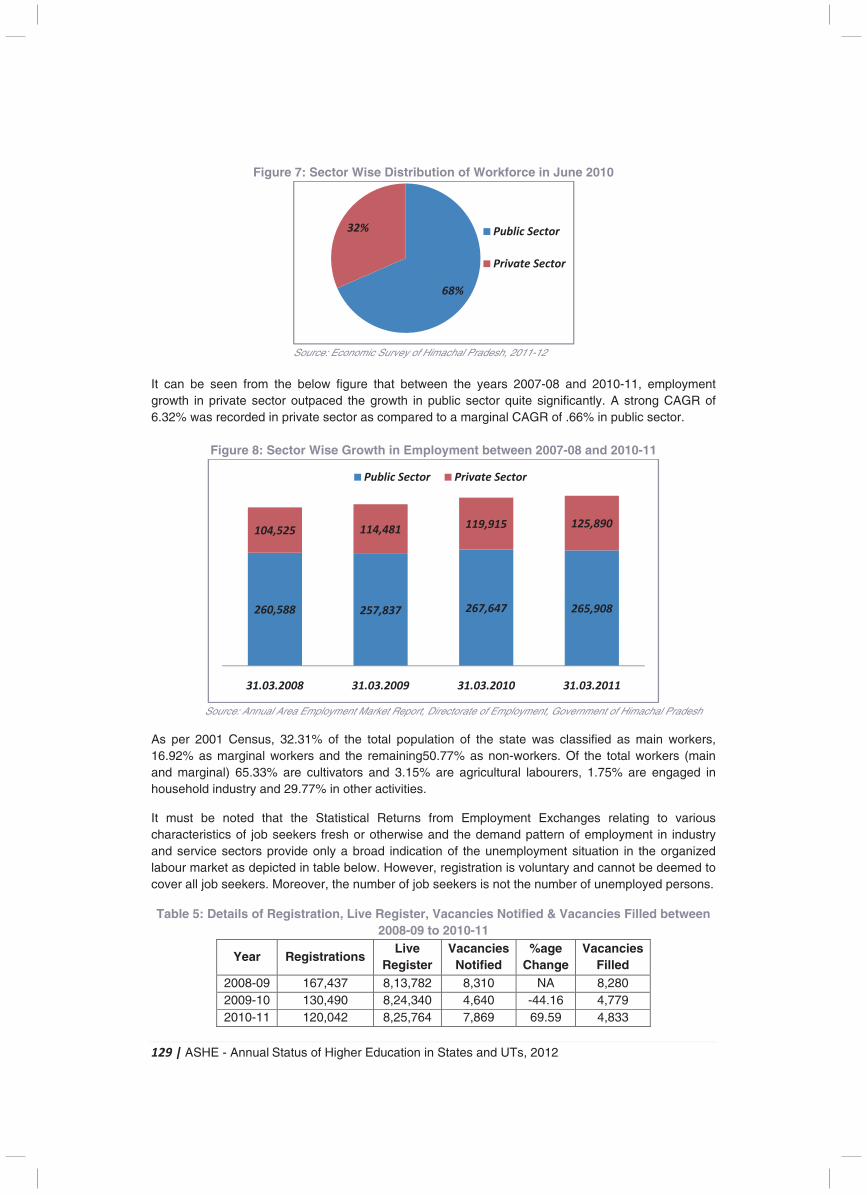
129 | ASHE - Annual Status of Higher Education in States and UTs, 2012
Figure 7: Sector Wise Distribution of Workforce in June 2010
Source: Economic Survey of Himachal Pradesh, 2011-12
It can be seen from the below figure that between the years 2007-08 and 2010-11, employment growth in private sector outpaced the growth in public sector quite significantly. A strong CAGR of 6.32% was recorded in private sector as compared to a marginal CAGR of .66% in public sector.
Figure 8: Sector Wise Growth in Employment between 2007-08 and 2010-11
Source: Annual Area Employment Market Report, Directorate of Employment, Government of Himachal Pradesh
As per 2001 Census, 32.31% of the total population of the state was classified as main workers, 16.92% as marginal workers and the remaining50.77% as non-workers. Of the total workers (main and marginal) 65.33% are cultivators and 3.15% are agricultural labourers, 1.75% are engaged in household industry and 29.77% in other activities.
It must be noted that the Statistical Returns from Employment Exchanges relating to various characteristics of job seekers fresh or otherwise and the demand pattern of employment in industry and service sectors provide only a broad indication of the unemployment situation in the organized labour market as depicted in table below. However, registration is voluntary and cannot be deemed to cover all job seekers. Moreover, the number of job seekers is not the number of unemployed persons. Table 5: Details of Registration, Live Register, Vacancies Notified & Vacancies Filled between
2008-09 to 2010-11
Year Registrations Live
Register Vacancies
Notified %age
ChangeVacancies
Filled 2008-09 167,437 8,13,782 8,310 NA 8,280 2009-10 130,490 8,24,340 4,640 -44.16 4,779 2010-11 120,042 8,25,764 7,869 69.59 4,833
68%
32% Public Sector
Private Sector
260,588 257,837 267,647 265,908
104,525 114,481119,915 125,890
31.03.2008 31.03.2009 31.03.2010 31.03.2011
Public Sector Private Sector
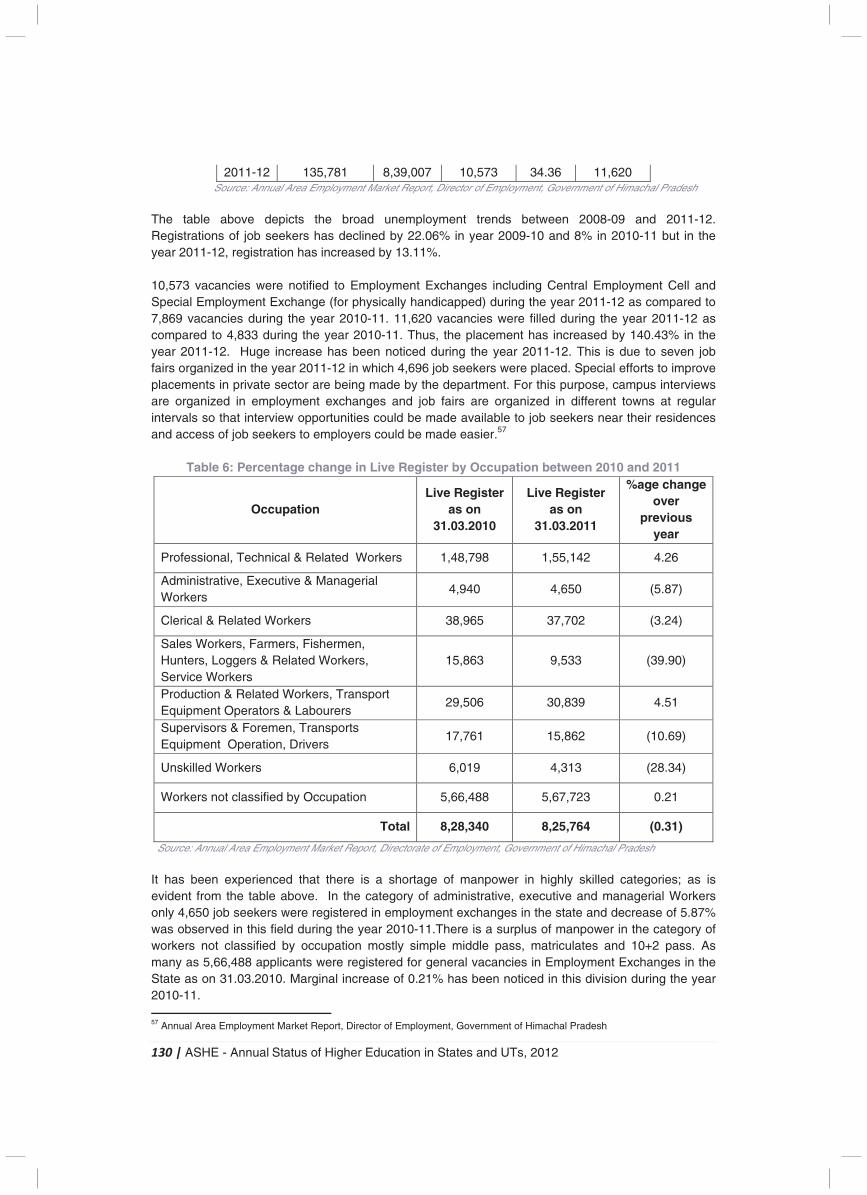
130 | ASHE - Annual Status of Higher Education in States and UTs, 2012
2011-12 135,781 8,39,007 10,573 34.36 11,620 Source: Annual Area Employment Market Report, Director of Employment, Government of Himachal Pradesh
The table above depicts the broad unemployment trends between 2008-09 and 2011-12. Registrations of job seekers has declined by 22.06% in year 2009-10 and 8% in 2010-11 but in the year 2011-12, registration has increased by 13.11%. 10,573 vacancies were notified to Employment Exchanges including Central Employment Cell and Special Employment Exchange (for physically handicapped) during the year 2011-12 as compared to 7,869 vacancies during the year 2010-11. 11,620 vacancies were filled during the year 2011-12 as compared to 4,833 during the year 2010-11. Thus, the placement has increased by 140.43% in the year 2011-12. Huge increase has been noticed during the year 2011-12. This is due to seven job fairs organized in the year 2011-12 in which 4,696 job seekers were placed. Special efforts to improve placements in private sector are being made by the department. For this purpose, campus interviews are organized in employment exchanges and job fairs are organized in different towns at regular intervals so that interview opportunities could be made available to job seekers near their residences and access of job seekers to employers could be made easier.57
Table 6: Percentage change in Live Register by Occupation between 2010 and 2011
Occupation Live Register
as on 31.03.2010
Live Register as on
31.03.2011
%age change over
previous year
Professional, Technical & Related Workers 1,48,798 1,55,142 4.26
Administrative, Executive & Managerial Workers
4,940 4,650 (5.87)
Clerical & Related Workers 38,965 37,702 (3.24)
Sales Workers, Farmers, Fishermen, Hunters, Loggers & Related Workers, Service Workers
15,863 9,533 (39.90)
Production & Related Workers, Transport Equipment Operators & Labourers
29,506 30,839 4.51
Supervisors & Foremen, Transports Equipment Operation, Drivers
17,761 15,862 (10.69)
Unskilled Workers 6,019 4,313 (28.34)
Workers not classified by Occupation 5,66,488 5,67,723 0.21
Total 8,28,340 8,25,764 (0.31)
Source: Annual Area Employment Market Report, Directorate of Employment, Government of Himachal Pradesh It has been experienced that there is a shortage of manpower in highly skilled categories; as is evident from the table above. In the category of administrative, executive and managerial Workers only 4,650 job seekers were registered in employment exchanges in the state and decrease of 5.87% was observed in this field during the year 2010-11.There is a surplus of manpower in the category of workers not classified by occupation mostly simple middle pass, matriculates and 10+2 pass. As many as 5,66,488 applicants were registered for general vacancies in Employment Exchanges in the State as on 31.03.2010. Marginal increase of 0.21% has been noticed in this division during the year 2010-11. 57 Annual Area Employment Market Report, Director of Employment, Government of Himachal Pradesh
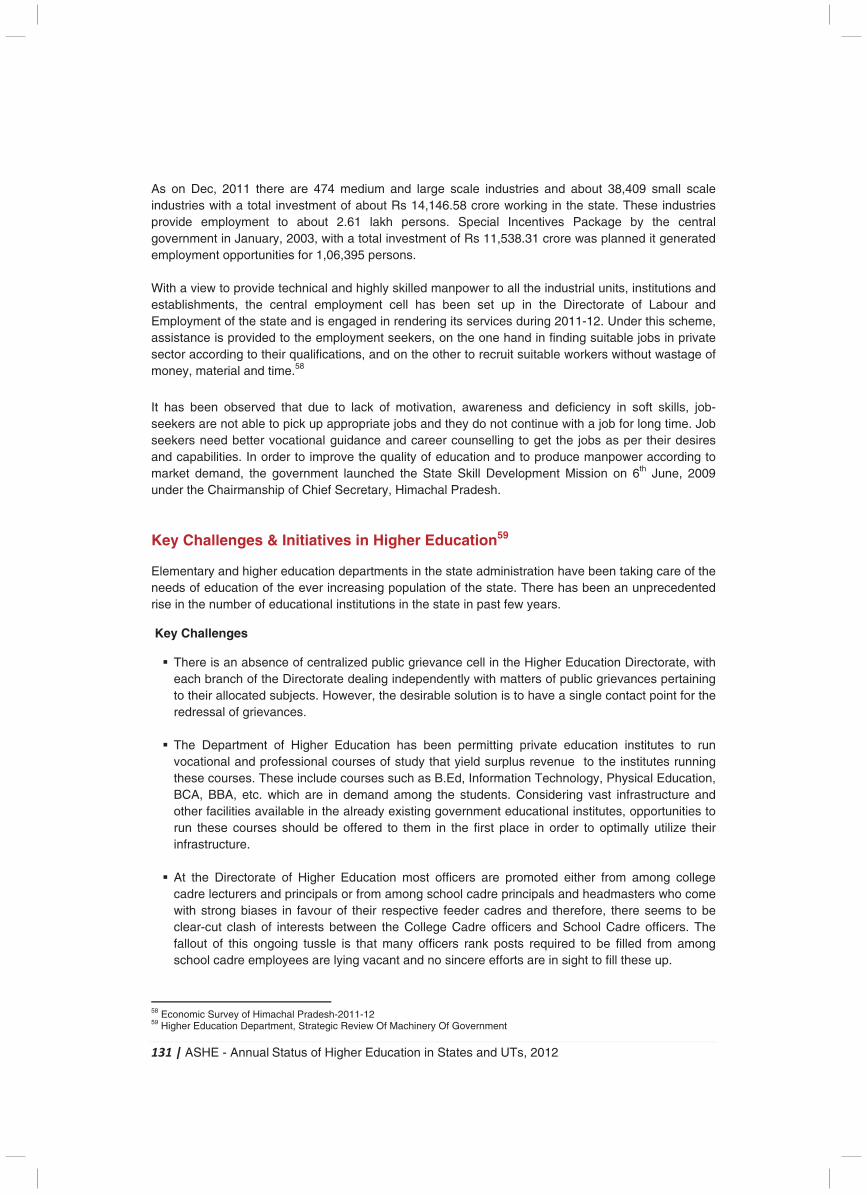
131 | ASHE - Annual Status of Higher Education in States and UTs, 2012
As on Dec, 2011 there are 474 medium and large scale industries and about 38,409 small scale industries with a total investment of about Rs 14,146.58 crore working in the state. These industries provide employment to about 2.61 lakh persons. Special Incentives Package by the central government in January, 2003, with a total investment of Rs 11,538.31 crore was planned it generated employment opportunities for 1,06,395 persons. With a view to provide technical and highly skilled manpower to all the industrial units, institutions and establishments, the central employment cell has been set up in the Directorate of Labour and Employment of the state and is engaged in rendering its services during 2011-12. Under this scheme, assistance is provided to the employment seekers, on the one hand in finding suitable jobs in private sector according to their qualifications, and on the other to recruit suitable workers without wastage of money, material and time.58
It has been observed that due to lack of motivation, awareness and deficiency in soft skills, job-seekers are not able to pick up appropriate jobs and they do not continue with a job for long time. Job seekers need better vocational guidance and career counselling to get the jobs as per their desires and capabilities. In order to improve the quality of education and to produce manpower according to market demand, the government launched the State Skill Development Mission on 6th June, 2009 under the Chairmanship of Chief Secretary, Himachal Pradesh.
Key Challenges & Initiatives in Higher Education59
Elementary and higher education departments in the state administration have been taking care of the needs of education of the ever increasing population of the state. There has been an unprecedented rise in the number of educational institutions in the state in past few years.
Key Challenges
� There is an absence of centralized public grievance cell in the Higher Education Directorate, with each branch of the Directorate dealing independently with matters of public grievances pertaining to their allocated subjects. However, the desirable solution is to have a single contact point for the redressal of grievances.
� The Department of Higher Education has been permitting private education institutes to run vocational and professional courses of study that yield surplus revenue to the institutes running these courses. These include courses such as B.Ed, Information Technology, Physical Education, BCA, BBA, etc. which are in demand among the students. Considering vast infrastructure and other facilities available in the already existing government educational institutes, opportunities to run these courses should be offered to them in the first place in order to optimally utilize their infrastructure.
� At the Directorate of Higher Education most officers are promoted either from among college
cadre lecturers and principals or from among school cadre principals and headmasters who come with strong biases in favour of their respective feeder cadres and therefore, there seems to be clear-cut clash of interests between the College Cadre officers and School Cadre officers. The fallout of this ongoing tussle is that many officers rank posts required to be filled from among school cadre employees are lying vacant and no sincere efforts are in sight to fill these up.
58 Economic Survey of Himachal Pradesh-2011-12 59 Higher Education Department, Strategic Review Of Machinery Of Government
132 | ASHE - Annual Status of Higher Education in States and UTs, 2012
� The officers of the Directorate of Education are of the opinion that it is not worth to open new colleges imparting general education in the state. They rather emphasize on introducing vocational courses in the existing institutes that have strong employer linkages. They feel that market driven demand for various courses be taken into consideration while introducing vocational streams. They also argue that opening of new colleges in the state will alter the social fabric as large scale exodus of youth to urban areas will take place in search of white collar jobs which for them are more yielding in terms of material gains.
� There have been no efforts at the Directorate level to chalk out suitable roadmap of higher
education for the state. A core group of department officers and experts from outside working in the field of education need to be formed under a “Think Tank” to track emerging issues and concerns of higher education. The role of the think tank is to suggest strategies to keep pace with advancements taking place in other parts of the country in imparting quality and relevant education in the state.
� The market is flooded with persons trained in skills, which are not being sought by the industry.
There is a considerable surplus of engineers in the market. It is necessary to bridge the gap between the demand and supply by training manpower in courses required by the industry and suitable to the local requirement.60
Strengths of Higher Education in the State
� High rates of overall literacy in the state. � The state is better placed in the progress of girl child education. � Network of educational institutes in the state has been widened as to bring education facilities to
the doorsteps to the people. � Girl students have been exempted from payment of tuition fee up to post-graduate level courses. � Teaching of English language has been introduced from Class-I level in schools. � Vocational education in the areas of banking, accountancy, bee-keeping and horticulture etc. has
been introduced in twenty-five schools of the state at +2 levels. � Environment education has been made compulsory at school level. � Complete ban has been imposed on corporal punishment. � Computer education in schools has been outsourced to DOEACC.
Reforms Required in the State
� There is a need to set up an interface in the Education Department and NGOs in Himachal Pradesh engaged in social sector projects such as protection of human rights, environmental safety, gender, education, culture, and protection of the disabled.
� Trends emerging in other parts of the country in the field of education need close monitoring and emphasis should be laid on supporting initiatives of private education sector. Government must evolve mechanisms to encourage private investment in education by providing level playing field to investors and allowing them respectable margins of return over their capital investment.
� Statistics on various aspects of education are not either available or are not even compiled which
are needed to analyse situations requiring corrective measures. Other constraints include the lack of accurate and reliable data on education, poor sharing and availability of such information, weak coordination of data collection initiatives, and lack of analytical skills for policy formulation and evaluation.
60Himachal Pradesh Development Report, Planning Commission
133 | ASHE - Annual Status of Higher Education in States and UTs, 2012
� Government must continue its efforts toward revamping education content and creating conditions for quality education. It is expected that the govt.’s efforts will focus on mechanisms for assuring the quality of education through attestation, accreditation, monitoring, and testing.
� Many private education institutions are established and operated not for the main purpose of providing education services but to make a profit, taking advantage of inadequate legal basis for the regulation and control of non-government education institutions; and the delegation of power to local authorities is slow. Such teaching shops should not be permitted to flourish to dupe ignorant students who get misled by tall claims made in the advertisements put up by these unscrupulous institutes.
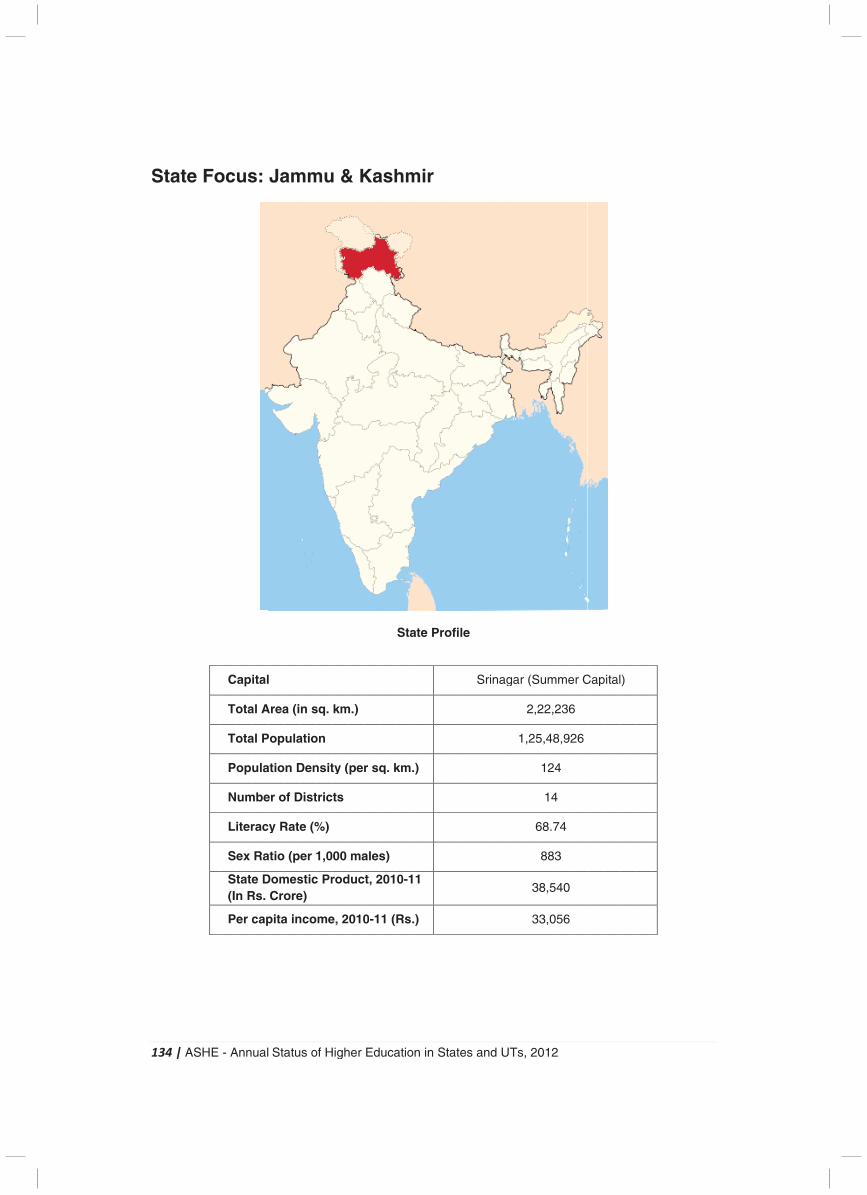
1
S
134
Sta
| A
ate
ASH
e F
HE
Fo
- A
oc
C
To
To
Po
N
Li
Se
St(In
Pe
Ann
us
api
ota
ota
opu
um
iter
ex
taten R
er c
ual
s:
ital
al A
al P
ula
mbe
rac
Ra
e DRs.
cap
Sta
Ja
l
Area
Pop
atio
er o
y R
atio
DomCro
pita
atu
am
a (i
ula
n D
of D
Rate
(pe
mesore
a in
s o
mm
n s
atio
Den
Dist
e (%
er 1
stice)
nco
of H
mu
sq.
on
nsit
tric
%)
1,0
c Pr
me
High
u &
km
ty (
ts
00
rod
e, 2
her
& K
m.)
(per
ma
duc
010
Ed
Ka
r sq
ales
t, 2
0-1
uca
ash
q. k
s)
201
1 (
atio
hm
Sta
km.
0-1
Rs.
on in
mir
ate
.)
11
.)
n S
r
Pr
Stat
ofi
es
le
and
Sri
d U
nag
UTs
gar
1
, 20
(S
2,2
,25
6
38
33
012
um
22,2
5,48
124
14
68.7
883
8,5
3,0
2
mme
236
8,92
4
4
74
3
40
56
er C
6
26
Cap
pitall)
135 | ASHE - Annual Status of Higher Education in States and UTs, 2012
Introduction
Jammu and Kashmir (J&K) is the northern-most state of India and it shares borders with Himachal Pradesh and Punjab, and the neighboring countries of Pakistan, China and Afghanistan. The state consists of three regions, namely Jammu, the Kashmir valley and Ladakh. Srinagar is the summer capital, and Jammu is the winter capital. While the Kashmir valley is famous for its beautiful mountainous landscape, Jammu's numerous shrines attract thousands of Hindu pilgrims every year. Ladakh, also known as "Little Tibet", is renowned for its remote mountain beauty and Buddhist culture.
Jammu and Kashmir's economy is predominantly dependent on agriculture and allied activities. The Kashmir valley is also known for its sericulture and cold-water fisheries. Wood from Kashmir is used to make high-quality cricket bats, popularly known as Kashmir Willow. Agricultural exports from the state include apples, barley, cherries, corn, millet, oranges, rice, peaches, pears, saffron, sorghum, vegetables, and wheat, while manufactured exports include handicrafts, rugs, and shawls.
Education is given utmost importance in the state and it is the only state in India where education is free up to the university level. There are two central universities in the state located one each in the region of Jammu and the region of Kashmir. By an ordinance promulgated by the Governor of the state on 5 September 1969 - which was subsequently replaced by an Act of the State Legislature, the University of Jammu and Kashmir was bifurcated into two full-fledged Universities: the University of Jammu and the University of Kashmir. Accordingly, the statutes and regulations of the Jammu and Kashmir University Act 1965 were modified.61
The state has many other prominent universities & colleges spread out in different regions. The state has reputed agricultural universities, medical colleges and institutes of science and technology.
Universities and University Level Institutes
6 state universities and 2 central universities characterize the higher education landscape of Jammu & Kashmir. There are no private and deemed universities in the state. In addition to these universities, there is 1 Institute of National Importance located in the state namely the National Institute of Technology (NIT) in Srinagar.
The Central University of Kashmir (formerly the Central University of Jammu and Kashmir) was recently established in 2009 as one of the thirteen new central universities established under the Central Universities Act, 2009.62 The 6 state universities offer specializations in the fields of general studies, science & technology and agriculture. Some of the state universities are the Baba Ghulam Shah Badhshah University (est. in 2002), The Islamic University of Science & Technology (est. in 2005), Sher-e-Kashmir University of Agricultural Sciences & Technology of Kashmir (est. in 1982), Shri Mata Vaishno Devi University (est. in 1999) and the University of Jammu (est. in 1969).
61 http://www.kashmiruniversity.net/aboutuok.aspx 62 "J & K: Education Profile".
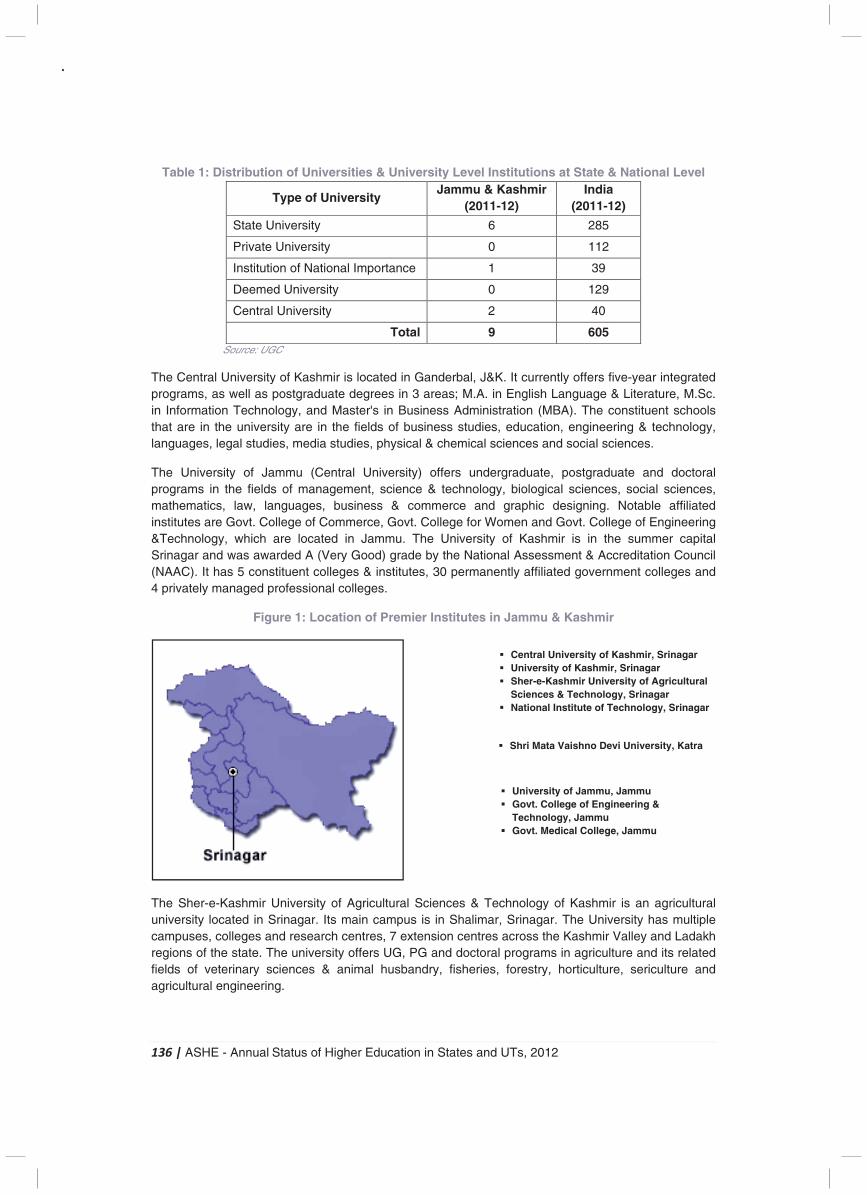
136 | ASHE - Annual Status of Higher Education in States and UTs, 2012
Table 1: Distribution of Universities & University Level Institutions at State & National Level
Type of University Jammu & Kashmir
(2011-12) India
(2011-12)
State University 6 285
Private University 0 112
Institution of National Importance 1 39
Deemed University 0 129
Central University 2 40
Total 9 605 Source: UGC
The Central University of Kashmir is located in Ganderbal, J&K. It currently offers five-year integrated programs, as well as postgraduate degrees in 3 areas; M.A. in English Language & Literature, M.Sc. in Information Technology, and Master's in Business Administration (MBA). The constituent schools that are in the university are in the fields of business studies, education, engineering & technology, languages, legal studies, media studies, physical & chemical sciences and social sciences.
The University of Jammu (Central University) offers undergraduate, postgraduate and doctoral programs in the fields of management, science & technology, biological sciences, social sciences, mathematics, law, languages, business & commerce and graphic designing. Notable affiliated institutes are Govt. College of Commerce, Govt. College for Women and Govt. College of Engineering &Technology, which are located in Jammu. The University of Kashmir is in the summer capital Srinagar and was awarded A (Very Good) grade by the National Assessment & Accreditation Council (NAAC). It has 5 constituent colleges & institutes, 30 permanently affiliated government colleges and 4 privately managed professional colleges.
Figure 1: Location of Premier Institutes in Jammu & Kashmir
The Sher-e-Kashmir University of Agricultural Sciences & Technology of Kashmir is an agricultural university located in Srinagar. Its main campus is in Shalimar, Srinagar. The University has multiple campuses, colleges and research centres, 7 extension centres across the Kashmir Valley and Ladakh regions of the state. The university offers UG, PG and doctoral programs in agriculture and its related fields of veterinary sciences & animal husbandry, fisheries, forestry, horticulture, sericulture and agricultural engineering.
� Central University of Kashmir, Srinagar � University of Kashmir, Srinagar � Sher-e-Kashmir University of Agricultural
Sciences & Technology, Srinagar � National Institute of Technology, Srinagar
� University of Jammu, Jammu � Govt. College of Engineering &
Technology, Jammu � Govt. Medical College, Jammu
� Shri Mata Vaishno Devi University, Katra
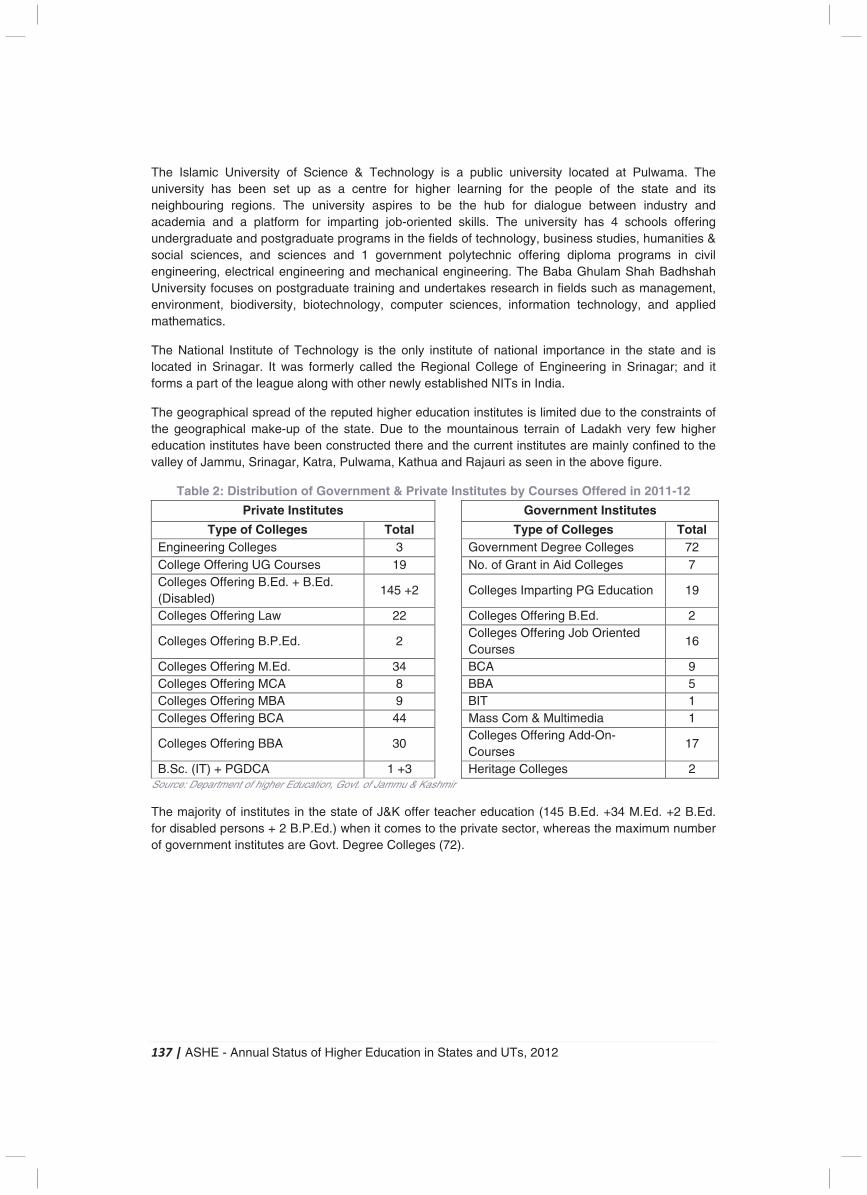
137 | ASHE - Annual Status of Higher Education in States and UTs, 2012
The Islamic University of Science & Technology is a public university located at Pulwama. The university has been set up as a centre for higher learning for the people of the state and its neighbouring regions. The university aspires to be the hub for dialogue between industry and academia and a platform for imparting job-oriented skills. The university has 4 schools offering undergraduate and postgraduate programs in the fields of technology, business studies, humanities & social sciences, and sciences and 1 government polytechnic offering diploma programs in civil engineering, electrical engineering and mechanical engineering. The Baba Ghulam Shah Badhshah University focuses on postgraduate training and undertakes research in fields such as management, environment, biodiversity, biotechnology, computer sciences, information technology, and applied mathematics.
The National Institute of Technology is the only institute of national importance in the state and is located in Srinagar. It was formerly called the Regional College of Engineering in Srinagar; and it forms a part of the league along with other newly established NITs in India.
The geographical spread of the reputed higher education institutes is limited due to the constraints of the geographical make-up of the state. Due to the mountainous terrain of Ladakh very few higher education institutes have been constructed there and the current institutes are mainly confined to the valley of Jammu, Srinagar, Katra, Pulwama, Kathua and Rajauri as seen in the above figure.
Table 2: Distribution of Government & Private Institutes by Courses Offered in 2011-12
Private Institutes Government Institutes
Type of Colleges Total Type of Colleges Total Engineering Colleges 3 Government Degree Colleges 72 College Offering UG Courses 19 No. of Grant in Aid Colleges 7 Colleges Offering B.Ed. + B.Ed. (Disabled)
145 +2 Colleges Imparting PG Education 19
Colleges Offering Law 22 Colleges Offering B.Ed. 2
Colleges Offering B.P.Ed. 2 Colleges Offering Job Oriented Courses
16
Colleges Offering M.Ed. 34 BCA 9 Colleges Offering MCA 8 BBA 5 Colleges Offering MBA 9 BIT 1 Colleges Offering BCA 44 Mass Com & Multimedia 1
Colleges Offering BBA 30 Colleges Offering Add-On-Courses
17
B.Sc. (IT) + PGDCA 1 +3 Heritage Colleges 2 Source: Department of higher Education, Govt. of Jammu & Kashmir
The majority of institutes in the state of J&K offer teacher education (145 B.Ed. +34 M.Ed. +2 B.Ed. for disabled persons + 2 B.P.Ed.) when it comes to the private sector, whereas the maximum number of government institutes are Govt. Degree Colleges (72).
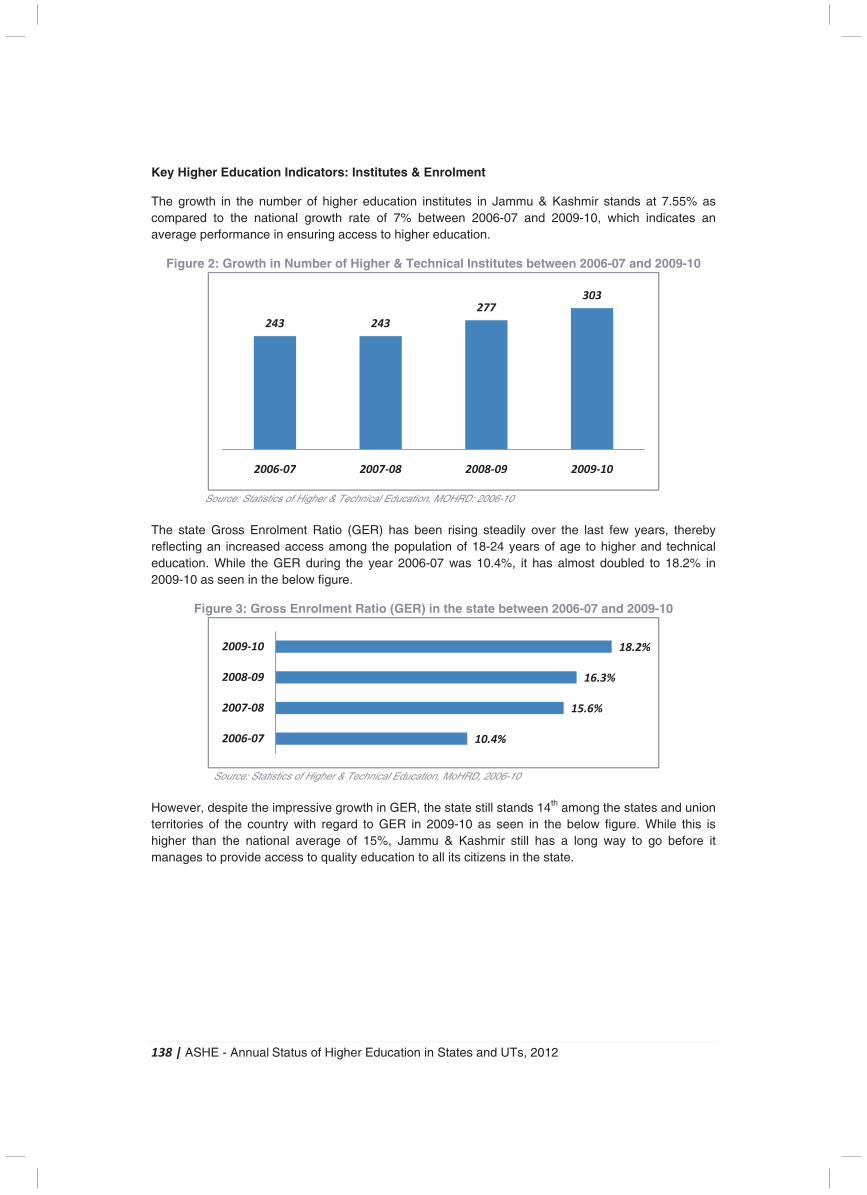
138 | ASHE - Annual Status of Higher Education in States and UTs, 2012
Key Higher Education Indicators: Institutes & Enrolment
The growth in the number of higher education institutes in Jammu & Kashmir stands at 7.55% as compared to the national growth rate of 7% between 2006-07 and 2009-10, which indicates an average performance in ensuring access to higher education.
Figure 2: Growth in Number of Higher & Technical Institutes between 2006-07 and 2009-10
Source: Statistics of Higher & Technical Education, MOHRD: 2006-10
The state Gross Enrolment Ratio (GER) has been rising steadily over the last few years, thereby reflecting an increased access among the population of 18-24 years of age to higher and technical education. While the GER during the year 2006-07 was 10.4%, it has almost doubled to 18.2% in 2009-10 as seen in the below figure.
Figure 3: Gross Enrolment Ratio (GER) in the state between 2006-07 and 2009-10
Source: Statistics of Higher & Technical Education, MoHRD, 2006-10
However, despite the impressive growth in GER, the state still stands 14th among the states and union territories of the country with regard to GER in 2009-10 as seen in the below figure. While this is higher than the national average of 15%, Jammu & Kashmir still has a long way to go before it manages to provide access to quality education to all its citizens in the state.
243 243
277
303
2006-07 2007-08 2008-09 2009-10
10.4%
15.6%
16.3%
18.2%
2006-07
2007-08
2008-09
2009-10
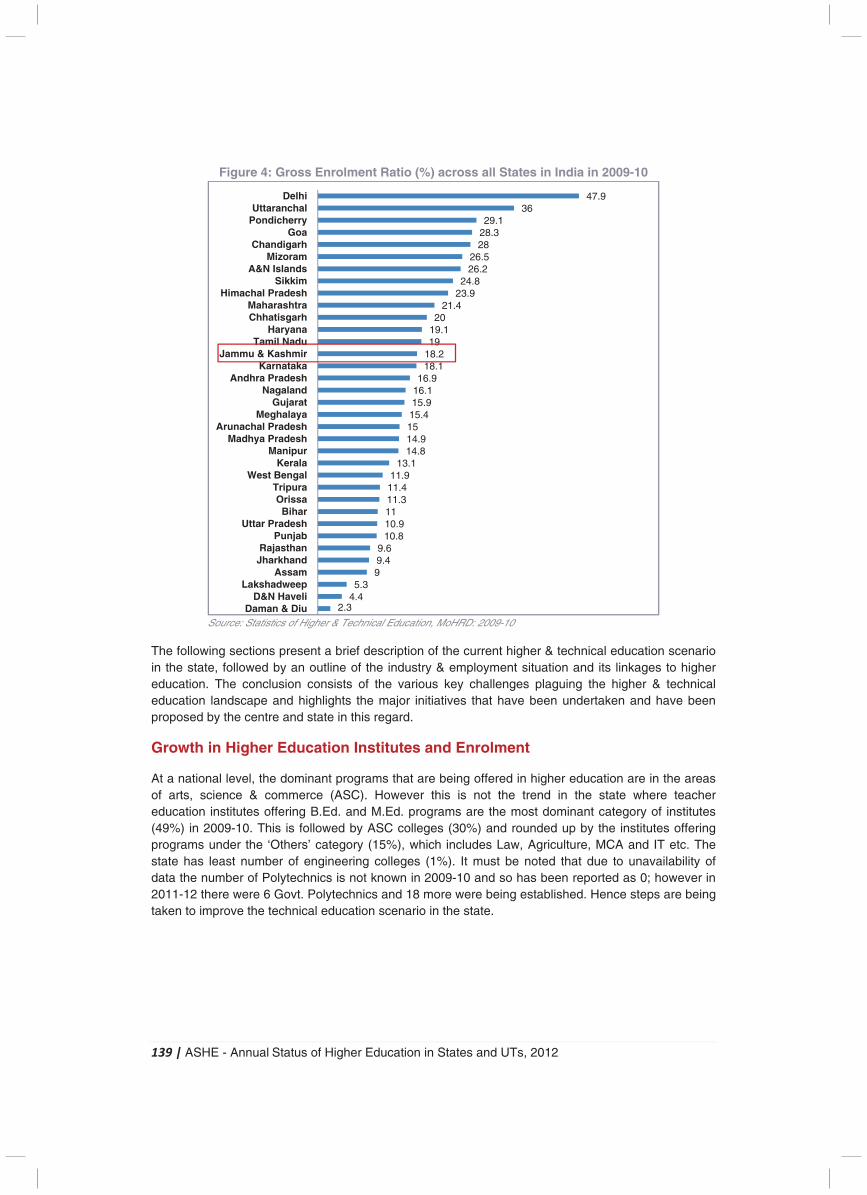
139 | ASHE - Annual Status of Higher Education in States and UTs, 2012
Figure 4: Gross Enrolment Ratio (%) across all States in India in 2009-10
Source: Statistics of Higher & Technical Education, MoHRD: 2009-10
The following sections present a brief description of the current higher & technical education scenario in the state, followed by an outline of the industry & employment situation and its linkages to higher education. The conclusion consists of the various key challenges plaguing the higher & technical education landscape and highlights the major initiatives that have been undertaken and have been proposed by the centre and state in this regard.
Growth in Higher Education Institutes and Enrolment
At a national level, the dominant programs that are being offered in higher education are in the areas of arts, science & commerce (ASC). However this is not the trend in the state where teacher education institutes offering B.Ed. and M.Ed. programs are the most dominant category of institutes (49%) in 2009-10. This is followed by ASC colleges (30%) and rounded up by the institutes offering programs under the ‘Others’ category (15%), which includes Law, Agriculture, MCA and IT etc. The state has least number of engineering colleges (1%). It must be noted that due to unavailability of data the number of Polytechnics is not known in 2009-10 and so has been reported as 0; however in 2011-12 there were 6 Govt. Polytechnics and 18 more were being established. Hence steps are being taken to improve the technical education scenario in the state.
2.34.45.3
99.49.6
10.810.91111.311.411.9
13.114.814.91515.415.916.116.9
18.118.21919.120
21.423.924.8
26.226.5
2828.329.1
3647.9
Daman & DiuD&N Haveli
LakshadweepAssam
JharkhandRajasthan
PunjabUttar Pradesh
BiharOrissa
TripuraWest Bengal
KeralaManipur
Madhya PradeshArunachal Pradesh
MeghalayaGujarat
NagalandAndhra Pradesh
KarnatakaJammu & Kashmir
Tamil NaduHaryana
ChhatisgarhMaharashtra
Himachal PradeshSikkim
A&N IslandsMizoram
ChandigarhGoa
PondicherryUttaranchal
Delhi
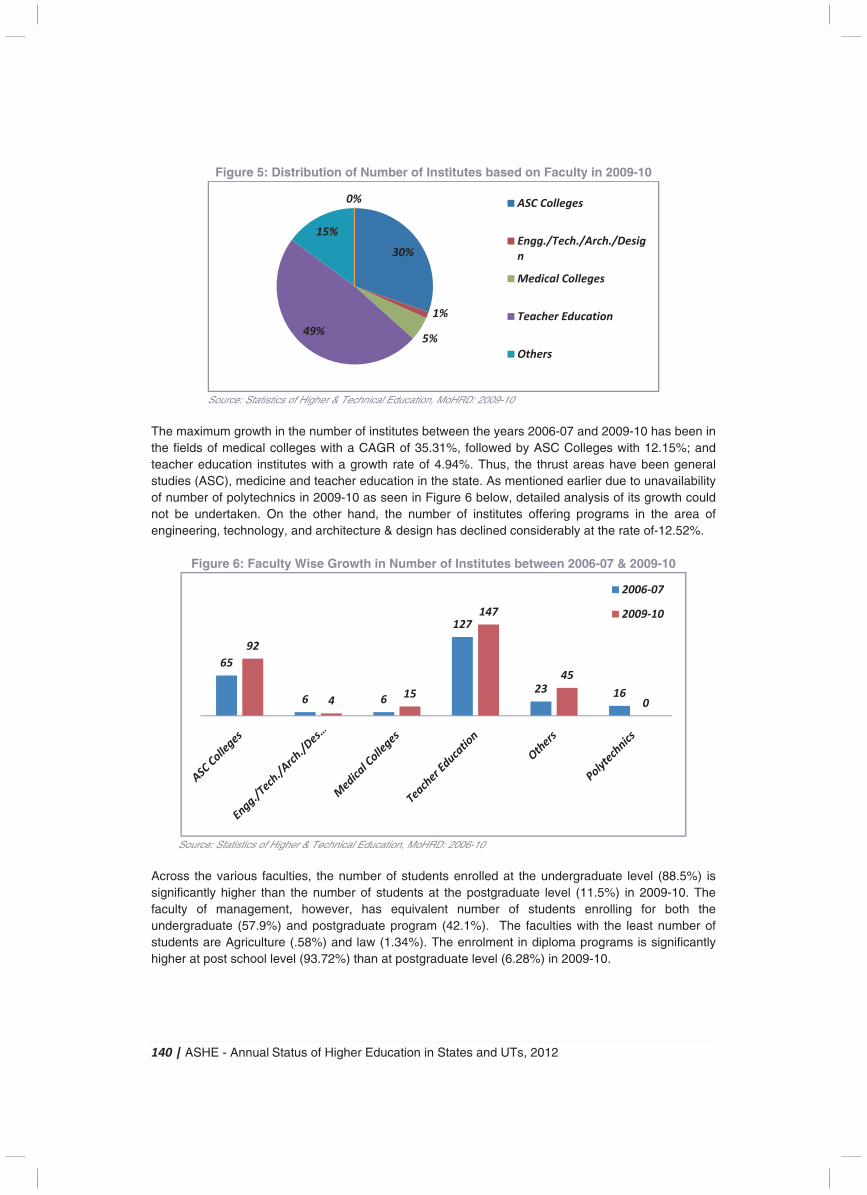
140 | ASHE - Annual Status of Higher Education in States and UTs, 2012
Figure 5: Distribution of Number of Institutes based on Faculty in 2009-10
Source: Statistics of Higher & Technical Education, MoHRD: 2009-10
The maximum growth in the number of institutes between the years 2006-07 and 2009-10 has been in the fields of medical colleges with a CAGR of 35.31%, followed by ASC Colleges with 12.15%; and teacher education institutes with a growth rate of 4.94%. Thus, the thrust areas have been general studies (ASC), medicine and teacher education in the state. As mentioned earlier due to unavailability of number of polytechnics in 2009-10 as seen in Figure 6 below, detailed analysis of its growth could not be undertaken. On the other hand, the number of institutes offering programs in the area of engineering, technology, and architecture & design has declined considerably at the rate of-12.52%.
Figure 6: Faculty Wise Growth in Number of Institutes between 2006-07 & 2009-10
Source: Statistics of Higher & Technical Education, MoHRD: 2006-10
Across the various faculties, the number of students enrolled at the undergraduate level (88.5%) is significantly higher than the number of students at the postgraduate level (11.5%) in 2009-10. The faculty of management, however, has equivalent number of students enrolling for both the undergraduate (57.9%) and postgraduate program (42.1%). The faculties with the least number of students are Agriculture (.58%) and law (1.34%). The enrolment in diploma programs is significantly higher at post school level (93.72%) than at postgraduate level (6.28%) in 2009-10.
(12.15%)
(-12.52%) (35.31%)
(4.94%)
(24.79%)
30%
1%
5%49%
15%
0% ASC Colleges
Engg./Tech./Arch./Desig
n
Medical Colleges
Teacher Education
Others
65
6 6
127
23 16
92
415
147
45
0
2006-07
2009-10
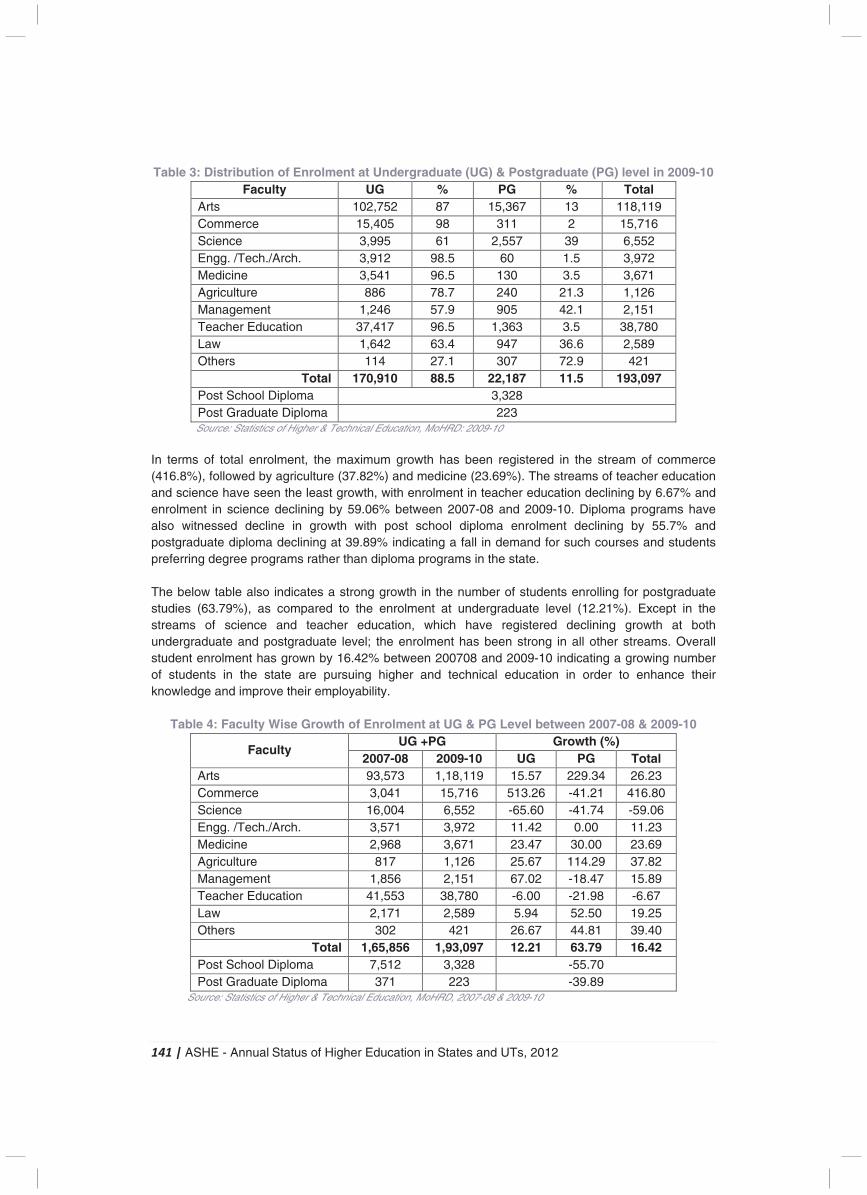
141 | ASHE - Annual Status of Higher Education in States and UTs, 2012
Table 3: Distribution of Enrolment at Undergraduate (UG) & Postgraduate (PG) level in 2009-10 Faculty UG % PG % Total
Arts 102,752 87 15,367 13 118,119 Commerce 15,405 98 311 2 15,716 Science 3,995 61 2,557 39 6,552 Engg. /Tech./Arch. 3,912 98.5 60 1.5 3,972 Medicine 3,541 96.5 130 3.5 3,671 Agriculture 886 78.7 240 21.3 1,126 Management 1,246 57.9 905 42.1 2,151 Teacher Education 37,417 96.5 1,363 3.5 38,780 Law 1,642 63.4 947 36.6 2,589 Others 114 27.1 307 72.9 421
Total 170,910 88.5 22,187 11.5 193,097 Post School Diploma 3,328 Post Graduate Diploma 223 Source: Statistics of Higher & Technical Education, MoHRD: 2009-10
In terms of total enrolment, the maximum growth has been registered in the stream of commerce (416.8%), followed by agriculture (37.82%) and medicine (23.69%). The streams of teacher education and science have seen the least growth, with enrolment in teacher education declining by 6.67% and enrolment in science declining by 59.06% between 2007-08 and 2009-10. Diploma programs have also witnessed decline in growth with post school diploma enrolment declining by 55.7% and postgraduate diploma declining at 39.89% indicating a fall in demand for such courses and students preferring degree programs rather than diploma programs in the state. The below table also indicates a strong growth in the number of students enrolling for postgraduate studies (63.79%), as compared to the enrolment at undergraduate level (12.21%). Except in the streams of science and teacher education, which have registered declining growth at both undergraduate and postgraduate level; the enrolment has been strong in all other streams. Overall student enrolment has grown by 16.42% between 200708 and 2009-10 indicating a growing number of students in the state are pursuing higher and technical education in order to enhance their knowledge and improve their employability.
Table 4: Faculty Wise Growth of Enrolment at UG & PG Level between 2007-08 & 2009-10
Faculty UG +PG Growth (%)
2007-08 2009-10 UG PG Total Arts 93,573 1,18,119 15.57 229.34 26.23 Commerce 3,041 15,716 513.26 -41.21 416.80 Science 16,004 6,552 -65.60 -41.74 -59.06 Engg. /Tech./Arch. 3,571 3,972 11.42 0.00 11.23 Medicine 2,968 3,671 23.47 30.00 23.69 Agriculture 817 1,126 25.67 114.29 37.82 Management 1,856 2,151 67.02 -18.47 15.89 Teacher Education 41,553 38,780 -6.00 -21.98 -6.67 Law 2,171 2,589 5.94 52.50 19.25 Others 302 421 26.67 44.81 39.40
Total 1,65,856 1,93,097 12.21 63.79 16.42 Post School Diploma 7,512 3,328 -55.70 Post Graduate Diploma 371 223 -39.89
Source: Statistics of Higher & Technical Education, MoHRD, 2007-08 & 2009-10
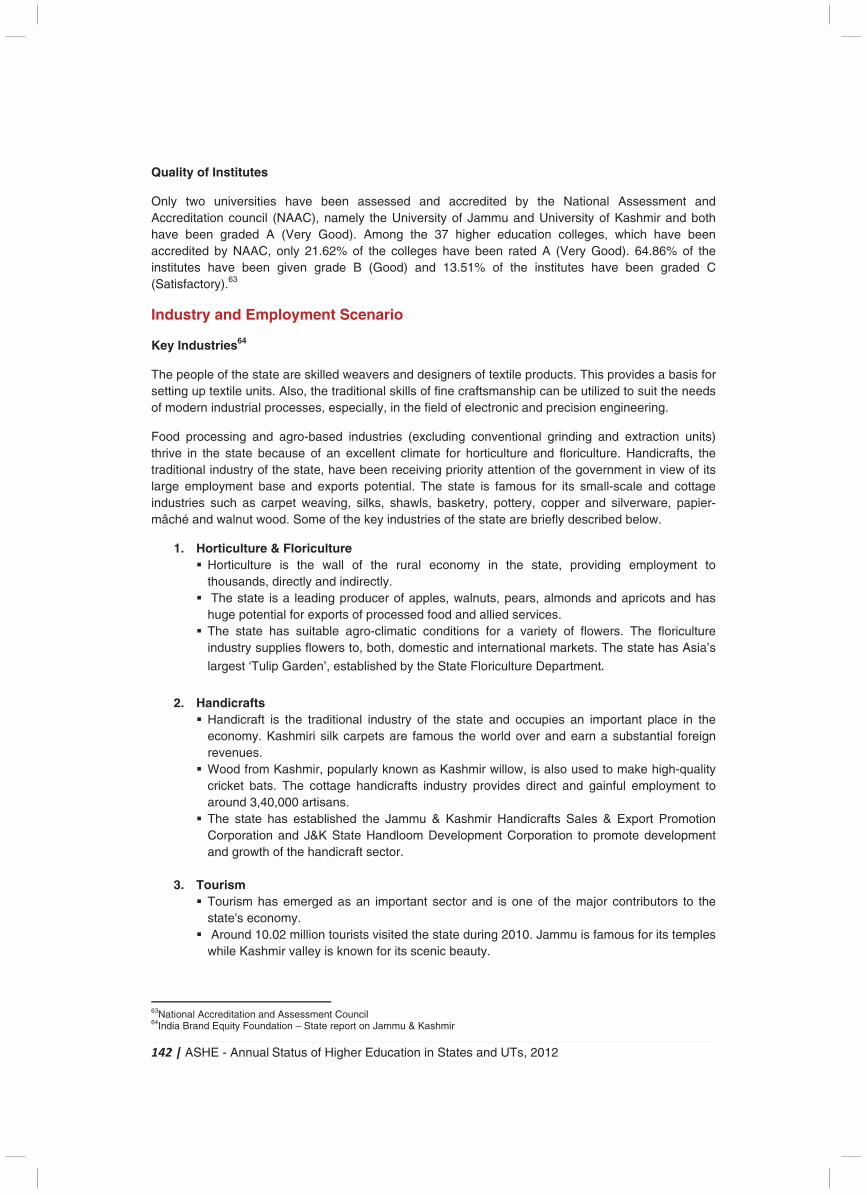
142 | ASHE - Annual Status of Higher Education in States and UTs, 2012
Quality of Institutes
Only two universities have been assessed and accredited by the National Assessment and Accreditation council (NAAC), namely the University of Jammu and University of Kashmir and both have been graded A (Very Good). Among the 37 higher education colleges, which have been accredited by NAAC, only 21.62% of the colleges have been rated A (Very Good). 64.86% of the institutes have been given grade B (Good) and 13.51% of the institutes have been graded C (Satisfactory).63
Industry and Employment Scenario
Key Industries64
The people of the state are skilled weavers and designers of textile products. This provides a basis for setting up textile units. Also, the traditional skills of fine craftsmanship can be utilized to suit the needs of modern industrial processes, especially, in the field of electronic and precision engineering.
Food processing and agro-based industries (excluding conventional grinding and extraction units) thrive in the state because of an excellent climate for horticulture and floriculture. Handicrafts, the traditional industry of the state, have been receiving priority attention of the government in view of its large employment base and exports potential. The state is famous for its small-scale and cottage industries such as carpet weaving, silks, shawls, basketry, pottery, copper and silverware, papier-mâché and walnut wood. Some of the key industries of the state are briefly described below.
1. Horticulture & Floriculture � Horticulture is the wall of the rural economy in the state, providing employment to
thousands, directly and indirectly. � The state is a leading producer of apples, walnuts, pears, almonds and apricots and has
huge potential for exports of processed food and allied services. � The state has suitable agro-climatic conditions for a variety of flowers. The floriculture
industry supplies flowers to, both, domestic and international markets. The state has Asia’s
largest ‘Tulip Garden’, established by the State Floriculture Department.
2. Handicrafts � Handicraft is the traditional industry of the state and occupies an important place in the
economy. Kashmiri silk carpets are famous the world over and earn a substantial foreign revenues.
� Wood from Kashmir, popularly known as Kashmir willow, is also used to make high-quality cricket bats. The cottage handicrafts industry provides direct and gainful employment to around 3,40,000 artisans.
� The state has established the Jammu & Kashmir Handicrafts Sales & Export Promotion Corporation and J&K State Handloom Development Corporation to promote development and growth of the handicraft sector.
3. Tourism � Tourism has emerged as an important sector and is one of the major contributors to the
state's economy. � Around 10.02 million tourists visited the state during 2010. Jammu is famous for its temples
while Kashmir valley is known for its scenic beauty.
63National Accreditation and Assessment Council 64India Brand Equity Foundation – State report on Jammu & Kashmir
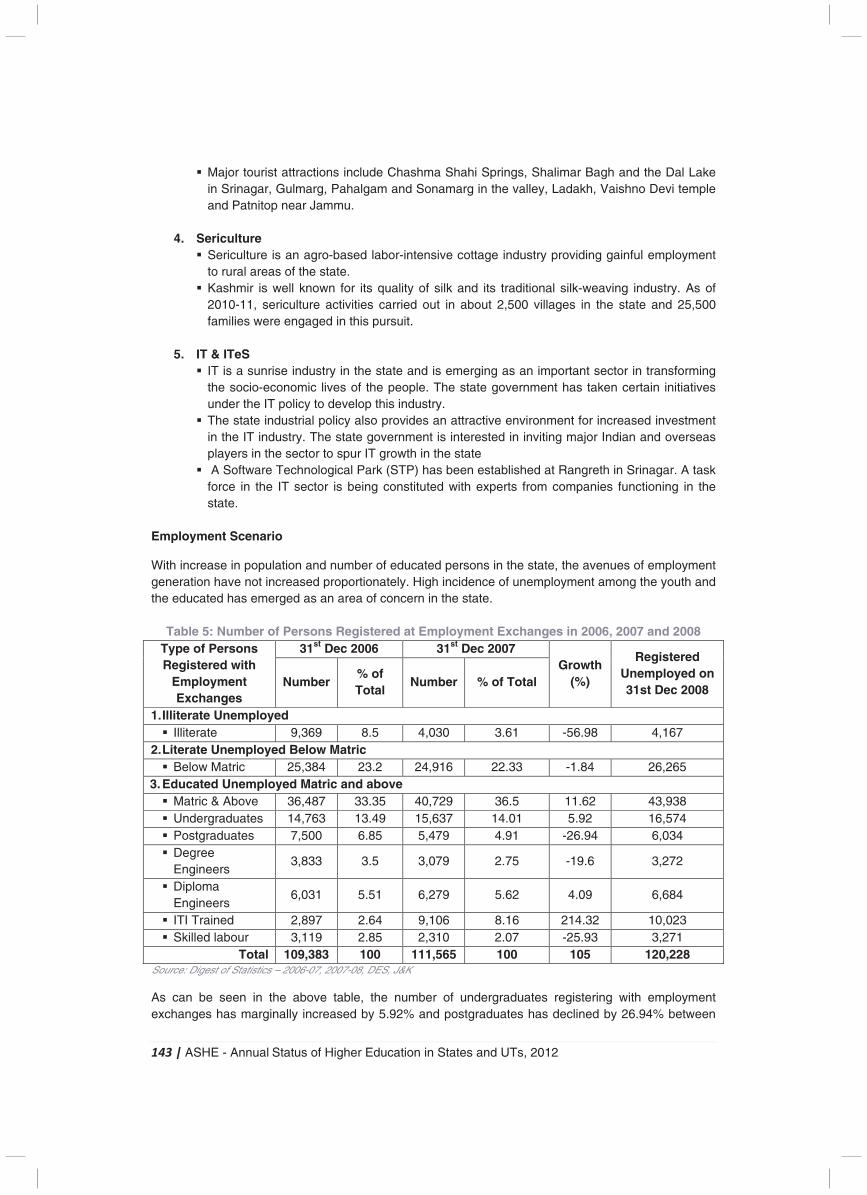
143 | ASHE - Annual Status of Higher Education in States and UTs, 2012
� Major tourist attractions include Chashma Shahi Springs, Shalimar Bagh and the Dal Lake in Srinagar, Gulmarg, Pahalgam and Sonamarg in the valley, Ladakh, Vaishno Devi temple and Patnitop near Jammu.
4. Sericulture � Sericulture is an agro-based labor-intensive cottage industry providing gainful employment
to rural areas of the state. � Kashmir is well known for its quality of silk and its traditional silk-weaving industry. As of
2010-11, sericulture activities carried out in about 2,500 villages in the state and 25,500 families were engaged in this pursuit.
5. IT & ITeS � IT is a sunrise industry in the state and is emerging as an important sector in transforming
the socio-economic lives of the people. The state government has taken certain initiatives under the IT policy to develop this industry.
� The state industrial policy also provides an attractive environment for increased investment in the IT industry. The state government is interested in inviting major Indian and overseas players in the sector to spur IT growth in the state
� A Software Technological Park (STP) has been established at Rangreth in Srinagar. A task force in the IT sector is being constituted with experts from companies functioning in the state.
Employment Scenario
With increase in population and number of educated persons in the state, the avenues of employment generation have not increased proportionately. High incidence of unemployment among the youth and the educated has emerged as an area of concern in the state.
Table 5: Number of Persons Registered at Employment Exchanges in 2006, 2007 and 2008 Type of Persons Registered with
Employment Exchanges
31st Dec 2006 31st Dec 2007 Growth
(%)
Registered Unemployed on 31st Dec 2008
Number % of Total
Number % of Total
1. Illiterate Unemployed � Illiterate 9,369 8.5 4,030 3.61 -56.98 4,167
2. Literate Unemployed Below Matric � Below Matric 25,384 23.2 24,916 22.33 -1.84 26,265
3. Educated Unemployed Matric and above � Matric & Above 36,487 33.35 40,729 36.5 11.62 43,938 � Undergraduates 14,763 13.49 15,637 14.01 5.92 16,574 � Postgraduates 7,500 6.85 5,479 4.91 -26.94 6,034 � Degree
Engineers 3,833 3.5 3,079 2.75 -19.6 3,272
� Diploma Engineers
6,031 5.51 6,279 5.62 4.09 6,684
� ITI Trained 2,897 2.64 9,106 8.16 214.32 10,023 � Skilled labour 3,119 2.85 2,310 2.07 -25.93 3,271
Total 109,383 100 111,565 100 105 120,228 Source: Digest of Statistics – 2006-07, 2007-08, DES, J&K
As can be seen in the above table, the number of undergraduates registering with employment exchanges has marginally increased by 5.92% and postgraduates has declined by 26.94% between
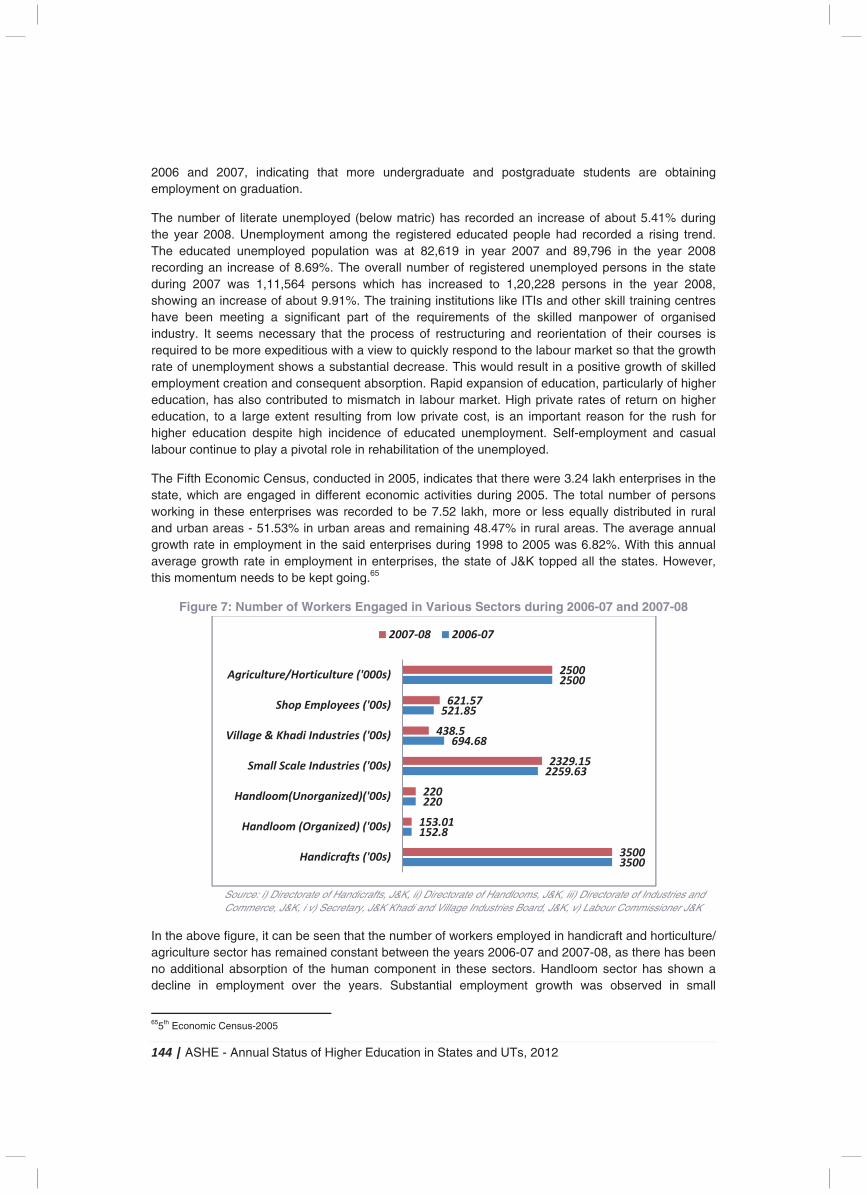
144 | ASHE - Annual Status of Higher Education in States and UTs, 2012
2006 and 2007, indicating that more undergraduate and postgraduate students are obtaining employment on graduation.
The number of literate unemployed (below matric) has recorded an increase of about 5.41% during the year 2008. Unemployment among the registered educated people had recorded a rising trend. The educated unemployed population was at 82,619 in year 2007 and 89,796 in the year 2008 recording an increase of 8.69%. The overall number of registered unemployed persons in the state during 2007 was 1,11,564 persons which has increased to 1,20,228 persons in the year 2008, showing an increase of about 9.91%. The training institutions like ITIs and other skill training centres have been meeting a significant part of the requirements of the skilled manpower of organised industry. It seems necessary that the process of restructuring and reorientation of their courses is required to be more expeditious with a view to quickly respond to the labour market so that the growth rate of unemployment shows a substantial decrease. This would result in a positive growth of skilled employment creation and consequent absorption. Rapid expansion of education, particularly of higher education, has also contributed to mismatch in labour market. High private rates of return on higher education, to a large extent resulting from low private cost, is an important reason for the rush for higher education despite high incidence of educated unemployment. Self-employment and casual labour continue to play a pivotal role in rehabilitation of the unemployed.
The Fifth Economic Census, conducted in 2005, indicates that there were 3.24 lakh enterprises in the state, which are engaged in different economic activities during 2005. The total number of persons working in these enterprises was recorded to be 7.52 lakh, more or less equally distributed in rural and urban areas - 51.53% in urban areas and remaining 48.47% in rural areas. The average annual growth rate in employment in the said enterprises during 1998 to 2005 was 6.82%. With this annual average growth rate in employment in enterprises, the state of J&K topped all the states. However, this momentum needs to be kept going.65
Figure 7: Number of Workers Engaged in Various Sectors during 2006-07 and 2007-08
Source: i) Directorate of Handicrafts, J&K, ii) Directorate of Handlooms, J&K, iii) Directorate of Industries and Commerce, J&K, i v) Secretary, J&K Khadi and Village Industries Board, J&K, v) Labour Commissioner J&K
In the above figure, it can be seen that the number of workers employed in handicraft and horticulture/ agriculture sector has remained constant between the years 2006-07 and 2007-08, as there has been no additional absorption of the human component in these sectors. Handloom sector has shown a decline in employment over the years. Substantial employment growth was observed in small
655th Economic Census-2005
3500
152.8
220
2259.63
694.68
521.85
2500
3500
153.01
220
2329.15
438.5
621.57
2500
Handicrafts ('00s)
Handloom (Organized) ('00s)
Handloom(Unorganized)('00s)
Small Scale Industries ('00s)
Village & Khadi Industries ('00s)
Shop Employees ('00s)
Agriculture/Horticulture ('000s)
2007-08 2006-07
145 | ASHE - Annual Status of Higher Education in States and UTs, 2012
enterprises, which tackled the task of unemployment to some extent by expanding their employment base. Regarding village and Khadi industries, the employment scenario has drastically reduced from 69,468 to 43,850, thereby registering a negative growth of 37.13%.
Key Challenges and Initiatives in Higher Education
Key Challenges of Higher Education Some of the problems that are plaguing the higher and technical education landscape of the state are: � The state government needs to prepare a comprehensive plan of higher education; information
with regard to number of type of district wise colleges, institutes, and GER & faculty position (institute-wise) should be collected with the aim to introduce employable courses in the colleges of the state.
� With regard to approved reforms agenda for 11th Five Year Plan like introduction of semester system, credit system, revision of curricula, autonomy etc., it is observed that the state has not initiated major steps to implement the agenda for higher education. For better quality of higher education, the state should start with the revision of curriculum and universalizing the semester system etc.
� Need to look into the existing and additional capacities that need to be created in higher education by aligning supply side from school education and demand side from labour market, to draw linkages between the sectors in higher education.
� Need for government to shift the salary component of the plan fund into non-plan fund. � Many of the 11th Five Year Plan reforms still have not been implemented fully. � Limited number of colleges and universities in the state has undergone assessment by NAAC.
Only 24 colleges (of 273 colleges) and 2 universities (of 6 universities) in the state have been accredited by NAAC till date. Similarly, NBA has accredited limited number of courses in technical institutes.
� There is a need to review the functioning, infrastructure, efficiency and contribution of polytechnics in the state. More government technical institutes are needed and the state should not rely on private participation alone.
Major Achievements during 11th Five Year Plan During the 11th Five Year Plan, the main thrust of the state in higher and technical education was to increase the Gross Enrolment ratio (GER) and to reduce the caste, gender and regional disparities in higher education by way of capacity expansion. Some of the achievements of the 11th Five Year Plan were: � A total of 45 degree colleges were established in the state during the 11th Five Year Plan. The
total enrolment in degree colleges increased by about 55% in the state. The enrolment of female students has also increased manifold and is now at par with the male students, which clearly reflects the reduction of disparities on the basis of gender.
� High GER growth has been due to massive capacity expansion by way of establishing new degree colleges and university campuses across the length and breadth of the state.
� EDUSAT facilities under the Indian Space Research Organization (ISRO) have been implemented. Two hubs are connected to nearly 40 degree colleges through Satellite Interactive Terminals and through this system quality study material and lecture were transmitted and the students in rural areas benefitted immensely.
� Two central universities one each in Jammu and Kashmir division were approved and established in the 11th Five Year Plan.
146 | ASHE - Annual Status of Higher Education in States and UTs, 2012
� All state universities have introduced job oriented technical degree/courses as a result of which most of the students are receiving placement after completion of their degree/course.
Thrust area of the 12th Five Year Plan
For the 12th Five Year Plan, the main thrust is on improved quality of education, institutions of excellence, which are world class and facilitating private investments including PPP in education. The basic objectives/thrust areas identified in higher education are: � Consolidation, Quality Improvement and Skill Development. � Improvement in faculty. � Increase in GER and capacity expansion. � ICT coverage of all universities and colleges. � Facilitating private investment including Public Private Partnership (PPP).
Initiatives Proposed
There are few initiatives that the state government has proposed for the years to come in order to make the higher & technical education infrastructure in the state reach world class standards. Few of these initiatives and identified action areas are as given below: � 18 new polytechnics are being established under integrated skill development mission. � There is a need to create State Council for Higher Education to better align and coordinate the
higher education system. � Consolidating, improving quality and skill development, improvement in GER, ICT coverage of all
colleges and universities and introduction of Public Private Partnership (PPP) � The state will try to introduce National Vocational Quality Education Framework (NVQEF) with the
assistance of AICTE/ MoHRD. This will help in providing vocational training to students of the state.
� Three new job oriented vocational courses have been proposed. � National Council of Skill Development is contemplating to establish 5,000 skill development
centres in PPP mode. � The state plans to increase the number of M.Phil. and Ph.D. degree students to ensure availability
of sufficient number of persons eligible for filling up the universities and colleges’ vacant faculty posts.
� Proposal to establish an IIT in PPP mode � Enhancing the enrolment of science students to promote research in science related fields. � Islamic University of Science & Technology will start offering PG courses in life sciences in 2012-
13. � The state plans on getting all the trades of all ITIs affiliated to National Council for Vocational
Training (NCVT), to give better placement opportunities in national and international organizations.
� An advance training institute is proposed to be setup in PPP mode.
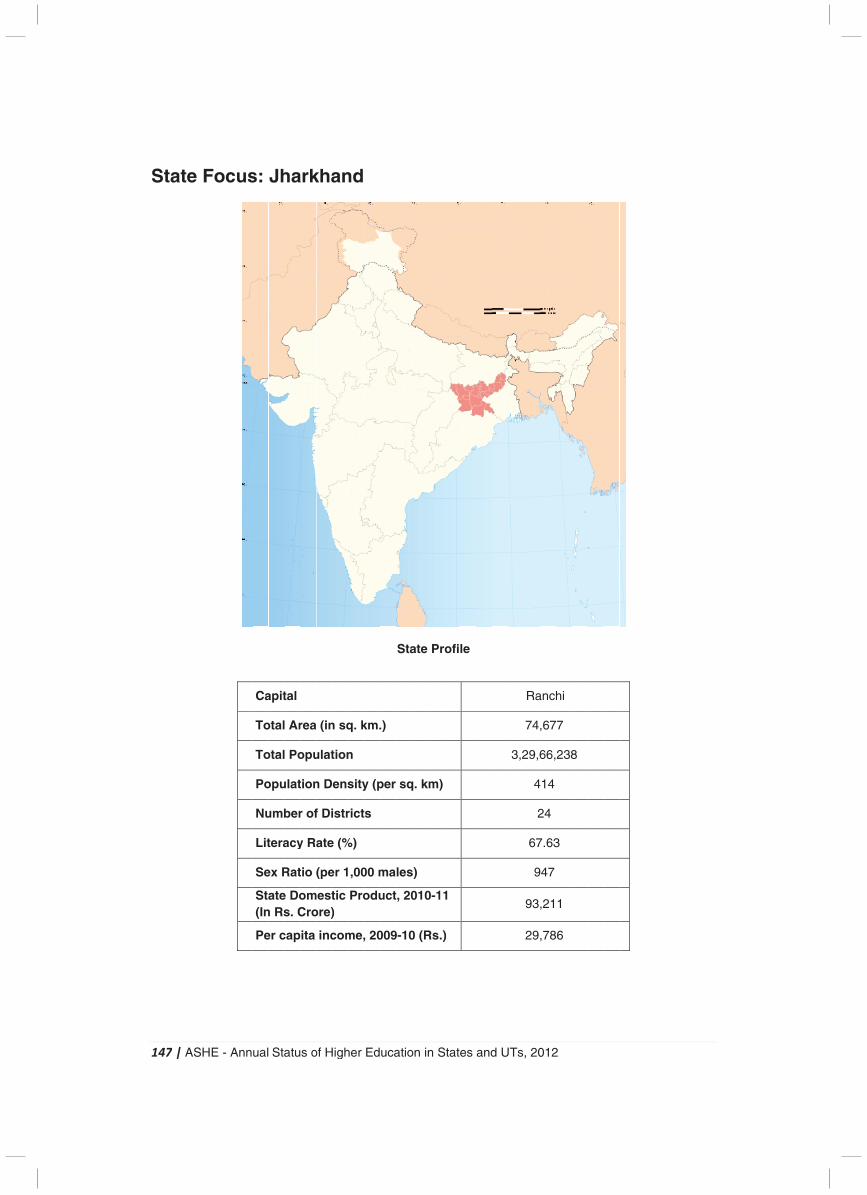
1
S
147
Sta
| A
ate
ASH
e F
HE
Fo
- A
oc
Ann
us
ual
s:
Ca
To
To
Po
Nu
Lit
Se
Sta(In
Pe
Sta
Jh
apit
otal
otal
opu
umb
tera
ex R
aten Rs
er c
atu
ha
tal
Ar
Po
ulat
ber
acy
Rat
e Dos. C
cap
s o
ark
rea
opu
tion
r of
y Ra
tio (
omCro
ita
of H
kha
(in
ulat
n D
f Di
ate
(pe
mestore)
inc
High
an
n sq
tion
ens
istr
e (%
er 1
tic )
com
her
nd
q. k
n
sity
rict
%)
,00
Pro
me,
Ed
km.
y (p
s
00 m
odu
, 20
uca
.)
per
ma
uct
009
atio
Sta
sq
les
, 20
9-10
on in
ate
q. k
s)
010
0 (R
n S
Pr
m)
0-11
Rs.)
Stat
ofi
1
)
es
le
and
d U
UTs
3,2
, 20
Ra
74
29,6
4
2
67
9
93
29
012
anc
,67
66,
414
24
7.63
947
,21
,78
2
hi
77
238
3
1
86
8
148 | ASHE - Annual Status of Higher Education in States and UTs, 2012
Introduction
Jharkhand was formed in 2000, when it was carved out of the southern part of Bihar. The state shares its border with the states of Bihar, Uttar Pradesh, Chhattisgarh, Odisha and West Bengal. The state has a concentration of the nation’s highly industrialized cities such as Jamshedpur, Ranchi, Bokaro Steel City and Dhanbad. Jharkhand is well known for its abundance in natural resources. Jharkhand that includes coal, iron ore, bauxite, copper, mica, graphite, silver, uranium and limestone, contributes about 40% of the nation’s mineral wealth. The natural resources, favourable policy initiatives and the location specific advantages of the state support private investments in sectors such as mining and metal extraction, engineering, iron and steel and chemicals.
The state houses some of the nation’s best technical and management institutes such as the National Institute of Technology (NIT), Jamshedpur; Birla Institute of Technology (BIT), Ranchi; Birsa Institute of Technology, Sindri; Indian School of Mines, Dhanbad and Xavier’s Labour Research Institute, Jamshedpur.
Universities and University Level Institutes
Higher education in Jharkhand is characterized by 14 universities and university level institutions, which includes 1 central university, 7 state universities, 3 private universities, 2 deemed universities and 1 institute of national importance. In the field of technical education, the state is home to several leading institutes, which attract students from across the nation.
The National Institute of Technology, Jamshedpur is one of the 30 NITs in India and currently enrols more than 3,000 students in its undergraduate and postgraduate programs. Established in 1960, the institute is considered to be among the best NITs in the nation. Another premier institute located in the state is the Birsa Institute of Technology, Sindri; which is the only government engineering college in Jharkhand. The institute is affiliated to Vinoda Bhave University and enrols about 3,000 students.
The Indian School of Mines, Dhanbad is a premier institute, which was established in 1926 on the lines of the Royal School of Mines in London. While the institute was established with a view to offer mining education, it has now become a complete technical institute. The institute is the one of the very few institutes in India, which caters to the human resource requirements in the areas of mining, petroleum, mining machinery, mineral engineering and earth sciences. The institute will soon be converted into an Indian Institute of Technology (IIT), with the resolution for conversion already been approved. The Birla Institute of Technology, Mesra – an autonomous engineering and technology oriented institute of higher education – is another premier institute located in the state.
In addition to the technical institutes, there are management institutes of national repute in the state as well. The Xavier Labour Research Institute, Jamshedpur (XLRI) is a private graduate business school and is often considered the best business school for personnel management and industrial relations. Established in 1949, the institute is placed among the top five business schools in India. Another premier management institute in the state is the Xavier Institute of Social Service, which was established in 1955, with an objective of producing resources trained in the areas of rural development, personnel management and industrial relations. Other key institute located in the state is the National Institute of Foundry and Forge Technology (NIFFT), which was established by the government of India in collaboration with UNDP-UNESCO during 1966 and offers programs in the areas of foundry technology, forge technology, manufacturing engineering, metallurgy and materials engineering, applied science and humanities and environmental engineering. A national law university (National University of Study and Research in Law) has also been established in the state in the year 2010 and currently enrols about 300 students.
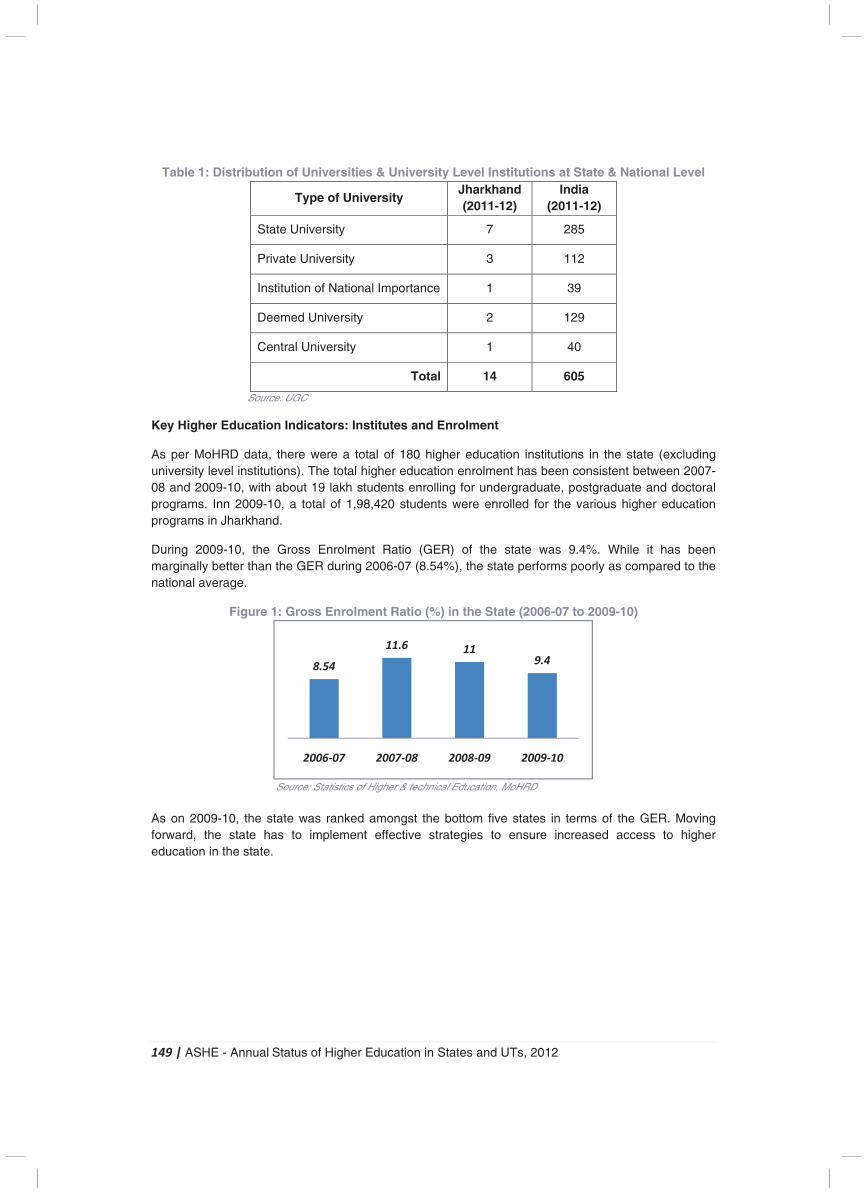
149 | ASHE - Annual Status of Higher Education in States and UTs, 2012
Table 1: Distribution of Universities & University Level Institutions at State & National Level
Type of University Jharkhand (2011-12)
India (2011-12)
State University 7 285
Private University 3 112
Institution of National Importance 1 39
Deemed University 2 129
Central University 1 40
Total 14 605
Source: UGC
Key Higher Education Indicators: Institutes and Enrolment
As per MoHRD data, there were a total of 180 higher education institutions in the state (excluding university level institutions). The total higher education enrolment has been consistent between 2007-08 and 2009-10, with about 19 lakh students enrolling for undergraduate, postgraduate and doctoral programs. Inn 2009-10, a total of 1,98,420 students were enrolled for the various higher education programs in Jharkhand.
During 2009-10, the Gross Enrolment Ratio (GER) of the state was 9.4%. While it has been marginally better than the GER during 2006-07 (8.54%), the state performs poorly as compared to the national average.
Figure 1: Gross Enrolment Ratio (%) in the State (2006-07 to 2009-10)
Source: Statistics of Higher & technical Education, MoHRD
As on 2009-10, the state was ranked amongst the bottom five states in terms of the GER. Moving forward, the state has to implement effective strategies to ensure increased access to higher education in the state.
8.54
11.6 119.4
2006-07 2007-08 2008-09 2009-10
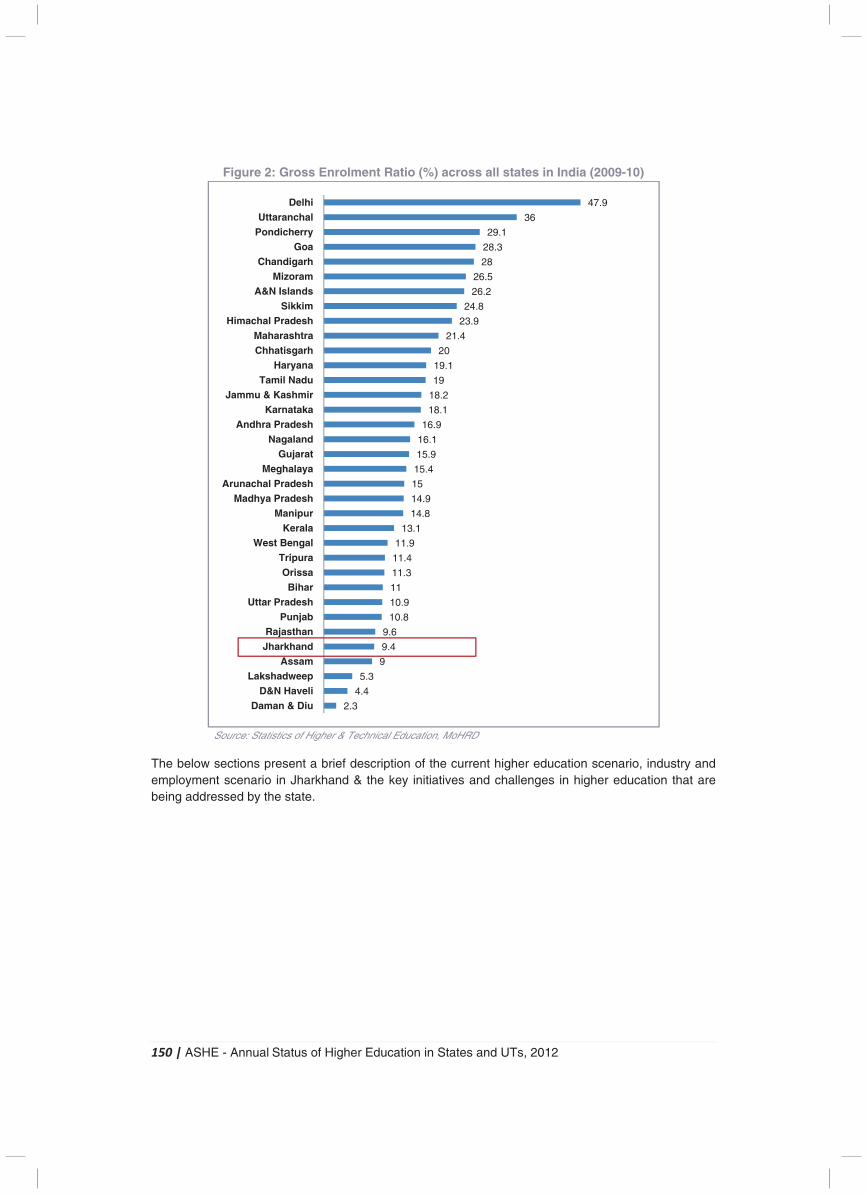
150 | ASHE - Annual Status of Higher Education in States and UTs, 2012
Figure 2: Gross Enrolment Ratio (%) across all states in India (2009-10)
Source: Statistics of Higher & Technical Education, MoHRD
The below sections present a brief description of the current higher education scenario, industry and employment scenario in Jharkhand & the key initiatives and challenges in higher education that are being addressed by the state.
2.3
4.4
5.3
9
9.4
9.6
10.8
10.9
11
11.3
11.4
11.9
13.1
14.8
14.9
15
15.4
15.9
16.1
16.9
18.1
18.2
19
19.1
20
21.4
23.9
24.8
26.2
26.5
28
28.3
29.1
36
47.9
Daman & DiuD&N Haveli
LakshadweepAssam
JharkhandRajasthan
PunjabUttar Pradesh
BiharOrissa
TripuraWest Bengal
KeralaManipur
Madhya PradeshArunachal Pradesh
MeghalayaGujarat
NagalandAndhra Pradesh
KarnatakaJammu & Kashmir
Tamil NaduHaryana
ChhatisgarhMaharashtra
Himachal PradeshSikkim
A&N IslandsMizoram
ChandigarhGoa
PondicherryUttaranchal
Delhi
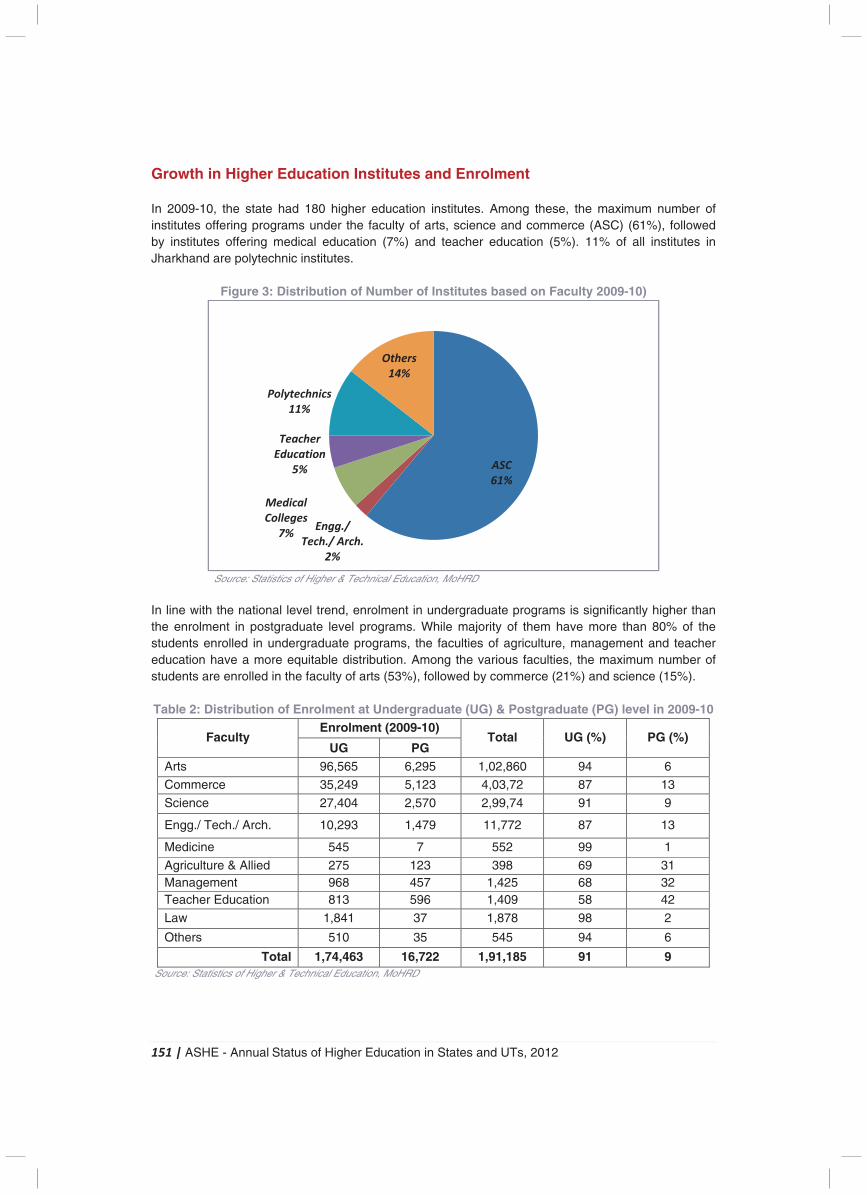
151 | ASHE - Annual Status of Higher Education in States and UTs, 2012
Growth in Higher Education Institutes and Enrolment In 2009-10, the state had 180 higher education institutes. Among these, the maximum number of institutes offering programs under the faculty of arts, science and commerce (ASC) (61%), followed by institutes offering medical education (7%) and teacher education (5%). 11% of all institutes in Jharkhand are polytechnic institutes.
Figure 3: Distribution of Number of Institutes based on Faculty 2009-10)
Source: Statistics of Higher & Technical Education, MoHRD
In line with the national level trend, enrolment in undergraduate programs is significantly higher than the enrolment in postgraduate level programs. While majority of them have more than 80% of the students enrolled in undergraduate programs, the faculties of agriculture, management and teacher education have a more equitable distribution. Among the various faculties, the maximum number of students are enrolled in the faculty of arts (53%), followed by commerce (21%) and science (15%). Table 2: Distribution of Enrolment at Undergraduate (UG) & Postgraduate (PG) level in 2009-10
Faculty Enrolment (2009-10)
Total UG (%) PG (%) UG PG
Arts 96,565 6,295 1,02,860 94 6
Commerce 35,249 5,123 4,03,72 87 13
Science 27,404 2,570 2,99,74 91 9
Engg./ Tech./ Arch. 10,293 1,479 11,772 87 13
Medicine 545 7 552 99 1
Agriculture & Allied 275 123 398 69 31 Management 968 457 1,425 68 32 Teacher Education 813 596 1,409 58 42
Law 1,841 37 1,878 98 2
Others 510 35 545 94 6
Total 1,74,463 16,722 1,91,185 91 9 Source: Statistics of Higher & Technical Education, MoHRD
ASC
61%
Engg./
Tech./ Arch.
2%
Medical
Colleges
7%
Teacher
Education
5%
Polytechnics
11%
Others
14%
152 | ASHE - Annual Status of Higher Education in States and UTs, 2012
Quality of Institutes
Among the various higher education institutes in the state, the National Assessment and Accreditation Council (NAAC) have accredited only 9 colleges. Among these 9 colleges, 7 institutes have been awarded B (Good) grade and 2 institutes have been awarded A (Very Good) grade.
Industry and Employment Scenario
Key Industries66
Jharkhand has around 40% of the country’s mineral wealth. The state is one of the largest producers of coal, mica and copper in India. Due to its large mineral reserves, mining and mineral extraction is the major industry in the state. Its extensive mineral resources make mining, metals and related sectors, a naturally strong sector in the state. Some of the major industries that are operational in the state are as follows:
1. Mining & Metals Industry � Jharkhand is a mineral-rich state; about 40%of India’s mineral reserves are available in the
state. � It supports downstream industries and thermal power generation. Jharkhand’s mineral
reserves include coal, iron ore, bauxite, copper, mica, graphite, manganese, lead, silver, uranium and limestone.
� The Central Mine Planning and Design Institute, the Central Institute of Mining & Fuel Research and the Indian School of Mines are located in Dhanbad and the National Metallurgical Laboratories is located in Jamshedpur.
� Some of the key players in the state are Tata Steel Ltd, Jindal Steel & Power Ltd, Hindalco Industries Ltd (HIL) and Steel Authority of India Ltd (SAIL).
2. Engineering Industry
� The major growth drivers for the engineering industry are the availability of raw material (iron and steel, aluminium, copper and other metals and non-metals), power, water and industrial labour.
� A number of heavy engineering companies located in the state produce equipment and provide turnkey and consulting services to the existing metal and mining industry.
� Some major Engineering firms conducting business in the state are McNally Bharat Engineering Company Ltd, TRF Ltd, Timken India Ltd and Mecon Ltd.
3. Chemical Industry
� The chemical industries in Jharkhand produce a wide range of chemicals such as caustic soda, dye and pigments and industrial and medical gas.
� The industry has developed to serve other manufacturing units in the region and the markets of eastern India.
� Prominent players in the chemical industry in the state are Aditya Birla Chemicals (India) Ltd, Tata Pigments Ltd and BOC India.
4. Cement Industry
� With the reserves of cement grade limestone, this region is well suited for creating additional capacities both in large and mini cement plants.
� Jharkhand has vast reserves of crystalline limestone, starting from Garhwa district to Bokaro district. Exploration of limestone in this area will help in developing cement plants in the state.
66 India Brand Equity Foundation- Report on Jharkhand, 2012
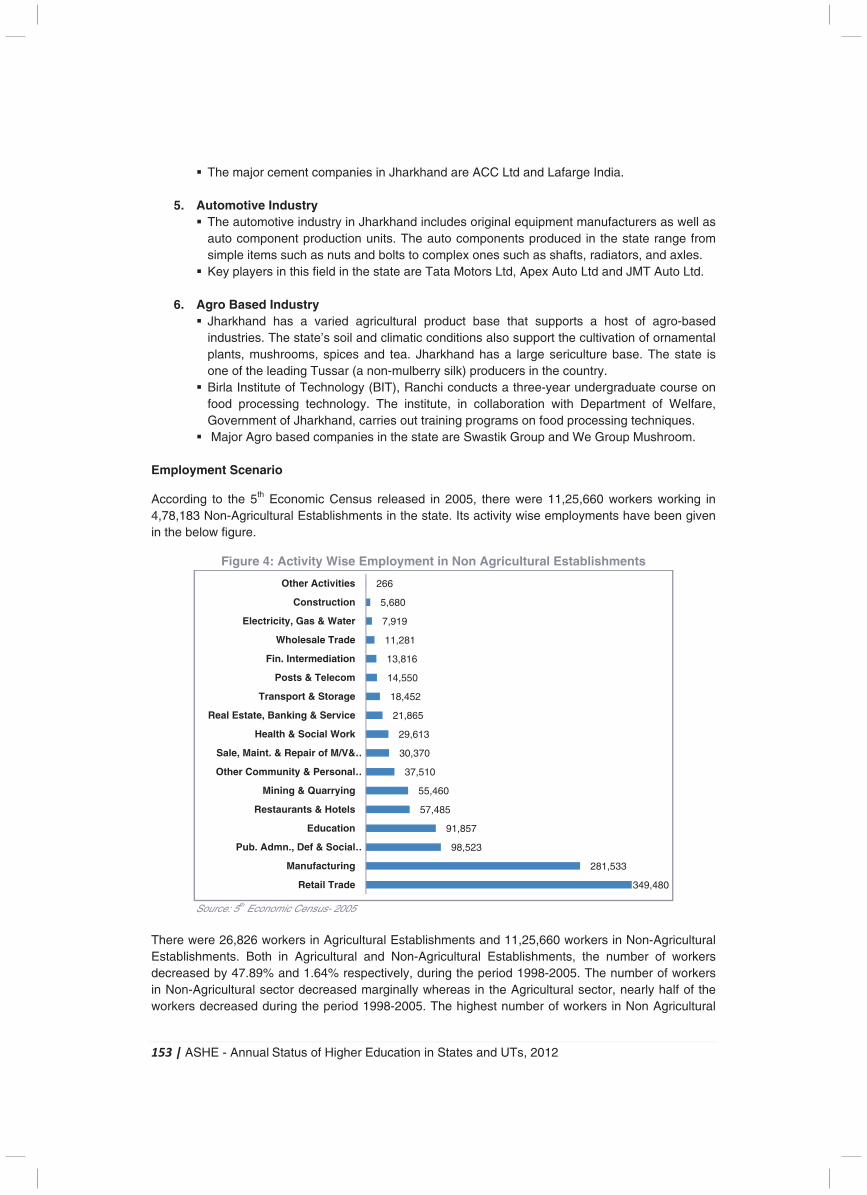
153 | ASHE - Annual Status of Higher Education in States and UTs, 2012
� The major cement companies in Jharkhand are ACC Ltd and Lafarge India.
5. Automotive Industry � The automotive industry in Jharkhand includes original equipment manufacturers as well as
auto component production units. The auto components produced in the state range from simple items such as nuts and bolts to complex ones such as shafts, radiators, and axles.
� Key players in this field in the state are Tata Motors Ltd, Apex Auto Ltd and JMT Auto Ltd.
6. Agro Based Industry � Jharkhand has a varied agricultural product base that supports a host of agro-based
industries. The state’s soil and climatic conditions also support the cultivation of ornamental plants, mushrooms, spices and tea. Jharkhand has a large sericulture base. The state is one of the leading Tussar (a non-mulberry silk) producers in the country.
� Birla Institute of Technology (BIT), Ranchi conducts a three-year undergraduate course on food processing technology. The institute, in collaboration with Department of Welfare, Government of Jharkhand, carries out training programs on food processing techniques.
� Major Agro based companies in the state are Swastik Group and We Group Mushroom.
Employment Scenario
According to the 5th Economic Census released in 2005, there were 11,25,660 workers working in 4,78,183 Non-Agricultural Establishments in the state. Its activity wise employments have been given in the below figure.
Figure 4: Activity Wise Employment in Non Agricultural Establishments
Source: 5th Economic Census- 2005
There were 26,826 workers in Agricultural Establishments and 11,25,660 workers in Non-Agricultural Establishments. Both in Agricultural and Non-Agricultural Establishments, the number of workers decreased by 47.89% and 1.64% respectively, during the period 1998-2005. The number of workers in Non-Agricultural sector decreased marginally whereas in the Agricultural sector, nearly half of the workers decreased during the period 1998-2005. The highest number of workers in Non Agricultural
349,480
281,533
98,523
91,857
57,485
55,460
37,510
30,370
29,613
21,865
18,452
14,550
13,816
11,281
7,919
5,680
266
Retail Trade
Manufacturing
Pub. Admn., Def & Social…
Education
Restaurants & Hotels
Mining & Quarrying
Other Community & Personal …
Sale, Maint. & Repair of M/V&…
Health & Social Work
Real Estate, Banking & Service
Transport & Storage
Posts & Telecom
Fin. Intermediation
Wholesale Trade
Electricity, Gas & Water
Construction
Other Activities
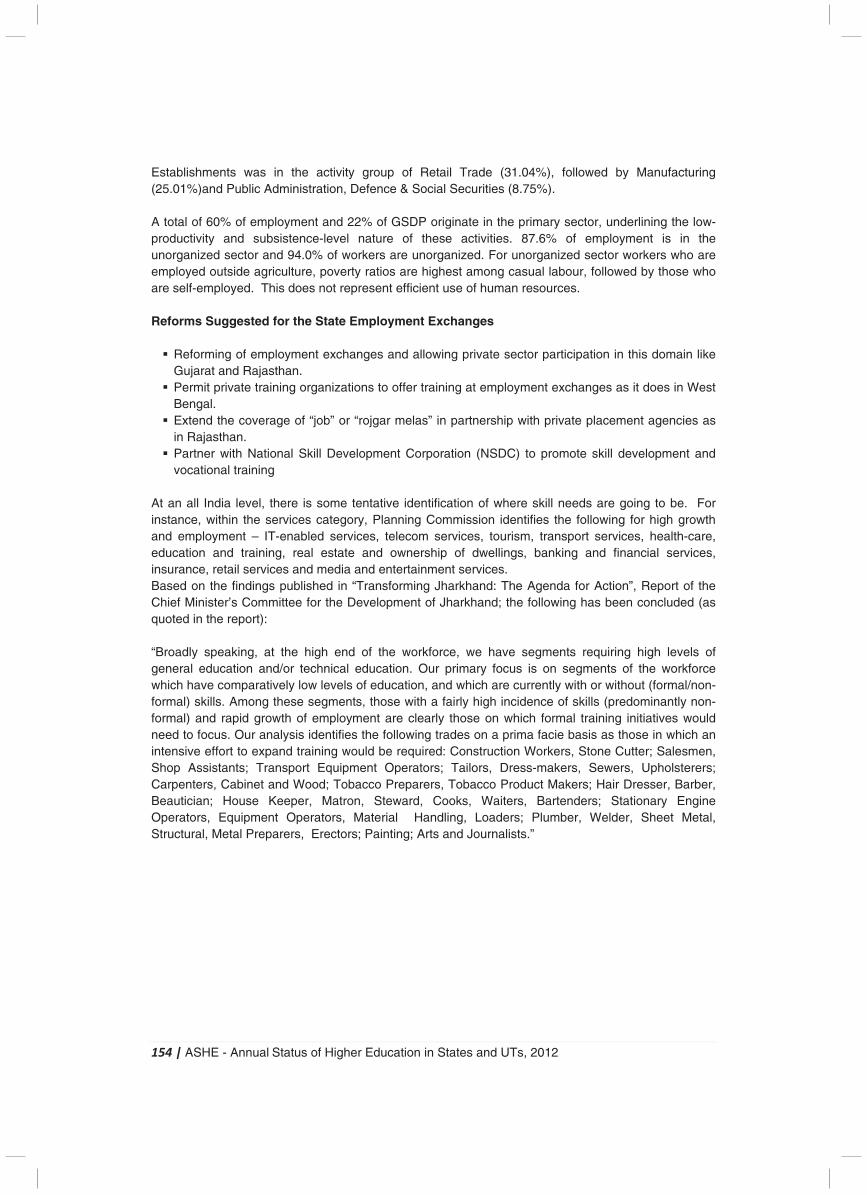
154 | ASHE - Annual Status of Higher Education in States and UTs, 2012
Establishments was in the activity group of Retail Trade (31.04%), followed by Manufacturing (25.01%)and Public Administration, Defence & Social Securities (8.75%). A total of 60% of employment and 22% of GSDP originate in the primary sector, underlining the low-productivity and subsistence-level nature of these activities. 87.6% of employment is in the unorganized sector and 94.0% of workers are unorganized. For unorganized sector workers who are employed outside agriculture, poverty ratios are highest among casual labour, followed by those who are self-employed. This does not represent efficient use of human resources. Reforms Suggested for the State Employment Exchanges � Reforming of employment exchanges and allowing private sector participation in this domain like
Gujarat and Rajasthan. � Permit private training organizations to offer training at employment exchanges as it does in West
Bengal. � Extend the coverage of “job” or “rojgar melas” in partnership with private placement agencies as
in Rajasthan. � Partner with National Skill Development Corporation (NSDC) to promote skill development and
vocational training At an all India level, there is some tentative identification of where skill needs are going to be. For instance, within the services category, Planning Commission identifies the following for high growth and employment – IT-enabled services, telecom services, tourism, transport services, health-care, education and training, real estate and ownership of dwellings, banking and financial services, insurance, retail services and media and entertainment services. Based on the findings published in “Transforming Jharkhand: The Agenda for Action”, Report of the Chief Minister’s Committee for the Development of Jharkhand; the following has been concluded (as quoted in the report): “Broadly speaking, at the high end of the workforce, we have segments requiring high levels of general education and/or technical education. Our primary focus is on segments of the workforce which have comparatively low levels of education, and which are currently with or without (formal/non-formal) skills. Among these segments, those with a fairly high incidence of skills (predominantly non-formal) and rapid growth of employment are clearly those on which formal training initiatives would need to focus. Our analysis identifies the following trades on a prima facie basis as those in which an intensive effort to expand training would be required: Construction Workers, Stone Cutter; Salesmen, Shop Assistants; Transport Equipment Operators; Tailors, Dress-makers, Sewers, Upholsterers; Carpenters, Cabinet and Wood; Tobacco Preparers, Tobacco Product Makers; Hair Dresser, Barber, Beautician; House Keeper, Matron, Steward, Cooks, Waiters, Bartenders; Stationary Engine Operators, Equipment Operators, Material Handling, Loaders; Plumber, Welder, Sheet Metal, Structural, Metal Preparers, Erectors; Painting; Arts and Journalists.”
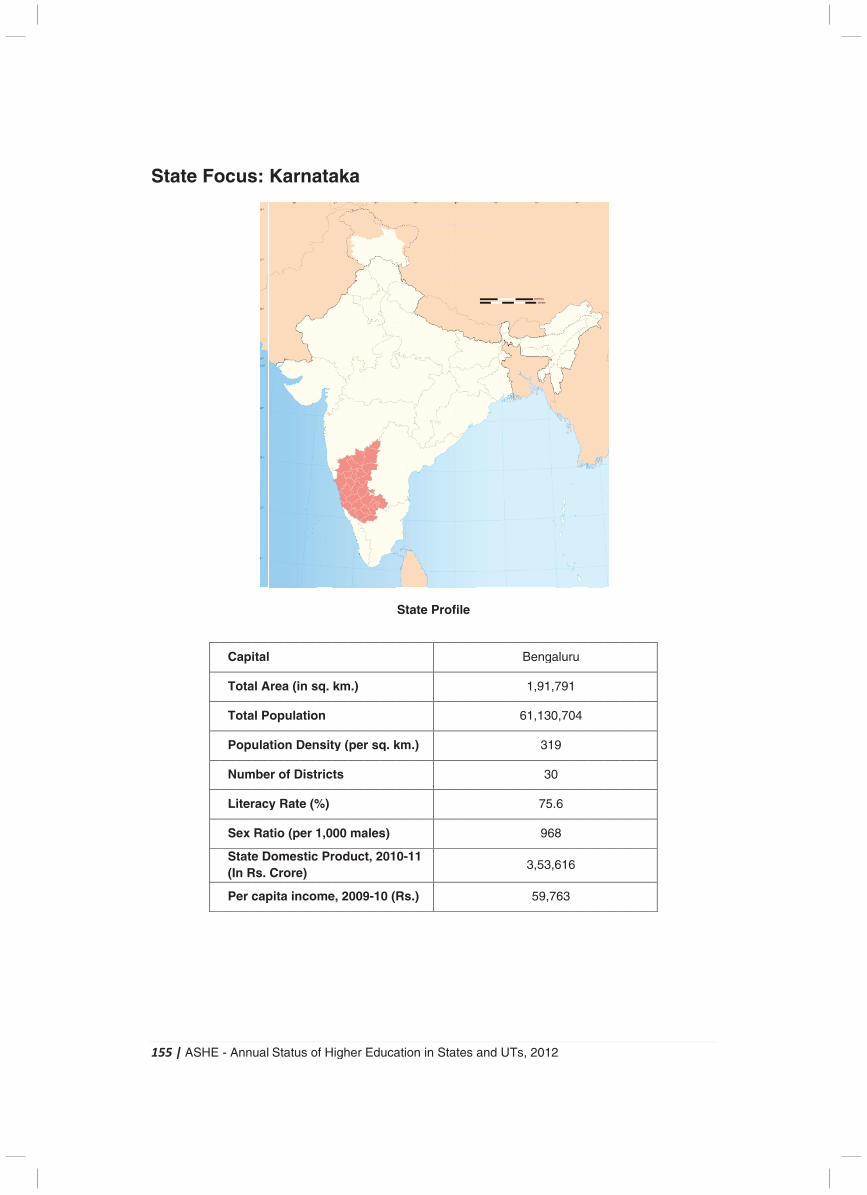
1
S
155
Sta
| A
ate
ASH
e F
HE
Fo
- A
oc
C
To
To
Po
N
Li
Se
St(In
Pe
Ann
us
api
ota
ota
opu
um
iter
ex
taten R
er c
ual
s:
ital
al A
al P
ula
mbe
rac
Ra
e DRs.
cap
Sta
Ka
l
Area
Pop
atio
er o
y R
atio
DomCro
pita
atu
ar
a (i
ula
n D
of D
Rate
(pe
mesore
a in
s o
na
n s
atio
Den
Dist
e (%
er 1
stice)
nco
of H
ata
sq.
on
nsit
tric
%)
1,0
c Pr
me
High
ak
km
ty (
ts
00
rod
e, 2
her
ka
m.)
(per
ma
duc
009
Ed
r sq
ales
t, 2
9-1
uca
q. k
s)
201
0 (
atio
Sta
km.
0-1
Rs.
on in
ate
.)
11
.)
n S
Pr
Stat
ofi
es
le
and
d U
UTs
B
6
, 20
Ben
1,9
61,1
7
3,5
59
012
nga
91,7
130
319
30
75.
968
53,6
9,7
2
alur
791
0,70
9
0
6
8
616
63
ru
1
04
6
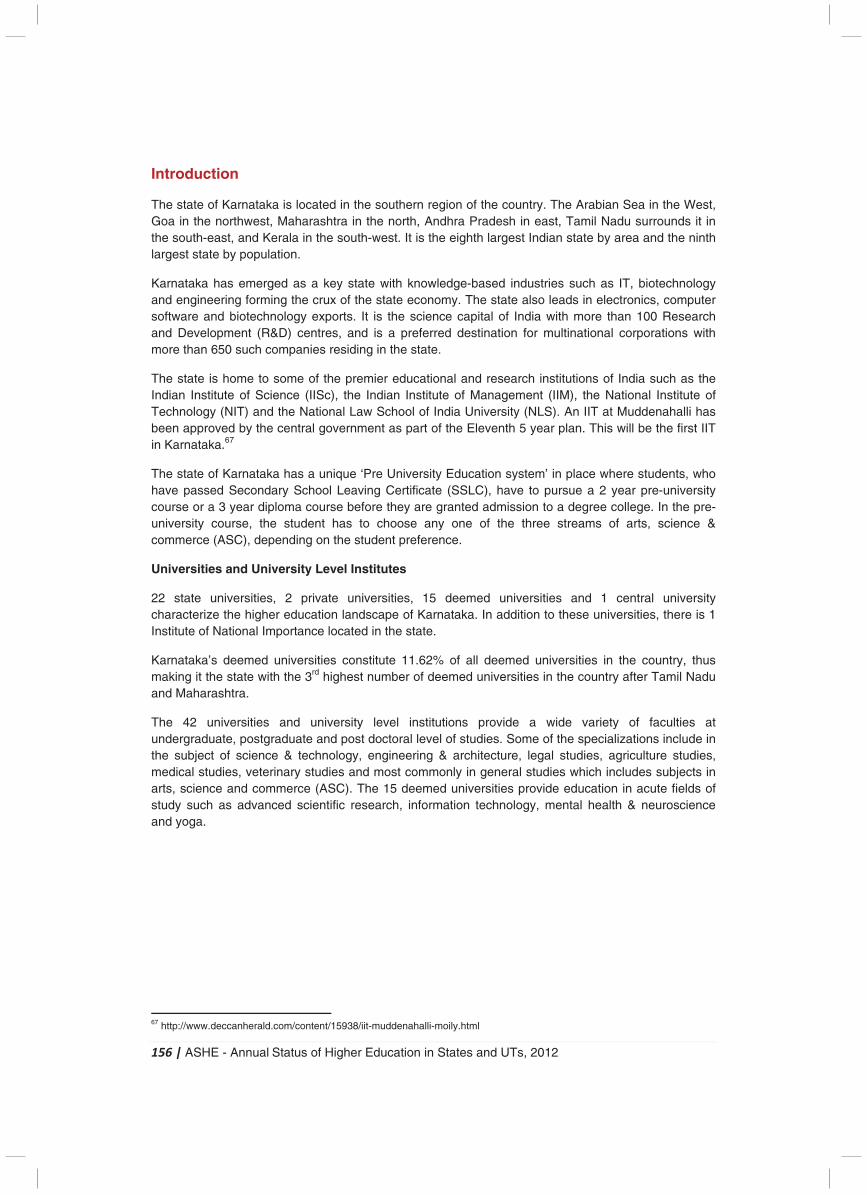
156 | ASHE - Annual Status of Higher Education in States and UTs, 2012
Introduction
The state of Karnataka is located in the southern region of the country. The Arabian Sea in the West, Goa in the northwest, Maharashtra in the north, Andhra Pradesh in east, Tamil Nadu surrounds it in the south-east, and Kerala in the south-west. It is the eighth largest Indian state by area and the ninth largest state by population.
Karnataka has emerged as a key state with knowledge-based industries such as IT, biotechnology and engineering forming the crux of the state economy. The state also leads in electronics, computer software and biotechnology exports. It is the science capital of India with more than 100 Research and Development (R&D) centres, and is a preferred destination for multinational corporations with more than 650 such companies residing in the state.
The state is home to some of the premier educational and research institutions of India such as the Indian Institute of Science (IISc), the Indian Institute of Management (IIM), the National Institute of Technology (NIT) and the National Law School of India University (NLS). An IIT at Muddenahalli has been approved by the central government as part of the Eleventh 5 year plan. This will be the first IIT in Karnataka.67
The state of Karnataka has a unique ‘Pre University Education system’ in place where students, who have passed Secondary School Leaving Certificate (SSLC), have to pursue a 2 year pre-university course or a 3 year diploma course before they are granted admission to a degree college. In the pre-university course, the student has to choose any one of the three streams of arts, science & commerce (ASC), depending on the student preference.
Universities and University Level Institutes
22 state universities, 2 private universities, 15 deemed universities and 1 central university characterize the higher education landscape of Karnataka. In addition to these universities, there is 1 Institute of National Importance located in the state.
Karnataka’s deemed universities constitute 11.62% of all deemed universities in the country, thus making it the state with the 3rd highest number of deemed universities in the country after Tamil Nadu and Maharashtra.
The 42 universities and university level institutions provide a wide variety of faculties at undergraduate, postgraduate and post doctoral level of studies. Some of the specializations include in the subject of science & technology, engineering & architecture, legal studies, agriculture studies, medical studies, veterinary studies and most commonly in general studies which includes subjects in arts, science and commerce (ASC). The 15 deemed universities provide education in acute fields of study such as advanced scientific research, information technology, mental health & neuroscience and yoga.
67 http://www.deccanherald.com/content/15938/iit-muddenahalli-moily.html
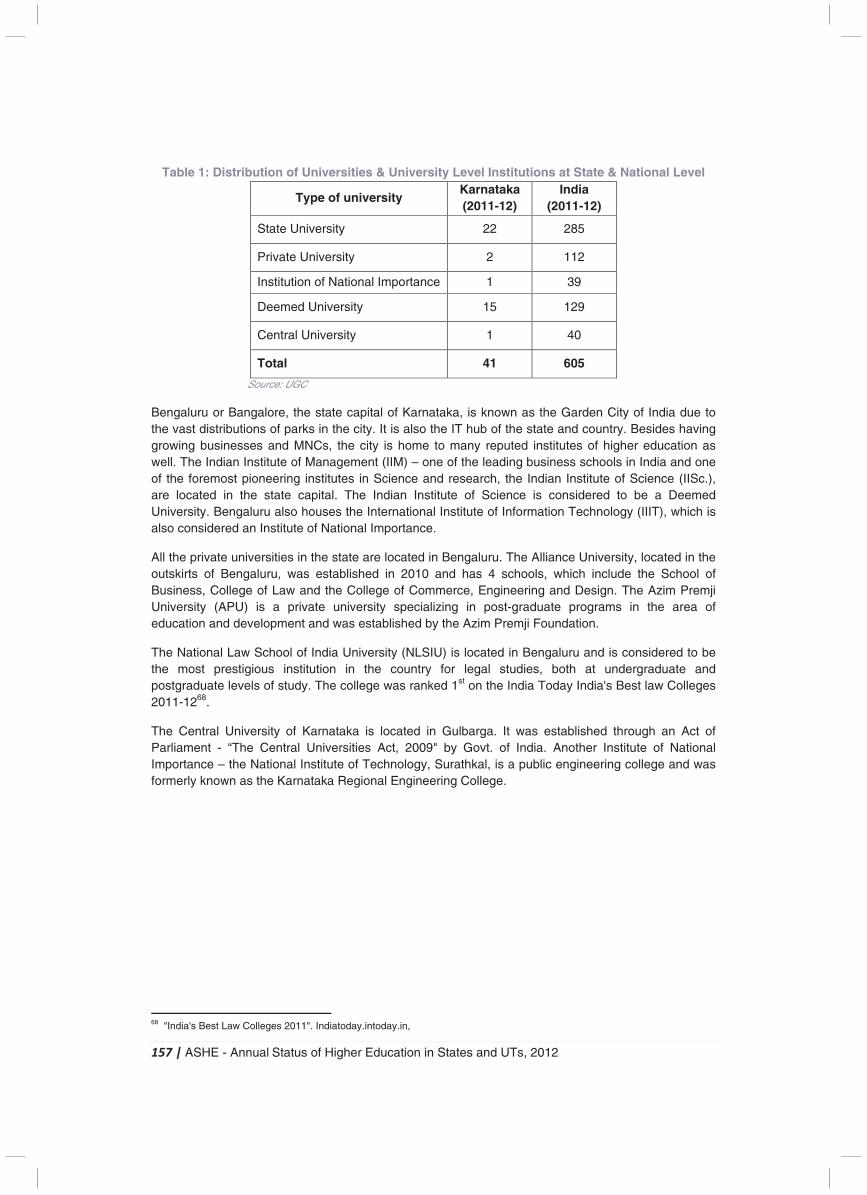
157 | ASHE - Annual Status of Higher Education in States and UTs, 2012
Table 1: Distribution of Universities & University Level Institutions at State & National Level
Type of university Karnataka (2011-12)
India (2011-12)
State University 22 285
Private University 2 112
Institution of National Importance 1 39
Deemed University 15 129
Central University 1 40
Total 41 605
Source: UGC
Bengaluru or Bangalore, the state capital of Karnataka, is known as the Garden City of India due to the vast distributions of parks in the city. It is also the IT hub of the state and country. Besides having growing businesses and MNCs, the city is home to many reputed institutes of higher education as well. The Indian Institute of Management (IIM) – one of the leading business schools in India and one of the foremost pioneering institutes in Science and research, the Indian Institute of Science (IISc.), are located in the state capital. The Indian Institute of Science is considered to be a Deemed University. Bengaluru also houses the International Institute of Information Technology (IIIT), which is also considered an Institute of National Importance.
All the private universities in the state are located in Bengaluru. The Alliance University, located in the outskirts of Bengaluru, was established in 2010 and has 4 schools, which include the School of Business, College of Law and the College of Commerce, Engineering and Design. The Azim Premji University (APU) is a private university specializing in post-graduate programs in the area of education and development and was established by the Azim Premji Foundation.
The National Law School of India University (NLSIU) is located in Bengaluru and is considered to be the most prestigious institution in the country for legal studies, both at undergraduate and postgraduate levels of study. The college was ranked 1st on the India Today India's Best law Colleges 2011-1268.
The Central University of Karnataka is located in Gulbarga. It was established through an Act of Parliament - “The Central Universities Act, 2009" by Govt. of India. Another Institute of National Importance – the National Institute of Technology, Surathkal, is a public engineering college and was formerly known as the Karnataka Regional Engineering College.
68 "India's Best Law Colleges 2011". Indiatoday.intoday.in,
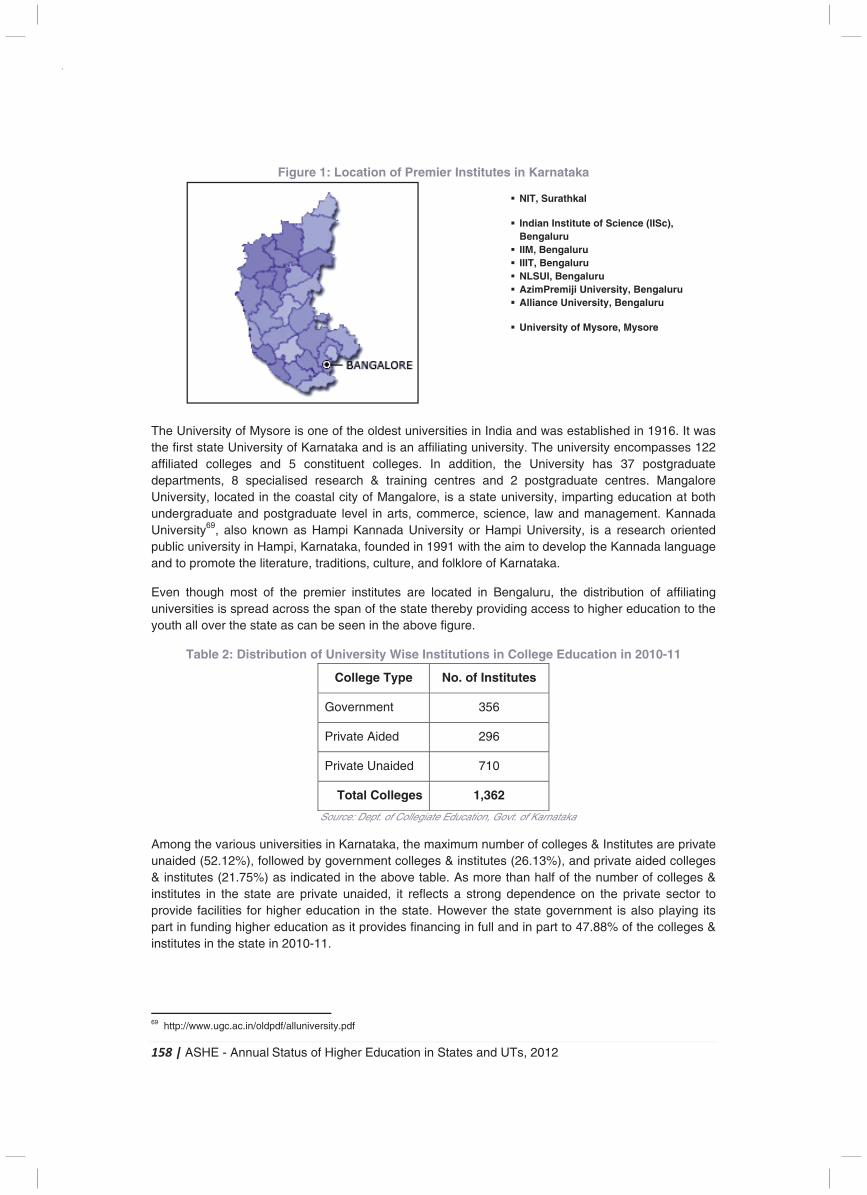
158 | ASHE - Annual Status of Higher Education in States and UTs, 2012
Figure 1: Location of Premier Institutes in Karnataka
The University of Mysore is one of the oldest universities in India and was established in 1916. It was the first state University of Karnataka and is an affiliating university. The university encompasses 122 affiliated colleges and 5 constituent colleges. In addition, the University has 37 postgraduate departments, 8 specialised research & training centres and 2 postgraduate centres. Mangalore University, located in the coastal city of Mangalore, is a state university, imparting education at both undergraduate and postgraduate level in arts, commerce, science, law and management. Kannada University69, also known as Hampi Kannada University or Hampi University, is a research oriented public university in Hampi, Karnataka, founded in 1991 with the aim to develop the Kannada language and to promote the literature, traditions, culture, and folklore of Karnataka.
Even though most of the premier institutes are located in Bengaluru, the distribution of affiliating universities is spread across the span of the state thereby providing access to higher education to the youth all over the state as can be seen in the above figure.
Table 2: Distribution of University Wise Institutions in College Education in 2010-11
College Type No. of Institutes
Government 356
Private Aided 296
Private Unaided 710
Total Colleges 1,362
Source: Dept. of Collegiate Education, Govt. of Karnataka
Among the various universities in Karnataka, the maximum number of colleges & Institutes are private unaided (52.12%), followed by government colleges & institutes (26.13%), and private aided colleges & institutes (21.75%) as indicated in the above table. As more than half of the number of colleges & institutes in the state are private unaided, it reflects a strong dependence on the private sector to provide facilities for higher education in the state. However the state government is also playing its part in funding higher education as it provides financing in full and in part to 47.88% of the colleges & institutes in the state in 2010-11.
69 http://www.ugc.ac.in/oldpdf/alluniversity.pdf
� NIT, Surathkal � Indian Institute of Science (IISc),
Bengaluru � IIM, Bengaluru � IIIT, Bengaluru � NLSUI, Bengaluru � AzimPremiji University, Bengaluru � Alliance University, Bengaluru � University of Mysore, Mysore
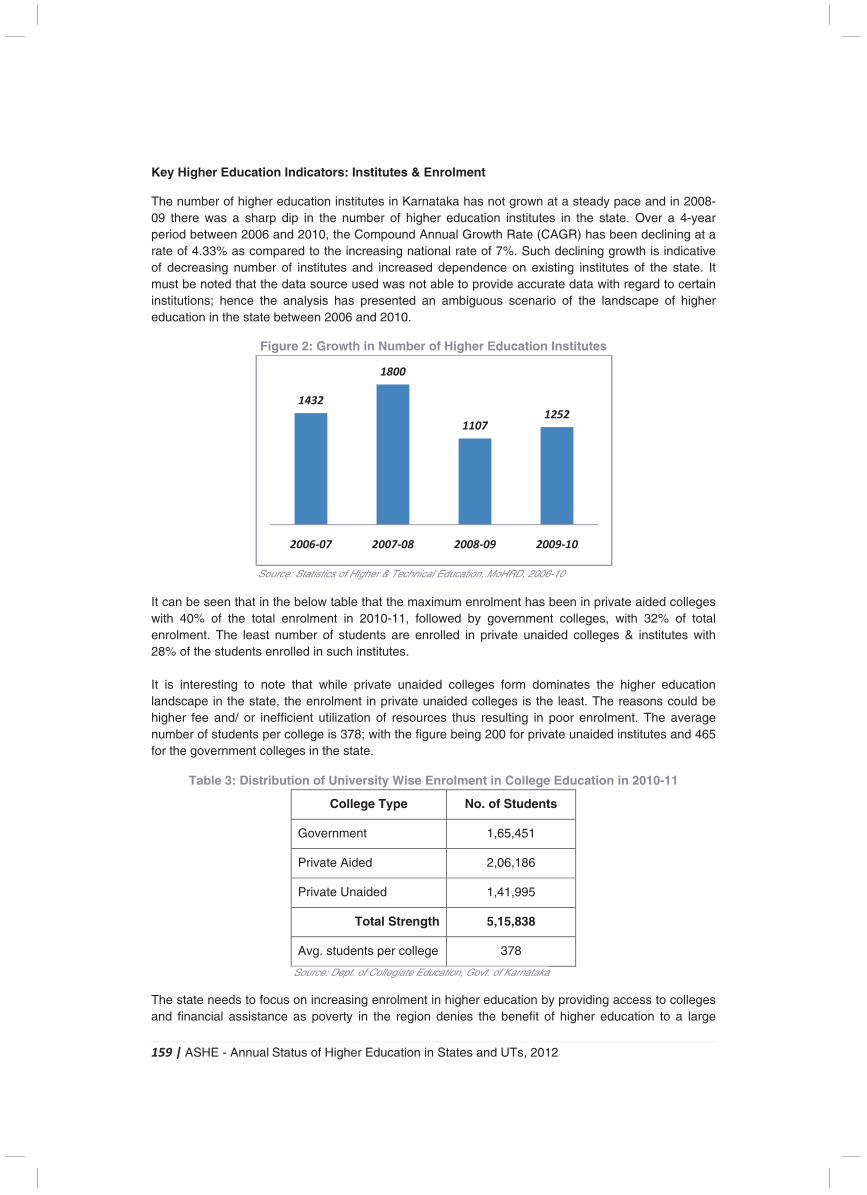
159 | ASHE - Annual Status of Higher Education in States and UTs, 2012
Key Higher Education Indicators: Institutes & Enrolment
The number of higher education institutes in Karnataka has not grown at a steady pace and in 2008-09 there was a sharp dip in the number of higher education institutes in the state. Over a 4-year period between 2006 and 2010, the Compound Annual Growth Rate (CAGR) has been declining at a rate of 4.33% as compared to the increasing national rate of 7%. Such declining growth is indicative of decreasing number of institutes and increased dependence on existing institutes of the state. It must be noted that the data source used was not able to provide accurate data with regard to certain institutions; hence the analysis has presented an ambiguous scenario of the landscape of higher education in the state between 2006 and 2010.
Figure 2: Growth in Number of Higher Education Institutes
Source: Statistics of Higher & Technical Education, MoHRD, 2006-10
It can be seen that in the below table that the maximum enrolment has been in private aided colleges with 40% of the total enrolment in 2010-11, followed by government colleges, with 32% of total enrolment. The least number of students are enrolled in private unaided colleges & institutes with 28% of the students enrolled in such institutes. It is interesting to note that while private unaided colleges form dominates the higher education landscape in the state, the enrolment in private unaided colleges is the least. The reasons could be higher fee and/ or inefficient utilization of resources thus resulting in poor enrolment. The average number of students per college is 378; with the figure being 200 for private unaided institutes and 465 for the government colleges in the state.
Table 3: Distribution of University Wise Enrolment in College Education in 2010-11
College Type No. of Students
Government 1,65,451
Private Aided 2,06,186
Private Unaided 1,41,995
Total Strength 5,15,838
Avg. students per college 378
Source: Dept. of Collegiate Education, Govt. of Karnataka
The state needs to focus on increasing enrolment in higher education by providing access to colleges and financial assistance as poverty in the region denies the benefit of higher education to a large
1432
1800
11071252
2006-07 2007-08 2008-09 2009-10
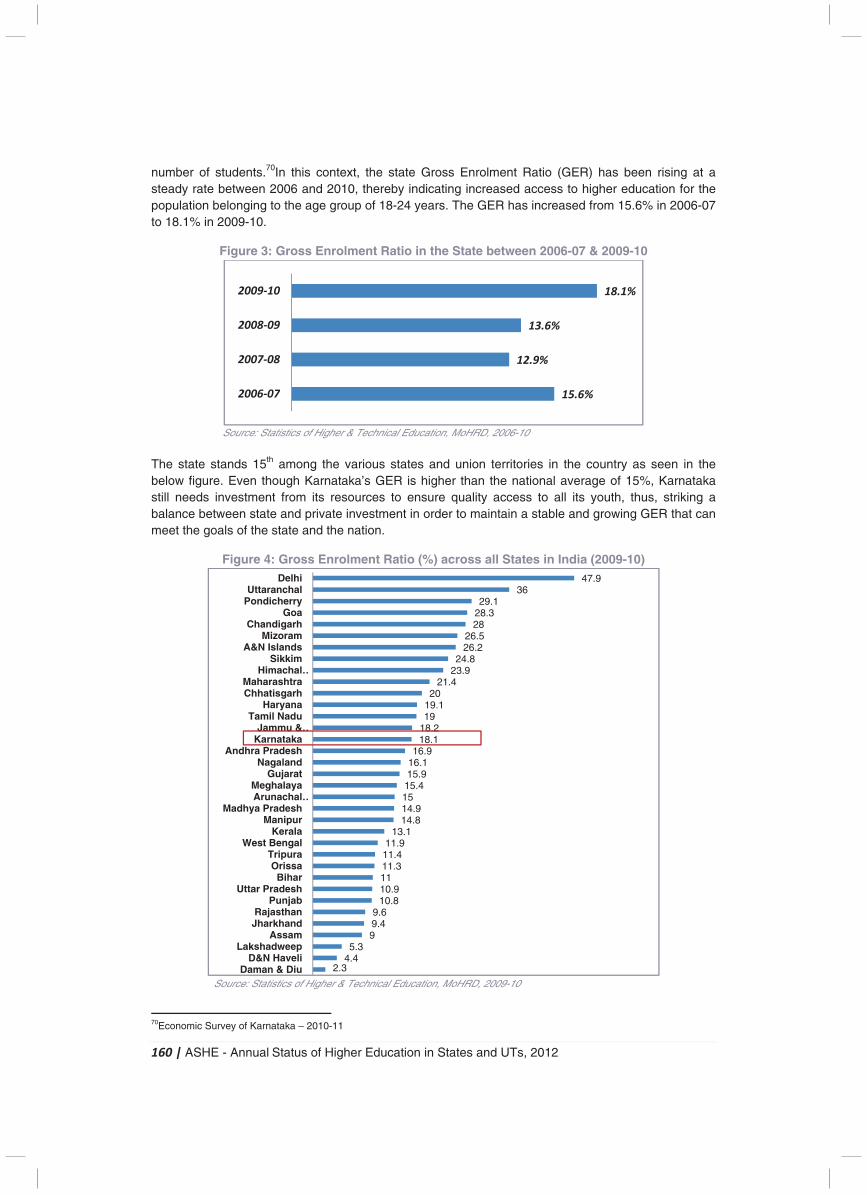
160 | ASHE - Annual Status of Higher Education in States and UTs, 2012
number of students.70In this context, the state Gross Enrolment Ratio (GER) has been rising at a steady rate between 2006 and 2010, thereby indicating increased access to higher education for the population belonging to the age group of 18-24 years. The GER has increased from 15.6% in 2006-07 to 18.1% in 2009-10.
Figure 3: Gross Enrolment Ratio in the State between 2006-07 & 2009-10
Source: Statistics of Higher & Technical Education, MoHRD, 2006-10
The state stands 15th among the various states and union territories in the country as seen in the below figure. Even though Karnataka’s GER is higher than the national average of 15%, Karnataka still needs investment from its resources to ensure quality access to all its youth, thus, striking a balance between state and private investment in order to maintain a stable and growing GER that can meet the goals of the state and the nation.
Figure 4: Gross Enrolment Ratio (%) across all States in India (2009-10)
Source: Statistics of Higher & Technical Education, MoHRD, 2009-10
70Economic Survey of Karnataka – 2010-11
15.6%
12.9%
13.6%
18.1%
2006-07
2007-08
2008-09
2009-10
2.34.45.3
99.49.6
10.810.91111.311.411.9
13.114.814.91515.415.916.116.9
18.118.21919.120
21.423.924.8
26.226.5
2828.329.1
3647.9
Daman & DiuD&N Haveli
LakshadweepAssam
JharkhandRajasthan
PunjabUttar Pradesh
BiharOrissa
TripuraWest Bengal
KeralaManipur
Madhya PradeshArunachal …Meghalaya
GujaratNagaland
Andhra PradeshKarnatakaJammu & …
Tamil NaduHaryana
ChhatisgarhMaharashtra
Himachal …Sikkim
A&N IslandsMizoram
ChandigarhGoa
PondicherryUttaranchal
Delhi
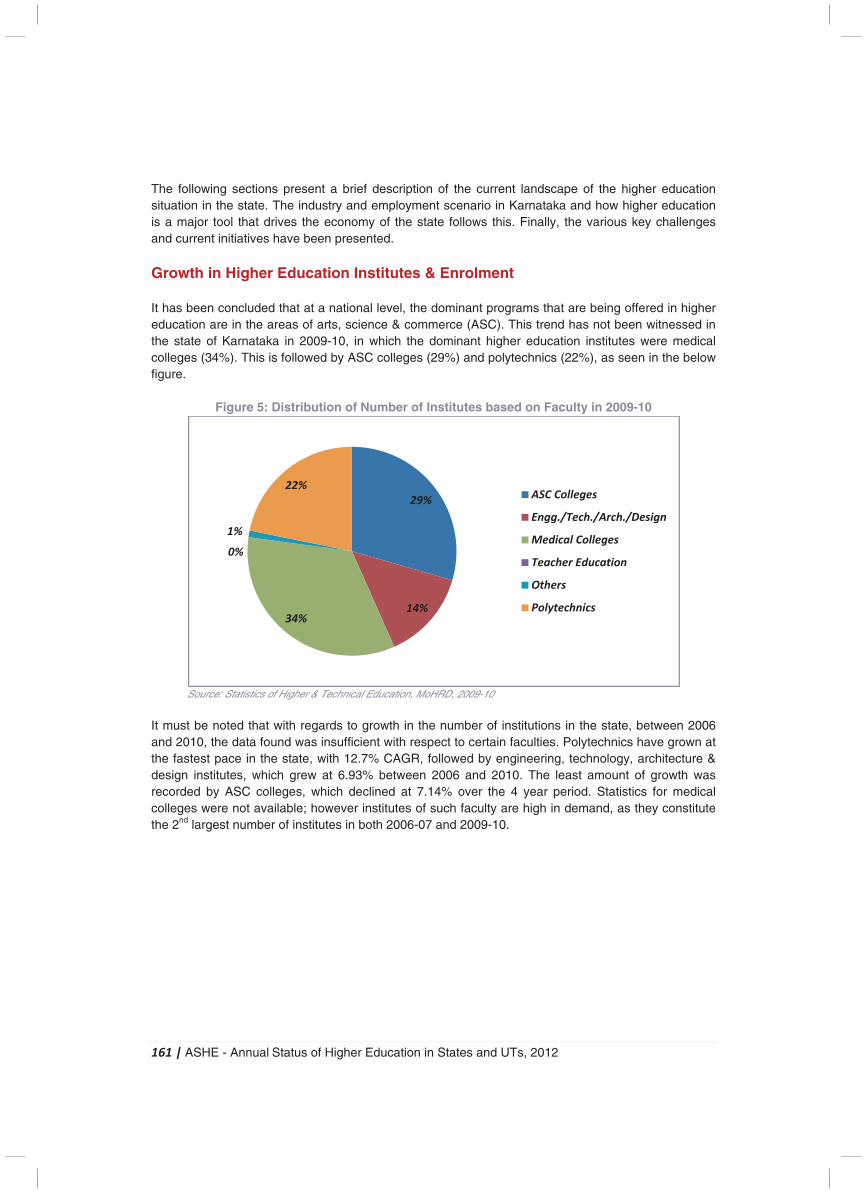
161 | ASHE - Annual Status of Higher Education in States and UTs, 2012
The following sections present a brief description of the current landscape of the higher education situation in the state. The industry and employment scenario in Karnataka and how higher education is a major tool that drives the economy of the state follows this. Finally, the various key challenges and current initiatives have been presented.
Growth in Higher Education Institutes & Enrolment It has been concluded that at a national level, the dominant programs that are being offered in higher education are in the areas of arts, science & commerce (ASC). This trend has not been witnessed in the state of Karnataka in 2009-10, in which the dominant higher education institutes were medical colleges (34%). This is followed by ASC colleges (29%) and polytechnics (22%), as seen in the below figure.
Figure 5: Distribution of Number of Institutes based on Faculty in 2009-10
Source: Statistics of Higher & Technical Education, MoHRD, 2009-10
It must be noted that with regards to growth in the number of institutions in the state, between 2006 and 2010, the data found was insufficient with respect to certain faculties. Polytechnics have grown at the fastest pace in the state, with 12.7% CAGR, followed by engineering, technology, architecture & design institutes, which grew at 6.93% between 2006 and 2010. The least amount of growth was recorded by ASC colleges, which declined at 7.14% over the 4 year period. Statistics for medical colleges were not available; however institutes of such faculty are high in demand, as they constitute the 2nd largest number of institutes in both 2006-07 and 2009-10.
29%
14%34%
0%
1%
22%ASC Colleges
Engg./Tech./Arch./Design
Medical Colleges
Teacher Education
Others
Polytechnics
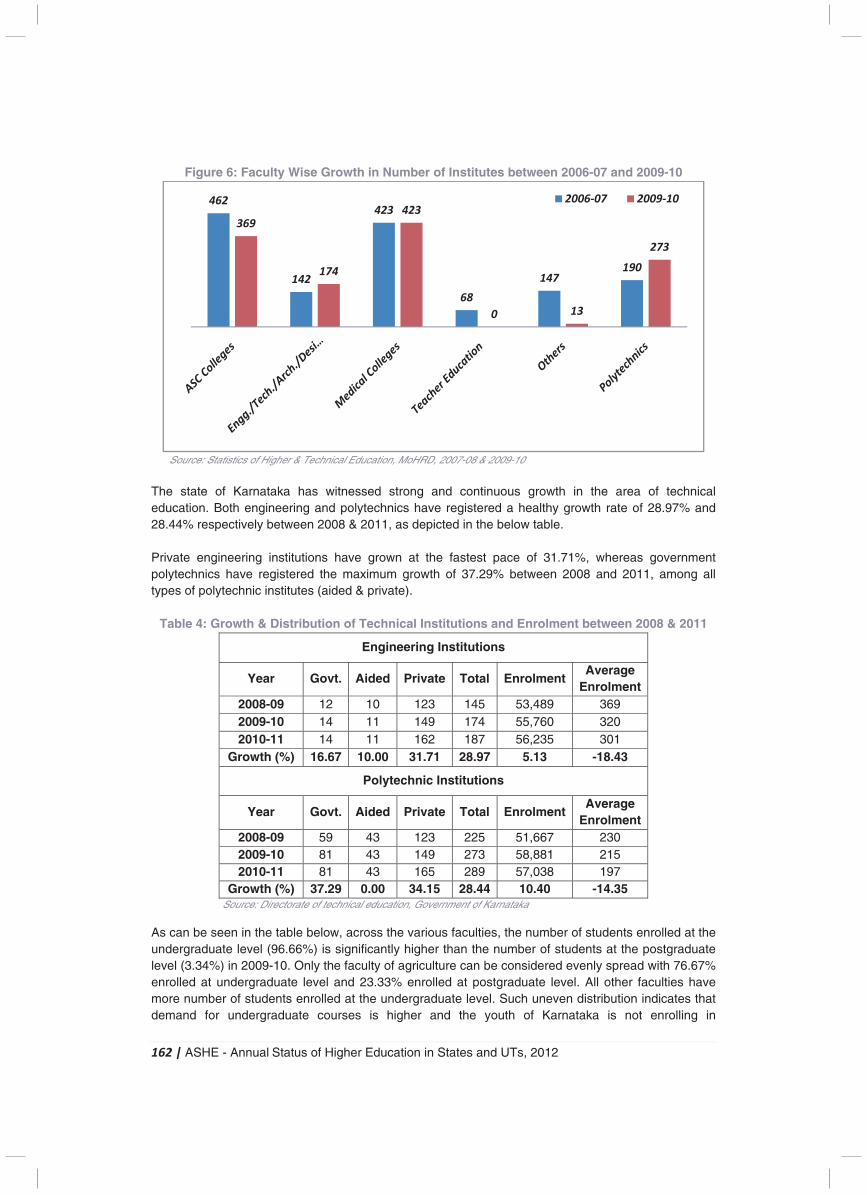
162 | ASHE - Annual Status of Higher Education in States and UTs, 2012
Figure 6: Faculty Wise Growth in Number of Institutes between 2006-07 and 2009-10
Source: Statistics of Higher & Technical Education, MoHRD, 2007-08 & 2009-10
The state of Karnataka has witnessed strong and continuous growth in the area of technical education. Both engineering and polytechnics have registered a healthy growth rate of 28.97% and 28.44% respectively between 2008 & 2011, as depicted in the below table. Private engineering institutions have grown at the fastest pace of 31.71%, whereas government polytechnics have registered the maximum growth of 37.29% between 2008 and 2011, among all types of polytechnic institutes (aided & private).
Table 4: Growth & Distribution of Technical Institutions and Enrolment between 2008 & 2011
Engineering Institutions
Year Govt. Aided Private Total Enrolment Average
Enrolment2008-09 12 10 123 145 53,489 369 2009-10 14 11 149 174 55,760 320 2010-11 14 11 162 187 56,235 301
Growth (%) 16.67 10.00 31.71 28.97 5.13 -18.43
Polytechnic Institutions
Year Govt. Aided Private Total Enrolment Average
Enrolment2008-09 59 43 123 225 51,667 230 2009-10 81 43 149 273 58,881 215 2010-11 81 43 165 289 57,038 197
Growth (%) 37.29 0.00 34.15 28.44 10.40 -14.35 Source: Directorate of technical education, Government of Karnataka
As can be seen in the table below, across the various faculties, the number of students enrolled at the undergraduate level (96.66%) is significantly higher than the number of students at the postgraduate level (3.34%) in 2009-10. Only the faculty of agriculture can be considered evenly spread with 76.67% enrolled at undergraduate level and 23.33% enrolled at postgraduate level. All other faculties have more number of students enrolled at the undergraduate level. Such uneven distribution indicates that demand for undergraduate courses is higher and the youth of Karnataka is not enrolling in
(-7.14%)
(-55.08%)
(6.93%)
(0%)
(0%)
(12.7%)
462
142
423
68
147
190
369
174
423
0 13
273
2006-07 2009-10
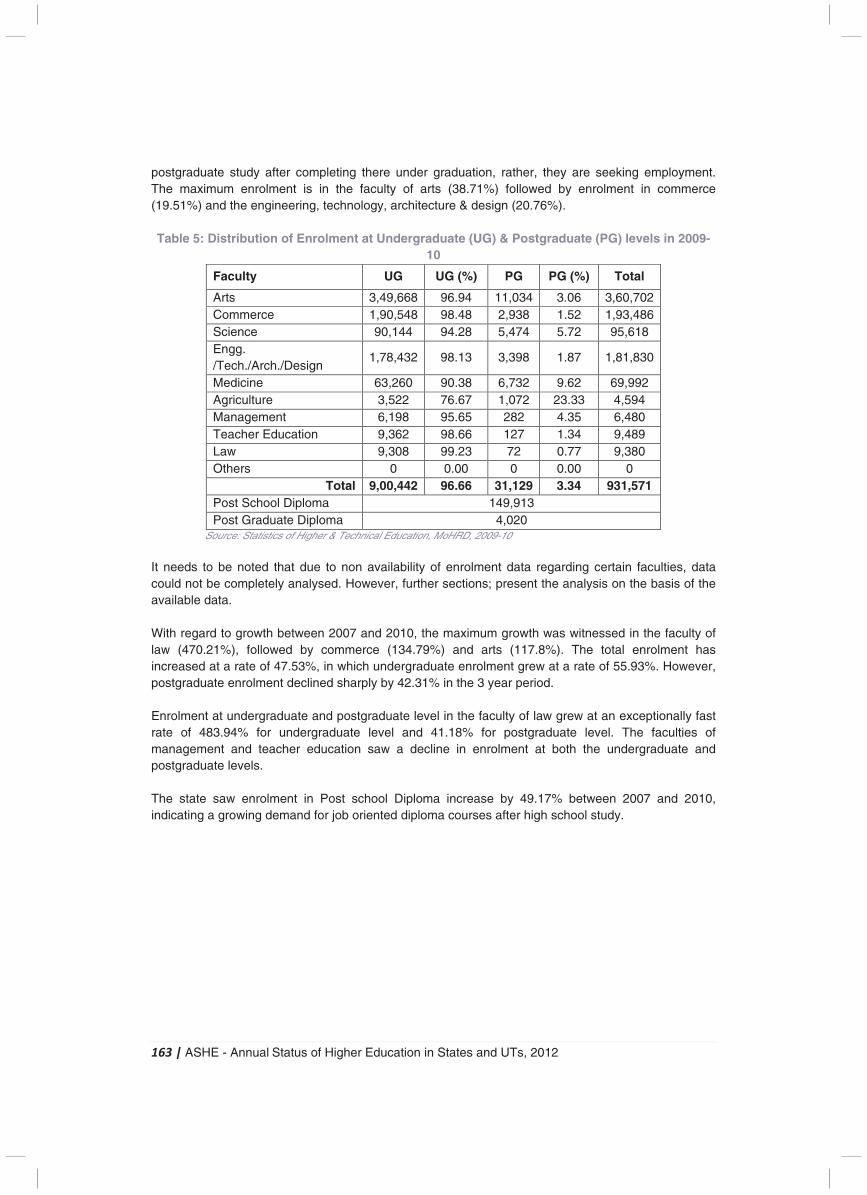
163 | ASHE - Annual Status of Higher Education in States and UTs, 2012
postgraduate study after completing there under graduation, rather, they are seeking employment. The maximum enrolment is in the faculty of arts (38.71%) followed by enrolment in commerce (19.51%) and the engineering, technology, architecture & design (20.76%). Table 5: Distribution of Enrolment at Undergraduate (UG) & Postgraduate (PG) levels in 2009-
10
Faculty UG UG (%) PG PG (%) Total
Arts 3,49,668 96.94 11,034 3.06 3,60,702 Commerce 1,90,548 98.48 2,938 1.52 1,93,486 Science 90,144 94.28 5,474 5.72 95,618 Engg. /Tech./Arch./Design
1,78,432 98.13 3,398 1.87 1,81,830
Medicine 63,260 90.38 6,732 9.62 69,992 Agriculture 3,522 76.67 1,072 23.33 4,594 Management 6,198 95.65 282 4.35 6,480 Teacher Education 9,362 98.66 127 1.34 9,489 Law 9,308 99.23 72 0.77 9,380 Others 0 0.00 0 0.00 0
Total 9,00,442 96.66 31,129 3.34 931,571 Post School Diploma 149,913 Post Graduate Diploma 4,020
Source: Statistics of Higher & Technical Education, MoHRD, 2009-10
It needs to be noted that due to non availability of enrolment data regarding certain faculties, data could not be completely analysed. However, further sections; present the analysis on the basis of the available data. With regard to growth between 2007 and 2010, the maximum growth was witnessed in the faculty of law (470.21%), followed by commerce (134.79%) and arts (117.8%). The total enrolment has increased at a rate of 47.53%, in which undergraduate enrolment grew at a rate of 55.93%. However, postgraduate enrolment declined sharply by 42.31% in the 3 year period. Enrolment at undergraduate and postgraduate level in the faculty of law grew at an exceptionally fast rate of 483.94% for undergraduate level and 41.18% for postgraduate level. The faculties of management and teacher education saw a decline in enrolment at both the undergraduate and postgraduate levels. The state saw enrolment in Post school Diploma increase by 49.17% between 2007 and 2010, indicating a growing demand for job oriented diploma courses after high school study.
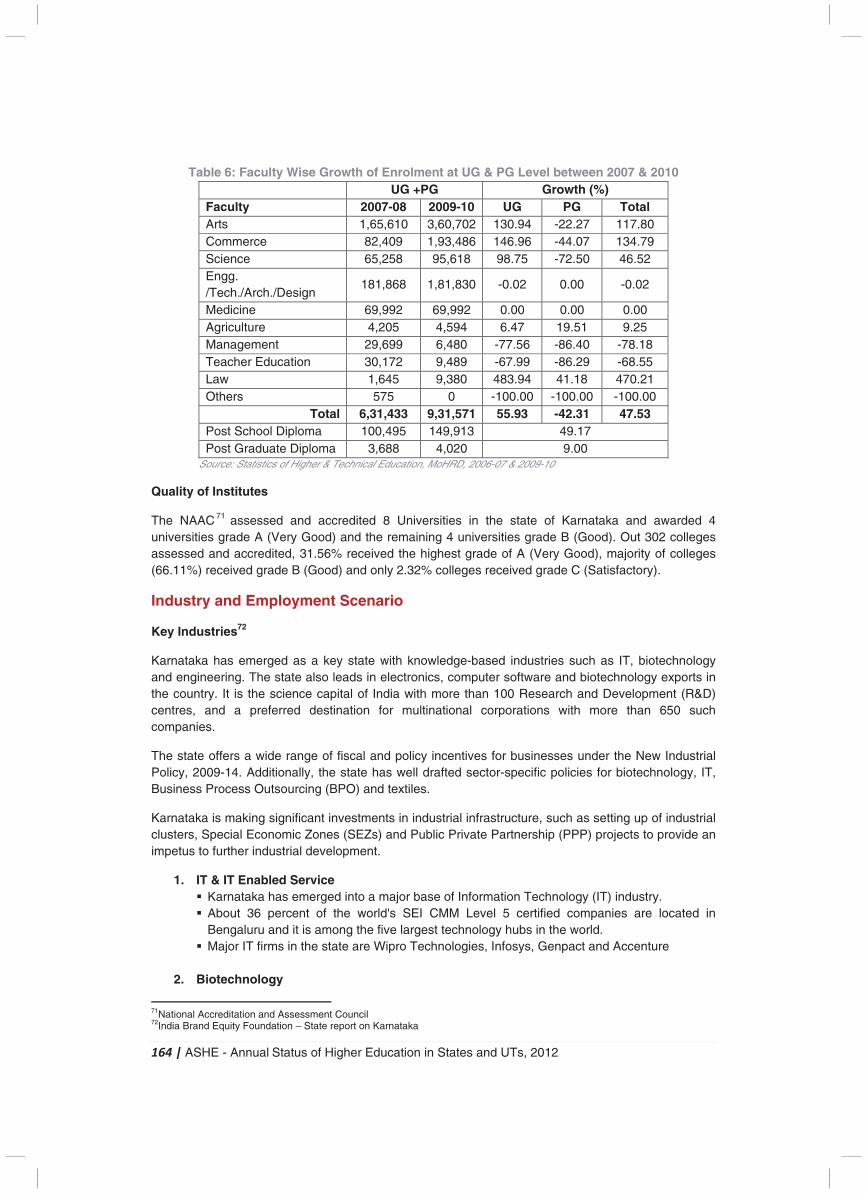
164 | ASHE - Annual Status of Higher Education in States and UTs, 2012
Table 6: Faculty Wise Growth of Enrolment at UG & PG Level between 2007 & 2010 UG +PG Growth (%)
Faculty 2007-08 2009-10 UG PG Total Arts 1,65,610 3,60,702 130.94 -22.27 117.80 Commerce 82,409 1,93,486 146.96 -44.07 134.79 Science 65,258 95,618 98.75 -72.50 46.52 Engg. /Tech./Arch./Design
181,868 1,81,830 -0.02 0.00 -0.02
Medicine 69,992 69,992 0.00 0.00 0.00 Agriculture 4,205 4,594 6.47 19.51 9.25 Management 29,699 6,480 -77.56 -86.40 -78.18 Teacher Education 30,172 9,489 -67.99 -86.29 -68.55 Law 1,645 9,380 483.94 41.18 470.21 Others 575 0 -100.00 -100.00 -100.00
Total 6,31,433 9,31,571 55.93 -42.31 47.53 Post School Diploma 100,495 149,913 49.17 Post Graduate Diploma 3,688 4,020 9.00
Source: Statistics of Higher & Technical Education, MoHRD, 2006-07 & 2009-10
Quality of Institutes
The NAAC 71 assessed and accredited 8 Universities in the state of Karnataka and awarded 4 universities grade A (Very Good) and the remaining 4 universities grade B (Good). Out 302 colleges assessed and accredited, 31.56% received the highest grade of A (Very Good), majority of colleges (66.11%) received grade B (Good) and only 2.32% colleges received grade C (Satisfactory).
Industry and Employment Scenario
Key Industries72
Karnataka has emerged as a key state with knowledge-based industries such as IT, biotechnology and engineering. The state also leads in electronics, computer software and biotechnology exports in the country. It is the science capital of India with more than 100 Research and Development (R&D) centres, and a preferred destination for multinational corporations with more than 650 such companies.
The state offers a wide range of fiscal and policy incentives for businesses under the New Industrial Policy, 2009-14. Additionally, the state has well drafted sector-specific policies for biotechnology, IT, Business Process Outsourcing (BPO) and textiles.
Karnataka is making significant investments in industrial infrastructure, such as setting up of industrial clusters, Special Economic Zones (SEZs) and Public Private Partnership (PPP) projects to provide an impetus to further industrial development.
1. IT & IT Enabled Service � Karnataka has emerged into a major base of Information Technology (IT) industry. � About 36 percent of the world's SEI CMM Level 5 certified companies are located in
Bengaluru and it is among the five largest technology hubs in the world. � Major IT firms in the state are Wipro Technologies, Infosys, Genpact and Accenture
2. Biotechnology
71National Accreditation and Assessment Council 72India Brand Equity Foundation – State report on Karnataka
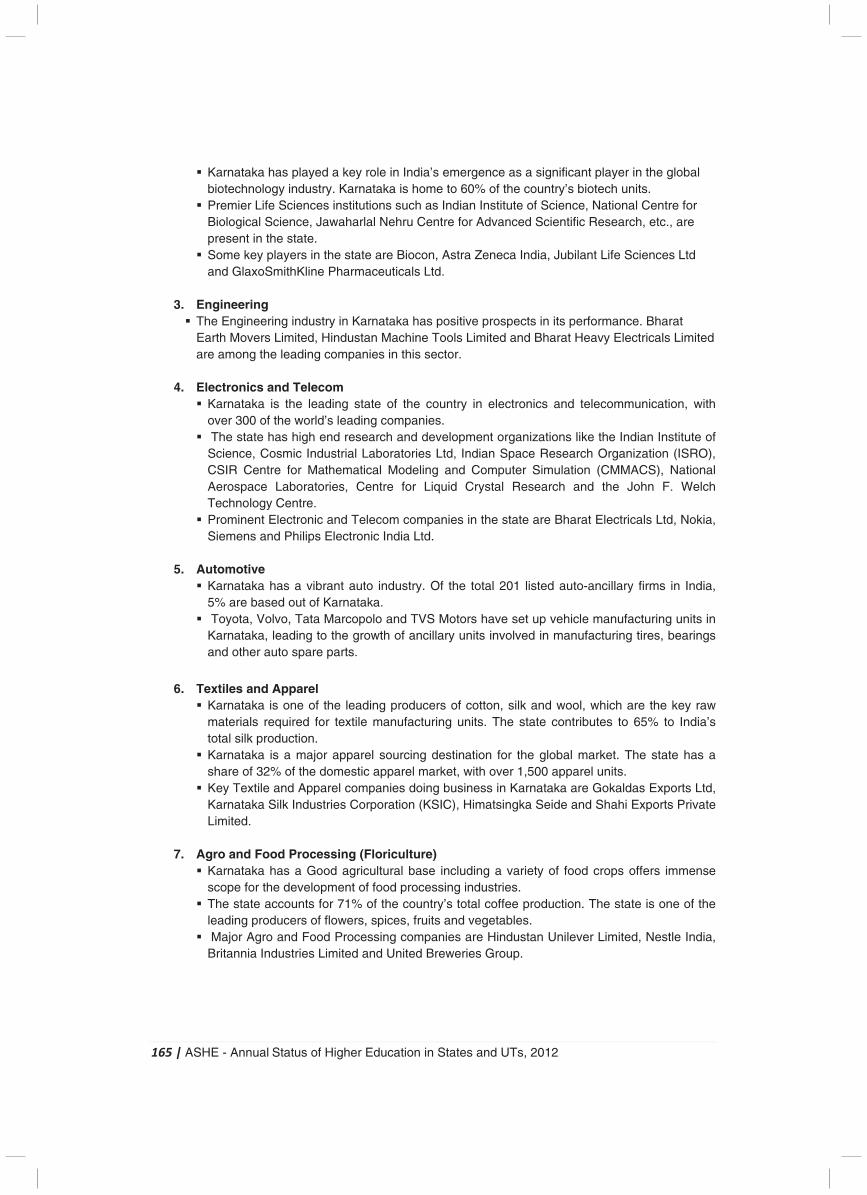
165 | ASHE - Annual Status of Higher Education in States and UTs, 2012
� Karnataka has played a key role in India’s emergence as a significant player in the global biotechnology industry. Karnataka is home to 60% of the country’s biotech units.
� Premier Life Sciences institutions such as Indian Institute of Science, National Centre for Biological Science, Jawaharlal Nehru Centre for Advanced Scientific Research, etc., are present in the state.
� Some key players in the state are Biocon, Astra Zeneca India, Jubilant Life Sciences Ltd and GlaxoSmithKline Pharmaceuticals Ltd.
3. Engineering � The Engineering industry in Karnataka has positive prospects in its performance. Bharat
Earth Movers Limited, Hindustan Machine Tools Limited and Bharat Heavy Electricals Limited are among the leading companies in this sector.
4. Electronics and Telecom � Karnataka is the leading state of the country in electronics and telecommunication, with
over 300 of the world’s leading companies. � The state has high end research and development organizations like the Indian Institute of
Science, Cosmic Industrial Laboratories Ltd, Indian Space Research Organization (ISRO), CSIR Centre for Mathematical Modeling and Computer Simulation (CMMACS), National Aerospace Laboratories, Centre for Liquid Crystal Research and the John F. Welch Technology Centre.
� Prominent Electronic and Telecom companies in the state are Bharat Electricals Ltd, Nokia, Siemens and Philips Electronic India Ltd.
5. Automotive � Karnataka has a vibrant auto industry. Of the total 201 listed auto-ancillary firms in India,
5% are based out of Karnataka. � Toyota, Volvo, Tata Marcopolo and TVS Motors have set up vehicle manufacturing units in
Karnataka, leading to the growth of ancillary units involved in manufacturing tires, bearings and other auto spare parts.
6. Textiles and Apparel � Karnataka is one of the leading producers of cotton, silk and wool, which are the key raw
materials required for textile manufacturing units. The state contributes to 65% to India’s total silk production.
� Karnataka is a major apparel sourcing destination for the global market. The state has a share of 32% of the domestic apparel market, with over 1,500 apparel units.
� Key Textile and Apparel companies doing business in Karnataka are Gokaldas Exports Ltd, Karnataka Silk Industries Corporation (KSIC), Himatsingka Seide and Shahi Exports Private Limited.
7. Agro and Food Processing (Floriculture)
� Karnataka has a Good agricultural base including a variety of food crops offers immense scope for the development of food processing industries.
� The state accounts for 71% of the country’s total coffee production. The state is one of the leading producers of flowers, spices, fruits and vegetables.
� Major Agro and Food Processing companies are Hindustan Unilever Limited, Nestle India, Britannia Industries Limited and United Breweries Group.
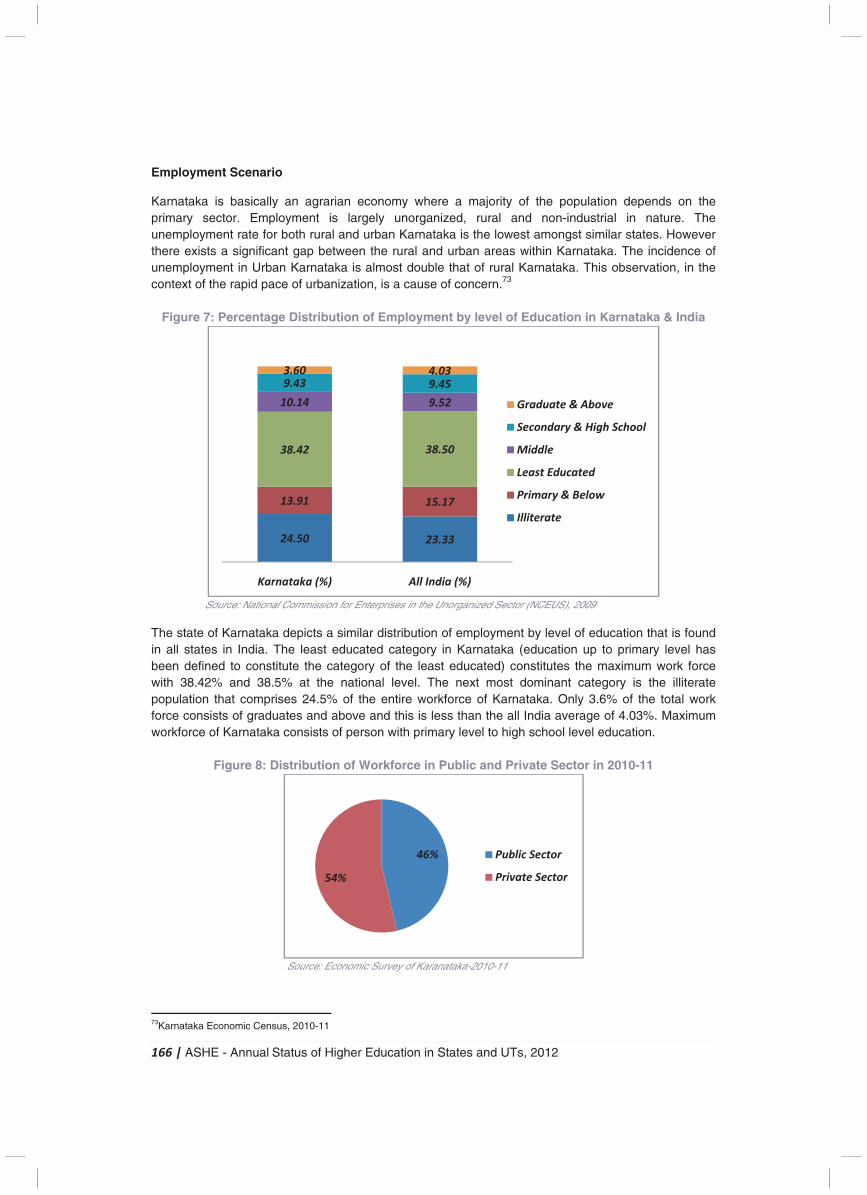
166 | ASHE - Annual Status of Higher Education in States and UTs, 2012
Employment Scenario
Karnataka is basically an agrarian economy where a majority of the population depends on the primary sector. Employment is largely unorganized, rural and non-industrial in nature. The unemployment rate for both rural and urban Karnataka is the lowest amongst similar states. However there exists a significant gap between the rural and urban areas within Karnataka. The incidence of unemployment in Urban Karnataka is almost double that of rural Karnataka. This observation, in the context of the rapid pace of urbanization, is a cause of concern.73
Figure 7: Percentage Distribution of Employment by level of Education in Karnataka & India
Source: National Commission for Enterprises in the Unorganized Sector (NCEUS), 2009
The state of Karnataka depicts a similar distribution of employment by level of education that is found in all states in India. The least educated category in Karnataka (education up to primary level has been defined to constitute the category of the least educated) constitutes the maximum work force with 38.42% and 38.5% at the national level. The next most dominant category is the illiterate population that comprises 24.5% of the entire workforce of Karnataka. Only 3.6% of the total work force consists of graduates and above and this is less than the all India average of 4.03%. Maximum workforce of Karnataka consists of person with primary level to high school level education.
Figure 8: Distribution of Workforce in Public and Private Sector in 2010-11
Source: Economic Survey of Karanataka-2010-11
73Karnataka Economic Census, 2010-11
24.50 23.33
13.91 15.17
38.42 38.50
10.14 9.52
9.43 9.453.60 4.03
Karnataka (%) All India (%)
Graduate & Above
Secondary & High School
Middle
Least Educated
Primary & Below
Illiterate
46%
54%
Public Sector
Private Sector
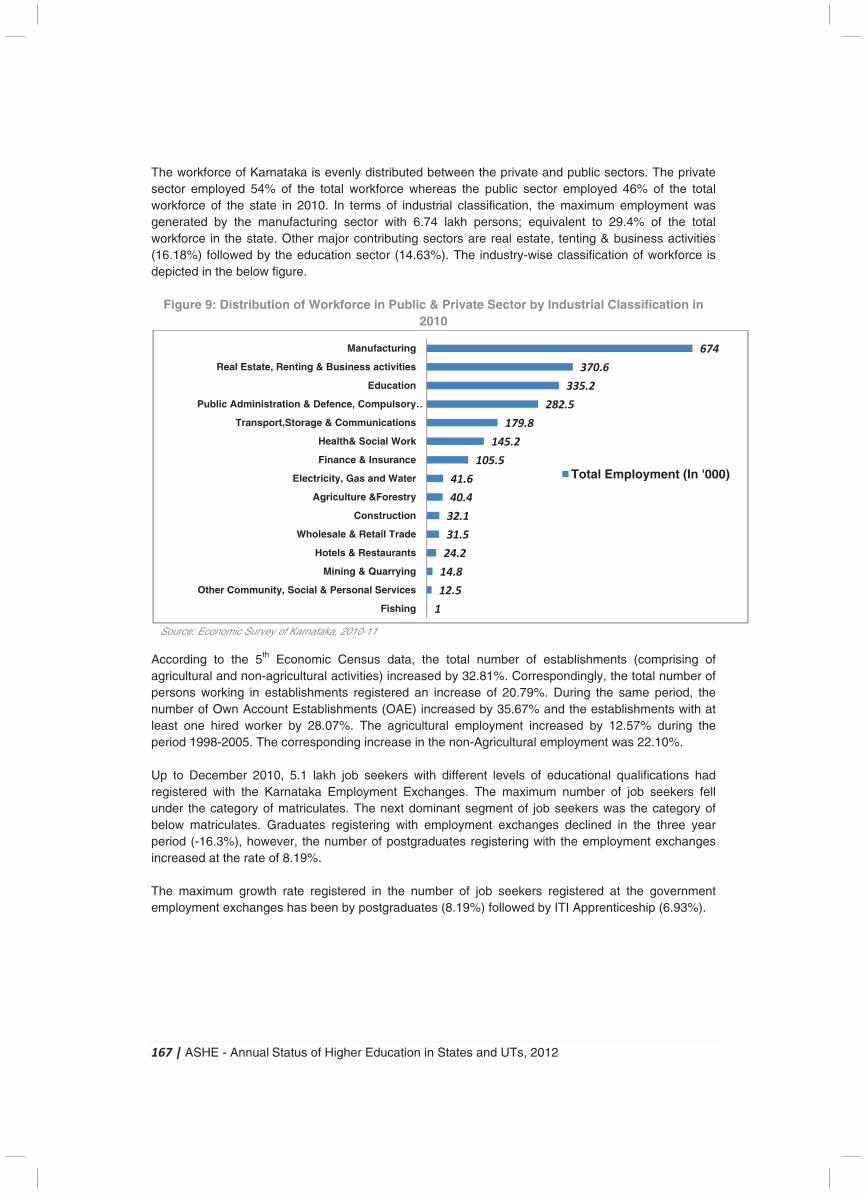
167 | ASHE - Annual Status of Higher Education in States and UTs, 2012
The workforce of Karnataka is evenly distributed between the private and public sectors. The private sector employed 54% of the total workforce whereas the public sector employed 46% of the total workforce of the state in 2010. In terms of industrial classification, the maximum employment was generated by the manufacturing sector with 6.74 lakh persons; equivalent to 29.4% of the total workforce in the state. Other major contributing sectors are real estate, tenting & business activities (16.18%) followed by the education sector (14.63%). The industry-wise classification of workforce is depicted in the below figure.
Figure 9: Distribution of Workforce in Public & Private Sector by Industrial Classification in 2010
Source: Economic Survey of Karnataka, 2010-11 According to the 5th Economic Census data, the total number of establishments (comprising of agricultural and non-agricultural activities) increased by 32.81%. Correspondingly, the total number of persons working in establishments registered an increase of 20.79%. During the same period, the number of Own Account Establishments (OAE) increased by 35.67% and the establishments with at least one hired worker by 28.07%. The agricultural employment increased by 12.57% during the period 1998-2005. The corresponding increase in the non-Agricultural employment was 22.10%. Up to December 2010, 5.1 lakh job seekers with different levels of educational qualifications had registered with the Karnataka Employment Exchanges. The maximum number of job seekers fell under the category of matriculates. The next dominant segment of job seekers was the category of below matriculates. Graduates registering with employment exchanges declined in the three year period (-16.3%), however, the number of postgraduates registering with the employment exchanges increased at the rate of 8.19%. The maximum growth rate registered in the number of job seekers registered at the government employment exchanges has been by postgraduates (8.19%) followed by ITI Apprenticeship (6.93%).
1
12.5
14.8
24.2
31.5
32.1
40.4
41.6
105.5
145.2
179.8
282.5
335.2
370.6
674
Fishing
Other Community, Social & Personal Services
Mining & Quarrying
Hotels & Restaurants
Wholesale & Retail Trade
Construction
Agriculture &Forestry
Electricity, Gas and Water
Finance & Insurance
Health& Social Work
Transport,Storage & Communications
Public Administration & Defence, Compulsory …
Education
Real Estate, Renting & Business activities
Manufacturing
Total Employment (In '000)
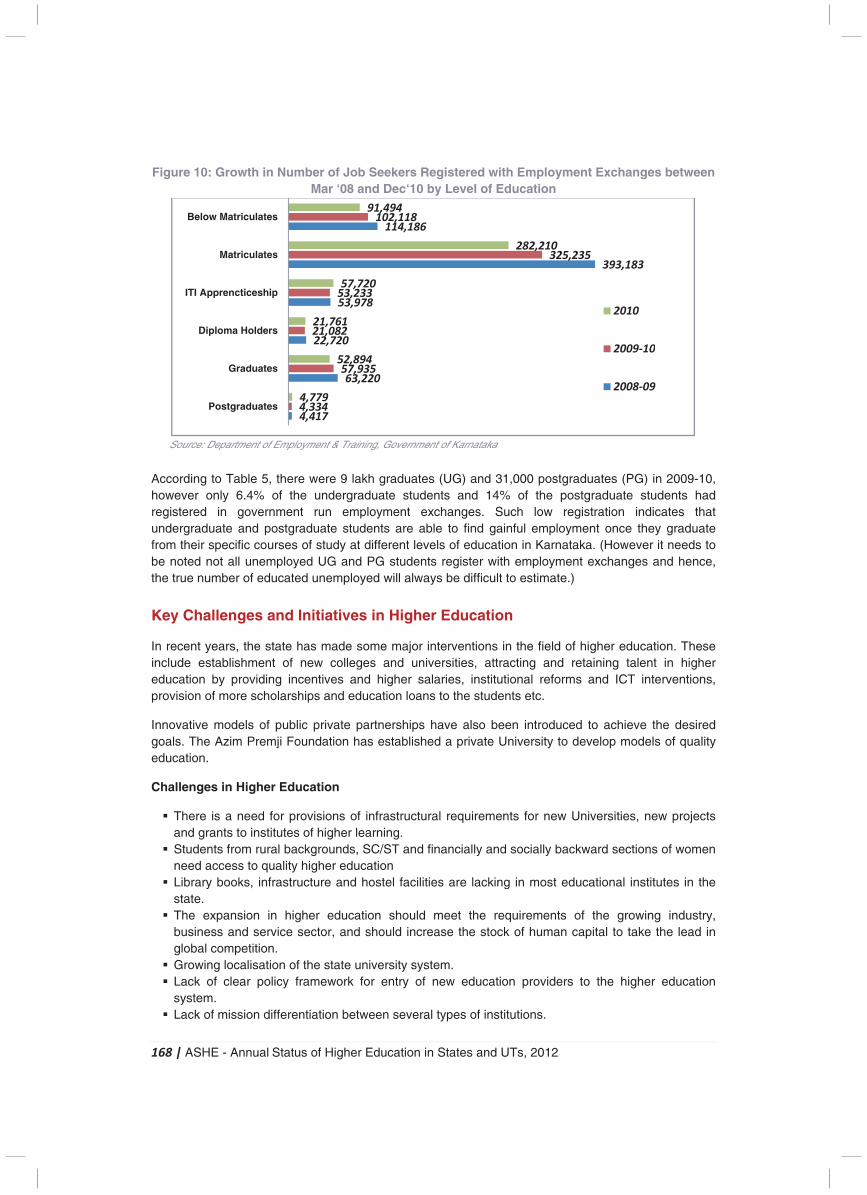
168 | ASHE - Annual Status of Higher Education in States and UTs, 2012
Figure 10: Growth in Number of Job Seekers Registered with Employment Exchanges between Mar ‘08 and Dec‘10 by Level of Education
Source: Department of Employment & Training, Government of Karnataka
According to Table 5, there were 9 lakh graduates (UG) and 31,000 postgraduates (PG) in 2009-10, however only 6.4% of the undergraduate students and 14% of the postgraduate students had registered in government run employment exchanges. Such low registration indicates that undergraduate and postgraduate students are able to find gainful employment once they graduate from their specific courses of study at different levels of education in Karnataka. (However it needs to be noted not all unemployed UG and PG students register with employment exchanges and hence, the true number of educated unemployed will always be difficult to estimate.)
Key Challenges and Initiatives in Higher Education
In recent years, the state has made some major interventions in the field of higher education. These include establishment of new colleges and universities, attracting and retaining talent in higher education by providing incentives and higher salaries, institutional reforms and ICT interventions, provision of more scholarships and education loans to the students etc.
Innovative models of public private partnerships have also been introduced to achieve the desired goals. The Azim Premji Foundation has established a private University to develop models of quality education.
Challenges in Higher Education
� There is a need for provisions of infrastructural requirements for new Universities, new projects and grants to institutes of higher learning.
� Students from rural backgrounds, SC/ST and financially and socially backward sections of women need access to quality higher education
� Library books, infrastructure and hostel facilities are lacking in most educational institutes in the state.
� The expansion in higher education should meet the requirements of the growing industry, business and service sector, and should increase the stock of human capital to take the lead in global competition.
� Growing localisation of the state university system. � Lack of clear policy framework for entry of new education providers to the higher education
system. � Lack of mission differentiation between several types of institutions.
4,417
63,220
22,720
53,978
393,183
114,186
4,334
57,935
21,082
53,233
325,235
102,118
4,779
52,894
21,761
57,720
282,210
91,494
Postgraduates
Graduates
Diploma Holders
ITI Apprencticeship
Matriculates
Below Matriculates
2010
2009-10
2008-09
169 | ASHE - Annual Status of Higher Education in States and UTs, 2012
� Deficit in public trust towards higher educational institutions. � Lack of dynamic learning goals and curricular relevance. � Research orientation in higher education is lacking in most of the universities in Karnataka. � Bridging the gap between school education and higher education � Financing patterns and self-financing of higher education institutions
Initiatives Proposed74
� There is an urgent need for universities to develop a broad-based recruitment policy. Towards that end, universities could develop a diversity index, which rates their performance on a diversity scale, which gives a sense of the different backgrounds (educational, social and regional) from which it has drawn its faculty members and administrative personnel.
� Developing stronger interlinks between different Universities in terms of academic collaborations, credit transfer system, and faculty and student mobility.
� Enhancing the autonomy of universities to take decisions regarding academic issues, intellectual issues like setting up new departments, areas of study, examination and evaluation schemes, coursework and curricula.
� Focusing attention on reform of bodies like the Academic Council and the University Syndicate to become representative of larger community and intellectual interests.
� The state has established the Karnataka Knowledge Commission, which is endeavouring to promote excellence and quality in higher education.
� Two of the state universities – Karnataka University and Mysore University – are being shaped as Model Universities. Karnataka State Higher Education Council is to be established to plan the development of higher education in the state to meet the global challenges. These developments need to be strengthened and sustained over a long period of time to increase enrolment in higher education from 13% to 21% by the end of the XII Five Year Plan.
� Collegiate Education: The main aim and responsibility is to bring up students in all respects to reach higher education Level. Thus, there are plans of opening Govt. 1st Grade Colleges at places where the demand exists, where the government would provide support in the form of land, building and other infrastructure facilities.
� Soft Skill development in colleges: This includes training programs for value education and English communication skills.
� Library books, infrastructure and hostel facilities are being proposed for the efficient functioning of Govt. polytechnic institutes.
� Paying special attention on establishing research centres across the streams of physical and natural sciences, humanities and social sciences which will have greater autonomy with regard to their academic functioning but will function under the umbrella of the Universities.
� To set up an Academy of Higher Education under the Karnataka State Higher Education Council to facilitate curriculum development, research, training value education in the Universities and Colleges
� Intensify the facility of ICT infrastructure and give access to teachers and students as basic educational facility. Make broadband connectivity, Internet access, and computer access absolutely universal such that it is perceived as a basic necessity and every student and faculty member in a university has unencumbered access to resources and data worldwide, thus encouraging a new culture of data-intensive research.
� Create new models of industry and education interface by exploring innovative internship programmes for teachers and students and collaborative and joint research projects by R&D departments of industries and faculty members in the universities.
� To continue provision of training programs for various polytechnic students as well as graduated students under Guidance Supervisory Development and Entrepreneurship Awareness programs.
74Vision Document -2020, Karnataka Higher Education
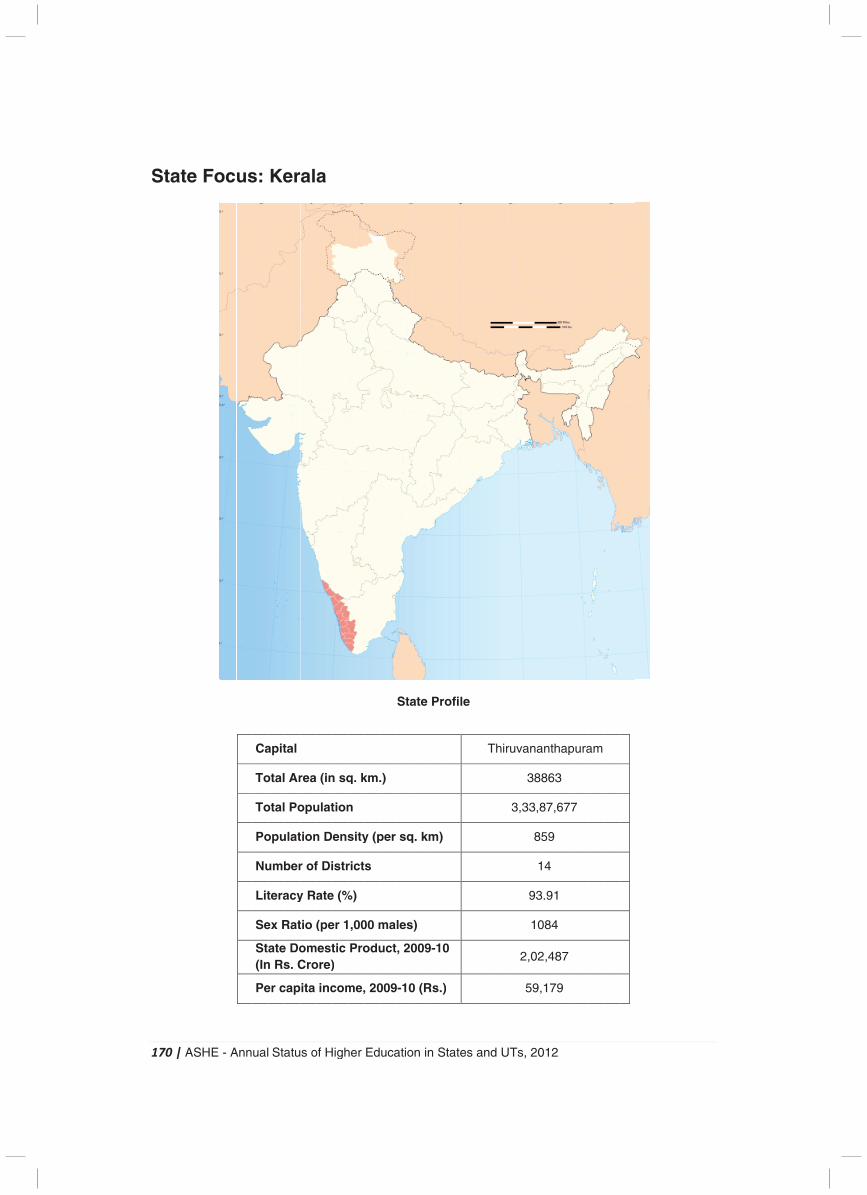
1
S
170
Sta
| A
ate
ASH
e F
HE
Fo
- A
oc
Ann
us
ual
s:
Ca
To
To
Po
Nu
Lit
Se
Sta(In
Pe
Sta
Ke
apit
otal
otal
opu
umb
tera
ex R
aten Rs
er c
atu
er
tal
Ar
Po
ulat
ber
acy
Rat
e Dos. C
cap
s o
al
rea
opu
tion
r of
y Ra
tio (
omCro
ita
of H
a
(in
ulat
n D
f Di
ate
(pe
mestore)
inc
High
n sq
tion
ens
istr
e (%
er 1
tic )
com
her
q. k
n
sity
rict
%)
,00
Pro
me,
Ed
km.
y (p
s
00 m
odu
, 20
uca
.)
per
ma
uct
009
atio
Sta
sq
les
, 20
9-10
on in
ate
q. k
s)
009
0 (R
n S
Pr
m)
9-10
Rs.)
Stat
ofi
0
)
es
le
and
T
d U
Thir
UTs
ruva
3,3
2
, 20
ana
38
33,8
8
1
93
10
2,02
59
012
anth
8863
87,
859
14
3.91
084
2,48
,17
2
hap
3
677
1
4
87
79
pura
7
am
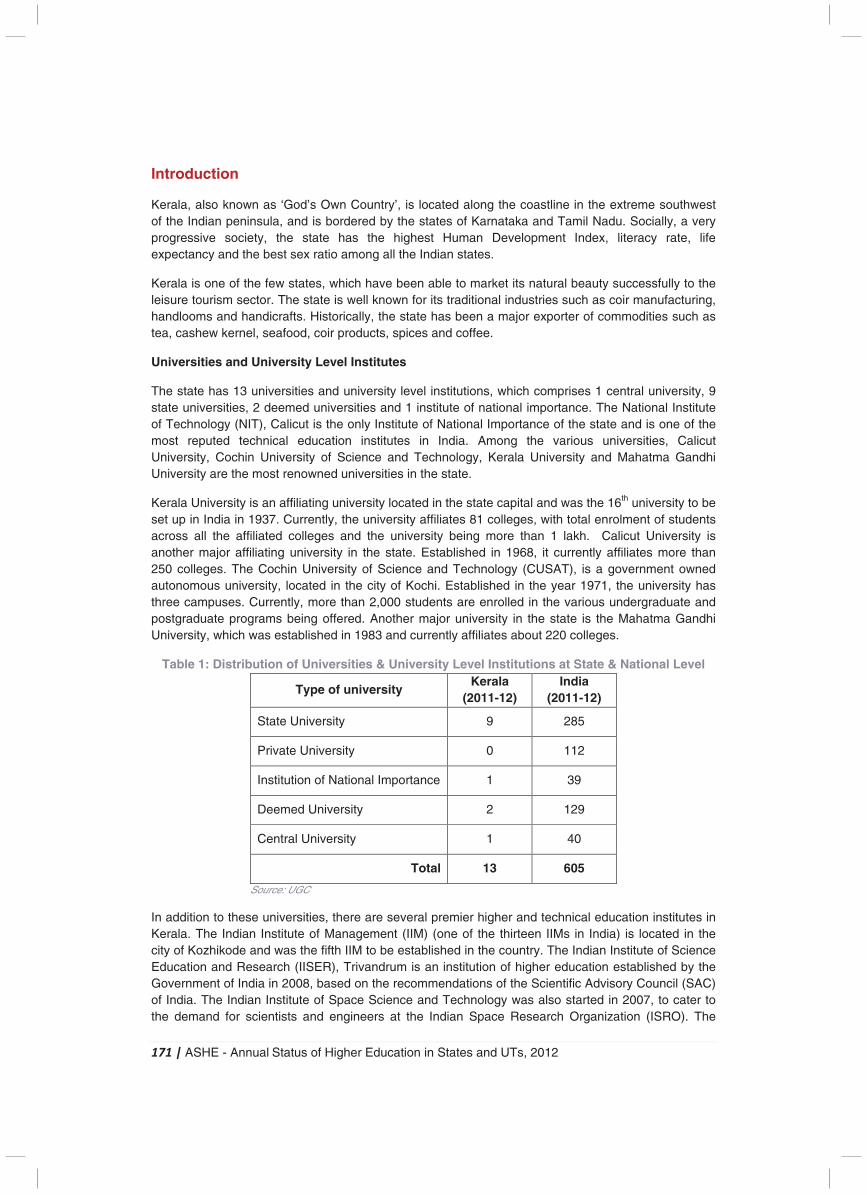
171 | ASHE - Annual Status of Higher Education in States and UTs, 2012
Introduction
Kerala, also known as ‘God’s Own Country’, is located along the coastline in the extreme southwest of the Indian peninsula, and is bordered by the states of Karnataka and Tamil Nadu. Socially, a very progressive society, the state has the highest Human Development Index, literacy rate, life expectancy and the best sex ratio among all the Indian states.
Kerala is one of the few states, which have been able to market its natural beauty successfully to the leisure tourism sector. The state is well known for its traditional industries such as coir manufacturing, handlooms and handicrafts. Historically, the state has been a major exporter of commodities such as tea, cashew kernel, seafood, coir products, spices and coffee.
Universities and University Level Institutes
The state has 13 universities and university level institutions, which comprises 1 central university, 9 state universities, 2 deemed universities and 1 institute of national importance. The National Institute of Technology (NIT), Calicut is the only Institute of National Importance of the state and is one of the most reputed technical education institutes in India. Among the various universities, Calicut University, Cochin University of Science and Technology, Kerala University and Mahatma Gandhi University are the most renowned universities in the state.
Kerala University is an affiliating university located in the state capital and was the 16th university to be set up in India in 1937. Currently, the university affiliates 81 colleges, with total enrolment of students across all the affiliated colleges and the university being more than 1 lakh. Calicut University is another major affiliating university in the state. Established in 1968, it currently affiliates more than 250 colleges. The Cochin University of Science and Technology (CUSAT), is a government owned autonomous university, located in the city of Kochi. Established in the year 1971, the university has three campuses. Currently, more than 2,000 students are enrolled in the various undergraduate and postgraduate programs being offered. Another major university in the state is the Mahatma Gandhi University, which was established in 1983 and currently affiliates about 220 colleges.
Table 1: Distribution of Universities & University Level Institutions at State & National Level
Type of university Kerala
(2011-12) India
(2011-12)
State University 9 285
Private University 0 112
Institution of National Importance 1 39
Deemed University 2 129
Central University 1 40
Total 13 605
Source: UGC
In addition to these universities, there are several premier higher and technical education institutes in Kerala. The Indian Institute of Management (IIM) (one of the thirteen IIMs in India) is located in the city of Kozhikode and was the fifth IIM to be established in the country. The Indian Institute of Science Education and Research (IISER), Trivandrum is an institution of higher education established by the Government of India in 2008, based on the recommendations of the Scientific Advisory Council (SAC) of India. The Indian Institute of Space Science and Technology was also started in 2007, to cater to the demand for scientists and engineers at the Indian Space Research Organization (ISRO). The
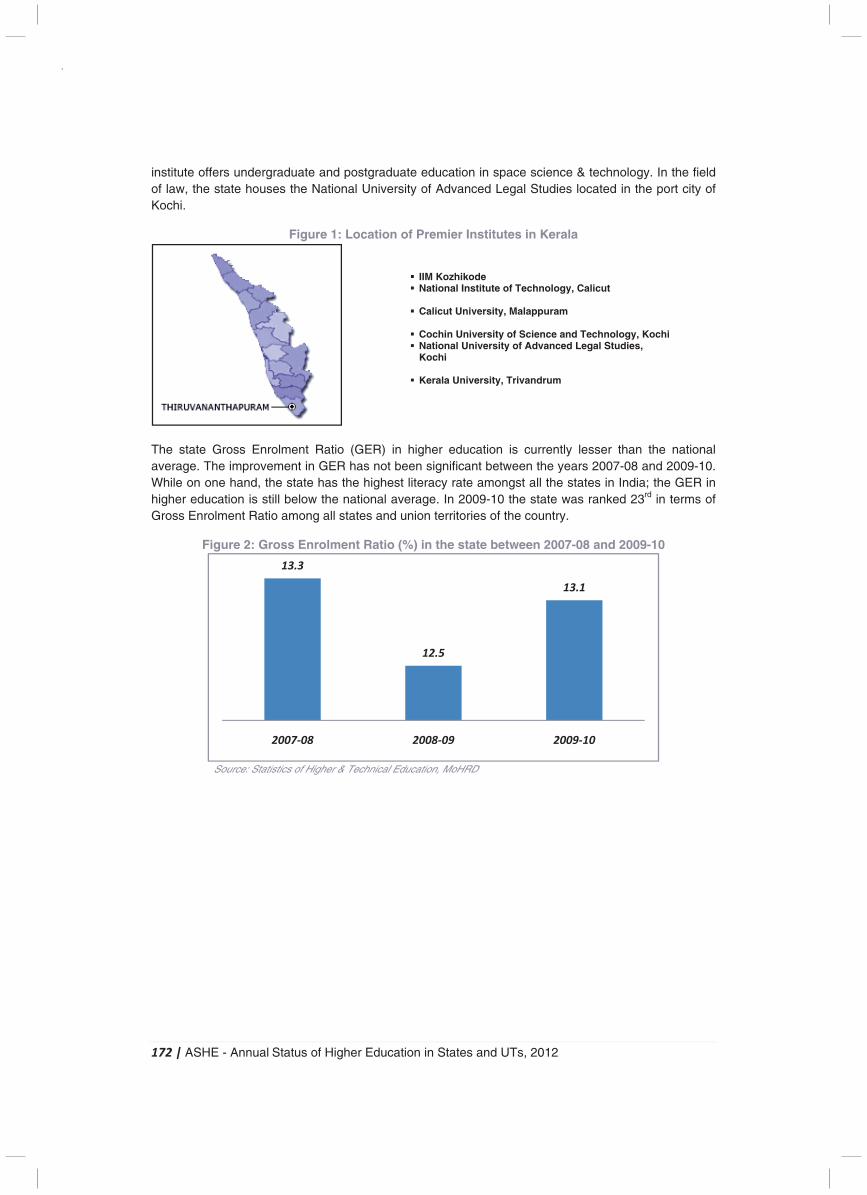
172 | ASHE - Annual Status of Higher Education in States and UTs, 2012
institute offers undergraduate and postgraduate education in space science & technology. In the field of law, the state houses the National University of Advanced Legal Studies located in the port city of Kochi.
Figure 1: Location of Premier Institutes in Kerala
The state Gross Enrolment Ratio (GER) in higher education is currently lesser than the national average. The improvement in GER has not been significant between the years 2007-08 and 2009-10. While on one hand, the state has the highest literacy rate amongst all the states in India; the GER in higher education is still below the national average. In 2009-10 the state was ranked 23rd in terms of Gross Enrolment Ratio among all states and union territories of the country.
Figure 2: Gross Enrolment Ratio (%) in the state between 2007-08 and 2009-10
Source: Statistics of Higher & Technical Education, MoHRD
� IIM Kozhikode � National Institute of Technology, Calicut
� Calicut University, Malappuram
� Cochin University of Science and Technology, Kochi � National University of Advanced Legal Studies,
Kochi
� Kerala University, Trivandrum
13.3
12.5
13.1
2007-08 2008-09 2009-10
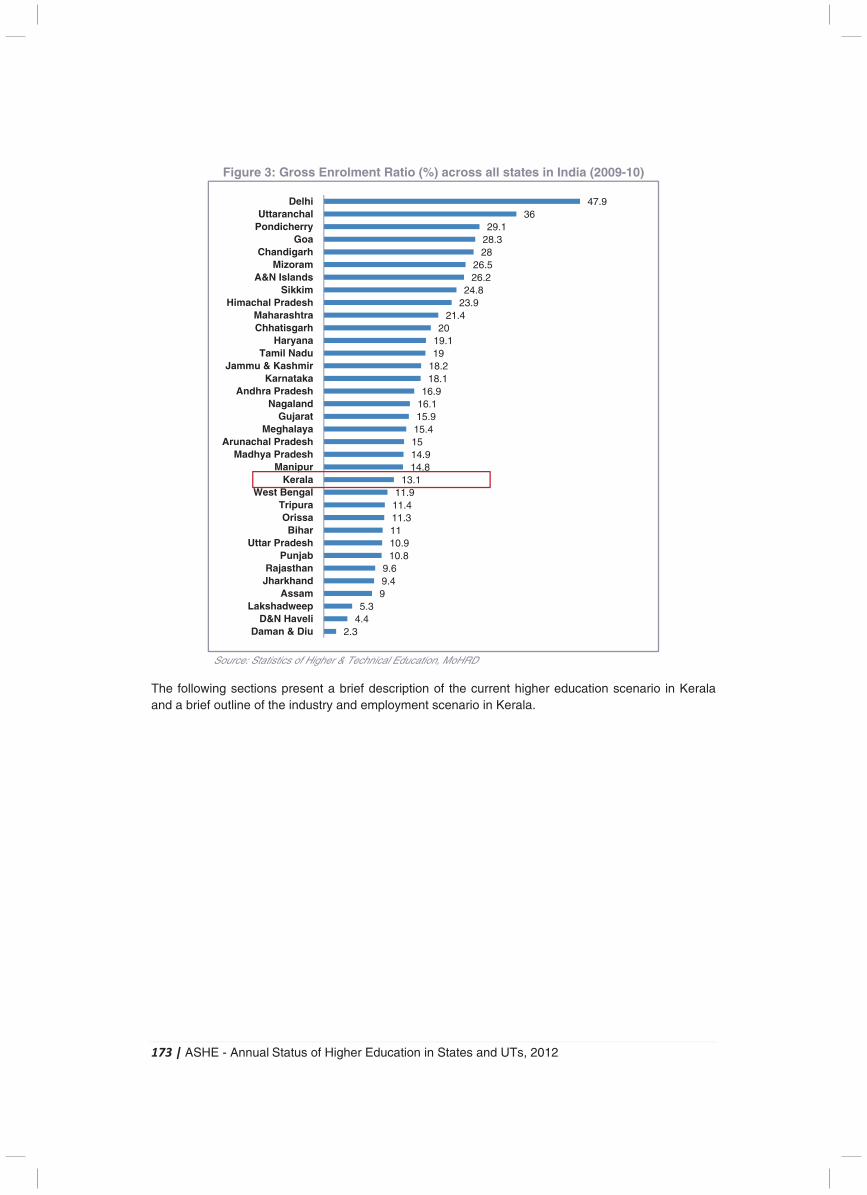
173 | ASHE - Annual Status of Higher Education in States and UTs, 2012
Figure 3: Gross Enrolment Ratio (%) across all states in India (2009-10)
Source: Statistics of Higher & Technical Education, MoHRD
The following sections present a brief description of the current higher education scenario in Kerala and a brief outline of the industry and employment scenario in Kerala.
2.34.45.3
99.49.6
10.810.91111.311.411.9
13.114.814.91515.415.916.116.9
18.118.21919.120
21.423.924.8
26.226.5
2828.329.1
3647.9
Daman & DiuD&N Haveli
LakshadweepAssam
JharkhandRajasthan
PunjabUttar Pradesh
BiharOrissa
TripuraWest Bengal
KeralaManipur
Madhya PradeshArunachal Pradesh
MeghalayaGujarat
NagalandAndhra Pradesh
KarnatakaJammu & Kashmir
Tamil NaduHaryana
ChhatisgarhMaharashtra
Himachal PradeshSikkim
A&N IslandsMizoram
ChandigarhGoa
PondicherryUttaranchal
Delhi
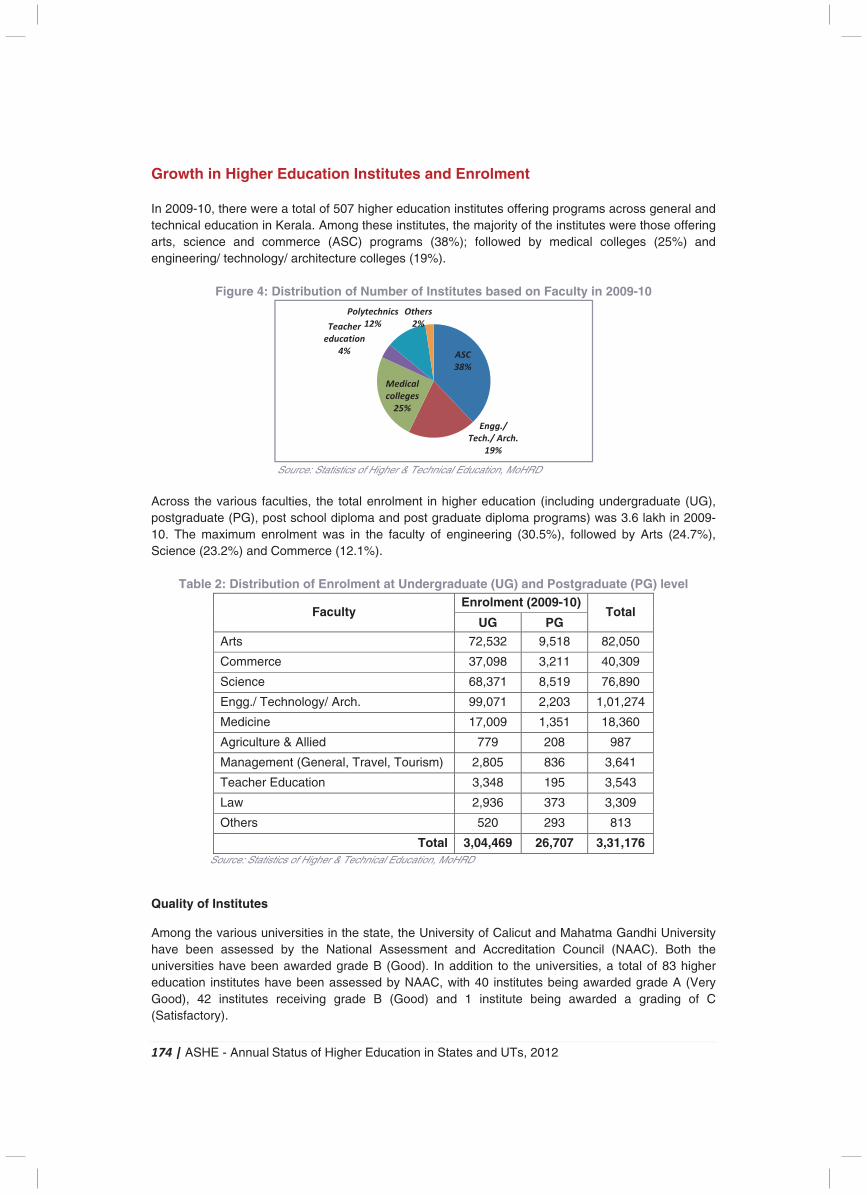
174 | ASHE - Annual Status of Higher Education in States and UTs, 2012
Growth in Higher Education Institutes and Enrolment In 2009-10, there were a total of 507 higher education institutes offering programs across general and technical education in Kerala. Among these institutes, the majority of the institutes were those offering arts, science and commerce (ASC) programs (38%); followed by medical colleges (25%) and engineering/ technology/ architecture colleges (19%).
Figure 4: Distribution of Number of Institutes based on Faculty in 2009-10
Source: Statistics of Higher & Technical Education, MoHRD
Across the various faculties, the total enrolment in higher education (including undergraduate (UG), postgraduate (PG), post school diploma and post graduate diploma programs) was 3.6 lakh in 2009-10. The maximum enrolment was in the faculty of engineering (30.5%), followed by Arts (24.7%), Science (23.2%) and Commerce (12.1%).
Table 2: Distribution of Enrolment at Undergraduate (UG) and Postgraduate (PG) level
Faculty Enrolment (2009-10)
Total UG PG
Arts 72,532 9,518 82,050
Commerce 37,098 3,211 40,309
Science 68,371 8,519 76,890
Engg./ Technology/ Arch. 99,071 2,203 1,01,274
Medicine 17,009 1,351 18,360
Agriculture & Allied 779 208 987
Management (General, Travel, Tourism) 2,805 836 3,641
Teacher Education 3,348 195 3,543
Law 2,936 373 3,309
Others 520 293 813
Total 3,04,469 26,707 3,31,176 Source: Statistics of Higher & Technical Education, MoHRD
Quality of Institutes
Among the various universities in the state, the University of Calicut and Mahatma Gandhi University have been assessed by the National Assessment and Accreditation Council (NAAC). Both the universities have been awarded grade B (Good). In addition to the universities, a total of 83 higher education institutes have been assessed by NAAC, with 40 institutes being awarded grade A (Very Good), 42 institutes receiving grade B (Good) and 1 institute being awarded a grading of C (Satisfactory).
ASC
38%
Engg./
Tech./ Arch.
19%
Medical
colleges
25%
Teacher
education
4%
Polytechnics
12%
Others
2%
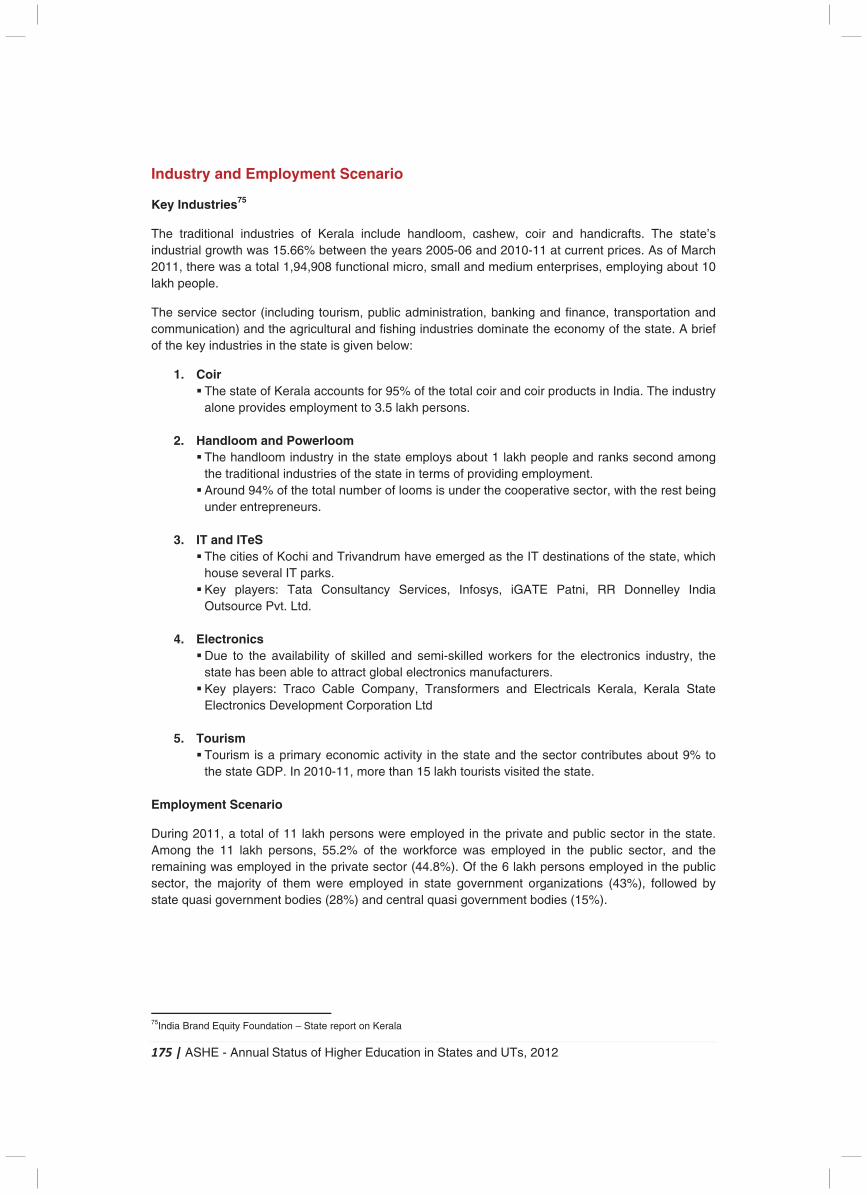
175 | ASHE - Annual Status of Higher Education in States and UTs, 2012
Industry and Employment Scenario
Key Industries75
The traditional industries of Kerala include handloom, cashew, coir and handicrafts. The state’s industrial growth was 15.66% between the years 2005-06 and 2010-11 at current prices. As of March 2011, there was a total 1,94,908 functional micro, small and medium enterprises, employing about 10 lakh people.
The service sector (including tourism, public administration, banking and finance, transportation and communication) and the agricultural and fishing industries dominate the economy of the state. A brief of the key industries in the state is given below:
1. Coir � The state of Kerala accounts for 95% of the total coir and coir products in India. The industry
alone provides employment to 3.5 lakh persons.
2. Handloom and Powerloom � The handloom industry in the state employs about 1 lakh people and ranks second among
the traditional industries of the state in terms of providing employment. � Around 94% of the total number of looms is under the cooperative sector, with the rest being
under entrepreneurs.
3. IT and ITeS � The cities of Kochi and Trivandrum have emerged as the IT destinations of the state, which
house several IT parks. � Key players: Tata Consultancy Services, Infosys, iGATE Patni, RR Donnelley India
Outsource Pvt. Ltd.
4. Electronics � Due to the availability of skilled and semi-skilled workers for the electronics industry, the
state has been able to attract global electronics manufacturers. � Key players: Traco Cable Company, Transformers and Electricals Kerala, Kerala State
Electronics Development Corporation Ltd
5. Tourism � Tourism is a primary economic activity in the state and the sector contributes about 9% to
the state GDP. In 2010-11, more than 15 lakh tourists visited the state.
Employment Scenario
During 2011, a total of 11 lakh persons were employed in the private and public sector in the state. Among the 11 lakh persons, 55.2% of the workforce was employed in the public sector, and the remaining was employed in the private sector (44.8%). Of the 6 lakh persons employed in the public sector, the majority of them were employed in state government organizations (43%), followed by state quasi government bodies (28%) and central quasi government bodies (15%).
75India Brand Equity Foundation – State report on Kerala
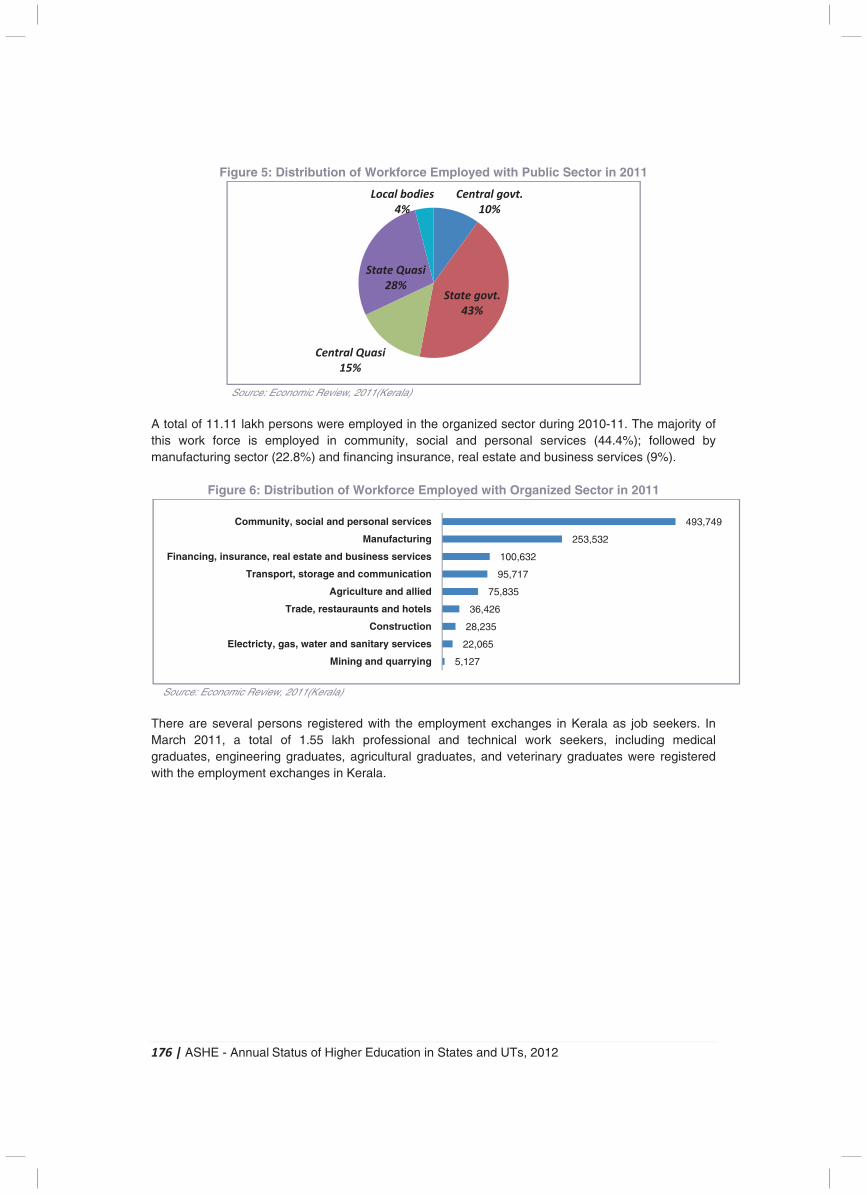
176 | ASHE - Annual Status of Higher Education in States and UTs, 2012
Figure 5: Distribution of Workforce Employed with Public Sector in 2011
Source: Economic Review, 2011(Kerala)
A total of 11.11 lakh persons were employed in the organized sector during 2010-11. The majority of this work force is employed in community, social and personal services (44.4%); followed by manufacturing sector (22.8%) and financing insurance, real estate and business services (9%).
Figure 6: Distribution of Workforce Employed with Organized Sector in 2011
Source: Economic Review, 2011(Kerala)
There are several persons registered with the employment exchanges in Kerala as job seekers. In March 2011, a total of 1.55 lakh professional and technical work seekers, including medical graduates, engineering graduates, agricultural graduates, and veterinary graduates were registered with the employment exchanges in Kerala.
Central govt.
10%
State govt.
43%
Central Quasi
15%
State Quasi
28%
Local bodies
4%
5,127
22,065
28,235
36,426
75,835
95,717
100,632
253,532
493,749
Mining and quarrying
Electricty, gas, water and sanitary services
Construction
Trade, restauraunts and hotels
Agriculture and allied
Transport, storage and communication
Financing, insurance, real estate and business services
Manufacturing
Community, social and personal services
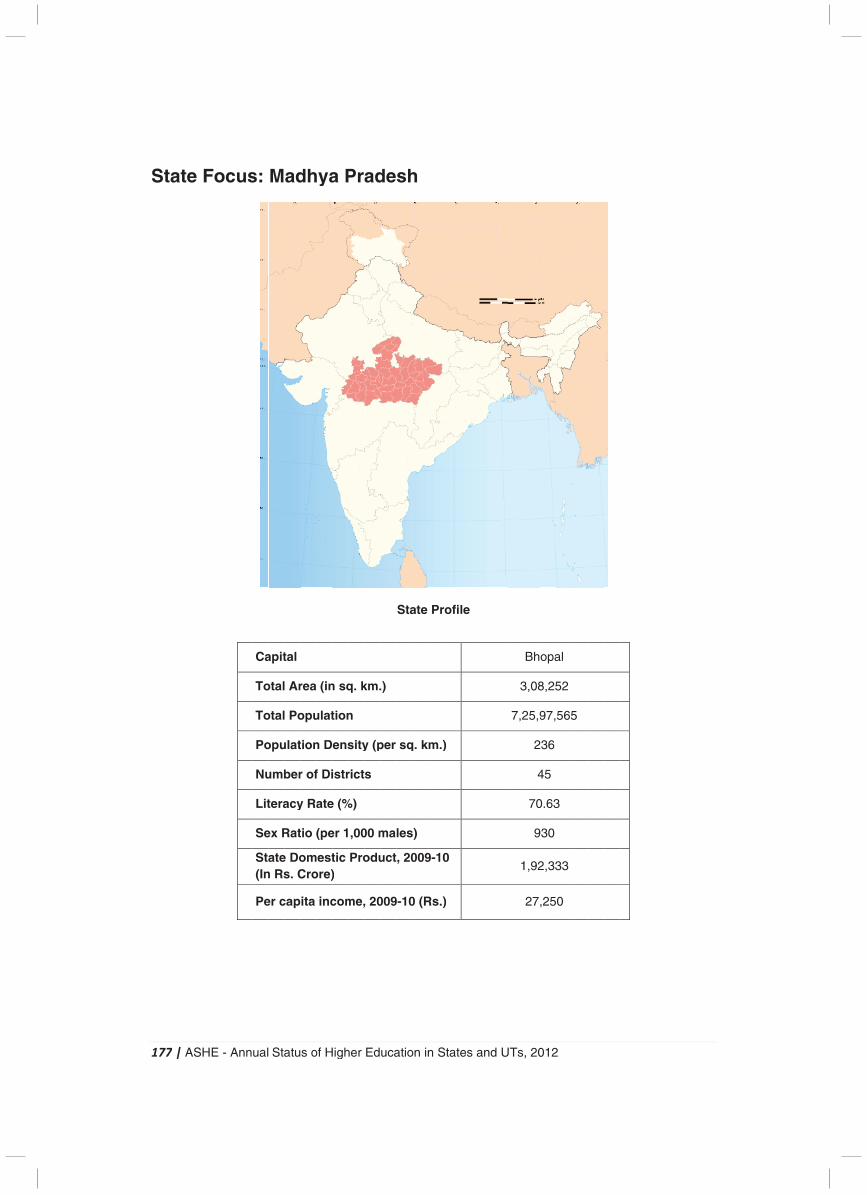
1
S
177
Sta
| A
ate
ASH
e F
HE
Fo
- A
oc
Ann
us
ual
s:
Ca
To
To
Po
Nu
Lit
Se
Sta(In
Pe
Sta
M
apit
otal
otal
opu
umb
tera
ex R
aten Rs
er c
atu
ad
tal
Ar
Po
ulat
ber
acy
Rat
e Dos. C
cap
s o
dh
rea
opu
tion
r of
y Ra
tio (
omCro
ita
of H
hya
(in
ulat
n D
f Di
ate
(pe
mestore)
inc
High
a P
n sq
tion
ens
istr
e (%
er 1
tic )
com
her
Pr
q. k
n
sity
rict
%)
,00
Pro
me,
Ed
ad
km.
y (p
s
00 m
odu
, 20
uca
de
.)
per
ma
uct
009
atio
sh
Sta
sq
les
, 20
9-10
on in
h
ate
q. k
s)
009
0 (R
n S
Pr
m.)
9-10
Rs.)
Stat
ofi
)
0
)
es
le
and
d U
UTs
3
7,2
1
, 20
Bh
3,08
25,9
2
4
70
9
1,92
27
012
opa
8,25
97,
236
45
0.63
930
2,33
,25
2
al
52
565
3
33
50
5
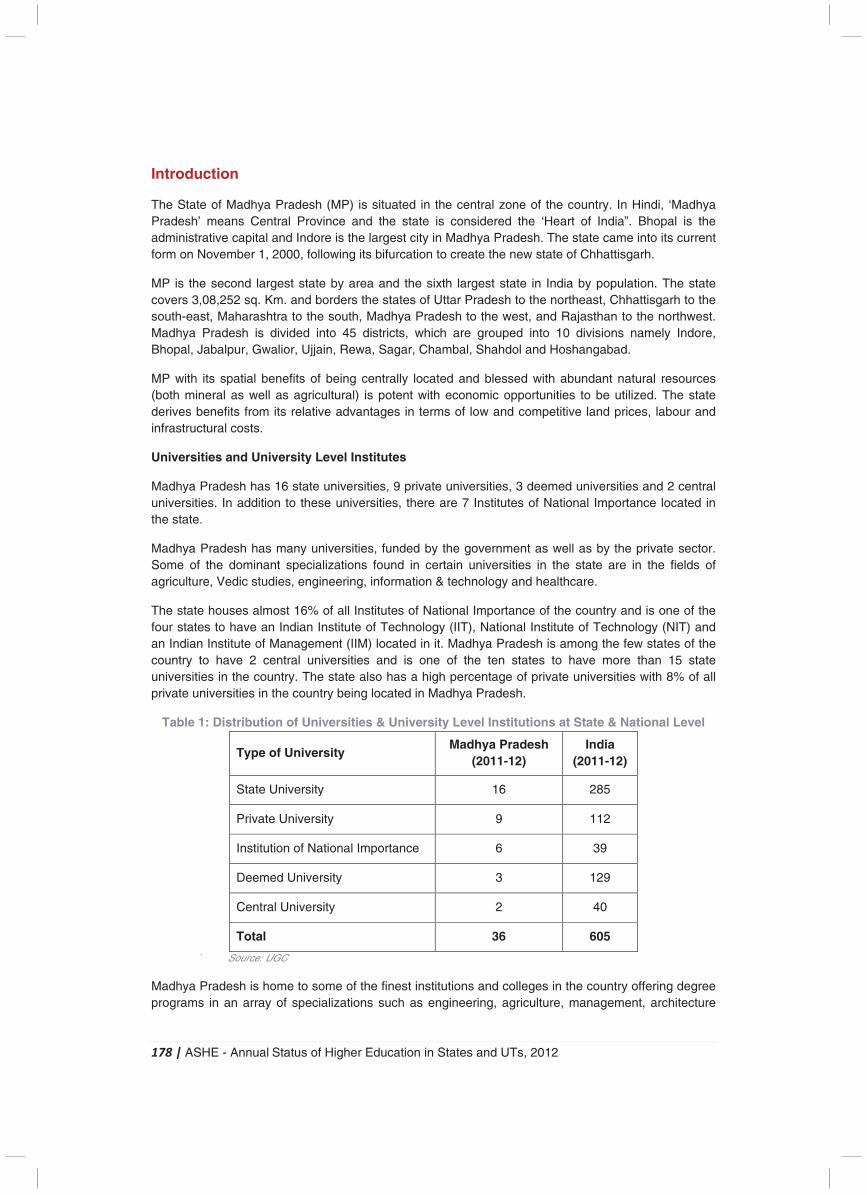
178 | ASHE - Annual Status of Higher Education in States and UTs, 2012
Introduction
The State of Madhya Pradesh (MP) is situated in the central zone of the country. In Hindi, ‘Madhya Pradesh’ means Central Province and the state is considered the ‘Heart of India”. Bhopal is the administrative capital and Indore is the largest city in Madhya Pradesh. The state came into its current form on November 1, 2000, following its bifurcation to create the new state of Chhattisgarh.
MP is the second largest state by area and the sixth largest state in India by population. The state covers 3,08,252 sq. Km. and borders the states of Uttar Pradesh to the northeast, Chhattisgarh to the south-east, Maharashtra to the south, Madhya Pradesh to the west, and Rajasthan to the northwest. Madhya Pradesh is divided into 45 districts, which are grouped into 10 divisions namely Indore, Bhopal, Jabalpur, Gwalior, Ujjain, Rewa, Sagar, Chambal, Shahdol and Hoshangabad.
MP with its spatial benefits of being centrally located and blessed with abundant natural resources (both mineral as well as agricultural) is potent with economic opportunities to be utilized. The state derives benefits from its relative advantages in terms of low and competitive land prices, labour and infrastructural costs.
Universities and University Level Institutes
Madhya Pradesh has 16 state universities, 9 private universities, 3 deemed universities and 2 central universities. In addition to these universities, there are 7 Institutes of National Importance located in the state.
Madhya Pradesh has many universities, funded by the government as well as by the private sector. Some of the dominant specializations found in certain universities in the state are in the fields of agriculture, Vedic studies, engineering, information & technology and healthcare.
The state houses almost 16% of all Institutes of National Importance of the country and is one of the four states to have an Indian Institute of Technology (IIT), National Institute of Technology (NIT) and an Indian Institute of Management (IIM) located in it. Madhya Pradesh is among the few states of the country to have 2 central universities and is one of the ten states to have more than 15 state universities in the country. The state also has a high percentage of private universities with 8% of all private universities in the country being located in Madhya Pradesh.
Table 1: Distribution of Universities & University Level Institutions at State & National Level
Type of University Madhya Pradesh
(2011-12) India
(2011-12)
State University 16 285
Private University 9 112
Institution of National Importance 6 39
Deemed University 3 129
Central University 2 40
Total 36 605
` Source: UGC
Madhya Pradesh is home to some of the finest institutions and colleges in the country offering degree programs in an array of specializations such as engineering, agriculture, management, architecture
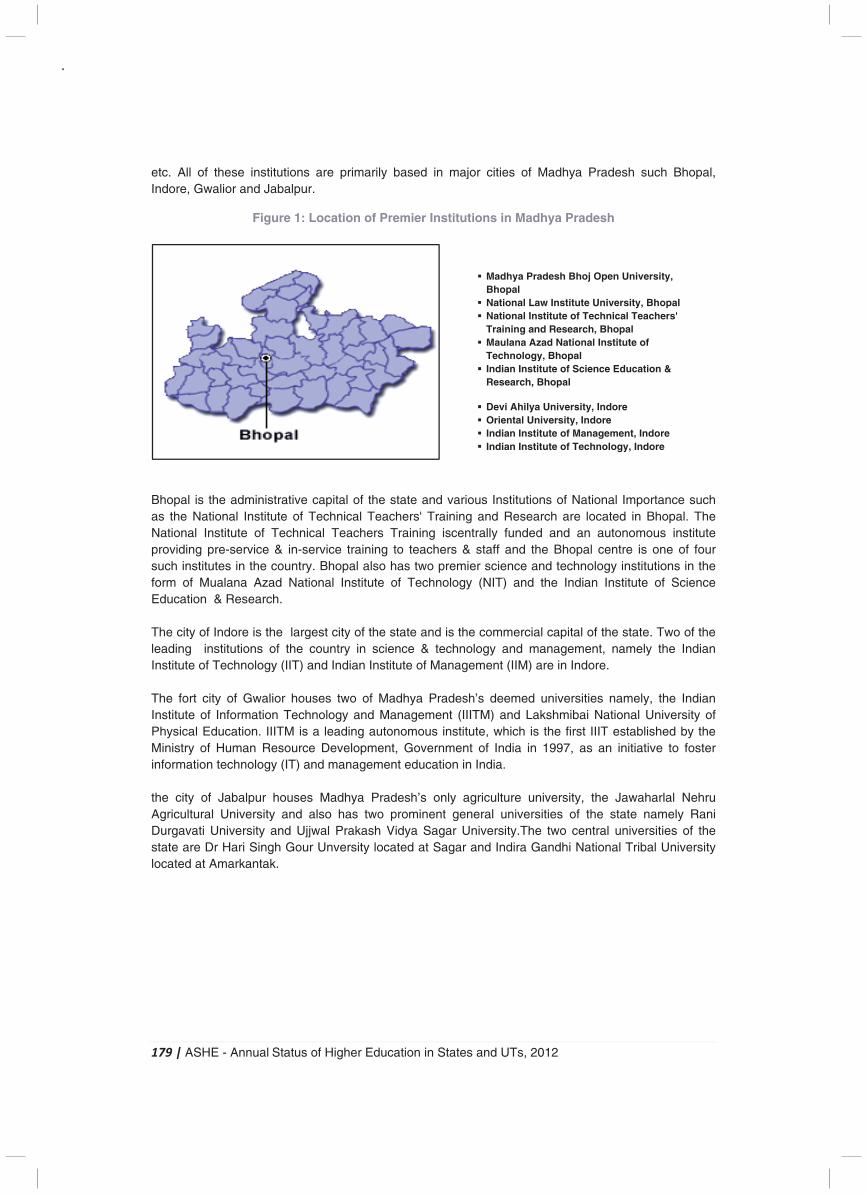
179 | ASHE - Annual Status of Higher Education in States and UTs, 2012
etc. All of these institutions are primarily based in major cities of Madhya Pradesh such Bhopal, Indore, Gwalior and Jabalpur.
Figure 1: Location of Premier Institutions in Madhya Pradesh
Bhopal is the administrative capital of the state and various Institutions of National Importance such as the National Institute of Technical Teachers' Training and Research are located in Bhopal. The National Institute of Technical Teachers Training iscentrally funded and an autonomous institute providing pre-service & in-service training to teachers & staff and the Bhopal centre is one of four such institutes in the country. Bhopal also has two premier science and technology institutions in the form of Mualana Azad National Institute of Technology (NIT) and the Indian Institute of Science Education & Research. The city of Indore is the largest city of the state and is the commercial capital of the state. Two of the leading institutions of the country in science & technology and management, namely the Indian Institute of Technology (IIT) and Indian Institute of Management (IIM) are in Indore. The fort city of Gwalior houses two of Madhya Pradesh’s deemed universities namely, the Indian Institute of Information Technology and Management (IIITM) and Lakshmibai National University of Physical Education. IIITM is a leading autonomous institute, which is the first IIIT established by the Ministry of Human Resource Development, Government of India in 1997, as an initiative to foster information technology (IT) and management education in India. the city of Jabalpur houses Madhya Pradesh’s only agriculture university, the Jawaharlal Nehru Agricultural University and also has two prominent general universities of the state namely Rani Durgavati University and Ujjwal Prakash Vidya Sagar University.The two central universities of the state are Dr Hari Singh Gour Unversity located at Sagar and Indira Gandhi National Tribal University located at Amarkantak.
� Madhya Pradesh Bhoj Open University,
Bhopal � National Law Institute University, Bhopal � National Institute of Technical Teachers'
Training and Research, Bhopal � Maulana Azad National Institute of
Technology, Bhopal � Indian Institute of Science Education &
Research, Bhopal
� Devi Ahilya University, Indore � Oriental University, Indore � Indian Institute of Management, Indore � Indian Institute of Technology, Indore
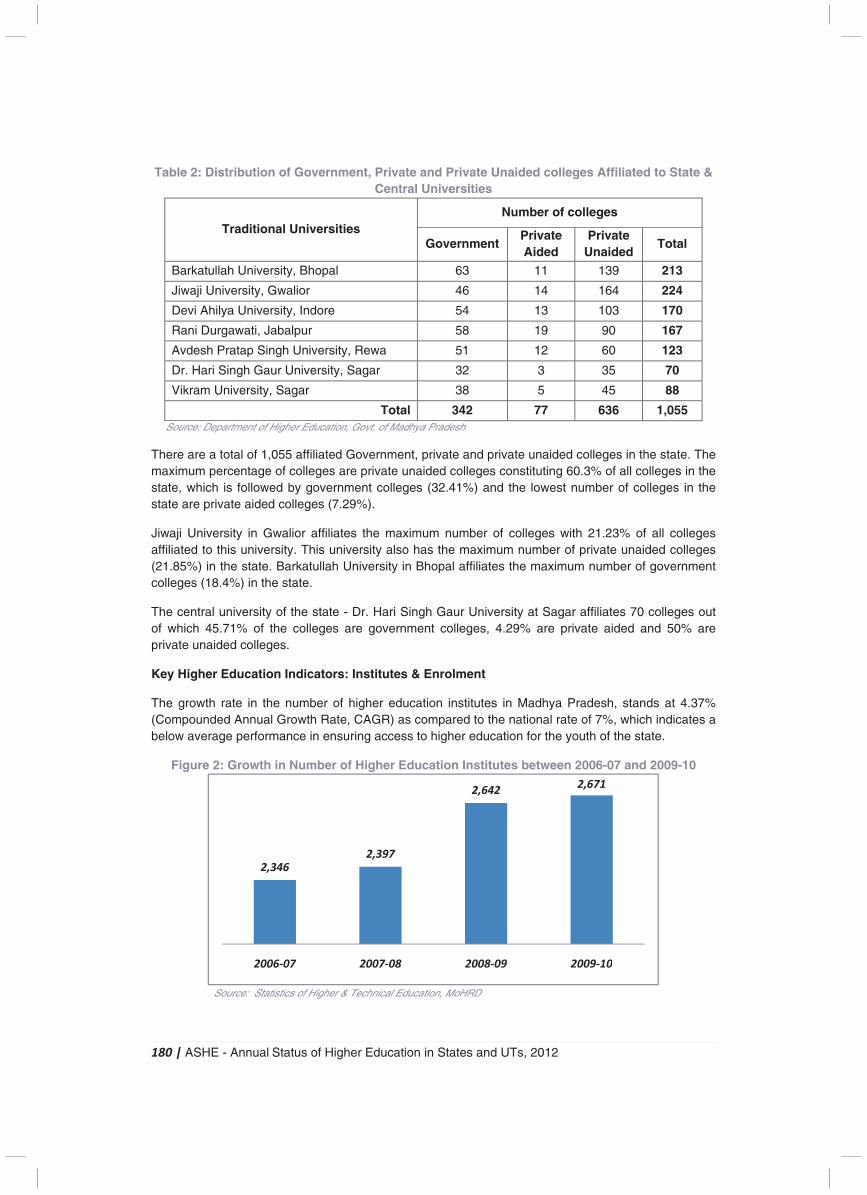
180 | ASHE - Annual Status of Higher Education in States and UTs, 2012
Table 2: Distribution of Government, Private and Private Unaided colleges Affiliated to State & Central Universities
Traditional Universities Number of colleges
Government Private Aided
Private Unaided
Total
Barkatullah University, Bhopal 63 11 139 213
Jiwaji University, Gwalior 46 14 164 224
Devi Ahilya University, Indore 54 13 103 170
Rani Durgawati, Jabalpur 58 19 90 167
Avdesh Pratap Singh University, Rewa 51 12 60 123
Dr. Hari Singh Gaur University, Sagar 32 3 35 70
Vikram University, Sagar 38 5 45 88
Total 342 77 636 1,055 Source: Department of Higher Education, Govt. of Madhya Pradesh
There are a total of 1,055 affiliated Government, private and private unaided colleges in the state. The maximum percentage of colleges are private unaided colleges constituting 60.3% of all colleges in the state, which is followed by government colleges (32.41%) and the lowest number of colleges in the state are private aided colleges (7.29%).
Jiwaji University in Gwalior affiliates the maximum number of colleges with 21.23% of all colleges affiliated to this university. This university also has the maximum number of private unaided colleges (21.85%) in the state. Barkatullah University in Bhopal affiliates the maximum number of government colleges (18.4%) in the state.
The central university of the state - Dr. Hari Singh Gaur University at Sagar affiliates 70 colleges out of which 45.71% of the colleges are government colleges, 4.29% are private aided and 50% are private unaided colleges.
Key Higher Education Indicators: Institutes & Enrolment
The growth rate in the number of higher education institutes in Madhya Pradesh, stands at 4.37% (Compounded Annual Growth Rate, CAGR) as compared to the national rate of 7%, which indicates a below average performance in ensuring access to higher education for the youth of the state.
Figure 2: Growth in Number of Higher Education Institutes between 2006-07 and 2009-10
Source: Statistics of Higher & Technical Education, MoHRD
2,3462,397
2,6422,671
2006-07 2007-08 2008-09 2009-10
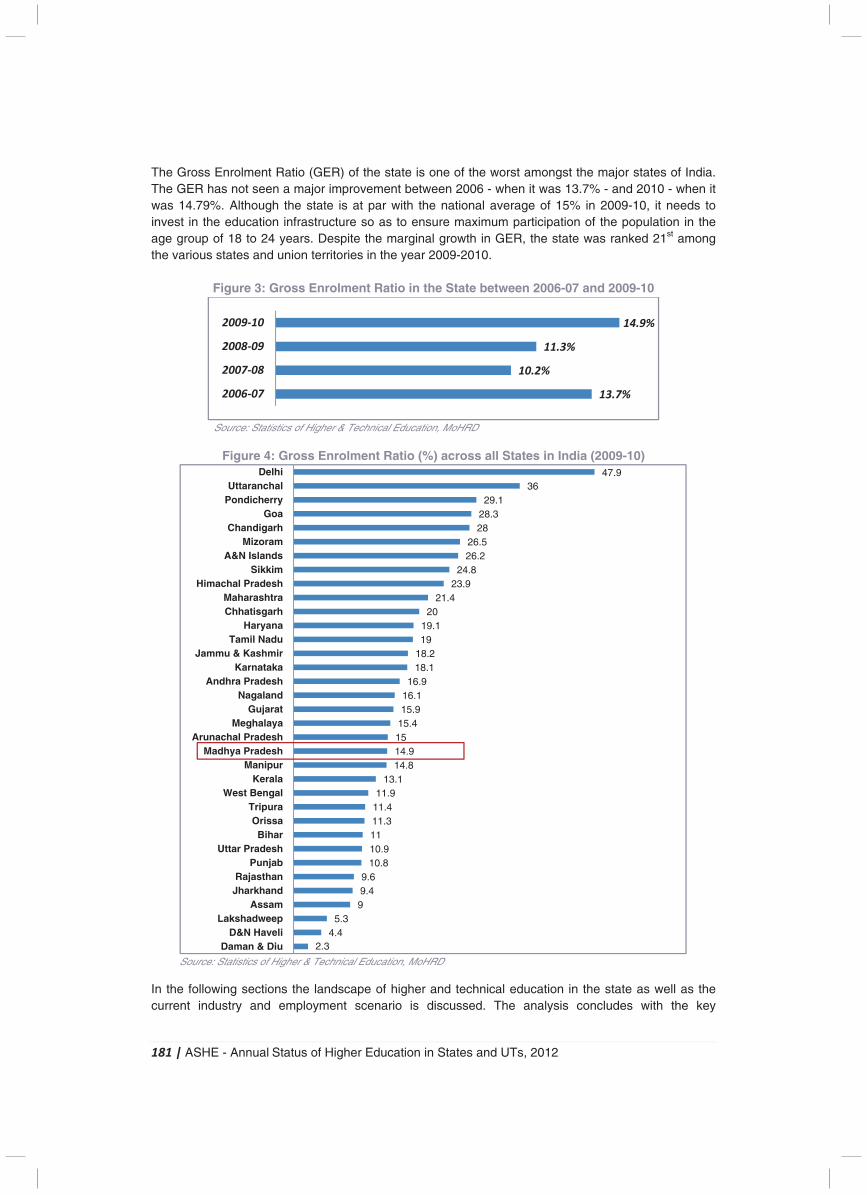
181 | ASHE - Annual Status of Higher Education in States and UTs, 2012
The Gross Enrolment Ratio (GER) of the state is one of the worst amongst the major states of India. The GER has not seen a major improvement between 2006 - when it was 13.7% - and 2010 - when it was 14.79%. Although the state is at par with the national average of 15% in 2009-10, it needs to invest in the education infrastructure so as to ensure maximum participation of the population in the age group of 18 to 24 years. Despite the marginal growth in GER, the state was ranked 21st among the various states and union territories in the year 2009-2010.
Figure 3: Gross Enrolment Ratio in the State between 2006-07 and 2009-10
Source: Statistics of Higher & Technical Education, MoHRD
Figure 4: Gross Enrolment Ratio (%) across all States in India (2009-10)
Source: Statistics of Higher & Technical Education, MoHRD
In the following sections the landscape of higher and technical education in the state as well as the current industry and employment scenario is discussed. The analysis concludes with the key
13.7%
10.2%
11.3%
14.9%
2006-07
2007-08
2008-09
2009-10
2.34.4
5.399.49.6
10.810.91111.311.411.9
13.114.814.91515.415.916.116.9
18.118.21919.1
2021.4
23.924.8
26.226.5
2828.329.1
3647.9
Daman & DiuD&N Haveli
LakshadweepAssam
JharkhandRajasthan
PunjabUttar Pradesh
BiharOrissa
TripuraWest Bengal
KeralaManipur
Madhya PradeshArunachal Pradesh
MeghalayaGujarat
NagalandAndhra Pradesh
KarnatakaJammu & Kashmir
Tamil NaduHaryana
ChhatisgarhMaharashtra
Himachal PradeshSikkim
A&N IslandsMizoram
ChandigarhGoa
PondicherryUttaranchal
Delhi
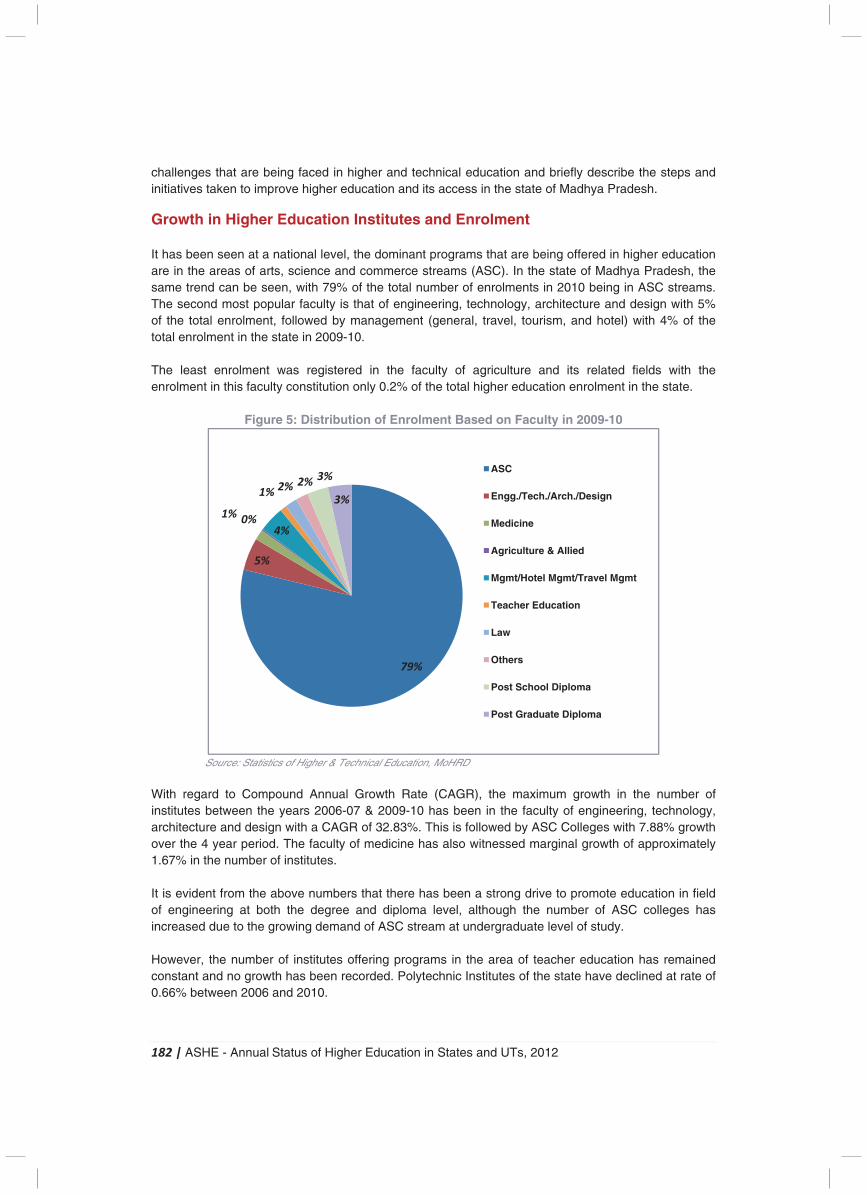
182 | ASHE - Annual Status of Higher Education in States and UTs, 2012
challenges that are being faced in higher and technical education and briefly describe the steps and initiatives taken to improve higher education and its access in the state of Madhya Pradesh.
Growth in Higher Education Institutes and Enrolment It has been seen at a national level, the dominant programs that are being offered in higher education are in the areas of arts, science and commerce streams (ASC). In the state of Madhya Pradesh, the same trend can be seen, with 79% of the total number of enrolments in 2010 being in ASC streams. The second most popular faculty is that of engineering, technology, architecture and design with 5% of the total enrolment, followed by management (general, travel, tourism, and hotel) with 4% of the total enrolment in the state in 2009-10. The least enrolment was registered in the faculty of agriculture and its related fields with the enrolment in this faculty constitution only 0.2% of the total higher education enrolment in the state.
Figure 5: Distribution of Enrolment Based on Faculty in 2009-10
Source: Statistics of Higher & Technical Education, MoHRD
With regard to Compound Annual Growth Rate (CAGR), the maximum growth in the number of institutes between the years 2006-07 & 2009-10 has been in the faculty of engineering, technology, architecture and design with a CAGR of 32.83%. This is followed by ASC Colleges with 7.88% growth over the 4 year period. The faculty of medicine has also witnessed marginal growth of approximately 1.67% in the number of institutes. It is evident from the above numbers that there has been a strong drive to promote education in field of engineering at both the degree and diploma level, although the number of ASC colleges has increased due to the growing demand of ASC stream at undergraduate level of study. However, the number of institutes offering programs in the area of teacher education has remained constant and no growth has been recorded. Polytechnic Institutes of the state have declined at rate of 0.66% between 2006 and 2010.
79%
5%
1%0%
4%
1%2% 2%
3%
3%
ASC
Engg./Tech./Arch./Design
Medicine
Agriculture & Allied
Mgmt/Hotel Mgmt/Travel Mgmt
Teacher Education
Law
Others
Post School Diploma
Post Graduate Diploma
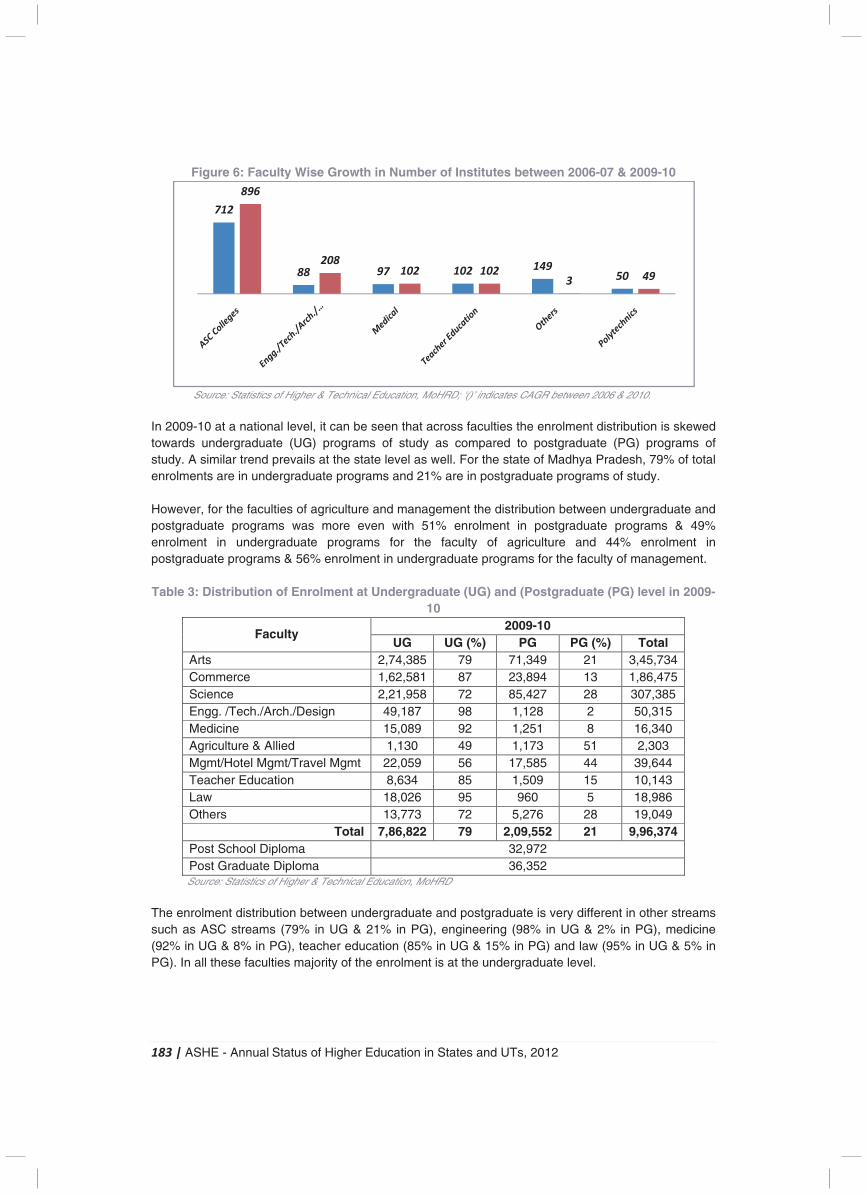
183 | ASHE - Annual Status of Higher Education in States and UTs, 2012
Figure 6: Faculty Wise Growth in Number of Institutes between 2006-07 & 2009-10
Source: Statistics of Higher & Technical Education, MoHRD; ‘()’ indicates CAGR between 2006 & 2010. In 2009-10 at a national level, it can be seen that across faculties the enrolment distribution is skewed towards undergraduate (UG) programs of study as compared to postgraduate (PG) programs of study. A similar trend prevails at the state level as well. For the state of Madhya Pradesh, 79% of total enrolments are in undergraduate programs and 21% are in postgraduate programs of study. However, for the faculties of agriculture and management the distribution between undergraduate and postgraduate programs was more even with 51% enrolment in postgraduate programs & 49% enrolment in undergraduate programs for the faculty of agriculture and 44% enrolment in postgraduate programs & 56% enrolment in undergraduate programs for the faculty of management. Table 3: Distribution of Enrolment at Undergraduate (UG) and (Postgraduate (PG) level in 2009-
10
Faculty 2009-10
UG UG (%) PG PG (%) Total Arts 2,74,385 79 71,349 21 3,45,734 Commerce 1,62,581 87 23,894 13 1,86,475 Science 2,21,958 72 85,427 28 307,385 Engg. /Tech./Arch./Design 49,187 98 1,128 2 50,315 Medicine 15,089 92 1,251 8 16,340 Agriculture & Allied 1,130 49 1,173 51 2,303 Mgmt/Hotel Mgmt/Travel Mgmt 22,059 56 17,585 44 39,644 Teacher Education 8,634 85 1,509 15 10,143 Law 18,026 95 960 5 18,986 Others 13,773 72 5,276 28 19,049
Total 7,86,822 79 2,09,552 21 9,96,374 Post School Diploma 32,972 Post Graduate Diploma 36,352 Source: Statistics of Higher & Technical Education, MoHRD
The enrolment distribution between undergraduate and postgraduate is very different in other streams such as ASC streams (79% in UG & 21% in PG), engineering (98% in UG & 2% in PG), medicine (92% in UG & 8% in PG), teacher education (85% in UG & 15% in PG) and law (95% in UG & 5% in PG). In all these faculties majority of the enrolment is at the undergraduate level.
(7.88%)
(32.83%) (1.67%) (0%) (-72.4%) (-.66%)
712
88 97 102149
50
896
208
102 1023
49
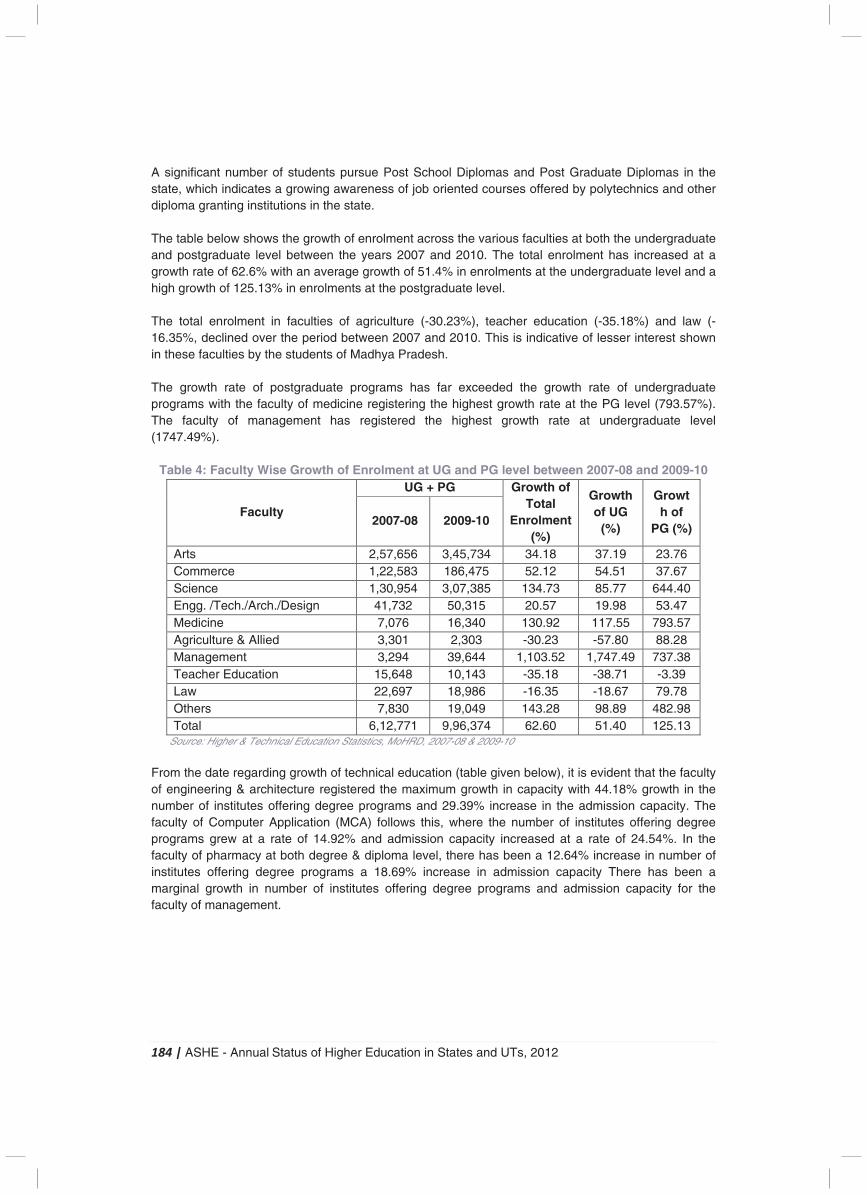
184 | ASHE - Annual Status of Higher Education in States and UTs, 2012
A significant number of students pursue Post School Diplomas and Post Graduate Diplomas in the state, which indicates a growing awareness of job oriented courses offered by polytechnics and other diploma granting institutions in the state. The table below shows the growth of enrolment across the various faculties at both the undergraduate and postgraduate level between the years 2007 and 2010. The total enrolment has increased at a growth rate of 62.6% with an average growth of 51.4% in enrolments at the undergraduate level and a high growth of 125.13% in enrolments at the postgraduate level. The total enrolment in faculties of agriculture (-30.23%), teacher education (-35.18%) and law (-16.35%, declined over the period between 2007 and 2010. This is indicative of lesser interest shown in these faculties by the students of Madhya Pradesh. The growth rate of postgraduate programs has far exceeded the growth rate of undergraduate programs with the faculty of medicine registering the highest growth rate at the PG level (793.57%). The faculty of management has registered the highest growth rate at undergraduate level (1747.49%).
Table 4: Faculty Wise Growth of Enrolment at UG and PG level between 2007-08 and 2009-10
Faculty
UG + PG Growth of Total
Enrolment (%)
Growth of UG
(%)
Growth of
PG (%) 2007-08 2009-10
Arts 2,57,656 3,45,734 34.18 37.19 23.76 Commerce 1,22,583 186,475 52.12 54.51 37.67 Science 1,30,954 3,07,385 134.73 85.77 644.40 Engg. /Tech./Arch./Design 41,732 50,315 20.57 19.98 53.47 Medicine 7,076 16,340 130.92 117.55 793.57 Agriculture & Allied 3,301 2,303 -30.23 -57.80 88.28 Management 3,294 39,644 1,103.52 1,747.49 737.38 Teacher Education 15,648 10,143 -35.18 -38.71 -3.39 Law 22,697 18,986 -16.35 -18.67 79.78 Others 7,830 19,049 143.28 98.89 482.98 Total 6,12,771 9,96,374 62.60 51.40 125.13
Source: Higher & Technical Education Statistics, MoHRD, 2007-08 & 2009-10 From the date regarding growth of technical education (table given below), it is evident that the faculty of engineering & architecture registered the maximum growth in capacity with 44.18% growth in the number of institutes offering degree programs and 29.39% increase in the admission capacity. The faculty of Computer Application (MCA) follows this, where the number of institutes offering degree programs grew at a rate of 14.92% and admission capacity increased at a rate of 24.54%. In the faculty of pharmacy at both degree & diploma level, there has been a 12.64% increase in number of institutes offering degree programs a 18.69% increase in admission capacity There has been a marginal growth in number of institutes offering degree programs and admission capacity for the faculty of management.
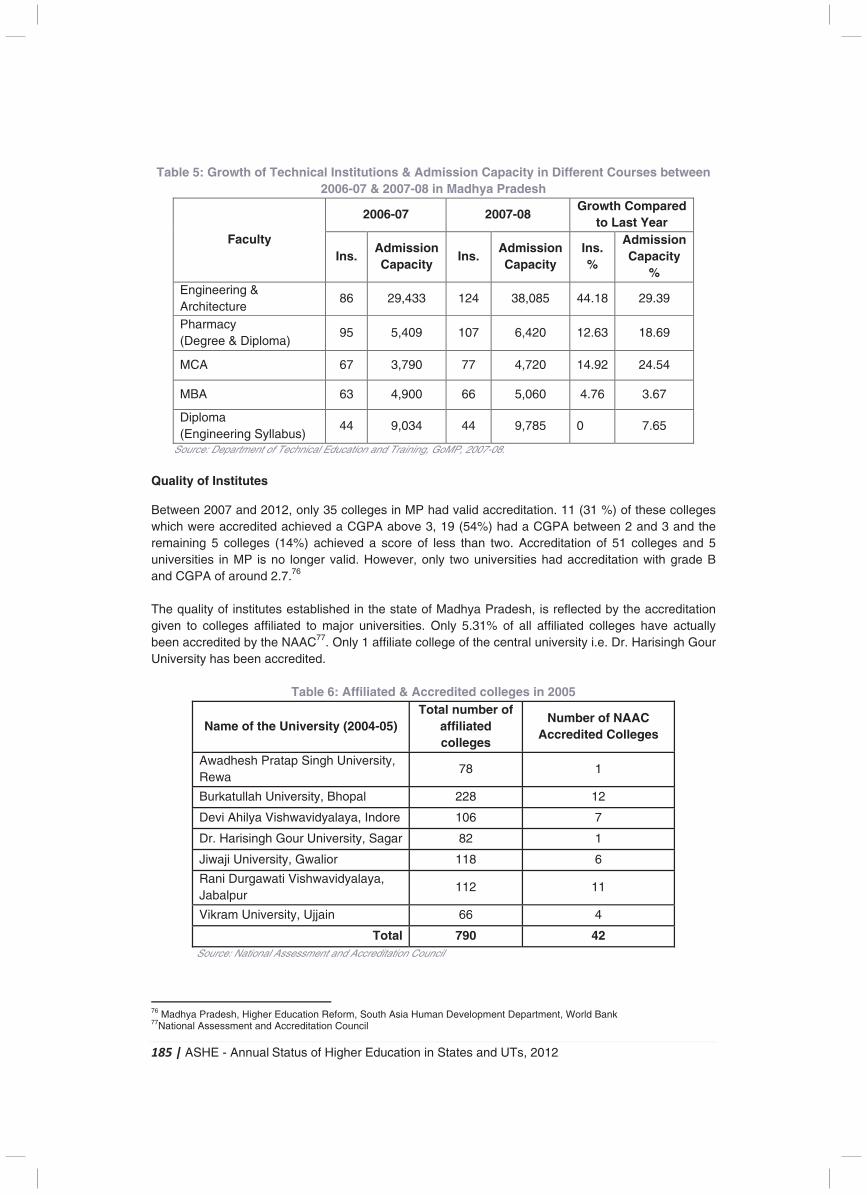
185 | ASHE - Annual Status of Higher Education in States and UTs, 2012
Table 5: Growth of Technical Institutions & Admission Capacity in Different Courses between 2006-07 & 2007-08 in Madhya Pradesh
Faculty
2006-07 2007-08 Growth Compared
to Last Year
Ins. Admission Capacity
Ins. Admission Capacity
Ins. %
Admission Capacity
% Engineering & Architecture
86 29,433 124 38,085 44.18 29.39
Pharmacy (Degree & Diploma)
95 5,409 107 6,420 12.63 18.69
MCA 67 3,790 77 4,720 14.92 24.54
MBA 63 4,900 66 5,060 4.76 3.67
Diploma (Engineering Syllabus)
44 9,034 44 9,785 0 7.65
Source: Department of Technical Education and Training, GoMP, 2007-08. Quality of Institutes
Between 2007 and 2012, only 35 colleges in MP had valid accreditation. 11 (31 %) of these colleges which were accredited achieved a CGPA above 3, 19 (54%) had a CGPA between 2 and 3 and the remaining 5 colleges (14%) achieved a score of less than two. Accreditation of 51 colleges and 5 universities in MP is no longer valid. However, only two universities had accreditation with grade B and CGPA of around 2.7.76 The quality of institutes established in the state of Madhya Pradesh, is reflected by the accreditation given to colleges affiliated to major universities. Only 5.31% of all affiliated colleges have actually been accredited by the NAAC77. Only 1 affiliate college of the central university i.e. Dr. Harisingh Gour University has been accredited.
Table 6: Affiliated & Accredited colleges in 2005
Name of the University (2004-05) Total number of
affiliated colleges
Number of NAAC Accredited Colleges
Awadhesh Pratap Singh University, Rewa
78 1
Burkatullah University, Bhopal 228 12
Devi Ahilya Vishwavidyalaya, Indore 106 7
Dr. Harisingh Gour University, Sagar 82 1
Jiwaji University, Gwalior 118 6
Rani Durgawati Vishwavidyalaya, Jabalpur
112 11
Vikram University, Ujjain 66 4
Total 790 42 Source: National Assessment and Accreditation Council
76 Madhya Pradesh, Higher Education Reform, South Asia Human Development Department, World Bank 77National Assessment and Accreditation Council
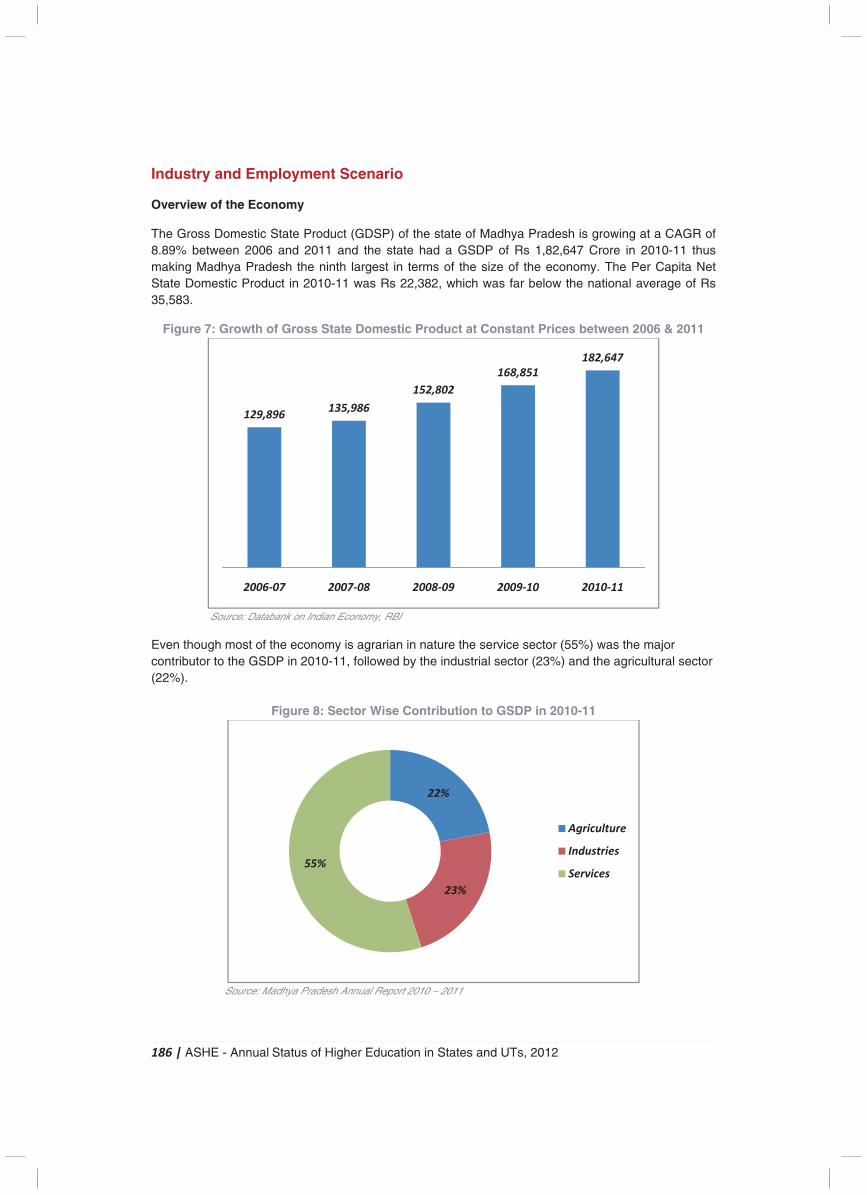
186 | ASHE - Annual Status of Higher Education in States and UTs, 2012
Industry and Employment Scenario
Overview of the Economy
The Gross Domestic State Product (GDSP) of the state of Madhya Pradesh is growing at a CAGR of 8.89% between 2006 and 2011 and the state had a GSDP of Rs 1,82,647 Crore in 2010-11 thus making Madhya Pradesh the ninth largest in terms of the size of the economy. The Per Capita Net State Domestic Product in 2010-11 was Rs 22,382, which was far below the national average of Rs 35,583.
Figure 7: Growth of Gross State Domestic Product at Constant Prices between 2006 & 2011
Source: Databank on Indian Economy, RBI Even though most of the economy is agrarian in nature the service sector (55%) was the major contributor to the GSDP in 2010-11, followed by the industrial sector (23%) and the agricultural sector (22%).
Figure 8: Sector Wise Contribution to GSDP in 2010-11
Source: Madhya Pradesh Annual Report 2010 – 2011
129,896135,986
152,802
168,851
182,647
2006-07 2007-08 2008-09 2009-10 2010-11
22%
23%
55%
Agriculture
Industries
Services
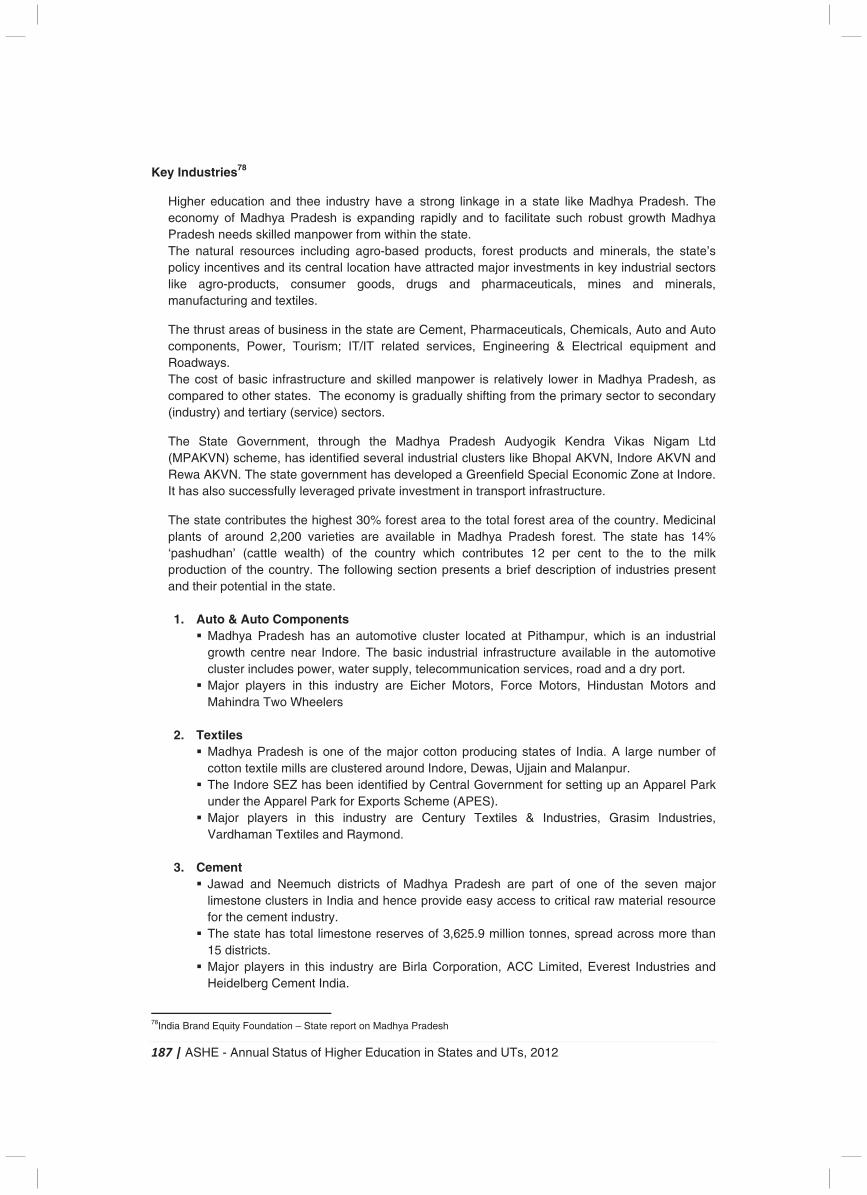
187 | ASHE - Annual Status of Higher Education in States and UTs, 2012
Key Industries78
Higher education and thee industry have a strong linkage in a state like Madhya Pradesh. The economy of Madhya Pradesh is expanding rapidly and to facilitate such robust growth Madhya Pradesh needs skilled manpower from within the state. The natural resources including agro-based products, forest products and minerals, the state’s policy incentives and its central location have attracted major investments in key industrial sectors like agro-products, consumer goods, drugs and pharmaceuticals, mines and minerals, manufacturing and textiles.
The thrust areas of business in the state are Cement, Pharmaceuticals, Chemicals, Auto and Auto components, Power, Tourism; IT/IT related services, Engineering & Electrical equipment and Roadways. The cost of basic infrastructure and skilled manpower is relatively lower in Madhya Pradesh, as compared to other states. The economy is gradually shifting from the primary sector to secondary (industry) and tertiary (service) sectors.
The State Government, through the Madhya Pradesh Audyogik Kendra Vikas Nigam Ltd (MPAKVN) scheme, has identified several industrial clusters like Bhopal AKVN, Indore AKVN and Rewa AKVN. The state government has developed a Greenfield Special Economic Zone at Indore. It has also successfully leveraged private investment in transport infrastructure.
The state contributes the highest 30% forest area to the total forest area of the country. Medicinal plants of around 2,200 varieties are available in Madhya Pradesh forest. The state has 14% ‘pashudhan’ (cattle wealth) of the country which contributes 12 per cent to the to the milk production of the country. The following section presents a brief description of industries present and their potential in the state. 1. Auto & Auto Components
� Madhya Pradesh has an automotive cluster located at Pithampur, which is an industrial growth centre near Indore. The basic industrial infrastructure available in the automotive cluster includes power, water supply, telecommunication services, road and a dry port.
� Major players in this industry are Eicher Motors, Force Motors, Hindustan Motors and Mahindra Two Wheelers
2. Textiles � Madhya Pradesh is one of the major cotton producing states of India. A large number of
cotton textile mills are clustered around Indore, Dewas, Ujjain and Malanpur. � The Indore SEZ has been identified by Central Government for setting up an Apparel Park
under the Apparel Park for Exports Scheme (APES). � Major players in this industry are Century Textiles & Industries, Grasim Industries,
Vardhaman Textiles and Raymond.
3. Cement � Jawad and Neemuch districts of Madhya Pradesh are part of one of the seven major
limestone clusters in India and hence provide easy access to critical raw material resource for the cement industry.
� The state has total limestone reserves of 3,625.9 million tonnes, spread across more than 15 districts.
� Major players in this industry are Birla Corporation, ACC Limited, Everest Industries and Heidelberg Cement India.
78India Brand Equity Foundation – State report on Madhya Pradesh
188 | ASHE - Annual Status of Higher Education in States and UTs, 2012
4. Pharmaceutical & Biotechnology Industry � Madhya Pradesh has a rich bio-diversity. 11 of the 25 agro-climatic zones are present in the
state and a large variety of rare and valuable medicinal and herbal plants are available. � The state has formulated a Biotechnology Policy, which is expected to create a conducive
environment for the bio-pharmaceutical industry in the state. � Major players in this industry are Ipca Labs, Lupin, Piramal Healthcare, and Ranbaxy.
5. Manufacturing
� Madhya Pradesh State Industrial Development Corporation and its subsidiaries have successfully developed several growth centers across the state. The Industrial Policy of the state provides multiple incentives for setting up manufacturing units.
� Industrial infrastructure, policy incentives, labour resources and central location of the state are some of the growth drivers for the manufacturing industry in the state.
� Major players in this industry are BHEL, Kirloskar Brothers, Kores (India) and Crompton Greaves.
6. Fast Moving Consumer Goods (FMCGs) � A number of factors such as industrial infrastructure in growth centers, labour pool and
central location of the state are the drivers for setting up consumer goods manufacturing facilities in Madhya Pradesh.
� A number of multinational companies such as Cadbury, Procter & Gamble, Hindustan Unilever Limited, Coca Cola and Cargill have their manufacturing plants in the state.
7. Agro Based Industries � Madhya Pradesh is one of the leading producers of soybean. The state is the largest
producer of, oilseeds and leads in the production of spices and is amongst the largest producers of garlic.
� Major players in this industry are Adani Wilmar, Anik Industries, KS Oils and Ruchi Soya Industries.
8. Mineral Based Industries � The state has vast mineral deposits of diamonds, slate, pyrophyllite, diaspore, coal,
limestone, copper ore and manganese among others. � Madhya Pradesh is the sole producer of diamonds in India. Besides, the state is the largest
producer of minerals such as pyrophyllite and copper.
9. IT and ITeS � Five information technology parks, located at Bhopal, Indore (2), Gwalior and Jabalpur, are
at various stages of development. � All the IT parks in the state have been given SEZ status. The IT Policy of the state provides
incentives to the investors in the information technology sector.
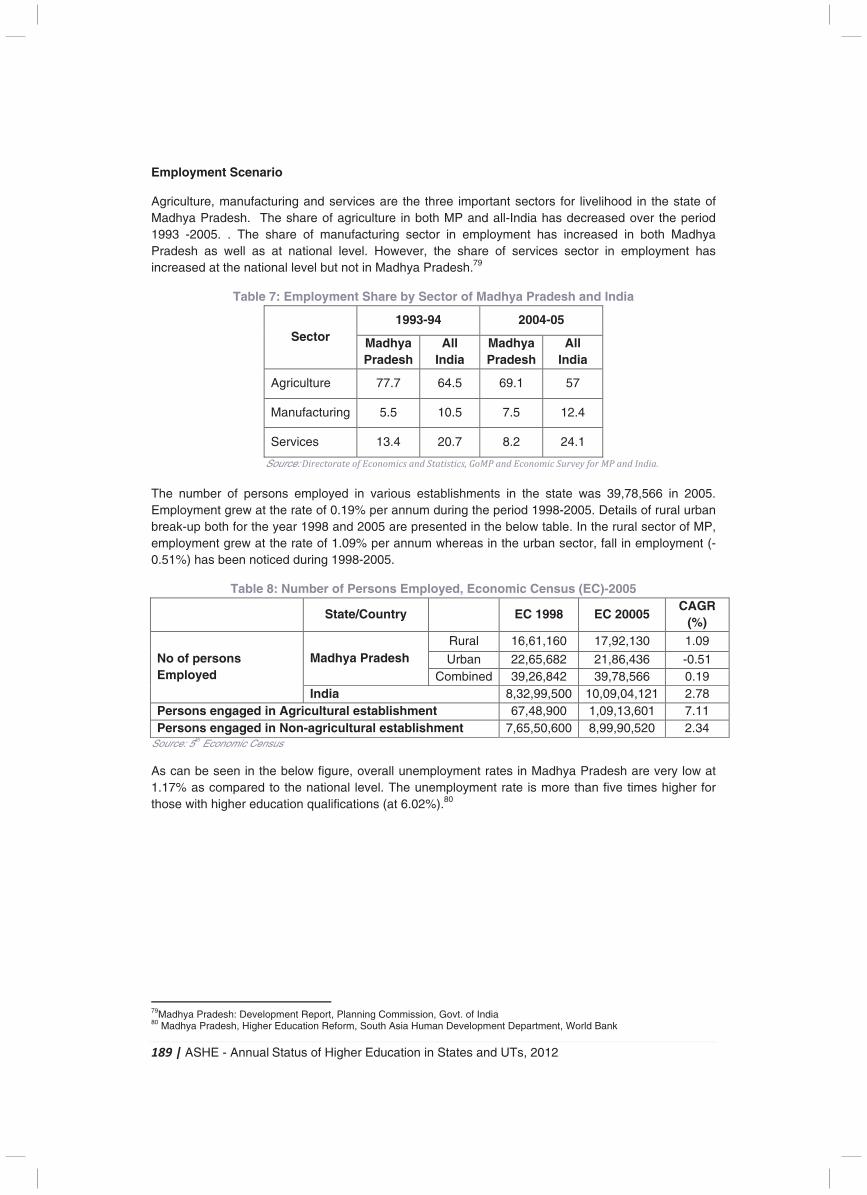
189 | ASHE - Annual Status of Higher Education in States and UTs, 2012
Employment Scenario
Agriculture, manufacturing and services are the three important sectors for livelihood in the state of Madhya Pradesh. The share of agriculture in both MP and all-India has decreased over the period 1993 -2005. . The share of manufacturing sector in employment has increased in both Madhya Pradesh as well as at national level. However, the share of services sector in employment has increased at the national level but not in Madhya Pradesh.79
Table 7: Employment Share by Sector of Madhya Pradesh and India
Sector 1993-94 2004-05
Madhya Pradesh
All India
Madhya Pradesh
All India
Agriculture 77.7 64.5 69.1 57
Manufacturing 5.5 10.5 7.5 12.4
Services 13.4 20.7 8.2 24.1
Source: Directorate of Economics and Statistics, GoMP and Economic Survey for MP and India.
The number of persons employed in various establishments in the state was 39,78,566 in 2005. Employment grew at the rate of 0.19% per annum during the period 1998-2005. Details of rural urban break-up both for the year 1998 and 2005 are presented in the below table. In the rural sector of MP, employment grew at the rate of 1.09% per annum whereas in the urban sector, fall in employment (-0.51%) has been noticed during 1998-2005.
Table 8: Number of Persons Employed, Economic Census (EC)-2005
State/Country
EC 1998 EC 20005
CAGR (%)
No of persons Employed
Madhya Pradesh Rural 16,61,160 17,92,130 1.09
Urban 22,65,682 21,86,436 -0.51 Combined 39,26,842 39,78,566 0.19
India 8,32,99,500 10,09,04,121 2.78 Persons engaged in Agricultural establishment 67,48,900 1,09,13,601 7.11 Persons engaged in Non-agricultural establishment 7,65,50,600 8,99,90,520 2.34
Source: 5th Economic Census
As can be seen in the below figure, overall unemployment rates in Madhya Pradesh are very low at 1.17% as compared to the national level. The unemployment rate is more than five times higher for those with higher education qualifications (at 6.02%).80
79Madhya Pradesh: Development Report, Planning Commission, Govt. of India 80 Madhya Pradesh, Higher Education Reform, South Asia Human Development Department, World Bank
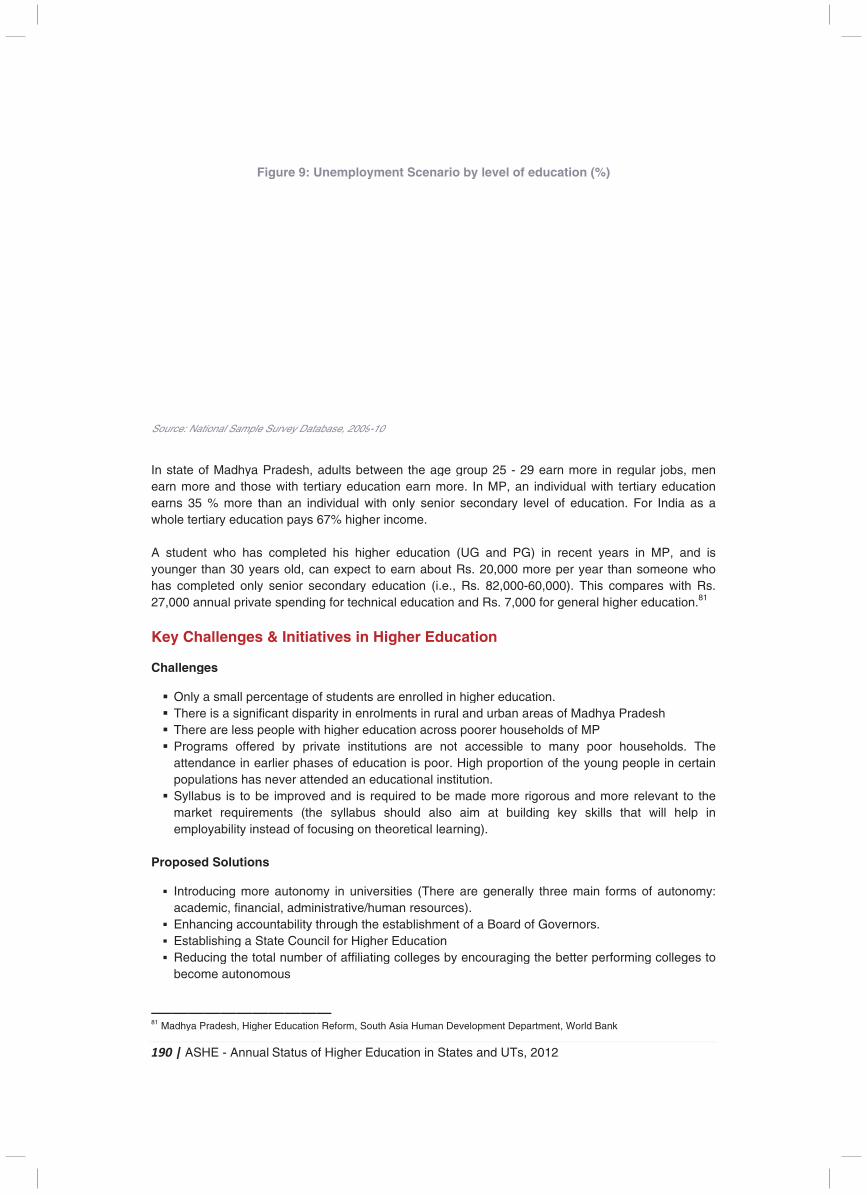
1
S
Ineew Ayh2
K
C
P
81
190
Sourc
n searnearnwho
A styounhas 27,0
Key
Cha
� � � �
�
Pro
�
�
�
�
1 Ma
| A
rce:
taten mns 3ole t
tudngeco
000
y C
alle
OnThThProattepopSymaem
pos
IntracaEnEstRebec
adhy
ASH
Nati
e omore35 tert
enter tomp0 an
Cha
nge
nly aereereogrendpulllab
arkemplo
sed
rodadehantab
educcom
ya P
HE
tiona
of Me a%
tiary
t whan
pletnnu
alle
es
a sme is e aramdanatiobuset oya
d S
duciemincin
blishcingme
Prad
- A
al Sa
Madand
moy ed
who n 3ed al p
en
maa s
re lems once ons is reqbilit
olu
ing c, fng hingg thaut
esh
Ann
Samp
dhyatho
ore duc
ha30 y
onpriv
ge
ll psignessoffein
s hato
quirety i
utio
mofinaaccg a he tton
, Hig
ual
Fig
ple S
a Poseth
cati
as yeanly vate
es &
ercnifics peeredea
as nbeemnst
ons
oreancicouStatotaom
ghe
Sta
gur
Surv
Prade wan ion
comrs osen
e sp
& I
centcaneopd brlienev iment
tead
s
e auial,
untaate al n
mou
r Ed
atu
re 9
vey D
deswith
anpa
mploldniorpen
Init
tagt dile wby r p
ver amprots d o
utonad
abiliCo
nums
duca
s o
9: U
Data
sh, ter
n inys
lete, car sendin
tia
ge oispawithprihasatteove(thef fo
nomminity tounmbe
ation
of H
Une
tabas
adurtiardiv67%
ed an econg f
ativ
of sarith hivatsesended ae s
ocus
my nistthro
ncil er o
n Re
High
em
ase, 2
ultsry e
vidu% h
hisexp
ondfor t
ves
tudy inighete s of ded andsyllsing
in tratougfor
of af
eform
her
plo
2009
s beedu
ual high
hipecarytec
s in
dentn ener einstedan
d isabug o
unive/
gh tHigffilia
m, S
Ed
oym
09-10
etwucawither
ghect toy edhni
n H
ts anroedutitu
ducan eds reus n th
ive/huthe gheatin
Sout
uca
men
0
weetionh oinc
er o educcal
Hig
are lme
ucationatioducequi
shheo
rsituma
ester Eng c
th As
atio
nt S
n thn eonlycom
eduearncati ed
ghe
enentstionns on iatioiredoul
oret
iesan rtab
Educoll
sia H
on in
Sce
he arn
y seme.
ucan abon
duca
er E
rolls inn acareis ponad told tica
(Tresoblishucatege
Hum
n S
ena
ag
n menio
ationbou(i.e
atio
Ed
ed n rucroe npooal ino beals
al le
Theourhmetiones
man
Stat
rio
e gmore
or
n (ut Re., on a
uc
in ral ss
not or. Hnstite m
so earn
re rcesent n
by
Dev
es
by
groue. Isec
(UGRs. Rsand
cati
higanpooac
Higtutio
madaimning
ares).of
enc
velo
and
y le
up n Mcon
G a20
s. 8d Rs
ion
herd uoreccesh pon.de mm ag).
e ge
a B
cou
opme
d U
vel
25 MP,nda
and 0,0082,0s. 7
n
r edurbar hossib
prop moat b
ene
Boa
urag
ent
UTs
l of
- 2, anry
PG00 m0007,00
ducan aousble port
ore buil
eral
ard
ging
Dep
, 20
f ed
29 en inleve
G) mo-6000 f
catioareseh
totion
rigoldin
lly t
of G
g th
partm
012
duc
earndivel o
in re
0,00for
on. as
holdo mn of
orong
thre
Gov
he
men
2
cati
rn mviduof e
recper00).ge
of Mds omanf th
ous key
ee
ver
bet
nt, W
on
morual edu
cenr ye. Tner
Maof Mny phe y
any s
ma
rnor
tter
World
(%
re iwit
uca
t year his ral h
adhyMP pooyou
d mskil
ain
rs.
pe
d Ba
%)
in rth t
ation
yearthaco
hig
ya
or ng
morls
for
erfo
ank
regutertn. F
rs an ompher
Pra
houpe
re rtha
rms
ormi
ulatiaryFor
in som
parer ed
ade
useeopl
releat w
s of
ing
r joy er In
MPmees duc
esh
ehole i
evawill
f au
co
obseducdia
P, aonewit
catio
ldsn c
nt the
uton
olleg
, mcat
a as
ande wth Ron.8
. Tcert
to telp
nom
ges
menions a
d iswhoRs.81
Theain
thein
my:
s to
a
191 | ASHE - Annual Status of Higher Education in States and UTs, 2012
Objectives for the 12th Five Year Plan in Higher Education82
� To increase the GER in higher education to 15% by 2011-12, to 21% by XII Plan and to 30% by 2020
� To expand institutional base of higher education by creating additional capacity in existing institutions, establishing new institutions, and incentivizing state governments and NGOs/civil society.
� To provide opportunities of higher education to socially deprived communities and remove disparities by promoting the inclusion of women, minorities and differently-abled population.
� To remove regional imbalances in access to higher education by setting up of institutions in under-served areas.
� To enhance plan support for infrastructure and faculty development in institutions of higher learning and attract talent in teaching and research.
� To improve research facilities. � To promote collaboration with Indian Universities. � To promote autonomy, innovations and academic reforms in higher education institutions. � To promote Indian languages. � To undertake institutional restructuring.
Initiatives Proposed
� Swami Vivekananda Carrier Scheme to be implemented across the state. � Three colleges to be developed as Colleges of Excellence. � Number of institutions to be increased and number of courses covered by current institutions to
be increased as well. � Rural college empowerment mission to be undertaken (Colleges of MP to focus more on tribal
and backward regions “satellite campuses” of Universities to be opened to reach remote areas, (all modes of teaching in addition to the classroom teaching option will be used to increase rural access).
� To Incentivize teachers to teach in rural areas (basic facilities in rural areas like hostels to be provided,
� Different kinds of curriculum to be adopted for rural areas, urban areas and tribal areas � More courses related to and promoting traditional livelihoods to be offered (appropriate subjects
that help in improvement of productivity at the existing livelihood of traditional workers to be encouraged, instead of prompting urban immigration).
� In rural/tribal areas, students to be given flexibility to choose their courses under a credit-based system
� Women’s University in Madhya Pradesh to be established. � Residential facilities for women students and for students in tribal areas to be build (safe and
affordable accommodation is a major deterrent in their opting for higher education). � Public-private partnership in vocational education to be increased � Massive infrastructural up-gradation in terms of Internet connectivity, hostels and equipment. � Improvement in faculty quality through teacher training and by reducing the number of vacant
faculty positions.
82Madhya Pradesh Department of Higher Education , 2012
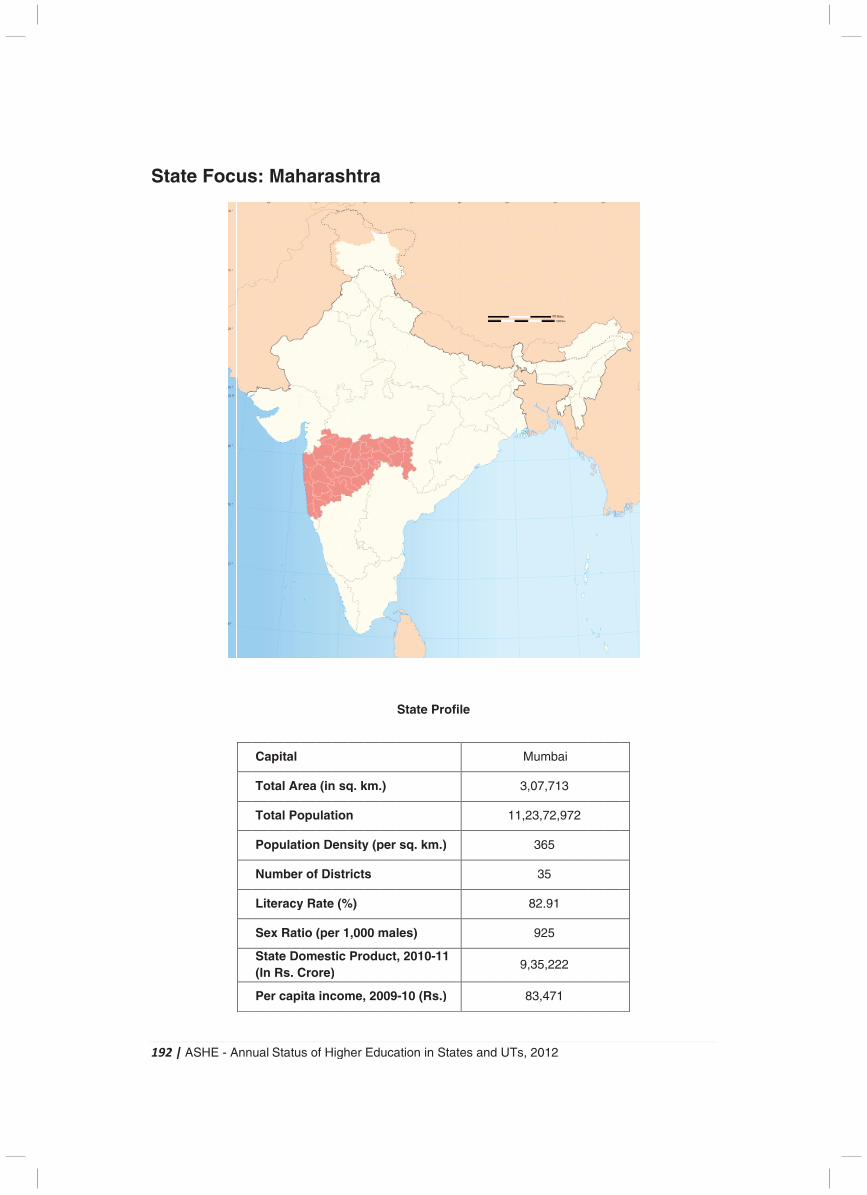
1
S
192
Sta
| A
ate
ASH
e F
HE
Fo
- A
oc
Ann
us
ual
s:
Ca
To
To
Po
Nu
Lit
Se
Sta(In
Pe
Sta
M
apit
otal
otal
opu
umb
tera
ex R
aten Rs
er c
atu
ah
tal
Ar
Po
ulat
ber
acy
Rat
e Dos. C
cap
s o
ha
rea
opu
tion
r of
y Ra
tio (
omCro
ita
of H
ra
(in
ulat
n D
f Di
ate
(pe
mestore)
inc
High
ash
n sq
tion
ens
istr
e (%
er 1
tic )
com
her
htr
q. k
n
sity
rict
%)
,00
Pro
me,
Ed
ra
km.
y (p
s
00 m
odu
, 20
uca
.)
per
ma
uct
009
atio
Sta
sq
les
, 20
9-10
on in
ate
q. k
s)
010
0 (R
n S
Pr
m.)
0-11
Rs.)
Stat
ofi
)
1
)
es
le
and
d U
UTs
3
11,
9
, 20
Mu
3,07
,23
3
3
82
9
9,35
83
012
mb
7,7
,72
365
35
2.91
925
5,22
,47
2
bai
13
2,97
1
22
71
72
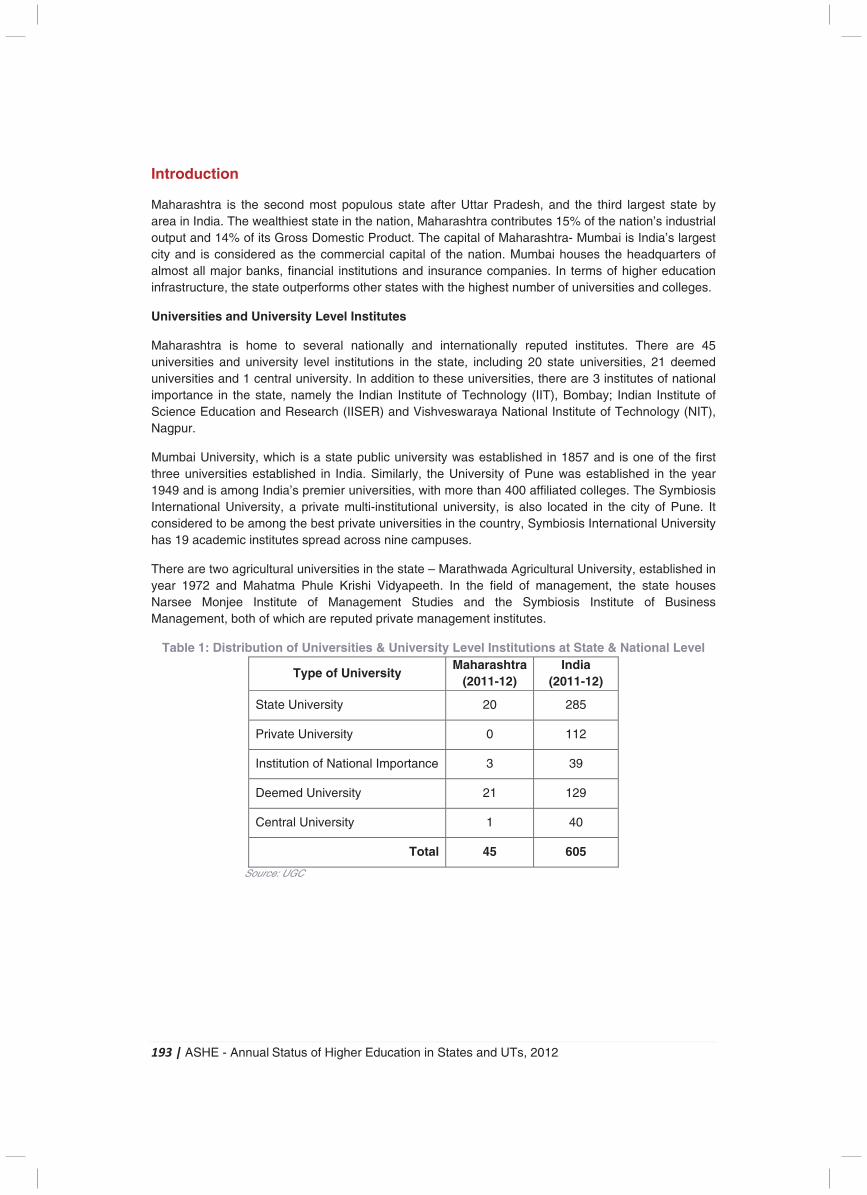
193 | ASHE - Annual Status of Higher Education in States and UTs, 2012
Introduction
Maharashtra is the second most populous state after Uttar Pradesh, and the third largest state by area in India. The wealthiest state in the nation, Maharashtra contributes 15% of the nation’s industrial output and 14% of its Gross Domestic Product. The capital of Maharashtra- Mumbai is India’s largest city and is considered as the commercial capital of the nation. Mumbai houses the headquarters of almost all major banks, financial institutions and insurance companies. In terms of higher education infrastructure, the state outperforms other states with the highest number of universities and colleges.
Universities and University Level Institutes
Maharashtra is home to several nationally and internationally reputed institutes. There are 45 universities and university level institutions in the state, including 20 state universities, 21 deemed universities and 1 central university. In addition to these universities, there are 3 institutes of national importance in the state, namely the Indian Institute of Technology (IIT), Bombay; Indian Institute of Science Education and Research (IISER) and Vishveswaraya National Institute of Technology (NIT), Nagpur.
Mumbai University, which is a state public university was established in 1857 and is one of the first three universities established in India. Similarly, the University of Pune was established in the year 1949 and is among India’s premier universities, with more than 400 affiliated colleges. The Symbiosis International University, a private multi-institutional university, is also located in the city of Pune. It considered to be among the best private universities in the country, Symbiosis International University has 19 academic institutes spread across nine campuses.
There are two agricultural universities in the state – Marathwada Agricultural University, established in year 1972 and Mahatma Phule Krishi Vidyapeeth. In the field of management, the state houses Narsee Monjee Institute of Management Studies and the Symbiosis Institute of Business Management, both of which are reputed private management institutes.
Table 1: Distribution of Universities & University Level Institutions at State & National Level
Type of University Maharashtra
(2011-12) India
(2011-12)
State University 20 285
Private University 0 112
Institution of National Importance 3 39
Deemed University 21 129
Central University 1 40
Total 45 605
Source: UGC
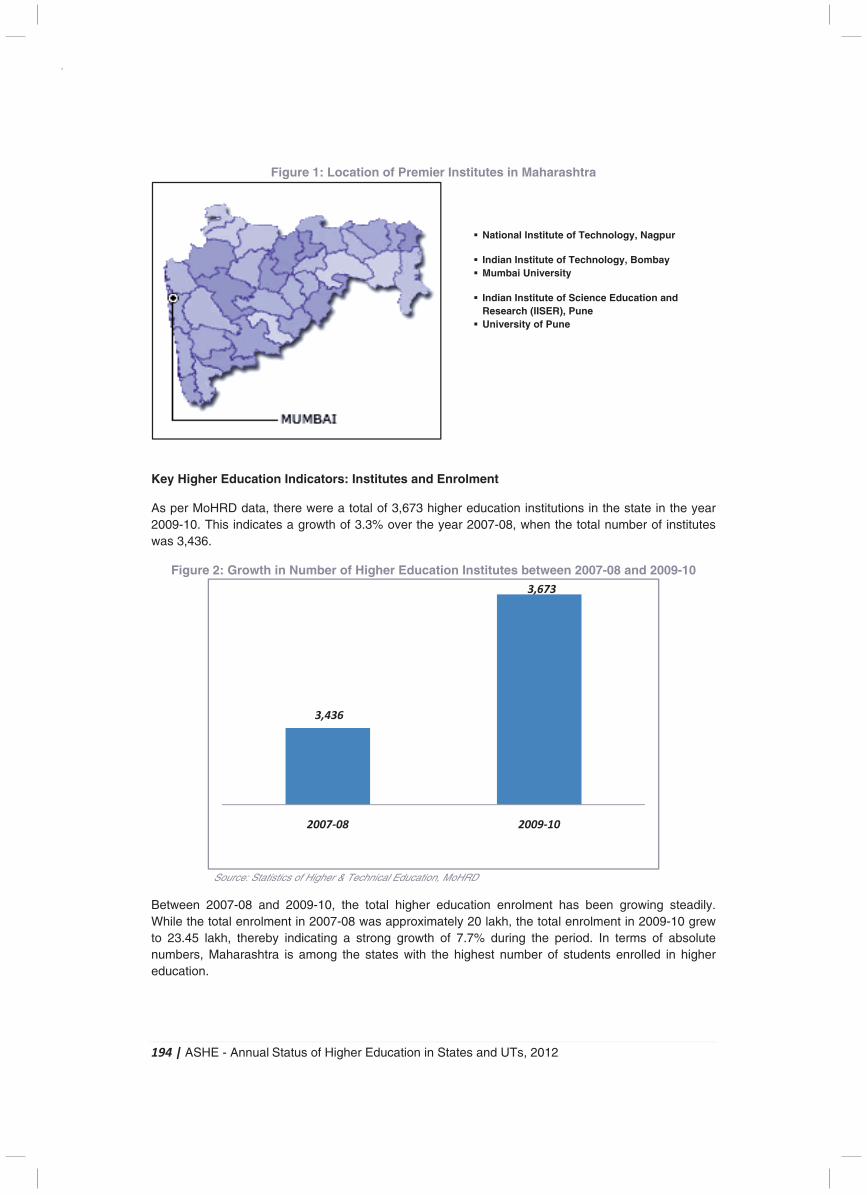
194 | ASHE - Annual Status of Higher Education in States and UTs, 2012
Figure 1: Location of Premier Institutes in Maharashtra
Key Higher Education Indicators: Institutes and Enrolment
As per MoHRD data, there were a total of 3,673 higher education institutions in the state in the year 2009-10. This indicates a growth of 3.3% over the year 2007-08, when the total number of institutes was 3,436.
Figure 2: Growth in Number of Higher Education Institutes between 2007-08 and 2009-10
Source: Statistics of Higher & Technical Education, MoHRD
Between 2007-08 and 2009-10, the total higher education enrolment has been growing steadily. While the total enrolment in 2007-08 was approximately 20 lakh, the total enrolment in 2009-10 grew to 23.45 lakh, thereby indicating a strong growth of 7.7% during the period. In terms of absolute numbers, Maharashtra is among the states with the highest number of students enrolled in higher education.
� National Institute of Technology, Nagpur
� Indian Institute of Technology, Bombay � Mumbai University
� Indian Institute of Science Education and
Research (IISER), Pune � University of Pune
(3.3%)
3,436
3,673
2007-08 2009-10
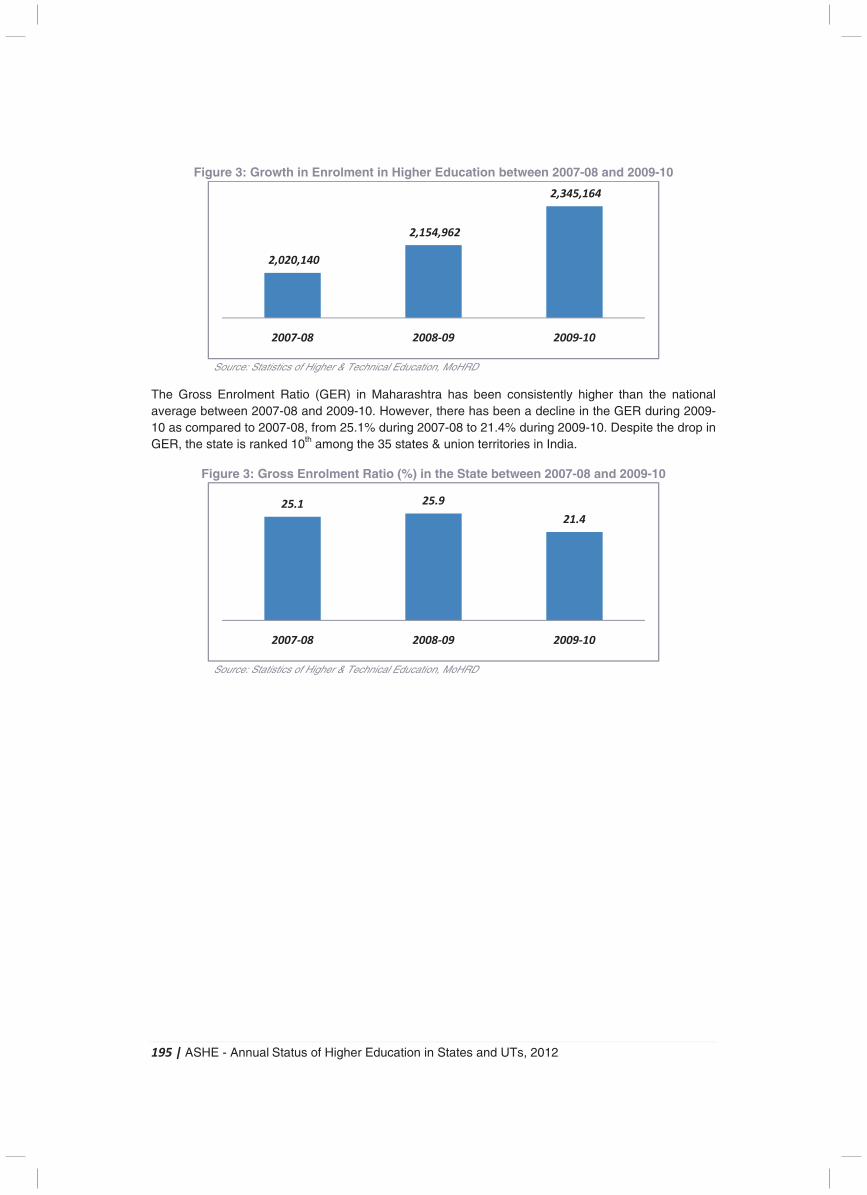
195 | ASHE - Annual Status of Higher Education in States and UTs, 2012
Figure 3: Growth in Enrolment in Higher Education between 2007-08 and 2009-10
Source: Statistics of Higher & Technical Education, MoHRD
The Gross Enrolment Ratio (GER) in Maharashtra has been consistently higher than the national average between 2007-08 and 2009-10. However, there has been a decline in the GER during 2009-10 as compared to 2007-08, from 25.1% during 2007-08 to 21.4% during 2009-10. Despite the drop in GER, the state is ranked 10th among the 35 states & union territories in India.
Figure 3: Gross Enrolment Ratio (%) in the State between 2007-08 and 2009-10
Source: Statistics of Higher & Technical Education, MoHRD
2,020,140
2,154,962
2,345,164
2007-08 2008-09 2009-10
25.1 25.9
21.4
2007-08 2008-09 2009-10

196 | ASHE - Annual Status of Higher Education in States and UTs, 2012
Figure 4: Gross Enrolment Ratio (%) across all States in India (2009-10)
Source: Statistics of Higher & Technical Education, MoHRD
The following sections present a brief description of the current higher education scenario in Maharashtra. The report presents a brief outline of the industry and employment scenario in state. The report concludes with describing the key initiatives and challenges in higher education that are being faced by the state.
2.34.45.3
99.49.6
10.810.91111.311.411.9
13.114.814.91515.415.916.116.9
18.118.21919.120
21.423.924.8
26.226.5
2828.329.1
3647.9
Daman & DiuD&N Haveli
LakshadweepAssam
JharkhandRajasthan
PunjabUttar Pradesh
BiharOrissa
TripuraWest Bengal
KeralaManipur
Madhya PradeshArunachal Pradesh
MeghalayaGujarat
NagalandAndhra Pradesh
KarnatakaJammu & Kashmir
Tamil NaduHaryana
ChhatisgarhMaharashtra
Himachal PradeshSikkim
A&N IslandsMizoram
ChandigarhGoa
PondicherryUttaranchal
Delhi
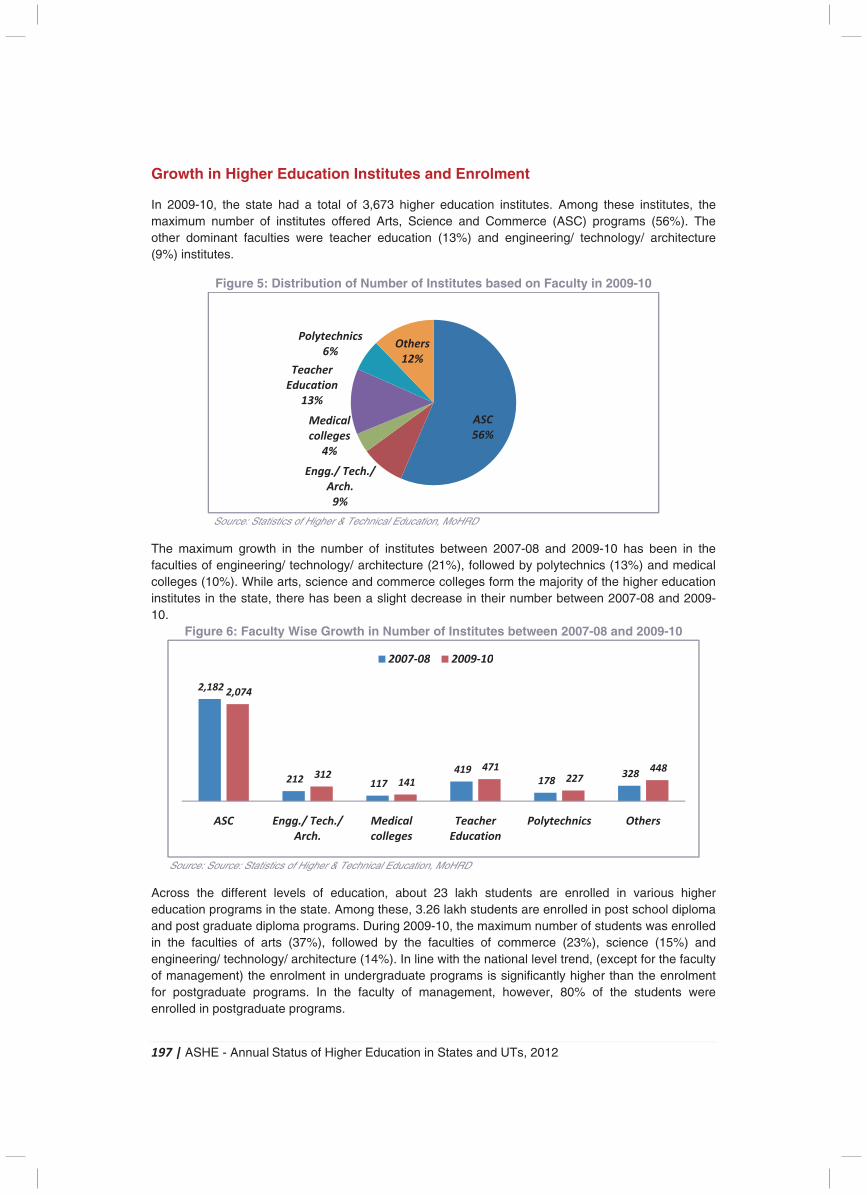
197 | ASHE - Annual Status of Higher Education in States and UTs, 2012
Growth in Higher Education Institutes and Enrolment
In 2009-10, the state had a total of 3,673 higher education institutes. Among these institutes, the maximum number of institutes offered Arts, Science and Commerce (ASC) programs (56%). The other dominant faculties were teacher education (13%) and engineering/ technology/ architecture (9%) institutes.
Figure 5: Distribution of Number of Institutes based on Faculty in 2009-10
Source: Statistics of Higher & Technical Education, MoHRD
The maximum growth in the number of institutes between 2007-08 and 2009-10 has been in the faculties of engineering/ technology/ architecture (21%), followed by polytechnics (13%) and medical colleges (10%). While arts, science and commerce colleges form the majority of the higher education institutes in the state, there has been a slight decrease in their number between 2007-08 and 2009-10.
Figure 6: Faculty Wise Growth in Number of Institutes between 2007-08 and 2009-10
Source: Source: Statistics of Higher & Technical Education, MoHRD
Across the different levels of education, about 23 lakh students are enrolled in various higher education programs in the state. Among these, 3.26 lakh students are enrolled in post school diploma and post graduate diploma programs. During 2009-10, the maximum number of students was enrolled in the faculties of arts (37%), followed by the faculties of commerce (23%), science (15%) and engineering/ technology/ architecture (14%). In line with the national level trend, (except for the faculty of management) the enrolment in undergraduate programs is significantly higher than the enrolment for postgraduate programs. In the faculty of management, however, 80% of the students were enrolled in postgraduate programs.
(6%) (10%)
(-3%)
(21%) (13%)
ASC
56%
Engg./ Tech./
Arch.
9%
Medical
colleges
4%
Teacher
Education
13%
Polytechnics
6%Others
12%
2,182
212 117
419
178 328
2,074
312 141
471
227 448
ASC Engg./ Tech./
Arch.
Medical
colleges
Teacher
Education
Polytechnics Others
2007-08 2009-10
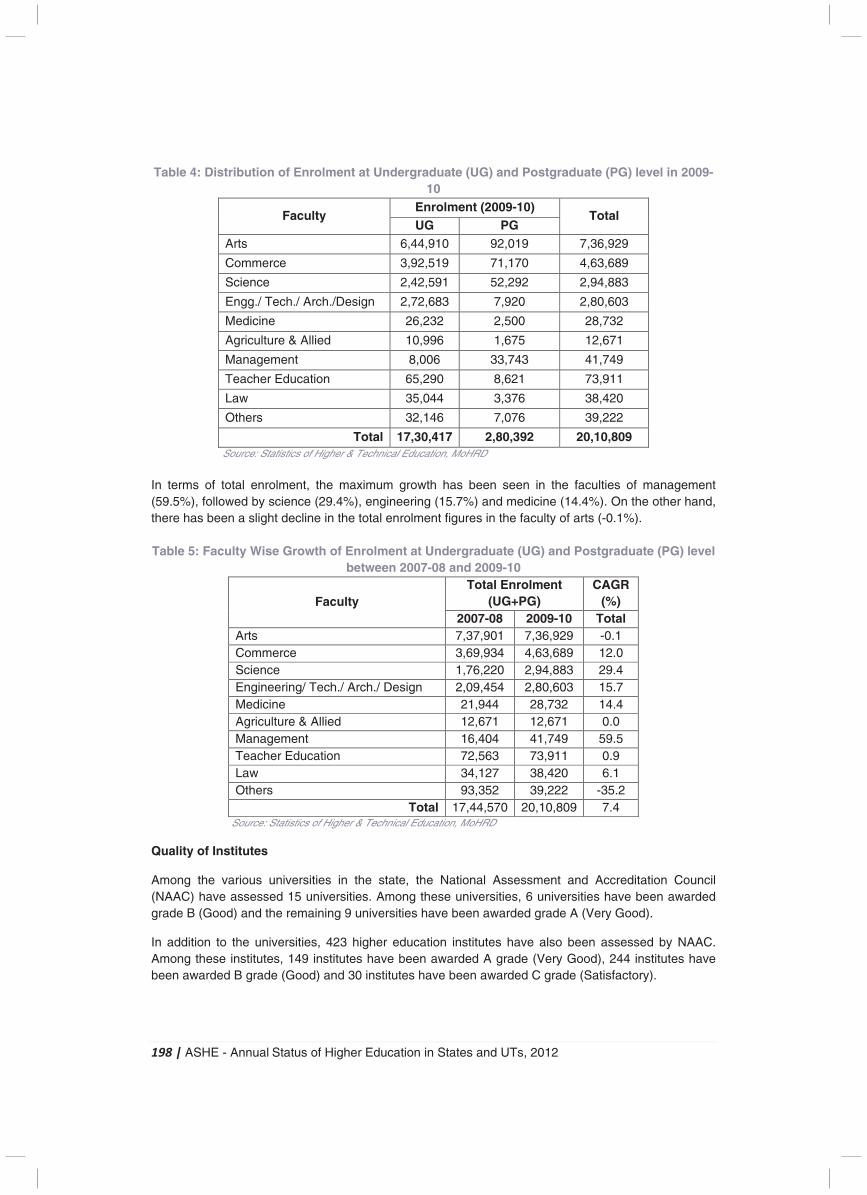
198 | ASHE - Annual Status of Higher Education in States and UTs, 2012
Table 4: Distribution of Enrolment at Undergraduate (UG) and Postgraduate (PG) level in 2009-10
Faculty Enrolment (2009-10)
Total UG PG
Arts 6,44,910 92,019 7,36,929
Commerce 3,92,519 71,170 4,63,689
Science 2,42,591 52,292 2,94,883
Engg./ Tech./ Arch./Design 2,72,683 7,920 2,80,603
Medicine 26,232 2,500 28,732
Agriculture & Allied 10,996 1,675 12,671
Management 8,006 33,743 41,749
Teacher Education 65,290 8,621 73,911
Law 35,044 3,376 38,420
Others 32,146 7,076 39,222
Total 17,30,417 2,80,392 20,10,809 Source: Statistics of Higher & Technical Education, MoHRD
In terms of total enrolment, the maximum growth has been seen in the faculties of management (59.5%), followed by science (29.4%), engineering (15.7%) and medicine (14.4%). On the other hand, there has been a slight decline in the total enrolment figures in the faculty of arts (-0.1%). Table 5: Faculty Wise Growth of Enrolment at Undergraduate (UG) and Postgraduate (PG) level
between 2007-08 and 2009-10
Faculty Total Enrolment
(UG+PG) CAGR
(%) 2007-08 2009-10 Total
Arts 7,37,901 7,36,929 -0.1 Commerce 3,69,934 4,63,689 12.0 Science 1,76,220 2,94,883 29.4 Engineering/ Tech./ Arch./ Design 2,09,454 2,80,603 15.7 Medicine 21,944 28,732 14.4 Agriculture & Allied 12,671 12,671 0.0 Management 16,404 41,749 59.5 Teacher Education 72,563 73,911 0.9 Law 34,127 38,420 6.1 Others 93,352 39,222 -35.2
Total 17,44,570 20,10,809 7.4 Source: Statistics of Higher & Technical Education, MoHRD
Quality of Institutes
Among the various universities in the state, the National Assessment and Accreditation Council (NAAC) have assessed 15 universities. Among these universities, 6 universities have been awarded grade B (Good) and the remaining 9 universities have been awarded grade A (Very Good).
In addition to the universities, 423 higher education institutes have also been assessed by NAAC. Among these institutes, 149 institutes have been awarded A grade (Very Good), 244 institutes have been awarded B grade (Good) and 30 institutes have been awarded C grade (Satisfactory).
199 | ASHE - Annual Status of Higher Education in States and UTs, 2012
Industry and Employment Scenario
Key Industries83
The government of Maharashtra is promoting the development of several Special Economic Zones (SEZs) across Maharashtra for sectors such as IT/ITeS, pharmaceuticals, biotechnology, textile, automotive & auto-components and food processing. The state has attracted highest number of industrial investment proposals among Indian states. The state’s share in the proposed investment and employment in the country is 9.4% and 19.6% respectively. Some of the key industries in the state are as follows:
1. Pharmaceuticals and biotechnology � Maharashtra accounts for approximately 18% of the country’s output of pharmaceuticals by
value. � Maharashtra is the base for top bio-agri companies and has a well-developed laboratory
and research development infrastructure and a strong resource pool. � Key players: GlaxoSmithKline Pharmaceuticals, Cipla, Wockhardt, Lupin Ltd
2. IT & ITeS and Electronics � The IT sector in Maharashtra is one of the most developed sectors in the state. � The state has 37 public IT parks. A total of 451 IT parks have been approved in the state,
out of which 107 are functional. The prime clusters are located in Greater Mumbai, Pune, Thane and Nashik.
� Key players: Accenture, IBM, Capgemini, Infosys
3. Engineering � The engineering industry in the state is highly diversified and produces a large range of
machine-parts. The industry, which was initially concentrated in the Mumbai-Pune belt, has spread to other cities such as Nagpur, Aurangabad, Nashik and Kolhapur.
� The major items of production and export are textile mill machinery, machinery for sugar, cement and chemical plants, food processing machinery, construction machinery, tractors, electric power machinery, transmission line towers, automobiles and ship building.
� Key players: Larsen and Toubro Ltd, Greaves Cotton Ltd, Siemens Group, ABB.
4. Petrochemicals, oil and gas, energy � The state has a strong presence in petrochemicals, oil and gas sectors. The industry has
seen significant growth in the state. � Mumbai, Nagothane, Rabale, Nagpur and Patalganga are the major petrochemical hubs.
The state contributes 27.4% to the country’s chemicals, petrochemicals, and oil and gas output.
� Key players: ONGC, Hindustan Petroleum Corporation Ltd, Bharat Petroleum Corporation Ltd, Reliance Industries Ltd.
5. Auto and auto components
� Maharashtra accounts for approximately 38% of the country’s output of automobile by value. The prime centres in the state are Pune, Nashik, Aurangabad and Nagpur.
� Pune is the largest auto hub of India, with over 4,000 manufacturing units in Pimpri-Chinchwad region.
� Key players: Bajaj Auto Ltd., TATA Motors Ltd., Force Motors Ltd., Mahindra and Mahindra Ltd.
83India Brand Equity Foundation – State report on Maharashtra
200 | ASHE - Annual Status of Higher Education in States and UTs, 2012
With Maharashtra at the forefront of the nation’s industrial development scenario and the state attracting large amounts of investment, it is expected that industrial growth would be further strengthened. As of now, the state has already established itself in the areas of engineering, automobiles and auto components, chemicals, drugs and pharmaceuticals, textiles, information technology and biotechnology. With one of the best financial infrastructures in the country, it is often considered an economic powerhouse of the nation. The constant development expected in the state indicates that there is a strong need to build the required talent to enable further growth of the state.
Current and Proposed Initiatives in Higher Education
During the 11th Five Year Plan, several initiatives were taken by the state government to increase the gross enrolment ratio in higher education and several other initiatives have been proposed for the 12th Five Year Plan. A brief about these initiatives is given below:
� To increase enrolment of students belonging to socially and financially backward families, 16 state and central scholarships were awarded to poor and meritorious students to continue their higher education.
� To increase the standard of higher education in the state, the government has decided to ensure accreditation of the various universities and colleges of the state.
� Model colleges are being established (under the financial assistance from UGC) to increase the GER in poorly performing districts.
� Financial assistance is being given to aided colleges located in hilly and tribal areas for upgrading the infrastructural facilities of the state.
� The state has planned to establish new government art colleges to meet the student demand in the cities of Pune, Nashik and Amravati. The state government is providing financial assistance.
� Up gradation of library facilities across government institutes has been taken up by the state government.
� The government has decided to establish the State Institute of Vocational Education, Training and Research in Jalana.
� Model vocation schools would be established in the year 2013-14, where 51 existing government high schools will be converted into model vocational schools. Up gradation of machinery and laboratories would be taken up.
� To further enhance the vocational education quality in the state, a vocational education university has been proposed.
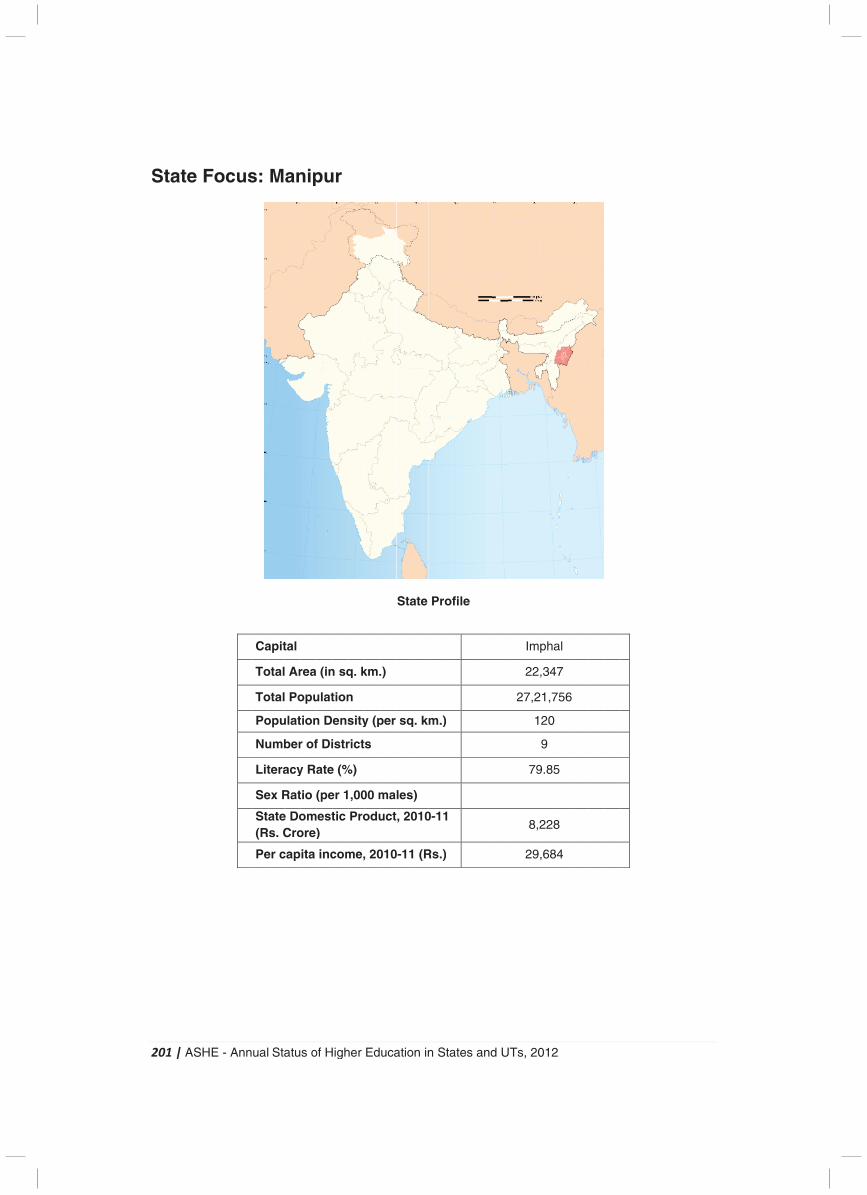
2
S
201
Sta
| A
ate
ASH
e F
HE
Fo
- A
oc
Ann
us
ual
s:
Ca
To
To
Po
Nu
Lit
Se
Sta(R
Pe
Sta
M
apit
otal
otal
opu
umb
tera
ex R
ates. C
er c
atu
an
tal
Ar
Po
ulat
ber
acy
Rat
e DoCro
cap
s o
nip
rea
opu
tion
r of
y Ra
tio (
omore)
ita
of H
pu
(in
ulat
n D
f Di
ate
(pe
mest)
inc
High
ur
n sq
tion
ens
istr
e (%
er 1
tic
com
her
q. k
n
sity
rict
%)
,00
Pro
me,
Ed
km.
y (p
s
00 m
odu
, 20
uca
.)
per
ma
uct
010
atio
Sta
sq
les
, 20
0-11
on in
ate
q. k
s)
010
1 (R
n S
Pr
m.)
0-11
Rs.)
Stat
ofi
)
1
)
es
le
and
d U
UTs
27
, 20
Im
22
7,2
1
79
8,2
29
012
pha
,34
21,7
20
9
9.85
228
,68
2
al
47
756
5
8
84
202 | ASHE - Annual Status of Higher Education in States and UTs, 2012
Introduction
In the local language of the state (Meiteilon or Manipuri), Manipur means “the jeweled land”, thus as the name suggest, the state is located in the lush green north east corner of the country and is considered to be a hill state due to its location, surrounded by blue hills with an oval valley in the centre. Manipur shares its borders with the states of Nagaland, Mizoram and Assam and the neighbouring country of Myanmar. Forest cover occupies nearly 64 per cent of the total geographical area of the state.
Manipur has abundant natural resources that facilitate development of infrastructure and industrial sectors. Many advantages that the state has are its agro-climatic conditions for fruits and vegetables, its access to South East Asian countries and its unique medicinal and aromatic plants.
Universities and University Level Institutes
There are 3 central universities in the state– Central Agricultural University, Manipur University and Indira Gandhi National Tribal University. There are no private, deemed or state universities in the state. The National Institute of Technology, Manipur (which is an Institute of National Importance) was established in the year 2010.
The Central Agricultural University is located near Imphal and was established in the year 1993. The jurisdiction of the university extends to all the six north-eastern hill states (Arunachal Pradesh, Manipur, Meghalaya, Mizoram, Sikkim and Tripura). The university offers under graduate programs, post graduate programs and research activities in the areas of agronomy, plant pathology, plant breeding, agricultural chemistry and entomology. Currently, there are seven colleges under the university.
The Manipur University was established during the year 1980 and was converted into a central university in 2005. The university has one constituent college (Manipur Institute of Technology) and affiliates 72 higher education colleges. The Indira Gandhi National Tribal University (which is a central university) has established a regional centre in the state during the year 2009. In addition to these universities, the National Institute of Technology – Manipur was established in the year 2010 and currently offers undergraduate programs in the fields of Computer Science Engineering, Electrical and Electronics Engineering & Electronics and Communication Engineering. The prominent medical institutes in the state are the Jawaharlal Nehru Institute of Medical Sciences and the Regional Institute of Medical Sciences.
Table 1: Distribution of Universities & University Level Institutions at State & National Level
Type of university Assam
(2011-12) India
(2011-12)
State University 0 285
Private University 0 112
Institution of National Importance 1 39
Deemed University 0 129
Central University 3 40
Total 4 605
Source: UGC
All premier higher education institutes of the state are located in the capital of the state, Imphal.
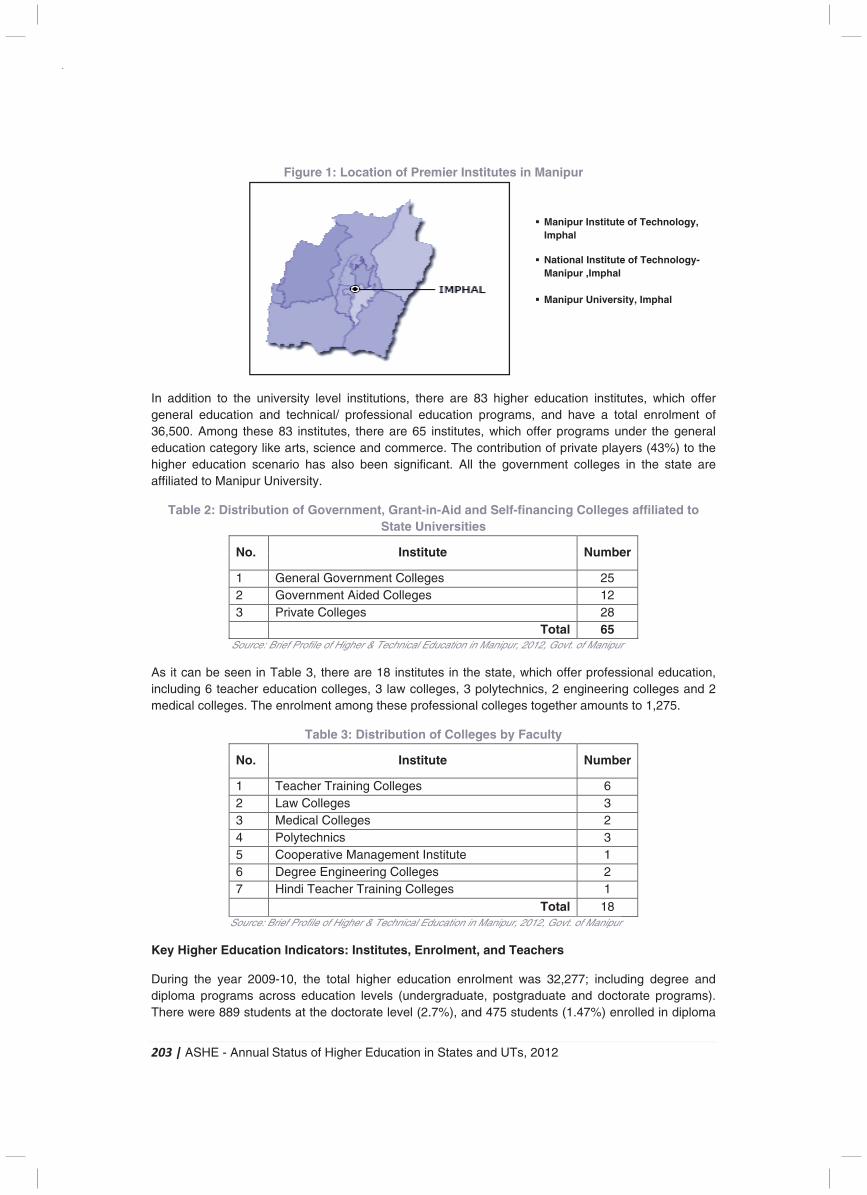
203 | ASHE - Annual Status of Higher Education in States and UTs, 2012
Figure 1: Location of Premier Institutes in Manipur
In addition to the university level institutions, there are 83 higher education institutes, which offer general education and technical/ professional education programs, and have a total enrolment of 36,500. Among these 83 institutes, there are 65 institutes, which offer programs under the general education category like arts, science and commerce. The contribution of private players (43%) to the higher education scenario has also been significant. All the government colleges in the state are affiliated to Manipur University.
Table 2: Distribution of Government, Grant-in-Aid and Self-financing Colleges affiliated to State Universities
No. Institute Number
1 General Government Colleges 25 2 Government Aided Colleges 12 3 Private Colleges 28
Total 65 Source: Brief Profile of Higher & Technical Education in Manipur, 2012, Govt. of Manipur
As it can be seen in Table 3, there are 18 institutes in the state, which offer professional education, including 6 teacher education colleges, 3 law colleges, 3 polytechnics, 2 engineering colleges and 2 medical colleges. The enrolment among these professional colleges together amounts to 1,275.
Table 3: Distribution of Colleges by Faculty
No. Institute Number
1 Teacher Training Colleges 6 2 Law Colleges 3 3 Medical Colleges 2 4 Polytechnics 3 5 Cooperative Management Institute 1 6 Degree Engineering Colleges 2 7 Hindi Teacher Training Colleges 1
Total 18 Source: Brief Profile of Higher & Technical Education in Manipur, 2012, Govt. of Manipur
Key Higher Education Indicators: Institutes, Enrolment, and Teachers
During the year 2009-10, the total higher education enrolment was 32,277; including degree and diploma programs across education levels (undergraduate, postgraduate and doctorate programs). There were 889 students at the doctorate level (2.7%), and 475 students (1.47%) enrolled in diploma
� Manipur Institute of Technology, Imphal
� National Institute of Technology-Manipur ,Imphal
� Manipur University, Imphal
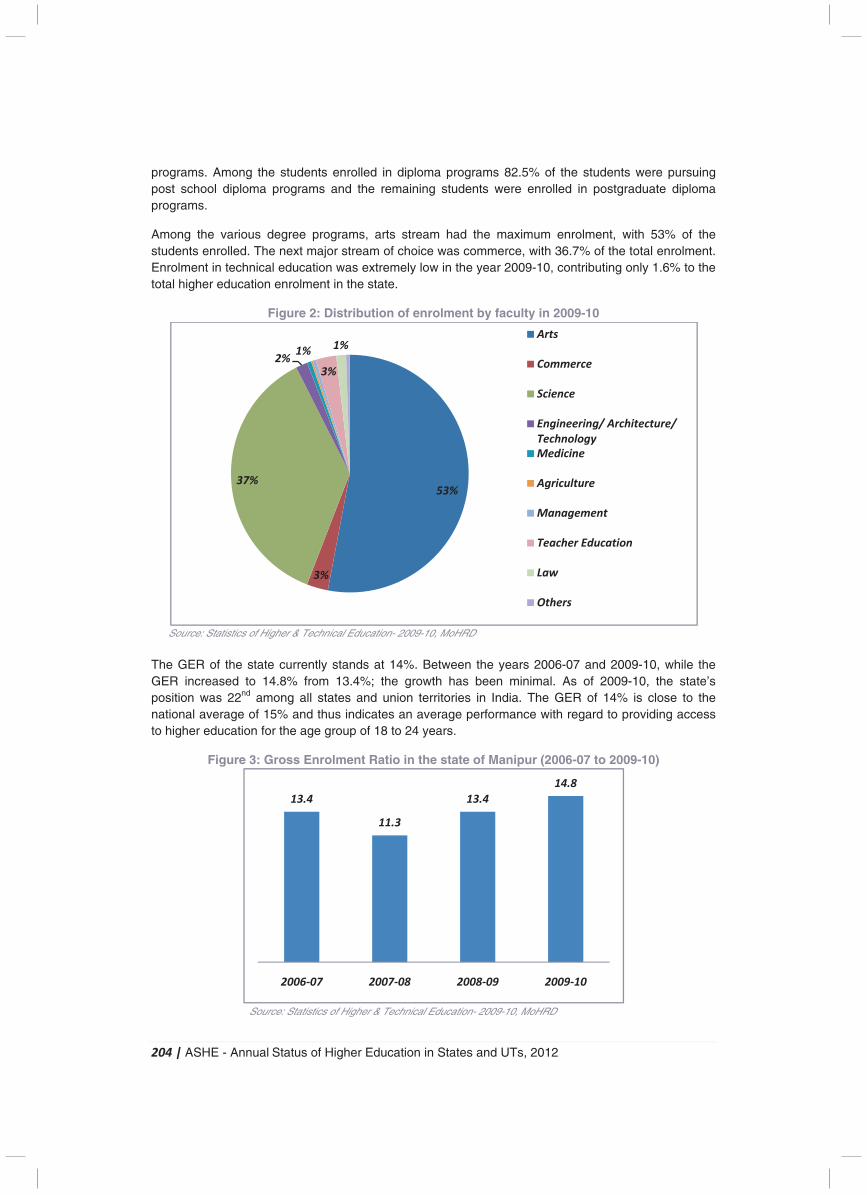
204 | ASHE - Annual Status of Higher Education in States and UTs, 2012
programs. Among the students enrolled in diploma programs 82.5% of the students were pursuing post school diploma programs and the remaining students were enrolled in postgraduate diploma programs.
Among the various degree programs, arts stream had the maximum enrolment, with 53% of the students enrolled. The next major stream of choice was commerce, with 36.7% of the total enrolment. Enrolment in technical education was extremely low in the year 2009-10, contributing only 1.6% to the total higher education enrolment in the state.
Figure 2: Distribution of enrolment by faculty in 2009-10
Source: Statistics of Higher & Technical Education- 2009-10, MoHRD The GER of the state currently stands at 14%. Between the years 2006-07 and 2009-10, while the GER increased to 14.8% from 13.4%; the growth has been minimal. As of 2009-10, the state’s position was 22nd among all states and union territories in India. The GER of 14% is close to the national average of 15% and thus indicates an average performance with regard to providing access to higher education for the age group of 18 to 24 years.
Figure 3: Gross Enrolment Ratio in the state of Manipur (2006-07 to 2009-10)
Source: Statistics of Higher & Technical Education- 2009-10, MoHRD
53%
3%
37%
2%1%
3%
1%Arts
Commerce
Science
Engineering/ Architecture/
Technology
Medicine
Agriculture
Management
Teacher Education
Law
Others
13.4
11.3
13.4
14.8
2006-07 2007-08 2008-09 2009-10
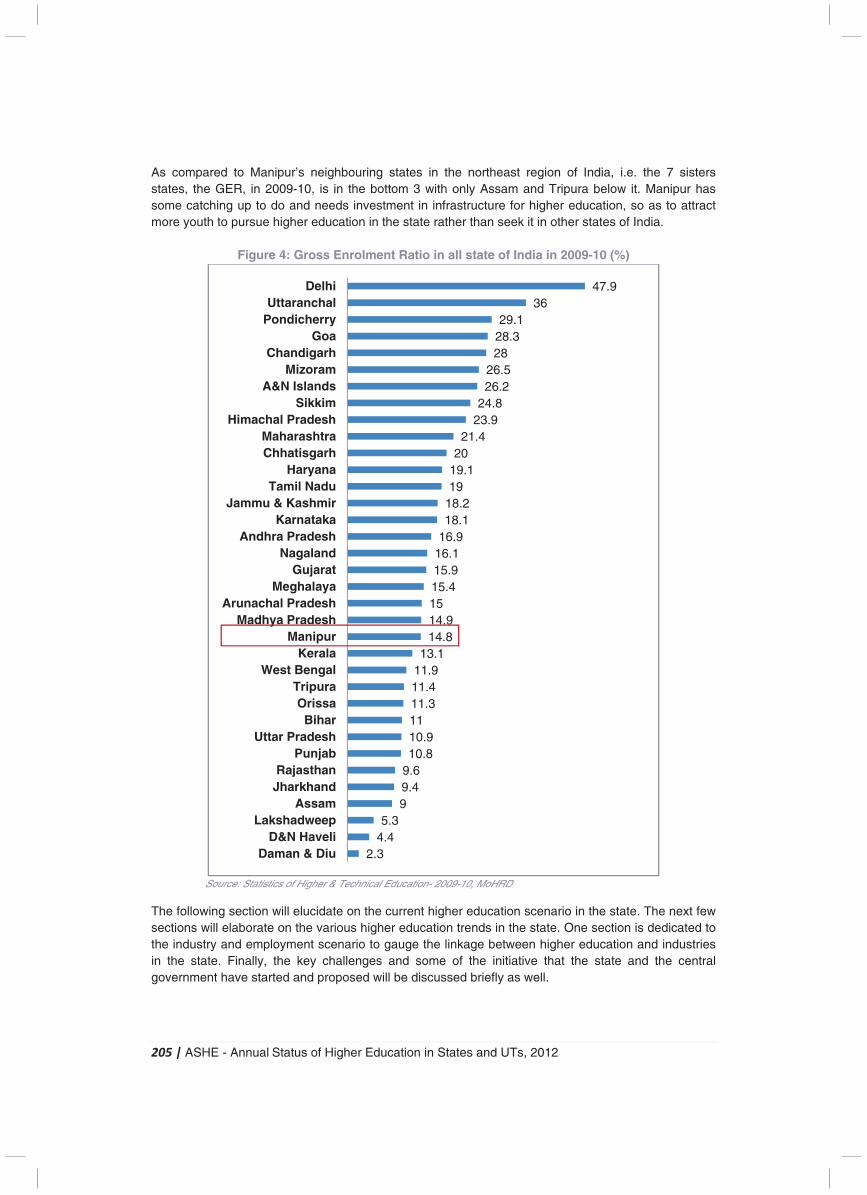
205 | ASHE - Annual Status of Higher Education in States and UTs, 2012
As compared to Manipur’s neighbouring states in the northeast region of India, i.e. the 7 sisters states, the GER, in 2009-10, is in the bottom 3 with only Assam and Tripura below it. Manipur has some catching up to do and needs investment in infrastructure for higher education, so as to attract more youth to pursue higher education in the state rather than seek it in other states of India.
Figure 4: Gross Enrolment Ratio in all state of India in 2009-10 (%)
Source: Statistics of Higher & Technical Education- 2009-10, MoHRD
The following section will elucidate on the current higher education scenario in the state. The next few sections will elaborate on the various higher education trends in the state. One section is dedicated to the industry and employment scenario to gauge the linkage between higher education and industries in the state. Finally, the key challenges and some of the initiative that the state and the central government have started and proposed will be discussed briefly as well.
2.34.45.3
99.49.610.810.91111.311.411.913.1
14.814.91515.415.916.116.918.118.21919.12021.4
23.924.826.226.5
2828.329.1
3647.9
Daman & DiuD&N Haveli
LakshadweepAssam
JharkhandRajasthan
PunjabUttar Pradesh
BiharOrissa
TripuraWest Bengal
KeralaManipur
Madhya PradeshArunachal Pradesh
MeghalayaGujarat
NagalandAndhra Pradesh
KarnatakaJammu & Kashmir
Tamil NaduHaryana
ChhatisgarhMaharashtra
Himachal PradeshSikkim
A&N IslandsMizoram
ChandigarhGoa
PondicherryUttaranchal
Delhi
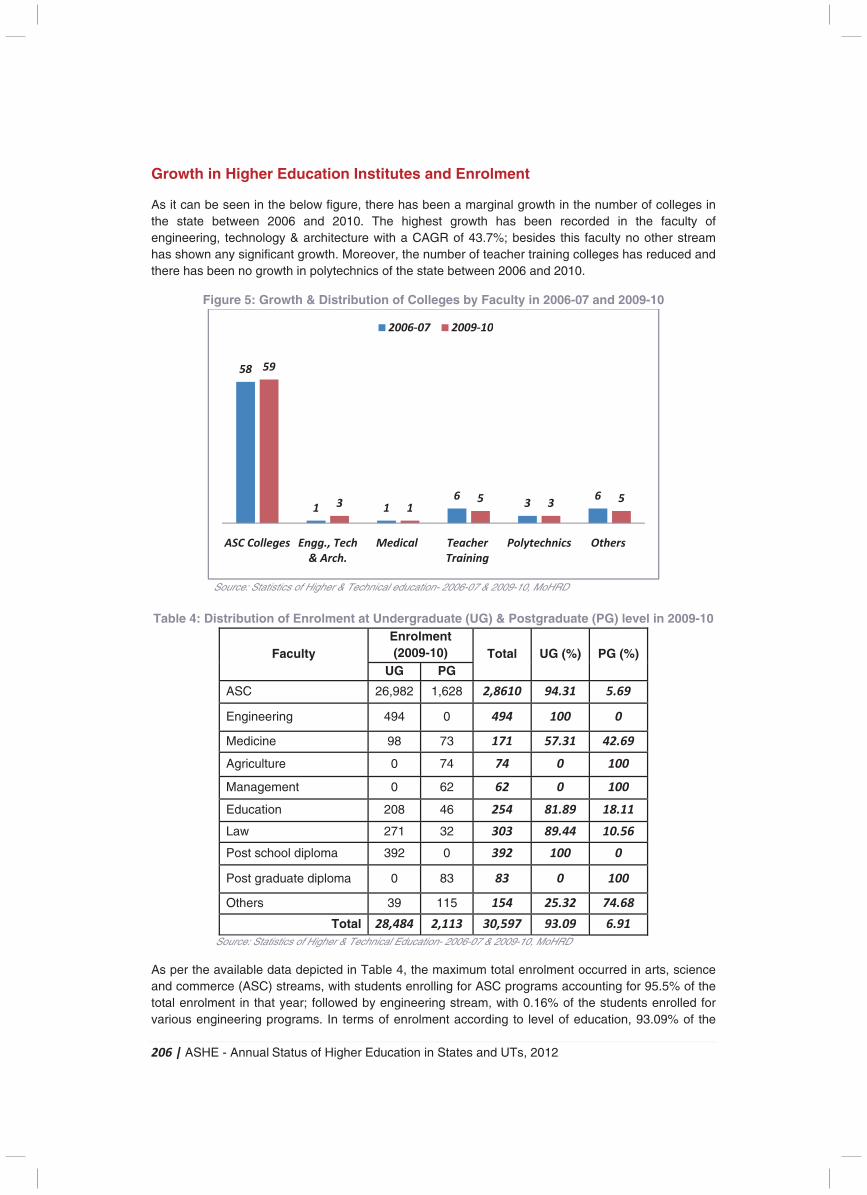
206 | ASHE - Annual Status of Higher Education in States and UTs, 2012
Growth in Higher Education Institutes and Enrolment
As it can be seen in the below figure, there has been a marginal growth in the number of colleges in the state between 2006 and 2010. The highest growth has been recorded in the faculty of engineering, technology & architecture with a CAGR of 43.7%; besides this faculty no other stream has shown any significant growth. Moreover, the number of teacher training colleges has reduced and there has been no growth in polytechnics of the state between 2006 and 2010.
Figure 5: Growth & Distribution of Colleges by Faculty in 2006-07 and 2009-10
Source: Statistics of Higher & Technical education- 2006-07 & 2009-10, MoHRD
Table 4: Distribution of Enrolment at Undergraduate (UG) & Postgraduate (PG) level in 2009-10
Faculty Enrolment (2009-10) Total UG (%) PG (%)
UG PG
ASC 26,982 1,628 2,8610 94.31 5.69
Engineering 494 0 494 100 0
Medicine 98 73 171 57.31 42.69
Agriculture 0 74 74 0 100
Management 0 62 62 0 100
Education 208 46 254 81.89 18.11
Law 271 32 303 89.44 10.56
Post school diploma 392 0 392 100 0
Post graduate diploma 0 83 83 0 100
Others 39 115 154 25.32 74.68
Total 28,484 2,113 30,597 93.09 6.91
Source: Statistics of Higher & Technical Education- 2006-07 & 2009-10, MoHRD As per the available data depicted in Table 4, the maximum total enrolment occurred in arts, science and commerce (ASC) streams, with students enrolling for ASC programs accounting for 95.5% of the total enrolment in that year; followed by engineering stream, with 0.16% of the students enrolled for various engineering programs. In terms of enrolment according to level of education, 93.09% of the
(.57%)
(43.7%) (0%)
(-5.84%) (-5.84%)
(0%)
58
1 16
36
59
3 15 3 5
ASC Colleges Engg., Tech
& Arch.
Medical Teacher
Training
Polytechnics Others
2006-07 2009-10
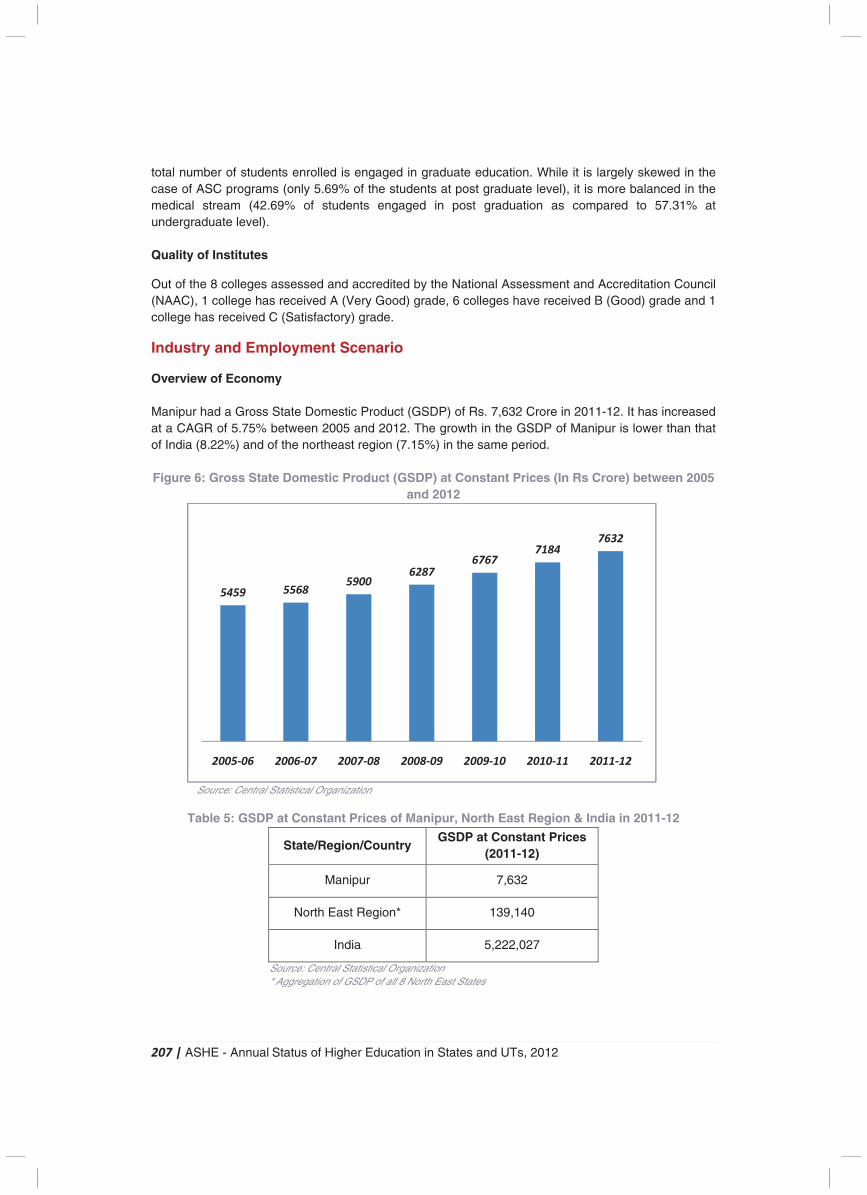
207 | ASHE - Annual Status of Higher Education in States and UTs, 2012
total number of students enrolled is engaged in graduate education. While it is largely skewed in the case of ASC programs (only 5.69% of the students at post graduate level), it is more balanced in the medical stream (42.69% of students engaged in post graduation as compared to 57.31% at undergraduate level). Quality of Institutes
Out of the 8 colleges assessed and accredited by the National Assessment and Accreditation Council (NAAC), 1 college has received A (Very Good) grade, 6 colleges have received B (Good) grade and 1 college has received C (Satisfactory) grade.
Industry and Employment Scenario
Overview of Economy Manipur had a Gross State Domestic Product (GSDP) of Rs. 7,632 Crore in 2011-12. It has increased at a CAGR of 5.75% between 2005 and 2012. The growth in the GSDP of Manipur is lower than that of India (8.22%) and of the northeast region (7.15%) in the same period. Figure 6: Gross State Domestic Product (GSDP) at Constant Prices (In Rs Crore) between 2005
and 2012
Source: Central Statistical Organization
Table 5: GSDP at Constant Prices of Manipur, North East Region & India in 2011-12
State/Region/Country GSDP at Constant Prices
(2011-12)
Manipur 7,632
North East Region* 139,140
India 5,222,027
Source: Central Statistical Organization * Aggregation of GSDP of all 8 North East States
CAGR 5.75%
5459 55685900
62876767
71847632
2005-06 2006-07 2007-08 2008-09 2009-10 2010-11 2011-12
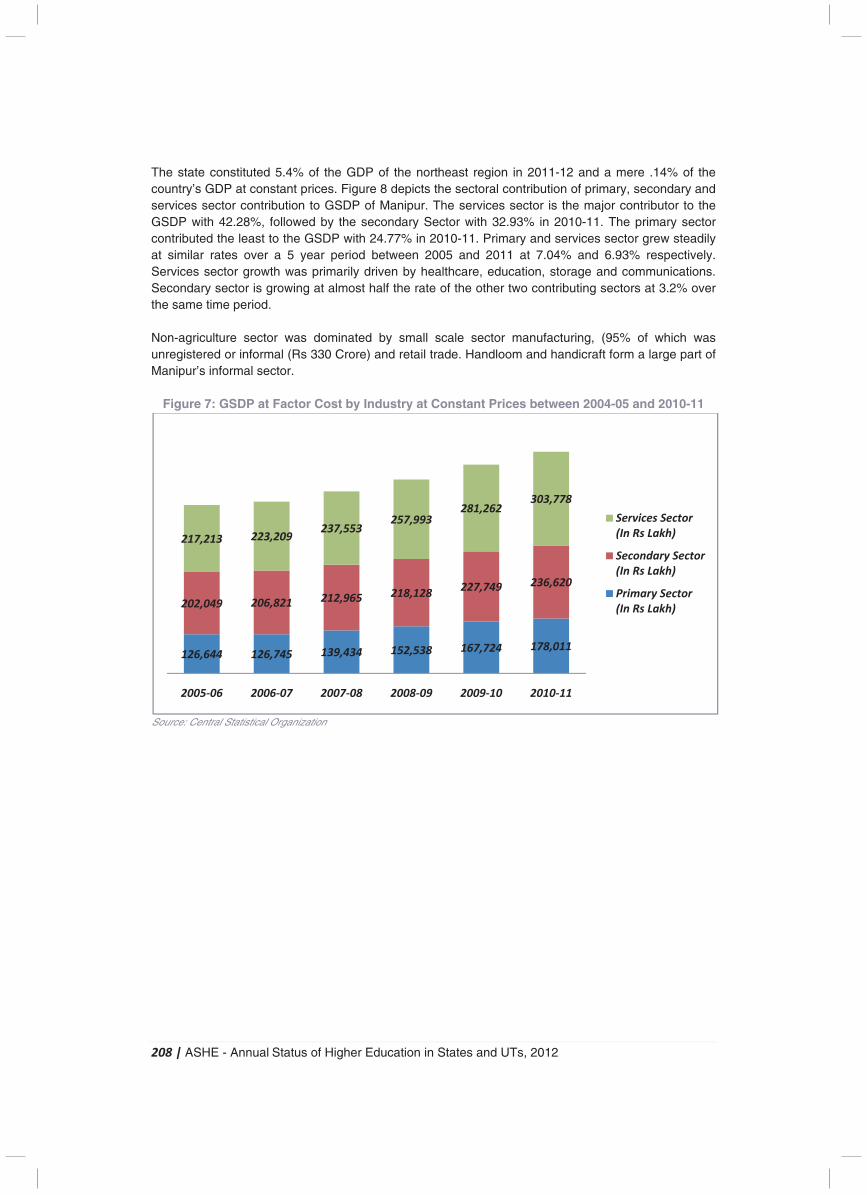
208 | ASHE - Annual Status of Higher Education in States and UTs, 2012
The state constituted 5.4% of the GDP of the northeast region in 2011-12 and a mere .14% of the country’s GDP at constant prices. Figure 8 depicts the sectoral contribution of primary, secondary and services sector contribution to GSDP of Manipur. The services sector is the major contributor to the GSDP with 42.28%, followed by the secondary Sector with 32.93% in 2010-11. The primary sector contributed the least to the GSDP with 24.77% in 2010-11. Primary and services sector grew steadily at similar rates over a 5 year period between 2005 and 2011 at 7.04% and 6.93% respectively. Services sector growth was primarily driven by healthcare, education, storage and communications. Secondary sector is growing at almost half the rate of the other two contributing sectors at 3.2% over the same time period. Non-agriculture sector was dominated by small scale sector manufacturing, (95% of which was unregistered or informal (Rs 330 Crore) and retail trade. Handloom and handicraft form a large part of Manipur’s informal sector.
Figure 7: GSDP at Factor Cost by Industry at Constant Prices between 2004-05 and 2010-11
Source: Central Statistical Organization
126,644 126,745 139,434 152,538 167,724 178,011
202,049 206,821 212,965 218,128227,749 236,620
217,213 223,209237,553
257,993281,262
303,778
2005-06 2006-07 2007-08 2008-09 2009-10 2010-11
Services Sector
(In Rs Lakh)
Secondary Sector
(In Rs Lakh)
Primary Sector
(In Rs Lakh)
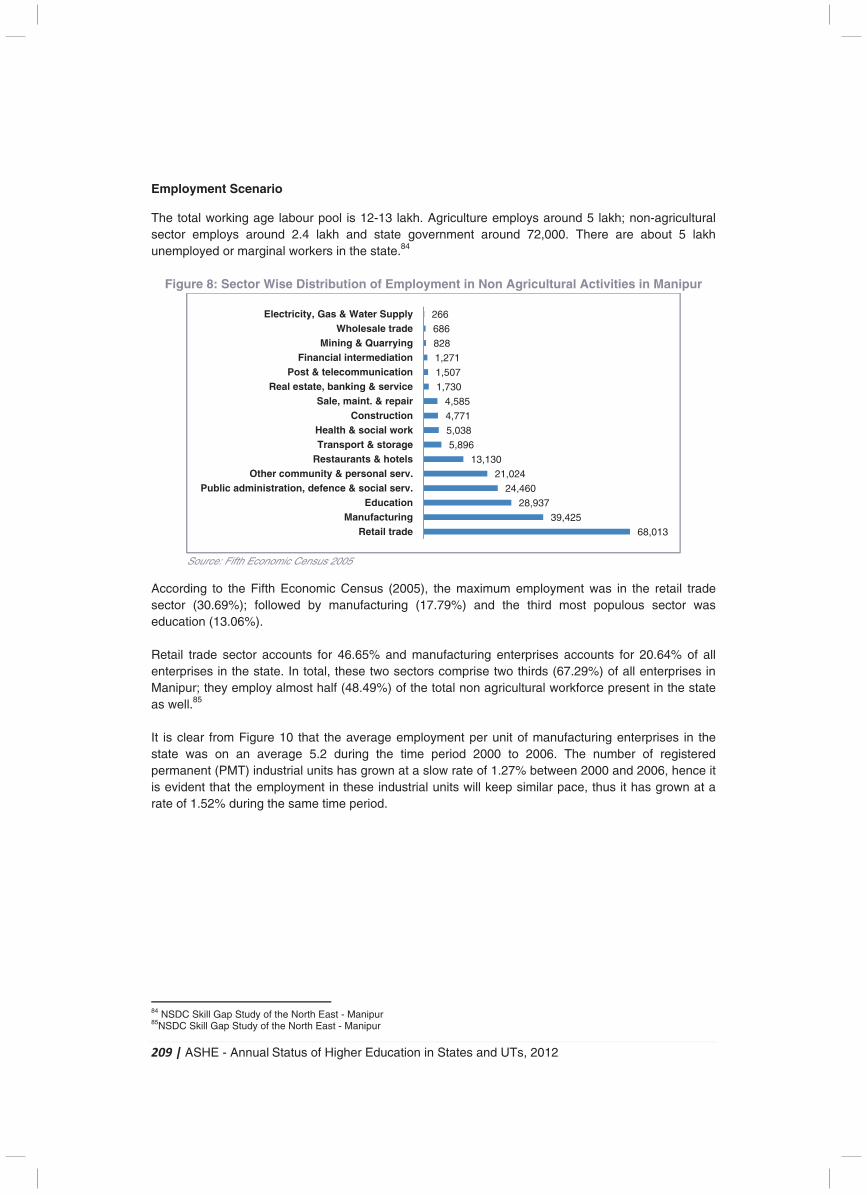
209 | ASHE - Annual Status of Higher Education in States and UTs, 2012
Employment Scenario
The total working age labour pool is 12-13 lakh. Agriculture employs around 5 lakh; non-agricultural sector employs around 2.4 lakh and state government around 72,000. There are about 5 lakh unemployed or marginal workers in the state.84
Figure 8: Sector Wise Distribution of Employment in Non Agricultural Activities in Manipur
Source: Fifth Economic Census 2005
According to the Fifth Economic Census (2005), the maximum employment was in the retail trade sector (30.69%); followed by manufacturing (17.79%) and the third most populous sector was education (13.06%). Retail trade sector accounts for 46.65% and manufacturing enterprises accounts for 20.64% of all enterprises in the state. In total, these two sectors comprise two thirds (67.29%) of all enterprises in Manipur; they employ almost half (48.49%) of the total non agricultural workforce present in the state as well.85 It is clear from Figure 10 that the average employment per unit of manufacturing enterprises in the state was on an average 5.2 during the time period 2000 to 2006. The number of registered permanent (PMT) industrial units has grown at a slow rate of 1.27% between 2000 and 2006, hence it is evident that the employment in these industrial units will keep similar pace, thus it has grown at a rate of 1.52% during the same time period.
84 NSDC Skill Gap Study of the North East - Manipur 85NSDC Skill Gap Study of the North East - Manipur
68,013
39,425
28,937
24,460
21,024
13,130
5,896
5,038
4,771
4,585
1,730
1,507
1,271
828
686
266
Retail tradeManufacturing
EducationPublic administration, defence & social serv.
Other community & personal serv.Restaurants & hotelsTransport & storageHealth & social work
ConstructionSale, maint. & repair
Real estate, banking & servicePost & telecommunication
Financial intermediationMining & Quarrying
Wholesale tradeElectricity, Gas & Water Supply
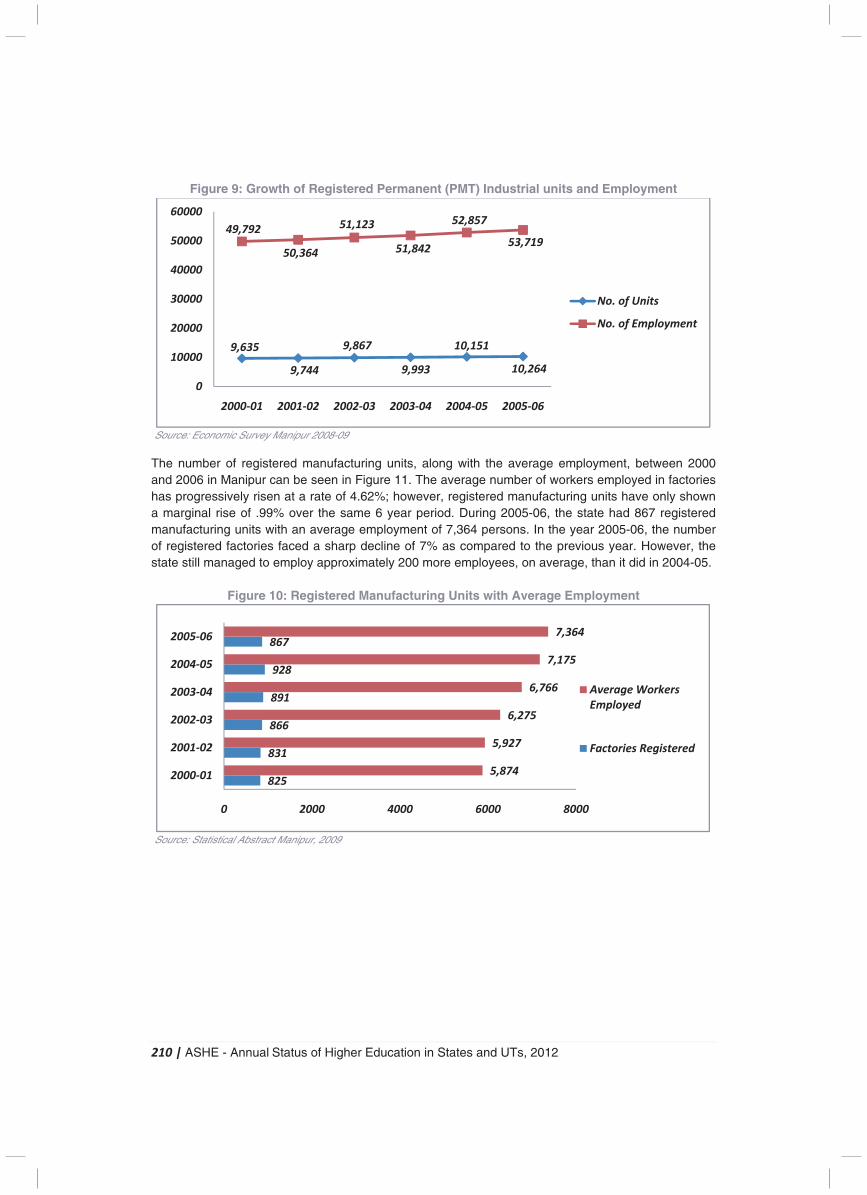
210 | ASHE - Annual Status of Higher Education in States and UTs, 2012
Figure 9: Growth of Registered Permanent (PMT) Industrial units and Employment
Source: Economic Survey Manipur 2008-09 The number of registered manufacturing units, along with the average employment, between 2000 and 2006 in Manipur can be seen in Figure 11. The average number of workers employed in factories has progressively risen at a rate of 4.62%; however, registered manufacturing units have only shown a marginal rise of .99% over the same 6 year period. During 2005-06, the state had 867 registered manufacturing units with an average employment of 7,364 persons. In the year 2005-06, the number of registered factories faced a sharp decline of 7% as compared to the previous year. However, the state still managed to employ approximately 200 more employees, on average, than it did in 2004-05.
Figure 10: Registered Manufacturing Units with Average Employment
Source: Statistical Abstract Manipur, 2009
Average employment per unit of manufacturing enterprises:
5.2 persons
9,635
9,744
9,867
9,993
10,151
10,264
49,792
50,364
51,123
51,842
52,857
53,719
0
10000
20000
30000
40000
50000
60000
2000-01 2001-02 2002-03 2003-04 2004-05 2005-06
No. of Units
No. of Employment
825
831
866
891
928
867
5,874
5,927
6,275
6,766
7,175
7,364
0 2000 4000 6000 8000
2000-01
2001-02
2002-03
2003-04
2004-05
2005-06
Average Workers
Employed
Factories Registered
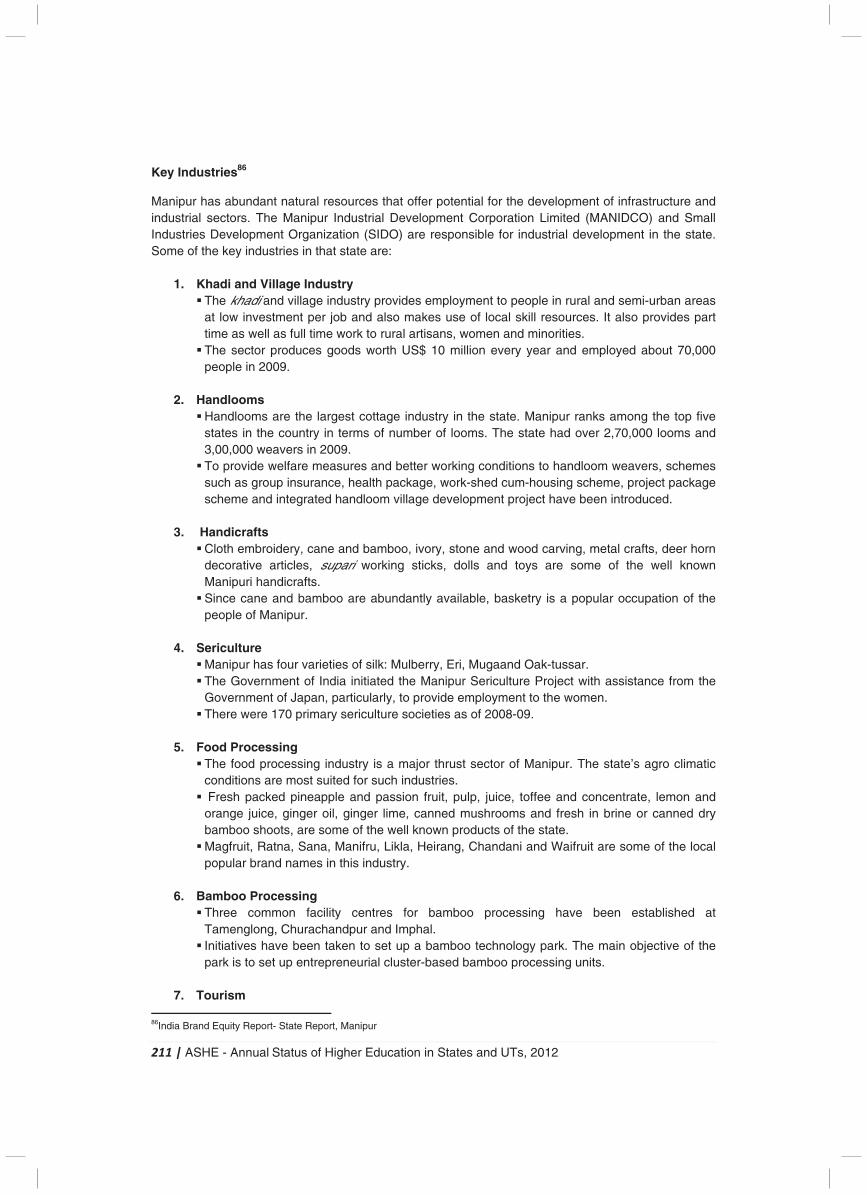
211 | ASHE - Annual Status of Higher Education in States and UTs, 2012
Key Industries86
Manipur has abundant natural resources that offer potential for the development of infrastructure and industrial sectors. The Manipur Industrial Development Corporation Limited (MANIDCO) and Small Industries Development Organization (SIDO) are responsible for industrial development in the state. Some of the key industries in that state are:
1. Khadi and Village Industry � The khadi and village industry provides employment to people in rural and semi-urban areas
at low investment per job and also makes use of local skill resources. It also provides part time as well as full time work to rural artisans, women and minorities.
� The sector produces goods worth US$ 10 million every year and employed about 70,000 people in 2009.
2. Handlooms
� Handlooms are the largest cottage industry in the state. Manipur ranks among the top five states in the country in terms of number of looms. The state had over 2,70,000 looms and 3,00,000 weavers in 2009.
� To provide welfare measures and better working conditions to handloom weavers, schemes such as group insurance, health package, work-shed cum-housing scheme, project package scheme and integrated handloom village development project have been introduced.
3. Handicrafts
� Cloth embroidery, cane and bamboo, ivory, stone and wood carving, metal crafts, deer horn decorative articles, supari working sticks, dolls and toys are some of the well known Manipuri handicrafts.
� Since cane and bamboo are abundantly available, basketry is a popular occupation of the people of Manipur.
4. Sericulture
� Manipur has four varieties of silk: Mulberry, Eri, Mugaand Oak-tussar. � The Government of India initiated the Manipur Sericulture Project with assistance from the
Government of Japan, particularly, to provide employment to the women. � There were 170 primary sericulture societies as of 2008-09.
5. Food Processing
� The food processing industry is a major thrust sector of Manipur. The state’s agro climatic conditions are most suited for such industries.
� Fresh packed pineapple and passion fruit, pulp, juice, toffee and concentrate, lemon and orange juice, ginger oil, ginger lime, canned mushrooms and fresh in brine or canned dry bamboo shoots, are some of the well known products of the state.
� Magfruit, Ratna, Sana, Manifru, Likla, Heirang, Chandani and Waifruit are some of the local popular brand names in this industry.
6. Bamboo Processing
� Three common facility centres for bamboo processing have been established at Tamenglong, Churachandpur and Imphal.
� Initiatives have been taken to set up a bamboo technology park. The main objective of the park is to set up entrepreneurial cluster-based bamboo processing units.
7. Tourism
86India Brand Equity Report- State Report, Manipur
212 | ASHE - Annual Status of Higher Education in States and UTs, 2012
� Besides a rich tribal culture, Manipur has pleasant climatic conditions, exotic greenery and varied flora. � According to the Ministry of Tourism, 1.2 million tourists visited Manipur in 2009.
Key Challenges and Initiatives in Higher Education
Challenges of Higher Education
� Colleges suffer from poor quality of education due to which they are unable to retain students. � Issues of employability of students as well as law and order problems are critical to the state and
play a crucial role in affecting the development of higher education infrastructure. � The conversion of state university into central university hasn’t helped in the development of
higher education in the state because the funds released weren’t allocated to the higher education sector.
� There is a need to explore various ways to bring more private players in the state which can cater to the increasing demand in courses like B.A, B.Com etc. and seek assistance for setting up more central institutes.
Initiatives Started
� NAAC accredited colleges have increased from 4 to 12, including 10 govt. colleges. � 2 colleges declared by UGC as Colleges of Potential for Excellence. � Academic building and science labs constructed in11 govt. colleges. � Placement of students from technical institutes in reputed companies.
Initiatives Proposed
� Opening of new market friendly courses of study and commencement of postgraduate classes in different subjects in select government colleges.
� Up gradation of an existing government college in each district as a model college with strong focus on job oriented courses and ICT initiatives.
� Establishment of 3 new polytechnics (including 1 women polytechnic), with a fully residential campus with new hostels & staff quarters.
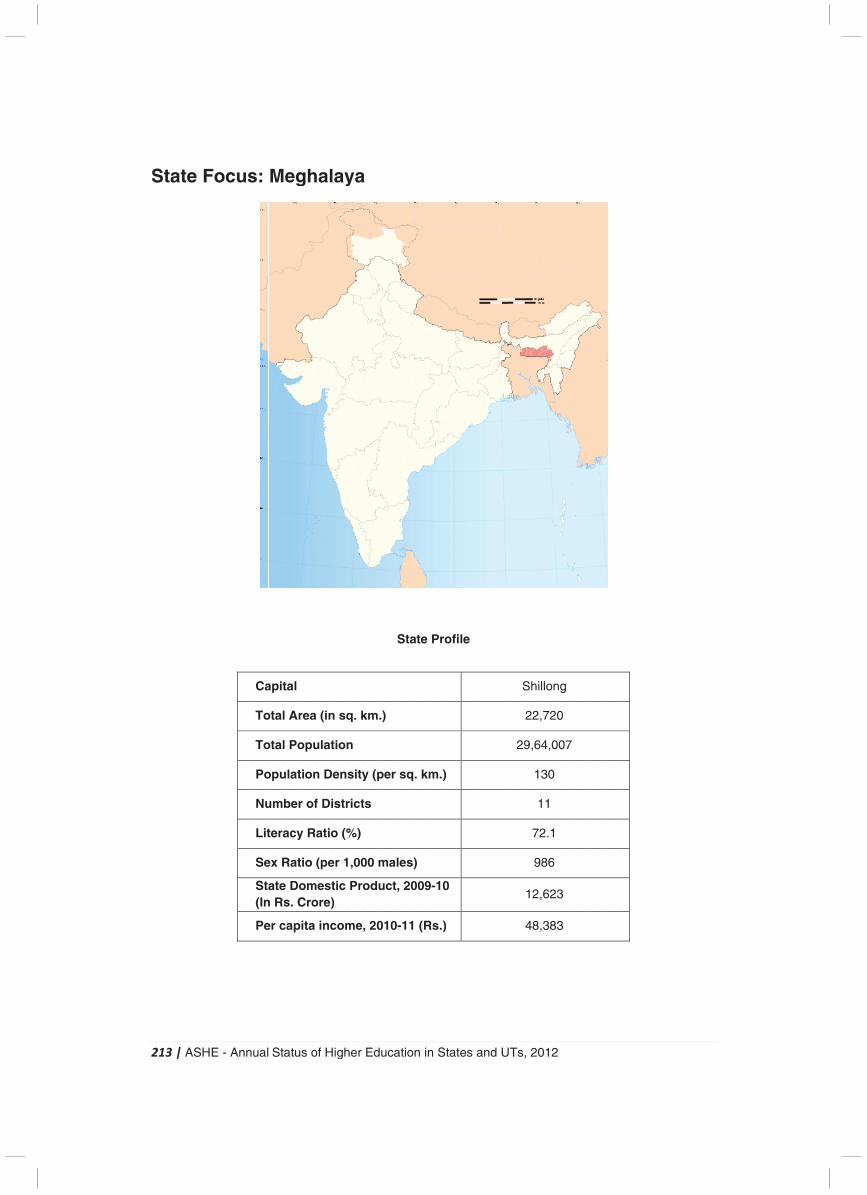
2
S
213
Sta
| A
ate
ASH
e F
HE
Fo
- A
oc
Ann
us
ual
s:
Ca
To
To
Po
Nu
Lit
Se
Sta(In
Pe
Sta
M
apit
otal
otal
opu
umb
tera
ex R
aten Rs
er c
atu
eg
tal
Ar
Po
ulat
ber
acy
Rat
e Dos. C
cap
s o
gh
rea
opu
tion
r of
y Ra
tio (
omCro
ita
of H
hal
(in
ulat
n D
f Di
atio
(pe
mestore)
inc
High
ay
n sq
tion
ens
istr
o (%
er 1
tic )
com
her
ya
q. k
n
sity
rict
%)
,00
Pro
me,
Ed
a
km.
y (p
s
00 m
odu
, 20
uca
.)
per
ma
uct
010
atio
Sta
sq
les
, 20
0-11
on in
ate
q. k
s)
009
1 (R
n S
Pr
m.)
9-10
Rs.)
Stat
ofi
)
0
)
es
le
and
d U
UTs
S
2
, 20
Shi
22
9,6
1
1
72
9
12
48
012
llon
,72
64,0
30
11
2.1
986
,62
,38
2
ng
20
007
23
83
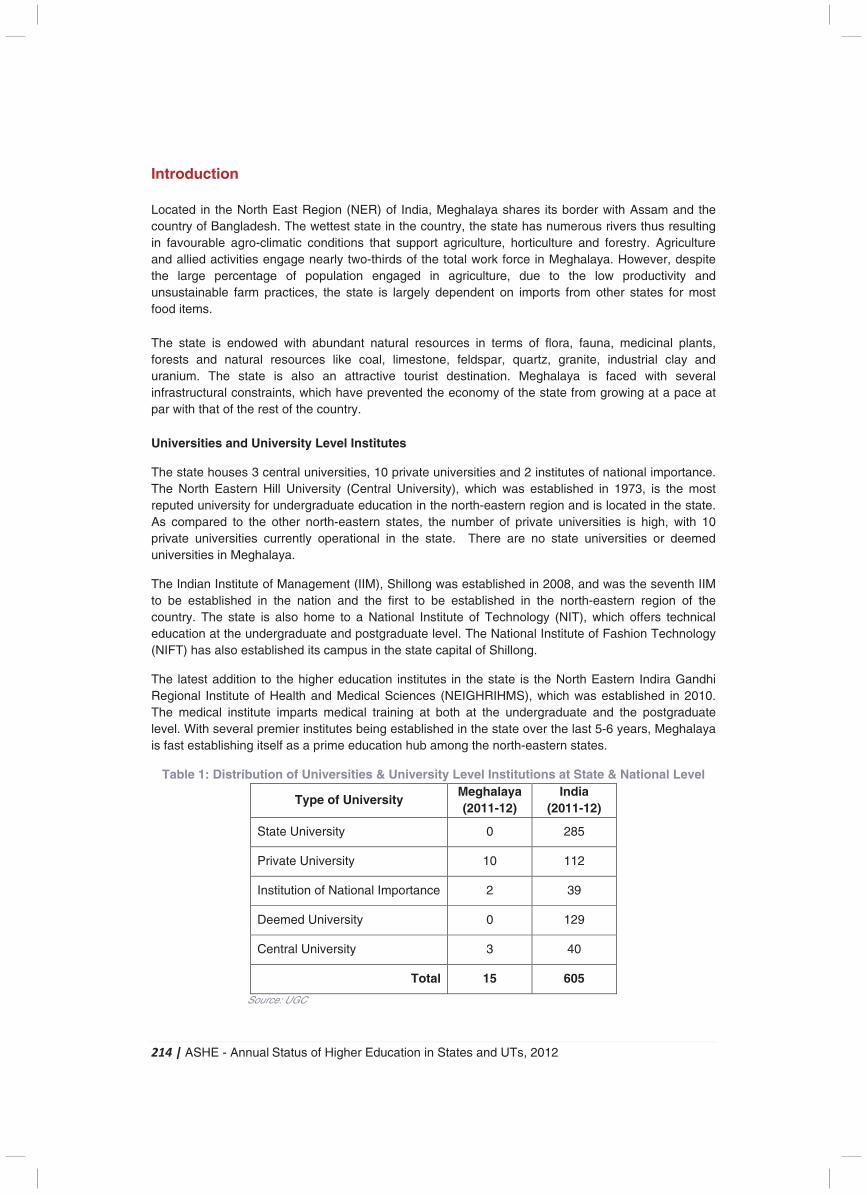
214 | ASHE - Annual Status of Higher Education in States and UTs, 2012
Introduction
Located in the North East Region (NER) of India, Meghalaya shares its border with Assam and the country of Bangladesh. The wettest state in the country, the state has numerous rivers thus resulting in favourable agro-climatic conditions that support agriculture, horticulture and forestry. Agriculture and allied activities engage nearly two-thirds of the total work force in Meghalaya. However, despite the large percentage of population engaged in agriculture, due to the low productivity and unsustainable farm practices, the state is largely dependent on imports from other states for most food items.
The state is endowed with abundant natural resources in terms of flora, fauna, medicinal plants, forests and natural resources like coal, limestone, feldspar, quartz, granite, industrial clay and uranium. The state is also an attractive tourist destination. Meghalaya is faced with several infrastructural constraints, which have prevented the economy of the state from growing at a pace at par with that of the rest of the country.
Universities and University Level Institutes
The state houses 3 central universities, 10 private universities and 2 institutes of national importance. The North Eastern Hill University (Central University), which was established in 1973, is the most reputed university for undergraduate education in the north-eastern region and is located in the state. As compared to the other north-eastern states, the number of private universities is high, with 10 private universities currently operational in the state. There are no state universities or deemed universities in Meghalaya.
The Indian Institute of Management (IIM), Shillong was established in 2008, and was the seventh IIM to be established in the nation and the first to be established in the north-eastern region of the country. The state is also home to a National Institute of Technology (NIT), which offers technical education at the undergraduate and postgraduate level. The National Institute of Fashion Technology (NIFT) has also established its campus in the state capital of Shillong.
The latest addition to the higher education institutes in the state is the North Eastern Indira Gandhi Regional Institute of Health and Medical Sciences (NEIGHRIHMS), which was established in 2010. The medical institute imparts medical training at both at the undergraduate and the postgraduate level. With several premier institutes being established in the state over the last 5-6 years, Meghalaya is fast establishing itself as a prime education hub among the north-eastern states.
Table 1: Distribution of Universities & University Level Institutions at State & National Level
Type of University Meghalaya (2011-12)
India (2011-12)
State University 0 285
Private University 10 112
Institution of National Importance 2 39
Deemed University 0 129
Central University 3 40
Total 15 605
Source: UGC
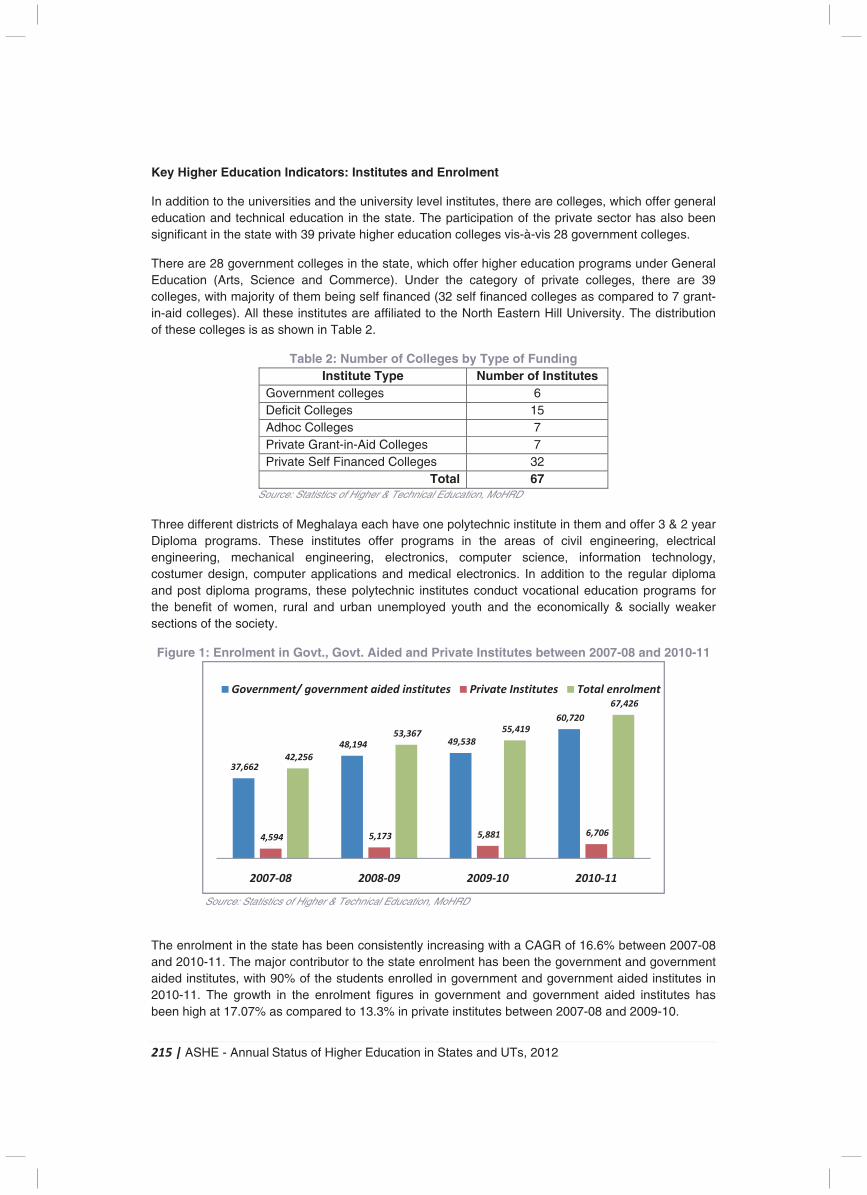
215 | ASHE - Annual Status of Higher Education in States and UTs, 2012
Key Higher Education Indicators: Institutes and Enrolment
In addition to the universities and the university level institutes, there are colleges, which offer general education and technical education in the state. The participation of the private sector has also been significant in the state with 39 private higher education colleges vis-à-vis 28 government colleges.
There are 28 government colleges in the state, which offer higher education programs under General Education (Arts, Science and Commerce). Under the category of private colleges, there are 39 colleges, with majority of them being self financed (32 self financed colleges as compared to 7 grant-in-aid colleges). All these institutes are affiliated to the North Eastern Hill University. The distribution of these colleges is as shown in Table 2.
Table 2: Number of Colleges by Type of Funding Institute Type Number of Institutes
Government colleges 6 Deficit Colleges 15 Adhoc Colleges 7 Private Grant-in-Aid Colleges 7 Private Self Financed Colleges 32
Total 67 Source: Statistics of Higher & Technical Education, MoHRD
Three different districts of Meghalaya each have one polytechnic institute in them and offer 3 & 2 year Diploma programs. These institutes offer programs in the areas of civil engineering, electrical engineering, mechanical engineering, electronics, computer science, information technology, costumer design, computer applications and medical electronics. In addition to the regular diploma and post diploma programs, these polytechnic institutes conduct vocational education programs for the benefit of women, rural and urban unemployed youth and the economically & socially weaker sections of the society.
Figure 1: Enrolment in Govt., Govt. Aided and Private Institutes between 2007-08 and 2010-11
Source: Statistics of Higher & Technical Education, MoHRD
The enrolment in the state has been consistently increasing with a CAGR of 16.6% between 2007-08 and 2010-11. The major contributor to the state enrolment has been the government and government aided institutes, with 90% of the students enrolled in government and government aided institutes in 2010-11. The growth in the enrolment figures in government and government aided institutes has been high at 17.07% as compared to 13.3% in private institutes between 2007-08 and 2009-10.
37,662
48,194 49,538
60,720
4,594 5,173 5,881 6,706
42,256
53,367 55,419
67,426
2007-08 2008-09 2009-10 2010-11
Government/ government aided institutes Private Institutes Total enrolment
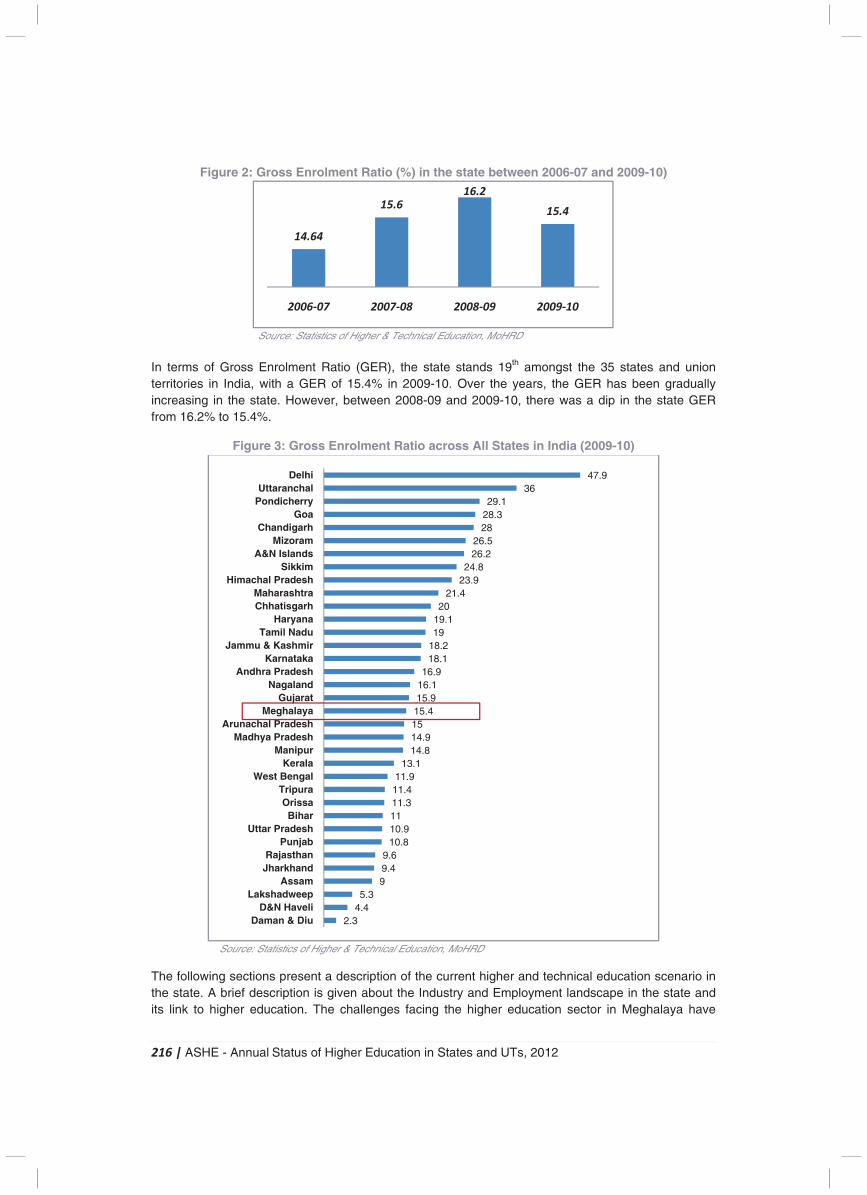
216 | ASHE - Annual Status of Higher Education in States and UTs, 2012
Figure 2: Gross Enrolment Ratio (%) in the state between 2006-07 and 2009-10)
Source: Statistics of Higher & Technical Education, MoHRD
In terms of Gross Enrolment Ratio (GER), the state stands 19th amongst the 35 states and union territories in India, with a GER of 15.4% in 2009-10. Over the years, the GER has been gradually increasing in the state. However, between 2008-09 and 2009-10, there was a dip in the state GER from 16.2% to 15.4%.
Figure 3: Gross Enrolment Ratio across All States in India (2009-10)
Source: Statistics of Higher & Technical Education, MoHRD
The following sections present a description of the current higher and technical education scenario in the state. A brief description is given about the Industry and Employment landscape in the state and its link to higher education. The challenges facing the higher education sector in Meghalaya have
14.64
15.6 16.2
15.4
2006-07 2007-08 2008-09 2009-10
2.34.45.3
99.49.6
10.810.91111.311.411.9
13.114.814.91515.415.916.116.9
18.118.21919.120
21.423.924.8
26.226.5
2828.329.1
3647.9
Daman & DiuD&N Haveli
LakshadweepAssam
JharkhandRajasthan
PunjabUttar Pradesh
BiharOrissa
TripuraWest Bengal
KeralaManipur
Madhya PradeshArunachal Pradesh
MeghalayaGujarat
NagalandAndhra Pradesh
KarnatakaJammu & Kashmir
Tamil NaduHaryana
ChhatisgarhMaharashtra
Himachal PradeshSikkim
A&N IslandsMizoram
ChandigarhGoa
PondicherryUttaranchal
Delhi
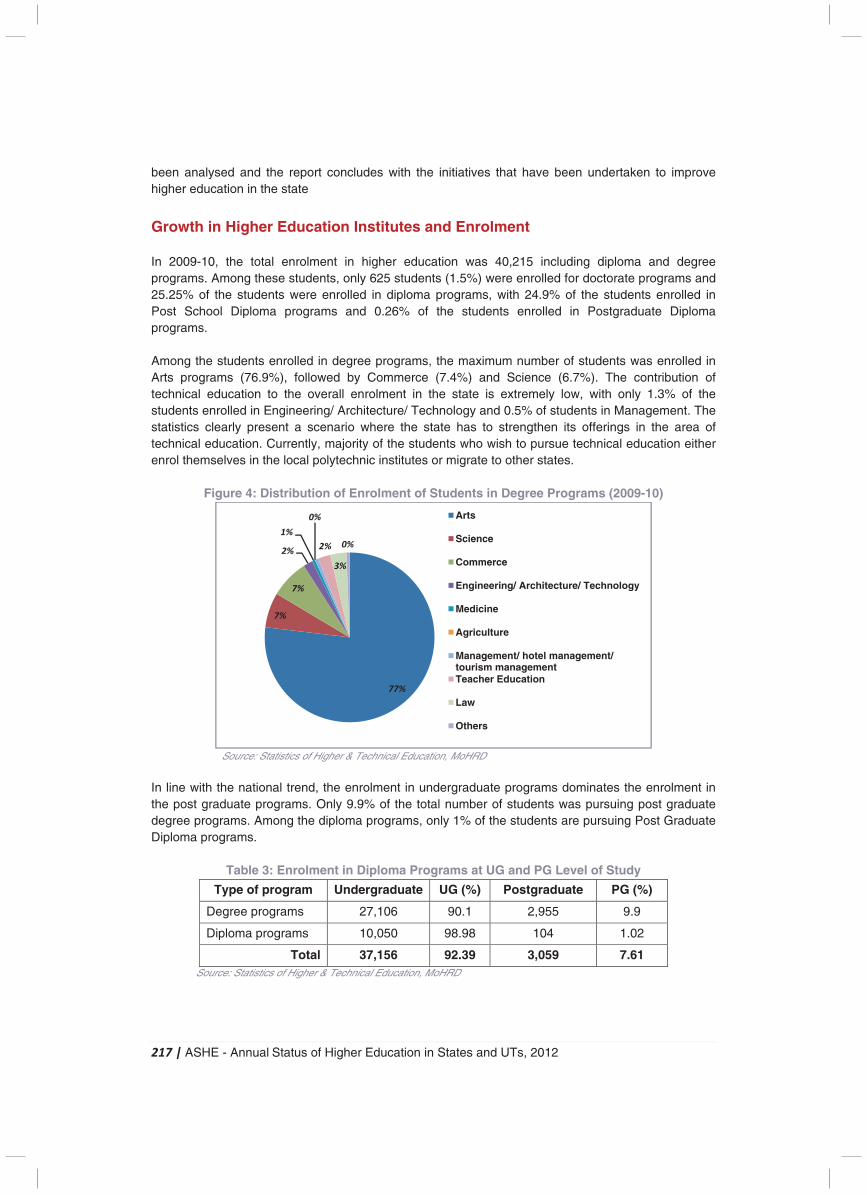
217 | ASHE - Annual Status of Higher Education in States and UTs, 2012
been analysed and the report concludes with the initiatives that have been undertaken to improve higher education in the state
Growth in Higher Education Institutes and Enrolment In 2009-10, the total enrolment in higher education was 40,215 including diploma and degree programs. Among these students, only 625 students (1.5%) were enrolled for doctorate programs and 25.25% of the students were enrolled in diploma programs, with 24.9% of the students enrolled in Post School Diploma programs and 0.26% of the students enrolled in Postgraduate Diploma programs. Among the students enrolled in degree programs, the maximum number of students was enrolled in Arts programs (76.9%), followed by Commerce (7.4%) and Science (6.7%). The contribution of technical education to the overall enrolment in the state is extremely low, with only 1.3% of the students enrolled in Engineering/ Architecture/ Technology and 0.5% of students in Management. The statistics clearly present a scenario where the state has to strengthen its offerings in the area of technical education. Currently, majority of the students who wish to pursue technical education either enrol themselves in the local polytechnic institutes or migrate to other states.
Figure 4: Distribution of Enrolment of Students in Degree Programs (2009-10)
Source: Statistics of Higher & Technical Education, MoHRD
In line with the national trend, the enrolment in undergraduate programs dominates the enrolment in the post graduate programs. Only 9.9% of the total number of students was pursuing post graduate degree programs. Among the diploma programs, only 1% of the students are pursuing Post Graduate Diploma programs.
Table 3: Enrolment in Diploma Programs at UG and PG Level of Study
Type of program Undergraduate UG (%) Postgraduate PG (%)
Degree programs 27,106 90.1 2,955 9.9
Diploma programs 10,050 98.98 104 1.02
Total 37,156 92.39 3,059 7.61 Source: Statistics of Higher & Technical Education, MoHRD
77%
7%
7%
2%
1%
0%
2%
3%
0%
Arts
Science
Commerce
Engineering/ Architecture/ Technology
Medicine
Agriculture
Management/ hotel management/ tourism managementTeacher Education
Law
Others
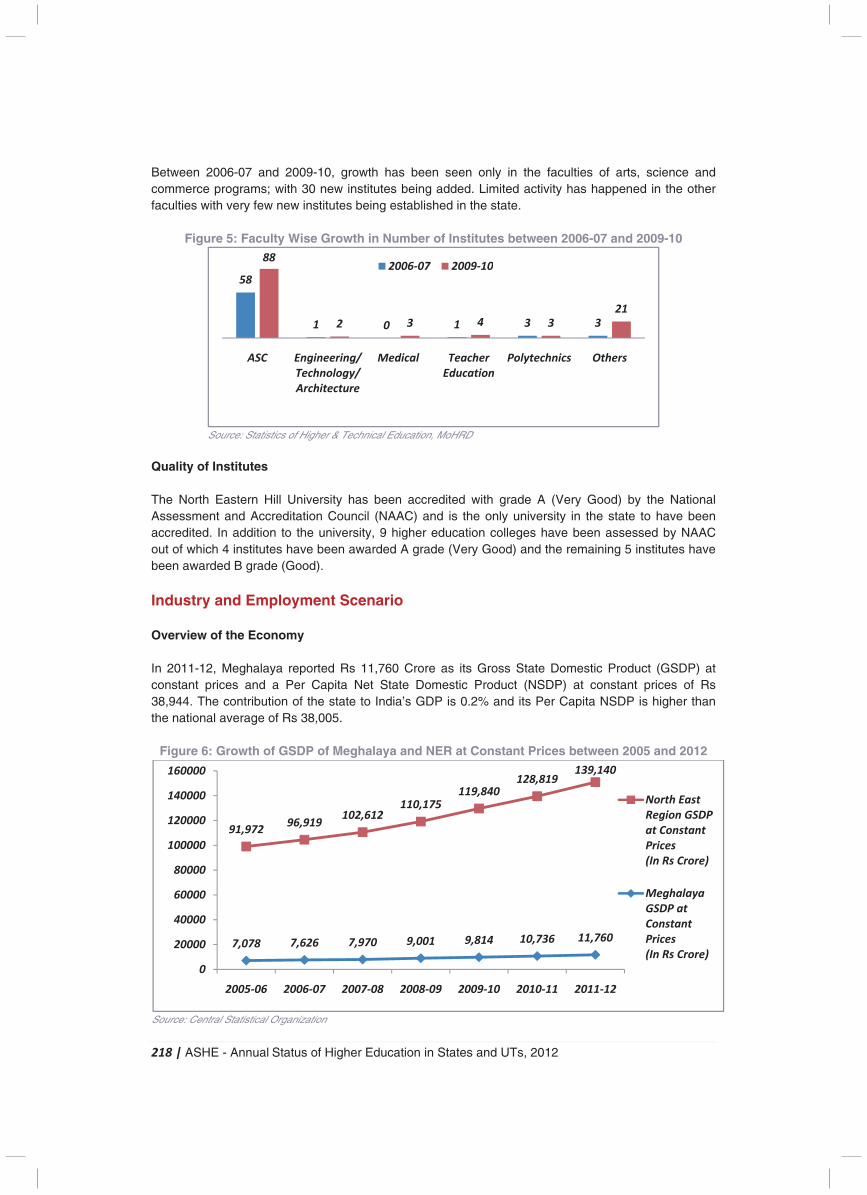
218 | ASHE - Annual Status of Higher Education in States and UTs, 2012
Between 2006-07 and 2009-10, growth has been seen only in the faculties of arts, science and commerce programs; with 30 new institutes being added. Limited activity has happened in the other faculties with very few new institutes being established in the state.
Figure 5: Faculty Wise Growth in Number of Institutes between 2006-07 and 2009-10
Source: Statistics of Higher & Technical Education, MoHRD
Quality of Institutes The North Eastern Hill University has been accredited with grade A (Very Good) by the National Assessment and Accreditation Council (NAAC) and is the only university in the state to have been accredited. In addition to the university, 9 higher education colleges have been assessed by NAAC out of which 4 institutes have been awarded A grade (Very Good) and the remaining 5 institutes have been awarded B grade (Good).
Industry and Employment Scenario Overview of the Economy In 2011-12, Meghalaya reported Rs 11,760 Crore as its Gross State Domestic Product (GSDP) at constant prices and a Per Capita Net State Domestic Product (NSDP) at constant prices of Rs 38,944. The contribution of the state to India’s GDP is 0.2% and its Per Capita NSDP is higher than the national average of Rs 38,005.
Figure 6: Growth of GSDP of Meghalaya and NER at Constant Prices between 2005 and 2012
Source: Central Statistical Organization
7 Year CAGR 8.85%
7 Year CAGR 7.16%
58
1 0 1 3 3
88
2 3 4 321
ASC Engineering/
Technology/
Architecture
Medical Teacher
Education
Polytechnics Others
2006-07 2009-10
7,078 7,626 7,970 9,001 9,814 10,736 11,760
91,97296,919
102,612110,175
119,840128,819
139,140
0
20000
40000
60000
80000
100000
120000
140000
160000
2005-06 2006-07 2007-08 2008-09 2009-10 2010-11 2011-12
North East
Region GSDP
at Constant
Prices
(In Rs Crore)
Meghalaya
GSDP at
Constant
Prices
(In Rs Crore)
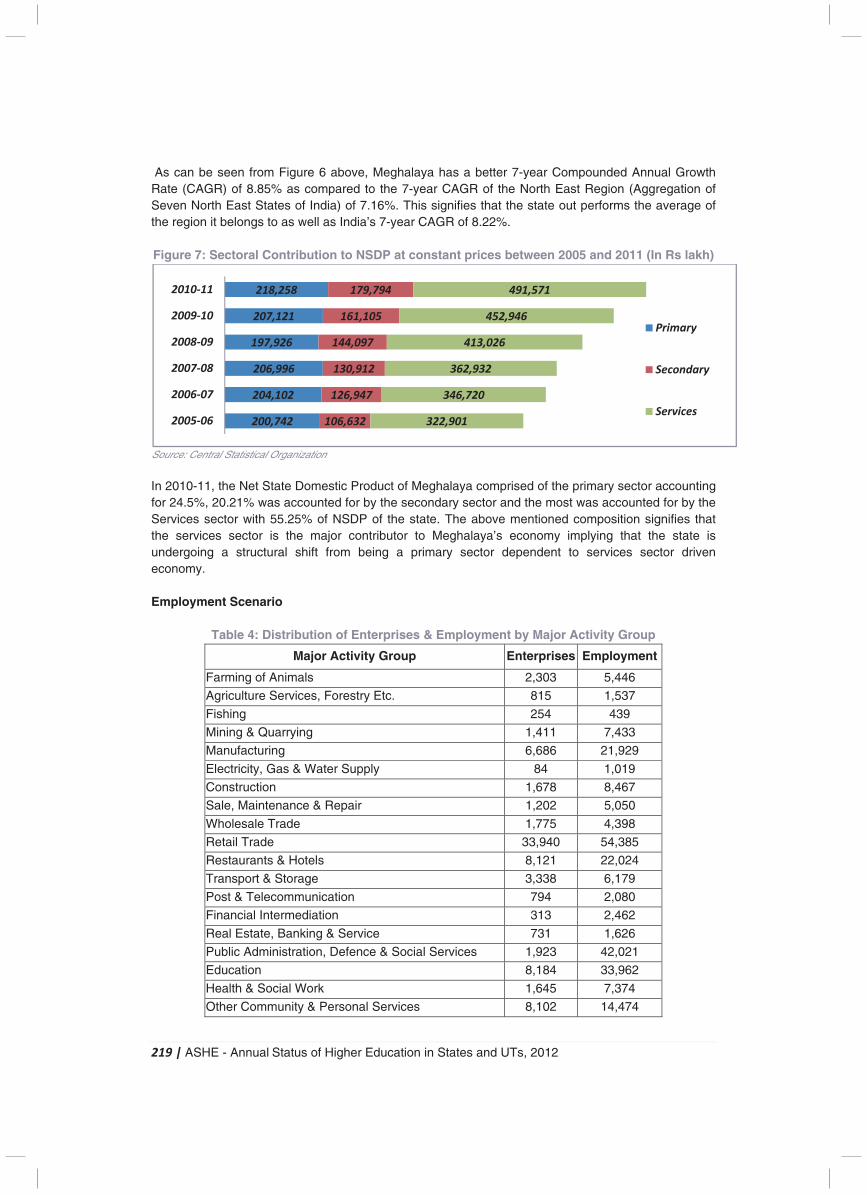
219 | ASHE - Annual Status of Higher Education in States and UTs, 2012
As can be seen from Figure 6 above, Meghalaya has a better 7-year Compounded Annual Growth Rate (CAGR) of 8.85% as compared to the 7-year CAGR of the North East Region (Aggregation of Seven North East States of India) of 7.16%. This signifies that the state out performs the average of the region it belongs to as well as India’s 7-year CAGR of 8.22%. Figure 7: Sectoral Contribution to NSDP at constant prices between 2005 and 2011 (In Rs lakh)
Source: Central Statistical Organization In 2010-11, the Net State Domestic Product of Meghalaya comprised of the primary sector accounting for 24.5%, 20.21% was accounted for by the secondary sector and the most was accounted for by the Services sector with 55.25% of NSDP of the state. The above mentioned composition signifies that the services sector is the major contributor to Meghalaya’s economy implying that the state is undergoing a structural shift from being a primary sector dependent to services sector driven economy. Employment Scenario
Table 4: Distribution of Enterprises & Employment by Major Activity Group
Major Activity Group Enterprises Employment
Farming of Animals 2,303 5,446
Agriculture Services, Forestry Etc. 815 1,537
Fishing 254 439
Mining & Quarrying 1,411 7,433
Manufacturing 6,686 21,929
Electricity, Gas & Water Supply 84 1,019
Construction 1,678 8,467
Sale, Maintenance & Repair 1,202 5,050
Wholesale Trade 1,775 4,398
Retail Trade 33,940 54,385
Restaurants & Hotels 8,121 22,024
Transport & Storage 3,338 6,179
Post & Telecommunication 794 2,080
Financial Intermediation 313 2,462
Real Estate, Banking & Service 731 1,626
Public Administration, Defence & Social Services 1,923 42,021
Education 8,184 33,962
Health & Social Work 1,645 7,374
Other Community & Personal Services 8,102 14,474
200,742
204,102
206,996
197,926
207,121
218,258
106,632
126,947
130,912
144,097
161,105
179,794
322,901
346,720
362,932
413,026
452,946
491,571
2005-06
2006-07
2007-08
2008-09
2009-10
2010-11
Primary
Secondary
Services
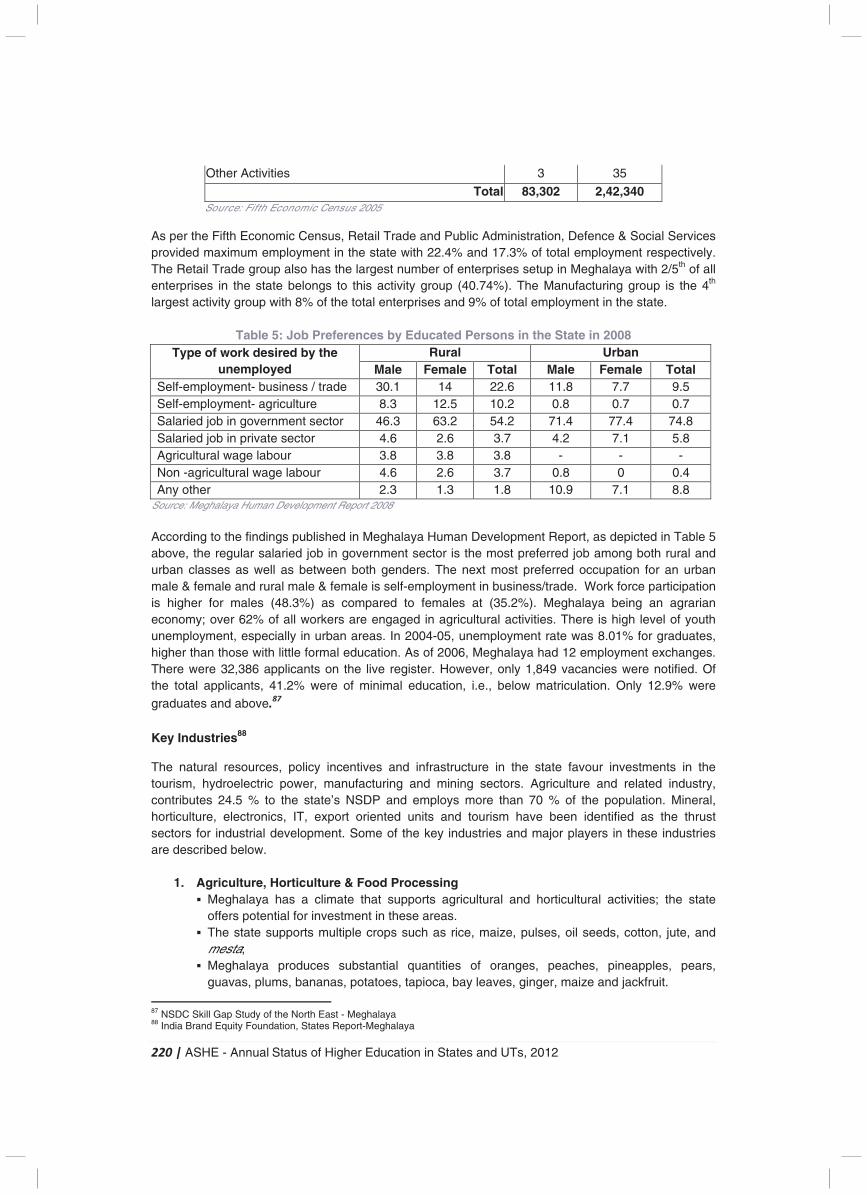
220 | ASHE - Annual Status of Higher Education in States and UTs, 2012
Other Activities 3 35
Total 83,302 2,42,340 Source: Fifth Economic Census 2005
As per the Fifth Economic Census, Retail Trade and Public Administration, Defence & Social Services provided maximum employment in the state with 22.4% and 17.3% of total employment respectively. The Retail Trade group also has the largest number of enterprises setup in Meghalaya with 2/5th of all enterprises in the state belongs to this activity group (40.74%). The Manufacturing group is the 4th largest activity group with 8% of the total enterprises and 9% of total employment in the state.
Table 5: Job Preferences by Educated Persons in the State in 2008 Type of work desired by the
unemployed Rural Urban
Male Female Total Male Female Total Self-employment- business / trade 30.1 14 22.6 11.8 7.7 9.5 Self-employment- agriculture 8.3 12.5 10.2 0.8 0.7 0.7 Salaried job in government sector 46.3 63.2 54.2 71.4 77.4 74.8 Salaried job in private sector 4.6 2.6 3.7 4.2 7.1 5.8 Agricultural wage labour 3.8 3.8 3.8 - - - Non -agricultural wage labour 4.6 2.6 3.7 0.8 0 0.4 Any other 2.3 1.3 1.8 10.9 7.1 8.8
Source: Meghalaya Human Development Report 2008 According to the findings published in Meghalaya Human Development Report, as depicted in Table 5 above, the regular salaried job in government sector is the most preferred job among both rural and urban classes as well as between both genders. The next most preferred occupation for an urban male & female and rural male & female is self-employment in business/trade. Work force participation is higher for males (48.3%) as compared to females at (35.2%). Meghalaya being an agrarian economy; over 62% of all workers are engaged in agricultural activities. There is high level of youth unemployment, especially in urban areas. In 2004-05, unemployment rate was 8.01% for graduates, higher than those with little formal education. As of 2006, Meghalaya had 12 employment exchanges. There were 32,386 applicants on the live register. However, only 1,849 vacancies were notified. Of the total applicants, 41.2% were of minimal education, i.e., below matriculation. Only 12.9% were graduates and above.
87 Key Industries88
The natural resources, policy incentives and infrastructure in the state favour investments in the tourism, hydroelectric power, manufacturing and mining sectors. Agriculture and related industry, contributes 24.5 % to the state’s NSDP and employs more than 70 % of the population. Mineral, horticulture, electronics, IT, export oriented units and tourism have been identified as the thrust sectors for industrial development. Some of the key industries and major players in these industries are described below.
1. Agriculture, Horticulture & Food Processing � Meghalaya has a climate that supports agricultural and horticultural activities; the state
offers potential for investment in these areas. � The state supports multiple crops such as rice, maize, pulses, oil seeds, cotton, jute, and
mesta; � Meghalaya produces substantial quantities of oranges, peaches, pineapples, pears,
guavas, plums, bananas, potatoes, tapioca, bay leaves, ginger, maize and jackfruit.
87 NSDC Skill Gap Study of the North East - Meghalaya 88 India Brand Equity Foundation, States Report-Meghalaya
221 | ASHE - Annual Status of Higher Education in States and UTs, 2012
2. Minerals, Mining & Cement
� Meghalaya has rich mineral resources such as coal, limestone, fire clay, lithographic clay, china clay, phosphate rocks, sillimanite, granite, and substantial reserves of quartz, feldspar, gypsum and uranium.
� The mining industry has just opened up in Meghalaya; most of the coal and stones are being exported to Bangladesh.
� A number of cement factories are being either planned or being set up, owing to the rich mineral content of the state.
� Coal and Limestone mining is one of the key industries in the state. Cement industry attracts the largest investments in the state with presence of big players like Lafarge, Star cements.
3. Tourism � Meghalaya is richly endowed with flora, fauna, thick forests, ancient forest groves, large
rivers and grass fields –making it an attractive tourism destination.
4. Hydroelectric Power � It is estimated that Meghalaya has a hydroelectric power capacity of 3,000 MW, of which
only 187 MW has been developed so far. � The state government is inviting investments in this area through the PPP mode.
Independent power producers (IPP) are also being invited to develop hydro projects in Meghalaya.
5. Handloom and Handicrafts
� Meghalaya has an established tradition of high-quality weaving, with more than 25,000 households engaged in handloom weaving.
� There are 8 production centres, 32 demonstration-cum-production centres, 10 weaving training centres and a state-level handloom training institute in the state.
� With support from National Institute of Design (NID) and National Institute of Fashion Technology (NIFT), the Meghalaya Government is developing the handloom industry.
6. Information Technology (IT) Sector
� The IT policy of Meghalaya defines the IT penetration plan for various industries and public sector organizations. The policy also provides various incentives and concessions for investments in IT sector.
� With a high literacy rate, affordable cost, substantial English-speaking population, improved telecommunication connectivity and favorable climate, Meghalaya is well poised to serve the IT industry.
Key Challenges and Current Initiatives
The state of Meghalaya faces several challenges in its endeavor to improve the higher education system due to the location of the state and the resultant infrastructural challenges. Some of the key challenges that are faced by the state are as given below:
1. Poor capacity in teacher education: Teacher training has been a major concern for the education department, particularly at the elementary level. Challenges are being faced by the state both in terms of quality and quantity.
222 | ASHE - Annual Status of Higher Education in States and UTs, 2012
2. Need for academic and governance reforms: There is an urgent need for the state to undertake academic and governance reforms in the higher education system. Measures and interventions are required for the development and consolidation of the existing institutions.
3. Mismatch in availability of skilled manpower: Vocalization of education is too focused on to enhance the individual employability, to reduce the mismatch between the demand and supply for skilled manpower and provide an alternative for those pursuing higher education, thus providing a platform for the diversification of higher education.
4. Migration of students to other states: A common concern across all northeastern states is that students wishing to pursue higher education are migrating to other states in large numbers. It thus becomes imminent to further improve the quality of higher education infrastructure in the state to prevent the mass exodus and to retain the local talent.
To combat the challenges faced by the state, several strategies have been planned by the state government for implementation under the 12th Five Year Plan. The key strategies have been mentioned below:
� Up gradation of Shillong Polytechnic to a degree level institutions/ engineering college during the 12th Five Year Plan. Setting up on a National Institute of Technology in Shillong.
� Establishment of State Technical University to cater to the specific needs of professional, technical and vocational education.
� Greater emphasis on women education, physically handicapped students and colleges of remote and backward districts so as to bring the backward districts at par with the advanced districts.
� Provisions of support to prominent colleges in the state to offer courses which are non-traditional in nature such as fishery science, mass media etc. These courses are designed to cater to students who wish to take advantage of the local employment opportunities.
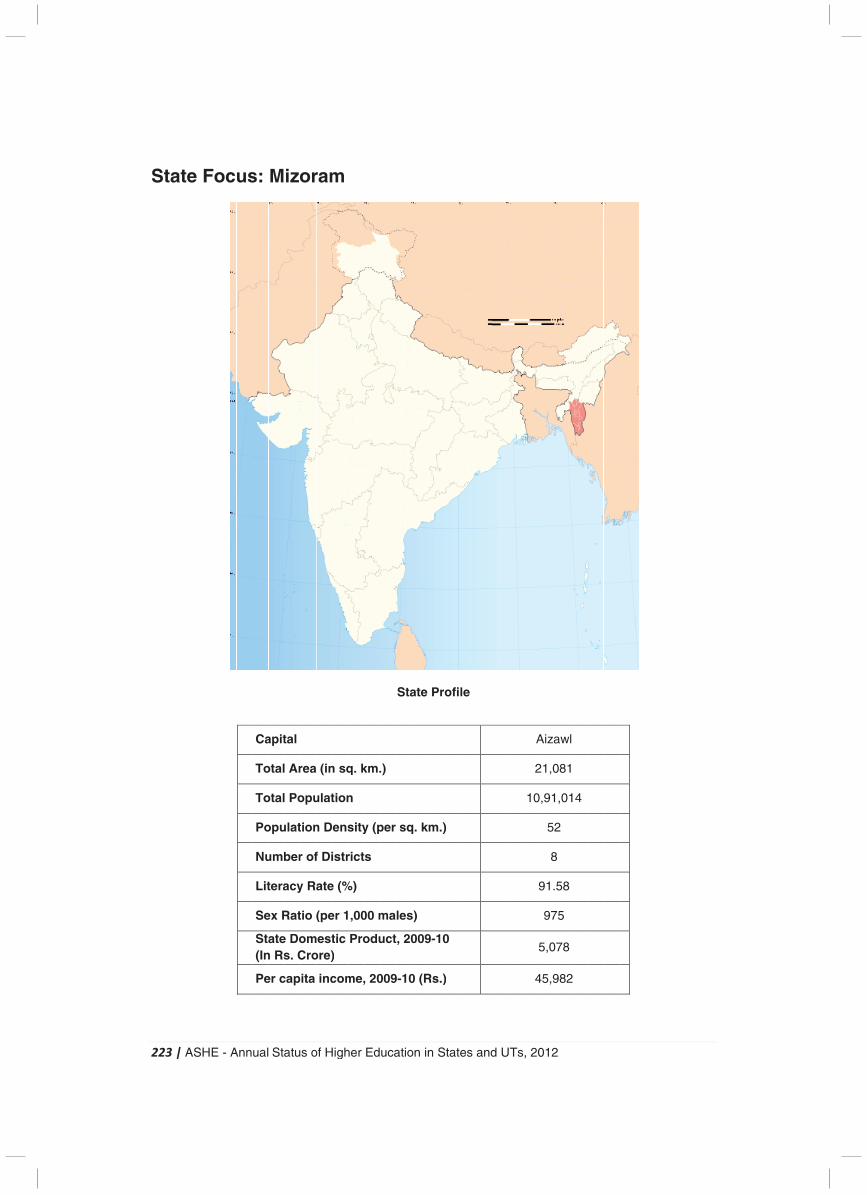
2
S
223
Sta
| A
ate
ASH
e F
HE
Fo
- A
oc
Ann
us
ual
s:
Ca
To
To
Po
Nu
Lit
Se
Sta(In
Pe
Sta
M
apit
otal
otal
opu
umb
tera
ex R
aten Rs
er c
atu
izo
tal
Ar
Po
ulat
ber
acy
Rat
e Dos. C
cap
s o
or
rea
opu
tion
r of
y Ra
tio (
omCro
ita
of H
ram
(in
ulat
n D
f Di
ate
(pe
mestore)
inc
High
m
n sq
tion
ens
istr
e (%
er 1
tic )
com
her
q. k
n
sity
rict
%)
,00
Pro
me,
Ed
km.
y (p
s
00 m
odu
, 20
uca
.)
per
ma
uct
009
atio
Sta
sq
les
, 20
9-10
on in
ate
q. k
s)
009
0 (R
n S
Pr
m.)
9-10
Rs.)
Stat
ofi
)
0
)
es
le
and
d U
UTs
, 20
A
2
10
9
5
4
012
Aiza
21,0
,91
52
8
91.
97
5,0
45,9
2
awl
081
,01
2
8
58
75
78
982
14
2
224 | ASHE - Annual Status of Higher Education in States and UTs, 2012
Introduction
Mizoram is located in the north-eastern region of the country and is one of the 7 sister states of the northeast. Mizoram is the land of the hill people, and the state shares its border with Assam to its north, Tripura to its northwest, Manipur to its northeast and Bangladesh and Myanmar to its east. The state is relatively new with the state being the 23rd state of the country, established in the year 1987.Mizoram is a land of rolling hills, valleys, rivers and lakes. There are 21 major hill ranges or peaks of different heights throughout the span of the state, with plains scattered amongst these hills. The state is covered with lush forests and thick bamboo groves, vibrant wildlife, unique landmarks of innumerable folklores and scenic villages of houses built on stilts. Mizoram is one of the few states in India to have a literacy ratio of more than 90%. Higher education establishments have come up in the state at a rapid pace. Although most institutions are state run and primarily central & state funded, private sector institutions have also taken up educational initiatives in the state.
Universities and University Level Institutes
1 central university and 1 private university characterize the higher education landscape of Mizoram. In addition to these two universities, there is 1 Institute of National Importance located in the state. The only private university in the state is the Institute of Chartered Financial Analysts of India (ICFAI) University. The number of higher education institutes of the state constitutes a minute proportion of the total number of higher education institutes in the country. However, the state still manages to impart quality education to its citizens. This is reflected in the fact that Mizoram has the highest expenditure per capita in higher education amongst all the north-eastern states.
Table 1: Distribution of Universities & University Level Institutions at State & National Level
Type of University Mizoram (2011-12)
India (2011-12)
State University 0 285
Private University 1 112
Institution of National Importance 1 39
Deemed University 0 129
Central University 1 40
Total 3 605
Source: UGC
Mizoram has 1 central university located in the state capital of Aizawl. The university was established in the year 2001under the Mizoram University Act, 2000, as a Central University of India. The central university of Mizoram affiliates 28 undergraduate colleges, 2 professional institutions and has 1 constituent college. Pachhunga University College is the one and only constituent college of the university. The objectives of the university are to "to disseminate and advance knowledge, to make provisions for integrated courses in humanities, natural and physical sciences, social sciences, forestry and other allied disciplines, to take measures for promoting innovations in teaching-disciplinary studies and research; to educate and train man-power in the development of the state of Mizoram; and to pay special attention to the improvement of the social and economic conditions and welfare of the people
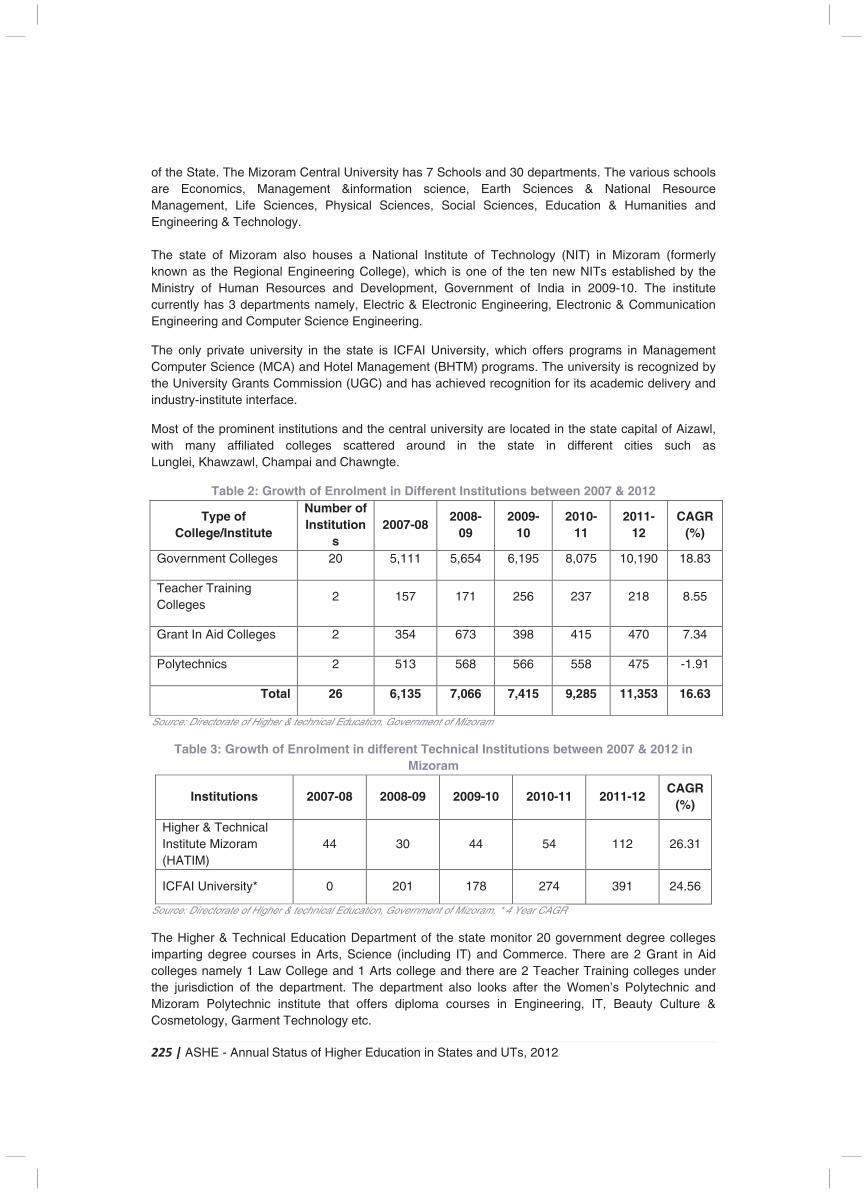
225 | ASHE - Annual Status of Higher Education in States and UTs, 2012
of the State. The Mizoram Central University has 7 Schools and 30 departments. The various schools are Economics, Management &information science, Earth Sciences & National Resource Management, Life Sciences, Physical Sciences, Social Sciences, Education & Humanities and Engineering & Technology. The state of Mizoram also houses a National Institute of Technology (NIT) in Mizoram (formerly known as the Regional Engineering College), which is one of the ten new NITs established by the Ministry of Human Resources and Development, Government of India in 2009-10. The institute currently has 3 departments namely, Electric & Electronic Engineering, Electronic & Communication Engineering and Computer Science Engineering.
The only private university in the state is ICFAI University, which offers programs in Management Computer Science (MCA) and Hotel Management (BHTM) programs. The university is recognized by the University Grants Commission (UGC) and has achieved recognition for its academic delivery and industry-institute interface.
Most of the prominent institutions and the central university are located in the state capital of Aizawl, with many affiliated colleges scattered around in the state in different cities such as Lunglei, Khawzawl, Champai and Chawngte.
Table 2: Growth of Enrolment in Different Institutions between 2007 & 2012
Type of College/Institute
Number of Institution
s 2007-08
2008-09
2009-10
2010-11
2011-12
CAGR (%)
Government Colleges 20 5,111 5,654 6,195 8,075 10,190 18.83
Teacher Training Colleges
2 157 171 256 237 218 8.55
Grant In Aid Colleges 2 354 673 398 415 470 7.34
Polytechnics 2 513 568 566 558 475 -1.91
Total 26 6,135 7,066 7,415 9,285 11,353 16.63
Source: Directorate of Higher & technical Education, Government of Mizoram
Table 3: Growth of Enrolment in different Technical Institutions between 2007 & 2012 in Mizoram
Institutions 2007-08 2008-09 2009-10 2010-11 2011-12 CAGR
(%)
Higher & Technical Institute Mizoram (HATIM)
44 30 44 54 112 26.31
ICFAI University* 0 201 178 274 391 24.56
Source: Directorate of Higher & technical Education, Government of Mizoram, * 4 Year CAGR
The Higher & Technical Education Department of the state monitor 20 government degree colleges imparting degree courses in Arts, Science (including IT) and Commerce. There are 2 Grant in Aid colleges namely 1 Law College and 1 Arts college and there are 2 Teacher Training colleges under the jurisdiction of the department. The department also looks after the Women’s Polytechnic and Mizoram Polytechnic institute that offers diploma courses in Engineering, IT, Beauty Culture & Cosmetology, Garment Technology etc.
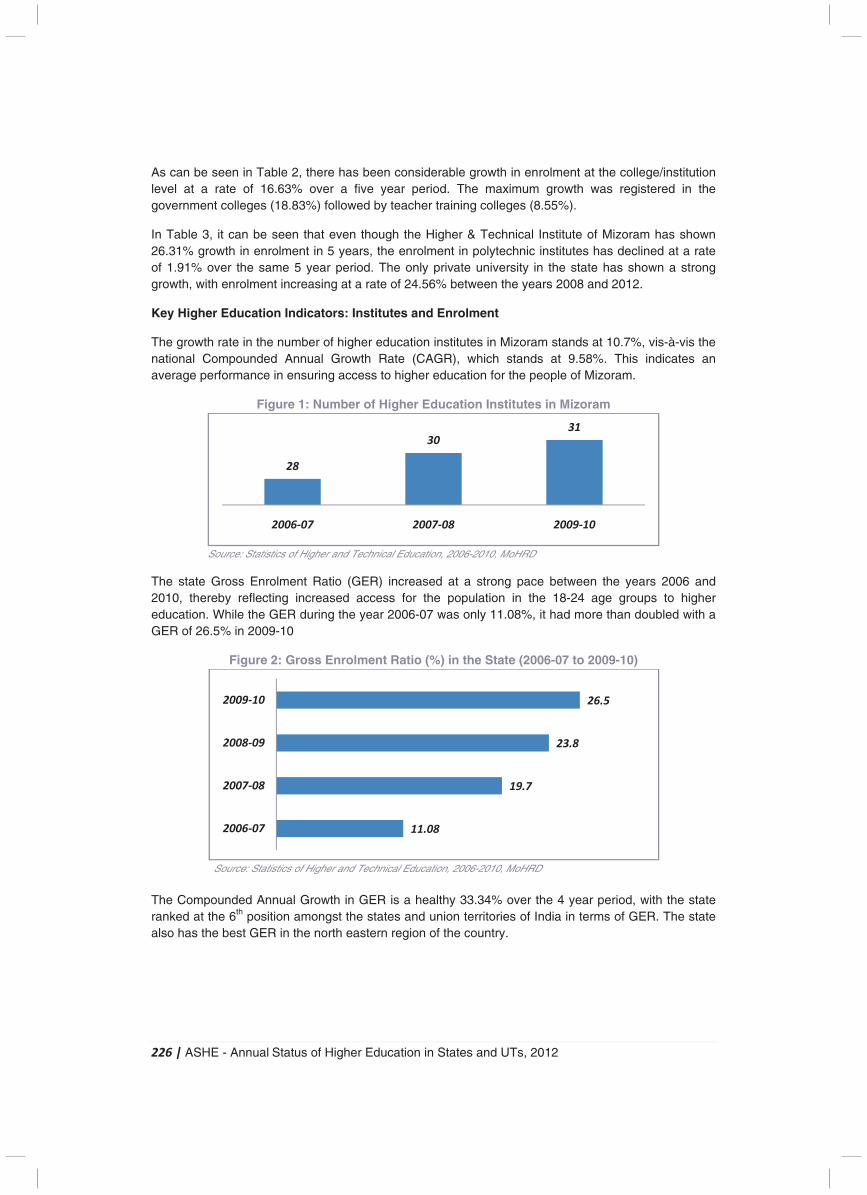
226 | ASHE - Annual Status of Higher Education in States and UTs, 2012
As can be seen in Table 2, there has been considerable growth in enrolment at the college/institution level at a rate of 16.63% over a five year period. The maximum growth was registered in the government colleges (18.83%) followed by teacher training colleges (8.55%).
In Table 3, it can be seen that even though the Higher & Technical Institute of Mizoram has shown 26.31% growth in enrolment in 5 years, the enrolment in polytechnic institutes has declined at a rate of 1.91% over the same 5 year period. The only private university in the state has shown a strong growth, with enrolment increasing at a rate of 24.56% between the years 2008 and 2012.
Key Higher Education Indicators: Institutes and Enrolment
The growth rate in the number of higher education institutes in Mizoram stands at 10.7%, vis-à-vis the national Compounded Annual Growth Rate (CAGR), which stands at 9.58%. This indicates an average performance in ensuring access to higher education for the people of Mizoram.
Figure 1: Number of Higher Education Institutes in Mizoram
Source: Statistics of Higher and Technical Education, 2006-2010, MoHRD
The state Gross Enrolment Ratio (GER) increased at a strong pace between the years 2006 and 2010, thereby reflecting increased access for the population in the 18-24 age groups to higher education. While the GER during the year 2006-07 was only 11.08%, it had more than doubled with a GER of 26.5% in 2009-10
Figure 2: Gross Enrolment Ratio (%) in the State (2006-07 to 2009-10)
Source: Statistics of Higher and Technical Education, 2006-2010, MoHRD
The Compounded Annual Growth in GER is a healthy 33.34% over the 4 year period, with the state ranked at the 6th position amongst the states and union territories of India in terms of GER. The state also has the best GER in the north eastern region of the country.
28
3031
2006-07 2007-08 2009-10
11.08
19.7
23.8
26.5
2006-07
2007-08
2008-09
2009-10

227 | ASHE - Annual Status of Higher Education in States and UTs, 2012
Figure 3: Gross Enrolment Ratio (%) across all States in India (2009-10)
Source: Statistics of Higher and Technical Education, 2009-10, MoHRD
The following sections present a brief description of the current higher education scenario and industry & employment scenario in the state of Mizoram. The key initiatives and challenges in higher education that are being faced by the state are also briefly discussed.
2.3
4.4
5.3
9
9.4
9.6
10.8
10.9
11
11.3
11.4
11.9
13.1
14.8
14.9
15
15.4
15.9
16.1
16.9
18.1
18.2
19
19.1
20
21.4
23.9
24.8
26.2
26.5
28
28.3
29.1
36
47.9
Daman & Diu
D&N Haveli
Lakshadweep
Assam
Jharkhand
Rajasthan
Punjab
Uttar Pradesh
Bihar
Orissa
Tripura
West Bengal
Kerala
Manipur
Madhya Pradesh
Arunachal Pradesh
Meghalaya
Gujarat
Nagaland
Andhra Pradesh
Karnataka
Jammu & Kashmir
Tamil Nadu
Haryana
Chhatisgarh
Maharashtra
Himachal Pradesh
Sikkim
A&N Islands
Mizoram
Chandigarh
Goa
Pondicherry
Uttaranchal
Delhi
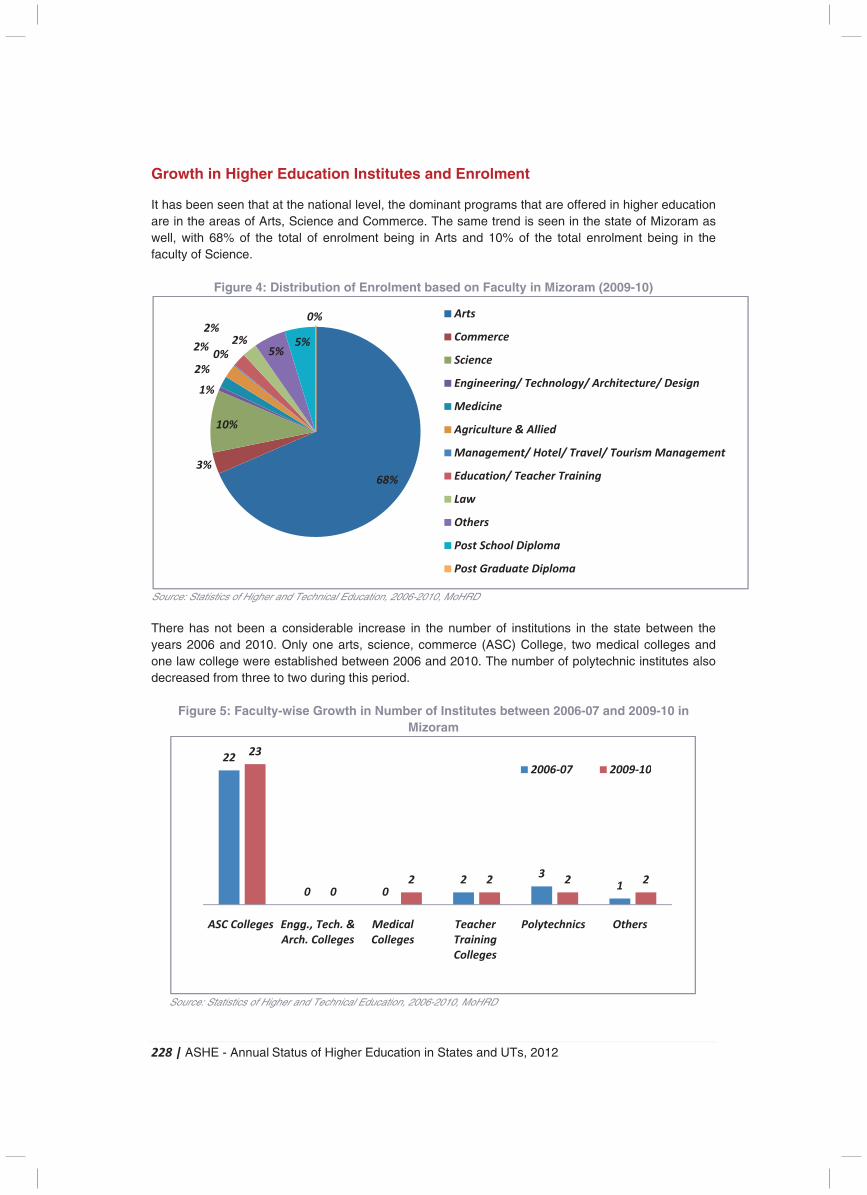
228 | ASHE - Annual Status of Higher Education in States and UTs, 2012
Growth in Higher Education Institutes and Enrolment
It has been seen that at the national level, the dominant programs that are offered in higher education are in the areas of Arts, Science and Commerce. The same trend is seen in the state of Mizoram as well, with 68% of the total of enrolment being in Arts and 10% of the total enrolment being in the faculty of Science.
Figure 4: Distribution of Enrolment based on Faculty in Mizoram (2009-10)
Source: Statistics of Higher and Technical Education, 2006-2010, MoHRD There has not been a considerable increase in the number of institutions in the state between the years 2006 and 2010. Only one arts, science, commerce (ASC) College, two medical colleges and one law college were established between 2006 and 2010. The number of polytechnic institutes also decreased from three to two during this period.
Figure 5: Faculty-wise Growth in Number of Institutes between 2006-07 and 2009-10 in
Mizoram
Source: Statistics of Higher and Technical Education, 2006-2010, MoHRD
68%
3%
10%
1%
2%
2%0%
2%2%
5%5%
0% Arts
Commerce
Science
Engineering/ Technology/ Architecture/ Design
Medicine
Agriculture & Allied
Management/ Hotel/ Travel/ Tourism Management
Education/ Teacher Training
Law
Others
Post School Diploma
Post Graduate Diploma
22
0 0 2
3 1
23
0 2 2 2 2
ASC Colleges Engg., Tech. &
Arch. Colleges
Medical
Colleges
Teacher
Training
Colleges
Polytechnics Others
2006-07 2009-10
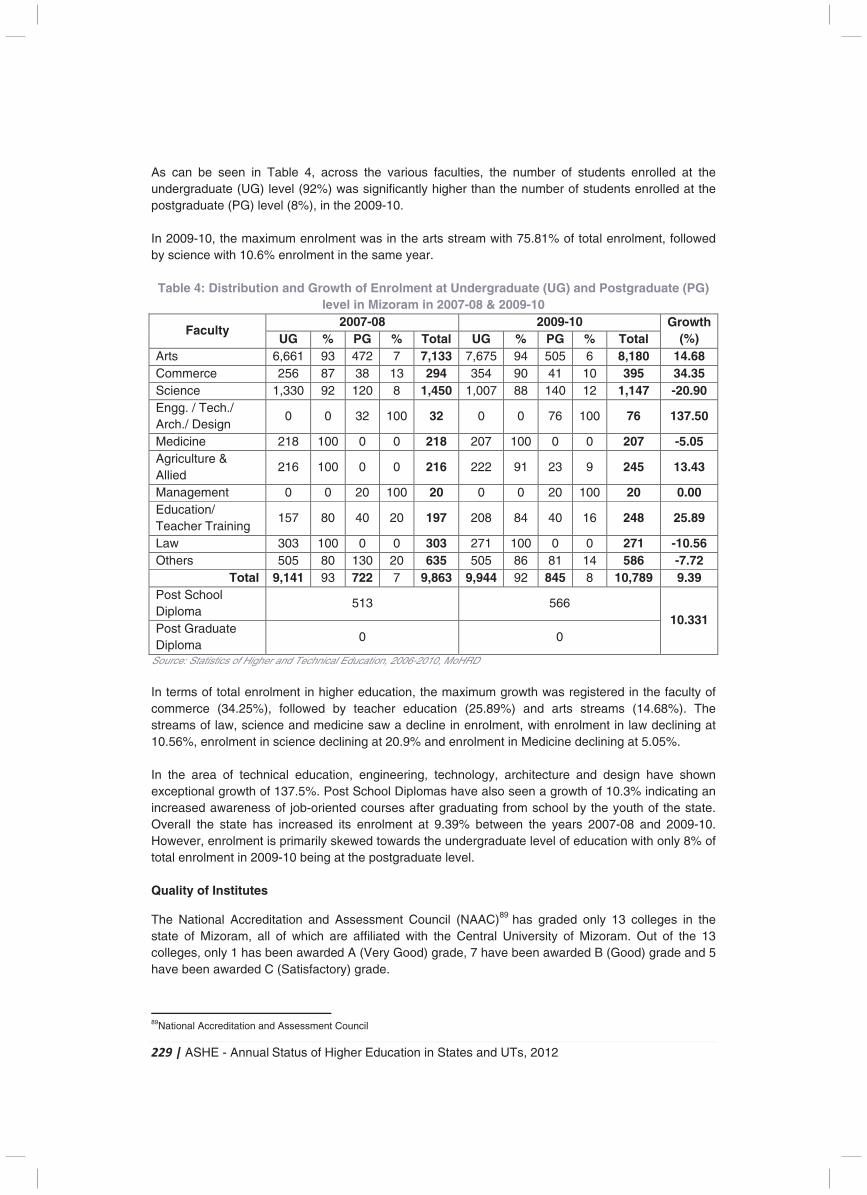
229 | ASHE - Annual Status of Higher Education in States and UTs, 2012
As can be seen in Table 4, across the various faculties, the number of students enrolled at the undergraduate (UG) level (92%) was significantly higher than the number of students enrolled at the postgraduate (PG) level (8%), in the 2009-10. In 2009-10, the maximum enrolment was in the arts stream with 75.81% of total enrolment, followed by science with 10.6% enrolment in the same year. Table 4: Distribution and Growth of Enrolment at Undergraduate (UG) and Postgraduate (PG)
level in Mizoram in 2007-08 & 2009-10
Faculty 2007-08 2009-10 Growth
(%) UG % PG % Total UG % PG % Total Arts 6,661 93 472 7 7,133 7,675 94 505 6 8,180 14.68 Commerce 256 87 38 13 294 354 90 41 10 395 34.35 Science 1,330 92 120 8 1,450 1,007 88 140 12 1,147 -20.90 Engg. / Tech./ Arch./ Design
0 0 32 100 32 0 0 76 100 76 137.50
Medicine 218 100 0 0 218 207 100 0 0 207 -5.05 Agriculture & Allied
216 100 0 0 216 222 91 23 9 245 13.43
Management 0 0 20 100 20 0 0 20 100 20 0.00 Education/ Teacher Training
157 80 40 20 197 208 84 40 16 248 25.89
Law 303 100 0 0 303 271 100 0 0 271 -10.56 Others 505 80 130 20 635 505 86 81 14 586 -7.72
Total 9,141 93 722 7 9,863 9,944 92 845 8 10,789 9.39 Post School Diploma
513 566 10.331
Post Graduate Diploma
0 0
Source: Statistics of Higher and Technical Education, 2006-2010, MoHRD In terms of total enrolment in higher education, the maximum growth was registered in the faculty of commerce (34.25%), followed by teacher education (25.89%) and arts streams (14.68%). The streams of law, science and medicine saw a decline in enrolment, with enrolment in law declining at 10.56%, enrolment in science declining at 20.9% and enrolment in Medicine declining at 5.05%. In the area of technical education, engineering, technology, architecture and design have shown exceptional growth of 137.5%. Post School Diplomas have also seen a growth of 10.3% indicating an increased awareness of job-oriented courses after graduating from school by the youth of the state. Overall the state has increased its enrolment at 9.39% between the years 2007-08 and 2009-10. However, enrolment is primarily skewed towards the undergraduate level of education with only 8% of total enrolment in 2009-10 being at the postgraduate level. Quality of Institutes
The National Accreditation and Assessment Council (NAAC)89 has graded only 13 colleges in the state of Mizoram, all of which are affiliated with the Central University of Mizoram. Out of the 13 colleges, only 1 has been awarded A (Very Good) grade, 7 have been awarded B (Good) grade and 5 have been awarded C (Satisfactory) grade.
89National Accreditation and Assessment Council
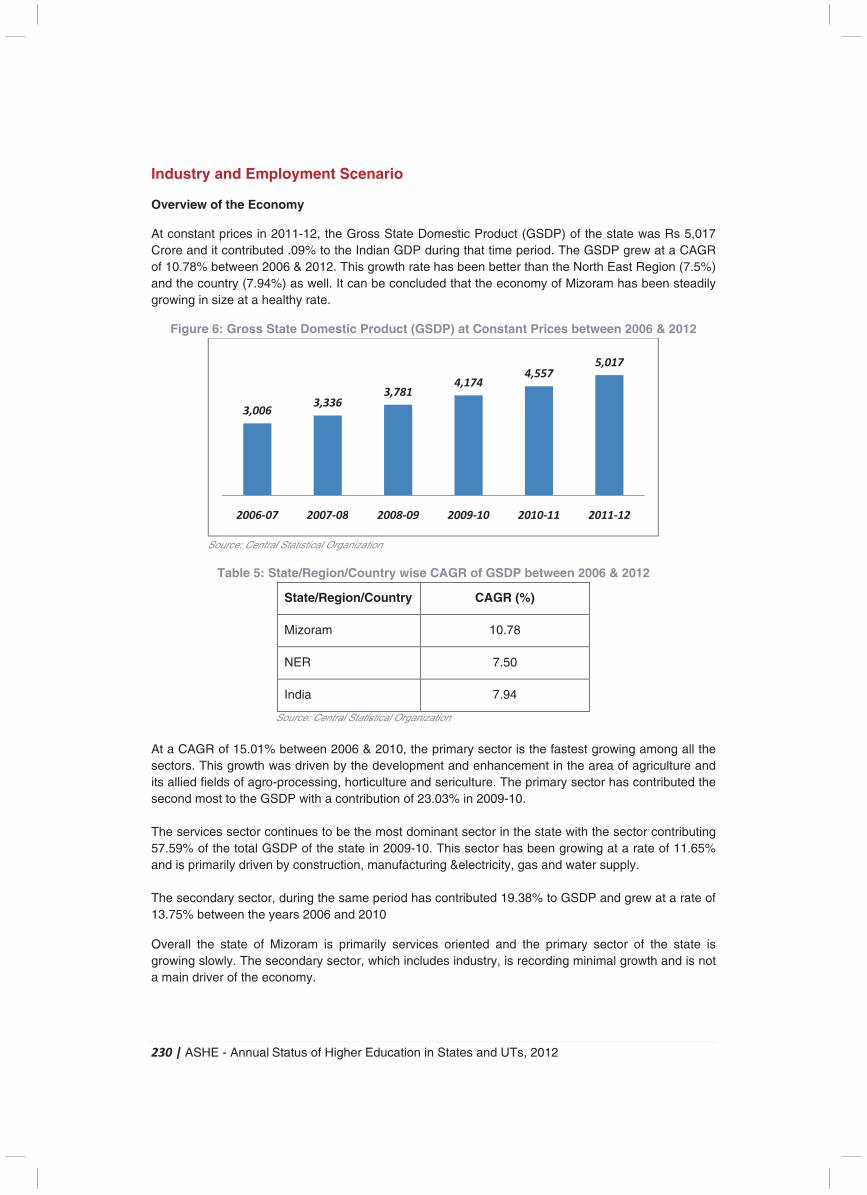
230 | ASHE - Annual Status of Higher Education in States and UTs, 2012
Industry and Employment Scenario
Overview of the Economy
At constant prices in 2011-12, the Gross State Domestic Product (GSDP) of the state was Rs 5,017 Crore and it contributed .09% to the Indian GDP during that time period. The GSDP grew at a CAGR of 10.78% between 2006 & 2012. This growth rate has been better than the North East Region (7.5%) and the country (7.94%) as well. It can be concluded that the economy of Mizoram has been steadily growing in size at a healthy rate.
Figure 6: Gross State Domestic Product (GSDP) at Constant Prices between 2006 & 2012
Source: Central Statistical Organization
Table 5: State/Region/Country wise CAGR of GSDP between 2006 & 2012
State/Region/Country CAGR (%)
Mizoram 10.78
NER 7.50
India 7.94
Source: Central Statistical Organization At a CAGR of 15.01% between 2006 & 2010, the primary sector is the fastest growing among all the sectors. This growth was driven by the development and enhancement in the area of agriculture and its allied fields of agro-processing, horticulture and sericulture. The primary sector has contributed the second most to the GSDP with a contribution of 23.03% in 2009-10. The services sector continues to be the most dominant sector in the state with the sector contributing 57.59% of the total GSDP of the state in 2009-10. This sector has been growing at a rate of 11.65% and is primarily driven by construction, manufacturing &electricity, gas and water supply. The secondary sector, during the same period has contributed 19.38% to GSDP and grew at a rate of 13.75% between the years 2006 and 2010 Overall the state of Mizoram is primarily services oriented and the primary sector of the state is growing slowly. The secondary sector, which includes industry, is recording minimal growth and is not a main driver of the economy.
3,0063,336
3,7814,174
4,5575,017
2006-07 2007-08 2008-09 2009-10 2010-11 2011-12
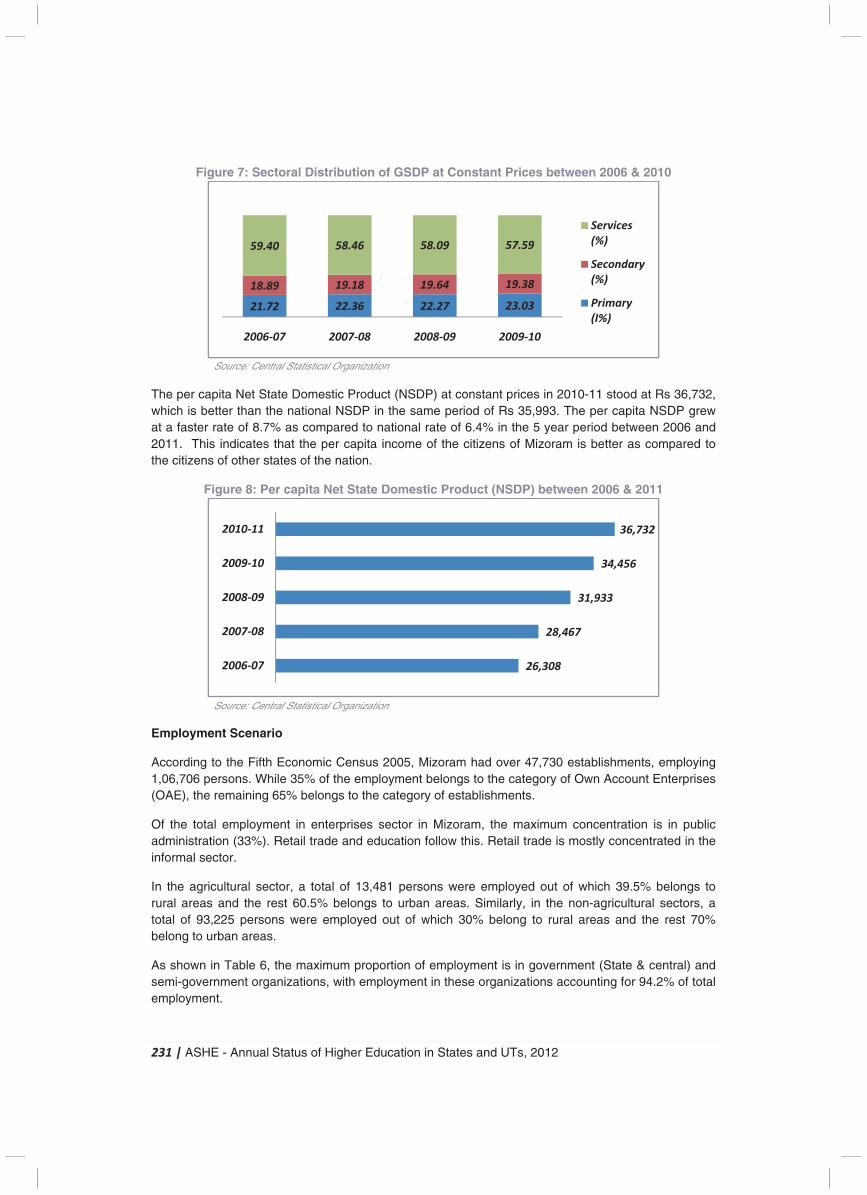
231 | ASHE - Annual Status of Higher Education in States and UTs, 2012
Figure 7: Sectoral Distribution of GSDP at Constant Prices between 2006 & 2010
Source: Central Statistical Organization
The per capita Net State Domestic Product (NSDP) at constant prices in 2010-11 stood at Rs 36,732, which is better than the national NSDP in the same period of Rs 35,993. The per capita NSDP grew at a faster rate of 8.7% as compared to national rate of 6.4% in the 5 year period between 2006 and 2011. This indicates that the per capita income of the citizens of Mizoram is better as compared to the citizens of other states of the nation.
Figure 8: Per capita Net State Domestic Product (NSDP) between 2006 & 2011
Source: Central Statistical Organization
Employment Scenario
According to the Fifth Economic Census 2005, Mizoram had over 47,730 establishments, employing 1,06,706 persons. While 35% of the employment belongs to the category of Own Account Enterprises (OAE), the remaining 65% belongs to the category of establishments.
Of the total employment in enterprises sector in Mizoram, the maximum concentration is in public administration (33%). Retail trade and education follow this. Retail trade is mostly concentrated in the informal sector.
In the agricultural sector, a total of 13,481 persons were employed out of which 39.5% belongs to rural areas and the rest 60.5% belongs to urban areas. Similarly, in the non-agricultural sectors, a total of 93,225 persons were employed out of which 30% belong to rural areas and the rest 70% belong to urban areas.
As shown in Table 6, the maximum proportion of employment is in government (State & central) and semi-government organizations, with employment in these organizations accounting for 94.2% of total employment.
21.72 22.36 22.27 23.03
18.89 19.18 19.64 19.38
59.40 58.46 58.09 57.59
2006-07 2007-08 2008-09 2009-10
Services
(%)
Secondary
(%)
Primary
(I%)
26,308
28,467
31,933
34,456
36,732
2006-07
2007-08
2008-09
2009-10
2010-11
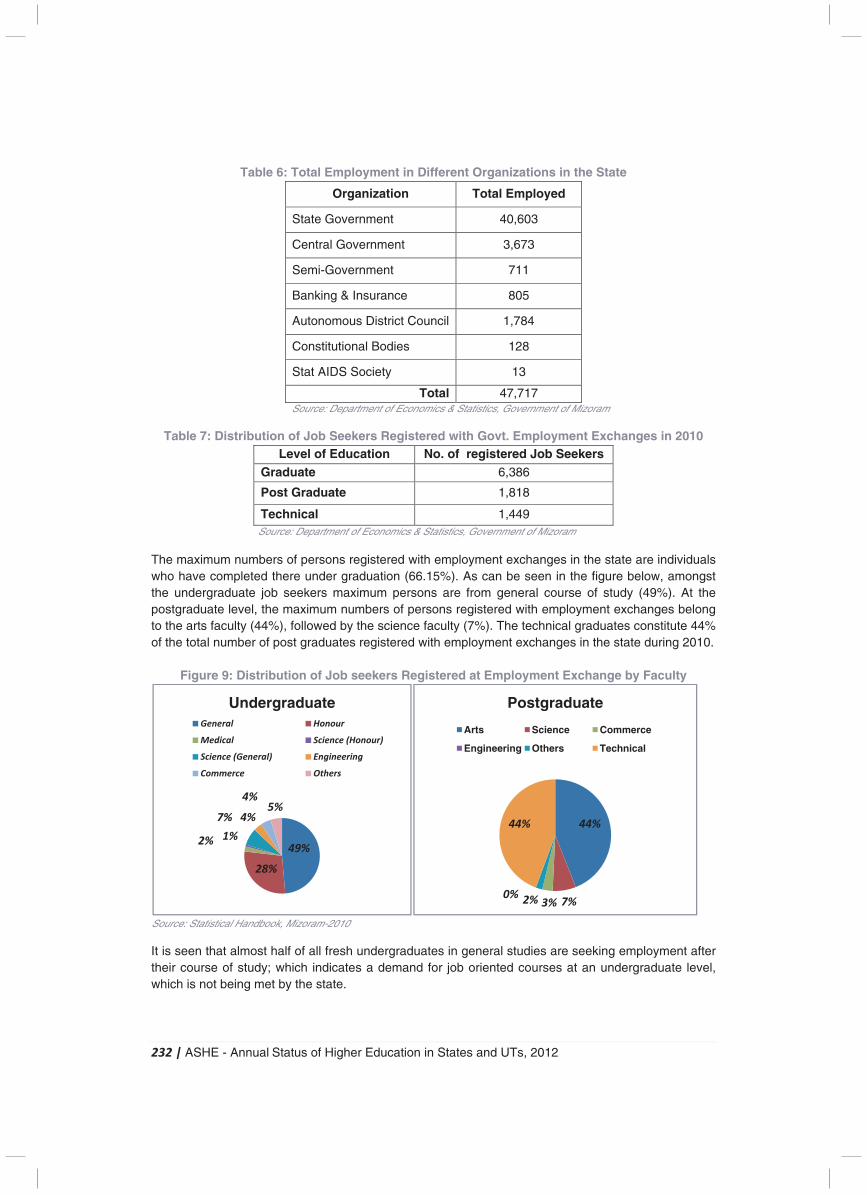
232 | ASHE - Annual Status of Higher Education in States and UTs, 2012
Table 6: Total Employment in Different Organizations in the State
Organization Total Employed
State Government 40,603
Central Government 3,673
Semi-Government 711
Banking & Insurance 805
Autonomous District Council 1,784
Constitutional Bodies 128
Stat AIDS Society 13
Total 47,717 Source: Department of Economics & Statistics, Government of Mizoram
Table 7: Distribution of Job Seekers Registered with Govt. Employment Exchanges in 2010 Level of Education No. of registered Job Seekers
Graduate 6,386
Post Graduate 1,818
Technical 1,449 Source: Department of Economics & Statistics, Government of Mizoram
The maximum numbers of persons registered with employment exchanges in the state are individuals who have completed there under graduation (66.15%). As can be seen in the figure below, amongst the undergraduate job seekers maximum persons are from general course of study (49%). At the postgraduate level, the maximum numbers of persons registered with employment exchanges belong to the arts faculty (44%), followed by the science faculty (7%). The technical graduates constitute 44% of the total number of post graduates registered with employment exchanges in the state during 2010.
Figure 9: Distribution of Job seekers Registered at Employment Exchange by Faculty
Source: Statistical Handbook, Mizoram-2010
It is seen that almost half of all fresh undergraduates in general studies are seeking employment after their course of study; which indicates a demand for job oriented courses at an undergraduate level, which is not being met by the state.
49%
28%
2% 1%
7% 4%
4%5%
UndergraduateGeneral Honour
Medical Science (Honour)
Science (General) Engineering
Commerce Others
44%
7%3%0%
2%
44%
Postgraduate
Arts Science Commerce
Engineering Others Technical
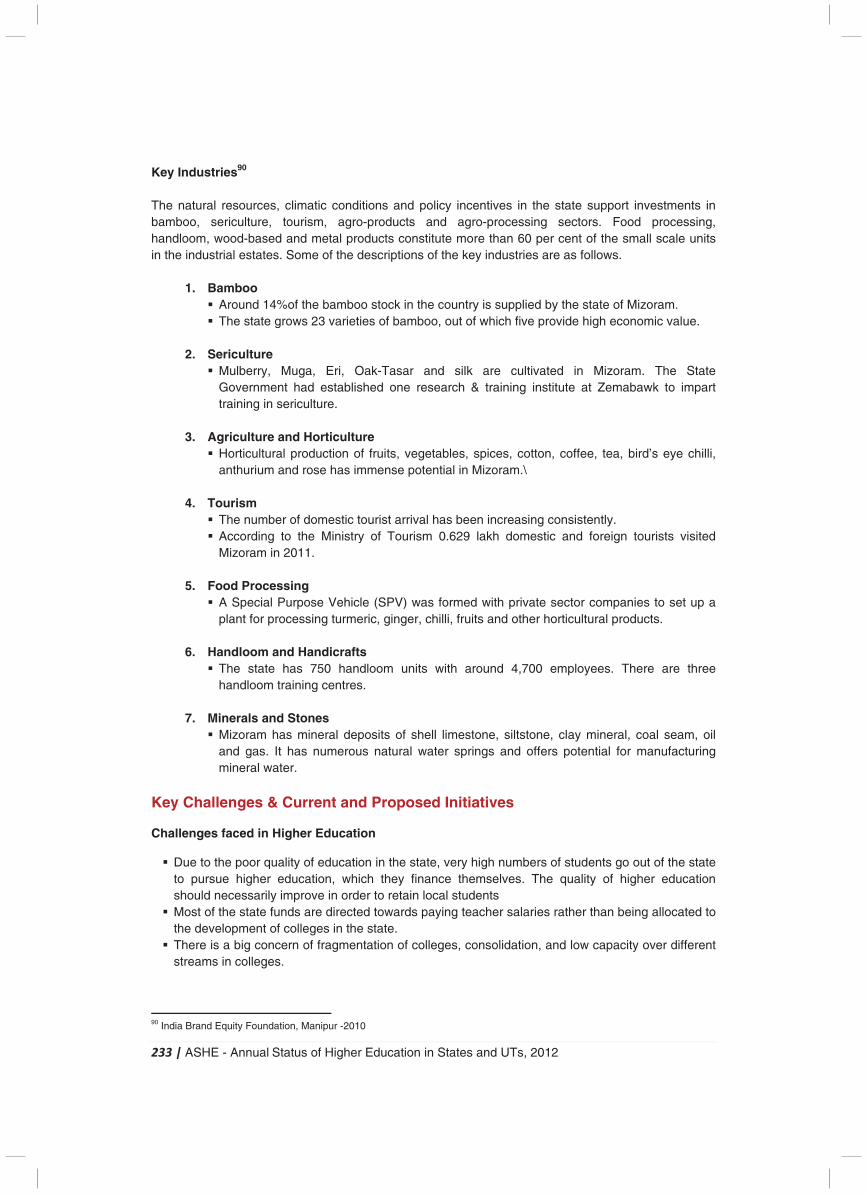
233 | ASHE - Annual Status of Higher Education in States and UTs, 2012
Key Industries90 The natural resources, climatic conditions and policy incentives in the state support investments in bamboo, sericulture, tourism, agro-products and agro-processing sectors. Food processing, handloom, wood-based and metal products constitute more than 60 per cent of the small scale units in the industrial estates. Some of the descriptions of the key industries are as follows.
1. Bamboo � Around 14%of the bamboo stock in the country is supplied by the state of Mizoram. � The state grows 23 varieties of bamboo, out of which five provide high economic value.
2. Sericulture
� Mulberry, Muga, Eri, Oak-Tasar and silk are cultivated in Mizoram. The State Government had established one research & training institute at Zemabawk to impart training in sericulture.
3. Agriculture and Horticulture � Horticultural production of fruits, vegetables, spices, cotton, coffee, tea, bird’s eye chilli,
anthurium and rose has immense potential in Mizoram.\
4. Tourism � The number of domestic tourist arrival has been increasing consistently. � According to the Ministry of Tourism 0.629 lakh domestic and foreign tourists visited
Mizoram in 2011.
5. Food Processing � A Special Purpose Vehicle (SPV) was formed with private sector companies to set up a
plant for processing turmeric, ginger, chilli, fruits and other horticultural products.
6. Handloom and Handicrafts � The state has 750 handloom units with around 4,700 employees. There are three
handloom training centres.
7. Minerals and Stones � Mizoram has mineral deposits of shell limestone, siltstone, clay mineral, coal seam, oil
and gas. It has numerous natural water springs and offers potential for manufacturing mineral water.
Key Challenges & Current and Proposed Initiatives
Challenges faced in Higher Education
� Due to the poor quality of education in the state, very high numbers of students go out of the state to pursue higher education, which they finance themselves. The quality of higher education should necessarily improve in order to retain local students
� Most of the state funds are directed towards paying teacher salaries rather than being allocated to the development of colleges in the state.
� There is a big concern of fragmentation of colleges, consolidation, and low capacity over different streams in colleges.
90 India Brand Equity Foundation, Manipur -2010
234 | ASHE - Annual Status of Higher Education in States and UTs, 2012
� The state has the potential to develop local talent in the fields of BPO, travel, tourism and hospitality etc., enabling companies from other states to recruit young professionals in these fields.
� The number of colleges should be reduced and the Central University should be given more focus with regards to fund allocation and quality improvement to make it the main centre of higher education in the state.
� Rationalization of existing facilities and resources by way of mergers of certain Colleges within and outside Aizawl.
Initiatives Started
� Introduction of semester system in all affiliated undergraduate colleges. � The College of Teacher Education, Aizawl has been upgraded to Institute of Advanced Education
Studies. � The Mizoram Scholarship Board (MBS) has been upgraded to the Level Directorate.
Initiatives Proposed
� Establishment of Indian Institute of Information Technology (IIIT) and Rajiv Gandhi Indian Institute of Management (RGIIM).
� Government of India has proposed to establish 6 polytechnics in the state in 6 different districts. The implementation of this scheme is being currently sought in Public Private Partnership (PPP) mode.
� Stipend for long term department trainees and tie up arrangement with banks regarding study loans for economically backward students.
� Setting up of law and medical colleges in the state has been proposed.
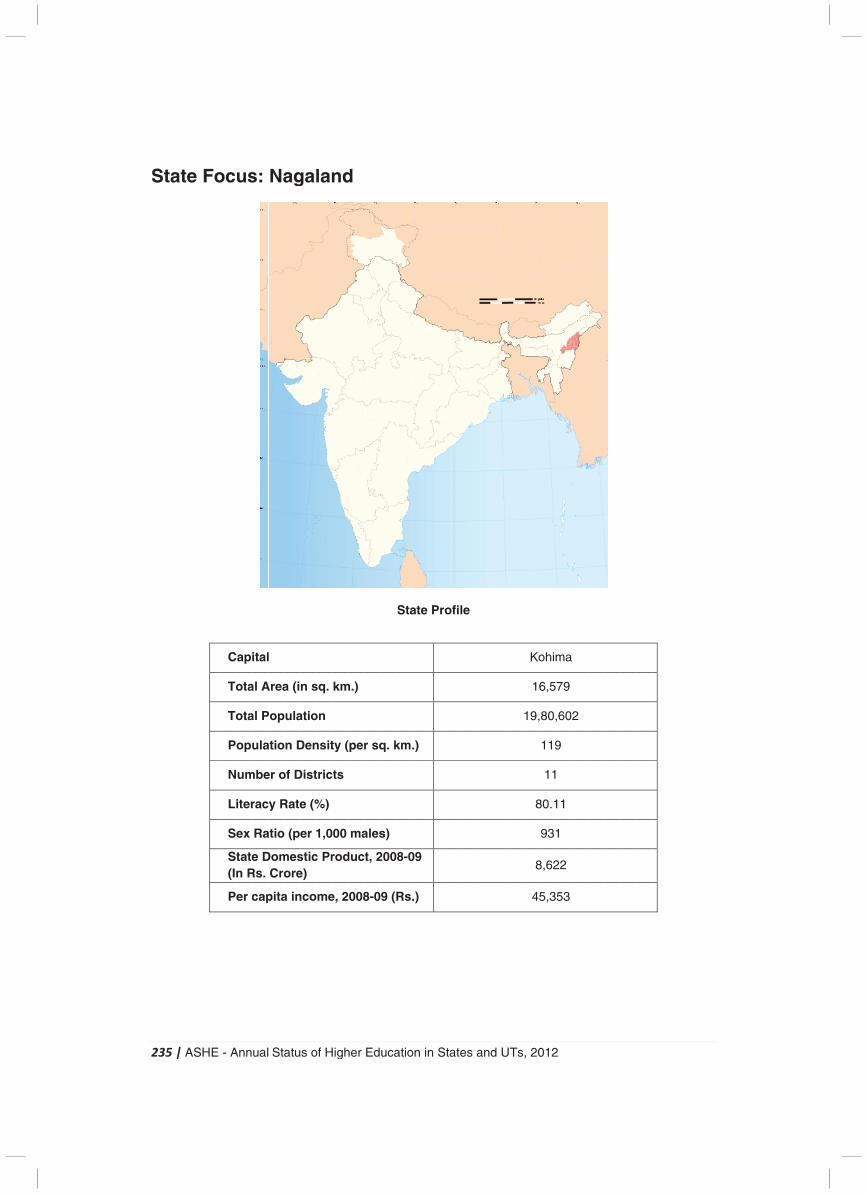
2
S
235
Sta
| A
ate
ASH
e F
HE
Fo
- A
oc
C
To
To
Po
N
Li
Se
St(In
Pe
Ann
us
api
ota
ota
opu
um
iter
ex
taten R
er c
ual
s:
ital
al A
al P
ula
mbe
rac
Ra
e DRs.
cap
Sta
Na
l
Area
Pop
atio
er o
y R
atio
DomCro
pita
atu
ag
a (i
ula
n D
of D
Rate
(pe
mesore
a in
s o
gal
n s
atio
Den
Dist
e (%
er 1
stice)
nco
of H
lan
sq.
on
nsit
tric
%)
1,0
c Pr
me
High
nd
km
ty (
ts
00
rod
e, 2
her
d
m.)
(per
ma
duc
008
Ed
r sq
ales
t, 2
8-0
uca
q. k
s)
200
09 (
atio
Sta
km.
08-0
Rs.
on in
ate
.)
09
.)
n S
Pr
Stat
ofi
es
le
and
d U
UTs
, 20
Ko
16
19,
8
8
45
012
ohim
6,5
80,
119
11
80.1
931
8,62
5,3
2
ma
79
,60
9
11
1
22
53
a
2
236 | ASHE - Annual Status of Higher Education in States and UTs, 2012
Introduction
Nagaland gained its statehood in the year 1963. It is bounded by the states of Assam to the west, Arunachal Pradesh and part of Assam to the north, and Manipur to the south. It shares international borders with Myanmar to the east. The state is mostly mountainous except those areas bordering the Assam valley. Agriculture is the most important economic activity in Nagaland. Principal crops include rice, corn, millets, pulses, tobacco, oilseeds, sugarcane, potatoes and fibres. Other economy boosters are forestry, cottage industries, insurance, real estate and tourism.
The many advantages of the state are that it is connected to other parts of the country through rail, road and air. More than 60% of its population belongs to the working age group. Tourism is a major industry, with several foreign tourists attracted to the state. There are investments & employment opportunities in the sectors of food processing, agro & forest based industries, mineral based industries, petrochemicals, handloom & handicrafts, horticulture & floriculture and tourism.
Universities and University Level Institutes
There is 1 central university in the state, Nagaland University (NU). In addition, there are 2 private universities in the state. There are no deemed or state universities in Nagaland. The National Institute of Technology, (which is an institute of national importance), was established during the 11th Five Year Plan.
The Nagaland University was established in 1994 as a central university. The university has Kohima Campus at Meriema, an agricultural campus in Mezdiphema and an engineering, technology & management at Dimapur. The headquarters has been functional since 2010 in Lumami. The university has 6 schools in the fields of science, social science, humanities & education, agricultural sciences & rural development, engineering & technology and management studies. The university currently affiliates 51 colleges in the state. The state has 2 private universities - Institute of Chartered Financial Analyst of India University (ICFAIU) which offers Bachelor’s and Master’s Degree Programs in management and computer science and The Global Open University which is recognized by the University Grants Commission (UGC) and Ministry of Human Resources Development (MoHRD) for imparting higher education in distance mode of study so as to introduce vocational, job oriented and employment centric education in north-east in general and in the state in particular.
The National Institute of Technology (NIT), Nagaland is one among the ten newly established NITs by the MoHRD, Government of India (GoI) in 2009 during the 11th Five Year Plan. It is located in Dimapur, the commercial hub of the state. At present the institute has 3 undergraduate courses in engineering namely Electrical & Electronics Engineering, Electronics & Communication Engineering and Computer Science Engineering.
Table 1: Distribution of Universities & University Level Institutions at State & National Level
Type of University Nagaland (2011-12)
India (2011-12)
State University 0 285
Private University 2 112
Institute of National Importance 1 39
Deemed University 0 129
Central University 1 40
Total 4 605 Source: UGC
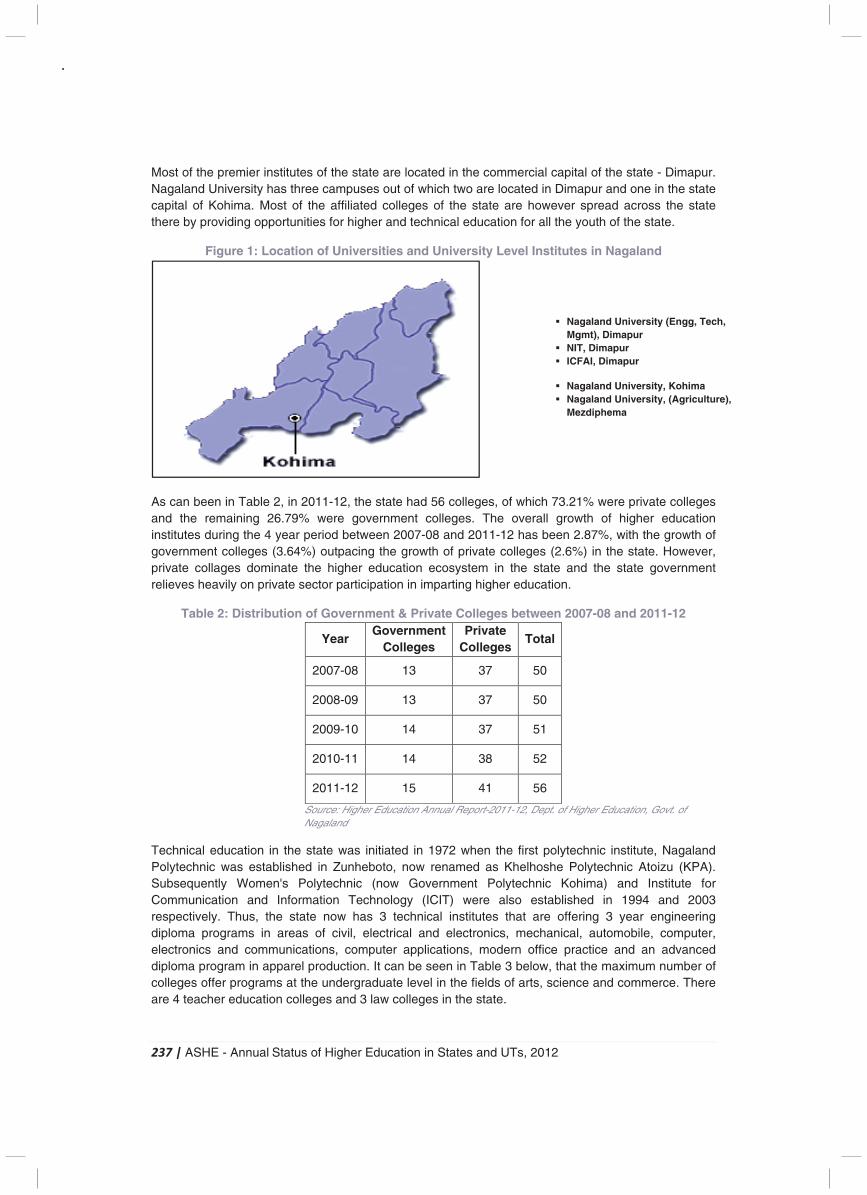
237 | ASHE - Annual Status of Higher Education in States and UTs, 2012
Most of the premier institutes of the state are located in the commercial capital of the state - Dimapur. Nagaland University has three campuses out of which two are located in Dimapur and one in the state capital of Kohima. Most of the affiliated colleges of the state are however spread across the state there by providing opportunities for higher and technical education for all the youth of the state.
Figure 1: Location of Universities and University Level Institutes in Nagaland
As can been in Table 2, in 2011-12, the state had 56 colleges, of which 73.21% were private colleges and the remaining 26.79% were government colleges. The overall growth of higher education institutes during the 4 year period between 2007-08 and 2011-12 has been 2.87%, with the growth of government colleges (3.64%) outpacing the growth of private colleges (2.6%) in the state. However, private collages dominate the higher education ecosystem in the state and the state government relieves heavily on private sector participation in imparting higher education.
Table 2: Distribution of Government & Private Colleges between 2007-08 and 2011-12
Year Government
Colleges Private
Colleges Total
2007-08 13 37 50
2008-09 13 37 50
2009-10 14 37 51
2010-11 14 38 52
2011-12 15 41 56
Source: Higher Education Annual Report-2011-12, Dept. of Higher Education, Govt. of Nagaland
Technical education in the state was initiated in 1972 when the first polytechnic institute, Nagaland Polytechnic was established in Zunheboto, now renamed as Khelhoshe Polytechnic Atoizu (KPA). Subsequently Women's Polytechnic (now Government Polytechnic Kohima) and Institute for Communication and Information Technology (ICIT) were also established in 1994 and 2003 respectively. Thus, the state now has 3 technical institutes that are offering 3 year engineering diploma programs in areas of civil, electrical and electronics, mechanical, automobile, computer, electronics and communications, computer applications, modern office practice and an advanced diploma program in apparel production. It can be seen in Table 3 below, that the maximum number of colleges offer programs at the undergraduate level in the fields of arts, science and commerce. There are 4 teacher education colleges and 3 law colleges in the state.
� Nagaland University (Engg, Tech, Mgmt), Dimapur
� NIT, Dimapur � ICFAI, Dimapur
� Nagaland University, Kohima � Nagaland University, (Agriculture),
Mezdiphema
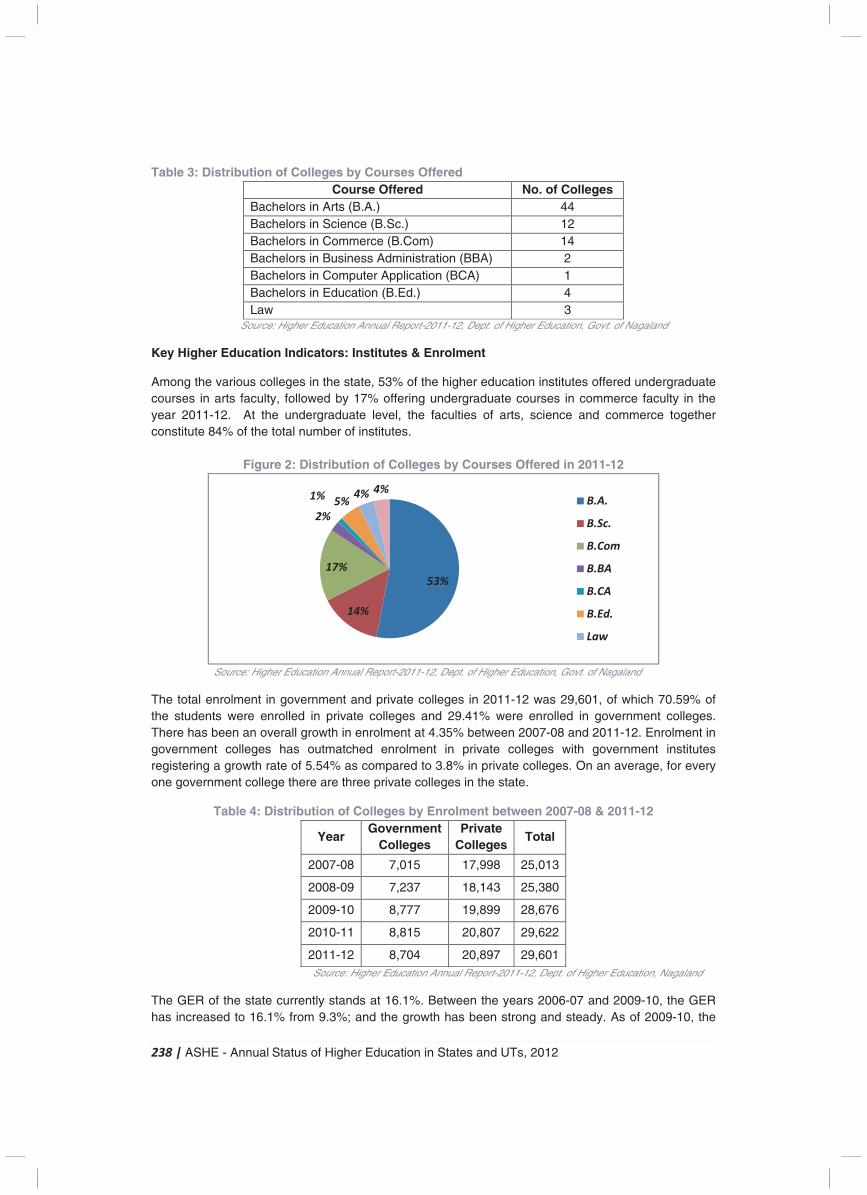
238 | ASHE - Annual Status of Higher Education in States and UTs, 2012
Table 3: Distribution of Colleges by Courses Offered Course Offered No. of Colleges
Bachelors in Arts (B.A.) 44 Bachelors in Science (B.Sc.) 12 Bachelors in Commerce (B.Com) 14 Bachelors in Business Administration (BBA) 2 Bachelors in Computer Application (BCA) 1 Bachelors in Education (B.Ed.) 4 Law 3
Source: Higher Education Annual Report-2011-12, Dept. of Higher Education, Govt. of Nagaland
Key Higher Education Indicators: Institutes & Enrolment
Among the various colleges in the state, 53% of the higher education institutes offered undergraduate courses in arts faculty, followed by 17% offering undergraduate courses in commerce faculty in the year 2011-12. At the undergraduate level, the faculties of arts, science and commerce together constitute 84% of the total number of institutes.
Figure 2: Distribution of Colleges by Courses Offered in 2011-12
Source: Higher Education Annual Report-2011-12, Dept. of Higher Education, Govt. of Nagaland
The total enrolment in government and private colleges in 2011-12 was 29,601, of which 70.59% of the students were enrolled in private colleges and 29.41% were enrolled in government colleges. There has been an overall growth in enrolment at 4.35% between 2007-08 and 2011-12. Enrolment in government colleges has outmatched enrolment in private colleges with government institutes registering a growth rate of 5.54% as compared to 3.8% in private colleges. On an average, for every one government college there are three private colleges in the state.
Table 4: Distribution of Colleges by Enrolment between 2007-08 & 2011-12
Year Government
Colleges Private
Colleges Total
2007-08 7,015 17,998 25,013
2008-09 7,237 18,143 25,380
2009-10 8,777 19,899 28,676
2010-11 8,815 20,807 29,622
2011-12 8,704 20,897 29,601 Source: Higher Education Annual Report-2011-12, Dept. of Higher Education, Nagaland
The GER of the state currently stands at 16.1%. Between the years 2006-07 and 2009-10, the GER has increased to 16.1% from 9.3%; and the growth has been strong and steady. As of 2009-10, the
53%
14%
17%
2%
1%5%
4% 4%B.A.
B.Sc.
B.Com
B.BA
B.CA
B.Ed.
Law
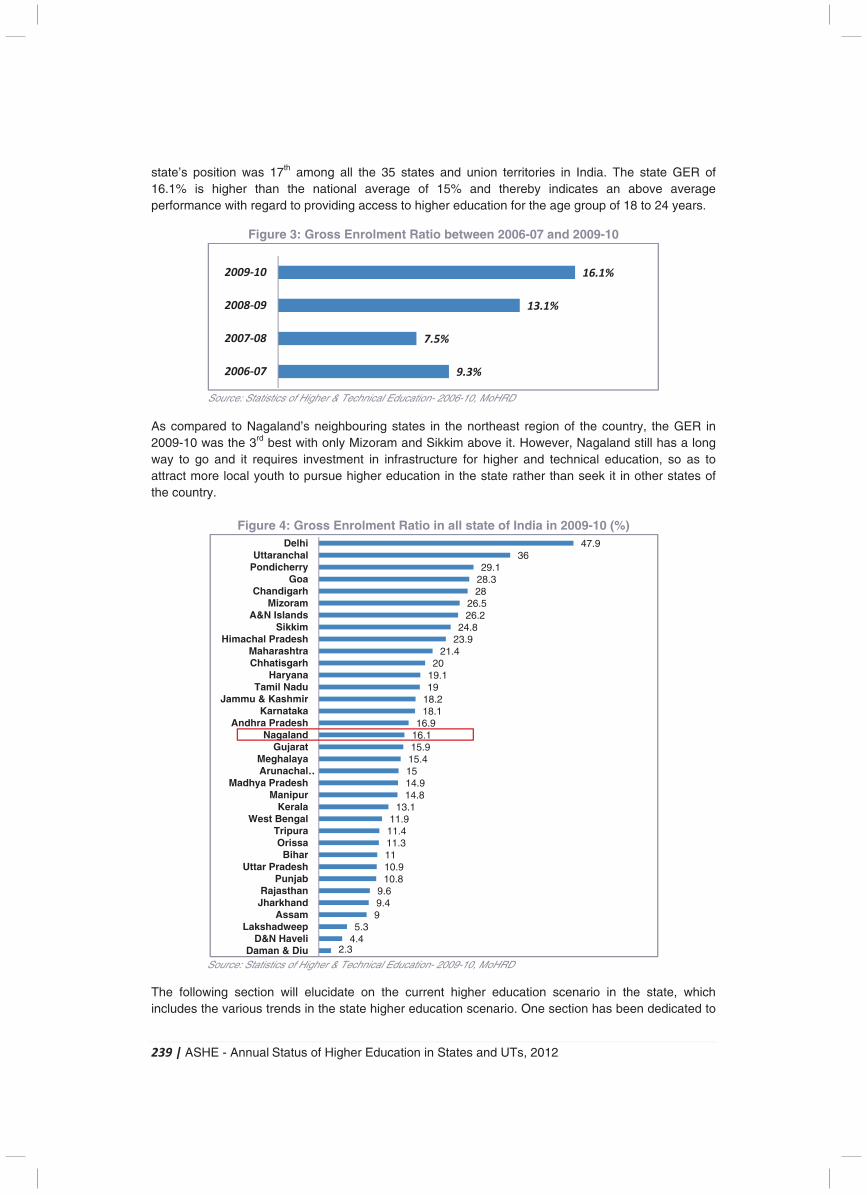
239 | ASHE - Annual Status of Higher Education in States and UTs, 2012
state’s position was 17th among all the 35 states and union territories in India. The state GER of 16.1% is higher than the national average of 15% and thereby indicates an above average performance with regard to providing access to higher education for the age group of 18 to 24 years.
Figure 3: Gross Enrolment Ratio between 2006-07 and 2009-10
Source: Statistics of Higher & Technical Education- 2006-10, MoHRD
As compared to Nagaland’s neighbouring states in the northeast region of the country, the GER in 2009-10 was the 3rd best with only Mizoram and Sikkim above it. However, Nagaland still has a long way to go and it requires investment in infrastructure for higher and technical education, so as to attract more local youth to pursue higher education in the state rather than seek it in other states of the country.
Figure 4: Gross Enrolment Ratio in all state of India in 2009-10 (%)
Source: Statistics of Higher & Technical Education- 2009-10, MoHRD
The following section will elucidate on the current higher education scenario in the state, which includes the various trends in the state higher education scenario. One section has been dedicated to
9.3%
7.5%
13.1%
16.1%
2006-07
2007-08
2008-09
2009-10
2.34.45.3
99.49.6
10.810.91111.311.411.9
13.114.814.91515.415.916.116.9
18.118.21919.120
21.423.924.8
26.226.5
2828.329.1
3647.9
Daman & DiuD&N Haveli
LakshadweepAssam
JharkhandRajasthan
PunjabUttar Pradesh
BiharOrissa
TripuraWest Bengal
KeralaManipur
Madhya PradeshArunachal …Meghalaya
GujaratNagaland
Andhra PradeshKarnataka
Jammu & KashmirTamil Nadu
HaryanaChhatisgarhMaharashtra
Himachal PradeshSikkim
A&N IslandsMizoram
ChandigarhGoa
PondicherryUttaranchal
Delhi
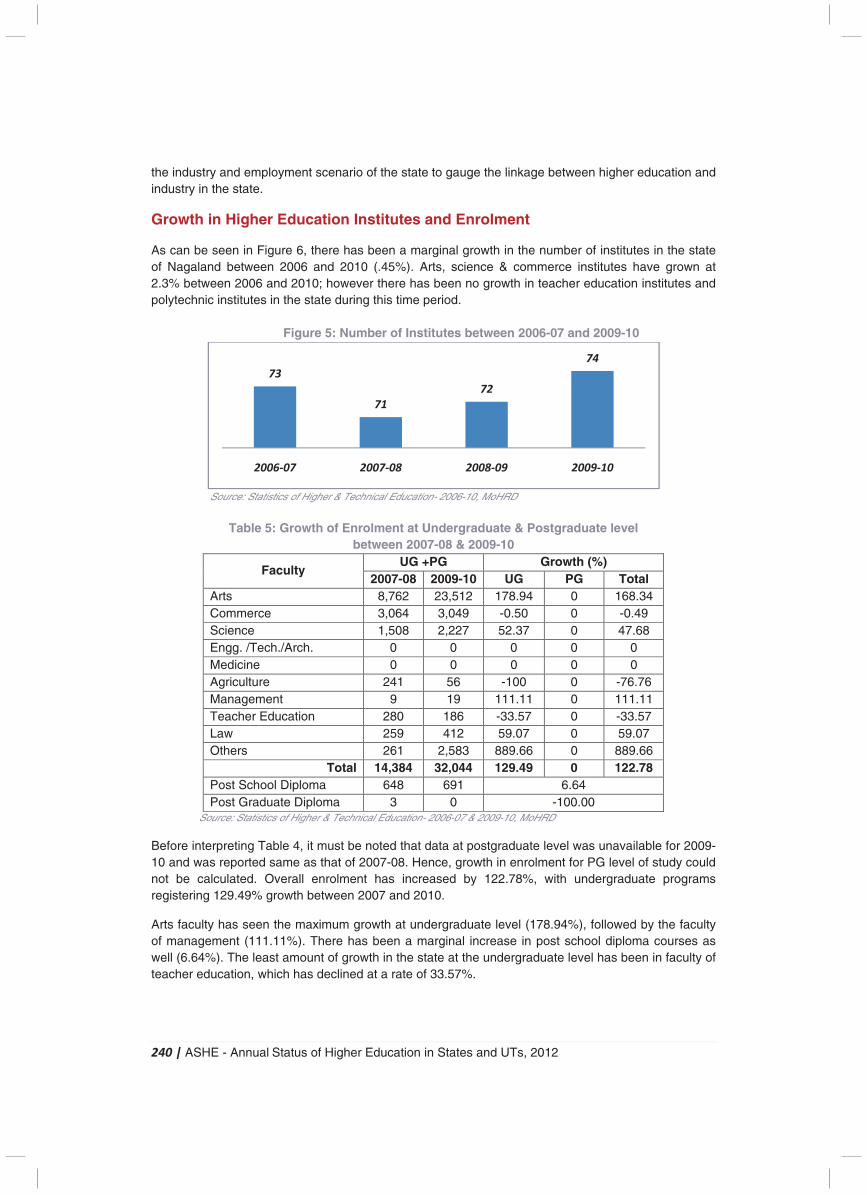
240 | ASHE - Annual Status of Higher Education in States and UTs, 2012
the industry and employment scenario of the state to gauge the linkage between higher education and industry in the state.
Growth in Higher Education Institutes and Enrolment
As can be seen in Figure 6, there has been a marginal growth in the number of institutes in the state of Nagaland between 2006 and 2010 (.45%). Arts, science & commerce institutes have grown at 2.3% between 2006 and 2010; however there has been no growth in teacher education institutes and polytechnic institutes in the state during this time period. Figure 5: Number of Institutes between 2006-07 and 2009-10
Source: Statistics of Higher & Technical Education- 2006-10, MoHRD
Table 5: Growth of Enrolment at Undergraduate & Postgraduate level
between 2007-08 & 2009-10
Faculty UG +PG Growth (%)
2007-08 2009-10 UG PG Total Arts 8,762 23,512 178.94 0 168.34 Commerce 3,064 3,049 -0.50 0 -0.49 Science 1,508 2,227 52.37 0 47.68 Engg. /Tech./Arch. 0 0 0 0 0 Medicine 0 0 0 0 0 Agriculture 241 56 -100 0 -76.76 Management 9 19 111.11 0 111.11 Teacher Education 280 186 -33.57 0 -33.57 Law 259 412 59.07 0 59.07 Others 261 2,583 889.66 0 889.66
Total 14,384 32,044 129.49 0 122.78 Post School Diploma 648 691 6.64 Post Graduate Diploma 3 0 -100.00
Source: Statistics of Higher & Technical Education- 2006-07 & 2009-10, MoHRD Before interpreting Table 4, it must be noted that data at postgraduate level was unavailable for 2009-10 and was reported same as that of 2007-08. Hence, growth in enrolment for PG level of study could not be calculated. Overall enrolment has increased by 122.78%, with undergraduate programs registering 129.49% growth between 2007 and 2010.
Arts faculty has seen the maximum growth at undergraduate level (178.94%), followed by the faculty of management (111.11%). There has been a marginal increase in post school diploma courses as well (6.64%). The least amount of growth in the state at the undergraduate level has been in faculty of teacher education, which has declined at a rate of 33.57%.
73
71
72
74
2006-07 2007-08 2008-09 2009-10
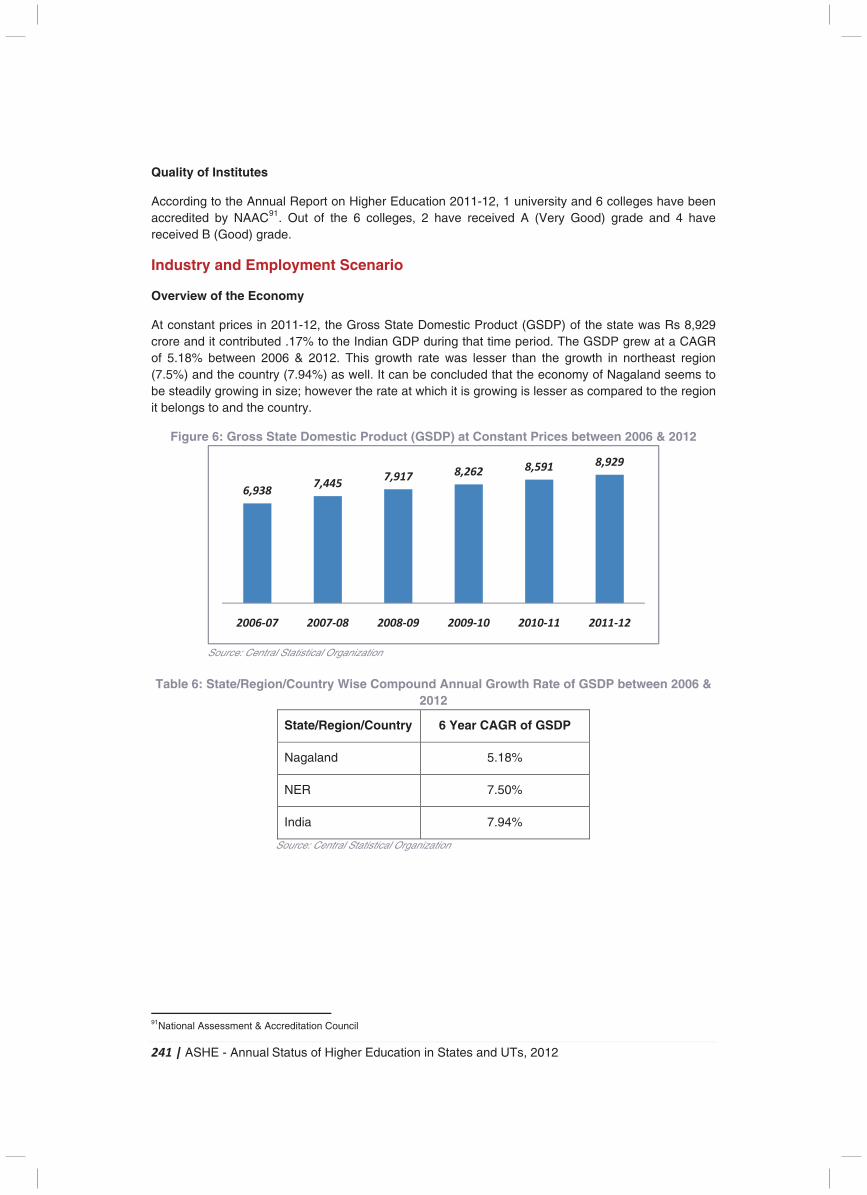
241 | ASHE - Annual Status of Higher Education in States and UTs, 2012
Quality of Institutes
According to the Annual Report on Higher Education 2011-12, 1 university and 6 colleges have been accredited by NAAC91. Out of the 6 colleges, 2 have received A (Very Good) grade and 4 have received B (Good) grade.
Industry and Employment Scenario
Overview of the Economy
At constant prices in 2011-12, the Gross State Domestic Product (GSDP) of the state was Rs 8,929 crore and it contributed .17% to the Indian GDP during that time period. The GSDP grew at a CAGR of 5.18% between 2006 & 2012. This growth rate was lesser than the growth in northeast region (7.5%) and the country (7.94%) as well. It can be concluded that the economy of Nagaland seems to be steadily growing in size; however the rate at which it is growing is lesser as compared to the region it belongs to and the country.
Figure 6: Gross State Domestic Product (GSDP) at Constant Prices between 2006 & 2012
Source: Central Statistical Organization
Table 6: State/Region/Country Wise Compound Annual Growth Rate of GSDP between 2006 &
2012
State/Region/Country 6 Year CAGR of GSDP
Nagaland 5.18%
NER 7.50%
India 7.94%
Source: Central Statistical Organization
91National Assessment & Accreditation Council
6,9387,445
7,917 8,262 8,591 8,929
2006-07 2007-08 2008-09 2009-10 2010-11 2011-12
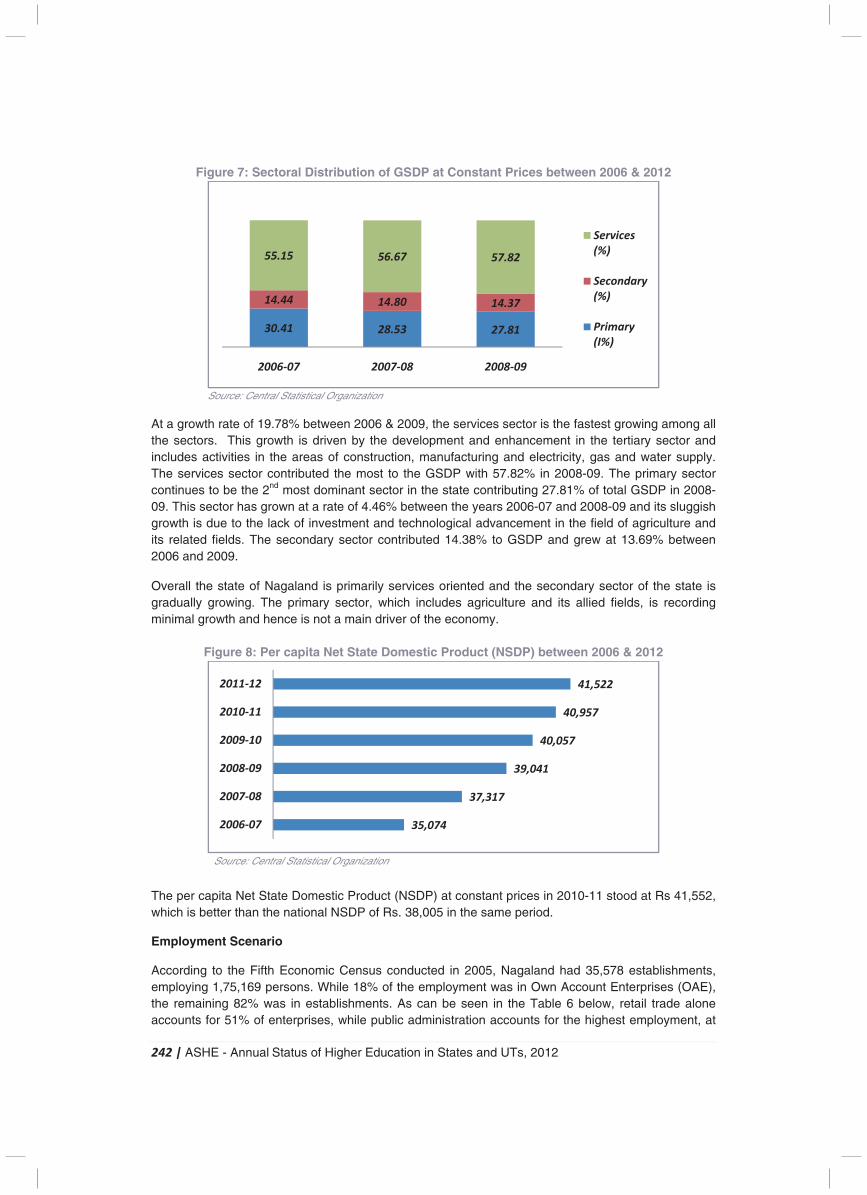
242 | ASHE - Annual Status of Higher Education in States and UTs, 2012
Figure 7: Sectoral Distribution of GSDP at Constant Prices between 2006 & 2012
Source: Central Statistical Organization
At a growth rate of 19.78% between 2006 & 2009, the services sector is the fastest growing among all the sectors. This growth is driven by the development and enhancement in the tertiary sector and includes activities in the areas of construction, manufacturing and electricity, gas and water supply. The services sector contributed the most to the GSDP with 57.82% in 2008-09. The primary sector continues to be the 2nd most dominant sector in the state contributing 27.81% of total GSDP in 2008-09. This sector has grown at a rate of 4.46% between the years 2006-07 and 2008-09 and its sluggish growth is due to the lack of investment and technological advancement in the field of agriculture and its related fields. The secondary sector contributed 14.38% to GSDP and grew at 13.69% between 2006 and 2009. Overall the state of Nagaland is primarily services oriented and the secondary sector of the state is gradually growing. The primary sector, which includes agriculture and its allied fields, is recording minimal growth and hence is not a main driver of the economy.
Figure 8: Per capita Net State Domestic Product (NSDP) between 2006 & 2012
Source: Central Statistical Organization
The per capita Net State Domestic Product (NSDP) at constant prices in 2010-11 stood at Rs 41,552, which is better than the national NSDP of Rs. 38,005 in the same period.
Employment Scenario
According to the Fifth Economic Census conducted in 2005, Nagaland had 35,578 establishments, employing 1,75,169 persons. While 18% of the employment was in Own Account Enterprises (OAE), the remaining 82% was in establishments. As can be seen in the Table 6 below, retail trade alone accounts for 51% of enterprises, while public administration accounts for the highest employment, at
30.41 28.53 27.81
14.44 14.80 14.37
55.15 56.67 57.82
2006-07 2007-08 2008-09
Services
(%)
Secondary
(%)
Primary
(I%)
35,074
37,317
39,041
40,057
40,957
41,522
2006-07
2007-08
2008-09
2009-10
2010-11
2011-12
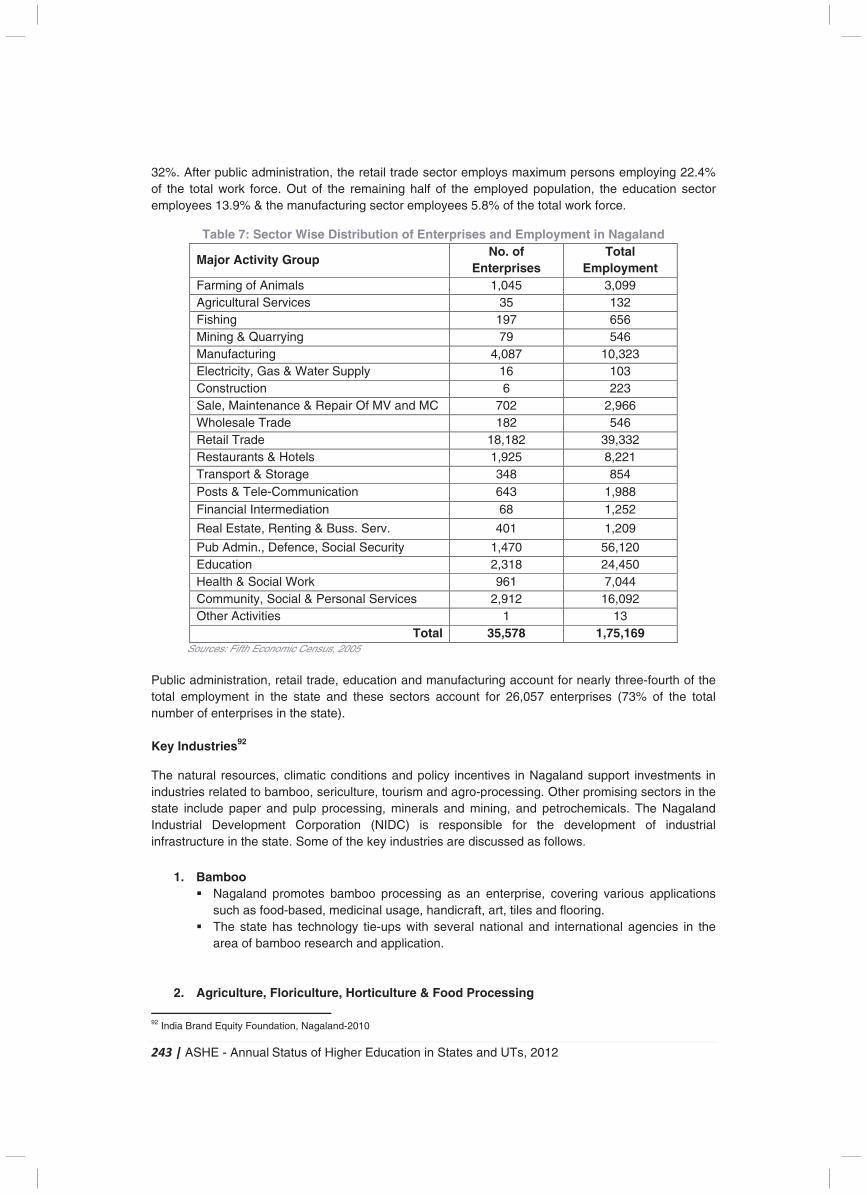
243 | ASHE - Annual Status of Higher Education in States and UTs, 2012
32%. After public administration, the retail trade sector employs maximum persons employing 22.4% of the total work force. Out of the remaining half of the employed population, the education sector employees 13.9% & the manufacturing sector employees 5.8% of the total work force.
Table 7: Sector Wise Distribution of Enterprises and Employment in Nagaland
Major Activity Group No. of
Enterprises Total
Employment Farming of Animals 1,045 3,099 Agricultural Services 35 132 Fishing 197 656 Mining & Quarrying 79 546 Manufacturing 4,087 10,323 Electricity, Gas & Water Supply 16 103 Construction 6 223 Sale, Maintenance & Repair Of MV and MC 702 2,966 Wholesale Trade 182 546 Retail Trade 18,182 39,332 Restaurants & Hotels 1,925 8,221 Transport & Storage 348 854 Posts & Tele-Communication 643 1,988 Financial Intermediation 68 1,252
Real Estate, Renting & Buss. Serv. 401 1,209
Pub Admin., Defence, Social Security 1,470 56,120 Education 2,318 24,450 Health & Social Work 961 7,044 Community, Social & Personal Services 2,912 16,092 Other Activities 1 13
Total 35,578 1,75,169 Sources: Fifth Economic Census, 2005
Public administration, retail trade, education and manufacturing account for nearly three-fourth of the total employment in the state and these sectors account for 26,057 enterprises (73% of the total number of enterprises in the state). Key Industries92
The natural resources, climatic conditions and policy incentives in Nagaland support investments in industries related to bamboo, sericulture, tourism and agro-processing. Other promising sectors in the state include paper and pulp processing, minerals and mining, and petrochemicals. The Nagaland Industrial Development Corporation (NIDC) is responsible for the development of industrial infrastructure in the state. Some of the key industries are discussed as follows.
1. Bamboo � Nagaland promotes bamboo processing as an enterprise, covering various applications
such as food-based, medicinal usage, handicraft, art, tiles and flooring. � The state has technology tie-ups with several national and international agencies in the
area of bamboo research and application.
2. Agriculture, Floriculture, Horticulture & Food Processing
92 India Brand Equity Foundation, Nagaland-2010
244 | ASHE - Annual Status of Higher Education in States and UTs, 2012
� Nagaland has a suitable climate for agricultural and horticultural produce. � Jhum cultivation (or shifting cultivation) is widely practiced in the state; however, crop
yields are low under such cultivation. There is potential for increasing capacity utilization by adopting modern techniques.
� Nagaland has a rich wealth of flora and fauna. Several varieties of orchids are available in the state, offering significant investment potential.
� Exotic and hybrid varieties of flowers are also being developed in Nagaland; the state is also home to the tallest Rhododendron tree in the world.
� The food and meat processing sector also provides immense potential for investment in the state.
3. Sericulture � Mulberry, muga, eri, oak-tussar, and silk are widely cultivated in Nagaland. � The Sericulture Department of Nagaland is promoting exports of silk.
4. Minerals and Mining
� Nagaland has vast, untapped natural resource reserves of limestone & marble, petroleum & natural gas, coal & substantial reserves of slate sandstones, basalt, chert, dunite, gabbro, granodiorite, serpentine, spilite pyroxenite, quartzite.
� Geology & Mining Department, Geological Survey of India, Oil and Natural Gas Corporation Limited (ONGC), Atomic Minerals Division and Central Ground Water Board are carrying out explorations.
5. Handloom and Handicrafts � The varied ethnic handloom and crafts of Nagaland have a ready market in India and
abroad. � Bamboo crafts and handloom are being promoted as a part of the bamboo policy of the
state. � The state has a tie-up with National Institute of Fashion Technology to promote and
provide sustained market for ethnic handloom. � With modern weaving-equipment being popularized in Nagaland, the handloom sector is
poised for growth in production and trade.
6. Tourism � Wholesome climate, green hills, criss-crossing rivers, interspersed lakes, vibrant culture,
colourful handicrafts and weavings, and numerous festivals make Nagaland a tourist’s paradise.
� According to the Ministry of Tourism, .275 lakh domestic and foreign tourists visited Nagaland in 2011.
Key Challenges and Initiatives in Higher Education
Challenges of Higher Education
� There is a need to explore ways to bring more private players in the state to cater to increasing demand in courses like B.A, B.Com etc. and seek help for setting up more central institutes.
� The issue of employability of students is a problem that is faced by the students of the state hence affecting the development of higher education.
� The colleges in the state suffer from poor quality of education due to which they are unable to retain students to the state.
� There is a need to strike a balance between private players and the government sector. Currently the state has private colleges outnumbering government colleges at the ratio 3:1.
245 | ASHE - Annual Status of Higher Education in States and UTs, 2012
Initiatives Started
Various post metric scholarship schemes implemented under the Department of Higher education are: � Centrally Sponsored Schemes (CSS): Post metric scholarships to schedule tribe students of
Nagaland state & post metric Scholarship for students belonging to minority communities. � NEC stipend and book grant. � Nagaland State Merit Scholarship and Nagaland State Research Scholarship.
The Technical Education sector in the state has improved due to the following initiatives: � Strengthening of the Directorate of Technical Education has been achieved through modification
and revamping of the examination system. � The libraries in all the polytechnics are being upgraded by acquiring adequate number of books,
LR’s, OHP’s etc. � Student hostels, staff quarters, administrative blocks etc. in all the polytechnics have been
renovated. � Stipends for technical students have been revised and the current year has been earmarked for
award as stipends for students undergoing technical courses within and outside the state at the diploma and degree levels.
� The department has taken over the subject of JEE since 2006 and a total number of 302 students were nominated for medical & allied and engineering & allied courses during 2008-2009 through JEE.
� The department, through the Chief Minister’s corpus fund facilitated 15 students to take up 9 months vocational studies in the UK during 2008-09 by way of joint scholarship from the Nagaland Government and Llandrillo International College Wales, UK.
� To properly monitor the functioning of commercial/vocational institutes and computer centres, the department has taken extensive touring within the state for on-the-spot inspection of various institutes and has formulated guidelines and terms of reference for such centres which have been approved by the government. This will ensure maintaining the standard of quality of such centres and institutes.
� All polytechnics have been provided with VSAT connectivity for easy access to the Internet. � GoI has approved and sanctioned opening two new polytechnics within the state. Preliminary
groundwork is currently underway to enable them to function early.
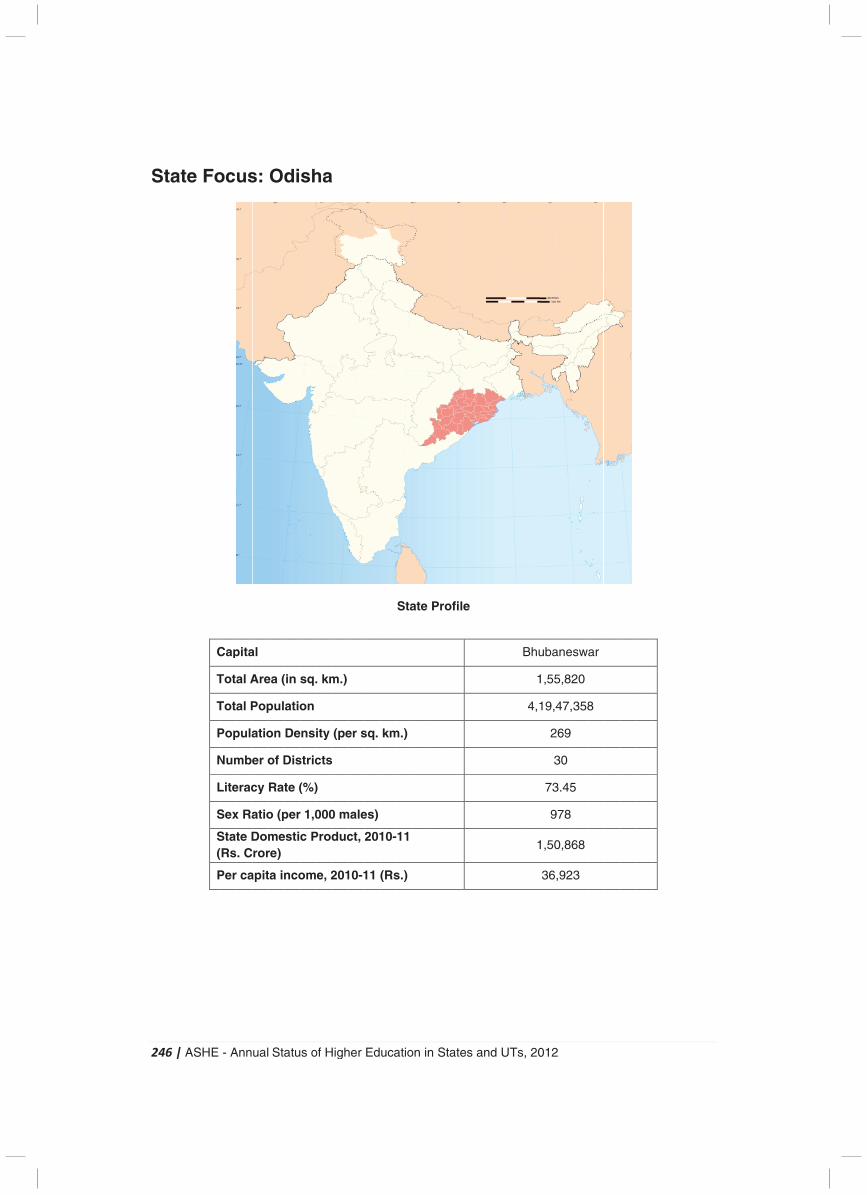
2
S
246
Sta
| A
ate
ASH
e F
HE
Fo
C
T
T
P
N
L
S
S(
P
- A
oc
Cap
Tota
Tota
Pop
Num
Lite
Sex
StatRs
Per
Ann
us
pita
al A
al P
pula
mbe
erac
x Ra
te D. C
ca
ual
s:
al
Are
Pop
atio
er o
cy
atio
Domror
apit
Sta
Od
ea (
pul
on
of D
Rat
o (p
mere)
ta in
atu
di
(in s
atio
De
Dis
te (
per
estic
nco
s o
sh
sq.
on
nsi
stric
(%)
1,0
c P
om
of H
ha
. km
ity
cts
)
000
Prod
e, 2
High
m.)
(pe
0 m
duc
201
her
er s
male
ct,
10-1
Ed
sq.
es)
201
11
uca
km
10-
(Rs
atio
Sta
m.)
-11
s.)
on in
ate
n S
Pr
Stat
ofi
es
le
and
d U
UTs
B
, 20
Bhu
1
4,1
1
012
uba
1,55
19,4
2
3
73
9
1,50
36
2
ane
5,82
47,
269
30
3.45
978
0,86
,92
esw
20
,358
5
68
23
ar
8
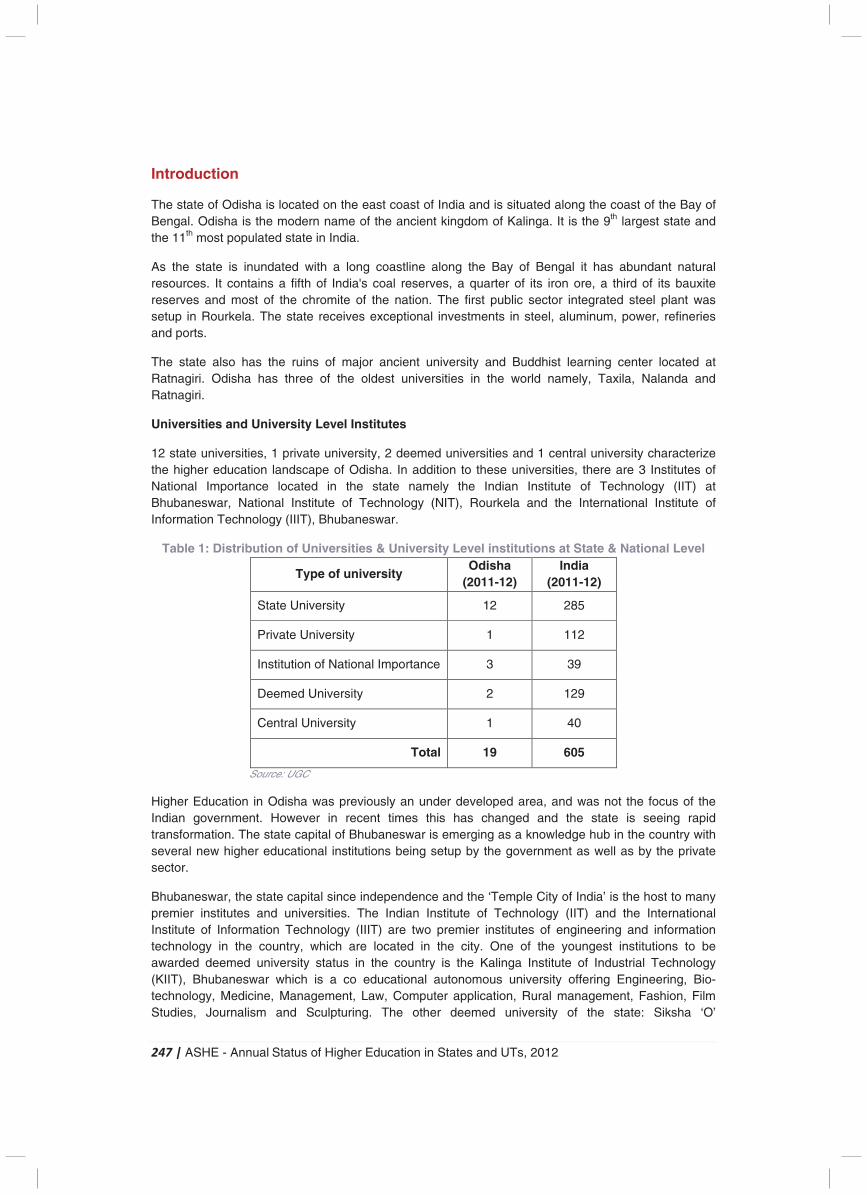
247 | ASHE - Annual Status of Higher Education in States and UTs, 2012
Introduction
The state of Odisha is located on the east coast of India and is situated along the coast of the Bay of Bengal. Odisha is the modern name of the ancient kingdom of Kalinga. It is the 9th largest state and the 11th most populated state in India.
As the state is inundated with a long coastline along the Bay of Bengal it has abundant natural resources. It contains a fifth of India's coal reserves, a quarter of its iron ore, a third of its bauxite reserves and most of the chromite of the nation. The first public sector integrated steel plant was setup in Rourkela. The state receives exceptional investments in steel, aluminum, power, refineries and ports.
The state also has the ruins of major ancient university and Buddhist learning center located at Ratnagiri. Odisha has three of the oldest universities in the world namely, Taxila, Nalanda and Ratnagiri.
Universities and University Level Institutes
12 state universities, 1 private university, 2 deemed universities and 1 central university characterize the higher education landscape of Odisha. In addition to these universities, there are 3 Institutes of National Importance located in the state namely the Indian Institute of Technology (IIT) at Bhubaneswar, National Institute of Technology (NIT), Rourkela and the International Institute of Information Technology (IIIT), Bhubaneswar.
Table 1: Distribution of Universities & University Level institutions at State & National Level
Type of university Odisha
(2011-12) India
(2011-12)
State University 12 285
Private University 1 112
Institution of National Importance 3 39
Deemed University 2 129
Central University 1 40
Total 19 605
Source: UGC
Higher Education in Odisha was previously an under developed area, and was not the focus of the Indian government. However in recent times this has changed and the state is seeing rapid transformation. The state capital of Bhubaneswar is emerging as a knowledge hub in the country with several new higher educational institutions being setup by the government as well as by the private sector.
Bhubaneswar, the state capital since independence and the ‘Temple City of India’ is the host to many premier institutes and universities. The Indian Institute of Technology (IIT) and the International Institute of Information Technology (IIIT) are two premier institutes of engineering and information technology in the country, which are located in the city. One of the youngest institutions to be awarded deemed university status in the country is the Kalinga Institute of Industrial Technology (KIIT), Bhubaneswar which is a co educational autonomous university offering Engineering, Bio-technology, Medicine, Management, Law, Computer application, Rural management, Fashion, Film Studies, Journalism and Sculpturing. The other deemed university of the state: Siksha ‘O’
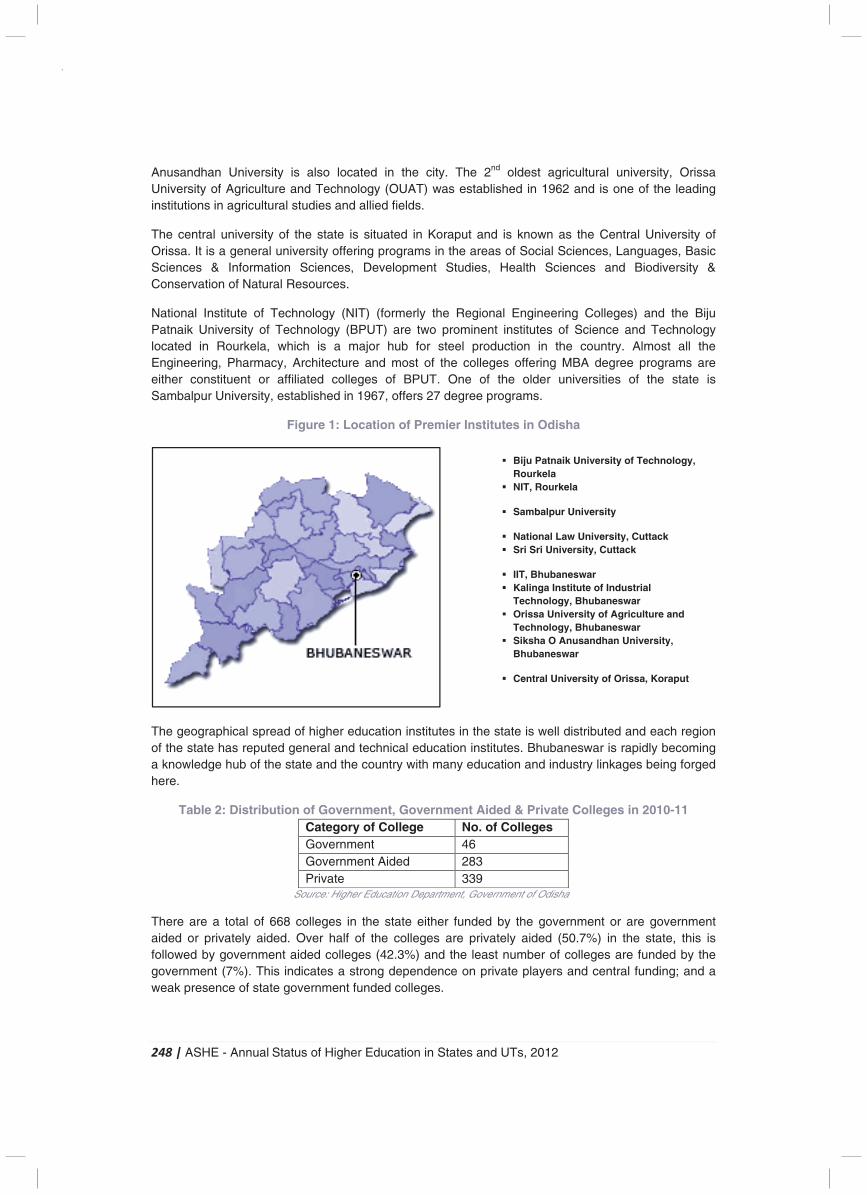
248 | ASHE - Annual Status of Higher Education in States and UTs, 2012
Anusandhan University is also located in the city. The 2nd oldest agricultural university, Orissa University of Agriculture and Technology (OUAT) was established in 1962 and is one of the leading institutions in agricultural studies and allied fields.
The central university of the state is situated in Koraput and is known as the Central University of Orissa. It is a general university offering programs in the areas of Social Sciences, Languages, Basic Sciences & Information Sciences, Development Studies, Health Sciences and Biodiversity & Conservation of Natural Resources.
National Institute of Technology (NIT) (formerly the Regional Engineering Colleges) and the Biju Patnaik University of Technology (BPUT) are two prominent institutes of Science and Technology located in Rourkela, which is a major hub for steel production in the country. Almost all the Engineering, Pharmacy, Architecture and most of the colleges offering MBA degree programs are either constituent or affiliated colleges of BPUT. One of the older universities of the state is Sambalpur University, established in 1967, offers 27 degree programs.
Figure 1: Location of Premier Institutes in Odisha
The geographical spread of higher education institutes in the state is well distributed and each region of the state has reputed general and technical education institutes. Bhubaneswar is rapidly becoming a knowledge hub of the state and the country with many education and industry linkages being forged here.
Table 2: Distribution of Government, Government Aided & Private Colleges in 2010-11 Category of College No. of Colleges Government 46 Government Aided 283 Private 339
Source: Higher Education Department, Government of Odisha
There are a total of 668 colleges in the state either funded by the government or are government aided or privately aided. Over half of the colleges are privately aided (50.7%) in the state, this is followed by government aided colleges (42.3%) and the least number of colleges are funded by the government (7%). This indicates a strong dependence on private players and central funding; and a weak presence of state government funded colleges.
� Biju Patnaik University of Technology, Rourkela
� NIT, Rourkela � Sambalpur University � National Law University, Cuttack � Sri Sri University, Cuttack � IIT, Bhubaneswar � Kalinga Institute of Industrial
Technology, Bhubaneswar � Orissa University of Agriculture and
Technology, Bhubaneswar � Siksha O Anusandhan University,
Bhubaneswar � Central University of Orissa, Koraput
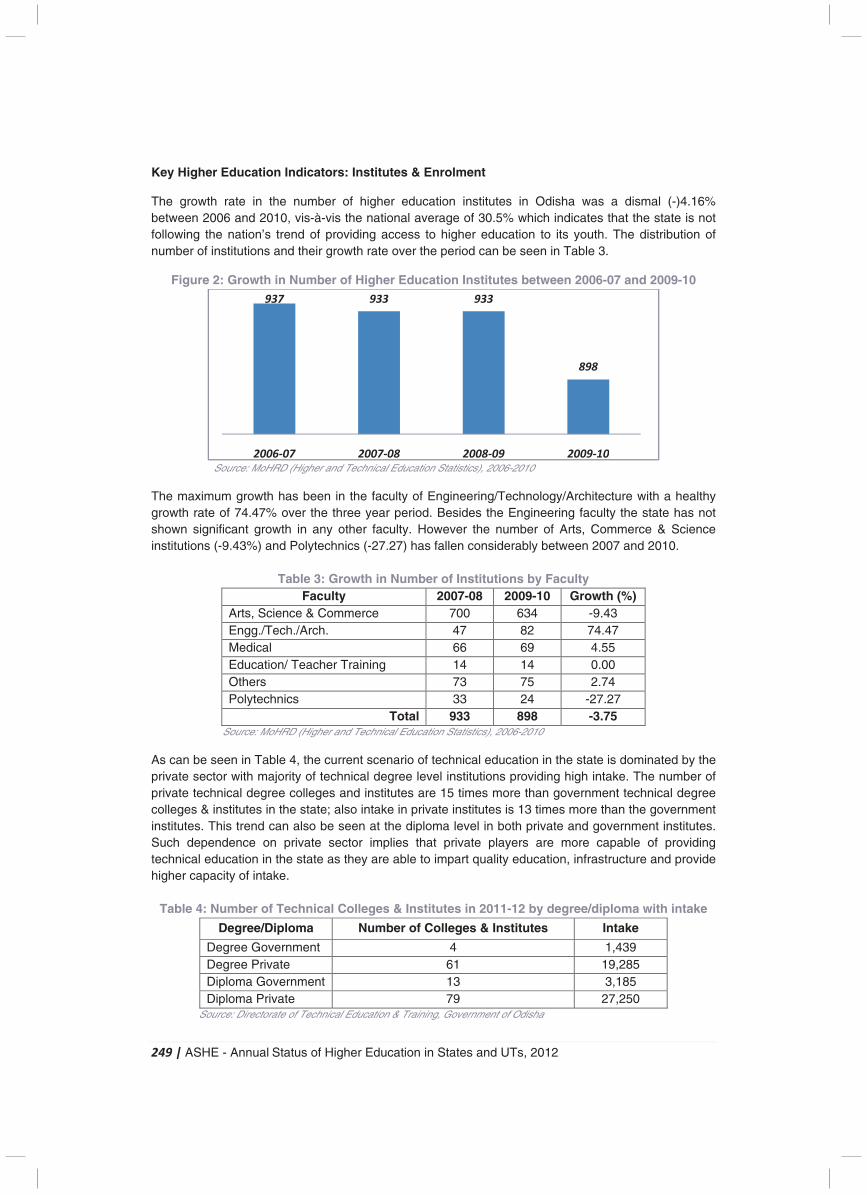
249 | ASHE - Annual Status of Higher Education in States and UTs, 2012
Key Higher Education Indicators: Institutes & Enrolment
The growth rate in the number of higher education institutes in Odisha was a dismal (-)4.16% between 2006 and 2010, vis-à-vis the national average of 30.5% which indicates that the state is not following the nation’s trend of providing access to higher education to its youth. The distribution of number of institutions and their growth rate over the period can be seen in Table 3.
Figure 2: Growth in Number of Higher Education Institutes between 2006-07 and 2009-10
Source: MoHRD (Higher and Technical Education Statistics), 2006-2010
The maximum growth has been in the faculty of Engineering/Technology/Architecture with a healthy growth rate of 74.47% over the three year period. Besides the Engineering faculty the state has not shown significant growth in any other faculty. However the number of Arts, Commerce & Science institutions (-9.43%) and Polytechnics (-27.27) has fallen considerably between 2007 and 2010.
Table 3: Growth in Number of Institutions by Faculty Faculty 2007-08 2009-10 Growth (%)
Arts, Science & Commerce 700 634 -9.43 Engg./Tech./Arch. 47 82 74.47 Medical 66 69 4.55 Education/ Teacher Training 14 14 0.00 Others 73 75 2.74 Polytechnics 33 24 -27.27
Total 933 898 -3.75 Source: MoHRD (Higher and Technical Education Statistics), 2006-2010
As can be seen in Table 4, the current scenario of technical education in the state is dominated by the private sector with majority of technical degree level institutions providing high intake. The number of private technical degree colleges and institutes are 15 times more than government technical degree colleges & institutes in the state; also intake in private institutes is 13 times more than the government institutes. This trend can also be seen at the diploma level in both private and government institutes. Such dependence on private sector implies that private players are more capable of providing technical education in the state as they are able to impart quality education, infrastructure and provide higher capacity of intake.
Table 4: Number of Technical Colleges & Institutes in 2011-12 by degree/diploma with intake
Degree/Diploma Number of Colleges & Institutes Intake
Degree Government 4 1,439 Degree Private 61 19,285 Diploma Government 13 3,185 Diploma Private 79 27,250
Source: Directorate of Technical Education & Training, Government of Odisha
937 933 933
898
2006-07 2007-08 2008-09 2009-10
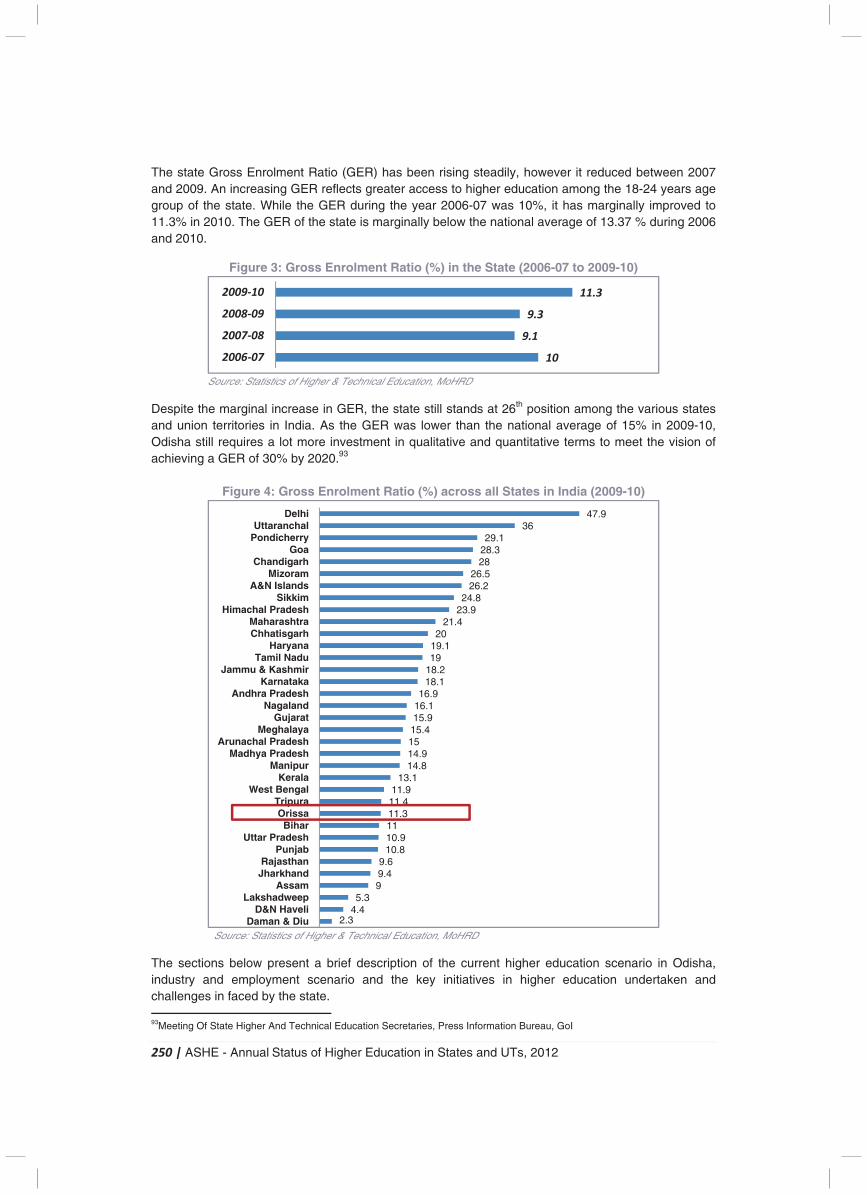
250 | ASHE - Annual Status of Higher Education in States and UTs, 2012
The state Gross Enrolment Ratio (GER) has been rising steadily, however it reduced between 2007 and 2009. An increasing GER reflects greater access to higher education among the 18-24 years age group of the state. While the GER during the year 2006-07 was 10%, it has marginally improved to 11.3% in 2010. The GER of the state is marginally below the national average of 13.37 % during 2006 and 2010.
Figure 3: Gross Enrolment Ratio (%) in the State (2006-07 to 2009-10)
Source: Statistics of Higher & Technical Education, MoHRD
Despite the marginal increase in GER, the state still stands at 26th position among the various states and union territories in India. As the GER was lower than the national average of 15% in 2009-10, Odisha still requires a lot more investment in qualitative and quantitative terms to meet the vision of achieving a GER of 30% by 2020.93
Figure 4: Gross Enrolment Ratio (%) across all States in India (2009-10)
Source: Statistics of Higher & Technical Education, MoHRD
The sections below present a brief description of the current higher education scenario in Odisha, industry and employment scenario and the key initiatives in higher education undertaken and challenges in faced by the state. 93Meeting Of State Higher And Technical Education Secretaries, Press Information Bureau, GoI
10
9.1
9.3
11.3
2006-07
2007-08
2008-09
2009-10
2.34.45.3
99.49.6
10.810.91111.311.411.9
13.114.814.91515.415.916.116.9
18.118.21919.120
21.423.924.8
26.226.5
2828.329.1
3647.9
Daman & DiuD&N Haveli
LakshadweepAssam
JharkhandRajasthan
PunjabUttar Pradesh
BiharOrissa
TripuraWest Bengal
KeralaManipur
Madhya PradeshArunachal Pradesh
MeghalayaGujarat
NagalandAndhra Pradesh
KarnatakaJammu & Kashmir
Tamil NaduHaryana
ChhatisgarhMaharashtra
Himachal PradeshSikkim
A&N IslandsMizoram
ChandigarhGoa
PondicherryUttaranchal
Delhi
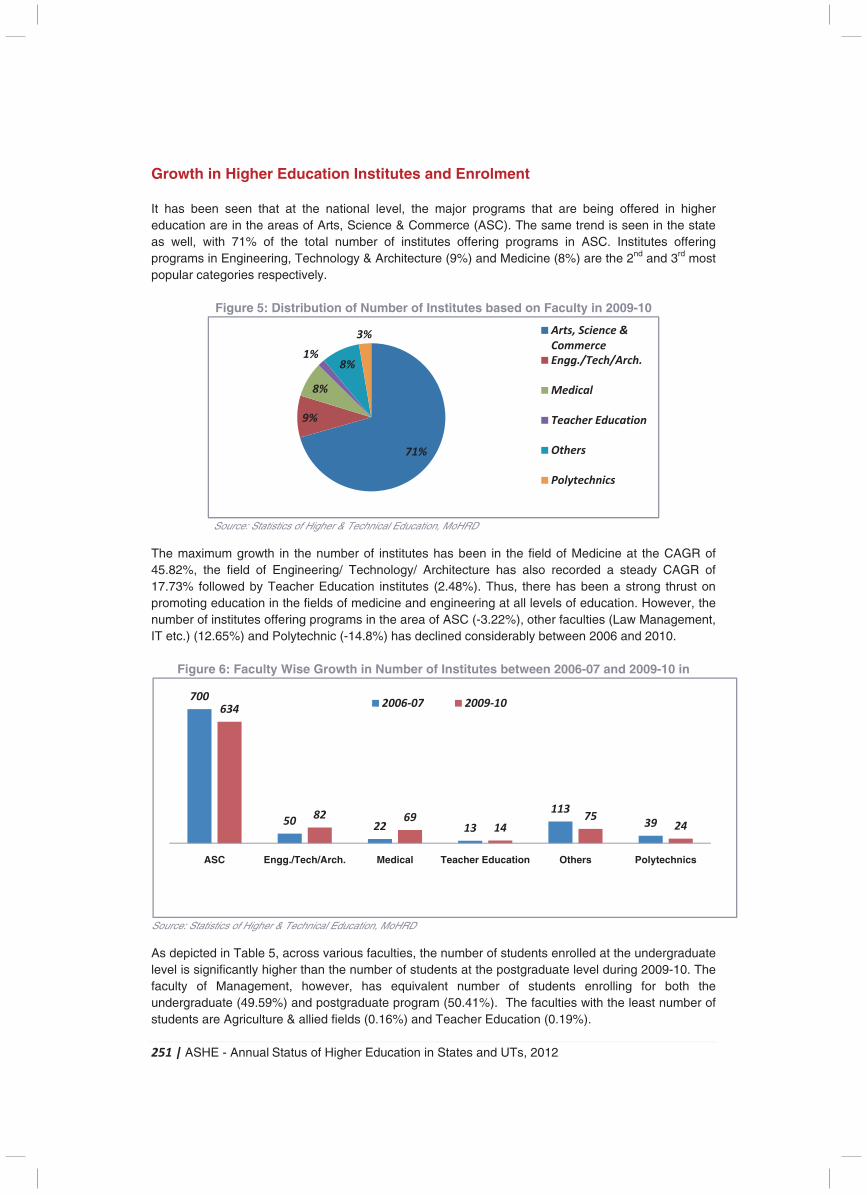
251 | ASHE - Annual Status of Higher Education in States and UTs, 2012
Growth in Higher Education Institutes and Enrolment It has been seen that at the national level, the major programs that are being offered in higher education are in the areas of Arts, Science & Commerce (ASC). The same trend is seen in the state as well, with 71% of the total number of institutes offering programs in ASC. Institutes offering programs in Engineering, Technology & Architecture (9%) and Medicine (8%) are the 2nd and 3rd most popular categories respectively.
Figure 5: Distribution of Number of Institutes based on Faculty in 2009-10
Source: Statistics of Higher & Technical Education, MoHRD
The maximum growth in the number of institutes has been in the field of Medicine at the CAGR of 45.82%, the field of Engineering/ Technology/ Architecture has also recorded a steady CAGR of 17.73% followed by Teacher Education institutes (2.48%). Thus, there has been a strong thrust on promoting education in the fields of medicine and engineering at all levels of education. However, the number of institutes offering programs in the area of ASC (-3.22%), other faculties (Law Management, IT etc.) (12.65%) and Polytechnic (-14.8%) has declined considerably between 2006 and 2010.
Figure 6: Faculty Wise Growth in Number of Institutes between 2006-07 and 2009-10 in
Source: Statistics of Higher & Technical Education, MoHRD
As depicted in Table 5, across various faculties, the number of students enrolled at the undergraduate level is significantly higher than the number of students at the postgraduate level during 2009-10. The faculty of Management, however, has equivalent number of students enrolling for both the undergraduate (49.59%) and postgraduate program (50.41%). The faculties with the least number of students are Agriculture & allied fields (0.16%) and Teacher Education (0.19%).
(-3.22%)
(17.73%)(45.82%)
(2.48%) (-12.65%) (-14.8%)
71%
9%
8%
1%8%
3% Arts, Science &
Commerce
Engg./Tech/Arch.
Medical
Teacher Education
Others
Polytechnics
700
50 22 13
113
39
634
82 6914
7524
ASC Engg./Tech/Arch. Medical Teacher Education Others Polytechnics
2006-07 2009-10
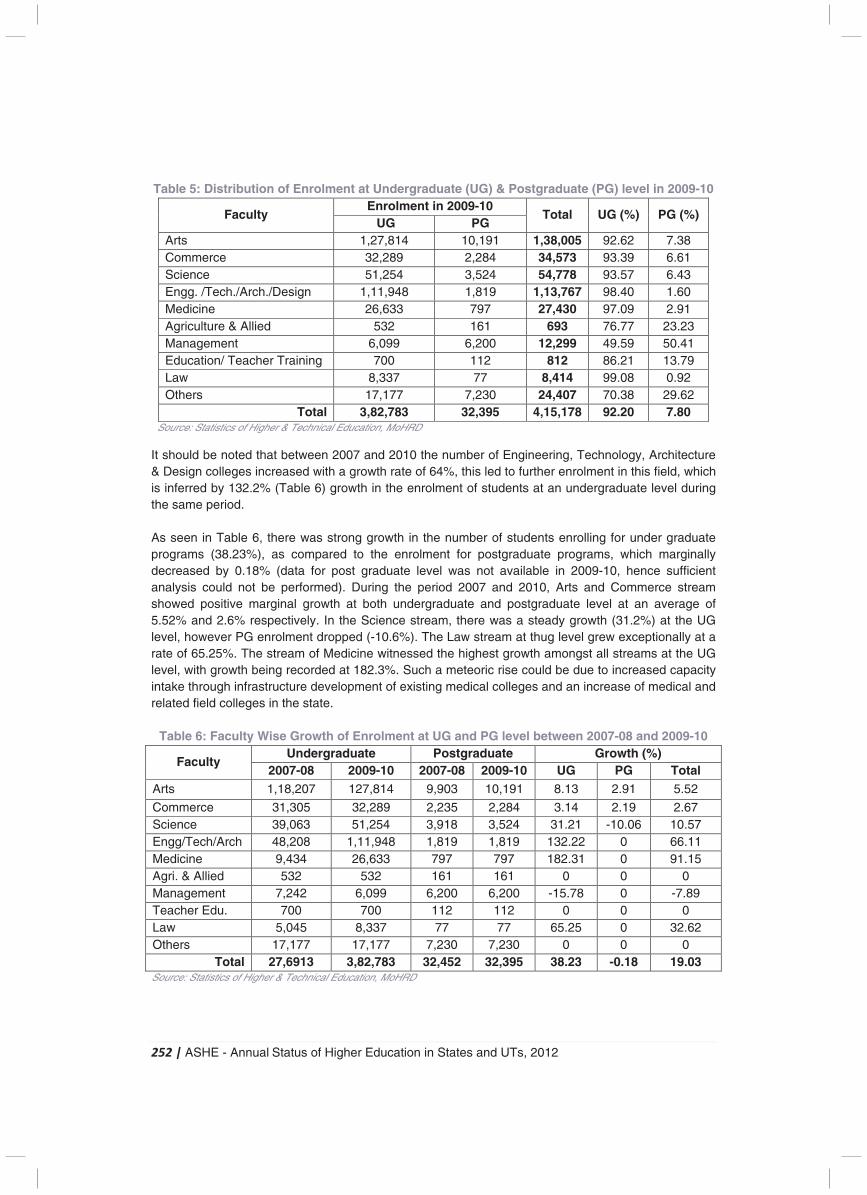
252 | ASHE - Annual Status of Higher Education in States and UTs, 2012
Table 5: Distribution of Enrolment at Undergraduate (UG) & Postgraduate (PG) level in 2009-10
Faculty Enrolment in 2009-10
Total UG (%) PG (%) UG PG
Arts 1,27,814 10,191 1,38,005 92.62 7.38 Commerce 32,289 2,284 34,573 93.39 6.61 Science 51,254 3,524 54,778 93.57 6.43 Engg. /Tech./Arch./Design 1,11,948 1,819 1,13,767 98.40 1.60 Medicine 26,633 797 27,430 97.09 2.91 Agriculture & Allied 532 161 693 76.77 23.23 Management 6,099 6,200 12,299 49.59 50.41 Education/ Teacher Training 700 112 812 86.21 13.79 Law 8,337 77 8,414 99.08 0.92 Others 17,177 7,230 24,407 70.38 29.62
Total 3,82,783 32,395 4,15,178 92.20 7.80 Source: Statistics of Higher & Technical Education, MoHRD
It should be noted that between 2007 and 2010 the number of Engineering, Technology, Architecture & Design colleges increased with a growth rate of 64%, this led to further enrolment in this field, which is inferred by 132.2% (Table 6) growth in the enrolment of students at an undergraduate level during the same period. As seen in Table 6, there was strong growth in the number of students enrolling for under graduate programs (38.23%), as compared to the enrolment for postgraduate programs, which marginally decreased by 0.18% (data for post graduate level was not available in 2009-10, hence sufficient analysis could not be performed). During the period 2007 and 2010, Arts and Commerce stream showed positive marginal growth at both undergraduate and postgraduate level at an average of 5.52% and 2.6% respectively. In the Science stream, there was a steady growth (31.2%) at the UG level, however PG enrolment dropped (-10.6%). The Law stream at thug level grew exceptionally at a rate of 65.25%. The stream of Medicine witnessed the highest growth amongst all streams at the UG level, with growth being recorded at 182.3%. Such a meteoric rise could be due to increased capacity intake through infrastructure development of existing medical colleges and an increase of medical and related field colleges in the state.
Table 6: Faculty Wise Growth of Enrolment at UG and PG level between 2007-08 and 2009-10
Faculty Undergraduate Postgraduate Growth (%)
2007-08 2009-10 2007-08 2009-10 UG PG Total Arts 1,18,207 127,814 9,903 10,191 8.13 2.91 5.52
Commerce 31,305 32,289 2,235 2,284 3.14 2.19 2.67 Science 39,063 51,254 3,918 3,524 31.21 -10.06 10.57 Engg/Tech/Arch 48,208 1,11,948 1,819 1,819 132.22 0 66.11 Medicine 9,434 26,633 797 797 182.31 0 91.15 Agri. & Allied 532 532 161 161 0 0 0 Management 7,242 6,099 6,200 6,200 -15.78 0 -7.89 Teacher Edu. 700 700 112 112 0 0 0 Law 5,045 8,337 77 77 65.25 0 32.62 Others 17,177 17,177 7,230 7,230 0 0 0
Total 27,6913 3,82,783 32,452 32,395 38.23 -0.18 19.03 Source: Statistics of Higher & Technical Education, MoHRD
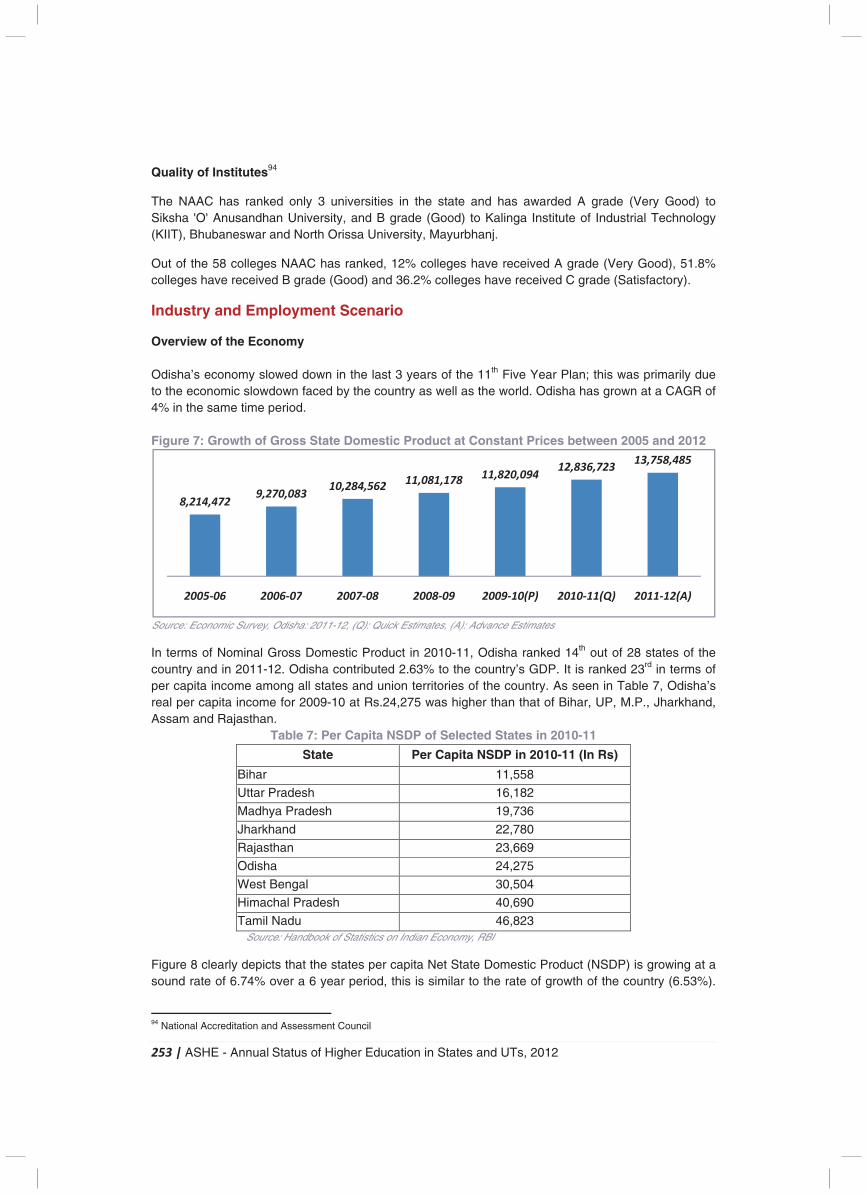
253 | ASHE - Annual Status of Higher Education in States and UTs, 2012
Quality of Institutes94
The NAAC has ranked only 3 universities in the state and has awarded A grade (Very Good) to Siksha 'O' Anusandhan University, and B grade (Good) to Kalinga Institute of Industrial Technology (KIIT), Bhubaneswar and North Orissa University, Mayurbhanj.
Out of the 58 colleges NAAC has ranked, 12% colleges have received A grade (Very Good), 51.8% colleges have received B grade (Good) and 36.2% colleges have received C grade (Satisfactory).
Industry and Employment Scenario
Overview of the Economy Odisha’s economy slowed down in the last 3 years of the 11th Five Year Plan; this was primarily due to the economic slowdown faced by the country as well as the world. Odisha has grown at a CAGR of 4% in the same time period.
Figure 7: Growth of Gross State Domestic Product at Constant Prices between 2005 and 2012
Source: Economic Survey, Odisha: 2011-12, (Q): Quick Estimates, (A): Advance Estimates
In terms of Nominal Gross Domestic Product in 2010-11, Odisha ranked 14th out of 28 states of the country and in 2011-12. Odisha contributed 2.63% to the country’s GDP. It is ranked 23rd in terms of per capita income among all states and union territories of the country. As seen in Table 7, Odisha’s real per capita income for 2009-10 at Rs.24,275 was higher than that of Bihar, UP, M.P., Jharkhand, Assam and Rajasthan.
Table 7: Per Capita NSDP of Selected States in 2010-11
State Per Capita NSDP in 2010-11 (In Rs)
Bihar 11,558
Uttar Pradesh 16,182
Madhya Pradesh 19,736
Jharkhand 22,780
Rajasthan 23,669
Odisha 24,275
West Bengal 30,504
Himachal Pradesh 40,690
Tamil Nadu 46,823 Source: Handbook of Statistics on Indian Economy, RBI
Figure 8 clearly depicts that the states per capita Net State Domestic Product (NSDP) is growing at a sound rate of 6.74% over a 6 year period, this is similar to the rate of growth of the country (6.53%).
94 National Accreditation and Assessment Council
CAGR4%
8,214,4729,270,083
10,284,56211,081,178 11,820,094
12,836,72313,758,485
2005-06 2006-07 2007-08 2008-09 2009-10(P) 2010-11(Q) 2011-12(A)
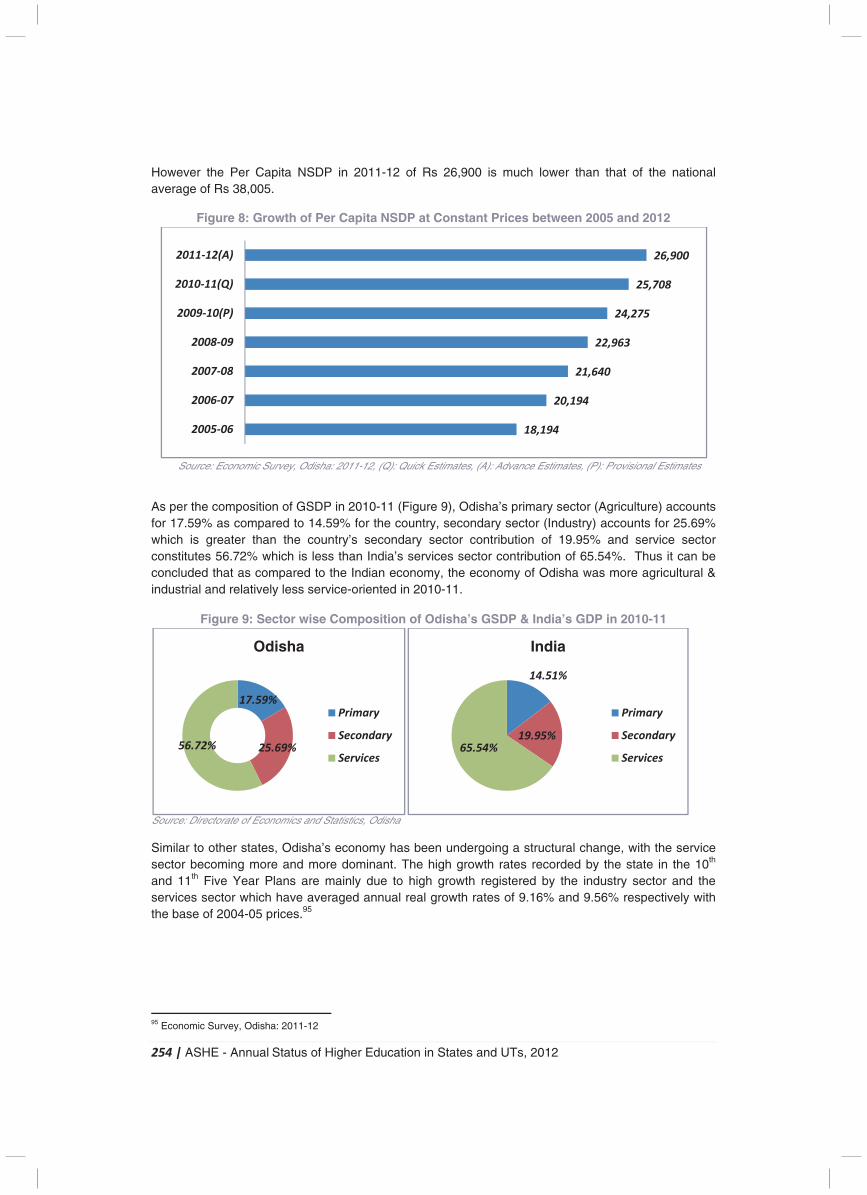
254 | ASHE - Annual Status of Higher Education in States and UTs, 2012
However the Per Capita NSDP in 2011-12 of Rs 26,900 is much lower than that of the national average of Rs 38,005.
Figure 8: Growth of Per Capita NSDP at Constant Prices between 2005 and 2012
Source: Economic Survey, Odisha: 2011-12, (Q): Quick Estimates, (A): Advance Estimates, (P): Provisional Estimates
As per the composition of GSDP in 2010-11 (Figure 9), Odisha’s primary sector (Agriculture) accounts for 17.59% as compared to 14.59% for the country, secondary sector (Industry) accounts for 25.69% which is greater than the country’s secondary sector contribution of 19.95% and service sector constitutes 56.72% which is less than India’s services sector contribution of 65.54%. Thus it can be concluded that as compared to the Indian economy, the economy of Odisha was more agricultural & industrial and relatively less service-oriented in 2010-11.
Figure 9: Sector wise Composition of Odisha’s GSDP & India’s GDP in 2010-11
Source: Directorate of Economics and Statistics, Odisha
Similar to other states, Odisha’s economy has been undergoing a structural change, with the service sector becoming more and more dominant. The high growth rates recorded by the state in the 10th and 11th Five Year Plans are mainly due to high growth registered by the industry sector and the services sector which have averaged annual real growth rates of 9.16% and 9.56% respectively with the base of 2004-05 prices.95
95 Economic Survey, Odisha: 2011-12
CAGR 6.74%
18,194
20,194
21,640
22,963
24,275
25,708
26,900
2005-06
2006-07
2007-08
2008-09
2009-10(P)
2010-11(Q)
2011-12(A)
17.59%
25.69%56.72%
Odisha
Primary
Secondary
Services
14.51%
19.95%65.54%
India
Primary
Secondary
Services
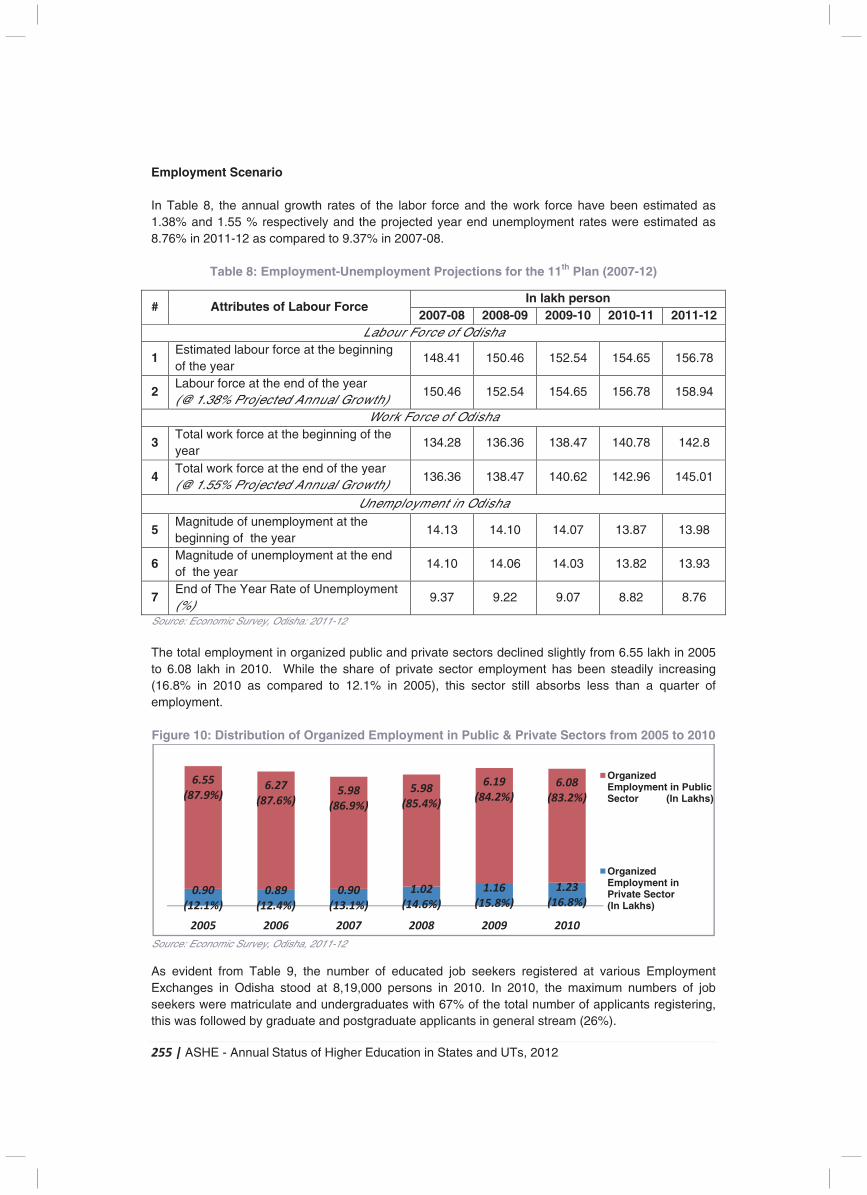
255 | ASHE - Annual Status of Higher Education in States and UTs, 2012
Employment Scenario In Table 8, the annual growth rates of the labor force and the work force have been estimated as 1.38% and 1.55 % respectively and the projected year end unemployment rates were estimated as 8.76% in 2011-12 as compared to 9.37% in 2007-08.
Table 8: Employment-Unemployment Projections for the 11th Plan (2007-12)
Source: Economic Survey, Odisha: 2011-12 The total employment in organized public and private sectors declined slightly from 6.55 lakh in 2005 to 6.08 lakh in 2010. While the share of private sector employment has been steadily increasing (16.8% in 2010 as compared to 12.1% in 2005), this sector still absorbs less than a quarter of employment. Figure 10: Distribution of Organized Employment in Public & Private Sectors from 2005 to 2010
Source: Economic Survey, Odisha, 2011-12
As evident from Table 9, the number of educated job seekers registered at various Employment Exchanges in Odisha stood at 8,19,000 persons in 2010. In 2010, the maximum numbers of job seekers were matriculate and undergraduates with 67% of the total number of applicants registering, this was followed by graduate and postgraduate applicants in general stream (26%).
0.90
(12.1%)
0.89
(12.4%)
0.90
(13.1%)
1.02
(14.6%)
1.16
(15.8%)
1.23
(16.8%)
6.55
(87.9%)6.27
(87.6%)5.98
(86.9%)
5.98
(85.4%)
6.19
(84.2%)
6.08
(83.2%)
2005 2006 2007 2008 2009 2010
Organized Employment in Public Sector (In Lakhs)
Organized Employment in Private Sector (In Lakhs)
# Attributes of Labour Force In lakh person
2007-08 2008-09 2009-10 2010-11 2011-12 Labour Force of Odisha
1 Estimated labour force at the beginning of the year
148.41 150.46 152.54 154.65 156.78
2 Labour force at the end of the year (@ 1.38% Projected Annual Growth) 150.46 152.54 154.65 156.78 158.94
Work Force of Odisha
3 Total work force at the beginning of the year
134.28 136.36 138.47 140.78 142.8
4 Total work force at the end of the year (@ 1.55% Projected Annual Growth) 136.36 138.47 140.62 142.96 145.01
Unemployment in Odisha
5 Magnitude of unemployment at the beginning of the year
14.13 14.10 14.07 13.87 13.98
6 Magnitude of unemployment at the end of the year
14.10 14.06 14.03 13.82 13.93
7 End of The Year Rate of Unemployment (%)
9.37 9.22 9.07 8.82 8.76
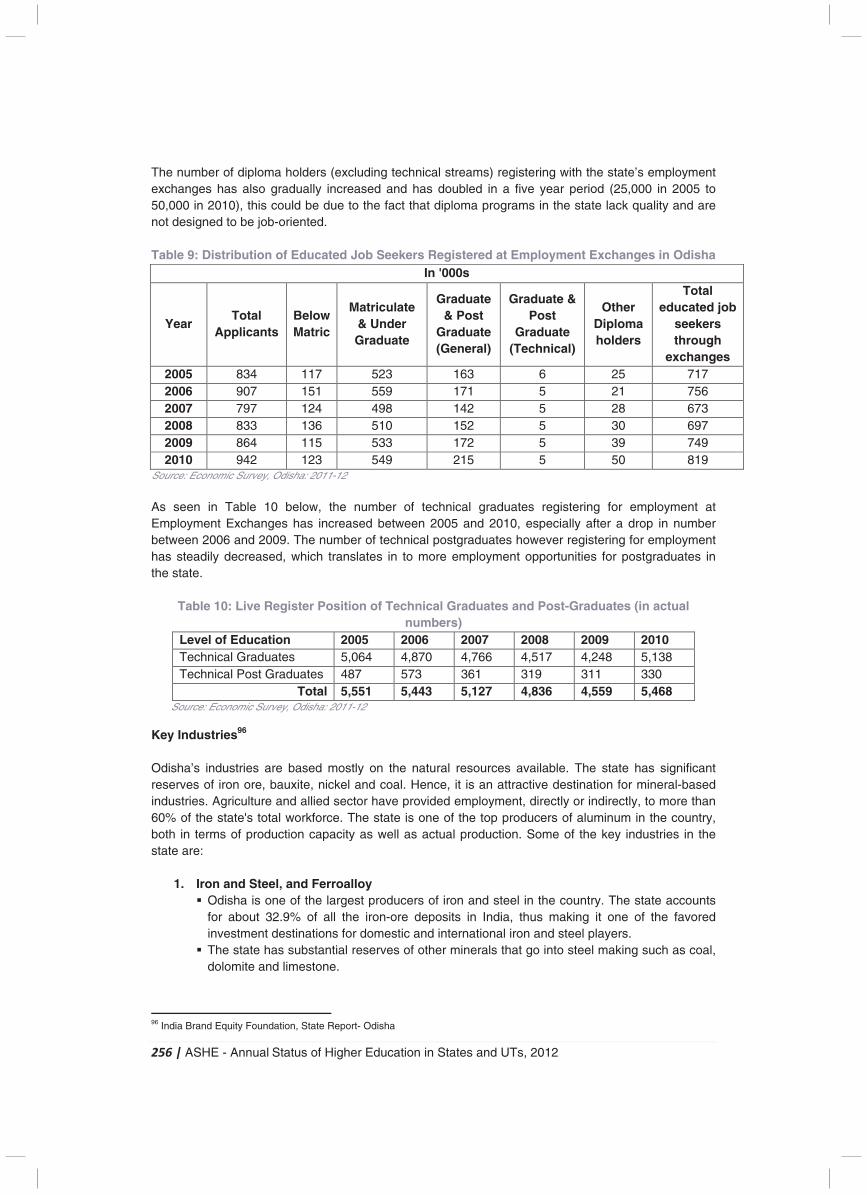
256 | ASHE - Annual Status of Higher Education in States and UTs, 2012
The number of diploma holders (excluding technical streams) registering with the state’s employment exchanges has also gradually increased and has doubled in a five year period (25,000 in 2005 to 50,000 in 2010), this could be due to the fact that diploma programs in the state lack quality and are not designed to be job-oriented. Table 9: Distribution of Educated Job Seekers Registered at Employment Exchanges in Odisha
In '000s
Year Total
Applicants Below Matric
Matriculate & Under Graduate
Graduate & Post
Graduate (General)
Graduate & Post
Graduate (Technical)
Other Diploma holders
Total educated job
seekers through
exchanges 2005 834 117 523 163 6 25 717 2006 907 151 559 171 5 21 756 2007 797 124 498 142 5 28 673 2008 833 136 510 152 5 30 697 2009 864 115 533 172 5 39 749 2010 942 123 549 215 5 50 819
Source: Economic Survey, Odisha: 2011-12 As seen in Table 10 below, the number of technical graduates registering for employment at Employment Exchanges has increased between 2005 and 2010, especially after a drop in number between 2006 and 2009. The number of technical postgraduates however registering for employment has steadily decreased, which translates in to more employment opportunities for postgraduates in the state.
Table 10: Live Register Position of Technical Graduates and Post-Graduates (in actual numbers)
Level of Education 2005 2006 2007 2008 2009 2010 Technical Graduates 5,064 4,870 4,766 4,517 4,248 5,138 Technical Post Graduates 487 573 361 319 311 330
Total 5,551 5,443 5,127 4,836 4,559 5,468 Source: Economic Survey, Odisha: 2011-12 Key Industries96
Odisha’s industries are based mostly on the natural resources available. The state has significant reserves of iron ore, bauxite, nickel and coal. Hence, it is an attractive destination for mineral-based industries. Agriculture and allied sector have provided employment, directly or indirectly, to more than 60% of the state's total workforce. The state is one of the top producers of aluminum in the country, both in terms of production capacity as well as actual production. Some of the key industries in the state are:
1. Iron and Steel, and Ferroalloy � Odisha is one of the largest producers of iron and steel in the country. The state accounts
for about 32.9% of all the iron-ore deposits in India, thus making it one of the favored investment destinations for domestic and international iron and steel players.
� The state has substantial reserves of other minerals that go into steel making such as coal, dolomite and limestone.
96 India Brand Equity Foundation, State Report- Odisha
257 | ASHE - Annual Status of Higher Education in States and UTs, 2012
� Key players in this sector who have setup businesses in the state are Tata Steel, POSCO India Pvt Ltd, Visa Steel Ltd and Essar Steel.
2. Aluminum
� Odisha has over 50% of the bauxite reserves of India, making it an ideal location for setting up aluminum and aluminum-based companies. It also has adequate water and power supply for such industries.
� Some key players in this segment are National Aluminum Company Limited, Hindalco Industries Limited and Vedanta Group.
3. Handloom
� Odisha’s small scale industries (SSI) are characterized by low capital investment, low gestation period, high value addition, and high export promotion prospects.
� The Orissa State Cooperative Handicrafts Corporation is engaged in strengthening the production base, enhancing marketing opportunities, encouraging exporters and introducing new designs and technology in the handicrafts sector.
4. Agro-Based Industry
� Odisha's main agriculture products are rice, pulses, oilseeds, vegetables, groundnut, cotton, jute, coconut, spices, potato and fruits. Coconut is cultivated over an area of around 52,200 hectares.
� There is a vast scope for agro-based industries for rice, lentils, edible oil-milling, dehydration of vegetables, maize-milling, cattle and poultry rearing, cotton oil, potato chips, coconut oil, sugar mills, mushroom cultivation, non-edible oils and others.
� Key players in this field are Nayagarh Sugar Complex Limited, Sakthi Sugars Limited, Aska Cooperative Sugar Industries Limited and Paradeep Phosphates Limited
5. Mining
� The key minerals found in the state are iron, coal, bauxite, manganese, nickel, chromite, limestone, dolomite, graphite, decorative stones, beach sand, china clay, tin ore, etc.
� Odisha is one of India’s richest states in terms of mineral reserves. � Major players which have undertaken mining activity in the state are Orissa Mining
Corporation, Mahanadi Coalfields Limited, Rungta Mines Limited and Ferro Alloy Corporation Limited (FACOR)
6. IT/ITeS & Electronics Industry
� The IT sector is dominated by over 300 small and medium enterprises. The sector employs about 12,000 software professionals.
� The state has an ample talent pool to cater to the needs of this industry. It produces 20,000 B.Tech and MCA graduates, about 3,000 management professionals and 50,000 general graduates every year.
� Prominent players in this sector which do business in Odisha are Infosys Ltd, Tata Consultancy Services, Wipro Ltd and Orisys Infotech Pvt Ltd.
7. Tourism
� Odisha has vast potential for the development of tourism. It is one of the critical sectors of the state economy in terms of foreign exchange earnings as well employment generation opportunities.
� Bhubaneswar, the capital city of the state, is known as the temple city of India and is home to about 500 temples. Puri, Bhubaneswar and Konark are the main centres for religious
tourism in the state.
258 | ASHE - Annual Status of Higher Education in States and UTs, 2012
Key Challenges and Educational Initiatives Key Challenges
� The state suffers from a lack of qualified teachers in professional courses. � The quality of diploma teaching is below par and there is a need for a National Institute for
Technical Teachers Training and Research (NITTTR), which can help train teachers to impart knowledge better.
� There is a need for new engineering and polytechnics in different districts of the state and demand for more multilingual schools, especially in tribal areas.
� Provisions for infrastructure facilities at engineering colleges, polytechnics and ITIs are needed urgently. Ways to bring in more private players should be looked in to as the demand for UG level courses is increasing every year.
� Higher and technical education departments should cater to the needs of the youth by providing them latest market driven and job oriented courses.
� Implementation of National Vocational Quality Education Framework (NVQEF) through engineering colleges, ITIs and polytechnics needs suitable action.
Initiatives Started
� National Law University established during 11th Five Year Plan in Cuttack. � Infrastructure assistance given to Institute of Information Technology (IIT) (Sambalpur
University) and the institute was established as an autonomous constituent institute on the lines of IITs to impart training and have quality research programs related to IT and allied subjects.
� Infrastructure grant to Ravenshaw University and other non government aided colleges. � Students Academic Management System (SAMS): e-admission process for all degree
colleges in the state. � New initiative in e-governance such as e-Abhiyog and Personnel Management Information
System, Human Resources Management System etc. � To monitor the academic performance, infrastructure, proper utilization of Government&
UGC grants; the state government established an Evaluation & Monitoring Cell to ensure observance of quality parameters by the institutions and the quality of academic delivery.
� Establishment of Centre of Excellence for multi skill education including language skills. English language laboratories have been proposed in all government colleges.
� Odisha Knowledge Corporation Limited established in JV with Maharashtra Knowledge Corporation Limited with a view to accelerate socio-economic development of the state by providing IT education.
� Career Advancement Scheme has been given to faculty in government colleges and non government aided colleges by giving them promotion to Lecturer and Reader grade.
� To promote technical and professional education, the state government has introduced award of Rs 10,000 per year per student pursuing professional education (Medical/Engineering/BDS etc.) with a target of 10,000 students.
� Skill development initiatives based on Modular Employable Skill have been implemented.
Initiatives Proposed
� National Mission on Education through Information & Communication Technology funded by Government of India.
� Uniform academic calendar for all institutions. � Establishment of 8 new model colleges where GER is less than the national average.
Establishment of Government Vocational Junior Educational Colleges.
259 | ASHE - Annual Status of Higher Education in States and UTs, 2012
� Infrastructure support for new engineering colleges, existing technological universities and polytechnics.
� Teacher Education Quality Improvement Program Phase (TEQIP) II needs to be implemented and work of TEQIP I needs be further improved.
� Infrastructure support to new and existing ITIs. Introduction of Hospitality sector courses at select ITIs.
� Establishment of Central Placement Cell. � Establishment of state of art Institute of Training of Trainers (IToT) to meet the need of
training trainers and skill gap training of the polytechnic graduates and ITI graduates. � Implementation of ICT program.
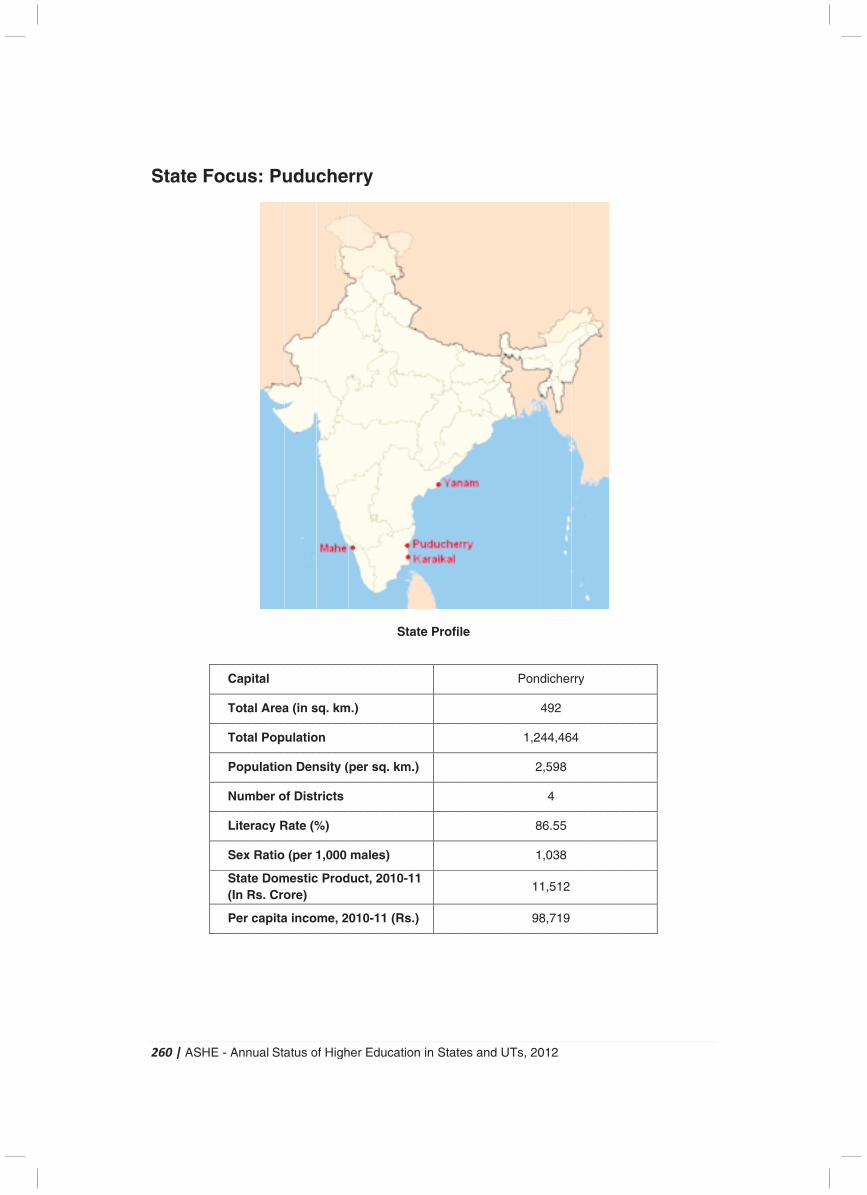
2
S
260
Sta
| A
ate
ASH
e F
HE
Fo
- A
oc
C
To
To
Po
N
Li
Se
St(In
Pe
Ann
us
api
ota
ota
opu
um
iter
ex
taten R
er c
ual
s:
ital
al A
al P
ula
mbe
rac
Ra
e DRs.
cap
Sta
Pu
l
Area
Pop
atio
er o
y R
atio
DomCro
pita
atu
ud
a (i
ula
n D
of D
Rate
(pe
mesore
a in
s o
du
n s
atio
Den
Dist
e (%
er 1
stice)
nco
of H
ch
sq.
on
nsit
tric
%)
1,0
c Pr
me
High
he
km
ty (
ts
00
rod
e, 2
her
rry
m.)
(per
ma
duc
010
Ed
y
r sq
ales
t, 2
0-1
uca
q. k
s)
201
1 (
atio
Sta
km.
0-1
Rs.
on in
ate
.)
11
.)
n S
Pr
Stat
ofi
es
le
and
d U
UTs
P
, 20
Pon
1,2
2
8
1
1
98
012
dic
492
244,
2,59
4
86.5
,03
1,5
8,7
2
her
2
,46
98
55
38
12
19
rry
4
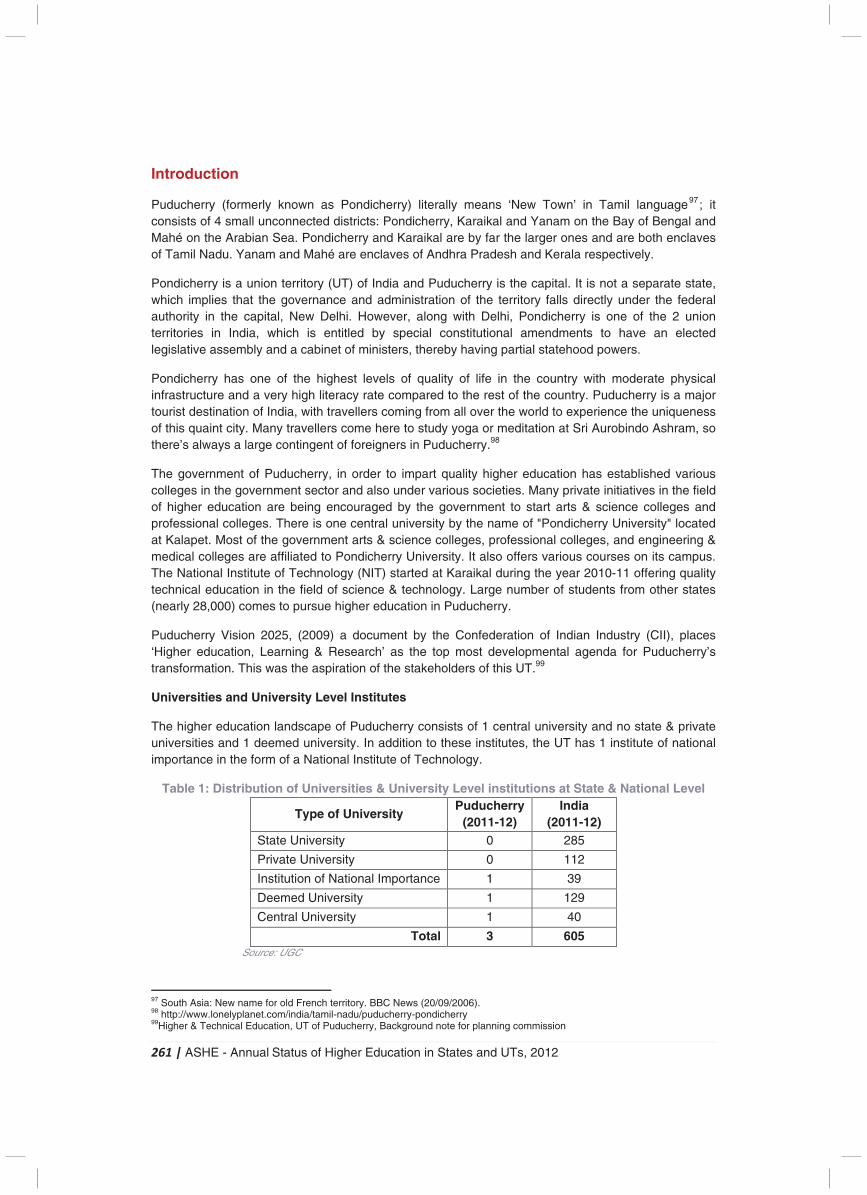
261 | ASHE - Annual Status of Higher Education in States and UTs, 2012
Introduction
Puducherry (formerly known as Pondicherry) literally means ‘New Town’ in Tamil language97; it consists of 4 small unconnected districts: Pondicherry, Karaikal and Yanam on the Bay of Bengal and Mahé on the Arabian Sea. Pondicherry and Karaikal are by far the larger ones and are both enclaves of Tamil Nadu. Yanam and Mahé are enclaves of Andhra Pradesh and Kerala respectively.
Pondicherry is a union territory (UT) of India and Puducherry is the capital. It is not a separate state, which implies that the governance and administration of the territory falls directly under the federal authority in the capital, New Delhi. However, along with Delhi, Pondicherry is one of the 2 union territories in India, which is entitled by special constitutional amendments to have an elected legislative assembly and a cabinet of ministers, thereby having partial statehood powers.
Pondicherry has one of the highest levels of quality of life in the country with moderate physical infrastructure and a very high literacy rate compared to the rest of the country. Puducherry is a major tourist destination of India, with travellers coming from all over the world to experience the uniqueness of this quaint city. Many travellers come here to study yoga or meditation at Sri Aurobindo Ashram, so there’s always a large contingent of foreigners in Puducherry.98
The government of Puducherry, in order to impart quality higher education has established various colleges in the government sector and also under various societies. Many private initiatives in the field of higher education are being encouraged by the government to start arts & science colleges and professional colleges. There is one central university by the name of "Pondicherry University" located at Kalapet. Most of the government arts & science colleges, professional colleges, and engineering & medical colleges are affiliated to Pondicherry University. It also offers various courses on its campus. The National Institute of Technology (NIT) started at Karaikal during the year 2010-11 offering quality technical education in the field of science & technology. Large number of students from other states (nearly 28,000) comes to pursue higher education in Puducherry.
Puducherry Vision 2025, (2009) a document by the Confederation of Indian Industry (CII), places ‘Higher education, Learning & Research’ as the top most developmental agenda for Puducherry’s transformation. This was the aspiration of the stakeholders of this UT.99
Universities and University Level Institutes
The higher education landscape of Puducherry consists of 1 central university and no state & private universities and 1 deemed university. In addition to these institutes, the UT has 1 institute of national importance in the form of a National Institute of Technology.
Table 1: Distribution of Universities & University Level institutions at State & National Level
Type of University Puducherry
(2011-12) India
(2011-12) State University 0 285
Private University 0 112
Institution of National Importance 1 39
Deemed University 1 129
Central University 1 40
Total 3 605 Source: UGC
97 South Asia: New name for old French territory. BBC News (20/09/2006). 98 http://www.lonelyplanet.com/india/tamil-nadu/puducherry-pondicherry 99Higher & Technical Education, UT of Puducherry, Background note for planning commission
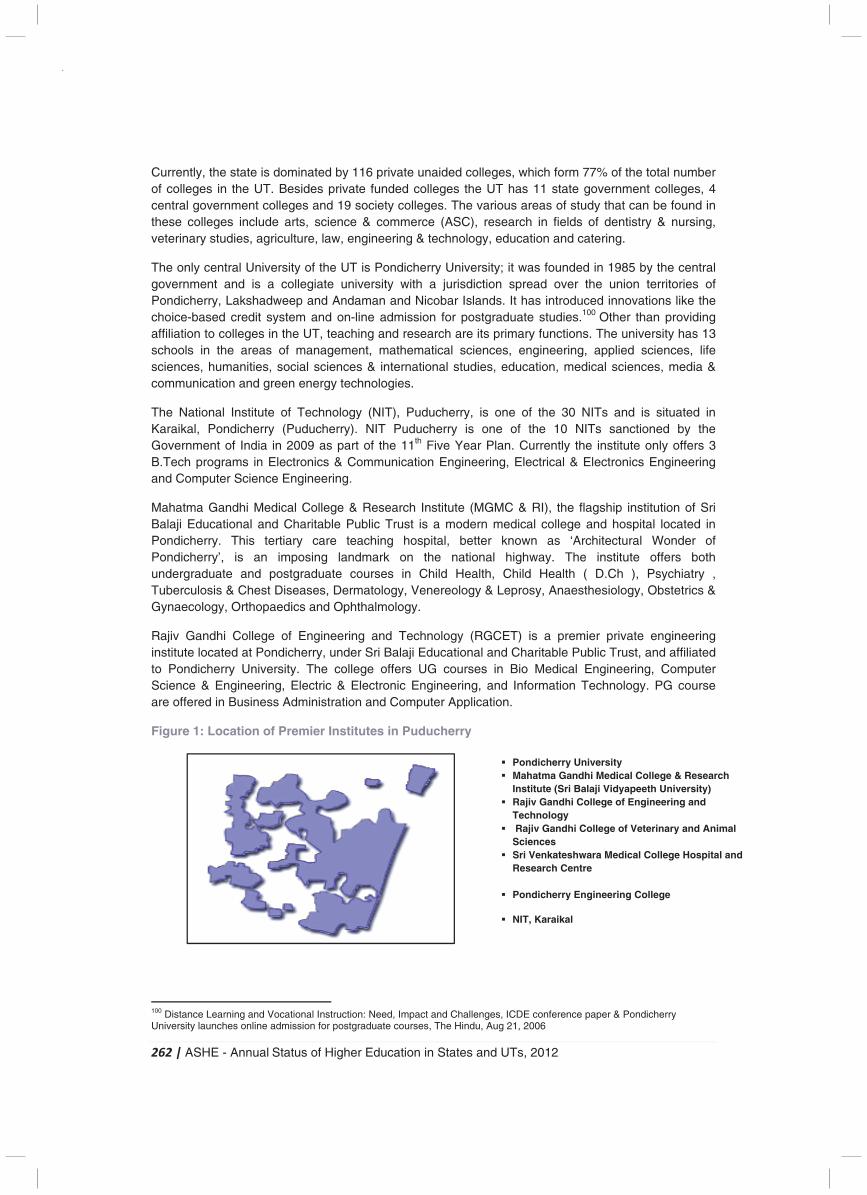
262 | ASHE - Annual Status of Higher Education in States and UTs, 2012
Currently, the state is dominated by 116 private unaided colleges, which form 77% of the total number of colleges in the UT. Besides private funded colleges the UT has 11 state government colleges, 4 central government colleges and 19 society colleges. The various areas of study that can be found in these colleges include arts, science & commerce (ASC), research in fields of dentistry & nursing, veterinary studies, agriculture, law, engineering & technology, education and catering.
The only central University of the UT is Pondicherry University; it was founded in 1985 by the central government and is a collegiate university with a jurisdiction spread over the union territories of Pondicherry, Lakshadweep and Andaman and Nicobar Islands. It has introduced innovations like the choice-based credit system and on-line admission for postgraduate studies.100 Other than providing affiliation to colleges in the UT, teaching and research are its primary functions. The university has 13 schools in the areas of management, mathematical sciences, engineering, applied sciences, life sciences, humanities, social sciences & international studies, education, medical sciences, media & communication and green energy technologies.
The National Institute of Technology (NIT), Puducherry, is one of the 30 NITs and is situated in Karaikal, Pondicherry (Puducherry). NIT Puducherry is one of the 10 NITs sanctioned by the Government of India in 2009 as part of the 11th Five Year Plan. Currently the institute only offers 3 B.Tech programs in Electronics & Communication Engineering, Electrical & Electronics Engineering and Computer Science Engineering.
Mahatma Gandhi Medical College & Research Institute (MGMC & RI), the flagship institution of Sri Balaji Educational and Charitable Public Trust is a modern medical college and hospital located in Pondicherry. This tertiary care teaching hospital, better known as ‘Architectural Wonder of Pondicherry’, is an imposing landmark on the national highway. The institute offers both undergraduate and postgraduate courses in Child Health, Child Health ( D.Ch ), Psychiatry , Tuberculosis & Chest Diseases, Dermatology, Venereology & Leprosy, Anaesthesiology, Obstetrics & Gynaecology, Orthopaedics and Ophthalmology.
Rajiv Gandhi College of Engineering and Technology (RGCET) is a premier private engineering institute located at Pondicherry, under Sri Balaji Educational and Charitable Public Trust, and affiliated to Pondicherry University. The college offers UG courses in Bio Medical Engineering, Computer Science & Engineering, Electric & Electronic Engineering, and Information Technology. PG course are offered in Business Administration and Computer Application.
Figure 1: Location of Premier Institutes in Puducherry
100 Distance Learning and Vocational Instruction: Need, Impact and Challenges, ICDE conference paper & Pondicherry University launches online admission for postgraduate courses, The Hindu, Aug 21, 2006
� Pondicherry University � Mahatma Gandhi Medical College & Research
Institute (Sri Balaji Vidyapeeth University) � Rajiv Gandhi College of Engineering and
Technology � Rajiv Gandhi College of Veterinary and Animal
Sciences � Sri Venkateshwara Medical College Hospital and
Research Centre � Pondicherry Engineering College
� NIT, Karaikal
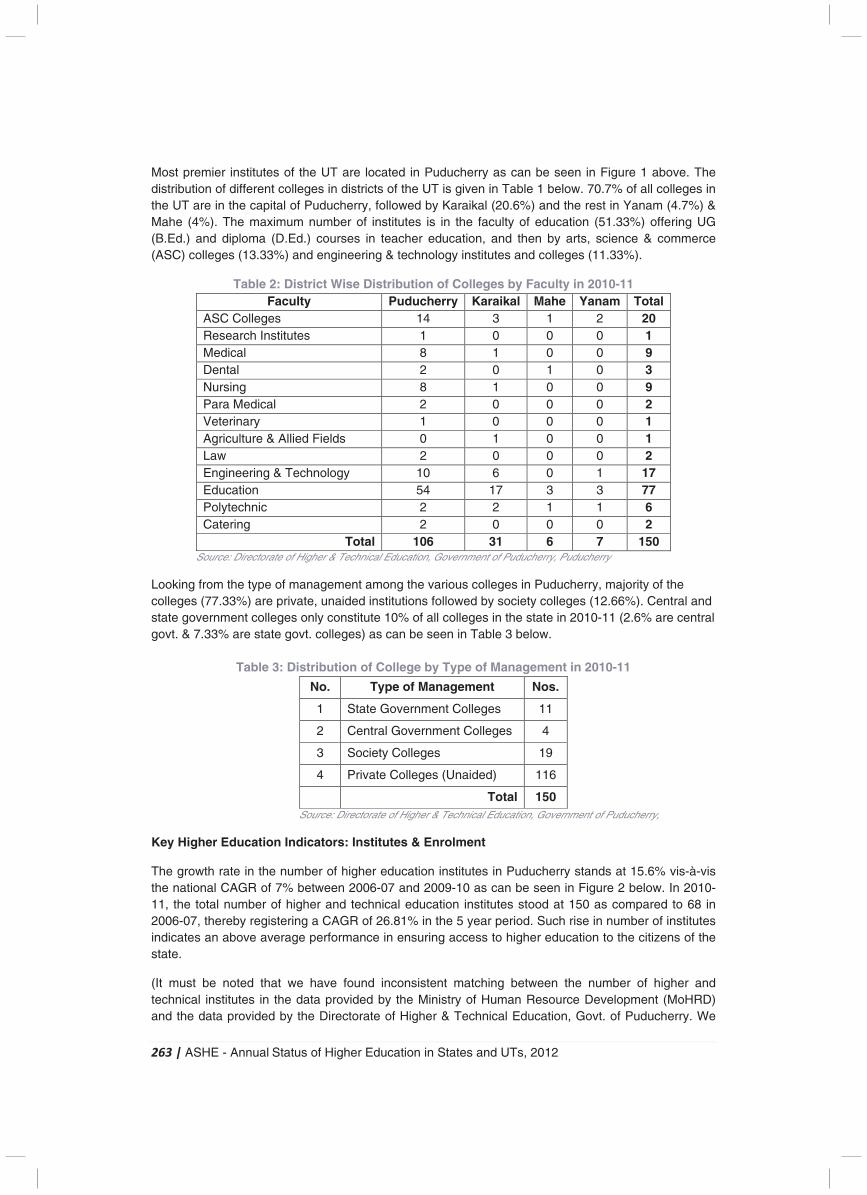
263 | ASHE - Annual Status of Higher Education in States and UTs, 2012
Most premier institutes of the UT are located in Puducherry as can be seen in Figure 1 above. The distribution of different colleges in districts of the UT is given in Table 1 below. 70.7% of all colleges in the UT are in the capital of Puducherry, followed by Karaikal (20.6%) and the rest in Yanam (4.7%) & Mahe (4%). The maximum number of institutes is in the faculty of education (51.33%) offering UG (B.Ed.) and diploma (D.Ed.) courses in teacher education, and then by arts, science & commerce (ASC) colleges (13.33%) and engineering & technology institutes and colleges (11.33%).
Table 2: District Wise Distribution of Colleges by Faculty in 2010-11 Faculty Puducherry Karaikal Mahe Yanam Total
ASC Colleges 14 3 1 2 20 Research Institutes 1 0 0 0 1 Medical 8 1 0 0 9 Dental 2 0 1 0 3 Nursing 8 1 0 0 9 Para Medical 2 0 0 0 2 Veterinary 1 0 0 0 1 Agriculture & Allied Fields 0 1 0 0 1 Law 2 0 0 0 2 Engineering & Technology 10 6 0 1 17 Education 54 17 3 3 77 Polytechnic 2 2 1 1 6 Catering 2 0 0 0 2
Total 106 31 6 7 150 Source: Directorate of Higher & Technical Education, Government of Puducherry, Puducherry
Looking from the type of management among the various colleges in Puducherry, majority of the colleges (77.33%) are private, unaided institutions followed by society colleges (12.66%). Central and state government colleges only constitute 10% of all colleges in the state in 2010-11 (2.6% are central govt. & 7.33% are state govt. colleges) as can be seen in Table 3 below.
Table 3: Distribution of College by Type of Management in 2010-11
No. Type of Management Nos.
1 State Government Colleges 11
2 Central Government Colleges 4
3 Society Colleges 19
4 Private Colleges (Unaided) 116
Total 150 Source: Directorate of Higher & Technical Education, Government of Puducherry,
Key Higher Education Indicators: Institutes & Enrolment
The growth rate in the number of higher education institutes in Puducherry stands at 15.6% vis-à-vis the national CAGR of 7% between 2006-07 and 2009-10 as can be seen in Figure 2 below. In 2010-11, the total number of higher and technical education institutes stood at 150 as compared to 68 in 2006-07, thereby registering a CAGR of 26.81% in the 5 year period. Such rise in number of institutes indicates an above average performance in ensuring access to higher education to the citizens of the state.
(It must be noted that we have found inconsistent matching between the number of higher and technical institutes in the data provided by the Ministry of Human Resource Development (MoHRD) and the data provided by the Directorate of Higher & Technical Education, Govt. of Puducherry. We
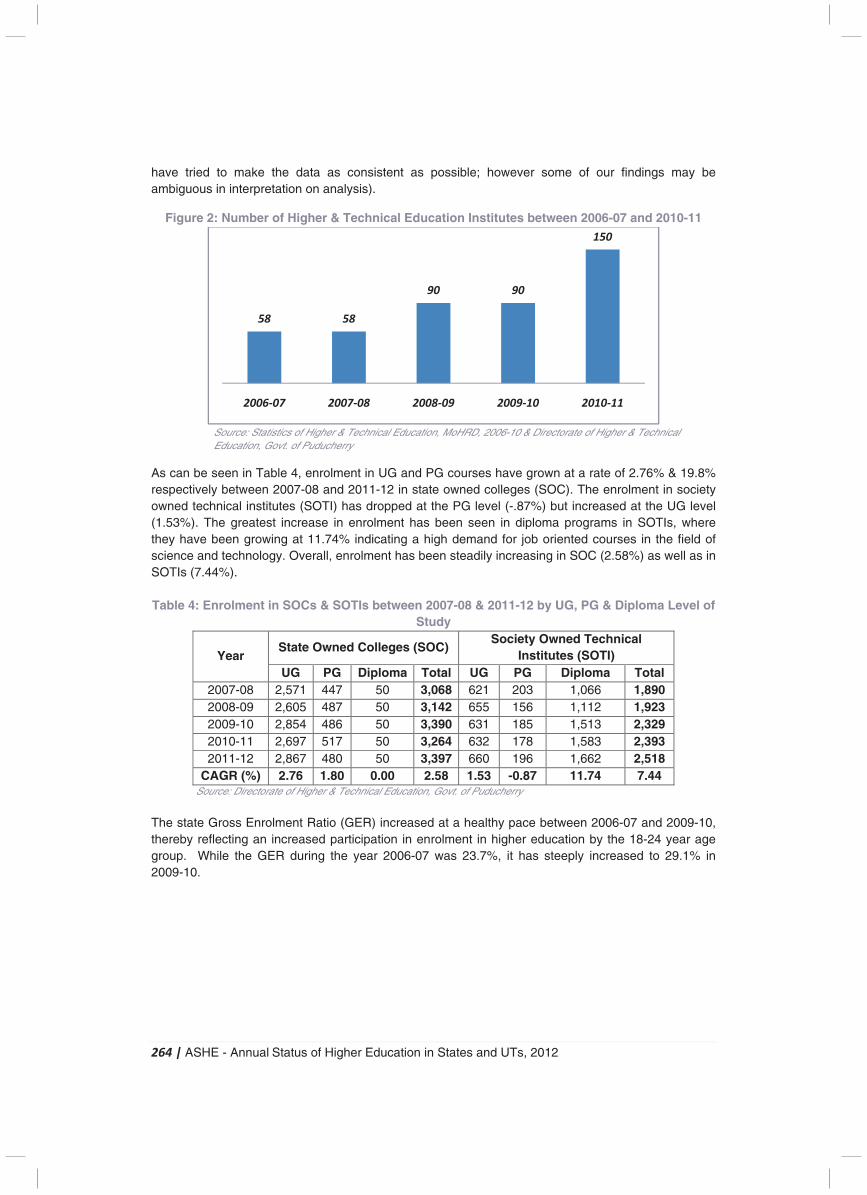
264 | ASHE - Annual Status of Higher Education in States and UTs, 2012
have tried to make the data as consistent as possible; however some of our findings may be ambiguous in interpretation on analysis).
Figure 2: Number of Higher & Technical Education Institutes between 2006-07 and 2010-11
Source: Statistics of Higher & Technical Education, MoHRD, 2006-10 & Directorate of Higher & Technical Education, Govt. of Puducherry
As can be seen in Table 4, enrolment in UG and PG courses have grown at a rate of 2.76% & 19.8% respectively between 2007-08 and 2011-12 in state owned colleges (SOC). The enrolment in society owned technical institutes (SOTI) has dropped at the PG level (-.87%) but increased at the UG level (1.53%). The greatest increase in enrolment has been seen in diploma programs in SOTIs, where they have been growing at 11.74% indicating a high demand for job oriented courses in the field of science and technology. Overall, enrolment has been steadily increasing in SOC (2.58%) as well as in SOTIs (7.44%). Table 4: Enrolment in SOCs & SOTIs between 2007-08 & 2011-12 by UG, PG & Diploma Level of
Study
Year State Owned Colleges (SOC)
Society Owned Technical Institutes (SOTI)
UG PG Diploma Total UG PG Diploma Total 2007-08 2,571 447 50 3,068 621 203 1,066 1,890 2008-09 2,605 487 50 3,142 655 156 1,112 1,923 2009-10 2,854 486 50 3,390 631 185 1,513 2,329 2010-11 2,697 517 50 3,264 632 178 1,583 2,393 2011-12 2,867 480 50 3,397 660 196 1,662 2,518
CAGR (%) 2.76 1.80 0.00 2.58 1.53 -0.87 11.74 7.44 Source: Directorate of Higher & Technical Education, Govt. of Puducherry
The state Gross Enrolment Ratio (GER) increased at a healthy pace between 2006-07 and 2009-10, thereby reflecting an increased participation in enrolment in higher education by the 18-24 year age group. While the GER during the year 2006-07 was 23.7%, it has steeply increased to 29.1% in 2009-10.
58 58
90 90
150
2006-07 2007-08 2008-09 2009-10 2010-11
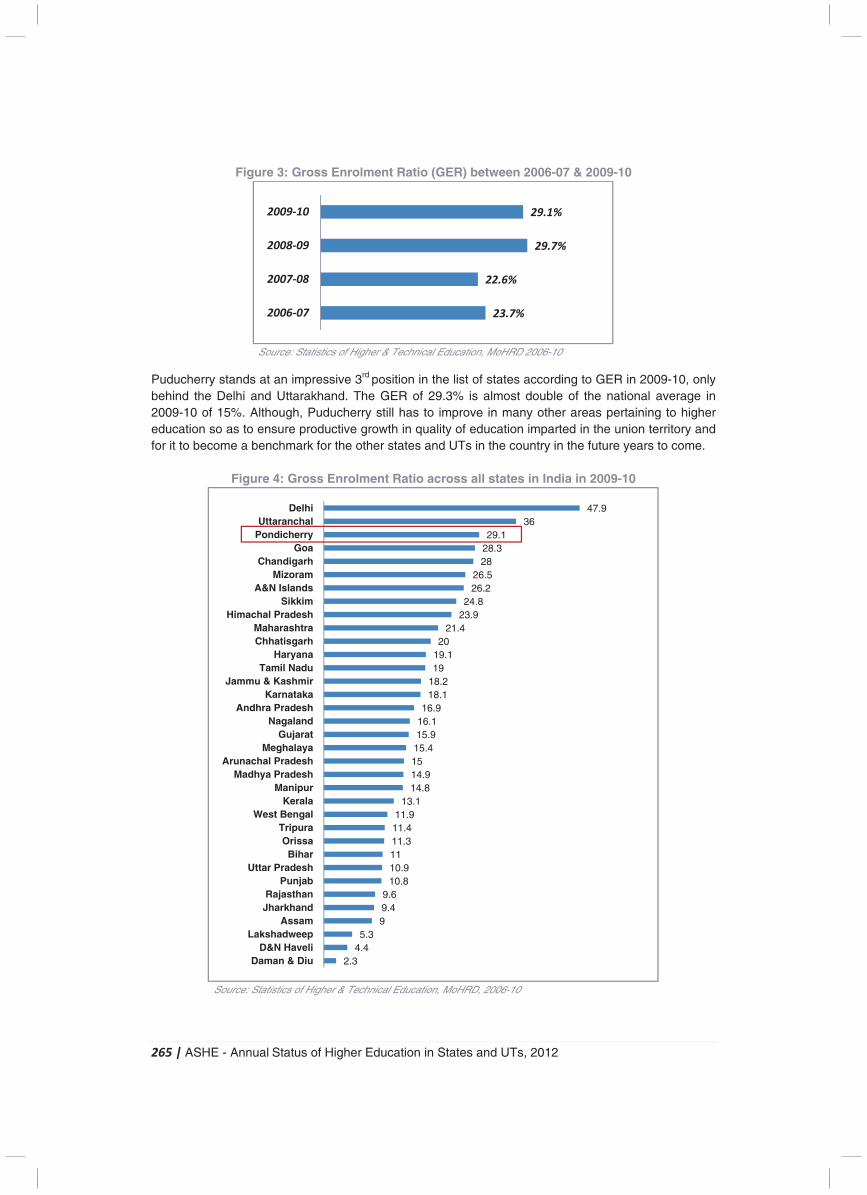
265 | ASHE - Annual Status of Higher Education in States and UTs, 2012
Figure 3: Gross Enrolment Ratio (GER) between 2006-07 & 2009-10
Source: Statistics of Higher & Technical Education, MoHRD 2006-10
Puducherry stands at an impressive 3rd position in the list of states according to GER in 2009-10, only behind the Delhi and Uttarakhand. The GER of 29.3% is almost double of the national average in 2009-10 of 15%. Although, Puducherry still has to improve in many other areas pertaining to higher education so as to ensure productive growth in quality of education imparted in the union territory and for it to become a benchmark for the other states and UTs in the country in the future years to come.
Figure 4: Gross Enrolment Ratio across all states in India in 2009-10
Source: Statistics of Higher & Technical Education, MoHRD, 2006-10
23.7%
22.6%
29.7%
29.1%
2006-07
2007-08
2008-09
2009-10
2.34.45.3
99.49.6
10.810.91111.311.411.9
13.114.814.91515.415.916.116.9
18.118.21919.120
21.423.924.8
26.226.5
2828.329.1
3647.9
Daman & DiuD&N Haveli
LakshadweepAssam
JharkhandRajasthan
PunjabUttar Pradesh
BiharOrissa
TripuraWest Bengal
KeralaManipur
Madhya PradeshArunachal Pradesh
MeghalayaGujarat
NagalandAndhra Pradesh
KarnatakaJammu & Kashmir
Tamil NaduHaryana
ChhatisgarhMaharashtra
Himachal PradeshSikkim
A&N IslandsMizoram
ChandigarhGoa
PondicherryUttaranchal
Delhi
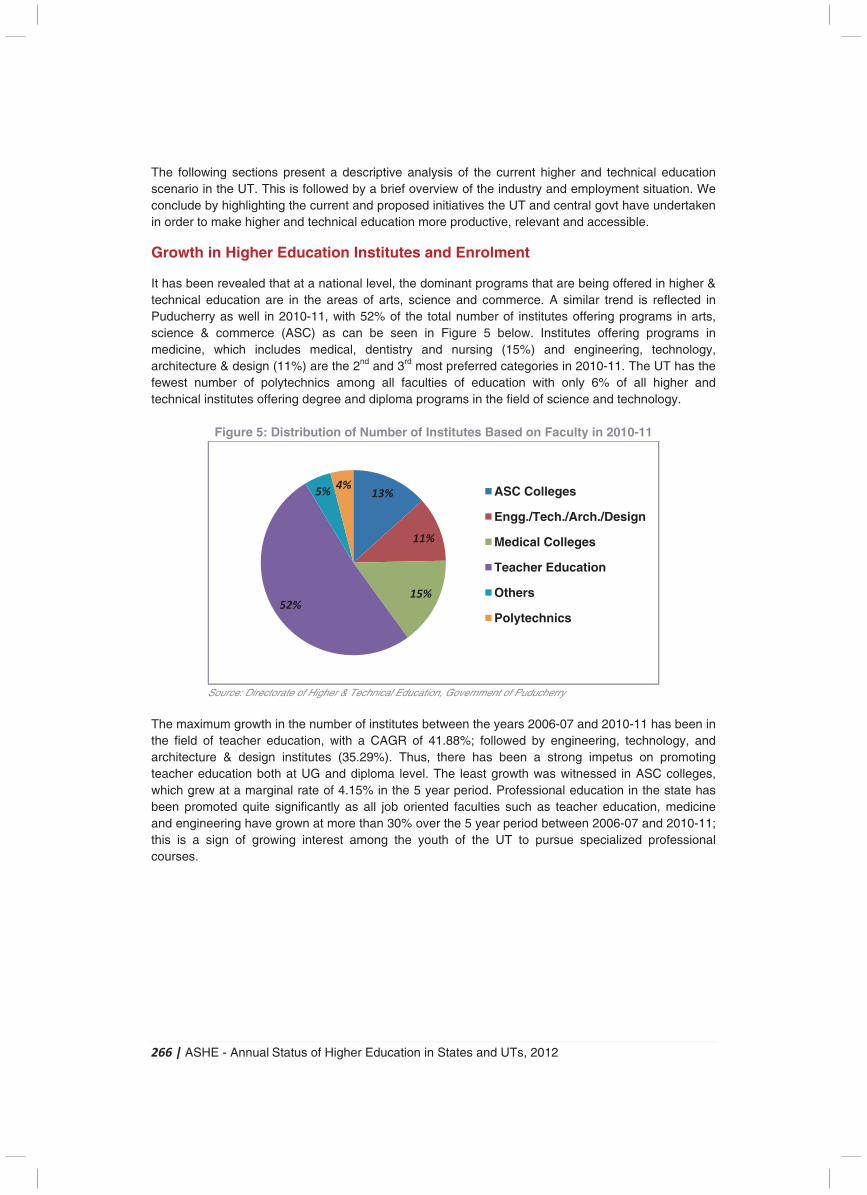
266 | ASHE - Annual Status of Higher Education in States and UTs, 2012
The following sections present a descriptive analysis of the current higher and technical education scenario in the UT. This is followed by a brief overview of the industry and employment situation. We conclude by highlighting the current and proposed initiatives the UT and central govt have undertaken in order to make higher and technical education more productive, relevant and accessible.
Growth in Higher Education Institutes and Enrolment
It has been revealed that at a national level, the dominant programs that are being offered in higher & technical education are in the areas of arts, science and commerce. A similar trend is reflected in Puducherry as well in 2010-11, with 52% of the total number of institutes offering programs in arts, science & commerce (ASC) as can be seen in Figure 5 below. Institutes offering programs in medicine, which includes medical, dentistry and nursing (15%) and engineering, technology, architecture & design (11%) are the 2nd and 3rd most preferred categories in 2010-11. The UT has the fewest number of polytechnics among all faculties of education with only 6% of all higher and technical institutes offering degree and diploma programs in the field of science and technology.
Figure 5: Distribution of Number of Institutes Based on Faculty in 2010-11
Source: Directorate of Higher & Technical Education, Government of Puducherry
The maximum growth in the number of institutes between the years 2006-07 and 2010-11 has been in the field of teacher education, with a CAGR of 41.88%; followed by engineering, technology, and architecture & design institutes (35.29%). Thus, there has been a strong impetus on promoting teacher education both at UG and diploma level. The least growth was witnessed in ASC colleges, which grew at a marginal rate of 4.15% in the 5 year period. Professional education in the state has been promoted quite significantly as all job oriented faculties such as teacher education, medicine and engineering have grown at more than 30% over the 5 year period between 2006-07 and 2010-11; this is a sign of growing interest among the youth of the UT to pursue specialized professional courses.
13%
11%
15%
52%
5%4% ASC Colleges
Engg./Tech./Arch./Design
Medical Colleges
Teacher Education
Others
Polytechnics
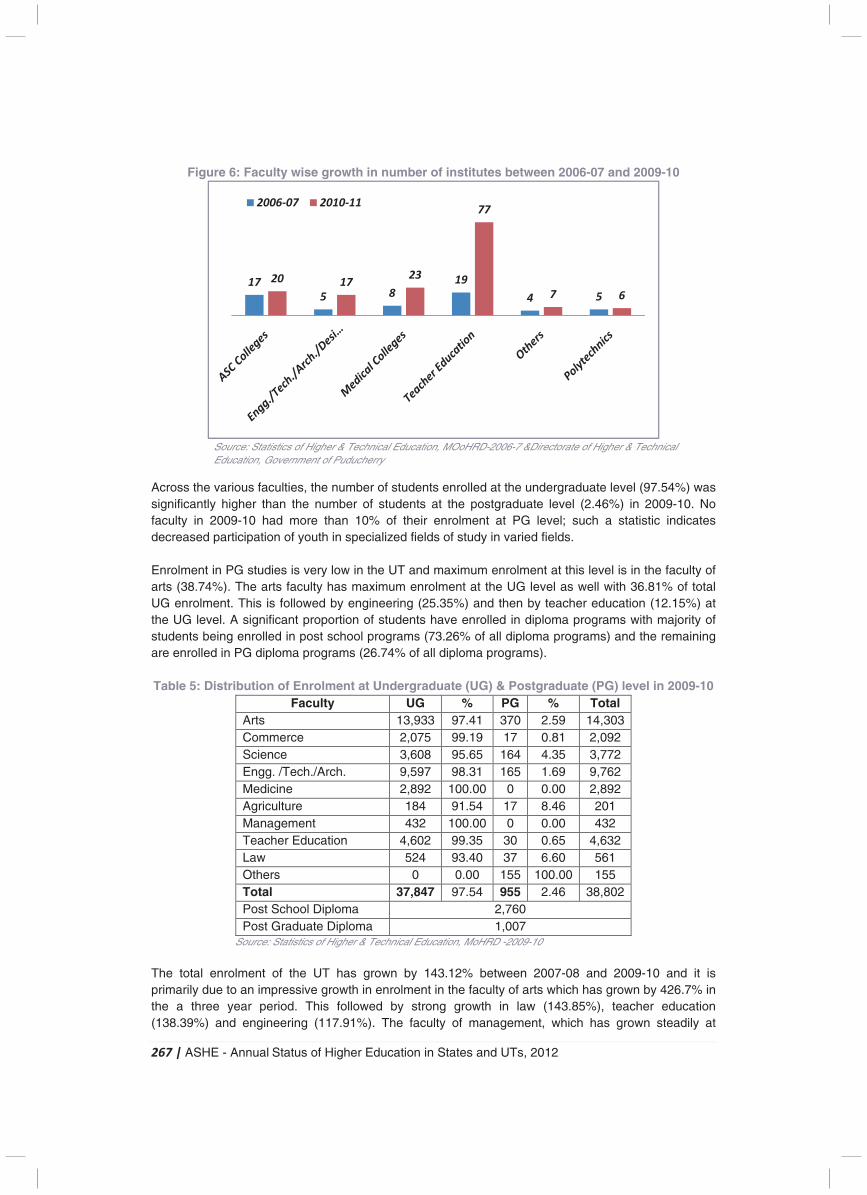
267 | ASHE - Annual Status of Higher Education in States and UTs, 2012
Figure 6: Faculty wise growth in number of institutes between 2006-07 and 2009-10
Source: Statistics of Higher & Technical Education, MOoHRD-2006-7 &Directorate of Higher & Technical Education, Government of Puducherry
Across the various faculties, the number of students enrolled at the undergraduate level (97.54%) was significantly higher than the number of students at the postgraduate level (2.46%) in 2009-10. No faculty in 2009-10 had more than 10% of their enrolment at PG level; such a statistic indicates decreased participation of youth in specialized fields of study in varied fields. Enrolment in PG studies is very low in the UT and maximum enrolment at this level is in the faculty of arts (38.74%). The arts faculty has maximum enrolment at the UG level as well with 36.81% of total UG enrolment. This is followed by engineering (25.35%) and then by teacher education (12.15%) at the UG level. A significant proportion of students have enrolled in diploma programs with majority of students being enrolled in post school programs (73.26% of all diploma programs) and the remaining are enrolled in PG diploma programs (26.74% of all diploma programs). Table 5: Distribution of Enrolment at Undergraduate (UG) & Postgraduate (PG) level in 2009-10
Faculty UG % PG % Total Arts 13,933 97.41 370 2.59 14,303Commerce 2,075 99.19 17 0.81 2,092 Science 3,608 95.65 164 4.35 3,772 Engg. /Tech./Arch. 9,597 98.31 165 1.69 9,762 Medicine 2,892 100.00 0 0.00 2,892 Agriculture 184 91.54 17 8.46 201 Management 432 100.00 0 0.00 432 Teacher Education 4,602 99.35 30 0.65 4,632 Law 524 93.40 37 6.60 561 Others 0 0.00 155 100.00 155 Total 37,847 97.54 955 2.46 38,802Post School Diploma 2,760 Post Graduate Diploma 1,007
Source: Statistics of Higher & Technical Education, MoHRD -2009-10 The total enrolment of the UT has grown by 143.12% between 2007-08 and 2009-10 and it is primarily due to an impressive growth in enrolment in the faculty of arts which has grown by 426.7% in the a three year period. This followed by strong growth in law (143.85%), teacher education (138.39%) and engineering (117.91%). The faculty of management, which has grown steadily at
(4.15%) (35.79%) (30.21%)
(41.88%)
(15.02%) (4.66%)
17
5 8
19
4 5
20 1723
77
7 6
2006-07 2010-11
268 | ASHE - Annual Status of Higher Education in States and UTs, 2012
45.48%, has witnessed least growth. However both post school and postgraduate diploma programs have declined in this time period at a rate of 1.39% and 31.31% respectively indicating a fall in demand in diploma education in the UT.
Table 6: Faculty wise Growth of enrolment at UG and PG level between 2007-08 and 2009-10
Faculty UG +PG Growth (%)
2007-08 2009-10 UG PG Total Arts 3,352 14,303 384.96 -22.76 426.7 Commerce 2,305 2,092 0.00 -92.61 90.76 Science 4,496 3,772 0.00 -81.53 83.9 Engg. /Tech./Arch. 8,279 9,762 31.79 -83.45 117.91 Medicine 3,675 2,892 -15.71 -100 78.69 Agriculture 57 201 360 0 352.63 Management 952 432 0.00 -100 45.38 Teacher Education 3,347 4,632 38.95 -14.29 138.39 Law 390 561 48.44 0 143.85 Others 259 155 -100 55 59.85 Total 27,112 38,802 60.61 -73.08 143.12 Post School Diploma 2,799 2760 -1.39 Post Graduate Diploma 1,466 1007 -31.31
Source: Statistics of Higher & Technical Education, MoHRD 2007-08 and 2009-10
Table 6 shows that the UG growth has outpaced PG growth quite significantly with the former registering a growth of 60.61% whereas PG is declining at a rate of 73.08% between 2007-08 and 2009-10. Such inequality translates in to students preferring UG courses for higher education and either pursing PG and/or postdoctoral studies outside the state or seeking gainful employment. Another point to be considered is that since there is an exclusive PG and research institute in the UT, the degree colleges have very few PG courses, which explains low enrolment in PG courses over the years as well. Maximum growth has been seen at UG level in the faculty of arts (384.96%) followed by law (48.44%). (It must be noted, due to the unavailability of data for certain faculties, some results have return inflated values, however the inferences that has been made are accurate to the present scenario in the UT) Quality of Institutes The only central university in the UT, Pondicherry University has been accredited and assessed by the NAAC101 up to 2012, has been awarded A (Very Good) grade and 4 colleges have also been graded and given B (Good) grade.
Out of the government manned institutes, only 5 institutes have been given NAAC accreditation, of which two have received B++ grade, two have received B+ grade and one has received C++ grade.
Employment and Industry Scenario
With a small industrial inheritance of 3 textile mills, Puducherry has come a long way. Now it has 7,553 industries representing a cross section of industries. Seven well established industrial estates with comprehensive infrastructure facilities propelling the industrial growth. There have been spectacular performances on the export front with principal export items being leather, chemicals, textiles and metallic products. 101National Accreditation and Assessment Council
269 | ASHE - Annual Status of Higher Education in States and UTs, 2012
Government of Puducherry also provides good infrastructural facilities of roads, electricity and water supply. Above all Puducherry has very informal work culture where all government executives and even ministers are easily approachable. It provides a peaceful and quality work force with no hassles of trade unions. And all this has made Puducherry a heaven for existing and new industrial units.102 Industry Strength Puducherry is already known as “Hardware capital of India”. Almost all the majors in the Hardware industry such as Lenovo, Acer, WIPRO, HCL and HP have set up their units. Name of the other players are LG, Samtel, Proview, Thapars, Henkel, Hindustan Unilever, Kotharies, Sriram, L&T, Chemcrown, Foseco, Chemfab Alkalis, Whirlpool, Suzlon, Lucas TVS Ltd, Rane Madras Ltd, MRF Ltd, Ace Glass, Berger Paints, Sundram Fastners, Rane Brake linings, Johnson, Neycer, Regency and Marico, etc.
Key Challenges and Initiatives in Higher Education As far as the UT of Puducherry is concerned, the access and equity components to higher education are of a high order, conforming to all India norms. The Human Development Index, Education Development Index and GER are consistently higher than the country level averages. Its main concern is the quality of higher & technical education in this territory, which is fast becoming the hub for higher education in the country.
There is a constant need to improve and innovate by designing and delivering effective courses and modules. A total revamping is required with respect to teaching, learning, and evaluation and outreach activities in the realm of higher education. Some of the key challenges that plague the UT currently are as follows.
Key Challenges � There is a need to separate higher education statistics pertaining to local students in the state
from the students who come from outside the state to avail higher education, to have an in depth analysis of current issues in the UT.
� There is an urgent need to upgrade the quality of existing educational institutes to address the language gaps, employability of students, and promote smart classrooms and academia-industry interface.
� A large part of the plan outlay is allocated towards salary component as grant in aid to society colleges, which should be shifted to non plan expenditure.
� At present, open ended assistance without any syntax of salary element is given for scholarship to students. Hence there is a need to review the scheme for assisting students in terms of an income ceiling, to lead to better targeting of needy ad deserving sections of society.
Innovative Practices in Higher Education � Introduction of add on certificate/diploma courses in the area of languages, information
technology etc. Utilization of IGNOU convergence scheme for conducting master degree courses like MBA and MCA as well as UGC merged schemes for conducting coaching classes for NET examination, coaching classes for weak and minority students and coaching for in service and soft skill training.
� Introduction of smart class room to have visual and more interactive education. Setting up of language labs for developing language skills and digital classrooms for implementation of modern facilities in teaching and learning processes.
102Note on Industry in Puducherry, Confederation of Indian Industries (CII)
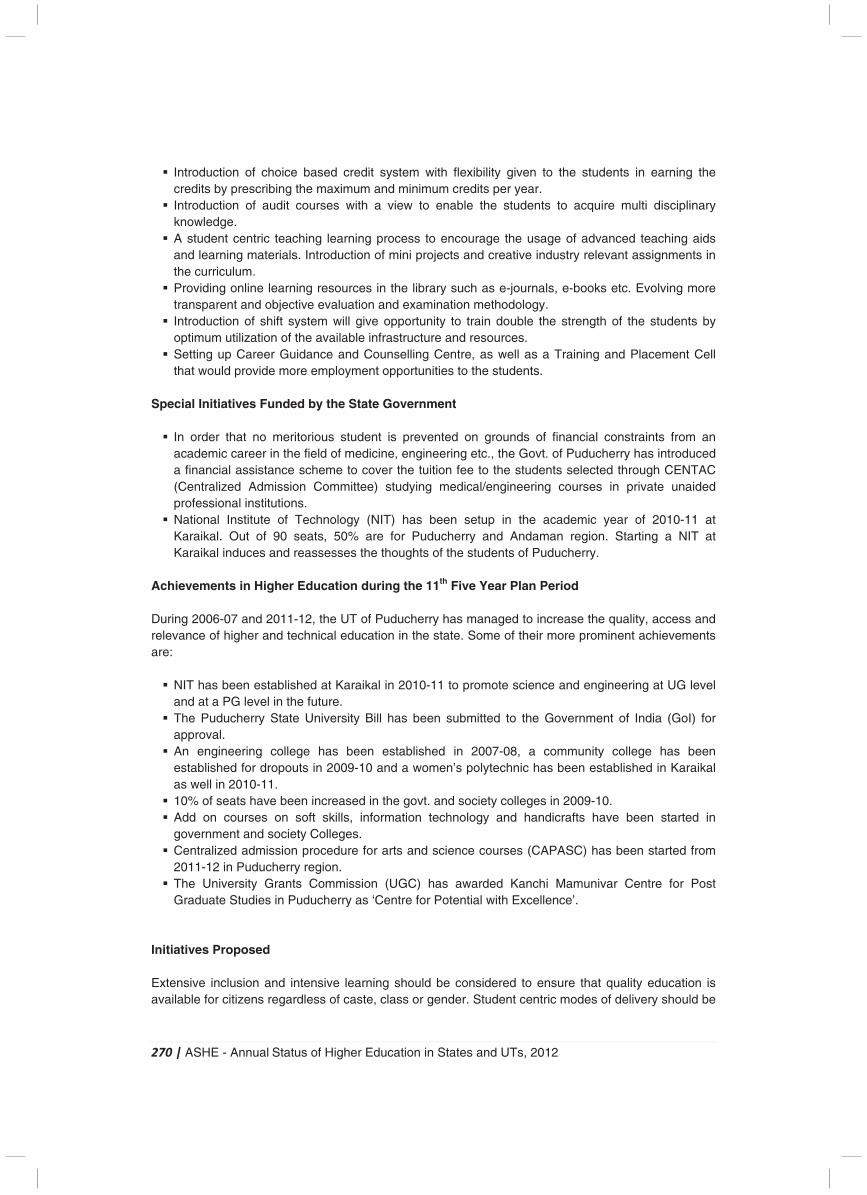
270 | ASHE - Annual Status of Higher Education in States and UTs, 2012
� Introduction of choice based credit system with flexibility given to the students in earning the credits by prescribing the maximum and minimum credits per year.
� Introduction of audit courses with a view to enable the students to acquire multi disciplinary knowledge.
� A student centric teaching learning process to encourage the usage of advanced teaching aids and learning materials. Introduction of mini projects and creative industry relevant assignments in the curriculum.
� Providing online learning resources in the library such as e-journals, e-books etc. Evolving more transparent and objective evaluation and examination methodology.
� Introduction of shift system will give opportunity to train double the strength of the students by optimum utilization of the available infrastructure and resources.
� Setting up Career Guidance and Counselling Centre, as well as a Training and Placement Cell that would provide more employment opportunities to the students.
Special Initiatives Funded by the State Government � In order that no meritorious student is prevented on grounds of financial constraints from an
academic career in the field of medicine, engineering etc., the Govt. of Puducherry has introduced a financial assistance scheme to cover the tuition fee to the students selected through CENTAC (Centralized Admission Committee) studying medical/engineering courses in private unaided professional institutions.
� National Institute of Technology (NIT) has been setup in the academic year of 2010-11 at Karaikal. Out of 90 seats, 50% are for Puducherry and Andaman region. Starting a NIT at Karaikal induces and reassesses the thoughts of the students of Puducherry.
Achievements in Higher Education during the 11th Five Year Plan Period During 2006-07 and 2011-12, the UT of Puducherry has managed to increase the quality, access and relevance of higher and technical education in the state. Some of their more prominent achievements are: � NIT has been established at Karaikal in 2010-11 to promote science and engineering at UG level
and at a PG level in the future. � The Puducherry State University Bill has been submitted to the Government of India (GoI) for
approval. � An engineering college has been established in 2007-08, a community college has been
established for dropouts in 2009-10 and a women’s polytechnic has been established in Karaikal as well in 2010-11.
� 10% of seats have been increased in the govt. and society colleges in 2009-10. � Add on courses on soft skills, information technology and handicrafts have been started in
government and society Colleges. � Centralized admission procedure for arts and science courses (CAPASC) has been started from
2011-12 in Puducherry region. � The University Grants Commission (UGC) has awarded Kanchi Mamunivar Centre for Post
Graduate Studies in Puducherry as ‘Centre for Potential with Excellence’.
Initiatives Proposed Extensive inclusion and intensive learning should be considered to ensure that quality education is available for citizens regardless of caste, class or gender. Student centric modes of delivery should be
271 | ASHE - Annual Status of Higher Education in States and UTs, 2012
incorporated and faculty regeneration should be given special emphasis to keep the education system up to date with national and global practices. Some of the other such initiatives are as follows.
� Establishment of Puducherry State University. � Steps are being taken to start a new arts and science college in Karaikal and new polytechnic
college in Puducherry under the centrally assisted scheme of the GoI. � Implementation of the CSS scheme ‘Community Development through Polytechnics (CDTP)’ in
Karaikal Polytechnic College. � Psychometric testing to be made mandatory as it provides information on the student’s current
and potential competence. � Bridge courses to be introduced for 4-6 weeks for ensuring that students are effectively able to
deal with the challenges presented to them. � Academic skills, research skills, job skills and life skills to be given special focus and short term
add on courses to be introduced that have employable and entrepreneurial value. � Postgraduate courses of interdisciplinary nature and disciplinary nature to be introduced. � Examination and evaluation reform to improve the existing system of assessment in all colleges.
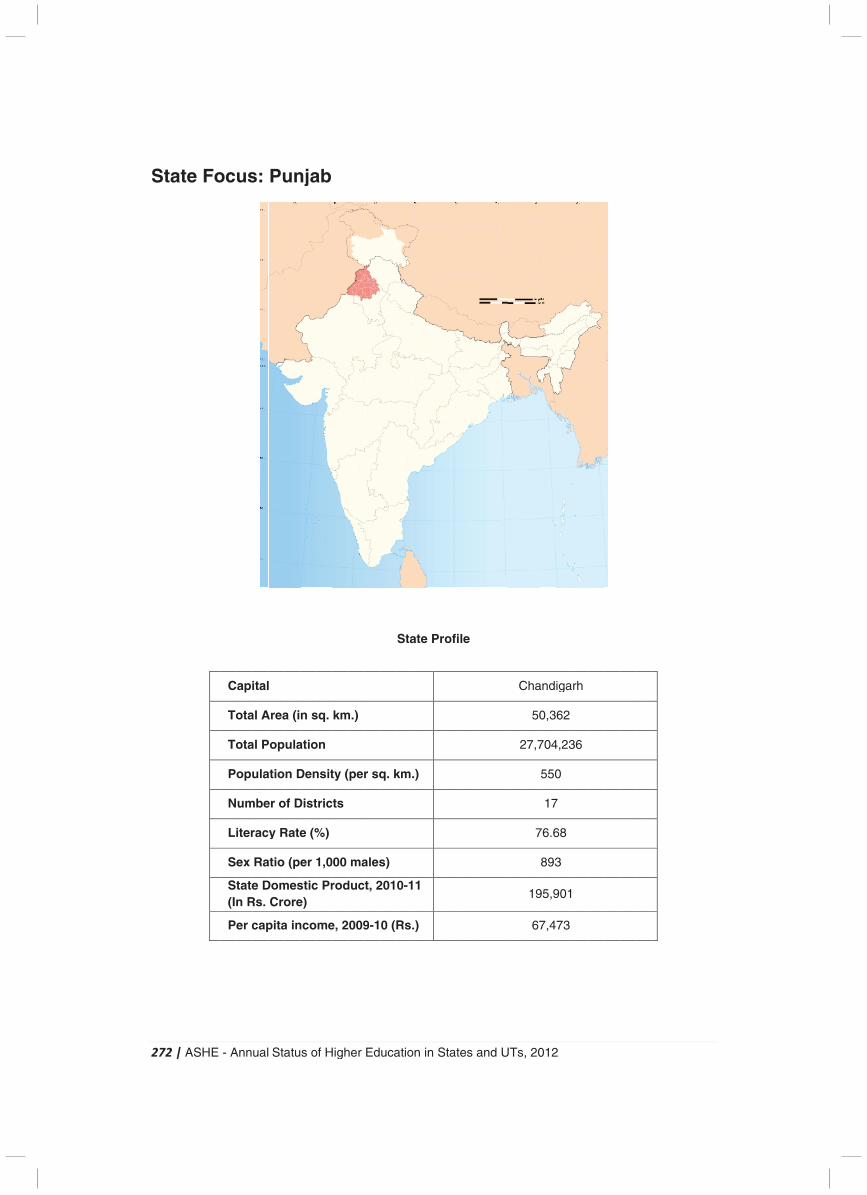
2
S
272
Sta
| A
ate
ASH
e F
HE
Fo
- A
oc
C
To
To
Po
N
Li
Se
St(In
Pe
Ann
us
api
ota
ota
opu
um
iter
ex
taten R
er c
ual
s:
ital
al A
al P
ula
mbe
rac
Ra
e DRs.
cap
Sta
Pu
l
Area
Pop
atio
er o
y R
atio
DomCro
pita
atu
un
a (i
ula
n D
of D
Rate
(pe
mesore
a in
s o
nja
n s
atio
Den
Dist
e (%
er 1
stice)
nco
of H
ab
sq.
on
nsit
tric
%)
1,0
c Pr
me
High
km
ty (
ts
00
rod
e, 2
her
m.)
(per
ma
duc
009
Ed
r sq
ales
t, 2
9-1
uca
q. k
s)
201
0 (
atio
Sta
km.
0-1
Rs.
on in
ate
.)
11
.)
n S
Pr
Stat
ofi
es
le
and
d U
UTs
C
2
, 20
Cha
50
27,7
7
19
67
012
and
0,3
704
550
17
76.6
893
95,9
7,4
2
iga
62
4,23
0
7
68
3
901
73
arh
36
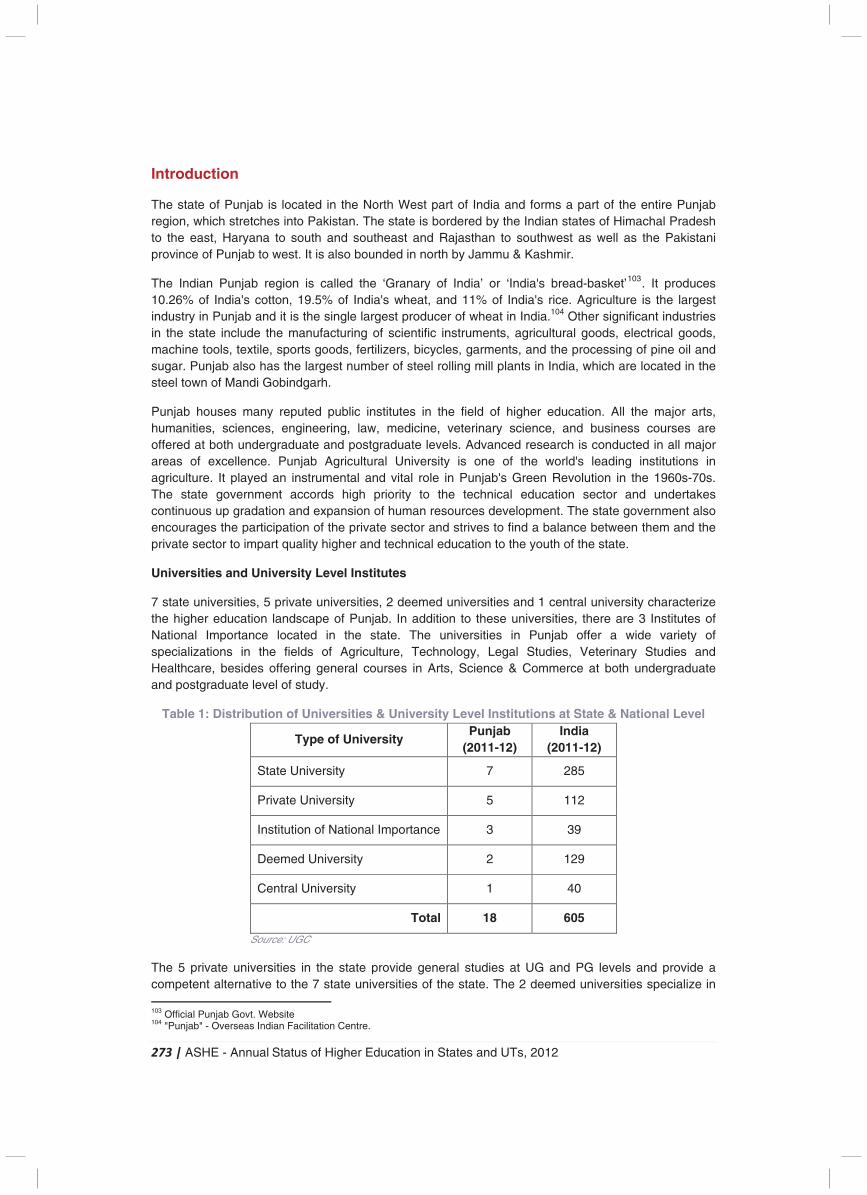
273 | ASHE - Annual Status of Higher Education in States and UTs, 2012
Introduction
The state of Punjab is located in the North West part of India and forms a part of the entire Punjab region, which stretches into Pakistan. The state is bordered by the Indian states of Himachal Pradesh to the east, Haryana to south and southeast and Rajasthan to southwest as well as the Pakistani province of Punjab to west. It is also bounded in north by Jammu & Kashmir.
The Indian Punjab region is called the ‘Granary of India’ or ‘India's bread-basket’103. It produces 10.26% of India's cotton, 19.5% of India's wheat, and 11% of India's rice. Agriculture is the largest industry in Punjab and it is the single largest producer of wheat in India.104 Other significant industries in the state include the manufacturing of scientific instruments, agricultural goods, electrical goods, machine tools, textile, sports goods, fertilizers, bicycles, garments, and the processing of pine oil and sugar. Punjab also has the largest number of steel rolling mill plants in India, which are located in the steel town of Mandi Gobindgarh.
Punjab houses many reputed public institutes in the field of higher education. All the major arts, humanities, sciences, engineering, law, medicine, veterinary science, and business courses are offered at both undergraduate and postgraduate levels. Advanced research is conducted in all major areas of excellence. Punjab Agricultural University is one of the world's leading institutions in agriculture. It played an instrumental and vital role in Punjab's Green Revolution in the 1960s-70s. The state government accords high priority to the technical education sector and undertakes continuous up gradation and expansion of human resources development. The state government also encourages the participation of the private sector and strives to find a balance between them and the private sector to impart quality higher and technical education to the youth of the state.
Universities and University Level Institutes
7 state universities, 5 private universities, 2 deemed universities and 1 central university characterize the higher education landscape of Punjab. In addition to these universities, there are 3 Institutes of National Importance located in the state. The universities in Punjab offer a wide variety of specializations in the fields of Agriculture, Technology, Legal Studies, Veterinary Studies and Healthcare, besides offering general courses in Arts, Science & Commerce at both undergraduate and postgraduate level of study.
Table 1: Distribution of Universities & University Level Institutions at State & National Level
Type of University Punjab
(2011-12) India
(2011-12)
State University 7 285
Private University 5 112
Institution of National Importance 3 39
Deemed University 2 129
Central University 1 40
Total 18 605
Source: UGC
The 5 private universities in the state provide general studies at UG and PG levels and provide a competent alternative to the 7 state universities of the state. The 2 deemed universities specialize in 103 Official Punjab Govt. Website 104 "Punjab" - Overseas Indian Facilitation Centre.
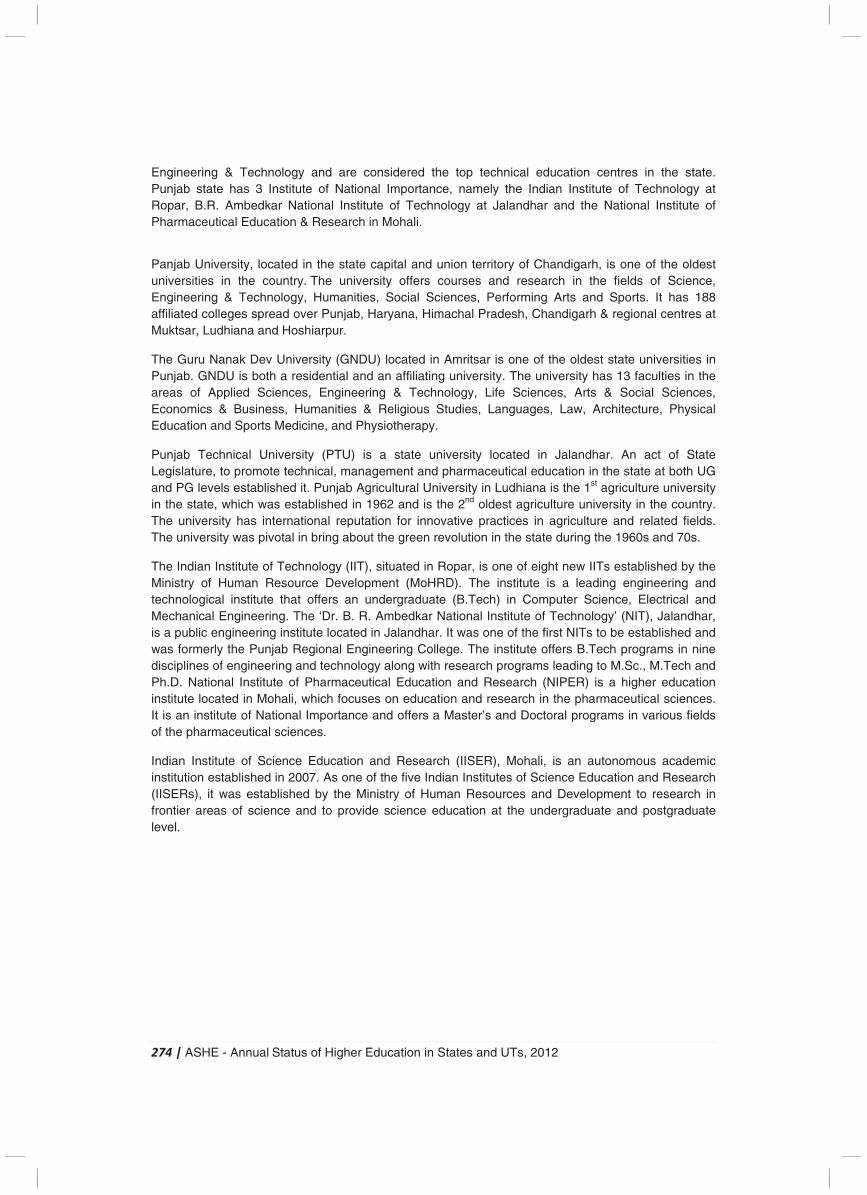
274 | ASHE - Annual Status of Higher Education in States and UTs, 2012
Engineering & Technology and are considered the top technical education centres in the state. Punjab state has 3 Institute of National Importance, namely the Indian Institute of Technology at Ropar, B.R. Ambedkar National Institute of Technology at Jalandhar and the National Institute of Pharmaceutical Education & Research in Mohali.
Panjab University, located in the state capital and union territory of Chandigarh, is one of the oldest universities in the country. The university offers courses and research in the fields of Science, Engineering & Technology, Humanities, Social Sciences, Performing Arts and Sports. It has 188 affiliated colleges spread over Punjab, Haryana, Himachal Pradesh, Chandigarh & regional centres at Muktsar, Ludhiana and Hoshiarpur.
The Guru Nanak Dev University (GNDU) located in Amritsar is one of the oldest state universities in Punjab. GNDU is both a residential and an affiliating university. The university has 13 faculties in the areas of Applied Sciences, Engineering & Technology, Life Sciences, Arts & Social Sciences, Economics & Business, Humanities & Religious Studies, Languages, Law, Architecture, Physical Education and Sports Medicine, and Physiotherapy.
Punjab Technical University (PTU) is a state university located in Jalandhar. An act of State Legislature, to promote technical, management and pharmaceutical education in the state at both UG and PG levels established it. Punjab Agricultural University in Ludhiana is the 1st agriculture university in the state, which was established in 1962 and is the 2nd oldest agriculture university in the country. The university has international reputation for innovative practices in agriculture and related fields. The university was pivotal in bring about the green revolution in the state during the 1960s and 70s.
The Indian Institute of Technology (IIT), situated in Ropar, is one of eight new IITs established by the Ministry of Human Resource Development (MoHRD). The institute is a leading engineering and technological institute that offers an undergraduate (B.Tech) in Computer Science, Electrical and Mechanical Engineering. The ‘Dr. B. R. Ambedkar National Institute of Technology’ (NIT), Jalandhar, is a public engineering institute located in Jalandhar. It was one of the first NITs to be established and was formerly the Punjab Regional Engineering College. The institute offers B.Tech programs in nine disciplines of engineering and technology along with research programs leading to M.Sc., M.Tech and Ph.D. National Institute of Pharmaceutical Education and Research (NIPER) is a higher education institute located in Mohali, which focuses on education and research in the pharmaceutical sciences. It is an institute of National Importance and offers a Master’s and Doctoral programs in various fields of the pharmaceutical sciences.
Indian Institute of Science Education and Research (IISER), Mohali, is an autonomous academic institution established in 2007. As one of the five Indian Institutes of Science Education and Research (IISERs), it was established by the Ministry of Human Resources and Development to research in frontier areas of science and to provide science education at the undergraduate and postgraduate level.
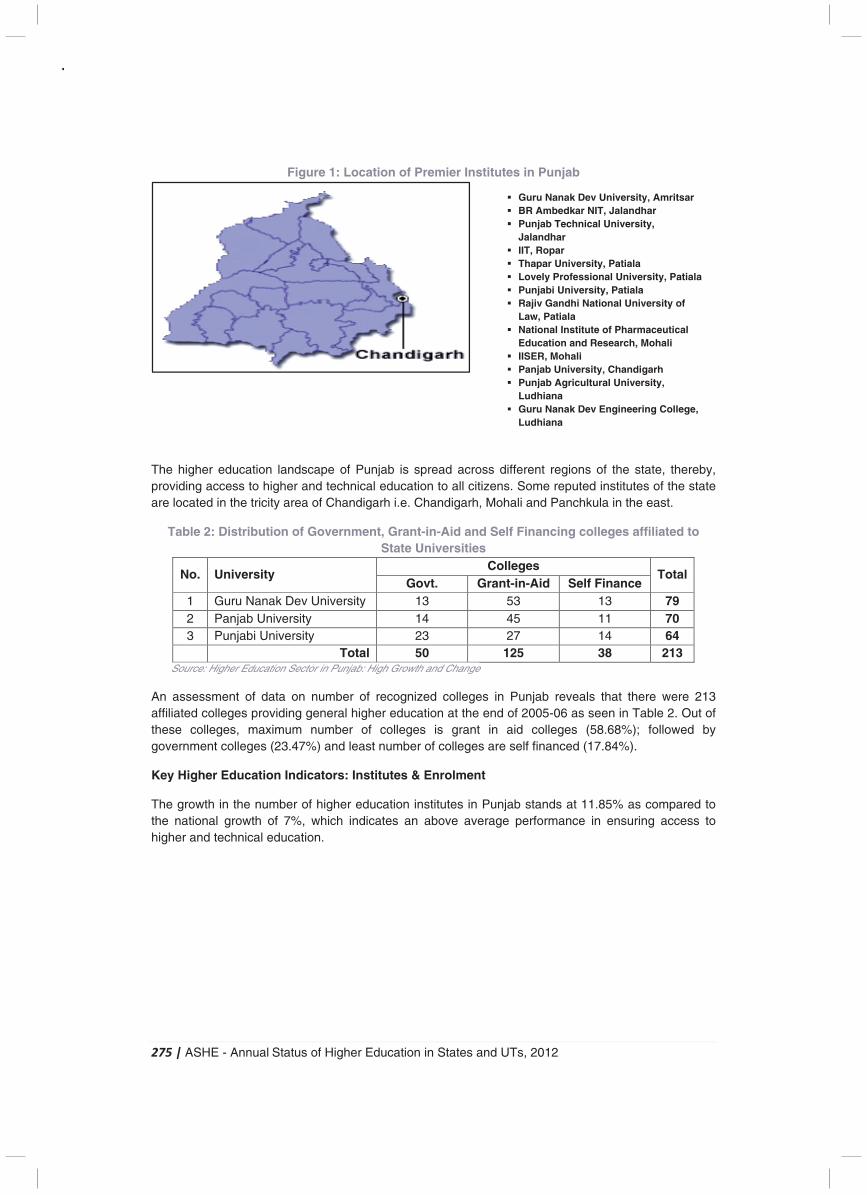
275 | ASHE - Annual Status of Higher Education in States and UTs, 2012
Figure 1: Location of Premier Institutes in Punjab
The higher education landscape of Punjab is spread across different regions of the state, thereby, providing access to higher and technical education to all citizens. Some reputed institutes of the state are located in the tricity area of Chandigarh i.e. Chandigarh, Mohali and Panchkula in the east.
Table 2: Distribution of Government, Grant-in-Aid and Self Financing colleges affiliated to State Universities
No. University Colleges
Total Govt. Grant-in-Aid Self Finance
1 Guru Nanak Dev University 13 53 13 79 2 Panjab University 14 45 11 70 3 Punjabi University 23 27 14 64
Total 50 125 38 213 Source: Higher Education Sector in Punjab: High Growth and Change An assessment of data on number of recognized colleges in Punjab reveals that there were 213 affiliated colleges providing general higher education at the end of 2005-06 as seen in Table 2. Out of these colleges, maximum number of colleges is grant in aid colleges (58.68%); followed by government colleges (23.47%) and least number of colleges are self financed (17.84%).
Key Higher Education Indicators: Institutes & Enrolment
The growth in the number of higher education institutes in Punjab stands at 11.85% as compared to the national growth of 7%, which indicates an above average performance in ensuring access to higher and technical education.
� Guru Nanak Dev University, Amritsar � BR Ambedkar NIT, Jalandhar � Punjab Technical University,
Jalandhar � IIT, Ropar � Thapar University, Patiala � Lovely Professional University, Patiala � Punjabi University, Patiala � Rajiv Gandhi National University of
Law, Patiala � National Institute of Pharmaceutical
Education and Research, Mohali � IISER, Mohali � Panjab University, Chandigarh � Punjab Agricultural University,
Ludhiana � Guru Nanak Dev Engineering College,
Ludhiana
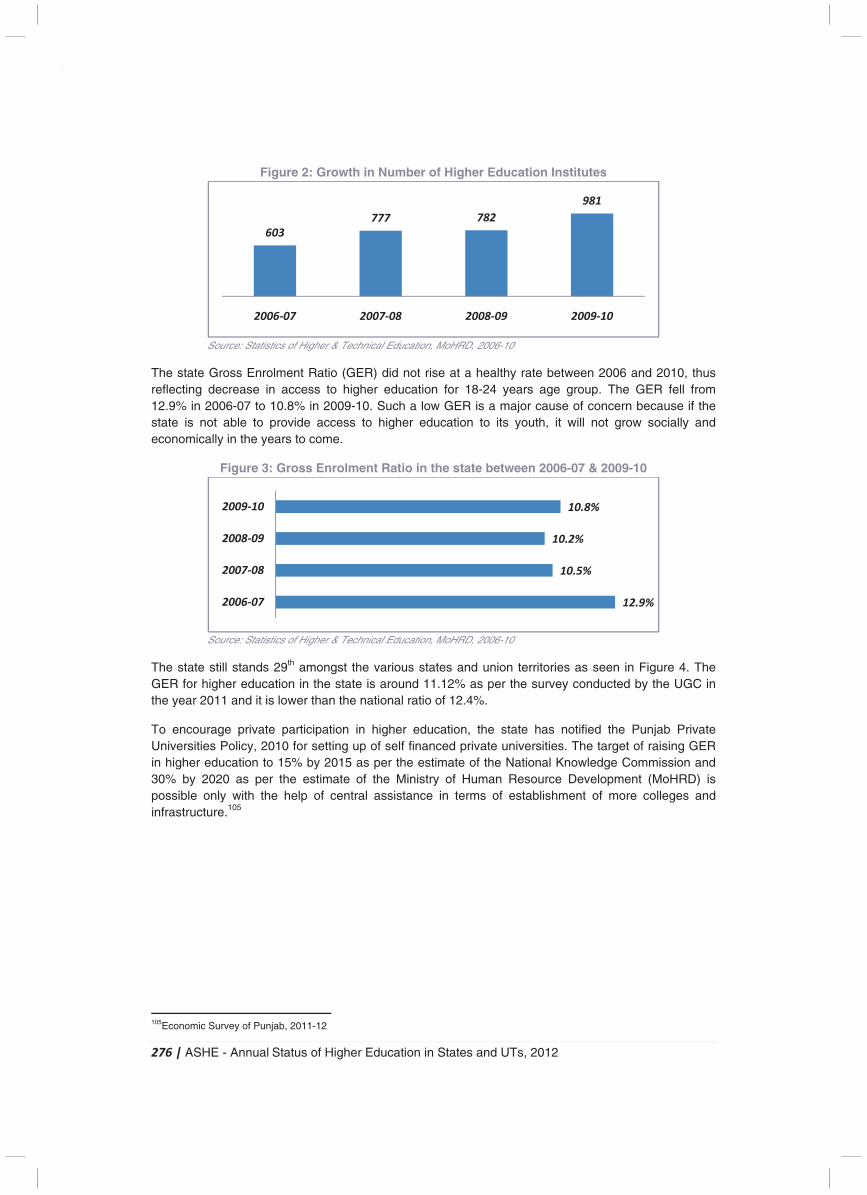
276 | ASHE - Annual Status of Higher Education in States and UTs, 2012
Figure 2: Growth in Number of Higher Education Institutes
Source: Statistics of Higher & Technical Education, MoHRD, 2006-10
The state Gross Enrolment Ratio (GER) did not rise at a healthy rate between 2006 and 2010, thus reflecting decrease in access to higher education for 18-24 years age group. The GER fell from 12.9% in 2006-07 to 10.8% in 2009-10. Such a low GER is a major cause of concern because if the state is not able to provide access to higher education to its youth, it will not grow socially and economically in the years to come.
Figure 3: Gross Enrolment Ratio in the state between 2006-07 & 2009-10
Source: Statistics of Higher & Technical Education, MoHRD, 2006-10
The state still stands 29th amongst the various states and union territories as seen in Figure 4. The GER for higher education in the state is around 11.12% as per the survey conducted by the UGC in the year 2011 and it is lower than the national ratio of 12.4%.
To encourage private participation in higher education, the state has notified the Punjab Private Universities Policy, 2010 for setting up of self financed private universities. The target of raising GER in higher education to 15% by 2015 as per the estimate of the National Knowledge Commission and 30% by 2020 as per the estimate of the Ministry of Human Resource Development (MoHRD) is possible only with the help of central assistance in terms of establishment of more colleges and infrastructure.105
105Economic Survey of Punjab, 2011-12
CAGR 11.85%
603
777 782
981
2006-07 2007-08 2008-09 2009-10
12.9%
10.5%
10.2%
10.8%
2006-07
2007-08
2008-09
2009-10
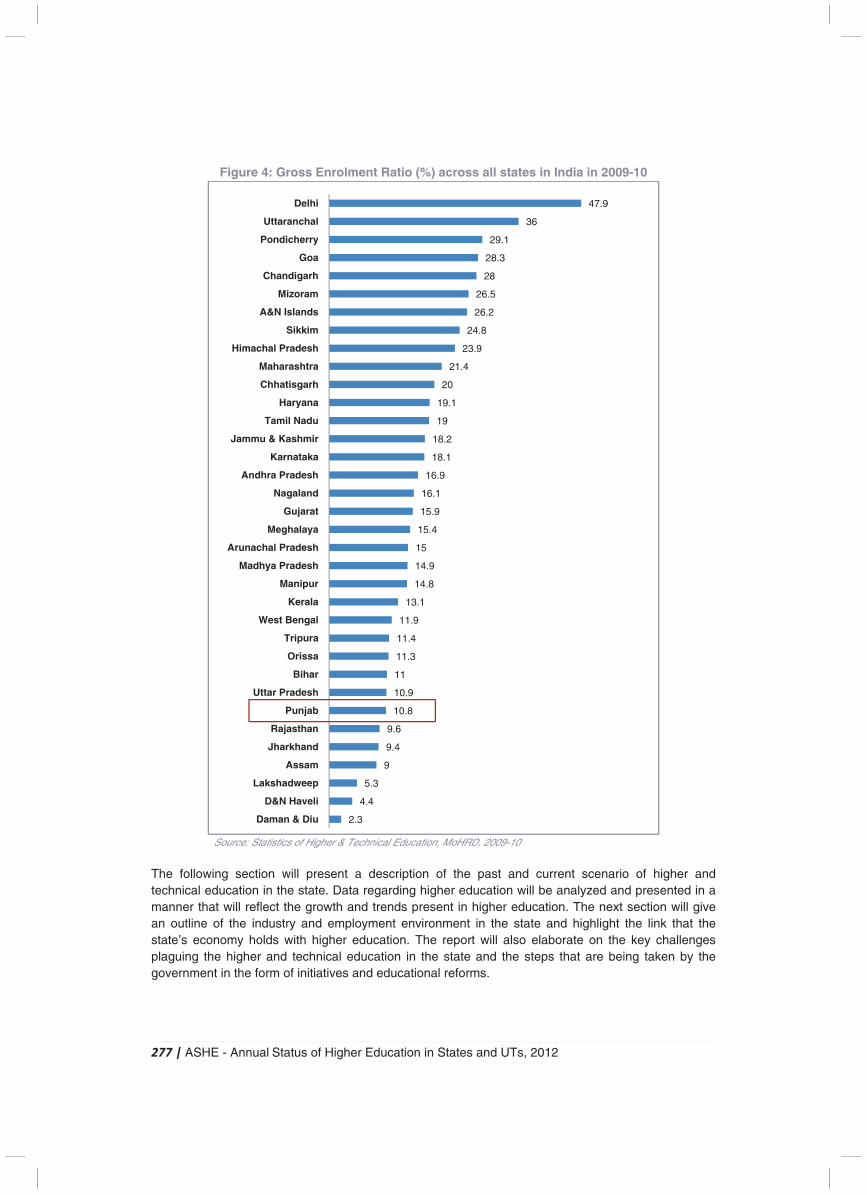
277 | ASHE - Annual Status of Higher Education in States and UTs, 2012
Figure 4: Gross Enrolment Ratio (%) across all states in India in 2009-10
Source: Statistics of Higher & Technical Education, MoHRD, 2009-10
The following section will present a description of the past and current scenario of higher and technical education in the state. Data regarding higher education will be analyzed and presented in a manner that will reflect the growth and trends present in higher education. The next section will give an outline of the industry and employment environment in the state and highlight the link that the state’s economy holds with higher education. The report will also elaborate on the key challenges plaguing the higher and technical education in the state and the steps that are being taken by the government in the form of initiatives and educational reforms.
2.3
4.4
5.3
9
9.4
9.6
10.8
10.9
11
11.3
11.4
11.9
13.1
14.8
14.9
15
15.4
15.9
16.1
16.9
18.1
18.2
19
19.1
20
21.4
23.9
24.8
26.2
26.5
28
28.3
29.1
36
47.9
Daman & Diu
D&N Haveli
Lakshadweep
Assam
Jharkhand
Rajasthan
Punjab
Uttar Pradesh
Bihar
Orissa
Tripura
West Bengal
Kerala
Manipur
Madhya Pradesh
Arunachal Pradesh
Meghalaya
Gujarat
Nagaland
Andhra Pradesh
Karnataka
Jammu & Kashmir
Tamil Nadu
Haryana
Chhatisgarh
Maharashtra
Himachal Pradesh
Sikkim
A&N Islands
Mizoram
Chandigarh
Goa
Pondicherry
Uttaranchal
Delhi
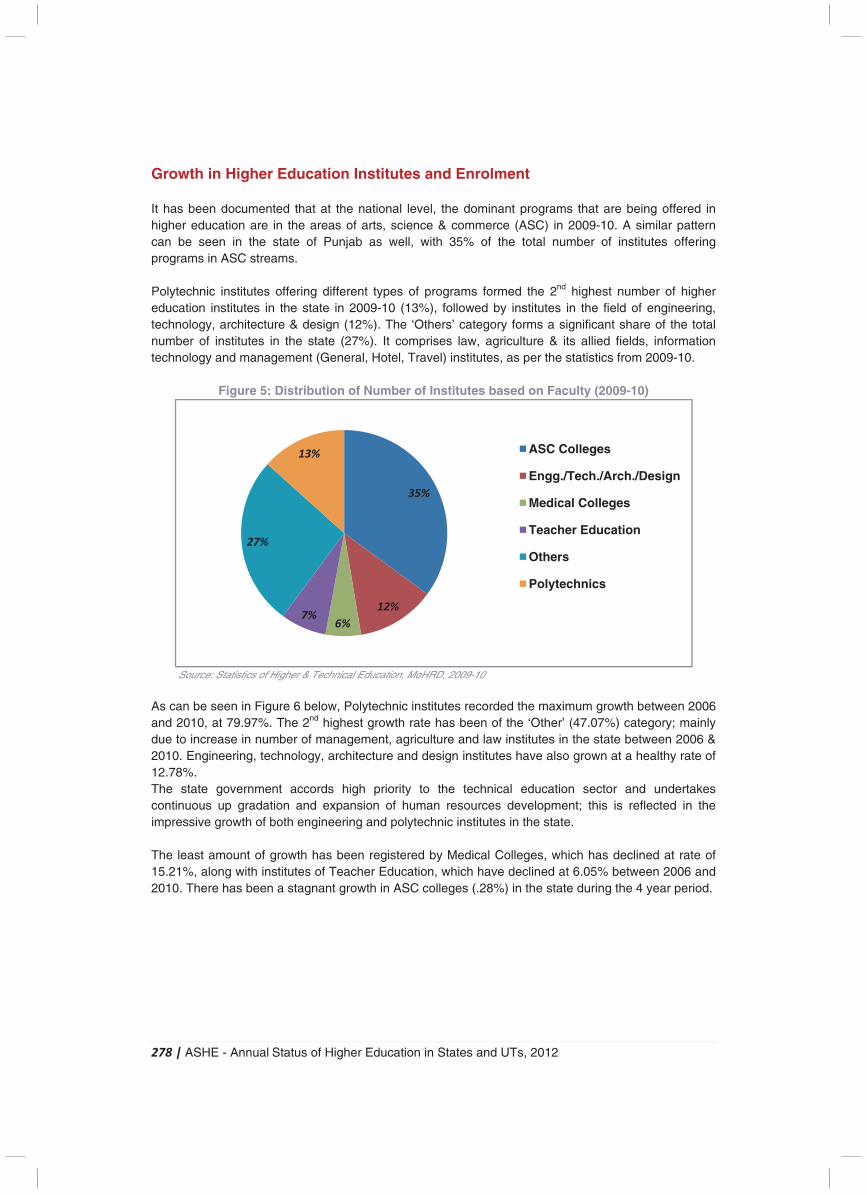
278 | ASHE - Annual Status of Higher Education in States and UTs, 2012
Growth in Higher Education Institutes and Enrolment It has been documented that at the national level, the dominant programs that are being offered in higher education are in the areas of arts, science & commerce (ASC) in 2009-10. A similar pattern can be seen in the state of Punjab as well, with 35% of the total number of institutes offering programs in ASC streams. Polytechnic institutes offering different types of programs formed the 2nd highest number of higher education institutes in the state in 2009-10 (13%), followed by institutes in the field of engineering, technology, architecture & design (12%). The ‘Others’ category forms a significant share of the total number of institutes in the state (27%). It comprises law, agriculture & its allied fields, information technology and management (General, Hotel, Travel) institutes, as per the statistics from 2009-10.
Figure 5: Distribution of Number of Institutes based on Faculty (2009-10)
Source: Statistics of Higher & Technical Education, MoHRD, 2009-10
As can be seen in Figure 6 below, Polytechnic institutes recorded the maximum growth between 2006 and 2010, at 79.97%. The 2nd highest growth rate has been of the ‘Other’ (47.07%) category; mainly due to increase in number of management, agriculture and law institutes in the state between 2006 & 2010. Engineering, technology, architecture and design institutes have also grown at a healthy rate of 12.78%. The state government accords high priority to the technical education sector and undertakes continuous up gradation and expansion of human resources development; this is reflected in the impressive growth of both engineering and polytechnic institutes in the state. The least amount of growth has been registered by Medical Colleges, which has declined at rate of 15.21%, along with institutes of Teacher Education, which have declined at 6.05% between 2006 and 2010. There has been a stagnant growth in ASC colleges (.28%) in the state during the 4 year period.
35%
12%
6%7%
27%
13% ASC Colleges
Engg./Tech./Arch./Design
Medical Colleges
Teacher Education
Others
Polytechnics
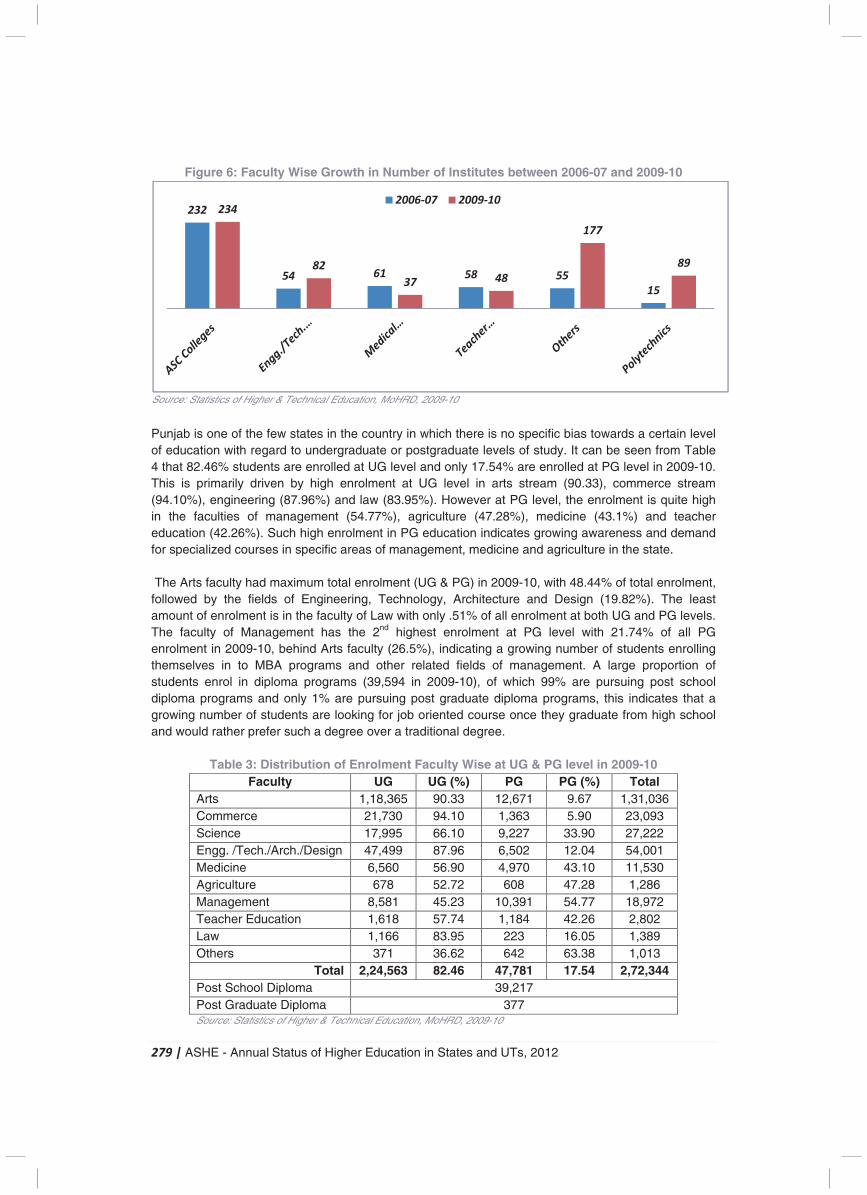
279 | ASHE - Annual Status of Higher Education in States and UTs, 2012
Figure 6: Faculty Wise Growth in Number of Institutes between 2006-07 and 2009-10
Source: Statistics of Higher & Technical Education, MoHRD, 2009-10
Punjab is one of the few states in the country in which there is no specific bias towards a certain level of education with regard to undergraduate or postgraduate levels of study. It can be seen from Table 4 that 82.46% students are enrolled at UG level and only 17.54% are enrolled at PG level in 2009-10. This is primarily driven by high enrolment at UG level in arts stream (90.33), commerce stream (94.10%), engineering (87.96%) and law (83.95%). However at PG level, the enrolment is quite high in the faculties of management (54.77%), agriculture (47.28%), medicine (43.1%) and teacher education (42.26%). Such high enrolment in PG education indicates growing awareness and demand for specialized courses in specific areas of management, medicine and agriculture in the state. The Arts faculty had maximum total enrolment (UG & PG) in 2009-10, with 48.44% of total enrolment, followed by the fields of Engineering, Technology, Architecture and Design (19.82%). The least amount of enrolment is in the faculty of Law with only .51% of all enrolment at both UG and PG levels. The faculty of Management has the 2nd highest enrolment at PG level with 21.74% of all PG enrolment in 2009-10, behind Arts faculty (26.5%), indicating a growing number of students enrolling themselves in to MBA programs and other related fields of management. A large proportion of students enrol in diploma programs (39,594 in 2009-10), of which 99% are pursuing post school diploma programs and only 1% are pursuing post graduate diploma programs, this indicates that a growing number of students are looking for job oriented course once they graduate from high school and would rather prefer such a degree over a traditional degree.
Table 3: Distribution of Enrolment Faculty Wise at UG & PG level in 2009-10 Faculty UG UG (%) PG PG (%) Total
Arts 1,18,365 90.33 12,671 9.67 1,31,036 Commerce 21,730 94.10 1,363 5.90 23,093 Science 17,995 66.10 9,227 33.90 27,222 Engg. /Tech./Arch./Design 47,499 87.96 6,502 12.04 54,001 Medicine 6,560 56.90 4,970 43.10 11,530 Agriculture 678 52.72 608 47.28 1,286 Management 8,581 45.23 10,391 54.77 18,972 Teacher Education 1,618 57.74 1,184 42.26 2,802 Law 1,166 83.95 223 16.05 1,389 Others 371 36.62 642 63.38 1,013
Total 2,24,563 82.46 47,781 17.54 2,72,344 Post School Diploma 39,217 Post Graduate Diploma 377 Source: Statistics of Higher & Technical Education, MoHRD, 2009-10
(.28%)
(14.78%) (-15.21%) (-6.05%) (79.97%) (47.07%)
232
54 61 58 55
15
234
82
37 48
177
89
2006-07 2009-10
280 | ASHE - Annual Status of Higher Education in States and UTs, 2012
With regard to total enrolment, the maximum growth has been registered in the faculties of Law (129.97%), followed by Management (67.76%) and Engineering (43.87%) between 2007 and 2010. The streams of Arts (-1.14%), Science (-8.75%), Agriculture (-3.38%) and Teacher Education (-59.99%) have all recorded negative growth in the same period. Post school diplomas have registered an impressive growth of 29.11%, indicating a growing demand for diploma courses offered after school. However, postgraduate diploma courses have witnessed a slump, with the enrolment in such diploma degree programs declining at 50.98%.
We can see in Table 4 that there has been a marginal growth at UG (3.37%) and overall levels of enrolment (7.38%) between 2007 and 2010; however PG level enrolment has registered an impressive growth of 31.3% in the same time period. Such impressive growth in PG is indicative of students opting for specialized degrees in the form of M.A, M.Sc., and MBA etc. after completing their UG degrees in the state. There has been an impressive growth in the enrolment at PG level in the faculties of Medicine (481.29%), Management (120.34%) and Science (29.3%). The enrolment at UG level has decreased in the faculties of Medicine (-31.45%), Science (-20.72%), Arts (-2.03%) and Teacher Education (-72.95%).
Table 4: Faculty Wise Growth of Enrolment at UG and PG level between 2007-08 & 2009-10
Faculty UG +PG Growth (%)
2007-08 2009-10 UG PG Total Arts 1,32,552 1,31,036 -2.03 7.98 -1.14 Commerce 22,425 23,093 7.09 -36.10 2.98 Science 29,833 27,222 -20.72 29.30 -8.75 Engg. /Tech./Arch. 37,535 54,001 60.35 -17.82 43.87 Medicine 10,425 11,530 -31.45 481.29 10.60 Agriculture 1,331 1,286 -12.52 9.35 -3.38 Management 11,309 18,972 30.15 120.34 67.76 Teacher Education 7,004 2,802 -72.97 16.42 -59.99 Law 604 1,389 206.04 0.00 129.97 Others 617 1,013 -27.25 500.00 64.18
Total 2,53,635 2,72,344 3.37 31.30 7.38 Post School Diploma 30,375 39,217 29.11 Post Graduate Diploma 769 377 -50.98
Source: Statistics of Higher & Technical Education, MoHRD, 2007-08 & 2009-10
Quality of Institutes
In total 68 colleges have been graded by the NAAC106 in 2005 and out of these, only 2 colleges have been graded under the previous star system and have been awarded 4 Star, while the remaining 68 have been accredited and graded according to the 9-point scale system.
A notable cluster of colleges falls in the grade range of B and A+ (62 colleges) with maximum number of colleges receiving B++ grade (32.35%). From Table 5 below, it can be noted that 50% of the accredited colleges of Guru Nanak Dev University are graded as A or A+; 68% of colleges of Panjab University have secured B++ and A; while 66% of the colleges of Punjabi University have secured B+ and B++ grades.
106National Assessment & Accreditation Council
281 | ASHE - Annual Status of Higher Education in States and UTs, 2012
Table 5: Number of Affiliated Colleges Graded by NAAC in 2005 University 4-star A+ A B++ B+ B C++ C+ C Total
Guru Nanak Dev University
1 6 4 3 3 2 1 0 0 20
Panjab University
1 2 6 14 4 1 1 1 – 30
Punjabi University
0 1 2 5 7 2 0 0 1 18
Total 2 9 12 22 14 5 2 1 1 68 Source: State Wise Analysis of Accreditation Reports- Punjab, 2005
Industry and Employment Scenario
Key Industries107
Punjab has emerged as a key hub for textile-based industries including yarn, readymade garments and hosiery. In 2009-10, the industry accounted for more than 35% share of the total exports of industrial goods from the state. Punjab is also a leading exporter of rice, including the well-known variety known as Basmati.
The state offers a wide range of subsidies, fiscal and policy incentives as well as assistance for businesses under the Industrial Policy, 2009. Additionally, the state has sector-specific policies for textile, IT and agro-based industries. Due to the major rivers flowing through the state, it has a rich and productive agricultural land. After the introduction of “Green Revolution” in the late 1960s, it has become the leading food-grain supplier in the country. This makes it suitable for agro-based industries, dairy farming and products, and other food processing industries. Descriptions of some of the key industries in the state currently are given as follows.
1. Agro-based Industries � The state government has actively promoted contract farming. Some of the notable contract
farming agreements includes those with the Tata Group for basmati rice, the UB Group for malting barley and Advanta India for hyola (high-breed rapeseeds and mustard). Crops being promoted include maize, hybrid basmati and sunflower.
� Key players in these industries are Nestle India, MILKFED, Jagjit Industries Ltd and Marfed.
2. Light Engineering Goods � The light engineering goods industry in Punjab includes bicycle and bicycle parts, hand
tools, sewing machines and machine tools. The industry accounts for around 21% share of the manufacturing output and more than 25% of the industrial employment in the state.
� The state accounts for around 15% of bicycle production and 80%of bicycle parts production in India. The industry is primarily located in Ludhiana.
� Key players in this industry are Hero Cycles and Avon Cycles
3. Petrochemical Products & Fertilizers � Industrial activity in the petrochemicals and fertilizer categories includes refining,
petrochemicals, chemicals, fertilizers and other related products and distribution. � Future growth in this sector is expected with the development of Hindustan Petroleum
Corporation Ltd. refinery project as well as increasing the production of fertilizer in the state. � Major players in this industry are Hindustan Petroleum Corporation Ltd, National Fertilizers
Ltd, Punjab Chemicals and Crop Protection Ltd and Punjab Alkalies & Chemicals Ltd.
107India Brand Equity Foundation – State report on Punjab
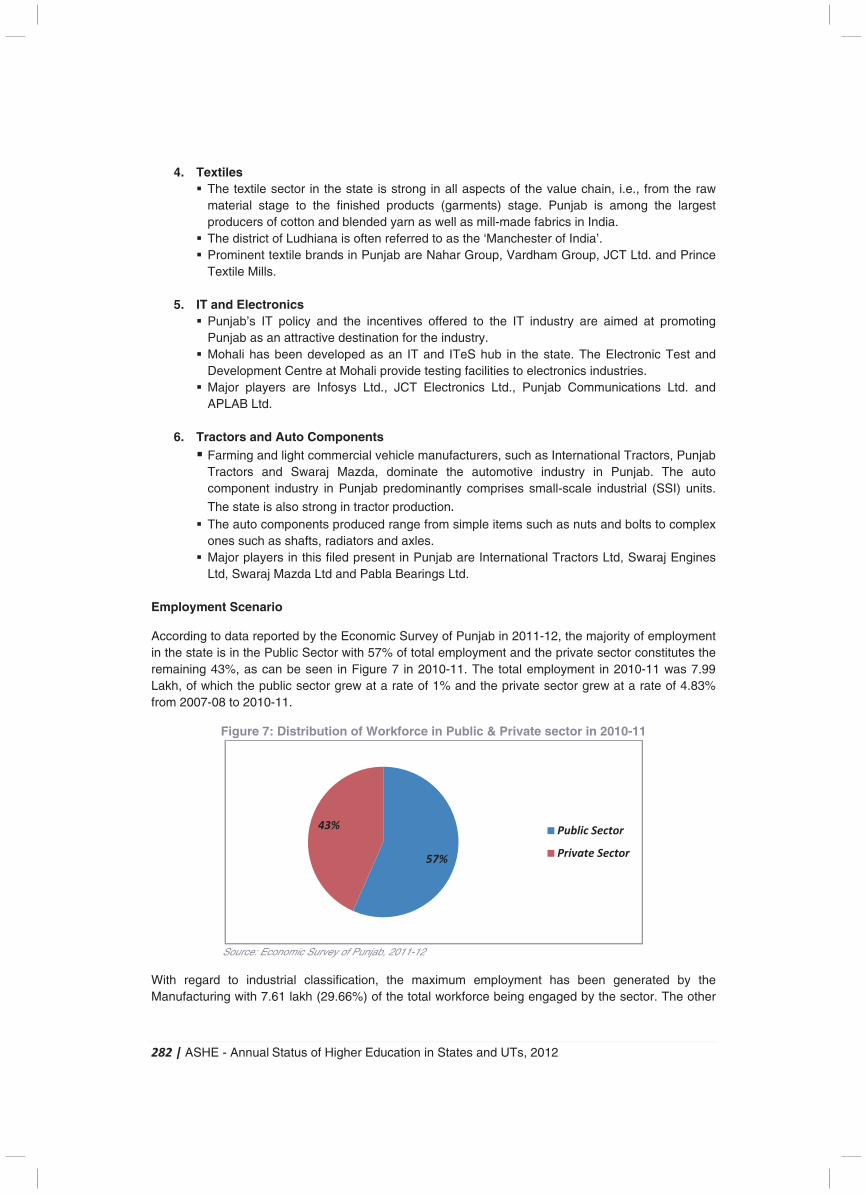
282 | ASHE - Annual Status of Higher Education in States and UTs, 2012
4. Textiles � The textile sector in the state is strong in all aspects of the value chain, i.e., from the raw
material stage to the finished products (garments) stage. Punjab is among the largest producers of cotton and blended yarn as well as mill-made fabrics in India.
� The district of Ludhiana is often referred to as the ‘Manchester of India’. � Prominent textile brands in Punjab are Nahar Group, Vardham Group, JCT Ltd. and Prince
Textile Mills.
5. IT and Electronics � Punjab’s IT policy and the incentives offered to the IT industry are aimed at promoting
Punjab as an attractive destination for the industry. � Mohali has been developed as an IT and ITeS hub in the state. The Electronic Test and
Development Centre at Mohali provide testing facilities to electronics industries. � Major players are Infosys Ltd., JCT Electronics Ltd., Punjab Communications Ltd. and
APLAB Ltd.
6. Tractors and Auto Components � Farming and light commercial vehicle manufacturers, such as International Tractors, Punjab
Tractors and Swaraj Mazda, dominate the automotive industry in Punjab. The auto component industry in Punjab predominantly comprises small-scale industrial (SSI) units.
The state is also strong in tractor production.
� The auto components produced range from simple items such as nuts and bolts to complex ones such as shafts, radiators and axles.
� Major players in this filed present in Punjab are International Tractors Ltd, Swaraj Engines Ltd, Swaraj Mazda Ltd and Pabla Bearings Ltd.
Employment Scenario
According to data reported by the Economic Survey of Punjab in 2011-12, the majority of employment in the state is in the Public Sector with 57% of total employment and the private sector constitutes the remaining 43%, as can be seen in Figure 7 in 2010-11. The total employment in 2010-11 was 7.99 Lakh, of which the public sector grew at a rate of 1% and the private sector grew at a rate of 4.83% from 2007-08 to 2010-11.
Figure 7: Distribution of Workforce in Public & Private sector in 2010-11
Source: Economic Survey of Punjab, 2011-12
With regard to industrial classification, the maximum employment has been generated by the Manufacturing with 7.61 lakh (29.66%) of the total workforce being engaged by the sector. The other
57%
43% Public Sector
Private Sector
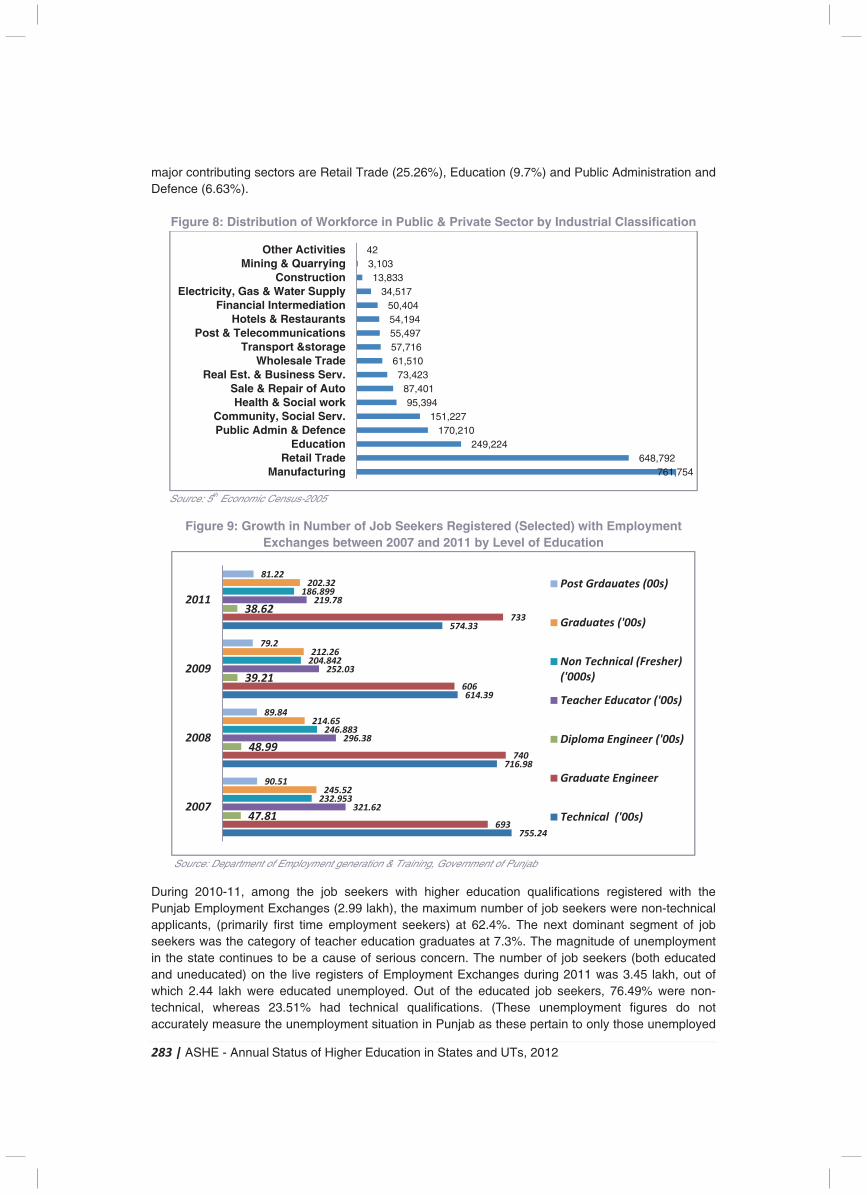
283 | ASHE - Annual Status of Higher Education in States and UTs, 2012
major contributing sectors are Retail Trade (25.26%), Education (9.7%) and Public Administration and Defence (6.63%).
Figure 8: Distribution of Workforce in Public & Private Sector by Industrial Classification
Source: 5th Economic Census-2005
Figure 9: Growth in Number of Job Seekers Registered (Selected) with Employment Exchanges between 2007 and 2011 by Level of Education
Source: Department of Employment generation & Training, Government of Punjab During 2010-11, among the job seekers with higher education qualifications registered with the Punjab Employment Exchanges (2.99 lakh), the maximum number of job seekers were non-technical applicants, (primarily first time employment seekers) at 62.4%. The next dominant segment of job seekers was the category of teacher education graduates at 7.3%. The magnitude of unemployment in the state continues to be a cause of serious concern. The number of job seekers (both educated and uneducated) on the live registers of Employment Exchanges during 2011 was 3.45 lakh, out of which 2.44 lakh were educated unemployed. Out of the educated job seekers, 76.49% were non-technical, whereas 23.51% had technical qualifications. (These unemployment figures do not accurately measure the unemployment situation in Punjab as these pertain to only those unemployed
761,754 648,792
249,224 170,210
151,227 95,394
87,401 73,423
61,510 57,716 55,497 54,194 50,404
34,517 13,833
3,103 42
ManufacturingRetail Trade
EducationPublic Admin & DefenceCommunity, Social Serv.
Health & Social workSale & Repair of Auto
Real Est. & Business Serv.Wholesale Trade
Transport &storagePost & Telecommunications
Hotels & RestaurantsFinancial Intermediation
Electricity, Gas & Water SupplyConstruction
Mining & QuarryingOther Activities
755.24
716.98
614.39
574.33
693
740
606
733
47.81
48.99
39.21
38.62
321.62
296.38
252.03
219.78
232.953
246.883
204.842
186.899
245.52
214.65
212.26
202.32
90.51
89.84
79.2
81.22
2007
2008
2009
2011
Post Grdauates (00s)
Graduates ('00s)
Non Technical (Fresher)
('000s)
Teacher Educator ('00s)
Diploma Engineer ('00s)
Graduate Engineer
Technical ('00s)
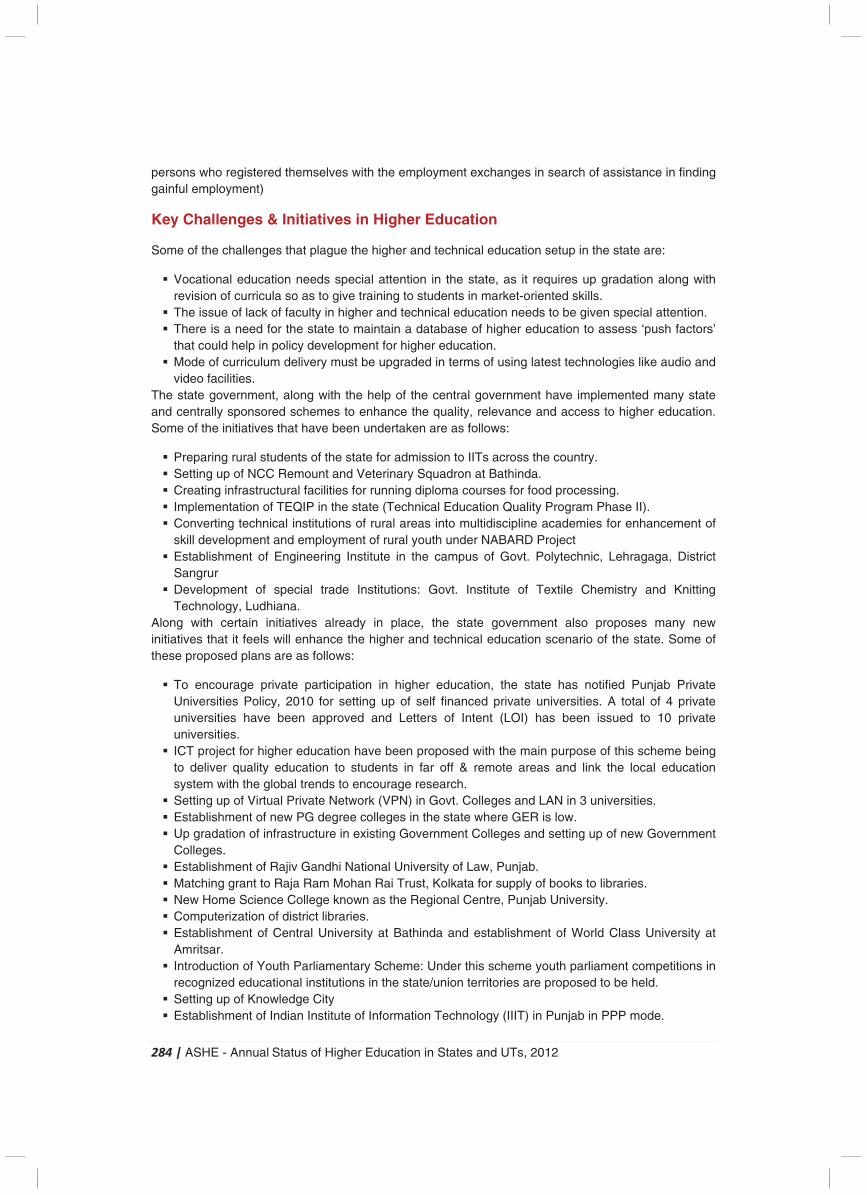
284 | ASHE - Annual Status of Higher Education in States and UTs, 2012
persons who registered themselves with the employment exchanges in search of assistance in finding gainful employment)
Key Challenges & Initiatives in Higher Education
Some of the challenges that plague the higher and technical education setup in the state are:
� Vocational education needs special attention in the state, as it requires up gradation along with revision of curricula so as to give training to students in market-oriented skills.
� The issue of lack of faculty in higher and technical education needs to be given special attention. � There is a need for the state to maintain a database of higher education to assess ‘push factors’
that could help in policy development for higher education. � Mode of curriculum delivery must be upgraded in terms of using latest technologies like audio and
video facilities. The state government, along with the help of the central government have implemented many state and centrally sponsored schemes to enhance the quality, relevance and access to higher education. Some of the initiatives that have been undertaken are as follows:
� Preparing rural students of the state for admission to IITs across the country. � Setting up of NCC Remount and Veterinary Squadron at Bathinda. � Creating infrastructural facilities for running diploma courses for food processing. � Implementation of TEQIP in the state (Technical Education Quality Program Phase II). � Converting technical institutions of rural areas into multidiscipline academies for enhancement of
skill development and employment of rural youth under NABARD Project � Establishment of Engineering Institute in the campus of Govt. Polytechnic, Lehragaga, District
Sangrur � Development of special trade Institutions: Govt. Institute of Textile Chemistry and Knitting
Technology, Ludhiana. Along with certain initiatives already in place, the state government also proposes many new initiatives that it feels will enhance the higher and technical education scenario of the state. Some of these proposed plans are as follows:
� To encourage private participation in higher education, the state has notified Punjab Private Universities Policy, 2010 for setting up of self financed private universities. A total of 4 private universities have been approved and Letters of Intent (LOI) has been issued to 10 private universities.
� ICT project for higher education have been proposed with the main purpose of this scheme being to deliver quality education to students in far off & remote areas and link the local education system with the global trends to encourage research.
� Setting up of Virtual Private Network (VPN) in Govt. Colleges and LAN in 3 universities. � Establishment of new PG degree colleges in the state where GER is low. � Up gradation of infrastructure in existing Government Colleges and setting up of new Government
Colleges. � Establishment of Rajiv Gandhi National University of Law, Punjab. � Matching grant to Raja Ram Mohan Rai Trust, Kolkata for supply of books to libraries. � New Home Science College known as the Regional Centre, Punjab University. � Computerization of district libraries. � Establishment of Central University at Bathinda and establishment of World Class University at
Amritsar. � Introduction of Youth Parliamentary Scheme: Under this scheme youth parliament competitions in
recognized educational institutions in the state/union territories are proposed to be held. � Setting up of Knowledge City � Establishment of Indian Institute of Information Technology (IIIT) in Punjab in PPP mode.
285 | ASHE - Annual Status of Higher Education in States and UTs, 2012
� Setting up of new polytechnics in districts where no Government Polytechnic exists at present. Community development through polytechnics.
� Up gradation of 18 Government Polytechnic Colleges into multi-purpose academies (B.Pharm, D.Pharm and opening of ITIs, Polytechnics, Engineering Colleges and 10+2 Science schools) within the same premises.
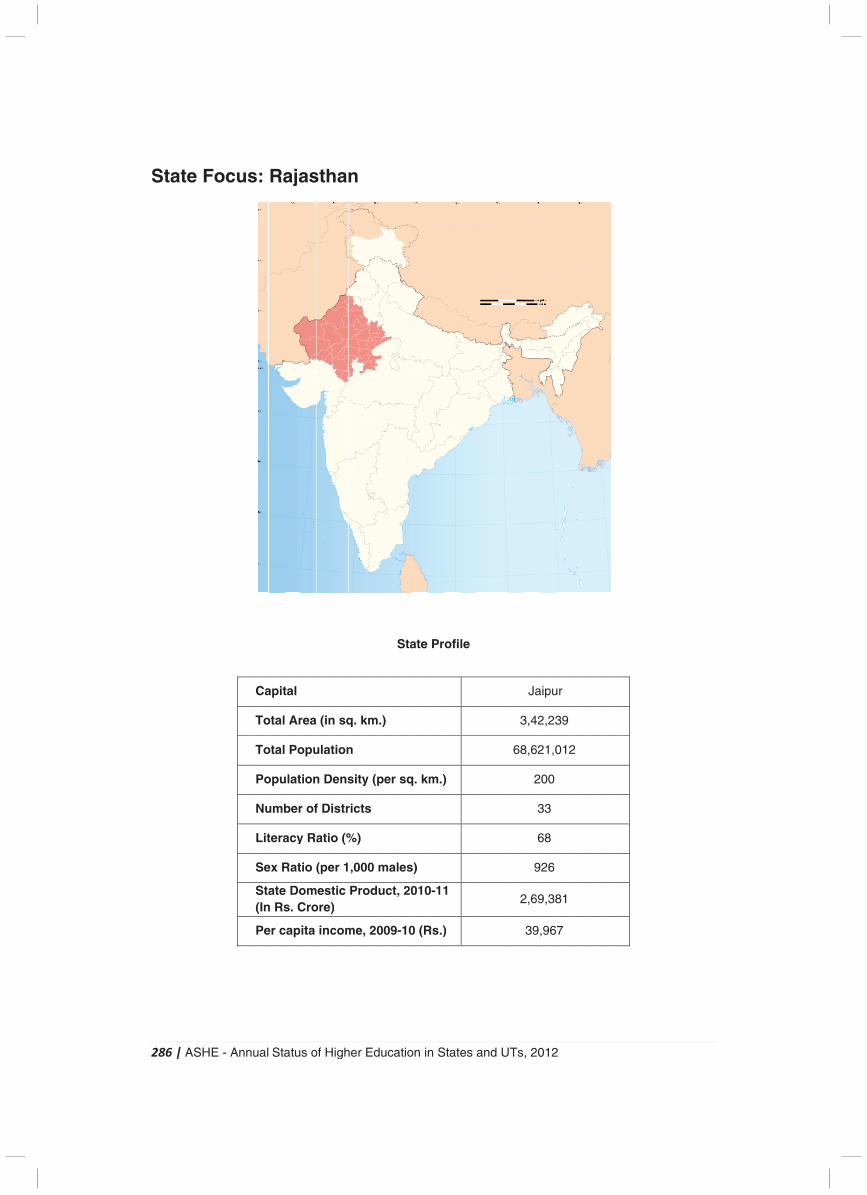
2
S
286
Sta
| A
ate
ASH
e F
HE
Fo
- A
oc
Ann
us
ual
s:
Ca
To
To
Po
Nu
Lit
Se
Sta(In
Pe
Sta
Ra
apit
otal
otal
opu
umb
tera
ex R
aten Rs
er c
atu
aja
tal
Ar
Po
ulat
ber
acy
Rat
e Dos. C
cap
s o
as
rea
opu
tion
r of
y Ra
tio (
omCro
ita
of H
sth
(in
ulat
n D
f Di
atio
(pe
mestore)
inc
High
ha
n sq
tion
ens
istr
o (%
er 1
tic )
com
her
n
q. k
n
sity
rict
%)
,00
Pro
me,
Ed
km.
y (p
s
00 m
odu
, 20
uca
.)
per
ma
uct
009
atio
Sta
sq
les
, 20
9-10
on in
ate
q. k
s)
010
0 (R
n S
Pr
m.)
0-11
Rs.)
Stat
ofi
)
1
)
es
le
and
d U
UTs
3
68
2
, 20
Ja
3,42
8,62
2
3
6
9
2,69
39
012
aipu
2,23
21,0
200
33
68
926
9,38
,96
2
ur
39
012
81
67
2
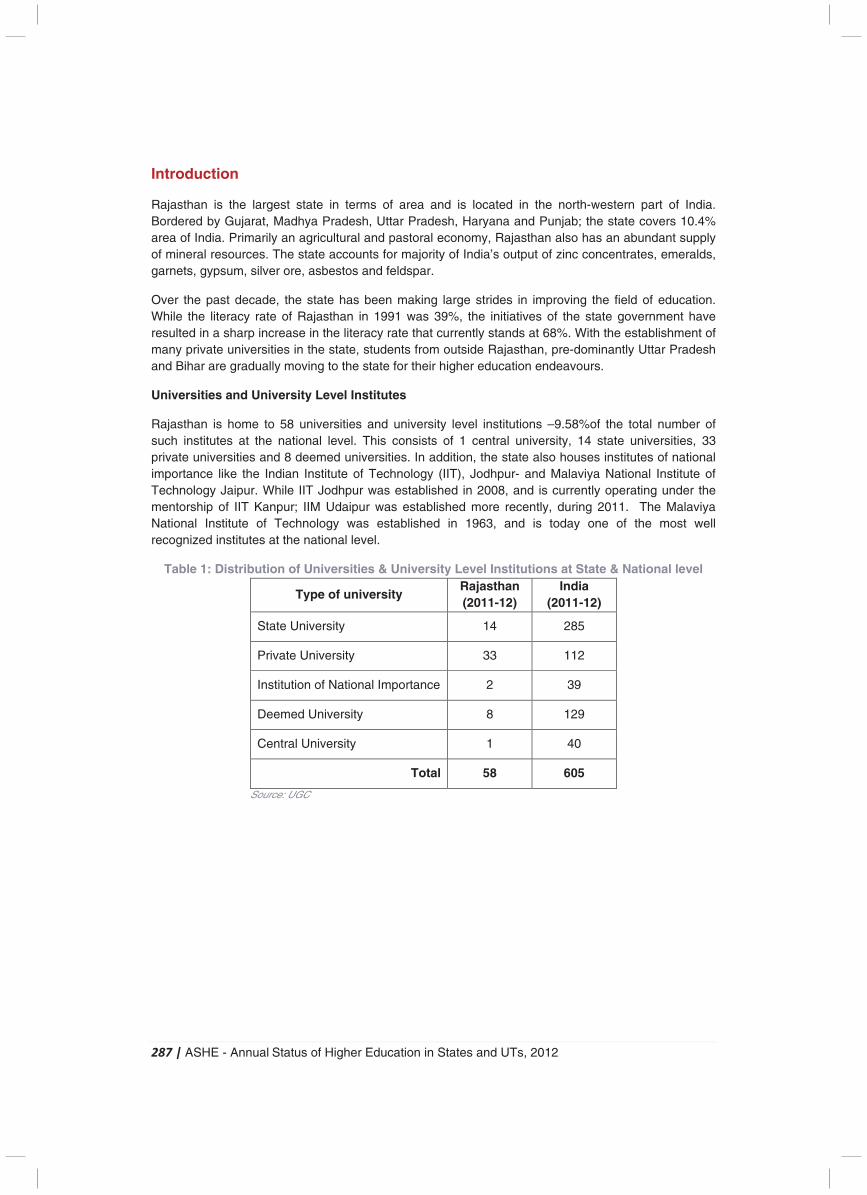
287 | ASHE - Annual Status of Higher Education in States and UTs, 2012
Introduction
Rajasthan is the largest state in terms of area and is located in the north-western part of India. Bordered by Gujarat, Madhya Pradesh, Uttar Pradesh, Haryana and Punjab; the state covers 10.4% area of India. Primarily an agricultural and pastoral economy, Rajasthan also has an abundant supply of mineral resources. The state accounts for majority of India’s output of zinc concentrates, emeralds, garnets, gypsum, silver ore, asbestos and feldspar.
Over the past decade, the state has been making large strides in improving the field of education. While the literacy rate of Rajasthan in 1991 was 39%, the initiatives of the state government have resulted in a sharp increase in the literacy rate that currently stands at 68%. With the establishment of many private universities in the state, students from outside Rajasthan, pre-dominantly Uttar Pradesh and Bihar are gradually moving to the state for their higher education endeavours.
Universities and University Level Institutes
Rajasthan is home to 58 universities and university level institutions –9.58%of the total number of such institutes at the national level. This consists of 1 central university, 14 state universities, 33 private universities and 8 deemed universities. In addition, the state also houses institutes of national importance like the Indian Institute of Technology (IIT), Jodhpur- and Malaviya National Institute of Technology Jaipur. While IIT Jodhpur was established in 2008, and is currently operating under the mentorship of IIT Kanpur; IIM Udaipur was established more recently, during 2011. The Malaviya National Institute of Technology was established in 1963, and is today one of the most well recognized institutes at the national level.
Table 1: Distribution of Universities & University Level Institutions at State & National level
Type of university Rajasthan (2011-12)
India (2011-12)
State University 14 285
Private University 33 112
Institution of National Importance 2 39
Deemed University 8 129
Central University 1 40
Total 58 605
Source: UGC
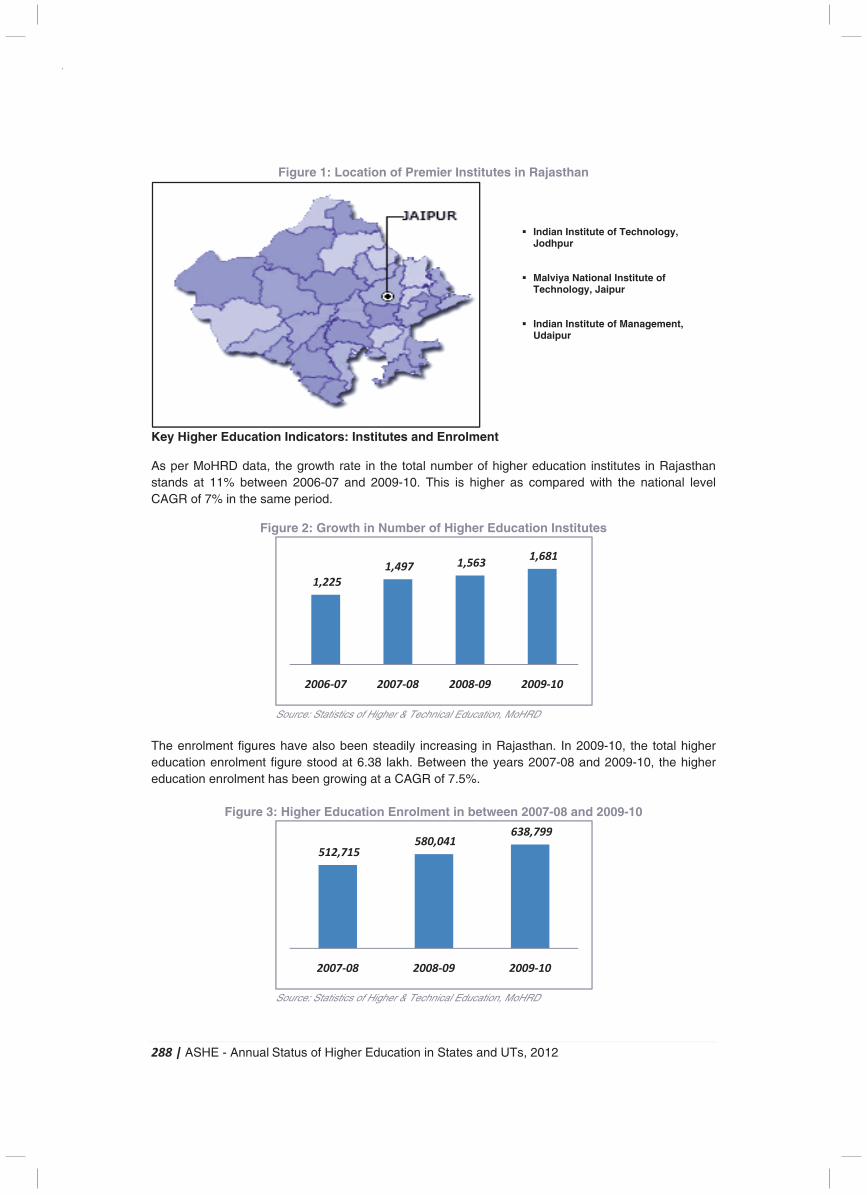
288 | ASHE - Annual Status of Higher Education in States and UTs, 2012
Figure 1: Location of Premier Institutes in Rajasthan
Key Higher Education Indicators: Institutes and Enrolment
As per MoHRD data, the growth rate in the total number of higher education institutes in Rajasthan stands at 11% between 2006-07 and 2009-10. This is higher as compared with the national level CAGR of 7% in the same period.
Figure 2: Growth in Number of Higher Education Institutes
Source: Statistics of Higher & Technical Education, MoHRD
The enrolment figures have also been steadily increasing in Rajasthan. In 2009-10, the total higher education enrolment figure stood at 6.38 lakh. Between the years 2007-08 and 2009-10, the higher education enrolment has been growing at a CAGR of 7.5%.
Figure 3: Higher Education Enrolment in between 2007-08 and 2009-10
Source: Statistics of Higher & Technical Education, MoHRD
� Indian Institute of Technology, Jodhpur
� Malviya National Institute of Technology, Jaipur
� Indian Institute of Management,
Udaipur
1,225
1,497 1,563 1,681
2006-07 2007-08 2008-09 2009-10
512,715 580,041
638,799
2007-08 2008-09 2009-10
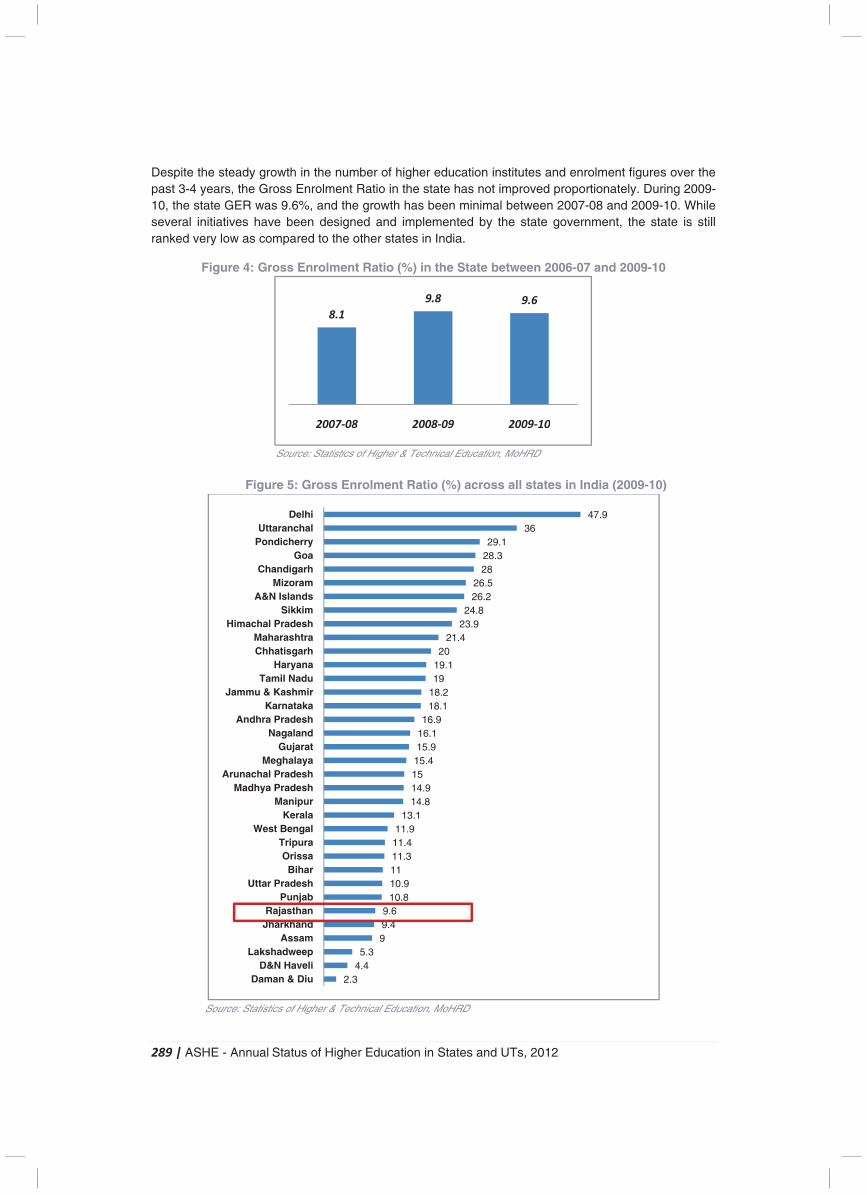
289 | ASHE - Annual Status of Higher Education in States and UTs, 2012
Despite the steady growth in the number of higher education institutes and enrolment figures over the past 3-4 years, the Gross Enrolment Ratio in the state has not improved proportionately. During 2009-10, the state GER was 9.6%, and the growth has been minimal between 2007-08 and 2009-10. While several initiatives have been designed and implemented by the state government, the state is still ranked very low as compared to the other states in India.
Figure 4: Gross Enrolment Ratio (%) in the State between 2006-07 and 2009-10
Source: Statistics of Higher & Technical Education, MoHRD
Figure 5: Gross Enrolment Ratio (%) across all states in India (2009-10)
Source: Statistics of Higher & Technical Education, MoHRD
8.1
9.8 9.6
2007-08 2008-09 2009-10
2.34.45.3
99.49.6
10.810.91111.311.411.9
13.114.814.91515.415.916.116.9
18.118.21919.120
21.423.924.8
26.226.5
2828.329.1
3647.9
Daman & DiuD&N Haveli
LakshadweepAssam
JharkhandRajasthan
PunjabUttar Pradesh
BiharOrissa
TripuraWest Bengal
KeralaManipur
Madhya PradeshArunachal Pradesh
MeghalayaGujarat
NagalandAndhra Pradesh
KarnatakaJammu & Kashmir
Tamil NaduHaryana
ChhatisgarhMaharashtra
Himachal PradeshSikkim
A&N IslandsMizoram
ChandigarhGoa
PondicherryUttaranchal
Delhi
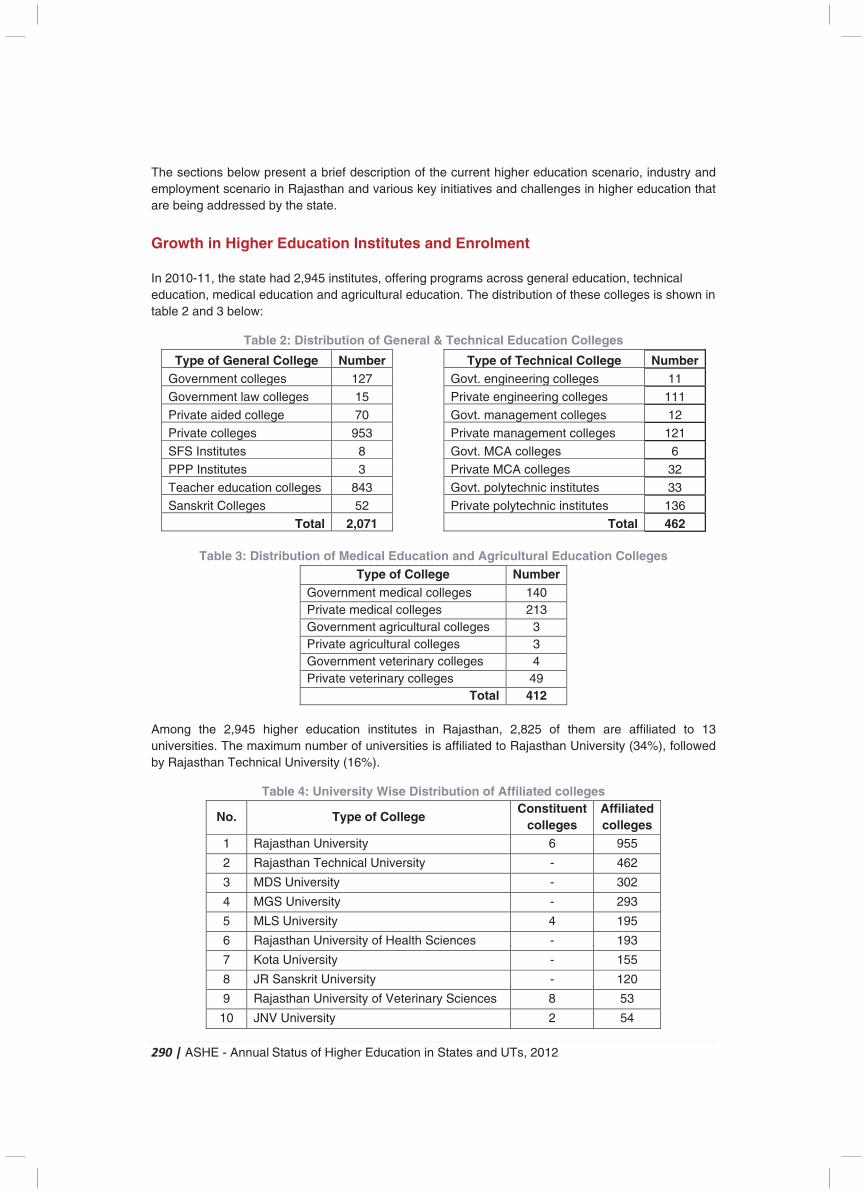
290 | ASHE - Annual Status of Higher Education in States and UTs, 2012
The sections below present a brief description of the current higher education scenario, industry and employment scenario in Rajasthan and various key initiatives and challenges in higher education that are being addressed by the state. Growth in Higher Education Institutes and Enrolment In 2010-11, the state had 2,945 institutes, offering programs across general education, technical education, medical education and agricultural education. The distribution of these colleges is shown in table 2 and 3 below:
Table 2: Distribution of General & Technical Education Colleges
Type of General College Number Type of Technical College Number Government colleges 127 Govt. engineering colleges 11
Government law colleges 15 Private engineering colleges 111
Private aided college 70 Govt. management colleges 12
Private colleges 953 Private management colleges 121
SFS Institutes 8 Govt. MCA colleges 6
PPP Institutes 3 Private MCA colleges 32
Teacher education colleges 843 Govt. polytechnic institutes 33
Sanskrit Colleges 52 Private polytechnic institutes 136
Total 2,071 Total 462
Table 3: Distribution of Medical Education and Agricultural Education Colleges Type of College Number
Government medical colleges 140 Private medical colleges 213 Government agricultural colleges 3 Private agricultural colleges 3 Government veterinary colleges 4 Private veterinary colleges 49
Total 412 Among the 2,945 higher education institutes in Rajasthan, 2,825 of them are affiliated to 13 universities. The maximum number of universities is affiliated to Rajasthan University (34%), followed by Rajasthan Technical University (16%).
Table 4: University Wise Distribution of Affiliated colleges
No. Type of College Constituent
colleges Affiliated colleges
1 Rajasthan University 6 955
2 Rajasthan Technical University - 462
3 MDS University - 302
4 MGS University - 293
5 MLS University 4 195
6 Rajasthan University of Health Sciences - 193
7 Kota University - 155
8 JR Sanskrit University - 120
9 Rajasthan University of Veterinary Sciences 8 53
10 JNV University 2 54
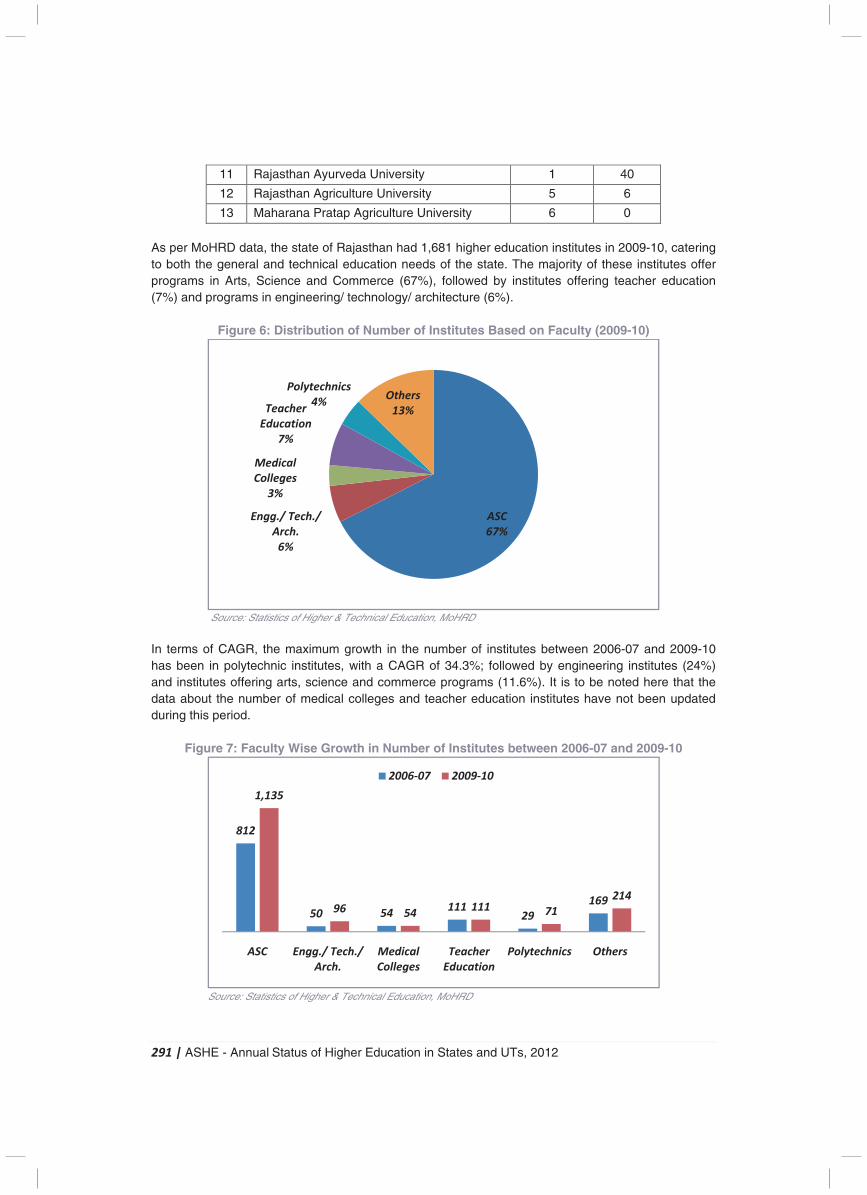
291 | ASHE - Annual Status of Higher Education in States and UTs, 2012
11 Rajasthan Ayurveda University 1 40
12 Rajasthan Agriculture University 5 6
13 Maharana Pratap Agriculture University 6 0
As per MoHRD data, the state of Rajasthan had 1,681 higher education institutes in 2009-10, catering to both the general and technical education needs of the state. The majority of these institutes offer programs in Arts, Science and Commerce (67%), followed by institutes offering teacher education (7%) and programs in engineering/ technology/ architecture (6%).
Figure 6: Distribution of Number of Institutes Based on Faculty (2009-10)
Source: Statistics of Higher & Technical Education, MoHRD
In terms of CAGR, the maximum growth in the number of institutes between 2006-07 and 2009-10 has been in polytechnic institutes, with a CAGR of 34.3%; followed by engineering institutes (24%) and institutes offering arts, science and commerce programs (11.6%). It is to be noted here that the data about the number of medical colleges and teacher education institutes have not been updated during this period.
Figure 7: Faculty Wise Growth in Number of Institutes between 2006-07 and 2009-10
Source: Statistics of Higher & Technical Education, MoHRD
(11.6%)
(24%) (0%) (0%) (34.3%)
ASC
67%
Engg./ Tech./
Arch.
6%
Medical
Colleges
3%
Teacher
Education
7%
Polytechnics
4%Others
13%
812
50 54111
29
169
1,135
96 54111 71
214
ASC Engg./ Tech./
Arch.
Medical
Colleges
Teacher
Education
Polytechnics Others
2006-07 2009-10
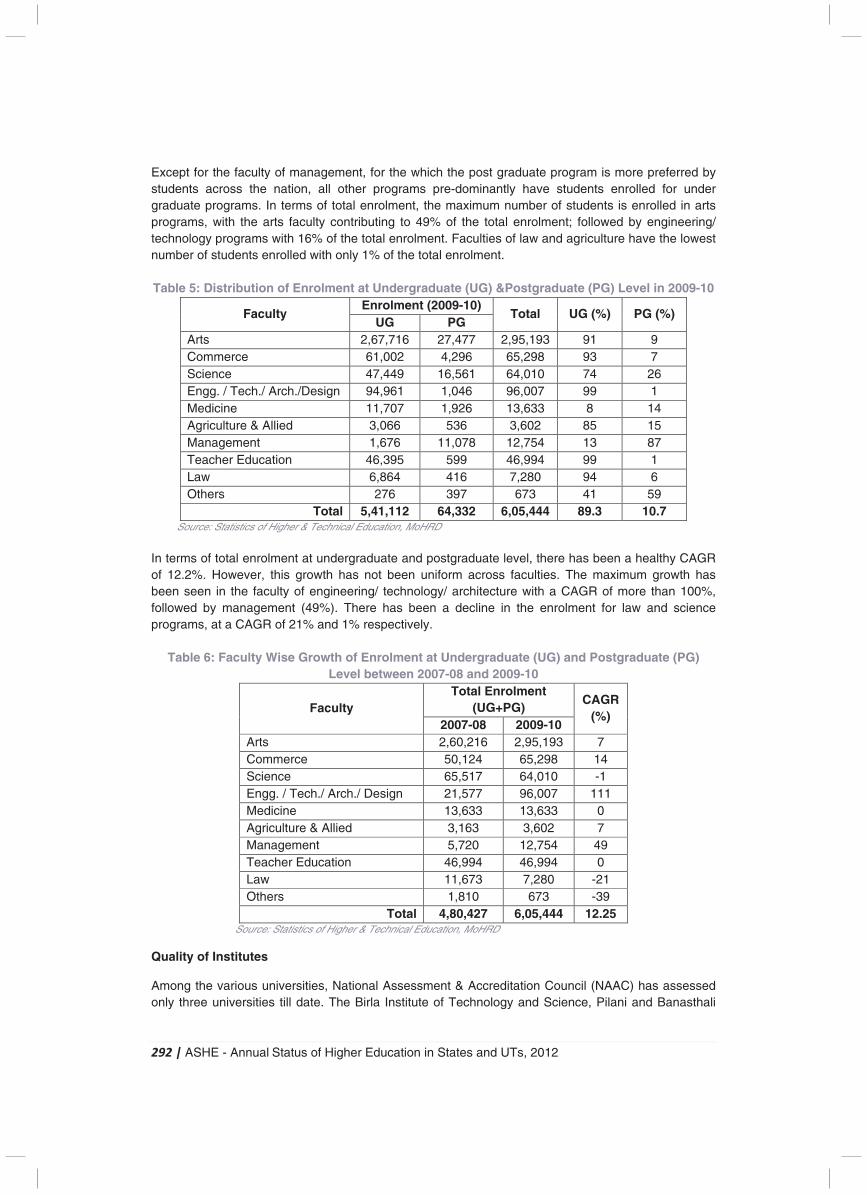
292 | ASHE - Annual Status of Higher Education in States and UTs, 2012
Except for the faculty of management, for the which the post graduate program is more preferred by students across the nation, all other programs pre-dominantly have students enrolled for under graduate programs. In terms of total enrolment, the maximum number of students is enrolled in arts programs, with the arts faculty contributing to 49% of the total enrolment; followed by engineering/ technology programs with 16% of the total enrolment. Faculties of law and agriculture have the lowest number of students enrolled with only 1% of the total enrolment. Table 5: Distribution of Enrolment at Undergraduate (UG) &Postgraduate (PG) Level in 2009-10
Faculty Enrolment (2009-10)
Total UG (%) PG (%) UG PG
Arts 2,67,716 27,477 2,95,193 91 9 Commerce 61,002 4,296 65,298 93 7 Science 47,449 16,561 64,010 74 26 Engg. / Tech./ Arch./Design 94,961 1,046 96,007 99 1 Medicine 11,707 1,926 13,633 8 14 Agriculture & Allied 3,066 536 3,602 85 15 Management 1,676 11,078 12,754 13 87 Teacher Education 46,395 599 46,994 99 1 Law 6,864 416 7,280 94 6 Others 276 397 673 41 59
Total 5,41,112 64,332 6,05,444 89.3 10.7 Source: Statistics of Higher & Technical Education, MoHRD In terms of total enrolment at undergraduate and postgraduate level, there has been a healthy CAGR of 12.2%. However, this growth has not been uniform across faculties. The maximum growth has been seen in the faculty of engineering/ technology/ architecture with a CAGR of more than 100%, followed by management (49%). There has been a decline in the enrolment for law and science programs, at a CAGR of 21% and 1% respectively.
Table 6: Faculty Wise Growth of Enrolment at Undergraduate (UG) and Postgraduate (PG) Level between 2007-08 and 2009-10
Faculty Total Enrolment
(UG+PG) CAGR
(%) 2007-08 2009-10
Arts 2,60,216 2,95,193 7 Commerce 50,124 65,298 14 Science 65,517 64,010 -1 Engg. / Tech./ Arch./ Design 21,577 96,007 111 Medicine 13,633 13,633 0 Agriculture & Allied 3,163 3,602 7 Management 5,720 12,754 49 Teacher Education 46,994 46,994 0 Law 11,673 7,280 -21 Others 1,810 673 -39
Total 4,80,427 6,05,444 12.25 Source: Statistics of Higher & Technical Education, MoHRD
Quality of Institutes
Among the various universities, National Assessment & Accreditation Council (NAAC) has assessed only three universities till date. The Birla Institute of Technology and Science, Pilani and Banasthali
293 | ASHE - Annual Status of Higher Education in States and UTs, 2012
Vidyapeeth have been awarded A grade (Very Good), while the Jai Narain Vyas University has been awarded B grade (Good).
Among colleges, 70 colleges have been accredited by NAAC, with 12 institutes being awarded A rating (Very Good), 48 institutes being awarded B rating (Good) and 10 institutes being awarded C grade (Satisfactory).
Industry and Employment Scenario
Key Industries108
1. Cement � With 14 major cement plants and two white cement plants, having a total capacity of 41
million tonnes per annum, the state is the second highest cement producing state in India. � The state contributes about 15% to the total cement production in the country. It has been
further planned to establish more than 10 cement plants in the near future, further strengthening the state’s position.
� Key players: ACC Ltd, Ambuja Cement Ltd, Shree Cement Ltd, Grasim Industries Ltd.
2. Mining and mineral processing � The state is among the largest mineral producing states in India, with about 210 million
tonnes of identified lead-zinc ore and 639 million tonnes of copper ore reserves. � Key players: Hindustan Zinc Ltd, Hindustan Copper Ltd, Rajasthan State Mines and
Minerals Ltd
3. Auto and auto-components � The districts of Alwar and Jaipur are situated in close proximity to the major auto production
hubs of the country (Noida, Gurgaon and Dharuhera); thus offering these cities the advantage for setting up of auto and auto ancillary units.
� Currently, more than 100 units are functional in Bhiwadi, Neemrana and Pathredi in Alwar district. In addition, a special auto and engineering zone is also being developed in Alwar.
� Key players: Amtek Auto ltd, Ashok Leyland, TAFE, Honda Siel Cars India Ltd.
4. Textiles � Rajasthan occupies a leading position in the country in the production of polyester viscose
yarn and synthetic suiting material as well as processing of low cost, low weight fabric. The city of Jaipur is considered as a hub for manufacturing of garments, primarily for exports. The city of Bhilwara has emerged as India’s largest manufacturer of suiting fabrics and yarn.
� Key players: Rajasthan Spinning and Weaving Mills, Jaykay Enterprises, Shree Rajasthan Syntex Ltd, Shriram Rayons
5. IT/ ITeS
� The low cost of operations in well-developed cities of the state has gradually made Rajasthan an attractive location for IT and ITeS units. While still not established, the state is emerging as one of the best locations in India to invest in the IT/ ITeS sector.
� IT parks with special infrastructure have been set up at cities like Jaipur, Jodhpur, Udaipur, Kota and Alwar.
� Key players: Infosys, Tech Mahindra, Genpact, Wipro Technologies
Employment Scenario 108India Brand Equity Foundation – State report on Rajasthan
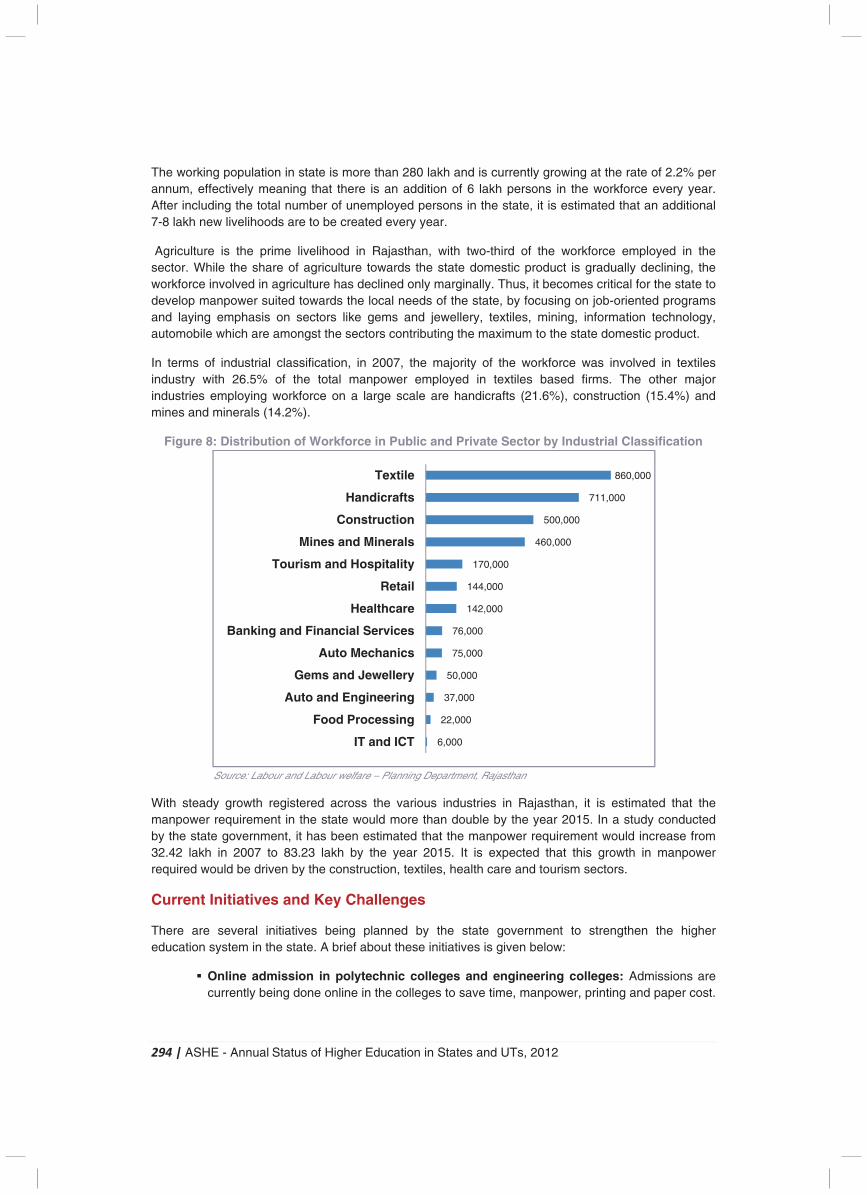
294 | ASHE - Annual Status of Higher Education in States and UTs, 2012
The working population in state is more than 280 lakh and is currently growing at the rate of 2.2% per annum, effectively meaning that there is an addition of 6 lakh persons in the workforce every year. After including the total number of unemployed persons in the state, it is estimated that an additional 7-8 lakh new livelihoods are to be created every year.
Agriculture is the prime livelihood in Rajasthan, with two-third of the workforce employed in the sector. While the share of agriculture towards the state domestic product is gradually declining, the workforce involved in agriculture has declined only marginally. Thus, it becomes critical for the state to develop manpower suited towards the local needs of the state, by focusing on job-oriented programs and laying emphasis on sectors like gems and jewellery, textiles, mining, information technology, automobile which are amongst the sectors contributing the maximum to the state domestic product.
In terms of industrial classification, in 2007, the majority of the workforce was involved in textiles industry with 26.5% of the total manpower employed in textiles based firms. The other major industries employing workforce on a large scale are handicrafts (21.6%), construction (15.4%) and mines and minerals (14.2%).
Figure 8: Distribution of Workforce in Public and Private Sector by Industrial Classification
Source: Labour and Labour welfare – Planning Department, Rajasthan
With steady growth registered across the various industries in Rajasthan, it is estimated that the manpower requirement in the state would more than double by the year 2015. In a study conducted by the state government, it has been estimated that the manpower requirement would increase from 32.42 lakh in 2007 to 83.23 lakh by the year 2015. It is expected that this growth in manpower required would be driven by the construction, textiles, health care and tourism sectors.
Current Initiatives and Key Challenges
There are several initiatives being planned by the state government to strengthen the higher education system in the state. A brief about these initiatives is given below:
� Online admission in polytechnic colleges and engineering colleges: Admissions are currently being done online in the colleges to save time, manpower, printing and paper cost.
6,000
22,000
37,000
50,000
75,000
76,000
142,000
144,000
170,000
460,000
500,000
711,000
860,000
IT and ICT
Food Processing
Auto and Engineering
Gems and Jewellery
Auto Mechanics
Banking and Financial Services
Healthcare
Retail
Tourism and Hospitality
Mines and Minerals
Construction
Handicrafts
Textile
295 | ASHE - Annual Status of Higher Education in States and UTs, 2012
At the same time, the online facility has made it easier for the students to register for the admission process across colleges.
� Digital library: To improve the efficiency and utilization of library resources in polytechnic libraries, the process of digitization has been initiated.
� E-governance: To combat the issue of lack of systematic data collection and dissemination
process, e-governance infrastructure has been operationalized between DTER Jodhpur and the various higher education institutes.
� Self-finance courses have been introduced in polytechnic institutes.
� Community development through polytechnics: Training of work force in the informal
(especially in the rural sector) has been started through community development programs implemented through various polytechnic institutes in the state. Under this scheme, each of the 19 selected polytechnic institutes will train 600 unemployed youth every year.
� Institute management committee: Industry institute interaction has been strengthened in
various polytechnic institutes by constituting an Institute Management Committee (IMC), with eminent industrialists in the area as the chairmen of the respective IMC.
Key Challenges in Higher Education While there has been steady progress in the higher education environment in the state, the state is faced with concerns that are to be imminently tackled. Some of these concerns are as given below:
� The unprecedented growth in higher education in the state has also led to issues that are unique to the state. There are multiple control mechanisms and controlling regulations that have stifled innovative initiatives in recruitment of faculty, admission of students, curricula revision and financial management in majority of the institutes. The existing institutes are also faced with issues of resource constraints and poor efficiency of existing resources. The curriculum also lacks relevance and requires immediate up gradation.
� Faculty quality: Institutes are finding it difficult to attract and retain high quality faculty due to archaic recruitment and promotion procedures, lack of systematic performance evaluation systems and lack of staff development policies in majority of the institutes.
� Lack of data collection mechanisms: The mechanism for data collection and
dissemination has not yet fully evolved in the state. There are no uniform methods or formats for collection of data among the different government departments, which are under separate administrative control.
� Financing: The state expenditure on higher education has been a significant small
percentage of the total expenditure on education. To further improve the higher education infrastructure in the state, and to meet the demands of the industry in the coming future, it is imperative for the state to infuse more funds in to higher education.
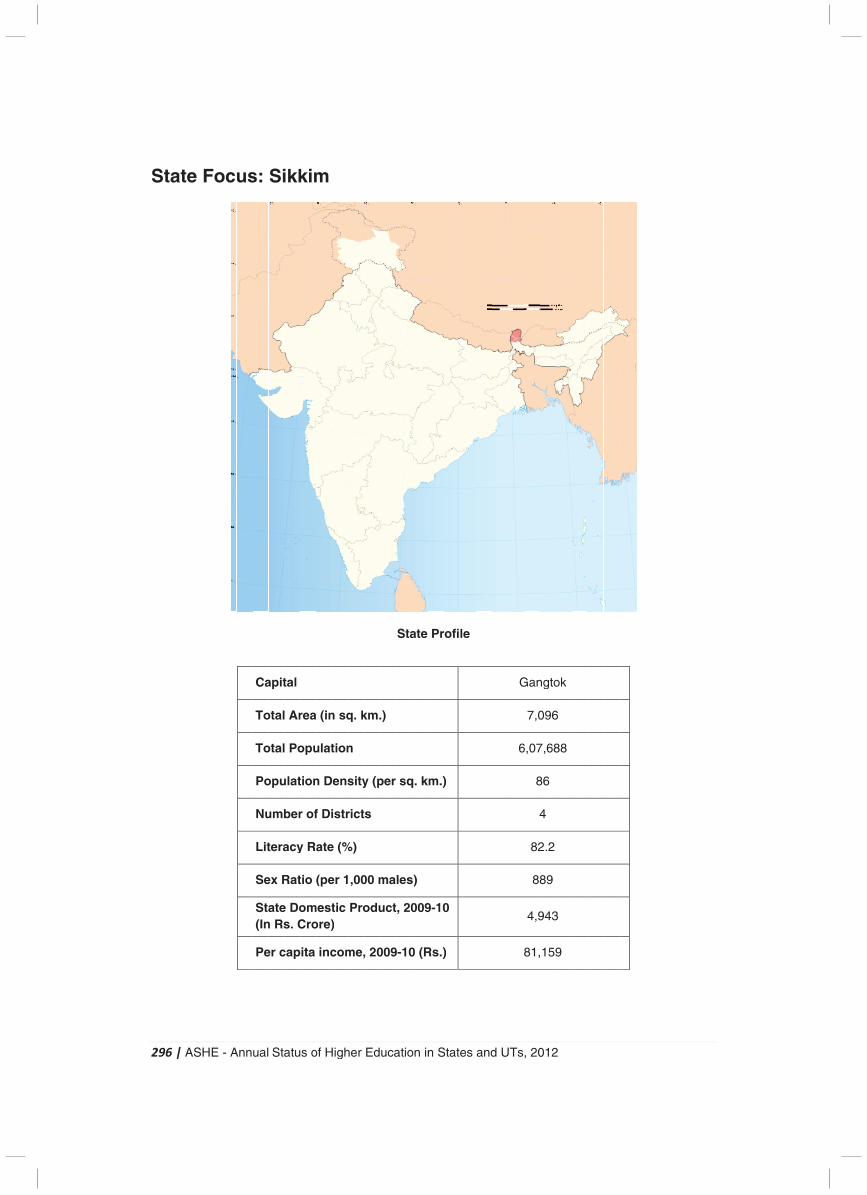
2
S
296
Sta
| A
ate
ASH
e F
HE
Fo
- A
oc
Ann
us
ual
s:
Ca
To
To
Po
Nu
Lit
Se
Sta(In
Pe
Sta
Si
apit
otal
otal
opu
umb
tera
ex R
aten Rs
er c
atu
ikk
tal
Ar
Po
ulat
ber
acy
Rat
e Dos. C
cap
s o
kim
rea
opu
tion
r of
y Ra
tio (
omCro
ita
of H
m
(in
ulat
n D
f Di
ate
(pe
mestore)
inc
High
n sq
tion
ens
istr
e (%
er 1
tic )
com
her
q. k
n
sity
rict
%)
,00
Pro
me,
Ed
km.
y (p
s
00 m
odu
, 20
uca
.)
per
ma
uct
009
atio
Sta
sq
les
, 20
9-10
on in
ate
q. k
s)
009
0 (R
n S
Pr
m.)
9-10
Rs.)
Stat
ofi
)
0
)
es
le
and
d U
UTs
G
6
, 20
Gan
7,0
6,07
8
4
82
88
4,9
81,
012
ngto
096
7,68
86
4
2.2
89
943
,159
2
ok
6
88
3
9
297 | ASHE - Annual Status of Higher Education in States and UTs, 2012
Introduction
Sikkim is a land locked state located in the Himalayan Mountains in the northeast region of the country. Sikkim borders Nepal to the West, Tibet to the North and East, Bhutan to the South East and West Bengal to its South. Sikkim is the least populous state in India and the second-smallest state after Goa in terms of total area. However, the state is geographically diverse due to its bio diversity and climatic ranges, which vary from sub tropical to high alpine. Though land-locked, Sikkim is one of the most beautiful and strategically important states of the Indian Union.
The state of Sikkim is one of the few states in the country with a literacy rate of over 80%; it also has the unique distinction of having enrolment of equal number of males and females at different levels of education in some programs of studies. Enrolment figures of girls surpass that of boys in all undergraduate courses in major government colleges.
Universities and University Level Institutions
1 central university, 4 private universities and no state or deemed universities characterizes the higher education landscape of Sikkim. Currently, the state does not have any Institutions of National Importance located within it.
Table 1: Distribution of Universities & University Level Institutions at State & National Level
Type of University Sikkim
(2011-12) India
(2011-12)
State University 0 285
Private University 4 112
Institution of National Importance 0 39
Deemed University 0 129
Central University 1 40
Total 5 605
Source: UGC
Sikkim University is a Central University established under the Act of Parliament of India, on 2nd June 2007 and the campus is built in Yangang in South Sikkim District. The university offers traditional courses in humanities, physical and life sciences and forestry along with non-traditional courses that are unique and related to the state including subjects like ethnic history, mountain studies, border studies and hill music and culture.
All the colleges in the state are affiliated to this university. There are 10 government colleges affiliated with the central university, including one law college, one Sanskrit college and one government teacher college. Out of the 4 private universities in the state, Sikkim Manipal University (SMU) is the largest and is located in the state capital of Gangtok. Competing with likes of the Indira Gandhi National Open University, SMU is considered by the students as the "Most Preferred University" for distance education in India.
SMU provides courses in IT, Engineering, Management, Commerce, Hospitality, Journalism & Mass Communication, Biotech and Health Sciences. It has two constituent institutes: Sikkim Manipal Institute of Medical Sciences (SMIMS) and Sikkim Manipal Institute of Technology (SMIT). Apart from
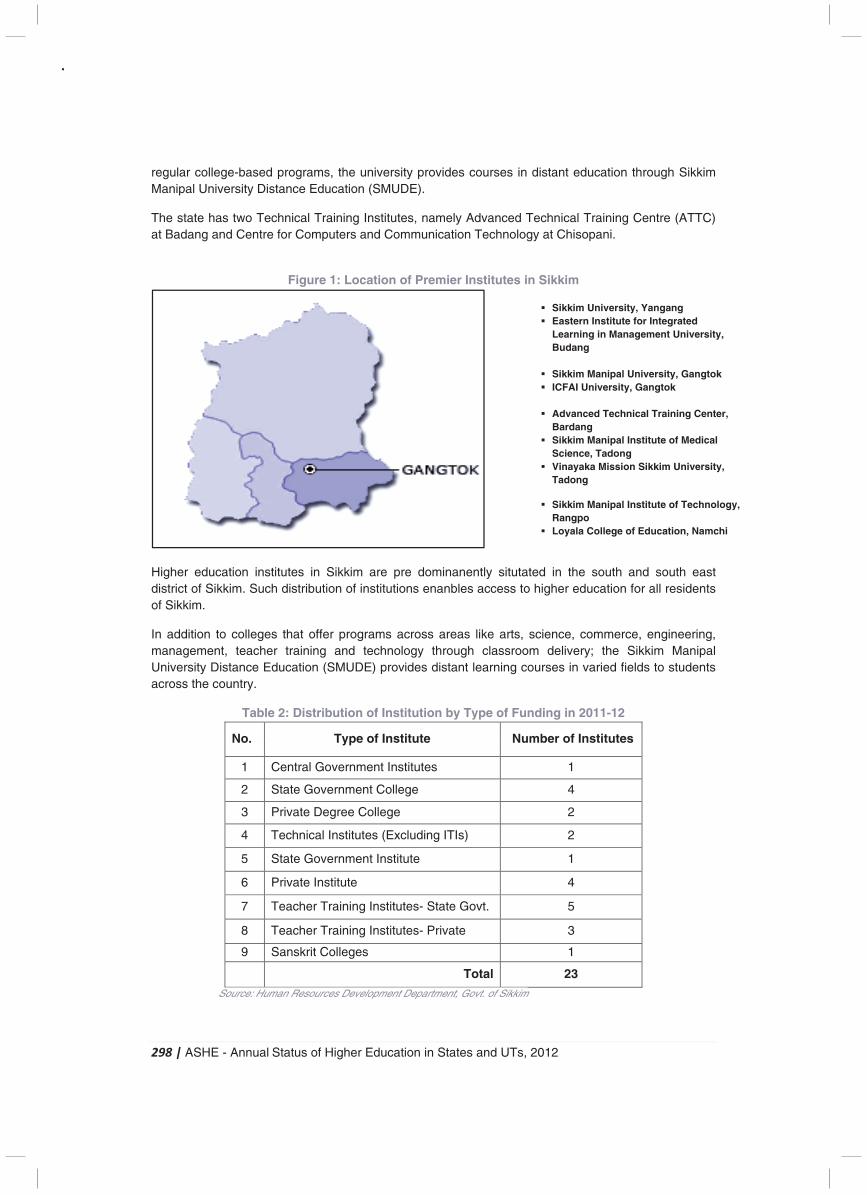
298 | ASHE - Annual Status of Higher Education in States and UTs, 2012
regular college-based programs, the university provides courses in distant education through Sikkim Manipal University Distance Education (SMUDE).
The state has two Technical Training Institutes, namely Advanced Technical Training Centre (ATTC) at Badang and Centre for Computers and Communication Technology at Chisopani.
Figure 1: Location of Premier Institutes in Sikkim
Higher education institutes in Sikkim are pre dominanently situtated in the south and south east district of Sikkim. Such distribution of institutions enanbles access to higher education for all residents of Sikkim.
In addition to colleges that offer programs across areas like arts, science, commerce, engineering, management, teacher training and technology through classroom delivery; the Sikkim Manipal University Distance Education (SMUDE) provides distant learning courses in varied fields to students across the country.
Table 2: Distribution of Institution by Type of Funding in 2011-12
No. Type of Institute Number of Institutes
1 Central Government Institutes 1
2 State Government College 4
3 Private Degree College 2
4 Technical Institutes (Excluding ITIs) 2
5 State Government Institute 1
6 Private Institute 4
7 Teacher Training Institutes- State Govt. 5
8 Teacher Training Institutes- Private 3
9 Sanskrit Colleges 1 Total 23
Source: Human Resources Development Department, Govt. of Sikkim
� Sikkim University, Yangang � Eastern Institute for Integrated
Learning in Management University, Budang
� Sikkim Manipal University, Gangtok � ICFAI University, Gangtok � Advanced Technical Training Center,
Bardang � Sikkim Manipal Institute of Medical
Science, Tadong � Vinayaka Mission Sikkim University,
Tadong
� Sikkim Manipal Institute of Technology, Rangpo
� Loyala College of Education, Namchi
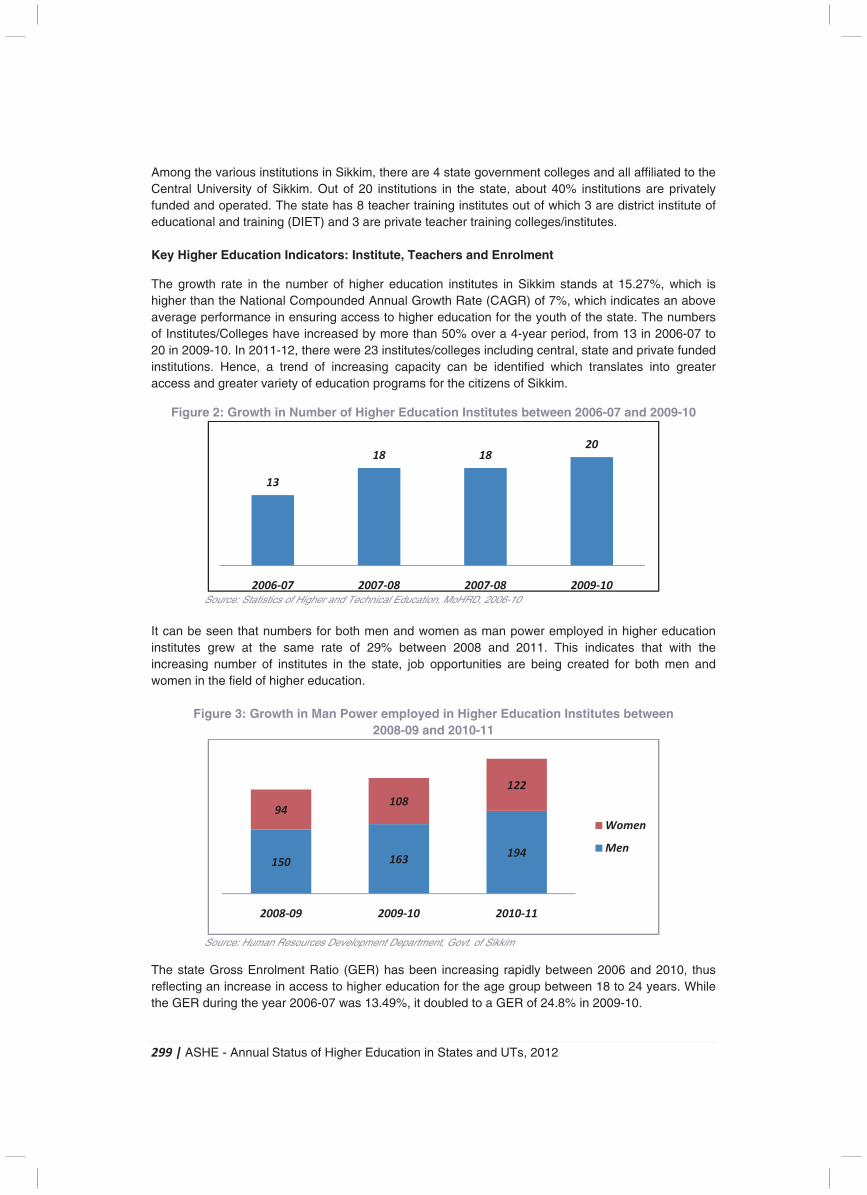
299 | ASHE - Annual Status of Higher Education in States and UTs, 2012
Among the various institutions in Sikkim, there are 4 state government colleges and all affiliated to the Central University of Sikkim. Out of 20 institutions in the state, about 40% institutions are privately funded and operated. The state has 8 teacher training institutes out of which 3 are district institute of educational and training (DIET) and 3 are private teacher training colleges/institutes. Key Higher Education Indicators: Institute, Teachers and Enrolment
The growth rate in the number of higher education institutes in Sikkim stands at 15.27%, which is higher than the National Compounded Annual Growth Rate (CAGR) of 7%, which indicates an above average performance in ensuring access to higher education for the youth of the state. The numbers of Institutes/Colleges have increased by more than 50% over a 4-year period, from 13 in 2006-07 to 20 in 2009-10. In 2011-12, there were 23 institutes/colleges including central, state and private funded institutions. Hence, a trend of increasing capacity can be identified which translates into greater access and greater variety of education programs for the citizens of Sikkim.
Figure 2: Growth in Number of Higher Education Institutes between 2006-07 and 2009-10
Source: Statistics of Higher and Technical Education, MoHRD, 2006-10 It can be seen that numbers for both men and women as man power employed in higher education institutes grew at the same rate of 29% between 2008 and 2011. This indicates that with the increasing number of institutes in the state, job opportunities are being created for both men and women in the field of higher education.
Figure 3: Growth in Man Power employed in Higher Education Institutes between 2008-09 and 2010-11
Source: Human Resources Development Department, Govt. of Sikkim
The state Gross Enrolment Ratio (GER) has been increasing rapidly between 2006 and 2010, thus reflecting an increase in access to higher education for the age group between 18 to 24 years. While the GER during the year 2006-07 was 13.49%, it doubled to a GER of 24.8% in 2009-10.
13
18 1820
2006-07 2007-08 2007-08 2009-10
150 163194
94108
122
2008-09 2009-10 2010-11
Women
Men
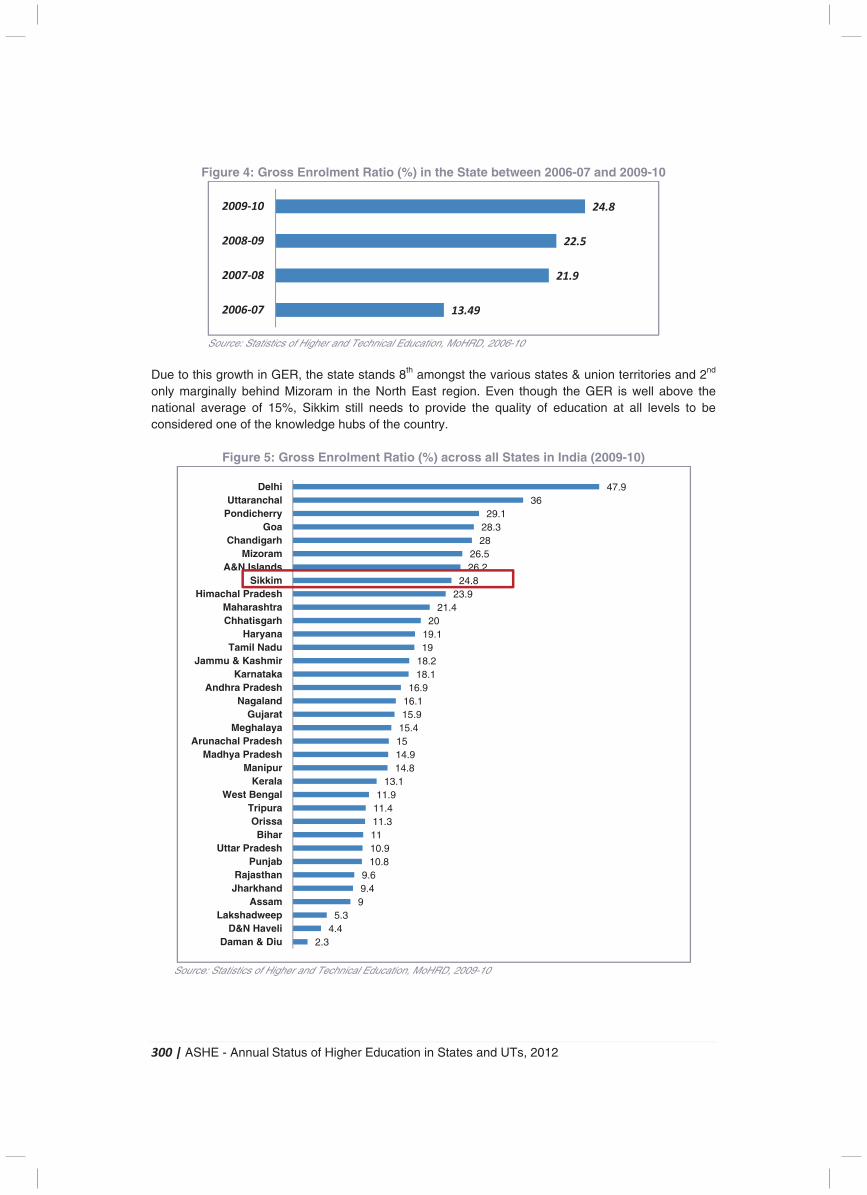
300 | ASHE - Annual Status of Higher Education in States and UTs, 2012
Figure 4: Gross Enrolment Ratio (%) in the State between 2006-07 and 2009-10
Source: Statistics of Higher and Technical Education, MoHRD, 2006-10
Due to this growth in GER, the state stands 8th amongst the various states & union territories and 2nd only marginally behind Mizoram in the North East region. Even though the GER is well above the national average of 15%, Sikkim still needs to provide the quality of education at all levels to be considered one of the knowledge hubs of the country.
Figure 5: Gross Enrolment Ratio (%) across all States in India (2009-10)
Source: Statistics of Higher and Technical Education, MoHRD, 2009-10
13.49
21.9
22.5
24.8
2006-07
2007-08
2008-09
2009-10
2.34.4
5.399.49.6
10.810.91111.311.411.9
13.114.814.91515.415.916.116.9
18.118.21919.1
2021.4
23.924.8
26.226.5
2828.329.1
3647.9
Daman & DiuD&N Haveli
LakshadweepAssam
JharkhandRajasthan
PunjabUttar Pradesh
BiharOrissa
TripuraWest Bengal
KeralaManipur
Madhya PradeshArunachal Pradesh
MeghalayaGujarat
NagalandAndhra Pradesh
KarnatakaJammu & Kashmir
Tamil NaduHaryana
ChhatisgarhMaharashtra
Himachal PradeshSikkim
A&N IslandsMizoram
ChandigarhGoa
PondicherryUttaranchal
Delhi
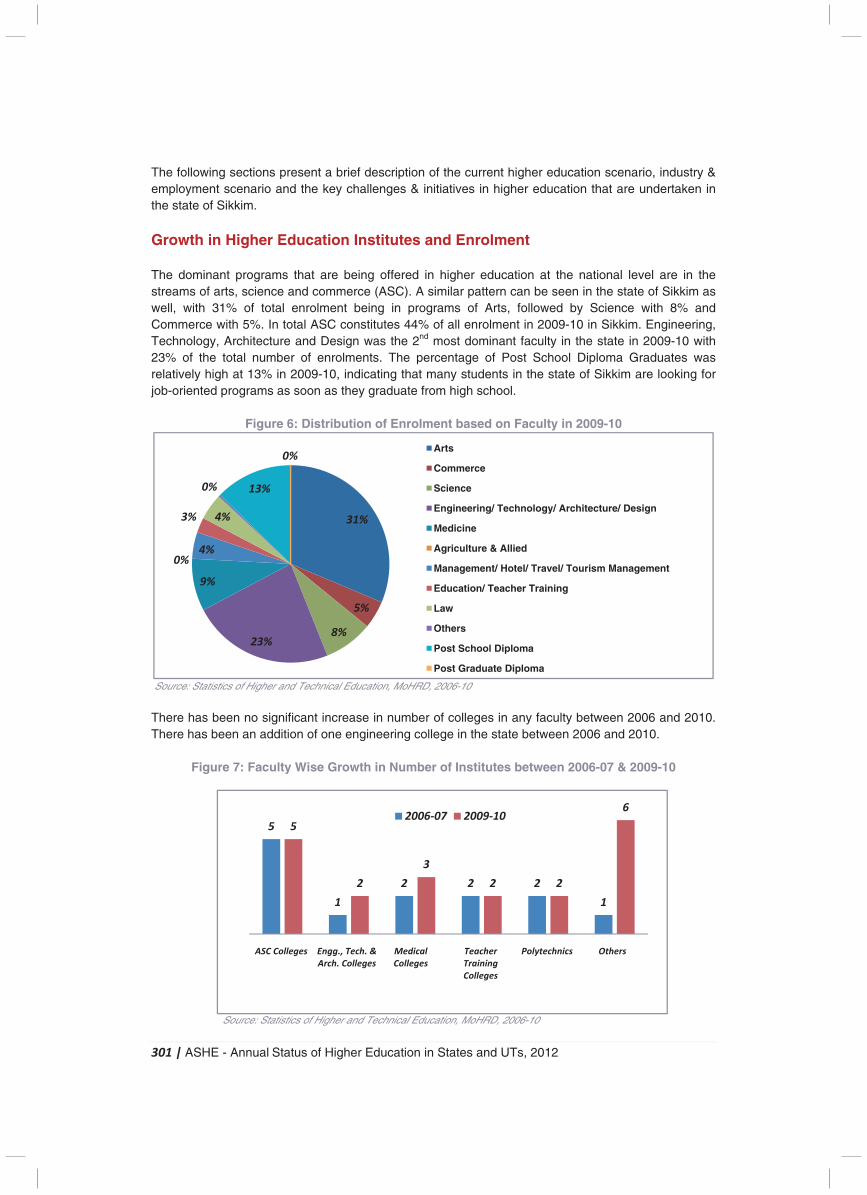
301 | ASHE - Annual Status of Higher Education in States and UTs, 2012
The following sections present a brief description of the current higher education scenario, industry & employment scenario and the key challenges & initiatives in higher education that are undertaken in the state of Sikkim. Growth in Higher Education Institutes and Enrolment The dominant programs that are being offered in higher education at the national level are in the streams of arts, science and commerce (ASC). A similar pattern can be seen in the state of Sikkim as well, with 31% of total enrolment being in programs of Arts, followed by Science with 8% and Commerce with 5%. In total ASC constitutes 44% of all enrolment in 2009-10 in Sikkim. Engineering, Technology, Architecture and Design was the 2nd most dominant faculty in the state in 2009-10 with 23% of the total number of enrolments. The percentage of Post School Diploma Graduates was relatively high at 13% in 2009-10, indicating that many students in the state of Sikkim are looking for job-oriented programs as soon as they graduate from high school.
Figure 6: Distribution of Enrolment based on Faculty in 2009-10
Source: Statistics of Higher and Technical Education, MoHRD, 2006-10
There has been no significant increase in number of colleges in any faculty between 2006 and 2010. There has been an addition of one engineering college in the state between 2006 and 2010.
Figure 7: Faculty Wise Growth in Number of Institutes between 2006-07 & 2009-10
Source: Statistics of Higher and Technical Education, MoHRD, 2006-10
31%
5%
8%23%
9%
0%4%
3% 4%
0% 13%
0%Arts
Commerce
Science
Engineering/ Technology/ Architecture/ Design
Medicine
Agriculture & Allied
Management/ Hotel/ Travel/ Tourism Management
Education/ Teacher Training
Law
Others
Post School Diploma
Post Graduate Diploma
5
1
2 2 2
1
5
2
3
2 2
6
ASC Colleges Engg., Tech. &
Arch. Colleges
Medical
Colleges
Teacher
Training
Colleges
Polytechnics Others
2006-07 2009-10
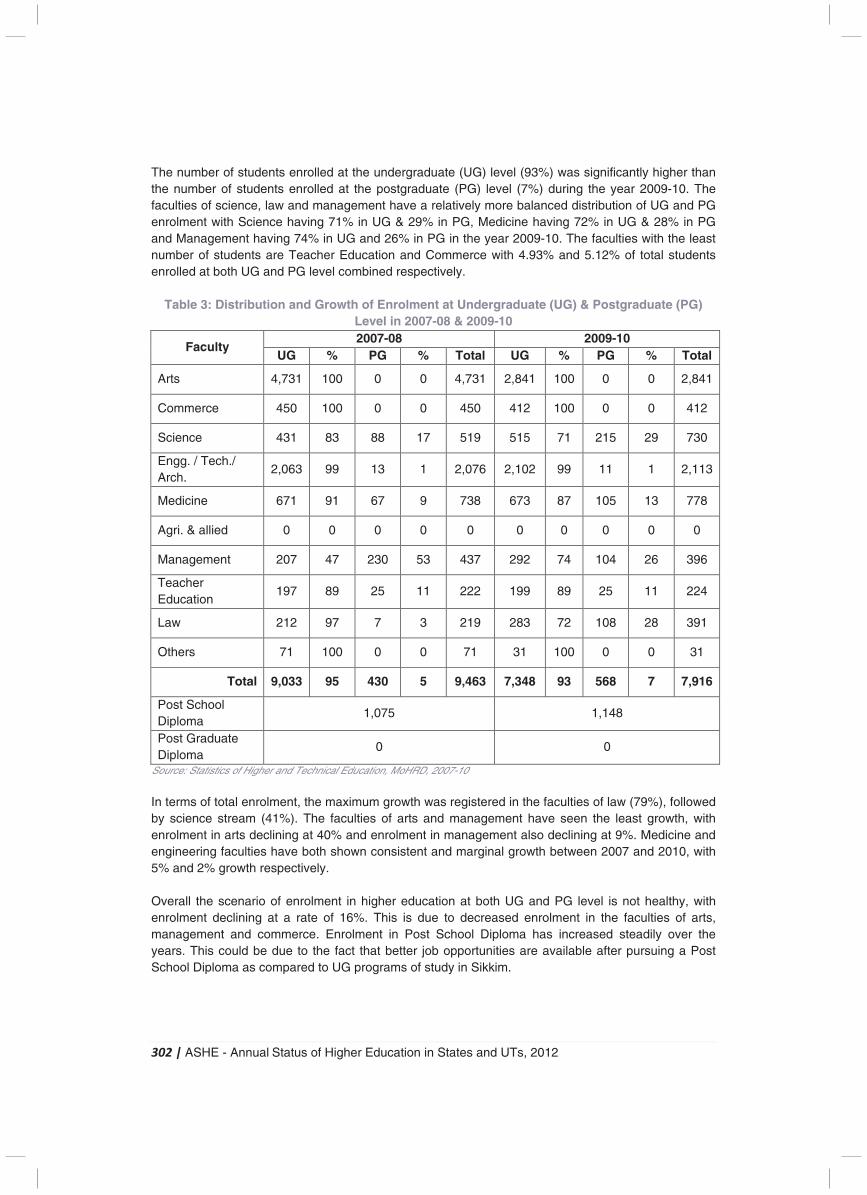
302 | ASHE - Annual Status of Higher Education in States and UTs, 2012
The number of students enrolled at the undergraduate (UG) level (93%) was significantly higher than the number of students enrolled at the postgraduate (PG) level (7%) during the year 2009-10. The faculties of science, law and management have a relatively more balanced distribution of UG and PG enrolment with Science having 71% in UG & 29% in PG, Medicine having 72% in UG & 28% in PG and Management having 74% in UG and 26% in PG in the year 2009-10. The faculties with the least number of students are Teacher Education and Commerce with 4.93% and 5.12% of total students enrolled at both UG and PG level combined respectively.
Table 3: Distribution and Growth of Enrolment at Undergraduate (UG) & Postgraduate (PG) Level in 2007-08 & 2009-10
Faculty 2007-08 2009-10
UG % PG % Total UG % PG % Total
Arts 4,731 100 0 0 4,731 2,841 100 0 0 2,841
Commerce 450 100 0 0 450 412 100 0 0 412
Science 431 83 88 17 519 515 71 215 29 730
Engg. / Tech./ Arch.
2,063 99 13 1 2,076 2,102 99 11 1 2,113
Medicine 671 91 67 9 738 673 87 105 13 778
Agri. & allied 0 0 0 0 0 0 0 0 0 0
Management 207 47 230 53 437 292 74 104 26 396
Teacher Education
197 89 25 11 222 199 89 25 11 224
Law 212 97 7 3 219 283 72 108 28 391
Others 71 100 0 0 71 31 100 0 0 31
Total 9,033 95 430 5 9,463 7,348 93 568 7 7,916
Post School Diploma
1,075 1,148
Post Graduate Diploma
0 0
Source: Statistics of Higher and Technical Education, MoHRD, 2007-10 In terms of total enrolment, the maximum growth was registered in the faculties of law (79%), followed by science stream (41%). The faculties of arts and management have seen the least growth, with enrolment in arts declining at 40% and enrolment in management also declining at 9%. Medicine and engineering faculties have both shown consistent and marginal growth between 2007 and 2010, with 5% and 2% growth respectively. Overall the scenario of enrolment in higher education at both UG and PG level is not healthy, with enrolment declining at a rate of 16%. This is due to decreased enrolment in the faculties of arts, management and commerce. Enrolment in Post School Diploma has increased steadily over the years. This could be due to the fact that better job opportunities are available after pursuing a Post School Diploma as compared to UG programs of study in Sikkim.
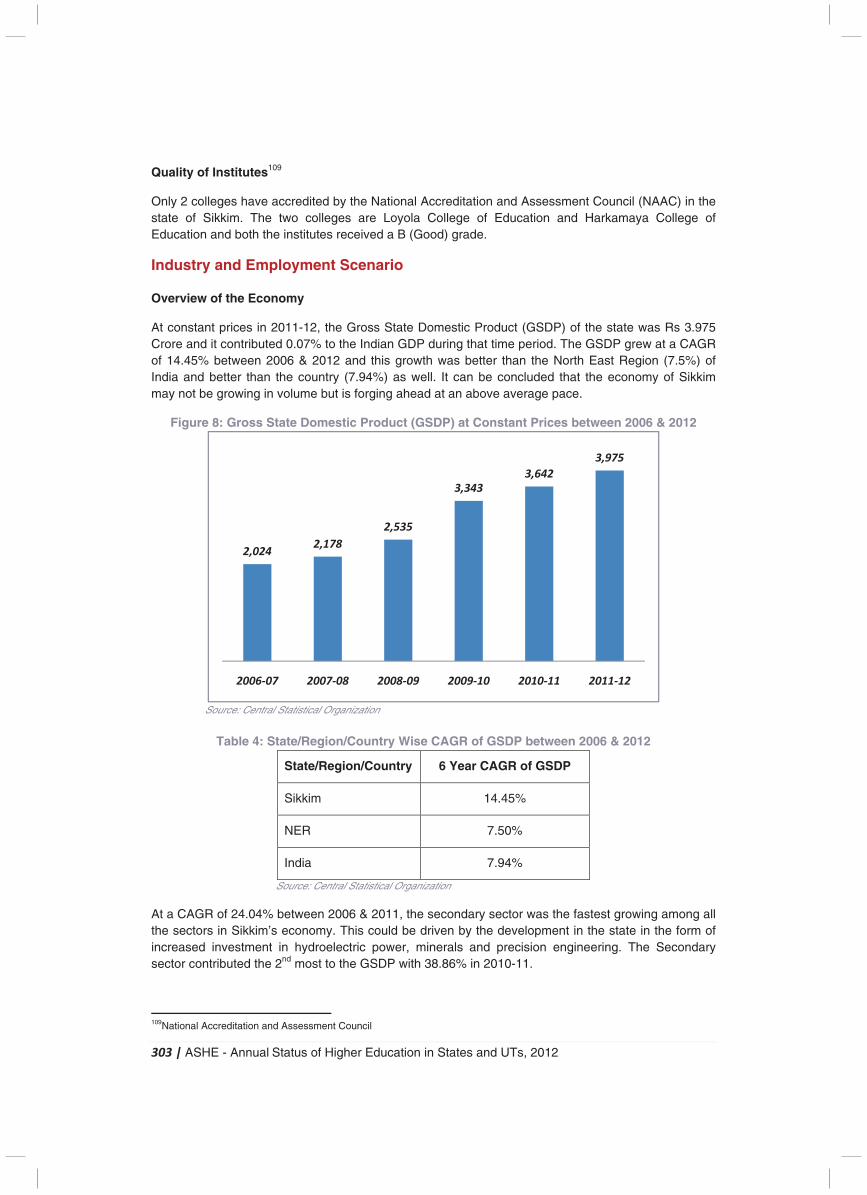
303 | ASHE - Annual Status of Higher Education in States and UTs, 2012
Quality of Institutes109
Only 2 colleges have accredited by the National Accreditation and Assessment Council (NAAC) in the state of Sikkim. The two colleges are Loyola College of Education and Harkamaya College of Education and both the institutes received a B (Good) grade.
Industry and Employment Scenario
Overview of the Economy
At constant prices in 2011-12, the Gross State Domestic Product (GSDP) of the state was Rs 3.975 Crore and it contributed 0.07% to the Indian GDP during that time period. The GSDP grew at a CAGR of 14.45% between 2006 & 2012 and this growth was better than the North East Region (7.5%) of India and better than the country (7.94%) as well. It can be concluded that the economy of Sikkim may not be growing in volume but is forging ahead at an above average pace.
Figure 8: Gross State Domestic Product (GSDP) at Constant Prices between 2006 & 2012
Source: Central Statistical Organization
Table 4: State/Region/Country Wise CAGR of GSDP between 2006 & 2012
State/Region/Country 6 Year CAGR of GSDP
Sikkim 14.45%
NER 7.50%
India 7.94%
Source: Central Statistical Organization At a CAGR of 24.04% between 2006 & 2011, the secondary sector was the fastest growing among all the sectors in Sikkim’s economy. This could be driven by the development in the state in the form of increased investment in hydroelectric power, minerals and precision engineering. The Secondary sector contributed the 2nd most to the GSDP with 38.86% in 2010-11.
109National Accreditation and Assessment Council
2,0242,178
2,535
3,343
3,642
3,975
2006-07 2007-08 2008-09 2009-10 2010-11 2011-12
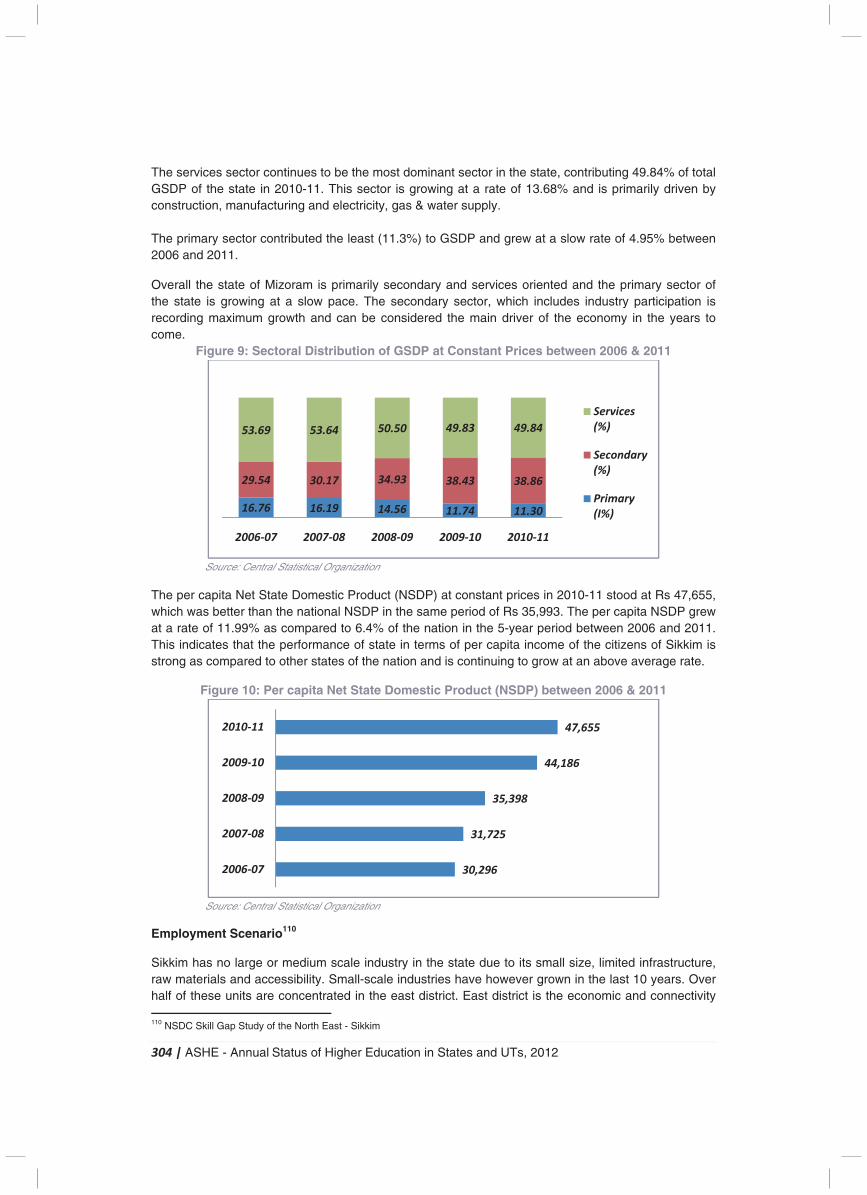
304 | ASHE - Annual Status of Higher Education in States and UTs, 2012
The services sector continues to be the most dominant sector in the state, contributing 49.84% of total GSDP of the state in 2010-11. This sector is growing at a rate of 13.68% and is primarily driven by construction, manufacturing and electricity, gas & water supply. The primary sector contributed the least (11.3%) to GSDP and grew at a slow rate of 4.95% between 2006 and 2011. Overall the state of Mizoram is primarily secondary and services oriented and the primary sector of the state is growing at a slow pace. The secondary sector, which includes industry participation is recording maximum growth and can be considered the main driver of the economy in the years to come.
Figure 9: Sectoral Distribution of GSDP at Constant Prices between 2006 & 2011
Source: Central Statistical Organization
The per capita Net State Domestic Product (NSDP) at constant prices in 2010-11 stood at Rs 47,655, which was better than the national NSDP in the same period of Rs 35,993. The per capita NSDP grew at a rate of 11.99% as compared to 6.4% of the nation in the 5-year period between 2006 and 2011. This indicates that the performance of state in terms of per capita income of the citizens of Sikkim is strong as compared to other states of the nation and is continuing to grow at an above average rate.
Figure 10: Per capita Net State Domestic Product (NSDP) between 2006 & 2011
Source: Central Statistical Organization
Employment Scenario110
Sikkim has no large or medium scale industry in the state due to its small size, limited infrastructure, raw materials and accessibility. Small-scale industries have however grown in the last 10 years. Over half of these units are concentrated in the east district. East district is the economic and connectivity 110 NSDC Skill Gap Study of the North East - Sikkim
16.76 16.19 14.56 11.74 11.30
29.54 30.17 34.93 38.43 38.86
53.69 53.64 50.50 49.83 49.84
2006-07 2007-08 2008-09 2009-10 2010-11
Services
(%)
Secondary
(%)
Primary
(I%)
30,296
31,725
35,398
44,186
47,655
2006-07
2007-08
2008-09
2009-10
2010-11
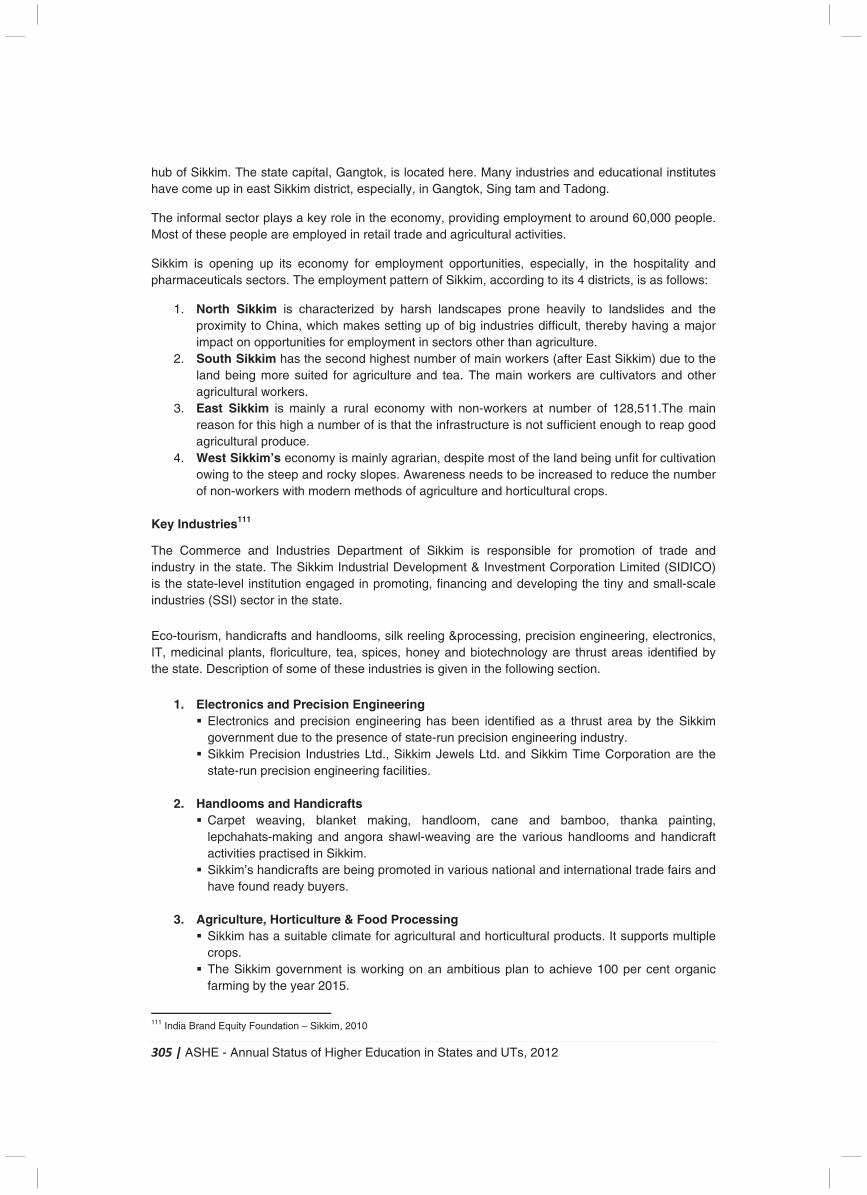
305 | ASHE - Annual Status of Higher Education in States and UTs, 2012
hub of Sikkim. The state capital, Gangtok, is located here. Many industries and educational institutes have come up in east Sikkim district, especially, in Gangtok, Sing tam and Tadong.
The informal sector plays a key role in the economy, providing employment to around 60,000 people. Most of these people are employed in retail trade and agricultural activities.
Sikkim is opening up its economy for employment opportunities, especially, in the hospitality and pharmaceuticals sectors. The employment pattern of Sikkim, according to its 4 districts, is as follows:
1. North Sikkim is characterized by harsh landscapes prone heavily to landslides and the proximity to China, which makes setting up of big industries difficult, thereby having a major impact on opportunities for employment in sectors other than agriculture.
2. South Sikkim has the second highest number of main workers (after East Sikkim) due to the land being more suited for agriculture and tea. The main workers are cultivators and other agricultural workers.
3. East Sikkim is mainly a rural economy with non-workers at number of 128,511.The main reason for this high a number of is that the infrastructure is not sufficient enough to reap good agricultural produce.
4. West Sikkim’s economy is mainly agrarian, despite most of the land being unfit for cultivation owing to the steep and rocky slopes. Awareness needs to be increased to reduce the number of non-workers with modern methods of agriculture and horticultural crops.
Key Industries111
The Commerce and Industries Department of Sikkim is responsible for promotion of trade and industry in the state. The Sikkim Industrial Development & Investment Corporation Limited (SIDICO) is the state-level institution engaged in promoting, financing and developing the tiny and small-scale industries (SSI) sector in the state. Eco-tourism, handicrafts and handlooms, silk reeling &processing, precision engineering, electronics, IT, medicinal plants, floriculture, tea, spices, honey and biotechnology are thrust areas identified by the state. Description of some of these industries is given in the following section.
1. Electronics and Precision Engineering � Electronics and precision engineering has been identified as a thrust area by the Sikkim
government due to the presence of state-run precision engineering industry. � Sikkim Precision Industries Ltd., Sikkim Jewels Ltd. and Sikkim Time Corporation are the
state-run precision engineering facilities.
2. Handlooms and Handicrafts � Carpet weaving, blanket making, handloom, cane and bamboo, thanka painting,
lepchahats-making and angora shawl-weaving are the various handlooms and handicraft activities practised in Sikkim.
� Sikkim’s handicrafts are being promoted in various national and international trade fairs and have found ready buyers.
3. Agriculture, Horticulture & Food Processing � Sikkim has a suitable climate for agricultural and horticultural products. It supports multiple
crops. � The Sikkim government is working on an ambitious plan to achieve 100 per cent organic
farming by the year 2015.
111 India Brand Equity Foundation – Sikkim, 2010
306 | ASHE - Annual Status of Higher Education in States and UTs, 2012
� The agro-climatic conditions in the state support a wide variety of exotic flora and fauna that have utility in the medicine sector.
� The state has identified medicinal plants and bamboo as one of the priority sectors for investment.
� Sikkim has 28 varieties of bamboo, offering potential for developing the handicrafts, construction, medicine, packaging, and food processing industries.
4. Hydroelectric Power � It is estimated that Sikkim has a peak potential capacity of 8,000MW and a steady 3,000
MW hydroelectric power. The state has invited PPP projects in the sector and 24 projects are already being set up in the state.
5. Tea � Tea grown in the Temi region of South Sikkim is famous by its brand name “Temi” tea. � The tea has its unique flavour and about 100 million tonnes of tea is produced, annually.
6. Minerals
� Sikkim has significant, untapped natural resource reserves of Coal, Lime Stone, Marble, Quartzite, Graphite and Garnet.
7. Sericulture � Mulberry, muga, eri, oak-tussarand silk are cultivated in Sikkim. The Sericulture Department
of Sikkim promotes exports of silk from Sikkim.
8. Tourism � Sikkim has the perfect blend of natural wealth and topography, which ranges from tropical
to temperate to alpine. The state is richly endowed with thick forests, flora and fauna, lakes, glaciers and mountain peaks, which makes it a tourist’s paradise.
� According to the Ministry of Tourism 5.76 lakh domestic and foreign tourists visited Sikkim in 2011.
Key Challenges & Initiatives in Higher Education Issues and Challenges � The number of students pursuing PG level degree programs in the state is very low as compared
to UG level degree programs in all colleges such a disparity is a cause of concern for the state’s higher education landscape.
� A trend has been observed of increasing number of students going out to other state for pursuing higher education. Retention of local students at higher education level is a huge challenge for the state.
� There is a need to upgrade the quality and standards of education in existing institutes in order to increase enrolment.
� B.Sc. courses need to be introduced in all colleges, augmenting the intake of students in Mathematics, Chemistry and Physics.
Initiatives Started � The World Bank assisted the state in its 3rd Technician Education Project under which 2
Polytechnics were established in the state. � Fellowship grants for those pursuing Ph.D. were approved and scholarships for higher studies
were provided to students of all colleges. � Teacher training institutes were strengthened with establishment of proper infrastructure.
307 | ASHE - Annual Status of Higher Education in States and UTs, 2012
Initiatives Proposed � Establishment of National Institute of Technology. � Professional teacher training to all teachers by 2015. � Up gradation of government degree College at Tadong in to a Centre of Excellence.
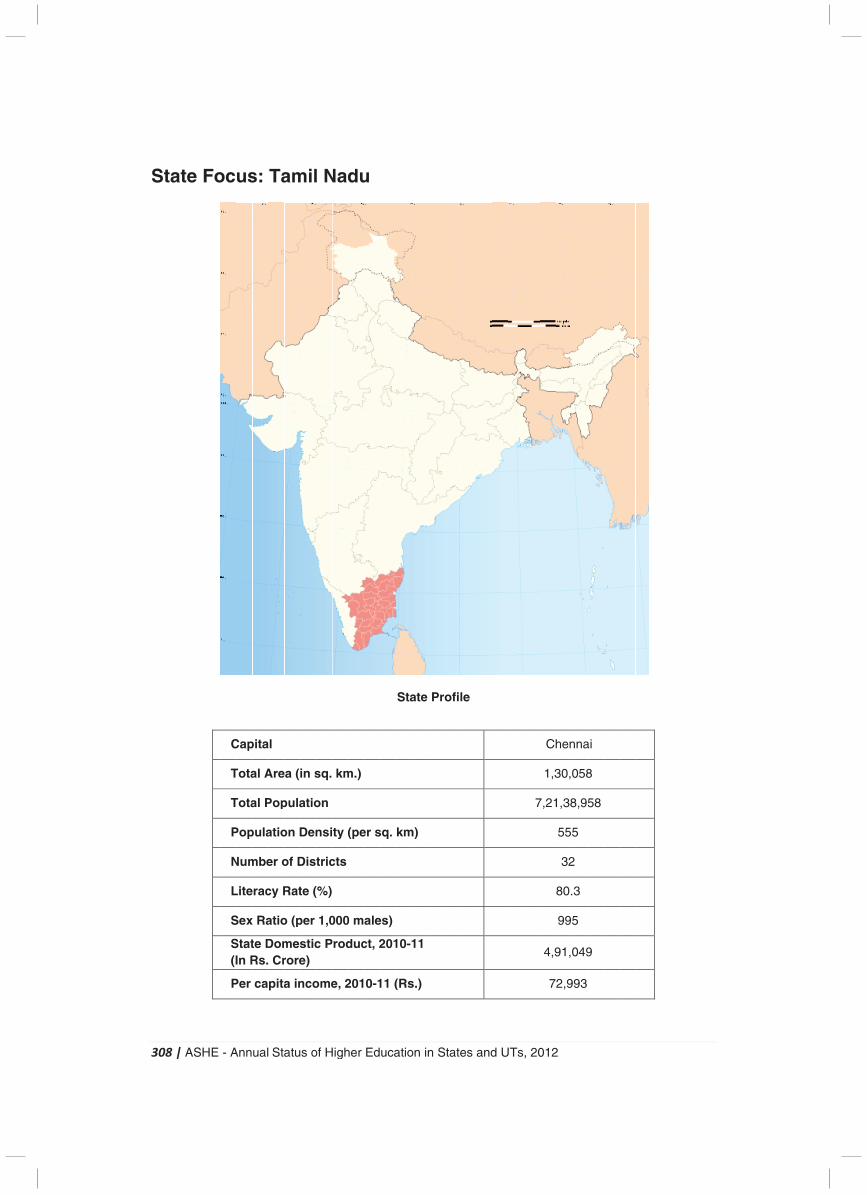
3
S
308
Sta
| A
ate
ASH
e F
HE
Fo
- A
oc
C
T
T
P
N
L
S
S(I
P
Ann
us
Cap
Tota
Tota
Pop
Num
Lite
Sex
StatIn R
Per
ual
s:
pita
al A
al P
pula
mbe
rac
x Ra
te DRs.
ca
Sta
Ta
l
Are
Pop
atio
er o
cy R
atio
Dom Cr
pita
atu
am
a (i
pula
on D
of D
Rat
o (p
mesrore
a in
s o
mil
in s
atio
Den
Dist
te (
per
stice)
nco
of H
l N
sq.
on
nsi
tric
(%)
1,0
c P
ome
High
Nad
km
ty (
cts
000
rod
e, 2
her
du
m.)
(pe
0 m
duc
201
Ed
u
er s
ale
ct, 2
0-1
uca
sq.
es)
201
11 (
atio
Sta
km
10-1
(Rs
on in
ate
m)
11
s.)
n S
Pr
Stat
ofi
es
le
and
d U
UTs
, 20
7
012
Ch
1,3
7,21
4,9
7
2
hen
30,
1,38
55
32
80.
99
91,
2,9
nna
058
8,95
5
2
.3
5
049
993
ai
8
58
9
309 | ASHE - Annual Status of Higher Education in States and UTs, 2012
Introduction
Located in the southern part of the Indian peninsula, Tamil Nadu (TN) is the eleventh largest by area and the seventh most populous state in India. It is the second largest state economy in India as of 2012. In terms of Human Development Index (as of 2006), the state was among the top 5 states in India.
Tamil Nadu also has the highest number of business enterprises and stands second in total employment in India, as compared to the population share of the state. The state has one of the highest literacy rates in India and is one of the few states in India with 100% Gross Enrolment Ratio in primary and upper primary education. Historically an agricultural state, it is now considered one of the most urbanised states in India.
Universities and University Level Institutes
There are 6 universities & university level institutions in the state, including 2 central universities, 24 state universities, 29 deemed universities and 5 Institutes of National Importance. The Central University of Tamil Nadu was established in 2009, and currently offers integrated masters programs in the subjects of physics, chemistry, mathematics and life sciences. The university also offers postgraduate and doctoral programs.
The Indian Maritime University is the other central university in Tamil Nadu, which was established in 2008 and offers programs in marine engineering and research, ship design and port management. Nationally reputed institutes like IIT Madras and NIT Trichy are also located in the state. Among the state universities, Anna University and Madras University are included in the most reputed universities in the country.
The Vellore Institute of Technology (VIT), Madras – a deemed university; is another premier institute and has been continuously ranked in the top 10 engineering colleges in India. VIT University has the distinction of being the first educational institution in India to be awarded the International Organization for Standardization 9002 certificate for three years. It is also the first university to receive ABET (a globally recognized accreditor) accreditation for their mechanical and computer science departments.
Table 1: Distribution of Universities & University Level Institutions at State & National Level
Type of University Tamil Nadu (2011-12)
India (2011-12)
State University 2 285
Private University 0 112
Institution of National Importance 24 39
Deemed University 29 129
Central University 5 40
Total 60 605
Source: UGC
In addition to general and technical education, there are several universities focusing on areas such as agriculture, teacher education, medicine, physical education and sports, veterinary and animal sciences. The Tamil Nadu Agricultural University was established in 1971 and has 11 constituent
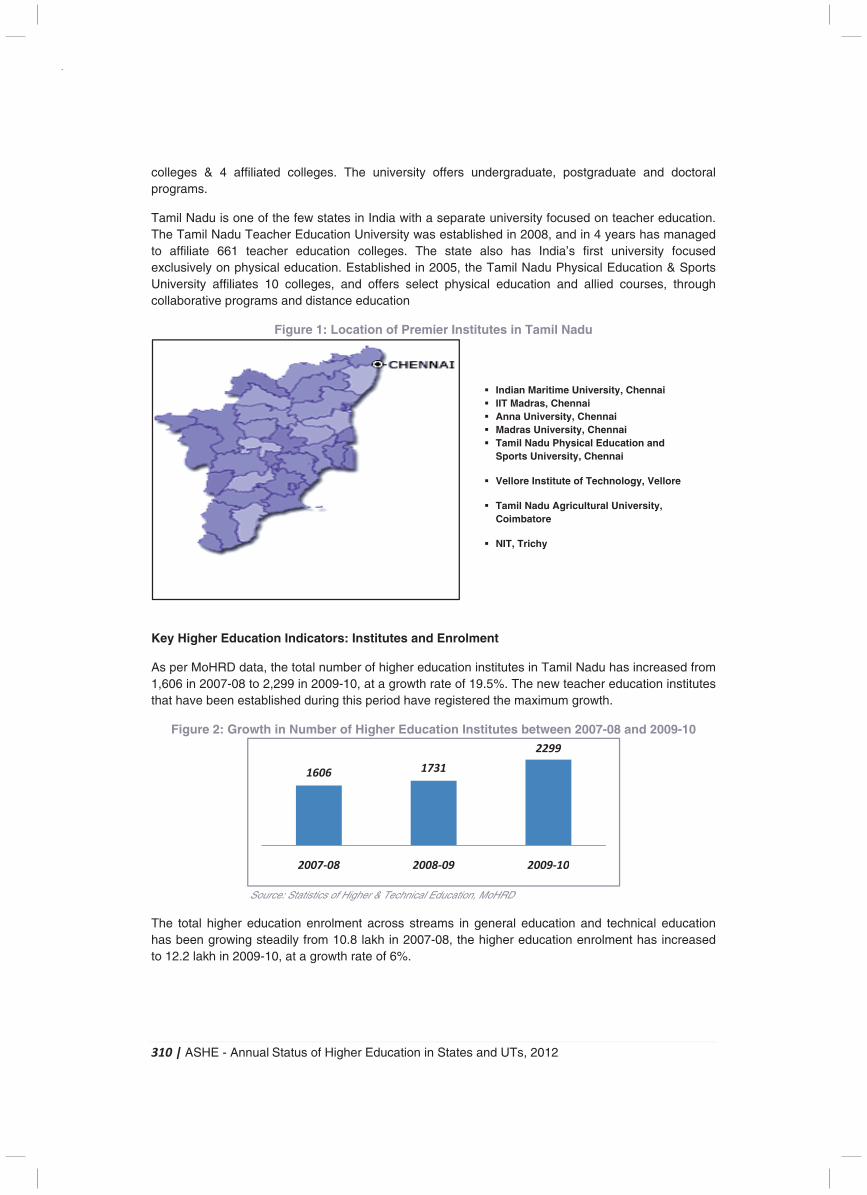
310 | ASHE - Annual Status of Higher Education in States and UTs, 2012
colleges & 4 affiliated colleges. The university offers undergraduate, postgraduate and doctoral programs.
Tamil Nadu is one of the few states in India with a separate university focused on teacher education. The Tamil Nadu Teacher Education University was established in 2008, and in 4 years has managed to affiliate 661 teacher education colleges. The state also has India’s first university focused exclusively on physical education. Established in 2005, the Tamil Nadu Physical Education & Sports University affiliates 10 colleges, and offers select physical education and allied courses, through collaborative programs and distance education
Figure 1: Location of Premier Institutes in Tamil Nadu
Key Higher Education Indicators: Institutes and Enrolment
As per MoHRD data, the total number of higher education institutes in Tamil Nadu has increased from 1,606 in 2007-08 to 2,299 in 2009-10, at a growth rate of 19.5%. The new teacher education institutes that have been established during this period have registered the maximum growth.
Figure 2: Growth in Number of Higher Education Institutes between 2007-08 and 2009-10
Source: Statistics of Higher & Technical Education, MoHRD
The total higher education enrolment across streams in general education and technical education has been growing steadily from 10.8 lakh in 2007-08, the higher education enrolment has increased to 12.2 lakh in 2009-10, at a growth rate of 6%.
� Indian Maritime University, Chennai� IIT Madras, Chennai � Anna University, Chennai � Madras University, Chennai � Tamil Nadu Physical Education and
Sports University, Chennai � Vellore Institute of Technology, Vellore � Tamil Nadu Agricultural University,
Coimbatore � NIT, Trichy
1606 1731
2299
2007-08 2008-09 2009-10
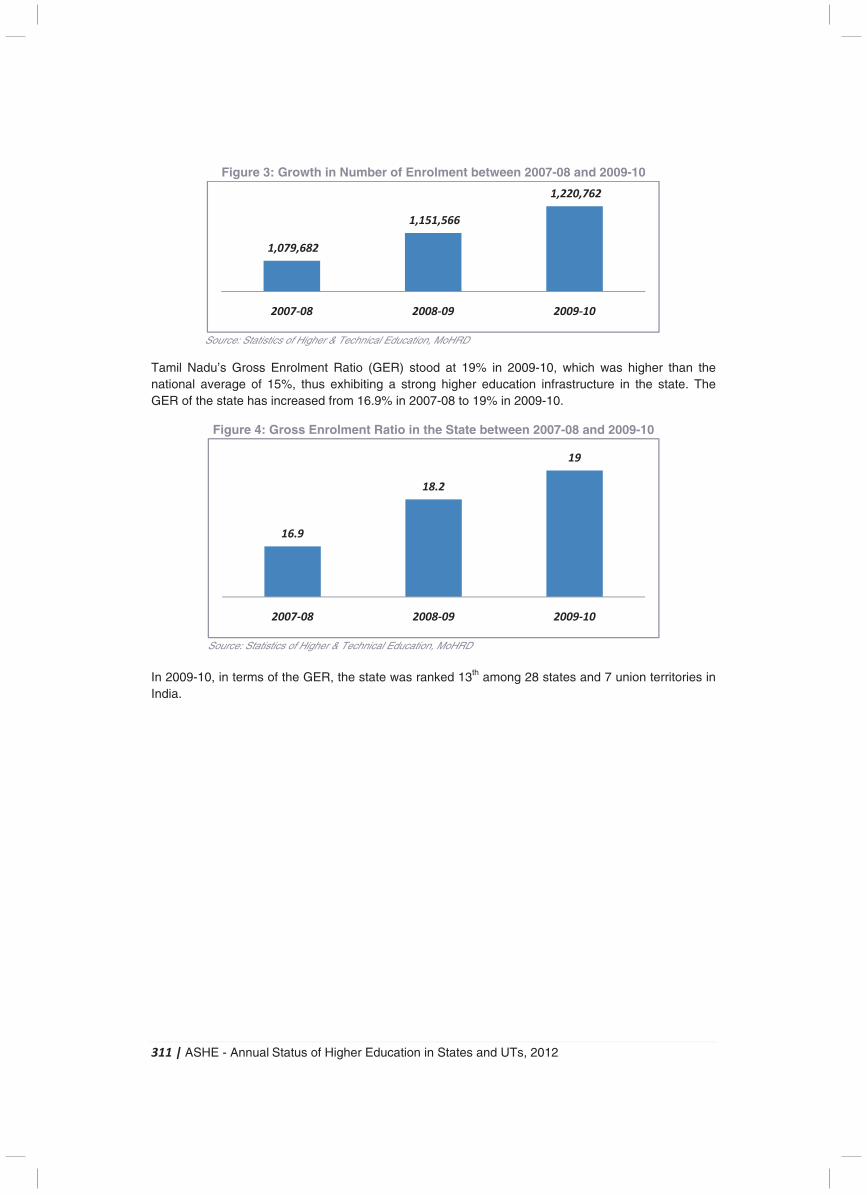
311 | ASHE - Annual Status of Higher Education in States and UTs, 2012
Figure 3: Growth in Number of Enrolment between 2007-08 and 2009-10
Source: Statistics of Higher & Technical Education, MoHRD
Tamil Nadu’s Gross Enrolment Ratio (GER) stood at 19% in 2009-10, which was higher than the national average of 15%, thus exhibiting a strong higher education infrastructure in the state. The GER of the state has increased from 16.9% in 2007-08 to 19% in 2009-10.
Figure 4: Gross Enrolment Ratio in the State between 2007-08 and 2009-10
Source: Statistics of Higher & Technical Education, MoHRD
In 2009-10, in terms of the GER, the state was ranked 13th among 28 states and 7 union territories in India.
1,079,682
1,151,566
1,220,762
2007-08 2008-09 2009-10
16.9
18.2
19
2007-08 2008-09 2009-10
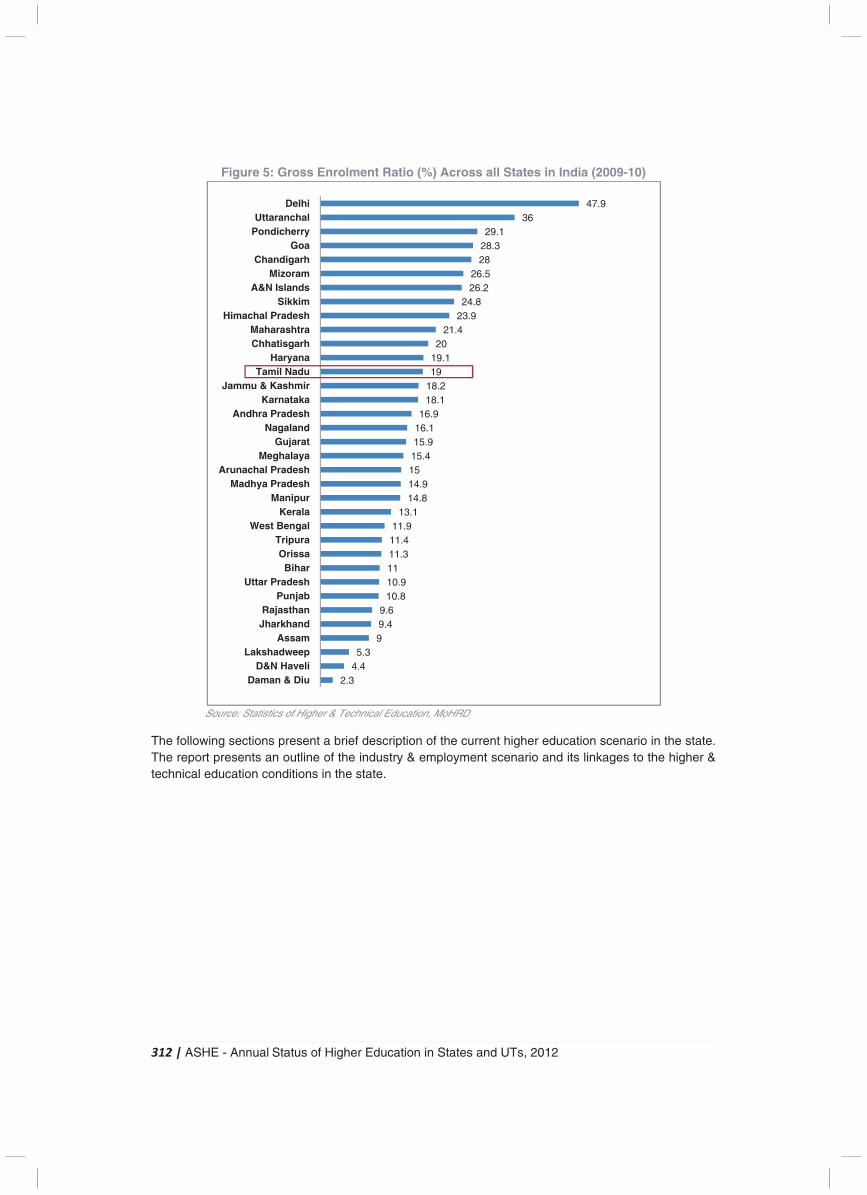
312 | ASHE - Annual Status of Higher Education in States and UTs, 2012
Figure 5: Gross Enrolment Ratio (%) Across all States in India (2009-10)
Source: Statistics of Higher & Technical Education, MoHRD
The following sections present a brief description of the current higher education scenario in the state. The report presents an outline of the industry & employment scenario and its linkages to the higher & technical education conditions in the state.
2.34.45.3
99.49.6
10.810.91111.311.411.9
13.114.814.91515.415.916.116.9
18.118.21919.120
21.423.924.8
26.226.5
2828.329.1
3647.9
Daman & DiuD&N Haveli
LakshadweepAssam
JharkhandRajasthan
PunjabUttar Pradesh
BiharOrissa
TripuraWest Bengal
KeralaManipur
Madhya PradeshArunachal Pradesh
MeghalayaGujarat
NagalandAndhra Pradesh
KarnatakaJammu & Kashmir
Tamil NaduHaryana
ChhatisgarhMaharashtra
Himachal PradeshSikkim
A&N IslandsMizoram
ChandigarhGoa
PondicherryUttaranchal
Delhi
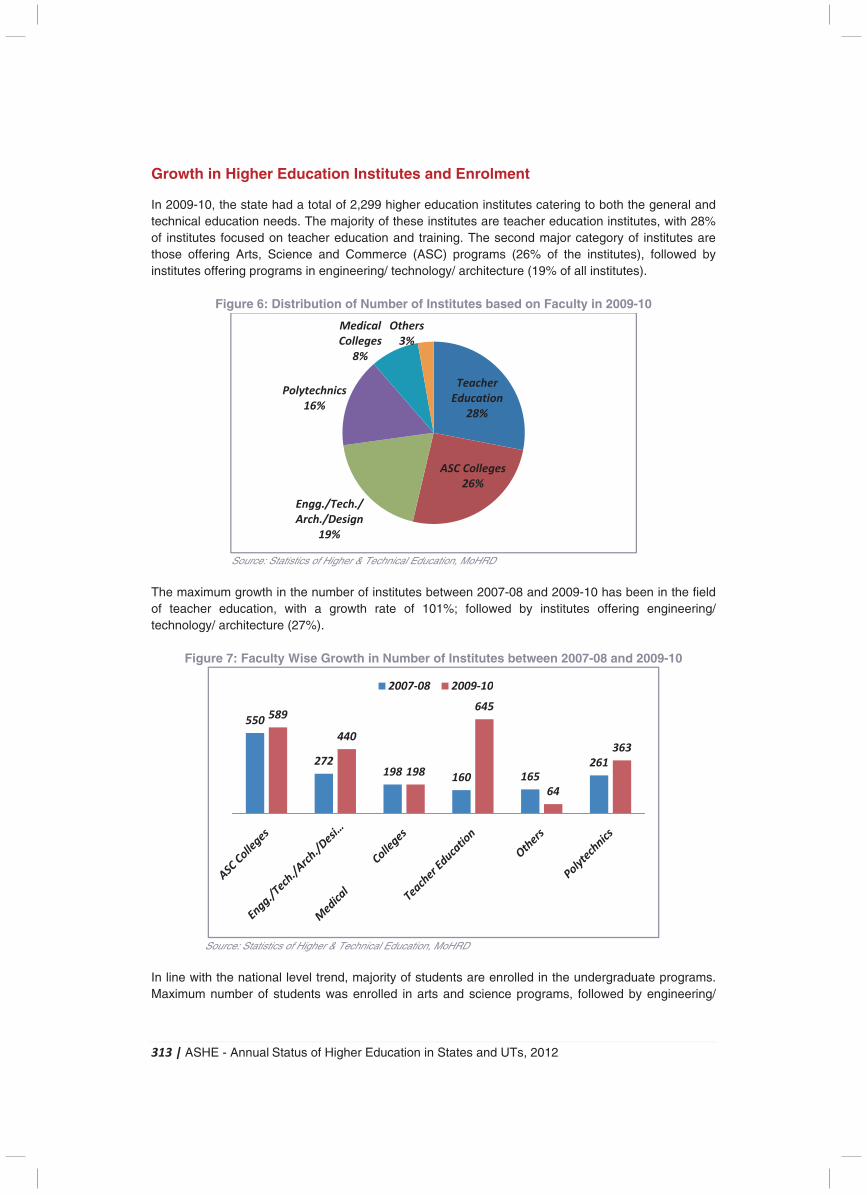
313 | ASHE - Annual Status of Higher Education in States and UTs, 2012
Growth in Higher Education Institutes and Enrolment
In 2009-10, the state had a total of 2,299 higher education institutes catering to both the general and technical education needs. The majority of these institutes are teacher education institutes, with 28% of institutes focused on teacher education and training. The second major category of institutes are those offering Arts, Science and Commerce (ASC) programs (26% of the institutes), followed by institutes offering programs in engineering/ technology/ architecture (19% of all institutes).
Figure 6: Distribution of Number of Institutes based on Faculty in 2009-10
Source: Statistics of Higher & Technical Education, MoHRD
The maximum growth in the number of institutes between 2007-08 and 2009-10 has been in the field of teacher education, with a growth rate of 101%; followed by institutes offering engineering/ technology/ architecture (27%).
Figure 7: Faculty Wise Growth in Number of Institutes between 2007-08 and 2009-10
Source: Statistics of Higher & Technical Education, MoHRD
In line with the national level trend, majority of students are enrolled in the undergraduate programs. Maximum number of students was enrolled in arts and science programs, followed by engineering/
Teacher
Education
28%
ASC Colleges
26%
Engg./Tech./
Arch./Design
19%
Polytechnics
16%
Medical
Colleges
8%
Others
3%
550
272198 160 165
261
589
440
198
645
64
363
2007-08 2009-10
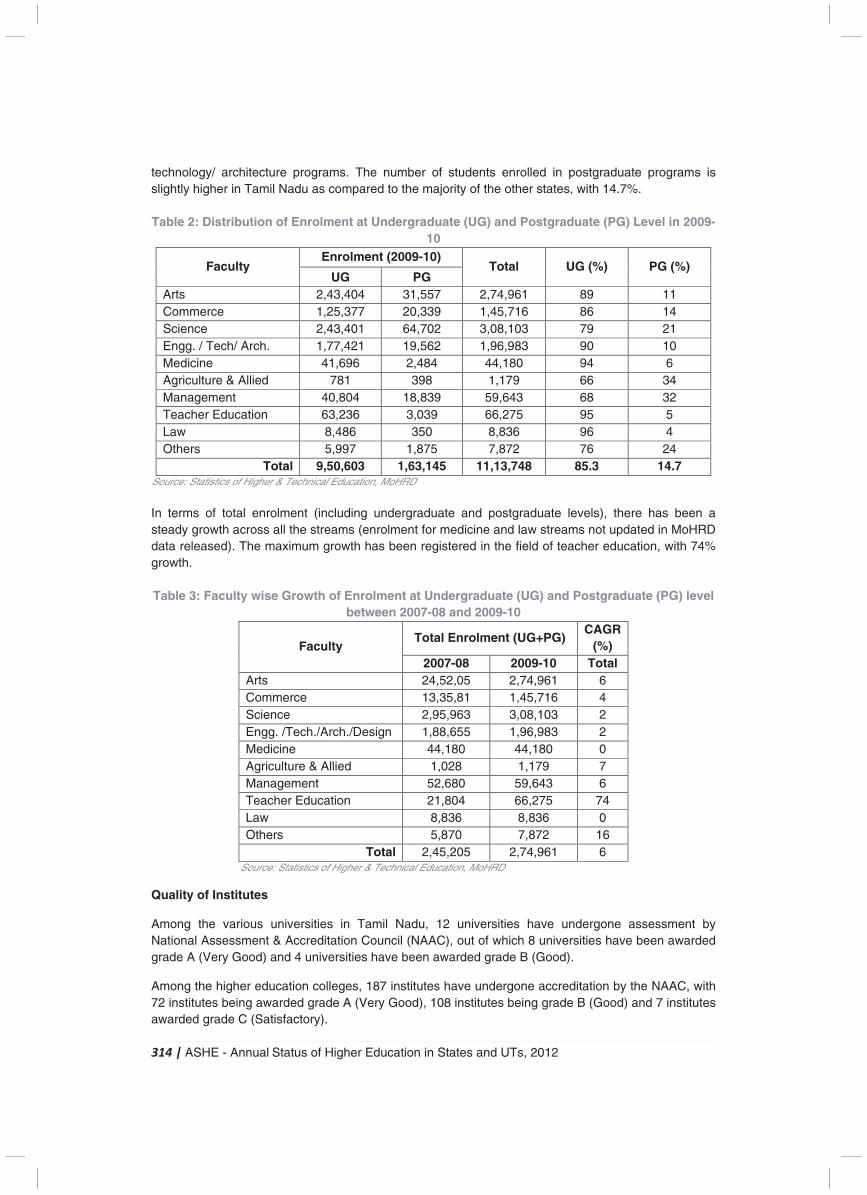
314 | ASHE - Annual Status of Higher Education in States and UTs, 2012
technology/ architecture programs. The number of students enrolled in postgraduate programs is slightly higher in Tamil Nadu as compared to the majority of the other states, with 14.7%. Table 2: Distribution of Enrolment at Undergraduate (UG) and Postgraduate (PG) Level in 2009-
10
Faculty Enrolment (2009-10)
Total UG (%) PG (%) UG PG
Arts 2,43,404 31,557 2,74,961 89 11 Commerce 1,25,377 20,339 1,45,716 86 14 Science 2,43,401 64,702 3,08,103 79 21 Engg. / Tech/ Arch. 1,77,421 19,562 1,96,983 90 10 Medicine 41,696 2,484 44,180 94 6 Agriculture & Allied 781 398 1,179 66 34 Management 40,804 18,839 59,643 68 32 Teacher Education 63,236 3,039 66,275 95 5 Law 8,486 350 8,836 96 4 Others 5,997 1,875 7,872 76 24
Total 9,50,603 1,63,145 11,13,748 85.3 14.7 Source: Statistics of Higher & Technical Education, MoHRD In terms of total enrolment (including undergraduate and postgraduate levels), there has been a steady growth across all the streams (enrolment for medicine and law streams not updated in MoHRD data released). The maximum growth has been registered in the field of teacher education, with 74% growth. Table 3: Faculty wise Growth of Enrolment at Undergraduate (UG) and Postgraduate (PG) level
between 2007-08 and 2009-10
Faculty Total Enrolment (UG+PG)
CAGR (%)
2007-08 2009-10 Total Arts 24,52,05 2,74,961 6 Commerce 13,35,81 1,45,716 4 Science 2,95,963 3,08,103 2 Engg. /Tech./Arch./Design 1,88,655 1,96,983 2 Medicine 44,180 44,180 0 Agriculture & Allied 1,028 1,179 7 Management 52,680 59,643 6 Teacher Education 21,804 66,275 74 Law 8,836 8,836 0 Others 5,870 7,872 16
Total 2,45,205 2,74,961 6 Source: Statistics of Higher & Technical Education, MoHRD
Quality of Institutes
Among the various universities in Tamil Nadu, 12 universities have undergone assessment by National Assessment & Accreditation Council (NAAC), out of which 8 universities have been awarded grade A (Very Good) and 4 universities have been awarded grade B (Good).
Among the higher education colleges, 187 institutes have undergone accreditation by the NAAC, with 72 institutes being awarded grade A (Very Good), 108 institutes being grade B (Good) and 7 institutes awarded grade C (Satisfactory).
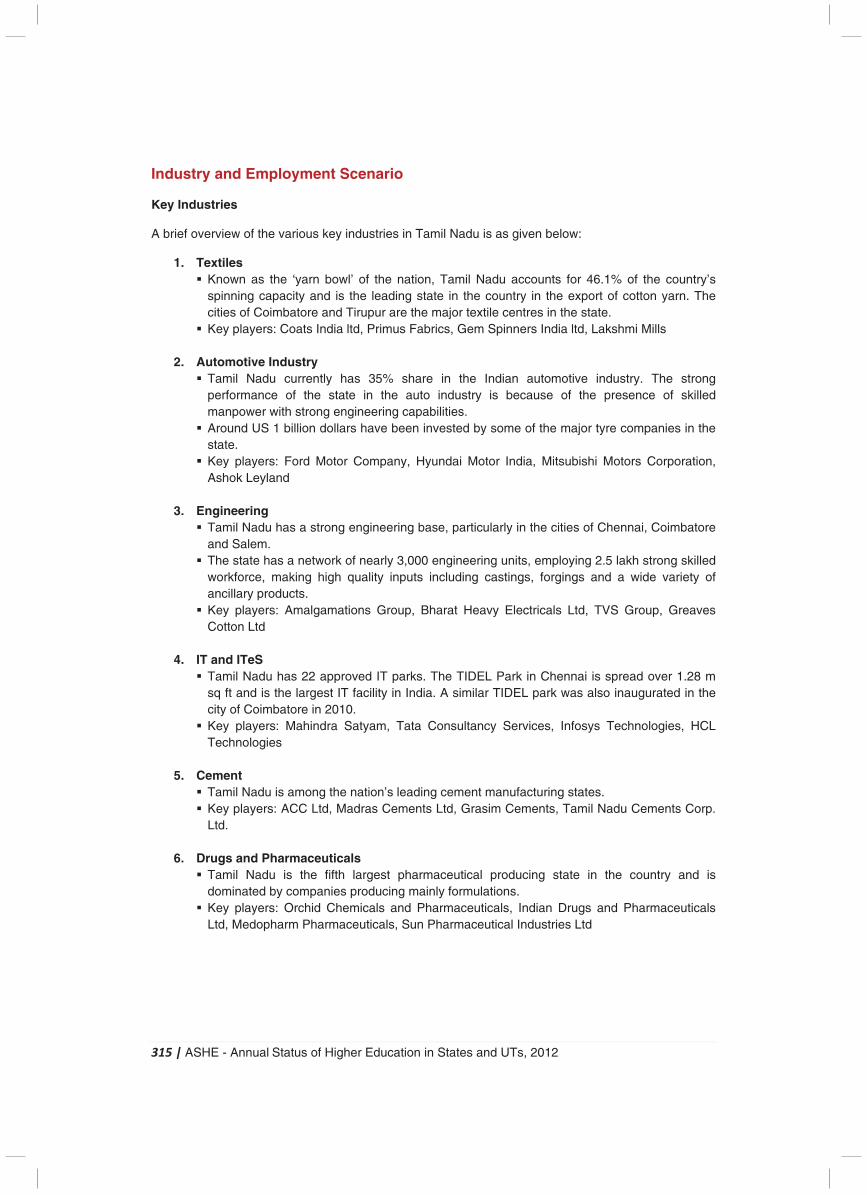
315 | ASHE - Annual Status of Higher Education in States and UTs, 2012
Industry and Employment Scenario
Key Industries
A brief overview of the various key industries in Tamil Nadu is as given below:
1. Textiles � Known as the ‘yarn bowl’ of the nation, Tamil Nadu accounts for 46.1% of the country’s
spinning capacity and is the leading state in the country in the export of cotton yarn. The cities of Coimbatore and Tirupur are the major textile centres in the state.
� Key players: Coats India ltd, Primus Fabrics, Gem Spinners India ltd, Lakshmi Mills
2. Automotive Industry � Tamil Nadu currently has 35% share in the Indian automotive industry. The strong
performance of the state in the auto industry is because of the presence of skilled manpower with strong engineering capabilities.
� Around US 1 billion dollars have been invested by some of the major tyre companies in the state.
� Key players: Ford Motor Company, Hyundai Motor India, Mitsubishi Motors Corporation, Ashok Leyland
3. Engineering
� Tamil Nadu has a strong engineering base, particularly in the cities of Chennai, Coimbatore and Salem.
� The state has a network of nearly 3,000 engineering units, employing 2.5 lakh strong skilled workforce, making high quality inputs including castings, forgings and a wide variety of ancillary products.
� Key players: Amalgamations Group, Bharat Heavy Electricals Ltd, TVS Group, Greaves Cotton Ltd
4. IT and ITeS
� Tamil Nadu has 22 approved IT parks. The TIDEL Park in Chennai is spread over 1.28 m sq ft and is the largest IT facility in India. A similar TIDEL park was also inaugurated in the city of Coimbatore in 2010.
� Key players: Mahindra Satyam, Tata Consultancy Services, Infosys Technologies, HCL Technologies
5. Cement
� Tamil Nadu is among the nation’s leading cement manufacturing states. � Key players: ACC Ltd, Madras Cements Ltd, Grasim Cements, Tamil Nadu Cements Corp.
Ltd.
6. Drugs and Pharmaceuticals � Tamil Nadu is the fifth largest pharmaceutical producing state in the country and is
dominated by companies producing mainly formulations. � Key players: Orchid Chemicals and Pharmaceuticals, Indian Drugs and Pharmaceuticals
Ltd, Medopharm Pharmaceuticals, Sun Pharmaceutical Industries Ltd
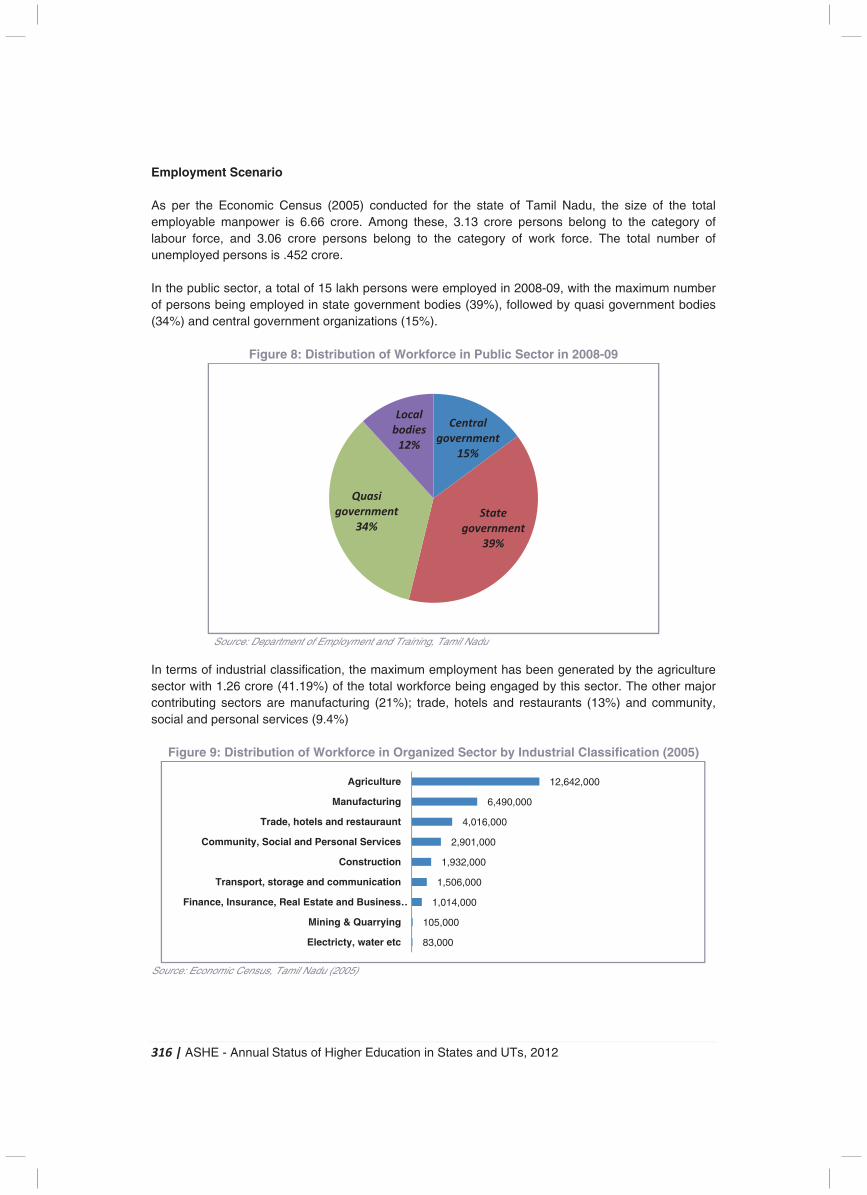
316 | ASHE - Annual Status of Higher Education in States and UTs, 2012
Employment Scenario As per the Economic Census (2005) conducted for the state of Tamil Nadu, the size of the total employable manpower is 6.66 crore. Among these, 3.13 crore persons belong to the category of labour force, and 3.06 crore persons belong to the category of work force. The total number of unemployed persons is .452 crore. In the public sector, a total of 15 lakh persons were employed in 2008-09, with the maximum number of persons being employed in state government bodies (39%), followed by quasi government bodies (34%) and central government organizations (15%).
Figure 8: Distribution of Workforce in Public Sector in 2008-09
Source: Department of Employment and Training, Tamil Nadu
In terms of industrial classification, the maximum employment has been generated by the agriculture sector with 1.26 crore (41.19%) of the total workforce being engaged by this sector. The other major contributing sectors are manufacturing (21%); trade, hotels and restaurants (13%) and community, social and personal services (9.4%)
Figure 9: Distribution of Workforce in Organized Sector by Industrial Classification (2005)
Source: Economic Census, Tamil Nadu (2005)
Central
government
15%
State
government
39%
Quasi
government
34%
Local
bodies
12%
83,000
105,000
1,014,000
1,506,000
1,932,000
2,901,000
4,016,000
6,490,000
12,642,000
Electricty, water etc
Mining & Quarrying
Finance, Insurance, Real Estate and Business …
Transport, storage and communication
Construction
Community, Social and Personal Services
Trade, hotels and restauraunt
Manufacturing
Agriculture
317 | ASHE - Annual Status of Higher Education in States and UTs, 2012
Current Initiatives in Higher Education The Tamil Nadu government has taken several initiatives, with a view to improve the higher education scenario in the state, particularly in terms of improving access. Several initiatives are currently underway to improve the quality of universities to ensure that world class education is delivered. A brief about these initiatives is given below:
� All self-supporting courses in government engineering and arts & science colleges have been converted into regular courses to enable students from financially weaker families to access higher education at an affordable cost.
� Introduction of shift system: Shift system has been introduced in government polytechnic
colleges and arts & science colleges. � Reducing of minimum marks for admission: The minimum marks for admission in
engineering colleges has been reduced for all categories of students from the year 2007-08, thus enabling students from rural areas to join professional courses in large numbers.
� Abolishment of Common Entrance Test: The Common Entrance Test for admission to
professional courses was abolished from 2007-08. This enabled students belonging to rural areas to join professional programs in large numbers. This is reflected in the fact that enrolment of rural students for professional courses increased from 24,670 during 2006-07 t 54,073 during 2009-10.
� Single window counselling system: To increase the transparency of the admissions process,
admission in B.Ed colleges and arts & science colleges is being conducted in a window counselling system, thus benefiting the meritorious students.
� Waiving of tuition fee: Tuition fee has been waived for all the students studying in government
polytechnic institutes. Similarly, to encourage students from families with no degree holders, the government has decided to bear the entire tuition fee payable by such students pursuing professional education.
� Choice Based Credit System has been introduced in the government arts and science
colleges to enhance the quality of education. � Up gradation of infrastructure: Audio-visual facilities have been provided to all the
government arts and science colleges. Similarly, 21 language laboratories have been established in government polytechnic colleges and 5 digital libraries were set-up in government engineering colleges.
� Centre of Excellence: To establish Centres of Excellence in the state, an assistance of Rs 1
crore each is provided by the state government to the following universities, Bharathiar University, Bharathidasan University, Madras University, Periyar University and Manomaniam Sundaranar University.
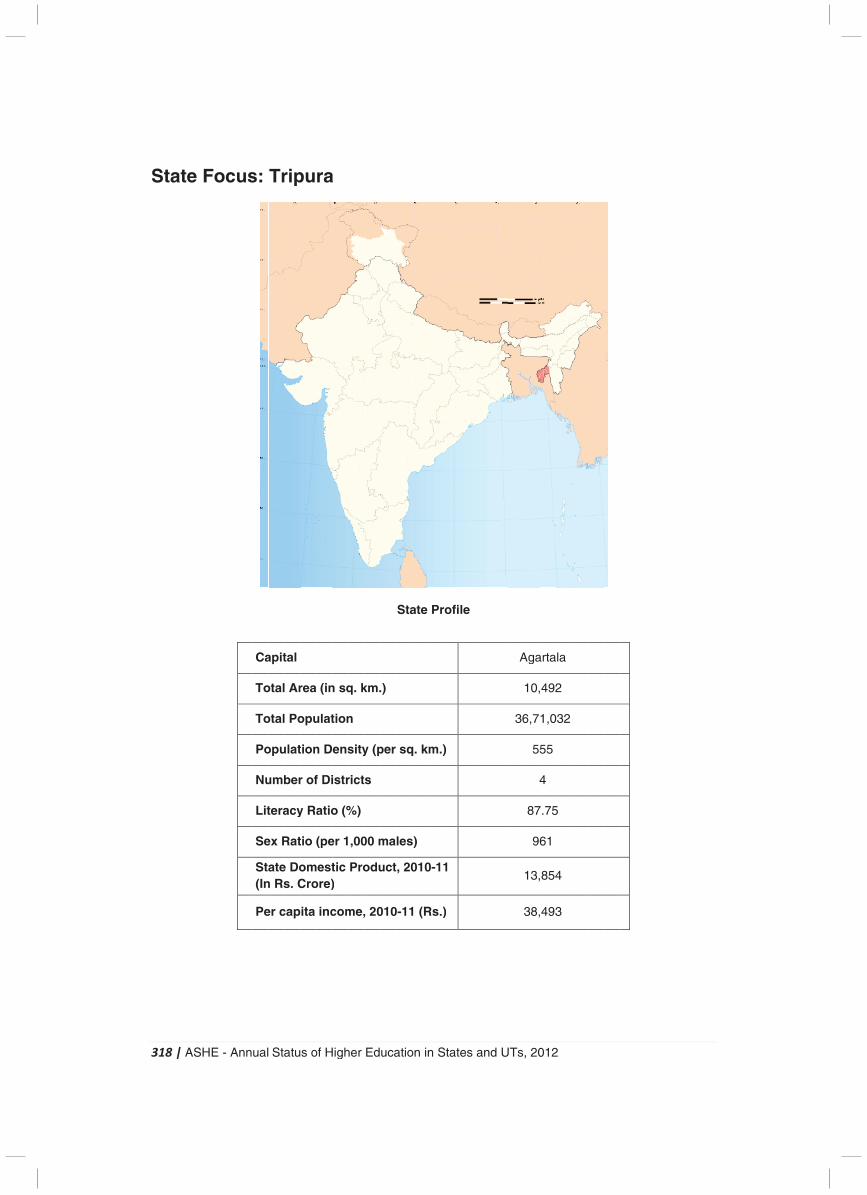
3
S
318
Sta
| A
ate
ASH
e F
HE
Fo
- A
oc
Ann
us
ual
s:
Ca
To
To
Po
Nu
Lit
Se
Sta(In
Pe
Sta
Tr
apit
otal
otal
opu
umb
tera
ex R
aten Rs
er c
atu
rip
tal
Ar
Po
ulat
ber
acy
Rat
e Dos. C
cap
s o
pu
rea
opu
tion
r of
y Ra
tio (
omCro
ita
of H
ra
(in
ulat
n D
f Di
atio
(pe
mestore)
inc
High
a
n sq
tion
ens
istr
o (%
er 1
tic )
com
her
q. k
n
sity
rict
%)
,00
Pro
me,
Ed
km.
y (p
s
00 m
odu
, 20
uca
.)
per
ma
uct
010
atio
Sta
sq
les
, 20
0-11
on in
ate
q. k
s)
010
1 (R
n S
Pr
m.)
0-11
Rs.)
Stat
ofi
)
1
)
es
le
and
d U
UTs
A
36
, 20
Aga
10,
6,7
55
4
87
96
13,
38,
012
arta
,492
1,0
55
4
7.75
61
,854
,493
2
ala
2
032
5
4
3
319 | ASHE - Annual Status of Higher Education in States and UTs, 2012
Introduction
Tripura is located in the North East region of the country and is part of the 7 sister states of the northeast region. In terms of area, Tripura is the 3rd smallest state in the country. The state shares a border with Bangladesh on its North, South & West Side and Assam & Mizoram lie on its East.
As a landlocked state, Tripura's terrain is characterised by numerous north-south hill ranges with valleys in between and plain in the western part of the state. Only one major highway connects Tripura to the rest of the country and so this serves as a major disadvantage as economic activity of the state gets adversely affected.
Tripura is a ‘sanskritized’ version of Tipra, which is the name of the local inhabitants of the state. Mainstream Indian culture and Scheduled Tribes coexist in this state where more than half of the area is covered by Forest. Most of the population is agrarian; however the services sector is the biggest contributor to the state’s economy.
Education infrastructure in Tripura has developed at a very fast pace and this can be seen in the state’s relatively high literacy rate. It is one of the few states in the country to record a literacy rate of more than 85%.
Universities and University Level Institutions
The State Department of Higher Education is entrusted with the task of providing opportunities to the students of the state for pursuing higher studies ranging from general education to sports and youth services and also for promotion of art and culture in the state.
The landscape of Higher Education in the state is characterized by one Central University and one Private University. Tripura has no state or deemed university till date and only one Institute of National Importance has been established in the state, namely the National Institute of Technology at Agartala.
Table 1: Distribution of Universities & University Level institutions at State & National Level
Type of University Tripura
(2011-12) India
(2011-12)
State University 0 285
Private University 1 112
Institution of National Importance 1 39
Deemed University 0 129
Central University 1 40
Total 3 605
Source: UGC
In Tripura a number of Undergraduate (UG), Postgraduate (PG), Medical, Engineering, Law, Polytechnics have been established both by the Government and the Private sector.
At present the Higher and Technical Education in the state comprises 16 degree colleges, out of which 14 are affiliated to Tripura Central University. The state has one Institute of Advanced Studies in Education (IASE), one Government Law Colleges, one Government Music College and one Arts and Crafts College. The state has 3 Engineering colleges and 3 Polytechnics as well. The state has 2 Medical Colleges as well as one Pharmacy College. The All India Technical Education Council (AICTE) has recognized all technical institutions in the state.
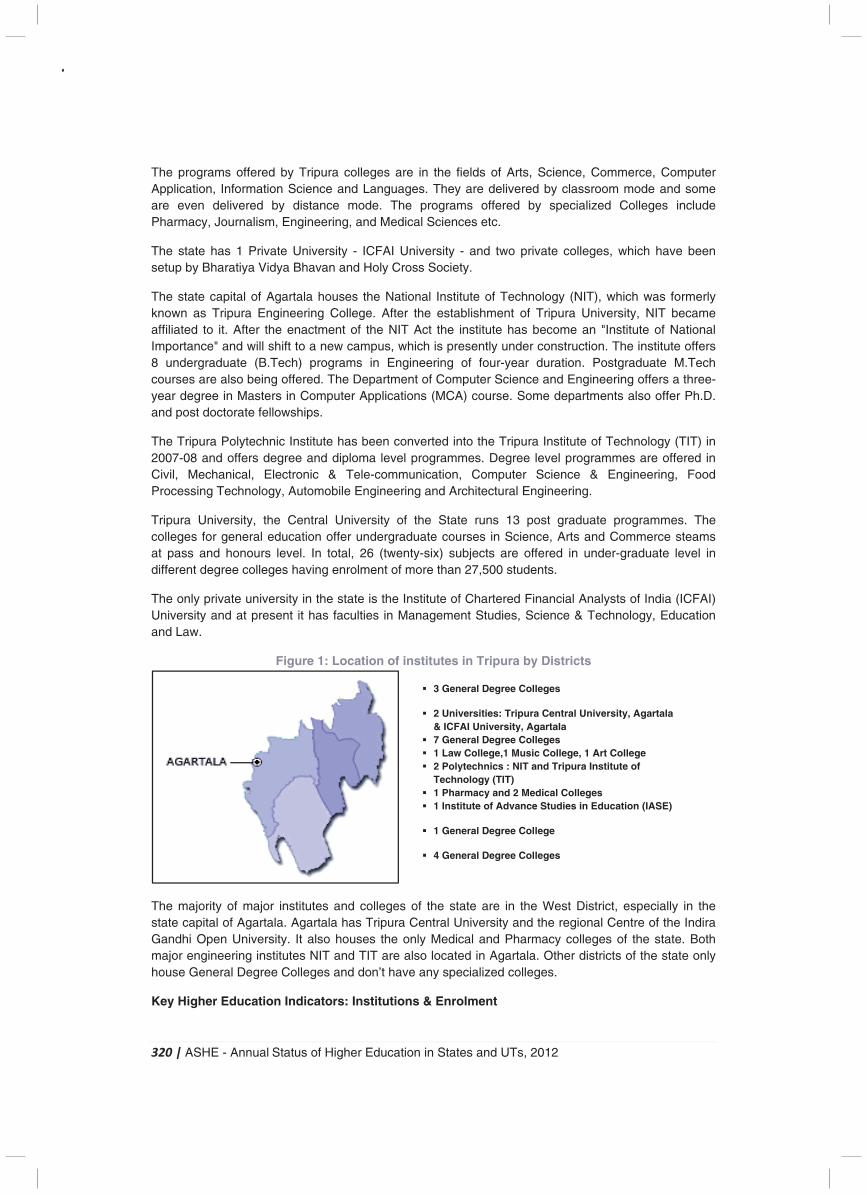
320 | ASHE - Annual Status of Higher Education in States and UTs, 2012
The programs offered by Tripura colleges are in the fields of Arts, Science, Commerce, Computer Application, Information Science and Languages. They are delivered by classroom mode and some are even delivered by distance mode. The programs offered by specialized Colleges include Pharmacy, Journalism, Engineering, and Medical Sciences etc.
The state has 1 Private University - ICFAI University - and two private colleges, which have been setup by Bharatiya Vidya Bhavan and Holy Cross Society.
The state capital of Agartala houses the National Institute of Technology (NIT), which was formerly known as Tripura Engineering College. After the establishment of Tripura University, NIT became affiliated to it. After the enactment of the NIT Act the institute has become an "Institute of National Importance" and will shift to a new campus, which is presently under construction. The institute offers 8 undergraduate (B.Tech) programs in Engineering of four-year duration. Postgraduate M.Tech courses are also being offered. The Department of Computer Science and Engineering offers a three-year degree in Masters in Computer Applications (MCA) course. Some departments also offer Ph.D. and post doctorate fellowships.
The Tripura Polytechnic Institute has been converted into the Tripura Institute of Technology (TIT) in 2007-08 and offers degree and diploma level programmes. Degree level programmes are offered in Civil, Mechanical, Electronic & Tele-communication, Computer Science & Engineering, Food Processing Technology, Automobile Engineering and Architectural Engineering.
Tripura University, the Central University of the State runs 13 post graduate programmes. The colleges for general education offer undergraduate courses in Science, Arts and Commerce steams at pass and honours level. In total, 26 (twenty-six) subjects are offered in under-graduate level in different degree colleges having enrolment of more than 27,500 students.
The only private university in the state is the Institute of Chartered Financial Analysts of India (ICFAI) University and at present it has faculties in Management Studies, Science & Technology, Education and Law.
Figure 1: Location of institutes in Tripura by Districts
The majority of major institutes and colleges of the state are in the West District, especially in the state capital of Agartala. Agartala has Tripura Central University and the regional Centre of the Indira Gandhi Open University. It also houses the only Medical and Pharmacy colleges of the state. Both major engineering institutes NIT and TIT are also located in Agartala. Other districts of the state only house General Degree Colleges and don’t have any specialized colleges.
Key Higher Education Indicators: Institutions & Enrolment
� 3 General Degree Colleges � 2 Universities: Tripura Central University, Agartala
& ICFAI University, Agartala � 7 General Degree Colleges � 1 Law College,1 Music College, 1 Art College � 2 Polytechnics : NIT and Tripura Institute of
Technology (TIT) � 1 Pharmacy and 2 Medical Colleges � 1 Institute of Advance Studies in Education (IASE) � 1 General Degree College � 4 General Degree Colleges
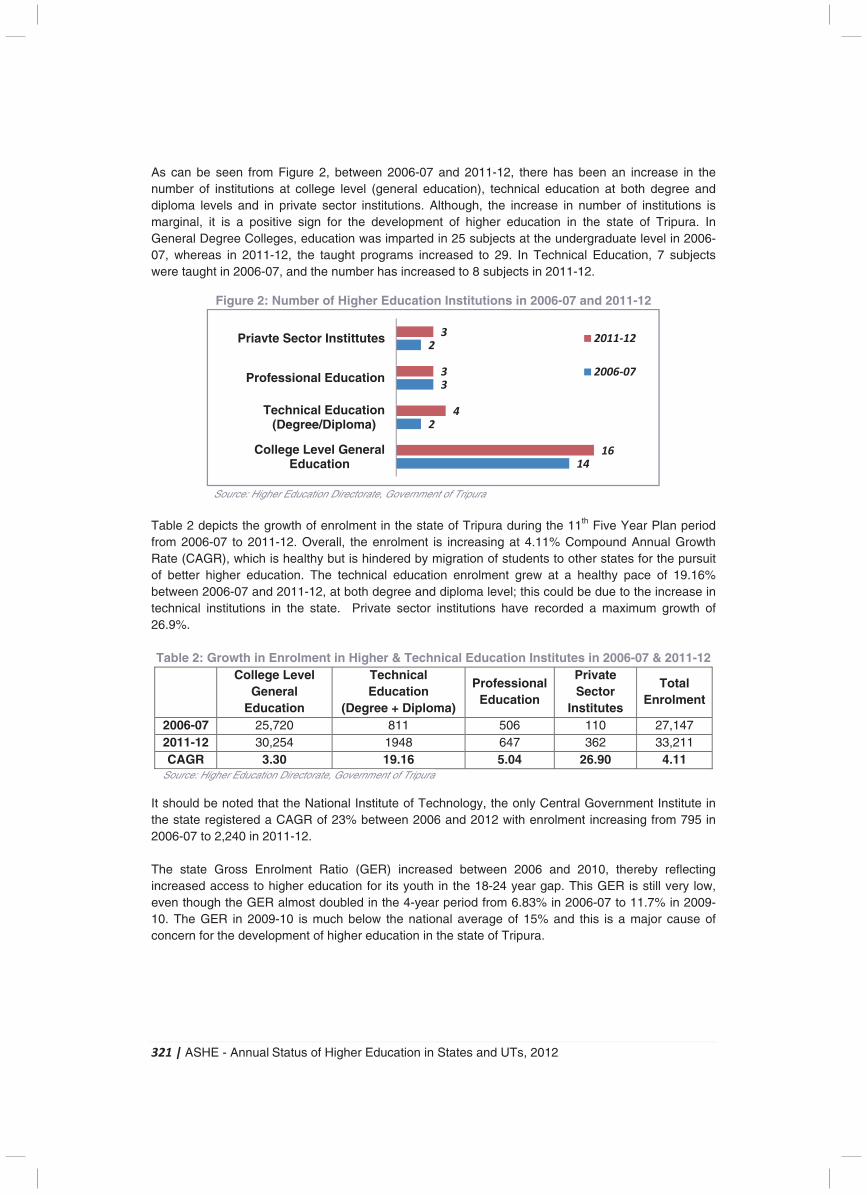
321 | ASHE - Annual Status of Higher Education in States and UTs, 2012
As can be seen from Figure 2, between 2006-07 and 2011-12, there has been an increase in the number of institutions at college level (general education), technical education at both degree and diploma levels and in private sector institutions. Although, the increase in number of institutions is marginal, it is a positive sign for the development of higher education in the state of Tripura. In General Degree Colleges, education was imparted in 25 subjects at the undergraduate level in 2006-07, whereas in 2011-12, the taught programs increased to 29. In Technical Education, 7 subjects were taught in 2006-07, and the number has increased to 8 subjects in 2011-12.
Figure 2: Number of Higher Education Institutions in 2006-07 and 2011-12
Source: Higher Education Directorate, Government of Tripura
Table 2 depicts the growth of enrolment in the state of Tripura during the 11th Five Year Plan period from 2006-07 to 2011-12. Overall, the enrolment is increasing at 4.11% Compound Annual Growth Rate (CAGR), which is healthy but is hindered by migration of students to other states for the pursuit of better higher education. The technical education enrolment grew at a healthy pace of 19.16% between 2006-07 and 2011-12, at both degree and diploma level; this could be due to the increase in technical institutions in the state. Private sector institutions have recorded a maximum growth of 26.9%. Table 2: Growth in Enrolment in Higher & Technical Education Institutes in 2006-07 & 2011-12
College Level General
Education
Technical Education
(Degree + Diploma)
Professional Education
Private Sector
Institutes
Total Enrolment
2006-07 25,720 811 506 110 27,147 2011-12 30,254 1948 647 362 33,211 CAGR 3.30 19.16 5.04 26.90 4.11
Source: Higher Education Directorate, Government of Tripura It should be noted that the National Institute of Technology, the only Central Government Institute in the state registered a CAGR of 23% between 2006 and 2012 with enrolment increasing from 795 in 2006-07 to 2,240 in 2011-12. The state Gross Enrolment Ratio (GER) increased between 2006 and 2010, thereby reflecting increased access to higher education for its youth in the 18-24 year gap. This GER is still very low, even though the GER almost doubled in the 4-year period from 6.83% in 2006-07 to 11.7% in 2009-10. The GER in 2009-10 is much below the national average of 15% and this is a major cause of concern for the development of higher education in the state of Tripura.
14
2
3
2
16
4
3
3
College Level General Education
Technical Education (Degree/Diploma)
Professional Education
Priavte Sector Instittutes 2011-12
2006-07
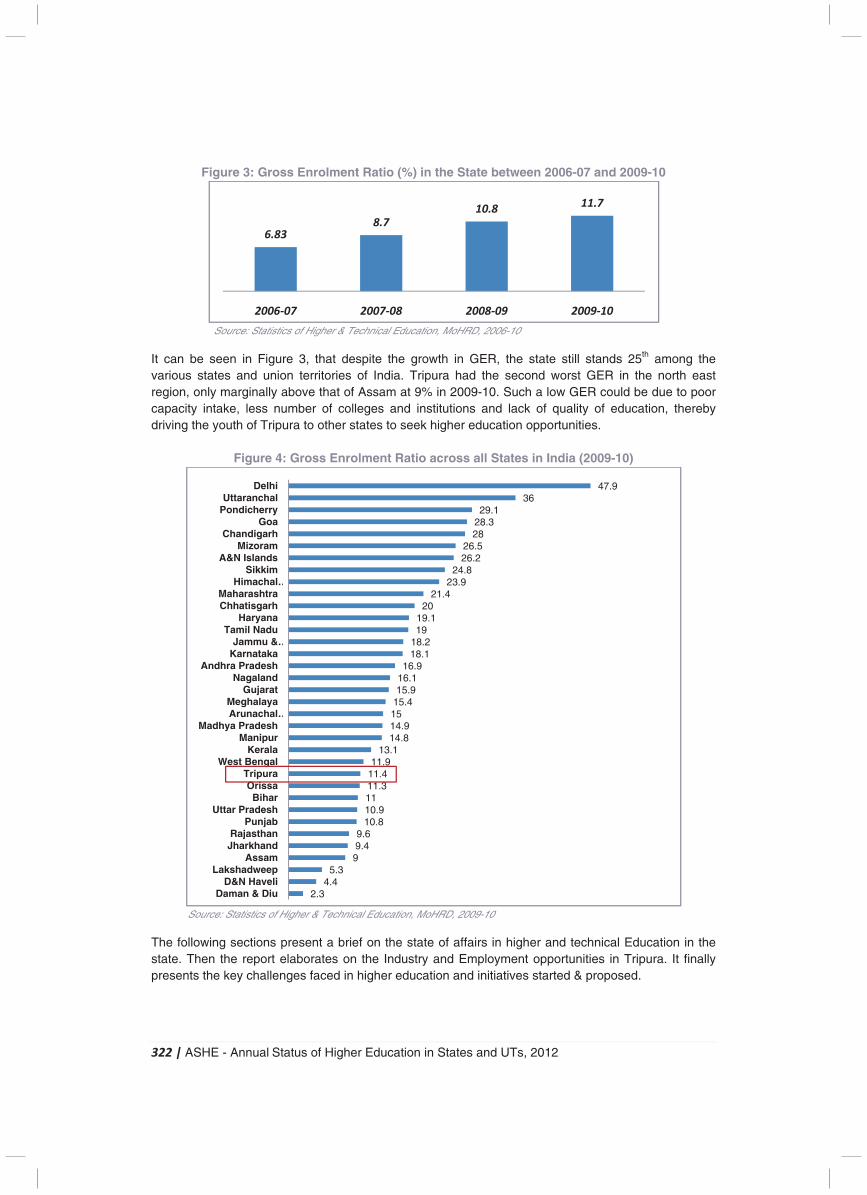
322 | ASHE - Annual Status of Higher Education in States and UTs, 2012
Figure 3: Gross Enrolment Ratio (%) in the State between 2006-07 and 2009-10
Source: Statistics of Higher & Technical Education, MoHRD, 2006-10
It can be seen in Figure 3, that despite the growth in GER, the state still stands 25th among the various states and union territories of India. Tripura had the second worst GER in the north east region, only marginally above that of Assam at 9% in 2009-10. Such a low GER could be due to poor capacity intake, less number of colleges and institutions and lack of quality of education, thereby driving the youth of Tripura to other states to seek higher education opportunities.
Figure 4: Gross Enrolment Ratio across all States in India (2009-10)
Source: Statistics of Higher & Technical Education, MoHRD, 2009-10 The following sections present a brief on the state of affairs in higher and technical Education in the state. Then the report elaborates on the Industry and Employment opportunities in Tripura. It finally presents the key challenges faced in higher education and initiatives started & proposed.
6.838.7
10.811.7
2006-07 2007-08 2008-09 2009-10
2.34.4
5.399.49.6
10.810.91111.311.411.9
13.114.814.91515.415.916.116.9
18.118.21919.1
2021.4
23.924.8
26.226.5
2828.329.1
3647.9
Daman & DiuD&N Haveli
LakshadweepAssam
JharkhandRajasthan
PunjabUttar Pradesh
BiharOrissa
TripuraWest Bengal
KeralaManipur
Madhya PradeshArunachal …Meghalaya
GujaratNagaland
Andhra PradeshKarnatakaJammu & …
Tamil NaduHaryana
ChhatisgarhMaharashtra
Himachal …Sikkim
A&N IslandsMizoram
ChandigarhGoa
PondicherryUttaranchal
Delhi
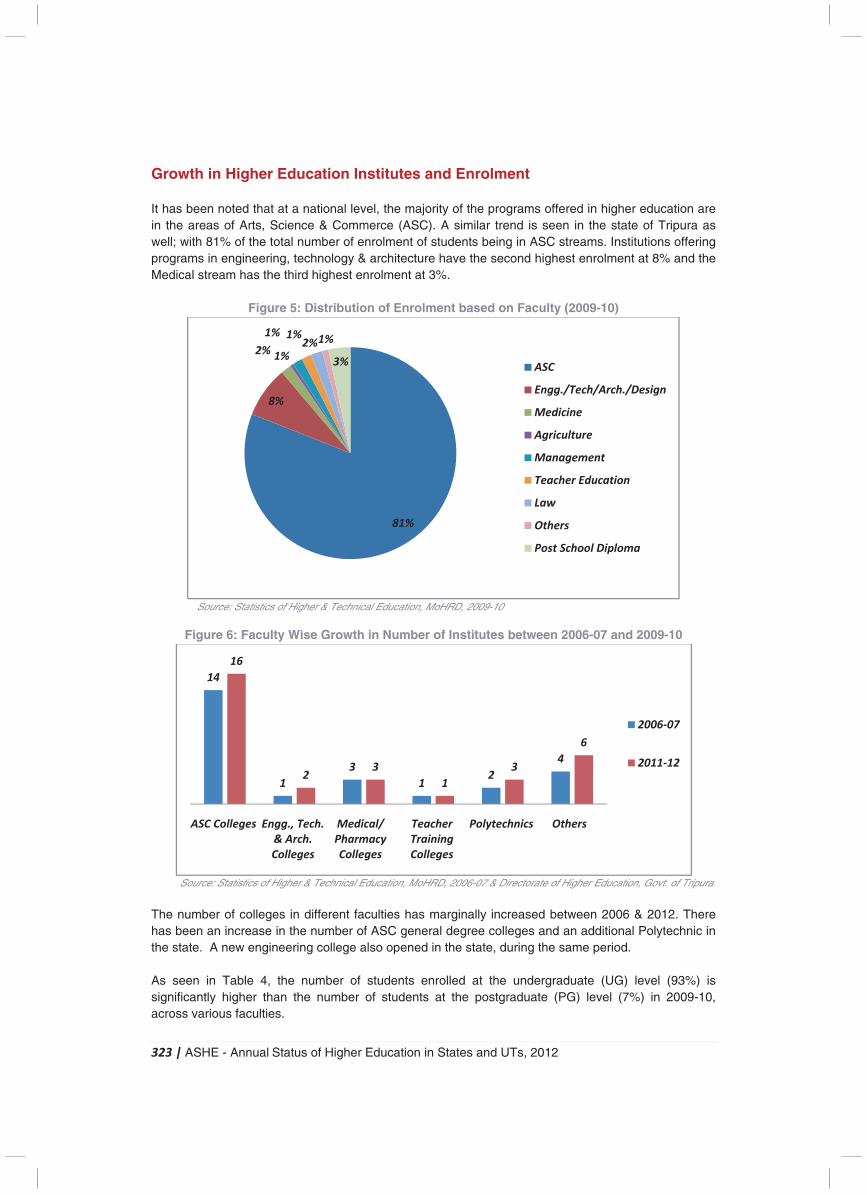
323 | ASHE - Annual Status of Higher Education in States and UTs, 2012
Growth in Higher Education Institutes and Enrolment It has been noted that at a national level, the majority of the programs offered in higher education are in the areas of Arts, Science & Commerce (ASC). A similar trend is seen in the state of Tripura as well; with 81% of the total number of enrolment of students being in ASC streams. Institutions offering programs in engineering, technology & architecture have the second highest enrolment at 8% and the Medical stream has the third highest enrolment at 3%.
Figure 5: Distribution of Enrolment based on Faculty (2009-10)
Source: Statistics of Higher & Technical Education, MoHRD, 2009-10
Figure 6: Faculty Wise Growth in Number of Institutes between 2006-07 and 2009-10
Source: Statistics of Higher & Technical Education, MoHRD, 2006-07 & Directorate of Higher Education, Govt. of Tripura
The number of colleges in different faculties has marginally increased between 2006 & 2012. There has been an increase in the number of ASC general degree colleges and an additional Polytechnic in the state. A new engineering college also opened in the state, during the same period. As seen in Table 4, the number of students enrolled at the undergraduate (UG) level (93%) is significantly higher than the number of students at the postgraduate (PG) level (7%) in 2009-10, across various faculties.
81%
8%
2% 1%
1% 1%2%1%
3% ASC
Engg./Tech/Arch./Design
Medicine
Agriculture
Management
Teacher Education
Law
Others
Post School Diploma
14
1
3
1 2
4
16
2 3
1
3
6
ASC Colleges Engg., Tech.
& Arch.
Colleges
Medical/
Pharmacy
Colleges
Teacher
Training
Colleges
Polytechnics Others
2006-07
2011-12
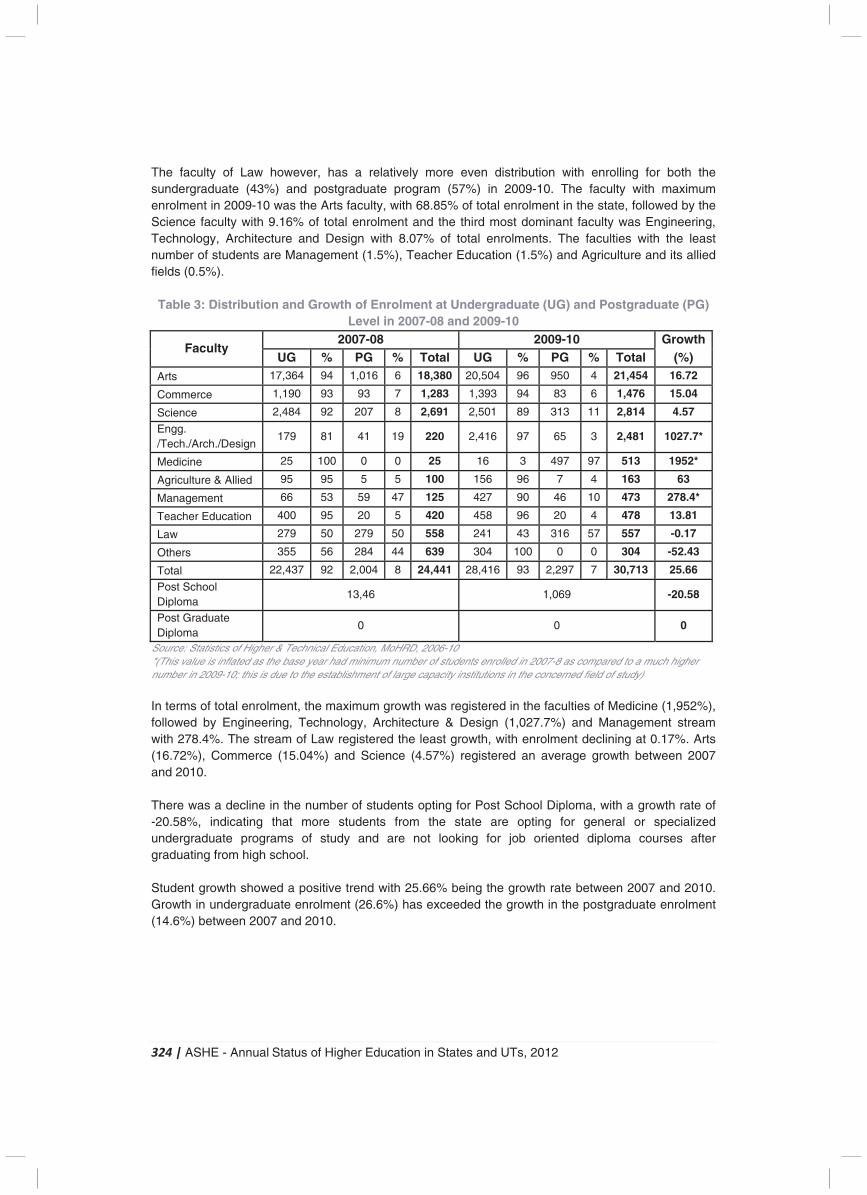
324 | ASHE - Annual Status of Higher Education in States and UTs, 2012
The faculty of Law however, has a relatively more even distribution with enrolling for both the sundergraduate (43%) and postgraduate program (57%) in 2009-10. The faculty with maximum enrolment in 2009-10 was the Arts faculty, with 68.85% of total enrolment in the state, followed by the Science faculty with 9.16% of total enrolment and the third most dominant faculty was Engineering, Technology, Architecture and Design with 8.07% of total enrolments. The faculties with the least number of students are Management (1.5%), Teacher Education (1.5%) and Agriculture and its allied fields (0.5%). Table 3: Distribution and Growth of Enrolment at Undergraduate (UG) and Postgraduate (PG)
Level in 2007-08 and 2009-10
Faculty 2007-08 2009-10 Growth
UG % PG % Total UG % PG % Total (%) Arts 17,364 94 1,016 6 18,380 20,504 96 950 4 21,454 16.72
Commerce 1,190 93 93 7 1,283 1,393 94 83 6 1,476 15.04
Science 2,484 92 207 8 2,691 2,501 89 313 11 2,814 4.57
Engg. /Tech./Arch./Design
179 81 41 19 220 2,416 97 65 3 2,481 1027.7*
Medicine 25 100 0 0 25 16 3 497 97 513 1952*
Agriculture & Allied 95 95 5 5 100 156 96 7 4 163 63
Management 66 53 59 47 125 427 90 46 10 473 278.4*
Teacher Education 400 95 20 5 420 458 96 20 4 478 13.81
Law 279 50 279 50 558 241 43 316 57 557 -0.17
Others 355 56 284 44 639 304 100 0 0 304 -52.43
Total 22,437 92 2,004 8 24,441 28,416 93 2,297 7 30,713 25.66
Post School Diploma
13,46 1,069 -20.58
Post Graduate Diploma
0 0 0
Source: Statistics of Higher & Technical Education, MoHRD, 2006-10 *(This value is inflated as the base year had minimum number of students enrolled in 2007-8 as compared to a much higher number in 2009-10; this is due to the establishment of large capacity institutions in the concerned field of study) In terms of total enrolment, the maximum growth was registered in the faculties of Medicine (1,952%), followed by Engineering, Technology, Architecture & Design (1,027.7%) and Management stream with 278.4%. The stream of Law registered the least growth, with enrolment declining at 0.17%. Arts (16.72%), Commerce (15.04%) and Science (4.57%) registered an average growth between 2007 and 2010. There was a decline in the number of students opting for Post School Diploma, with a growth rate of -20.58%, indicating that more students from the state are opting for general or specialized undergraduate programs of study and are not looking for job oriented diploma courses after graduating from high school. Student growth showed a positive trend with 25.66% being the growth rate between 2007 and 2010. Growth in undergraduate enrolment (26.6%) has exceeded the growth in the postgraduate enrolment (14.6%) between 2007 and 2010.
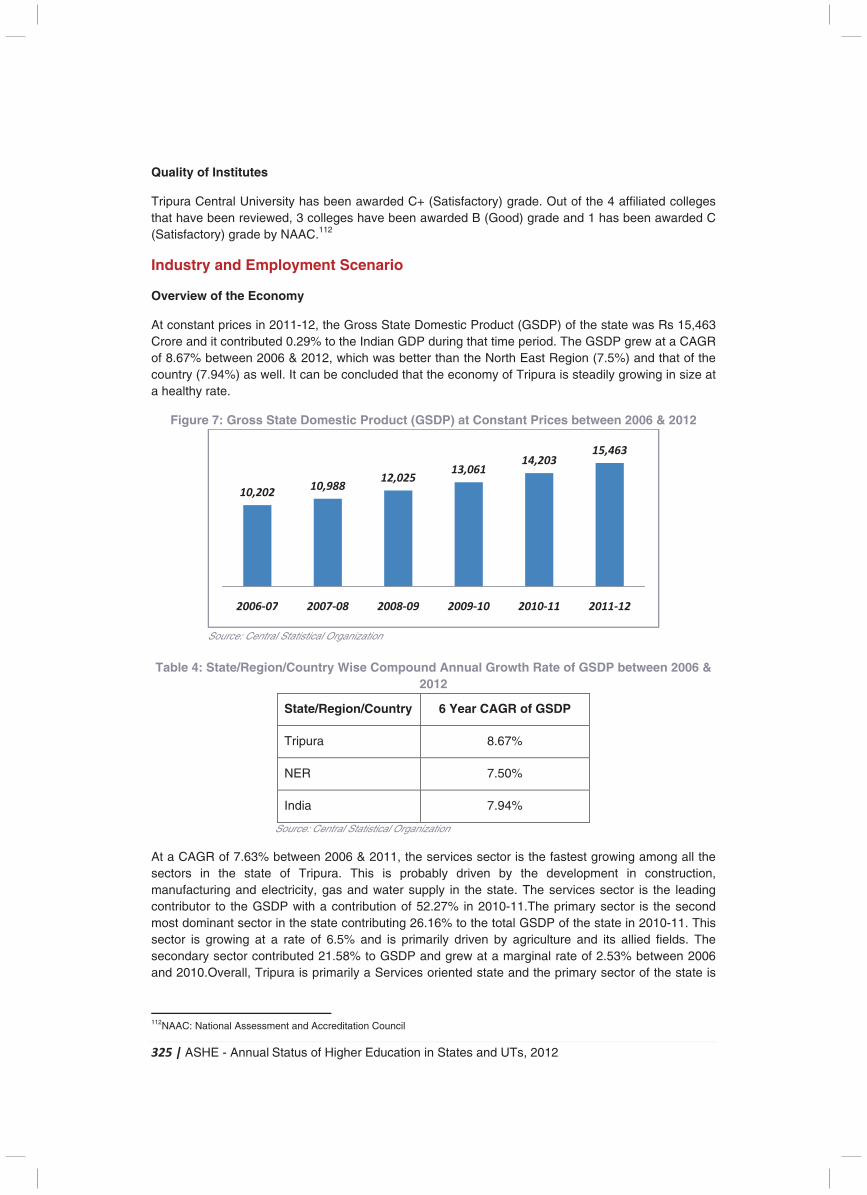
325 | ASHE - Annual Status of Higher Education in States and UTs, 2012
Quality of Institutes
Tripura Central University has been awarded C+ (Satisfactory) grade. Out of the 4 affiliated colleges that have been reviewed, 3 colleges have been awarded B (Good) grade and 1 has been awarded C (Satisfactory) grade by NAAC.112
Industry and Employment Scenario
Overview of the Economy
At constant prices in 2011-12, the Gross State Domestic Product (GSDP) of the state was Rs 15,463 Crore and it contributed 0.29% to the Indian GDP during that time period. The GSDP grew at a CAGR of 8.67% between 2006 & 2012, which was better than the North East Region (7.5%) and that of the country (7.94%) as well. It can be concluded that the economy of Tripura is steadily growing in size at a healthy rate.
Figure 7: Gross State Domestic Product (GSDP) at Constant Prices between 2006 & 2012
Source: Central Statistical Organization
Table 4: State/Region/Country Wise Compound Annual Growth Rate of GSDP between 2006 &
2012
State/Region/Country 6 Year CAGR of GSDP
Tripura 8.67%
NER 7.50%
India 7.94%
Source: Central Statistical Organization At a CAGR of 7.63% between 2006 & 2011, the services sector is the fastest growing among all the sectors in the state of Tripura. This is probably driven by the development in construction, manufacturing and electricity, gas and water supply in the state. The services sector is the leading contributor to the GSDP with a contribution of 52.27% in 2010-11.The primary sector is the second most dominant sector in the state contributing 26.16% to the total GSDP of the state in 2010-11. This sector is growing at a rate of 6.5% and is primarily driven by agriculture and its allied fields. The secondary sector contributed 21.58% to GSDP and grew at a marginal rate of 2.53% between 2006 and 2010.Overall, Tripura is primarily a Services oriented state and the primary sector of the state is
112NAAC: National Assessment and Accreditation Council
10,20210,988
12,02513,061
14,20315,463
2006-07 2007-08 2008-09 2009-10 2010-11 2011-12
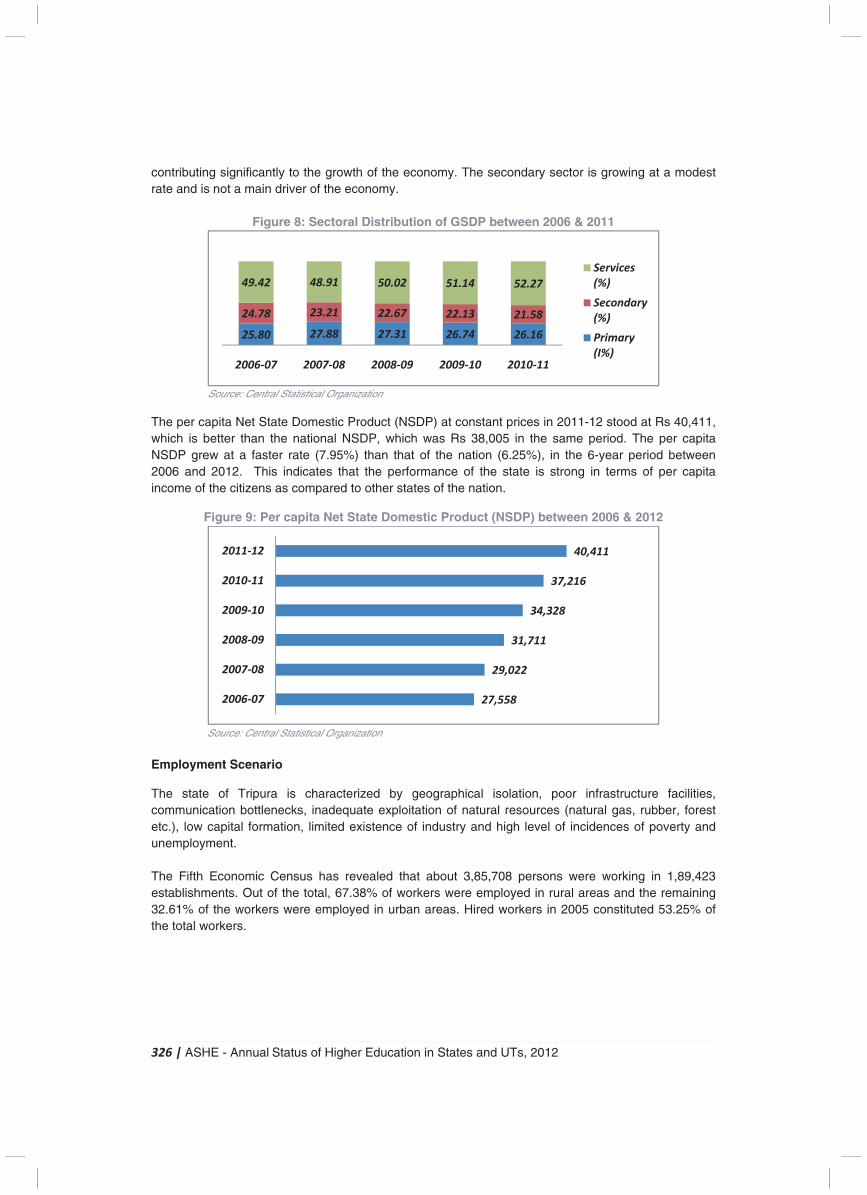
326 | ASHE - Annual Status of Higher Education in States and UTs, 2012
contributing significantly to the growth of the economy. The secondary sector is growing at a modest rate and is not a main driver of the economy.
Figure 8: Sectoral Distribution of GSDP between 2006 & 2011
Source: Central Statistical Organization
The per capita Net State Domestic Product (NSDP) at constant prices in 2011-12 stood at Rs 40,411, which is better than the national NSDP, which was Rs 38,005 in the same period. The per capita NSDP grew at a faster rate (7.95%) than that of the nation (6.25%), in the 6-year period between 2006 and 2012. This indicates that the performance of the state is strong in terms of per capita income of the citizens as compared to other states of the nation.
Figure 9: Per capita Net State Domestic Product (NSDP) between 2006 & 2012
Source: Central Statistical Organization Employment Scenario
The state of Tripura is characterized by geographical isolation, poor infrastructure facilities, communication bottlenecks, inadequate exploitation of natural resources (natural gas, rubber, forest etc.), low capital formation, limited existence of industry and high level of incidences of poverty and unemployment. The Fifth Economic Census has revealed that about 3,85,708 persons were working in 1,89,423 establishments. Out of the total, 67.38% of workers were employed in rural areas and the remaining 32.61% of the workers were employed in urban areas. Hired workers in 2005 constituted 53.25% of the total workers.
25.80 27.88 27.31 26.74 26.16
24.78 23.21 22.67 22.13 21.58
49.42 48.91 50.02 51.14 52.27
2006-07 2007-08 2008-09 2009-10 2010-11
Services
(%)
Secondary
(%)
Primary
(I%)
27,558
29,022
31,711
34,328
37,216
40,411
2006-07
2007-08
2008-09
2009-10
2010-11
2011-12
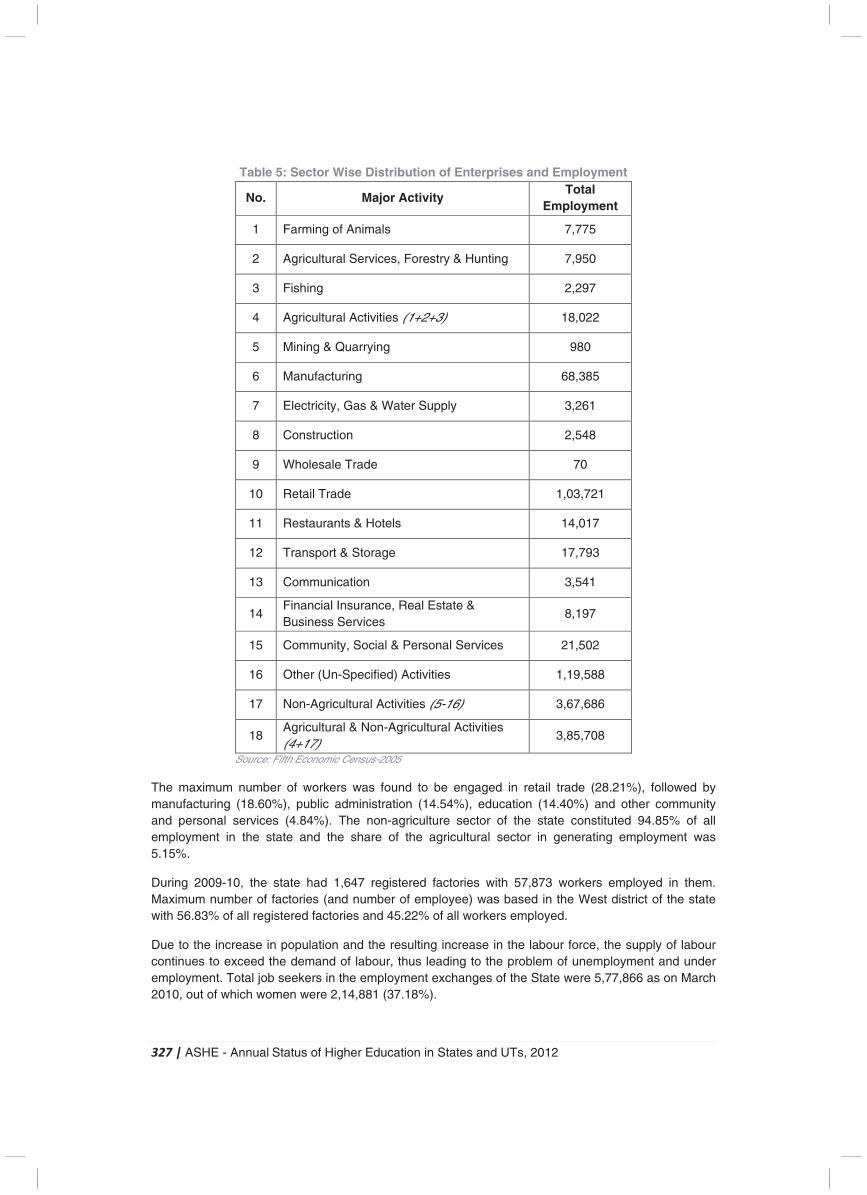
327 | ASHE - Annual Status of Higher Education in States and UTs, 2012
Table 5: Sector Wise Distribution of Enterprises and Employment
No. Major Activity Total
Employment
1 Farming of Animals 7,775
2 Agricultural Services, Forestry & Hunting 7,950
3 Fishing 2,297
4 Agricultural Activities (1+2+3) 18,022
5 Mining & Quarrying 980
6 Manufacturing 68,385
7 Electricity, Gas & Water Supply 3,261
8 Construction 2,548
9 Wholesale Trade 70
10 Retail Trade 1,03,721
11 Restaurants & Hotels 14,017
12 Transport & Storage 17,793
13 Communication 3,541
14 Financial Insurance, Real Estate & Business Services
8,197
15 Community, Social & Personal Services 21,502
16 Other (Un-Specified) Activities 1,19,588
17 Non-Agricultural Activities (5-16) 3,67,686
18 Agricultural & Non-Agricultural Activities (4+17)
3,85,708
Source: Fifth Economic Census-2005 The maximum number of workers was found to be engaged in retail trade (28.21%), followed by manufacturing (18.60%), public administration (14.54%), education (14.40%) and other community and personal services (4.84%). The non-agriculture sector of the state constituted 94.85% of all employment in the state and the share of the agricultural sector in generating employment was 5.15%.
During 2009-10, the state had 1,647 registered factories with 57,873 workers employed in them. Maximum number of factories (and number of employee) was based in the West district of the state with 56.83% of all registered factories and 45.22% of all workers employed.
Due to the increase in population and the resulting increase in the labour force, the supply of labour continues to exceed the demand of labour, thus leading to the problem of unemployment and under employment. Total job seekers in the employment exchanges of the State were 5,77,866 as on March 2010, out of which women were 2,14,881 (37.18%).
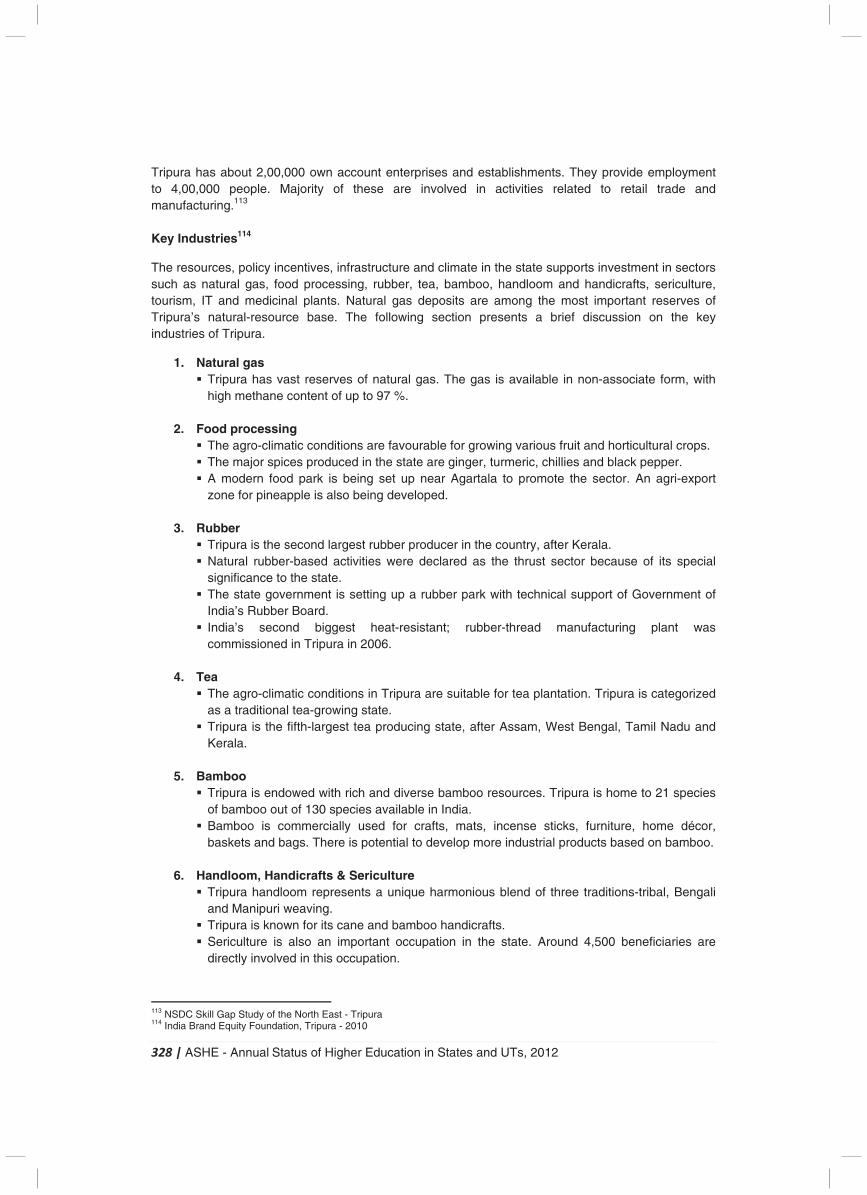
328 | ASHE - Annual Status of Higher Education in States and UTs, 2012
Tripura has about 2,00,000 own account enterprises and establishments. They provide employment to 4,00,000 people. Majority of these are involved in activities related to retail trade and manufacturing.113 Key Industries114
The resources, policy incentives, infrastructure and climate in the state supports investment in sectors such as natural gas, food processing, rubber, tea, bamboo, handloom and handicrafts, sericulture, tourism, IT and medicinal plants. Natural gas deposits are among the most important reserves of Tripura’s natural-resource base. The following section presents a brief discussion on the key industries of Tripura.
1. Natural gas � Tripura has vast reserves of natural gas. The gas is available in non-associate form, with
high methane content of up to 97 %.
2. Food processing � The agro-climatic conditions are favourable for growing various fruit and horticultural crops. � The major spices produced in the state are ginger, turmeric, chillies and black pepper. � A modern food park is being set up near Agartala to promote the sector. An agri-export
zone for pineapple is also being developed.
3. Rubber � Tripura is the second largest rubber producer in the country, after Kerala. � Natural rubber-based activities were declared as the thrust sector because of its special
significance to the state. � The state government is setting up a rubber park with technical support of Government of
India’s Rubber Board. � India’s second biggest heat-resistant; rubber-thread manufacturing plant was
commissioned in Tripura in 2006.
4. Tea � The agro-climatic conditions in Tripura are suitable for tea plantation. Tripura is categorized
as a traditional tea-growing state. � Tripura is the fifth-largest tea producing state, after Assam, West Bengal, Tamil Nadu and
Kerala.
5. Bamboo � Tripura is endowed with rich and diverse bamboo resources. Tripura is home to 21 species
of bamboo out of 130 species available in India. � Bamboo is commercially used for crafts, mats, incense sticks, furniture, home décor,
baskets and bags. There is potential to develop more industrial products based on bamboo.
6. Handloom, Handicrafts & Sericulture � Tripura handloom represents a unique harmonious blend of three traditions-tribal, Bengali
and Manipuri weaving. � Tripura is known for its cane and bamboo handicrafts. � Sericulture is also an important occupation in the state. Around 4,500 beneficiaries are
directly involved in this occupation.
113 NSDC Skill Gap Study of the North East - Tripura 114 India Brand Equity Foundation, Tripura - 2010
329 | ASHE - Annual Status of Higher Education in States and UTs, 2012
� The state produces a wide variety of products such as silk and cotton saris, lungis, shirts, jute carpets, bedspreads and furnishing fabrics.
7. Tourism � Tripura is an attractive tourist destination because of its rich flora and fauna. � As of 2011, 3.5 lakh domestic and foreign tourists visited the state according to the Ministry
of Tourism.
Key Challenges and Initiative in Higher Education
Current Challenges
� The current Gross Enrolment Ratio is very low as compared to the national as well as regional levels.
� Many students from the state decide to pursue higher education outside the state due to unavailability of their course of study, limited intake capacity and/or the quality of education that is being provided in the state.
� Most major institutes are located in the state capital of Agartala and only a few general degree colleges are established in other districts of Tripura, due to this students from different parts of the state do not get an opportunity to pursue specialized higher education.
� Limited industry - university interface in the state results in poor placement. Some programs are outdated, irrelevant and don’t prepare students for the job market.
� There are only two Polytechnics in the state and there is need for more such establishments so as to meet the demand of this course of study.
� Basic Infrastructure and facilities in the state need immediate expansion and up gradation.
Initiatives Started
� Polytechnic Institutes were upgraded to degree level engineering colleges that offer both diploma and degree programs.
� New general degree colleges were set up in remote tribal localities for widening the scope of higher education in tribal areas.
� To create avenues for employment by skill development, new Polytechnics were setup in unreserved districts.
� Broadband/Internet was provided to 9 Colleges and SMART Class with modern technologies started under the NMEICT scheme.
� New college of Teachers Education was started. � Convergence scheme of IGNOU as well as distance education facility of Tripura University was
introduced. Initiatives Proposed
� Introduction of job oriented honours/pass courses in general degree colleges. � Setting up of new state University and up gradation of Government Law College to Law University. � Setup a new College exclusively for Science Education for both UG and PG studies. � Modernization of Science Labs of general degree colleges and workshops of Technical Institutions
by providing modern equipment, machineries and apparatuses etc. � Introduction of new branches in both UG and PG which are demand driven and have social and
market relevancy in both Tripura Institute of Technology and Women’s Polytechnic. � Setting up of 4 Polytechnics in 4 districts under centrally sponsored schemes. � Introduction of Food Processing Technology & Rubber Technology in the state Polytechnic
institutes.
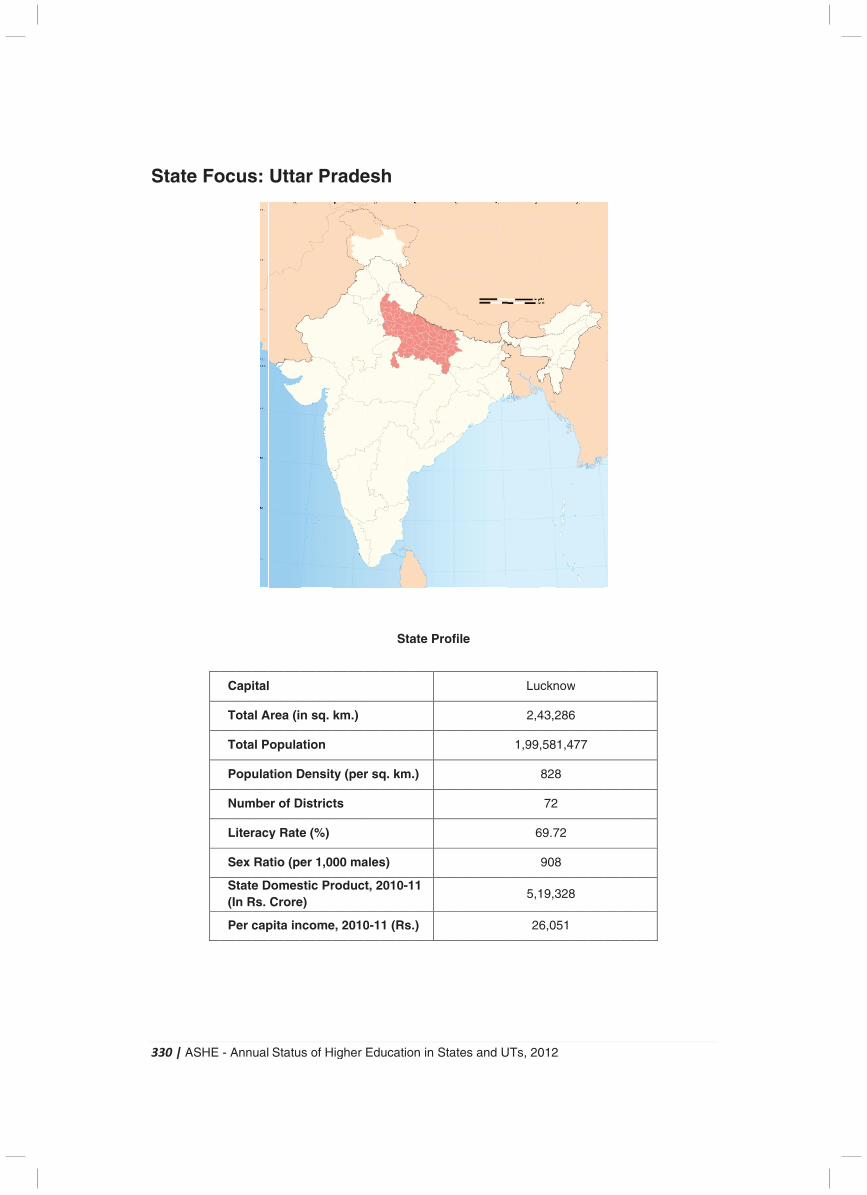
3
S
330
Sta
| A
ate
ASH
e F
HE
Fo
- A
oc
C
To
To
Po
N
Li
Se
St(In
Pe
Ann
us
api
ota
ota
opu
um
iter
ex
taten R
er c
ual
s:
ital
al A
al P
ula
mbe
rac
Ra
e DRs.
cap
Sta
Ut
l
Area
Pop
atio
er o
y R
atio
DomCro
pita
atu
tta
a (i
ula
n D
of D
Rate
(pe
mesore
a in
s o
ar
n s
atio
Den
Dist
e (%
er 1
stice)
nco
of H
Pr
sq.
on
nsit
tric
%)
1,0
c Pr
me
High
ra
km
ty (
ts
00
rod
e, 2
her
de
m.)
(per
ma
duc
010
Ed
es
r sq
ales
t, 2
0-1
uca
h
q. k
s)
201
1 (
atio
Sta
km.
0-1
Rs.
on in
ate
.)
11
.)
n S
Pr
Stat
ofi
es
le
and
d U
UTs
1,
, 20
Lu
2,4
99
6
5,1
26
012
ckn
43,2
,58
828
72
69.7
908
19,3
6,0
2
now
286
1,4
8
2
72
8
328
51
w
6
477
8
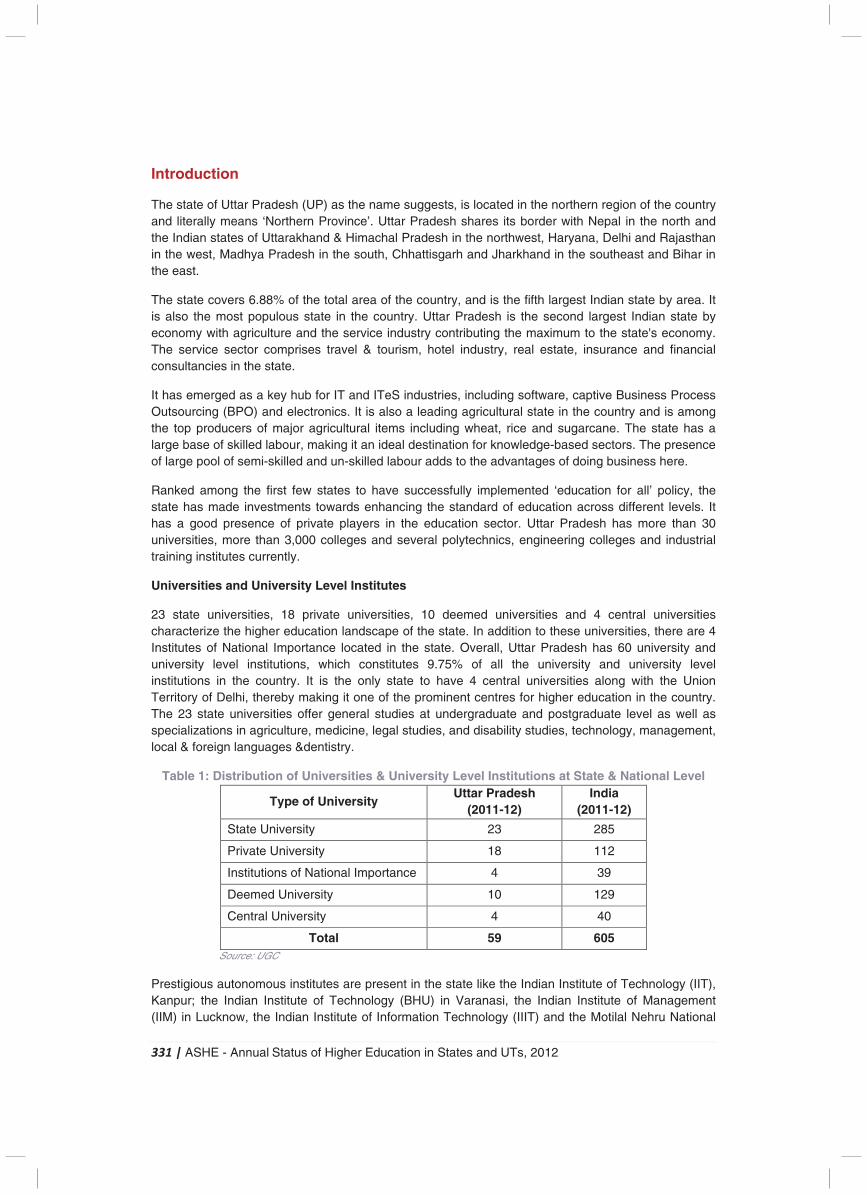
331 | ASHE - Annual Status of Higher Education in States and UTs, 2012
Introduction
The state of Uttar Pradesh (UP) as the name suggests, is located in the northern region of the country and literally means ‘Northern Province’. Uttar Pradesh shares its border with Nepal in the north and the Indian states of Uttarakhand & Himachal Pradesh in the northwest, Haryana, Delhi and Rajasthan in the west, Madhya Pradesh in the south, Chhattisgarh and Jharkhand in the southeast and Bihar in the east.
The state covers 6.88% of the total area of the country, and is the fifth largest Indian state by area. It is also the most populous state in the country. Uttar Pradesh is the second largest Indian state by economy with agriculture and the service industry contributing the maximum to the state's economy. The service sector comprises travel & tourism, hotel industry, real estate, insurance and financial consultancies in the state.
It has emerged as a key hub for IT and ITeS industries, including software, captive Business Process Outsourcing (BPO) and electronics. It is also a leading agricultural state in the country and is among the top producers of major agricultural items including wheat, rice and sugarcane. The state has a large base of skilled labour, making it an ideal destination for knowledge-based sectors. The presence of large pool of semi-skilled and un-skilled labour adds to the advantages of doing business here.
Ranked among the first few states to have successfully implemented ‘education for all’ policy, the state has made investments towards enhancing the standard of education across different levels. It has a good presence of private players in the education sector. Uttar Pradesh has more than 30 universities, more than 3,000 colleges and several polytechnics, engineering colleges and industrial training institutes currently.
Universities and University Level Institutes
23 state universities, 18 private universities, 10 deemed universities and 4 central universities characterize the higher education landscape of the state. In addition to these universities, there are 4 Institutes of National Importance located in the state. Overall, Uttar Pradesh has 60 university and university level institutions, which constitutes 9.75% of all the university and university level institutions in the country. It is the only state to have 4 central universities along with the Union Territory of Delhi, thereby making it one of the prominent centres for higher education in the country. The 23 state universities offer general studies at undergraduate and postgraduate level as well as specializations in agriculture, medicine, legal studies, and disability studies, technology, management, local & foreign languages &dentistry.
Table 1: Distribution of Universities & University Level Institutions at State & National Level
Type of University Uttar Pradesh
(2011-12) India
(2011-12)
State University 23 285
Private University 18 112
Institutions of National Importance 4 39
Deemed University 10 129
Central University 4 40
Total 59 605 Source: UGC
Prestigious autonomous institutes are present in the state like the Indian Institute of Technology (IIT), Kanpur; the Indian Institute of Technology (BHU) in Varanasi, the Indian Institute of Management (IIM) in Lucknow, the Indian Institute of Information Technology (IIIT) and the Motilal Nehru National
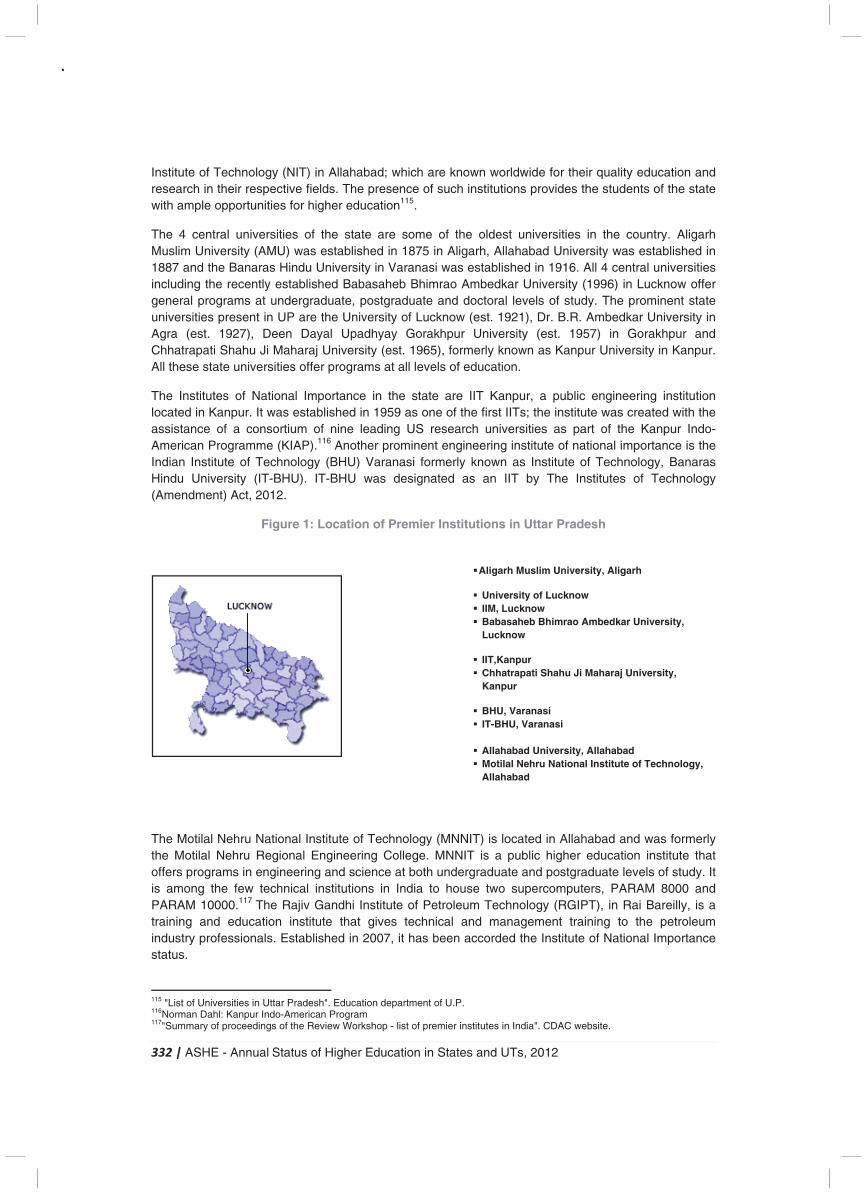
332 | ASHE - Annual Status of Higher Education in States and UTs, 2012
Institute of Technology (NIT) in Allahabad; which are known worldwide for their quality education and research in their respective fields. The presence of such institutions provides the students of the state with ample opportunities for higher education115.
The 4 central universities of the state are some of the oldest universities in the country. Aligarh Muslim University (AMU) was established in 1875 in Aligarh, Allahabad University was established in 1887 and the Banaras Hindu University in Varanasi was established in 1916. All 4 central universities including the recently established Babasaheb Bhimrao Ambedkar University (1996) in Lucknow offer general programs at undergraduate, postgraduate and doctoral levels of study. The prominent state universities present in UP are the University of Lucknow (est. 1921), Dr. B.R. Ambedkar University in Agra (est. 1927), Deen Dayal Upadhyay Gorakhpur University (est. 1957) in Gorakhpur and Chhatrapati Shahu Ji Maharaj University (est. 1965), formerly known as Kanpur University in Kanpur. All these state universities offer programs at all levels of education.
The Institutes of National Importance in the state are IIT Kanpur, a public engineering institution located in Kanpur. It was established in 1959 as one of the first IITs; the institute was created with the assistance of a consortium of nine leading US research universities as part of the Kanpur Indo-American Programme (KIAP).116 Another prominent engineering institute of national importance is the Indian Institute of Technology (BHU) Varanasi formerly known as Institute of Technology, Banaras Hindu University (IT-BHU). IT-BHU was designated as an IIT by The Institutes of Technology (Amendment) Act, 2012.
Figure 1: Location of Premier Institutions in Uttar Pradesh
The Motilal Nehru National Institute of Technology (MNNIT) is located in Allahabad and was formerly the Motilal Nehru Regional Engineering College. MNNIT is a public higher education institute that offers programs in engineering and science at both undergraduate and postgraduate levels of study. It is among the few technical institutions in India to house two supercomputers, PARAM 8000 and PARAM 10000.117 The Rajiv Gandhi Institute of Petroleum Technology (RGIPT), in Rai Bareilly, is a training and education institute that gives technical and management training to the petroleum industry professionals. Established in 2007, it has been accorded the Institute of National Importance status.
115 "List of Universities in Uttar Pradesh". Education department of U.P. 116Norman Dahl: Kanpur Indo-American Program 117"Summary of proceedings of the Review Workshop - list of premier institutes in India". CDAC website.
� Aligarh Muslim University, Aligarh
� University of Lucknow � IIM, Lucknow � Babasaheb Bhimrao Ambedkar University,
Lucknow
� IIT,Kanpur � Chhatrapati Shahu Ji Maharaj University,
Kanpur
� BHU, Varanasi � IT-BHU, Varanasi � Allahabad University, Allahabad � Motilal Nehru National Institute of Technology,
Allahabad
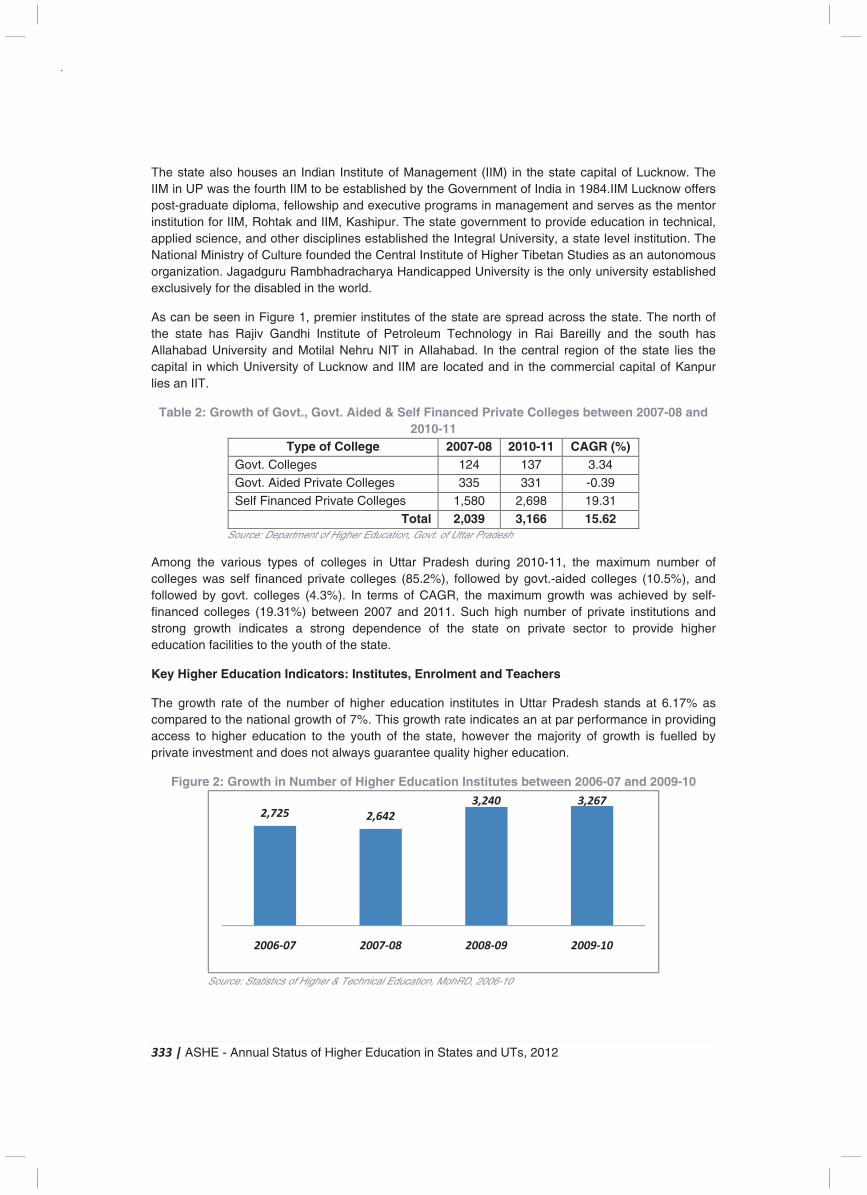
333 | ASHE - Annual Status of Higher Education in States and UTs, 2012
The state also houses an Indian Institute of Management (IIM) in the state capital of Lucknow. The IIM in UP was the fourth IIM to be established by the Government of India in 1984.IIM Lucknow offers post-graduate diploma, fellowship and executive programs in management and serves as the mentor institution for IIM, Rohtak and IIM, Kashipur. The state government to provide education in technical, applied science, and other disciplines established the Integral University, a state level institution. The National Ministry of Culture founded the Central Institute of Higher Tibetan Studies as an autonomous organization. Jagadguru Rambhadracharya Handicapped University is the only university established exclusively for the disabled in the world.
As can be seen in Figure 1, premier institutes of the state are spread across the state. The north of the state has Rajiv Gandhi Institute of Petroleum Technology in Rai Bareilly and the south has Allahabad University and Motilal Nehru NIT in Allahabad. In the central region of the state lies the capital in which University of Lucknow and IIM are located and in the commercial capital of Kanpur lies an IIT.
Table 2: Growth of Govt., Govt. Aided & Self Financed Private Colleges between 2007-08 and 2010-11
Type of College 2007-08 2010-11 CAGR (%) Govt. Colleges 124 137 3.34 Govt. Aided Private Colleges 335 331 -0.39
Self Financed Private Colleges 1,580 2,698 19.31
Total 2,039 3,166 15.62 Source: Department of Higher Education, Govt. of Uttar Pradesh
Among the various types of colleges in Uttar Pradesh during 2010-11, the maximum number of colleges was self financed private colleges (85.2%), followed by govt.-aided colleges (10.5%), and followed by govt. colleges (4.3%). In terms of CAGR, the maximum growth was achieved by self-financed colleges (19.31%) between 2007 and 2011. Such high number of private institutions and strong growth indicates a strong dependence of the state on private sector to provide higher education facilities to the youth of the state.
Key Higher Education Indicators: Institutes, Enrolment and Teachers
The growth rate of the number of higher education institutes in Uttar Pradesh stands at 6.17% as compared to the national growth of 7%. This growth rate indicates an at par performance in providing access to higher education to the youth of the state, however the majority of growth is fuelled by private investment and does not always guarantee quality higher education.
Figure 2: Growth in Number of Higher Education Institutes between 2006-07 and 2009-10
Source: Statistics of Higher & Technical Education, MohRD, 2006-10
CAGR 6.17%
2,725 2,642
3,240 3,267
2006-07 2007-08 2008-09 2009-10
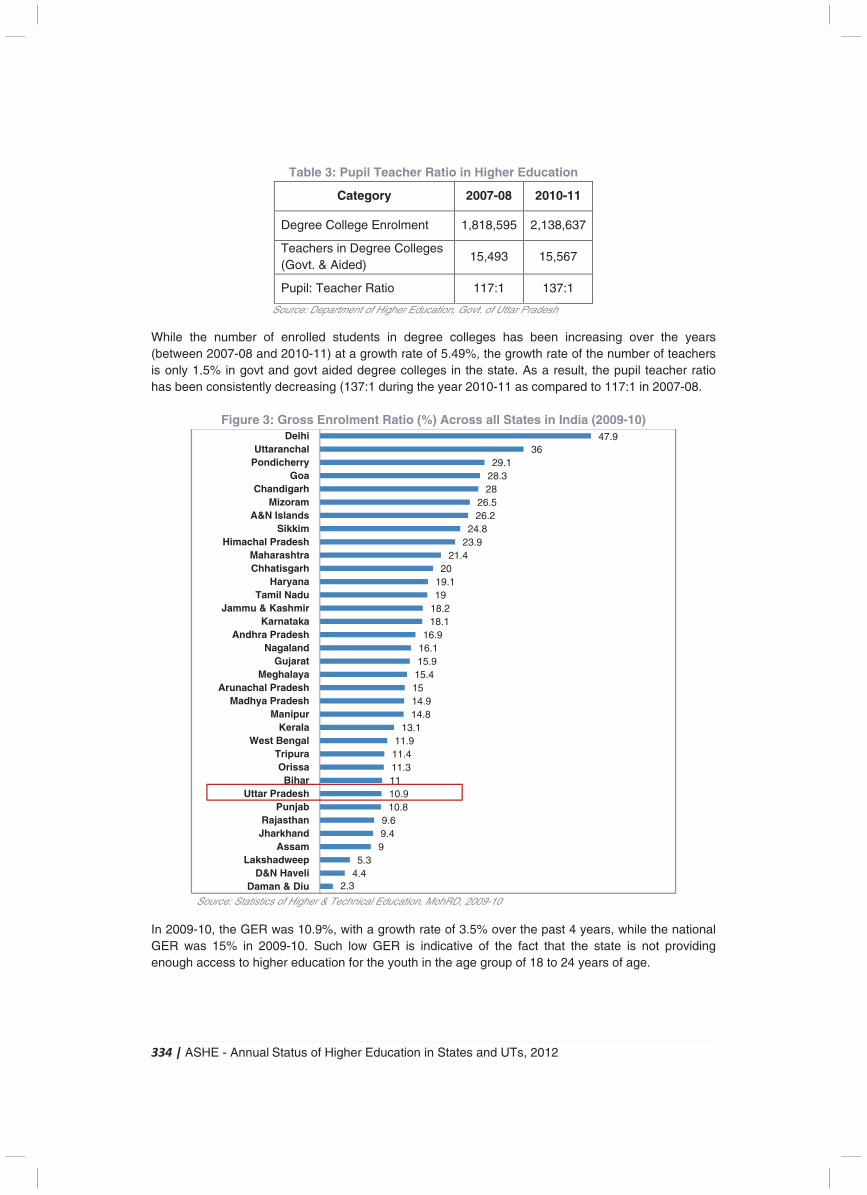
334 | ASHE - Annual Status of Higher Education in States and UTs, 2012
Table 3: Pupil Teacher Ratio in Higher Education
Category 2007-08 2010-11
Degree College Enrolment 1,818,595 2,138,637
Teachers in Degree Colleges (Govt. & Aided)
15,493 15,567
Pupil: Teacher Ratio 117:1 137:1
Source: Department of Higher Education, Govt. of Uttar Pradesh
While the number of enrolled students in degree colleges has been increasing over the years (between 2007-08 and 2010-11) at a growth rate of 5.49%, the growth rate of the number of teachers is only 1.5% in govt and govt aided degree colleges in the state. As a result, the pupil teacher ratio has been consistently decreasing (137:1 during the year 2010-11 as compared to 117:1 in 2007-08.
Figure 3: Gross Enrolment Ratio (%) Across all States in India (2009-10)
Source: Statistics of Higher & Technical Education, MohRD, 2009-10
In 2009-10, the GER was 10.9%, with a growth rate of 3.5% over the past 4 years, while the national GER was 15% in 2009-10. Such low GER is indicative of the fact that the state is not providing enough access to higher education for the youth in the age group of 18 to 24 years of age.
2.34.45.3
99.49.6
10.810.91111.311.411.9
13.114.814.91515.415.916.116.9
18.118.21919.120
21.423.924.8
26.226.5
2828.329.1
3647.9
Daman & DiuD&N Haveli
LakshadweepAssam
JharkhandRajasthan
PunjabUttar Pradesh
BiharOrissa
TripuraWest Bengal
KeralaManipur
Madhya PradeshArunachal Pradesh
MeghalayaGujarat
NagalandAndhra Pradesh
KarnatakaJammu & Kashmir
Tamil NaduHaryana
ChhatisgarhMaharashtra
Himachal PradeshSikkim
A&N IslandsMizoram
ChandigarhGoa
PondicherryUttaranchal
Delhi
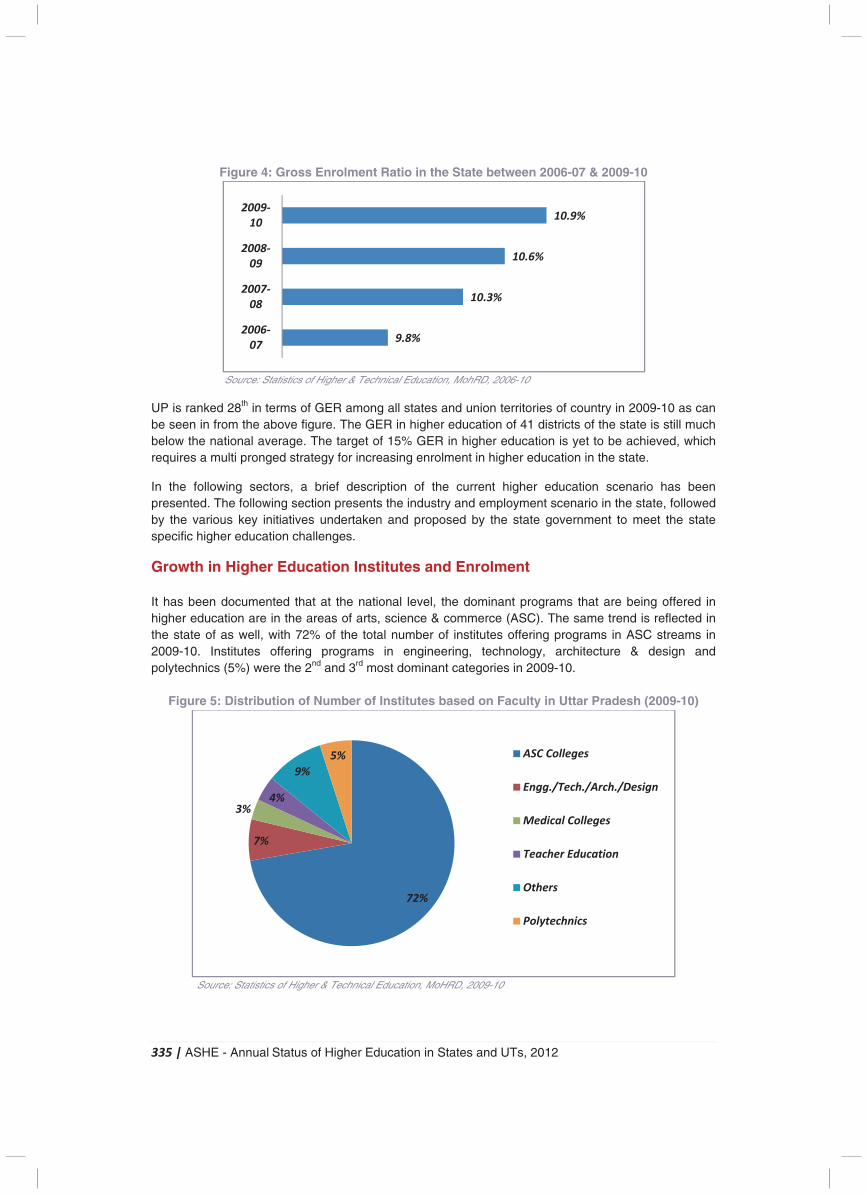
335 | ASHE - Annual Status of Higher Education in States and UTs, 2012
Figure 4: Gross Enrolment Ratio in the State between 2006-07 & 2009-10
Source: Statistics of Higher & Technical Education, MohRD, 2006-10 UP is ranked 28th in terms of GER among all states and union territories of country in 2009-10 as can be seen in from the above figure. The GER in higher education of 41 districts of the state is still much below the national average. The target of 15% GER in higher education is yet to be achieved, which requires a multi pronged strategy for increasing enrolment in higher education in the state.
In the following sectors, a brief description of the current higher education scenario has been presented. The following section presents the industry and employment scenario in the state, followed by the various key initiatives undertaken and proposed by the state government to meet the state specific higher education challenges.
Growth in Higher Education Institutes and Enrolment It has been documented that at the national level, the dominant programs that are being offered in higher education are in the areas of arts, science & commerce (ASC). The same trend is reflected in the state of as well, with 72% of the total number of institutes offering programs in ASC streams in 2009-10. Institutes offering programs in engineering, technology, architecture & design and polytechnics (5%) were the 2nd and 3rd most dominant categories in 2009-10.
Figure 5: Distribution of Number of Institutes based on Faculty in Uttar Pradesh (2009-10)
Source: Statistics of Higher & Technical Education, MoHRD, 2009-10
9.8%
10.3%
10.6%
10.9%
2006-
07
2007-
08
2008-
09
2009-
10
72%
7%
3%4%
9%
5% ASC Colleges
Engg./Tech./Arch./Design
Medical Colleges
Teacher Education
Others
Polytechnics
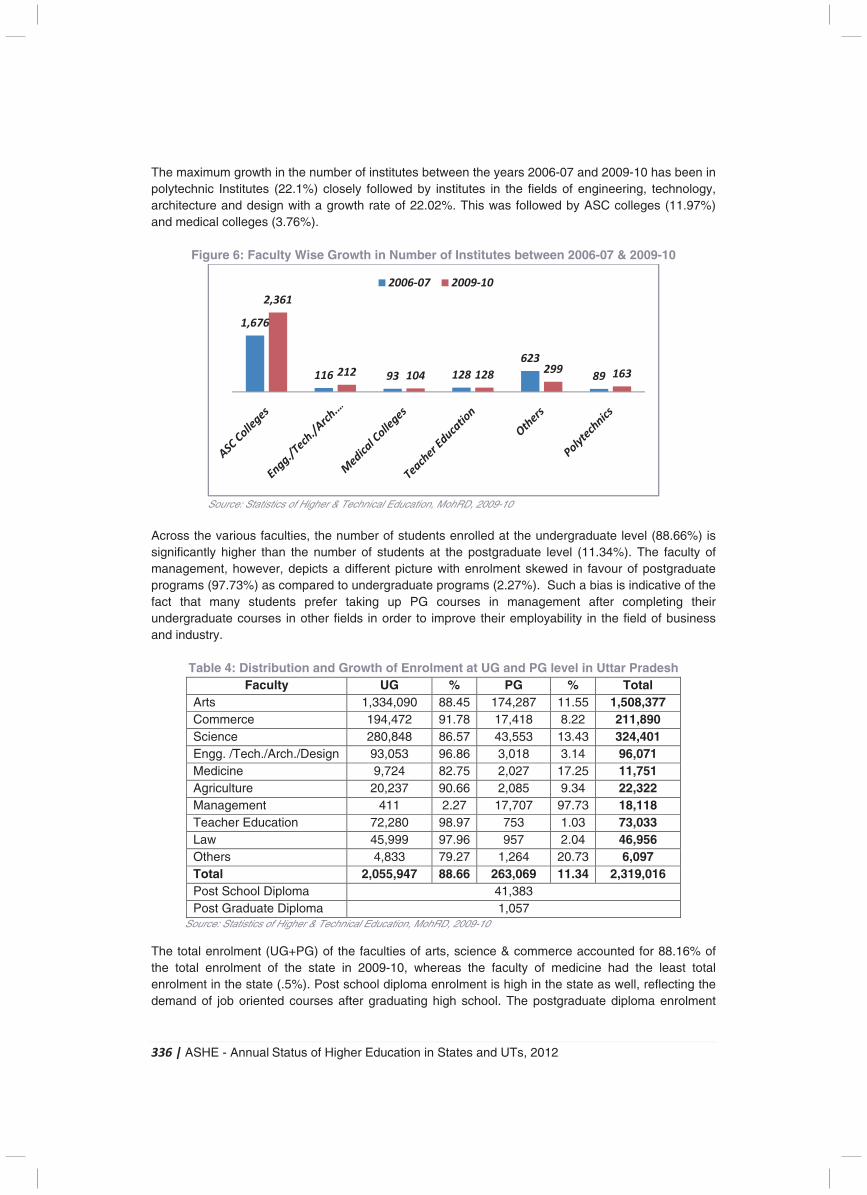
336 | ASHE - Annual Status of Higher Education in States and UTs, 2012
The maximum growth in the number of institutes between the years 2006-07 and 2009-10 has been in polytechnic Institutes (22.1%) closely followed by institutes in the fields of engineering, technology, architecture and design with a growth rate of 22.02%. This was followed by ASC colleges (11.97%) and medical colleges (3.76%).
Figure 6: Faculty Wise Growth in Number of Institutes between 2006-07 & 2009-10
Source: Statistics of Higher & Technical Education, MohRD, 2009-10
Across the various faculties, the number of students enrolled at the undergraduate level (88.66%) is significantly higher than the number of students at the postgraduate level (11.34%). The faculty of management, however, depicts a different picture with enrolment skewed in favour of postgraduate programs (97.73%) as compared to undergraduate programs (2.27%). Such a bias is indicative of the fact that many students prefer taking up PG courses in management after completing their undergraduate courses in other fields in order to improve their employability in the field of business and industry.
Table 4: Distribution and Growth of Enrolment at UG and PG level in Uttar Pradesh Faculty UG % PG % Total
Arts 1,334,090 88.45 174,287 11.55 1,508,377 Commerce 194,472 91.78 17,418 8.22 211,890 Science 280,848 86.57 43,553 13.43 324,401 Engg. /Tech./Arch./Design 93,053 96.86 3,018 3.14 96,071 Medicine 9,724 82.75 2,027 17.25 11,751 Agriculture 20,237 90.66 2,085 9.34 22,322 Management 411 2.27 17,707 97.73 18,118 Teacher Education 72,280 98.97 753 1.03 73,033 Law 45,999 97.96 957 2.04 46,956 Others 4,833 79.27 1,264 20.73 6,097 Total 2,055,947 88.66 263,069 11.34 2,319,016 Post School Diploma 41,383 Post Graduate Diploma 1,057
Source: Statistics of Higher & Technical Education, MohRD, 2009-10
The total enrolment (UG+PG) of the faculties of arts, science & commerce accounted for 88.16% of the total enrolment of the state in 2009-10, whereas the faculty of medicine had the least total enrolment in the state (.5%). Post school diploma enrolment is high in the state as well, reflecting the demand of job oriented courses after graduating high school. The postgraduate diploma enrolment
(11.97%)
(22.02%) (3.76%) (0%) (-21.51%) (22.1%)
1,676
116 93 128
623
89
2,361
212 104 128299 163
2006-07 2009-10
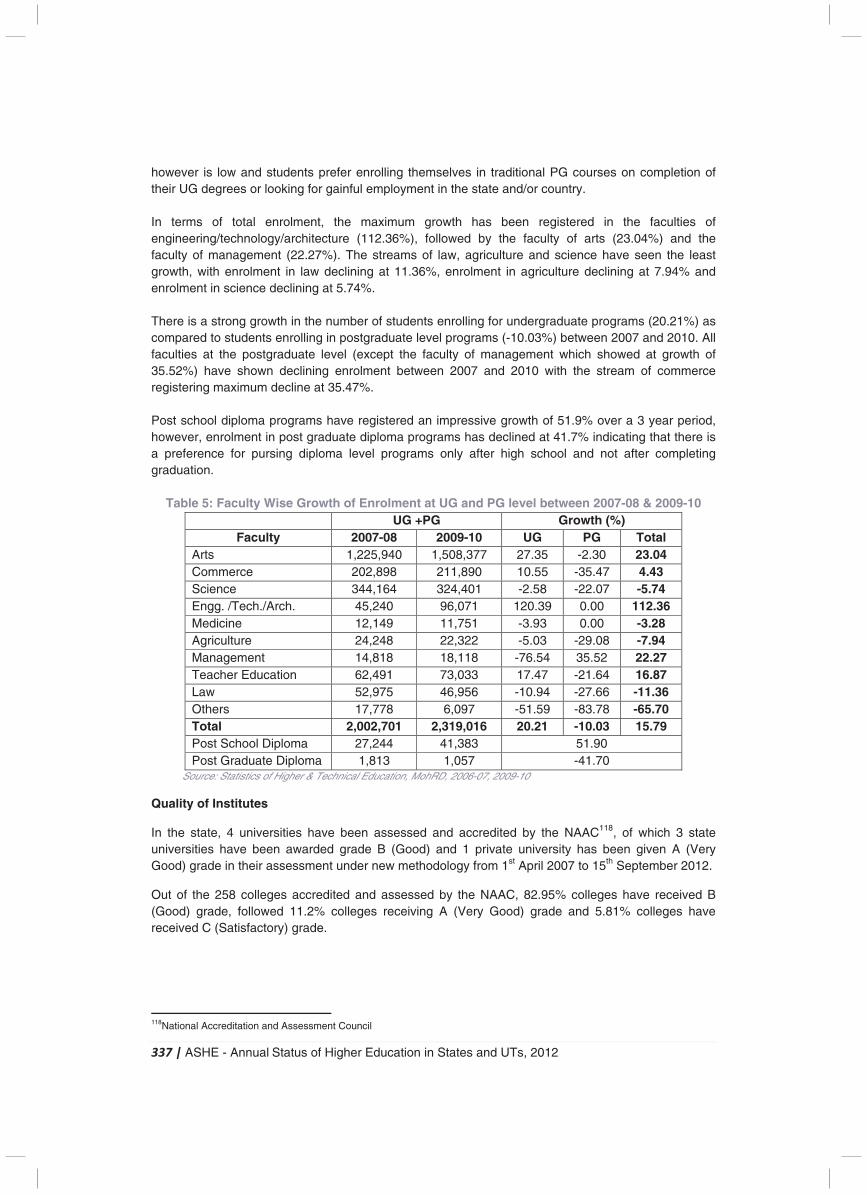
337 | ASHE - Annual Status of Higher Education in States and UTs, 2012
however is low and students prefer enrolling themselves in traditional PG courses on completion of their UG degrees or looking for gainful employment in the state and/or country. In terms of total enrolment, the maximum growth has been registered in the faculties of engineering/technology/architecture (112.36%), followed by the faculty of arts (23.04%) and the faculty of management (22.27%). The streams of law, agriculture and science have seen the least growth, with enrolment in law declining at 11.36%, enrolment in agriculture declining at 7.94% and enrolment in science declining at 5.74%. There is a strong growth in the number of students enrolling for undergraduate programs (20.21%) as compared to students enrolling in postgraduate level programs (-10.03%) between 2007 and 2010. All faculties at the postgraduate level (except the faculty of management which showed at growth of 35.52%) have shown declining enrolment between 2007 and 2010 with the stream of commerce registering maximum decline at 35.47%. Post school diploma programs have registered an impressive growth of 51.9% over a 3 year period, however, enrolment in post graduate diploma programs has declined at 41.7% indicating that there is a preference for pursing diploma level programs only after high school and not after completing graduation.
Table 5: Faculty Wise Growth of Enrolment at UG and PG level between 2007-08 & 2009-10 UG +PG Growth (%)
Faculty 2007-08 2009-10 UG PG Total Arts 1,225,940 1,508,377 27.35 -2.30 23.04 Commerce 202,898 211,890 10.55 -35.47 4.43 Science 344,164 324,401 -2.58 -22.07 -5.74 Engg. /Tech./Arch. 45,240 96,071 120.39 0.00 112.36 Medicine 12,149 11,751 -3.93 0.00 -3.28 Agriculture 24,248 22,322 -5.03 -29.08 -7.94 Management 14,818 18,118 -76.54 35.52 22.27 Teacher Education 62,491 73,033 17.47 -21.64 16.87 Law 52,975 46,956 -10.94 -27.66 -11.36 Others 17,778 6,097 -51.59 -83.78 -65.70 Total 2,002,701 2,319,016 20.21 -10.03 15.79 Post School Diploma 27,244 41,383 51.90 Post Graduate Diploma 1,813 1,057 -41.70
Source: Statistics of Higher & Technical Education, MohRD, 2006-07, 2009-10
Quality of Institutes
In the state, 4 universities have been assessed and accredited by the NAAC118, of which 3 state universities have been awarded grade B (Good) and 1 private university has been given A (Very Good) grade in their assessment under new methodology from 1st April 2007 to 15th September 2012.
Out of the 258 colleges accredited and assessed by the NAAC, 82.95% colleges have received B (Good) grade, followed 11.2% colleges receiving A (Very Good) grade and 5.81% colleges have received C (Satisfactory) grade.
118National Accreditation and Assessment Council
338 | ASHE - Annual Status of Higher Education in States and UTs, 2012
Industry and Employment Scenario
Key Industries119
The resources, policy incentives, infrastructure and climate in Uttar Pradesh are ideally suited for investments in sectors such as IT, sugar, auto components, petrochemicals & fertilizers, electronics, consumer goods and manufacturing. The state government has set up the “Udyog Bandhu” to facilitate investment in industrial and service sectors. The government of Uttar Pradesh is promoting the development of several Special Economic Zones (SEZs) across the state, such as IT and ITeS, electronic hardware and software, handicrafts and agro-based industries. Presented in the following section is a brief description of some of the major industries of the state.
1. IT � The driving factors of IT and ITeS industry in the state are infrastructural facilities in areas
such as Noida and Greater Noida, the proximity to Delhi and the easy availability of manpower. There are five operational SEZs in Noida and Greater Noida, of which three are primarily, dedicated to IT/ITeS industries.
� Some of the key IT players in the state are Birlasoft, HCL Technologies, EXL and NIIT Technologies.
2. Sugar � Uttar Pradesh is the largest producer of sugarcane in India. The state contributed 40% to
the country’s total sugarcane production during 2010. � Bajaj Hindustan Limited, one of the largest sugar producers in the country has its plants in
Uttar Pradesh.
3. Auto & Auto Components � One of the country’s auto-clusters is located in Delhi-Gurgaon-Noida-Ghaziabad, part of
which is situated in Western Uttar Pradesh. A number of original equipment manufacturers and auto component suppliers are located at Noida and Ghaziabad.
� Some of the major Auto & Auto Component suppliers in the state are ANG Auto Ltd, Honda Siel Cars Ltd, Delphi and Motherson Sumi Systems Ltd.
4. Petroleum, Chemicals and Fertilizers
� Uttar Pradesh is one of the largest consumers of fertilisers in India, owing to its large size and agricultural activities.
� Apart from fertilisers, a number of manufacturing units spanning petroleum (Indian Oil), gas (GAIL), basic chemicals (Tata Chemicals) and paint (Kansai Nerolac) are located in the state.
5. Electronics
� The major incentives for the companies are the industrial infrastructure and access to consumer markets of Uttar Pradesh and National Capital Region. Majority of the companies are located in Noida and Ghaziabad.
� A number of major multinational companies such as LG Electronics, Samsung and Xerox have their operations in the state.
6. Consumer Goods
119India Brand Equity Foundation – State report on Uttar Pradesh
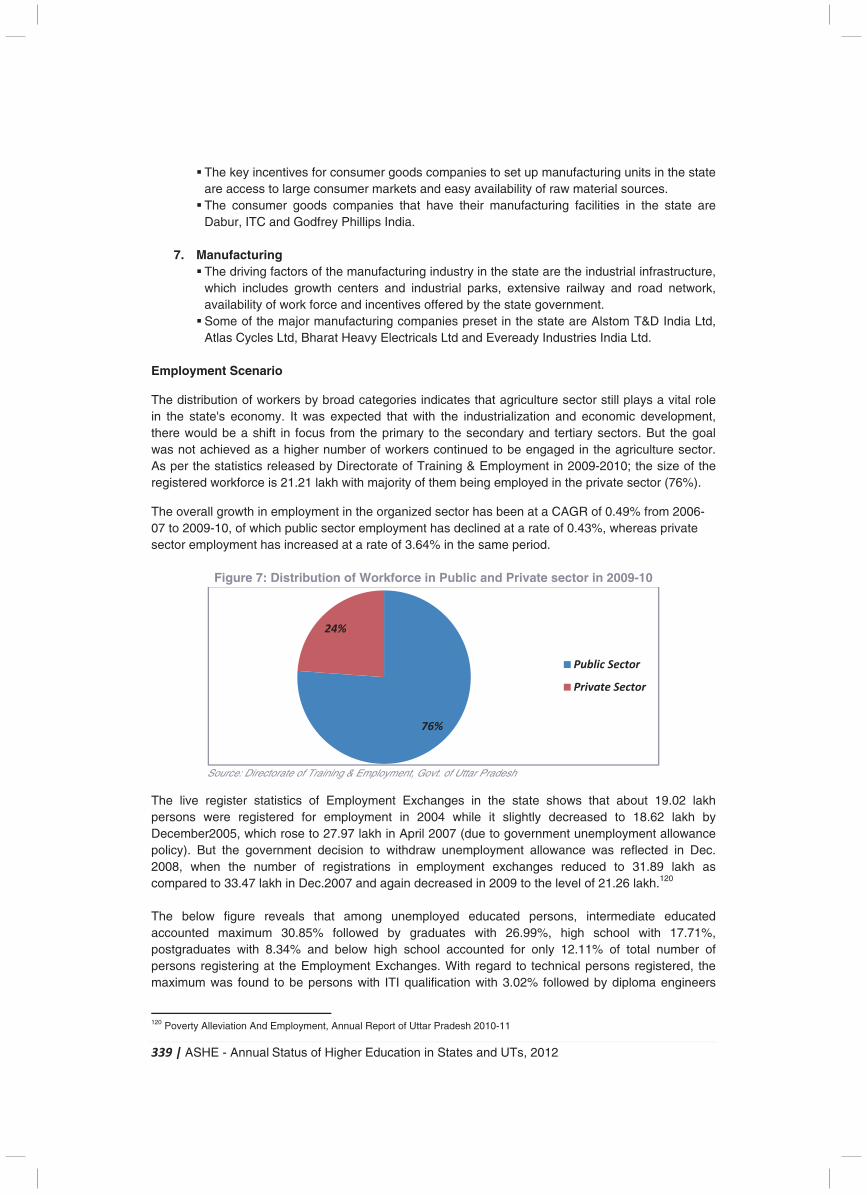
339 | ASHE - Annual Status of Higher Education in States and UTs, 2012
� The key incentives for consumer goods companies to set up manufacturing units in the state are access to large consumer markets and easy availability of raw material sources.
� The consumer goods companies that have their manufacturing facilities in the state are Dabur, ITC and Godfrey Phillips India.
7. Manufacturing
� The driving factors of the manufacturing industry in the state are the industrial infrastructure, which includes growth centers and industrial parks, extensive railway and road network, availability of work force and incentives offered by the state government.
� Some of the major manufacturing companies preset in the state are Alstom T&D India Ltd, Atlas Cycles Ltd, Bharat Heavy Electricals Ltd and Eveready Industries India Ltd.
Employment Scenario
The distribution of workers by broad categories indicates that agriculture sector still plays a vital role in the state's economy. It was expected that with the industrialization and economic development, there would be a shift in focus from the primary to the secondary and tertiary sectors. But the goal was not achieved as a higher number of workers continued to be engaged in the agriculture sector. As per the statistics released by Directorate of Training & Employment in 2009-2010; the size of the registered workforce is 21.21 lakh with majority of them being employed in the private sector (76%).
The overall growth in employment in the organized sector has been at a CAGR of 0.49% from 2006-07 to 2009-10, of which public sector employment has declined at a rate of 0.43%, whereas private sector employment has increased at a rate of 3.64% in the same period.
Figure 7: Distribution of Workforce in Public and Private sector in 2009-10
Source: Directorate of Training & Employment, Govt. of Uttar Pradesh
The live register statistics of Employment Exchanges in the state shows that about 19.02 lakh persons were registered for employment in 2004 while it slightly decreased to 18.62 lakh by December2005, which rose to 27.97 lakh in April 2007 (due to government unemployment allowance policy). But the government decision to withdraw unemployment allowance was reflected in Dec. 2008, when the number of registrations in employment exchanges reduced to 31.89 lakh as compared to 33.47 lakh in Dec.2007 and again decreased in 2009 to the level of 21.26 lakh.120 The below figure reveals that among unemployed educated persons, intermediate educated accounted maximum 30.85% followed by graduates with 26.99%, high school with 17.71%, postgraduates with 8.34% and below high school accounted for only 12.11% of total number of persons registering at the Employment Exchanges. With regard to technical persons registered, the maximum was found to be persons with ITI qualification with 3.02% followed by diploma engineers
120 Poverty Alleviation And Employment, Annual Report of Uttar Pradesh 2010-11
76%
24%
Public Sector
Private Sector
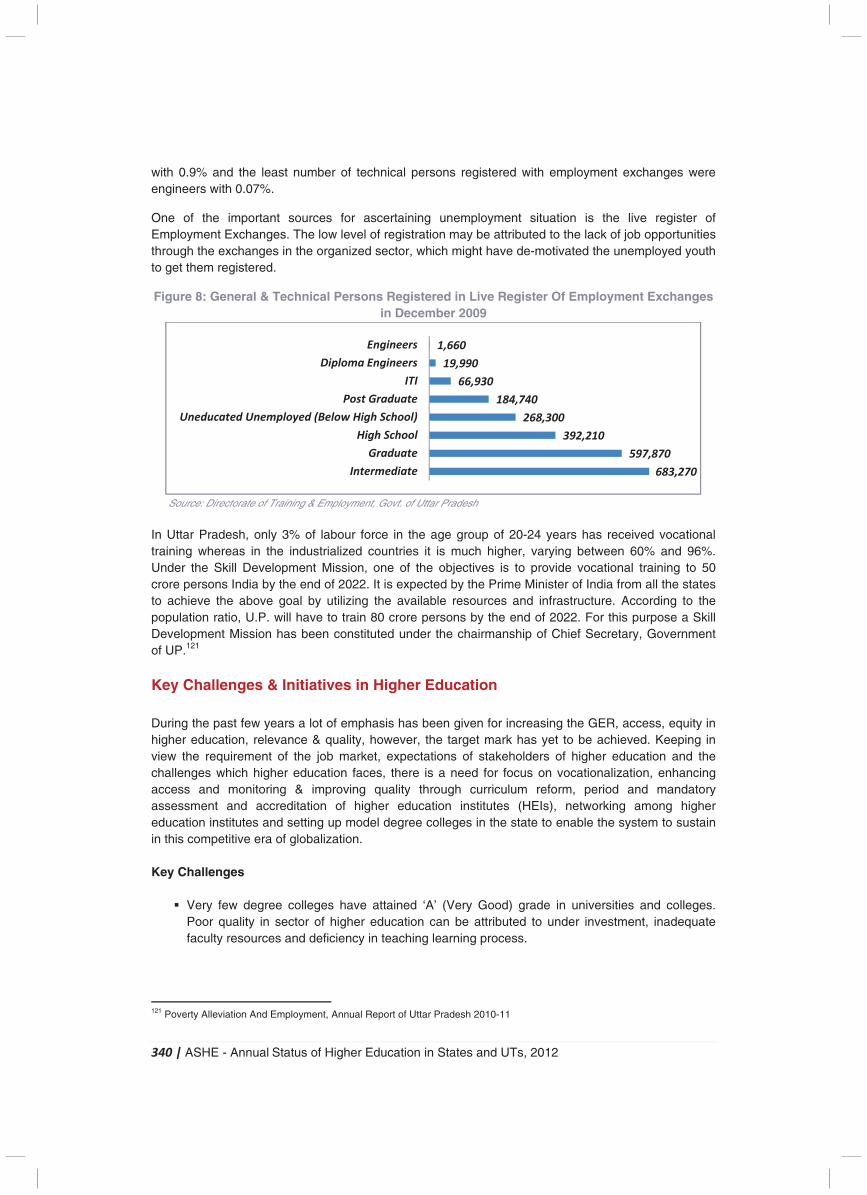
340 | ASHE - Annual Status of Higher Education in States and UTs, 2012
with 0.9% and the least number of technical persons registered with employment exchanges were engineers with 0.07%.
One of the important sources for ascertaining unemployment situation is the live register of Employment Exchanges. The low level of registration may be attributed to the lack of job opportunities through the exchanges in the organized sector, which might have de-motivated the unemployed youth to get them registered.
Figure 8: General & Technical Persons Registered in Live Register Of Employment Exchanges in December 2009
Source: Directorate of Training & Employment, Govt. of Uttar Pradesh In Uttar Pradesh, only 3% of labour force in the age group of 20-24 years has received vocational training whereas in the industrialized countries it is much higher, varying between 60% and 96%. Under the Skill Development Mission, one of the objectives is to provide vocational training to 50 crore persons India by the end of 2022. It is expected by the Prime Minister of India from all the states to achieve the above goal by utilizing the available resources and infrastructure. According to the population ratio, U.P. will have to train 80 crore persons by the end of 2022. For this purpose a Skill Development Mission has been constituted under the chairmanship of Chief Secretary, Government of UP.121
Key Challenges & Initiatives in Higher Education During the past few years a lot of emphasis has been given for increasing the GER, access, equity in higher education, relevance & quality, however, the target mark has yet to be achieved. Keeping in view the requirement of the job market, expectations of stakeholders of higher education and the challenges which higher education faces, there is a need for focus on vocationalization, enhancing access and monitoring & improving quality through curriculum reform, period and mandatory assessment and accreditation of higher education institutes (HEIs), networking among higher education institutes and setting up model degree colleges in the state to enable the system to sustain in this competitive era of globalization. Key Challenges
� Very few degree colleges have attained ‘A’ (Very Good) grade in universities and colleges. Poor quality in sector of higher education can be attributed to under investment, inadequate faculty resources and deficiency in teaching learning process.
121 Poverty Alleviation And Employment, Annual Report of Uttar Pradesh 2010-11
683,270
597,870
392,210
268,300
184,740
66,930
19,990
1,660
Intermediate
Graduate
High School
Uneducated Unemployed (Below High School)
Post Graduate
ITI
Diploma Engineers
Engineers
341 | ASHE - Annual Status of Higher Education in States and UTs, 2012
� Shortage of faculty members have been a major deterrent in implementation of academic reforms in universities and colleges like introduction of new courses, restructuring of syllabi and innovation in teaching learning processes.
� Delay in recruitment of faculty and staff force the state universities to appoint faculties on contractual and part time basis, which in turn has an adverse impact on the quality of knowledge imparted.
� The GER in higher education in 41 districts of UP is very low and much below the national average. The target of 15% GER is yet to be achieved which will require a multi pronged strategy
� Making higher education relevant to the contemporary as well as future need of society at large, while making it more inclusive by enhanced participation of underserved population is another challenge before higher education in the state.
� There are certain courses with unfilled sanctioned seats. Universities and colleges need to find out reasons and provide incentives to launch special drive including curriculum revision, introduction of skilled-based courses to enrol more students in these courses.
� While focussing on vocational and market oriented courses, it is to be ensured that such courses do not prosper at cost of humanities and social science subjects, as these disciplines are paramount for making a humane society.
� There is urgent need to raise the percentage of youth participating in higher education network in order to contribute in national progress and development.
� There is an urgent need to revise the syllabus of subjects in accordance with emerging demand.
� Infrastructure in HEIs needs urgent attention especially in the context of ICT and e-Education.
To compete successfully in the knowledge based economy, Uttar Pradesh needs higher education institutes that not only produce bright graduates for export but can also support advanced research in several scientific and scholarly fields and produce at least some of the knowledge & technology needed for an expanding economy. The vision for the 12thFive-year plan for higher education in the state is as follows. Goals in Higher Education
� To impart, disseminate and advance knowledge by quality and innovative teaching in different branches of learning.
� To support horizontal expansion and vertical growth of universities and colleges through infrastructural development and opening of new courses.
� To ensure welfare of students, faculty and staff, extend opportunities for their capacity building and professional development.
� To produce skilled human resource; employable & socially sensitive responsible citizens of the state and country.
Priorities & Objectives
� Quality & Assurance: NAAC assessment for all the institutions to be made mandatory. Stimulating research culture in higher education institutes. Incorporating ICT based teaching in all HEIs.
� Access & Equity: Equitable access and minimizing gender disparities in all HEIs in the state. � Infrastructural Development
342 | ASHE - Annual Status of Higher Education in States and UTs, 2012
Initiatives Proposed
� Development grants to universities and up gradation of basic amenities of universities. � Assistance to universities in developing centres of excellence. � Implementation of programs of National Service Scheme (NSS) � To establish 36 model government degree colleges in low GER districts encompassing minority
concentration districts and unreserved blocks. � To develop 5 model government degree colleges with state support and approved centre of
assistance. � Improve GER in 41 educationally backward districts of UP, � Infrastructure development including ICT infrastructure and basic amenities in universities and
colleges. � To fill the nearly 4,342 vacant teaching posts in universities and colleges. � Mandatory NAAC accreditation of 2,803 degree colleges. � To start B.Ed. courses within 5 years in newly established government degree colleges. � Establishment of 16 polytechnics in those districts that have no polytechnics. � To prepare curriculum of 20 new trades and revision of 52 curriculum in IRDT � The level of placement will be increased from 70% to 90% and to gain the national level GER
new courses will be started in 50 existing polytechnics. � To establish one world class IIT, centres of excellence, faculty development institutes and
placement enhancement centres. � To strengthen industry- institute interaction for better job opportunities. � To ensure availability of latest and modern equipment as per industry demand and as per new
course curriculum. � To start virtual classrooms in all government polytechnics. � Establishment of new engineering institutions and colleges at the division where government
institutions do not exist.
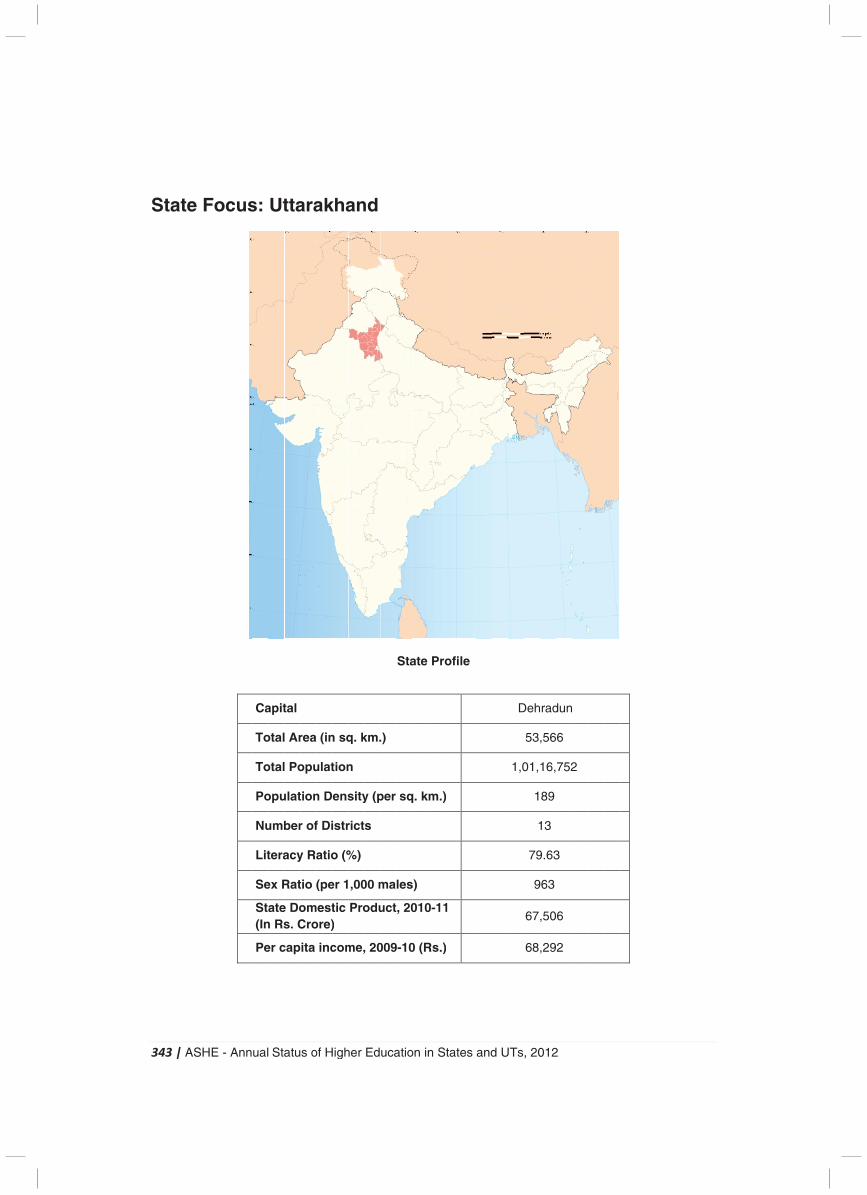
3
S
343
Sta
| A
ate
ASH
e F
HE
Fo
- A
oc
Ann
us
ual
s:
Ca
To
To
Po
Nu
Lit
Se
Sta(In
Pe
Sta
Ut
apit
otal
otal
opu
umb
tera
ex R
aten Rs
er c
atu
tta
tal
Ar
Po
ulat
ber
acy
Rat
e Dos. C
cap
s o
ara
rea
opu
tion
r of
y Ra
tio (
omCro
ita
of H
ak
(in
ulat
n D
f Di
atio
(pe
mestore)
inc
High
kha
n sq
tion
ens
istr
o (%
er 1
tic )
com
her
an
q. k
n
sity
rict
%)
,00
Pro
me,
Ed
nd
km.
y (p
s
00 m
odu
, 20
uca
.)
per
ma
uct
009
atio
Sta
sq
les
, 20
9-10
on in
ate
q. k
s)
010
0 (R
n S
Pr
m.)
0-11
Rs.)
Stat
ofi
)
1
)
es
le
and
d U
UTs
D
1,0
, 20
Deh
53
01,
1
1
79
9
67
68
012
hrad
,56
16,
89
13
9.63
963
,50
,29
2
dun
66
752
3
06
92
n
2
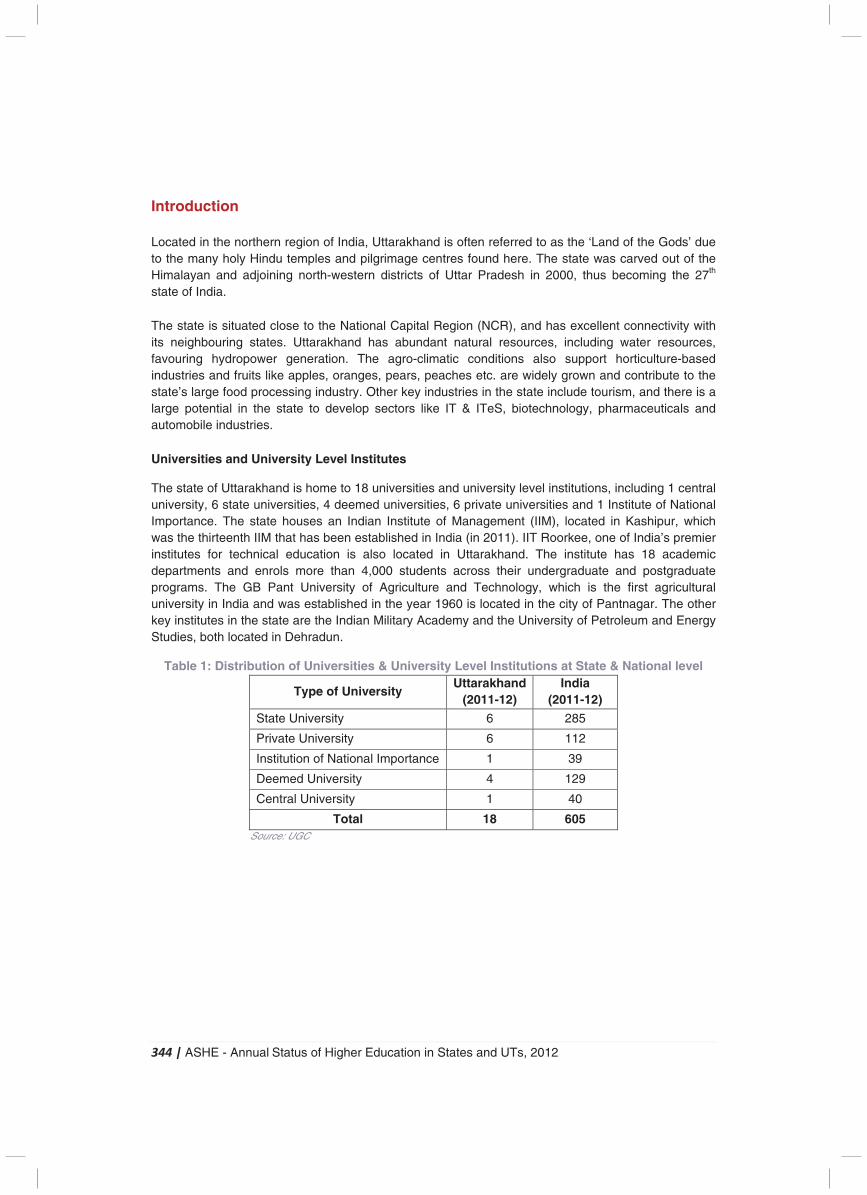
344 | ASHE - Annual Status of Higher Education in States and UTs, 2012
Introduction
Located in the northern region of India, Uttarakhand is often referred to as the ‘Land of the Gods’ due to the many holy Hindu temples and pilgrimage centres found here. The state was carved out of the Himalayan and adjoining north-western districts of Uttar Pradesh in 2000, thus becoming the 27th state of India.
The state is situated close to the National Capital Region (NCR), and has excellent connectivity with its neighbouring states. Uttarakhand has abundant natural resources, including water resources, favouring hydropower generation. The agro-climatic conditions also support horticulture-based industries and fruits like apples, oranges, pears, peaches etc. are widely grown and contribute to the state’s large food processing industry. Other key industries in the state include tourism, and there is a large potential in the state to develop sectors like IT & ITeS, biotechnology, pharmaceuticals and automobile industries.
Universities and University Level Institutes
The state of Uttarakhand is home to 18 universities and university level institutions, including 1 central university, 6 state universities, 4 deemed universities, 6 private universities and 1 Institute of National Importance. The state houses an Indian Institute of Management (IIM), located in Kashipur, which was the thirteenth IIM that has been established in India (in 2011). IIT Roorkee, one of India’s premier institutes for technical education is also located in Uttarakhand. The institute has 18 academic departments and enrols more than 4,000 students across their undergraduate and postgraduate programs. The GB Pant University of Agriculture and Technology, which is the first agricultural university in India and was established in the year 1960 is located in the city of Pantnagar. The other key institutes in the state are the Indian Military Academy and the University of Petroleum and Energy Studies, both located in Dehradun.
Table 1: Distribution of Universities & University Level Institutions at State & National level
Type of University Uttarakhand
(2011-12) India
(2011-12)
State University 6 285
Private University 6 112
Institution of National Importance 1 39
Deemed University 4 129
Central University 1 40
Total 18 605 Source: UGC
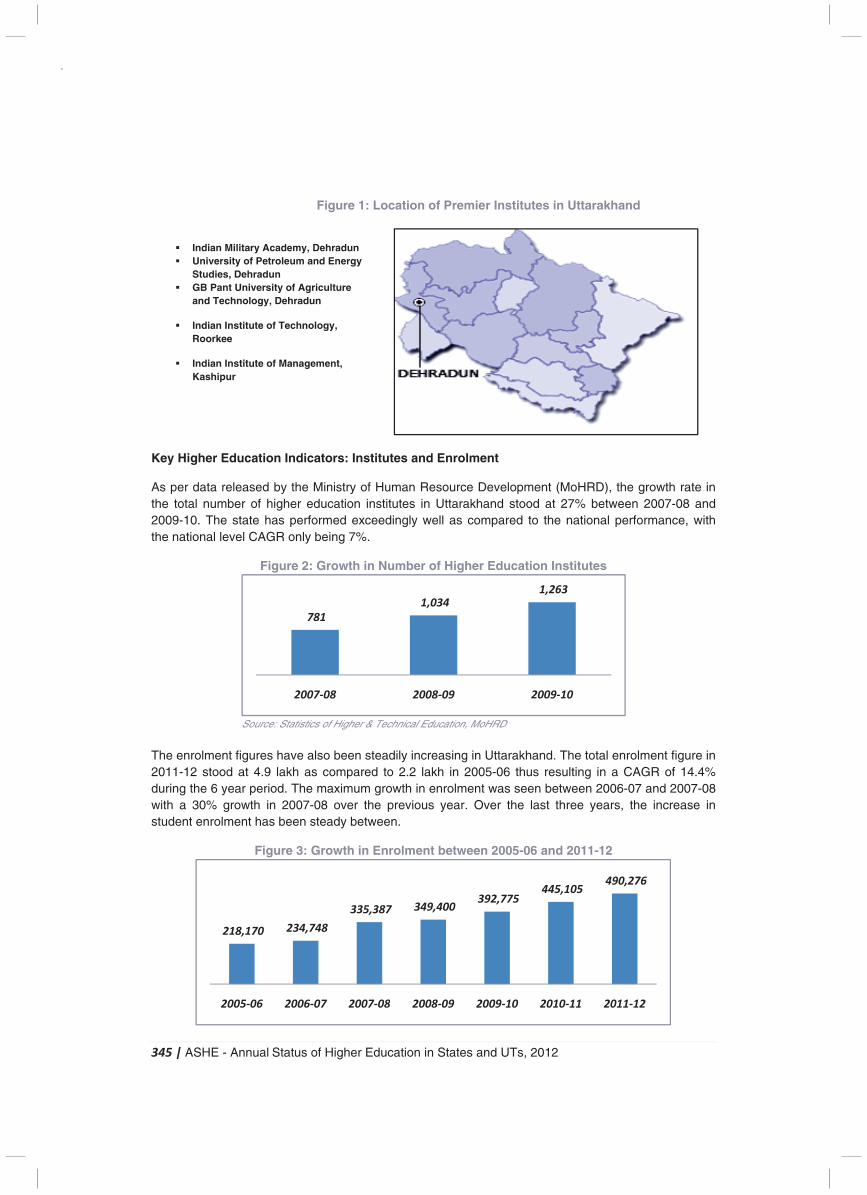
345 | ASHE - Annual Status of Higher Education in States and UTs, 2012
Figure 1: Location of Premier Institutes in Uttarakhand
Key Higher Education Indicators: Institutes and Enrolment
As per data released by the Ministry of Human Resource Development (MoHRD), the growth rate in the total number of higher education institutes in Uttarakhand stood at 27% between 2007-08 and 2009-10. The state has performed exceedingly well as compared to the national performance, with the national level CAGR only being 7%.
Figure 2: Growth in Number of Higher Education Institutes
Source: Statistics of Higher & Technical Education, MoHRD
The enrolment figures have also been steadily increasing in Uttarakhand. The total enrolment figure in 2011-12 stood at 4.9 lakh as compared to 2.2 lakh in 2005-06 thus resulting in a CAGR of 14.4% during the 6 year period. The maximum growth in enrolment was seen between 2006-07 and 2007-08 with a 30% growth in 2007-08 over the previous year. Over the last three years, the increase in student enrolment has been steady between.
Figure 3: Growth in Enrolment between 2005-06 and 2011-12
� Indian Military Academy, Dehradun � University of Petroleum and Energy
Studies, Dehradun � GB Pant University of Agriculture
and Technology, Dehradun
� Indian Institute of Technology, Roorkee
� Indian Institute of Management, Kashipur
781
1,034
1,263
2007-08 2008-09 2009-10
218,170 234,748
335,387 349,400 392,775
445,105 490,276
2005-06 2006-07 2007-08 2008-09 2009-10 2010-11 2011-12
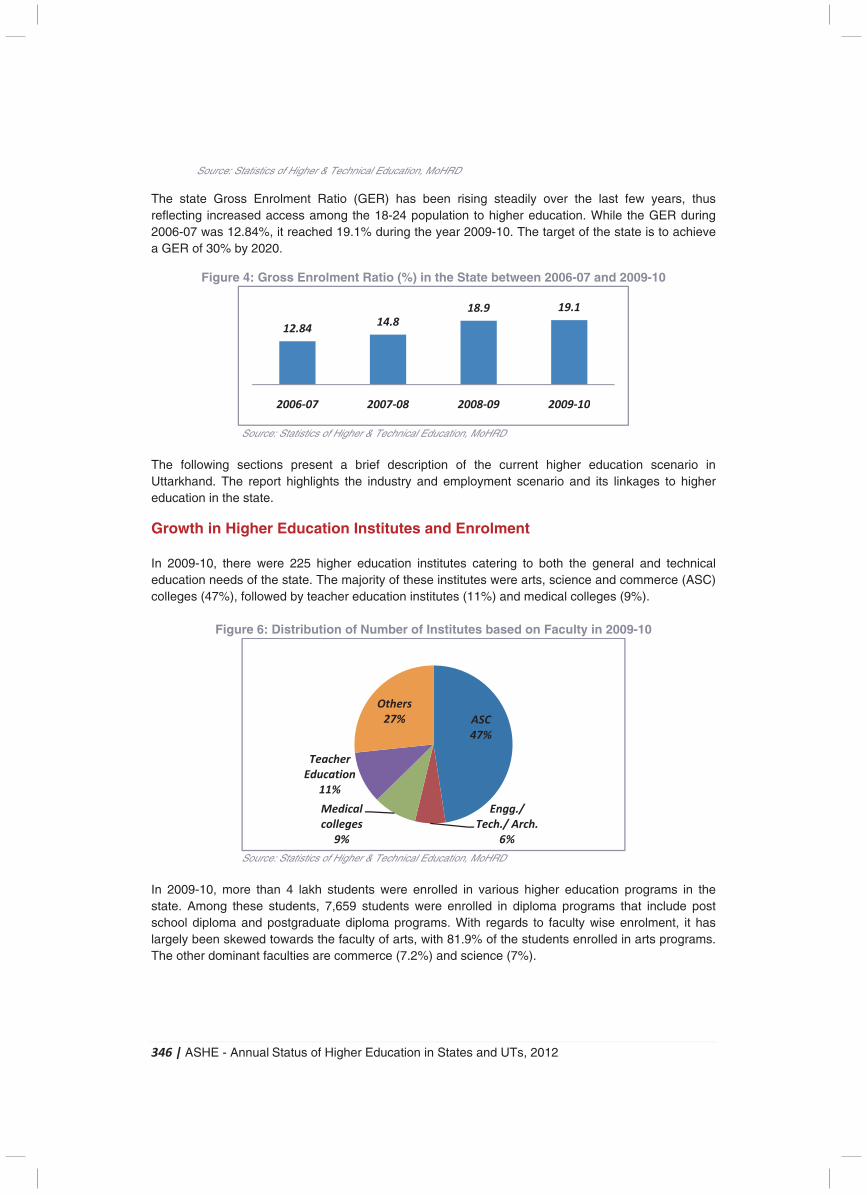
346 | ASHE - Annual Status of Higher Education in States and UTs, 2012
Source: Statistics of Higher & Technical Education, MoHRD
The state Gross Enrolment Ratio (GER) has been rising steadily over the last few years, thus reflecting increased access among the 18-24 population to higher education. While the GER during 2006-07 was 12.84%, it reached 19.1% during the year 2009-10. The target of the state is to achieve a GER of 30% by 2020.
Figure 4: Gross Enrolment Ratio (%) in the State between 2006-07 and 2009-10
Source: Statistics of Higher & Technical Education, MoHRD
The following sections present a brief description of the current higher education scenario in Uttarkhand. The report highlights the industry and employment scenario and its linkages to higher education in the state.
Growth in Higher Education Institutes and Enrolment In 2009-10, there were 225 higher education institutes catering to both the general and technical education needs of the state. The majority of these institutes were arts, science and commerce (ASC) colleges (47%), followed by teacher education institutes (11%) and medical colleges (9%).
Figure 6: Distribution of Number of Institutes based on Faculty in 2009-10
Source: Statistics of Higher & Technical Education, MoHRD
In 2009-10, more than 4 lakh students were enrolled in various higher education programs in the state. Among these students, 7,659 students were enrolled in diploma programs that include post school diploma and postgraduate diploma programs. With regards to faculty wise enrolment, it has largely been skewed towards the faculty of arts, with 81.9% of the students enrolled in arts programs. The other dominant faculties are commerce (7.2%) and science (7%).
12.8414.8
18.9 19.1
2006-07 2007-08 2008-09 2009-10
ASC
47%
Engg./
Tech./ Arch.
6%
Medical
colleges
9%
Teacher
Education
11%
Others
27%
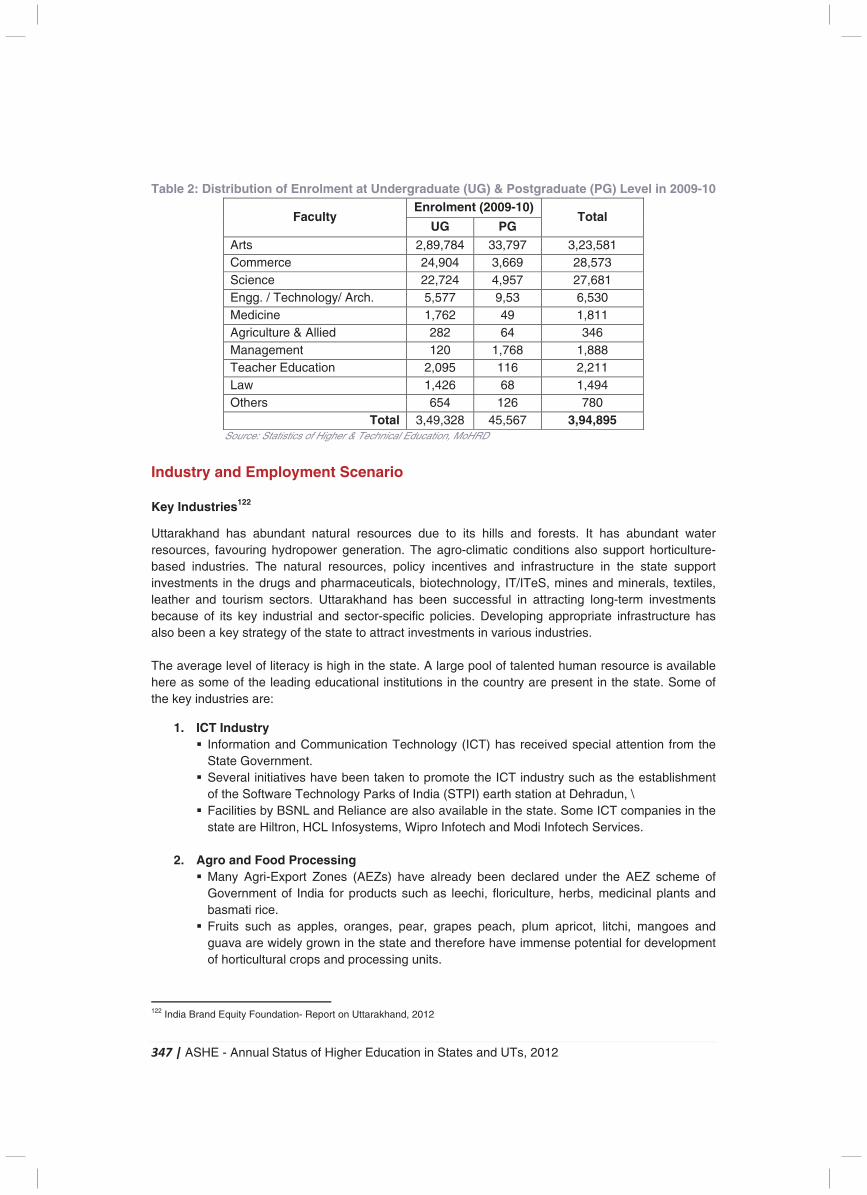
347 | ASHE - Annual Status of Higher Education in States and UTs, 2012
Table 2: Distribution of Enrolment at Undergraduate (UG) & Postgraduate (PG) Level in 2009-10
Faculty Enrolment (2009-10)
Total UG PG
Arts 2,89,784 33,797 3,23,581 Commerce 24,904 3,669 28,573 Science 22,724 4,957 27,681 Engg. / Technology/ Arch. 5,577 9,53 6,530 Medicine 1,762 49 1,811 Agriculture & Allied 282 64 346 Management 120 1,768 1,888 Teacher Education 2,095 116 2,211 Law 1,426 68 1,494 Others 654 126 780
Total 3,49,328 45,567 3,94,895 Source: Statistics of Higher & Technical Education, MoHRD
Industry and Employment Scenario Key Industries122
Uttarakhand has abundant natural resources due to its hills and forests. It has abundant water resources, favouring hydropower generation. The agro-climatic conditions also support horticulture-based industries. The natural resources, policy incentives and infrastructure in the state support investments in the drugs and pharmaceuticals, biotechnology, IT/ITeS, mines and minerals, textiles, leather and tourism sectors. Uttarakhand has been successful in attracting long-term investments because of its key industrial and sector-specific policies. Developing appropriate infrastructure has also been a key strategy of the state to attract investments in various industries. The average level of literacy is high in the state. A large pool of talented human resource is available here as some of the leading educational institutions in the country are present in the state. Some of the key industries are:
1. ICT Industry � Information and Communication Technology (ICT) has received special attention from the
State Government. � Several initiatives have been taken to promote the ICT industry such as the establishment
of the Software Technology Parks of India (STPI) earth station at Dehradun, \ � Facilities by BSNL and Reliance are also available in the state. Some ICT companies in the
state are Hiltron, HCL Infosystems, Wipro Infotech and Modi Infotech Services.
2. Agro and Food Processing � Many Agri-Export Zones (AEZs) have already been declared under the AEZ scheme of
Government of India for products such as leechi, floriculture, herbs, medicinal plants and basmati rice.
� Fruits such as apples, oranges, pear, grapes peach, plum apricot, litchi, mangoes and guava are widely grown in the state and therefore have immense potential for development of horticultural crops and processing units.
122 India Brand Equity Foundation- Report on Uttarakhand, 2012
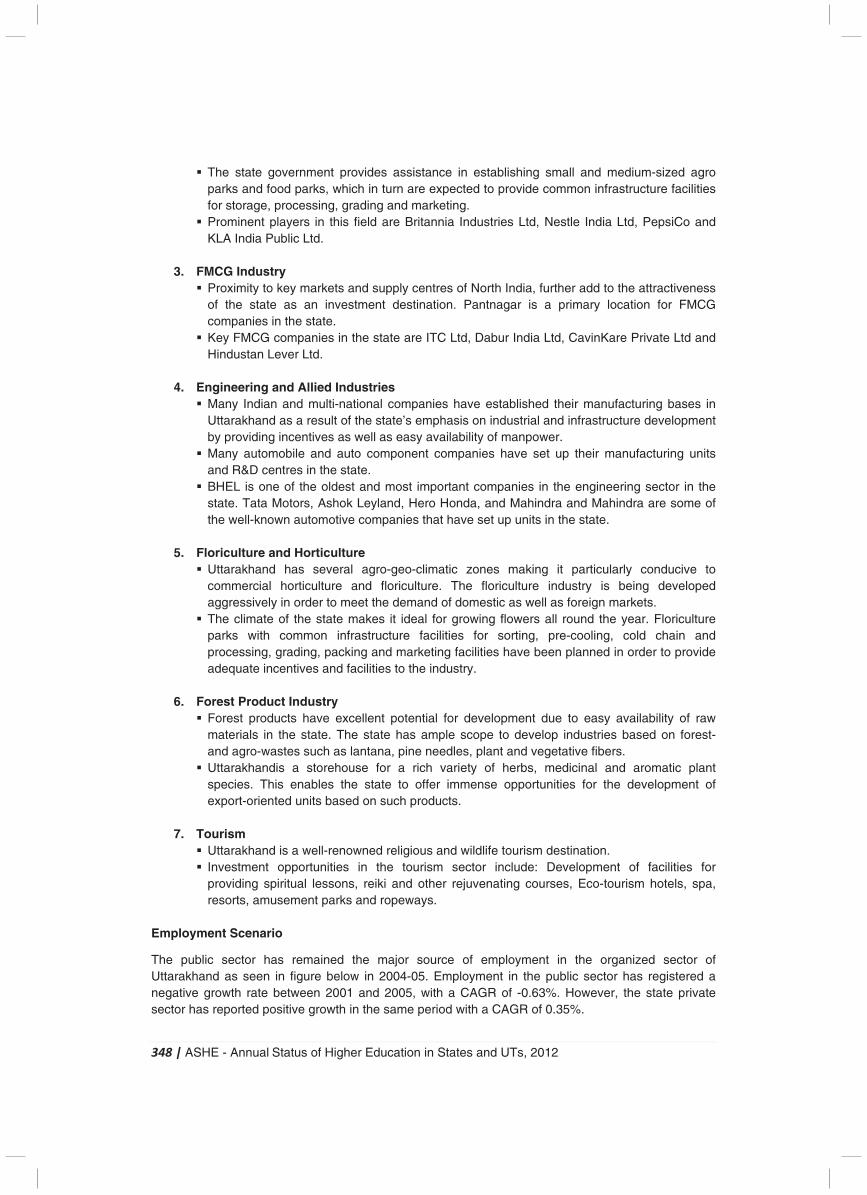
348 | ASHE - Annual Status of Higher Education in States and UTs, 2012
� The state government provides assistance in establishing small and medium-sized agro parks and food parks, which in turn are expected to provide common infrastructure facilities for storage, processing, grading and marketing.
� Prominent players in this field are Britannia Industries Ltd, Nestle India Ltd, PepsiCo and KLA India Public Ltd.
3. FMCG Industry � Proximity to key markets and supply centres of North India, further add to the attractiveness
of the state as an investment destination. Pantnagar is a primary location for FMCG companies in the state.
� Key FMCG companies in the state are ITC Ltd, Dabur India Ltd, CavinKare Private Ltd and Hindustan Lever Ltd.
4. Engineering and Allied Industries � Many Indian and multi-national companies have established their manufacturing bases in
Uttarakhand as a result of the state’s emphasis on industrial and infrastructure development by providing incentives as well as easy availability of manpower.
� Many automobile and auto component companies have set up their manufacturing units and R&D centres in the state.
� BHEL is one of the oldest and most important companies in the engineering sector in the state. Tata Motors, Ashok Leyland, Hero Honda, and Mahindra and Mahindra are some of the well-known automotive companies that have set up units in the state.
5. Floriculture and Horticulture � Uttarakhand has several agro-geo-climatic zones making it particularly conducive to
commercial horticulture and floriculture. The floriculture industry is being developed aggressively in order to meet the demand of domestic as well as foreign markets.
� The climate of the state makes it ideal for growing flowers all round the year. Floriculture parks with common infrastructure facilities for sorting, pre-cooling, cold chain and processing, grading, packing and marketing facilities have been planned in order to provide adequate incentives and facilities to the industry.
6. Forest Product Industry � Forest products have excellent potential for development due to easy availability of raw
materials in the state. The state has ample scope to develop industries based on forest- and agro-wastes such as lantana, pine needles, plant and vegetative fibers.
� Uttarakhandis a storehouse for a rich variety of herbs, medicinal and aromatic plant species. This enables the state to offer immense opportunities for the development of export-oriented units based on such products.
7. Tourism � Uttarakhand is a well-renowned religious and wildlife tourism destination. � Investment opportunities in the tourism sector include: Development of facilities for
providing spiritual lessons, reiki and other rejuvenating courses, Eco-tourism hotels, spa, resorts, amusement parks and ropeways.
Employment Scenario
The public sector has remained the major source of employment in the organized sector of Uttarakhand as seen in figure below in 2004-05. Employment in the public sector has registered a negative growth rate between 2001 and 2005, with a CAGR of -0.63%. However, the state private sector has reported positive growth in the same period with a CAGR of 0.35%.
349 | ASHE - Annual Status of Higher Education in States and UTs, 2012
Figure 7: Sector Wise Distribution of Workforce in 2004-05
Source: Ministry of Labour and Employment, Govt. of India
Since its formation, the economic development of the state has taken a new turn. Growing at one of the fastest rates, Uttarakhand is poised to bridge the gap in per capita income from the average of all India to become part of the leading states in the country. The results of the Economic Census 2005 indicate Uttarakhand has performed better than the all India average in terms of growth of employment as well as growth in enterprises. Some of the details of the establishments and employment figures are displayed in Table below.
Table 3: Details of Establishments and Employment Total Establishment 3,25,157Own Account Establishment 2,20,729Establishments at Least One Hired Worker 1,04,428Agricultural Establishment 31,880 Non- Agricultural Establishment 2,93,277Persons Usually Working in Establishments 7,37,869Persons Usually Working in Establishments on Hired Basis 4,02,469
Source: 5th Economic Census-2005
In 2003-04, the number of unemployed persons registered in the live register of 23 employment exchanges in Uttarakhand was 3.3 lakh. During 2003-04, 75,529 registrations took place. Of these, only 2727 (3.6 %) were actually employed in 2003-04. The number of state government employees of Uttarakhand as of 2003-04 was 1.08 lakh. Thus, government appears to be one of the major job providers with almost every 85th person of the population in government service.
According to the Census 2001, the total workers in the state were 31.34 lakh. Of these, about 25 lakh were in the rural areas and 6.35 lakh in the urban areas. These workers are classified as main and marginal workers according to their work in the reference period of the Census.
Table 4: Total, Main & Marginal Workers in Urban and Combined (Rural & Urban) Areas
Type of Worker Total (In'000s) Urban (In '000s)
Total Main Marginal Total Main Marginal Cultivators 1,570 1,068 503 14 12 2 Agricultural Labourers 260 143 117 15 10 5 Household Industry Workers 72 49 23 16 12 4 Other Workers 1,232 1,063 169 591 543 48
Total 3,134 2,322 812 635 577 58 Source: Census-2001 Within the main and marginal workers category there is further classification into cultivators, agricultural labourers, household industry workers and other workers. The group of other workers includes factory jobs as well as services sector jobs. Uttarakhand had 37% of its population in its workforce. The total of main and marginal workers in Uttarakhand was distributed in the ratio of 74%
86%
14%
Public Sector
Private Sector
350 | ASHE - Annual Status of Higher Education in States and UTs, 2012
and 26% respectively. Both these conditions are in line with lower per capita income of the sate vis-à-vis that of all India average. On the contrary, Himachal Pradesh has its 49% of population in the workforce, but a relatively larger proportion (34%) as marginal workers. Yet, the per capita income of Himachal Pradesh is better than that of Uttarakhand. It can be inferred that getting an opportunity to work is of primary importance and then to seek regular and permanent work.123 The industrial requirements for a skilled workforce are far higher than the availability due not only to the shortage of Industrial Training Institutes (ITIs) in the state but also, more importantly, due to the quality and orientation of education and training imparted at these institutes which does not fit job requirements at the factories. It is estimated that around 70% of the ITI-trained local persons do not get employment in the industries, whereas outside candidates are given employment opportunities. Vocational courses should be encouraged to meet the shortage of skilled labour and the government should take steps to tackle this problem. There is need for training that should include industry-specific training. Given this scenario in the state, there has been suggestions proposed by CII that the state government should privatize five ITIs to impart industry-oriented training that matches industry requirements. These training institutes should tie up with industry.
Creating education centers would lead to development in a radius area around it. High-level vocational training is required for which polytechnics should be set up; they could train students for the hotel and construction industries. Course development is also required in every block of the state but it should be customized and not standardized. Since soft skills are very important, 10-20% of training time should be spent on developing these skills.124 The state government has generated good employment opportunities. The unemployment rate in Uttarakhand was 4.9% (2009‐10), which is better than the national average of 9.4%. It is ranked 4th in terms of unemployment at all India level. To generate employment, the government has opened 24 employment exchanges in the state. The total number of unemployed persons registered in the live register as on 31 March 2010 in Uttarakhand was 4,84,972.
Although, the level of education is quite good in the state, there is a need to develop human resources and conduct capacity building programs to boost the momentum and to achieve higher literacy rate. It is imperative to set up more and more skill development centres and vocational training institutes to create more employment opportunities, improve income level and enhance the potential for economic growth.125
123Uttarakhand Development Report-2009, Planning Commission 124 Development Strategy for the Hill Districts of Uttarakhand, Working Paper # 127, ICRIER 125 Uttarakhand: State Profile, PHD Chambers
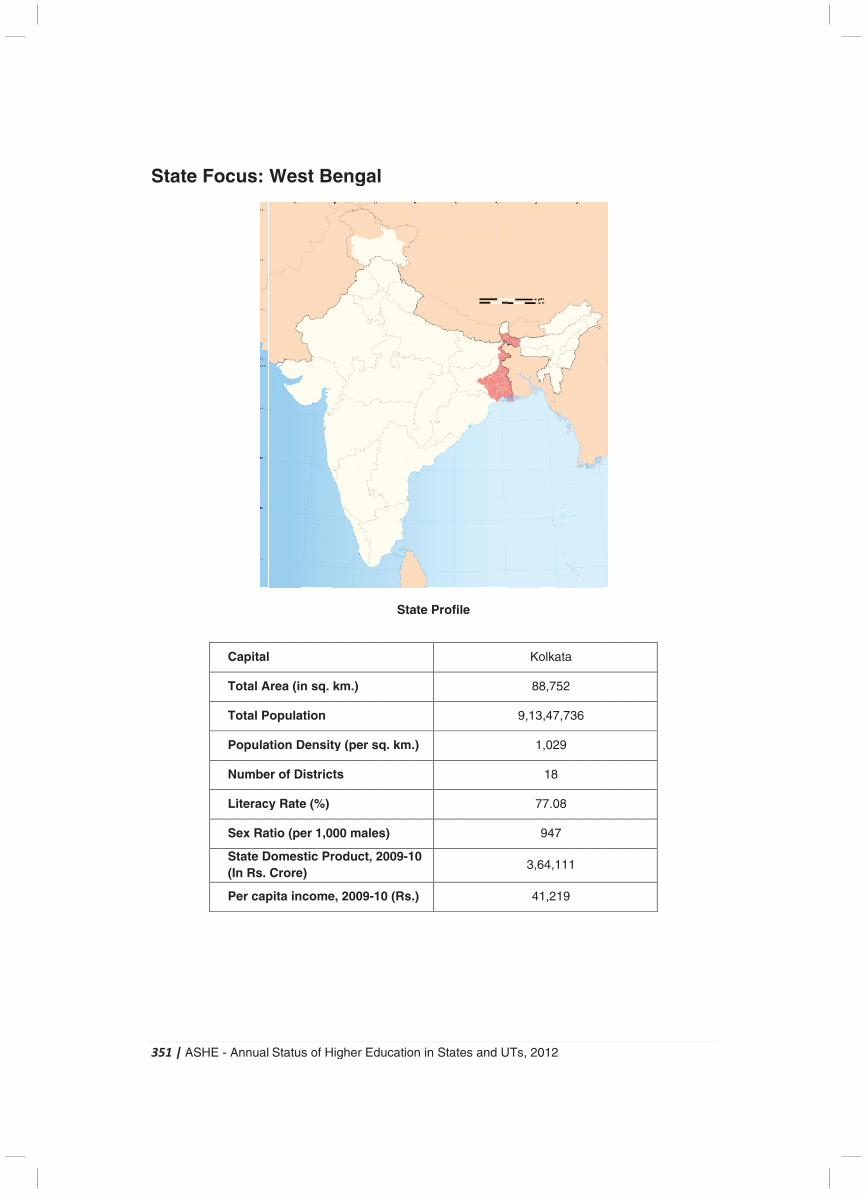
3
S
351
Sta
| A
ate
ASH
e F
HE
Fo
- A
oc
C
To
To
Po
N
Li
Se
St(In
Pe
Ann
us
api
ota
ota
opu
um
iter
ex
taten R
er c
ual
s:
ital
al A
al P
ula
mbe
rac
Ra
e DRs.
cap
Sta
W
l
Area
Pop
atio
er o
y R
atio
DomCro
pita
atu
Wes
a (i
ula
n D
of D
Rate
(pe
mesore
a in
s o
st
n s
atio
Den
Dist
e (%
er 1
stice)
nco
of H
B
sq.
on
nsit
tric
%)
1,0
c Pr
me
High
en
km
ty (
ts
00
rod
e, 2
her
ng
m.)
(per
ma
duc
009
Ed
gal
r sq
ales
t, 2
9-1
uca
l
q. k
s)
200
0 (
atio
Sta
km.
09-1
Rs.
on in
ate
.)
10
.)
n S
Pr
Stat
ofi
es
le
and
d U
UTs
9
, 20
Ko
88
9,13
1
7
3,6
4
012
olka
8,7
3,47
,02
18
77.0
947
64,1
1,2
2
ata
52
7,73
29
8
08
7
111
19
36
1
352 | ASHE - Annual Status of Higher Education in States and UTs, 2012
Introduction
The state of West Bengal (WB) is situated in eastern India. The state shares its borders with Jharkhand, Bihar, Odisha, Sikkim and Assam. The state also shares its borders with international neighbouring countries of Bangladesh, Bhutan and Nepal. The Bay of Bengal is in the south of the state. West Bengal encompasses two broad natural regions: the Gangetic Plain in the south and the Sub-Himalayan and Himalayan area in the north.
West Bengal is the 4th most populous state in the country126 and the 6th largest contributor to the nation’s Net Domestic Product (NDP). Due to its location, West Bengal offers definite advantage as the traditional domestic market in eastern India, the northeast and the land-locked countries of Nepal and Bhutan, which are easily accessible. The state is also an entry point to markets in Southeast Asia via north-eastern states. West Bengal has abundant natural resources of minerals and suitable agro-climatic conditions for agriculture, horticulture and fisheries.
West Bengal has more than 20 universities. The University of Calcutta is the oldest public university in India and has 136 colleges affiliated to it. The state capital, Kolkata, has played a pioneering role in the development of the modern education system in India. It is the gateway to the revolution of European education. The state has several higher education institutes of prominence, including the Indian Institute of Foreign Trade (IIFT), the Indian Institute of Management Calcutta (the 1st IIM to be established in the country), the Indian Institute of Science Education and Research (IISER) Kolkata, the Indian Statistical Institute (ISI), the Indian Institute of Technology Kharagpur (the 1st IIT to be established in the country), National Institute of Technology (NIT) Durgapur in the field of science, engineering & technology and the West Bengal National University of Juridical Sciences in the discipline of legal education.
Universities and University Level Institutes
20 state universities, no private universities, 1 deemed universities and 1 central university characterize the higher education landscape of West Bengal. In addition to these universities, there are Institutes of National Importance located in the state. West Bengal and other large states such as Andhra Pradesh, Bihar, Maharashtra and Tamil Naduhave no private universities, as other (central, state and deemed) types of universities are abundant.127
The state has two of the oldest state universities in the country, namely, the Bengal Engineering and Science University in Shibpur (Est. in 1856) and the University of Calcutta (Est. in 1857), located in Kolkata. The central university of the state – Visva-Bharati University was established after independence in 1951 and it is located in Santiniketan. The universities in the state offer programs in diverse fields, at both undergraduate and postgraduate levels, such as General Studies (arts, science & commerce), Technology, Agriculture, Veterinary Science, Distance Education, Medical Studies and Legal Studies.
126 "India: Administrative Divisions (population and area)"- Census of India. 127 “List of State Universities"- University Grants Commission.
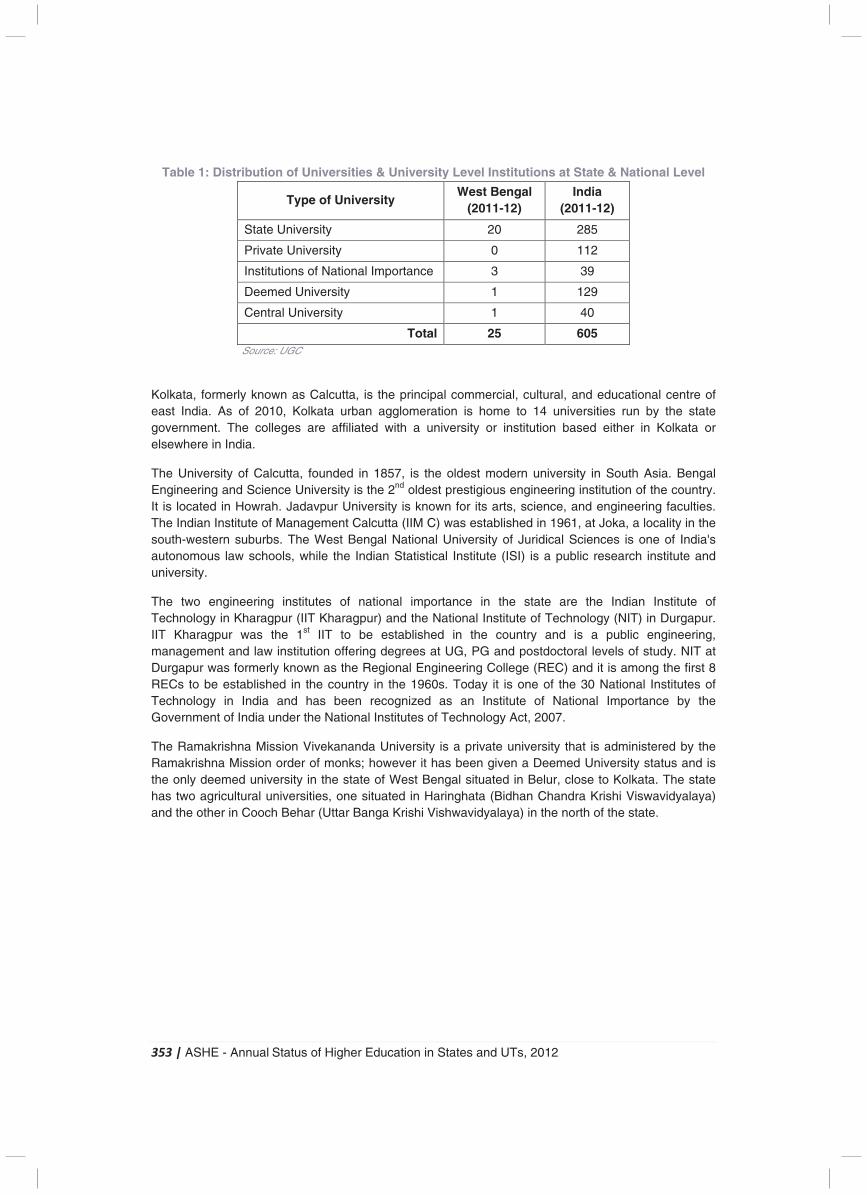
353 | ASHE - Annual Status of Higher Education in States and UTs, 2012
Table 1: Distribution of Universities & University Level Institutions at State & National Level
Type of University West Bengal
(2011-12) India
(2011-12)
State University 20 285
Private University 0 112
Institutions of National Importance 3 39
Deemed University 1 129
Central University 1 40
Total 25 605 Source: UGC
Kolkata, formerly known as Calcutta, is the principal commercial, cultural, and educational centre of east India. As of 2010, Kolkata urban agglomeration is home to 14 universities run by the state government. The colleges are affiliated with a university or institution based either in Kolkata or elsewhere in India.
The University of Calcutta, founded in 1857, is the oldest modern university in South Asia. Bengal Engineering and Science University is the 2nd oldest prestigious engineering institution of the country. It is located in Howrah. Jadavpur University is known for its arts, science, and engineering faculties. The Indian Institute of Management Calcutta (IIM C) was established in 1961, at Joka, a locality in the south-western suburbs. The West Bengal National University of Juridical Sciences is one of India's autonomous law schools, while the Indian Statistical Institute (ISI) is a public research institute and university.
The two engineering institutes of national importance in the state are the Indian Institute of Technology in Kharagpur (IIT Kharagpur) and the National Institute of Technology (NIT) in Durgapur. IIT Kharagpur was the 1st IIT to be established in the country and is a public engineering, management and law institution offering degrees at UG, PG and postdoctoral levels of study. NIT at Durgapur was formerly known as the Regional Engineering College (REC) and it is among the first 8 RECs to be established in the country in the 1960s. Today it is one of the 30 National Institutes of Technology in India and has been recognized as an Institute of National Importance by the Government of India under the National Institutes of Technology Act, 2007.
The Ramakrishna Mission Vivekananda University is a private university that is administered by the Ramakrishna Mission order of monks; however it has been given a Deemed University status and is the only deemed university in the state of West Bengal situated in Belur, close to Kolkata. The state has two agricultural universities, one situated in Haringhata (Bidhan Chandra Krishi Viswavidyalaya) and the other in Cooch Behar (Uttar Banga Krishi Vishwavidyalaya) in the north of the state.
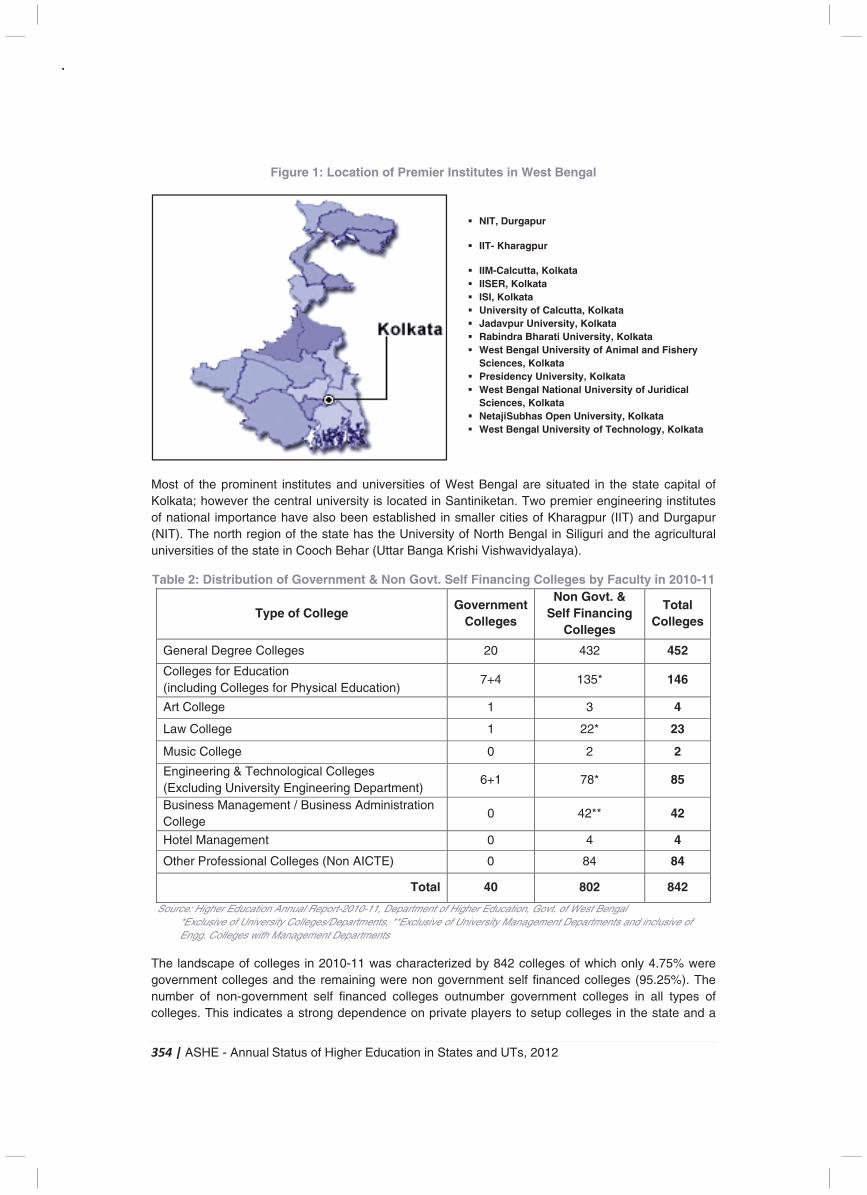
354 | ASHE - Annual Status of Higher Education in States and UTs, 2012
Figure 1: Location of Premier Institutes in West Bengal
Most of the prominent institutes and universities of West Bengal are situated in the state capital of Kolkata; however the central university is located in Santiniketan. Two premier engineering institutes of national importance have also been established in smaller cities of Kharagpur (IIT) and Durgapur (NIT). The north region of the state has the University of North Bengal in Siliguri and the agricultural universities of the state in Cooch Behar (Uttar Banga Krishi Vishwavidyalaya).
Table 2: Distribution of Government & Non Govt. Self Financing Colleges by Faculty in 2010-11
Type of College Government
Colleges
Non Govt. & Self Financing
Colleges
Total Colleges
General Degree Colleges 20 432 452
Colleges for Education (including Colleges for Physical Education)
7+4 135* 146
Art College 1 3 4
Law College 1 22* 23
Music College 0 2 2
Engineering & Technological Colleges (Excluding University Engineering Department)
6+1 78* 85
Business Management / Business Administration College
0 42** 42
Hotel Management 0 4 4
Other Professional Colleges (Non AICTE) 0 84 84
Total 40 802 842
Source: Higher Education Annual Report-2010-11, Department of Higher Education, Govt. of West Bengal *Exclusive of University Colleges/Departments, **Exclusive of University Management Departments and inclusive of Engg. Colleges with Management Departments
The landscape of colleges in 2010-11 was characterized by 842 colleges of which only 4.75% were government colleges and the remaining were non government self financed colleges (95.25%). The number of non-government self financed colleges outnumber government colleges in all types of colleges. This indicates a strong dependence on private players to setup colleges in the state and a
� NIT, Durgapur
� IIT- Kharagpur
� IIM-Calcutta, Kolkata � IISER, Kolkata � ISI, Kolkata � University of Calcutta, Kolkata � Jadavpur University, Kolkata � Rabindra Bharati University, Kolkata � West Bengal University of Animal and Fishery
Sciences, Kolkata � Presidency University, Kolkata � West Bengal National University of Juridical
Sciences, Kolkata � NetajiSubhas Open University, Kolkata � West Bengal University of Technology, Kolkata
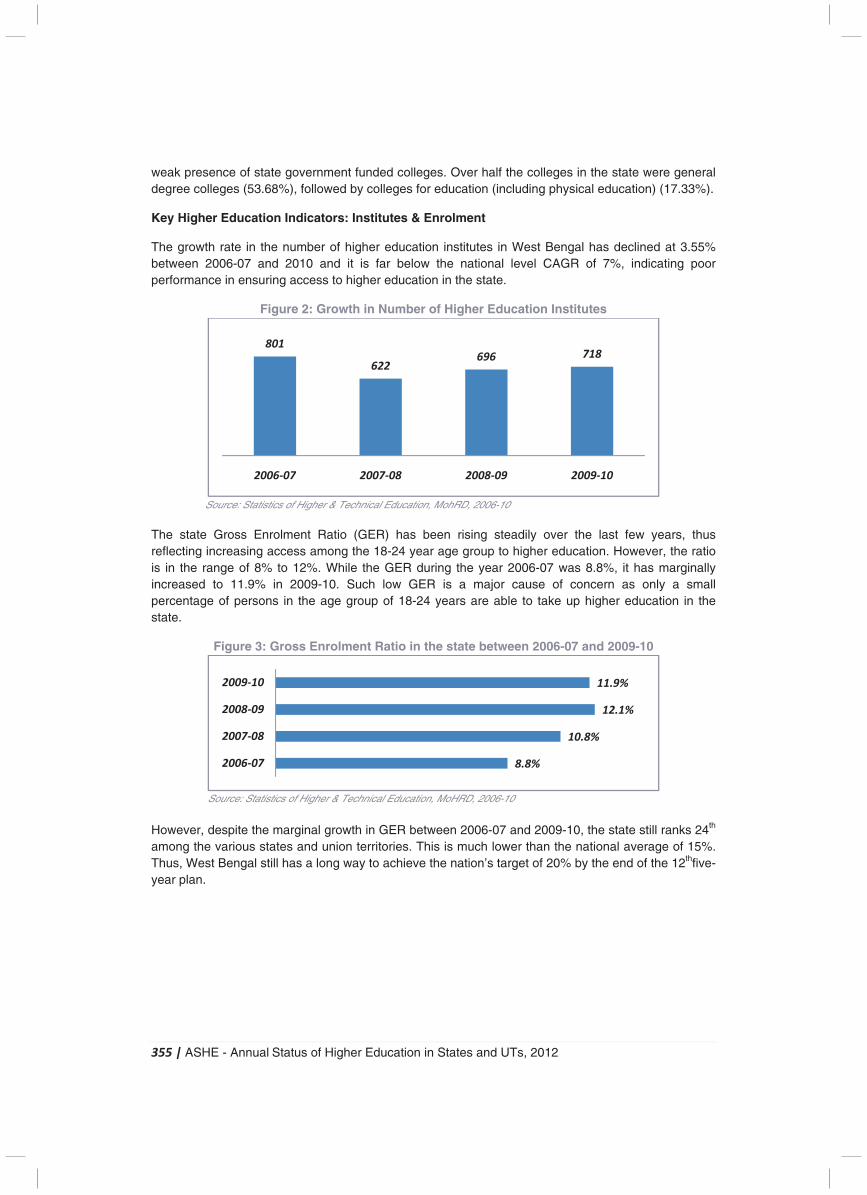
355 | ASHE - Annual Status of Higher Education in States and UTs, 2012
weak presence of state government funded colleges. Over half the colleges in the state were general degree colleges (53.68%), followed by colleges for education (including physical education) (17.33%).
Key Higher Education Indicators: Institutes & Enrolment
The growth rate in the number of higher education institutes in West Bengal has declined at 3.55% between 2006-07 and 2010 and it is far below the national level CAGR of 7%, indicating poor performance in ensuring access to higher education in the state.
Figure 2: Growth in Number of Higher Education Institutes
Source: Statistics of Higher & Technical Education, MohRD, 2006-10
The state Gross Enrolment Ratio (GER) has been rising steadily over the last few years, thus reflecting increasing access among the 18-24 year age group to higher education. However, the ratio is in the range of 8% to 12%. While the GER during the year 2006-07 was 8.8%, it has marginally increased to 11.9% in 2009-10. Such low GER is a major cause of concern as only a small percentage of persons in the age group of 18-24 years are able to take up higher education in the state.
Figure 3: Gross Enrolment Ratio in the state between 2006-07 and 2009-10
Source: Statistics of Higher & Technical Education, MoHRD, 2006-10
However, despite the marginal growth in GER between 2006-07 and 2009-10, the state still ranks 24th among the various states and union territories. This is much lower than the national average of 15%. Thus, West Bengal still has a long way to achieve the nation’s target of 20% by the end of the 12thfive-year plan.
801
622696 718
2006-07 2007-08 2008-09 2009-10
8.8%
10.8%
12.1%
11.9%
2006-07
2007-08
2008-09
2009-10
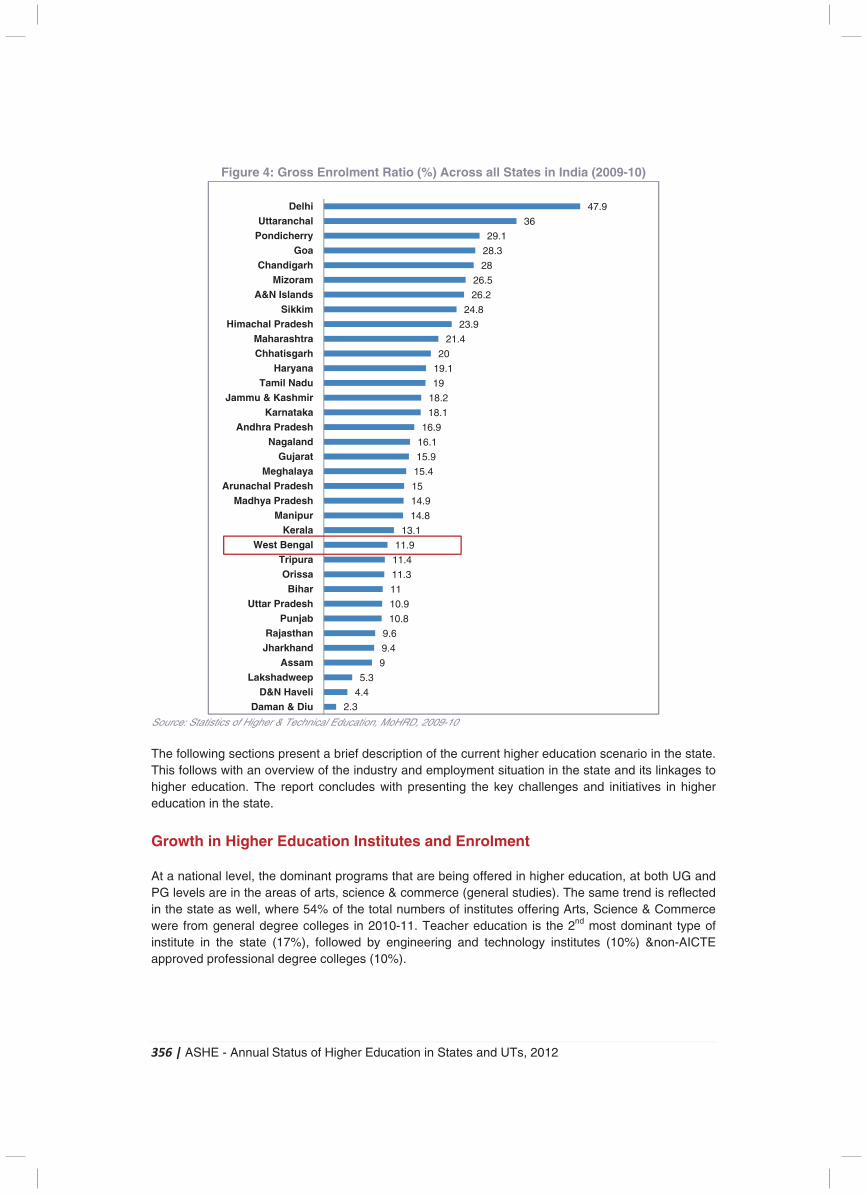
356 | ASHE - Annual Status of Higher Education in States and UTs, 2012
Figure 4: Gross Enrolment Ratio (%) Across all States in India (2009-10)
Source: Statistics of Higher & Technical Education, MoHRD, 2009-10 The following sections present a brief description of the current higher education scenario in the state. This follows with an overview of the industry and employment situation in the state and its linkages to higher education. The report concludes with presenting the key challenges and initiatives in higher education in the state.
Growth in Higher Education Institutes and Enrolment At a national level, the dominant programs that are being offered in higher education, at both UG and PG levels are in the areas of arts, science & commerce (general studies). The same trend is reflected in the state as well, where 54% of the total numbers of institutes offering Arts, Science & Commerce were from general degree colleges in 2010-11. Teacher education is the 2nd most dominant type of institute in the state (17%), followed by engineering and technology institutes (10%) &non-AICTE approved professional degree colleges (10%).
2.34.4
5.3
9
9.4
9.6
10.8
10.9
11
11.3
11.4
11.9
13.1
14.8
14.9
15
15.4
15.9
16.1
16.9
18.1
18.2
19
19.1
20
21.4
23.9
24.8
26.2
26.5
28
28.3
29.1
36
47.9
Daman & DiuD&N Haveli
LakshadweepAssam
JharkhandRajasthan
PunjabUttar Pradesh
BiharOrissa
TripuraWest Bengal
KeralaManipur
Madhya PradeshArunachal Pradesh
MeghalayaGujarat
NagalandAndhra Pradesh
KarnatakaJammu & Kashmir
Tamil NaduHaryana
ChhatisgarhMaharashtra
Himachal PradeshSikkim
A&N IslandsMizoram
ChandigarhGoa
PondicherryUttaranchal
Delhi
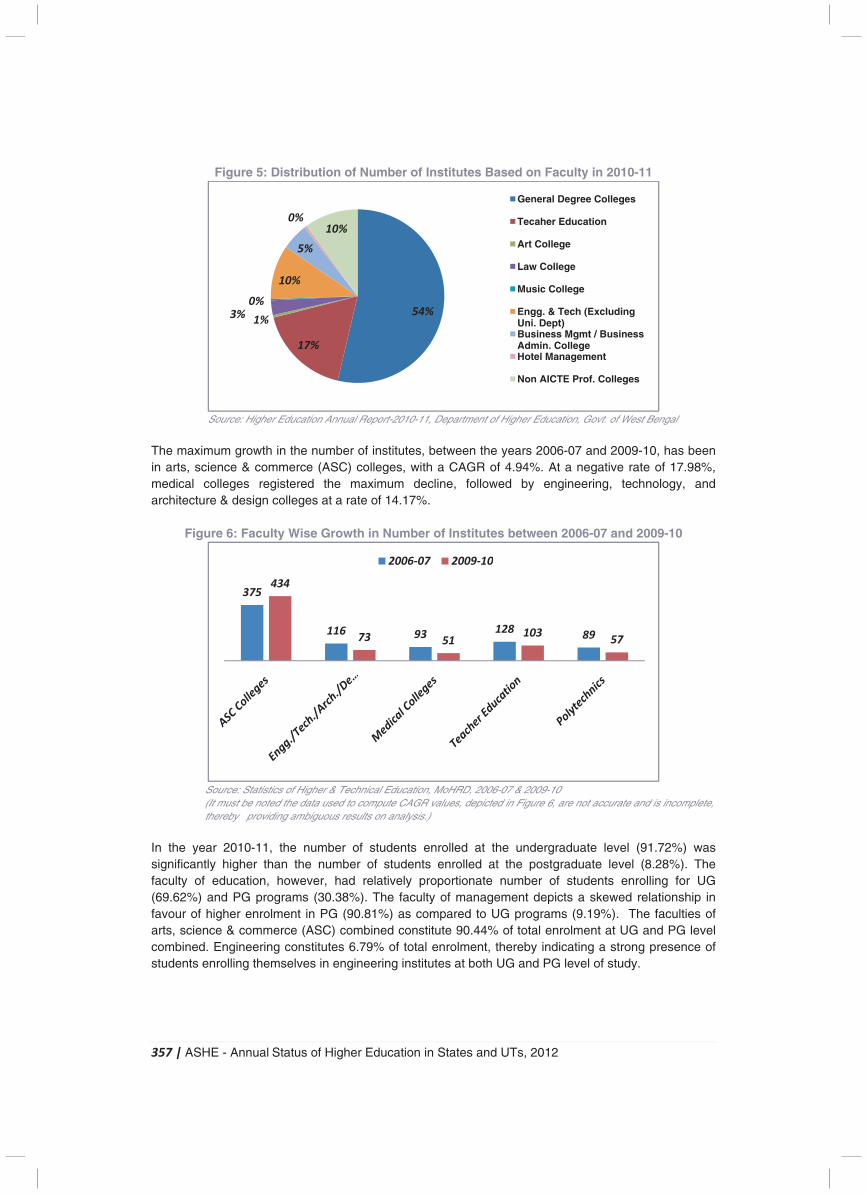
357 | ASHE - Annual Status of Higher Education in States and UTs, 2012
Figure 5: Distribution of Number of Institutes Based on Faculty in 2010-11
Source: Higher Education Annual Report-2010-11, Department of Higher Education, Govt. of West Bengal
The maximum growth in the number of institutes, between the years 2006-07 and 2009-10, has been in arts, science & commerce (ASC) colleges, with a CAGR of 4.94%. At a negative rate of 17.98%, medical colleges registered the maximum decline, followed by engineering, technology, and architecture & design colleges at a rate of 14.17%.
Figure 6: Faculty Wise Growth in Number of Institutes between 2006-07 and 2009-10
Source: Statistics of Higher & Technical Education, MoHRD, 2006-07 & 2009-10
(It must be noted the data used to compute CAGR values, depicted in Figure 6, are not accurate and is incomplete, thereby providing ambiguous results on analysis.)
In the year 2010-11, the number of students enrolled at the undergraduate level (91.72%) was significantly higher than the number of students enrolled at the postgraduate level (8.28%). The faculty of education, however, had relatively proportionate number of students enrolling for UG (69.62%) and PG programs (30.38%). The faculty of management depicts a skewed relationship in favour of higher enrolment in PG (90.81%) as compared to UG programs (9.19%). The faculties of arts, science & commerce (ASC) combined constitute 90.44% of total enrolment at UG and PG level combined. Engineering constitutes 6.79% of total enrolment, thereby indicating a strong presence of students enrolling themselves in engineering institutes at both UG and PG level of study.
(4.94%)
(-14.17%) (-17.98%) (-6.92%) (-13.67%)
54%
17%
1%3%
0%
10%
5%
0%
10%
General Degree Colleges
Tecaher Education
Art College
Law College
Music College
Engg. & Tech (Excluding Uni. Dept)Business Mgmt / Business Admin. CollegeHotel Management
Non AICTE Prof. Colleges
375
116 93128
89
434
73 51103
57
2006-07 2009-10
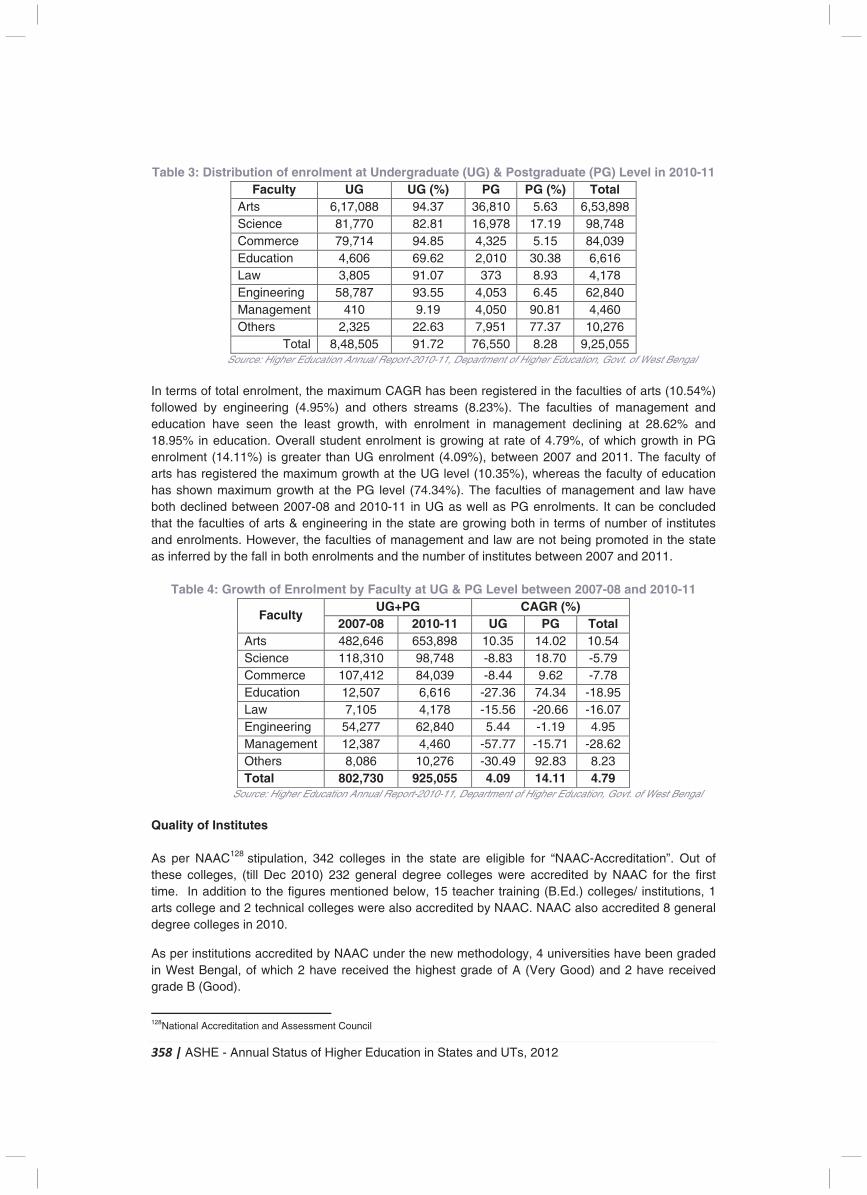
358 | ASHE - Annual Status of Higher Education in States and UTs, 2012
Table 3: Distribution of enrolment at Undergraduate (UG) & Postgraduate (PG) Level in 2010-11 Faculty UG UG (%) PG PG (%) Total
Arts 6,17,088 94.37 36,810 5.63 6,53,898 Science 81,770 82.81 16,978 17.19 98,748 Commerce 79,714 94.85 4,325 5.15 84,039 Education 4,606 69.62 2,010 30.38 6,616 Law 3,805 91.07 373 8.93 4,178 Engineering 58,787 93.55 4,053 6.45 62,840 Management 410 9.19 4,050 90.81 4,460 Others 2,325 22.63 7,951 77.37 10,276
Total 8,48,505 91.72 76,550 8.28 9,25,055 Source: Higher Education Annual Report-2010-11, Department of Higher Education, Govt. of West Bengal
In terms of total enrolment, the maximum CAGR has been registered in the faculties of arts (10.54%) followed by engineering (4.95%) and others streams (8.23%). The faculties of management and education have seen the least growth, with enrolment in management declining at 28.62% and 18.95% in education. Overall student enrolment is growing at rate of 4.79%, of which growth in PG enrolment (14.11%) is greater than UG enrolment (4.09%), between 2007 and 2011. The faculty of arts has registered the maximum growth at the UG level (10.35%), whereas the faculty of education has shown maximum growth at the PG level (74.34%). The faculties of management and law have both declined between 2007-08 and 2010-11 in UG as well as PG enrolments. It can be concluded that the faculties of arts & engineering in the state are growing both in terms of number of institutes and enrolments. However, the faculties of management and law are not being promoted in the state as inferred by the fall in both enrolments and the number of institutes between 2007 and 2011.
Table 4: Growth of Enrolment by Faculty at UG & PG Level between 2007-08 and 2010-11
Faculty UG+PG CAGR (%)
2007-08 2010-11 UG PG Total Arts 482,646 653,898 10.35 14.02 10.54 Science 118,310 98,748 -8.83 18.70 -5.79 Commerce 107,412 84,039 -8.44 9.62 -7.78 Education 12,507 6,616 -27.36 74.34 -18.95 Law 7,105 4,178 -15.56 -20.66 -16.07 Engineering 54,277 62,840 5.44 -1.19 4.95 Management 12,387 4,460 -57.77 -15.71 -28.62 Others 8,086 10,276 -30.49 92.83 8.23 Total 802,730 925,055 4.09 14.11 4.79
Source: Higher Education Annual Report-2010-11, Department of Higher Education, Govt. of West Bengal Quality of Institutes As per NAAC128 stipulation, 342 colleges in the state are eligible for “NAAC-Accreditation”. Out of these colleges, (till Dec 2010) 232 general degree colleges were accredited by NAAC for the first time. In addition to the figures mentioned below, 15 teacher training (B.Ed.) colleges/ institutions, 1 arts college and 2 technical colleges were also accredited by NAAC. NAAC also accredited 8 general degree colleges in 2010.
As per institutions accredited by NAAC under the new methodology, 4 universities have been graded in West Bengal, of which 2 have received the highest grade of A (Very Good) and 2 have received grade B (Good).
128National Accreditation and Assessment Council
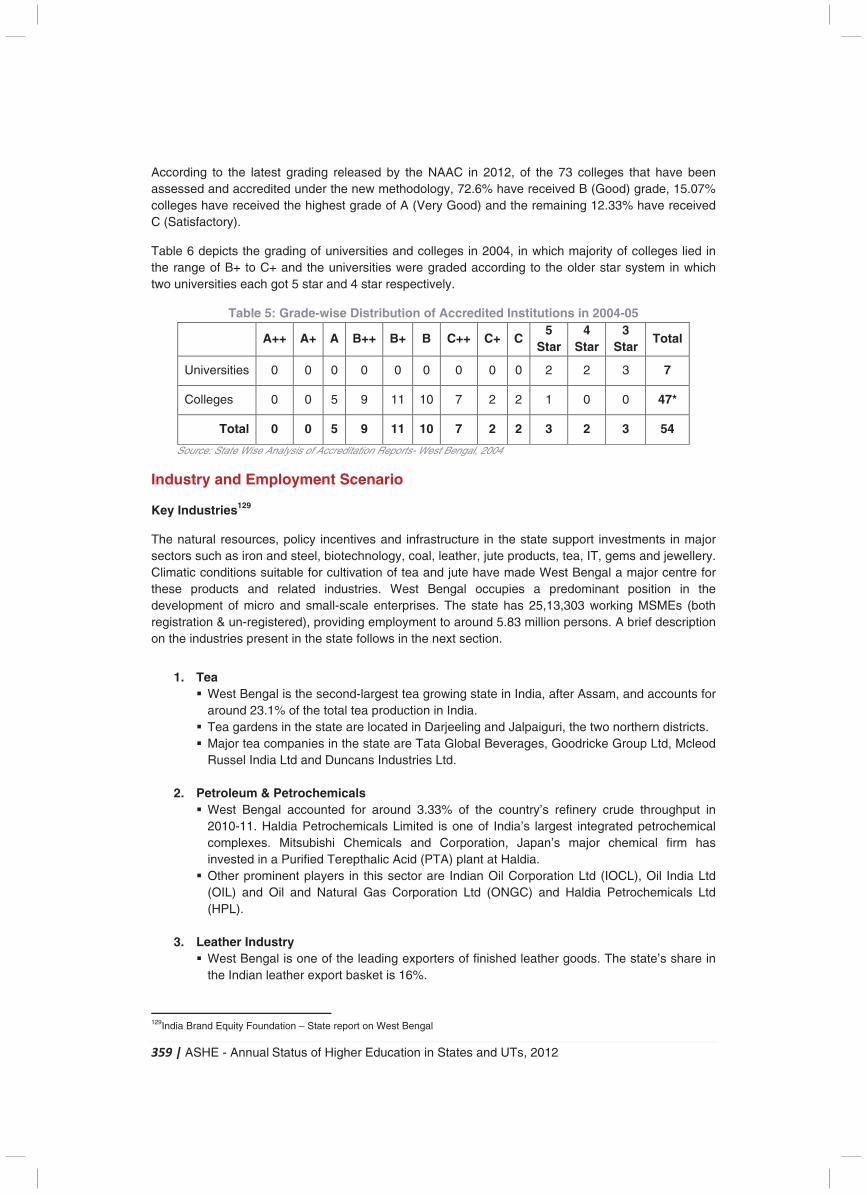
359 | ASHE - Annual Status of Higher Education in States and UTs, 2012
According to the latest grading released by the NAAC in 2012, of the 73 colleges that have been assessed and accredited under the new methodology, 72.6% have received B (Good) grade, 15.07% colleges have received the highest grade of A (Very Good) and the remaining 12.33% have received C (Satisfactory).
Table 6 depicts the grading of universities and colleges in 2004, in which majority of colleges lied in the range of B+ to C+ and the universities were graded according to the older star system in which two universities each got 5 star and 4 star respectively.
Table 5: Grade-wise Distribution of Accredited Institutions in 2004-05
A++ A+ A B++ B+ B C++ C+ C
5 Star
4 Star
3 Star
Total
Universities 0 0 0 0 0 0 0 0 0 2 2 3 7
Colleges 0 0 5 9 11 10 7 2 2 1 0 0 47*
Total 0 0 5 9 11 10 7 2 2 3 2 3 54
Source: State Wise Analysis of Accreditation Reports- West Bengal, 2004
Industry and Employment Scenario
Key Industries129
The natural resources, policy incentives and infrastructure in the state support investments in major sectors such as iron and steel, biotechnology, coal, leather, jute products, tea, IT, gems and jewellery. Climatic conditions suitable for cultivation of tea and jute have made West Bengal a major centre for these products and related industries. West Bengal occupies a predominant position in the development of micro and small-scale enterprises. The state has 25,13,303 working MSMEs (both registration & un-registered), providing employment to around 5.83 million persons. A brief description on the industries present in the state follows in the next section.
1. Tea � West Bengal is the second-largest tea growing state in India, after Assam, and accounts for
around 23.1% of the total tea production in India. � Tea gardens in the state are located in Darjeeling and Jalpaiguri, the two northern districts. � Major tea companies in the state are Tata Global Beverages, Goodricke Group Ltd, Mcleod
Russel India Ltd and Duncans Industries Ltd.
2. Petroleum & Petrochemicals � West Bengal accounted for around 3.33% of the country’s refinery crude throughput in
2010-11. Haldia Petrochemicals Limited is one of India’s largest integrated petrochemical complexes. Mitsubishi Chemicals and Corporation, Japan’s major chemical firm has invested in a Purified Terepthalic Acid (PTA) plant at Haldia.
� Other prominent players in this sector are Indian Oil Corporation Ltd (IOCL), Oil India Ltd (OIL) and Oil and Natural Gas Corporation Ltd (ONGC) and Haldia Petrochemicals Ltd (HPL).
3. Leather Industry
� West Bengal is one of the leading exporters of finished leather goods. The state’s share in the Indian leather export basket is 16%.
129India Brand Equity Foundation – State report on West Bengal

360 | ASHE - Annual Status of Higher Education in States and UTs, 2012
� West Bengal Leather Industrial Development Corporation provides assistance to small & micro scale industries of the state for the development and marketing of leather goods.
� Some key players are Khadim India Ltd., Bata India Limited, Singhvi International and Balmer Lawrie and Company Limited.
4. Iron & Steel Industry � West Bengal has emerged as a favoured destination for the steel industry. Its deposits of
iron ore have helped attract new projects. � The Chota Nagpur plateau, bordering West Bengal, is the nerve-centre of this industry. The
state accounts for about 10% of country’s total steel capacity. � Major steel companies doing business in the state are JSW Steel Ltd, SAIL, Shyam Steel
and Super Forgings & Steel Ltd (SFSL).
5. Information Technology Sector � Around 500 IT and ITeS companies are operating in the state, employing more than
1,00,000 professionals. � The state has identified IT as a priority sector to be developed into a growth engine for the
future. West Bengal has 16 IT/ITeS based SEZs with formal approval. � Some of the IT companies present in the state are Genpact, Cognizant Technology
Solutions, HCL and Tata Consultancy Services.
6. Biotechnology � West Bengal has many attributes that favor the development of biotechnology industry. It
has rich natural resources based on a diversity of flora and fauna. A wide variety of commercial crops are cultivated, which can be improved by biotechnology interventions.
� Examples of such interventions are application of bio-fertilizers for soil fertility, bio-pesticides for environment friendly integrated pest management, genetic modification to produce golden rice, tissue culture for horticulture, floriculture and medicinal plants.
� Research institutes such as Bose Institute, Indian Institute of Chemical Biology, Indian Association for the Cultivation of Science, National Institute of Cholera and Enteric Diseases, Jadavpur University, All India Institute of Hygiene and Public Health, Calcutta School of Tropical Medicine and Indian Institute of Technology, Kharagpur are engaged in high quality research in various areas of biotechnology.
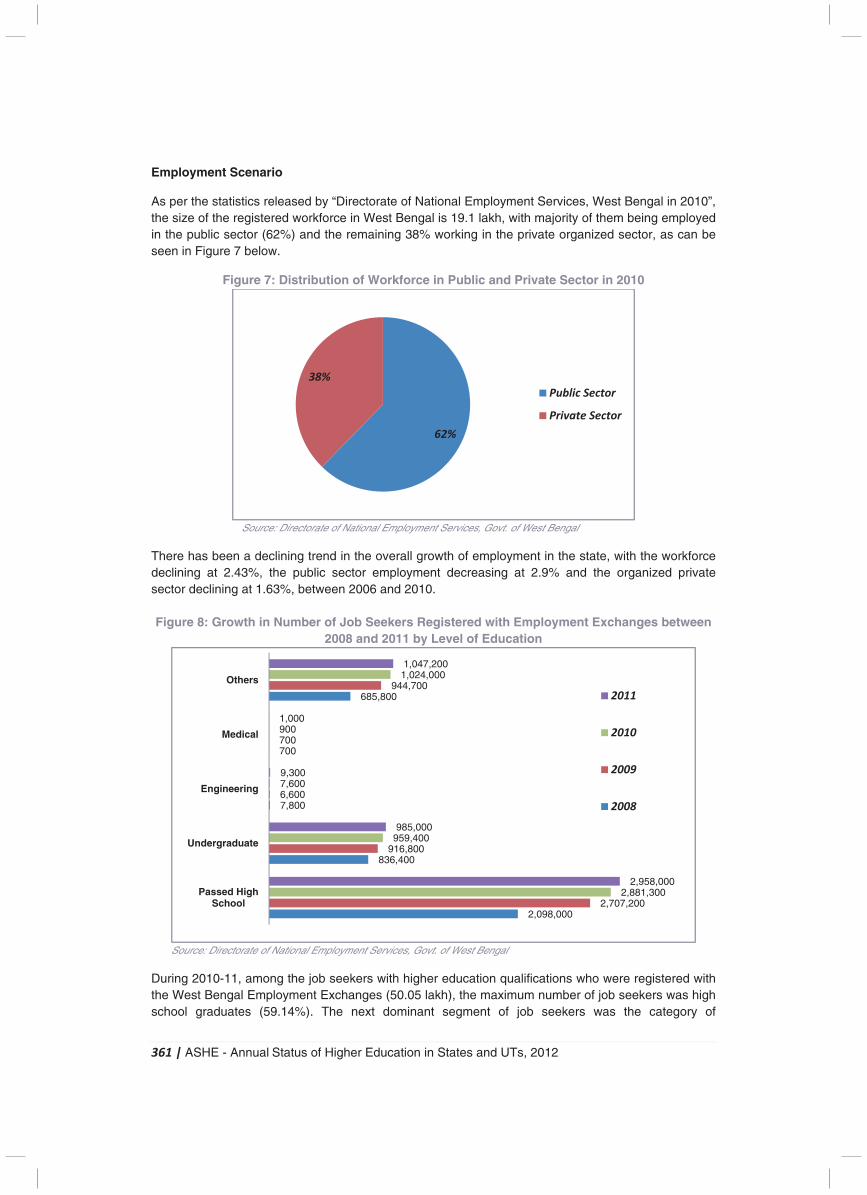
361 | ASHE - Annual Status of Higher Education in States and UTs, 2012
Employment Scenario
As per the statistics released by “Directorate of National Employment Services, West Bengal in 2010”, the size of the registered workforce in West Bengal is 19.1 lakh, with majority of them being employed in the public sector (62%) and the remaining 38% working in the private organized sector, as can be seen in Figure 7 below.
Figure 7: Distribution of Workforce in Public and Private Sector in 2010
Source: Directorate of National Employment Services, Govt. of West Bengal
There has been a declining trend in the overall growth of employment in the state, with the workforce declining at 2.43%, the public sector employment decreasing at 2.9% and the organized private sector declining at 1.63%, between 2006 and 2010. Figure 8: Growth in Number of Job Seekers Registered with Employment Exchanges between
2008 and 2011 by Level of Education
Source: Directorate of National Employment Services, Govt. of West Bengal During 2010-11, among the job seekers with higher education qualifications who were registered with the West Bengal Employment Exchanges (50.05 lakh), the maximum number of job seekers was high school graduates (59.14%). The next dominant segment of job seekers was the category of
62%
38%
Public Sector
Private Sector
2,098,000
836,400
7,800
700
685,800
2,707,200
916,800
6,600
700
944,700
2,881,300
959,400
7,600
900
1,024,000
2,958,000
985,000
9,300
1,000
1,047,200
Passed High School
Undergraduate
Engineering
Medical
Others
2011
2010
2009
2008
362 | ASHE - Annual Status of Higher Education in States and UTs, 2012
undergraduates with 19.69% contribution. The category of ‘Others’ (20.94%) is not included, as the composition of the level of education in this category is not known.
The total number of educated graduates (engineers, medical & others) and undergraduates stood at 20.4 lakh. Thus the state had 40.84% of the total persons registered with the employment exchanges as ‘educated unemployed’. Out of which there were an equal share of undergraduates and postgraduates. Such a high number of qualified persons looking for employment is a cause for concern as it can be deduced that the education imparted at the UG and PG level is not up to the standards required by industry and other places of work.
The maximum growth rate, in the number of job seekers registering at the government employment exchanges, has been registered by ‘Others’ category (14.99%) and followed by medical graduates (12.49%) and high school pass individuals (12%) between 2008 and 2011. This increasing trend reflects that more and more educated individuals are finding it difficult to secure gainful employment in the state and that the degree that they have procured, at UG or PG level, is not providing them with enough knowledge and expertise that is required by industry standards in the state and the country.
Key Challenges and Initiatives in Higher Education
Initiatives funded by the State Government and their impact
� The World Bank and Government of India (GoI) coordinated the 1st phase of Technical Education Quality Improvement Program (TEQIP) in West Bengal. 127 institutions (18 centrally funded) from all over the country participated in this program. Implementation of TEQIP in West Bengal has earned ‘Satisfactory’ ranking from the World Bank and GoI, along with states like Maharashtra and Karnataka.
Academic Achievements
� Production of high quality graduates (75% or more marks) has been increased from 2,346, in 2004-05 to 2,860, in 2007-08, marking an increase of 22% over 4 years.
� In total, 22 new ‘demand driven’ UG/PG course have been introduced and 117 courses have been restructured, reoriented or revised.
� In the 3rd part quality audits by educational experts, West Bengal has always scored above the national average. (In 2008-09, the national average was 8.5 on a 10 point scale and the state scored 8.9)
� Number of private institutions (universities and colleges) and technical institutes has grown exponentially during the 11th Five Year Plan. This is mainly due to the establishment of new self-financed institutes.
Institutional Reforms
� One of the most important aspects of Project Implementation is granting academic, financial, managerial and administrative autonomy to the institutes with accountability, especially in the 4 government engineering colleges.
� Four funds viz. Corpus Fund, Staff Development Fund, Depreciation Fund and Maintenance Fund have been established in these institutions in which their annual savings are being invested to strengthen the institutes’ own financial backbone, and hence become self sufficient over the coming years.
363 | ASHE - Annual Status of Higher Education in States and UTs, 2012
Initiatives Proposed
� Under the sub-component, “Scaling up Post Graduate Education and Demand Driven, Research and Development and Innovation”, 3 state funded universities and 1 private university has been selected and all four of them have signed a MoU with the state government.
Innovative Practices in Higher Education
� Students are encouraged to perform industry-based projects with their own innovative ideas during the course of study.
� Students are allowed to perform industry based projects with other well know institutions in their desired field of study.
� The teachers for weaker students conduct special classes/tutorial classes. � The students have developed feedback system for the teachers’ evaluation. � Non-salary, non-plan budget provisions have been converted to ‘Block Grants’, to keep flexibility
in fund utilization instead of following many number of sub heads. � Institutes have been allowed and encouraged for Internal Revenue Generation (IRG) through
consultancy and projects with the industry, and conducting short courses etc. Main Activities and Achievements during 2010-11
� Consolidation and qualitative improvement of colleges and expanding the base of social relevance of higher education.
� Linkage of education to employment through vocationalization. � There has been emphasis on engineering and technological education with special focus on
information technology and biotechnology. � Diversification of subject compositions. � Emphasis on basic science courses and scientific research. � Emphasis on liberal arts, culture, languages, physical education and humanistic values. � Mobilisation of internal resources.
364 | ASHE - Annual Status of Higher Education in States and UTs, 2012
Brief Note on Certain Union Territories (UTs)
The union territories of Andaman & Nicobar Islands, Chandigarh, Daman & Diu, Dadra & Nagar Haveli and Lakshadweep have not been included in this report as key data points pertaining to these states were not readily available. However for the purpose of completeness, we present a brief outline of the landscape of higher education and some of the initiatives and challenges that are present in these UTs.
1. Andaman & Nicobar Islands
Andaman and Nicobar Islands state education has a very strong network of schools and centers of higher education. The education department of Andaman and Nicobar is devoted towards enhancing the education profile of the State, specially the comparatively deprived tribal regions. As a result of their tireless work and efforts, Andaman and Nicobar is presently a Union Territory with one of the highest literacy rates in the country.
Andaman and Nicobar Islands state education also has a great infrastructure for higher education. The colleges of Andaman and Nicobar were originally affiliated to the Rangoon University. However, the cessation of Burma from India brought about a change in the structure of state education at Andaman and Nicobar Islands. The colleges thereafter became affiliated to the Calcutta University. The higher education of Andaman and Nicobar State education includes two training institutes, two polytechnic colleges, a government B.Ed. College and a government college.
2. Chandigarh
The union territory of Chandigarh has 1 state university and 1 deemed university, namely Panjab University and PEC University of Technology. The Chandigarh administration has 7 privately managed Government Aided Colleges imparting higher education; however there is no private unaided college in the UT. There are 2 Medical Colleges, 3 Teacher Training Colleges, 6 Engineering Colleges, 11 Arts & Science Colleges and 6 Polytechnics. Two Polytechnics and two ITIs are under the purview of the Directorate of Technical Education in Chandigarh.
Some of the initiatives that have been implemented in the state include increased used of ICT tools, job oriented courses and amenities for students studying in various institutes and colleges. The following provides brief description of some of the initiative in the UT:
� E-Content development in all Government colleges for the students to access through college websites.
� College libraries are fully computerized and provided with Internet connectivity. � Personality Development and Soft Skills course and workshops made compulsory for students. � College facilities are put to optimum use and various Hobby Classes, Computer Literacy
Courses, and Personality Development Courses are run at different times of the day at these facilities.
� Campus Placement, Job Fairs and Career Counseling are regularly conducted in all colleges and a placement cell has been established in each college.
� Add-on job oriented, vocational and honours courses have been introduced in all colleges. � Regular alumni interaction is conducted at all colleges so as to provide avenues for job
prospects for students currently studying. � Anti Stress help desks, Women Cell and a Grievance council has been setup for all the
students of various colleges. � Various Government colleges have conducted national conferences, seminars and workshops. � Up gradation of Govt. ITIs through PPP mode. � Skill Development Initiative Scheme implemented in 2007-08 and 12 Institutions have been
registered as Vocational Training Providers (VTPs).
365 | ASHE - Annual Status of Higher Education in States and UTs, 2012
� Skill Mapping i.e. to determine the mapping and gaps between the courses offered and the local demand by the industry is under taken by CII, Northern Region, Chandigarh.
� Community Development through Polytechnics (CDTP) program has been initiated.
Along with some of the initiatives that the Government of the UT has already implemented, there are some initiatives that have been proposed for the coming years. Some of them are:
� ‘EduCity Project’ is an initiative proposed by the Government of India with an objective to set up a world-class education Institutions of excellence that will offer high-end professional courses.
� TEQIP Phase II will be implemented after the successful completion of TEQIP Phase II. � Introduction of Diploma Level Courses in Polytechnics and ITIs. � Modernization of Workshops, Development of Institution campus and setting up/renovation of
Computer Centers. � Introduction of new trades/Diversification of existing trades.
3. Daman & Diu
The landscape of higher and technical education in the UT of Daman and Diu consists of Technical Training Institutes (TTIs) in both the districts of Daman and Diu. A Polytechnic College was established in Daman during 1990-91 and at present there is no College in Diu.
Some of the initiative that have been started by the Government here are with regard to enhancing infrastructure, improving quality of education imparted and incentives provided to students. Some of the initiatives have been listed below:
� Strengthening of Government College and promoting extracurricular and co curricular activities Govt. College in Daman.
� Strengthening and expansion of TTIs in Daman& Diu. � Craft training to tribal youth with the objective of providing technical training to tribal to enable
them to get suitable jobs in necessary industries. � Grant of merit cum means stipend to students for Professional/Technical Degree/ Diploma
Courses. � Establishment of Technical Education Cell in Daman, in order to coordinate technical education
in the state.
As there is a long way to go before higher education in the UT meets the standard of the nation, there are many initiative that have been proposed in order to make higher and technical education relevant and accessible to all in the UT. Some of them are:
� Establishing Model College in Diu in PPP mode with objective of providing opportunity of higher education to the students of UT of Daman and Diu district, which is identified as one of the higher educationally backward districts. Setting of Centre for Study of Business and Finance.
� Implementation of Vocational Education courses for out of school Government of India students. The scheme is aimed at providing employable skills to post matric drop out students who are working as unskilled workers in industry or remain unemployed. The Technical Training Institutes, Damn & Diu will conduct the appropriate training and act as an Accredited Vocational Institute (AVI). The vocational courses are affiliated with National Institute of Open Schooling (NIOS) and Technical Education Board, Gujarat State.
� Modernization of Technical Training Institutes in Daman & Diu. � Incentive to girl students for pursuing professional courses at UG and PG Levels. � Establishment of Govt. Polytechnic in Diu and a New Govt. Engineering College in Daman.
4. Dadra & Nagar Haveli
366 | ASHE - Annual Status of Higher Education in States and UTs, 2012
Dadra & Nagar Haveli is predominately inhabited by the Tribal community which constitutes 64 % of the population. Education is free of cost up to standard XII in the UT. A major problem faced by this state is that students have to look at neighbouring states like Gujarat and Maharashtra for Higher Education due to lack of facilities in the UT itself.
The Silvassa Institute of Higher Learning has been established as degree level college due a strong demand by the citizens of the UT. In 2011 the College started functioning with Arts and Commerce Stream. The College is affiliated to Gujarat University, Ahmadabad. This institute is financed under the Grant-in-Aid Scheme of the central government. Certain construction and up gradation work is under Capital Head during 12th Five Year Plan.
5. Lakshadweep
Most of colleges in Lakshadweep are affiliated to the University of Calicut. Though presently, Lakshadweep does not have many educational institutes, the state government is promoting higher education among schools and colleges. The colleges of the island offer degree courses in various disciplines of arts, science and technology. The Lakshadweep Colleges specializes in the departments of English, British History, World History, Chemistry, Mathematics, and Computer Applications, Physics, Botany, Zoology and other allied disciplines. The various colleges in Lakshadweep, besides imparting education thorough knowledge and quality education also focus on character building for effectively grooming responsible citizens for the country.
367 | ASHE - Annual Status of Higher Education in States and UTs, 2012
References
State Wise Data Sources
1. Andhra Pradesh � Socio Economic Survey, 2010-11:
http://dilipvaka.files.wordpress.com/2010/12/apeconomicsurvey2010-11english.pdf � Approach to 12th Five Year Plan, Andhra Pradesh
http://www.cess.ac.in/cesshome/pdf/Draft_Approach_to_12th_Plan_for_discussion.pdf � India Brand Equity Foundation- Andhra Pradesh, 2012
http://www.ibef.org/download/Andhra-Pradesh-260912.pdf
2. Arunachal Pradesh � India Brand Equity Foundation- Arunachal Pradesh, 2010
http://www.ibef.org/download/Arunachal_pradesh_190111.pdf � National Skill Development Corporation- Skill Gap Analysis of the North East: Arunachal
Pradesh http://www.nsdcindia.org/pdf/arunachal-pradesh-sg.pdf
3. Assam
� India Brand Equity Foundation- Assam, 2010 http://www.ibef.org/download/Assam_190111.pdf
� National Skill Development Corporation- Skill Gap Analysis of the North East: Assam http://www.nsdcindia.org/pdf/Assam-sg.pdf
4. Bihar
� Approach to 12th Five Year Plan, Bihar http://planning.bih.nic.in/Documents/DOC-01-06-08-2012.pdf
� India Brand Equity Foundation-Bihar, 2012 http://www.ibef.org/download/Bihar-260912.pdf
� Bihar Economic Survey, 2011 http://www.ibef.org/download/Bihar-260912.pdf
5. Chhattisgarh � India Brand Equity Foundation- Chhattisgarh, 2012
http://www.ibef.org/download/Chhattisgarh-260912.pdf � Economic Census, 2005 - Chhattisgarh
http://descg.gov.in/Economic%20Census%202005,%20DES%20CG.pdf
6. Goa � Goa Economic Survey, 2011-12
http://goadpse.gov.in/publications/ECONOMIC_SURVEY_2012-13.pdf � Goa Economic Survey, 2010-11
http://www.goa.gov.in/pdf/goa-esurvey-2010-2011.pdf � India Brand Equity Foundation-Goa, 2012
http://www.ibef.org/download/Goa-260912.pdf � Goa Statistical Handbook, 2008-09
http://www.goa.gov.in/pdf/goa-statistical-handbook-2008-09.pdf
368 | ASHE - Annual Status of Higher Education in States and UTs, 2012
7. Gujarat � Socio Economic Review
http://financedepartment.gujarat.gov.in/budget11_12_pdf/34_Socio_Economic_Review_English.pdf
� India Brand Equity Foundation-Gujarat,2012 http://www.ibef.org/download/Gujarat-260912.pdf
8. Haryana � India Brand Equity Foundation- Haryana, 2012
http://www.ibef.org/download/Haryana-260912.pdf
9. Himachal Pradesh � Himachal Pradesh Economic Survey,2011-12
http://himachal.nic.in/economics/pdfs/EconSurveyEng2012_A1b.pdf � Strategic Review of Government Machinery, Govt. of Himachal Pradesh
http://himachal.gov.in/hipa/ARC_HIPA_Report/6_Education.pdf � India Brand Equity Foundation-Himachal Pradesh, 2012
http://www.ibef.org/download/Himachal-Pradesh-260912.pdf � Himachal Pradesh Development Report, Planning Commission
http://planningcommission.nic.in/plans/stateplan/sdr_pdf/shdr_hp02.pdf
10. Jammu & Kashmir � Jammu & Kashmir Economic Survey, 2008-09
http://ecostatjk.nic.in/publications/release4.pdf � India Brand Equity Foundation, Jammu & Kashmir, 2012
http://www.ibef.org/download/Jammu-Kashmir-260912.pdf
11. Jharkhand � Jharkhand 5th Economic Census
http://www.desjharkhand.nic.in/files/fifth_economic_census.pdf � India Brand Equity Foundation-Jharkhand, 2012
http://www.ibef.org/download/Jharkhand-260912.pdf � Transforming Jharkhand: The Agenda for Action
http://jharkhand.gov.in/new_depts/pland/Transforming%20Jharkhand.pdf
12. Karnataka � Karnataka Economic Survey 2010-11
http://www.planning.kar.nic.in/sites/planning.kar.nic.in/files/ES_Final_Printing_English_13-3-11_5.30.pdf
� India Brand Equity Foundation-Karnataka,2012 http://www.ibef.org/download/Karnataka-260912.pdf
� Karnataka Vision Document 2020 http://kshec.co.in/images/vision-document-2020.pdf
13. Kerala
� Kerala State Planning Board: Labour & Employment http://www.spb.kerala.gov.in/images/pdf/er2011/pdf/Chapter05.pdf
� Kerala State Planning Board: Industry & Allied Sectors http://www.spb.kerala.gov.in/images/pdf/er2011/pdf/Chapter07.pdf
� India Brand Equity Foundation-Kerala, 2012 http://www.ibef.org/download/Kerala-260912.pdf
369 | ASHE - Annual Status of Higher Education in States and UTs, 2012
14. Madhya Pradesh � Madhya Pradesh Development Report, Planning Commission
http://planningcommission.nic.in/plans/stateplan/sdr/sdr_mp1909.pdf � India Brand Equity Foundation-Madhya Pradesh, 2012
http://www.ibef.org/download/Madhya-Pradesh-260912.pdf
15. Maharashtra � India Brand Equity Foundation- Maharashtra, 2012
http://www.ibef.org/download/Maharasthra-260912.pdf
16. Manipur � India Brand Equity Foundation- Manipur, 2010
http://www.ibef.org/download/Manipur_190111.pdf � National Skill Development Corporation- Skill Gap Analysis of the North East: Manipur
http://www.nsdcindia.org/pdf/Manipur-sg.pdf
17. Meghalaya � India Brand Equity Foundation- Meghalaya, 2010
http://www.ibef.org/download/Meghalaya_190111.pdf � National Skill Development Corporation- Skill Gap Analysis of the North East: Meghalaya
http://www.nsdcindia.org/pdf/Meghalaya-sg.pdf
18. Mizoram � India Brand Equity Foundation- Mizoram, 2010
http://www.ibef.org/download/Mizoram_190111.pdf � National Skill Development Corporation- Skill Gap Analysis of the North East: Mizoram
http://www.nsdcindia.org/pdf/Mizoram-sg.pdf
19. Nagaland � India Brand Equity Foundation- Nagaland, 2010
http://www.ibef.org/download/Assam_190111.pdf � National Skill Development Corporation- Skill Gap Analysis of the North East: Assam
http://www.nsdcindia.org/pdf/Nagaland-sg.pdf � Annual Administrative Report-2008-09
http://nagatechnicaledu.nic.in/ARR/ARR08n09.pdf � Annual Administrative Report, Department of Higher Education
http://www.highereducationngl.in/update13-5 2012/Higher_Education_Annual_Report2011-12.pdf
20. Odisha
� India Brand Equity Foundation- Odisha, 2012 http://www.ibef.org/download/Odisha-260912.pdf
� National Skill Development Corporation- Skill Gap Analysis of the North East: Odisha http://www.nsdcindia.org/pdf/odisha-skill-gap-report.pdf
21. Punjab
� 5th Economic Survey 2005, Punjab http://pbplanning.gov.in/pdf/Fifth%20Economic%20Census%202005.pdf
� Punjab Economic Survey, 2010-11 http://pbplanning.gov.in/pdf/economicsurvey%202011-12.pdf
� India Brand Equity Foundation, Punjab, 2012 http://www.ibef.org/download/Punjab-260912.pdf
370 | ASHE - Annual Status of Higher Education in States and UTs, 2012
� State Wise Analysis of Accreditation Reports- Punjab http://www.naac.gov.in/sites/naac.gov.in/files/Analysis_Punjab.pdf
22. Rajasthan � India Brand Equity Foundation- Rajasthan, 2012
http://www.ibef.org/download/Rajasthan-260912.pdf � Labour and Labour Welfare – Planning Department, Rajasthan
http://www.planning.rajasthan.gov.in/Twelfth%20Plan/Chapters/Chap_24_Labour.pdf
23. Sikkim � India Brand Equity Foundation- Sikkim, 2010
http://www.ibef.org/download/Sikkim_190111.pdf � National Skill Development Corporation- Skill Gap Analysis of the North East: Sikkim
http://www.nsdcindia.org/pdf/Sikkim-sg.pdf
24. Tamil Nadu � India Brand Equity Foundation- Tamil Nadu, 2012
http://www.ibef.org/download/Tamil-Nadu-260912.pdf � Economic Census, 2005 – Tamil Nadu
http://mospi.nic.in/mospi_new/upload/economic_census_2005%5CTamil20Nadu.pdf
25. Tripura � India Brand Equity Foundation- Tripura, 2010
http://www.ibef.org/download/Tripura_190111.pdf � National Skill Development Corporation- Skill Gap Analysis of the North East: Tripura
http://www.nsdcindia.org/pdf/Tripura-sg.pdf
26. Uttar Pradesh � India Brand Equity Foundation- Uttar Pradesh, 2012
http://www.ibef.org/download/UttarPradesh_140109.pdf � Poverty Alleviation & Employment, Planning Commission
http://planning.up.nic.in/Annual%20Plan%202010-11%20for%20website/Volume%20-%20I%20(%20Part-II)/Chapter-2.prn.pdf
27. Uttarakhand
� Uttarkhand Development Report, Planning Commission http://planningcommission.nic.in/plans/stateplan/sdr/sdr_uttarakhand1909.pdf
� Development Strategy for the Hill Districts of Uttarakhand, ICRIER http://www.icrier.org/pdf/Working_Paper_217.pdf
� India Brand Equity Foundation- Uttarakhand, 2012 http://www.ibef.org/download/Uttarakhand-260912.pdf
� Uttarakhand: The State Profile, PHD Chambers http://www.phdcci.in/admin/userfiles/file/Research-Bureau/Uttarakhand.pdf
28. West Bengal
� West Bengal Economic Review, 2011-12 http://www.wbfin.nic.in/writereaddata/EconomicReview11_Part2.pdf
� Annual Report of the Department of Higher Education, 2010-11 http://higherednwb.net/documents/annual%20report/annual%20report%202011.pdf
� India Brand Equity Foundation- West Bengal, 2012 http://www.ibef.org/download/West-Bengal-260912.pdf
371 | ASHE - Annual Status of Higher Education in States and UTs, 2012
29. Delhi � India Brand Equity Foundation- Delhi, 2012
http://www.ibef.org/download/Delhi-260912.pdf � Directorate of Economics and Statistics, Delhi
http://www.delhi.gov.in/wps/wcm/connect/9da222804b55d1ef8ca29f625bd7d0f4/Report+on+Emp+%26+Unemp+%2866th+Round%29.pdf?MOD=AJPERES&lmod=1938505935&CACHEID=9da222804b55d1ef8ca29f625bd7d0f4
30. Puducherry
� Confederation of Indian Industry: Note on Puducherry � Annual Plan, 2011-12
http://pandr.puducherry.gov.in/Plan%20Formulation/Plan%20Document/DAP%202011-12/pdffiles/int/int.pdf
Other Data Sources
1. Ministry of Human Resource Development, Government of India � Ministry of Human Resource Development-Annual Report, 2011-12
http://mhrd.gov.in/sites/upload_files/mhrd/files/AR2011-12.pdf � Statistics of Higher & Technical Education, 2006-07
http://mhrd.gov.in/sites/upload_files/mhrd/files/Abstract2006-07.pdf � Statistics of Higher & Technical Education, 2007-08
http://mhrd.gov.in/sites/upload_files/mhrd/files/Stat-HTE-200708_0.pdf � Statistics of Higher & Technical Education, 2008-09
http://mhrd.gov.in/sites/upload_files/mhrd/files/StatHTE_2008-09.pdf � Statistics of Higher & Technical Education, 2009-10
http://mhrd.gov.in/sites/upload_files/mhrd/files/Abstract2009-10_0.pdf
2. University Grants Commission, Government of India � All Universities and Colleges in India in 2011-12
http://www.ugc.ac.in/oldpdf/alluniversity.pdf � Inclusive and Qualitative Expansion Of Higher Education 12th Five-Year Plan, 2012-17
http://www.ugc.ac.in/ugcpdf/740315_12FYP.pdf � Higher Education at a Glance, 2011-12
http://oldwebsite.ugc.ac.in/pub/HEglance2012.pdf

Related Documents