Welcome message from author
This document is posted to help you gain knowledge. Please leave a comment to let me know what you think about it! Share it to your friends and learn new things together.
Transcript
CONTENTS
2 Introduction
2 Capital Adequacy
8 Capital Structure
9 Risk Management
10 Credit Risk
33 Securitization
33 Market Risk
34 Operational Risk
34 Equities
34 Interest Rate Risk/Rate of Return Risk
in the Banking Book (IRR/RORBB)
35 Profit Sharing Investment Accounts
and Shariah Governance

C i t i b a n k B e r h a d l 2 0 1 1 A n n u a l R e p o r t0 0 2
P i l l a r 3 D i s c l o s u r e
1. Introduction
Citibank Berhad was incorporated in Malaysia on 22 April 1994 and has its registered office at 165 Jalan Ampang, 50450 Kuala Lumpur, Malaysia. The Bank is licensed under the Banking and Financial Institution Act 1989 (“BAFIA”). The Bank also operates an Islamic window under the Islamic Banking Scheme licensed under the BAFIA Act 1989.
The group organization structure of Citibank Berhad is detailed below:-
The subsidiaries of Citibank Berhad are consolidated using the purchase method of accounting. The basis of consolidation for financial accounting purposes is the same as that used for regulatory purposes.
The Capital Requirements Directive (CRD), often referred to as Basel II, introduced the need for banks operating under this new legislative framework to publish certain information relating to their risk management and capital adequacy. The disclosure of this information is known as Pillar 3 and is designed to complement the other two pillars of the Basel II, namely the minimum capital requirements (Pillar 1) and the supervisory review process (Pillar 2). The disclosure has been prepared in accordance with the Guidelines for Risk Weighted Capital Adequacy Framework (Basel II) – Disclosure Requirements (Pillar 3) (BNM/RH/GL 001-32) and Capital Adequacy Framework for Islamic Banks (CAFIB) – Disclosure Requirements (Pillar 3) (BNM/RH/GL 007-18) issued by Bank Negara Malaysia (“BNM”).
Since 1 January 2008, the capital adequacy ratios of the Group and the Bank are computed in accordance with Bank Negara Malaysia’s revised Risk-Weighted Capital Adequacy Framework (RWCAF-Basel II). The Group and the Bank have adopted Standardized Approach (SA) for Credit Risk and Market Risk, and the Basic Indicator Approach (BIA) for Operational Risk.
There are no significant restrictions or major impediments on transfer of funds or regulatory capital within the Group.
There were no capital deficiencies in any of subsidiaries of the Group as at the financial year end.
This Pillar 3 disclosure should be read in conjunction with Citibank Berhad’s Financial Statements for the corresponding financial year.
2. Capital Adequacy
The Bank’s capital management is designed to ensure that it maintains sufficient capital consistent with the Bank’s risk profile and all applicable regulatory standards and guidelines. The Bank adopts a balanced approach in risk taking, balancing senior management and Board of Directors oversight with well-defined independent risk management functions. The Board engages senior management regularly in key activities that may impact capital assessment and adequacy.
Other than paid up capital of the Bank, the bank’s capital is historically generated via retained earnings from the business.
100%
Citigroup Nominees (Tempatan) Sdn. Bhd.*
Citigroup Nominees(Asing) Sdn. Bhd.*
Citibank Berhad
Citigroup Nominee (Malaysia) Sdn. Bhd.
100% 100%
* Principal activity is as a nominee company

C i t i b a n k B e r h a d l 2 0 1 1 A n n u a l R e p o r t 0 0 3
P i l l a r 3 D i s c l o s u r e
2. Capital Adequacy (continued)
The risk weighted assets and Capital Adequacy Ratios of Citibank Berhad are as follows:-
Dec 2011 Dec 2010
RM’000 RM’000
Computation of Total Risk Weighted Assets (RWA)
Total Credit RWA 22,272,830 19,954,371
Credit RWA Absorbed by PSIA - -
Total Market RWA 2,019,640 2,398,682
Market RWA Absorbed by PSIA - -
Total Operational RWA 3,525,964 3,550,272
Large Exposure Risk RWA for Equity Holdings - -
Total Risk Weighted Assets 27,818,434 25,903,325
Computation of Capital Ratios
Tier 1 Capital 4,008,709 3,565,282
Capital Base 4,262,475 3,801,235
Before deducting proposed dividends
Core Capital Ratio 14.41% 13.76%
Risk-Weighted Capital Ratio 15.32% 14.67%
After deducting proposed dividends / dividend payment
Core Capital Ratio 13.33% 12.61%
Risk-Weighted Capital Ratio 14.24% 13.52%
The risk weighted assets and Capital Adequacy Ratios for the Islamic Banking Window are as follows:
Dec 2011 Dec 2010
RM’000 RM’000
Computation of Total Risk Weighted Assets (RWA)
Total Credit RWA 199,050 436,946
Credit RWA Absorbed by PSIA - -
Total Market RWA 20,319 79,687
Market RWA Absorbed by PSIA - -
Total Operational RWA 84,785 92,001
Large Exposure Risk RWA for Equity Holdings - -
Total Risk Weighted Assets 304,154 608,634
Computation of Capital Ratios
Tier 1 Capital 225,131 203,761
Capital Base 231,517 210,955
Core Capital Ratio 74.02% 33.48%
Risk-Weighted Capital Ratio 76.12% 34.66%
The above ratios are well above the regulatory requirements for Total Capital Adequacy Ratios of 8%.
C i t i b a n k B e r h a d l 2 0 1 1 A n n u a l R e p o r t0 0 4
P i l l a r 3 D i s c l o s u r e
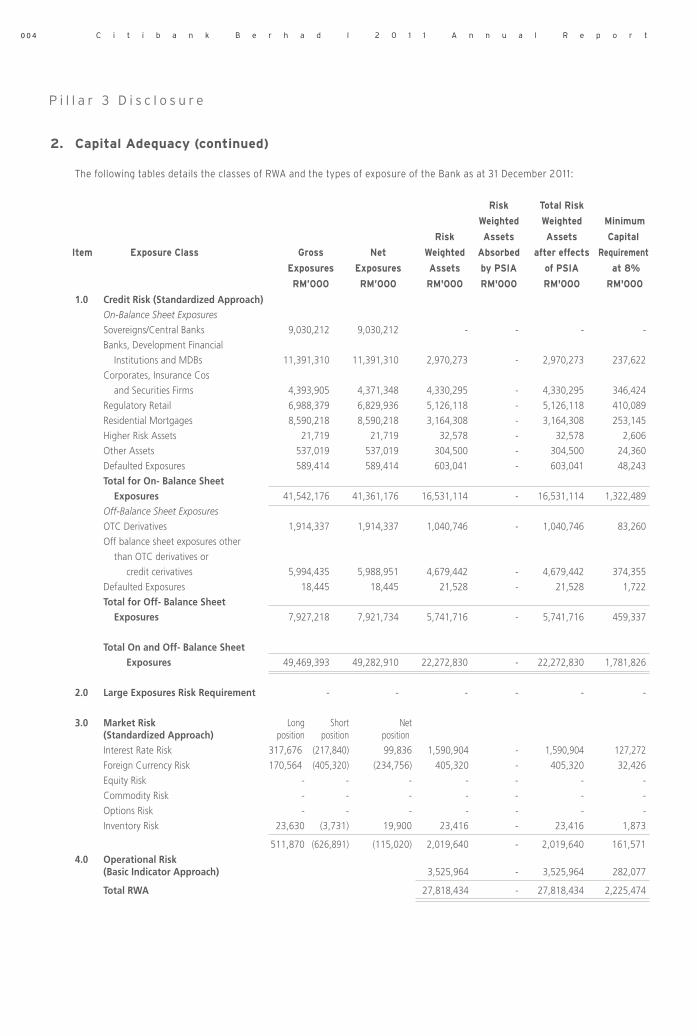
2. Capital Adequacy (continued) The following tables details the classes of RWA and the types of exposure of the Bank as at 31 December 2011 :
Risk Total Risk
Weighted Weighted Minimum
Risk Assets Assets Capital
Item Exposure Class Gross Net Weighted Absorbed after effects Requirement
Exposures Exposures Assets by PSIA of PSIA at 8%
RM’000 RM’000 RM'000 RM'000 RM'000 RM'000
1.0 Credit Risk (Standardized Approach) On-Balance Sheet Exposures
Sovereigns/Central Banks 9,030,212 9,030,212 - - - -
Banks, Development Financial
Institutions and MDBs 11,391,310 11,391,310 2,970,273 - 2,970,273 237,622
Corporates, Insurance Cos
and Securities Firms 4,393,905 4,371,348 4,330,295 - 4,330,295 346,424
Regulatory Retail 6,988,379 6,829,936 5,126,118 - 5,126,118 410,089
Residential Mortgages 8,590,218 8,590,218 3,164,308 - 3,164,308 253,145
Higher Risk Assets 21,719 21,719 32,578 - 32,578 2,606
Other Assets 537,019 537,019 304,500 - 304,500 24,360
Defaulted Exposures 589,414 589,414 603,041 - 603,041 48,243
Total for On- Balance Sheet Exposures 41,542,176 41,361,176 16,531,114 - 16,531,114 1,322,489
Off-Balance Sheet Exposures
OTC Derivatives 1,914,337 1,914,337 1,040,746 - 1,040,746 83,260
Off balance sheet exposures other
than OTC derivatives or
credit cerivatives 5,994,435 5,988,951 4,679,442 - 4,679,442 374,355
Defaulted Exposures 18,445 18,445 21,528 - 21,528 1,722
Total for Off- Balance Sheet Exposures 7,927,218 7,921,734 5,741,716 - 5,741,716 459,337
Total On and Off- Balance Sheet Exposures 49,469,393 49,282,910 22,272,830 - 22,272,830 1,781,826
2.0 Large Exposures Risk Requirement - - - - - -
3.0 Market Risk Long Short Net (Standardized Approach) position position position
Interest Rate Risk 317,676 (217,840) 99,836 1,590,904 - 1,590,904 127,272
Foreign Currency Risk 170,564 (405,320) (234,756) 405,320 - 405,320 32,426
Equity Risk - - - - - - -
Commodity Risk - - - - - - -
Options Risk - - - - - - -
Inventory Risk 23,630 (3,731) 19,900 23,416 - 23,416 1,873
511,870 (626,891) (115,020) 2,019,640 - 2,019,640 161,571
4.0 Operational Risk (Basic Indicator Approach) 3,525,964 - 3,525,964 282,077
Total RWA 27,818,434 - 27,818,434 2,225,474

C i t i b a n k B e r h a d l 2 0 1 1 A n n u a l R e p o r t 0 0 5
P i l l a r 3 D i s c l o s u r e
2. Capital Adequacy (continued)
The following tables details the classes of RWA and the types of exposure of the Islamic Banking Window as at 31 December 2011 :
Risk Total Risk
Weighted Weighted Minimum
Risk Assets Assets Capital
Item Exposure Class Gross Net Weighted Absorbed after effects Requirement
Exposures Exposures Assets by PSIA of PSIA at 8%
RM’000 RM’000 RM'000 RM'000 RM'000 RM'000
1.0 Credit Risk (Standardized Approach) On-Balance Sheet Exposures
Sovereigns/Central Banks 502,232 502,232 - - - -
Corporates 842 842 842 - 842 67
Residential Mortgages 443,796 443,796 165,277 - 165,277 13,222
Higher Risk Assets 58 58 88 - 88 7
Other Assets 11,213 11,213 8,350 - 8,350 668
Defaulted Exposures 5,843 5,843 5,843 - 5,843 467
Total for On- Balance Sheet Exposures 963,984 963,984 180,400 - 180,400 14,432
Off-Balance Sheet Exposures
OTC Derivatives 28,721 28,721 15,344 - 15,344 1,228
Off balance sheet exposures other
than OTC derivatives or
credit cerivatives 4,447 4,447 3,305 - 3,305 264
Defaulted Exposures 1 1 1 - 1 -
Total for Off- Balance Sheet Exposures 33,169 33,169 18,651 - 18,651 1,492
Total On and Off- Balance Sheet Exposures 997,153 997,153 199,050 - 199,050 15,924
2.0 Large Exposures Risk Requirement - - - - - -
3.0 Market Risk Long Short Net (Standardized Approach) position position position
Benchmark Rate Risk 1,625 - 1,625 20,319 - 20,319 1,625
Foreign Currency Risk - - - - - - -
Equity Risk - - - - - - -
Commodity Risk - - - - - - -
Options Risk - - - - - - -
Inventory Risk - - - - - - -
4.0 Operational Risk (Basic Indicator Approach) 84,785 - 84,785 6,783
Total RWA 304,154 - 304,154 24,332

C i t i b a n k B e r h a d l 2 0 1 1 A n n u a l R e p o r t0 0 6
P i l l a r 3 D i s c l o s u r e
2. Capital Adequacy (continued) The following table details the classes of RWA and the types of exposure of the Bank as at 31 December 2010:
Risk Total Risk
Weighted Weighted Minimum
Risk Assets Assets Capital
Item Exposure Class Gross Net Weighted Absorbed after effects Requirement
Exposures Exposures Assets by PSIA of PSIA at 8%
RM’000 RM’000 RM'000 RM'000 RM'000 RM'000
1.0 Credit Risk (Standardized Approach) On-Balance Sheet Exposures
Sovereigns/Central Banks 8,111,852 8,111,852 274 - 274 22
Banks, Development Financial
Institutions and MDBs 6,463,580 6,463,580 1,417,201 - 1,417,201 113,376
Insurance Cos, Securities Firms
and Fund Managers 254 254 - - - -
Corporates 3,078,104 3,076,833 3,021,479 - 3,021,479 241,718
Regulatory Retail 6,770,010 6,605,653 4,954,240 - 4,954,240 396,339
Residential Mortgages 9,164,982 9,164,982 3,479,201 - 3,479,201 278,336
Higher Risk Assets 40,145 40,145 60,218 - 60,218 4,817
Other Assets 659,283 659,283 597,800 - 597,800 47,824
Defaulted Exposures 651,337 651,337 672,800 - 672,800 53,824
Total for On- Balance Sheet Exposures 34,939,546 34,773,918 14,203,212 - 14,203,212 1,136,257
Off-Balance Sheet Exposures
OTC Derivatives 2,199,313 2,199,313 1,273,623 - 1,273,623 101,890
Off balance sheet exposures other
than OTC derivatives or
credit cerivatives 5,572,879 5,569,664 4,441,926 - 4,441,926 355,354
Defaulted Exposures 32,701 32,701 35,610 - 35,610 2,849
Total for Off- Balance Sheet Exposures 7,804,893 7,801,678 5,751,159 - 5,751,159 460,093
Total On and Off- Balance Sheet Exposures 42,744,439 42,575,596 19,954,371 - 19,954,371 1,596,350
2.0 Large Exposures Risk Requirement - - - - - -
3.0 Market Risk Long Short Net (Standardized Approach) position position position
Interest Rate Risk 316,277 (255,670) 60,607 1,125,706 - 1,125,706 90,056
Foreign Currency Risk 146,021 (1,205,930) (1,059,909) 1,205,930 - 1,205,930 96,474
Equity Risk - - - - - - -
Commodity Risk - - - - - - -
Options Risk - - - - - - -
Inventory Risk 9,412 (1,820) 7,593 67,046 - 67,046 5,364
471,711 (1,463,420) (991,709) 2,398,682 - 2,398,682 191,895
4.0 Operational Risk (Basic Indicator Approach) 3,550,272 - 3,550,272 284,022
Total RWA 25,903,325 - 25,903,325 2,072,266

C i t i b a n k B e r h a d l 2 0 1 1 A n n u a l R e p o r t 0 0 7
P i l l a r 3 D i s c l o s u r e
2. Capital Adequacy (continued)
The following tables details the classes of RWA and the types of exposure of the Islamic Banking Window as at 31 December 2010:
Risk Total Risk
Weighted Weighted Minimum
Risk Assets Assets Capital
Item Exposure Class Gross Net Weighted Absorbed after effects Requirement
Exposures Exposures Assets by PSIA of PSIA at 8%
RM’000 RM’000 RM'000 RM'000 RM'000 RM'000
1.0 Credit Risk (Standardized Approach) On-Balance Sheet Exposures
Sovereigns/Central Banks 665,218 665,218 - - - -
Corporates 19,908 19,908 19,908 - 19,908 1,593
Residential Mortgages 493,563 493,563 224,151 - 224,151 17,932
Higher Risk Assets 601 601 901 - 901 72
Other Assets 14,716 14,716 10,415 - 10,415 833
Defaulted Exposures 9,094 9,094 10,599 - 10,599 848
Total for On- Balance Sheet Exposures 1,203,101 1,203,101 265,974 - 265,974 21,278
Off-Balance Sheet Exposures
OTC Derivatives 173,956 173,956 167,660 - 167,660 13,413
Off balance sheet exposures other
than OTC derivatives or
credit cerivatives 8,341 8,341 3,312 - 3,312 265
Total for Off- Balance Sheet Exposures 182,297 182,297 170,972 - 170,972 13,678
Total On and Off- Balance Sheet Exposures 1,385,398 1,385,398 436,946 - 436,946 34,956
2.0 Large Exposures Risk Requirement - - - - - -
3.0 Market Risk Long Short Net (Standardized Approach) position position position
Benchmark Rate Risk 6,375 - 6,375 79,687 - 79,687 6,375
Foreign Currency Risk - - - - - - -
Equity Risk - - - - - - -
Commodity Risk - - - - - - -
Options Risk - - - - - - -
Inventory Risk - - - - - - -
4.0 Operational Risk (Basic Indicator Approach) 92,001 - 92,001 7,360
Total RWA 608,634 - 608,634 48,691

C i t i b a n k B e r h a d l 2 0 1 1 A n n u a l R e p o r t0 0 8
P i l l a r 3 D i s c l o s u r e
3. Capital Structure
The following details the capital structure for the Group and Bank: Group and Bank
Dec 2011 Dec 2010
RM’000 RM’000
Tier I CapitalPaid Up Share Capital 121,697 121,697
Share Premium 380,303 380,303
Retained earnings 3,388,271 2,998,408
Other Reserves 121,697 121,697
4,011,968 3,622,105
less: Deferred Tax Assets (3,259) (56,823)
Total Tier 1 Capital 4,008,709 3,565,282 Tier II CapitalCollective assessment allowance for impaired loans and financing 253,786 235,973
General allowance for bad and doubtful debts and financing - -
Maximum allowable subordinated debt capital - -
Total Tier II Capital 253,786 235,973
Total Eligible Tier 2 Capital 253,786 235,973
less: Investment in Subsidiaries (20) (20)
Capital Base 4,262,475 3,801,235
The following details the capital structure for the Islamic Banking Window:
Dec 2011 Dec 2010
RM’000 RM’000
Tier I CapitalFund allocated 20,000 20,000
Retained earnings 205,550 184,714
Other reserves - -
225,550 204,714
less: Deferred Tax Assets (419) (953)
Total Tier 1 Capital 225,131 203,761 Tier II CapitalCollective assessment allowance for impaired financing, advances and other loans 6,386 7,194
General allowance for bad and doubtful debts and financing - -
Capital Base 231,517 210,955
The capital structure of the Group and the Bank as disclosed above does not have any specific terms and conditions attached to them.

C i t i b a n k B e r h a d l 2 0 1 1 A n n u a l R e p o r t 0 0 9
P i l l a r 3 D i s c l o s u r e
4. Risk Management
A sound risk management process, strong internal controls and well documented policies and procedures are the foundation for ensuring the safety and soundness of the Bank. The Board and Senior Management ensure that capital levels are adequate for the Bank’s risk profile. They also ensure that the risk management and control processes are appropriate in the light of the Bank’s risk profile and business plans.
The Bank has put in place a risk management system, which leverages in part the risk management framework developed by Citigroup, to oversee and monitor material risks faced by the Bank, including credit, market and operational risks. The Audit Committee assists the Board in overseeing legal, compliance and operational risks and is supported by the Bank’s audit and compliance functions. The Audit Committee will review the audit findings of the compliance and internal audit functions at its quarterly meetings, including management’s response to the audit findings and progress of the related corrective action plans. The Bank’s management, Audit Committee and relevant bank personnel will update the Board during its quarterly meetings about pertinent operational, legal and compliance risk management issues which have arisen during the quarter such as reporting risk positions and performance, capital requirements, risk and control limits.
The Bank has a Risk Management Committee, which together with the Audit Committee and management team assists the Board in fulfilling its oversight responsibility relating to the establishment and operation of a risk management system. The Risk Management Committee has particular oversight of credit, market and liquidity risk; reviews acquisition and disposal of large securities positions of the Bank; and monitors the progress of the Basel II implementation.
The compositions of the Audit Committee and Risk Management Committee are disclosed in the Statement of Corporate Governance in Citibank Berhad’s Annual Report.
Strategies & Policies
The Bank's risk management framework recognizes the diversity of the organization's activities by balancing the Board's strong supervision with well-defined independent risk management functions within each business area.
The risk management framework is firmly based on the following six principles, applicable across the board for all businesses and risk types:
• Risk management policies are integrated with business plans and strategies;
• All risks and returns resulting from this are owned and managed by an accountable business unit;
• All risks are managed within a limited framework while the risk limits are endorsed by the business management and approved by an independent risk management organization;
• All risk management policies are clearly and formally documented;
• All risks are measured using well defined methodologies, including stress testing; and
• All risks are comprehensively reported across the organization.
Risks are regularly reviewed by independent risk managers, senior business managers and whenever appropriate, by the Board of Directors themselves.
The independent risk managers are responsible for establishing and implementing risk management policies and practices within their business units while ensuring consistency with Citi’s corporate standards.
The independent risk managers are ultimately accountable to the Board and on a day-to-day basis; they are also individually responsible for meeting and responding to the needs of their respective business units, apart from overseeing their existing portfolio risks.
To assess adequacy of the Bank’s capital to support its current and future activities, the Bank has identified material risks applicable to the Citibank Berhad’s lines of business, in accordance with the Guidelines for Risk Weighted Capital Adequacy Framework (Basel II) – Internal Capital Adequacy Assessment Process (Pillar 2) issued by BNM (BNM/RH/GL 001-33). Material risks are regularly reviewed by senior management and presented to the Board of Directors. For the purpose of Pillar 3, the following material risks are discussed in this document: Credit Risk, Market Risk (comprising Price Risk, Liquidity Risk, Interest Rate Risk in the Banking Book (“IRRBB”)) and Operational Risk.

C i t i b a n k B e r h a d l 2 0 1 1 A n n u a l R e p o r t0 1 0
P i l l a r 3 D i s c l o s u r e
5. Credit Risk
Credit risk is the potential for financial loss resulting from the failure of a borrower or counter party to honor its financial or contractual obligations.
Credit risk arises in lending, trading and derivatives transactions, securities transactions, settlement and when the Bank acts as an intermediary on behalf of its clients and other third parties. For the retail bank, credit risk arises by way of the borrower being unable to fulfill his contractual commitments thereby resulting in causing credit losses to the Bank.
5.1 Credit Risk management policy
While business managers and independent risk management are jointly responsible for managing the risk/return tradeoffs as well as establishing limits and risk management practices, the origination and approval roles are clearly defined and segregated.
In addition to conforming to established corporate standards, independent credit risk management is responsible for establishing local policies that comply with local regulations and any other relevant legal requirements.
These standards will cover credit origination, measurement and documentation as well as problem recognition, classification and remedial actions. In addition, specific write-off criterion is set according to Citigroup’s corporate requirements or the BNM guideline BNM/RH/GC-007-17 on Classification and Impairment Provisions for Loans/Financing, whichever is more stringent.
Independent credit risk management is also responsible for implementing portfolio limits, including obligor limits through risk rating, maturity and business segments to ensure diversification of portfolio. The Risk management team also evaluates the immediate to long term risks for all products and segments thus providing for profitability on a long term sustainable basis.
Continuous monitoring of credit behavior aided by sophisticated debt rating modules, plus portfolio delinquency performance allows independent credit risk management to constantly assess the health of the credit portfolio.
5.2 Definition of past due and impaired loans
Definition of past due loans are disclosed in Note 2(g) of the financial statements.
A loan is impaired when there is objective evidence that demonstrates that a loss event has occurred after the initial recognition of the loan, and that the loss event has an impact on the future cash flows of the loan.
Objective evidence that a loan or a loan portfolio is impaired includes observable data that could include the following loss events:
• significant financial difficulty of the issuer or obligor;
• a breach of contract, such as a default or delinquency in interest or principal payments;
• it becomes probable that the borrower will enter bankruptcy or other financial reorganisation;
• observable data relating to a portfolio of financial assets such as :
i) adverse changes in the payment status of borrowers in the portfolio; and
ii) national or local economic conditions that correlate with defaults on the assets in the portfolio.
Under the revised policy issued by BNM on Classification and Impairment Provisions for Loan Financing, if the repayment conduct of the loan is past due for more than 90 days of either principal, interest or both, the loan shall be classified as impaired. The Bank applies this policy in addition to the above when determining if a loan is impaired.
5.3 Impairment Provision
The Bank complies with the Financial Reporting Standards (“FRS”) 139, Financial Instruments: Recognition and Measurement for loan impairment.
5.3.1 Individual Impairment
The Bank assesses whether objective evidence of impairment exists individually for financial assets that are individually significant. For financial assets that are not individually significant assessment for impairment is done individually and/or collectively. If the Group determines that no objective
C i t i b a n k B e r h a d l 2 0 1 1 A n n u a l R e p o r t 0 1 1
P i l l a r 3 D i s c l o s u r e
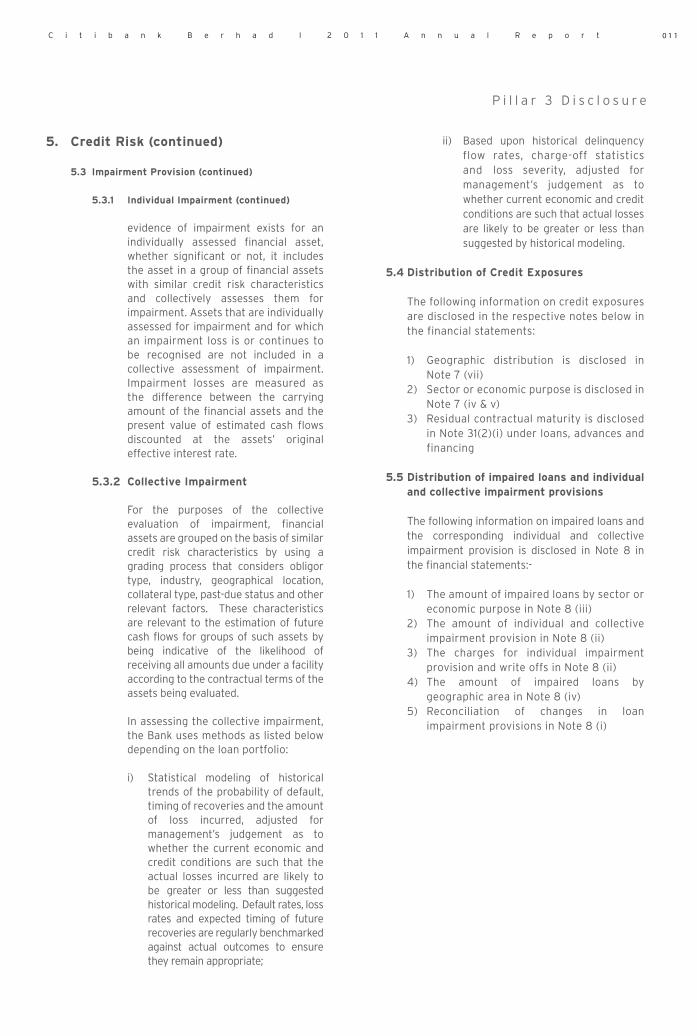
5. Credit Risk (continued) 5.3 Impairment Provision (continued)
5.3.1 Individual Impairment (continued)
evidence of impairment exists for an individually assessed financial asset, whether significant or not, it includes the asset in a group of financial assets with similar credit risk characteristics and collectively assesses them for impairment. Assets that are individually assessed for impairment and for which an impairment loss is or continues to be recognised are not included in a collective assessment of impairment. Impairment losses are measured as the difference between the carrying amount of the financial assets and the present value of estimated cash flows discounted at the assets’ original effective interest rate.
5.3.2 Collective Impairment
For the purposes of the collective evaluation of impairment, financial assets are grouped on the basis of similar credit risk characteristics by using a grading process that considers obligor type, industry, geographical location, collateral type, past-due status and other relevant factors. These characteristics are relevant to the estimation of future cash flows for groups of such assets by being indicative of the likelihood of receiving all amounts due under a facility according to the contractual terms of the assets being evaluated.
In assessing the collective impairment, the Bank uses methods as listed below depending on the loan portfolio:
i) Statistical modeling of historical trends of the probability of default, timing of recoveries and the amount of loss incurred, adjusted for management’s judgement as to whether the current economic and credit conditions are such that the actual losses incurred are likely to be greater or less than suggested historical modeling. Default rates, loss rates and expected timing of future recoveries are regularly benchmarked against actual outcomes to ensure they remain appropriate;
ii) Based upon historical delinquency flow rates, charge-off statistics and loss severity, adjusted for management’s judgement as to whether current economic and credit conditions are such that actual losses are likely to be greater or less than suggested by historical modeling.
5.4 Distribution of Credit Exposures
The following information on credit exposures are disclosed in the respective notes below in the financial statements:
1) Geographic distribution is disclosed in Note 7 (vii)
2) Sector or economic purpose is disclosed in Note 7 (iv & v)
3) Residual contractual maturity is disclosed in Note 31(2)(i) under loans, advances and financing
5.5 Distribution of impaired loans and individual and collective impairment provisions
The following information on impaired loans and the corresponding individual and collective impairment provision is disclosed in Note 8 in the financial statements:-
1) The amount of impaired loans by sector or economic purpose in Note 8 (iii)
2) The amount of individual and collective impairment provision in Note 8 (ii)
3) The charges for individual impairment provision and write offs in Note 8 (ii)
4) The amount of impaired loans by geographic area in Note 8 (iv)
5) Reconciliation of changes in loan impairment provisions in Note 8 (i)

C i t i b a n k B e r h a d l 2 0 1 1 A n n u a l R e p o r t0 1 2
P i l l a r 3 D i s c l o s u r e
5. Credit Risk (continued)
5.6 External Credit Assessment Institutions (ECAIs)
In terms of assessing Counterparty Credit Risk, Citibank Berhad uses ratings by global agencies Fitch Ratings, Moody’s Investor Services, and Standard & Poor’s. Citibank Berhad also uses ratings from local agencies Rating Agency Malaysia (RAM) Berhad and Malaysian Rating Corporation (MARC) Berhad.
The Bank uses a regional system called Asia Pacific Reveleus to calculate its risk weighted assets and this system receives its external ratings from a credit system that has a feed for external ratings from approved ECAIs. The mapping of external ratings to the respective counterparties and exposures is automated in the system.
The Bank uses issue-specific ratings for securities. In general, where no issue-specific rating exists, the credit rating assigned to the counterparty of a particular credit exposure is used. Where an exposure has neither an issue-specific rating nor counterparty rating, it is deemed as unrated.
The alignment of the alphanumerical scale of each recognized ECAIs used by Citibank Berhad is detailed in the table below:
CREDIT QUALITY GRADES AND ELIGIBLE ECAIs
Credit Quality Grade 1 2 3 4 5 6 Unrated
Reveleus CQG (Basel Credit Ratings)
Rating Source Rating Agencies AAA A+ BBB+ BB+ B+ CCC+ Unrated
CCC+
AAA CCC
AA+ A+ BBB+ BB+ B+ CCC-
Central Fitch Ratings AA A BBB BB B CC
AA- A- BBB- BB- B- C
D
Caa1
Aaa Caa2
Central Moody's Investor Services Aa1 A1 Baa1 Ba1 B1 Caa3
Aa2 A2 Baa2 Ba2 B2 Ca
Aa3 A3 Baa3 Ba3 B3 C
CCC+
CCC
Central Standard & Poor's AAA CCC-
AA+ A+ BBB+ BB+ B+ CC
AA A BBB BB B C
AA- A- BBB- BB- B- D
AAA C1
Local Rating Agency Aa1 A1 BBB1 BB1 B1 C2
Malaysia Berhad (RAM) Aa2 A2 BBB2 BB2 B2 C3
Aa3 A3 BBB3 BB3 B3 D
AAA
Local Malaysian Rating AA+ A+ BBB+ BB+ B+
Corporation Berhad (MARC) AA A BBB BB B C
AA- A- BBB- BB- B- D
AAA CCC
Central Rating and Investment AA+ A+ BBB+ BB+ B+ CC
Information Inc AA A BBB BB B C
AA- A- BBB- BB- B- D

C i t i b a n k B e r h a d l 2 0 1 1 A n n u a l R e p o r t 0 1 3
P i l l a r 3 D i s c l o s u r e
5. Credit Risk (continued)
The following tables show Citibank Berhad’s rated and unrated exposures according to ratings by ECAIs:
5.6.1 Ratings of Corporates by Approved ECAIs
December 2011
Group and Bank
Ratings of Corporates by Approved ECAIs (amounts in RM'000)
Moodys Aaa to Aa3 A1 to A3 Baa1 to Ba3 B1 to C Unrated S&P AAA to AA- A+ to A- BBB+ to BB- B+ to D Unrated Exposure Class Fitch AAA to AA- A+ to A- BBB+ to BB- B+ to D Unrated Total RAM AAA to AA3 A to A3 BBB1 to BB3 B1 to C Unrated MARC AAA to AA- A+ to A- BBB+ to BB- B+ to D Unrated
Rating & Investment Inc AAA to AA- A+ to A- BBB+ to BB- B+ to D Unrated
Public Sector Entities (applicable for entities risk - - - - - - weighted based on their external ratings as corporates)
Insurance Cos, Securities Firms and Fund Managers 4,262 12,369 - - 26,370 43,001 Corporates 20,169 24,103 4,211 - 6,489,590 6,538,072
Islamic Banking Window
Ratings of Corporates by Approved ECAIs (amounts in RM'000)
Moodys Aaa to Aa3 A1 to A3 Baa1 to Ba3 B1 to C Unrated S&P AAA to AA- A+ to A- BBB+ to BB- B+ to D Unrated Exposure Class Fitch AAA to AA- A+ to A- BBB+ to BB- B+ to D Unrated Total RAM AAA to AA3 A to A3 BBB1 to BB3 B1 to C Unrated MARC AAA to AA- A+ to A- BBB+ to BB- B+ to D Unrated
Entities (applicable for entities risk - - - - - - weighted based on their external ratings as corporates)
Insurance Cos, Securities Firms and Fund Managers - - - - - -
Corporates - - - - 874 874
C i t i b a n k B e r h a d l 2 0 1 1 A n n u a l R e p o r t0 1 4
P i l l a r 3 D i s c l o s u r e
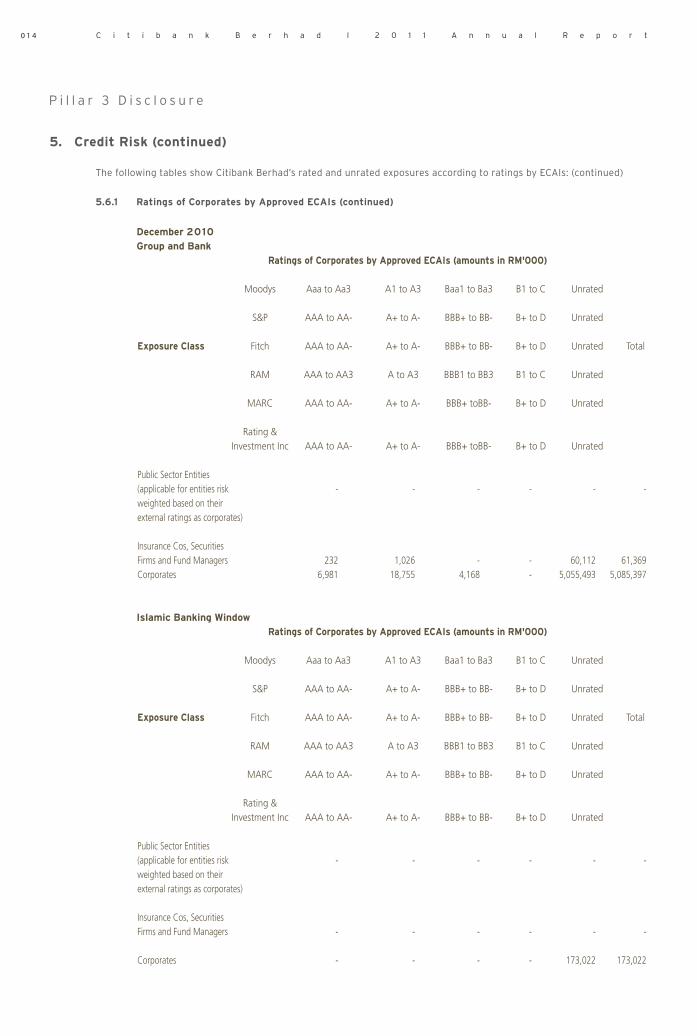
5. Credit Risk (continued)
The following tables show Citibank Berhad’s rated and unrated exposures according to ratings by ECAIs: (continued)
5.6.1 Ratings of Corporates by Approved ECAIs (continued)
December 2010
Group and Bank
Ratings of Corporates by Approved ECAIs (amounts in RM'000)
Moodys Aaa to Aa3 A1 to A3 Baa1 to Ba3 B1 to C Unrated S&P AAA to AA- A+ to A- BBB+ to BB- B+ to D Unrated Exposure Class Fitch AAA to AA- A+ to A- BBB+ to BB- B+ to D Unrated Total RAM AAA to AA3 A to A3 BBB1 to BB3 B1 to C Unrated MARC AAA to AA- A+ to A- BBB+ toBB- B+ to D Unrated
Rating & Investment Inc AAA to AA- A+ to A- BBB+ toBB- B+ to D Unrated
Public Sector Entities (applicable for entities risk - - - - - - weighted based on their external ratings as corporates)
Insurance Cos, Securities Firms and Fund Managers 232 1,026 - - 60,112 61,369 Corporates 6,981 18,755 4,168 - 5,055,493 5,085,397
Islamic Banking Window
Ratings of Corporates by Approved ECAIs (amounts in RM'000)
Moodys Aaa to Aa3 A1 to A3 Baa1 to Ba3 B1 to C Unrated S&P AAA to AA- A+ to A- BBB+ to BB- B+ to D Unrated Exposure Class Fitch AAA to AA- A+ to A- BBB+ to BB- B+ to D Unrated Total RAM AAA to AA3 A to A3 BBB1 to BB3 B1 to C Unrated MARC AAA to AA- A+ to A- BBB+ to BB- B+ to D Unrated Rating & Investment Inc AAA to AA- A+ to A- BBB+ to BB- B+ to D Unrated
Public Sector Entities (applicable for entities risk - - - - - - weighted based on their external ratings as corporates)
Insurance Cos, Securities Firms and Fund Managers - - - - - -
Corporates - - - - 173,022 173,022

C i t i b a n k B e r h a d l 2 0 1 1 A n n u a l R e p o r t 0 1 5
P i l l a r 3 D i s c l o s u r e
5. Credit Risk (continued) 5.6.2 Short Term Ratings of Banking Institutions and Corporates by Approved ECAIs
This disclosure does not apply to Citibank Berhad as it uses long term ratings for all exposures.
5.6.3 Ratings of Sovereigns and Central Banks by Approved ECAIs
December 2011
Group and Bank
Ratings of Sovereign/Central Banks by Approved ECAIs (amounts in RM'000)
Moodys Aaa to Aa3 A1 to A3 Baa1 to Ba3 Ba1 to B3 Caa1 to C Unrated
S&P AAA to AA- A+ to A- BBB+ to BB- BB+ to B- CCC+ to D Unrated
Exposure Class Fitch AAA to AA- A+ to A- BBB+ to BB- BB+ to B- CCC+ to D Unrated Total
Rating & AAA to AA- A+ to A- BBB+ to BB- BB+ to B- CCC+ to C Unrated
Investment
Inc
Sovereigns/
Central Banks - 9,050,336 - - - - 9,050,336
Islamic Banking Window
Ratings of Sovereign/Central Banks by Approved ECAIs (amounts in RM'000)
Moodys Aaa to Aa3 A1 to A3 Baa1 to Ba3 Ba1 to B3 Caa1 to C Unrated
S&P AAA to AA- A+ to A- BBB+ to BB- BB+ to B- CCC+ to D Unrated
Exposure Class Fitch AAA to AA- A+ to A- BBB+ to BB- BB+ to B- CCC+ to D Unrated Total
Sovereigns/
Central Banks - 502,232 - - - - 502,232

C i t i b a n k B e r h a d l 2 0 1 1 A n n u a l R e p o r t0 1 6
P i l l a r 3 D i s c l o s u r e
5. Credit Risk (continued)
5.6.3 Ratings of Sovereigns and Central Banks by Approved ECAIs (continued)
December 2010
Group and Bank
Ratings of Sovereign/Central Banks by Approved ECAIs (amounts in RM'000)
Moodys Aaa to Aa3 A1 to A3 Baa1 to Ba3 Ba1 to B3 Caa1 to C Unrated
S&P AAA to AA- A+ to A- BBB+ to BB- BB+ to B- CCC+ to D Unrated
Exposure Class Fitch AAA to AA- A+ to A- BBB+ to BB- BB+ to B- CCC+ to D Unrated Total
Rating & AAA to AA- A+ to A- BBB+ to BB- BB+ to B- CCC+ to C Unrated
Investment
Inc
Sovereigns/
Central Banks 111,711 7,142,517 - - - 914,540 8,168,768
Islamic Banking Window
Ratings of Sovereign/Central Banks by Approved ECAIs (amounts in RM'000)
Moodys Aaa to Aa3 A1 to A3 Baa1 to Ba3 Ba1 to B3 Caa1 to C Unrated
S&P AAA to AA- A+ to A- BBB+ to BB- BB+ to B- CCC+ to D Unrated
Exposure Class Fitch AAA to AA- A+ to A- BBB+ to BB- BB+ to B- CCC+ to D Unrated Total
Rating & AAA to AA- A+ to A- BBB+ to BB- BB+ to B- CCC+ to C Unrated
Investment
Inc
Sovereigns/
Central Banks - 85,160 - - - 580,059 665,218

C i t i b a n k B e r h a d l 2 0 1 1 A n n u a l R e p o r t 0 1 7
P i l l a r 3 D i s c l o s u r e
5. Credit Risk (continued)
5.6.4 Ratings of Banking Institutions by Approved ECAIs
December 2011
Group and Bank
Ratings of Banks, Development Financial Institutions and MDBs by Approved ECAIs (amounts in RM'000)
Moodys Aaa to Aa3 A1 to A3 Baa1 to Ba3 Ba1 to B3 Caa1 to C Unrated
S&P AAA to AA- A+ to A- BBB+ to BB- BB+ to B- CCC+ to D Unrated
Exposure Class Fitch AAA to AA- A+ to A- BBB+ to BB- BB+ to B- CCC+ to D Unrated Total
RAM AAA to AA3 A to A3 BBB1+ to BB3 BB1 to B3 C1 to D Unrated
MARC AAA to AA- A+ to A- BBB+ to BB- BB+ to B- C+ to D Unrated
Rating & AAA to AA- A+ to A- BBB+ to BB- BB+ to B- CCC to C Unrated
Investment
Inc
Banks, Development
Financial Institutions
and MDBs 1,117,837 11,192,600 270,715 632 - 666,160 13,247,944
Islamic Banking Window
Ratings of Banks, Development Financial Institutions and MDBs by Approved ECAIs (amounts in RM'000)
Moodys Aaa to Aa3 A1 to A3 Baa1 to Ba3 Ba1 to B3 Caa1 to C Unrated
S&P AAA to AA- A+ to A- BBB+ to BB- BB+ to B- CCC+ to D Unrated
Exposure Class Fitch AAA to AA- A+ to A- BBB+ to BB- BB+ to B- CCC+ to D Unrated Total
RAM AAA to AA3 A to A3 BBB1+ to BB3 BB1 to B3 C1 to D Unrated
MARC AAA to AA- A+ to A- BBB+ to BB- BB+ to B- C+ to D Unrated
Banks, Development
Financial Institutions
and MDBs - 16,721 12,000 - - - 28,721

C i t i b a n k B e r h a d l 2 0 1 1 A n n u a l R e p o r t0 1 8
P i l l a r 3 D i s c l o s u r e
5. Credit Risk (continued)
5.6.4 Ratings of Banking Institutions by Approved ECAIs (continued)
December 2010
Group and Bank
Ratings of Banks, Development Financial Institutions and MDBs by Approved ECAIs (amounts in RM'000)
Moodys Aaa to Aa3 A1 to A3 Baa1 to Ba3 Ba1 to B3 Caa1 to C Unrated
S&P AAA to AA- A+ to A- BBB+ to BB- BB+ to B- CCC+ to D Unrated
Exposure Class Fitch AAA to AA- A+ to A- BBB+ to BB- BB+ to B- CCC+ to D Unrated Total
RAM AAA to AA3 A to A3 BBB+ to BB3 BB1 to B3 C1 to D Unrated
MARC AAA to AA- A+ to A- BBB+ to BB- BB+ to B- C+ to D Unrated
Rating & AAA to AA- A+ to A- BBB+ to BB- BB+ to B- CCC+ to C Unrated
Investment
Inc
Banks, Development
Financial Institutions
and MDBs 935,648 5,395,544 117,091 25,448 - 1,831,155 8,304,885
Islamic Banking Window
Ratings of Banks, Development Financial Institutions and MDBs by Approved ECAIs (amounts in RM'000)
Moodys Aaa to Aa3 A1 to A3 Baa1 to Ba3 Ba1 to B3 Caa1 to C Unrated
S&P AAA to AA- A+ to A- BBB+ to BB- BB+ to B- CCC+ to D Unrated
Exposure Class Fitch AAA to AA- A+ to A- BBB+ to BB- BB+ to B- CCC+ to D Unrated Total
RAM AAA to AA3 A to A3 BBB+ to BB3 BB1 to B3 C1 to D Unrated
MARC AAA to AA- A+ to A- BBB+ to BB- BB+ to B- C+ to D Unrated
Banks, Development
Financial Institutions
and MDBs - 12,592 - 4,000 - - 16,592

C i t i b a n k B e r h a d l 2 0 1 1 A n n u a l R e p o r t 0 1 9
P i l l a r 3 D i s c l o s u r e
5. Credit Risk (continued)
5.7 Credit Risk Mitigation Citibank Berhad uses credit risk mitigation
for the following exposure classes: 1) Corporates 2) Regulatory Retail
Citibank Berhad uses eligible guarantees and financial collaterals which are primarily cash and equity for credit risk mitigation. At present, the Bank does not make use of credit derivatives and on and off-balance sheet netting in its credit risk mitigation process.
For the purpose of calculating and assessing Net Credit RWA, the Bank takes into account eligible collaterals pledged by the customers with the Bank, that are primarily cash deposits and equities.
The Bank’s Credit Department is guided by its Credit Policy and Procedures for collateral valuation and management. It marks to market the CRM eligible financial collateral value on a daily/weekly/monthly (whichever is applicable) basis. Collateral valuations and re-valuations must be completed daily for SFTs, OTC and Margin Lending by the various Operations Units and Collateral/Margin Departments. Collateral haircuts are applied in a number of circumstances such as where there is a material positive correlation between the credit quality of the counterparty and the value of the collateral, or where there are currency or maturity mismatches. The Bank has appropriately sound and well managed systems and procedures for requesting and promptly receiving additional collateral for transactions whose terms require maintenance of collateral values at specified thresholds as documented in the respective legal agreements.
The Bank has procedures to ensure that appropriate information is available to support the collateral process and to make timely and accurate margin calls feed correctly into the Margin applications from upstream systems. These also provide a daily credit exposure report. There are also reports identifying counterparties that have not met their requirement for additional collateral to satisfy specified initial margin amount and variation margin thresholds. In addition, there is risk reporting of counterparty exposures at an individual and an aggregated level.
As the end of December 2011 , the Bank’s gross credit exposure is RM 49,469 mil, of which RM 400 mil was offset by CRM. After applying required risk weights, the Bank’s Credit RWA is RM 22,273 mil. Given the immateriality of CRM, which is 1% of total credit exposure, asset class breakdowns are not provided and for the same reason, there is no CRM risk concentration exposure to the Bank.
C i t i b a n k B e r h a d l 2 0 1 1 A n n u a l R e p o r t0 2 0
P i l l a r 3 D i s c l o s u r e
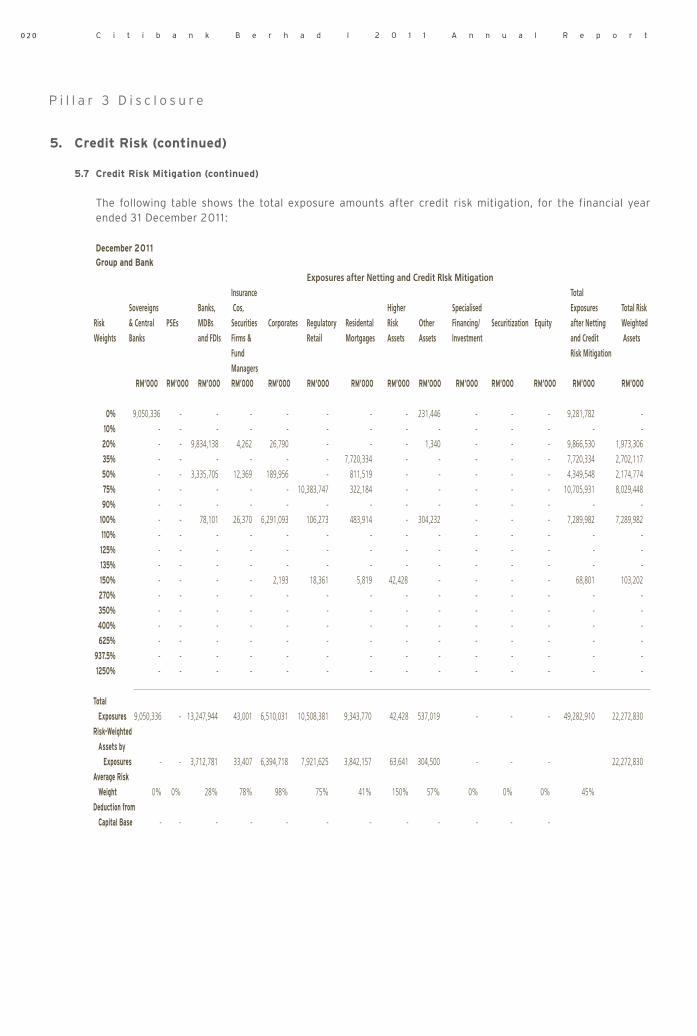
5. Credit Risk (continued)
5.7 Credit Risk Mitigation (continued)
The following table shows the total exposure amounts after credit risk mitigation, for the financial year ended 31 December 2011 :
December 2011
Group and Bank
Exposures after Netting and Credit RIsk Mitigation Insurance Total Sovereigns Banks, Cos, Higher Specialised Exposures Total Risk Risk & Central PSEs MDBs Securities Corporates Regulatory Residental Risk Other Financing/ Securitization Equity after Netting Weighted Weights Banks and FDIs Firms & Retail Mortgages Assets Assets Investment and Credit Assets Fund Risk Mitigation Managers RM’000 RM’000 RM’000 RM’000 RM’000 RM’000 RM’000 RM’000 RM’000 RM’000 RM’000 RM’000 RM’000 RM’000
0% 9,050,336 - - - - - - - 231,446 - - - 9,281,782 -
10% - - - - - - - - - - - - - -
20% - - 9,834,138 4,262 26,790 - - - 1,340 - - - 9,866,530 1,973,306
35% - - - - - - 7,720,334 - - - - - 7,720,334 2,702,117
50% - - 3,335,705 12,369 189,956 - 811,519 - - - - - 4,349,548 2,174,774
75% - - - - - 10,383,747 322,184 - - - - - 10,705,931 8,029,448
90% - - - - - - - - - - - - - -
100% - - 78,101 26,370 6,291,093 106,273 483,914 - 304,232 - - - 7,289,982 7,289,982
110% - - - - - - - - - - - - - -
125% - - - - - - - - - - - - - -
135% - - - - - - - - - - - - - -
150% - - - - 2,193 18,361 5,819 42,428 - - - - 68,801 103,202
270% - - - - - - - - - - - - - -
350% - - - - - - - - - - - - - -
400% - - - - - - - - - - - - - -
625% - - - - - - - - - - - - - -
937.5% - - - - - - - - - - - - - -
1250% - - - - - - - - - - - - - -
Total
Exposures 9,050,336 - 13,247,944 43,001 6,510,031 10,508,381 9,343,770 42,428 537,019 - - - 49,282,910 22,272,830
Risk-Weighted
Assets by
Exposures - - 3,712,781 33,407 6,394,718 7,921,625 3,842,157 63,641 304,500 - - - 22,272,830
Average Risk
Weight 0% 0% 28% 78% 98% 75% 41% 150% 57% 0% 0% 0% 45%
Deduction from
Capital Base - - - - - - - - - - - -

C i t i b a n k B e r h a d l 2 0 1 1 A n n u a l R e p o r t 0 2 1
P i l l a r 3 D i s c l o s u r e
5. Credit Risk (continued)
5.7 Credit Risk Mitigation (continued)
The following table shows the total exposure amounts after credit risk mitigation, for the financial year ended 31 December
2011 : (continued)
December 2011
Islamic Banking Window Exposures after Netting and Credit RIsk Mitigation Insurance Total Sovereigns Banks, Cos, Higher Specialised Exposures Total Risk Risk & Central PSEs MDBs Securities Corporates Regulatory Residental Risk Other Financing/ Securitization Equity after Netting Weighted Weights Banks and FDIs Firms & Retail Mortgages Assets Assets Investment and Credit Assets Fund Risk Mitigation Managers RM’000 RM’000 RM’000 RM’000 RM’000 RM’000 RM’000 RM’000 RM’000 RM’000 RM’000 RM’000 RM’000 RM’000
0% 502,232 - - - - - - - 2,863 - - - 505,095 -
10% - - - - - - - - - - - - - -
20% - - 16,721 - - - - - - - - - 16,721 3,344
35% - - - - - - 377,760 - - - - - 377,760 132,216
50% - - - - - - 66,014 - - - - - 66,014 33,007
75% - - - - - - 4,437 - - - - - 4,437 3,328
90% - - - - - - - - - - - - - -
100% - - 12,000 - 874 - 5,844 - 8,350 - - - 27,068 27,068
110% - - - - - - - - - - - - - -
125% - - - - - - - - - - - - - -
135% - - - - - - - - - - - - - -
150% - - - - - - - 58 - - - - 58 88
270% - - - - - - - - - - - - - -
350% - - - - - - - - - - - - - -
400% - - - - - - - - - - - - - -
625% - - - - - - - - - - - - - -
937.5% - - - - - - - - - - - - - -
1250% - - - - - - - - - - - - - -
Total
Exposures 502,232 - 28,721 - 874 - 454,056 58 11,213 - - - 997,153 199,050
Risk-Weighted
Assets by
Exposures - - 15,344 - 874 - 174,395 88 8,350 - - - 199,050
Average Risk
Weight 0% 0% 53% 0% 100% 0% 38% 150% 74% 0% 0% 0% 20%
Deduction from
Capital Base - - - - - - - - - - - -

C i t i b a n k B e r h a d l 2 0 1 1 A n n u a l R e p o r t0 2 2
P i l l a r 3 D i s c l o s u r e
5. Credit Risk (continued)
5.7 Credit Risk Mitigation (continued)
The following table shows the total exposure amounts after credit risk mitigation, for the financial year ended 31 December 2010:
December 2010
Group and Bank
Exposures after Netting and Credit RIsk Mitigation Insurance Total Sovereigns Banks, Cos, Higher Specialised Exposures Total Risk Risk & Central PSEs MDBs Securities Corporates Regulatory Residental Risk Other Financing/ Securitization Equity after Netting Weighted Weights Banks and FDIs Firms & Retail Mortgages Assets Assets Investment and Credit Assets Fund Risk Mitigation Managers RM’000 RM’000 RM’000 RM’000 RM’000 RM’000 RM’000 RM’000 RM’000 RM’000 RM’000 RM’000 RM’000 RM’000
0% 8,167,398 - 116,225 - - - - - 60,872 - - - 8,344,495 -
10% - - - - - - - - - - - - - -
20% 1,370 - 6,375,206 232 7,723 - - - 763 - - - 6,385,294 1,277,059
35% - - - - - - 7,838,805 - - - - - 7,838,805 2,743,582
50% - - 1,781,846 1,026 60,442 - 1,111,453 - - - - - 2,954,767 1,477,383
75% - - - - - 10,214,521 385,996 - - - - - 10,600,517 7,950,388
90% - - - - - - - - - - - - - -
100% - - 31,607 60,112 5,008,647 108,457 525,925 - 608,490 - - - 6,343,237 6,343,237
110% - - - - - - - - - - - - - -
125% - - - - - - - - - - - - - -
135% - - - - - - - - - - - - - -
150% - - - - 4,100 22,244 13,917 68,220 - - - - 108,481 162,722
270% - - - - - - - - - - - - - -
350% - - - - - - - - - - - - - -
400% - - - - - - - - - - - - - -
625% - - - - - - - - - - - - - -
937.5% - - - - - - - - - - - - - -
1250% - - - - - - - - - - - - - -
Total
Exposures 8,168,768 - 8,304,885 61,369 5,080,912 10,345,222 9,876,096 68,220 670,125 - - - 42,575,596 19,954,371
Risk-Weighted
Assets by
Exposures 274 - 2,197,571 60,671 5,046,562 7,802,713 4,135,606 102,331 608,642 - - - 19,954,371
Average Risk
Weight 0% - 26% 99% 99% 75% 42% 150% 91% - - - 47%
Deduction from
Capital Base - - - - - - - - - - - -
C i t i b a n k B e r h a d l 2 0 1 1 A n n u a l R e p o r t 0 2 3
P i l l a r 3 D i s c l o s u r e
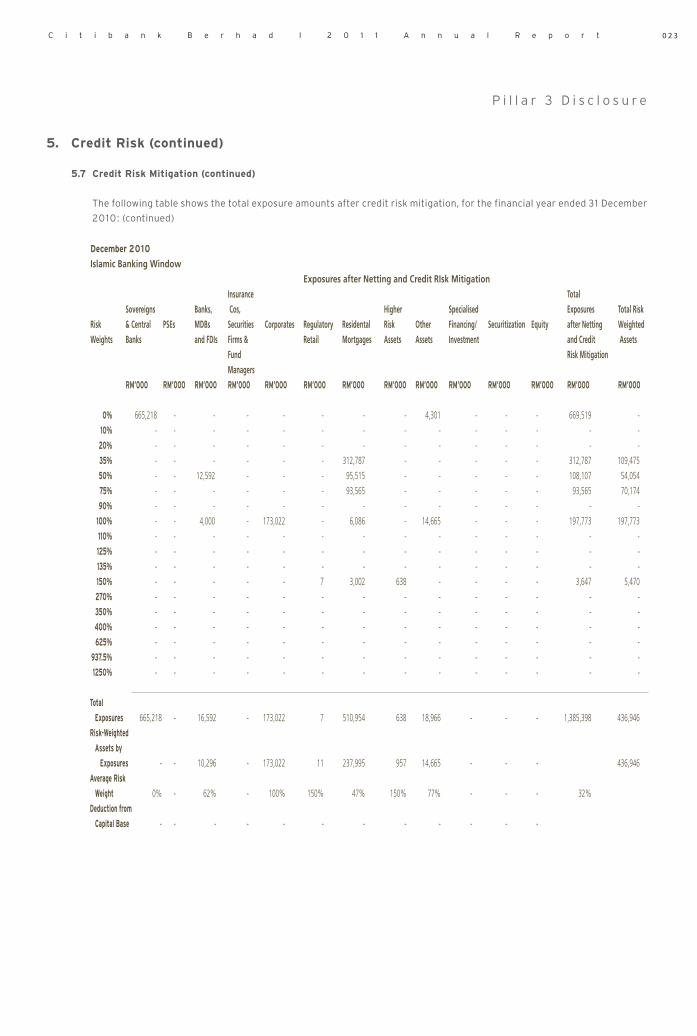
5. Credit Risk (continued)
5.7 Credit Risk Mitigation (continued)
The following table shows the total exposure amounts after credit risk mitigation, for the financial year ended 31 December
2010: (continued)
December 2010
Islamic Banking Window Exposures after Netting and Credit RIsk Mitigation Insurance Total Sovereigns Banks, Cos, Higher Specialised Exposures Total Risk Risk & Central PSEs MDBs Securities Corporates Regulatory Residental Risk Other Financing/ Securitization Equity after Netting Weighted Weights Banks and FDIs Firms & Retail Mortgages Assets Assets Investment and Credit Assets Fund Risk Mitigation Managers RM’000 RM’000 RM’000 RM’000 RM’000 RM’000 RM’000 RM’000 RM’000 RM’000 RM’000 RM’000 RM’000 RM’000
0% 665,218 - - - - - - - 4,301 - - - 669,519 -
10% - - - - - - - - - - - - - -
20% - - - - - - - - - - - - - -
35% - - - - - - 312,787 - - - - - 312,787 109,475
50% - - 12,592 - - - 95,515 - - - - - 108,107 54,054
75% - - - - - - 93,565 - - - - - 93,565 70,174
90% - - - - - - - - - - - - - -
100% - - 4,000 - 173,022 - 6,086 - 14,665 - - - 197,773 197,773
110% - - - - - - - - - - - - - -
125% - - - - - - - - - - - - - -
135% - - - - - - - - - - - - - -
150% - - - - - 7 3,002 638 - - - - 3,647 5,470
270% - - - - - - - - - - - - - -
350% - - - - - - - - - - - - - -
400% - - - - - - - - - - - - - -
625% - - - - - - - - - - - - - -
937.5% - - - - - - - - - - - - - -
1250% - - - - - - - - - - - - - -
Total
Exposures 665,218 - 16,592 - 173,022 7 510,954 638 18,966 - - - 1,385,398 436,946
Risk-Weighted
Assets by
Exposures - - 10,296 - 173,022 11 237,995 957 14,665 - - - 436,946
Average Risk
Weight 0% - 62% - 100% 150% 47% 150% 77% - - - 32%
Deduction from
Capital Base - - - - - - - - - - - -
C i t i b a n k B e r h a d l 2 0 1 1 A n n u a l R e p o r t0 2 4
P i l l a r 3 D i s c l o s u r e
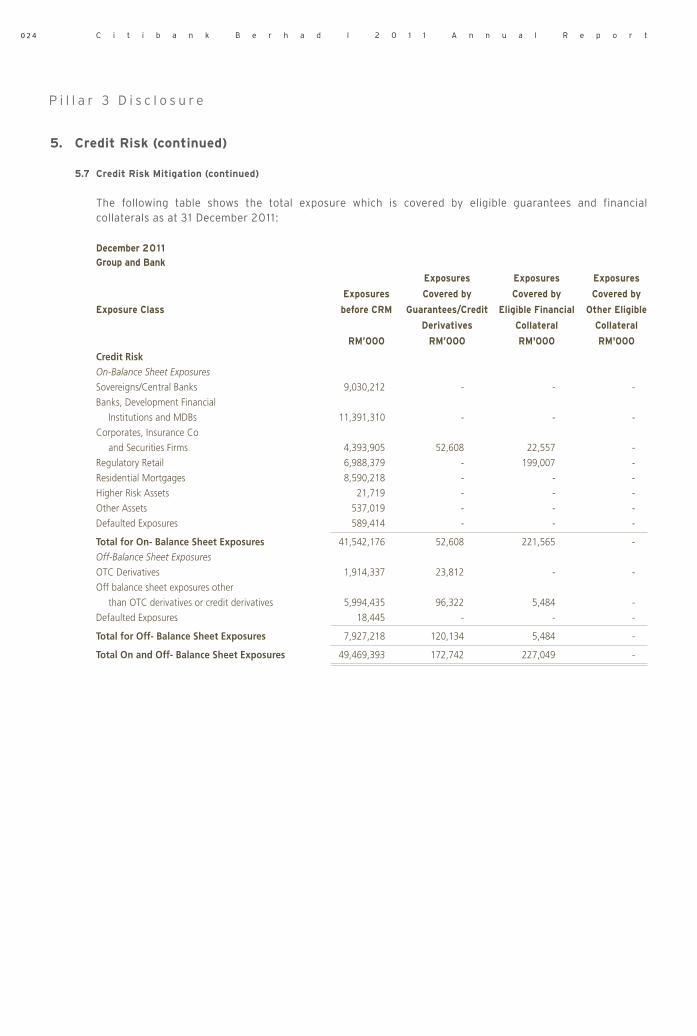
5. Credit Risk (continued)
5.7 Credit Risk Mitigation (continued)
The following table shows the total exposure which is covered by eligible guarantees and financial collaterals as at 31 December 2011 :
December 2011
Group and Bank
Exposures Exposures Exposures
Exposures Covered by Covered by Covered by
Exposure Class before CRM Guarantees/Credit Eligible Financial Other Eligible
Derivatives Collateral Collateral
RM’000 RM’000 RM'000 RM'000
Credit Risk On-Balance Sheet Exposures
Sovereigns/Central Banks 9,030,212 - - -
Banks, Development Financial
Institutions and MDBs 11,391,310 - - -
Corporates, Insurance Co
and Securities Firms 4,393,905 52,608 22,557 -
Regulatory Retail 6,988,379 - 199,007 -
Residential Mortgages 8,590,218 - - -
Higher Risk Assets 21,719 - - -
Other Assets 537,019 - - -
Defaulted Exposures 589,414 - - -
Total for On- Balance Sheet Exposures 41,542,176 52,608 221,565 -
Off-Balance Sheet Exposures
OTC Derivatives 1,914,337 23,812 - -
Off balance sheet exposures other
than OTC derivatives or credit derivatives 5,994,435 96,322 5,484 -
Defaulted Exposures 18,445 - - -
Total for Off- Balance Sheet Exposures 7,927,218 120,134 5,484 -
Total On and Off- Balance Sheet Exposures 49,469,393 172,742 227,049 -
C i t i b a n k B e r h a d l 2 0 1 1 A n n u a l R e p o r t 0 2 5
P i l l a r 3 D i s c l o s u r e
5. Credit Risk (continued)
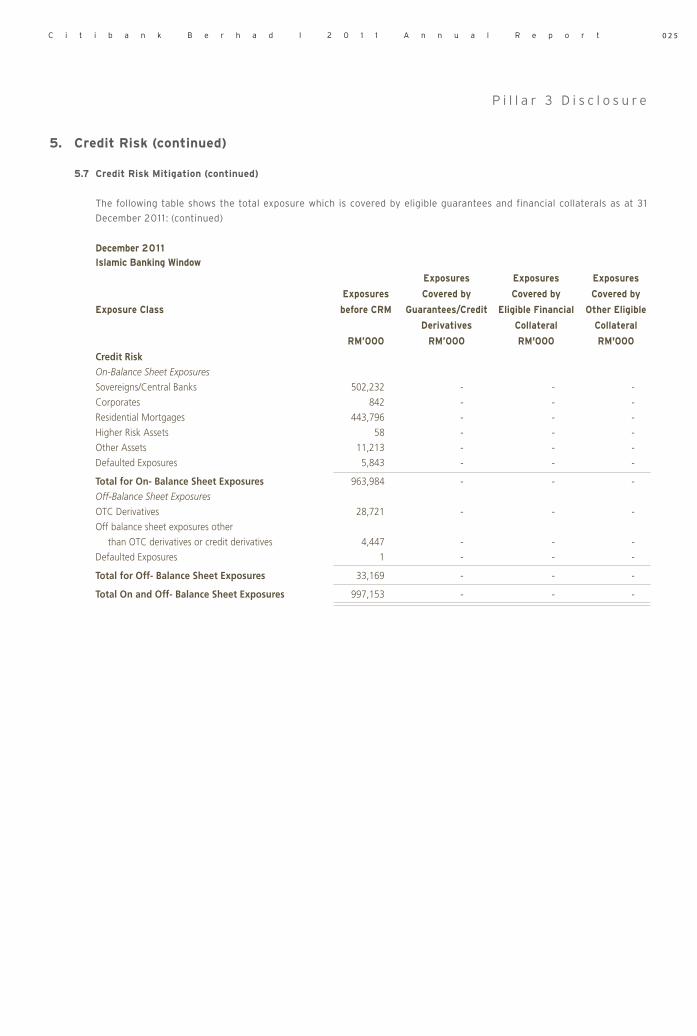
5.7 Credit Risk Mitigation (continued)
The following table shows the total exposure which is covered by eligible guarantees and financial collaterals as at 31
December 2011 : (continued)
December 2011
Islamic Banking Window
Exposures Exposures Exposures
Exposures Covered by Covered by Covered by
Exposure Class before CRM Guarantees/Credit Eligible Financial Other Eligible
Derivatives Collateral Collateral
RM’000 RM’000 RM'000 RM'000
Credit Risk On-Balance Sheet Exposures
Sovereigns/Central Banks 502,232 - - -
Corporates 842 - - -
Residential Mortgages 443,796 - - -
Higher Risk Assets 58 - - -
Other Assets 11,213 - - -
Defaulted Exposures 5,843 - - -
Total for On- Balance Sheet Exposures 963,984 - - -
Off-Balance Sheet Exposures
OTC Derivatives 28,721 - - -
Off balance sheet exposures other
than OTC derivatives or credit derivatives 4,447 - - -
Defaulted Exposures 1 - - -
Total for Off- Balance Sheet Exposures 33,169 - - -
Total On and Off- Balance Sheet Exposures 997,153 - - -

C i t i b a n k B e r h a d l 2 0 1 1 A n n u a l R e p o r t0 2 6
P i l l a r 3 D i s c l o s u r e
5. Credit Risk (continued)
5.7 Credit Risk Mitigation (continued)
The following table shows the total exposure which is covered by eligible guarantees and financial collaterals as at 31 December 2010:
December 2010
Group and Bank
Exposures Exposures Exposures
Exposures Covered by Covered by Covered by
Exposure Class before CRM Guarantees/Credit Eligible Financial Other Eligible
Derivatives Collateral Collateral
RM’000 RM’000 RM'000 RM'000
Credit Risk On-Balance Sheet Exposures
Sovereigns/Central Banks 8,111,852 - - -
Banks, Development Financial
Institutions and MDBs 6,463,580 - - -
Insurance Cos, Securities Firms
and Fund Managers 254 - - -
Corporates 3,078,104 42,179 1,271 -
Regulatory Retail 6,770,010 - 206,325 -
Residential Mortgages 9,164,982 - - -
Higher Risk Assets 40,145 - - -
Other Assets 659,283 - - -
Defaulted Exposures 651,337 - - -
Total for On- Balance Sheet Exposures 34,939,546 42,179 207,596 -
Off-Balance Sheet Exposures
OTC Derivatives 2,199,313 - - -
Off balance sheet exposures other
than OTC derivatives or credit derivatives 5,572,879 - 3,215 -
Defaulted Exposures 32,701 - - -
Total for Off- Balance Sheet Exposures 7,804,893 - 3,215 -
Total On and Off- Balance Sheet Exposures 42,744,439 42,179 210,810 -
C i t i b a n k B e r h a d l 2 0 1 1 A n n u a l R e p o r t 0 2 7
P i l l a r 3 D i s c l o s u r e
5. Credit Risk (continued)
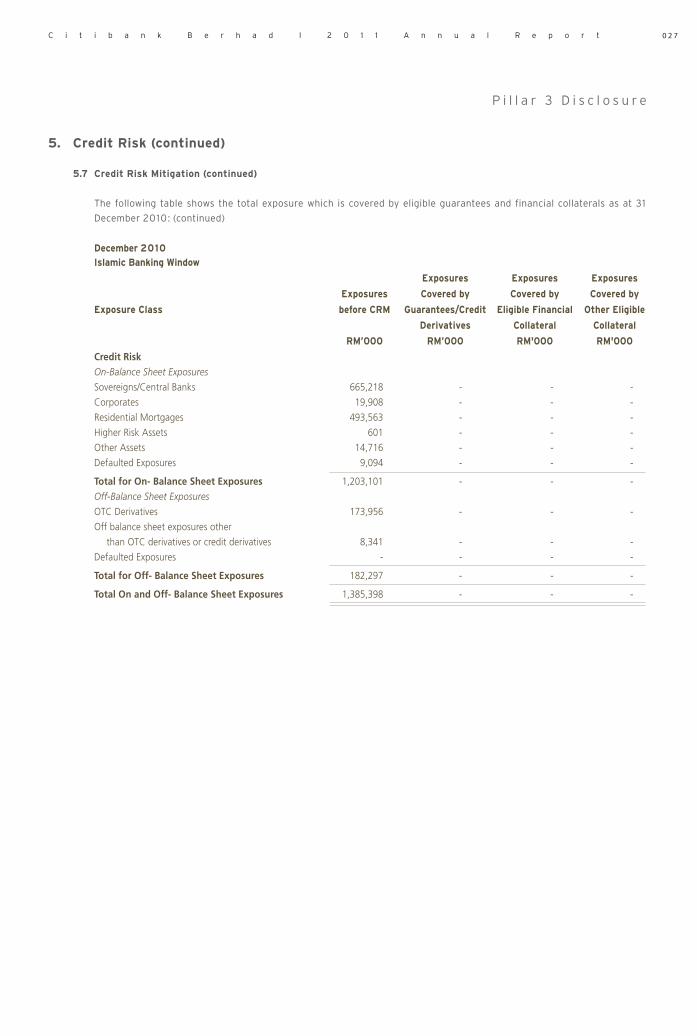
5.7 Credit Risk Mitigation (continued)
The following table shows the total exposure which is covered by eligible guarantees and financial collaterals as at 31
December 2010: (continued)
December 2010
Islamic Banking Window
Exposures Exposures Exposures
Exposures Covered by Covered by Covered by
Exposure Class before CRM Guarantees/Credit Eligible Financial Other Eligible
Derivatives Collateral Collateral
RM’000 RM’000 RM'000 RM'000
Credit Risk On-Balance Sheet Exposures
Sovereigns/Central Banks 665,218 - - -
Corporates 19,908 - - -
Residential Mortgages 493,563 - - -
Higher Risk Assets 601 - - -
Other Assets 14,716 - - -
Defaulted Exposures 9,094 - - -
Total for On- Balance Sheet Exposures 1,203,101 - - -
Off-Balance Sheet Exposures
OTC Derivatives 173,956 - - -
Off balance sheet exposures other
than OTC derivatives or credit derivatives 8,341 - - -
Defaulted Exposures - - - -
Total for Off- Balance Sheet Exposures 182,297 - - -
Total On and Off- Balance Sheet Exposures 1,385,398 - - -
C i t i b a n k B e r h a d l 2 0 1 1 A n n u a l R e p o r t0 2 8
P i l l a r 3 D i s c l o s u r e
5. Credit Risk (continued)
5.8 Off-Balance Sheet Exposures and Counterparty Credit Risk (CCR)
The risk that a counterparty will not fulfill its financial obligations is fundamental in the bank’s management of counterparty credit risk. The process for approving a counterparty’s risk exposure limits is two-fold: guided by the core credit policies, procedures and standards, and the experience and judgment of credit risk professionals. All corporate exposures are subject to these credit policies.
Credit Risk Principles, Policies and Procedures mandate a comprehensive analysis of the proposed credit exposure or transaction, review of external agency ratings, financial and corporate due diligence including support, management profile and qualitative factors.
The total facility amount, including direct, contingent and pre-settlement exposure, is aggregated and the credit officer reviews the approved tables within policy that appoints the appropriate level of authority that needs to review and approve.
The utilization of collateral is of critical importance in the mitigation of risk. In house legal counsel in consultation with approved external legal counsel will determine whether collateral documentation is enforceable and gives the Bank the right to liquidate or take possession in a timely manner in the event of the default, insolvency, bankruptcy or other defined credit event of the obligor.
As mentioned in Section 5.7, majority of the collateral received is in the form of cash deposit and equities while the rest relate to guarantees, so the impact of a credit grading downgrade will have minimal impact on the collateral valuation.
C i t i b a n k B e r h a d l 2 0 1 1 A n n u a l R e p o r t 0 2 9
P i l l a r 3 D i s c l o s u r e
5. Credit Risk (continued)
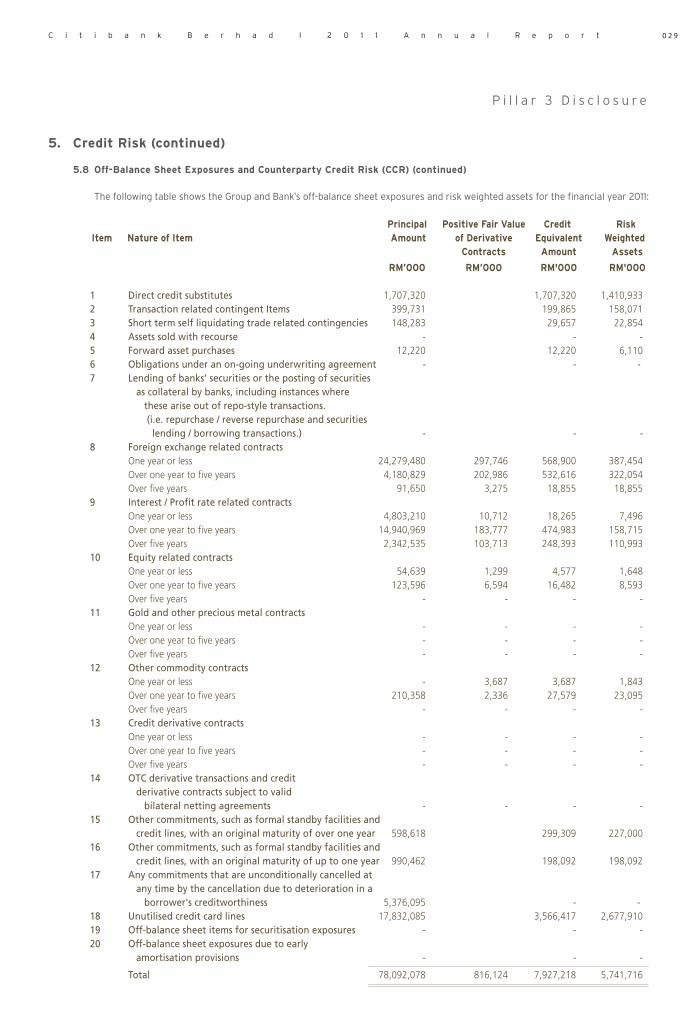
5.8 Off-Balance Sheet Exposures and Counterparty Credit Risk (CCR) (continued)
The following table shows the Group and Bank’s off-balance sheet exposures and risk weighted assets for the financial year 2011:
Principal Positive Fair Value Credit Risk Item Nature of Item Amount of Derivative Equivalent Weighted Contracts Amount Assets
RM’000 RM’000 RM'000 RM'000
1 Direct credit substitutes 1,707,320 1,707,320 1,410,933 2 Transaction related contingent Items 399,731 199,865 158,071 3 Short term self liquidating trade related contingencies 148,283 29,657 22,854 4 Assets sold with recourse - - - 5 Forward asset purchases 12,220 12,220 6,110 6 Obligations under an on-going underwriting agreement - - - 7 Lending of banks’ securities or the posting of securities as collateral by banks, including instances where these arise out of repo-style transactions. (i.e. repurchase / reverse repurchase and securities lending / borrowing transactions.) - - - 8 Foreign exchange related contracts One year or less 24,279,480 297,746 568,900 387,454 Over one year to five years 4,180,829 202,986 532,616 322,054 Over five years 91,650 3,275 18,855 18,855 9 Interest / Profit rate related contracts One year or less 4,803,210 10,712 18,265 7,496 Over one year to five years 14,940,969 183,777 474,983 158,715 Over five years 2,342,535 103,713 248,393 110,993 10 Equity related contracts One year or less 54,639 1,299 4,577 1,648 Over one year to five years 123,596 6,594 16,482 8,593 Over five years - - - - 11 Gold and other precious metal contracts One year or less - - - - Over one year to five years - - - - Over five years - - - - 12 Other commodity contracts One year or less - 3,687 3,687 1,843 Over one year to five years 210,358 2,336 27,579 23,095 Over five years - - - - 13 Credit derivative contracts One year or less - - - - Over one year to five years - - - - Over five years - - - - 14 OTC derivative transactions and credit derivative contracts subject to valid bilateral netting agreements - - - - 15 Other commitments, such as formal standby facilities and credit lines, with an original maturity of over one year 598,618 299,309 227,000 16 Other commitments, such as formal standby facilities and credit lines, with an original maturity of up to one year 990,462 198,092 198,092 17 Any commitments that are unconditionally cancelled at any time by the cancellation due to deterioration in a borrower's creditworthiness 5,376,095 - - 18 Unutilised credit card lines 17,832,085 3,566,417 2,677,910 19 Off-balance sheet items for securitisation exposures - - - 20 Off-balance sheet exposures due to early amortisation provisions - - -
Total 78,092,078 816,124 7,927,218 5,741,716
C i t i b a n k B e r h a d l 2 0 1 1 A n n u a l R e p o r t0 3 0
P i l l a r 3 D i s c l o s u r e
5. Credit Risk (continued)
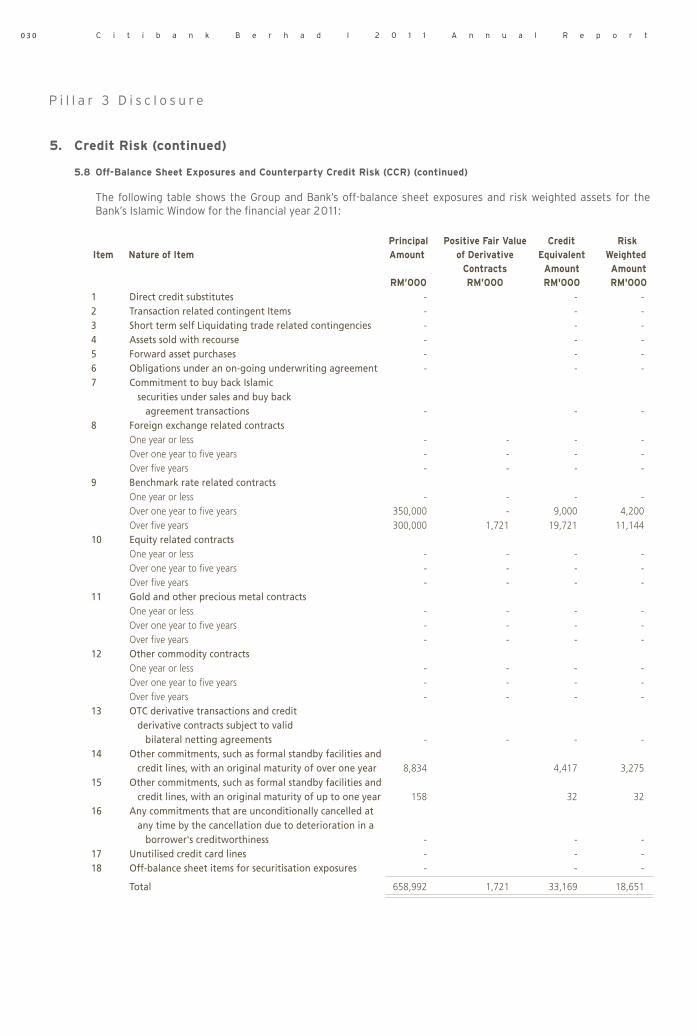
5.8 Off-Balance Sheet Exposures and Counterparty Credit Risk (CCR) (continued)
The following table shows the Group and Bank’s off-balance sheet exposures and risk weighted assets for the Bank’s Islamic Window for the financial year 2011 :
Principal Positive Fair Value Credit Risk Item Nature of Item Amount of Derivative Equivalent Weighted Contracts Amount Amount RM’000 RM’000 RM'000 RM'000
1 Direct credit substitutes - - - 2 Transaction related contingent Items - - - 3 Short term self Liquidating trade related contingencies - - - 4 Assets sold with recourse - - - 5 Forward asset purchases - - - 6 Obligations under an on-going underwriting agreement - - - 7 Commitment to buy back Islamic securities under sales and buy back agreement transactions - - - 8 Foreign exchange related contracts One year or less - - - - Over one year to five years - - - - Over five years - - - - 9 Benchmark rate related contracts One year or less - - - - Over one year to five years 350,000 - 9,000 4,200 Over five years 300,000 1,721 19,721 11,144 10 Equity related contracts One year or less - - - - Over one year to five years - - - - Over five years - - - - 11 Gold and other precious metal contracts One year or less - - - - Over one year to five years - - - - Over five years - - - - 12 Other commodity contracts One year or less - - - - Over one year to five years - - - - Over five years - - - - 13 OTC derivative transactions and credit derivative contracts subject to valid bilateral netting agreements - - - - 14 Other commitments, such as formal standby facilities and credit lines, with an original maturity of over one year 8,834 4,417 3,275 15 Other commitments, such as formal standby facilities and credit lines, with an original maturity of up to one year 158 32 32 16 Any commitments that are unconditionally cancelled at any time by the cancellation due to deterioration in a borrower's creditworthiness - - - 17 Unutilised credit card lines - - - 18 Off-balance sheet items for securitisation exposures - - -
Total 658,992 1,721 33,169 18,651

C i t i b a n k B e r h a d l 2 0 1 1 A n n u a l R e p o r t 0 3 1
P i l l a r 3 D i s c l o s u r e
5. Credit Risk (continued)
5.8 Off-Balance Sheet Exposures and Counterparty Credit Risk (CCR) (continued)
The following table shows the Group and Bank’s off-balance sheet exposures and risk weighted assets for the financial year 2010:
Principal Positive Fair Value Credit Risk Item Nature of Item Amount of Derivative Equivalent Weighted Contracts Amount Assets RM’000 RM’000 RM'000 RM'000 1 Direct credit substitutes 1,489,992 1,489,992 1,288,190 2 Transaction related contingent Items 395,970 197,985 180,418 3 Short term self liquidating trade related contingencies 422,631 84,526 127,781 4 Assets sold with recourse - - - 5 Forward asset purchases 617 617 - 6 Obligations under an on-going underwriting agreement - - - 7 Lending of banks’ securities or the posting of securities as collateral by banks, including instances where these arise out of repo-style transactions. (i.e. repurchase / reverse repurchase and securities lending / borrowing transactions.) - - - 8 Foreign exchange related contracts One year or less 24,729,003 468,137 758,795 561,289 Over one year to five years 3,637,939 222,693 539,734 321,023 Over five years - - - - 9 Interest / Profit rate related contracts One year or less 7,896,887 26,236 37,105 13,589 Over one year to five years 16,604,797 187,133 586,871 255,311 Over five years 1,800,014 69,729 191,416 64,169 10 Equity related contracts One year or less 388,457 2,635 25,785 12,867 Over one year to five years 153,686 12,292 24,797 12,399 Over five years - - - - 11 Gold and other precious metal contracts One year or less - - - - Over one year to five years - - - - Over five years - - - - 12 Other commodity contracts One year or less 175,461 16,983 34,810 32,977 Over one year to five years - - - - Over five years - - - - 13 Credit derivative contracts One year or less - - - - Over one year to five years - - - - Over five years - - - - 14 OTC derivative transactions and credit derivative contracts subject to valid bilateral netting agreements - - - - 15 Other commitments, such as formal standby facilities and credit lines, with an original maturity of over one year 421,905 210,952 158,455 16 Other commitments, such as formal standby facilities and credit lines, with an original maturity of up to one year - - - 17 Any commitments that are unconditionally cancelled at any time by the cancellation due to deterioration in a borrower's creditworthiness 5,014,737 - - 18 Unutilised credit card lines 18,107,541 3,621,508 2,722,693 19 Off-balance sheet items for securitisation exposures - - - 20 Off-balance sheet exposures due to early amortisation provisions - - -
Total 81,239,636 1,005,839 7,804,893 5,751,159

C i t i b a n k B e r h a d l 2 0 1 1 A n n u a l R e p o r t0 3 2
P i l l a r 3 D i s c l o s u r e
5. Credit Risk (continued)
5.8 Off-Balance Sheet Exposures and Counterparty Credit Risk (CCR) (continued)
The following table shows the Islamic Banking Window’s off-balance sheet exposures and risk weighted assets for the financial year 2010:
Principal Positive Fair Value Credit Risk Item Nature of Item Amount of Derivative Equivalent Weighted Contracts Amount Amount RM’000 RM’000 RM'000 RM'000
1 Direct credit substitutes - - - 2 Transaction related contingent Items - - - 3 Short term self liquidating trade related contingencies - - - 4 Assets sold with recourse - - - 5 Forward asset purchases - - - 6 Obligations under an on-going underwriting agreement - - - 7 Commitment to buy back Islamic securities under sales and buy back agreement transactions - - - 8 Foreign exchange related contracts One year or less 828,235 139,723 152,975 152,975 Over one year to five years - - - - Over five years - - - - 9 Benchmark rate related contracts One year or less 138,758 - 139 139 Over one year to five years 550,000 2,342 20,842 14,546 Over five years - - - - 10 Equity related contracts One year or less - - - - Over one year to five years - - - - Over five years - - - - 11 Gold and other precious metal contracts One year or less - - - - Over one year to five years - - - - Over five years - - - - 12 Other commodity contracts One year or less - - - - Over one year to five years - - - - Over five years - - - - 13 OTC derivative transactions and credit derivative contracts subject to valid bilateral netting agreements - - - - 14 Other commitments, such as formal standby facilities and credit lines, with an original maturity of over one year 16,683 8,341 3,312 15 Other commitments, such as formal standby facilities and credit lines, with an original maturity of up to one year - - - 16 Any commitments that are unconditionally cancelled at any time by the cancellation due to deterioration in a borrower's creditworthiness 1,054 - - 17 Unutilised credit card lines - - - 18 Off-balance sheet items for securitisation exposures - - -
Total 1,534,730 142,065 182,297 170,972
C i t i b a n k B e r h a d l 2 0 1 1 A n n u a l R e p o r t 0 3 3
P i l l a r 3 D i s c l o s u r e
6. Securitization
At present, Citibank Berhad does not have any exposures to securitization transactions. Hence, this disclosure is not applicable.
7. Market Risk
Market risk encompasses price risk and liquidity risk, both arising in the normal course of business operations in a global financial intermediary. At Citibank Berhad, market risk is managed through corporate-wide standards, business policies and procedures with the help of responsible personnel and committees delegated by the Board of Directors (for example, the Asset and Liability Committee and Market Risk Management).
The business is required to establish risk measures, limits and controls, clearly defining approved risk profiles within the parameters of the Bank's overall risk appetite.
The result of every risk assessment and review exercise is then presented to the Board of Directors for feedback and recommended action (if necessary).
7.1 Price Risk
Price risk is the risk associated to earnings arising from changes in interest rates, foreign exchange rates, equity and commodity prices (wherever relevant) and in their implied volatilities. Price risk arises in both non-trading portfolios and trading portfolios.
Interest rate risk in non-trading portfolios is inherent in many client-related activities, primarily lending and deposit taking from both individuals and corporations.
The risk arises due to factors including the timing of rate resetting and maturity period between assets and liabilities, change in the profile of assets and liabilities whereby the maturity period differs in response to alterations in market interest rates, changes in the form of the yield curve and modifications in the spread between various market rate indices.
Interest Rate Exposure (IRE) is used as a tool to monitor such interest rate risk and is calculated as the pre-tax earning impact of an instantaneous parallel increase or decrease in the yield curve.
IRE is supplemented with additional measurements including stress testing the
impact on earnings and equity for non-linear interest rate movements and analysis of portfolio duration, basis risk, spread risk, volatility risk and cost-to-close.
Price risk in trading portfolios is measured through a complementary set of tools such as factor sensitivities, value-at-risk and stress testing.
It is the responsibility of the independent market risk management to ensure that factor sensitivities are calculated, monitored and in most cases limited, for all relevant risks taken in a trading portfolio. In addition, stress testing is performed on trading portfolios on a regular basis to estimate the impact of extreme market movements.
7.2 Liquidity Risk
Liquidity risk can best be defined as risks that the Bank may not be able to meet in terms of a financial commitment to customers, creditors or investors, when due.
Under the Bank's internal Liquidity Risk Management policy, there are set standards for the measurement of liquidity risk in order to ensure consistency, stability in methodologies and transparency of risk.
This is in addition to the requirements of BNM's New Liquidity Framework, which requires that a certain surplus liquidity position be maintained to meet pre-defined withdrawal amounts.
Management of liquidity is performed on a daily basis and is monitored by the Country Treasurer. Along with the Country Treasurer and the Corporate Treasurer, the Asset and Liability Committee (ALCO) undertakes the joint responsibility of overall liquidity risk management which covers establishing and endorsing the annual funding and liquidity plan, liquidity limits, liquidity ratios, market triggers and assumptions for periodic stress tests.
The Bank's liquidity management process includes:
• Establishing liquidity limit based on the size of the balance sheet, depth of the market, experience level of management, stability of the liabilities and liquidity of the assets under both business as usual scenario and stress scenarios;

C i t i b a n k B e r h a d l 2 0 1 1 A n n u a l R e p o r t0 3 4
P i l l a r 3 D i s c l o s u r e
7. Market Risk (continued)
7.2 Liquidity Risk (continued)
• Daily maturity profiling of the Bank's assets and liabilities including behavioral analysis of major third party sources and uses of funds versus liquidity limits;
• Perform simulated liquidity stress testing periodically relative to significant changes in key funding sources, credit ratings, contingent uses of funding and market disruptions;
• Preparing annual funding and liquidity plan which includes analysis of the annual balance sheet as well as the economic and business conditions impacting the liquidity of the Bank;
• Use liquidity ratios to monitor the structural elements of the Bank's liquidity position;
• Review potential concentrations of funding; and
• Monitor market triggers which are internal and/or external market or economic factors that may cause a change to market liquidity.
8. Operational Risk
Operational risk is the risk of loss resulting from inadequate or failed internal processes, people, and systems as well as from external events.
It includes reputation and franchise risks associated with the Bank's business practices or market conduct. It also includes the risk of failing to comply with applicable laws, regulations, and Citi policies.
The Citi Self Assessment and Operational Risk Framework includes the Citi Risk & Control Self-Assessment/Operational Risk Policy and Standards (“The Policy”), which clearly defines the Bank's approach to operational risk management.
The Operational Risk policy codifies the core governing principles for operational risk management and provides a consistent, value added framework for assessing, communicating operational risk and the overall effectiveness of the internal control environment across Citi.
The policy covers the following:
• The Policy focuses on Important Risks and Key Controls and not all risks and controls;
• The senior management is responsible for the oversight of the operational risk management framework, including fostering an organizational culture that places high priority on effective operational risk management and adherence to sound internal controls, including all applicable policies;
• The identification of key operational risks & controls to be done on a collaborative effort, with the input from business and functional areas;
• Key operational risks identified will be assessed on a regular basis through key risk indicators to monitor potential significant risk inherent in the business; and
• Operational losses are collected and reported to senior management.
The Bank’s management places a very high value on maintaining an effective control environment to mitigate operational risk. Therefore, a number of tools have been put in place to mitigate this risk. These tools range from conducting Risk & Control Self-Assessments (“RCSA”), operational loss reporting and several escalations mechanisms related to operational risk. It is the Business Risk, Compliance & Control Committee (“BRCC”) that governs operational risk within the Bank. The Committee meets on a quarterly basis and discusses operational risk related items according to a standard agenda. The Audit Committee is the independent governing body monitoring operational risk within the Bank.
The Bank uses Basic Indicator approach for calculating Operational Risk Capital.
9. Equities
This disclosure is not applicable as Citibank Berhad does not have any exposures to equities.
10. Interest Rate Risk/Rate of Return Risk in the Banking Book (IRR/RORBB)
Interest rate risk in banking book arises from both interest bearing and non-interest bearing asset and liabilities. Interest rate risk is monitored on a daily basis within the approved limits framework set by the Regional Market Risk Management and considers changes of economic value per 1% interest rate increase for each currency as an index for internal control.

C i t i b a n k B e r h a d l 2 0 1 1 A n n u a l R e p o r t 0 3 5
P i l l a r 3 D i s c l o s u r e
10. Interest Rate Risk/Rate of Return Risk in the Banking Book (IRR/RORBB) (continued)
Asset and liabilities, which are contractual in nature, are monitored up to the re-pricing tenors. Consumer loans having long term re-pricing exposures are subjected to prepayment assumptions based on historical studies on customer early payout behavior. Non-interest bearing and perpetual products, e.g. current/saving accounts, credit cards, ready credit, are monitored for interest rate risk on core balances. The core balances are computed based on statistical regression analysis.
Potential interest rate risk in banking book is monitored through interest rate exposure at 100 bps parallel move in interest rates. Interest rate exposure at each major currency level for the banking book as below:
Impact on Positions as at 31 Dec 2011
+100bps Up Move (RM’000)
Increase/(Decline) Increase/(Decline)
in Earnings in Economic Value
Currency
MYR (766,801) (766,801)
SGD (11) (11)
USD +6,210 +6,210
GBP (13) (13)
JPY (33) (33)
CAD - -
AUD +56 +56
NZD - -
EUR (16) (16)
Impact on Positions as at 31 Dec 2010
+100bps Up Move (RM’000)
Increase/(Decline) Increase/(Decline)
in Earnings in Economic Value
Currency
MYR (16,666) (16,666)
SGD (10) (10)
USD (15,233) (15,233)
GBP - -
JPY (39) (39)
CAD - -
AUD - -
NZD - -
EUR +5 +5
11. Profit Sharing Investment Accounts and Shariah Governance
11.1 Profit Sharing Investment Accounts
This disclosure is not applicable as Citibank Berhad’s Islamic Banking Window does not have any Profit Sharing Investment Accounts.
11.2 Shariah Governance
This is disclosed in Citibank Berhad’s Annual Report, under the section “Shariah Committee”.

Related Documents