
Welcome message from author
This document is posted to help you gain knowledge. Please leave a comment to let me know what you think about it! Share it to your friends and learn new things together.
Transcript

2
Content & liability disclaimer
The information contained in this presentation or enclosed herewith is provided andintended for informational purposes only and should not be relied on for any investmentdecisions. The information provided in the presentation includes assumptions and financialinformation on M.Video operations and expectations which are "indicative". Specifically,some of the 2008-2017 information presented is taken from the M.Video Groupmanagement information system and as such may be unaudited and may includeaccruals and estimates. Except for numbers which can be traced to the auditedConsolidated Financial statements for the years ended 31 December 2007-2017 thenumbers may not have been subjected to any audit testing nor have the IFRS policiesnecessarily been applied to these numbers/calculations. All M.Video Group companiesinformation provided in this presentation is provided on an "as is" basis. M.Video believesand has done everything within its power to ensure the information is not misleading,nevertheless M.Video does not take any responsibility for the accuracy or completeness ofthe information. Likewise, for the forward looking information provided, these are basedupon the M.Video Group management high level, longer term views and not on detailedbudgeting or forecasting principles. The addressees of the presentation should not takethese numbers as the true and accurate numbers and as such not disseminate, or refer tothese numbers for any purpose other than for the purpose they were given, namely forinformational purpose. A person who uses the information contained in this presentationdoes so at his/her own risk.

3
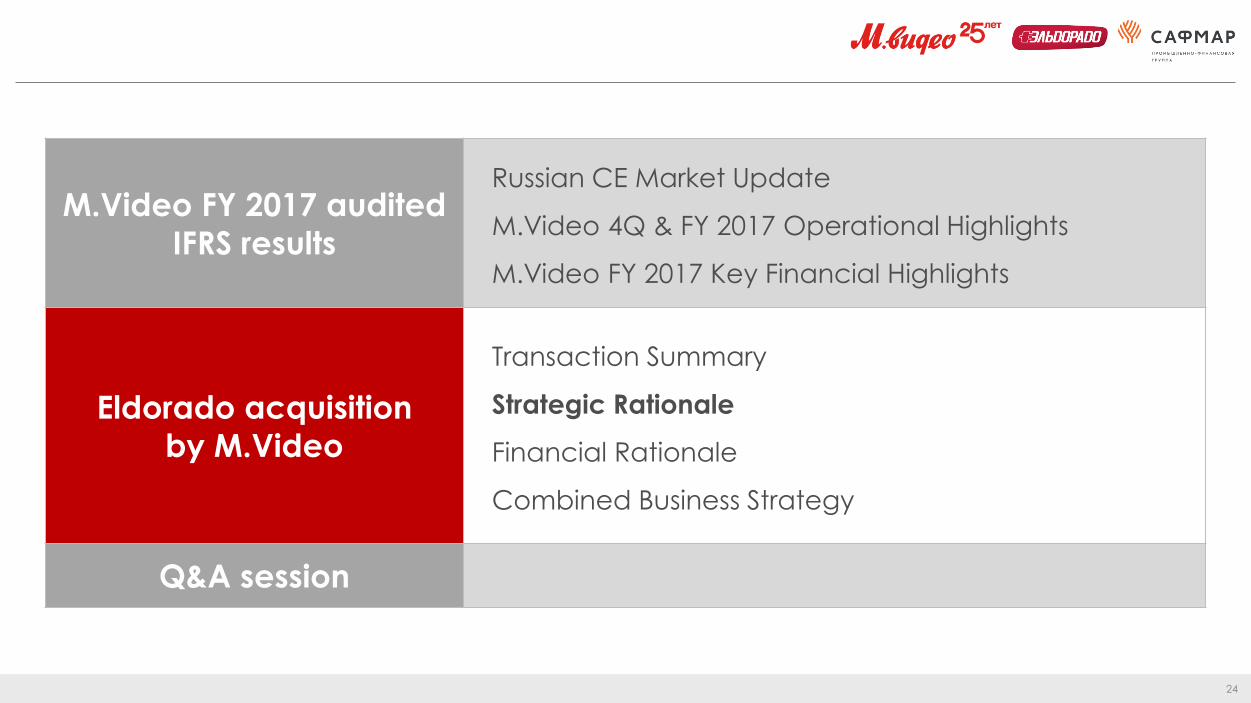
M.Video FY 2017 audited
IFRS results
Russian CE Market Update
M.Video 4Q & FY 2017 Operational Highlights
M.Video FY 2017 Key Financial Highlights
Eldorado acquisition
by M.Video
Transaction Summary
Strategic Rationale
Financial Rationale
Combined Business Strategy
Q&A session
4
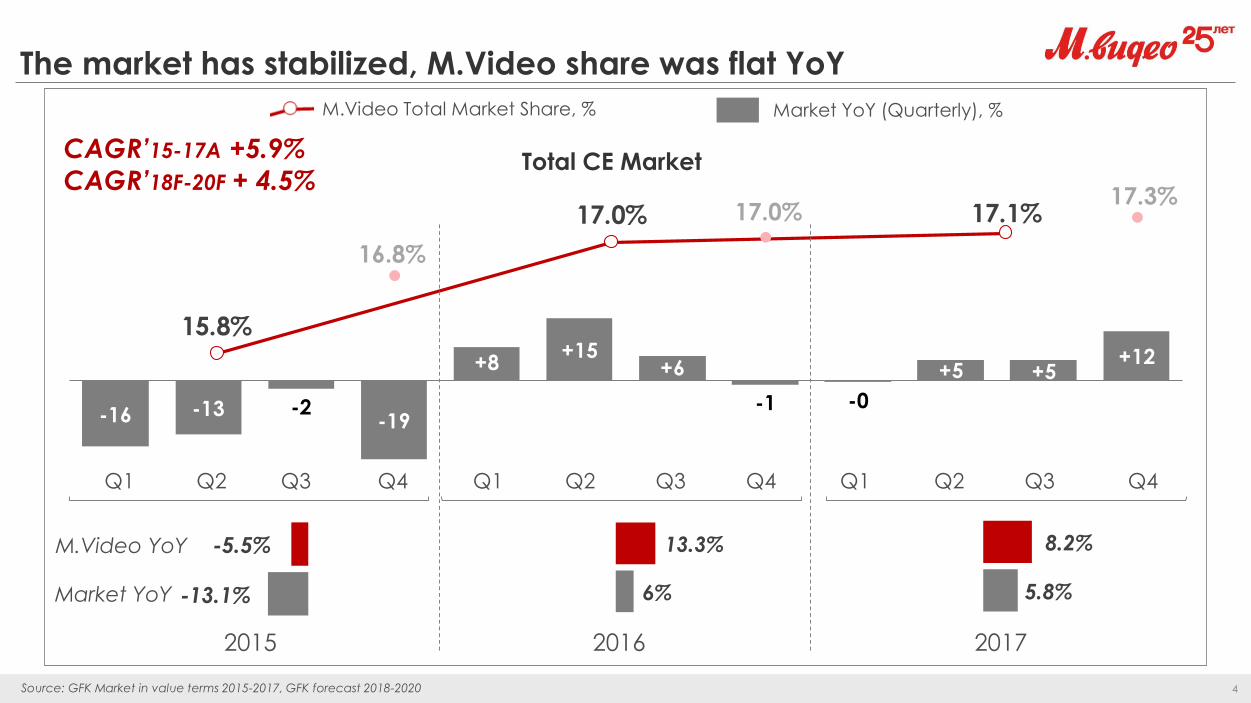
15.8%
17.0% 17.1%
The market has stabilized, M.Video share was flat YoY
Total CE Market
Market YoY (Quarterly), %M.Video Total Market Share, %
Q1 Q2 Q3 Q4 Q1 Q2 Q3 Q4 Q1 Q2 Q3 Q4
2015 2016 2017
CAGR’15-17A +5.9%
CAGR’18F-20F + 4.5%17.3%
17.0%
16.8%
-13.1%
-5.5%
6%
13.3%
5.8%
8.2%M.Video YoY
Market YoY
-16 -13 -2-19
+8+15
+6
-1 -0
+5 +5+12
Source: GFK Market in value terms 2015-2017, GFK forecast 2018-2020

5
10.2%11.3%
14.1%
+1+3 +17
-17
+20 +24+12 +10 +3 +16 +11 +16
M.Video considerably gained share in growing online market
reaching record-high 14%
Online CE Market
Market YoY (Quarterly), %M.Video Online Market Share, %
Q1 Q2 Q3 Q4 Q1 Q2 Q3 Q4 Q1 Q2 Q3 Q4
2015 2016 2017
CAGR’15-17A +13.8%
CAGR’18F-20F + 15.4%
M.Video YoY
Market YoY
11.6%
16.6%
10.4%
-2.3%
12.5%
15.7%
26.6%
12.0%
41.3%
Source: GFK Market in value terms 2015-2017, Euromonitor forecast 2018-2020

6
56%
26%
5%+6%
+1%
-12%
+9%
+1%
+17%
+8%
+2%
-8%
+9%
+5%
+23%
M.Video grew in Digital with the market, but the
category still underpenetrated and attractive
AV
Photo-Auto
Digital
Home Appliances
179 025
158 795 162 458
46 25843 981
24 489
18 917
11 903
8 834
14 345
5 799
32 141
41 483
21 756
18 251
12 207
6 410
17 675
4 646
31 772
43 573
21 654
18 466
11 958
6 721
19 912
4 717
AV LHA Computers SHA Accessories Photo - Avto Telecom Entertainment
2015RF 20152014
-1,1% vs Reforecast
-31,3% vs Actual
5,0% vs Reforecast
-0,9% vs Actual
-0,5% vs Reforecast
-11,6% vs Actual
1,2% vs Reforecast
-2,4% vs Actual
1,5% vs Reforecast
-18,7% vs Actual
12,7%vs Reforecast
38,8% vs Actual
-2,0% vs Reforecast
0,5% vs Actual
4,9% vs Reforecast
-23,9% vs Actual
2015RF 20152014
2,3% vs Reforecast
-9,3% vs Actual
2015RF 20152014 2015RF 20152014 2015RF 20152014 2015RF 20152014 2015RF 20152014 2015RF 20152014 2015RF 20152014
AV
179 025
158 795 162 458
46 25843 981
24 489
18 917
11 903
8 834
14 345
5 799
32 141
41 483
21 756
18 251
12 207
6 410
17 675
4 646
31 772
43 573
21 654
18 466
11 958
6 721
19 912
4 717
AV LHA Computers SHA Accessories Photo - Avto Telecom Entertainment
2015RF 20152014
-1,1% vs Reforecast
-31,3% vs Actual
5,0% vs Reforecast
-0,9% vs Actual
-0,5% vs Reforecast
-11,6% vs Actual
1,2% vs Reforecast
-2,4% vs Actual
1,5% vs Reforecast
-18,7% vs Actual
12,7%vs Reforecast
38,8% vs Actual
-2,0% vs Reforecast
0,5% vs Actual
4,9% vs Reforecast
-23,9% vs Actual
2015RF 20152014
2,3% vs Reforecast
-9,3% vs Actual
2015RF 20152014 2015RF 20152014 2015RF 20152014 2015RF 20152014 2015RF 20152014 2015RF 20152014 2015RF 20152014
Home Appliances
179 025
158 795 162 458
46 25843 981
24 489
18 917
11 903
8 834
14 345
5 799
32 141
41 483
21 756
18 251
12 207
6 410
17 675
4 646
31 772
43 573
21 654
18 466
11 958
6 721
19 912
4 717
AV LHA Computers SHA Accessories Photo - Avto Telecom Entertainment
2015RF 20152014
-1,1% vs Reforecast
-31,3% vs Actual
5,0% vs Reforecast
-0,9% vs Actual
-0,5% vs Reforecast
-11,6% vs Actual
1,2% vs Reforecast
-2,4% vs Actual
1,5% vs Reforecast
-18,7% vs Actual
12,7%vs Reforecast
38,8% vs Actual
-2,0% vs Reforecast
0,5% vs Actual
4,9% vs Reforecast
-23,9% vs Actual
2015RF 20152014
2,3% vs Reforecast
-9,3% vs Actual
2015RF 20152014 2015RF 20152014 2015RF 20152014 2015RF 20152014 2015RF 20152014 2015RF 20152014 2015RF 20152014
Photo-Auto
179 025
158 795 162 458
46 25843 981
24 489
18 917
11 903
8 834
14 345
5 799
32 141
41 483
21 756
18 251
12 207
6 410
17 675
4 646
31 772
43 573
21 654
18 466
11 958
6 721
19 912
4 717
AV LHA Computers SHA Accessories Photo - Avto Telecom Entertainment
2015RF 20152014
-1,1% vs Reforecast
-31,3% vs Actual
5,0% vs Reforecast
-0,9% vs Actual
-0,5% vs Reforecast
-11,6% vs Actual
1,2% vs Reforecast
-2,4% vs Actual
1,5% vs Reforecast
-18,7% vs Actual
12,7%vs Reforecast
38,8% vs Actual
-2,0% vs Reforecast
0,5% vs Actual
4,9% vs Reforecast
-23,9% vs Actual
2015RF 20152014
2,3% vs Reforecast
-9,3% vs Actual
2015RF 20152014 2015RF 20152014 2015RF 20152014 2015RF 20152014 2015RF 20152014 2015RF 20152014 2015RF 20152014
Entertainment & Accessories
Total
27%37%
16%
Digital
179 025
158 795 162 458
46 25843 981
24 489
18 917
11 903
8 834
14 345
5 799
32 141
41 483
21 756
18 251
12 207
6 410
17 675
4 646
31 772
43 573
21 654
18 466
11 958
6 721
19 912
4 717
AV LHA Computers SHA Accessories Photo - Avto Telecom Entertainment
2015RF 20152014
-1,1% vs Reforecast
-31,3% vs Actual
5,0% vs Reforecast
-0,9% vs Actual
-0,5% vs Reforecast
-11,6% vs Actual
1,2% vs Reforecast
-2,4% vs Actual
1,5% vs Reforecast
-18,7% vs Actual
12,7%vs Reforecast
38,8% vs Actual
-2,0% vs Reforecast
0,5% vs Actual
4,9% vs Reforecast
-23,9% vs Actual
2015RF 20152014
2,3% vs Reforecast
-9,3% vs Actual
2015RF 20152014 2015RF 20152014 2015RF 20152014 2015RF 20152014 2015RF 20152014 2015RF 20152014 2015RF 20152014
CE Market
M.Video SalesYoY, %
RUB 1.2 trl
CE Market
M.Video
Entertainment
& Accessories

7
51%
31%
5%+12%
+1%
+2%
+20%
+3%
+33%
+41%
+27%
+19%
+60%
+26%
+91%
In online M.Video greatly outperformed the market
in all categories thanks to effective OMNI-strategy
CE Market
M.Video
Digital
32%38%
14%
Online CE Market
M.Video Online SalesYoY, %
AV
Photo-Auto
Digital
Home Appliances
Entertainment
& Accessories
RUB 230 bn
179 025
158 795 162 458
46 25843 981
24 489
18 917
11 903
8 834
14 345
5 799
32 141
41 483
21 756
18 251
12 207
6 410
17 675
4 646
31 772
43 573
21 654
18 466
11 958
6 721
19 912
4 717
AV LHA Computers SHA Accessories Photo - Avto Telecom Entertainment
2015RF 20152014
-1,1% vs Reforecast
-31,3% vs Actual
5,0% vs Reforecast
-0,9% vs Actual
-0,5% vs Reforecast
-11,6% vs Actual
1,2% vs Reforecast
-2,4% vs Actual
1,5% vs Reforecast
-18,7% vs Actual
12,7%vs Reforecast
38,8% vs Actual
-2,0% vs Reforecast
0,5% vs Actual
4,9% vs Reforecast
-23,9% vs Actual
2015RF 20152014
2,3% vs Reforecast
-9,3% vs Actual
2015RF 20152014 2015RF 20152014 2015RF 20152014 2015RF 20152014 2015RF 20152014 2015RF 20152014 2015RF 20152014
AV
179 025
158 795 162 458
46 25843 981
24 489
18 917
11 903
8 834
14 345
5 799
32 141
41 483
21 756
18 251
12 207
6 410
17 675
4 646
31 772
43 573
21 654
18 466
11 958
6 721
19 912
4 717
AV LHA Computers SHA Accessories Photo - Avto Telecom Entertainment
2015RF 20152014
-1,1% vs Reforecast
-31,3% vs Actual
5,0% vs Reforecast
-0,9% vs Actual
-0,5% vs Reforecast
-11,6% vs Actual
1,2% vs Reforecast
-2,4% vs Actual
1,5% vs Reforecast
-18,7% vs Actual
12,7%vs Reforecast
38,8% vs Actual
-2,0% vs Reforecast
0,5% vs Actual
4,9% vs Reforecast
-23,9% vs Actual
2015RF 20152014
2,3% vs Reforecast
-9,3% vs Actual
2015RF 20152014 2015RF 20152014 2015RF 20152014 2015RF 20152014 2015RF 20152014 2015RF 20152014 2015RF 20152014
Home Appliances
179 025
158 795 162 458
46 25843 981
24 489
18 917
11 903
8 834
14 345
5 799
32 141
41 483
21 756
18 251
12 207
6 410
17 675
4 646
31 772
43 573
21 654
18 466
11 958
6 721
19 912
4 717
AV LHA Computers SHA Accessories Photo - Avto Telecom Entertainment
2015RF 20152014
-1,1% vs Reforecast
-31,3% vs Actual
5,0% vs Reforecast
-0,9% vs Actual
-0,5% vs Reforecast
-11,6% vs Actual
1,2% vs Reforecast
-2,4% vs Actual
1,5% vs Reforecast
-18,7% vs Actual
12,7%vs Reforecast
38,8% vs Actual
-2,0% vs Reforecast
0,5% vs Actual
4,9% vs Reforecast
-23,9% vs Actual
2015RF 20152014
2,3% vs Reforecast
-9,3% vs Actual
2015RF 20152014 2015RF 20152014 2015RF 20152014 2015RF 20152014 2015RF 20152014 2015RF 20152014 2015RF 20152014
Photo-Auto
179 025
158 795 162 458
46 25843 981
24 489
18 917
11 903
8 834
14 345
5 799
32 141
41 483
21 756
18 251
12 207
6 410
17 675
4 646
31 772
43 573
21 654
18 466
11 958
6 721
19 912
4 717
AV LHA Computers SHA Accessories Photo - Avto Telecom Entertainment
2015RF 20152014
-1,1% vs Reforecast
-31,3% vs Actual
5,0% vs Reforecast
-0,9% vs Actual
-0,5% vs Reforecast
-11,6% vs Actual
1,2% vs Reforecast
-2,4% vs Actual
1,5% vs Reforecast
-18,7% vs Actual
12,7%vs Reforecast
38,8% vs Actual
-2,0% vs Reforecast
0,5% vs Actual
4,9% vs Reforecast
-23,9% vs Actual
2015RF 20152014
2,3% vs Reforecast
-9,3% vs Actual
2015RF 20152014 2015RF 20152014 2015RF 20152014 2015RF 20152014 2015RF 20152014 2015RF 20152014 2015RF 20152014
Entertainment & Accessories
Total
179 025
158 795 162 458
46 25843 981
24 489
18 917
11 903
8 834
14 345
5 799
32 141
41 483
21 756
18 251
12 207
6 410
17 675
4 646
31 772
43 573
21 654
18 466
11 958
6 721
19 912
4 717
AV LHA Computers SHA Accessories Photo - Avto Telecom Entertainment
2015RF 20152014
-1,1% vs Reforecast
-31,3% vs Actual
5,0% vs Reforecast
-0,9% vs Actual
-0,5% vs Reforecast
-11,6% vs Actual
1,2% vs Reforecast
-2,4% vs Actual
1,5% vs Reforecast
-18,7% vs Actual
12,7%vs Reforecast
38,8% vs Actual
-2,0% vs Reforecast
0,5% vs Actual
4,9% vs Reforecast
-23,9% vs Actual
2015RF 20152014
2,3% vs Reforecast
-9,3% vs Actual
2015RF 20152014 2015RF 20152014 2015RF 20152014 2015RF 20152014 2015RF 20152014 2015RF 20152014 2015RF 20152014
Digital
179 025
158 795 162 458
46 25843 981
24 489
18 917
11 903
8 834
14 345
5 799
32 141
41 483
21 756
18 251
12 207
6 410
17 675
4 646
31 772
43 573
21 654
18 466
11 958
6 721
19 912
4 717
AV LHA Computers SHA Accessories Photo - Avto Telecom Entertainment
2015RF 20152014
-1,1% vs Reforecast
-31,3% vs Actual
5,0% vs Reforecast
-0,9% vs Actual
-0,5% vs Reforecast
-11,6% vs Actual
1,2% vs Reforecast
-2,4% vs Actual
1,5% vs Reforecast
-18,7% vs Actual
12,7%vs Reforecast
38,8% vs Actual
-2,0% vs Reforecast
0,5% vs Actual
4,9% vs Reforecast
-23,9% vs Actual
2015RF 20152014
2,3% vs Reforecast
-9,3% vs Actual
2015RF 20152014 2015RF 20152014 2015RF 20152014 2015RF 20152014 2015RF 20152014 2015RF 20152014 2015RF 20152014

8
M.Video FY 2017 audited
IFRS results
Russian CE Market Update
M.Video 4Q & FY 2017 Operational Highlights
M.Video FY 2017 Key Financial Highlights
Eldorado acquisition
by M.Video
Transaction Summary
Strategic Rationale
Financial Rationale
Combined Business Strategy
Q&A session

9
FY 2017 Stores & Space Growth
M.Video 4Q & FY 2017 operational highlights
4Q & FY 2017 Sales, RUB bn (VAT incl.)
398
895
424
937
Number of stores, eop Total space, '000 sq m, eop
FY 2016 FY 2017
65
216
77
234
4Q FY
2016 2017
+26
+4.7% +8.2%
+18.6%

10
7,800
FY 2017
Number of checks Average check Turnover
+5.3% -1.2% +4.1%
8,442
4Q 2017
Number of checks Average check Turnover
+13.1% -0.3% +12.7%
M.Video 4Q & FY 2017 LFL sales highlights
67
mln of transactions RUB, VAT incl. B’RUB, VAT incl.
7.9
26.3
205
4Q 2017 Like-for-Like Stores Sales FY 2017 Like-for-Like Stores Sales
mln of transactions RUB, VAT incl. B’RUB, VAT incl.

11
M.Video record growth in online reaching 16% of total sales
4Q & FY 2017 Online Sales, RUB bn (VAT incl.) 2014-2017 Online Sales Share in Total Sales
8
26
14
37
4Q FY
2016 2017
+68.5%
+41.3%
9%11%
12%
16%
66.5% 67.9% 67.0%72.1%
2014 2015 2016 2017
OBS Share in Total Sales Pick-up share in OBS
Note: Online sales include home delivery and in-store pick-up

12
M.Video strategic projects launched in 2017
added incremental revenue
# of authorizations
714 thousand
Accessories penetration rate
235%
Approval rate increase
to 85%m_credit
%
+2.4
+3.5
+1.3
Added Revenue 2017
(RUB bn)
# of Omni-baskets sent
235 thousand
# of cards issued
205 thousand
Service average penetration rate
51%
Note: Based on company managerial accounting estimates
Tablet-based in-store sales
(Real Time Dealing)
Shop-in-shop for
digital products & services
Outsourced consumer
loans broker

13
M.Video FY 2017 audited
IFRS results
Russian CE Market Update
M.Video 4Q & FY 2017 Operational Highlights
M.Video FY 2017 Key Financial Highlights
Eldorado acquisition
by M.Video
Transaction Summary
Strategic Rationale
Financial Rationale
Combined Business Strategy
Q&A session

14
38.942.9
46.5
24.1% 23.4% 23.5%
2015A 2016A 2017A
Gross Margin, %
162183
198
378398
424
2015A 2016A 2017A
№ of Stores
CAGR’15-17 +10.7%
Revenue (net of VAT), RUB bn Gross Profit, RUB bn
M.Video FY 2017 key financial highlights
+8.2%+8.4%

15
4.55.5
7.0
2.8% 3.0% 3.5%
2015A 2016A 2017A
Net Margin, %
8.810.3
11.8
5.5% 5.6% 6.0%
2015A 2016A 2017A
EBITDA Margin, %
M.Video showed best EBITDA margin over 3 years,
solid Net Income
EBITDA, RUB bn
+14.0%
Net Income, RUB bn
+25.4%

16
+0.05pp -0.10pp +0.22pp+0.17pp - 0.48pp +0.64pp
Net Margin
2016
Gross Margin Personnel Lease D&A Other OPEX Other
Operating
Income
Net Margin
2017
M.Video Net Margin improvement factors in FY 2017
3.0%
3.5%
Promos fully
offset by
better mix and
efficient
procurement
One-off LTIP
vesting;
strategic
projects of
2017
Rates re-
negotiations;
IFRS strait-line
adj. positive
effect
Net credit
commissions
(M.Credit)
High base of
2016 (assets
write-off in
2016)
M.Credit
outsourcing fees
fully offset by
operating income

17
It’s time to take next step
in M.Video’s strategic development
Stable market share 17%
Record 14% market share in online
Services and accessories growth by
+26% and +21%, due to strategic
projects and eco-system
Solid EoP cash balance of RUB 18 bn
EBITDA margin up by 40 bp’s to 6.0%
Net income up by 25% to RUB 7.0 bn
Online sales grew +41% YoY
Share of OBS in Sales was up to 16%
Russian CE market is maturing, the
growth has slowed down to 5 - 6%
In spite of M.Video strategic initiatives,
single digit growth just above the
market is forecasted in mid-term
M_Mobile helps to compete in
Digital, but M.Video needs to grow
mobile category faster
Achievements Headwinds
Competition from local CE players
in Digital
Intensifying presence of cross-
boarder e-commerce players
18
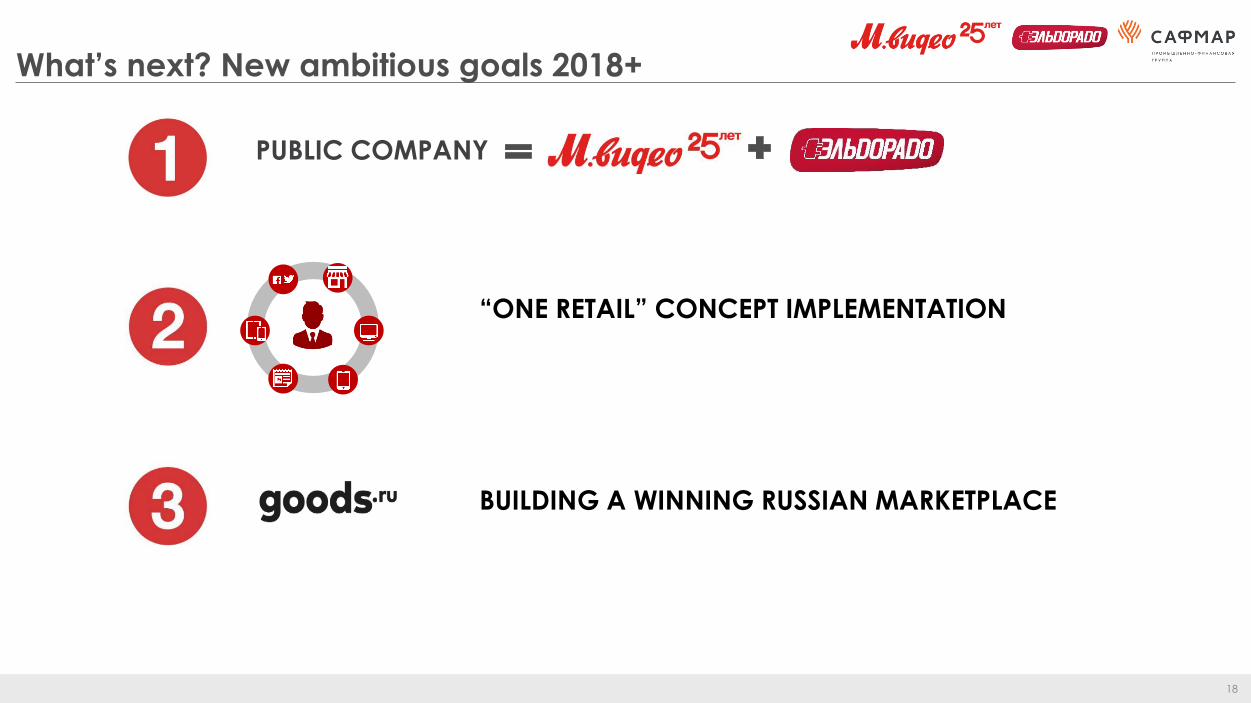
PUBLIC COMPANY
What’s next? New ambitious goals 2018+
BUILDING A WINNING RUSSIAN MARKETPLACE
“ONE RETAIL” CONCEPT IMPLEMENTATION

19
M.Video FY 2017 audited
IFRS results
Russian CE Market Update
M.Video 4Q & FY 2017 Operational Highlights
M.Video FY 2017 Key Financial Highlights
Eldorado acquisition
by M.Video
Transaction Summary
Strategic Rationale
Financial Rationale
Combined Business Strategy
Q&A session

20
Transaction summary
M.video Management LLC buys 100% in Eldorado LLC
Acquisition cost Up to RUB 45.5 bn
Financing sources Cash and Debt of c. RUB 40.0 bn
Deal timing In Q2, 2018
Condition EGSM approval on April 13, 2018
Legal mergerof M.Video Management & Eldorado LLC
In Q1, 2019

21
High-level structure of Eldorado acquisition
100%
M.Video Management
LLC takes c. RUB 40 bn
loan to acquire 100%
interest in BOVESTO LTD
M.Video Management
LLC acquires 100% in
BOVESTO LTD from
SAFMAR GROUP for up
to RUB 45.5 bn
Merger between
M.video Management
LLC and Eldorado LLCEldorado
LLC
BOVESTO LTD(CYPRUS)
PJSC
M.video
M.video
Management
LLC
100%
SAFMAR GROUP
Financing
bank
33
100%
1
1
2
2
22
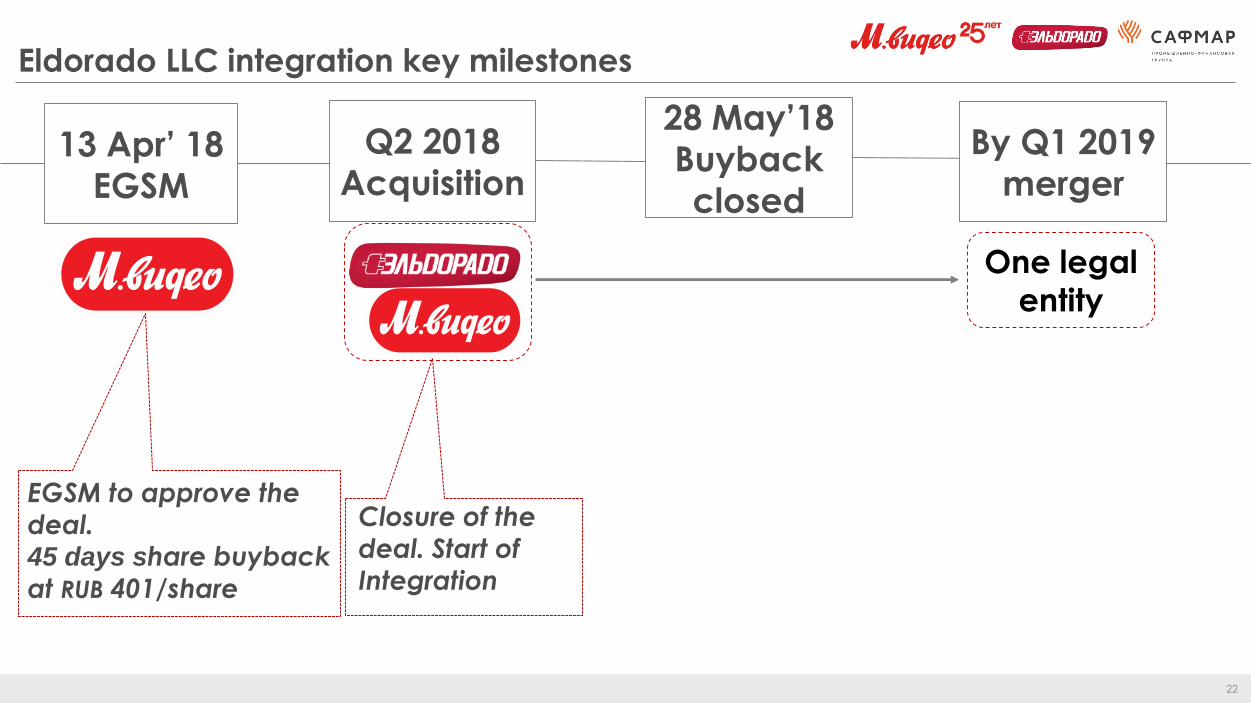
Eldorado LLC integration key milestones
Closure of the
deal. Start of Integration
EGSM to approve the deal. 45 days share buyback
at RUB 401/share
13 Apr’ 18
EGSM
Q2 2018
Acquisition
28 May’18
Buyback
closed
By Q1 2019
merger
One legal
entity

2323
One legal entity is necessary for business efficiency
Combined
procurement and
stock management1
• Market leader
• Easy stock relocation
• Common warehouses
Lower maintenance
costs for single legal
entity2
• Elimination of functions duplication
• Elimination of possible transfer pricing risks
• IT-infrastructure optimization
• Investors participation in common success
• Efficiency improvements and profitability growth
• Higher transparency of the business
Public combined
company3
24
M.Video FY 2017 audited
IFRS results
Russian CE Market Update
M.Video 4Q & FY 2017 Operational Highlights
M.Video FY 2017 Key Financial Highlights
Eldorado acquisition
by M.Video
Transaction Summary
Strategic Rationale
Financial Rationale
Combined Business Strategy
Q&A session

2525
Euronics. 6%
Apple. 7%
Expert
16%
MediaMarkt &
Saturn
40%
Yodobashi Camera
11%
Edion
11%
Bic Camera
11%
Yamada Denki
20%
Dell. 1%MicroElectronics. 2%
Apple
22%
Best Buy
27%
Svyaznoy
8%
Eldorado
9%
DNS
15%
M.Video
17%
Fast Shop. 5%
Máquina de Vendas
6%
Magazine Luiza
13%
Groupe Casino
24%
Russian Electronics retail is maturing and
it is right time to take the lead in its consolidation
Sources used: GFK (M.Video & Eldorado), Euromonitor 2017 (the rest)
69%
53% 52% 49% 48%

2626
3.3
25.9%+ =
Russian CE market RUB1,228 bn
Market Shares are based on M.Video internal estimates
Market Value is based on GFK forecast 2017
Russian CE market today: DNS is making visible progress
8.88.1
6.0
17.115.0
5.54.8
3.3

27
Complementarity in sales structure and operations
make Eldorado a great M&A target for M.Video
27%37%
31%
15%
Sales by Product Category Sales by Region
Siberia
Moscow
North
Center
South
East
№ of Stores
Average Selling Space
Average Ticket
Years on the market
25 24
424 415
7,700 5,200
Eldorado
M.Video
1,600 1,400
AV
Photo-Auto
Digital
Home Appliances
Entertainment
& Accessories
16%
49%
21%21%
Eldorado
M.Video
28
30%18%
30%35%
40% 47%
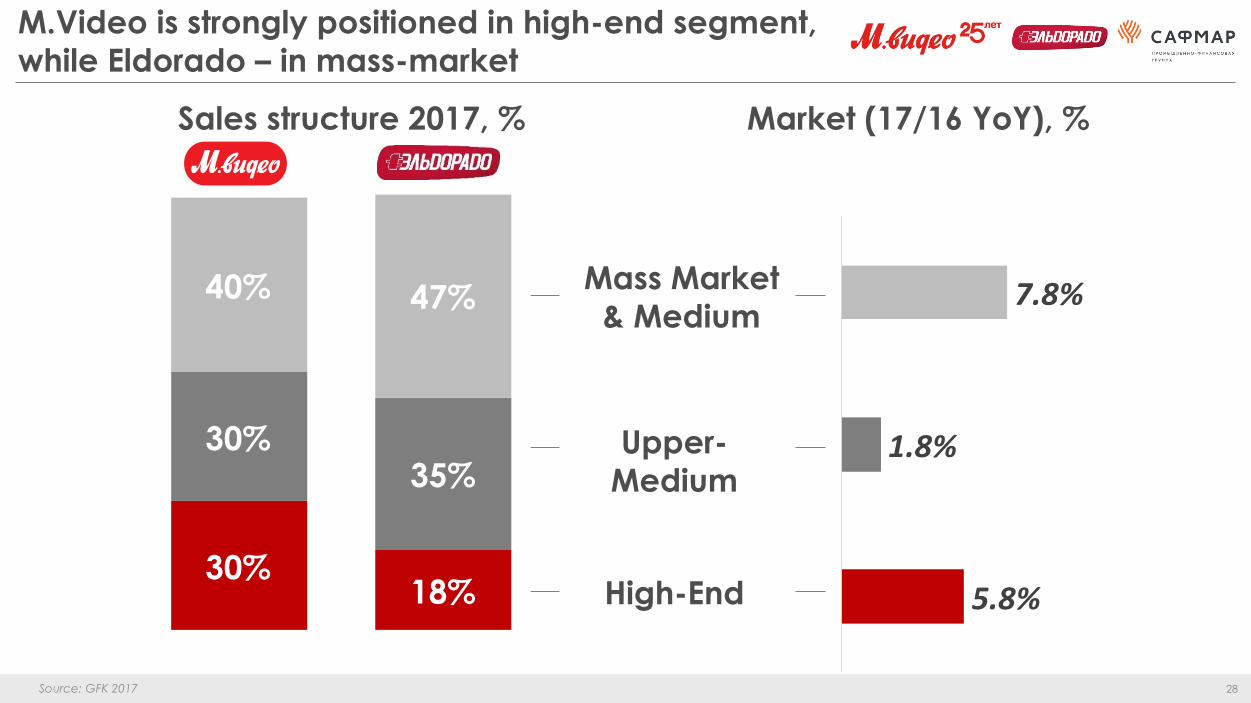
M.Video is strongly positioned in high-end segment,
while Eldorado – in mass-market
Mass Market
& Medium
High-End
Upper-
Medium
5.8%
1.8%
7.8%
Market (17/16 YoY), %Sales structure 2017, %
Source: GFK 2017
29
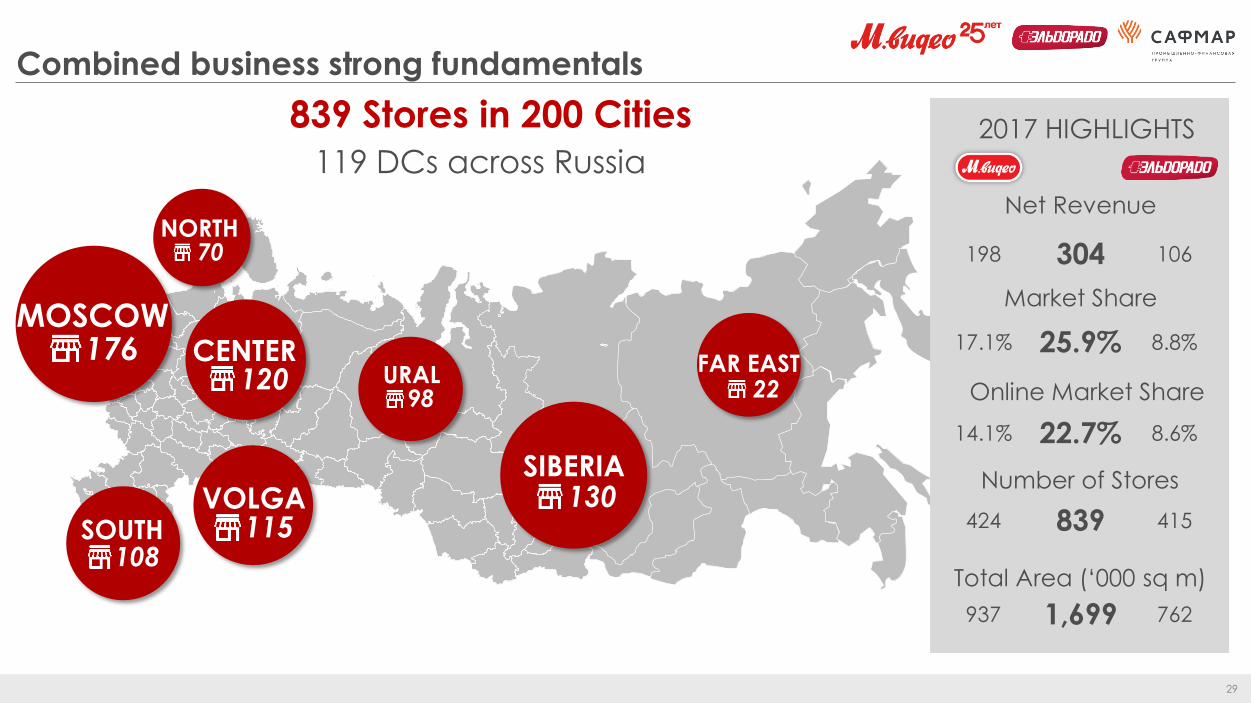
Combined business strong fundamentals
839 Stores in 200 Cities
130SIBERIA
22FAR EAST
98URAL
108SOUTH
70NORTH
120CENTER
115VOLGA
176MOSCOW
2017 HIGHLIGHTS
119 DCs across Russia
Net Revenue
Market Share
Online Market Share
Number of Stores
Total Area (‘000 sq m)
304 106198
25.9% 8.8%17.1%
22.7% 8.6%14.1%
839 415424
1,699 762937
30
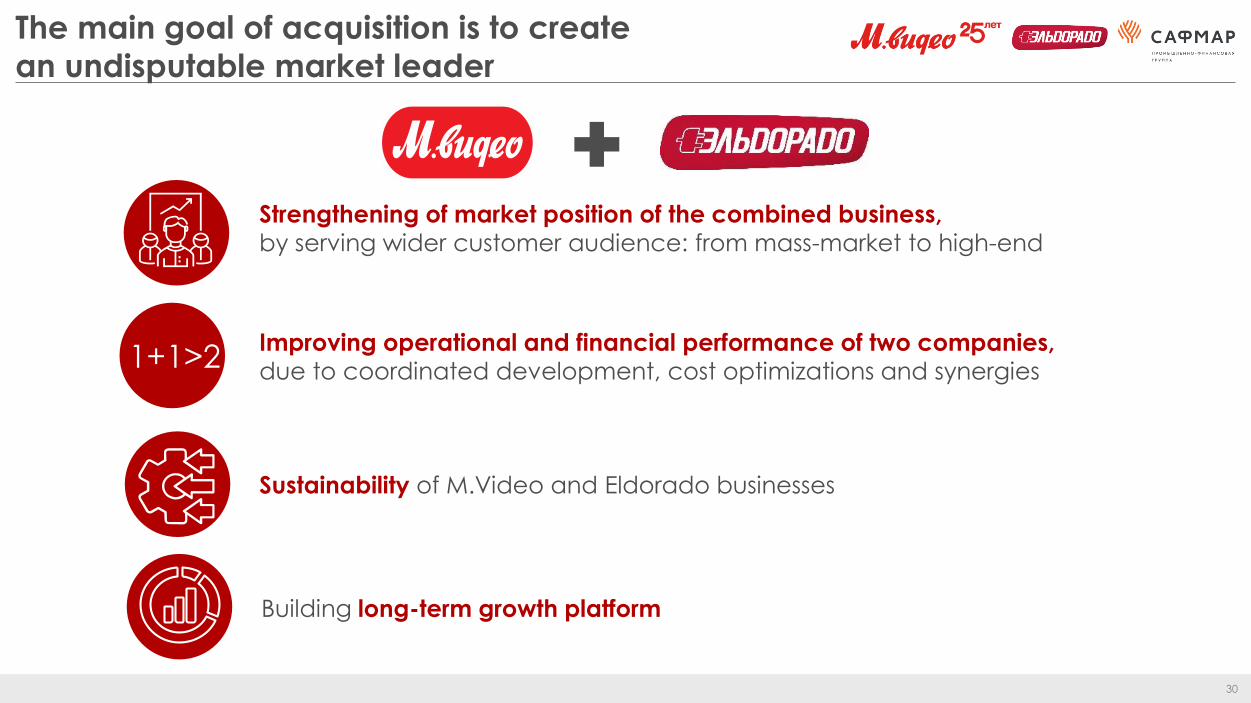
The main goal of acquisition is to create
an undisputable market leader
Strengthening of market position of the combined business,
by serving wider customer audience: from mass-market to high-end
1+1>2Improving operational and financial performance of two companies,
due to coordinated development, cost optimizations and synergies
Sustainability of M.Video and Eldorado businesses
Building long-term growth platform

31
M.Video FY 2017 audited
IFRS results
Russian CE Market Update
M.Video 4Q & FY 2017 Operational Highlights
M.Video FY 2017 Key Financial Highlights
Eldorado acquisition
by M.Video
Transaction Summary
Strategic Rationale
Financial Rationale
Combined Business Strategy
Q&A session

32
Logistics 2.0
Total synergies 18
Procurement 10.6
SG&A 7.4
Maintenance 0.2
Rent 1.2
Finance 1.2
IT 0.3
Marketing 1.6
0.9Personnel
Source of synergies Positive effect on EBITDA
The acquisition will bring RUB 18 bn synergies over 3 years
The information provided is based on M.Video’s expectations which are indicative and cannot be considered as an official guidance

33
Combined EBITDA Margin of 6+% sustainable from 2019+
47
7
5.0%
2017A 2018E 2019E 2020E
Synergies, RUB bn
EBITDA, RUB bn
EBITDA Margin, %15
6%+
The information provided is based on M.Video’s expectations which are indicative and cannot be considered as an official guidance
5%+

34
Revenue (net of VAT), RUB bn
Group financial forecasts 2018E-2022E
CAGR’17-22F 8+%
EBITDA, RUB bn
CAGR’17-22F 14+%
304
450+839
1050+
2017A 2018E 2019E 2020E 2021E 2022E
Revenue, RUB bn № of stores
1519
30+
5.0%
5%+
2017A 2018E 2019E 2020E 2021E 2022E
EBITDA, RUB bn EBITDA Margin, %
6%+
The information provided is based on M.Video’s expectations which are indicative and cannot be considered as an official guidance
Pro-forma Pro-forma

35
Group debt portfolio 2018E-2022E
Total Debt & Total Debt/EBITDA Net Debt & Net Debt/EBITDA
9
47
2721 19
28
0.6
2.6
0.9
2017A 2018E 2019E 2020E 2021E 2022E
Total Debt, RUB bn Cash (eop) Total Debt/EBITDA
-11
28
0
-0.7
1.5
0.0
2017A 2018E 2019E 2020E 2021E 2022E
Net Debt, RUB bn Net Debt/EBITDA
The information provided is based on M.Video’s expectations which are indicative and cannot be considered as an official guidance
Pro-forma Pro-forma

36
M.Video FY 2017 audited
IFRS results
Russian CE Market Update
M.Video 4Q & FY 2017 Operational Highlights
M.Video FY 2017 Key Financial Highlights
Eldorado acquisition
by M.Video
Transaction Summary
Strategic Rationale
Financial Rationale
Combined Business Strategy
Q&A session

37
17.1%
8.8%
ONE COMPANY
ONE OPERATING BUSINESS MODEL
TWO BRANDS
Groupmarket share
25.9%
Source: GFK data 2017 market share M.VIDEO & ELDORADO
Merge strategy: One company – Two brands
2018 2019 2020+
Market
Share3EBITDA
Margin 6%2Business
Model1
Centralization of operations keeping 2
brands
Sustainable EBITDA margin 6%+
CE market share 30+%

38
Board of Directorsof which
Independent Directors
Audit CommitteeThe Remuneration and
Nomination Committee
Adhering to best corporate governance standards
14 members
4
Remuneration policies and
practices
Recruitment, development
and retention of the personnel
Financial reporting
Risk management, internal control
Corporate governance
External & internal audit
SAFMAR
Group57.7%
Free Float
42.3%
AGMCapital Structure
9.4%
5.8%
27.1%
Pension fund
“Doverie”
Pension fund
“Buduschee”
Other
One Company
One Model
Two brands
Note: PJSC M.Video capital structure is provided as of Dec 31, 2017
SAID GUTSERIEVChairman of the Board of Directors

39
Consistency in leadership – the team in place
ALEXANDER TYNKOVAN
Founder, President
Management Board Chairman
PAVEL BREEVVice-President
Management Board Member
25 years with M.Video
STEVEN LEWISManaging Director
8 years with M.Video
SERGEY LEEManaging Director
10 years with M.Video
BILAN UZHAHOVVice-President
Management Board Member
ENRIQUE FERNANDEZ
Group CEOManagement Board Member
9 years with M.Video
EKATERINA SOKOLOVA
Group CFOManagement Board Member
2 years with M.Video
MANAGEMENT BOARD
CENTRAL TEAM
Front functions Back office
HR
Logistics
Finance
Commerce
One Company
One Model
Two brands

40
Marketing
Two competing brands with one merged back office
ENRIQUE FERNANDEZ
Group CEOManagement Board Member
CENTRAL TEAM
E-Commerce
Retail
M_Mobile +
Marketing
E-Commerce
Retail
Front functions remain
separate for each brand Back office functions merge
Commerce &
Procurement
Strategic
MarketingLogistics
IT Development
HR Transformation
Finance
Investor
RelationsSecurity PR Legal
One Company
One Model
Two brands

4141
M.Video efficient model to be rolled-out
on Eldorado businessEco-SystemEfficient
Procurement
Working
Capital
Assortment
Target
Margin
OMNI
Stores
Internet
Mobile
2
Best assortment = endless online shelf
Best service = across all channels
Best price guarantee = price match online
1
3
One Company
One Model
Two brands

4242
“One Retail” Re-start
600 m2
Evolution Re-concept
Maximization
“As big as we can”
Re-design
“As big as we need”
Strategic Initiatives
Customers
Footprint
Strategy of Two Brands
Customer Value Proposition
Two brands strategy 2018+
+
One Company
One Model
Two brands

43
Two brands differentiation and market positioning
Best deal
Promo-oriented
Affordability
Simplicity
Fast deal
Proximity locations
“One Retail”
Leader
Center of competence
Uniqueness
Shopping
experience
Location
One Company
One Model
Two brands
Best locations
Top-level customer service

44
till 2022
ONE RETAIL
20182014OMNI channel
strategy
mobile
phone
store
internet
2015-2017
STRATEGIC projects
m_mobile M.Broker RTD
235%accessoriespenetration
85%approval
rate
+3%revenue
M.Video digital transformation to ONE RETAIL
%
%
CONVERGENCE
One Company
One Model
Two brands

4545
42,200
25,200
14,20013,50012,2008,4007,1006,0006,0005,200
Best BuyCeconomyYamada
Denki
Dixons
Carphone
GomeFNAC
Darty
Bic CameraEdionK's
M.Video & Eldorado joint business is in Top-10 public
consumer electronics retailers worldwide by revenue
USD million
2017№10
Source: companies data as reported for 2017, Thompson Reuters
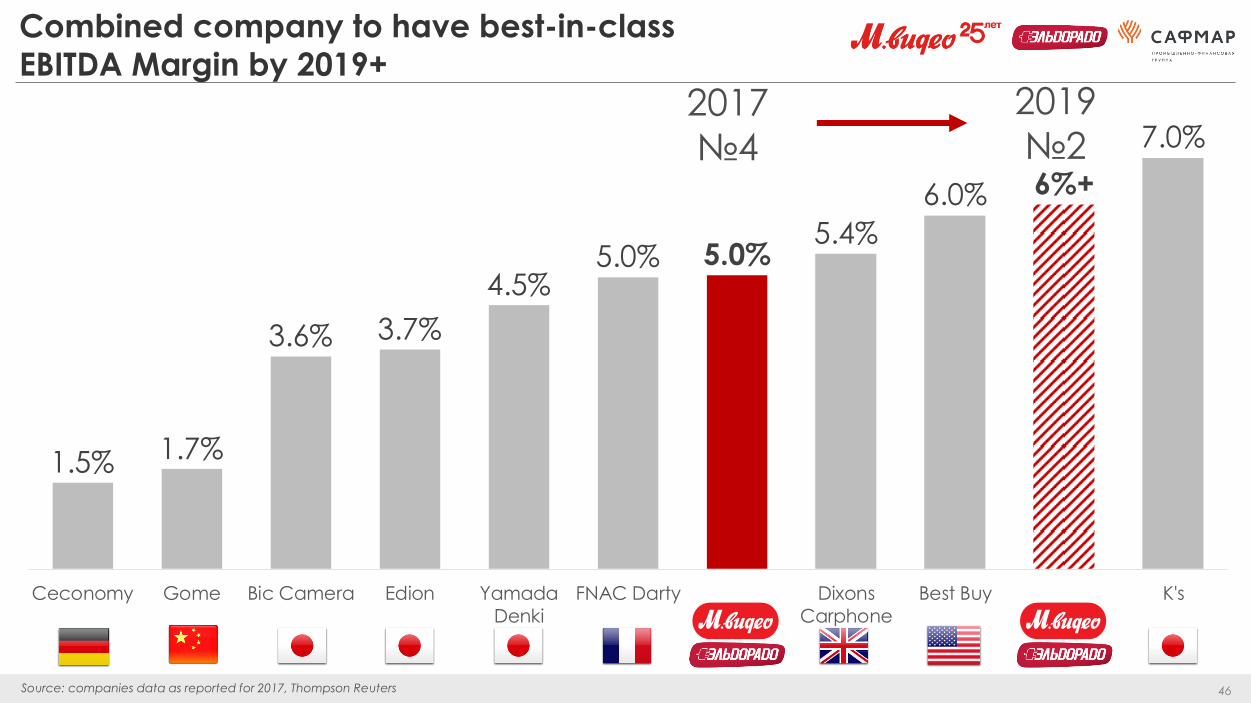
4646
7.0%
6%+6.0%
5.4%5.0%5.0%
4.5%
3.7%3.6%
1.7%1.5%
K'sBest BuyDixons
Carphone
FNAC DartyYamada
Denki
EdionBic CameraGomeCeconomy
Combined company to have best-in-class
EBITDA Margin by 2019+
2017
№4
2019
№2
Source: companies data as reported for 2017, Thompson Reuters

4747
Joint business to bring additional value to all stakeholders
Best products for
reasonable price
Healthy competition
Technologies for unique
customer experience
Market leadership
Public transparent
business
Revenue grows 1.5x, Net Income
doubles in 3 years
Best-in-class EBITDA Margin
Best corporate governance
Reliable long-term
collaboration
In top-10 best
employers in Russia
Corporate Social
Responsibility practices
Exclusive all-Russia
contracts
Total Quality
Management
30,000+ employees in
200 cities
Suppliers Customers
InvestorsSocietyBest HR brand in
Retail 2017

4848
M.Video FY 2017 audited
IFRS results
Russian CE Market Update
M.Video 4Q & FY 2017 Operational Highlights
M.Video FY 2017 Key Financial Highlights
Eldorado acquisition
by M.Video
Transaction Summary
Strategic Rationale
Financial Rationale
Combined Business Strategy
Q&A session

49
APPENDIX I. M.Video Statement of Profit & Loss
RUBm% of
RevenueRUBm
% of
RevenueRUBm %
Revenue 198 197 183 219 14 978 8.2%
Cost of Sales 151 670 76.5% 140 284 76.6% 11 386 8.1%
Gross profit 46 527 23.5% 42 935 23.4% 3 592 8.4%
SG&A 40 754 20.6% 37 351 20.4% 3 403 9.1%
Other operating income, net of expenses 2 407 1.2% 1 100 0.6% 1 307 118.8%
Operating profit 8 180 4.1% 6 684 3.6% 1 496 22.4%
Finance income / (cost), net 659 0.3% 511 0.3% 148 29.0%
Profit before income tax 8 839 4.5% 7 195 3.9% 1 644 22.8%
Income Tax Expense 1 885 1.0% 1 649 0.9% 236 14.3%
Net Income 6 954 3.5% 5 546 3.0% 1 408 25.4%
EBITDA 11 794 6.0% 10 344 5.6% 1 450 14.0%
12m 2017 12m 2016 Change YoY

50
APPENDIX II. M.Video SG&A Expenses
12m 2017as % of
revenue12m 2016
as % of
revenueRUBm % RUBm %
Payroll and related taxes 12 538 6.3% 11 415 6.2%
Lease expenses 8 885 4.5% 8 621 4.7%
Advert ising & promotional expenses 3 827 1.9% 3 521 1.9%
Utilit ies, maintenance & other property operating costs 2 847 1.4% 2 802 1.5%
Warehouse services 1 484 0.7% 1 469 0.8%
Bank charges 1 600 0.8% 1 331 0.7%
Repairs and servicing 1 096 0.6% 1 082 0.6%
Security 979 0.5% 970 0.5%
Other SG&A 3 884 2.0% 2 480 1.4%
Subtotal 37 140 18.7% 33 691 18.4%
D&A 3 614 1.8% 3 660 2.0%
Total 40 754 20.6% 37 351 20.4%

51
APPENDIX III. M.Video Statement of Financial Position
31.12.2017 31.12.2016
RUBm RUBm RUBm %
Assets
Non-current Assets 23,663 18,959 4,704 24.8%
Fixed assets 7,936 8,127 (191) -2.4%
Intangible assets 7,999 6,145 1,854 30.2%
Other non-current 7,728 4,687 3,041 64.9%
Current assets 97,862 81,342 16,520 20.3%
Inventory 52,283 45,170 7,113 15.7%
Accounts receivable 21,611 13,162 8,449 64.2%
Cash 17,791 18,763 (972) -5.2%
Other 6,177 4,247 1,930 45.4%
Total Assets 121,525 100,301 21,224 21.2%
Liabilities and equity
Stockholders' equity 23,154 15,951 7,203 45.2%
Equity attributable to owners of the
Company 22,924 15,950 6,974 43.7%
Non-controlling interests 230 1 229 22900.0%
Liabilities 98,371 84,350 14,021 16.6%
Accounts payable to suppliers 77,698 66,285 11,413 17.2%
Other current liabilit ies 20,669 17,990 2,679 14.9%
Other non-current liabilit ies 4 75 (71) -94.7%
Total Liabilities and Equity 121,525 100,301 21,224 21.2%
Change

52
APPENDIX IV. M.Video Cash Flow Statement
12m 2017 12m 2016
RUBm RUBm RUBm %
Operating CF
Operating cash flows before movements in WC 11,816 10,238 1,578 15.4%
Inventory change (7,118) (1,044) (6,074) 581.8%
Trade payables 11,413 8,123 3,290 40.5%
Others (8,389) (1,996) (6,393) 320.3%
Interest paid - (56) 56 -100.0%
Income tax paid (2,704) (1,831) (873) 47.7%
Net CF from operations 5,018 13,434 (8,416) -62.6%
Investing CF
CAPEX - PPE (2,088) (1,816) (272) 15.0%
CAPEX - IA (3,168) (2,368) (800) 33.8%
Net inflow\(outflow) from deposits (1,631) - (1,631) 100.0%
Investment in associates (15) - (15) 100.0%
Withdrawal of deposits with an original maturity of more than 90 days - 800 (800) -100.0%
Interest received 661 527 134 25.4%
Net CF from investing activities (6,241) (2,857) (3,384) 118.5%
Financing CF
Net CF from financing activities 249 (3,591) 3,840 106.9%
Net increase/(decrease) in cash and cash equivalents (974) 6,986 (7,960) -113.9%
Net foreign exchange difference 2 (2)
CASH AND CASH EQUIVALENTS, bop 18,763 11,779 6,984 59.3%
CASH AND CASH EQUIVALENTS, eop 17,791 18,763 (972) -5.2%
Change YoY
Related Documents


![· Web viewPost Until: [Date] PRODUCT RECALL. PRODUCT RECALL. PRODUCT RECALL. PRODUCT LIABILITY EVALUATION. PRODUCT LIABILITY EVALUATION. PRODUCT LIABILITY EVALUATION. PRODUCT LIABILITY](https://static.cupdf.com/doc/110x72/5e58b356d7aea8615859438c/web-view-post-until-date-product-recall-product-recall-product-recall-product.jpg)


