Presentation to Select Presentation to Select Committee on Public Service Committee on Public Service Overview of the Strategic and Overview of the Strategic and Annual Performance Plans Annual Performance Plans 2013/14 – 15/16 2013/14 – 15/16 Mr. T.W. Zulu Mr. T.W. Zulu Director-General Director-General

Content
Jan 03, 2016
Presentation to Select Committee on Public Service Overview of the Strategic and Annual Performance Plans 2013/14 – 15/16 Mr. T.W . Zulu Director-General. - PowerPoint PPT Presentation
Welcome message from author
This document is posted to help you gain knowledge. Please leave a comment to let me know what you think about it! Share it to your friends and learn new things together.
Transcript
Presentation to Select Presentation to Select Committee on Public ServiceCommittee on Public Service
Overview of the Strategic and Annual Overview of the Strategic and Annual Performance Plans Performance Plans
2013/14 – 15/16 2013/14 – 15/16
Mr. T.W. ZuluMr. T.W. ZuluDirector-GeneralDirector-General
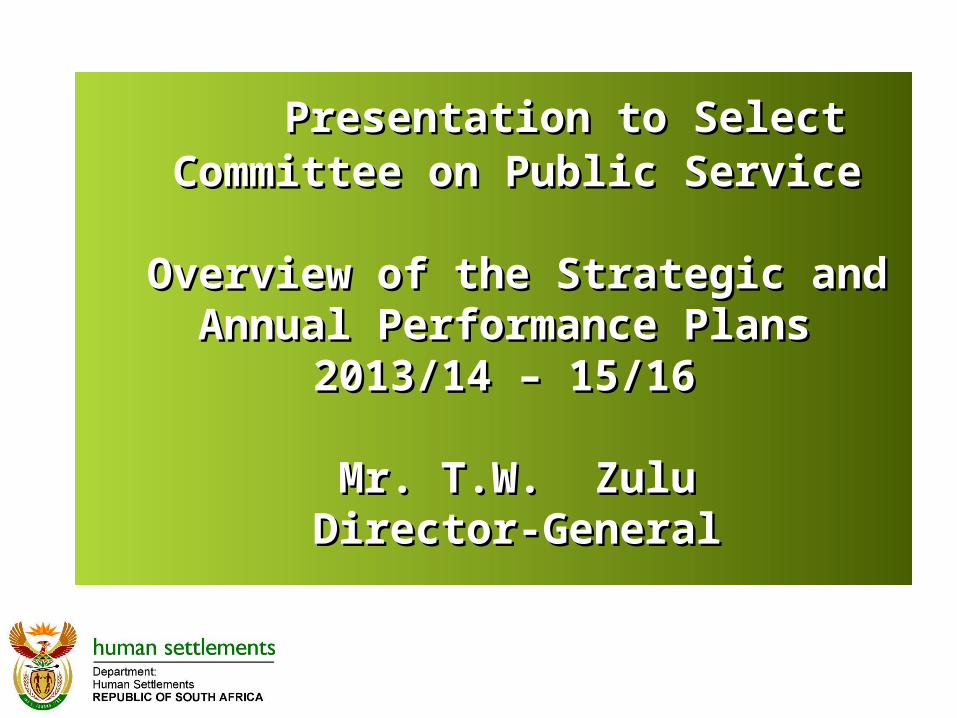
VISION VISION “A NATION HOUSED IN SUSTAINABLE HUMAN SETLLEMENTS ““A NATION HOUSED IN SUSTAINABLE HUMAN SETLLEMENTS “
MISSION MISSION “ TO FACILITATE THE CREATION OF SUSTAINABLE HUMAN “ TO FACILITATE THE CREATION OF SUSTAINABLE HUMAN
SETTLEMENTS AND IMPROVED QUALITY OF HOUSEHOLD LIFESETTLEMENTS AND IMPROVED QUALITY OF HOUSEHOLD LIFE” ”

ContentContent
Strategic Overview of the Department – 2013/16
Values Budget Structure of the Department Human Settlements Priorities Performance Indicators and Targets Financial Information Key Risks And Challenges
3
Strategic OverviewStrategic Overview
4
The Department implemented the approved turnaround strategy with effect from 01st April 2012.
An organogram was approved by DPSA with effect from 01st April and a process on migration of staff and personnel has been completed.
The National Treasury approved a revised budget structure which is consistent with the strategic plan but not the organisational structure.
A key issue intended to receive priority is the matter of alignment of the strategies with plans, budget and performance.
Strategic OverviewStrategic Overview
5
A process will also unfold to further refine strategies and alignment to national development goals and priorities and this includes matters related to policy and strategic infrastructure development.
A key issue to receive attention is the alignment of roles, responsibilities, obligations and accountability for the household sanitation function.
The year will also require term reports to be completed and this includes Outcome 8 as well as the 20 year review of government
Strategic OverviewStrategic Overview
The material and key performance indicators, outputs and outcomes as contained in Outcome 8 and the objectives in the Estimates of National Estimates (ENE) receive priority focus in the strategic and annual performance plans of the Department.
The Department will use the 2013/14 financial year as one that imbeds the National Development Plan in respect of strategy, policy and operations for sector and institutional transformation and implementation.
The targets as contained in the Delivery Agreement signed between the Minister and the President also form a key basis of the strategic focus areas of planning, funding and implementation.
6

Strategic OverviewStrategic Overview
7
The following are key programme and projects activities for the period head:
The implementation of the revised FLISP programme.
Implementation of the management of the Rectification Programme by the Department.
Focus on the accreditation programme
Improving on the social and rental housing units delivered.
Better and improved intergovernmental collaboration and coordination.

Strategic OverviewStrategic Overview
8
Special and designated group and sector focused programmes including “Youth Builds”, “Women's’ Builds” and the “Each One, Settle One” programmes are to be up scaled and planning and funding improved.
Better and improved output and target monitoring including quality and value for money through the Programme Management Unit is envisaged.

9
ValuesValues
The core values of the Department based on the Constitution include :
Accountability Fairness and equity Choice, quality and affordability Sustainability Innovation as well as adherence to;
Batho Pele principles.

10
DEPARTMENTAL ORGANOGRAMDEPARTMENTAL ORGANOGRAM

CD: EXECUTIVE SUPPORTMr. S.S. Nkosi
CD: INTERNAL AUDIT, RISK MANAGEMENT AND SPECIAL INVESTIGATION Mr. T. Mashabane (Act)
CD: HS StrategyDr Z Sokopo
DIRECTOR-GENERALMr T Zulu
CD: HS Planning Mr A Arendse
CD: Stakeholder Relations & IntergovernmentalMr W Jiyana
CD: Corporate SupportMr E Sithole
CD: CIOMr M Xaba
CD: LegalServicesAdv J Tladi
DDG: HS Strategy
&Planning
Mr N Chainee
CD: Governance FrameworksMr T Nobotana
CD: Operational Policy FrameworksMr L vd Walt (Act)
DDG:CorporateServices Ms NLetsholonyane
DDG: HS Delivery FrameworksMr M Maphisa
CD: Human ResourcesMs. M. Snyman
DDG: Chief Of OperationsMs. S. Ngxongo
CD: Regulatory Compliance ServicesVacant
CD: Technical CapacityDevelopment Mr M Maclean
CD: Enterprise Architecture Mr M Moerane
CD: Chief Investment Officer
Mr M Hitge (Act)
CD: Financial Management
Mr N Mbengo
DDG: Chief Financial Officer
Ms F Matlatsi
CD:Communication
s ServicesMr X Xundu
CD: Programme & Project PlanningMs J Bayat
CD: Programme Implementation FacilitationMr J Wallis
CD: Sanitation ProgrammeMr P Chauke (Act)
DDG: Project Management Unit (PMU)Mr J Wallis
(Act)
CD: Programme Monitoring & EvaluationMr P Chauke
11
CD: Advisory ServicesMr L Jolobe
12
Budget Programme StructureBudget Programme Structure
• Programme 1: Administration.
Purpose: Provide strategic leadership and administrative support services to the department
• Programme 2: Human Settlements Policy, Strategy and Planning.
Purpose: Manage the development and compliance with human settlements sector delivery frameworks and oversee integrated human settlements strategic and planning services.
13
Budget Programme StructureBudget Programme Structure
• Programme 3: Programme Deliver Support.
Purpose: Support the execution of human settlement programmes and projects and oversee the implementation of the household sanitation programme
• Programme 4: Housing Development Finance
Purpose: Fund and monitor the delivery of all housing and human settlements programmes, including oversight of public entities reporting to the Minister of Human Settlements and manage all matters related to improving access to housing finance and developing partnerships with the financial sector.
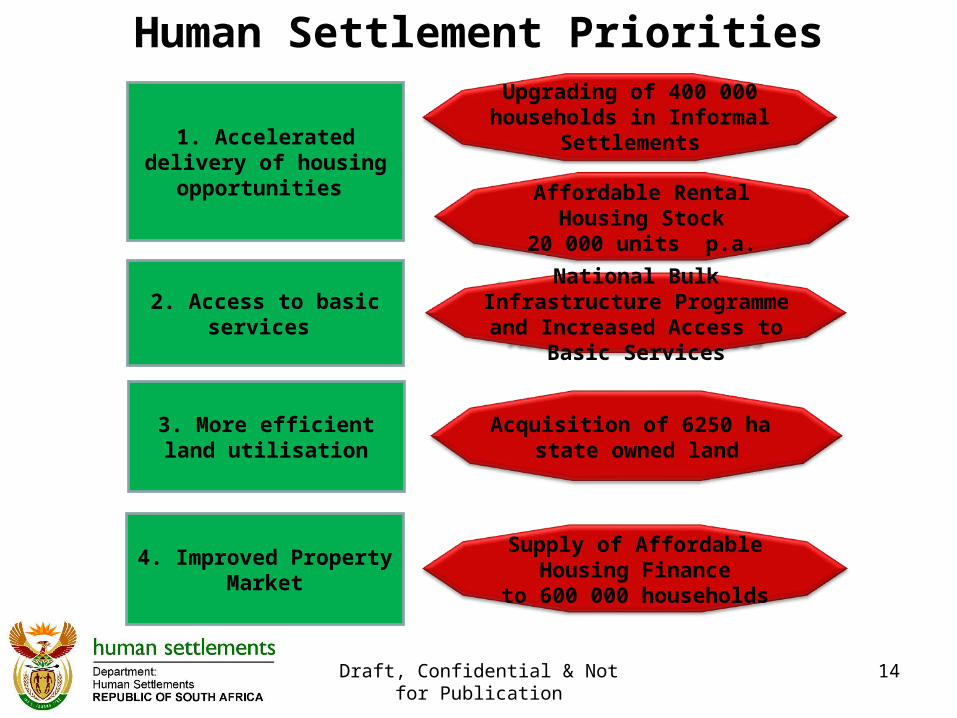
Human Settlement Priorities
1. Accelerated delivery of housing opportunities
2. Access to basic services
3. More efficient land utilisation
4. Improved Property Market
Upgrading of 400 000 households in Informal
Settlements
Affordable Rental Housing Stock
20 000 units p.a.
National Bulk Infrastructure Programme and Increased Access to Basic Services
Acquisition of 6250 ha state owned land
Supply of Affordable Housing Finance
to 600 000 households
14Draft, Confidential & Not for Publication

15
Performance Indicators and Performance Indicators and Targets Targets 2013/142013/14

Draft, Confidential & Not for Publication
16
Indicators Programme Outcome to
which it contributes
PastCurre
ntProjected
2009/10 2010/11 2011/12 2012/13 2013/14 2014/15 2015/16
Number of additional municipalities assessed for accreditation level 2 per year
Human Settlements Policy, Strategy and Planning
Outcome 8: Sustainable
human settlements
and improved quality of
household life
- 6 10 10 5 5 5
Total number of municipalities provided with technical assistance for informal settlement upgrading per year
Housing Development Finance
- 20 20 20 49 49 49
Number of additional residential units completed per year
Housing Development Finance
161,854 121,879 120,610 72,223 132,705 138,540 137,898
Number of additional sites serviced per year (green fields)
Housing Development Finance
64,362 63,546 58,587 26,308 77,248 81,883 85,568
Key Performance Indicators
Draft, Confidential & Not for Publication
17
Indicators Programme Outcome to
which it contributes
PastCurren
tProjected
2009/10 2010/112011/1
22012/1
32013/1
42014/1
52015/16
Number of additional households upgraded in well-located informal settlements with access to secure tenure and basic services per year (Brownfields)
Housing Development Finance
- 52,383 66,639 22,460 62,752 66,517 69,510
Number of additional hectares of land prepared for human settlements development per year
Housing Development Finance
Outcome 8: Sustainable
human settlements
and improved quality of
household life
- 4,945 2,000 2,000 2,000 2,000 2,000
Number of additional loans granted in the affordable housing segment per year
Housing Development Finance
- 47,616 69,576 69,970 63,798 62,344 67,527
Number of additional households provided with on-site sanitation in rural areas per year
Rural Household Infrastructure Programme
- 11,652 19,225 5,818 11,858 12,296 12,588
Key Performance Indicators
Financial InformationFinancial Information
18

2013 MTEF Allocation2013 MTEF Allocation
19
Rand thousand
Medium term estimates
2013/14 2014/15 2015/16
Administration 422,399 426,948 445,106
Human Settlements Policy, Strategy and Planning
84,055 89,301 92,967
Programme Delivery Support 226,922 239,335 251,305
Housing Development Finance 27,377,087 29,450,583 31,957,214
Human Settlements Development Grant
16,983,872
17,918,321
19,667,204
Urban Settlements Development Grant
9,076,906
10,334,684
10,699,773 Rural Households Infrastructure Development
106,721 113,124 118,328
Departmental Public Entities
1,133,751
1,002,070
1,388,035
Total 28,110,463 30,206,167 32,746,592


Rand thousand
Medium term estimates
2013/14 2014/15 2015/16
Housing Development Agency 97,497 101,047 104,615
National Urban Reconstruction and Housing Agency
100,000 - -
Social Housing Regulatory Authority: Operational
32,151 33,480 34,560
Social Housing Regulatory Authority: Capital restructuring grant
904,103 867,543
1,248,860
Total 1,133,751 1,002,070 1,388,035
Transfer payments to Public Transfer payments to Public EntitiesEntities
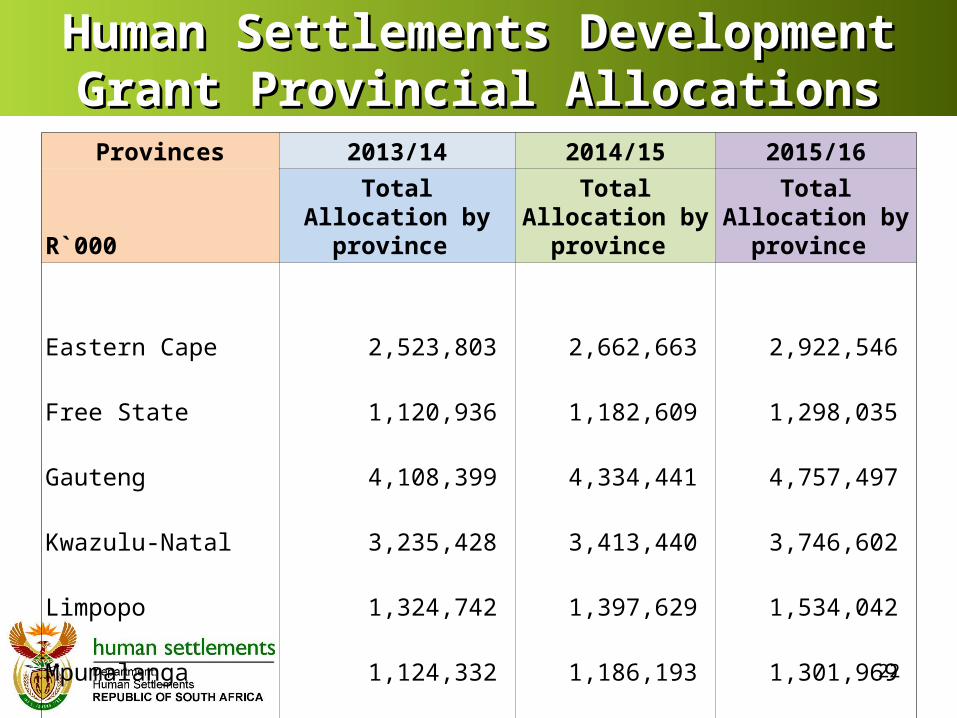
Human Settlements Development Grant Human Settlements Development Grant Provincial AllocationsProvincial Allocations
22
Provinces 2013/14 2014/15 2015/16
R`000
Total Allocation by province
Total Allocation by province
Total Allocation by province
Eastern Cape 2,523,803 2,662,663 2,922,546
Free State 1,120,936 1,182,609 1,298,035
Gauteng 4,108,399 4,334,441 4,757,497
Kwazulu-Natal 3,235,428 3,413,440 3,746,602
Limpopo 1,324,742 1,397,629 1,534,042
Mpumalanga 1,124,332 1,186,193 1,301,969
Northern Cape 395,724 417,497 458,247
North West 1,224,537 1,291,911 1,418,005
Western Cape 1,925,971 2,031,938 2,230,261
Total 16,983,872 17,918,321 19,667,204
Human Settlements Development GrantHuman Settlements Development Grant
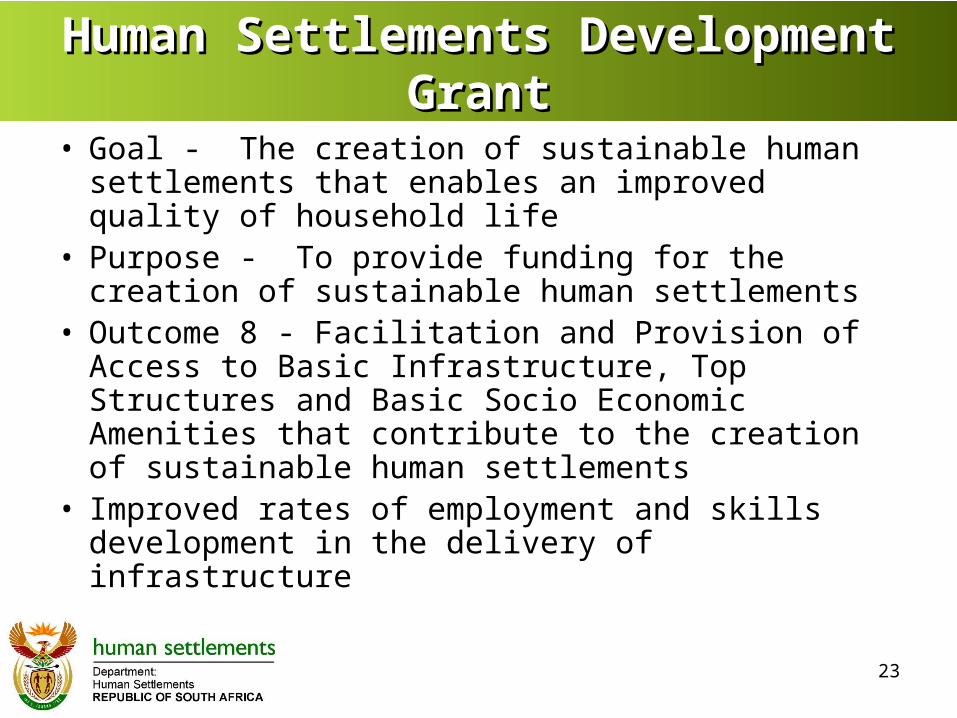
• Goal - The creation of sustainable human settlements that enables an improved quality of household life
• Purpose - To provide funding for the creation of sustainable human settlements
• Outcome 8 - Facilitation and Provision of Access to Basic Infrastructure, Top Structures and Basic Socio Economic Amenities that contribute to the creation of sustainable human settlements
• Improved rates of employment and skills development in the delivery of infrastructure
23

National Priority Programme AllocationsNational Priority Programme Allocations
24
Province Town 2013/14 2014/15 2015/16
Eastern Cape Duncan Village 109,767 117,881 129,386 Gauteng Lufhereng 182,944 196,468 215,644 Diepsloot 91,472 98,234 107,822 Sweetwaters 45,736 49,117 53,911 Khutsong 96,046 103,146 113,213 Sub Total 416,198 446,965 490,590 Kwazulu-natal Cornubia 120,743 129,669 142,325 Limpopo Lephalale 291,651 313,211 343,781 Western Cape Drommedaris 62,736 67,374 73,950
Total 1,001,095 1,075,099 1,180,032

20% Allocation to Specific Outcome Targets20% Allocation to Specific Outcome Targets
25
2013/14
Province Upgrading of Informal Settlements
Rental and Social Housing
Land acquisition
National Priority Programme
EASTERN CAPE 145,778 170,074 24,296 109,767
FREE STATE 62,861 73,338 10,477 -
GAUTENG 246,500 287,584 41,083 416,198
KWAZULU-NATAL 191,022 222,860 31,837 120,743
LIMPOPO 77,345 90,235 12,891 291,651
MPUMALANGA 67,424 78,661 11,237 -
NORTHERN CAPE 22,712 26,497 3,785 -
NORTH WEST 71,894 83,876 11,982 -
WESTERN CAPE 115,558 134,818 19,260 62,736 Total 1,001,095 1,167,944 166,849 1,001,095

HSDG Allocations to Metropolitan HSDG Allocations to Metropolitan CouncilsCouncils
26
Provinces Metropolitan 2013/14 2014/15 2015/16
Eastern Cape Nelson Mandela 206,900 220,800 242,351
Gauteng Ekurhuleni 933,800 996,600 1,093,871
Jo'burg 1,314,000 1,403,000 1,539,937
Tshwane 788,600 841,700 923,852
Sub Total 3,036,400 3,241,300 3,557,661
Kwazulu-Natal eThekwini 878,400 937,600 1,029,113
Western Cape Cape Town 733,484 782,870 859,280
Grant Total 4,855,184 5,182,570 5,688,405
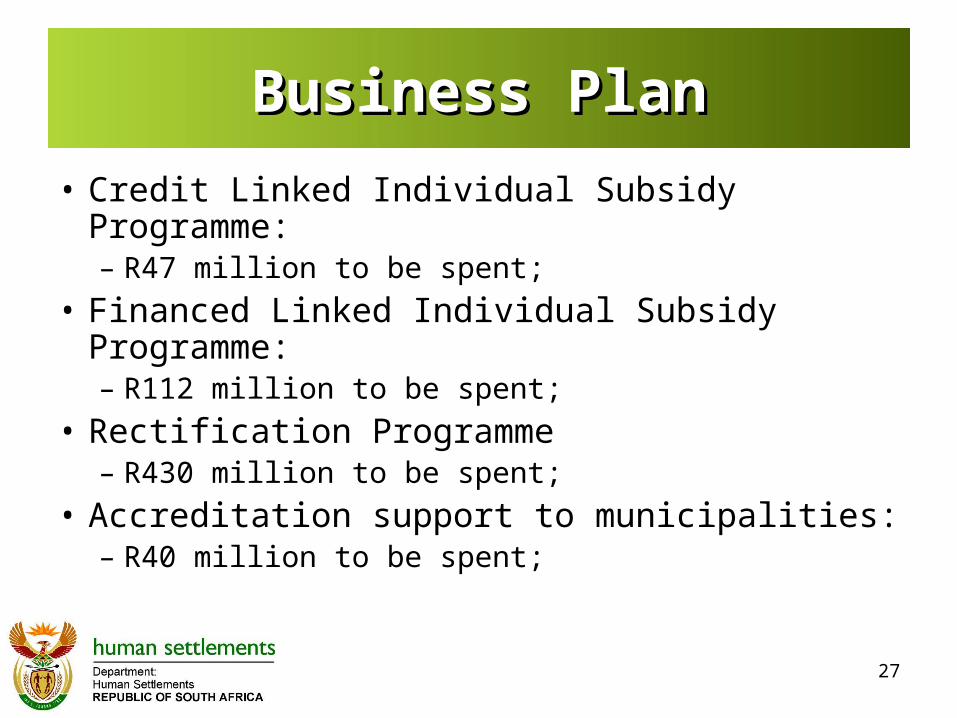
Business PlanBusiness Plan
• Credit Linked Individual Subsidy Programme:– R47 million to be spent;
• Financed Linked Individual Subsidy Programme:– R112 million to be spent;
• Rectification Programme– R430 million to be spent;
• Accreditation support to municipalities:– R40 million to be spent;
27

Business PlanBusiness Plan
• Blocked projects:– R184 million to be spent;
• Land Parcels;– R278 million to be spent;
• Rental and Social Housing:– R1.1 billion to be spent;
28

Business PlanBusiness Plan
• Incremental Housing Programmes:– R7.6 billion to be spent;
• Rural Housing Programme: – R811 million to be spent.
29

Current Challenges Current Challenges
• Lack of bulk and link infrastructure and related funding to implement projects;
• Delays in the planning of supply chain management;
• Lack of technical capacity at provinces and municipalities;
• Poor in the alignment, cooperation and coordination of strategic objectives and programmes of Provinces, Municipalities and Entities
• Inadequate medium and long term pipeline planning for programmes and projects;
• Deficiencies in data management and integrity.
30

InterventionsInterventions• Provinces and Municipalities to align all grants to
ensure bulk infrastructure is in place before implementation of programmes and projects;
• Provinces and Municipalities must develop and align programme and procurement plans
• Feasibilties to ensure programme and project readiness.
• Programme Management Units to be established and prioritised.
• Provinces to utilise the HSS to administer and report on all human settlements delivery programme and processes.
31

Measures Undertaken by DHS Measures Undertaken by DHS Provincial Business plans for 2013/14 have
been received and analysed by the DHS.
The 2013/14 Allocation letters sent to Provinces to allow for programme and project planning
From 28 February to 1 March – 3rd Quarter Mid Term reviews were conducted with Provinces and Council on Performance, Spending and Planning for 2013/14
DHS commented on 2013 DoRA Bill including Grant Frameworks.
32

Urban Settlements Development Urban Settlements Development GrantGrant
Grant Purpose:Grant Purpose:
– To improve the efficiency and coordination of To improve the efficiency and coordination of investments in the built environment through:investments in the built environment through:
– Providing large municipalities with appropriate Providing large municipalities with appropriate resources and control over the selection and pursuit resources and control over the selection and pursuit of investment programmes in the built environment;of investment programmes in the built environment;
– USDG is an instrument for Metropolitan Council to address linkages between public housing and economic growth to simultaneously and contribute to Human Settlements Outcomes
33
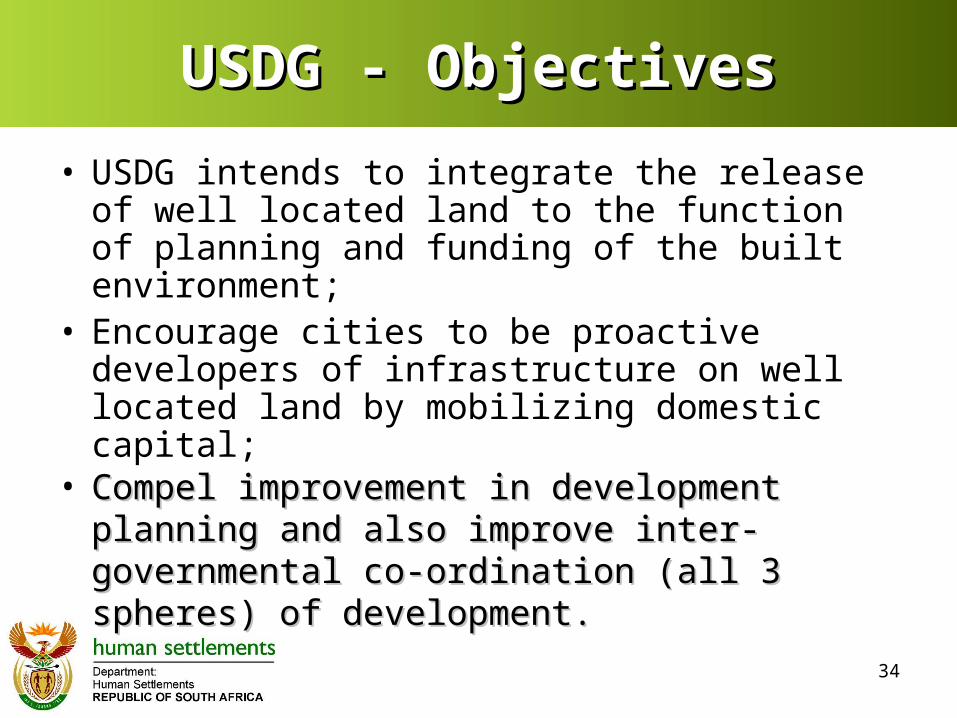
USDG - ObjectivesUSDG - Objectives
• USDG intends to integrate the release of well located land to the function of planning and funding of the built environment;
• Encourage cities to be proactive developers of infrastructure on well located land by mobilizing domestic capital;
• Compel improvement in development planning Compel improvement in development planning and also improve inter-governmental co-and also improve inter-governmental co-ordination (all 3 spheres) of development.ordination (all 3 spheres) of development.
34
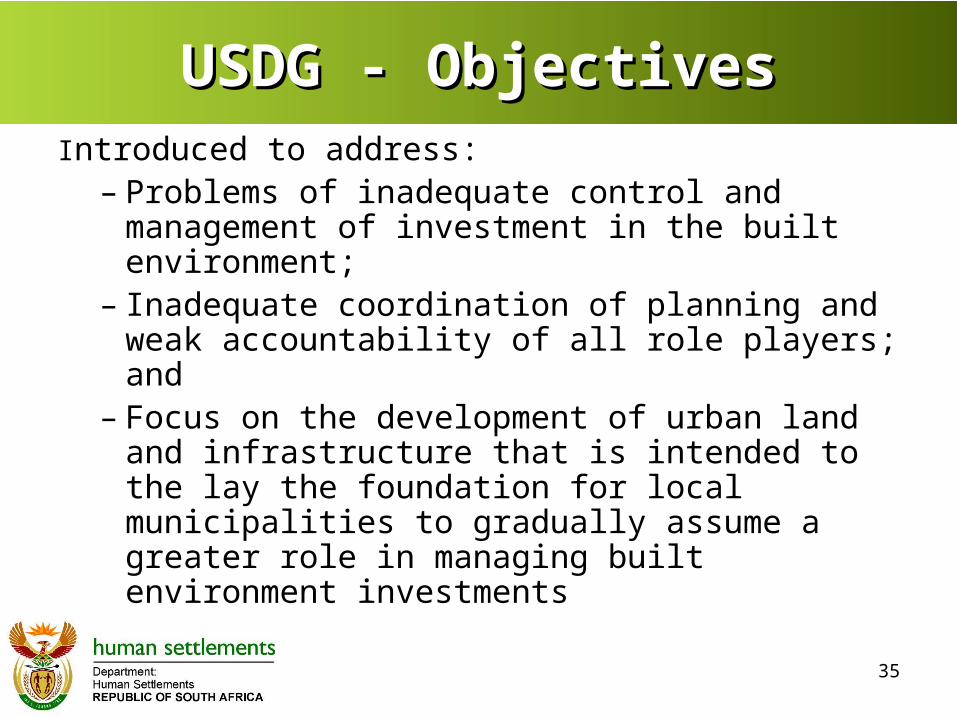
USDG - ObjectivesUSDG - ObjectivesIntroduced to address:
– Problems of inadequate control and management of investment in the built environment;
– Inadequate coordination of planning and weak accountability of all role players; and
– Focus on the development of urban land and infrastructure that is intended to the lay the foundation for local municipalities to gradually assume a greater role in managing built environment investments
35
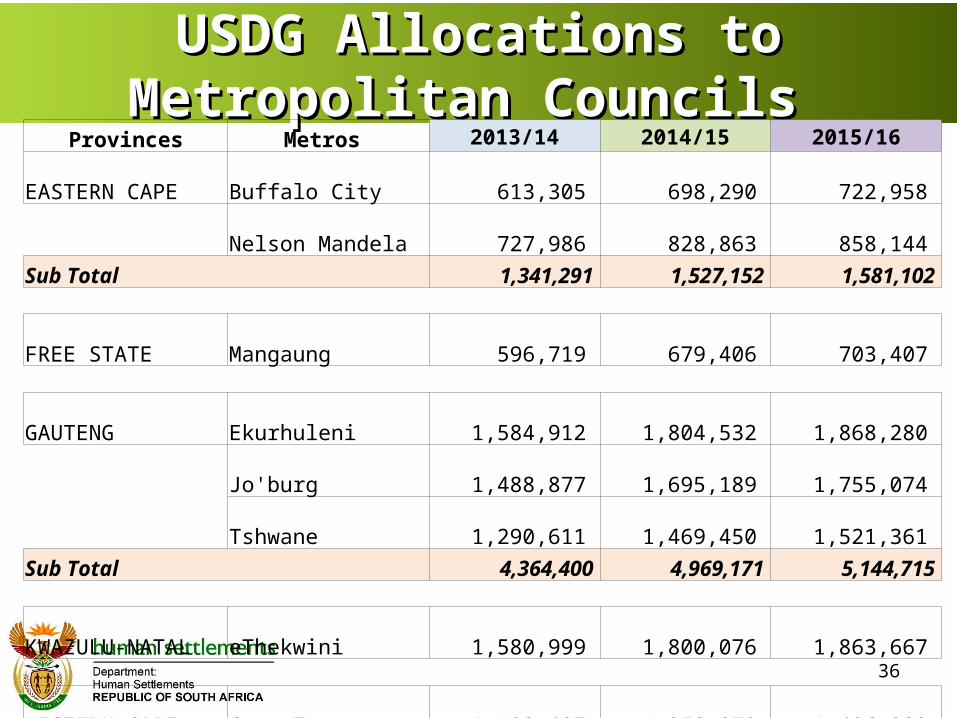
USDG Allocations to Metropolitan USDG Allocations to Metropolitan Councils Councils
36
Provinces Metros 2013/14 2014/15 2015/16
EASTERN CAPE Buffalo City 613,305 698,290 722,958
Nelson Mandela 727,986 828,863 858,144
Sub Total 1,341,291 1,527,152 1,581,102
FREE STATE Mangaung 596,719 679,406 703,407
GAUTENG Ekurhuleni 1,584,912 1,804,532 1,868,280
Jo'burg 1,488,877 1,695,189 1,755,074
Tshwane 1,290,611 1,469,450 1,521,361
Sub Total 4,364,400 4,969,171 5,144,715
KWAZULU-NATAL eThekwini 1,580,999 1,800,076 1,863,667
WESTERN CAPE Cape Town 1,193,497 1,358,879 1,406,883
Grant Total 9,076,906 10,334,684 10,699,773
Challenges Challenges Lack of Coordination and alignment
experienced within Metros that causes poor service delivery coordination for USDG;
Lack of capacity to carry out programme plans;
Critical vacancies and consistency of personnel managing the USDG;
Land acquisition challenges and limited land in close proximity to the city centre;
37
Challenges Challenges
Multi-year projects are budgeted for in one financial year due to inadequate planning of projects;
Lengthy procurement processes; Legal challenges - Tenders being
contested in court for major projects; Management and governance of informal
settlements;
38
InterventionsInterventions
• Improving the alignment and coordination in implementation of the USDG;
• Capacity constraints to be addressed through the Cities Support Programme established by National Treasury;
• Metropolitan Municipalities encouraged to appoint officials on a full time;
• Land acquisition management to be improved with the assistance of the Housing Development Agency;
39

InterventionsInterventions
• Conducting of project readiness and attached list of projects as addendum to Performance Matrix;
• Councils to develop a programme plans aligned to procurement plans
• National and Provincial support for land acquisition, informal settlement upgrading and policy formulation to support council implementation
40

Support Processes In Place Support Processes In Place • The Department has developed and presented a
turnaround strategy to improve spending for the Councils’ and presented to Technical MinMec, Portfolio Committee on Human Settlements etc.
• Performance Matrix developed that addresses human settlements related issues
• Consulted with National Treasury to incorporate the matrix in the Service Delivery Business and Implementation Plan (SDBIP) reporting template so as to have one single reporting template
• Support to be provided through the National City Support Programme (CSP) to the Metros with capacity constraints.
41

Support Processes In PlaceSupport Processes In Place• The Department has the following systems in
place for monitoring the implementation of the USDG:– Quarterly oversight visits are planned with all
Councils to monitor progress and to address challenges.
– Quarterly reviews are conducted with Metros.– Monthly Expenditure Analysis and Quarterly
feedback to individual metros.– Regular reviews and programme and policy
support with Sector Department to Councils – City Budget Forum, Outcome 9, NUSP and Accreditation .
42
43
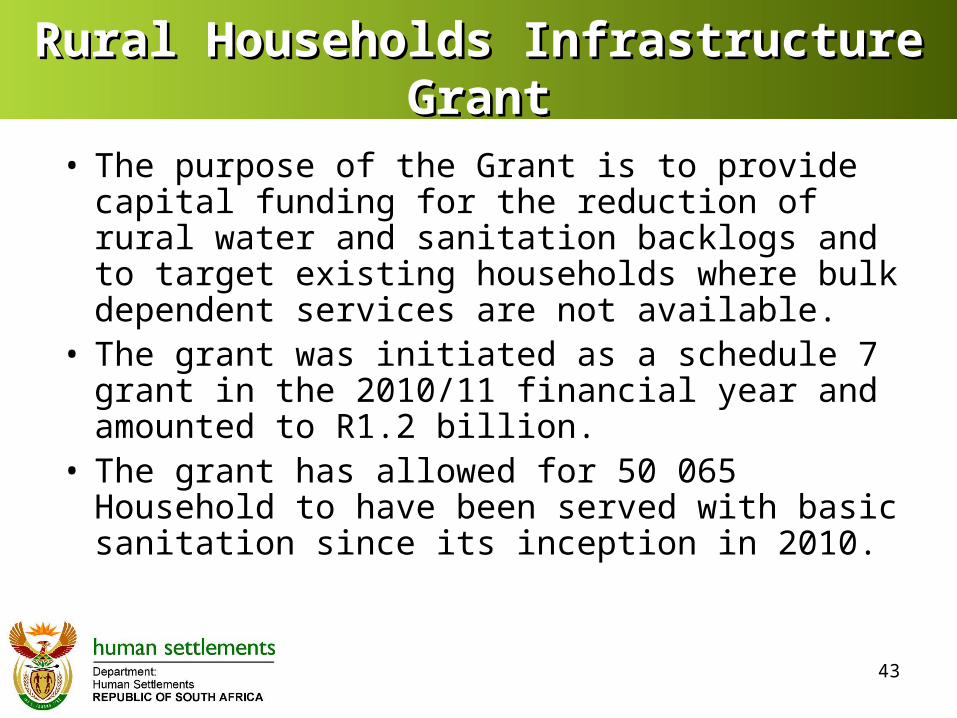
Rural Households Infrastructure GrantRural Households Infrastructure Grant
• The purpose of the Grant is to provide capital funding for the reduction of rural water and sanitation backlogs and to target existing households where bulk dependent services are not available.
• The grant was initiated as a schedule 7 grant in the 2010/11 financial year and amounted to R1.2 billion.
• The grant has allowed for 50 065 Household to have been served with basic sanitation since its inception in 2010.
Rural Households Rural Households Infrastructure GrantInfrastructure Grant
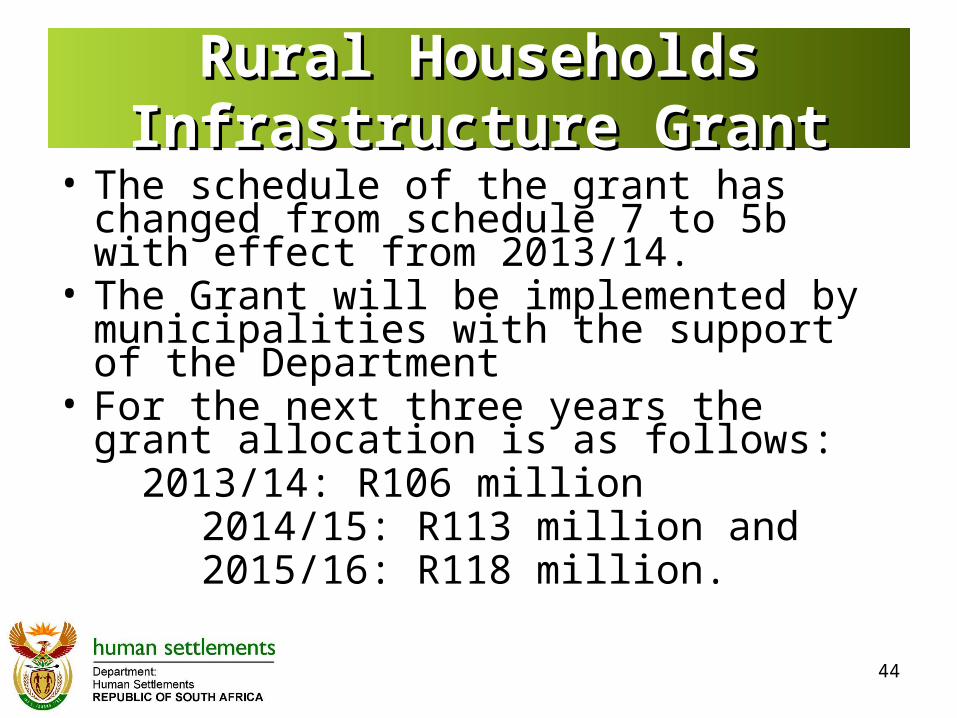
• The schedule of the grant has changed from schedule 7 to 5b with effect from 2013/14.
• The Grant will be implemented by municipalities with the support of the Department
• For the next three years the grant allocation is as follows: 2013/14: R106 million
2014/15: R113 million and 2015/16: R118 million.
44
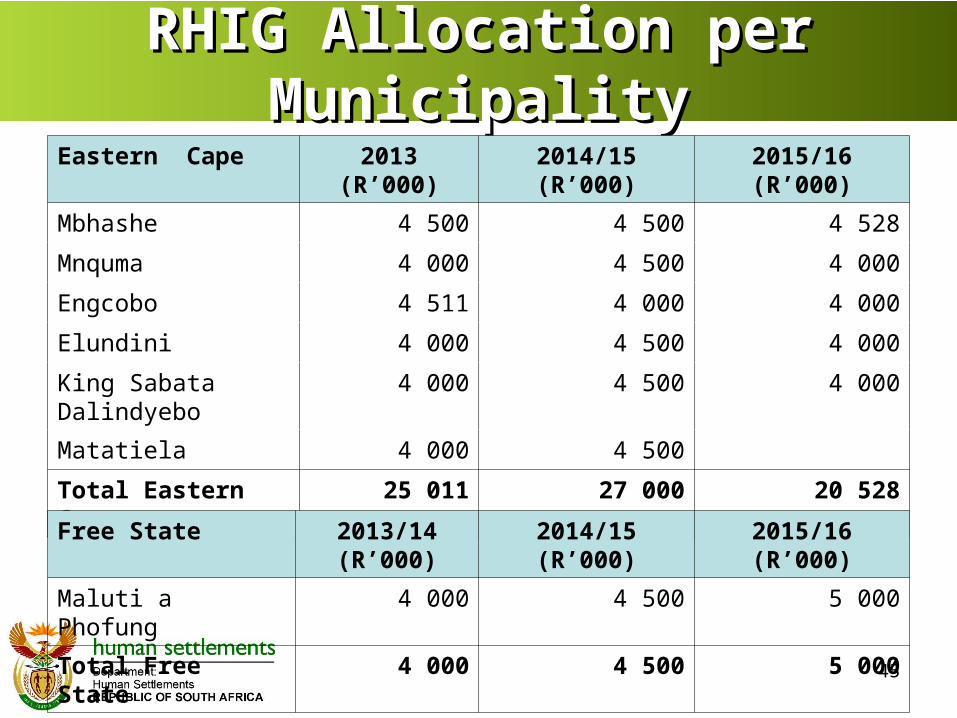
RHIG Allocation per MunicipalityRHIG Allocation per MunicipalityEastern Cape 2013 (R’000) 2014/15 (R’000) 2015/16 (R’000)
Mbhashe 4 500 4 500 4 528
Mnquma 4 000 4 500 4 000
Engcobo 4 511 4 000 4 000
Elundini 4 000 4 500 4 000
King Sabata Dalindyebo
4 000 4 500 4 000
Matatiela 4 000 4 500
Total Eastern Cape 25 011 27 000 20 528
45
Free State 2013/14 (R’000)
2014/15 (R’000) 2015/16 (R’000)
Maluti a Phofung 4 000 4 500 5 000
Total Free State 4 000 4 500 5 000

RHIG Allocation per MunicipalityRHIG Allocation per MunicipalityKWAZULU-NATAL 2013/14
(R’000)2014/15 (R’000) 2015/16 (R’000)
Umzumbe 4 000 4 500 5 000
Umnambithi/ Ladysmith 4 000 4 124 5 000
Umvoti 4 000 4 000 5 000
Dannhouser 4 000 4 500 4 000
Nongoma 4 500 4 000 5 000
Jozini 4 000 4 000 5 000
Umhlathuze 4 000 5 000 5 000
Umlalazi 4 000 4 000 5 000
Ndwedwe 4 000 4 000 5 000
Umzimkhulu 4 000 4 500 5 000
Total KwaZulu- Natal 40 500 42 624 49 000
46
RHIG Allocation per Municipality RHIG Allocation per Municipality ..
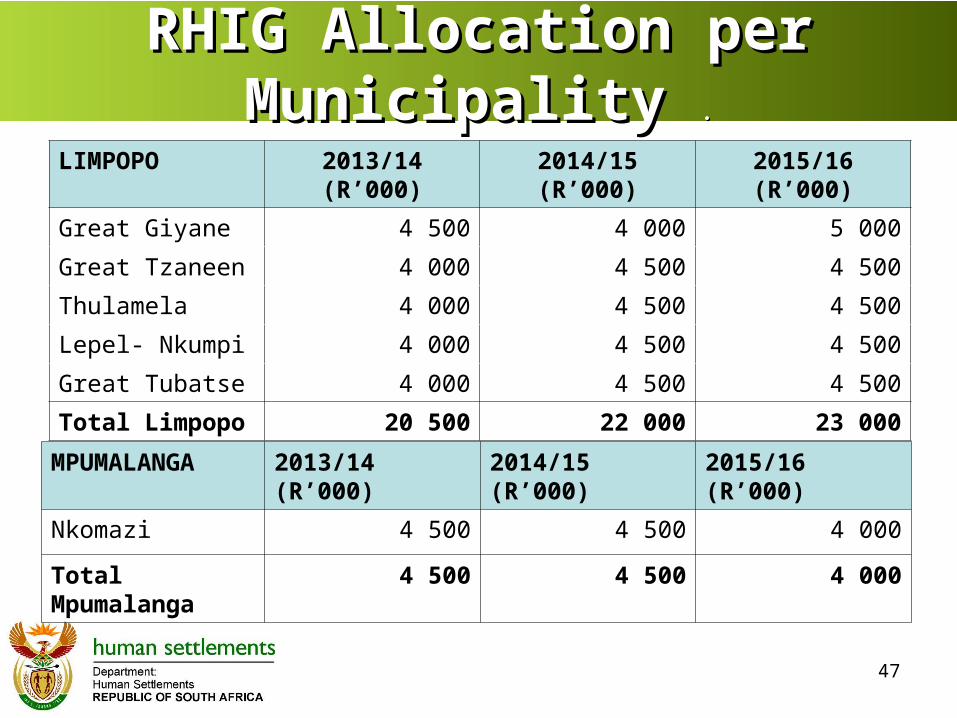
LIMPOPO 2013/14 (R’000) 2014/15 (R’000) 2015/16 (R’000)
Great Giyane 4 500 4 000 5 000
Great Tzaneen 4 000 4 500 4 500
Thulamela 4 000 4 500 4 500
Lepel- Nkumpi 4 000 4 500 4 500
Great Tubatse 4 000 4 500 4 500
Total Limpopo 20 500 22 000 23 000
47
MPUMALANGA 2013/14 (R’000) 2014/15 (R’000) 2015/16 (R’000)
Nkomazi 4 500 4 500 4 000
Total Mpumalanga
4 500 4 500 4 000
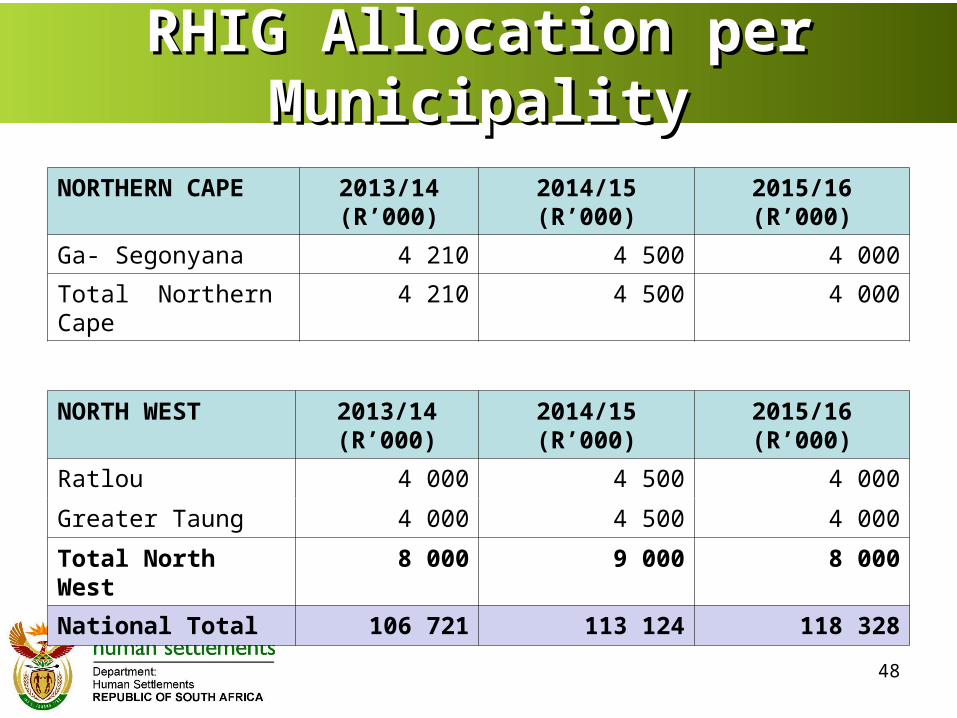
RHIG Allocation per MunicipalityRHIG Allocation per Municipality
NORTHERN CAPE 2013/14 (R’000)
2014/15 (R’000) 2015/16 (R’000)
Ga- Segonyana 4 210 4 500 4 000
Total Northern Cape 4 210 4 500 4 000
48
NORTH WEST 2013/14 (R’000)
2014/15 (R’000) 2015/16 (R’000)
Ratlou 4 000 4 500 4 000
Greater Taung 4 000 4 500 4 000
Total North West 8 000 9 000 8 000
National Total 106 721 113 124 118 328

Departmental Support To Departmental Support To MunicipalitiesMunicipalities
The Department will support municipalities in the following manner:
• approve the business plans submitted by municipalities;• Continuously monitor implementation and provide support
to municipalities;• Submit monthly financial and quarterly non- financial
reports to National Treasury;• Submit an annual evaluation report after the end of the
financial year; and• Prepare a payment schedule for the transfer of the grant
to municipalities.
49

Departmental Support To Departmental Support To MunicipalitiesMunicipalities
• The Department is in the process of filling vacant posts at regional offices in order to provide support.
• Monitoring and reporting processes and schedules are being developed to report on financial and non-financial progress
50
51
Thank youThank you
Related Documents