PB92147453 \1 I 1111 1\ 111111 I \II \ 1\111 11111\ NOAA Technical Memorandum NMFS-F/NEC-79 Contaminants in Sediment and Fish Tissue from Estuarine and Coastal Sites of the Northeastern United States: Data Summary for the Baseline Phase of the National Status and Trends Program Benthic Surveillance Project, 1984-1986 u.s. DEPARTMENT OF COMMERCE National Oceanic and Atmospheric Administration National Marine Fisheries Service Northeast Fisheries Center Woods Hole, Massachusetts December 1990 REPRODUCED BY u.S. DEPARTMENT OF COMMERCE NATIONAL TECHNICAL INFORMATION SERVICE SPRINGFIELD, VA 22161

Welcome message from author
This document is posted to help you gain knowledge. Please leave a comment to let me know what you think about it! Share it to your friends and learn new things together.
Transcript
PB92147453 \1 I 1111 1\ 111111 I \II \ 1\111 11111\
NOAA Technical Memorandum NMFS-F/NEC-79
Contaminants in
Sediment and Fish Tissue
from Estuarine and Coastal Sites
of the Northeastern United States:
Data Summary for the Baseline Phase of the
National Status and Trends Program
Benthic Surveillance Project, 1984-1986
u.s. DEPARTMENT OF COMMERCE National Oceanic and Atmospheric Administration
National Marine Fisheries Service Northeast Fisheries Center
Woods Hole, Massachusetts
December 1990
REPRODUCED BY u.S. DEPARTMENT OF COMMERCE
NATIONAL TECHNICAL INFORMATION SERVICE SPRINGFIELD, VA 22161

Recent issues in this series
48. Indexed Bibliography of the Bay Scallop (Argopecten irradians). By Barbara D. Sabo (Gibson) and Edwin W. Rhodes. May 1987. iii + 85p. NTIS Access. No. PB87-231411/AS.
49. Northeast Fisheries Center Framework for Inshore Research. By Research Planning & Coordination Staff, Northeast Fisheries Center. July 1987. vi + 44p., 2 figs., 2 tables. NTIS Access. No. PB87-232286/AS.
50. Status of the Fishery Resources Off the Northeastern United States for 1987. By Conservation & Utilization Division, Northeast Fisheries Center. October 1987. iii + 132 p., 48 figs., 50 tables. NTIS Access. No. PB88-148549.
51. An Annotated List of the FIshes of Massachusetts Bay. By BruceB. Collette and Karsten E. Hartel. February 1988. x + 70 p., 1 fig., 1 table. NTIS Access. No. PB88-179247/AS.
52. An Evaluation of the Bottom Trawl Survey Program of the Northeast Fisheries Center. By Survey Working Group, Northeast Fisheries Center. March 1988. ix + 83 p., 33 figs., 13 tables. NTIS Access No. PB88-201983/AS.
53. Contaminants in Hudson-Raritan Estuary Water and Influence of Cold Storage upon Its Chemical Composition. By Anthony Calabrese, Lawrence 1. Buckley, and 1. Christopher Powell. May 1988. vii + 37 p., 10 figs., 11 tables. NTIS Access. No. PB88-225628/AS.
54. Epizootic Ulcerative Syndromes in CoastalfEstuarine Fish. By Carl 1. Sindennann. June 1988. v + 37 p., 8 figs., 1 table. NTIS Access. No. PB89-110803/AS.
55. A Plan for Study: Response of the Habitat and Biota of the Inner New York Bight to Abatement of Sewage Sludge Dumping. By Envirorunental Processes Division, Northeast Fisheries Center. June 1988. iii + 34 p., 5 figs., 3 tables, 4 app. NTIS Access. No. PB89-100903/AS.
56. Characterization of the Middle AtlanticWater Management Unit of the Northeast Regional Action Plan. By Anthony L. Pacheco, ed. July 1988. v + 322 p., 136 figs., 21 tables. NTIS Access. No. PB89-145262/AS.
57. An Analysis and Evaluation of Ichthyoplankton Survey Data from the Northeast Continental Shelf Ecosystem. By Wallace G. Smith, ed. August 1988. xiii + 132 p., 53 figs., 12 tables, 1 app. NTIS Access. No. PB89-122501/AS.
58. An Indexed Bibliography of Northeast Fisheries Center Publications and Reports for 1987. By Jon A. Gibson. August 1988. iii + 20 p. NTIS Access. No. PB89-113013/AS.
59. SUll"Veys of Breeding Penguins and Other Seabirds in the South Shetland Islands, Antarctica, J anuaryFebruary 1987. ByW. David Shuford and Larry B. Spear. September 1988. vii + 27 p., 14 figs., 1 table. NTIS Access. No. PB89-141311/AS.
60. Survey of Antarctic Fur Seals in the South Shetland Islands, Antarctica, during the 1986-1987 Austral Summer. By John L. Bengtson, Lisa M. Fenn, Tero 1. Harkonen, Everett G. Schaner, and Brent S. Stewart. September 1988. vii + 8 p., 1 fig., 3 tables. NTIS Access. No. PB89-141303/AS.
61. Fish as Sentinels of Environmental Health. By Robert A. Murchelano. September 1988. iii + 16 p., 4 figs. NTIS Access. No. PB89-139737/AS.
62. The Effects of Density Dependent Population Mechanisms on Assessment Advice for the Northwest Atlantic Mackerel Stock. By W. 1. Overholtz, SA Murawski, W.L. Michaels, and L.M. Dery. October 1988. v + 49 p., 7 figs.,
!"_ 20 tables. NTIS Access. No. PB89-151948/AS.
63. Status of the Fishery Resources Off the Northeastern United States for 1988. By Conservation and Utilization Division. October 1988. iii + 135 p", 51 figs., 52 tables. NTIS Access. No. PB89-130819/AS.
(continued on inside back cover)

Page iii
TABLE OF CONTENTS
Executive Summary .................................................................................................................................................... ix Introduction .................................................................................................................................................................. 1 Methods ........................................................................................................................................................................ 1 Data Presentation ......................................................................................................................................................... 1 Acknowledgements ...................................................................................................................................................... 2 References Cited .......................................................................................................................................................... 2 Site Summary Figures .................................................................................................................................................. 6 Analyte Summary Figures .......................................................................................................................................... 44 Analytical Data Tables ............................................................................................................................................... 72
LIST OF FIGURES
Figure 1. Sites sampled in the northeastern United States during 1984-86 as part of the National Status and Trends Program's Benthic Surveillance Project ........................................................ X
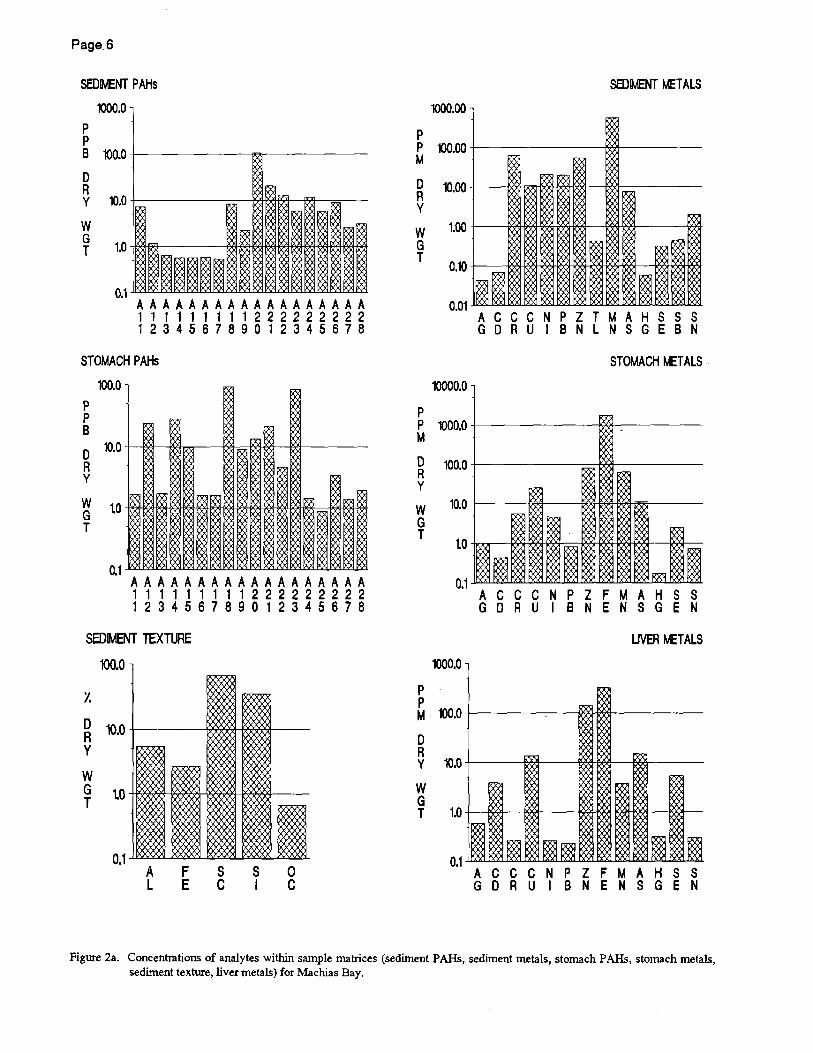
Figure 2a. Concentrations of analytes within sample matrices (sediment P AHs, sediment metals, stomach PAHs, stomach metals, sediment texture, liver metals) for Machias Bay ................................... 6
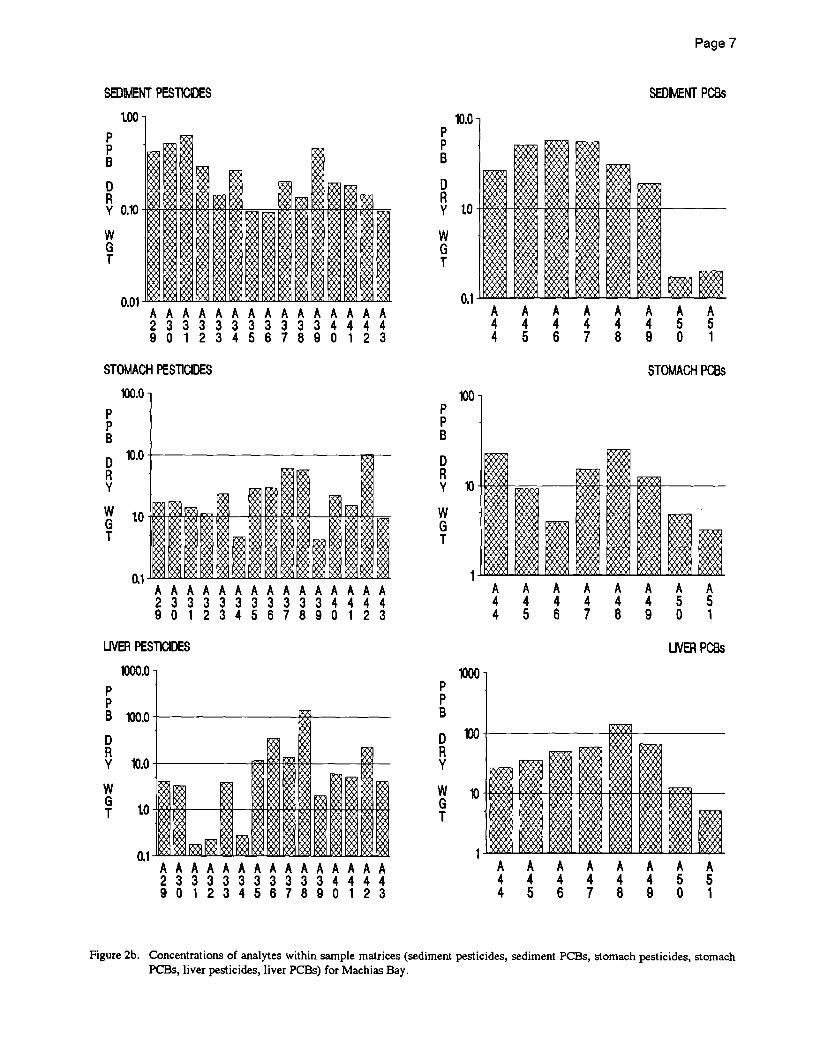
Figure 2b. Concentrations of analytes within sample matrices (sediment pesticides, sediment PCBs, stomach pesticides, stomach PCBs, liver pesticides, liver PCBs) for Machias Bay .................................. 7
Figure 3a. Concentrations of analytes within sample matrices (sediment P AHs, sediment metals, stomach PAHs, stomach metals, sediment texture, liver metals) for Frenclunans Bay ............................ 8
Figure 3b. Concentrations of analytes within sample matrices (sediment pesticides, sediment PCBs, stomach pesticides, stomach PCBs, liver pesticides, liver PCBs) for Frenclunans Bay ............................ 9
Figure 4a. Concentrations of analytes within sample matrices (sediment P AHs, sediment metals, stomach PARs, stomach metals, sediment texture, liver metals) for Penobscot Bay .............................. 10
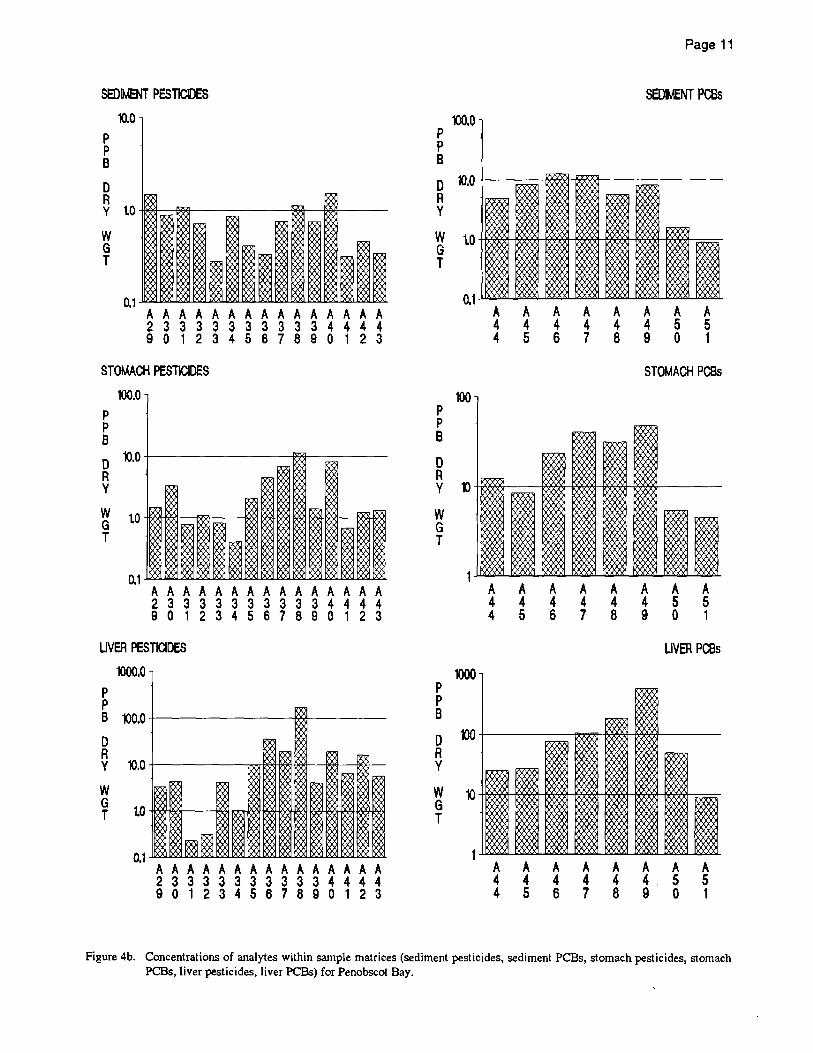
Figure 4b. Concentrations of analytes within sample matrices (sediment pesticides, sediment PCBs, stomach pesticides, stomach PCBs, liver pesticides, liver PCBs) for Penobscot Bay ............................. 11
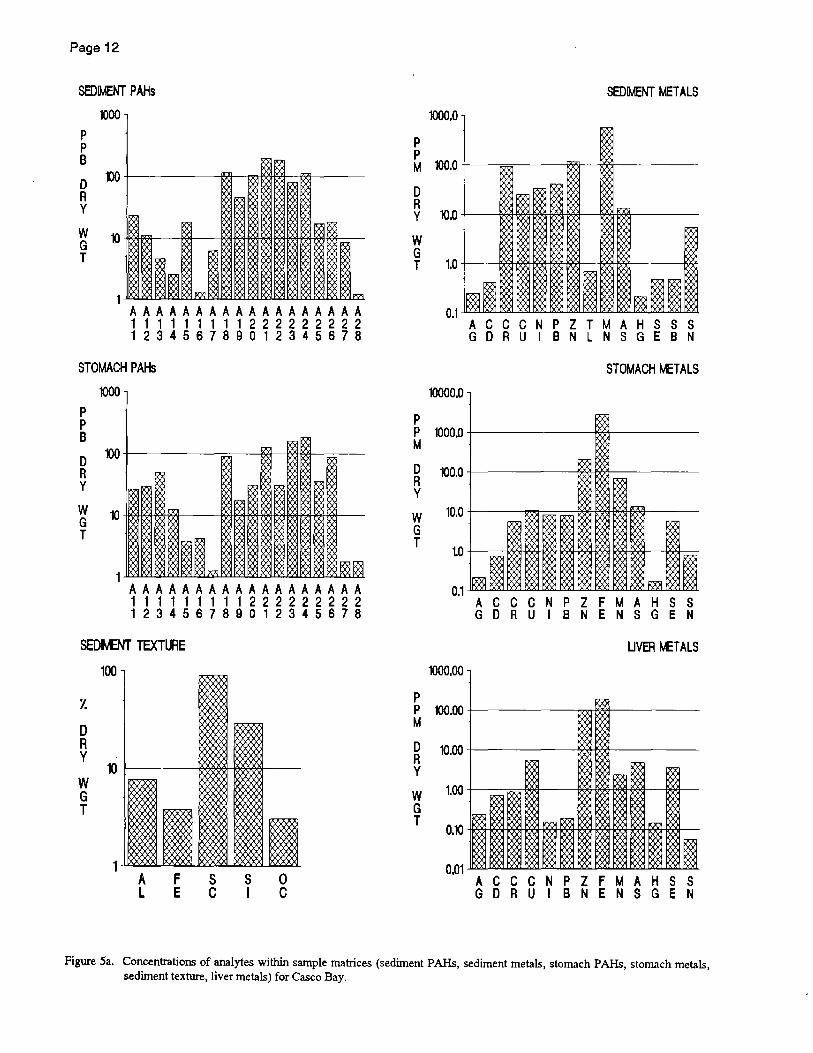
Figure 5a. Concentrations of analytes within sample matrices (sediment P AHs, sediment metals, stomach PAHs, stomach metals, sediment texture, liver metals) for Casco Bay ..................................... 12
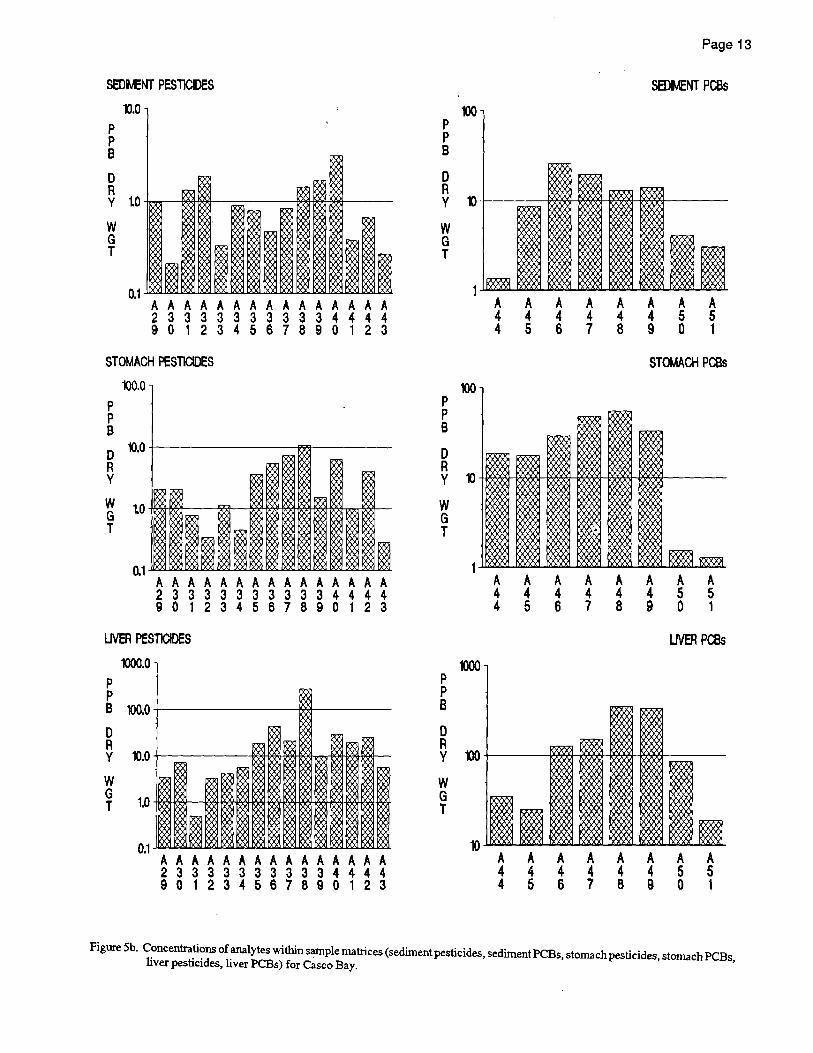
Figure 5b. Concentrations of analytes within sample matrices (sediment pesticides, sediment PCBs, stomach pesticides, stomach PCBs, liver pesticides, liver PCBs) for Casco Bay .................................... 13
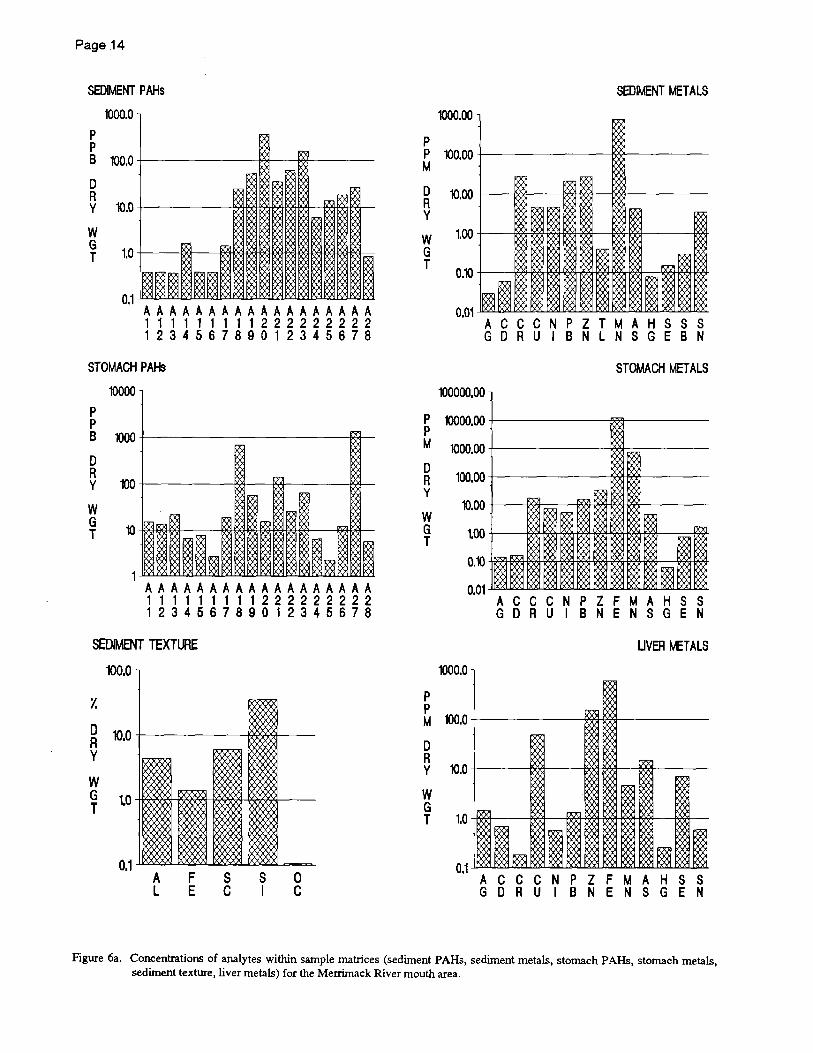
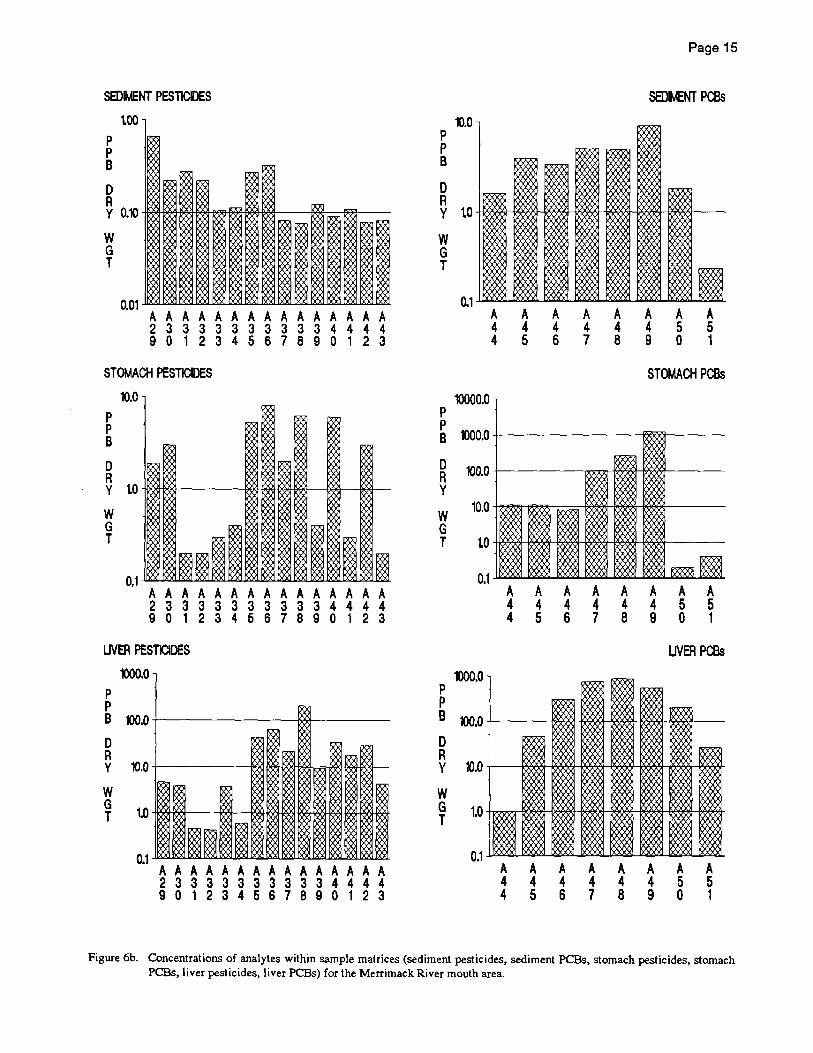
Figure 6a. Concentrations of analytes within sample matrices (sediment P AHs, sediment metals, stomach PARs, stomach metals, sediment texture, liver metals) for the Merrimack River mouth area ................................................................................................................... 14
Figure 6b. Concentrations of analytes within sample matrices (sediment pesticides, sediment PCBs, stomach pesticides, stomach PCBs,liver pesticides, liver PCBs) for the Merrimack River mouth area ........................................................................................................ 15
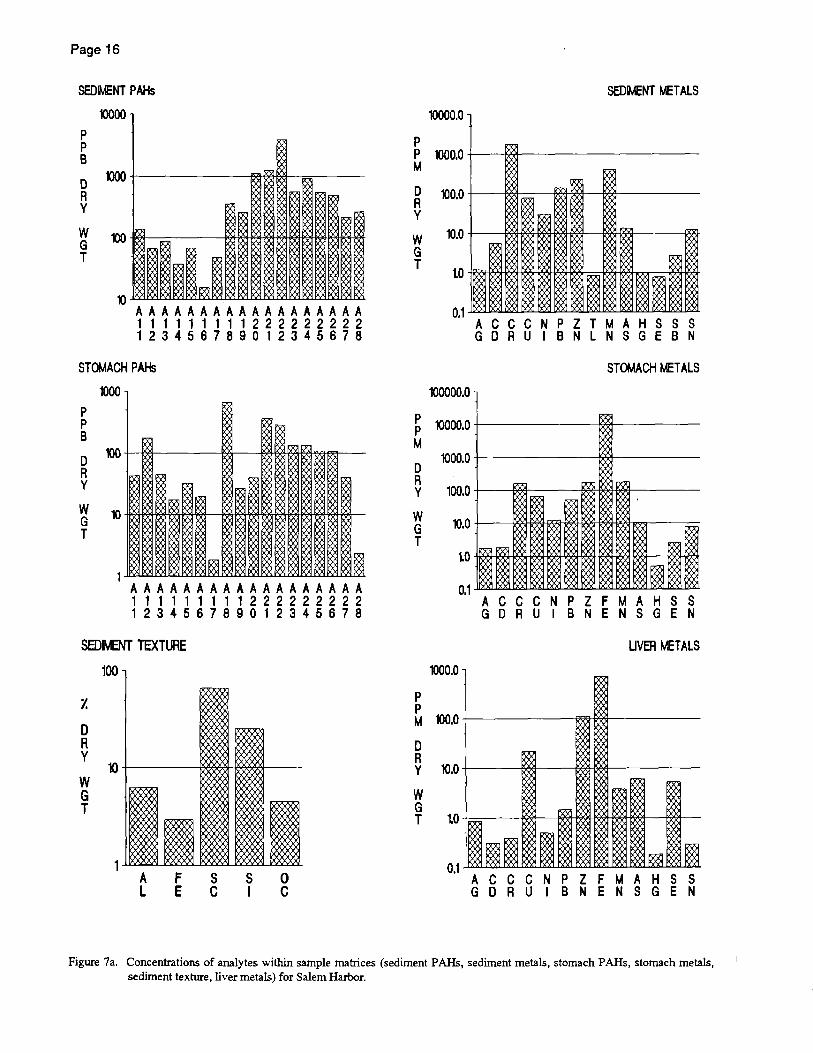
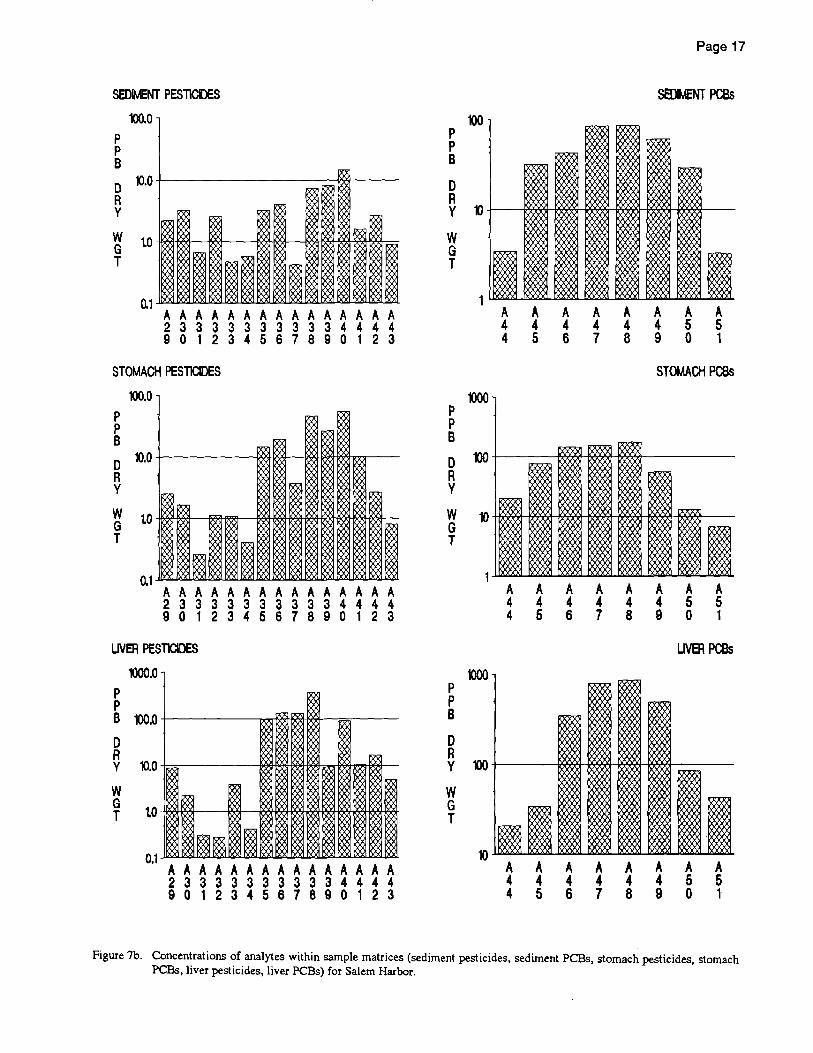
Figure 7a. Concentrations of analytes within sample matrices (sediment PARs, sediment metals, stomach PARs, stomach metals, sediment texture, liver metals) for Salem Harbor ................................ 16

Page iv
Figure 7b. Concentrations of analytes within sample matrices (sediment pesticides, sediment PCBs, stomach pesticides, stomach PCBs, liver pesticides, liver PCBs) for Salem Harbor ............................... 17
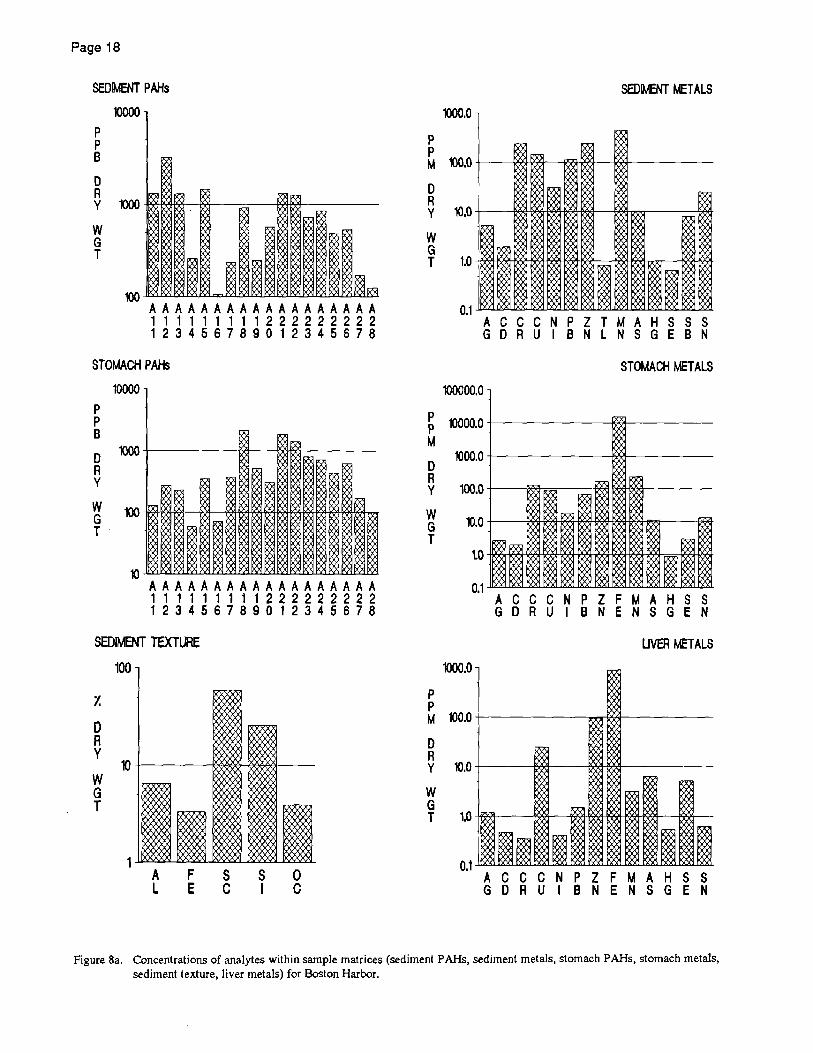
Figure 8a. Concentrations of analytes within sample matrices (sediment PAHs, sediment metals, stomach PARs, stomach metals, sediment texture, liver metals) for Boston Harbor ............................... 18
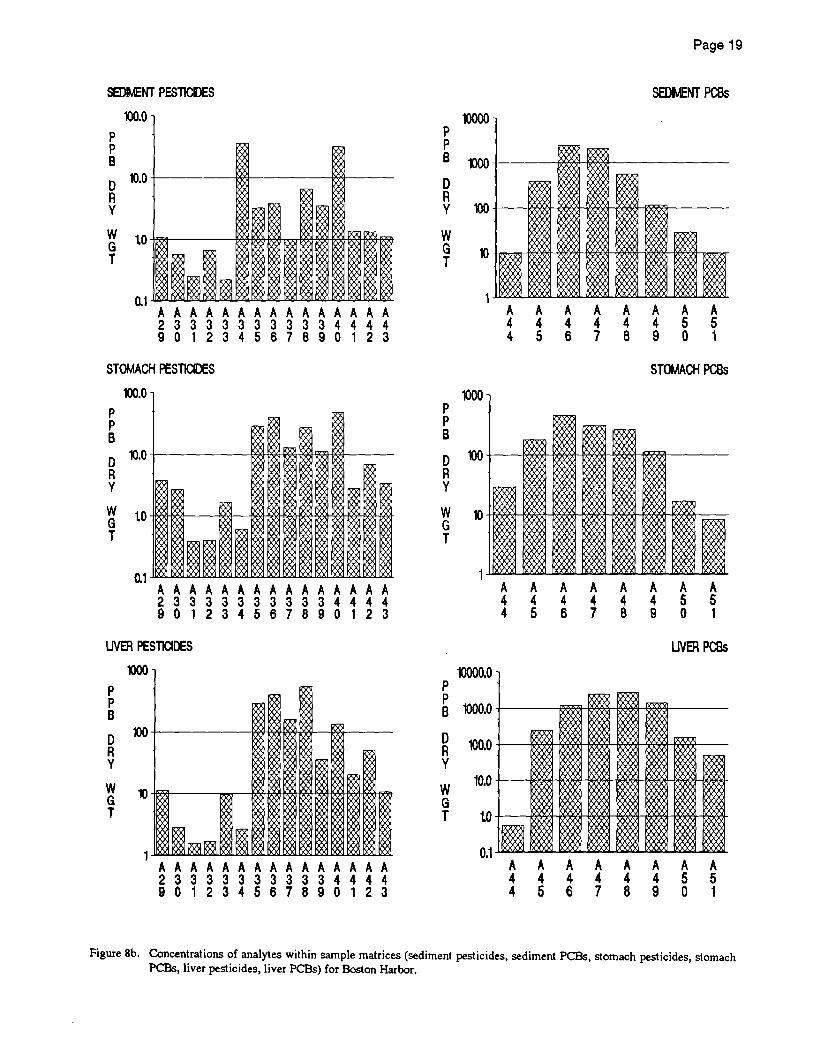
Figure 8b. Concentrations of analytes within sample matrices (sediment pesticides, sediment PCBs, stomach pesticides, stomach PCBs, liver pesticides, liver PCBs) for Boston Harbor ............................. 19
Figure 9a. Concentrations of analytes within sample matrices (sediment PARs, sediment metals, stomach PAHs, sediment texture, liver metals) for Quincy Bay .............................................................. 20
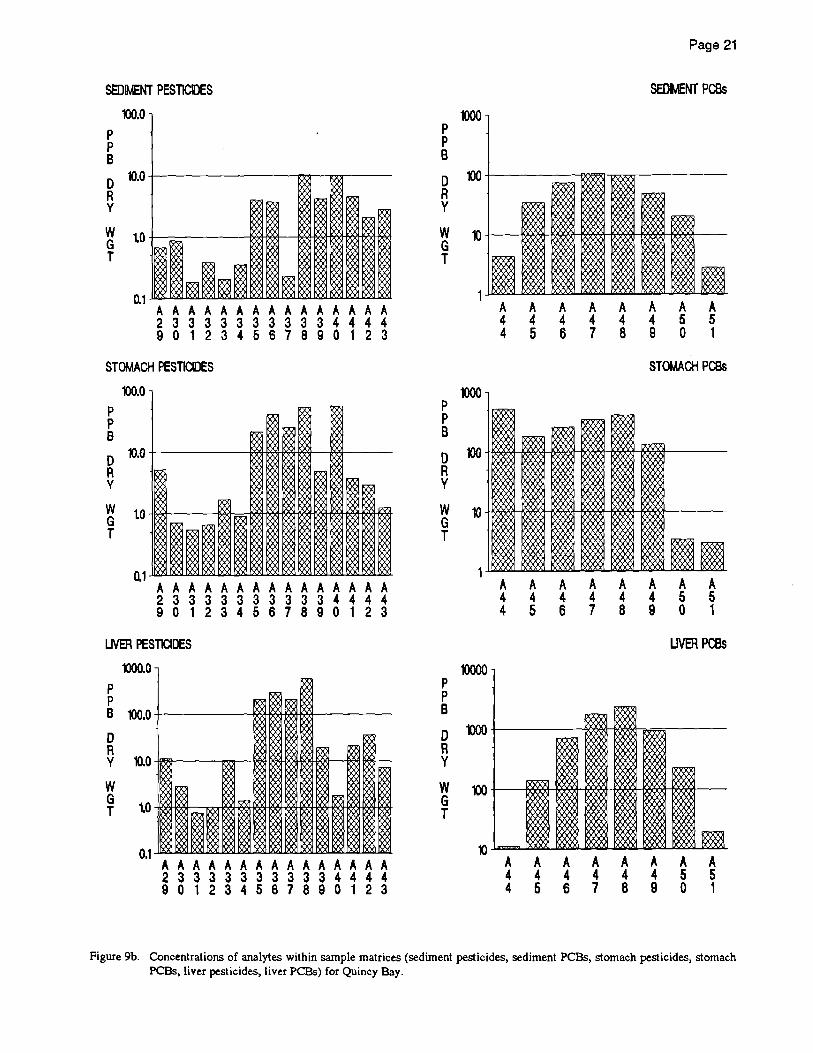
Figure 9b. Concentrations of analytes within sample matrices (sediment pesticides, sediment PCBs, stomach pesticides, stomach PCBs, liver pesticides, liver PCBs) for Quincy Bay .................................. 21
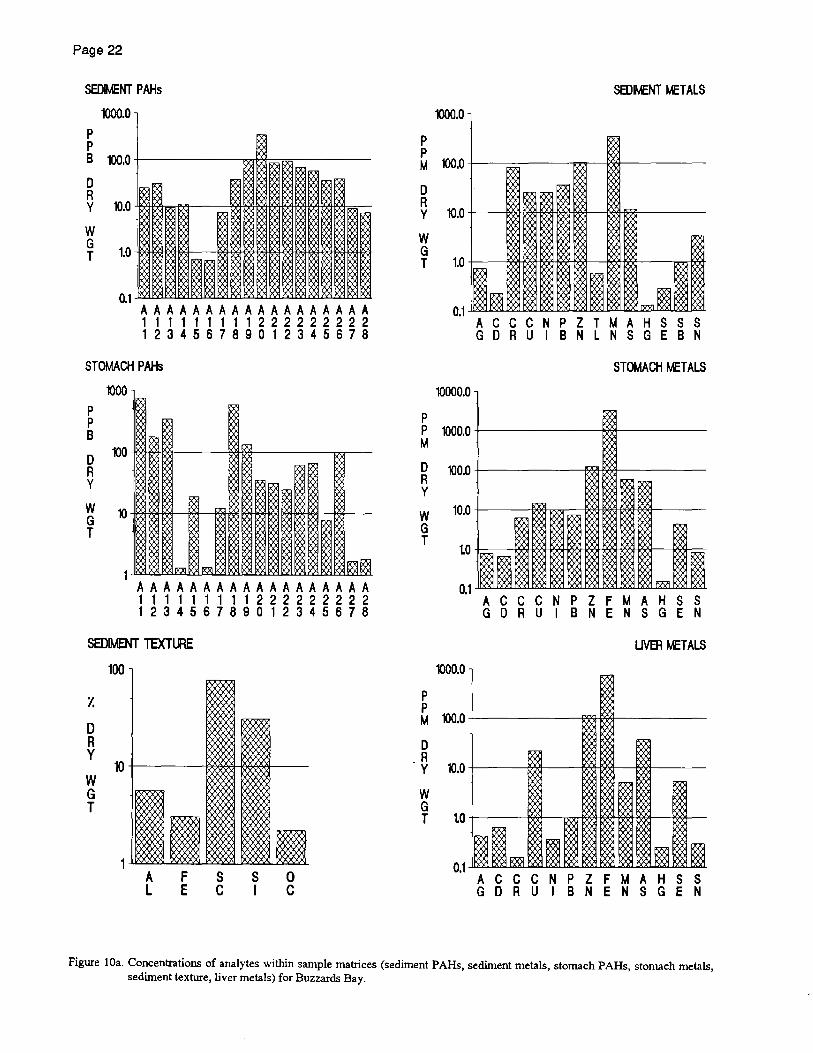
Figure lOa. Concentrations of analytes within sample matrices (sediment PAHs, sediment metals, stomach PAHs, stomach metals, sediment texture, liver metals) for Buzzards Bay .............................. 22
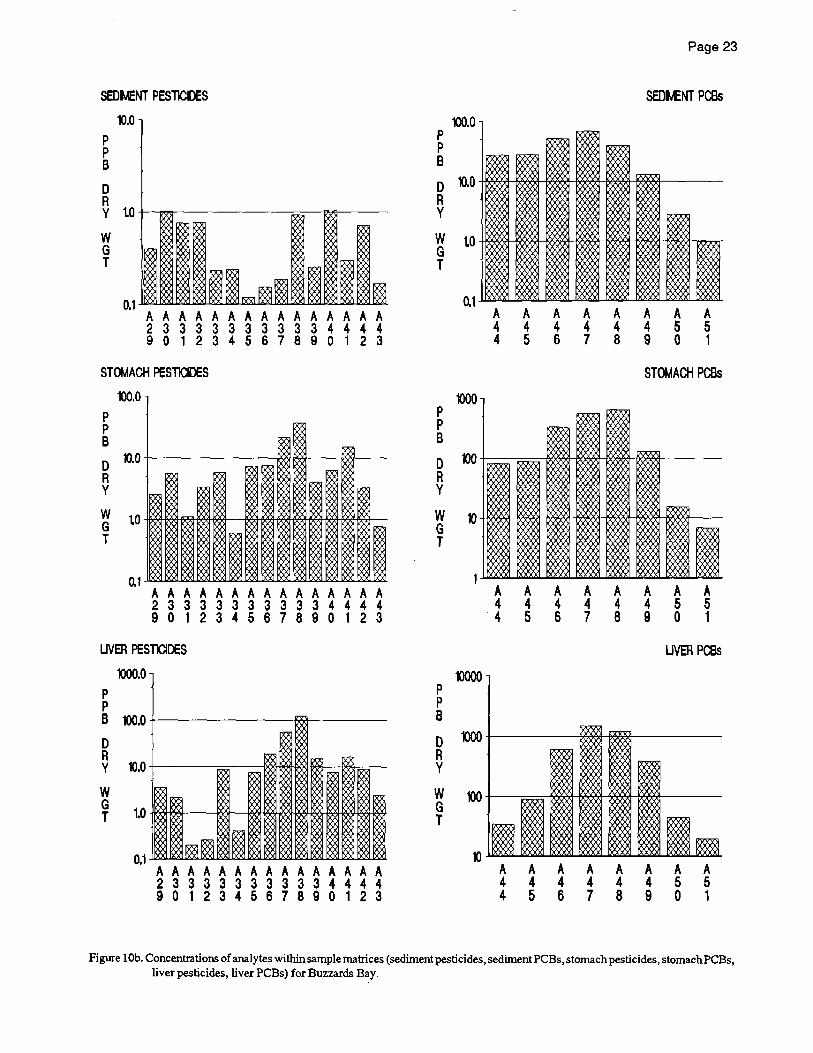
Figure lOb. Concentrations of analytes within sample matrices (sediment pesticides, sediment PCBs, stomach pesticides, stomach PCBs, liver pesticides, liver PCBs) for Buzzards Bay ............................. 23
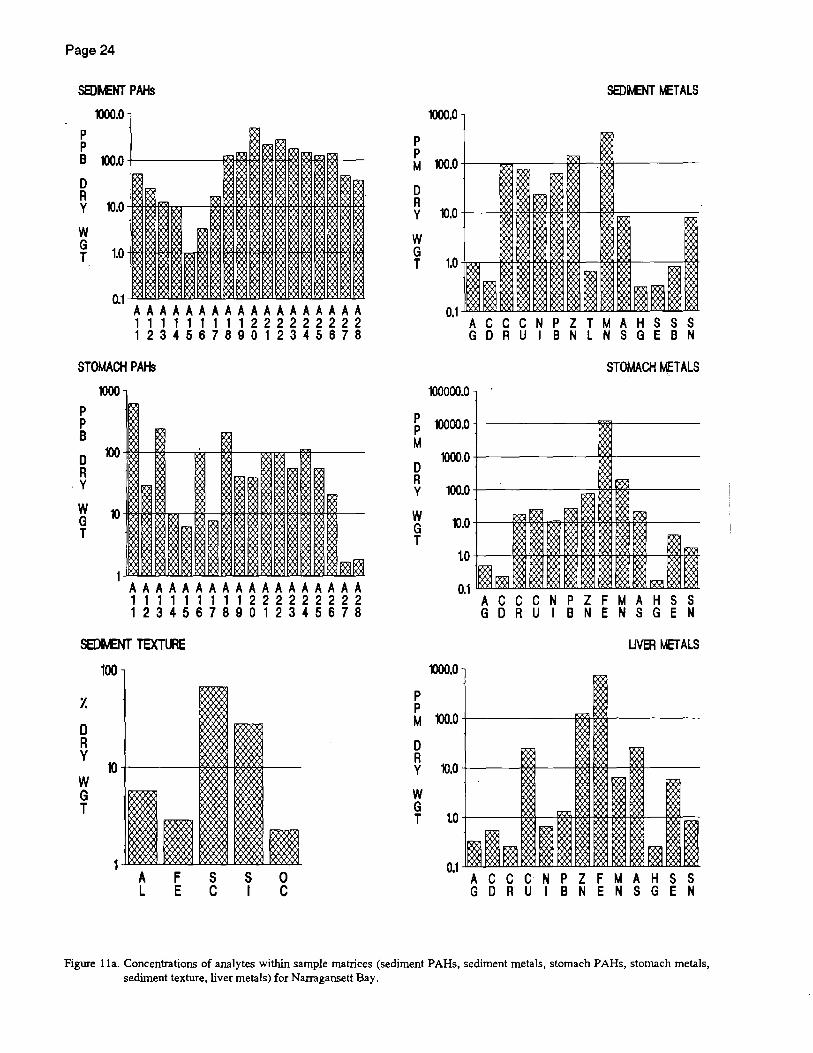
Figure lla. Concentrations of analytes within sample matrices (sediment PAHs, sediment metals, stomach PAHs, stomach metals, sediment texture, liver metals) for Narragansett Bay ......................... 24
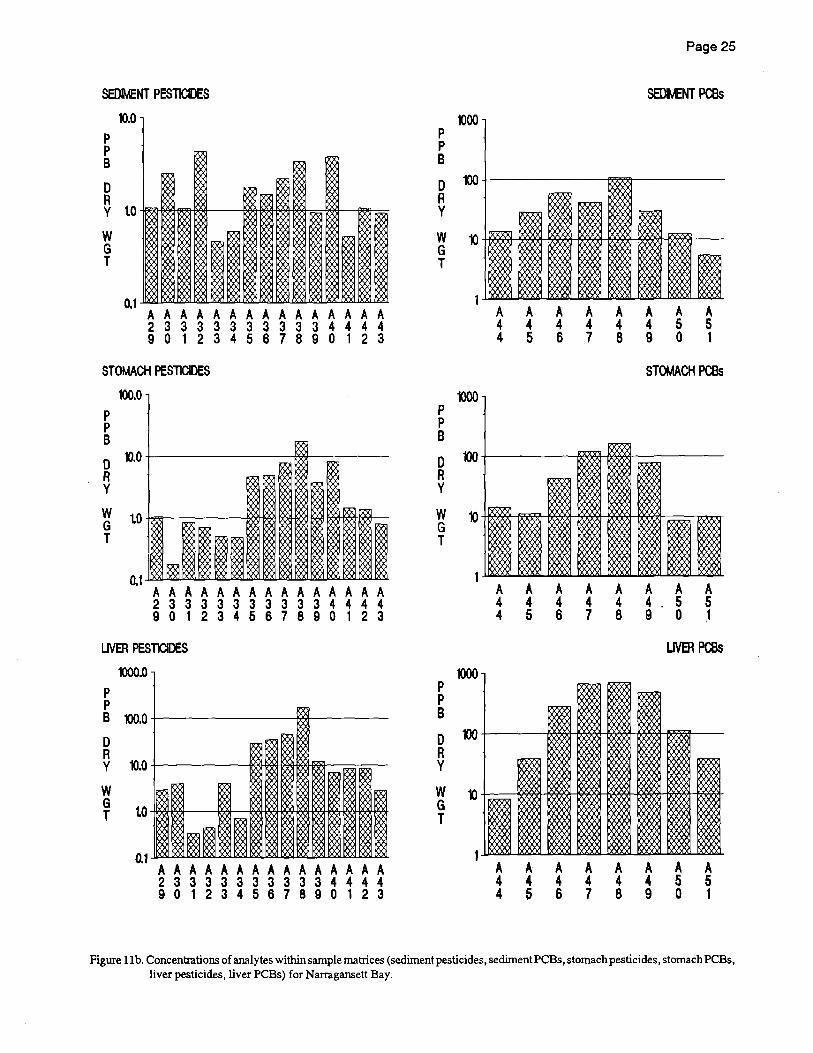
Figure lIb. Concentrations of analytes within sample matrices (sediment pesticides, sediment PCBs, stomach pesticides, stomach PCBs, liver pesticides, liver PCBs) for Narragansett Bay ........................ 25
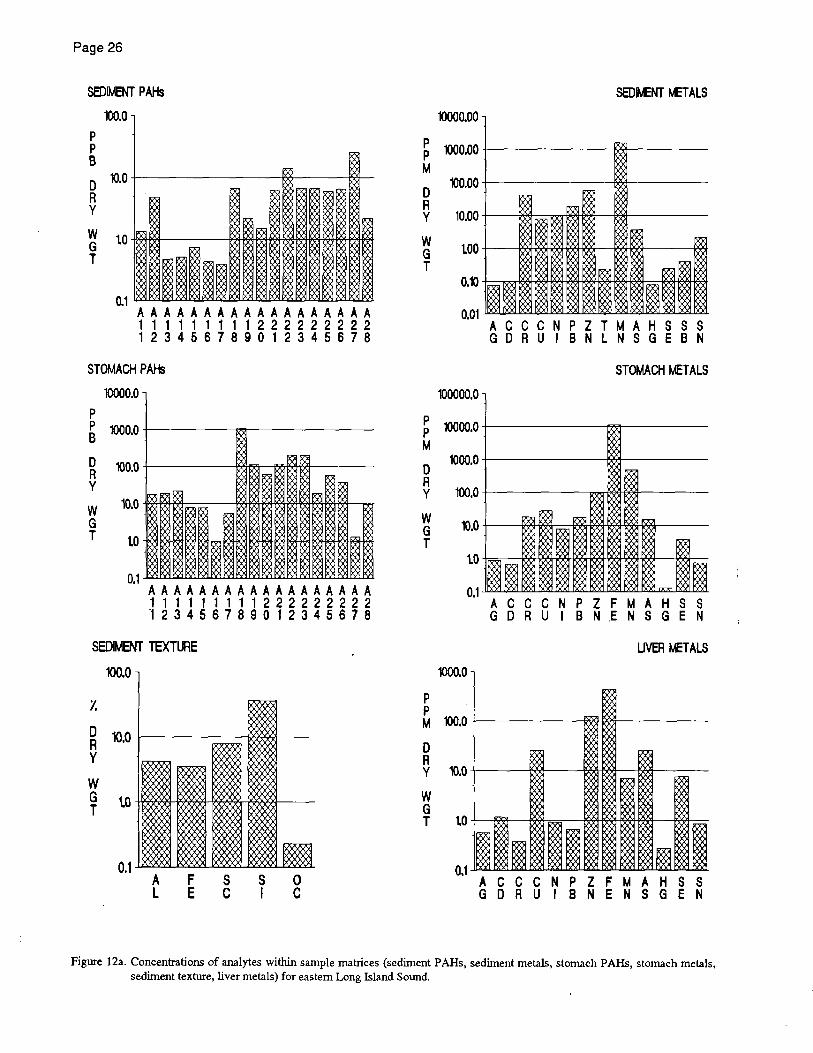
Figure 12a. Concentrations of analytes within sample matrices (sediment PAHs, sediment metals, stomach PAHs, stomach metals, sediment texture, liver metals) for eastern Long Island Sound ................................................................................................................ 26
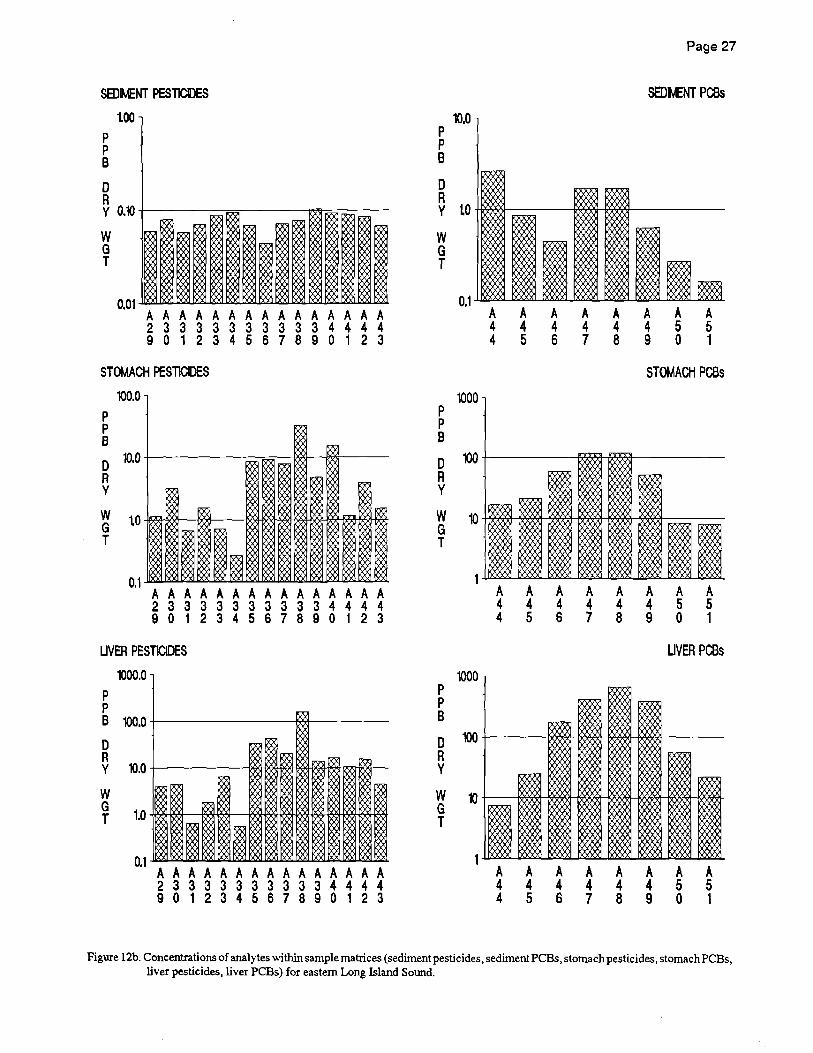
Figure 12b. Concentrations of analytes within sample matrices (sediment pesticides, sediment PCBs, stomach pesticides, stomach PCBs, liver pesticides, liver PCBs) for eastern Long Island Sound ..................................................................................................................... 27
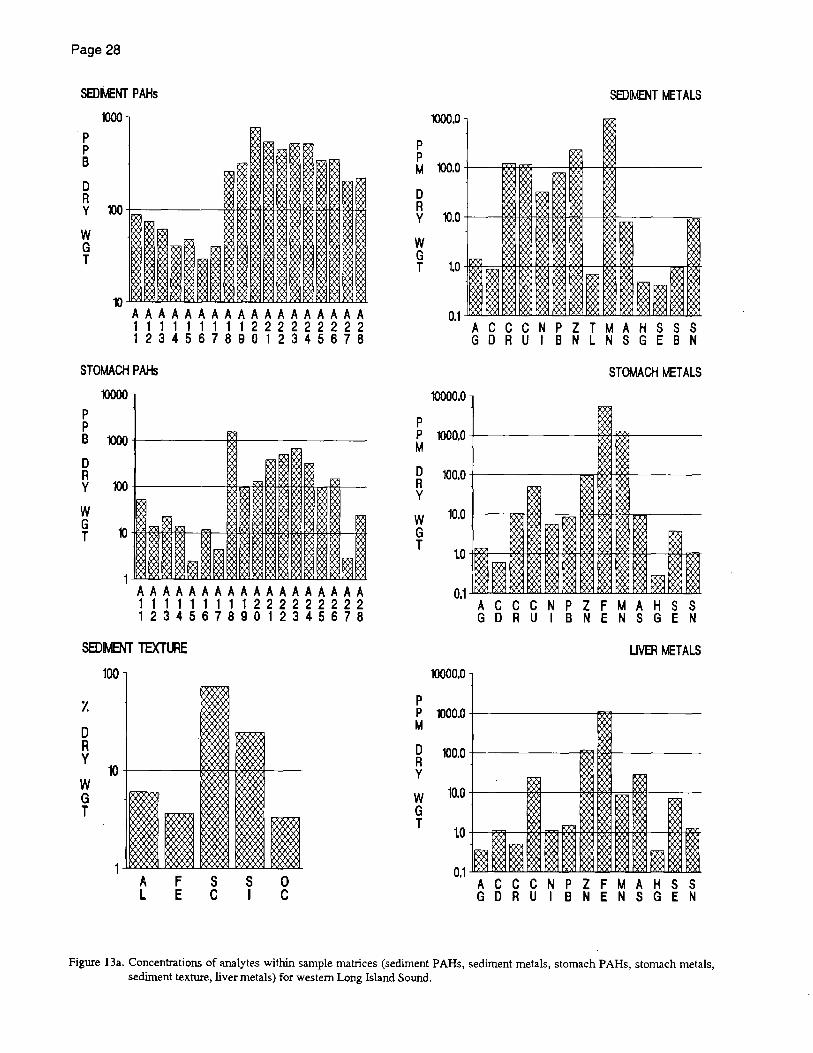
Figure 13a. Concentrations of analytes within sample matrices (sediment PAHs, sediment metals, stomach PAHs, stomach metals, sediment texture, liver metals) for western Long Island Sound .................................................................................................................... 28
Figure 13b. Concentrations of analytes within sample matrices (sediment pesticides, sediment PCBs, stomach pesticides, stomach PCBs, liver pesticides, liver PCBs) for western Long Island Sound .................................................................................................................... 29
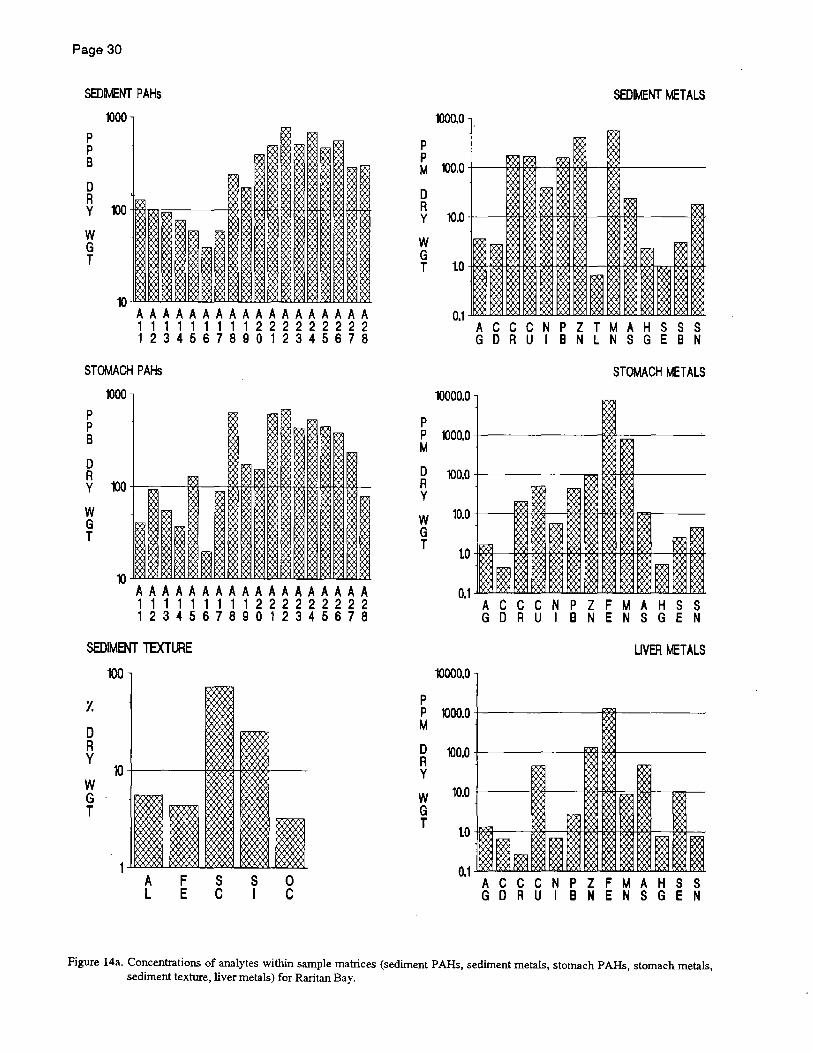
Figure 14a. Concentrations of analytes within sample matrices (sediment PAHs, sediment metals, stomach PARs, stomach metals, sediment texture, liver metals) for Raritan Bay ................................. 30
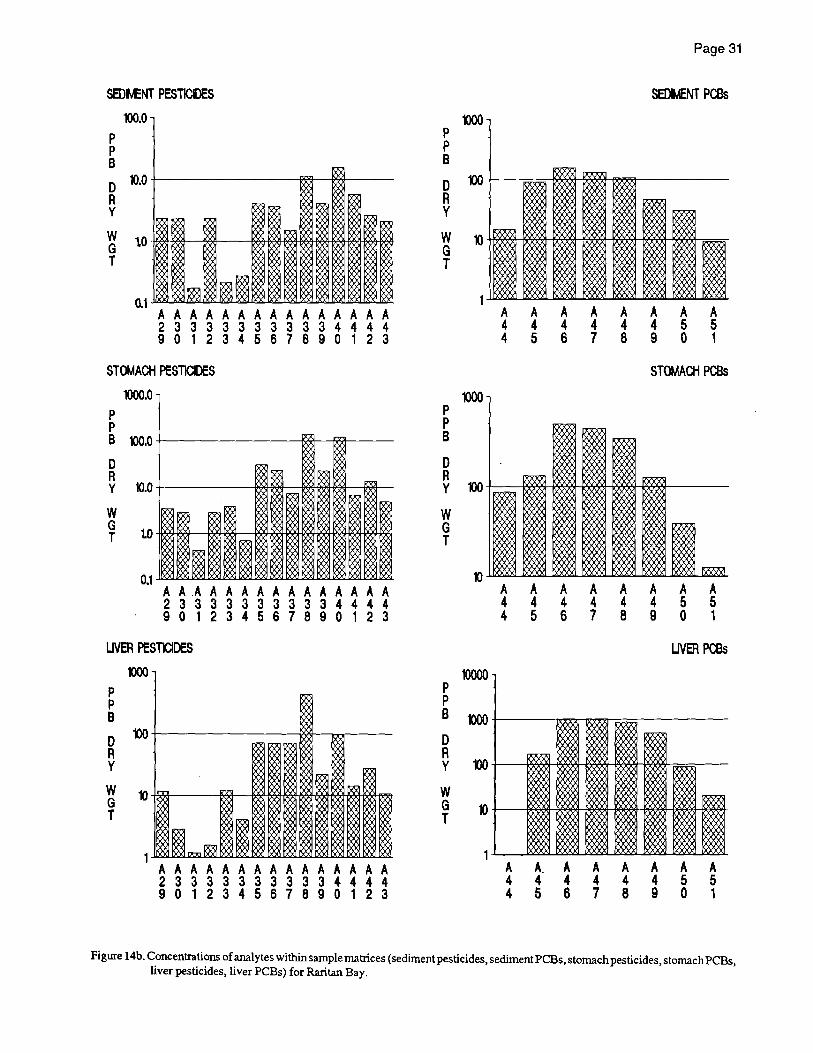
Figure 14b. Concentrations of analytes within sample matrices (sediment pesticides, sediment PCBs, stomach pesticides, stomach PCBs, liver pesticides, liver PCBs) for Raritan Bay ................................ 31
Figure 15a. Concentrations of analytes within sample matrices (sediment PARs, sediment metals, stomach PARs, stomach metals, sediment texture, liver metals) for Great Bay r .................................... 32
Figure 15b. Concentrations of analytes within sample matrices (sediment pesticides, sediment PCBs, stomach pesticides, stomach PCBs, liver pesticides, liver PCBs) for Great Bay ................................... 33
Page v
Figure 16a. Concentrations of analytes within sample matrices (sediment PARs, sediment metals, stomach PARs, stomach metals, sediment texture, liver metals) for Delaware Bay .............................. 34
Figure 16b. Concentrations of analytes within sample matrices (sediment pesticides, sediment PCBs, stomach pesticides, stomach PCBs, liver pesticides, liver PCBs) for Delaware Bay ............................ 35
Figure 17a. Concentrations of analytes within sample matrices (sediment PARs, sediment metals, stomach PARs, stomach metals, sediment texture, liver metals) for Upper Chesapeake Bay ............... 36
Figure 17b. Concentrations of analytes within sample matrices (sediment pesticides, sediment PCBs, stomach pesticides, stomach PCBs, liver pesticides, liver PCBs) for Upper Chesapeake Bay .............. 37
Figure 18. Concentrations of analytes within sample matrices (sediment P AHs, sediment metals, sediment texture, sediment pesticides, sediment PCBs) for Baltimore Harbor ...................................... 38
Figure 19. Concentrations of analytes within sample matrices (sediment PARs, sediment metals, sediment texture, sediment pesticides, sediment PCBs) for Mid Chesapeake Bay ................................ 39
Figure 20a. Concentrations of analytes within sample matrices (sediment P AHs, sediment metals, stomach PAHs, stomach metals, sediment texture, liver metals) for Lower Chesapeake Bay .............. 40
Figure 20b. Concentrations of analytes within sample matrices (sediment pesticides, sediment PCBs, stomach pesticides, stomach PCBs, liver pesticides, liver PCBs) for Lower Chesapeake Bay ............. 41
Figure 21a. Concentrations of analytes within sample matrices (sediment P AHs, sediment metals, stomach PAHs, stomach metals, sediment texture, liver metals) for the Elizabeth River ...................... 42
Figure 21b. Concentrations of analytes within sample matrices (sediment pesticides, sediment PCBs, stomach pesticides, stomach PCBs, liver pesticides, liver PCBs) for the Elizabeth River .................... 43
Figure 22a. Concentrations of hydrocarbons (naphthalene, 2-methylnaphthalene, l-methylnaphthalene, biphenyl, 2,6-dimethylnaphthalene, acenaphthene) in sediments from all sites .................................... 44
Figure 22b. Concentrations of hydrocarbons (fluorene, phenanthrene, anthracene, I-methylphenanthrene, fluoranthene, pyrene) in sediments from all sites .......................................................................... : ........ 45
Figure 22c. Concentrations of hydrocarbons (benzo[a]anthracene, chrysene, benzo[e]pyrene, benzo[a]pyrene, perylene, dibenzo[a,h]anthracene) in sediments from all sites .................................... 46
Figure 22d. Concentrations of hydrocarbons (hexachlorobenzene, lindane, heptachlor, aldrin, heptachlor epoxide, o,p' -DOE) in sediments from all sites .................................................................... 47
Figure 22e. Concentrations of hydrocarbOns (a-chlordane, trans-nonachlor, dieldrin, p,p'-DDE, o,p'-DDD, p,p' -DOD) in sediments from all sites ................................................................................................... 48
Figure 22f. Concentrations of hydrocarbons (o,p' -DDT, p,p' -DDT, mirex, dichlorobiphenyls, trichlorobiphenyls, tetrachlorobiphenyls) in sediments from all sites .................................................... 49
Figure 22g. Concentrations of hydrocarbons (pentachlorobiphenyls, hexachlorobiphenyls, heptachloro-biphenyls, octachlorobiphenyls, nonachlorobiphenyls) in sediments from all sites .............................. 50
Figure 23a. Concentrations of metals (silver, cadmium, chromium, copper, nickel, lead) in sediments from all sites ......... : ............................................................................................................ 51
Figure 23b. Concentrations of metals (zinc, thallium, manganese, arsenic, mercury ~ selenium) in sediments from all sites ...................................................................................................................... 52
Page vi
Figure 23c. Concentrations of metals (antimony, tin, silicon, iron, aluminum) in sediments from all sites ...................................................................................................................... 53
Figure 24. Concentrations of total organic carbon and silt-clay in sediments from all sites ..................................... 54
Figure 25a. Concentrations of hydrocarbons (naphthalene, 2-methylnaphthalene, I-methylnaphthalene, biphenyl, 2,6-dimethylnaphthalene, acenaphthene) in stomach contents collected from all sites .............................................................................................................. 55
Figure 25b. Concentrations of hydrocarbons (fluorene, phenanthrene, anthracene, I-methylphenanthrene, fluoranthene, pyrene) in stomach contents collected from all sites .................. 56
Figure 25c. Concentrations of hydrocarbons (benzo[a]anthracene, chrysene, benzo[e]pyrene, benzo[a]pyrene, perylene, dibenzo[a,h]anthracene) in stomach contents collected from all sites .............................................................................................................. 57
Figure 25d. Concentrations of hydrocarbons (hexachlorobenzene, lindane, heptachlor, aldrin, heptachlor epoxide, o,p'-DDE) in stomach contents collected from all sites ............................. 58
Figure 25e. Concentrations of hydrocarbons (a-chlordane, trans-nonachlor, dieldrin, p,p'-DDE, o,p' -DOD, p,p' -DOD) in stomach contents collected from all sites ...................................................... 59
Figure 25f. Concentrations of hydrocarbons (o,p' -DDT, p,p' -DDT, mirex, dichlorobiphenyls, trichlorobiphenyls, tetrachlorobiphenyls) in stomach contents collected from all sites ......................... 60
Figure 25g. Concentrations of hydrocarbons (pentachlorobiphenyls, hexachlorobiphenyls, heptachlorobiphenyls, octachlorobiphenyls, nonachlorobiphenyls) in stomach contents collected from all sites .............................................................................................................. 61
Figure 26a. Concentrations of metals (silver, cadmium, chromium, copper, nickel, lead) in stomach contents collected from all sites ............................................................................................... 62
Figure 26b. Concentrations of metals (zinc, iron, manganese, arsenic, mercury, selenium) in stomach contents collected from all sites ............................................................................................... 63
Figure 26c. Concentrations of metals (tin) in stomach contents collected from all sites ........................................... 64
Figure 27a. Concentrations of hydrocarbons (hexachlorobenzene, lindane, heptachlor, aldrin, heptachlor epoxide, o,p'-DDE) in livers collected from all sites ........................................................... 65
Figure 27b. Concentrations of hydrocarbons (a-chlordane, trans-nonachlor, dieldrin, p,p' -DOE, o,P' -DOD, p,p' -DOD) in livers collected from all sites ......................................................................... 66
Figure 27c. Concentrations of hydrocarbons (o,p' -DDT, p,p' -DDT, rnirex, dichlorobiphenyls, trichlorobiphenyls, tetrachlorobiphenyls) in livers collected from all sites ............................................ 67
Figure 27d. Concentrations of hydrocarbons (pentachlorobiphenyls, hexachlorobiphenyls, heptachlorobiphenyls, octachlorobiphenyls, nonachlorobiphenyls) in livers collected from all sites ............................................................................................................................ 68
Figure 28a. Concentrations of metals (silver, cadmium, chromium, copper, nickel, lead) in livers collected from all sites .................................................................................................................. 69
Figure 28b. Concentrations of metals (zinc, iron, manganese, arsenic, mercury, selenium) in livers collected from all sites .................................................................................................................. 70
Figure 28c. Concentrations of metals (tin) in livers collected from all sites .............................................................. 71

Page vii
LIST OF TABLES
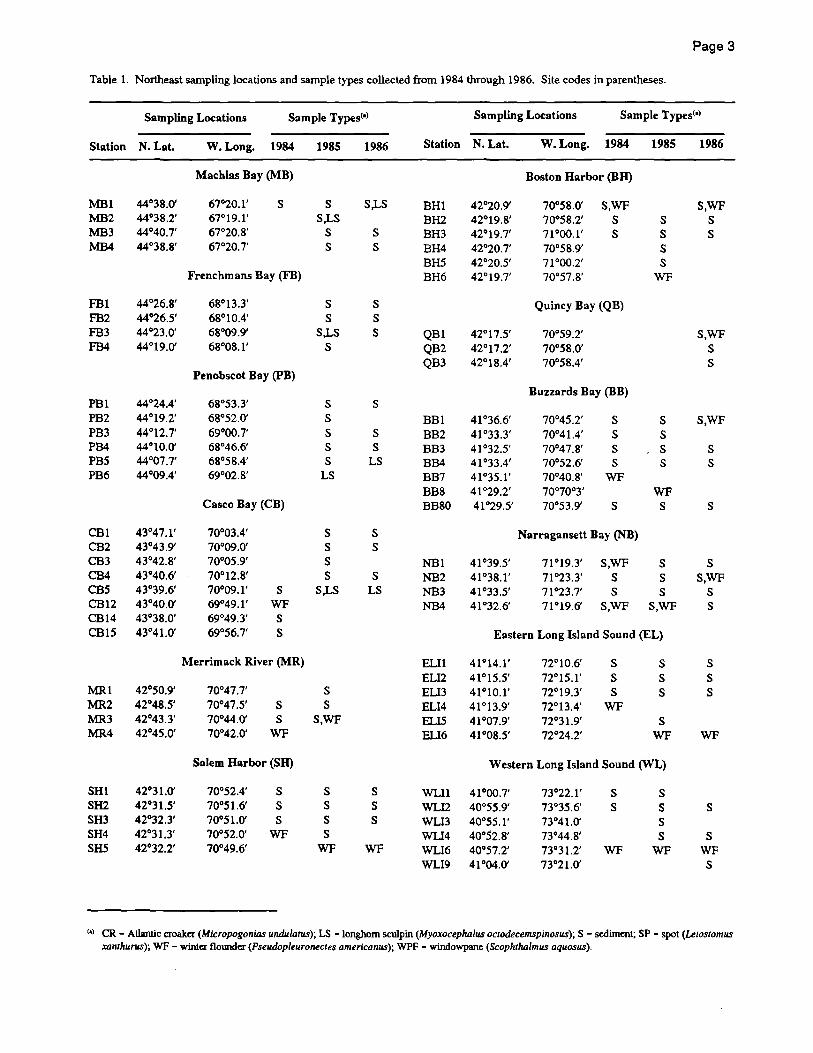
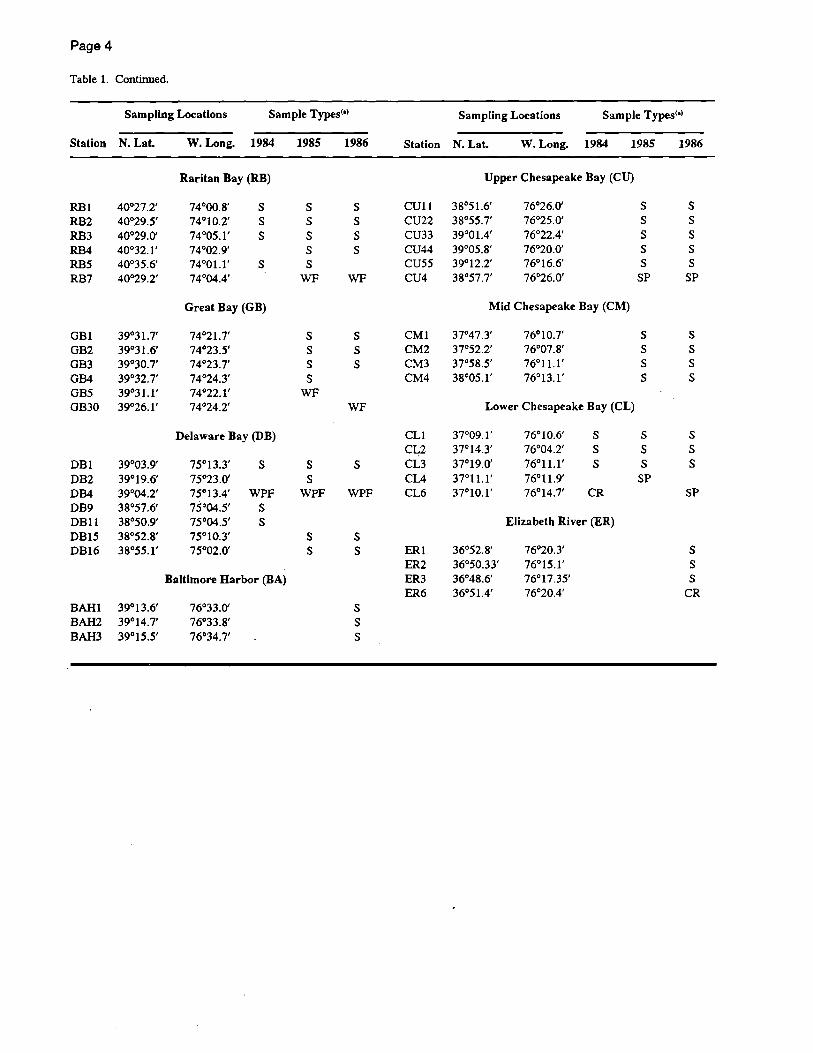
Table 1. Northeast sampling locations and sample types collected from 1984 through 1986 ................................. 3
Table 2. Variables measured, sample matrices, and key to analyte codes used in Site Summary section ............... 5
Table 3a. Concentrations of hydrocarbons (naphthalene, 2-methylnaphthalene, 1-methylnaphthalene, biphenyl, 2,6-dimethylnaphthalene, acenaphthene, fluorene, phenanthrene, anthracene) in sediment (ppb dry weight) ............................................................................................................... 72
Table 3b. Concentrations of hydrocarbons (l-methylphenanthrene, fluoranthene, pyrene, benzo[a)anthracene, chrysene, benzo[e]pyrene, benzo[a]pyrene, perylene, dibenzo[a,h]anthracene) in sediment (ppb dry weight) ......................................................................... 76
Table 3c. Concentrations of hydrocarbons (hexachlorobenzene, lindane, heptachlor, aldrin, heptachlorepoxide, o,p' -DDE, a-chlordane, trans-nonachlor, dieldrin) in sediment (ppb dry weight) ............................................................................................................... 80
Table 3d. Concentrations of hydrocarbons (p,p' -DDE, o,p' -DDD, p,p' -DDD, o,p' -DDT, p,p' -DDT, mirex, dichlorobiphenyl, trichlorobiphenyl, tetrachlorobiphenyl) in sediment (ppb dry weight) ............ 84
Table 3e. Concentrations of hydrocarbons (pentachlorobiphenyl, hexachlorobiphenyl, heptachlorobiphenyl, octachlorobiphenyl, nonachlorobiphenyl) in sediment (ppb dry weight) ............. 88
Table 4a. Concentrations of metals (silver, cadmium, chromium, copper, nickel, lead, zinc, iron, manganese) in sediment (ppm dry weight, except where noted) ........................................................... 90
Table 4b. Concentrations of metals (thallium, aluminum, silicon, arsenic, mercury, selenium, tin, antimony) in sediment (ppm dry weight, except where noted) ........................................................ 94
Table S. Total organic carbon (TOC) and silt-clay in sediment (% dry weight) .................................................. 98
Table 6a. Concentrations of hydrocarbons (naphthalene, 2-methylnaphthalene, l-methylnaphthalene, biphenyl, 2,6-dimethylnaphthalene, acenaphthene, fluorene, phenanthrene, anthracene) in stomach contents (ppb dry weight) ................................................................................................ 100
Table 6b. Concentrations of hydrocarbons (l-methylphenanthrene, fluoranthene, pyrene, benzo[a]anthracene, chrysene, benzo[e]pyrene, benzo[a]pyrene,perylene, dibenzo[a,h]anthracene) in stomach contents (ppb dry weight) .......................................................... 102
Table 6c. Concentrations of hydrocarbons (hexachlorobenzene, lindane, heptachlor, aldrin, heptachlor epoxide, o,p' -DDE, a-chlordane, trans-nonachlor, dieldrin) in stomach contents (ppb dry weight) .................................................................................................................. 104
Table 6d. Concentrations of hydrocarbons (p,p'-DDE, o,p'-DDD, p,p'-DDD, o,p'-DDT, p,p'-DDT, mirex, dichlorobiphenyl, trichlorobiphenyl, tetrachlorobiphenyl) in stotnachcontents (ppb dry weight) .................................................................................................... 106
Table 6e. Concentrations of hydrocarbons (pentachlorobiphenyl, hexachlorobiphenyl, heptachlorobiphenyl, octachlorobiphenyl, nonachlorobiphenyl) in stomach contents (ppb dry weight) ............................... 108
Table 7. Concentrations of metals in stomach contents (ppm dry weight) ......................................................... 109
Table 8a. Concentrations of hydrocarbons (hexachlorobenzene, lindane, heptachlor, aldrin, heptachlor epoxide, o,p' -DDE, a-chlordane, trans-nonachlor) in fish liver (ppb dry weight) .............. 110
Page viii
Table 8b. Concentrations of hydrocarbons (dieldrin, p,p' -DOE, o,p' -DOD, p,p' -DOD, o,p' -DDT, p,p'-DDT, mirex, dichlorobiphenyl) in fish liver (ppb dry weight) .................................................... 114
Table 8c. Concentrations of hydrocarbons (trichlorobiphenyl, tetrachlorobiphenyl, pentachlorobiphenyl, hexachlorobiphenyl,heptachlorobiphenyl,octachlorobiphenyl,nonachlorobiphenyl) in fish liver (ppb dry weight) ............................................................................................................ 117
Table 9a. Concentrations of metals (silver, cadmimn, chromimn, copper, nickel, lead, zinc, iron) in fish liver (ppm dry weight) ........................................................................................................... 121
Table 9b. Concentrations of metals (manganese, thallimn, arsenic, mercury, selenimn, tin, antimony) in fish liver (ppm dry weight) ........................................................................................................... 130
Page ix
EXECUTIVE SUMMARY
~'\ Between 1984 and 1986, the baseline phase of the National Status and Trends Program was conducted at approximately
SO estuarine and coastal sites around the nation. Numerous histopathological observations of fish tissues and measurements of concentrations of chemical contaminants in sediments and fish tissues were made to quantify the status of United States coastal habitats with respect to environmental contamination. One of the products of this effort is a large data set containing information on concentrations of contaminants that possibly may threaten the health of the nation' s coastal ecosystems. This body of data is useful to environmental scientists and managers. The purpose of this document is to make the chemical contaminant data available to the environmental community. Data sununaries are presented in both graphical and tabular form. <"_ ..
Page x
76' 74" 72' 70'
NATIONAL ST A TUS AND TRENDS
PROGRAM
achias Bay(MB) renchmans Bay(FB)
.. .' Penobscot Bay(PB)_ l}.~r Casco Bay(CB) ¥
Benthic Surveillance Project
Merrimack River Mouth(MR)
Salem Harbor(SH) Boston Harbor(BH}
~"---~OUinCY BayCOBl
~ Buzzards Bay(BB} , Narragansett Bay(NB}
Eastern Long Island Sound(EL} Western Long Island Sound(WL}
Raritan Bay(RB}
Great Bay(GB} Baltimore Harbor( BA}
Delaware Bay(DB}
Upper Chesapeake B~y(CU}
Mid Chesapeake Bay(CM}
. Lower Chesapeake Bay(CL)
Elizabeth Rlver(ER)
..
42
66'
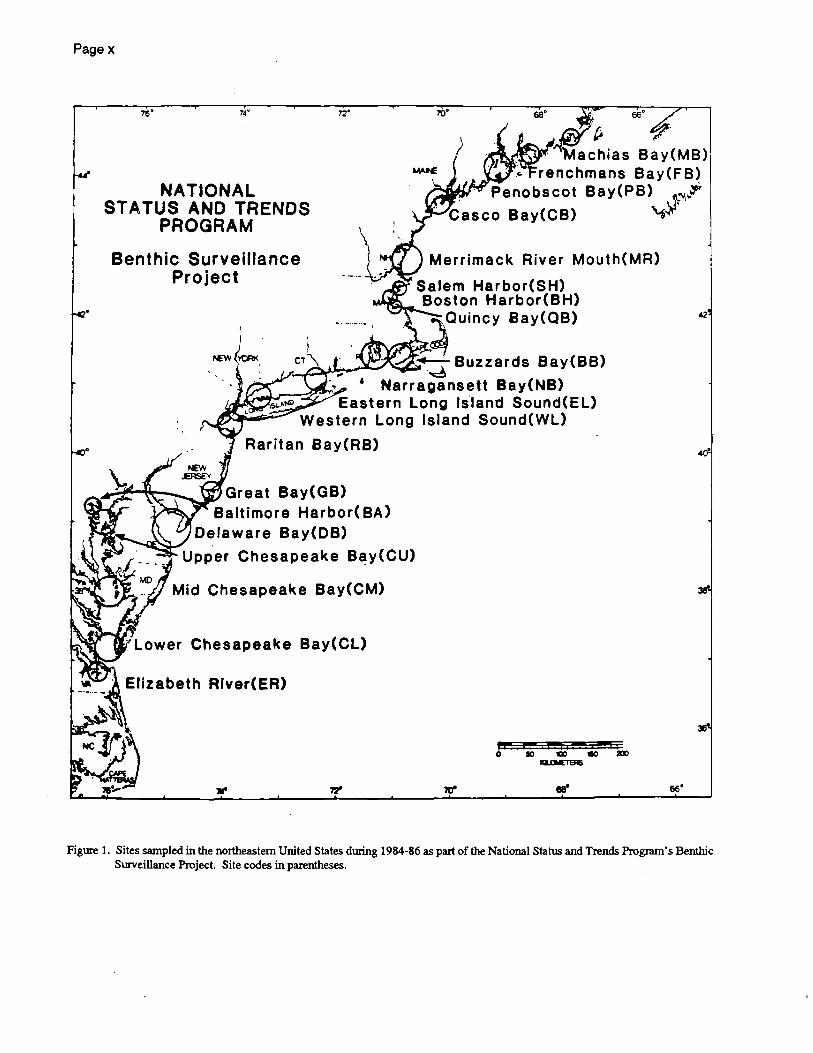
Figure 1. Sites sampled in the northeastern United States during 1984-86 as part of the National Status and Trends Program's Benthic Surveillance Project. Site codes in parentheses.
INTRODUCTION
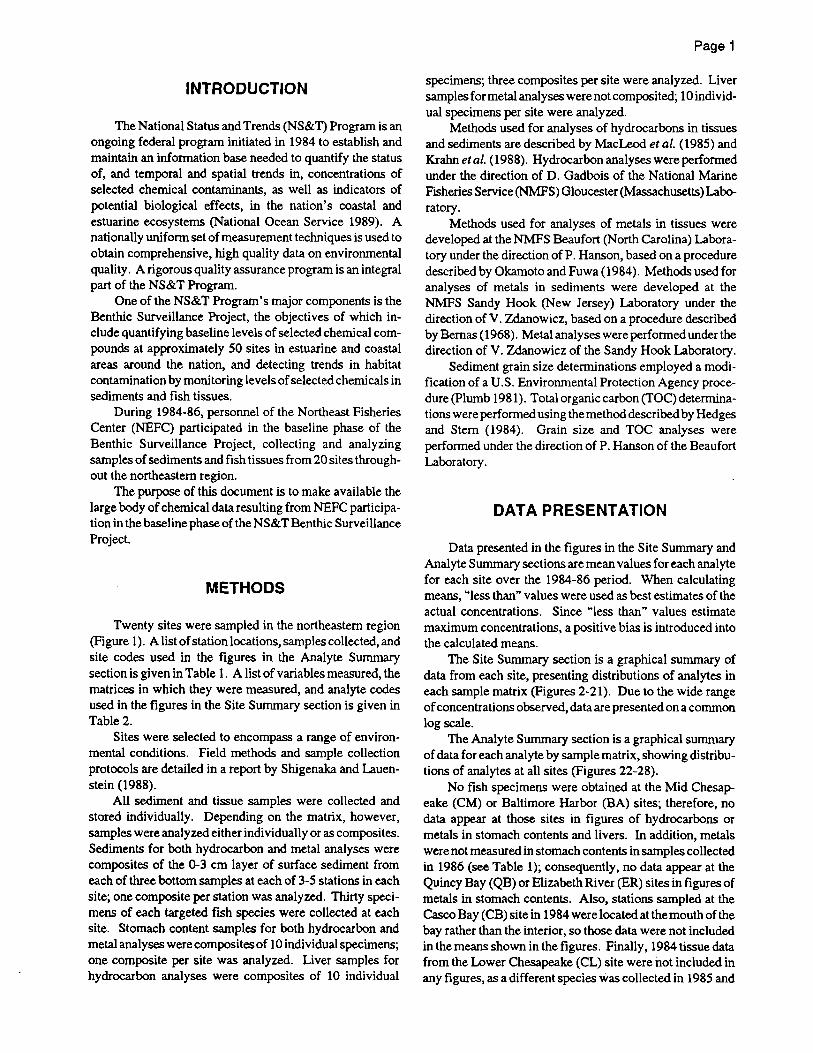
The National Status and Trends (NS&T) Program is an ongoing federal program initiated in 1984 to establish and maintain an information base needed to quantify the status of, and temporal and spatial trends in, concentrations of selected chemical contaminants, as well as indicators of potential biological effects, in the nation's coastal and estuarine ecosystems (National Ocean Service 1989). A nationally uniform set of measurement techniques is used to obtain comprehensive, high quality data on environmental quality. A rigorous quality assurance program is an integral part of the NS&T Program.
One of the NS&T Program's major components is the Benthic Surveillance Project, the objectives of which include quantifying baseline levels of selected chemical compounds at approximately 50 sites in estuarine and coastal areas around the nation, and detecting trends in habitat contamination by monitoring levels of selected chemicals in sediments and fish tissues.
During 1984-86, personnel of the Northeast Fisheries Center (NEFC) participated in the baseline phase of the Benthic Surveillance Project, collecting and analyzing samples of sediments and fish tissues from 20 sites throughout the northeastern region.
The purpose of this document is to make available the large body of chemical data resulting from NEFC participation in the baseline phase of the NS&T Benthic Surveillance Project.
METHODS
Twenty sites were sampled in the northeastern region (Figure 1). A list of station locations, samples collected, and site codes used in the figures in the Analyte Summary section is given in Table 1. A list of variables measured, the matrices in which they were measured, and analyte codes used in the figures in the Site Summary section is given in Table 2.
Sites were selected to encompass a range of environmental conditions. Field methods and sample collection protocols are detailed in a report by Shigenaka and Lauenstein (1988).
AU sediment and tissue samples were collected and stored individually. Depending on the matrix, however, samples were analyzed either individually or as composites. Sediments for both hydrocarbon and metal analyses were composites of the 0-3 cm layer of surface sediment from each of three bottom samples at each of 3-5 stations in each site; one composite per station was analyzed. Thirty specimens of each targeted fish species were collected at each site. Stomach content samples for both hydrocarbon and metal analyses were composites of 10 individual specimens; one composite per site was analyzed. Liver samples for hydrocarbon analyses were composites of 10 individual
Page 1
specimens; three composites per site were analyzed. Liver samples for metal analyses were not composited; 10 individual specimens per site were analyzed.
Methods used for analyses of hydrocarbons in tissues and sediments are described by MacLeod et al. (1985) and Krahn et al. (1988). Hydrocarbon analyses were performed under the direction of D. Gadbois of the National Marine Fisheries Service (NMFS) Gloucester (Massachusetts) laboratory.
Methods used for analyses of metals in tissues were developed at the NMFS Beaufort (North Carolina) Laboratory under the direction of P. Hanson, based on a procedure described by Okamoto and Fuwa (1984). Methods used for analyses of metals in sediments were developed at the NMFS Sandy Hook (New Jersey) Laboratory under the direction of V. Zdanowicz, based on a procedure described by Bernas (1968). Metal analyses were performed under the direction of V. Zdanowicz of the Sandy Hook Laboratory.
Sediment grain size determinations employed a modification of a U.S. Environmental Protection Agency procedure (Plumb 1981). Total organic carbon (TOC) determinations were performed using the method described by Hedges and Stem (1984). Grain size and TOC analyses were performed under the direction of P. Hanson of the Beaufort Laboratory.
DATA PRESENTATION
Data presented in the figures in the Site Summary and Analyte Summary sections are mean values for each analyte for each site over the 1984-86 period. When calculating means, "less than" values were used as best estimates of the actual concentrations. Since "less than" values estimate maximum concentrations, a positive bias is introduced into the calculated means.
The Site Summary section is a graphical summary of data from each site, presenting distributions of analytes in each sample matrix (Figures 2-21). Due to the wide range of concentrations observed, data are presented on a common log scale.
The Analyte Summary section is a graphical summary of data for each analyte by sample matrix, showing distributions of analytes at all sites (Figures 22-28).
No fish specimens were obtained at the Mid Chesapeake (CM) or Baltimore Harbor (BA) sites; therefore, no data appear at those sites in figures of hydrocarbons or metals in stomach contents and livers. In addition, metals were not measured in stomach contents in samples collected in 1986 (see Table 1); consequently, no data appear at the Quincy Bay (QB) or Elizabeth Ri ver (ER) sites in figures of metals in stomach contents. Also, stations sampled at the Casco Bay (CB) site in 1984 were located at the mouth of the bay rather than the interior, so those data were not included in the means shown in the figures. Finally, 1984 tissue data from the Lower Chesapeake (CL) site were not included in any figures, as a different species was collected in 1985 and

Page 2
1986. . Analytical data are presented in the Analytical Data
section (Tables 3-9).
ACKNOWLEDGEMENTS
The authors thank E. Leimburg and P. Fournier for producing the graphics, R Murchelano for suggestions on presentation format, and R. Reid, F. Steimle, A. Draxler, and 1. E. O'Reilly for critical review.
The following NOAA personnel made completion of this project possible through their dedication and their participation in field work, laboratory analyses or project administration: Gloucester Laboratory--C. Auld, P. Chen, B. Dockum, A. Humason, L. Karohl, A. Khan, and R Tremblay; Oxford Laboratory--1. Evans, S. Everline, S. McLaughlin, S. Maclean, R Murchelano, M. Newman, A. Rosenfield, and D. Spitzer; Sandy Hook Laboratory--K. Fedosh, T. Finneran, R Kothe, S. Leftwich, K McNulty, J. Pearce, 1. Vitaliano, S. Wilk, and 1. Ziskowski; and the officers and crews of the research vessels Albatross IV Ferrell, Gloria Michelle, and Kyma. '
!REFERENCES CITED
Bernas, B. 1968. A new method for decomposition and comprehensive analysis of silicates by atomic absorption spectrometry. Anal. Chem. 40(11): 1682-1686.
Hedges, 1.1., and 1.H. Stern. 1984. Carbon and nitrogen
determination of carbonate-containing solids. Limnol . Oceanogr. 29: 657-663.
Krahn M.M., L.K Moore, RG. Bogar, C.A. Wigren, S-L Chan, andD.W. Brown. 1988. A rapid HPLC method for isolating organic contaminants from tissue and sediment extracts. J. Chromatogr. 437: 161-175.
MacLeod, W.D., Jr., D.W. Brown, A.S. Friedman, D.G. Burrows, o. Maynes, R. Pearce, c.A. Wigren, andRG. Bogar. 1985. Standard analytical procedures of the NOAA National Analytical Facility, 1985-1986: extractable toxic organic compounds. 2nd ed. NOAA [Nat. Ocean. Atmos. Admin.] Tech. Mem. NMFS [Nat. Mar. Fish. Serv.] FjNWC-92. 121 pp.
National Ocean Service. 1989. Report to the Congress on ocean pollution, monitoring and research: October 1987 through September 1988. Available from National Oceanic and Atmospheric Administration, National Ocean Pollution Program Office, Rockville, MD 20852. 68pp.
Okamoto, K, and K Fuwa. 1984. Low-contamination digestion bomb method using a teflon double vessel for biological materials. Anal. Chem. 56: 1758-1760.
Plumb, R.H. 1981. Procedures for handling and chemical analysis of sediment and water samples. Tech. Rep. EPA/CE-81-1. Available from U.S. Army Corps of Engineers, Waterways Experiment Station, P.O. Box· 631, Vicksburg, MS 39180. 478 pp.
Shigenaka, G., and G.G. Lauenstein. 1988. National Status and Trends Program for Marine Environmental Quality: Benthic Surveillance and Mussel Watch Projects sampling protocols. NOAA [Nat. Ocean. Atmos. Admin.] Tech. Mem. NOS [Nat. Ocean Serv.] OMA 40. 18 pp.
Page 3
Table 1. Northeast sampling locations and sample types collected from 1984 through 1986. Site codes in parentheses.
Sampling Locations Sample Types(·) Sampling Locations Sample Types(·)
Station N.Lat. W.Long. 1984 1985 1986 Station N.Lat. W.Long. 1984 1985 1986
Machias Bay (MB) Boston Harbor (BB)
MB1 44°38.0' 67°20.1' S S S,LS BH1 42°20.9' 70°58.0' S,WF S,WF MB2 44°38.2' 67°19.1' S,LS BH2 42°19.8' 70°58.2' S S S MB3 44°40.7' 67°20.8' S S BH3 42°19.7' 71°00.1' S S S MB4 44°38.8' 67°20.7' S S BH4 42°20.7' 70°58.9' S
BHS 42°20.5' 71°00.2' S Frenchmans Bay (FB) BH6 42°19.7' 70°57.8' WF
FBI 44°26.8' 68°13.3' S S Quincy Bay (QB) FB2 44°26.5' 68°10.4' S S FB3 44°23.0' 68°09.9' S,LS S QB1 42°17.5' 70°59.2' S,WF FB4 44°19.0' 68°08.1' S QB2 42°17.2' 70°58.0' S
QB3 42°18.4' 70°58.4' S Penobscot Bay (PB)
Buzzards Bay (BB) PB1 44°24.4' 68°53.3' S S PB2 44°19.2' 68°52.0' S BB1 41°36.6' 70°45.2' S S S,WF PB3 44°12.7' 69°00.7' S S BB2 41 °33.3' 70°41.4' S S PB4 44°10.0' 68°46.6' S S BB3 41 °32.5' 70°47.8' S S S PB5 44°07.7' 68°58.4' S LS BB4 41 °33.4' 70°52.6' S S S PB6 44°09.4' 69°02.8' LS BB7 41°35.1' 70°40.8' WF
BB8 41°29.2' 70"70°3' WF Casco Bay (CB) BB80 41 °29.5' 70°53.9' S S S
CB1 43°47.1' 70°03.4' S S Narragansett Bay (NB) CB2 43°43.9' 70°09.0' S S CB3 43°42.8' 70°05.9' S NBI 41°39.5' 71 °19.3' S,WF S S CB4 43°40.6' 70°12.8' S S NB2 41°38.1' 71°23.3' S S S,WF CB5 43°39.6' 70°09.1' S S,LS LS NB3 41 °33.5' 71°23.7' S S S CB12 43°40.0' 69°49.1' WF NB4 41"32.6' 71°19.6' S,WF S,WF S CB14 43°38.0' 69°49.3' S CB15 43°41.0' 69°56.7' S Eastern Long Island Sound (EL)
Merrimack River (MR) EU1 41°14.1' 72°10.6' S S S ELI2 41 °15.5' 72°15.1' S S S
MR1 42°50.9' 70°47.7' S ELI3 41°10.1' 72°19.3' S S S MR2 42°48.5' 70°47.5' S S ELI4 41°13.9' 72°13.4' WF MR3 42°43.3' 70°44.0' S S,WF ELlS 41°07.9' 72°31.9' S MR4 42°45.0' 70°42.0' WF ELI6 41 °08.5' 72°24.2' WF WF
Salem Harbor (SB) Western Long Island Sound (WL)
SH1 42°31.0' 70°52.4' S S S WLIl 41°00.7' 73°22.1' S S SH2 42°31.5' 70°51.6' S S S WLI2 40°55.9' 73°35.6' S S S SH3 42°32.3' 70°51.0' S S S WLI3 40°55.1' 73°41.0' S SH4 42°31.3' 70°52.0' WF S WLI4 40°52.8' 73°44.8' S S SHS 42°32.2' 70°49.6' WF WF WLI6 40°57.2' 73°31.2' WF WF WF
WLI9 41°04.0' 73°21.0' S
(I) CR - Atlantic croaker (Micropogollias unduultus); LS - longhorn sculpin (Myoxocephalus oClOdecemspillosus); S - sediment; SP - spot (Leiostomus XDlI1hurus); WF - winter flounder (Pseudopleurollectes americallus); WPF - windowpane (Scophthalmus aquosus).
Page 4
Table 1. Continued.
SAmpling LocAtions SAmple TypeS(I) Sampling LocAtions Sample Types(a)
Station N.LAt. W. Long. 1984 1985 1986 Station N.Lat. W.Long. 1984 1985 1986
RAritan Bay (RB) Upper ChesApeAke BAY (CU)
RBI 40°27.2' 74°00.8' S S S CUll 38°51.6' 76°26.0' S S RB2 40°29.5' 74°10.2' S S S CU22 38°55.7' 76°25.0' S S RB3 40°29.0' 74°05.1' S S S CU33 39°01.4' 76°22.4' S S RB4 40°32.1' 74°02.9' S S CU44 39°05.8' 76°20.0' S S RB5 40°35.6' 74°01.1' S S CUS5 39°12.2' 76°16.6' S S RB7 40°29.2' 74°04.4' WF WF CU4 38°57.7' 76°26.0' SP SP
GreAt BAY (GB) Mid ChesApeAke BAY (CM)
GBI 39°31.7' 74°21.7' S S CMl 37°47.3' 76°10.7' S S GB2 39°31.6' 74°23.5' S S CM2 37°52.2' 76°07.8' S S GB3 39°30.7' 74°23.7' S S CM3 37°58.5' 76°11.1' S S GB4 39°32.7' 74°24.3' S CM4 38°05.1' 76°13.1' S S GB5 39°31.1' 74°22.1' WF GB30 39°26.1' 74°24.2' WF Lower ChesapeAke BAY (CL)
DelaWAre Bay (DB) CLl 37°09.1' 76°10.6' S S S CL2 37°14.3' 76°04.2' S S S
DBI 39°03.9' 75°13.3' S S S CL3 37°19.0' 76°11.1' S S S DB2 39°19.6' 75°23.0' S CL4 37°11.1' 76°11.9' SP DB4 39°04.2' 75°13.4' WPF WPF WPF CL6 37°10.1' 76°14.7' CR SP DB9 38°57.6' 75°04.5' S DB 11 38°50.9' 75°04.5' S ElizAbeth River (ER) DB15 38°52.8' 75°10.3' S S DB16 38°55.1' 75°02.0' S S ERI 36°52.8' 76°20.3' S
ER2 36°50.33' 76°15.1' S Baltimore Harbor (BA) ER3 36°48.6' 76°17.35' S
ER6 36°51.4' 76°20.4' CR BAHI 39°13.6' 76°33.0' S BAHZ 39°14.7' 76°33.8' S BAH3 39°15.5' 76°34.7' S
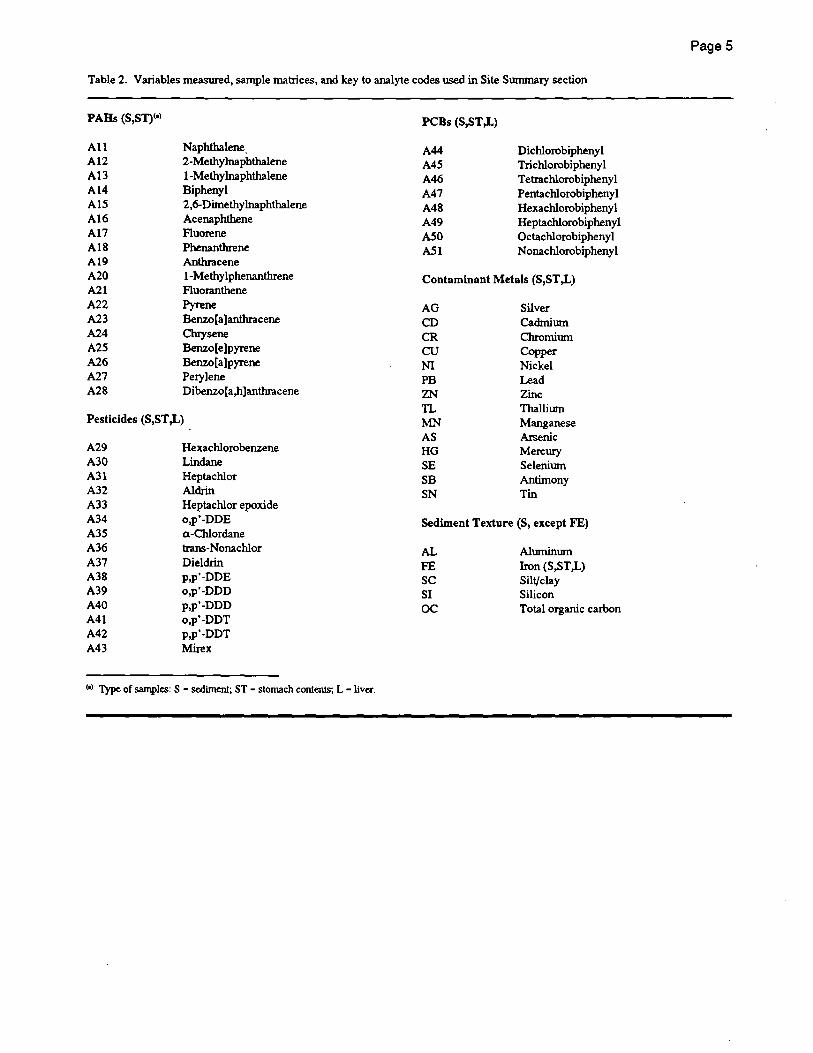
Table 2. Variables measured, sample matrices, and key to analyte codes used in Site Summary section
PARs (S,ST)(O)
A1l AI2 A13 A14 AlS AI6 AI7 Al8 A19 A20 A21 A22 A23 A24 A2S A26 A27 A28
Naphthalene, 2-Methylnaphthalene I-Methylnaphthalene Biphenyl 2,6-Dimethylnaphthalene Acenaphthene Fluorene Phenanthrene Anthracene I-Methy Iphenanthrene Fluoranthene Pyrene Benzo[a] anthracene Cluysene Benzo[e]pyrene Benzo[a]pyrene Perylene Dibenzo[a,h]anthracene
Pesticides (S,ST,L)
A29 Hexachlorobenzene A30 Lindane A31 Heptachlor A32 Aldrin A33 Heptachlor epoxide A34 o,p'-DDE A3S a-Chlordane A36 trans-Nonachlor A37 Dieldrin A38 p,p'-DDE A39 o,p'-DDD A40 p,p'-DDD A41 o,p'-DDT A42 p,p'-DDT A43 Mirex
(0) Type of samples: S - sediment; ST - stomach contents; L - liver.
PCBs (S,ST ,I.)
A44 A4S A46 A47 A48 A49 ASO ASI
Dichlorobiphenyl Trichlorobiphenyl Tetrachlorobiphenyl Pentachlorobiphenyl Hexachlorobiphenyl Heptachlorobiphenyl Octachlorobiphenyl N onachlorobiphenyl
Contaminant Metals (S,ST,L)
AG Silver CD Cadmium CR Chromium CU Copper NI Nickel PB Lead ZN Zinc TL Thallium MN Manganese AS Arsenic HG Mercury SE Selenium SB Antimony SN Tin
Sediment Texture (S, except FE)
AL FE SC SI OC
Aluminum Iron (S,ST,L) Silt/clay Silicon Total organic carbon
PageS
PageS
SEDIMENT PAHs
"KlOO.o P P B 100.0 +--------------
D R Y 10.0 +---------fii'HYT-M----I9l------.=---
W G T
A A A A A A A A A A A A A A A A A A 111111111222222222 1 2 3 4 5 6 7 8 9 0 1 2 3 4 5 678
STOMACH PAHs
100.0
P P B D 10.0 R Y
W G T
AAAAAAAAAAAAAAAAAA 1 1 1 1 1 1 1 1 1 222 2 2 2 2 2 2 1 2 345 6 7 890 1 2 345 6 7 8
SEDIMENT TEXTURE
100.0
'I.
~ 10.0 +----~~I<;;4--f;)~;+----Y
W G tO~~~~~~~~T
A L
F E
s c
S I
a c
SEDLVENT METALS
1000.00
p P 'KXl.OO .J-----------l'*f------M
D R Y
W G T
p
10.00 +--f.M-t~Mf,(~>i}__~f------
0.01 ~l.U!.U~"""-"~""'_""''''"_"'''~~~'''''''_'''"''''_'''''''_
10000.0
Ace C N P Z T M A H S S S G D R U IBN L N S G E B N
STOMACH METALS .
P 1000.0 +-------~----M
~ 100.0 +-----------==:-iS9l----
Y
W G T
P P
10.0 +---~---M4M4-I:)OO_j~---
0.1 J.CQ:LU.lU.J.1..lU.~=..u~=~~l..J.2\.AI~J..UJ.
1000.0
Ace C N P Z F M A H 5 S G D R U IBN ENS G E N
UVEA METALS
M 100.0 +--------J;>~~----
o R y 10.0 +-----~-----l!%i'H~~M_---
W G T 1.0 +--K!Ii+-~---i\~~**"M___f*f___
0.1 -=~llXA.l.Lll;5J..~llQUJllQ::lJLll.l~UliJ<lU..[.;!;z.J.liI.lU. Ace C N P Z F M A H S S G 0 R U IBN ENS G E N
Figure 2a. Concentrations of analytes within sample matrices (sediment PAlls, sediment metals, stomach PAlls, stomach metals, sediment texture, liver metals) for Machias Bay.
SEDLMENT PESTIOOES
p P B
o R
tOO
y 0.10 ~'OOoe-OO<H~~oo-...==~Hlo:1<l'OOoe-OOoEH~oOO-.==
W G T
A A A A A A A A A A A A A A A 2 333 3 3 3 3 3 3 3 4 4 4 4 9 0 1 234 5 6 789 0 1 2 3
STOMACH PESTICIDES
100.0
P P B o 10.0 R Y
W G T
A A A A A A A A A A A A A A A 233 333 3 3 3 3 3 4 4 4 4 9 0 1 234 5 6 7 8 9 0 123
UVER PESTICIDES
p P
1000.0
B 100.0 -t----------li'9f-----
o R y 10.0 +-----~I_&OO_-oo4I)OO---~-
W G T 1.0 -IMY<.¥!I------I!IA/----Jt¥,HA/'iI--I!Io'\I-I/',/l,/-I<'I.'\I-&".I-&'!I-II'AI-M-
A A A A A A A A A A A A A A A 2 3 3 3 3 3 3 3 3 3 3 4 4 4 4 9 0 1 2 3 4 5 6 7 8 9 0 1 2 3
10.0 P P B
o R
Page 7
SEDtlENT PCBs
y tO~~~~~~~~~~----
W G T
p P B
o R
100
A A A A A A 4 4 4 444 4 5 678 9
A A 5 5 o 1
STOMACH PCBs
y 10~~==~-~~~~~---
W G T
P P B
1000
A A A A A A 4 4 4 444 4 5 6 7 8 9
A A 5 5 o 1
UVEA PCBs
o 1OO+-----------j!}~----R Y
W 10~~~~~~~~~~~-G T
A A A 444 456
A A A A A 44455 7 890 1
Figure 2b. Concentrations of analytes within sample matrices (sediment pesticides, sediment PCBs, stomach pesticides, stomach PCBs, liver pesticides, liver PCBs) for Machias Bay.

Page 8
SEDIMENT PAHs
P P B
o R
100
y ~+---------~~+-=~~~~~
W G T
A A A A A A A A A A A A A A A A A A 111 1 1 1 1 1 1 222 2 2 2 222 1 2 345 6 7 8 9 0 123 4 5 678
STOMACH PAHs
p P B
o R y
W G T
1000
~+----------=~~~~-------
AAAAAAAAAAAAAAAAAA 111111111222222222 12345 678 9 0 1 2 345 6 7 8
SEDIMENT TEXTURE
'I.
D R Y
W G T
100
10+-----~~~~--
A L
F E
s c
S I
o c
SEDIMENT METALS
1000.00
p P 100.00 +--=---~.,----mf-----M
~ 1).00 +--m-l~~~";----!\b1!-"".cr----
Y
W G T
P
0.01 -.t=.=.l~=!J...LlI.lILI.&3.L=.l.MI...J.3=IJ....I.!..3.I..I.I!.II.LJ.!:.I!>L
10000.0
·A C C C N P Z T M A H S S S G D R U IBN L N S G E B N
STOMACH METALS
P 1000.0 +---------jK>*------M
~ 100.0 +-----------~~-------
Y
W G T
P P
10.0 +-----"'OO';I-----*"I-OO<l~f._-----
100.00
Ace C N P Z F M A H S S G D R U I 8 N ENS G E N
UVEA METALS
M 10.00 +--------------jm-ltM----------
o R y 1.00 +------~-----j~<;.blH~M_____{)<~-
W G T ~1O~~~~~~~~~**-~~
Ace C N P Z F M A H S S G D R U IBN ENS G E N
Figure 3a. Concentrations of analytes within sample matrices (sediment PAHs, sediment metals, stomach PAHs, stomach metals, sediment texture, liver metals) for Frenchmans Bay.

SEDIMENT PESTJOOES
1).0
P P B
D R Y tO~--~~------------------
W G T
A A A A A A A A A A A A A A A 2 3 3 3 3 3 3 3 3 3 3 4 444 9 0 1 2 3 4 5 6 7 8 9 0 1 2 3
STOMACH PESTICIDES
10.0
P P B
D R Y to~~~~--~~~~----~~
W G T
A A A A A A A A A A A A A A A 2 3 333 3 3 3 3 3 3 4 4 4 4 9 0 1 2 3 4 5 678 9 0 1 2 3
UVEA PESTICIDES
P P
1000.0
B 100.0 +-------------l9'.lI-------
o R y 10.0 +-----fIOO-£Ooo-&<:~1--EiOO___OO'G__
W G T 1.0 -fI.lI,!\I-lIIi'\I-----l.Y,j---II\t\I-li'lN-l".'Y-'.!Y\I--I.¥.H!\I\I-W~
A A A A A A A A A A A A A A A 2 3 3 3 3 3 3 3 3 3 3 4 4 4 4 9 0 1 2 3 4 5 6 7 8 9 0 1 2 3
)
100.0 P P B
Page 9
SEDtAENT PCBs
D ll.O f-----f.i"i('i5'\--------
R Y
W tO~WH~~~--~~~=-G T
100.0 P P 8
A A A A 4 4 4 4 4 5 6 7
A A A A 4 455 690 1
STOMACH PCBs
o ll.O -t6!'.('M-----l'.(!).!IM-l')~-----R Y
W tO~~~~~~~~~-~== G T
1000.0 P P
A A A A A 4 4 4 4 4 4 5 676
A A A 455 901
UVEA PCBs
B 100.0 f---------KXI<to>I-----
o R Y 10.0 +---"~~'I.l'H!Q9QQ-llQ\IW-Il~---
W ~ 1.0 +----Il~___M()~~~\l!-Mtl\M_Wll~!\?lII_
A A A A 4 4 4 4 4 5 6 7
A A A A 4 4 5 5 890 1
Figure 3b. Concentrations of analytes within sample matrices (sediment pesticides, sediment PCBs, stomach pesticides, stomach PCBs, liver pesticides, liver PCBs) for Frenchmans Bay.

Page 10
SEDIMENT PAHs
P P B
o R y
W G T
1000
~+----------Rb-~~~-------
A A A A A A A A A A A A A A A A A A 111111111222222222 1 2 3 4 5 6 7 8 9 0 123 4 5 678
STOMACH PAHs
p P B
o R y
W G T
1000
~O+----------R~~~~-------
AAAAAAAAAAAAAAAAAA 1 111 1 1 1 1 1 222 2 2 222 2
- 1 2 345 6 7 8 9 0 1 2 345 6 7 8
SEDIMENT TEXTURE
'I.
D R Y
W G T
100
A L
F E
S C
S I
o c
p P
1000.0
SEDIMENT METALS
M 100.0 +--.-rr----li9if--1X<4-----
o R y
W G T
P
0.1 --'=..-=.lZUL:QJJl!:l!J..C!Q~l.1'!:.4l.~~~~u.=
10000.0
Ace C N P Z T M A H S S S G 0 R U IBN L N S G E B N
STOMACH METALS
P 1000.0 +---------------,..,.,,-------M
o R Y
W G T
P P
100.0 +-------------=~----------
10.0 +-------WI------M\'II--t\Mf--M4~-----
1000.0
Ace C N P Z F M A H S S G 0 R U IBN ENS G E N
UVEA METALS
M 100.0 +-----~~»-----
o R y 10.0 +-----------~~1i--------
W G T 1.0 +-----I9:>4-------I9:>4-------i<X~~~)oI._____f*~
0.1 ..l.C!Qi:J...W:l.llI:.l!J.LQJ.LQ;u;Q~~O-l.ll.lu...LlUUJLJ~u.LJ!.lU Ace C N P Z F M A H S S G D RU IBN ENS G E N
Figure 4a. Concentrations of analytes within sample matrices (sediment PAHs, sediment metals, stomach PAHs, stomach metals, sediment texture, liver metals) for Penobscot Bay.
S8)IMENT PESllOOES
10.0
P P B
D R Y tO~~~----------~r-~-----
W G T
0.1..JJ<!.AL.J..l!,&~~"""-I.I"""-""ol!.I..l.!J~~~"""",-,""""'~""-
A A A A A A A A A A A A A A A 2 3 3 3 3 3 3 3 3 3 3 4 4 4 4 9 0 1 2 3 4 5 6 7 8 9 0 1 2 3
STOMACH PESTlaDES
100.0
P P B D 10.0 R Y
W G T
A A A A A A A A A A A A A A A 2 3 3 333 333 3 3 4 4 4 4 9 0 1 234 5 6 7 890 1 2 3
UVEA PESTICIDES
p P
1000.0
B 100.0 -1-----------------1<;0;4---------
D R Y
W G T
10.0 -1------------".,.,;r0041iOO-l)oo-~>+____OO(f-
A A A A A A A A A A A A A A A 2 3 3 3 3 3 3 3 3 3 3 4 4 4 4 9 0 1 2 3 4 5 6 7 8 9 0 1 2 3
100.0 P P 8
Page 11
SEDt£NT PCBs
o 1O.0-+---~~~-----R Y
W tO~*H~~~~~~~~~~ G T
p P B
o R
100
A 4 4
A 4 5
A 4 6
A 4 7
A 4 6
A 4 9
A 5 o
A 5 1
STOMACH PCBs
y 10~~--~~~~~~~------
W G T
p P B
o R y
W G T
1000
A A 4 4 4 5
A A 4 4 6 7
A A 4 4 6 9
A A 5 5 o 1
UVER PCBs
100+---------~~~~~------
A A A 444 456
A A 4 4 7 6
A A A 455 901
Figure 4b. Concentrations of analytes within sample matrices (sediment pesticides, sediment PCBs, stomach pesticides, stomach PCBs, liver pesticides, liver PCBs) for Penobscot Bay.
Page 12
SEDIMENT PAHs
1000
P P B
o R y
W G T
A A A A A A A A A A A A A A A A A A 111111111222222222 1 2 3 4 5 6 7 8 9 0 1 2 3 4 5 678
STOMACH PAHs
1000 p P B
o R y
W G T
AAAAAAAAAAAAAAAAAA 1 1 1 1 1 1 1 1 1 222 2 2 2 2 2 2 1 2 3 4 567 8 9 0 123 4 5 678
SEDIMENT TEXTURE
'/.
o R y
W G T
100
1O+----~1lI<'lf-_lA;¥,M---
A L
F E
s c
S I
o c
SEDIMENT METALS
1000.0
P P M100.0+--~-----f9'ir---m-----
o R y
W G T
P
0.1 J.CQ;J~=.L~=~l..llll=.J.25..!iJ...Il!..!J..1l,.lJ....I.2I.!J....I.&!!J.
10000.0
Ace C N P Z T M A H S S S G D R U I 8 N L N S G E 8 N
STOMACH METALS
P 1000.0 -+--------~----M
o R Y
W G T
P
100.0 +--------1i9'9!-l~-----
10.0 -+----_--~~)?iH)M----
0.1 J.llQ;u;;;l.U=I..la.l..l.lUU.llUU..1ii.il.L=..L.;I..l;J.j=.lJUlJ...l.iI.&I..l.<!.2IJ.
1000.00
Ace C N P Z F M A H S S G D R U IBN ENS G E N
UVEA METALS
P 100.00 +-------,"OVT-!'*1-------M
o R Y
W G T
10.00 +------J\iSlI-~-----
O.01-=l...Ll(Al..l.lUU.llUU.==-L.;I..l;J.j.i!i.3J..lUll~~5LJ..J.l!=
Ace C N P Z F M A H S S G D R U IBN ENS G E N
Figure Sa. Concentrations of analytes within sample matrices (sediment PAHs, sediment metals, stomach PAHs, stomach metals, sediment texture, liver metals) for Casco Bay.
SEDIMENT PESllCDES
p P B
10.0
o R y tO~~~~-=~--~*M~r----
W G T
OJ A A A A A A A A A A A A A A A 233 3 3 3 3 3 3 3 344 4 4 9 0 123 4 5 678 9 0 1 2 3
STOMACH PESTJaDES
100.0
P P B D 10.0 R Y
W to JlC¢!.J;XlI...-----,Q~---KiQj_W_~M_!\.!~h=_RXl_G T
~1 A A A A A A A A A A A A A A A 2 3 3 3 3 3 3 3 3 3 3 4 4 4 4 9 0 1 234 5 6 7 8 9 0 123
UVEA PESTICIDES
1000.0
P P B 100.0 +--------------~I__-----
o R ~--------~*M~~~*W~ Y 10.0
W G T 1.0
0.1 A A A A A A A A A A A A A A A 2 333 3 3 3 3 3 3 3 444 4 9 0 1 234 567 890 1 2 3
P P 8
Page 13
SEDtvENT PCBs
o R y 1OJ-----~00___C:9m__lX'X~'i'Y9)I-----
W G T
p P B
100
A A A A A A A A 4 4 4 4 4 4 5 5 4 567 890 1
STOMACH PCBs
o R y 1O-lU>i:!~~~~~~w_t'i'Y9)l-----
W G T
p P B
1000
A A 4 4 4 5
A A 4 4 6 7
A A A A 445 5 890 1
LIVER PCBs
o R y lOO+---~~~W_m~___:_-
W G T
lO~~~~~~~wuuw~~~
A A A 444 456
A A A A A 44455 7 890 1
Figure 5b. Concentrations of analytes within sample matrices (sediment pesticides, sediment PCBs, stomach pesticides, stomach PCBs, liver pesticides, liver PCBs) for Casco Bay.
Page .14
SEDIMENT PAHs
1000.0
P P B 100.0-l---------4?!~----J;I~---
D R V 10.0 -l-----~~~~<4__~'itH'i'4_
W G T
0.1 ..JJ::aOOJ::lL1.l::Ll=:.::ii::il.OOJCQ..l:loCl..lYl.=..r:=u::cu=:u::a
AAAAAAAAAAAAAAAAAA 111111111222222222 1 234 5 6 789 0 1 234 5 678
STOMACH PAHs
10000
P P B 1000 -l------------W-
D R V 1OO-l-------l44----t>i4-----f9l-
W ~ 1O-M.J~~-~~~:l-OOi~~~~-
AAAAAAAAAAAAAAAAAA 1 1 1 1 1 1 1 1 1 2 2 2 2 2 2 222 12345 6 7 8 9 0 123 4 5 678
SEDIMENT TEXTURE
100.0
'I.
D R 10.0 Y
W G T
A L
F E
s c
S I
o c
SEDIMENT METALS
1000.00
p P 100.00 +--------lii9i----M
~ 10.00 Y
W G T
0.01-=l.ll.ZJ..JL.ZJ..JIl.III..J.~I6LI.!!.~~l..JAI!.I~-"'G!...J~~
Ace C N P Z T M A H S S S G D R U IBN L N S G E B N
STOMACH METALS
100000.00
P 10000.00 -+------------£i!>1r----p
M 1000.00 -l---------J.?9'l------
~ 100.00 -l----------J<;4'h'991----
Y
P P
10.00 -+---~-~~~;.H><;4_---
1000.0
0.10 ~1-M4-W4-1X4{*tHXl4*~~_____1~*
0.01-=~.J.:Q;.U=..J;!QU.J.I;=!IJ...l.!>l!J..l.l\.2IJ~.=.J..&!.J...I<=
Ace C N P Z F M A H S S G D R U IBN ENS G E N
UVEA METALS
M 100.0 -l-------~-004-----
D R Y 10.0 -l-----I9\I!--~~-~---
W G T
0.1 ~l.lXlJ...c;o;:L!i:laJ~=.rl~=:!J...[lQ~~UlUU. Ace C N P Z F M A H S S G D R U IBN ENS G E N
Figure 6a. Concentrations of analytes within sample matrices (sediment PARs, sediment metals, stomach PAHs, stomach metals, sediment texture, liver metals) for the Merrimack River mouth area.
SEDtvlENT PESTlCDES
tOO P P B
o R y 0.10 -l*<'l~Wl1loOOi:~~**<l---004=17i*---
W G T
A A A A A A A A A A A A A A A 23333 3 3 3 333 4 4 4 4 9 0 1 2 3 4 5 678 9 0 123
STOMACH PESTICIDES
10.0
P P B
D R Y tO~~---~~~~-~~~-
W G T
A A A A A A A A A A A A A A A 2 3 3 3 3 3 3 3 3 3 3 4 4 4 4 9 0 1 2 3 4 5 6 7 890 123
UVEA PESTICIDES
P P
1000.0
B 100.0 +---------m~---
o R y 10.0 +-------I$if-moo.H~r.__M~~-
W G T 1.0 -lMM-------l<'I.')I--!I'J:l\HI~~_M_I~i:'II__\o1\c'!IH6:'Sf
A A A A A A A A A A A A A A A 2 3 3 3 333 3 3 3 3 4 4 4 4 9 0 1 234 567 890 1 2 3
10.0 P P B
o R
Page 15
SED~NT PCBs
y tO~~~~~~~~~&r~~-
W G T
10000.0 P
A A A A 4 4 4 4 4 567
A A A A 4 4 5 5 890 1
STOMACH PCBs
P B 1000.0 -f-------~~--
o R Y
100.0 +--------rJr=-~s.:t_iSi'!Oi'id_---
W G T
1000.0 P P
A A A A A A 4 4 4 4 4 4 4 5 6 7 8 9
A A 5 5 o 1
UVEA PCBs
B 100.0 +-------I'*M-/oi~i....i*I*_Il~~~-o R Y 10.0 +-~'6!\i'\I---I!'ll\Iw-t'Wif}-4!Sr:""l~~~~~
W ~ 1.0 -+"""''''''''--!!'~~~~~>1!-Meoo--~9-M<loM-
A A A A 4 4 4 4 4 5 6 7
A A A A 4 4 5 5 8 9 0 1
Figure 6b. Concentrations of analytes within sample matrices (sediment pesticides, sediment PCBs, stomach pesticides, stomach PCBs, liver pesticides, liver PCBs) for the Merrimack River mouth area.
Page 16
SEDIMENT PAHs
p P B
o R y
W G T
~
1000 +------~!I_OO1e<r___=---
AAAAAAAAAAAAAAAAAA 1 1 111 1 1 1 122 2 2 2 2 2 2 2 12345 678 9 0 1 2 3 4 5 678
STOMACH PAHs
P P B
o R y
W G T
1000
AAAAAAAAAAAAAAAAAA 111111111222222222 12345 678 9 0 1 2 345 6 7 8
SEDIMENT TEXTURE
l
o R y
W G T
100
1O-+----~~-l6&1M---
A L
F E
s c
S I
o c
S8)IMENT METALS
10000.0
P P 1000.0 +------j9l/f-----------M
2 100.0 +--M+-~~>t_~I__---
Y
W G T
10.0 +--W<l-!X/4I)~~4_~I_m--___ltW
100000.0
Ace C N P Z T M A H S S S G 0 R U IBN L N S G E 8 N
STOMACH METALS
P P 10000.0 M
o R Y
W G T
P P
1000.0 +---------j<,M------
100.0 +---!)OO-----£>OO-tioo-e.~---
1000.0
Ace C N P Z F M A H S S G 0 R U IBN ENS G E N
UVEA METALS
M 100.0 +------~-m------
o R y 10.0 +----ISM--~-fl.M:------
W G T 1.0 +=,------~-_tWI*94*94i'n'1__f'i&!_-~-
O.l..u..o.L>J...J.AAI. .......... u.AJ....I..:...o..L..L. ............. '-AJ.J.4 ............. ..............,......,...'U"O":"L..L.:..o.L Ace C N P Z F M A H S 5 G 0 R U I 8 N ENS G E N
Figure 7a. Concentrations of analytes within sample matrices (sediment PARs, sediment metals. stomach PAHs. stomach metals, sediment texture, liver metals) for Salem Harbor.
SEDIMENT PESTlCDES
100.0
P P B D 10.0 R Y
W G T
A A A A A A A A A A A A A A A 233 3 3 3 3 3 3 334 444 9 0 1 2 3 4 5 6 7 890 1 2 3
STOMACH PESTlCl)fS
p P B
100.0
D 10.0 R Y
W G T
A A A A A A A A A A A A A A A 233 333 3 333 3 4 4 4 4 9 0 1 2 3 4 5 678 9 0 123
UVal PESTICIDES
1000.0
P p B 100.0 +-------..-.-rf'.l\i\-f.i'ii\-l'i"i+---;;;;;;;----
o R y 10.0 -+=-----m~~~~~*_-
W G T 1.0 -1M-M------I.'X'5I----JIixl\I-M-l<'I6I-I1I~'I-M-&'\HiSi'\HI'ii'\I_
A A A A A A A A A A A A A A A 2 3 3 3 333 333 3 4 444 9 0 1 234 5 6 7 890 '1 2 3
p P B
D R
Page 17
SEDlJfNT PCBs
Y 1O+-~~r&~~~~YMMH~~-
W G T
p P B
A A A A A A A A 4 4 4 4 4 455 4 5 6 7 8 9 0 1
STOMACH PCBs
D 100 +-------I'R:.&+-l'~~)!\/f------R Y
W G T
p P B
D R
1000
A A A A A 4 4 4 4 4 4 5 678
A A A 455 9 0 '1
LIVER PCBs
Y 100 +------lr"l/'iI't4-l.w.riHi'li~~8-----
W G T
A A A 444 456
A A A A A 44455 78901
Figure 7b. Concentrations of analytes within sample matrices (sediment pesticides, sediment PCBs, stomach pesticides, stomach PCBs,liver pesticides, liver PCBs) for Salem Harbor.
Page 18
SEDIMENT PAHs
P P B
D R
10000
Y 1000 -i!'ii'l1~"!--M------=----l"i'tI'Yt------
W G T
AAAAAAAAAAAAAAAAAA 111111111222222222 1 2 3 4 5 6 7 8 9 0 1 2 3 4 5 6 7 8
STOMACH PAHs
10000
P P B
DlOOO R Y
W G T
AAAAAAAAAAAAAAAAAA 111111111222222222 123 4 5 678 9 0 123 4 5 678
SEDIMENT TEXTURE
'I.
o A y
W G T
100
1O-+----~lOO-~~--
A L
F E
s c
S I
o c
P P
1000.0
SEDLVENT METALS
M 100.0 +----\i'iN-R'i'il------l19iH1'i'\I--'o/'i/<r-----
o R y 10.0 +---&OO-~)OO-t)'M+w---------w~;r__--_&OO_
W G T 1.0 -1N\IIH'NI-~I'li9H~i'iII-l'I"l'r------I'r'i'I-I'i"o'!_rr._r___f'.i".i+_1\i91_
Ace C N P Z T M A H S S S G 0 R U IBN L N S G E B N
STOMACH METALS
100000.0
P p 10000.0 +-------------!'iM-----
M
o R Y
W G T
P P
1000.0 +----------liM-----
100.0 +--~=--~~~M_---
1000.0
Ace C N P Z F M A H S S G 0 R U I 8 N ENS G E N
UVEA METALS
M 100.0 +-------.....".~-----
o R y 10.0 +----M'\---N\o!!--I\M------
W G T 1.0 --I!"iI91----I'<>9I--+\l9I--f9'*-f9'*-I99!--I99!--!';>94--
Ace C N P Z F M A H S S G 0 R U IBN ENS G E N
Figure Sa. Concentrations of analytes within sample matrices (sediment PAHs. sediment metals. stomach PAHs, stomach metals, sediment texture, liver metals) for Boston Harbor.
SEDItvENT PESTlCDES
P P B
100.0
o 10.0 R Y
W G T
A A A A A A A A A A A A A A A 2 3 3 3 3 3 3 3 3 334 444 9 0 123 4 567 890 1 2 3
STOMACH PESTlClJES
P P B
100.0
o 10.0 R Y
W G T
A A A A A A A A A A A A A A A 2 3 3 333 3 333 3 4 4 4 4 9 0 1 234 5 6 7 8 9 0 123
UVEA PESTICIDES
p P B
D R Y
W G T
1000
A A A A A A A A A A A A A A A 2 3 3 3 3 3 3 3 3 3 3 4 444 901 234 567 890 1 2 3
p P B
o R y
W G T
P P B
D R Y
W G T
p
Page 19
SEDM:NT PCBs
noo~----~~~------------
10000.0
A A 4 4 4 5
A A 4 4 6 7
A 4 8
A A A A A 4 4 444 4 5 678
A 4 9
A 5 o
A 5 1
STOMACH PCBs
A A A 4 5 5 9 0 1
lIVER PCBs
P B 1000.0 +-----~~~_JM.:;~;.oot_-----
o R Y
W G T
A A A A A A 4 4 4 4 4 4 4 5 6 7 8 9
A A 5 5 o 1
Figure 8b. Concentrations of analytes within sample matrices (sediment pesticides, sediment PCBs, stomach pesticides, stomach PCBs, liver pesticides, liver PCBs) for Boston Harbor.

Page 20
SEDIMENT PAHs
P P B
D R
1000
Y ~~~------~~~~~~~---
W G T
A A A A A A A A A A A A A A A A A A 1 1 1 1 1 111 1 222 2 2 2 222 1 2 345 678 9 0 1 2 3 456 7 8
STOMACH PAHs
1000
P P B
D R Y
W G T
A A A A A A A A A A A A A A A A A A 111111111222222222 12345 6 7 8 9 0 1 2 345 678
~TEXTlft
I.
o R y
W G T
100
~+-------~~HM~----
A L
F E
s c
S I
o c
P P M
D R Y
W G T.
P P M
D R Y
W G T
SEDu..ENT METALS
1000.0
~.o
10.0
1.0
0.1 A C C C N P Z T M A H S S S G D R U I 8 N L N S G E 8 N
Metals in stomach contents
not measured in
1986 specimens
UVEA METALS
10000.0
'K)()O.O
100.0
10.0
to
0.1 A C C C N P Z F M A H S S G D R U I B N E N S G E N
Figure 9a. Concentrations of analytes within sample matrices (sediment P AHs, sediment metals, stomach P AHs, sediment texture, liver metals) for Quincy Bay.
SED~NT PESTJCI)ES
p P B
m.o
o 10.0 R Y
W 1.0 +-----~_f,{,.lf_~Mf..!~/!_Mo1I_f,{,.lf_Mi1_ G T
A A A A A A A A A A A A A A A 2 3 3 333 3 333 3 4 444 9 0 1 234 567 890 1 2 3
STOMACH PESTICIDES
p P B
m.o
o 10.0 R V
W G T
A A A A A A A A A A A A A A A 2 3 3 3 3 3 3 3 3 3 3 4 444 9 0 1 234 567 890 1 2 3
LIVER PESTICIDES
p P
1000.0
B 1OO.0+-----~~~----
o R y 10.0 -!M----v"I~_w;Ii*WH~w___~I_m-
W G T 1.0 -l&'\I-M-----.;:><~I_M_~Wl6:~rM1~~)I_M
A A A A A A A A A A A A A A A 2 3 333 333 3 3 3 4 4 4 4 9 0 1 2 3 4 5 6 7 8 9 0 123
p P B
D R Y
W G T
p P B
Page 21
SEDtENT PCBs
m+------~~~r------
1000
A A 4 4 4 5
A A A 444 678
A A A 455 901
STOMACH PCBs
o 'K)() ~rM__/I~~>M_t~~~~t__-
R Y
W G T
p P B
'0000
A A 4 4 4 5
A A A A A A 4 4 4 4 5 5 6 7 890 1
LIVER PCBs
o 1XlO +_--------t.~__Moe<M__o;~---R Y
W ~+-~~~~~~~~~~-G T
A A A 444 456
A A 4 4 7 8
A 4 9
A 5 o
A 5 1
Figure 9b. Concentrations of analytes within sample matrices (sediment pesticides, sediment PCBs, stomach pesticides, stomach PCBs, liver pesticides, liver PCBs) for Quincy Bay.
Page 22
SEDIMENT PAHs
P P
1000.0
B 100.0 +-------,.,.o-M+::==--n7';------
o R y 10.0 -\K4-1*\-,.=l'i?l----»I-I~>W;>4~~~'i4=;_
W ~ 1.0 --iMj~~-__Ml~:tOOli~I-M1:~~~
AAAAAAAAAAAAAAAAAA 111111111222222222 123 456 7 8 9 0 1 2 3 4 5 6 7 8
STOMACH PAHs
P P B
o R y
W G T
1000
A A A A A A A A A A A A A A A A A A 1 1 1 1 111 1 1 222 2 222 2 2 12345 6 789 0 1 2 345 6 7 8
SEDIMENT TEXTlitE
'I.
o R y
W G T
100
lO+----~~-1:?6€>o/lI---
A L
F E
s c
S I
o c
SEDLVENT ~T ALS
1000.0
P p M 100.0 +--------"R"l<lr----m-----
o ~ 10.0 +----lQ';I!.~!\I\II_l'~M-~~(!l__---W G T 1.0 +----Joi4'I-w-l~~~~~lj__-_,."..,_fO:'!
P
0.1 ~~=-r;Q;J.Jl!=ll.ll.lIJ....IlIl!J.JZ.l::J..J.:!.ZJ...I.IQ>J..J.2Iz.J..llS..!~
10000.0
Ace C N P Z T M A H S S S G 0 R U IBN L N S G E B N
STOMACH METALS
P 1000.0 +-------~)9\------M
o R Y
W G T
P P
100.0 +-------!'X9I-1~-----
10.0 +----.{>M-=-MI}-~~~---
0.1 ~l...I2C:!J~.L!:Xl.l.!::la.~CQJJ:lOOJ2Q!J.l~!QUll~;JU
1000.0
Ace C N P Z F M A H S S G D R U IBN ENS G E N
UVEA METALS
M 100.0 +-------oo;t-004---'------
o R y 10.0 +----MI!--~-I9\.1I--~---
W G T 1.0 +----~r__""TVVl40004~~~-~-
Figure lOa. Concentrations of analytes within sample matrices (sediment PARs, sediment metals, stomach PAHs, stomach metals, sediment texture, liver metals) for Buzzards Bay.
SEDtJENT PESTlOOES
10.0
P P B
o R y W+-~------------~--~-----
W G T
A A A A A A A A A A A A A A A 2 333 3 3 3 3 3 3 3 4 4 4 4 9 0 1 2 3 4 5 678 9 0 1 2 3
STOMACH PESllCI)ES
100.0
P P B o ':>.0 R Y
W G T
A A A A A A A A A A A A A A A 233 3 3 3 3 3 3 334 444 9 0 1 2 3 4 5 6 7 890 123
UVEA PESTICIDES
P P
1000.0
B 100.0 +--------f,l<,;+------
o R y 10.0 +------=o;---OO<H~»wOil_____m_,=_-
W G T 1.0 ~-M--~t---M_li~iJH,l!',!I,I-M-M_I:'I<'II_I1\i9_M_
A A A A A A A A A A A A A A A 2 3 333 333 333 4 4 4 4 9 0 1 2 3 4 5 6 789 0 1 2 3
100.0 P P B
Page 23
SEDt.£NT PCBs
D 10.0 +¥.!',..'~'Nh1l__M/':o!\I\__f:,!'B:.!'t--I'X~---t65M__--R Y
W tO~~~~~~~~~~~=rr G T
P P B
1000
A A A A 4 4 4 4 4 5 6 7
A A A A 4 4 5 5 890 1
ST~ACH PCBs
D 100 +-----::=~~~~H%!%o:t-----R y
W G T
P P B
10000
A A A 444 4 5 6
A A A A 4 445 7 8 9 0
A 5 1
UVEA PCBs
D 1000 -f--------M<:IM--~~----R Y
W 100 -f------;;:=~~m-~~ffi----G T
A A A A 4 4 4 4 4 5 6 7
A A 4 4 8 9
A A 5 5 o 1
Figure lOb. Concentrations of analytes within sample matrices (sediment pesticides, sediment PCBs, stomach pesticides, stomach PCBs, liver pesticides, liver PCBs) for Buzzards Bay.
Page 24
S8)~NT PAHs
P P
l)()().0
B '00.0 +-------1~»ffi*M<I*>#~f*t__-
o R y 10.0 -ll9l-l9H'Si'I-n:..---lSi'H9l-I:9HS'H9l-~i'l-l9lfM-PS:"l-I9H9t
W G T 1.0 -JOOj~8I-OO""",""oGOOfOO-I~:I-OO100f108l-OO00-£oGOOfOO
A A A A A A A A A A A A A A A A A A 1 1 1 1 1 1 1 1 1 2 2 2 2 2 2 2 2 2 1 2 3 4 5 6 7 8 9 0 1 2 3 4 5 6 7 8
STOMACH PAHs
P P B
o R y
W G T
tlOO
A A A A-A A A A A A A A A A A A A A 1 1 1 1 1 1 1 1 1 222 2 2 2 2 2 2 1 2 3 4 5 6 7 8 9 0 1 2 3 4 5 678
SEDtBlT TEXT~
Yo
o R Y
W G T
100
1O-t----~~-IeOOOO____--
A L
F E
s c
S I
o c
P P
mo.o SEDLVfNT ~TALS
M '00.0 +--......---________ ;;>;t--------1?X'll------
o R y 10.0 +---M4-e.oo--l)OO--£i*&M-------M+=::------
W G T 1.0~-~~~~~~~-~~~
0.1 ~L.J.=.~lA&.l~""'-U=.!A"'--"'""-"'"''''"''''''''_'''Alu.o..o..L_'''''''_ Ace C N P Z T M A H S S S G 0 R U IBN L N S G E 8 N
STOMACH METALS
100000.0
P P 10000.0 +----------ml-------M
o R y
W G T
P P
1000.0 +----------lS6'r-----
100.0 +-------~~oo___---
1000.0
Ace C N P Z F M A H S S G D R U I 8 N ENS G E N
UVEA ~TALS
M '00.0 +-----~Wi1'itll--------
D R Y 10.0 +---~-______15oM__1;'OO-_____f'OO__---
W G T 1.0 +----l'ii>li+-l99\-1~9'i'H9Ii'H'~______f'i/9l_::_-
O.l-=~~..I.l!.lI..l~ ........... _UlU.J..l!..O.LJ..l!..O.L .................... ....u..L.O.O.J.
Ace C- N P Z F M A H S S G D R U I 8 N ENS G E N
Figure lla. Concentrations of analytes within sample matrices (sediment PARs, sediment metals, stomach PARs, stomach metals, sediment texture. liver metals) for Narragansett Bay.
SEDM:NT PESllCIlES
P P B
o R
1l.0
y to~~~~--~~~~~~~~=
W G T
A A A A A A A A A A A A A A A 2 3 3 3 3 3 3 333 3 4 444 9 0 1 2 3 4 5 6 789 0 1 2 3
STOMACH PESTlCIDES
P P B
100.0
o 10.0 R Y
W G T
A A A A A A A A A A A A A A A 2 3 3 333 3 3 3 3 3 4 444 9 0 1 2 3 4 5 6 7 8 9 0 1 2 3
UVEA PESTICIDES
1000.0
P P B 100.0 +--------fi9I-----
D R Y 1l.0 +-----WHi"*«**II-tiOO-----::==___
W ~ tO~~--w~~~~ww~~~
A A A A A A A A A A A A A A A 2 3 3 3 3 3 333 334 444 9 0 1 234 567 890 123
P P B
1000
Page 25
SEDt.AENT PCBs
D 1lO +_----------l1!~-----
R Y
W 1l~00H~~~~~~~~~~G T
P P B
A A A 444 456
A A A A 4 4 4 5 7 890
A 5 1
STOMACH PCBs
o m +-------,i~~~---R Y
W G T
p P B
1000
A A A 444 456
A A A A 4 4 4 5 789 0
LIVER PCBs
o m+-~-~~~~~~~r-R y
W ~+-~~~WH~~~~~~~ G T
A A A 444 456
A A 4 4 7 8
A A 4 5 9 0
A 5 1
Figure lIb. Concentrations of analytes within sample matrices (sediment pesticides, sediment PCBs, stomach pesticides, stomachPCBs, liver pesticides, liver PCBs) for Narragansett Bay.
Page 26
SEDIMENT PAHs
P P B
100.0
D 10.0 R Y
W G T
A A A A A A A A A A A A A A A A A A 1 1 1 1 1 1 1 1 1 222 2 2 2 2 2 2 1 2 3 4 5 6 7 8 9 0 1 2 3 4 5 6 7 8
STOMACH PAHs
10000.0
P ~ 1000.0 +-----_w_-------
D R Y
W G T
100.0 +------Mi"i"!---l'i'W:.>HQ'I-----
AAAAAAAAAAAAAAAAAA 1 1 1 1 1 1 1 1 122 2 2 2 2 222 , 2 3 4 5 6 7 8 9 0 1 2 345 6 7 8
SEDIMENT TEXTLR:
100.0
'I.
~ 10.0 +--------IV~lt---Y
W G W~~~HHMH~~~-T
A L
F E
s c
S I
o c
SEDL'.£NT ~TALS
10000.00
~ 1000.00 -f------~+-----M
D R Y
W G T
100.00 +----------1'>M------
10.00 +---li>*==-v;>v#»iM--I~----
100000.0
Ace C N P Z T M A H S S S G D R U IBN L N S G E B N
STOMACH METALS
~ 10000.0 +-----------f'jI'----
M
D R Y
W G T
P P
1000.0 +------------l!i6i1-----
100.0 +---------.~~M_---
10.0 +----m-004------Il9:H~~~XI_--
0.1 ..lLl..!;.u;!.lI.l-=-ll!..lI.L.l.!lll!..L~~~u..J2I..lI"__=lJ2S..ilJ.J.25..3.l
1000.0
Ace C N P Z F M A H S S G 0 R U IBN .E N S G E N
UVEA ~TALS
M 100.0 +-----~~»-------
D R Y 10.0 +---I%i1--~~~__lSlSIl_--
W G T 1.0 +-~f_____-J«+=___I~~OO4_f<X4______+O>94_==_
0.1-=L1lI2U.J,.l;.lU.!l5:lUJ:UW:ULI.l~=lU.!ls;J<.LllS..lI~~
Ace C N P Z F M A H S S G 0 R U IBN ENS G E N
Figure 12a. Concentrations of analytes within sample matrices (sediment PARs, sediment metals, stomach PAHs, stomach metals, sediment texture, liver metals) for eastern Long Island Sound.
SEDLVENT PESllOOES
tOO P P B
o R y 0.10 +--------;:;o:;------j~=--
W G T
0.01 ~~~~~~~w..:.L~~""'_'A~ .......... A A A A A A A A A A A A A A A 2 3 3 3 3 3 3 3 3 3 3 4 4 4 4 9 0 1 2 3 4 5 6 7 8 9 0 1 2 3
STOMACH PESTJCI)ES
P P B
100.0
o 10.0 R Y
W G T
A A A A A A A A A A A A A A A 233 3 3 3 333 3 3 4 4 4 4 9 0 1 234 5 6 7 890 1 2 3
UVEA PESTICIDES
1000.0
P p B 100.0 +------------f',l<,:\------
D R Y 10.0 +------004~~)4000il_W1_W'tl1*_-
W G T 1.0 ~-1¥lI-____i!~~--&'lI-_I!\o!\H!'.!IH!'.!\I-W'>HMI~~W
A A A A A A A A A A A A A A A 2 3 3 3 3 3 3 3 3 3 3 4 4 4 4 9 0 1 2 3 4 5 6 7 8 9 0 1 2 3
10.0 p P B
D R
Page 27
SIDIvlENT PCBs
Y tO~Mr------~~~----------
W G T
p P B
1000
A 4 4
A 4 5
A 4 6
A 4 7
A 4 8
A 4 9
A 5 o
A 5 1
STOMACH PCBs
D ~+-------~~~~--------R Y
W 1O~WH~~~~~~~M-----G T
P P B
1000
A A A 4 4 4 456
A A A A 444 5 7 8 9 0
A 5 1
UVEA PCBs
o 100 +------~:6H~~~~j__----R Y
W n+-~~~~HW~~~~MM~~ G T
A A A A A 4 4 444 4 5 678
A A A 455 901
Figure 12b. Concentrations of analytes within sample matrices (sediment pesticides, sediment PCBs, stomach pesticides, stomachPCBs, liver pesticides, liver PCBs) for eastern Long Island Sound.
Page 28
SEDIMENT PAHs
P P B
D R
"k)()()
Y ~+---------~~~~~~~~
W G T
A A A A A A A A A A A A A A A A A A 111111111222222222 12345 6 7 8 901 2 345 6 7 8
STOMACH PAHs
P P
10000
B 1000 +---------w-------------
D R Y
W G T
AAAAAAAAAAAAAAAAAA 1 1 1 1 1 1 1 1 1 2 2 2 2 2 2 222 1 2 3 4 5 6 7 8 9 0 123 4 5 6 7 8
SEDIMENT TEXTLRE
Z
D R Y
W G T
100
1O+---------JOO.(~~oo-----
A L
F E
s c
S I
o c
P P
llOO.O
SEDIMENT METALS
M m.o +--{i7,)->9iI-----l?i4---{';4--------
D R Y 10.0 +----M\'}l:iM-l~~OO------M+------V'i'ii"
W G T 1.0 -Il'*I-=-lSt9I-l'i'i'H99H'i9H5\'X1------!S:'~<'I_--__=_w
10000.0
P
Ace C N P Z T M A H S S S G D R U IBN L N S G E B N
STOMACH METALS
P 1000.0 +------------~9*_------M
D R Y
W G T
P
100.0 +------"""'rI'ii'5Ij~f_______----
10000.0
Ace C N P Z F M A H S S G D R U IBN ENS G E N
UVEA METALS
P 1000.0 +---------------1"i"O't------M
~ 100.0 +---------f~M-----
Y
W G T
10.0 +----tm--~~~~~--
Ace C N P Z F M A H S S G D R U IBN ENS G E N
Figure 13a. Concentrations of analytes within sample matrices (sediment PAHs, sediment metals, stomach PARs, stomach metals, sediment texture, liver metals) for western Long Island Sound.

SEDt.ENT PESTlCl)ES
p P B
o R
"Xl.a
y ta+-~-------M~~~~M---~
W G T
O.l-=t..=.=..,=....i..!W..!.!~=!.Ll;\;,!I~~.=.i~=.J.!>lJ.
A A A A A A A A A A A A A A A 2 3 3 3 333 3 3 3 3 4 4 4 4 9 0 1 2 345 678 9 a 1 2 3
STOMACH PESTJCI)ES
p P B
100.0
o "Xl.O R Y
W G T
A A A A A A A A A A A A A A A 2 3 3 333 3 3 3 3 344 4 4 9 a 1 2 3 4 5 6 7 8 9 a 123
LIVER PESTICIDES
p P
1000.0
B 100.0 +-----------.._---/'i'Jlf------
o R y to.O -I-------".,,...---~I_bMbM-!~~~rW""""'"
W G T 1.0 -lII%I~-~h=-~~~~~~~
A A A A A A A A A A A A A A A 2 3 3 3 3 3 3 3 3 3 3 4 444 9 a 1 2 3 4 5 6 7 890 1 2 3
P P B
o R
Page 29
SEDtJ.ENT PCBs
y ~+-~~~~oooo~~~~----
W G T
P P B
o R
A 4 4
A 4 5
A 4 6
A 4 7
A 4 8
A 4 9
A 5 o
A 5 1
STOMACH PCBs
y no +-------/;9;)9Q....l;:>;>Q9;~;.;:q.....j~I__--
w G T
P P B
o R y
W G T
A A 4 4 4 5
A A 4 4 6 7
A A 4 4 8 9
A 5 o
A 5 1
LIVER PCBs
DOO+-----~~~------
A A A A 4 4 4 4 4 5 6 7
A A A A 4 4 5 5 890 1
Figure 13b. Concentrations of analytes within sample matrices (sediment pesticides, sediment PCBs, stomach pesticides, stomach PCBs, liver pesticides, liver PCBs) for western Long Island Sound.
Page 30
S8JIMENT IP AHs
p P B
o R
1000
y ~~~~----~~~~~~~~
W G T
A A A A A A A A A A A A A A A A A A 1 1 1 1 1 1 1 1 1 2 222 2 2 222 123 4 5 678 9 0 1 2 3 4 5 6 7 8
STOMACH PAHs
P P B
o R
1000
y ~+-~--~--~~~~~~~*-
W G T
A A A A A A A A A A A A A A A A A A 111 1 1 1 1 1 1 222 2 2 222 2 1 2 3 4 5 678 9 0 1 2 3 456 7 8
SEDIMENT TEXTLR:
'I.
D R Y
W G T
100
~+-------~~~~----
A L
F E
s c
S I
o c
p P
1000.0
S8JIMENT METALS
M 100.0 +----m-m--4i~W___1'i>;j_-------
D R Y 10.0 -l----W-m.1;,M.l!~M__R>?t_Ni~----_llM
W G T 1.0 -mH9Q\~OOi~~~-I'<'>!I-l9lx-m'h:o:-r1'i'l?!-l'i9f
10000.0
p
Ace C N P Z T M A H S S S G 0 R U I 8 N L N S G E B N
STOMACH METALS
P 1000.0 -l---------------4~--------~ M
~ 100.0 Y
W G T
p
10.0 +----M?l~--*4_00<}1004l~~-----
10000.0
Ace C N P Z F M A H S S G 0 R U I 8 N ENS G E N
UVEA METALS
P 1000.0 +-----------I'i:~----M
~ 100.0 +-------4'i<9H5<!'Xl------
y
W G T
10.0 +-----~-----1&OO-lm-:=_£'*______"..,.,_-
0.1 -=UlI.EJ:J..lU'..I.ll.lU.l4lJ..J.JI.lI.Luu;.J..J.z.z.,u.l!.Z.lll5..l'.W.""""""'<l\J..l.!=
Ace C N P Z F M A H S S G 0 R U I 8 N ENS G E N
Figure 14a. Concentrations of analytes within sample matrices (sediment PARs, sediment metals, stomach PARs, stomach metals, sediment texture, liver metals) for Raritan Bay.
SBlLVENT PESTlCDES
m.o P P B D 10.0 R Y
W G T
~1~~~~~~~~~~~~~
A A A A A A A A A A A A A A A 2 3 3 3 3 3 3 3 3 3 3 4 4 4 4 9 0 1 2 3 4 5 6 7 890 1 2 3
STOMACH PESTlCl)ES
P P
1000.0
B 100.0 -I----------1~____fiI'~--
D R Y 10.0 +-----~iM_~~~____flt4__
W G T 1.0 -IlIQ';I-II99-~~<4___lIS:'SfM_M-Im_Ii~~iI_M_M_
0.1 JJ6.1$J..J2Q!J..J.lQ;LJ.!S;l!:I..ruJ..J.lSl5J..J.!QlLll~~~IISJSJ...I.!=~ A AA A A A A A A A A A A A A 2 333 333 333 3 444 4 9 0 1 234 567 8 9 0 123
UVEA PESTICIDES
P P B
1000
D 100 R Y
W G T
A A A A A A A A A A A A A A A 2 3 3 3 3 333 3 3 344 4 4 9 0 1 2 3 4 567 890 1 2 3
P P B
1000
Page 31
SEIJt.fNT PCBs
o 100 ~----;o=-IQQQ~~~j-----R Y
W 1O~~~~~~~H*~~~= G T
P P B
o R
1000
A A 4 4 4 5
A 4 6
A A 4 4 7 8
A A 4 5 9 0
A 5 1
STOMACH PCBs
y 1OO+-~~~~~~~~w-----
W G T
P P B
o R y
W G T
10000
A A A A 4 4 4 4 4 5 6 7
A A A A 4 4 5 5 890 1
UVEA PCBs
1000 +----....rvvr-1VV'O'"vr-==-----
A A. A A 4 4 4 4 4 567
A A 4 4 8 9
A A 5 5 o 1
Figure 14b. Concentrations of analytes within sample matrices (sediment pesticides, sediment PCBs, stomach pesticides, stomach PCBs, liver pesticides, liver PCBs) for Raritan Bay.
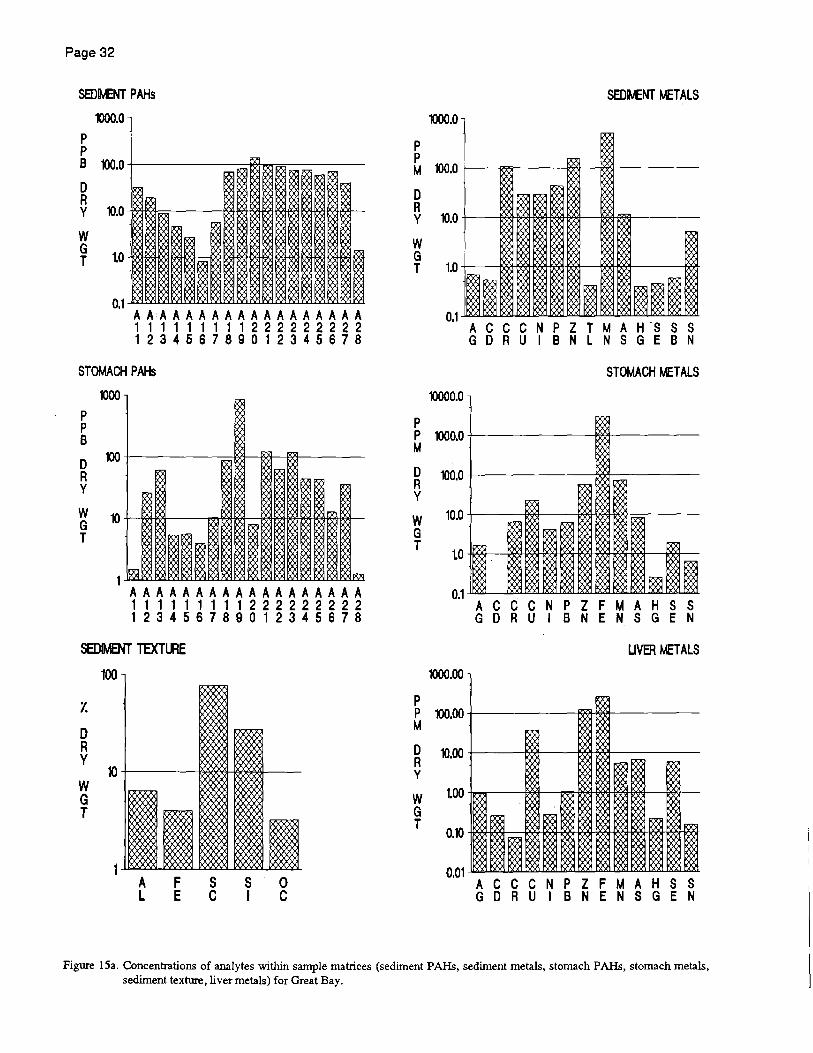
Page 32
S8JIMENT PAHs
1000.0
P P B '00.0 +---------;e+.o:..-=-----
o R y 10.0 -1I"rl1i91==-----AA-l'i'H'iI'l-M-~i'l_M.Jl'.lH'~1___
W G T 1.0 -fOO-IW1i''~OO_____wI-001~:H*oo*E;tOO_oo1i~1OO
A AA A A A A A A A A A A A A A A A 111111111222222222 123 456 789 0 1 2 3 4 5 6 7 8
STOMACH PAHs
P P B
o R y
W G T
1000
'OO+------~Mr~~~---
AAAAAAAAAAAAAAAAAA 1 1 1 1 1 1 1 1 1 222 222 2 2 2 123 456 7 8 9 0 1 234 5 6 7 8
SEDItJfNT TEXTrnE
'I.
D R Y
W G T
100
lO-t--------IM<:?MI--JeMM---
A L
F E
s c
S I
o c
P P
1000.0
SBlIMENT ~TAL5
M 100.0 -t--iO'X'ir-----IOiSl----I<'lOI-----
o R y 10.0 +---fi.M-l)oo-!\oo-bi'l<!-OOoil-----Moil~----
W G T 1.0 +---f'X'J'H'M-f\M-1'i/'>:'\-Mi'\---!'M~--____1'X'i\_
10000.0
P
Ace C N P Z T M A H -5 5 5 G 0 R U IBN L N S G E B N
5TOMACH ~TAL5
P 1000.0 +-----------;"i'9t-------
M
~ 100.0 +-----------;'><'Id------
Y
W G T
P
10.0 +---~------&~~~=-----
O.l-='-------..Ll\.l!..L~~UUUJ~"""'--.1~I!..2!..l.Jo"""'--1l""'-"'""-
ACe C N P Z F M A H S S G 0 R U IBN ENS G E N
UVEA ~TAL5
1000.00
P '00.00 -t------~>Wt------M
~ 10.00 +---~-_____I\M_f'J,3d-----
Y
W G T
Ace C N P Z F M A H 5 5 G 0 R U IBN ENS G E N
Figure 15a. Concentrations of analytes within sample matrices (sediment PAHs, sediment metals, stomach PAHs, stomach metals, sediment texture, liver metals) for Great Bay.
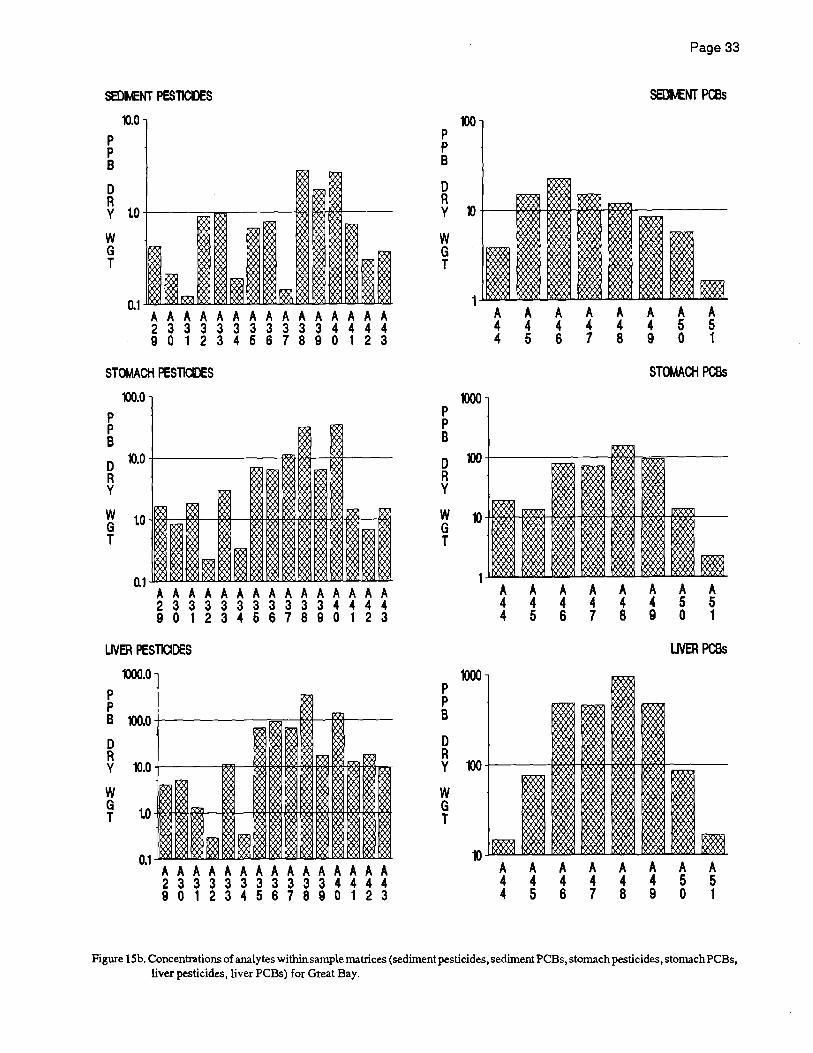
SEDM:NT PEST1CDES
p P B
o R
10.0
y to+-----~--------~~M-----
W G T
A A A A A A A A A A A A A A A 2 3 3 3 3 3 3 3 3 3 3 4 4 4 4 9 0 123 4 5 6 789 0 123
STOMACH PESTlOOES
p P B
100.0
o 10.0 R Y
W G T
A A A A A A A A A A A A A A A 233 333 3 3 3 3 3 4 444 9 0 1 2 3 4 5 6 7 8 9 0 1 2 3
UVEA PESTlCIDES
p P
m.o
B 100.0 +-----------=----Ir,;t,;\----f,l\,l---
o R y 10.0 +-----__ --Mlt-004l~OO-OO4*'lI-OO4-~..,
W ~ W~~~_w~~~~ww~~~
A A A A A A A A A A A A A A A 2 3 3 3 3 3 3 3 3 3 3 4 444 9 0 123 4 567 890 123
p P B
o R
Page 33
SEDl.£NT PCBs
y t)+-----':««I--t«*-':««f--Wi:o.?t-----
W G T
p P B
o R Y
W G T
p P B
D R
A A A 444 456
A A A A A 4 4 4 5 5 7 8 9 0 1
STMCH PCBs
1OO+------~~h=~---
A A 4 4 4 5
A A A A A 4 4 445 6 7 890
A 5 1
UVEA PCBs
Y 1)(} +-------W9i'll-.ltWj~I9i4-{l'i:9l"1_-----
W G T
A A 4 4 4 5
A A A 444 678
A A A 455 901
Figure iSb. Concentrations of analytes within sample matrices (sediment pesticides, sediment PCBs, stomach pesticides, stomachPCBs, liver pesticides, liver PCBs) for Great Bay.

Page 34
SEDIMENT PAHs
P P
1000.0
B 100.0 +-------------M.j--------
D R Y
W G T
0.1 ~t:JC1J::>ana.=..t::Li..I:::.::!.OC1l~:u::.a.=.:u::.a..t::aL=lllCl A A A A A A A A A A A A A A A A A A 1 1 111 1 1 1 1 222 2 2 2 2 2 2 1 234 5 6 7 890 1 234 567 8
STOMACH PAHs
P P B
1000
D 100 R Y
W G T
A A A A A A A A A A A A A A A A A A 111111111222222222 1 2 3 4 5 6 7 8 9 0 123 4 5 6 7 8
SEDIMENT TEXTURE
z o R y
W G T
100
1O+-----1:'X'>t~1i)MM---
A L
F E
s c
S I
o c
S8JLl.ENT ~TALS
1000.00
P P 100.00 +-------==--~f----M
D R Y
W G T
P
10.00 +--l?M-t~M-&i~>iI-~f-----
0.01lJ.lQ>1.=J.lI,!;.l.Q=~~=.i.2\lJ...Jl5=!J...I.!:.lo,L..1I!.AI..1AloL
1000.00
Ace C N P Z T M A H S S S G D R U IBN L N S G E B N
STOMACH ~TALS
P 100.00 +---------;.......,..j«+------M
~ 10.00 +----I\(l'j/j------1I9XH'SI9H~=_---
Y
W G T
P P
0.01-=J....L.!Ll..llS.liJl..!Z.Z.l..L2I.2IJ..J.lS.lU.~I.i5..!SJJ~.lI.2U..J.z.z.w."""-!2 ......
1000.0
Ace C N P Z F M A H S S G D R U IBN ENS G E N
UVER ~TALS
M 100.0 +------il'~<4-----
D R Y 10.0 +-----t;IQ!--~-tiI\II---I9Qi--......._-
W G T 1.0 +---~~___!~~~l'*-__l'>!9\_K>*
0.1 ..l.CIs::!:lI..!lOO..ooa..!lOO..J=-rlC!J..ll~=~a.r.u~1.lnl Ace C N P Z F M A H S S G D R U IBN ENS G E N
Figure 16a. Concentrations of analytes within sample matrices (sediment PARs, sediment metals, stomach PARs, stomach metals, sediment texture, liver metals) for Delaware Bay.
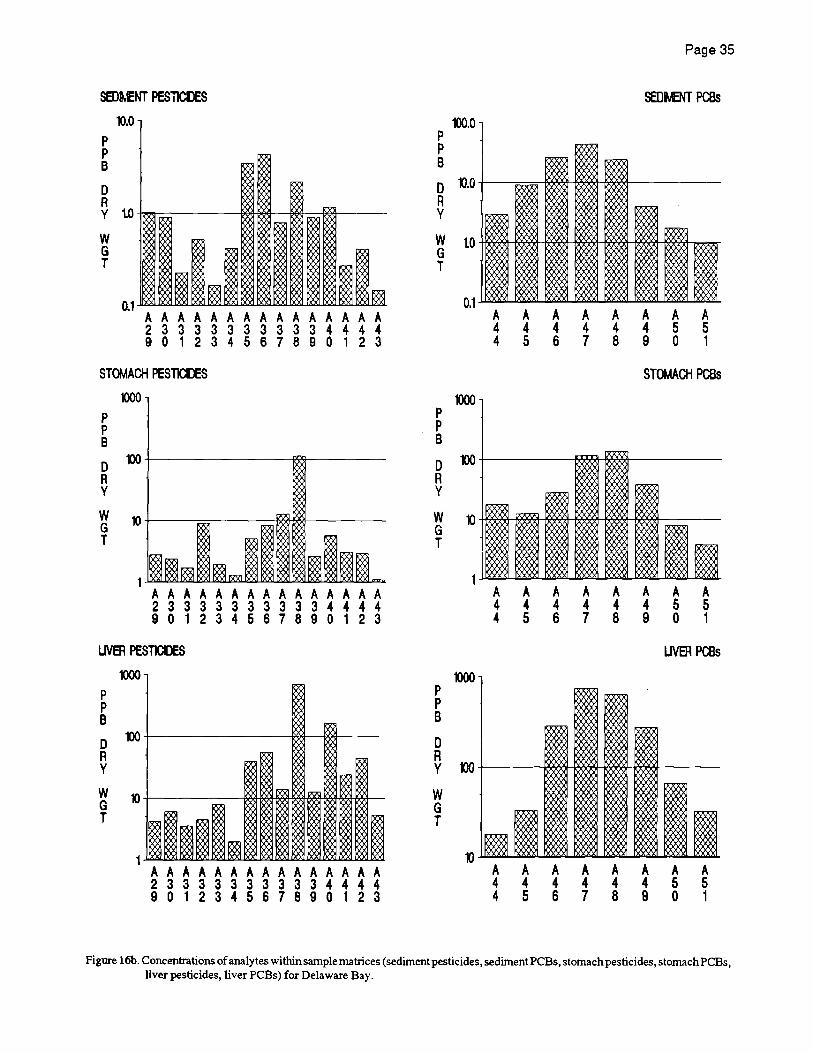
SEDtvENT PESTlCDES
10.0 P P B
o R y W~~------~»M~~~~-----
W G T
~1~~~~~~~~~~~~~~
A A A A A A A A A A A A A A A 2 333 3 3 3 333 3 4 444 9 0 1 2 3 4 5 678 9 0 1 2 3
STOMACH PESTlCl)ES
p P B
o R y
W G T
1000
~+---------------~--------
10+---~~------~~--------
A A A A A A A A A A A A A A A 2 3 3 3 3 3 3 3 3 3 3 4 444 9 0 1 234 5 6 7 8 9 0 1 2 3
UVEA PESTICIDES
P P B
o R y
W G T
1000
~+---------------~~w-----
A A A A A A A A A A A A A A A 2 3 3 3 3 3 333 3 344 4 4 9 0 1 234 5 6 789 0 123
m.o P P B
Page 35
SEDtJBfT PCBs
D n.o +------;=;--!\oi'X~~~~-----R Y
W tO~~~~~~~~*H~~~ G T
p P B
1000
A 4 4
A 4 5
A 4 6
A 4 7
A 4 8
A 4 9
STOMACH PCBs
D ~ +---------R'X'X'~~---------R Y
W 10~~**~~~~~~~---G T
P P B
o R
1000
A A A A 4 4 4 4 4 5 6 7
A A 4 4 8 9
A A 5 5 o 1
UVEA PCBs
y no +----k'X'iS:9--f>Xm-~l___f5')~---
W G T
A A A A A 4 4 444 4 5 678
A A 4 5 9 0
A 5 1
Figure 16b. Concentrations of analytes within sample matrices (sediment pesticides, sediment PCBs, stomach pesticides, stomach PCBs, liver pesticides, liver PCBs) for Delaware Bay.
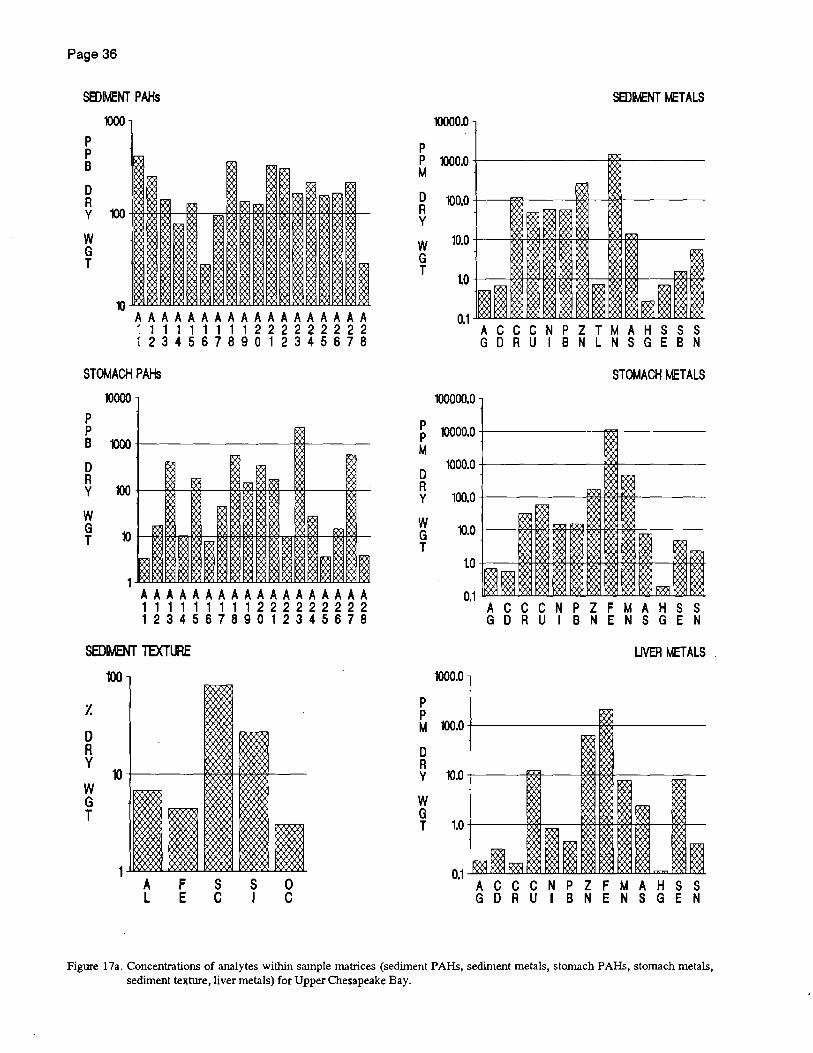
Page 36
SEDIM:NT PAHs
P P B
D R
1000
Y ~~~~~-=~~~~WN~~~
W G T
A A A A A A A A A A A A A A A A A A 111111111222222222 12345 6 7 8 9 0 1 2 345 678
STOMACH PAHs
P P
10000
B ~ -t-----------t<:>t-----
D R Y
W G T
AAAAAAAAAAAAAAAAAA 1 1 1 1 1 1 1 1 1 2 2 2 2 2 222 2 1 2 3 4 5 6 7 8 9 0 123 4 5 678
SEDIDT TEXTlftE
'I.
o A y
W G T
100
1O+-----I:'l<'>:'~~M---
A L
F E
s c
S I
o c
SEDLVCNT ~TALS
10000.0
P P ~o.o -t----------mr-----
M
D R Y
W G T
100.0 +--N"}5---~>t_~I------
10.0 +--K"H~N_W4_IXX)___-m-IIiW----
100000.0
Ace C N P Z T M A H S S S G D R U IBN L N S G E B N
STOMACH METALS
P P 10000.0 +----------rl7"7I-----
M
D R Y
W G T
P P
1000.0 +--------1\M------
100.0 -t---------I'!oM-{)oo-!>M-----
10.0 -t---li'V\I-i;l9';I--ii"i"IHi'W-tW-i/WV'w------
1000.0
Ace C N P Z F M A H S S G 0 R U IBN ENS G E N
UVEA ~TALS
M 100.0 +--------IXXI-------
o R y 10.0 -t-----I':6d---floM--b:1II------
W G T 1.0 +----l9'i1----=----f>:)<}H'i/9H'WH'm-------i"i9l--
Ace C N P Z F M A H S S G 0 R U IBN ENS G E N
Figure 17a. Concentrations of analytes within sample matrices (sediment PAHs, sediment metals, stomach PAHs, stomach metals, sediment texture, liver metals) for Upper Chesapeake Bay.
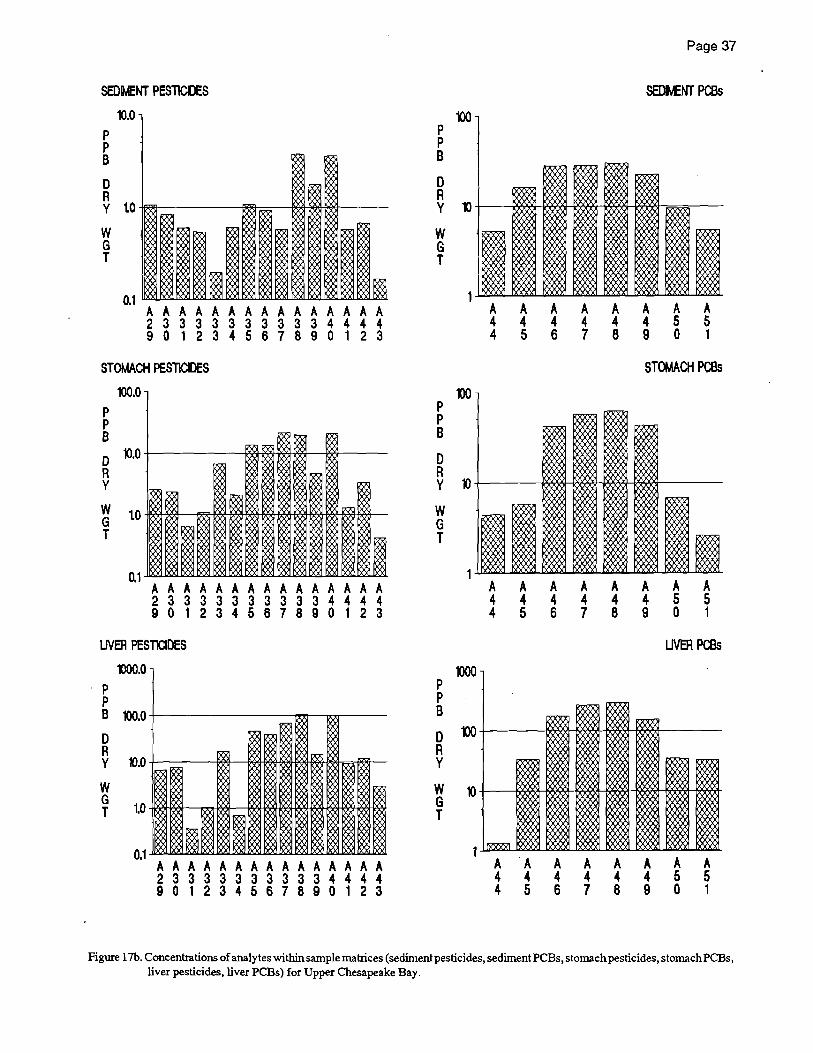
SEDIvlENT PESllCDES
p P B
o R
ll.O
y tO~--------~~~~~~-----
W G T
A A A A A A A A A A A A A A A 2 3 3 3 3 3 3 3 3 3 3 4 4 4 4 9 0 1 2 3 4 5 678 9 0 1 2 3
STOMACH PESTlCl)ES
p P B
m.o
o 10.0 R Y
W G T
A A A A A A A A A A A A A A A 2 3 3 333 3 333 3 4 4 4 4 9 0 1 234 5 6 7 8 9 0 123
UVER PESTlCIDES
p P
'000.0
B 100.0 +----------rl!"XIr--;~--
o R y 10.0 +----~~iit_____oo<:Ireoo_OO<H~*_W~~-
W G T 1.0 -/&')/-/t.¥)/----,,:n-&'II-----i<'\{)/-&"JHc.........,I':H/',.>>H6I'i-&."J1<"l<"!H:' ....
A A A A A A A A A A A A A A A 2 3 3 3 3 3 3 3 3 3 3 4 4 4 4 9 0 1 2 3 4 5 6 7 8 9 0 1 2 3
p P B
o R
Page 37
100
y ~+-~~~~~~~~~~~--
W G T
P P B
o R
100
A A 4 4 4 5
A A 4 4 6 7
A 4 8
A 4 9
A A 5 5 o 1
STOMACH PCBs
y 1O+-----~~~~~HMMr------
W G T
P P B
1000
A A A A A A A A 4 4 4 4 4 455 4 5 6 789 0 1
UVER PCBs
o 100 +---~)i'XI_!~\--I'i:o:~~~-R Y
W 1O+-~~~~~~~~~~~M G T
A A A A 4 4 4 4 4 5 6 7
A A 4 4 8 9
A 5 o
A 5 1
Figure 17b. Concentrations of analytes within sample matrices (sediment pesticides, sediment PCBs, stomach pesticides, stomachPCBs, liver pesticides, liver PCBs) for Upper Chesapeake Bay.

Page 38
SEDIMENT PAHs
P P 8
D R Y
W G T
10000
AAAAAAAAAAAAAAAAAA 1 1 1 111 1 1 1 2 2 2 2 2 2 222 123 4 5 6 7 8 9 0 1 2 3 4 5 6 7 8
SEDIMENT PESTICIDES
P P 8
100.0
D 10.0 -t-----------.l~---.-rr----
R y
W G T
A A A A A A A A .A A A A A A A 2 3 3 333 333 334 444 9 0 1 2 3 456 7 8 9 0 123
SEDIMENT TEXTIllE
'I.
o R y
W G T
100
1O-t------'Ie>E)OO€!--'Ie>E)OO€!--
A L
F E
s c
S I
o c
P P 8
D R Y
W G T
P P
1000.0
A A A A 4 4 4 4 4 5 6 7
SEDf.ENT PCBs
A A 4 4 8 9
A 5 o
A 5 1
SEDLVENT METALS
M 100.0 +---m-m----li9'lH/'it'JI-----J.."'X'ir-----
D R Y 10.0 +---f)OO+El4-t)OO-BoOO-I~~oo-f)OO_-~>4f)OO_
W G T
Ace C N P Z T M A H S S S G D R U IBN L N S G E B N
No fish specimens obtained
Figure 18. Concentrations of analytes within sample matrices (sediment P AHs, sediment metals, sediment texture, sediment pesticides, sediment PCBs) for Baltimore Harbor.

SEDtJENT P AHs
1000.0
P P B m.o o R y 10.0
W G T 1.0
0.1
~ ~~
8]B:8
I ~~ ~~ ~~ ~~ ~~ ~ ~~ ~~
~ ~~ ~ ~ ~ ~ ~~ ~~ ~ :X ~
~ ~~ ~~ X»Si g A A A A A A A A A A A A A A A A A A 1 1 1 1 1 1 1 1 1 2 2 2 2 2 2 2 2 2 1 234 567 890 1 234 5 678
SEDtJENT PEST1CDES
to p p B
o R y
W G T
0.1-"""" ...................... ""'"-' ............. """-"'.........". .......... ""-""' ......... '-"""".....,..."""""'-'....,... A A A A A A A A A A A A A A A 2 333 3 333 3 3 344 4 4 90123 456 7 8 9 0 1 2 3
SErnVBfT TEXT~
'I.
o R y
W G T
100
1O+------l!'leI~~M---
A L
F E
s c
S I
o c
p P B
0 R Y
W G T
P P M
o R Y
W G T
Page 39
SEDtvENT PCBs
10.0
to
0.1 A A A A A A A A 4 4 4 4 4 4 5 5 4 5 6 7 8 9 0 1
SEDL\ENT ~T ALS
1000.00
100.00
10.00 +---I'.<YH~M-I';.'YHYid---~I------
0.01 -"""""""""'-""""-''''''''-''''''''"''''''''-''''':.u.:.:''-'''''''''''''''''"~'''''''-''''''''-'''=
Ace C N P Z T M A H S S S G 0 R U IBN L N S G E B N
No fish specimens obtained
Figure 19. Concentrations of analytes within sample matrices (sediment P AHs, sediment metals, sediment texture, sediment pesticides, sediment PCBs) for Mid Chesapeake Bay.
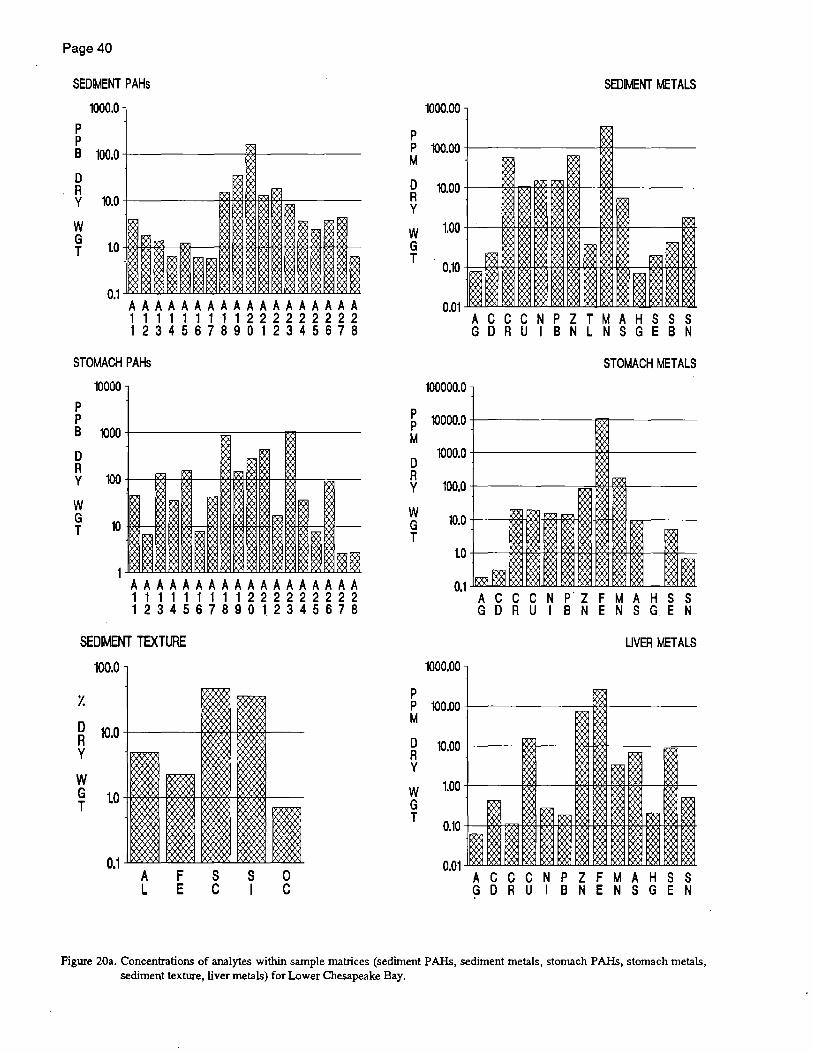
Page 40
SEDIMENT PAHs
P P
1000.0
B 100.0 +-------M+------
o R y 10.0 +-----t94l'l<'l-l9l-lS'H'i:'l-=----
W G T to -IOO1I*1-i:?€I---OO---oo-J9€ffi<~l*H)o€tOOfOOl:~:t__
A A A A A A A A A A A A A A A A A A 1 1 1 1 1 1 1 1 1 2 2 2 2 2 2 2 2 2 1 234 567 890 1 2 3 4 567 8
STOMACH PAHs
p P
10000
B 1000 +------=----00-----
o R y
W G T
AAAAAAAAAAAAAAAAAA 1 1 1 1 1 1 1 1 1 2 2 2 2 2 2 2 2 2 1 2 3 4 5 6 7 8 9 0 123 4 5 678
SEDIMENT TEXTURE
100.0
I.
~ 10.0 +-------1r.xt'i'i/'il--f;"N'i'ii\--
y
W G tO~HW~~~~~~-T
A l
F E
s c
S I
o c
SEDIMENT METALS
1000.00
P P 100.00 +--------1991-----
M
o R Y
W G T
too +--I1W-II~t'iI_W~l___-m-m----___m
0.01 ~.JU.L~~~~~.JU.L~~~~ Ace C N P Z T M A H S S S G D R U IBN L N S G E B N
STOMACH METALS
100000.0
~ 10000.0 +--------J'V'i'!----
M
D R Y
W G T
P
1000.0 +----------{',M-----
100.0 +----------==-flM-floM----
1000.00
Ace C N P' Z F M A H S S G D R U IBN ENS G E N
UVEA METALS
P 100.00 +-_____ ----.J~-----M
~ 10.00 +----f:6<'t--~I'>6d_--____;;=_
Y
W G T
tOO -t----E>OO--t'>OO-Il*41m-1)oo----£"*--
Ace C N P Z F M A H S S G D R U IBN ENS G E N
Figure 20a. Concentrations of analytes within sample matrices (sediment PAHs, sediment metals, stomach PAHs, stomach metals, sediment texture, liver metals) for Lower Chesapeake Bay.
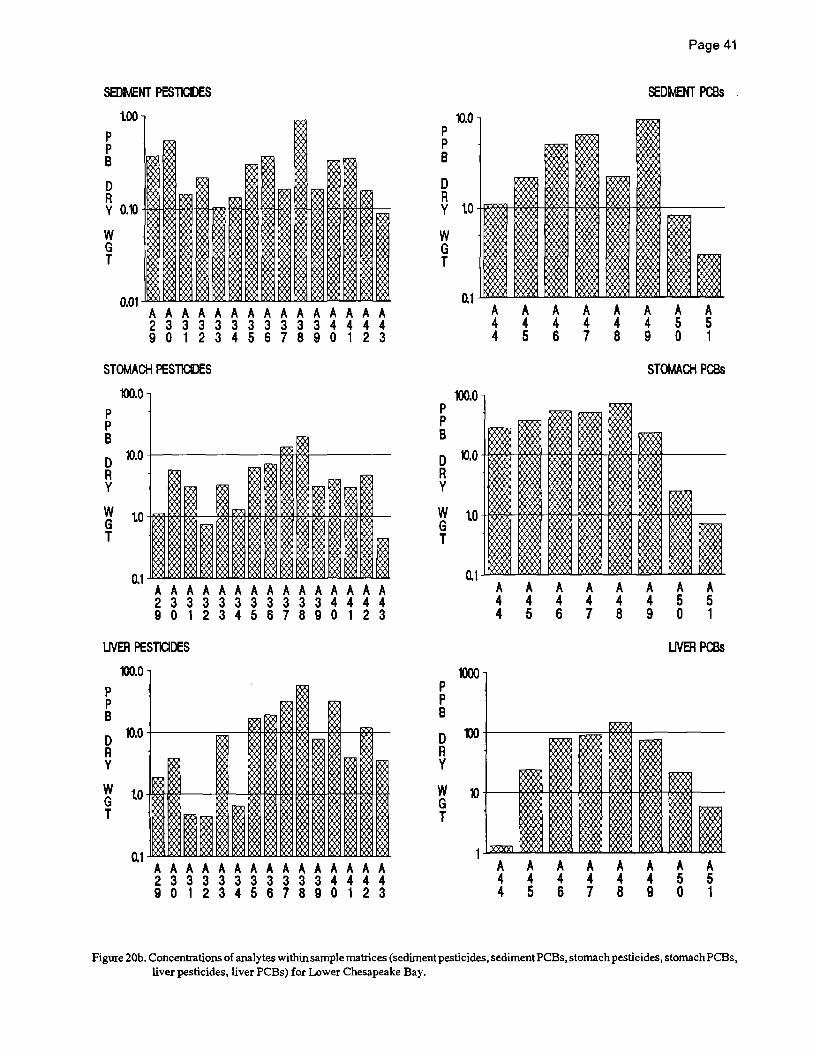
SEDL\ENT PESTlCDES
tOO P P B
o R y 0.10 ~-M4~~~~H\OO~~~~~l--
W G T
A A A A A A A A A A A A A A A 2 3 3 3 3 3 3 3 3 3 3 4 4 4 4 9 0 123 4 5 6 789 0 123
STOMACH PESllOOES
100.0
P P B o 10.0 R Y
W G T
A A A A A A A A A A A A A A A 233 333 3 3 3 3 344 4 4 9 0 1 234 5 6 7 8 9 0 123
UVEA PESTICIDES
p P B
100.0
o 10.0 R Y
W G T
A A A A A A A A A A A A A A A 2 3 3 333 3 3 3 3 3 4 4 4 4 9 0 1 234 5 6 7 8 9 0 1 2 3
10.0 P P 8
o R
Page 41
SEDt.£NT PCBs .
y tO~~~~~ww~~~~-----
W G T
100.0 p P B
A A A A A A A A 4 4 444 455 4 5 678 901
STOMACH PCBs
o 10.0 ~1)!Qf-~~~~9HI<~-,IQQ!M----R Y
W to~~~~~~~~~~~-G T
p P B
A A 4 4 4 5
A A 4 4 6 7
A 4 8
A 4 9
A A 5 5 o 1
LIVER PCBs
o 1OO+-----==~~------R Y
W G T
A A 4 4 4 5
A A 4 4 6 7
A 4 8
A A 4 5 9 0
A 5 1
Figure 20b. Concentrations of analytes within sample matrices (sediment pesticides, sediment PCBs, stomach pesticides, stomachPCBs, liver pesticides, liver PCBs) for Lower Chesapeake Bay.
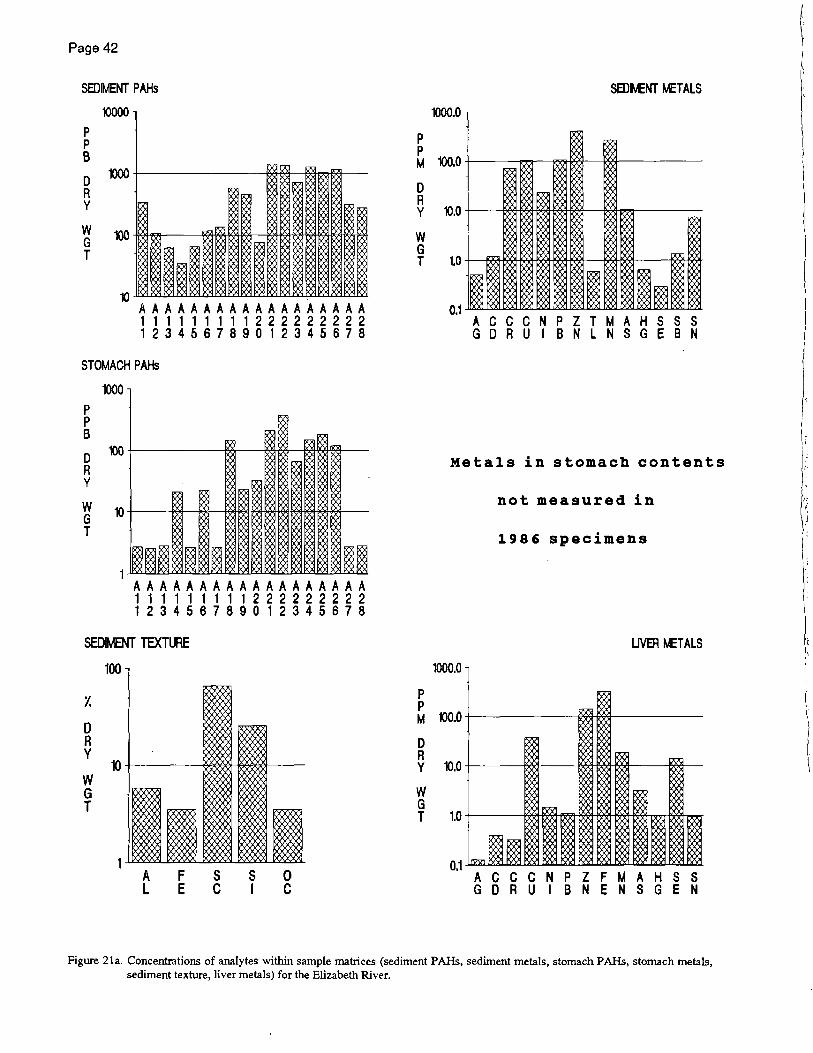
Page 42
SEDIMENT PAHs
P P B
D R Y
W G T
10000
1000 +-------~l_M_______I':oi'l_=_OO_-
~~aw~~~~~==~~w=~==
AAAAAAAAAAAAAAAAAA 111111111222222222 123 4 5 6 7 8 9 0 1 2 3 4 5 678
STOMACH PAHs
1000 p P B
D R Y
W G T
A A A A A A A A A A A A A A A A A A 1 1 1 1 1 1 1 1 1 2 2 222 2 2 2 2 1 2 3 4 5 6 789 0 1 234 5 678
SEDIMENT TEXTlllE
'/.
o A y
W G T
100
A L
F E
s c
S I
o c
P P M
D R Y
W G T
P P M
D R Y
W G T
SEDtJENT METALS
1000.0
100.0
10.0
1.0
0.1 Ace C N P Z T M A H 5 S 5 G D R U I B N L N S G E B N
Metals in stomach contents
not measured in
1986 specimens
UVEA METALS
1000.0
100.0
10.0
1.0
0.1 A C C C N P Z F ~ A H S S G D R U I B N E N S G E N
Figure 21a. Concentrations of analytes within sample matrices (sediment PAlls. sediment metals, stomach PAlls, stomach metals, sediment texture, liver metals) for the Elizabeth River.
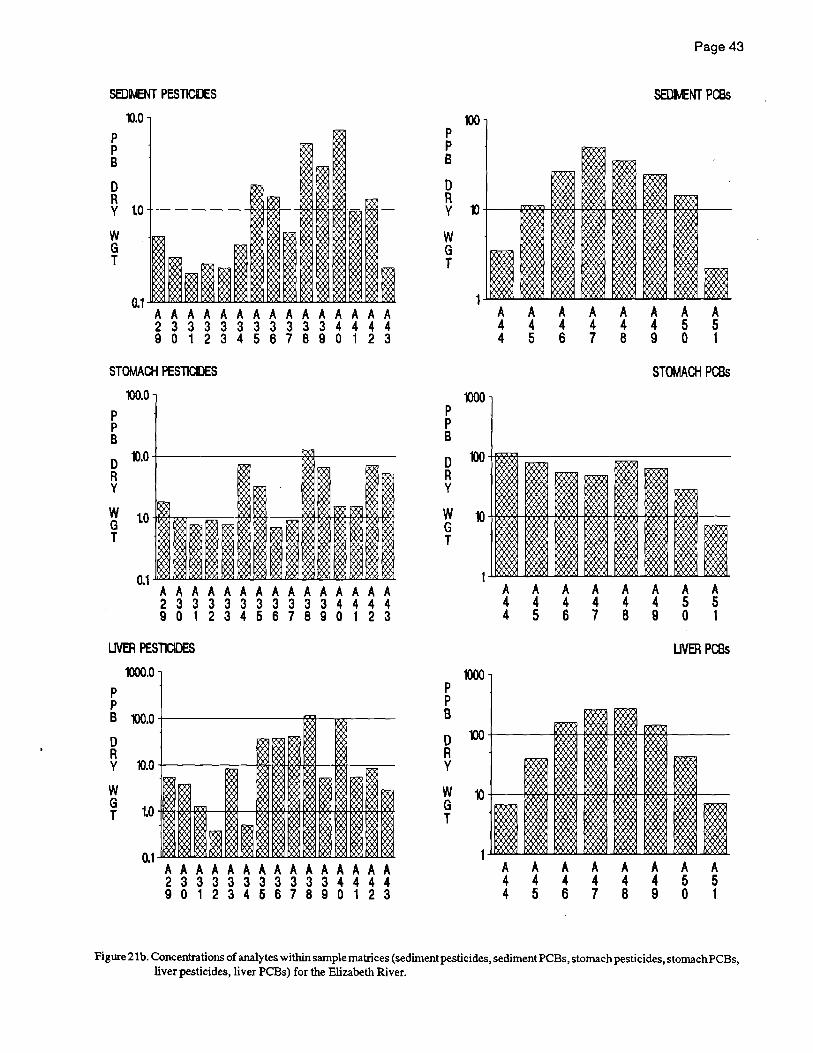
SEDM:NT PESTICIlES
10.0
P P B
o R y to+---------~~~~~~~OO--
W G T
0.1 ~..I.II.lo.I.~~~.IW4I11.1Al\l..lAl>.L.Io!.loj..l.ll.lo.l..IAtoj,J..:..:.w.~"'" A A A A A A A A A A A A A A A 2 3 3 3 3 3 3 3 3 3 3 4 4 4 4 9 0 1 2 3 4 5 6 7 8 9 0 1 2 3
STOMACH PESTICIDES
P p B
100.0
o 10.0 R Y
W G T
A A A A A A A A A A A A A A A 2 3 333 3 3 3 3 3 3 4 444 9 0 1 234 567 890 1 2 3
lJVER PESTICIDES
1000.0
P P B 100.0 +----------mf-rn:r---
o R y
W G T
A A A A A A A A A A A A A A A 2 3 3 3 3 3 3 3 3 3 3 4 4 4 4 9 0 1 234 567 8 9 0 123
p P B
o R
100
Page 43
SEDtJENT PCBs
y 1O+-~~~~~~~HMMrWW~--
W G T
p P B
1000
o 100 R Y
W G T
p P B
o R y
W G T
A 4 4
A 4 5
A 4 6
A 4 7
A 4 8
A A A A A 4 4 444 4 5 6 7 8
A A A A A 4 4 444 4 5 678
A 4 9
A 5 o
A 5 1
STOMACH PCBs
A A 4 5 9 0
A 5 1
UVER PCBs
A A 4 5 9 0
A 5 1
Figure 21 b. Concentrations of analytes within sample matrices (sediment pesticides, sediment PCBs, stomach pesticides. stomach PCBs, liver pesticides, liver PCBs) for the Elizabeth River.
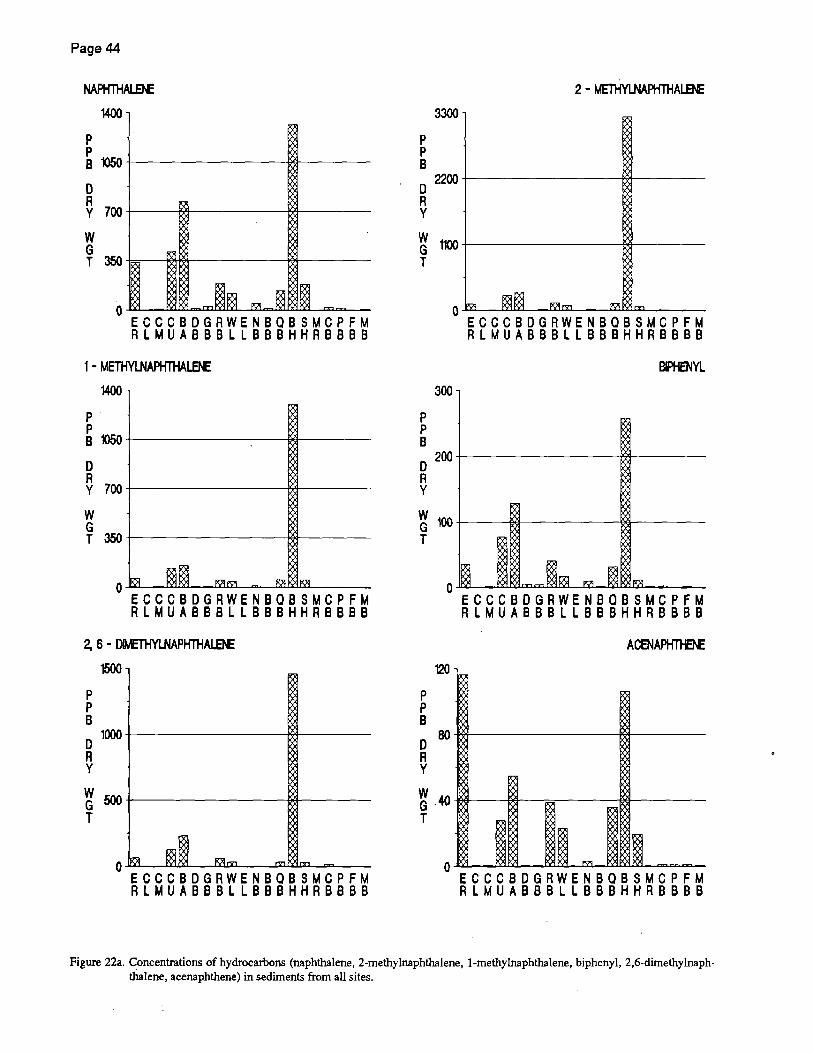
Page 44
NAPHlHALEN:
P P
1400
B 1050 +_--------l*1r-----
D R Y 700+--~~----_Mr_---
W G T ~~-~~----~~---
ECCCBDGRWENBOBSMCPFM RLMUABBBLLBBBHHRBBBB
1 - METHYL.NAPHTHALEt£
P p
1400
B 1050 +_--------l*1r-----
D R Y 700+---------Mr_---
W G T ~+--------~r-------
ECCCBDGRWENBOBSMCPFM RLMUABBBLLBBBHHRBBBB
2, 6 - I».£THYl.NAPHTHALEt.£
P P B
1500
D 1000
R Y
~ ~+---------OOr_--T
ECCCBDGRWENBOBSMCPFM RLMUABBBL LBBBHHRBBBB
P P B
3300
o 2200 R Y
2 - METHYLNAPHTHAJB.E
W ~+-_______ ~ ___ __ G T
P p B
300
D 200 R Y
o~--~~~~--~~~------
ECCCBDGRWENBOBSMCPFM RLMUABB8LL888HHR888B
~ 100 +_------;;>(I-----------J;><;);------
T
P P B
120
D 80 A Y
ECCCBDGRWENBQBSMCPFM R LMUABB8 L L 8BBHHR8888
ACENAPHn£NE
~.~~--1~~~--~~---T
ECCCBDGRWENBOBSMCPFM RLMUABB8LLB88HHR8888
Figure 22a. Concentrations of hydrocarbons (naphthalene, 2-methylnaphthalene, I-methylnaphthalene, biphenyl, 2,6-dimethylnaphthalene, acenaphthene) in sediments from all sites.
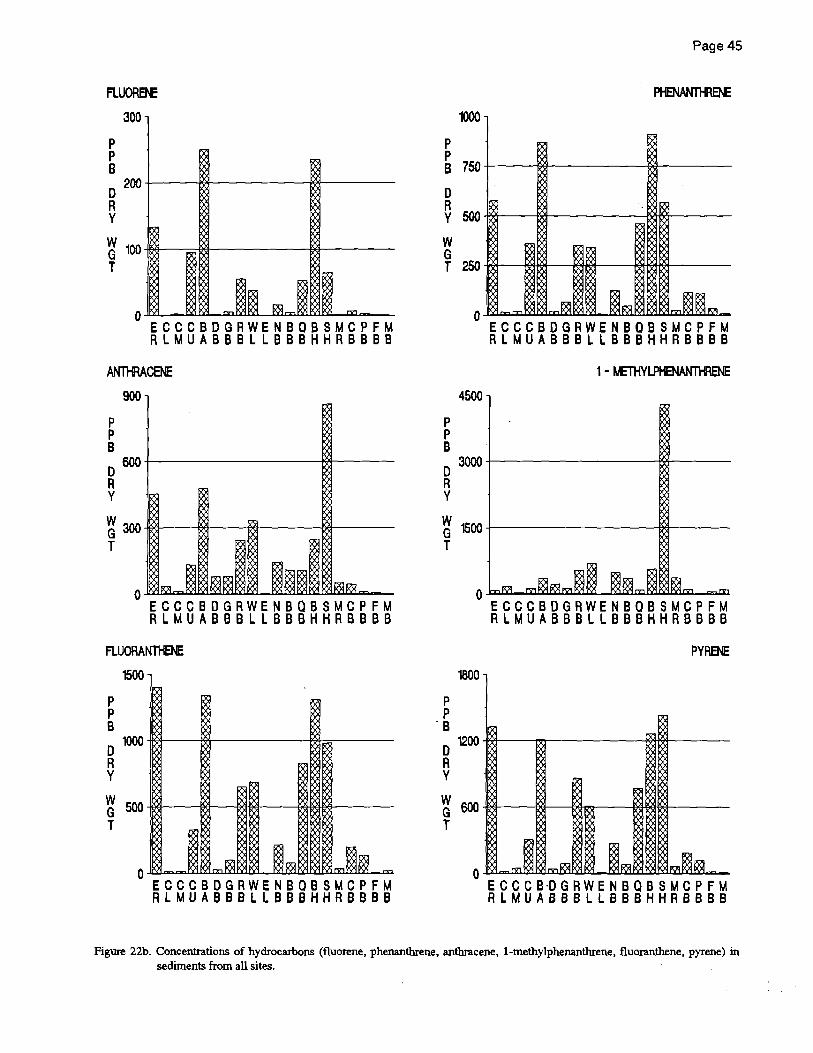
FLlJOR&£
300
P P B o 200 R Y
~ 100 -lM---=i:~------fjEot---T
ECCCBOGRWENBOBSMCPFM RLMUABBBLLBBBHHRBBBB
ANnmCENE
900
p P B o 600 R Y
~ 300 -lOO---4;~--OO-----OO---T
ECCCBOGRWENBQBSMCPFM RLMUABBBLLBBBHHRBBBB
FLUORANTHENE
1500
p P B o 1000 R Y
~ ~~-~~-OO~-~ffiffi~---T
ECCCBOGRWENBOBSMCPFM RLMUABBBLLBBBHHRBBBB
P P
Page 45
B 750 +----~~-----M-----
o R Y ~~--~~------~~-----
W G T 250 -1i<*---~>4--~ft€+-----*~<'t------
p P B
4500
03000
R Y
ECCCBDGRWENBOBSMCPFM RLMUABBBLLBBBHHRBBBB
~ ~OOr---------OOr--T
P P
- B
1800
o 1200 R Y
ECCCBOGRWENBOBSMCPFM RLMUABBBLLBBBHHRBBBB
PYRENE
~ ~~-~r--Mmr-~~~--T
E C C C B'O G R WEN B Q B S M C P F M RLMUABBBLLBBBHHRBBBB
Figure 22b. Concentrations of hydrocarbons (fluorene, phenanthrene, anthracene, I-methylphenanthrene, fluoranthene, pyrene) in sediments from all sites.
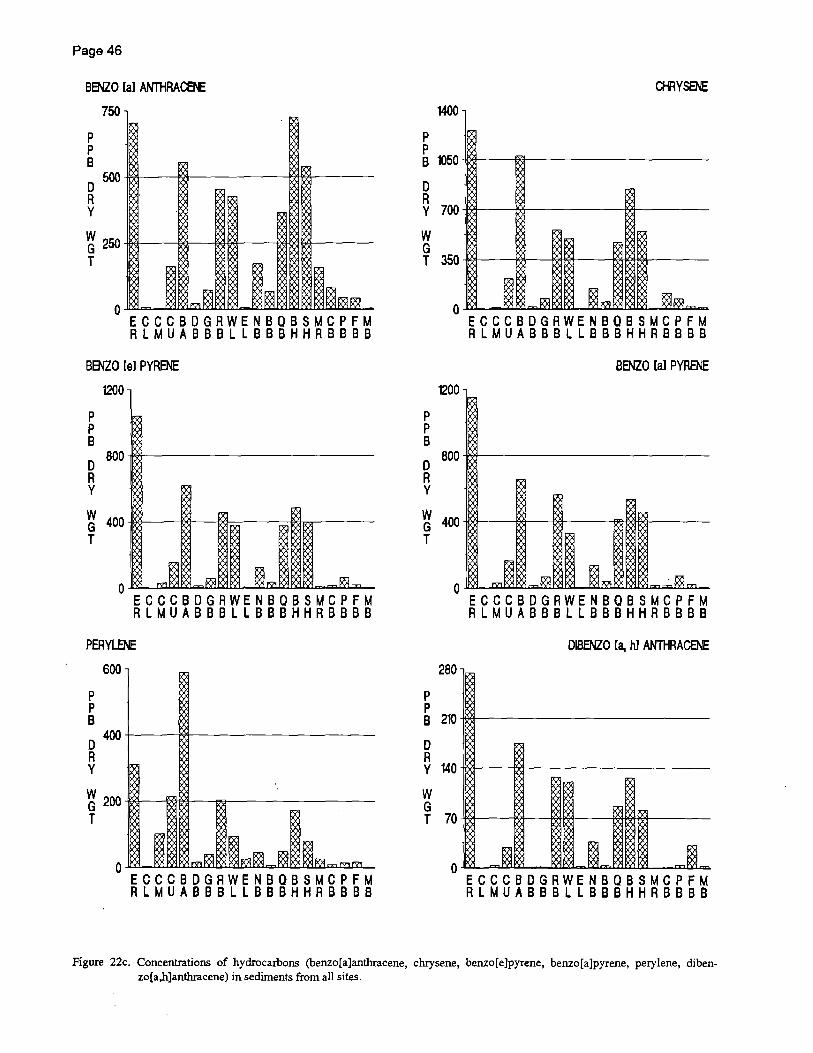
Page 46
BENZO [aJ ANTliRAce£
P P B
750
0500
R Y
~ 250 -lM---!;~~<lOO--~~--T
ECCCBOGRWENBOBSMCPFM RLMUABBBLLBBBHHRBBBB
BENZO [e] PYRENE
P P B
1200
o 800 R Y
W 400~--~~~*=--~~~---G T
ECCCBOGRWENBOBSMCPFM RLMUABBBLLBBBHHRBBBB
PERYLENE
P P B
600
o 400 R Y
~ 200 -;OO---oo100---~---------T
ECCCBOGRWENBOBSMCPFM R L M U AS B B L L B B B H H R B B B B
P p
1400
~YSENE
B ~50~-~r----------
o R Y 700 -iM-----!~----~'-':l-------
W G T ~~-~~~~r---~~~-----
P P B
1200
o 800 R Y
ECCCBOGRWENBOBSMCPFM RLMUABBBLLBBBHHRBBBB
BENZO [aJ PYRENE
~ 400~-~~~~--~~-----T
P P
280
ECCCBDGRWENBOBSMCPFM RLMUABBBLLBBBHHRBBBB
DIBENZO [a, h1 ANTliRACENE
B 2ID~-----------------
D R Y ~O~--~~----------
W G T 70~-~~~~~-~~~---
ECCCBDGRWENBOBSMCPFM RLMUABBB L L BBBHHRBBBB
Figure 22c. Concentrations of hydrocarbons (benzo[a]anthracene, chrysene, benzo[e]pyrene, benzo[a]pyrene, perylene, dibenzo[a,h]anthracene) in sediments from all sites.
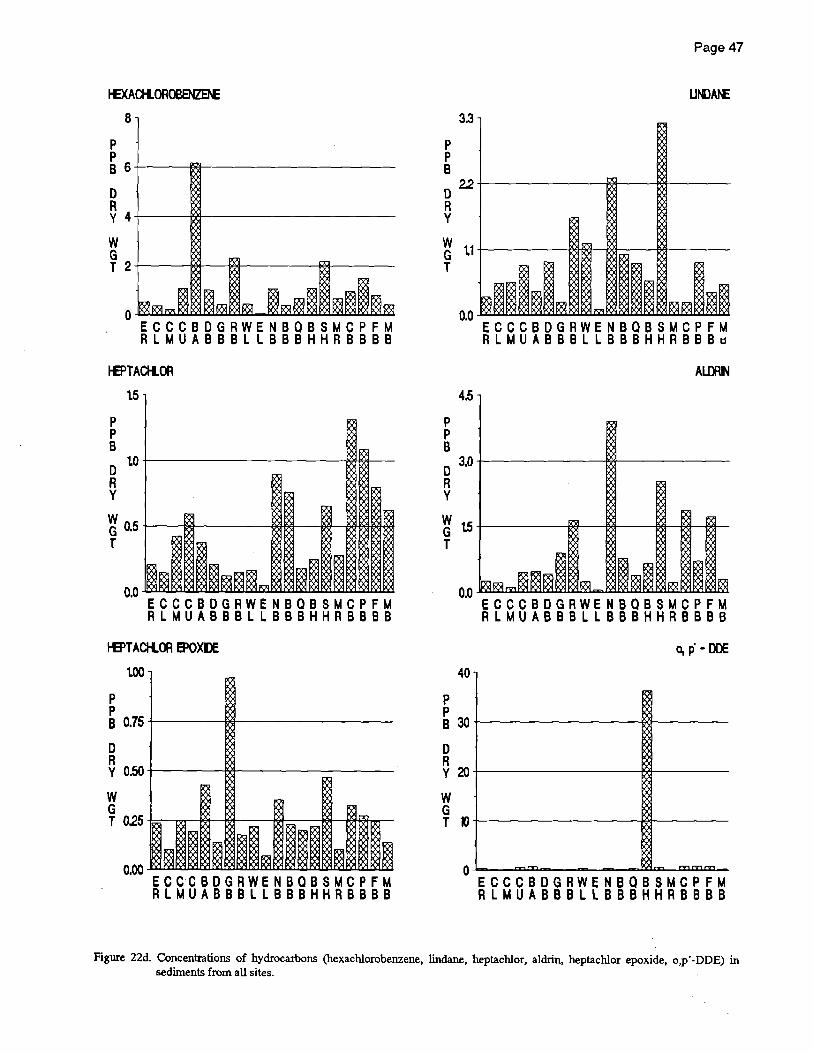
P P B 6+---~~-------------------
o R y 4+---~~-------------------
W G T 2+---~~~~------~~-----
ECCCBDGRWENBOBSMCPFM RLMUABBBLLBBBHHRBBBB
I-£PTACHLOR
P P B
t5
o to R y
~ 0.5 +------OO---------i'~L---OO--l'ie-oooooo T
ECCCBDGRWENBOBSMCPFM RLMUABBBLLBBBHHRBBBB
I-£PTACHLOR EPOXDE
p P
1.00
B 0.75 +---~oo----------
o R y 0.50 +-------ll?l---------
W G T 025~~~~~-~=-~*-~~-
ECCCBDGRWENBOBSMCPFM RLMUABBBLLBBBHHRBBBB
P P B
3.3
022
R Y
Page 47
~ 1.1+-------~OO-~---«~---T
p P B
4.5
o 3.0
R Y
ECCCBDGRWENBOBSMCPFM R L M U A B B B L L B B B H H R B B B ~
ALDRN
~ ~+-------~~~~--~~~OOT
p P
40
B 30
o R y2Q
W G T 10
o
ECCCBDGRWENBOBSMCPFM RLMUABBBLLBBBHHRBBBB
0, p' - DOE
.rr> ~~~
ECCCBDGRWENBOBSMCPFM RLMUABBBLLBBBHHRBBBB
Figure 22d. Concentrations of hydrocarbons (hexachlorobenzene, lindane, heptachlor, aldrin, heptachlor epoxide, o,p'-DDE) in sediments from all sites.

Page 48
alpha - Clt.ORDAt£
p P B
6
o 4 R Y
~2+---~~~~--~~~------T
ECCCBOGRWENBOBSMCPFM R L M U A B B B L L B B B H H R B B B B
DIELDRIN
p P B
3
02
R Y
~ 1r----1*--1*--1*-~~------T
ECCCBOGRWENBOBSMCPFM R L M U A B B B L L B B B H H R B B B B
0, p' - ODD
P P B
9
o 6 R Y
~3~--~~~~----~~~----T
o~==~==~==~==~==~==~=
ECCCBOGRWENBOBSMCPFM R L M U A B B B L L B B B H H R B B B B
P P
4
trans - NONACH..OR
B 3 r---~<2tOO----te-(t-----------i~t-OO--------
o R y 2 +-----I".i'l-M--1".i't--------'l'i'HYfM--------
W G T 1~--~~~#*-*~*»~------
P P B
12
o 8 R Y
ECCCBOGRWENBOBSMCPFM R L M U A B B B L L B B B H H R B B B B
p, p' - OOE
W 4 -lOO----1*-----£~----~~----G T
P P
36
ECCCBDGRWENBOBSMCPFM R L M U A B B B L L B B B H H R B B B B
p, p' - DOD
B 27r---------------~(t-----------
o R y ~+-----------------1".~------
W G T 9+---~~~~----~~------
o~=-~==~~~===ww=~~=-
ECCCBDGRWENBOBSMC'FM R L M U A B B B L L B B B H H R B B B B
Figure 22e. Concentrations of hydrocarbons (a-chlordane, trans-nonachlor, dieldrin,p,p' -DOE, o,p' -DDD,p,p' -DOD) in sediments from all sites.
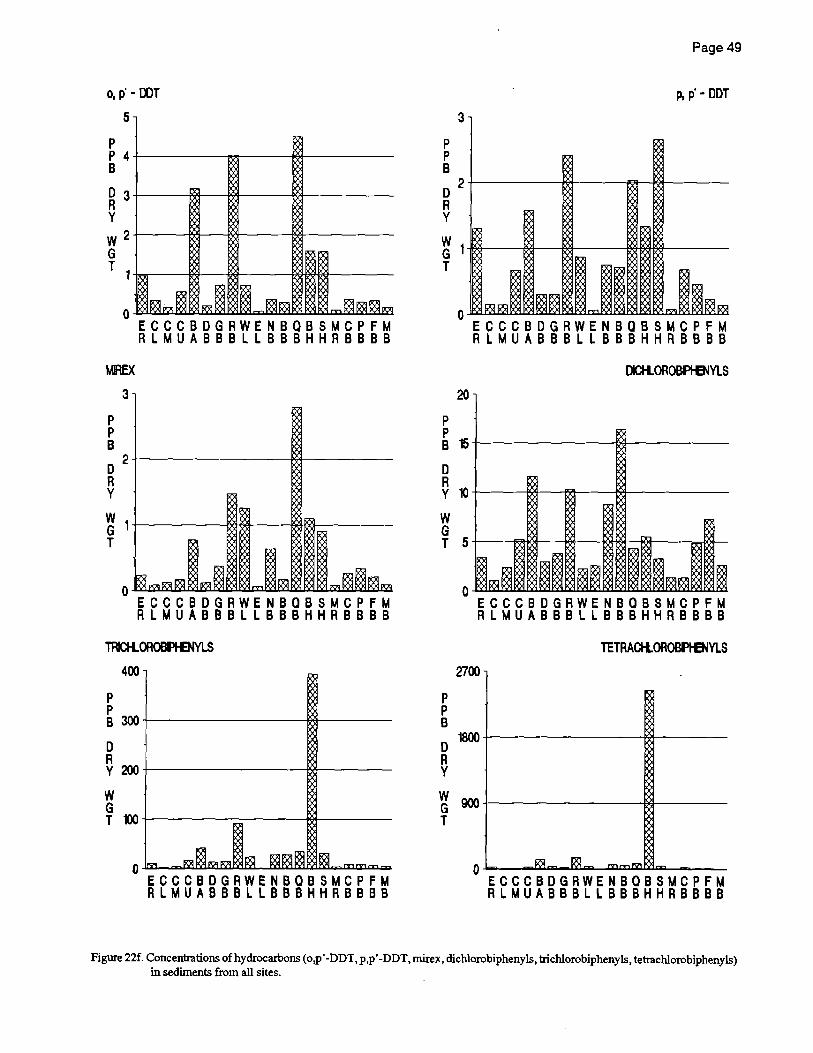
0, p' - OOT
5
P P 4+-------~------~---------B
o 3+---~~~~----~--------R Y
W 2 G
T 1~--~~~~----~~~-----
tJJREX
P P B
3
o 2 R Y
ECCCBDGRWENBOBSMCPFM RLMUABBBLLBBBHHRBBBB
~ 1+---------~~--~~------T
ECCCBOGRWENBOBSMCPFM RLMUABBBLLBBBHHRBBBB
TRlCK.OROBA£NYl.S
P P
400
B 300+---------------~~------
o R y ~+---------------~~------
W G T »o+---------------~~------
ECCCBDGRWENBOBSMCPFM RLMUABBBLLBBBHHRBBBB
P P B
3
o 2 R Y
Page 49
p, p' - DDT
~ 1-lM---~~---£~--M-£i~--T
p P
20
ECCCBOGRWENBOBSMCPFM RLMUABBBLLBBBHHRBBBB
DICH..OROBfI-ENYLS
B ~+--------------w~---------
o R y ~+--~~~~-~------
W G T 5+--~*-~*-~~~~-~*-
P P B
ECCCBOGRWENBOBSMCPFM RLMUABBBLLBBBHHRBBBB
TETRACH.OROBPI-ENYLS
2700
01800 R Y
~ ~+---------------~-------T
ECCCBOGRWENBOBSMCPFM RLMUABBBLLBBBHHRBBBB
Figure 22f. Concentrations of hydrocarbons (o,p' -DDT, P,P' -DDT, mirex, dichlorobiphenyls, trichlorobiphenyls, tetrachlorobiphenyls) in sediments from all sites.
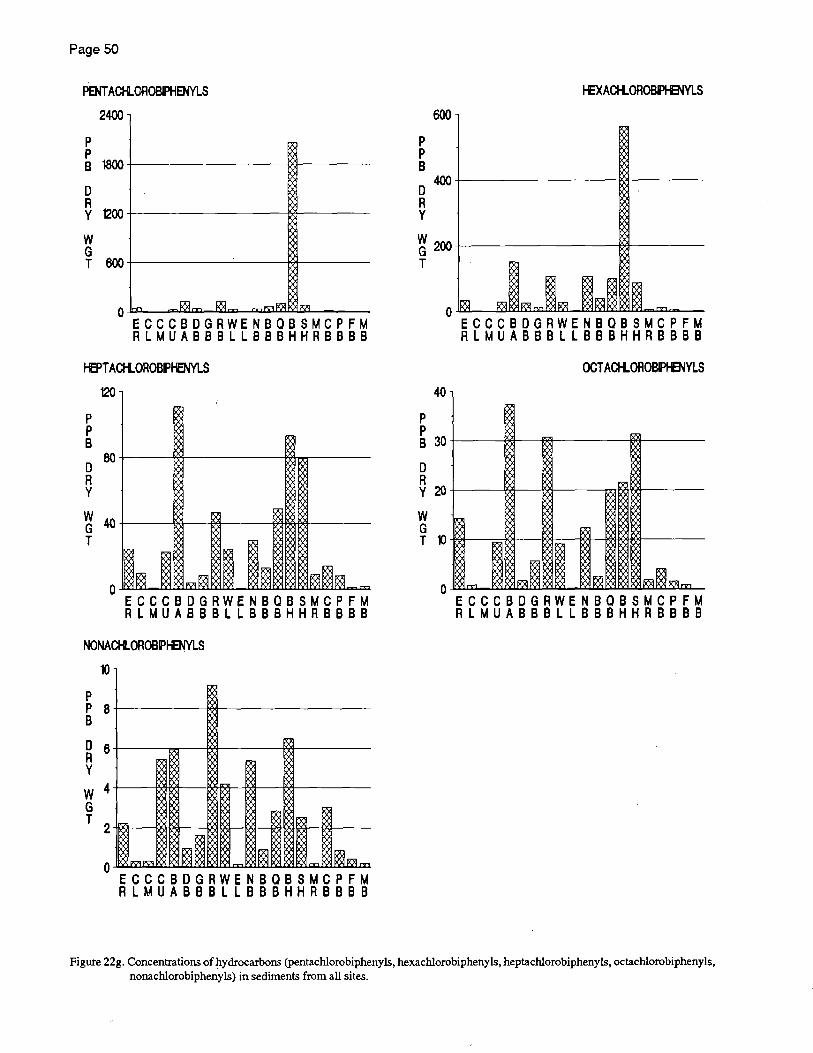
Page 50
PelT ACtt.OROBIPHENYLS
2400
P P B 1800
D R Y 1200
W G T 600
o IrV"I ,R>l~ .~ ,ml'Q'l 1M
ECCCBDGRWENBOBSMCPFM RLMUABBBLLBBBHHRBBBB
I-EPTACH.OOOBFt£NYLS
P P B
120
8O+------1>9'!-------""*"".,-----D R Y
W40+------100----100---~oo-eoOl;__--G T
ECCCBDGRWENBOBSMCPFM RLMUABBBLLBBBHHRBBBB
NONACH.OR081P1-ENYLS
"Kl
P P 8 B
D 6 R Y
W 4 G T 2
o
~
~I ~
~ ~ ~ILrV"I """"" iX,=
ECCCBDGRWENBOBSMCPFM R L M U A B B B L L B B B H H R B B B B
P P B
600
D400 R Y
taACH.OROBPH:NYLS
~ ~+---------~»-------T
P P
40
ECCCBDGRWENBOBSMCPFM RLMUABBBLLBBBHHRBBBB
OCT ACH.OROBP1-ENYLS
B 30 +-------100----00-------------I9oEt------
D R Y 20 +--------1<9l---m--------=~il'l------
W G T "Kl~--~~--~--~~~*-----
ECCCBDGRWENBOBSMCPFM R L M U A B B B L L B B B H H R B B B B
Figure 22g. Concentrations of~ydrocarbons (pentachlorobiphenyIs, hexachlorobiphenyIs, heptachlorobiphenyIs, octachlorobiphenyIs, nonachlorobiphenyIs) in sediments from all sites.
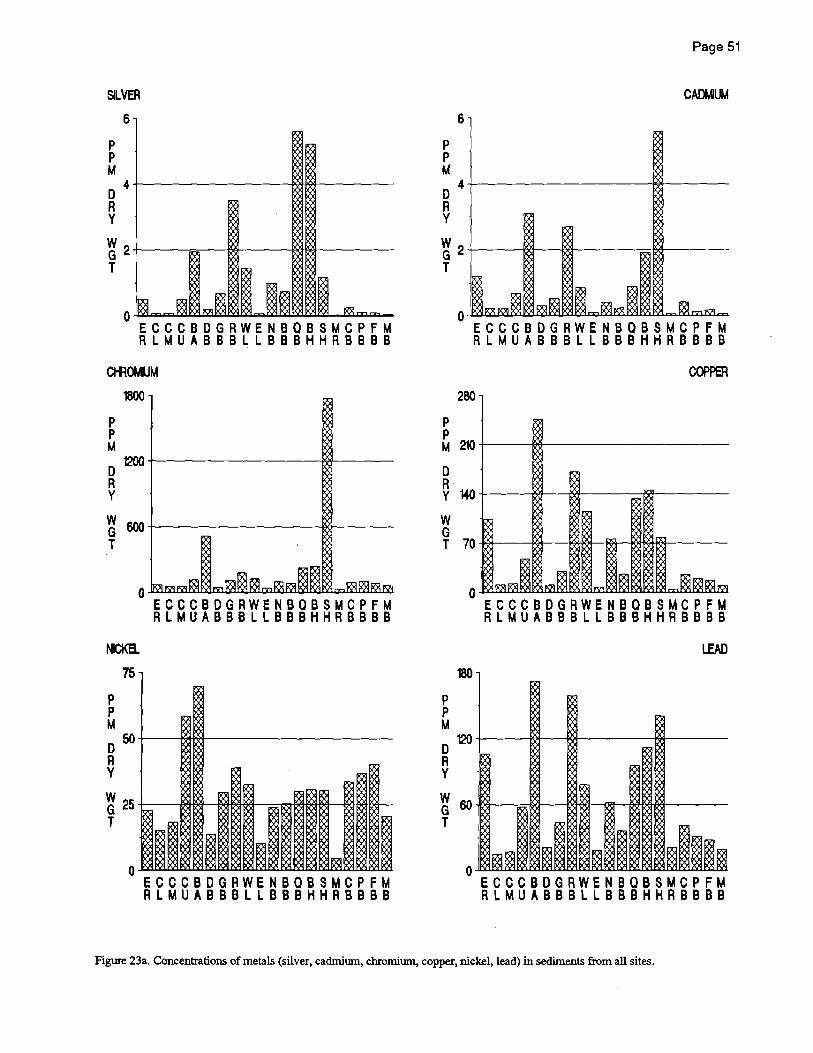
SILVER 6
P P M o 4 R Y
~2+---~~~OO-----~OO-------T
ECCCBOGRWENBOBSMCPFM RLMUABBBLLBBBHHRBBBB
CIilCMJM
P P M
1800
01200 R Y
~ ~+-----------------~-----T
f«)(a,
75
P P M
050
R Y
ECCCBOGRWENBOBSMCPFM RLMUABBBLLBBBHHRBBBB
~ 25r---~~~~~~~~~~~ T
ECCCBDGRWENBOBSMCPFM RLMUABBBLLBBBHHRBBBB
P P M
6
o 4 R Y
Page 51
~ 2 +---~*I-~OO-------=h€t-----T
ECCCBDGRWENBOBSMCPFM R L M U A B B B L L B B B H H R B B B B
COPPER
280
P P M ~r---~~------------------
o R y WO+---~*-~~----~~------
W G T 70+*--~*-~~~~~~------
P P M
180
0120 R Y
ECCCBOGRWENBOBSMCPFM RLMUABBBLLBBBHHRBBBB
LEAD
W60-IM----="")6------IO~---t3&--M-&EI-OO------G T
ECCCBDGRWENBOBSMCPFM RLMUABBBLLBBBHHRBBBB
Figure 23a. Concentrations of metals (silver, cadmium, chromium, copper, nickel, lead) in sediments from all sites.

Page 52
ZINC
660
P P M o 440
R Y
~ ~O~--~f~~~----~~-----T
ECCCBDGRWENBOBSMCPFM ALMUABBBLLBBBHHRBBBB
MANGANESE
1800
P P M
D1200 R Y
W ~~--~~--~w-----~~---G T
o~==~u==ww==a~u=~~~~
ECCCBDGRWENBOBSMCPFM RLMUABBBLLBBBHHRBBBB
MERrow 2.4
P P M 18
D R Y 12
W G T 0.6
ECCCBDGRWENBOBSMCPFM R L M U A B B B L L B B B H H R B B B B
p. P
100
THAWI.J.A
M 0.75 +-'----IJoa------~l-OOli~----
D R Y 0.50 -lM---I'i'H':oIl------t'x'!I-f'x't--Mt'x'H'X'l-Ntf'-'1---oo-t'.>Mx'j--
W G T 025~~~~~~=»~~~~~~
P P
32
ECCCBDGRWENBOBSMCPFM RLMUABBB L L BBBHHABBBB
ARSENIC
M 24+---~*-~=----------------
o R y ~+---~~~~---------------
W G T 8~~MM*=~~~~00#~~~~
P P M
18
D 12 R Y
ECCCBDGRWENBOBSMCPFM R L M U A B B B L L B B B H H R B B B B
S8..EN1UM
~ 0.6 4----MJ:)4-----t:;~----~I1OO----T
ECCCBDGRWENBOeSMCPFM R L M U A B B B L L B B B H H R B B B B
Figure 23b. Concentrations of metals (zinc, thallium, manganese, arsenic, mercury, selenium) in sediments from all sites.

ANTIMONY
P P
52
M 39~--~~-------------------
D R Y 26+---~~-------------------
W G T O+---~~-------------------
ECCCBDGRWENBOBSMCPFM RLMUABBBLLBBBHHRBBBB
SlUCON
40
ECCCBDGRWENBOBSMCPFM R L M U A B B B L L B B B H H R B B B B
ALlMNllM
9
'/.
D 6+---~~~~~--4*~~~~R Y
W ~ 3~~~~~~~~~~~~~M
ECCCBDGRWENBOBSMCPFM RLMUABBBLlBBBHHRBBBB
P P M
75
D 50 R Y
Page 53
~~+---~~------~~------T
6
"I.
ECCCBDGRWENBOBSMCPFM RLMUABBBLlBBBHHRBBBB
IRON
o 4+---~~~~----~----~~R Y
W ~ 2~~~~~~~~~~~~~
ECCCBDGRWENBOBSMCPFM RLMUABBBllBBBHHRBBBB
Figure 23c. Concentrations of metals (antimony, tin, silicon, iron, ahuninum) in sediments from all sites.

Page 54
TOTAl ORGANC CARBON 5.0 -
'/.
o R Y
W G T
~5~--~~~~~--~~~Nm~-
ECCCBDGRWENBOBSMCPFM R L M U A B B B L L B B B H H RoB B B B
'/.
o R Y
W G T
100
SLT-CLAY
ECCCBDGRWENBOBSMCPFM R L M U A B B B L L B B B H H R B B B B
Figure 24. Concentrations of total organic carbon and silt-clay in sediments from all sites.

NAPliTHALaE
P P
800
B ~+-------------~~---------
o R Y400+-------------u<::rM-l'i'l-------
W G T ~+-----------~~#*---------
ECCCBOGRWENBOBSMCPFM RLMUABBBLLBBBHHRBBBB
1 - METHYLNAPHTHALENE
P P B
450
0300
R Y
W ~+_--~------~~~»-------_ G T
ECCCBOGRWENBOBSMCPFM RLMUABBBLLBBBHHRBBBB
2, 6 - DtJETHYl.NAPHTHALEtE
400
P P B300
o R Y200
W G T 100
o
~ ~ ~
1~f9\ .~ ,~~ .rn
ECCCBOGRWENBOBSMCPFM RLMUABBBLLBBBHHRBBBB
P p-B
300
o 200 R Y
Page 55
2 - METHYLNAPHTH~
W 100 +-----------OO---*"i~--G T
150
P P B
0100
R Y
ECCCBOGRWENBOBSMCPFM R L MU A B B B L L B B B H H R B B B B
W 50 +------------------w-oo---------G T
P P B
75
o 50 R Y
ECCCBOGRWENBOBSMCPFM RLMUABBB L LBBBHHRBBBB
ACENAPHTI-ENE
~ ~+------~~~~----T
ECCCBOGRWENBOBSMCPFM RLMUABBBLLBBBHHRBBBB
Figure 25a. Concentrations of hydrocarbons (naphthalene, 2-methylnaphthalene, I-methylnaphthalene, biphenyl, 2,6-dimethylnaphthalene, acenaphthene) in stomach contents collected from all sites.

Page 56
FLlJOREft:
400
P P B300
o R Y200
W G T XlO
P P B
o
0600
R Y
.~. 1'71 ,~P'7l ~
ECCCBOGRWENBOBSMCPFM RLMUABBBLLBBBHHRBBBB
~300+-----.oo----~I------T
ECCCBOGRWENBOBSMCPFM RLMUABBBLLBBBHHRBBBB
FLUORANTI-EfE
P P B
0 R Y
W G T
2000
1500
1000
500
ECCCBDGRWENBOBSMCPFM RLMUABBBLLBBBHHRBBBB
P P B
2400
01600 R Y
~ 800 +-I*l--=-------OO'OO------&EI----
T
P P
320
ECCCBOGRWENBOBSMCPFM RLMUABBBLLBBBHHRBBBB
B 240 +-l*---=------~;l;-----
o R y ~~~~--=---~~----
W G T 80 +--1~--m--___I~4__-___I~----
P P B
1500
o 1000 R Y
ECCCBOGRWENBOBSMCPFM RLMUABBBLLBBBHHRBBBB
PYREt£
~ ~+----~~~-~~----T
o~------~~~u=~~~~---
ECCCBDGRWENBOBSMCPFM RLMUABBBLLBBBHHRBBBB
Figure 25b. Concentrations of hydrocarbons (fluorene, phenanthrene, anthracene, I-methylphenanthrene, fluoranthene, pyrene) in stomach contents collected from all sites.

BENZO [a] ANTHRAce£
P P
2400
B ~+---~-------------------
o R y ~+---~-------------------
W G T ~~*-~----------~-------
o~=-~~~~==w=~~~==~
ECCCBDGRWENBOBSMCPFM RLMUABBBLLBBBHHRBBBB
BENZO Ie] PYRENE
P P
500
B 375 ~-----------f:oG-----~O!-------
o R y 250 +-------~<'I---------IS)4-------
W G T ~5~------~~----~~------
ECCCBOGRWENBOBSMCPFM RLMUABBBLLBBBHHRBBBB
PERYLEtI:
P P
1400
B l)5O +---------------~~--
o R y 700 +----------------1'\1'1-----
W G T ~+---~---------~~---
ECCCBDGRWENBOBSMCPFM RLMUABBBLLBBBHHRBBBB
P P B
750
0500
R Y
Page 57
CHWse£
~ 250 +----~}----"---oo----T
P P B
660
o 440 R Y
ECCCBDGRWENBOBSMCPFM RLMUABBBLLBBBHHRBBBB
BENZO [a] PYReE
~ ~O+----~~--~---T
100
P P B 75
o R y 50
W G T 25
o
ECCCBOGRWENBOBSMCPFM RLMUABBBLLBBBHHRBBBB
DlBENZO [&, h1 ANTHRAcaE
ri"U"i"l .I""a l~~ I,..,.,~~,..,.,~~
ECCCBDGRWENBOBSMCPFM RLMUABBBLLBBBHHRBBBB
Figure 25c. Concentrations of hydrocarbons (benzo[a] anthracene , chrysene, benzo[e]pyrene, benzo[a]pyrene, perylene, dibenzo[a,h]anthracene) in stomach contents collected from all sites.

Page 58
~XACl-LOAOBENZe£
P p B
6
D 4 R Y
~ 2 +----M--I'!>(t--M1!)(t------1Mf'\<'j-MM--<fl--
T
ECCCBDGRWENBOBSMCPFM R L M U A B B B L L B B B H H R B B B B
HEPTACH..OR
P P
32
B ~4+-~-------------
D R Y t6~~--~---------
W G T 0.8 -l=-&M-~----+:~----+:)t-----4i)t-----=r.,.-*4
ECCCBDGRWENBOBSMCPFM R L M U A B B B L L B B B H H R B B B B
HEPT ACI-LOIR EPO)(I)E
P P B
6
D 4 R Y
~ 2 +-M---M----1:'>efOO-------1M--------l*i
T
ECCCBDGRWENBOBSMCPFM R L M U A B B B L L B B B H H R B B B B
. 6
P p B D 4 R Y
~ 2 +-I~-=------I!~-OO-----OO-----t;;illM1WT
P
ECCCBDGRWENBOBSMCPFM R L M U A B B B L L B B B H H R B B B B
ALDRIN
P 8+------#~----------------B
D 6+---~~---------~ R Y W 4+-----~~---------------G
T 2+----W~*--~----,~
P P B
75
D 5.0
R Y
ECCCBDGRWENBOBSMCPFM R L M U A B B B L L B B B H H R B B B B
0, p' - ODE
~ ~5 -JM-----------------------
T
ECCCBDGRWENBOBSMCPFM R L M U A B B B L L B B B H H R B B B B
Figure 25d. Concentrations of hydrocarbons (hexachlorobenzene, lindane, heptachlor, aldrin, heptachlor epoxide, o,p' -DDE) in stomach contents collected from all sites.

q,ha - CH.ORDAJ£
P P
32
B 24+-------~~~--~~-------
o R y ~+-------~~r---~~-------
W G T 8+---~--~~~--~~~-----
ECCCBOGRWENBOBSMCPFM R L M U A B B B L L B B B H H R B B B B
01El..D~
P P B
0 R Y
W G T
27
18
9
ECCCBOGRWENBOBSMCPFM RLMUABBBLLBBBHHRBBBB
0, p' - DOD
P P B
30
020 R Y
~ 10+-------~~~--~~r-----T
ECCCBDGRWENBOBSMCPFM RLMUABBBLLBBBHHRBBBB
P P B
45
o 30 R Y
Page 59
trans - NONACHLOR
~ 5+-------~~~--~~r_----T
140
P
ECCCBDGRWENBOBSMCPFM RLMUABBBLLBBBHHRB88B
Po p' - DOE
P B1)5+----~I----!;>4--------------
o R y 70+------R~~-------------
W G T ~+-----~~~--~~~-----
140
P
ECCC80GRWEN80BSMCPFM R L M U A B B B L L B B B H H R B B B B
Po p' - 000
P B1)5+----------E>e---------------
o R y 70+-------~~--------------
W G T ~+-------~*-----~~-----
ECCCBDGRWENBOBSMCPFM RLMUAB8BLLB8BHHRBBBB
Figure 25e. Concentrations of hydrocarbons (a-chlordane, trans-nonachlor, dieldrin, p,p'-DDE, o,p'-DDD, p,p'-DDD) in stomach contents collected from all sites.

Page 60
0, p' - OOT
p P
16
B 12+--------------1~----------
D R Y 8+--------------4~~~------
W G T 4+---------~--~*=~*-------
MlREX
p P B
6
D 4 R Y
ECCCBDGRWENBOBSMCPFM R L M U A B B B L L B B B H H R B B B B
~ 2~------~~~----~------T
ECCCBDGRWENBOBSMCPFM R L M U A B B B L L B B B H H R B B B B
TRlCK.OA08IPt£NYlS
P P B
180
D120 R Y
W 60 -ffi€I---------OO--------I'>a.MOOi>Jt;f------G T
ECCCBDGRWENBOBSMCPFM RLMUABBBLLBBBHHRBBBB
p P B
15
D 10 R Y
p, p' - DDT
W 5~--------~------~------~ G T
P P B
600
D 400
R Y
ECCCBDGRWENBOBSMCPFM R L M U A B B B L L B B B H H R B B B B
DJCli.OROBIPHENYLS
~ 200 +----------------11*\------T
P P
500
ECCCBDGRWENBOBSMCPFM RLMUABBBLLBBBHHRBBBB
TETRActl.OROBI'I-ENYLS
B 375+------~~---~~-----
D R Y 250+------~~--~~~------
W G T ~5+-------~~~~~~~-----
ECCCBDGRWENBOBSMCPFM RLMUABBBLLBBBHHRBBBB
Figure 25f. Concentrations ofhydrocaroons (o,p' -DDT, p,p' -DDT, mirex, dichlorobiphenyls, trichlorobiphenyls, tetrachlorobiphenyls) in stomach contents collected from all sites.

PENT ACtlOROBPHENYLS
p P B
600
0400 R Y
~ ~+-------~~--~~r------T
ECCCBOGRWENBOBSMCPFM RLMUABBBLLBBBHHRBBBB
I-EPTACli.OROBPt£NYLS
p P B
1200
o BOO R Y
~ ~O+-----------------~~---T
ECCCBOGRWENBOBSMCPFM RLMUABBBLLBBBHHRBBBB
NONACli.OROBIPI-ENYLS
P P B
15
o 10 R Y
W 5~--------~~~~~M------G T
ECCCBOGRWENBOBSMCPFM RLMUABBBLLBBBHHRBBBB
P P B
660
o 440 R Y
Page 61
HEXACK.OROBI'I-ENYLS
~ ~O+-------~~--~~~r---T
P p
40
ECCCBOGRWENBOBSMCPFM RLMUABBBLLBBBHHRBBBB
OCT ACK.OROBR£NYlS
B ~+---------~----------------
o R y ~~------~~--------------
W G T ~~------~~~~*-~*-------
ECCCBOGRWENBQBSMCPFM RLMUABBBLLBBBHHRBBBB
Figure 25g. Concentrations of hydrocarbons (pentachlorobiphenyls, hexachlorobiphenyls, heptachlorobiphenyls, octachlorobiphenyls, nonachlorobiphenyls) in stomach contents collected from all sites.
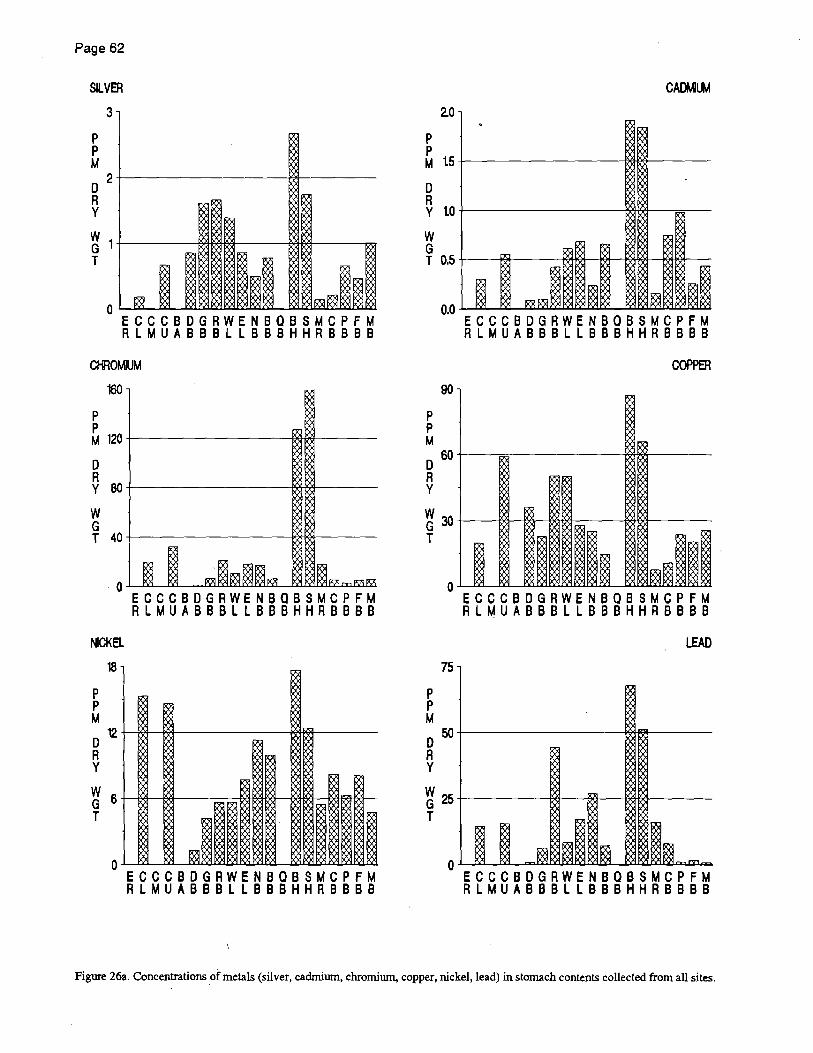
Page 62
SILVER
P P M
3
o 2 R Y
~ 1+-------~~r_----~r_----= T
ECCCBOGRWENBOBSMCPFM R L M U A B B B L L B B B H H R B B B B
CHROMIUM
P P
160
M 1~+---------------~~------
o R Y80+----------------i'X'H'X'l-------
W G T 40 +-----------------hl+l<*------
~CKa
18
P P M
o 12 R Y
W 6 G T
o
ECCCBOGRWENBOBSMCPFM RLMUABBBLLBBBHHRBBBB
~ ~
~H~ ~ ~ ~~~ ~ ~~ ~~~~
~ ~~
~~~~~ >X ~~
~~~~ ;x ;x~
ECCCBOGRWENBOBSMCPFM R L M U A B B B L L B B B H H R B B B B
P P
2.0
M t5 +-----------------~a-w------
o R y to -t---------------------t'J6ffl----=--
W G T 0.5 +------t<3+-----~*+__+e+~~~***-
P P M
90
060
R Y
ECCCBOGRWENBOBSMCPFM R L M U A B B B L L B B B H H R B B B B
COPPER
~ 30 +------OO----OOr---l2~----~-Effle:----T
P P M
75
050
R Y
ECCCBOGRWENBOBSMCPFM R L M U A B B B L L B B B H H R B B B B
LEAD
~ 25+-------~~~~~~----T
ECCCBOGRWENBOBSMCPFM RLMUABBBLLBBBHHRBBBB
Figure 26a. Concentrations of metals (silver, cadmiwn, chromium. copper, nickel, lead) in stomach contents collected from all sites.
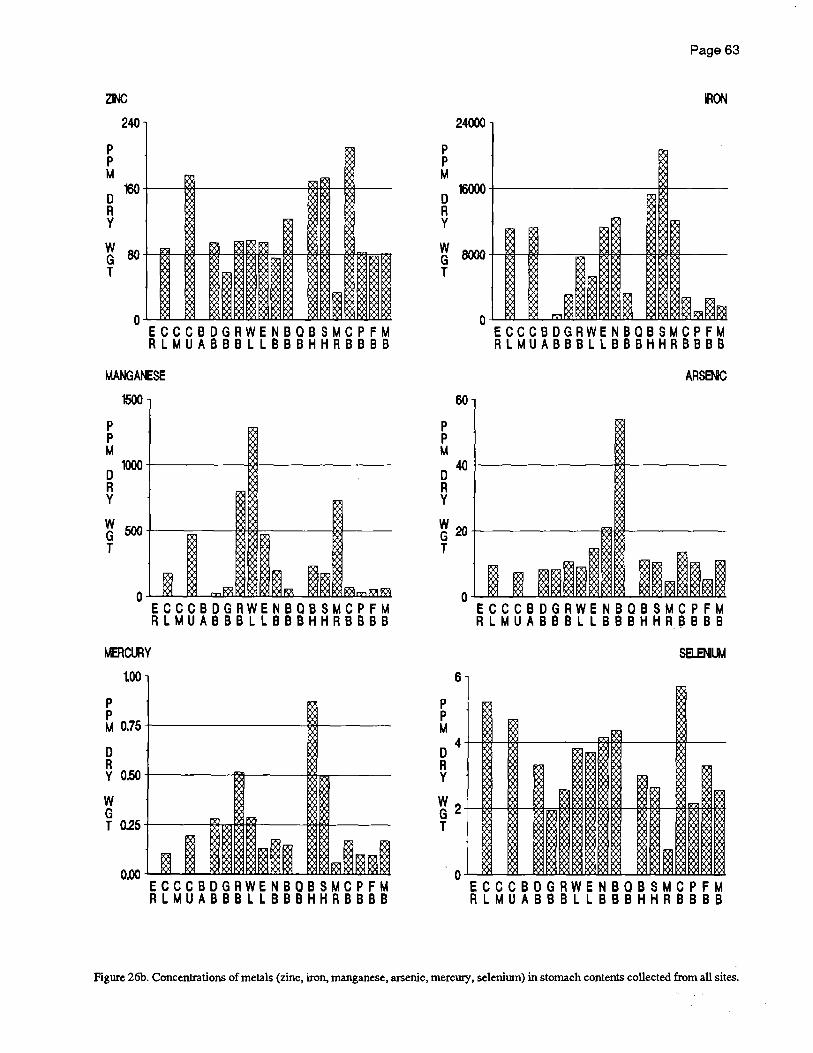
ZN)
240
P P M
o 160 R Y
~ 80 T
o
1'5<':
~ ~ ~
~ ~ Q<:
~ ~~ ~ Xz ~ ~~ ~ ~ ~ ~ ~ ~i z ~ ~ ~ ~ ~ ~
ECCCBOGRWENBOBSMCPFM RLMUABBBLLBBBHHRBBBB
MANGANESE
1500
P P M o 1000 R Y
~ ~+---~--~~=-----~~---T
ECCCBOGRWENBOBSMCPFM RLMUABBBLLBBBHHRBBBB
~ClJly
tOO
P P M 0.75 +------------------00--------
o R y 0.50 +---------f':i:'i---------f':..Ij-,....--------
W G T 025~----~~~----~~------
ECCCBDGRWENBOBSMCPFM RLMUABBBLLBBBHHRBBBB
Page 63
IRON
24000
P P M
016000
R Y
W 8000 +---t>Q---,OO-----=-----S€fOO-~S>GWfOO----G T
P P M
60
o 40 R Y
o~~~~w=~~~~~~~
ECCCBOGRWENBOBSMCPFM RLMUABBBLLBBBHHRBBBB
ARSEtfC
~ ~+-----------~~---------T
P P M
6
o 4 R Y
~2 T
o
ECCCBOGRWENBOBSMCPFM R L M U A B B B L L B B B H H R ~ B B B
S8..EN1lJv1
)1'j
~ ~~ ~2
~H-:
~~ ~~ ~ !X
~ ~~ ~ ~~ ~~ ~
I~ ~ ~~ ~~~ ~ !X~x ;X
ECCCBDGRWENBOBSMCPFM RLMUABBBLLBBBHHRBBBB
Figure 26b. Concentrations of metals (zinc, iron, manganese, arsenic, mercury. selenium) in stomach contents collected from all sites.
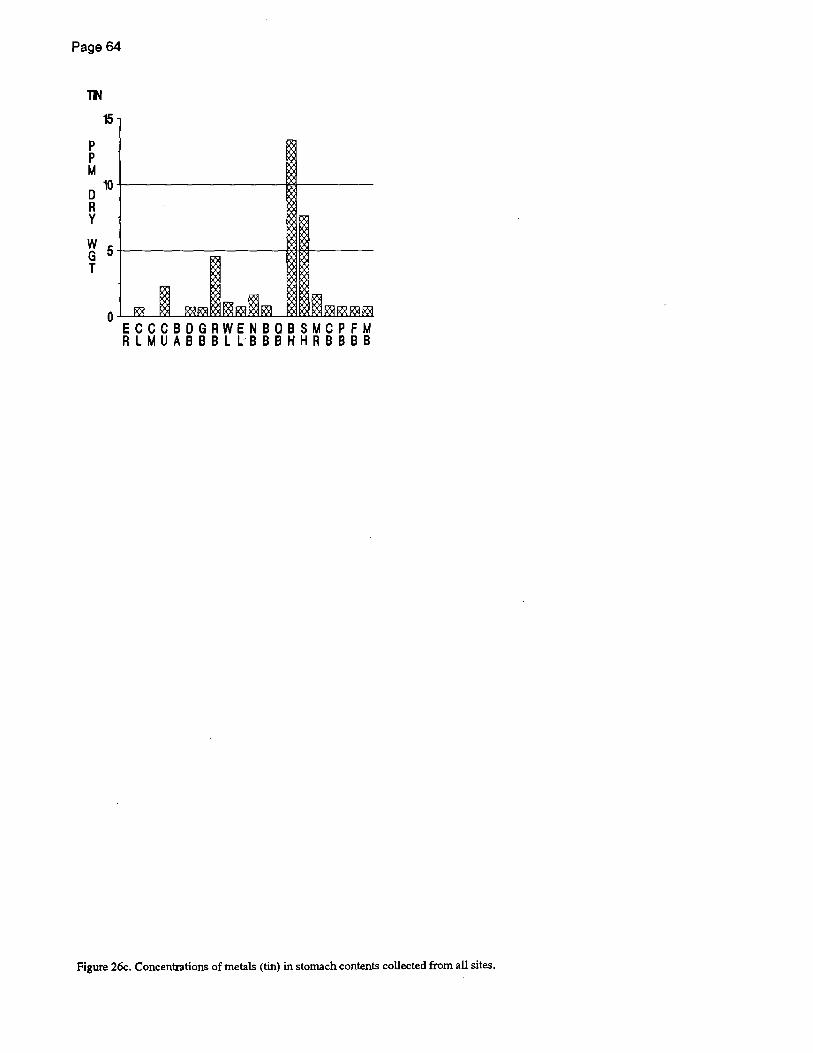
Page 64
P P M
15
o 10+----------------*~------R Y
~ 5 +---------------~tM_-----T
ECCC8DGRWEN808SMCPFM RLMUA888Ll888HHR8B8B
Figure 26c. Concentrations of metals (tin) in stomach contents collected from all sites.

I-EXACK.OROBENZm:
12
P p B
8 o R y
~ 4 T
o
~ ~ ~~ ~~8! ~ ~
~~ ~
~I~ ~~
I ~ ~ ~ ~ ~ ECCCBDGRWENBOBSMCPFM RLMUABBBLLBBBHHRBBBB
I'EPTACH..OR
p P
4
B 3+-----~~-----------------
o R y 2+------N~-----------------
W G T 1~----~~~------~-------
ECCCBDGRWENBOBSMCPFM RLMUABBBLLBBBHHRBBBB
I-EPTACK.OR EPOXDE
18
p P B o 12 R Y
~ 6 T
o
~ ~ ~ I;~ ~ ~
~~ ~ ~~ ~ ~~ ECCCBDGRWENBOBSMCPFM RLMUABBBLLBBBHHRBBBB
8
p P B 6
o R y 4
W G T 2
P P
o
4
Page 65
~;8 Q-)Q-)
~ ~~ ~ ~ ~ ~rx
~ ~ ~~ ~ ~~ ~~
~~ ~ ~~ I ~ ~ ~~~ ~~ ~ ~ ~~~ ~ ~~ ~ ~
ECCCBDGRWENBOBSMCPFM RLMUABBBLLBBBHHRBBBB
ALDAN
B 3+-----~~------------~---
o R y 2 +------N~------------m-----
W G T 1+---~~~~~--~~--~---
P P B
6
o 4 R Y
ECCCBDGRWENBOBSMCPFM RLMUABBBLLBBBHHRBBBB
0. p' - DOE
~ 2 +---------100---------.....------~~T
ECCCBDGRWENBOBSMCPFM RLMUABBBLLBBBHHRBBBB
Figure 27a. Concentrations ofhydrocaroons (hexachlorobenzene, lindane, heptachlor, aldrin, heptachlor epoxide, o,p'-DDE) in livers collected from all sites.
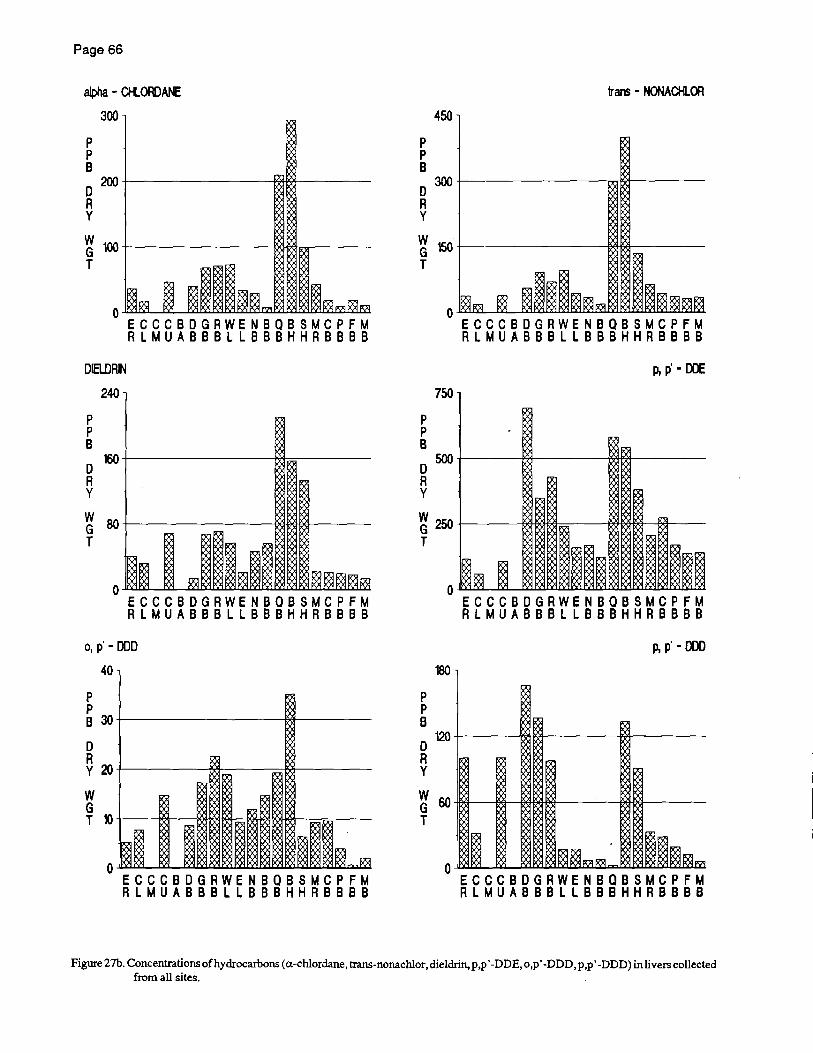
Page 66
alpha - C/i.ORDAf'£
P P B
300
D 200
R Y
~ 100 +----------'~'h",._--T
ECCCBDGRWENBOBSMCPFM RLMUABBBLLBBBHHRBBBB
DIELDRIN
P P B
D R Y
240
~+---------~~---
W80+__--------l~l-OO----G T
ECCCBDGRWENBOBSMCPFM RLMUABBBLLBBBHHRBBBB
0, p' - DOD
P P
40
B 30 -t--------------le>(t-----
o R y 20 +__-----1''i'l------I''ii'l-----
W G T ~+---~-~~~~OO#*-~~-
ECCCBDGRWENBOBSMCPFM R L M U A B B B L L B B B H H R B B B B
P P B
450
0300
R Y
trans - NONACHLOR
~15O+----------l~l----T
P P B
750
0500
R Y
ECCCBDGRWENBOBSMCPFM RLMUABBBLLBBBHHRBBBB
Po p' - OOE
~ 250 +-----OO-00J9~---l~l-OO-------e€l--T
180
P P B
0120
R Y
ECCCBDGRWENBOBSMCPFM RLMUABBBLLBBBHHRBBBB
Po p' - 000
~60-ffi€l---i*j-------e€Ii*H:~------I9oe-oo----T
ECCCBDGRWENBOBSMCPFM RLMUABBBLLBBBHHRBBBB
Figure 27b. Concentrations of hydrocarbons (a-chlordane, trans-nonachlor, dieldrin,p,p' -DDE, o,p' -DDD,p,p' -DDD) in livers collected from all sites.
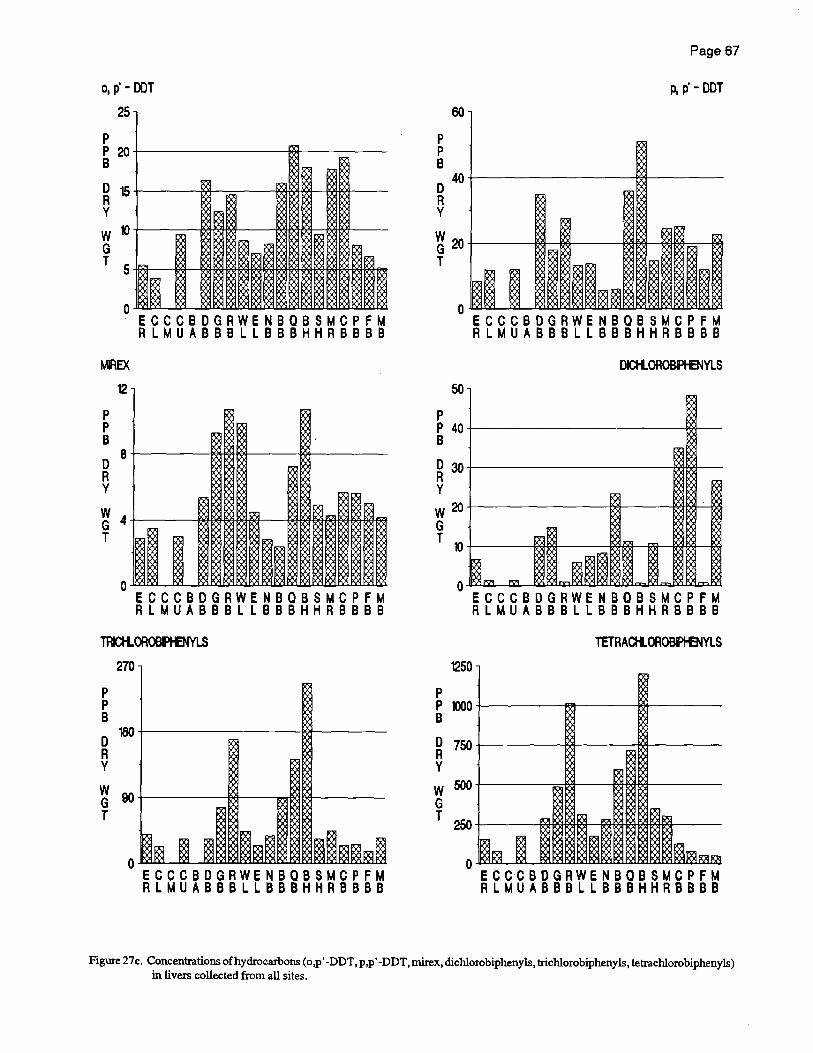
o. p' - DDT
25
P p 20 B
o 15 R Y
W 10 G T 5
o
w:lEX
12
P P B o 8 R Y
~ 4 T
o
~ ~I ~ ~ ~ ~~
~~ ~ ~~ ~~ ~~
~~ ~~ ~~ X !XiX IX
~;I ~ ~~ ~ ~~ ~~
~ ~~ IX ~~ ~~ ;.; PH~ ~~ iX~ x~
ECCCBOGRWENBOBSMCPFM R L M U A B B B L L B B B H H R B B B B
~~
~ ~ ~~ ~iX
~ ~ ~~ ~ ~~
~~ ~iX[8 ~~ ~ ~~ ~ ~~ ~~~ ~~
~ ~~ ~ ~l6~ iX~ ~ iX~ x ECCCBOGRWENBOBSMCPFM R L M U A B B B L L B B B H H R B B B B
TRlCH.OROBA£NYLS
P P B
0 R Y
W G T
270
180
90
o~n-~~~wn~~~ww~~~
ECCCBOGRWENBOBSMCPFM RLMUABBBLLBBBHHRBBBB
P P B
60
040 R Y
Page 67
p. p' - DDT
~ 20 -t------1*t-----1:~---oo-t;~1*HO~---OO T
50
P
ECCCBDGRWENBOBSMCPFM R L M U A B B B L L B B B H H R B B B B
DICtt.OROBAENYLS
P 40+-----------~~ B
o ~+------------------M~R Y W20+-------~r--~~~
G T 10+---~~--~~~~~~
1250
P
ECCCBDGRWENBOBSMCPFM RLMUABBBLLBBBHHRBBBB
TETRACH.OR~YLS
P mO-t-------~r-----~------B
D 750+-------~~----~------R Y W ~O-t-----~~~~~~------G
T 250+-----~~~~~~~-----
O~~~~~~~~~~~~=
ECCCBDGRWENBOBSMCPFM RLMUABBBLLBBBHHRBBBB
Figure 27c. Concentrations of hydrocarbons (o,p' -DDT, p,p' -DDT, mirex, dichlorobiphenyls, trichlorobiphenyls, tetrachlorobiphenyls) in livers collected from all sites.

Page 68
PENT ACH..OAOBPHENYLS
P P B
2700
D1800 R Y
W ~+_------~~--~~~----__ G T
ECCCBDGRWENBOBSMCPFM RLMUABBBLLBBBHHRBBBB
I-EPTACli.OROBfl~
P P B
1500
D 1000 R Y
W ~+-______ ~~~=-~~~~ ___ G T
ECCCBDGRWENBOBSMCPFM RLMUABBBLLBBBHHRBBBB
NONACli.OROBPI-£NYLS
P P B
60
D40 R Y
~ ~+---~~~~~~==~~~----T
ECCCBDGRWENBOBSMCPFM R L M U A B B B L L B B B H H R B B B B
P P B
3000
D 2000 R Y
HEXACli.OROBU't-ENYlS
~ 1000 +--------=--OO------I»~SI-------T
P P B
D R Y
240
ECCCBDGRWENBOBSMCPFM RLMUABBBLLBBBHHRBBBB
OCTACli.OROBPHENYlS
~O+---------------~---------
W 80 +--------oo-J:~I----l:){t-__ooJ::~IOO-J:*---G T
ECCCBDGRWENBOBSMCPFM RLMUABBBLLBBBHHRBBBB
Figure 27d. Concentrations ofhyd.rocarbons (pentachlorobiphenyls. hexachlorobiphenyls. heptachlorobiphenyls. octachlorobiphenyls. nonachlorobiphenyls) in livers collected from all sites.
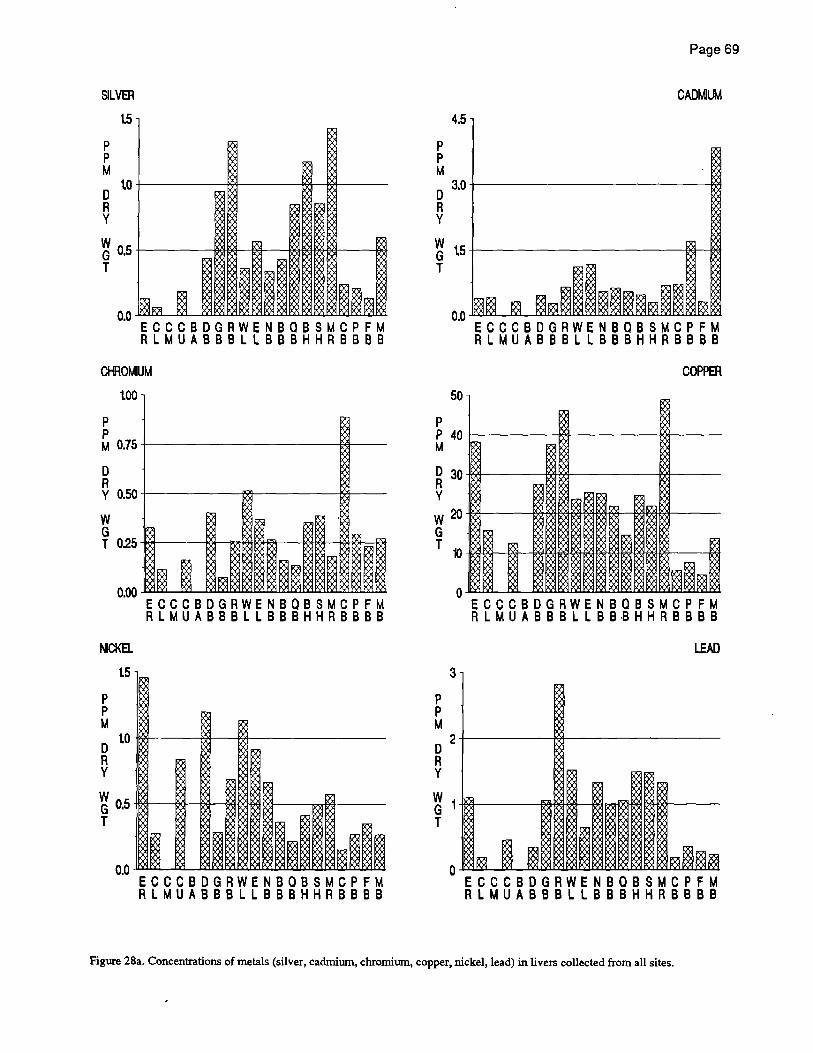
SILVER
P P M
D R Y
t5
to+-------~*-----~~~---
~ 0.5 +--------ooiloET-1*l----I*ffioEl-OO-OO-------OO
T
ECCCBDGRWENBOBSMCPFM R L M U A B B B L L B B B H H R B B B B
CHROMIUM
P p
tOO
M 0.75 +---------------00----
D R Y 0.50 -f--------~----------i'S:"l----
W G T 025~--~~~~~~~~~~
ECCCBDGRWENBOBSMCPFM RLMUABBBLLBBBHHRBBBB
t-ICKa
p P M
o R y
t5
tO~---~~~~-----------
W G 0.5 -tOO----OO-----wI---l:~~4--------,.",-M------T
ECCCBDGRWENBOBSMCPFM RLMUABBBLLBBBHHRBBBB
p P M
4.5
D 3.0
R Y
Page 69
CADMIUM
~ t5 -t-----------------------oo---I*t
T
50
P P 40 M
D 30 R Y
W20 G T 10
P P M
3
D 2 R Y
o
ECCCBDGRWENBOBSMCPFM R L M U A B B B L L B B B H H R B 8 B B
COPPER
~[l;
[2~Z>'l
~ ~ ~~~
~~ ~~ ~ ~ R)~ ~~
~ ~~ ~~ ~ ~ III ~ ~Q; ~~ ~~I !~ ~~ ~~~ (X: 0.;
ECCCBDGRWENBOBSMCPFM R L M U A 8 8 8 L L B 8 ·8 H H R 8 8 B 8
LEAD
~ 1~------~~~~~~~----T
ECCCBDGRWENBQBSMCPFM RLMUAB8BLLBBBHHRBBBB
Figure 28a. Concentrations of metals (silver, cadmium, chromium, copper, nickel, lead) in livers collected from all sites.
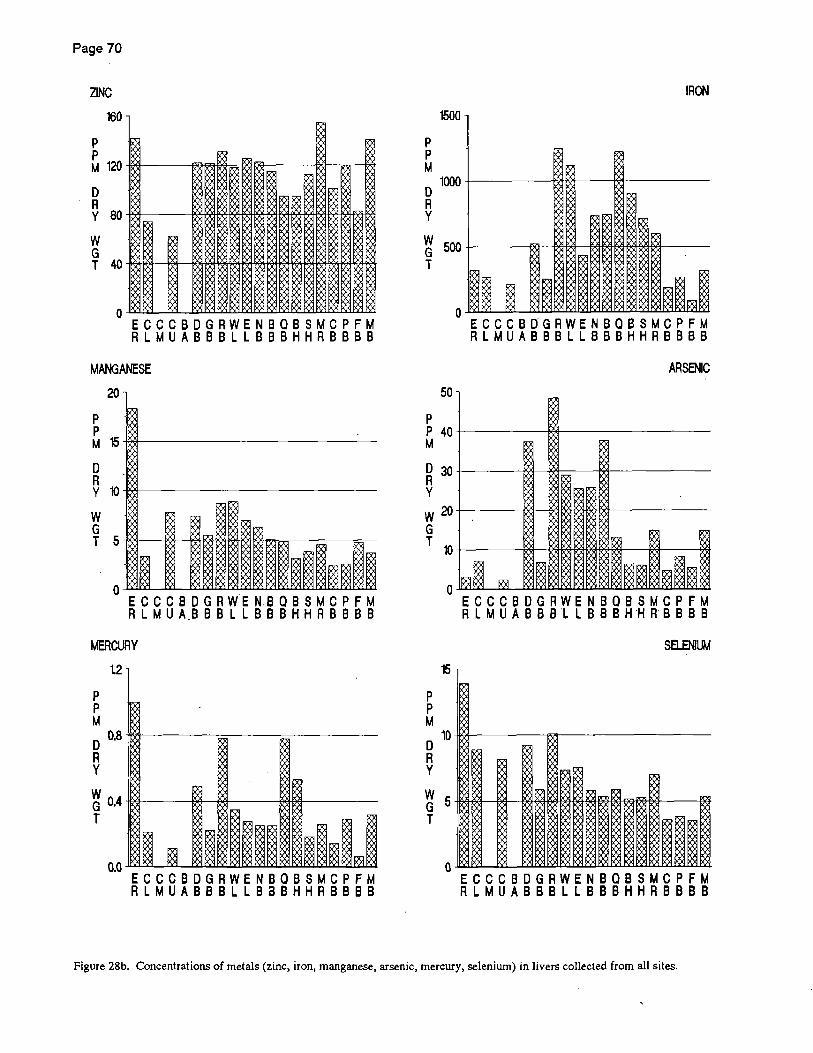
Page 70
ZINC
P P
160
M 120 -JOO-----e<:wa1I*4-=:o-OO100----OO----.....----1W
D R Y 80 -lI9I------t'ii4mI9WX4mI9WX'H'i'11I9WX'l-I'X'Hl9HSi'l-l'X'11i'X'r
W G T 40 ~~___*+---M#W~~~~~~~"**~
ECCCBDGRWENBOBSMCPFM RLMUABBBLLBBBHHRBBBB
MANGANESE 20
P P M 15
D R Y 10
W G T 5
o~=-~~~~~=ww=u=~u=u=~
ECCCBDGRWE~BOBSMCPFM R L M U A.B B B L L B B B H H A B B B B
MERCURY
P P M
1.2
D 0.8
R Y
~ 0.4 iOO----Wf--f2..;t----~\:I----T
ECCCBDGRWENBOBSMCPFM A L M U A B B B L L B a B H H R B B B B
IRON
1500
P P M D 1000
R Y
W 5OO~---oo~~~~~~~-G T
50
P
o~=-~-=~~~==~~~~~
ECCCBrrGRWENBOBSMCPFM RLMUABBB L LBBBHHRBBBB
ARSENIC
P 40~----~--------M
D 30~--~+-~-~~-----R Y
W20 G
T 1O~--~r-~~~~-~r--~
P P M
15
D 10
R Y
W 5 G T
o
ECCCBDGRWENBOBSMCPFM R L M U A B B B'L L B B B H'H R'B B B B
saENlLIM
~ ~~~
~ ~
~~~ ~ ~~~ ~ ~~~ ~ ~~~ ~ x ~~~ ~
ECCCBDGRWENBOBSMCPFM R L M U A B B B L L B B B H H R B B B B
Figure 2gb. Concentrations of metals (zinc, iron, manganese, arsenic, mercury, selenium) in livers collected from all sites.
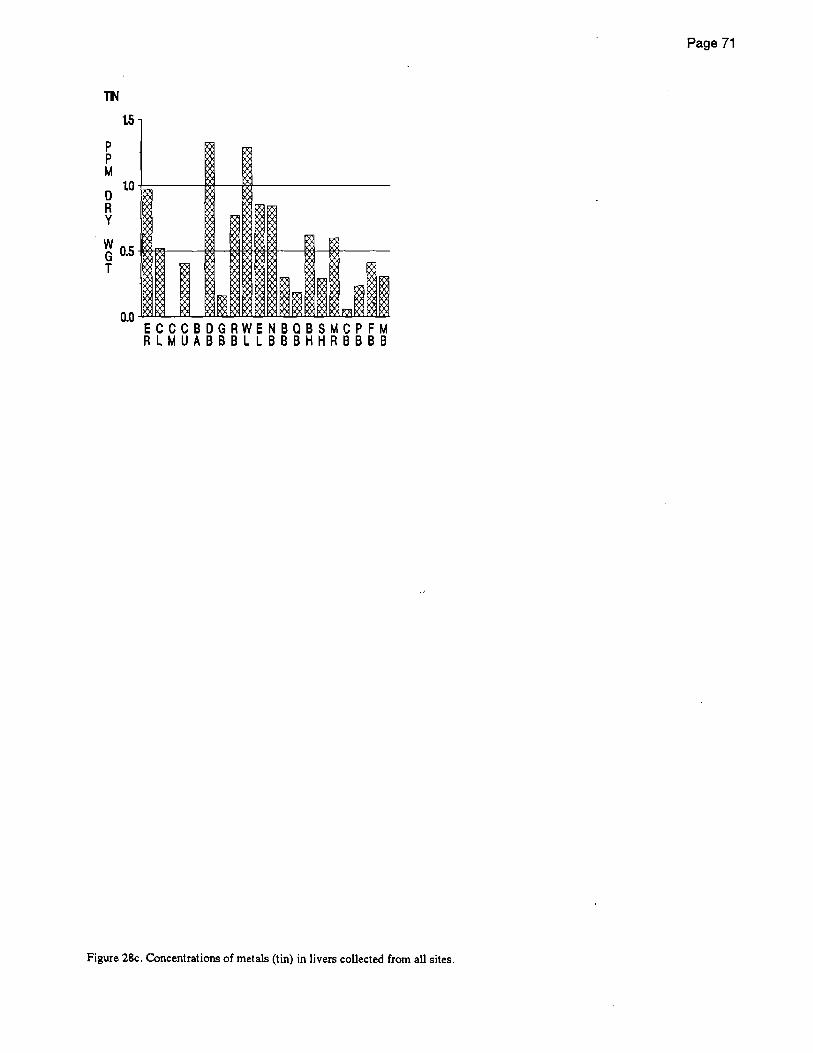
TN
P P M
o R y
1.5
1.0+-----~~-4*--------------
~ 0.5 -A-I:le----M~m1~I_____M~~--T
ECCC8DGRWEN8Q8SMCPFM R L M U A 8 B B L L 8 B 8 H H R 8 8 8 B
Figure 28c. Concentrations of metals (tin) in livers collected from all sites.
Page 71

Page 72
Table 3a. Concentrations ofhydrocarbons (naphthalene, 2-methy lnaphthalene, 1-methylnaphthalene, biphenyl, 2 ,6-dimethy lnaphthalene, acenaphthene, fluorene, phenanthrene, anthracene) in sediment (ppb dry weight)
Year
1985 1985 1985 1985 1986 1986 1986
1985 1985 1985 1985 1986 1986 1986
1985 1985 1985 1985 1985 1986 1986 1986
1984 1985 1985 1985 1985 1985 1986 1986
1984 1984 1985 1985 1985
1984 1984 1984 1985 1985
Station
MB1 MB2 MB3 MB4 MB1 MB3 MB4
FBI FB2 FB3 FB4 FBI FB2 FB3
PB1 PB2 PB3 PB4 PB5 PB1 PB3 PB4
CB5 CB1 CB2 CB3 CB4 CB5 CB1 CB2
MR2 MR3 MR1 MR2 MR3
SH1 SH2 SH3 SH1 SH2
Naphthalene
< 0.60 13.00
< 0.70 12.60 5.83
11.39 6.50
< 1.40 < 2.40 < 0.90 <1.60 < 0.96 < 0.92 < 1.05
27.20 12.50 11.40
< 0.90 7.90
36.80 27.35 17.75
< 2.20 12.90 31.80
< 2.10 50.50 38.70
< 1.12 26.70
< 0.60 < 0.40 < 0.30 < 0.30 < 0.30
279.98 . 438.11 256.80 152.30 68.30
2-Me-naph-l-Me-naph- Biphenyl 2,6-diMe- Acenaph-thalene thalene thalene thene
< 0.60 < 0.60 < 0.70 < 0.70 < 0.52
4.46 < 0.53
< 1.50 < 2.40 < 0.90 < 1.60 < 0.83 < 0.80 < 0.91
19.30 9.10 9.60
< 1.00 < 1.00 17.27 10.99 6.17
< 2.20 < 1.70 14.30
< 2.20 30.90 18.30
< 0.96 10.75
< 0.60 < 0.40 < 0.30 < 0.30 < 0.30
< 7.20 < 6.80 157.30 95.50 20.30
< 0.60 < 0.60 < 0.70 < 0.70 < 0.62 < 0.75 < 0.64
< 1.00 < 2.00 < 1.00 < 2.00 < 1.00 < 0.96 < 1.09
20.10 < 1.20 < 1.20 < 0.90 < 1.00 12.79
< 1.42 < 1.03
< 2.10 <1.60 < 1.80 < 2.10 < 1.70 16.70
< 1.16 7.91
< 0.50 < 0.40 < 0.30 < 0.30 < 0.30
< 6.90 < 6.60 69.40
112.10 47.20
Machias Bay
< 0.50 < 0.50 < 0.60 < 0.50 < 0.59 < 0.71 < 0.61
< 0.50 < 0.50 < 0.60 < 0.50 < 0.60 < 0.72 < 0.62
Frenchmans Bay
< 1.00 < 2.00 < 1.00 < 2.00
6.22 < 0.97 < 1.02
<1.00 < 2.00 <1.00 < 2.00 < 1.02 < 0.98 <1.04
Penobscot Bay
< 1.10 < 1.10 < 1.10 < 0.80 < 0.90 < 1.16 < 1.35 < 0.96
16.70 < 1.10 < 1.10 < 0.80 < 0.90 < 1.18 < 1.38 < 0.98
Casco Bay
< 2.40 < 1.50 < 1.50 < 1.80 <1.40 < 1.00 10.01
< 0.95
< 2.30 < 1.50 122.10 < 1.80 <1.40 < 1.00 < 1.03 < 0.97
Merrimack River
6.89 < 0.40 < 0.30 < 0.30 < 0.30
< 0.60 < 0.40 < 0.30 < 0.30 < 0.30
Salem Harbor
< 5.60 < 4.70 25.30
< 1.90 < 0.70
< 5.40 < 4.60 < 3.60 45.70 12.20
< 0.50 < 0.60 < 0.60 < 0.60 < 0.58 < 0.70 < 0.60
<1.00 < 2.00 <1.00 < 2.00 < 1.00 < 0.96 < 1.02
<1.10 < 1.10 < 1.10 < 0.90 < 0.90 < 1.15 < 1.34 < 0.95
37.65 < 1.50 <1.60 < 1.90 < 1.40 <1.00 < 1.01 < 0.95
< 0.60 < 0.40 < 0.30 < 0.30 < 0.30
< 5.70 < 4.80 < 3.80 15.40 5.00
Fluorene
< 0.40 < 0.50 < 0.50 < 0.50 < 0.57 < 0.68 < 0.59
< 1.00 < 2.00 < 1.00 < 2.00 < 0.98 < 0.94 < 0.99
9.90 < 1.00 < 1.00 < 0.80 < 0.80
9.61 < 1.31 < 0.93
< 2.20 < 1.30 < 1.40 < 1.70 19.30 12.70
< 0.98 7.04
5.70 < 0.40 < 0.30 < 0.30 < 0.30
33.77 34.84 52.70
103.60 33.50
Phenan- Anthracene threne
< 0.40 < 0.50 17.60
< 0.50 3.89
29.53 6.20
42.90 62.80 46.10 49.60 17.96 10.42 7.18
137.20 73.40
326.40 37.10 44.90
116.80 80.33 52.46
262.00 60.40
129.90 100.90 238.50 133.60 44.04
100.71
91.91 16.24
3.30 7.20 4.30
955.73 581.02 660.00 664.80 352.50
< 0.40 < 0.60 < 0.50
8.50 < 0.51
4.53 < 0.53
<1.00 < 2.00 < 1.00 < 1.00 30.74 10.30 7.15
17.50 < 0.90 < 0.90 < 0.70 < 0.70 34.48 15.65 10.77
793.19 < 1.20 16.90 12.90 52.50 38.10
101.61 97.10
190.35 21.25 13.30 19.80 15.70
627.79 356.95
1464.60 3777.70
402.30
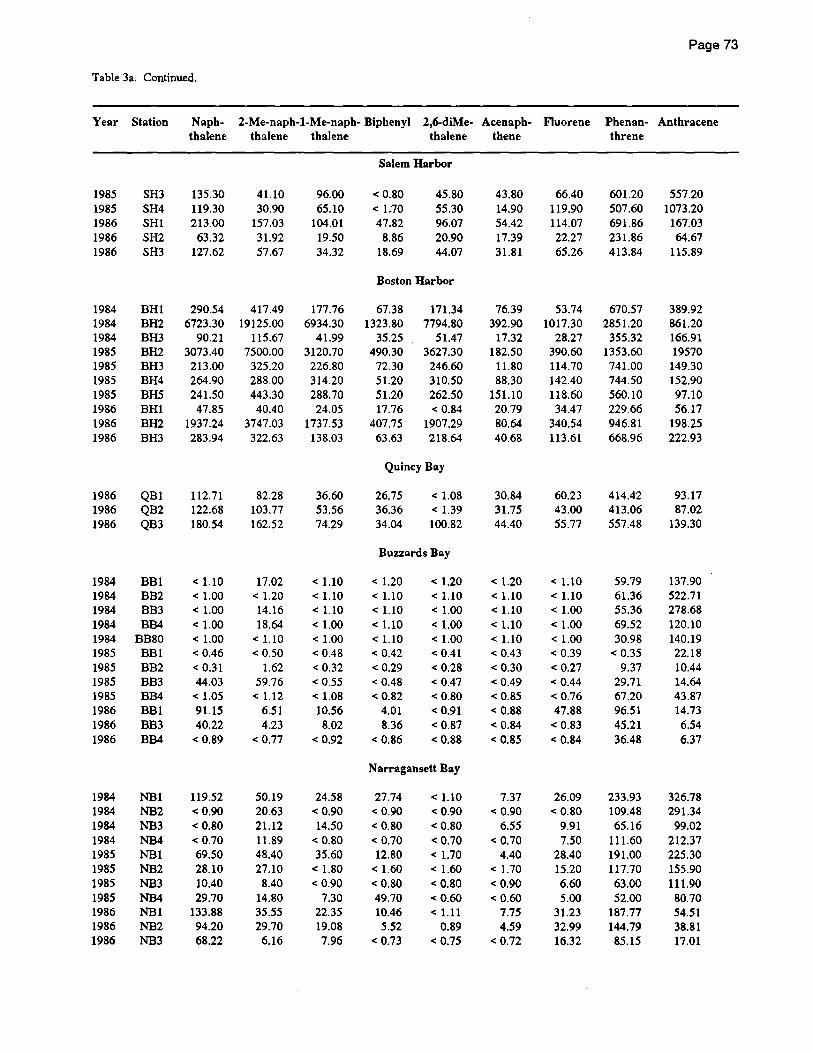
Page 73
Table 3a. Continued.
Year Station Naph- 2-Me-naph-l-Me-naph- Biphenyl 2,6-diMe- Acenaph- Fluorene Phenan- Anthracene thalene thalene thalene thalene thene threne
Salem Harbor
1985 SH3 135.30 41.10 96.00 < 0.80 45.80 43.80 66.40 601.20 557.20 1985 SH4 119.30 30.90 65.10 < 1.70 55.30 14.90 119.90 507.60 1073.20 1986 SHI 213.00 157.03 104.01 47.82 96.07 54.42 114.07 691.86 167.03 1986 SH2 63.32 31.92 19.50 8.86 20.90 17.39 22.27 231.86 64.67 1986 SH3 127.62 57.67 34.32 18.69 44.07 31.81 65.26 413.84 115.89
Boston Harbor
1984 BHl 290.54 417.49 177.76 67.38 171.34 76.39 53.74 670.57 389.92 1984 BH2 6723.30 19125.00 6934.30 1323.80 7794.80 392.90 1017.30 2851.20 861.20 1984 BH3 90.21 115.67 41.99 35.25 51.47 17.32 28.27 355.32 166.91 1985 BH2 3073.40 7500.00 3120.70 490.30 3627.30 182.50 390.60 1353.60 19570 1985 BH3 213.00 325.20 226.80 72.30 246.60 11.80 114.70 741.00 149.30 1985 BH4 264.90 288.00 314.20 51.20 310.50 88.30 142.40 744.50 152.90 1985 BID 241.50 443.30 288.70 51.20 262.50 151.10 118.60 560.10 97.10 1986 BHl 47.85 40.40 24.05 17.76 < 0.84 20.79 34.47 229.66 56.17 1986 BH2 1937.24 3747.03 1737.53 407.75 1907.29 80.64 340.54 946.81 198.25 1986 BH3 283.94 322.63 138.03 63.63 218.64 40.68 113.61 668.96 222.93
Quincy Bay
1986 QBl 112.71 82.28 36.60 26.75 < 1.08 30.84 60.23 414.42 93.17 1986 QB2 122.68 103.77 53.56 36.36 < 1.39 31.75 43.00 413.06 87.02 1986 QB3 180.54 162.52 74.29 34.04 100.82 44.40 55.77 557.48 139.30
Buzzards Bay
1984 BBI < 1.10 17.02 < 1.10 < 1.20 < 1.20 < 1.20 < 1.10 59.79 137.90 1984 BB2 <1.00 < 1.20 < 1.10 < 1.10 < 1.10 < 1.10 < 1.10 61.36 522.71 1984 BB3 <1.00 14.16 < 1.10 < 1.10 <1.00 < 1.10 <1.00 55.36 278.68 1984 BB4 <1.00 18.64 <1.00 < 1.10 <1.00 < 1.10 <1.00 69.52 120.10 1984 BB80 < 1.00 < 1.10 < 1.00 < 1.10 < 1.00 < 1.10 < 1.00 30.98 140.19 1985 BBI < 0.46 < 0.50 < 0.48 < 0.42 < 0.41 < 0.43 < 0.39 < 0.35 22.18 1985 BB2 < 0.31 1.62 < 0.32 < 0.29 < 0.28 < 0.30 < 0.27 9.37 10.44 1985 BB3 44.03 59.76 < 0.55 < 0.48 < 0.47 < 0.49 < 0.44 29.71 14.64 1985 BB4 < 1.05 < 1.12 < 1.08 < 0.82 < 0.80 < 0.85 < 0.76 67.20 43.87 1986 BBI 91.15 6.51 10.56 4.01 < 0.91 < 0.88 47.88 96.51 14.73 1986 BB3 40.22 4.23 8.02 8.36 < 0.87 < 0.84 < 0.83 45.21 6.54 1986 BB4 < 0.89 < 0.77 < 0.92 < 0.86 < 0.88 < 0.85 < 0.84 36.48 6.37
Narragansett Bay
1984 NBI 119.52 50.19 24.58 27.74 < 1.10 7.37 26.09 233.93 326.78 1984 NB2 < 0.90 20.63 < 0.90 < 0.90 < 0.90 < 0.90 < 0.80 109.48 291.34 1984 NB3 < 0.80 21.12 14.50 < 0.80 < 0.80 6.55 9.91 65.16 99.02 1984 NB4 < 0.70 11.89 < 0.80 < 0.70 < 0.70 < 0.70 7.50 111.60 212.37 1985 NBI 69.50 48.40 35.60 12.80 < 1.70 4.40 28.40 191.00 225.30 1985 NB2 28.10 27.10 < 1.80 <1.60 <1.60 < 1.70 15.20 117.70 155.90 1985 NB3 10.40 8.40 < 0.90 < 0.80 < 0.80 <0.90 6.60 63.00 111.90 1985 NB4 29.70 14.80 7.30 49.70 <0.60 < 0.60 5.00 52.00 80.70 1986 NBI 133.88 35.55 22.35 10.46 <1.11 7.75 31.23 187.77 54.51 1986 NB2 94.20 29.70 19.08 5.52 0.89 4.59 32.99 144.79 38.81 1986 NB3 68.22 6.16 7.96 < 0.73 < 0.75 < 0.72 16.32 85.15 17.01
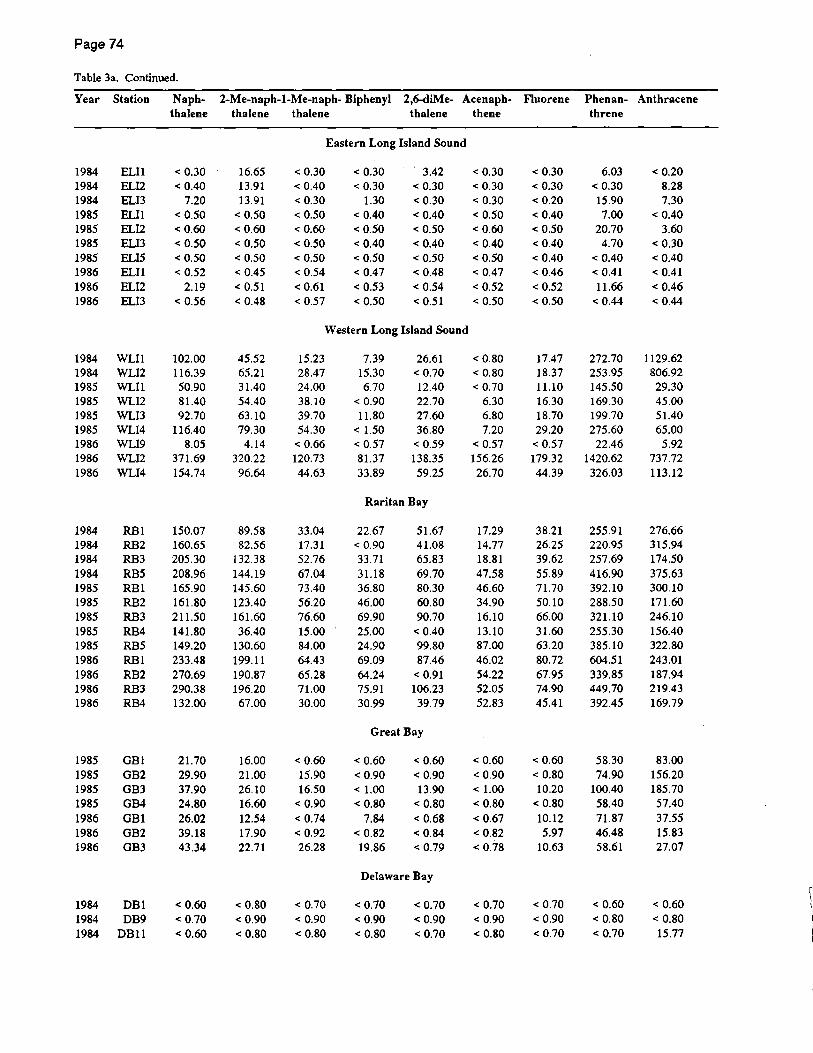
Page 74
Table 3a. Continued.
Year Station
1984 1984 1984 1985 1985 1985 1985 1986 1986 1986
ELI 1 ELI2 ELI3 ELI 1 ELI2 ELI3 ELlS ELIl ELI2 ELI3
1984 WLIl 1984 WLI2 1985 WLIl 1985 WLI2 1985 WLI3 1985 WLI4 1986 WLI9 1986 WLl2 1986 WLJ4
1984 1984 1984 1984 1985 1985 1985 1985 1985 1986 1986 1986 1986
1985 1985 1985 1985 1986 1986 1986
RBI RB2 RB3 RB5 RBI RB2 RB3 RB4 RB5 RBI RB2 RB3 RB4
GB1 GB2 GB3 GB4 GBI GB2 GB3
1984 OBI 1984 DB9 1984 DB11
Naphthalene
< 0.30 < 0.40
7.20 < 0.50 <0.60 < 0.50 < 0.50 < 0.52
2.19 < 0.56
102.00 116.39 50.90 81.40 92.70
116.40 8.05
371.69 154.74
150.Q7 160.65 205.30 208.96 165.90 161.80 211.50 141.80 149.20 233.48 270.69 290.38 132.00
21.70 29.90 37.90 24.80 26.02 39.18 43.34
< 0.60 < 0.70 <0.60
2-Me-naph-l-Me-naph- Biphenyl 2,6-diMe- Acenaph-thalene thalene thalene thene
16.65 13.91 13.91
< 0.50 < 0.60 < 0.50 < 0.50 < 0.45 < 0.51 < 0.48
45.52 65.21 31.40 54.40 63.10 79.30
4.14 320.22 96.64
89.58 82.56
132.38 144.19 145.60 123.40 161.60 36.40
130.60 199.11 190.87 196.20 67.00
16.00 21.00 26.10 16.60 12.54 17.90 22.71
< 0.80 < 0.90 < 0.80
< 0.30 < 0.40 < 0.30 < 0.50 < 0.60 < 0.50 < 0.50 < 0.54 < 0.61 < 0.57
Eastern Long Island Sound
< 0.30 < 0.30
1.30 < 0.40 < 0.50 < 0.40 < 0.50 < 0.47 < 0.53 < 0.50
3.42 < 0.30 < 0.30 < 0.40 < 0.50 < 0.40 < 0.50 < 0.48 < 0.54 < 0.51
Western Long Island Sound
15.23 28.47 24.00 38.10 39.70 54.30
< 0.66 120.73 44.63
33.04 17.31 52.76 67.04 73.40 56.20 76.60 15.00 84.00 64.43 65.28 71.00 30.00
< 0.60 15.90 16.50
< 0.90 < 0.74 < 0.92 26.28
< 0.70 < 0.90 < 0.80
7.39 15.30 6.70
< 0.90 11.80
< 1.50 < 0.57 81.37 33.89
26.61 < 0.70 12.40 22.70 27.60 36.80
< 0.59 138.35 59.25
Raritan Bay
22.67 < 0.90 33.71 31.18 36.80 46.00 69.90 25.00 24.90 69.09 64.24 75.91 30.99
51.67 41.08 65.83 69.70 80.30 60.80 90.70
< 0.40 99.80 87.46
< 0.91 106.23 39.79
Great Bay
< 0.60 < 0.90 <1.00 < 0.80
7.84 < 0.82 19.86
< 0.60 < 0.90 13.90
< 0.80 < 0.68 < 0.84 < 0.79
Delaware Bay
< 0.70 < 0.90 < 0.80
< 0.70 < 0.90 < 0.70
< 0.30 < 0.30 < 0.30 < 0.50 < 0.60 < 0.40 < 0.50 < 0.47 < 0.52 < 0.50
< 0.80 < 0.80 < 0.70
6.30 6.80 7.20
< 0.57 156.26 26.70
17.29 14.77 18.81 47.58 46.60 34.90 16.10 13.10 87.00 46.02 54.22 52.05 52.83
< 0.60 < 0.90 <1.00 < 0.80 < 0.67 < 0.82 < 0.78
< 0.70 < 0.90 < 0.80
Fluorene Phenan- Anthracene threne
< 0.30 < 0.30 < 0.20 < 0.40 < 0.50 < 0.40 < 0.40 < 0.46 < 0.52 < 0.50
6.03 < 0.30 15.90 7.00
20.70 4.70
< 0.40 < 0.41 11.66
< 0.44
17.47 272.70 18.37 253.95 11.10 145.50 16.30 169.30 18.70 199.70 29.20 275.60
< 0.57 22.46 179.32 1420.62 44.39 326.03
38.21 26.25 39.62 55.89 71.70 50.10 66.00 31.60 63.20 80.72 67.95 74.90 45.41
< 0.60 < 0.80 10.20
< 0.80 10.12 5.97
10.63
< 0.70 < 0.90 < 0.70
255.91 220.95 257.69 416.90 392.10 288.50 321.10 255.30 385.10 604.51 339.85 449.70 392.45
58.30 74.90
100.40 58.40 71.87 46.48 58.61
< 0.60 < 0.80 < 0.70
< 0.20 8.28 7.30
< 0.40 3.60
< 0.30 < 0.40 < 0.41 < 0.46 < 0.44
1129.62 806.92 29.30 45.00 51.40 65.00
5.92 737.72 113.12
276.66 315.94 174.50 375.63 300.10 171.60 246.10 156.40 322.80 243.01 187.94 219.43 169.79
83.00 156.20 185.70 57.40 37.55 15.83 27.07
< 0.60 < 0.80 15.77
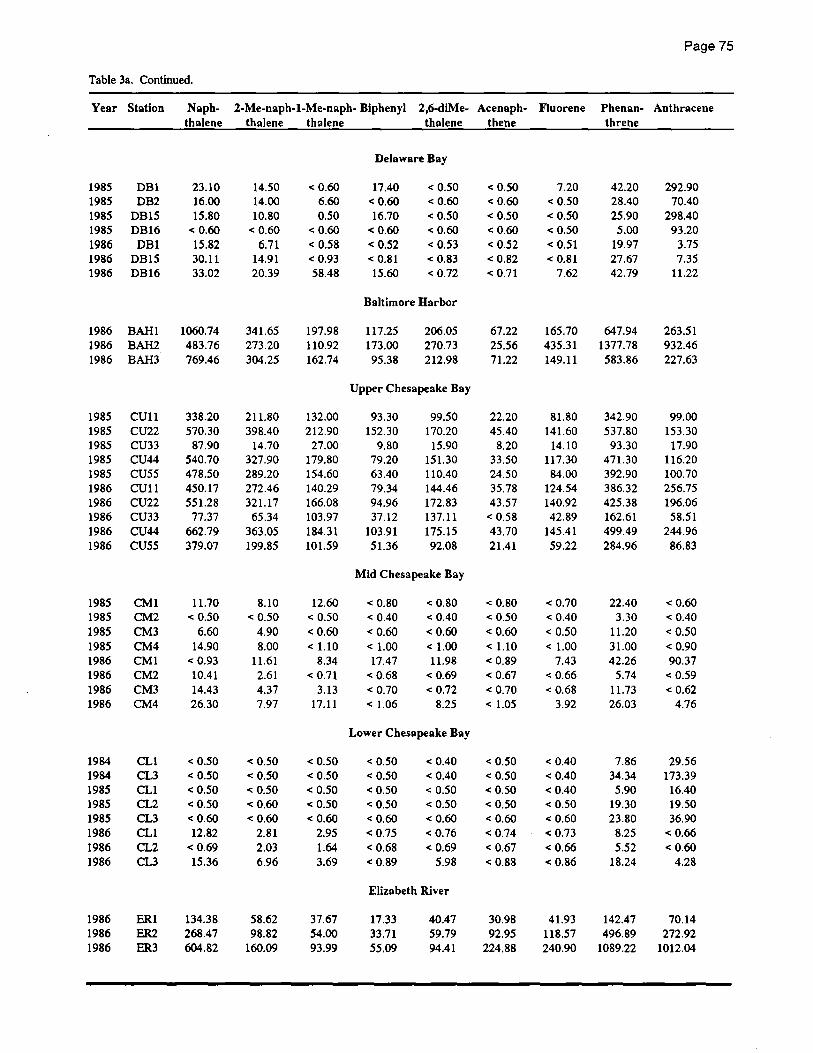
Page 75
Table 3a. Continued.
Year Station Naph- 2-Me-naph-I-Me-naph- Biphenyl 2,6-ciiMe- Acenaph- Fluorene Phenan- Anthracene thalene thalene thalene thalene thene threne
Delaware Bay
1985 OBI 23.10 14.50 <0.60 17.40 < 0.50 < 0.50 7.20 42.20 292.90 1985 OB2 16.00 14.00 6.60 < 0.60 < 0.60 < 0.60 < 0.50 28.40 70.40 1985 OB15 15.80 10.80 0.50 16.70 < 0.50 < 0.50 < 0.50 25.90 298.40 1985 OB16 < 0.60 < 0.60 < 0.60 < 0.60 < 0.60 < 0.60 < 0.50 5.00 93.20 1986 OBI 15.82 6.71 < 0.58 < 0.52 < 0.53 < 0.52 < 0.51 19.97 3.75 1986 OB15 30.11 14.91 < 0.93 < 0.81 < 0.83 < 0.82 < 0.81 27.67 7.35 1986 OB16 33.02 20.39 58.48 15.60 < 0.72 < 0.71 7.62 42.79 11.22
Baltimore Harbor
1986 BAH 1 1060.74 341.65 197.98 117.25 206.05 67.22 165.70 647.94 263.51 1986 BAH2 483.76 273.20 110.92 173.00 270.73 25.56 435.31 1377.78 932.46 1986 BAH3 769.46 304.25 162.74 95.38 212.98 71.22 149.11 583.86 227.63
Upper Chesapeake Bay
1985 CUll 338.20 211.80 132.00 93.30 99.50 22.20 81.80 342.90 99.00 1985 CU22 570.30 398.40 212.90 152.30 170.20 45.40 141.60 537.80 153.30 1985 CU33 87.90 14.70 27.00 9.80 15.90 8.20 14.10 93.30 17.90 1985 CU44 540.70 327.90 179.80 79.20 151.30 33.50 117.30 471.30 116.20 1985 CU55 478.50 289.20 154.60 63.40 110.40 24.50 84.00 392.90 100.70 1986 CUll 450.17 272.46 140.29 79.34 144.46 35.78 124.54 386.32 256.75 1986 CU22 551.28 321.17 166.08 94.96 172.83 43.57 140.92 425.38 196.06 1986 CU33 77.37 65.34 103.97 37.12 137.11 < 0.58 42.89 162.61 58.51 1986 CU44 662.79 363.05 184.31 103.91 175.15 43.70 145.41 499.49 244.96 1986 CU55 379.07 199.85 101.59 51.36 92.08 21.41 59.22 284.96 86.83
Mid Chesapeake Bay
1985 CMl 11.70 8.10 12.60 < 0.80 < 0.80 < 0.80 < 0.70 22.40 < 0.60 1985 CM2 < 0.50 < 0.50 < 0.50 < 0.40 < 0.40 < 0.50 < 0.40 3.30 < 0.40 1985 CM3 6.60 4.90 < 0.60 < 0.60 < 0.60 < 0.60 < 0.50 11.20 < 0.50 1985 CM4 14.90 8.00 < 1.10 <1.00 <1.00 < 1.10 < 1.00 31.00 < 0.90 1986 CMl < 0.93 11.61 8.34 17.47 11.98 < 0.89 7.43 42.26 90.37 1986 CM2 10.41 2.61 < 0.71 < 0.68 < 0.69 < 0.67 < 0.66 5.74 < 0.59 1986 CM3 14.43 4.37 3.13 < 0.70 < 0.72 < 0.70 < 0.68 11.73 < 0.62 1986 CM4 26.30 7.97 17.11 < 1.06 8.25 < 1.05 3.92 26.03 4.76
Lower Chesapeake Bay
1984 CLI < 0.50 < 0.50 < 0.50 < 0.50 < 0.40 < 0.50 < 0.40 7.86 29.56 1984 CL3 < 0.50 < 0.50 < 0.50 < 0.50 < 0.40 < 0.50 < 0.40 34.34 173.39 1985 CLI < 0.50 < 0.50 < 0.50 < 0.50 < 0.50 < 0.50 < 0.40 5.90 16.40 1985 CL2 < 0.50 < 0.60 < 0.50 < 0.50 < 0.50 < 0.50 < 0.50 19.30 19.50 1985 CL3 < 0.60 < 0.60 < 0.60 < 0.60 < 0.60 < 0.60 < 0.60 23.80 36.90 1986 CLI 12.82 2.81 2.95 < 0.75 < 0.76 < 0.74 < 0.73 8.25 < 0.66 1986 CL2 < 0.69 2.03 1.64 < 0.68 < 0.69 < 0.67 < 0.66 5.52 < 0.60 1986 CL3 15.36 6.96 3.69 < 0.89 5.98 < 0.88 < 0.86 18.24 4.28
Elizabeth River
1986 ERI 134.38 58.62 37.67 17.33 40.47 30.98 41.93 142.47 70.14 1986 ER2 268.47 98.82 54.00 33.71 59.79 92.95 118.57 496.89 272.92 1986 ER3 604.82 160.09 93.99 55.09 94.41 224.88 240.90 1089.22 1012.04
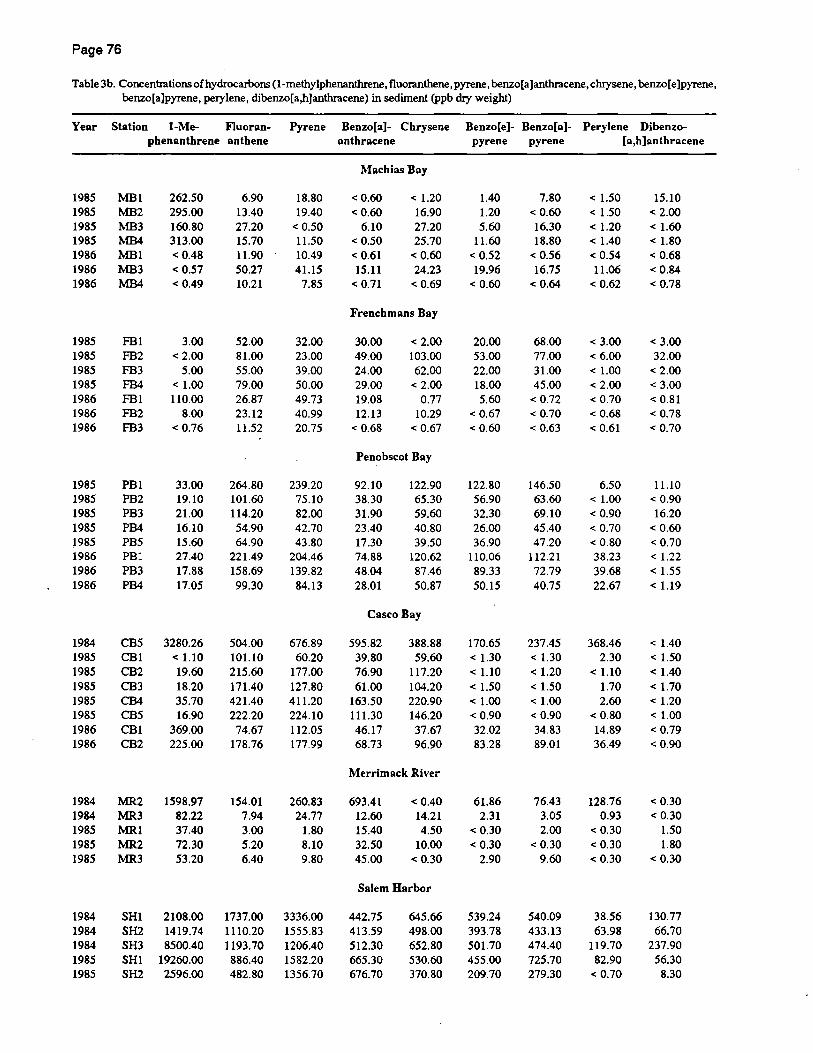
Page 76
Table 3b. Concentrations of hydrocarbons (l-methylphenanthrene, fluoranthene, pyrene, benzo[a] anthracene, chrysene, benzo[e]p)Tene, benzo[a]pyrene, perylene, dibenzo[a,h]anthracene) in sediment (ppb dry weight)
Year Station I-Me- Fluoran- Pyrene Benzo[a]- Chrysene Benzo[e]- Benzo[a]- Perylene Dibenzo-phenanthrene anthene anthracene pyrene pyrene [a,h]anthracene
Machias Bay
1985 MB1 262.50 6.90 18.80 < 0.60 < 1.20 1.40 7.80 < 1.50 15.10 1985 MB2 295.00 13.40 19.40 < 0.60 '16.90 1.20 < 0.60 < 1.50 < 2.00 1985 MB3 160.80 27.20 < 0.50 6.10 27.20 5.60 16.30 < 1.20 <1.60 1985 MB4 313.00 15.70 11.50 < 0.50 25.70 11.60 18.80 < 1.40 < 1.80 1986 MBI < 0.48 11.90 10.49 < 0.61 < 0.60 < 0.52 < 0.56 < 0.54 < 0.68 1986 MB3 < 0.57 50.27 41.15 15.11 24.23 19.96 16.75 11.06 <0.84 1986 MB4 < 0.49 10.21 7.85 < 0.71 < 0.69 < 0.60 < 0.64 < 0.62 < 0.78
Frenchmans Bay
1985 FBI 3.00 52.00 32.00 30.00 < 2.00 20.00 68.00 < 3.00 < 3.00 1985 FB2 < 2.00 81.00 23.00 49.00 103.00 53.00 77.00 < 6.00 32.00 1985 FB3 5.00 55.00 39.00 24.00 62.00 22.00 31.00 <1.00 < 2.00 1985 FB4 <1.00 79.00 50.00 29.00 < 2.00 18.00 45.00 < 2.00 < 3.00 1986 FBI 110.00 26.87 49.73 19.08 0.77 5.60 < 0.72 < 0.70 < 0.81 1986 FB2 8.00 23.12 40.99 12.13 10.29 < 0.67 < 0.70 < 0.68 < 0.78 1986 FB3 < 0.76 11.52 20.75 < 0.68 < 0.67 < 0.60 < 0.63 < 0.61 < 0.70
Penobscot Bay
1985 PBl 33.00 264.80 239.20 92.10 122.90 122.80 146.50 6.50 11.10 1985 PB2 19.10 101.60 75.10 38.30 65.30 56.90 63.60 <1.00 < 0.90 1985 PB3 21.00 114.20 82.00 31.90 59.60 32.30 69.10 < 0.90 16.20 1985 PB4 16.10 54.90 42.70 23.40 40.80 26.00 45.40 < 0.70 < 0.60 1985 PBS 15.60 64.90 43.80 17.30 39.50 36.90 47.20 < 0.80 < 0.70 1986 PB:!. 27.40 221.49 204.46 74.88 120.62 110.06 112.21 38.23 < 1.22 1986 PB3 17.88 158.69 139.82 48.04 87.46 89.33 72.79 39.68 < 1.55 1986 PB4 17.05 99.30 84.13 28.01 50.87 50.15 40.75 22.67 < 1.19
Casco Bay
1984 CB5 3280.26 504.00 676.89 595.82 388.88 170.65 237.45 368.46 < 1.40 1985 CBl < 1.10 101.10 60.20 39.80 59.60 < 1.30 < 1.30 2.30 < 1.50 1985 CB2 19.60 215.60 177.00 76.90 117.20 < 1.10 < 1.20 < 1.10 < 1.40 1985 CB3 18.20 171.40 127.80 61.00 104.20 < 1.50 < 1.50 1.70 < 1.70 1985 CB4 35.70 421.40 411.20 163.50 220.90 <1.00 <1.00 2.60 < 1.20 1985 CB5 16.90 222.20 224.10 111.30 146.20 < 0.90 < 0.90 < 0.80 <1.00 1986 CBl 369.00 74.67 112.05 46.17 37.67 32.02 34.83 14.89 < 0.79 1986 CB2 225.00 178.76 177.99 68.73 96.90 83.28 89.01 36.49 < 0.90
Merrimack River
1984 MR.2 1598.97 154.01 260.83 693.41 < 0.40 61.86 76.43 128.76 < 0.30 1984 MR.3 82.22 7.94 24.77 12.60 14.21 2.31 3.05 0.93 < 0.30 1985 MR.l 37.40 3.00 1.80 15.40 4.50 < 0.30 2.00 < 0.30 1.50 1985 MR.2 72.30 5.20 8.10 32.50 10.00 < 0.30 < 0.30 < 0.30 1.80 1985 MR.3 53.20 6.40 9.80 45.00 < 0.30 2.90 9.60 < 0.30 < 0.30
Salem Harbor
1984 SHI 2108.00 1737.00 3336.00 442.75 645.66 539.24 540.09 38.56 130.77 1984 SH2 1419.74 1110.20 1555.83 413.59 498.00 393.78 433.13 63.98 66.70 1984 SH3 8500.40 1193.70 1206.40 512.30 652.80 501.70 474.40 119.70 237.90 1985 SHI 19260.00 886.40 1582.20 665.30 530.60 455.00 725.70 82.90 56.30 1985 SH2 2596.00 482.80 1356.70 676.70 370.80 209.70 279.30 < 0.70 8.30
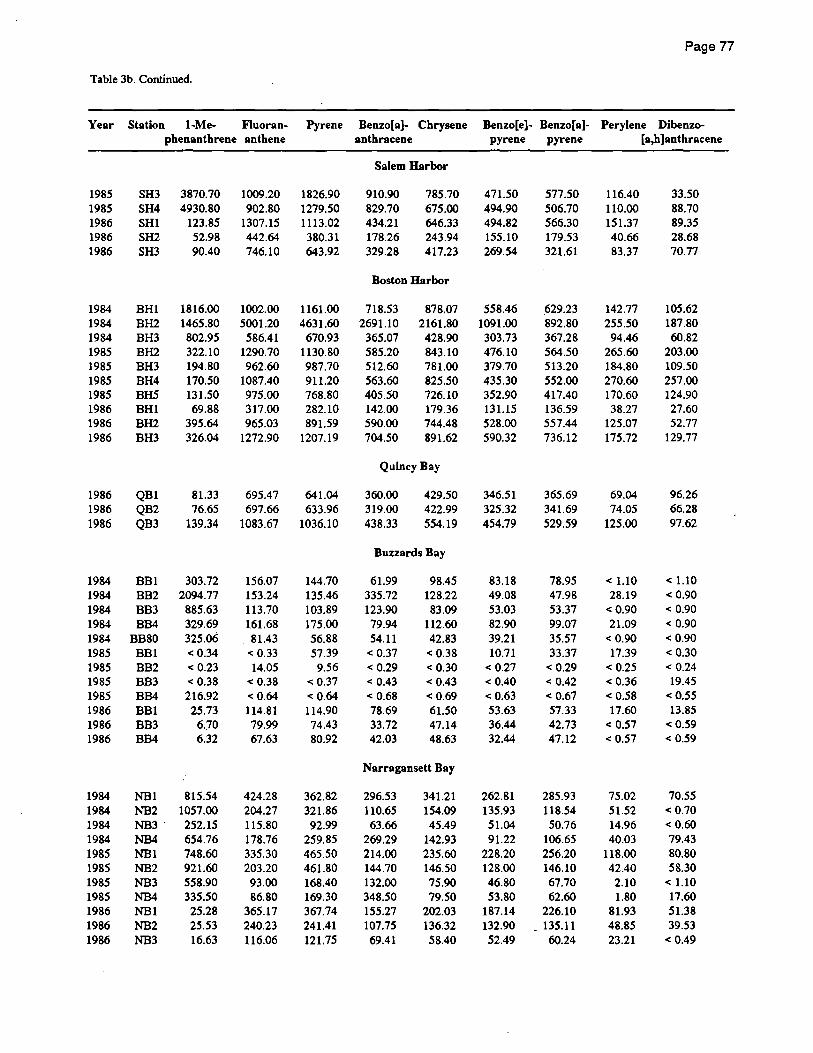
Page 77
Table 3b. Continued.
Year Station I-Me- F1uoran- Pyrene Benzo[a)- Chrysene Benzo(e)- Benzo[a)- Perylene Dibenzo-phenanthrene anthene anthracene pyrene pyrene [a,h)anthracene
Salem Harbor
1985 SH3 3870.70 1009.20 1826.90 910.90 785.70 471.50 577.50 116.40 33.50 1985 SH4 4930.80 902.80 1279.50 829.70 675.00 494.90 506.70 110.00 88.70 1986 SHI 123.85 1307.15 1113.02 434.21 646.33 494.82 566.30 151.37 89.35 1986 SH2 52.98 442.64 380.31 178.26 243.94 155.10 179.53 40.66 28.68 1986 SH3 90.40 746.10 643.92 329.28 417.23 269.54 321.61 83.37 70.77
Boston Harbor
1984 BHl 1816.00 1002.00 1161.00 718.53 878.07 558.46 629.23 142.77 105.62 1984 BH2 1465.80 5001.20 4631.60 2691.10 2161.80 1091.00 892.80 255.50 187.80 1984 BH3 802.95 586.41 670.93 365.07 428.90 303.73 367.28 94.46 60.82 1985 BH2 322.10 1290.70 1130.80 585.20 843.10 476.10 564.50 265.60 203.00 1985 BH3 194.80 962.60 987.70 512.60 781.00 379.70 513.20 184.80 109.50 1985 BH4 170.50 1087.40 911.20 563.60 825.50 435.30 552.00 270.60 257.00 1985 BHS 131.50 975.00 768.80 405.50 726.10 352.90 417.40 170.60 124.90 1986 BHl 69.88 317.00 282.10 142.00 179.36 131.15 136.59 38.27 27.60 1986 BH2 395.64 965.03 891.59 590.00 744.48 528.00 557.44 125.07 52.77 1986 BH3 326.04 1272.90 1207.19 704.50 891.62 590.32 736.12 175.72 129.77
Quincy Bay
1986 QBl 81.33 695.47 641.04 360.00 429.50 346.51 365.69 69.04 96.26 1986 QB2 76.65 697.66 633.96 319.00 422.99 325.32 341.69 74.05 66.28 1986 QB3 139.34 1083.67 1036.10 438.33 554.19 454.79 529.59 125.00 97.62
Buzzards Bay
1984 BBI 303.72 156.07 144.70 61.99 98.45 83.18 78.95 < 1.10 < 1.10 1984 BB2 2094.77 153.24 135.46 335.72 128.22 49.08 47.98 28.19 < 0.90 1984 BB3 885.63 113.70 103.89 123.90 83.09 53.03 53.37 < 0.90 < 0.90 1984 BB4 329.69 161.68 175.00 79.94 112.60 82.90 99.07 21.09 < 0.90 1984 BB80 325.06 81.43 56.88 54.11 42.83 39.21 35.57 < 0.90 < 0.90 1985 BBI < 0.34 < 0.33 57.39 < 0.37 < 0.38 10.71 33.37 17.39 < 0.30 1985 BB2 < 0.23 14.05 9.56 < 0.29 < 0.30 < 0.27 < 0.29 < 0.25 < 0.24 1985 BB3 < 0.38 < 0.38 < 0.37 < 0.43 < 0.43 < 0.40 < 0.42 < 0.36 19.45 1985 BB4 216.92 < 0.64 < 0.64 < 0.68 < 0.69 < 0.63 < 0.67 < 0.58 < 0.55 1986 BBI 25.73 114.81 114.90 78.69 61.50 53.63 57.33 17.60 13.85 1986 BB3 6.70 79.99 74.43 33.72 47.14 36.44 42.73 < 0.57 < 0.59 1986 BB4 6.32 67.63 80.92 42.03 48.63 32.44 47.12 < 0.57 < 0.59
Narragansett Bay
1984 NBI 815.54 424.28 362.82 296.53 341.21 262.81 285.93 75.02 70.55 1984 NB2 1057.00 204.27 321.86 110.65 154.09 135.93 118.54 51.52 < 0.70 1984 NB3 . 252.15 115.80 92.99 63.66 45.49 51.04 50.76 14.96 < 0.60 1984 NB4 654.76 178.76 259.85 269.29 142.93 91.22 106.65 40.03 79.43 1985 NBI 748.60 335.30 465.50 214.00 235.60 228.20 256.20 118.00 80.80 1985 NB2 921.60 203.20 461.80 144.70 146.50 128.00 146.10 42.40 58.30 1985 NB3 558.90 93.00 168.40 132.00 75.90 46.80 67.70 2.10 < 1.10 1985 NB4 335.50 86.80 169.30 348.50 79.50 53.80 62.60 1.80 17.60 1986 NBI 25.28 365.17 367.74 155.27 202.03 187.14 226.10 81.93 51.38 1986 NB2 25.53 240.23 241.41 107.75 136.32 132.90 135.11 48.85 39.53 1986 NB3 16.63 116.06 121.75 69.41 58.40 52.49 60.24 23.21 < 0.49

Page 78
Table 3b. Continued.
Year Station I-Me- Fluoran- Pyrene Benzo[a]- Chrysene Benzo[e]- Benzo[a]- Perylene Dibenzo-phenanthrene anthene anthracene pyrene pyrene [a,h]anthracene
Eastern Long Island Sound
1984 ELIl 4.39 9.21 8.68 3.97 7.37 6.64 5.05 < 0.50 < 0.60 1984 ELI2 3.05 .( 0.30 16.76 < 0.30 < 0.40 .( 0.30 6.56 < 0.60 < 0.70 1984 ELI3 4.80 < 0.20 35.90 21.30 30.60 25.90 29.00 241.40 12.70 1985 ELI 1 < 0.30 9.70 11.90 < 0.30 < 0.30 < 0.30 < 0.30 < 0.30 0.40 1985 ELI2 <0.40 34.00 35.00 21.50 .( 0.50 < 0.40 < 0.50 1.50 2.10 1985 ELI3 < 0.30 4.80 7.30 3.60 < 0.30 2.40 < 0.30 0.70 0.40 1985 ELlS < 0.40 1.30 < 0.40 < 0.50 < 0.50 < 0.50 < 0.50 4.00 0.50 1986 ELI 1 < 0.40 < 0.39 < 0.38 < 1.38 < 1.34 < 1.17 < 1.38 < 1.28 < 2.24 1986 ELI2 < 0.45 < 0.44 23.56 13.92 24.24 21.19 20.24 < 0.76 < 1.32 1986 ELI3 < 0.43 < 0.42 < 0.41 < 0.72 < 0.70 < 0.61 < 0.72 < 0.67 < 1.17
Western Long Island Sound
1984 WLll 3372.01 504.11 1845.84 498.09 399.00 305.94 783.13 95.57 80.90 1984 WLI2 2500.85 486.09 1321.23 346.28 342.55 373.75 505.31 103.95 76.94 1985 WLll 24.00 300.40 316.40 128.10 255.00 161.30 225.50 < 0.90 69.10 1985 WLI2 28.20 328.40 344.60 136.20 291.00 251.40 260.10 < 1.10 51.20 1985 WLI3 40.10 384.00 403.70 166.50 364.90 281.90 314.30 .( 1.30 63.00 1985 WLI4 27.80 479.60 516.80 203.00 443.40 289.40 368.40 < 1.90 88.60 1986 WLI9 < 0.49 3.06 42.89 12.40 25.09 27.18 26.01 7.63 <1.00 1986 WLI2 285.90 3061.53 <0.67 2084.78 1944.70 1381.81 <0.66 532.24 556.49 1986 WLI4 43.15 646.14 695.59 267.13 392.39 361.35 471.55 116.64 96.63
Raritan Bay
1984 RBI 472.83 508.10 687.23 304.00 437.47 333.52 317.19 99.20 104.96 1984 RB2 497.23 512.67 612.19 304.70 348.92 336.10 404.57 145.37 101.05 1984 RB3 130.10 576.23 672.84 347.58 491.40 400.00 454.02 190.59 106.31 1984 RB5 2030.90 762.10 837.20 472.06 554.50 402.24 523.90 184.36 109.87 1985 RBI 918.10 741.30 1335.70 568.00 631.50 461.30 544.00 247.60 115.00 1985 RB2 185.20 590.60 674.40 413.10 524.50 460.50 581.60 243.90 95.60 1985 RB3 381.80 547.30 757.60 409.60 551.00 465.40 584.50 243.40 115.90 1985 RB4 124.20 642.10 802.20 503.00 531.80 434.20 665.10 174.40 124.10 1985 RB5 1899.60 661.10 1009.90 534.10 606.80 382.00 531.00 214.50 129.70 1986 RBI 129.65 928.39 1267.41 628.56 776.84 680.05 734.89 232.19 216.36 1986 RB2 67.85 568.82 761.12 388.42 542.27 563.62 649.40 244.49 146.23 1986 RB3 113.38 721.46 975.93 503.57 664.95 556.76 664.85 264.61 176.44 1986 RB4 88.45 730.17 784.95 502.83 558.00 429.43 615.89 161.77 118.12
Great Bay
1985 GBI 250.90 75.90 70.00 74.20 59.70 43.40 61.20 37.20 1.20 1985 GB2 287.10 94.90 114.50 135.40 71.60 43.20 83.80 < 1.40 <1.40 1985 GB3 330.80 125.10 95.90 < 0.90 78.70 87.30 85.60 ·68.50 2.00 1985 GB4 80.90 80.70 54.50 180.40 36.60 27.40 57.50 < 1.50 <1.60 1986 GBI 6.08 101.16 87.33 37.14 71.23 60.11 58.31 40.47 < 0.91 1986 GB2 5.84 90.19 87.95 28.38 85.83 17.55 58.89 65.66 < 1.79 1986 GB3 9.96 111.71 111.14 57.48 120.17 73.40 77.68 62.89 <1.04
Delaware Bay
1984 OBI 185.96 26.96 22.21 < 0.50 13.43 25.68 < 0.50 .( 0.50 < 0.60 1984 DB9 533.75 < 0.70. 28.18 < 0.70 26.89 15.51 14.73 21.37 < 0.70 1984 DB 11 66.87 < 0.60 < 0.60 < 0.60 < 0.60 < 0.50 < 0.60 < 0.50 < 0.60 1985 OBI 640.90 62.90 120.40 30.70 24.20 25.50 38.40 20.50 8.50

Page 79
Table 3b. Continued.
Year Station I-Me- F1uoran- Pyrene Benzo[a]- Chrysene Benzo[e]- Benzo[a]- Perylene Dibenzo-phenanthrene anthene anthracene pyrene pyrene [a,h]anthracene
Delaware Bay
1985 DB2 101.20 29.70 42.90 27.40 24.70 9.60 18.60 49.00 <0.60 1985 DB15 648.10 33.40 56.10 39.20 23.30 15.5C 30.20 < 0.50 0.90 1985 DB16 125.00 12.10 48.10 11.40 < 0.50 0.50 1.00 < 0.70 < 0.70 1986 OBI < 0.43 29.81 24.86 24.18 17.74 13.58 15.89 < 0.45 < 0.59 1986 DB15 < 0.68 42.21 35.82 47.83 21.92 18.26 16.99 24.80 < 0.93 1986 DB16 < 0.59 54.20 44.79 27.06 27.74 24.32 21.40 41.05 < 0.79
Baltimore Harbor
1986 BAHI 97.46 1145.28 1040.96 51l.43 786.97 618.82 670.76 597.06 129.23 1986 BAH2 869.21 1857.11 1675.61 653.25 167l.97 660.41 661.31 706.96 266.06 1986 BAH3 84.72 1013.03 907.07 499.47 775.93 575.78 631.40 465.54 129.01
Upper Chesapeake Bay
1985 CUll 96.50 325.30 258.50 160.30 197.50 174.40 152.20 177.40 15.90 1985 CU22 139.80 449.90 435.40 230.80 233.20 161.80 200.40 313.10 21.00 1985 CU33 9.30 90.60 76.40 47.50 66.40 41.80 44.80 < 0.60 9.70 1985 CU44 70.80 427.50 435.80 233.40 280.10 186.40 217.50 349.90 24.90 1985 CU55 56.80 342.80 314.50 185.20 204.40 169.90 185.10 429.40 36.00 1986 CUll 446.14 369.86 335.26 129.71 186.17 127.63 135.95 157.10 22.55 1986 CU22 261.79 406.11 371.22 156.79 227.11 167.45 156.07 166.30 27.93 1986 CU33 43.88 111.11 112.81 194.82 344.22 226.73 219.07 88.64 65.13 1986 CU44 68.18 468.03 439.35 171.60 241.00 181.65 196.98 261.99 35.25 1986 CUS5 60.18 291.15 287.62 114.48 160.01 113.59 131.00 196.92 26.74
Mid Chesapeake Bay
1985 CM1 < 0.60 17.10 <0.60 < 0.80 18.50 106.10 123.40 234.60 < 0.80 1985 CM2 < 0.30 3.80 27.30 < 0.30 < 0.40 13.40 14.40 12.10 < 0.40 1985 CM3 < 0.50 9.40 64.10 < 0.50 2.60 47.90 46.50 156.50 1.10 1985 CM4 < 0.80 29.00 212.60 < 0.80 20.90 72.00 74.80 365.70 < 0.90 1986 CMl 271.58 31.93 33.16 21.16 28.67 12.80 1.69 34.46 22.60 1986 CM2 < 0.56 6.19 8.72 < 0.72 < 0.72 < 0.68 < 0.69 < 0.69 < 0.71 1986 CM3 < 0.58 8.42 7.52 < 0.95 6.35 < 0.90 < 0.91 < 0.91 < 0.94 1986 CM4 2.29 18.70 24.52 5.03 13.86 6.70 < 0.99 20.88 < 1.02
Lower Chesapeake Bay
1984 CLI 110.05 3.04 < 0.30 < 0.30 < 0.30 < 0.30 < 0.30 < 0.40 < 0.50 1984 CL3 816.34 15.31 53.22 14.72 < 0.30 7.11 < 0.30 3.50 < 0.50 1985 CL1 111.10 4.30 8.00 4.70 < 0.50 1.20 9.60 < 0.50 < 0.50 1985 CL2 115.40 22.20 22.80 11.50 < 0.50 3.80 16.70 < 0.50 < 0.50 1985 CL3 162.20 21.90 24.70 24.20 <0.60 4.70 < 0.60 < 0.70 < 0.70 1986 CLI < 0.62 7.03 11.81 < 0.71 9.45 < 0.67 <0.69 8.56 < 0.70 1986 CL2 < 0.56 5.88 3.79 < 0.76 < 0.76 < 0.72 < 0.73 8.90 < 0.75 1986 CL3 1.76 25.56 23.17 9.64 16.38 < 0.76 <0.77 19.81 < 0.79
Elizabeth River
1986 ER1 23.26 278.26 249.93 132.87 227.91 139.26 127.63 79.98 26.13 1986 ER2 56.39 1114.29 906.80 488.54 746.94 480.65 512.19 158.32 103.70 1986 ER3 150.15 2819.79 2820.84 1489.95 2796.33 499.02 2814.59 693.36 693.90
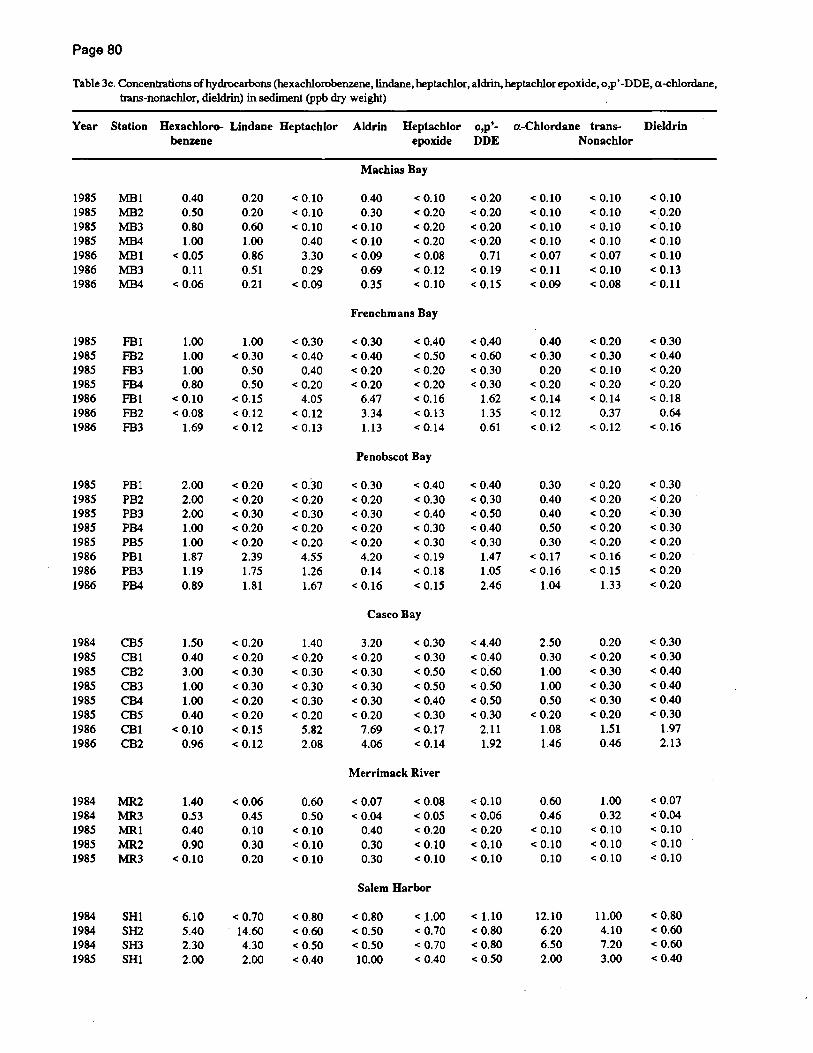
Page 80
Table 3c. Concentrations of hydrocarbons (hexachlorobenzene,lindane, heptachlor, aldrin, heptachlorepoxide, o,p' -DDE, a-chlordane, trans-nonachlor, dieldrin) in sediment (ppb dIy weight)
Year Station Hexachloro- Lindane Heptacblor Aldrin Heptachlor o,p'- a-Chlordane trans- Dieldrin benzene epoxide DDE Nonachlor
Machias Bay
1985 MB1 0.40 0.20 < 0.10 0.40 < 0.10 < 0.20 < 0.10 < 0.10 < 0.10 1985 MB2 0.50 0.20 < 0.10 0.30 <0.20 < 0.20 < 0.10 < 0.10 < 0.20 1985 MB3 0.80 0.60 < 0.10 < 0.10 < 0.20 < 0.20 < 0.10 < 0.10 < 0.10 1985 MB4 1.00 1.00 0.40 < 0.10 < 0.20 <'0.20 < 0.10 < 0.10 < 0.10 1986 MB1 < 0.05 0.86 3.30 < 0.09 < 0.08 0.71 < 0.07 < 0.07 < 0.10 1986 MB3 0.11 0.51 0.29 0.69 < 0.12 < 0.19 < 0.11 < 0.10 < 0.13 1986 MB4 < 0.06 0.21 < 0.09 0.35 < 0.10 < 0.15 <0.09 < 0.08 < 0.11
Frenchmans Bay
1985 FBI 1.00 1.00 < 0.30 < 0.30 < 0.40 < 0.40 0.40 < 0.20 < 0.30 1985 FB2 1.00 < 0.30 < 0.40 <0.40 < 0.50 < 0.60 < 0.30 < 0.30 < 0.40 1985 FB3 1.00 0.50 0.40 < 0.20 < 0.20 < 0.30 0.20 < 0.10 < 0.20 1985 FB4 0.80 0.50 < 0.20 < 0.20 < 0.20 < 0.30 < 0.20 < 0.20 < 0.20 1986 FBl < 0.10 < 0.15 4.05 6.47 < 0.16 1.62 < 0.14 < 0.14 < 0.18 1986 FB2 < 0.08 < 0.12 < 0.12 3.34 < 0.13 1.35 < 0.12 0.37 0.64 1986 FB3 1.69 < 0.12 < 0.13 1.13 < 0.14 0.61 < 0.12 < 0.12 < 0.16
Penobscot Bay
1985 PBl 2.00 < 0.20 < 0.30 < 0.30 < 0.40 < 0.40 0.30 < 0.20 < 0.30 1985 PB2 2.00 < 0.20 < 0.20 < 0.20 < 0.30 < 0.30 0.40 < 0.20 < 0.20 1985 PB3 2.00 < 0.30 < 0.30 < 0.30 < 0.40 < 0.50 0.40 < 0.20 < 0.30 1985 PB4 1.00 < 0.20 < 0.20 < 0.20 < 0.30 < 0.40 0.50 < 0.20 < 0.30 1985 PB5 1.00 < 0.20 < 0.20 < 0.20 < 0.30 < 0.30 0.30 < 0.20 < 0.20 1986 PBl 1.87 2.39 4.55 4.20 < 0.19 1.47 < 0.17 < 0.16 < 0.20 1986 PB3 1.19 1.75 1.26 0.14 < 0.18 1.05 < 0.16 < 0.15 < 0.20 1986 PB4 0.89 1.81 1.67 < 0.16 < 0.15 2.46 1.04 1.33 < 0.20
Casco Bay
1984 CB5 1.50 < 0.20 1.40 3.20 < 0.30 < 4.40 2.50 0.20 < 0.30 1985 CBl 0.40 < 0.20 < 0.20 < 0.20 < 0.30 < 0.40 0.30 < 0.20 < 0.30 1985 CB2 3.00 < 0.30 < 0.30 < 0.30 < 0.50 < 0:60 1.00 < 0.30 < 0.40 1985 CB3 1.00 < 0.30 < 0.30 < 0.30 < 0.50 < 0.50 1.00 < 0.30 < 0.40 1985 CB4 1.00 < 0.20 < 0.30 < 0.30 < 0.40 < 0.50 0.50 < 0.30 < 0.40 1985 CB5 0.40 < 0.20 < 0.20 < 0.20 < 0.30 < 0.30 < 0.20 < 0.20 < 0.30 1986 CBl < 0.10 < 0.15 5.82 7.69 < 0.17 2.11 1.08 1.51 1.97 1986 CB2 0.96 < 0.12 2.08 4.06 < 0.14 1.92 1.46 0.46 2.13
Merrimack River
1984 MR2 1.40 < 0.06 0.60 < 0.07 < 0.08 < 0.10 0.60 1.00 < 0.07 1984 MRJ 0.53 0.45 0.50 < 0.04 < 0.05 < 0.06 0.46 0.32 <0.04 1985 MRI 0.40 0.10 < 0.10 0.40 < 0.20 <0.20 < 0.10 < 0.10 < 0.10 1985 MR2 0.90 0.30 < 0.10 0.30 < 0.10 < 0.10 < 0.10 < 0.10 < 0.10 1985 MRJ < 0.10 0.20 < 0.10 0.30 < 0.10 < 0.10 0.10 < 0.10 < 0.10
Salem Harbor
1984 SHI 6.10 < 0.70 < 0.80 < 0.80 <.1.00 < 1.10 12.10 11.00 < 0.80 1984 SH2 5.40 14.60 < 0.60 < 0.50 < 0.70 < 0.80 6.20 4.10 < 0.60 1984 SH3 2.30 4.30 < 0.50 < 0.50 < 0.70 < 0.80 6.50 7.20 < 0.60 1985 SHI 2.00 2.00 < 0.40 10.00 < 0.40 < 0.50 2.00 3.00 < 0.40

Page 81
Table 3c. Continued.
Year Station Hexachloro- Lindane Heptachlor Aldrin Heptachlor o,p'- a-Chlordane trans- Dieldrin benzene epoxide DDE Nonachlor
Salem Harbor
1985 SH2 < 0.20 0.90 < 0.20 3.00 < 0.30 < 0.30 1.00 2.00 < 0.20 1985 SH3 1.00 2.00 < 0.30 6.00 < 0.30 < 0.40 2.00 3.00 < 0.30 1985 SH4 2.00 4.00 < 0.50 4.00 < 0.60 < 0.70 2.00 3.00 < 0.50 1986 SHI 1.16 0.90 2.34 0.43 < 0.24 < 0.42 < 0.22 2.79 < 0.27 1986 SH2 0.48 0.74 0.43 0.02 < 0.13 < 0.23 < 0.12 1.32 < 0.15 1986 SH3 1.21 1.97 0.51 0.10 < 0.33 < 0.57 < 0.29 2.49 < 0.37
Boston Harbor
1984 BHl 1.98 < 0.30 < 0.40 < 0.30 <0.40 < 0.50 5.57 5.03 1.31 1984 BH2 2.54 < 0.07 < 0.07 < 0.07 < 0.10 357.72 < 0.07 6.64 < 0.08 1984 BH3· 0.31 0.43 0.76 1.98 <0.09 < 0.10 3.34 3.01 0.93 1985 BH2 1.00 < 0.10 < 0.20 3.00 < 0.20 < 0.30 5.00 4.00 4.00 1985 BH3 0.40 < 0.20 < 0.20 < 0.20 < 0.30 < 0.30 3.00 3.00 1.00 1985 BH4 1.00 < 0.20 < 0.20 < 0.20 < 0.30 < 0.40 3.00 3.00 1.00 1985 BHS 0.80 < 0.20 < 0.20 < 0.20 < 0.30 < 0.40 4.00 3.00 1.00 1986 BHl 0.24 0.31 < 0.10 < 0.12 < 0.11 < 0.20 0.92 0.74 < 0.13 1986 BH2 1.74 1.79 < 0.23 < 0.28 < 0.25 < 0.44 6.88 5.09 < 0.29 1986 BH3 0.87 2.17 < 0.15 0.25 < 0.17 < 0.29 < 0.15 5.29 < 0.19
Quincy Bay
1986 QBl 0.33 0.40 < 0.16 < 0.20 < 0.18 < 0.31 2.95 2.70 < 0.20 1986 QB2 0.50 1.02 < 0.20 0.56 < 0.22 < 0.39 3.66 3.18 < 0.25 1986 QB3 1.20 1.19 < 0.19 0.40 < 0.21 < 0.36 5.40 5.26 < 0.24
Buzzards Bay
1984 BBI < 0.40 < 0.40 < 0.70 < 0.50 < 0.60 < 0.70 < 0.40 <0.40 < 0.50 1984 BB2 < 0.10 < 0.20 < 0.20 < 0.20 < 0.20 < 0.30 < 0.10 < 0.10 < 0.20 1984 BB3 1.69 < 0.07 <0.07 < 0.07 < 0.10 0.48 < 0.07 0.58 < 0.08 1984 BB4 < 0.10 < 0.10 < 0.10 < 0.10 < 0.10 < 0.10 < 0.10 < 0.10 < 0.10 1984 BB80 < 0.10 < 0.10 < 0.20 < 0.10 < 0.20 < 0.20 < 0.20 < 0.10 < 0.10 1985 BBI < 0.03 5.00 < 0.05 < 0.04 < 0.05 <0.06 < 0.03 < 0.03 0.40 1985 BB2 < 0.02 < 0.02 < 0.03 < 0.02 < 0.03 < 0.03 < 0.02 < 0.02 0.20 1985 BB3 < 0.03 0.90 < 0.05 < 0.04 < 0.05 <0.06 < 0.04 < 0.03 <0.04 1985 BB4 <0.04 5.00 < 0.06 < 0.05 < 0.07 < 0.08 < 0.05 < 0.05 < 0.06 1986 BBI 1.69 < 0.19 4.82 6.85 1.10 < 0.34 < 0.17 0.19 < 0.22 1986 BB3 0.43 < 0.11 1.49 1.10 < 0.11 < 0.19 < 0.10 < 0.09 < 0.13 1986 BB4 < 0.13 < 0.18 1.37 < 0.20 < 0.18 < 0.32 < 0.17 < 0.16 < 0.21
Narragansett Bay
1984 NBI 1.46 1.52 < 0.40 4.13 < 0.30 < 0.40 2.73 1.97 1.94 1984 NB2 0.80 0.23 1.27 1.25 < 0.10 < 0.10 1.52 1.13 2.00 1984 NB3 0.45 1.14 < 0.10 1.26 < 0.10 < 0.10 0.82 0.61 1.03 1984 NB4 1.39 < 0.10 1.16 < 0.10 < 0.20 <0.20 1.17 0.86 < 0.20 1985 NBI 2.00 < 0.50 < 0.60 4.00 < 0.90 <1.00 3.00 3.00 4.00 1985 NB2 3.00 < 0.50 < 0.60 -6.00 < 0.90 <1.00 4.00 3.00 4.00 1985 NB3 < 0.20 < 0.20 < 0.20 4.00 < 0.30 < 0.30 0.60 0.50 0.50 1985 NB4 < 0.20 < 0.20 < 0.20 3.00 < 0.30 0.80 0.80 < 0.20 < 0.30 1986 NBI < 0.17 3.31 5.01 8.72 . < 0.25 < 0.43 1.55 1.21 2.02 1986 NB2 < 0.11 10.21 < 0.15 7.50 0.36 < 0.28 1.36 1.14 2.00 1986 NB3 2.01 7.38 < 0.19 3.13 < 0.20 < 0.34 1.73 2.77 4.11
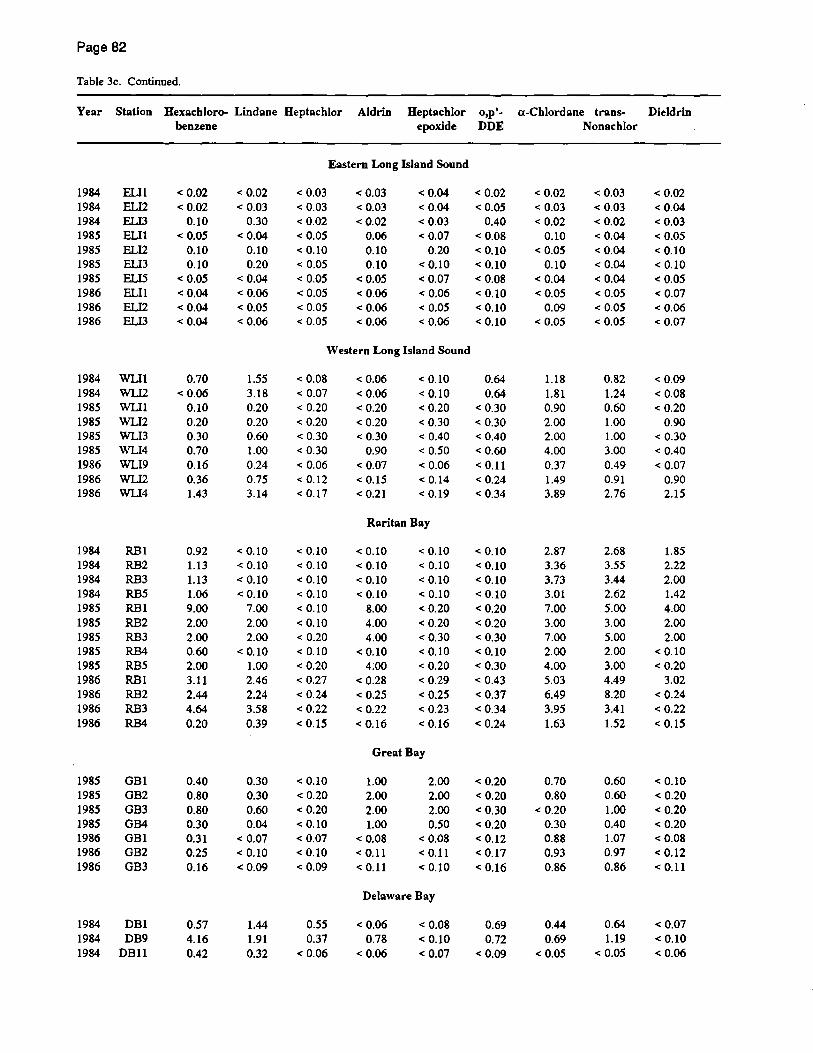
Page 82
Table 3c. Continued.
Year Station Hexacbloro- Lindane Heptacblor Aldrin benzene
Heptachlor o,p'- a-Chlordane trans- Dieldrin
1984 ELIl 1984 ELI2 1984 ELI3 1985 ELIl 1985 ELI2 1985 ELI3 1985 ELlS 1986 ELI 1 1986 ELI2 1986 ELI3
1984 WLI1 1984 WLI2 1985 WLIl 1985 WLI2 1985 WLI3 1985 WLI4 1986 WLI9 1986 WLI2 1986 WLI4
1984 1984 1984 1984 1985 1985 1985 1985 1985 1986 1986 1986 1986
1985 1985 1985 1985 1986 1986 1986
RBI RB2 RB3 RB5 RBI RB2 RB3 RB4 RB5 RBI RB2 RB3 RB4
GB1 GB2 GB3 GB4 GB1 GB2 GB3
1984 OBI 1984 DB9 1984 DB11
< 0.02 < 0.02
0.10 < 0.05
0.10 0.10
< 0.05 < 0.04 < 0.04 < 0.04
0.70 < 0.06
0.10 0.20 0.30 0.70 0.16 0.36 1.43
0.92 1.13 1.13 1.06 9.00 2.00 2.00 0.60 2.00 3.11 2.44 4.64 0.20
0.40 0.80 0.80 0.30 0.31 0.25 0.16
0.57 4.16 0.42
< 0.02 < 0.03
0.30 < 0.04
0.10 0.20
< 0.04 < 0.06 < 0.05 < 0.06
1.55 3.18 0.20 0.20 0.60 1.00 0.24 0.75 3.14
< 0.10 < 0.10 < 0.10 < 0.10
7.00 2.00 2.00
< 0.10 1.00 2.46 2.24 3.58 0.39
0.30 0.30 0.60 0.04
< 0.07 < 0.10 < 0.09
1.44 1.91 0.32
epoxide DDE Nonacblor
< 0.03 < 0.03 < 0.02 < 0.05 < 0.10 < 0.05 < 0.05 < 0.05 < 0.05 < 0.05
Eastern Long Island Sound
< 0.03 < 0.03 < 0.02
0.06 0.10 0.10
< 0.05 < 0.06 < 0.06 < 0.06
< 0.04 < 0.04 < 0.03 < 0.07
0.20 < 0.10 < 0.07 < 0.06 < 0.05 < 0.06
Western Long Island Sound
< 0.08 < 0.07 < 0.20 < 0.20 < 0.30 < 0.30 < 0.06 < 0.12 < 0.17
< 0.10 < 0.10 < 0.10 < 0.10 < 0.10 < 0.10 < 0.20 < 0.10 < 0.20 < 0.27 < 0.24 < 0.22 < 0.15
< 0.10 < 0.20 < 0.20 < 0.10 < 0.07 < 0.10 < 0.09
0.55 0.37
< 0.06
< 0.06 < 0.06 < 0.20 < 0.20 < 0.30
0.90 < 0.07 < 0.15 < 0.21
< 0.10 < 0.10 < 0.20 < 0.30 < 0.40 < 0.50 < 0.06 < 0.14 < 0.19
Raritan Bay
< 0.10 < 0.10 < 0.10 < 0.10
8.00 4.00 4.00
< 0.10 4:00
< 0.28 < 0.25 < 0.22 < 0.16
< 0.10 < 0.10 < 0.10 < 0.10 < 0.20 < 0.20 < 0.30 < 0.10 < 0.20 < 0.29 < 0.25 < 0.23 < 0.16
Great Bay
1.00 2.00 2.00 1.00
< 0.08 < 0.11 < 0.11
2.00 2.00 2.00 0.50
< 0.08 < 0.11 < 0.10
Delaware Bay
< 0.06 0.78
< 0.06
< 0.08 < 0.10 < 0.07
< 0.02 < 0.05
0.40 < 0.08 < 0.10 < 0.10 < 0.08 < 0.10 < 0.10 < 0.10
0.64 0.64
< 0.30 < 0.30 < 0.40 < 0.60 < 0.11 < 0.24 < 0.34
< 0.10 < 0.10 < 0.10 < 0.10 < 0.20 < 0.20 < 0.30 < 0.10 < 0.30 < 0.43 < 0.37 < 0.34 < 0.24
< 0.20 < 0.20 < 0.30 < 0.20 < 0.12 < 0.17 < 0.16
0.69 0.72
<0.09
< 0.02 < 0.03 < 0.02
0.10 < 0.05
0.10 < 0.04 < 0.05
0.09 < 0.05
1.18 1.81 0.90 2.00 2.00 4.00 0.37 1.49 3.89
2.87 3.36 3.73 3.01 7.00 3.00 7.00 2.00 4.00 5.03 6.49 3.95 1.63
0.70 0.80
< 0.20 0.30 0.88 0.93 0.86
0.44 0.69
< 0.05
< 0.03 < 0.03 <0.02 < 0.04 < 0.04 < 0.04 < 0.04 < 0.05 < 0.05 < 0.05
0.82 1.24 0.60 1.00 1.00 3.00 0.49 0.91 2.76
2.68 3.55 3.44 2.62 5.00 3.00 5.00 2.00 3.00 4.49 8.20 3.41 1.52
0.60 0.60 1.00 0.40 1.07 0.97 0.86
0.64 1.19
< 0.05
< 0.02 < 0.04 < 0.03 < 0.05 < 0.10 < 0.10 < 0.05 < 0.07 < 0.06 < 0.07
< 0.09 < 0.08 < 0.20
0.90 < 0.30 < 0.40 < 0.07
0.90 2.15
1.85 2.22 2.00 1.42 4.00 2.00 2.00
< 0.10 < 0.20
3.02 < 0.24 < 0.22 < 0.15
< 0.10 < 0.20 < 0.20 < 0.20 < 0.08 < 0.12 < 0.11
< 0.07 < 0.10 < 0.06

Page 83
Table 3c. Continued.
Year Station Bexachloro- Lindane Heptachlor Aldrin Heptachloro,p' -DDE a-Chlordane trans- Dieldrin benzene epoxide Nonachlor
Delaware Bay
1985 DB1 1.00 1.00 < 0.20 < 0.10 < 0.20 < 0.20 17.00 21.00 3.00 1985 DB2 1.00 1.00 < 0.20 1.00 < 0.20 < 0.30 4.00 6.00 1.00 1985 DB15 1.00 1.00 < 0.20 1.00 < 0.20 < 0.20 6.00 8.00 1.00 1985 DB16 < 0.20 <0.20 < 0.20 1.00 < 0.30 < 0.30 1.00 0.30 < 0.20 1986 DB1 0.17 0.32 0.13 < 0.06 <0.06 0.98 0.40 0.47 < 0.07 1986 DB15 1.18 0.94 < 0.09 < 0.11 <0.10 < 0.16 0.96 1.04 < 0.11 1986 DB16 0.49 0.86 < 0.09 < 0.10 < 0.10 < 0.15 0.62 0.40 < 0.11
Baltimore Harbor
1986 BAH1 12.40 < 0.20 < 0.19 < 0.24 < 0.22 < 0.38 7.05 4.11 < 0.25 1986 BAH2 2.34 < 0.46 < 0.43 < 0.54 < 0.49 < 0.86 4.66 1.45 3.89 1986 BAH3 3.81 < 0.55 < 0.51 < 0.64 < 0.58 < 1.02 5.92 3.72 2.66
Upper Chesapeake Bay
1985 CUll 1.00 < 0.20 < 0.20 0.20 < 0.30 < 0.30 0.70 0.80 < 0.20 1985 CU22 1.00 < 0.10 < 0.20 0.90 < 0.20 < 0.30 1.00 1.00 < 0.20 1985 CU33 0.70 < 0.10 < 0.10 0.40 < 0.10 < 0.10 0.20 0.40 < 0.10 1985 CU44 1.00 0.60 < 0.10 1.00 < 0.20 < 0.20 1.00 0.70 < 0.10 1985 CUSS 2.00 < 0.10 < 0.10 1.00 < 0.20 < 0.20 0.90 0.70 < 0.10 1986 CUll 1.28 2.29 2.16 < 0.18 < 0.16 1.25 1.81 1.72 1.60 1986 CU22 1.33 1.63 1.83 < 0.29 < 0.27 1.44 1.80 1.42 < 0.30 1986 CU33 0.53 0.47 0.93 < 0.21 < 0.19 < 0.34 < 0.17 < 0.16 < 0.22 1986 CU44 1.37 2.61 < 0.19 < 0.23 < 0.21 1.62 2.00 1.46 1.92 1986 CUSS 0.42 0.27 < 0.12 < 0.15 < 0.13 < 0.23 1.13 0.81 0.94
Mid Chesapeake Bay
1985 CM1 < 0.10 < 0.09 < 0.10 < 0.10 < 0.20 < 0.20 0.50 < 0.10 < 0.10 1985 CM2 < 0.05 < 0.05 < 0.07 <0.06 < 0.09 < 0.10 < 0.05 < 0.05 < 0.07 1985 CM3 < 0.10 < 0.10 < 0.10 < 0.10 < 0.10 < 0.10 0.20 < 0.10 < 0.10 1985 CM4 < 0.10 < 0.10 < 0.20 < 0.10 < 0.20 < 0.20 0.40 0.20 < 0.20 1986 CM1 1.08 3.58 2.61 < 0.19 1.09 < 0.30 1.09 1.79 1.54 1986 CM2 <0.06 < 0.08 < 0.08 < 0.10 < 0.09 < 0.15 < 0.08 < 0.08 < 0.10 1986 CM3 < 0.07 0.15 < 0.08 < 0.10 < 0.09 < 0.16 < 0.08 < 0.08 < 0.11 1986 CM4 < 0.10 0.26 < 0.13 < 0.16 < 0.15 < 0.25 < 0.13 < 0.13 < 0.17
Lower Chesapeake Bay
1984 CL1 0.74 1.05 < 0.04 <0.04 < 0.05 < 0.06 0.35 0.27 < 0.04 1984 CL3 0.51 0.64 0.55 <0.06 < 0.08 < 0.09 0.64 0.58 0.62 1985 CL1 0.50 0.60 < 0.10 0.20 < 0.10 < 0.10 0.20 0.40 < 0.10 1985 CL2 0.40 0.50 < 0.10 0.20 < 0.10 < 0.10 0.20 0.50 < 0.10 1985 CL3 0.60 0.60 < 0.10 0.90 < 0.20 < 0.20 0.60 0.90 < 0.10 1986 CL1 < 0.07 0.15 < 0.09 < 0.11 < 0.10 < 0.17 < 0.09 <0.09 < 0.11 1986 CL2 <0.06 0.15 < 0.08 < 0.09 < 0.09 < 0.15 < 0.08 < 0.07 < 0.10 1986 CL3 < 0.08 0.59 < 0.10 < 0.12 < 0.11 < 0.19 0.22 < 0.10 < 0.13
Elizabeth River
1986 ER1 0.36 < 0.21 < 0.19 < 0.24 < 0.22 < 0.38 1.41 1.60 1.15 1986 ER2 0.52 0.42 < 0.16 < 0.20 < 0.18 < 0.32 2.06 1.38 < 0.21 1986 ER3 0.66 < 0.29 < 0.27 < 0.34 < 0.31 < 0.55 2.06 1.16 < 0.36
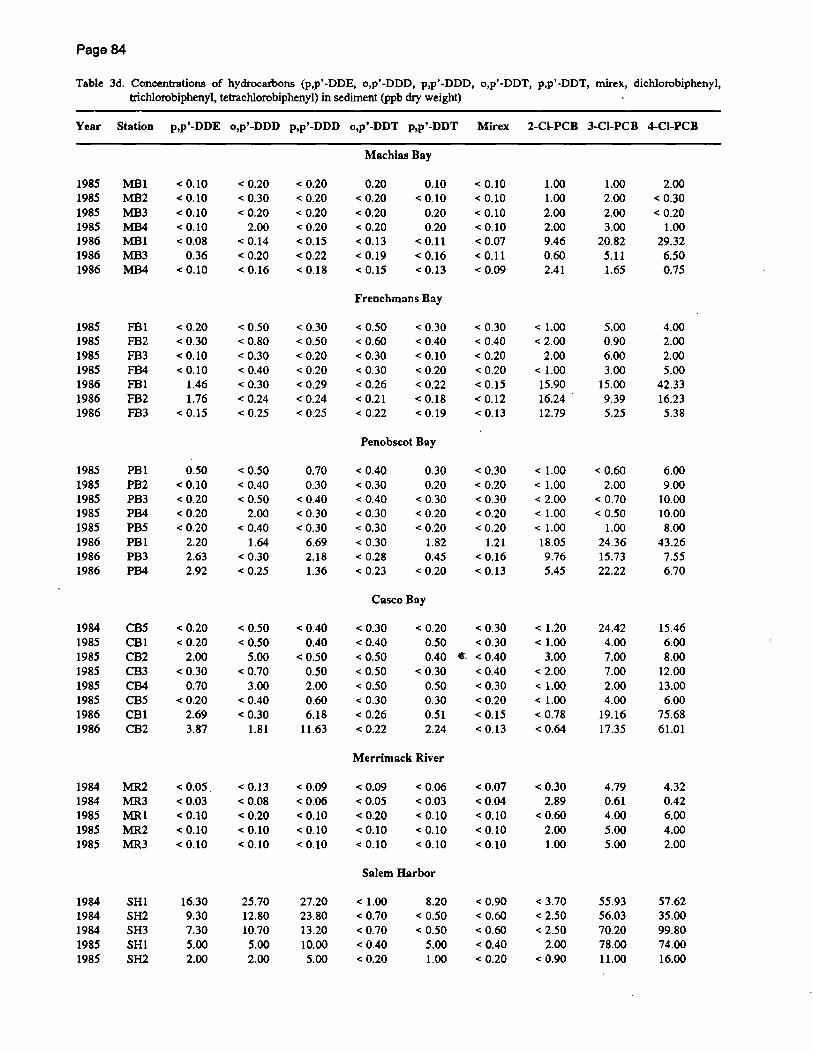
Page 84
Table 3d. Concentrations of hydrocarbons (p,p'-DDE, o,p'-DDD, p,p'-DDD, o,p'-DDT, p,p'-DDT, mirex, dichlorobiphenyl, trichlorobiphenyl, tetrachlorobiphenyl) in sediment (ppb dry weight)
Year Station p,p'-DDE o,p'-DDD p,p'-DDD o,p'-DDTp,p'-DDT Mirex 2-CI-PCB 3-CI-PCB 4-CI-PCB
1985 1985 1985 1985 1986 1986 1986
1985 1985 1985 1985 1986 1986 1986
1985 1985 1985 1985 1985 1986 1986 1986
1984 1985 1985 1985 1985 1985 1986 1986
1984 1984 1985 1985 1985
1984 1984 1984 1985 1985
MBI MB2 MB3 MB4 MBI MB3 MB4
FBI FB2 FB3 FB4 FBI FB2 FB3
PBI PB2 PB3 PB4 PBS PBl PB3 PB4
CBS CBl CB2 CB3 CB4 CBS CBl CB2
MR2 MR3 MRI MR2 MR3
SHI SH2 SH3 SHI SH2
< 0.10 < 0.10 < 0.10 < 0.10 < 0.08
0.36 < 0.10
<0.20 < 0.30 < 0.10 < 0.10
1.46 1.76
< 0.15
0.50 < 0.10 < 0.20 < 0.20 < 0.20
2.20 2.63 2.92
< 0.20 < 0.20
2.00 < 0.30
0.70 < 0.20
2.69 3.87
< 0.05 < 0.03 < 0.10 < 0.10 < 0.10
16.30 9.30 7.30 5.00 2.00
< 0.20 < 0.30 < 0.20
2.00 < 0.14 < 0.20 < 0.16
< 0.50 < 0.80 < 0.30 < 0.40 < 0.30 < 0.24 < 0.25
< 0.50 < 0.40 < 0.50
2.00 < 0.40
1.64 < 0.30 < 0.25
< 0.50 < 0.50
5.00 < 0.70
3.00 < 0.40 < 0.30
1.81
< 0.13 < 0.08 < 0.20 < 0.10 < 0.10
25.70 12.80 10.70
5.00 2.00
<0.20 < 0.20 < 0.20 < 0.20 < 0.15 < 0.22 < 0.18
< 0.30 < 0.50 < 0.20 < 0.20 < 0.29 < 0.24 < 0.25
0.70 0.30
< 0.40 < 0.30 < 0.30
6.69 2.18 1.36
< 0.40 0.40
< 0.50 0.50 2.00 0.60 6.18
11.63
< 0.09 < 0.06 < 0.10 < 0.10 < 0.10
27.20 23.80 13.20 10.00 5.00
Machias Bay
0.20 < 0.20 < 0.20 < 0.20 < 0.13 < 0.19 < 0.15
0.10 < 0.10
0.20 0.20
< 0.11 < 0.16 < 0.13
< 0.10 < 0.10 < 0.10 < 0.10 < 0.07 < 0.11 < 0.09
Frenchmans Bay
< 0.50 < 0.60 < 0.30 < 0.30 < 0.26 < 0.21 < 0.22
< 0.30 < 0.40 < 0.10 < 0.20 < 0.22 < 0.18 < 0.19
< 0.30 < 0.40 < 0.20 < 0.20 < 0.15 < 0.12 < 0.13
Penobscot Bay
< 0.40 < 0.30 < 0.40 < 0.30 < 0.30 < 0.30 < 0.28 < 0.23
0.30 0.20
< 0.30 < 0.20 < 0.20
1.82 0.45
< 0.20
< 0.30 < 0.20 < 0.30 < 0.20 < 0.20
1.21 < 0.16 < 0.13
Casco Bay
< 0.30 <0.40 < 0.50 < 0.50 < 0.50 < 0.30 < 0.26 < 0.22
< 0.20 < 0.30 0.50 < 0.30 0.40 ¢- < 0.40
< 0.30 < 0.40 0.50 < 0.30 0.30 < 0.20 0.51 < 0.15 2.24 < 0.13
Merrimack River
<0.09 < 0.05 < 0.20 < 0.10 < 0.10
< 0.06 < 0.03 < 0.10 < 0.10 < 0.10
Salem Harbor
<1.00 < 0.70 < 0.70 < 0.40 < 0.20
8.20 < 0.50 < 0.50
5.00 1.00
< 0.07 < 0.04 < 0.10 < 0.10 < 0.10
< 0.90 < 0.60 <0.60 < 0.40 < 0.20
1.00 1.00 2.00 2.00 9.46 0.60 2.41
<1.00 < 2.00
2.00 <1.00 15.90 16.24 12.79
<1.00 <1.00 < 2.00 <1.00 <1.00 18.05 9.76 5.45
< 1.20 <1.00
3.00 < 2.00 <1.00 <1.00 < 0.78 < 0.64
< 0.30 2.89
<0.60 2.00 1.00
< 3.70 < 2.50 < 2.50
2.00 < 0.90
1.00 2.00 2.00 3.00
20.82 5.11 1.65
5.00 0.90 6.00 3.00
15.00 9.39 5.25
< 0.60 2.00
< 0.70 < 0.50
1.00 24.36 15.73 22.22
24.42 4.00 7.00 7.00 2.00 4.00
19.16 17.35
4.79 0.61 4.00 5.00 5.00
55.93 56.03 70.20 78.00 11.00
2.00 < 0.30 < 0.20
1.00 29.32
6.50 0.75
4.00 2.00 2.00 5.00
42.33 16.23 5.38
6.00 9.00
10.00 10.00 8.00
43.26 7.55 6.70
15.46 6.00 8.00
12.00 13.00 6.00
75.68 61.01
4.32 0.42 6.00 4.00 2.00
57.62 35.00 99.80 74.00 16.00

Page 85
Table 3d. Continued.
Year Station p,p'-DDE o,p'-DDD p,p'-DDD o,p'-DDT p,p'-DDT Mirex 2-CI-PCB 3-CI-PCB 4-CI-PCB
Salem Harbor
1985 SH3 4.00 5.00 9.00 < 0.30 2.00 < 0.30 <1.00 17.00 34.00 1985 SH4 6.00 4.00 9.00 < 0.50 2.00 < 0.50 5.00 27.00 37.00 1986 SHI 10.60 7.01 21.86 3.53 2.61 2.33 <1.11 15.24 89.58 1986 SH2 4.41 3.70 5.90 0.43 0.78 1.22 1.47 0.74 < 0.32 1986 SH3 8.87 5.66 17.89 8.10 4.00 2.04 12.60 17.52 15.60
Boston Harbor
1984 BHl 4.83 3.95 5.33 < 0.40 < 0.30 < 0.30 <1.60 29.77 72.75 1984 BH2 11.81 < 0.10 234.86 < 0.10 < 0.07 0.59 6.88 3447.80 23222.00 1984 BH3 3.11 2.37 4.91 < 0.10 < 0.05 1.83 < 0.40 17.89 48.94 1985 BH2 6.00 4.00 9.00 < 0.30 2.00 0.70 2.00 86.00 78.00 1985 BH3 4.00 3.00 6.00 < 0.30 2.00 < 0.20 <0.80 26.00 34.00 1985 BH4 4.00 3.00 7.00 < 0.30 2.00 < 0.20 < 0.90 26.00 33.00 1985 BHS 4.00 3.00 9.00 < 0.30 2.00 0.70 < 0.90 27.00 38.00 1986 BH1 3.14 2.36 4.08 3.05 1.27 1.58 0.81 8.38 18.96 1986 BH2 12.98 7.45 17.15 5.46 2.06 2.66 32.49 102.77 170.78 1986 BH3 12.15 5.59 20.00 3.46 1.58 2.19 8.65 56.54 127.19
Quincy Bay
1986 QBl 8.26 3.94 7.68 3.10 0.70 2.28 2.15 25.97 62.08 1986 QB2 9.02 - 3.41 7.36 3.56 3.15 1.68 5.21 35.75 74.80 1986 QB3 13.58 5.24 14.79 6.83 2.27 4.43 5.68 41.35 86.28
Buzzards Bay
1984 BBI 2.85 < 0.90 < 0.70 < 0.60 < 0.50 < 0.50 < 2.40 46.09 87.69 1984 BB2 3.15 < 0.30 < 0.30 < 0.20 < 0.20 < 0.20 < 0.80 < 0.40 10.86 1984 BB3 0.50 < 0.10 3.66 < 0.10 5.91 < 0.08 < 0.40 27.85 43.51 1984 BB4 3.18 < 0.20 < 0.20 < 0.10 0.88 0.49 < 0.40 60.88 136.42 1984 BB80 0.74 < 0.30 < 0.30 < 0.20 <0.20 < 0.10 < 0.70 13.47 31.05 1985 BB1 < 0.03 < 0.08 0.50 < 0.06 <0.04 <0.04 < 0.20 < 0.08 < 0.08 1985 BB2 < 0.02 <0.04 < 0.03 < 0.03 < 0.02 < 0.02 28.00 < 0.05 < 0.05 1985 BB3 < 0.03 < 0.08 0.50 0.60 < 0.04 < 0.03 27.00 < 0.09 2.00 1985 BB4 <0.04 < 0.10 1.00 0.90 < 0.05 < 0.06 83.00 < 0.10 < 11.00 1986 BBI < 0.23 < 0.36 3.29 < 0.32 < 0.30 < 0.20 26.51 72.83 153.85 1986 BB3 < 0.13 < 0.21 1.49 < 0.18 < 0.17 < 0.11 10.78 33.98 55.87 1986 BB4 < 0.22 < 0.35 < 0.36 < 0.30 < 0.28 < 0.19 16.44 51.71 85.72
Narragansett Bay
1984 NB1 3.19 2.73 < 0.40 < 0.30 < 0.30 < 0.30 < 1.30 12.72 66.29 1984 NB2 3.35 1.24 1.55 < 0.10 < 0.10 < 0.10 < 0.50 7.63 43.53 1984 NB3 1.21 . < 0.10 0.59 <0.09 < 0.08 < 0.07 < 0.30 4.99 18.43 1984 NB4 1.06 < 0.30 < 0.20 < 0.20 < 0.10 < 0.10 < 0.70 7.41 1.82 1985 NB1 6.00 <1.00 6.00 <0.90 < 0.70 < 0.70 12.00 50.00 54.00 1985 NB2 4.00 <1.00 5.00 < 0.90 < 0.60 < 0.70 12.00 50.00 80.00 1985 NB3 1.00 0.40 0.90 < 0.30 < 0.20 <0.20 20.00 66.00 93.00 1985 NB4 1.00 < 0.40 1.00 < 0.30 0.50 <0.20 4.00 19.00 24.00 1986 NBI 3.72 < 0.47 7.32 < 0.41 2.97 2.00 22.66 27.48 79.78 1986 NB2 4.84 < 0.30 5.90 < 0.27 2.37 1.02 6.78 40.36 119.54 1986 NB3 8.09 < 0.37 6.43 < 0.33 0.35 1.69 16.55 24.04 72.04

Page 86
Table 3d. Continued.
Year Station p,p'-DDE o,p'-DDD p,p'-DDD o,p'-DDT p,p'-DDT Mirex 2-Cl-PCB 3-Cl-PCB 4-Cl-PCB
1984 1984 1984 1985 1985 1985 1985 1986 1986 1986
ELI 1 ELI2 ELI3 ELI 1 ELI2 ELI3 ELlS ELIl ELI2 ELB
1984 Will 1984 WU2 1985 WLH 1985 WU2 1985 WLI3 1985 WLI4 1986 WLI9 1986 WLI2 1986 WLI4
1984 1984 1984 1984 1985 1985 1985 1985 1985 1986 1986 1986 1986
1985 1985 1985 1985 1986 1986 1986
RBI RB2 RB3 RB5 RBI RB2 RB3 RB4 RB5 RBI RB2 RB3 RB4
GBI GB2 GB3 GB4 GBI GB2 GB3
1984 OBI 1984 DB9 1984 DB11 1985 OBI
< 0.02 < 0.03 < 0.02 < 0.04 < 0.04 < 0.04 < 0.04 < 0.07
0.24 < 0.07
0.16 0.21 1.80 3.00 3.00 5.00 1.12 2.79 8.32
8.98 8.83
10.90 7.50
14.00 9.00
11.00 0.40 7.00
23.97 26.05 14.56 4.68
1.00 2.00 3.00 3.00 3.65 3.58 3.58
1.20 1.71
< 0.04 3.00
< 0.06 < 0.07 < 0.05 < 0.10 < 0.10 < 0.10 < 0.10 < 0.11 < 0.10 < 0.11
< 0.20 < 0.20
1.30 2.00 2.00 3.00
< 0.11 2.51 4.28
5.70 7.38 7.80 5.46
10.00 6.00 6.00
< 0.20 4.00
< 0.22 < 0.19 < 0.17 < 0.12
0.70 2.00 2.00 2.00 2.52 1.45 1.48
< 0.10 < 0.20 < 0.10
1.00
< 0.05 < 0.05 < 0.04 < 0.06 < 0.10
0.10 < 0.07 < 0.11 < 0.10 < 0.11
Eastern Long Island Sound
< 0.05 < 0.05 <0.04 < 0.08 < 0.10 < 0.10 < 0.08 < 0.09 < 0.09 < 0.09
< 0.03 < 0.03 < 0.03 < 0.05 < 0.10
0.10 < 0.05 < 0.09
0.11 < 0.09
Western Long Island Sound
1.42 2.25 1.20 2.00 3.00 4.00 0.21 2.86 6.48
13.99 13.97 18.94 12.98 20.00 12.00 18.00 0.30
11.00 20.78 36.48 19.83 7.27
1.30 2.00 3.00 2.00 4.68 2.97 2.77
0.41 < 0.10 < 0.08 < 0.20
< 0.10 < 0.10 < 0.20 < 0.30 < 0.40 < 0.50 < 0.10 < 0.22
4.55
0.30 0.28 0.30 0.40 0.60 1.00 0.18 1.10 3.74
Raritan Bay
< 0.10 < 0.10 < 0.10 < 0.10 19.00 14.00 13.00 0.50 4.00
< 0.45 < 0.39 < 0.36 < 0.25
0.12 < 0.10 < 0.10
0.09 3.00 0.50 2.00 0.40
15.00 4.79 2.07 1.50 1.76
Great Bay
0.90 1.00 2.00 0.80
< 0.12 < 0.16 < 0.16
0.10 0.20 0.30 0.05 1.04 0.15 0.30
Delaware Bay
< 0.08 < 0.10 < 0.08 < 0.20
< 0.06 < 0.08 < 0.05
0.30
< 0.03 < 0.04 < 0.03 < 0.05 < 0.10 < 0.10 < 0.10 < 0.06 < 0.06 < 0.06
1.68 0.80
< 0.20 0.50
< 0.30 0.40
< 0.06 2.57 4.82
< 0.10 < 0.10 < 0.10 < 0.10
3.00 0.60 0.80
< 0.10 2.00 2.10 2.65 6.04 1.51
< 0.10 < 0.20 < 0.20 < 0.20
1.76 < 0.09 < 0.09
< 0.06 < 0.08 < 0.05 < 0.20
3.00 2.74
16.50 < 0.30 < 0.30 < 0.30 < 0.30 < 0.30
1.72 < 0.30
3.42 2.75
< 0.80 < 0.90 <1.00 < 2.00
2.18 1.53 5.67,
< 0.30 < 0.40 < 0.40 < 0.30 13.00 5.00 6.00 1.00 5.00
27.81 25.89 45.32
3.45
2.00 3.00 3.00 2.00 7.31 6.69 2.99
< 0.30 < 0.40
1.46 4.00
< 0.06 1.04 3.80
< 0.10 < 0.10
0.60 < 0.10
0.74 1.77 0.21
83.06 48.35 9.00 7.00 6.00
11.00 3.54 9.77
34.98
17.12 39.69 53.51 48.19
152.00 82.00 87.00
8.00 63.00
166.91 155.53 259.34
52.56
13.00 20.00 20.00
8.00 20.16 11.14 12.81
< 0.10 < 0.20 < 0.10 21.00
< 0.06 < 0.07 < 0.05
0.60 1.00 0.50 0.20 0.09 1.73
< 0.14
46.41 70.62 14.00 17.00 18.00 41.00
9.12 41.72 88.21
112.45 112.01 124.16 102.70 243.00 148.00 164.00 22.00
116.00 414.26 319.41
82.42 95.28
12.00 13.00 23.00 15.00 37.17 27.91 30.64
< 0.10 < 0.20 < 0.10 81.00
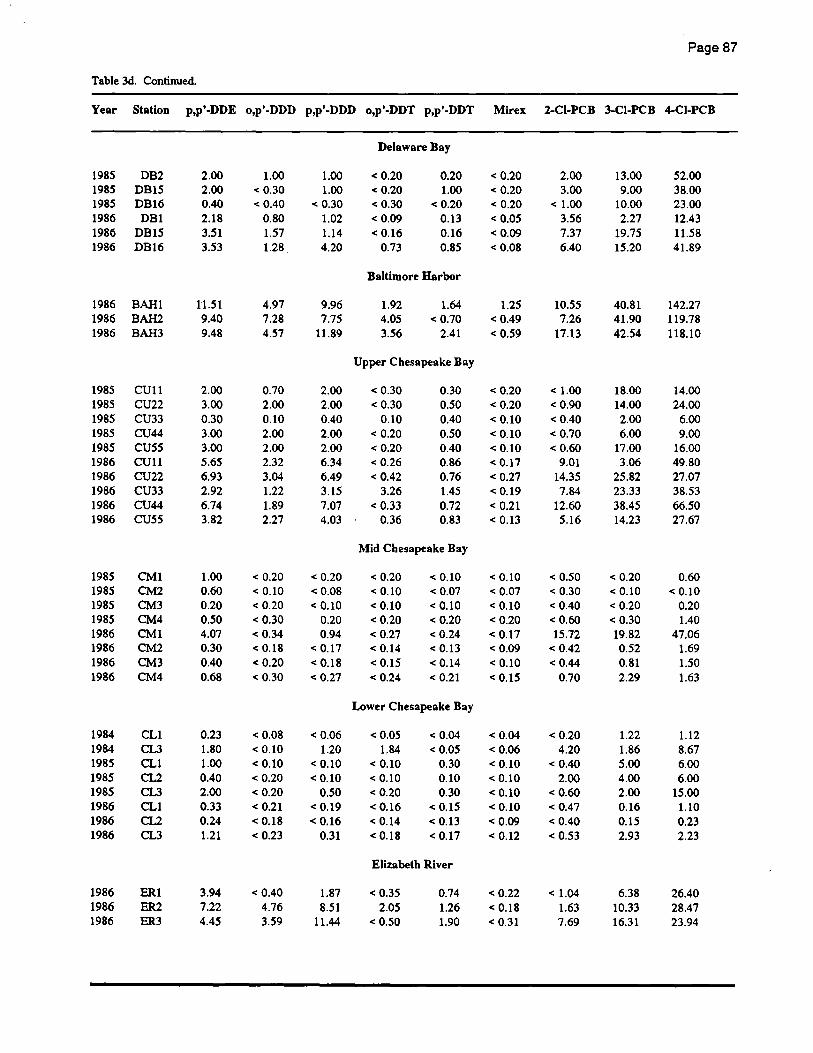
Page 87
Table 3d. Continued.
Year Station p,p'-DDE o,p'-DDD p,p'-DDD o,p'-DDT p,p'-DDT Mirex 2-CI-PCB 3-CI-PCB 4-CI-PCB
Delaware Bay
1985 DB2 2.00 1.00 1.00 < 0.20 0.20 < 0.20 2.00 13.00 52.00 1985 DB15 2.00 < 0.30 1.00 < 0.20 1.00 < 0.20 3.00 9.00 38.00 1985 DB16 0.40 < 0.40 < 0.30 < 0.30 < 0.20 < 0.20 <1.00 10.00 23.00 1986 OBI 2.18 0.80 1.02 <0.09 0.13 < 0.05 3.56 2.27 12.43 1986 DB15 3.51 1.57 1.14 < 0.16 0.16 < 0.09 7.37 19.75 11.58 1986 DB16 3.53 1.28 4.20 0.73 0.85 < 0.08 6.40 15.20 41.89
Baltimore Harbor
1986 BAH1 11.51 4.97 9.96 1.92 1.64 1.25 10.55 40.81 142.27 1986 BAH2 9.40 7.28 7.75 4.05 <0.70 < 0.49 7.26 41.90 119.78 1986 BAH3 9.48 4.57 11.89 3.56 2.41 < 0.59 17.13 42.54 118.10
Upper Chesapeake Bay
1985 CUll 2.00 0.70 2.00 < 0.30 0.30 < 0.20 <1.00 18.00 14.00 1985 CU22 3.00 2.00 2.00 < 0.30 0.50 < 0.20 < 0.90 14.00 24.00 1985 CU33 0.30 0.10 0.40 0.10 0.40 < 0.10 < 0.40 2.00 6.00 1985 CU44 3.00 2.00 2.00 < 0.20 0.50 < 0.10 < 0.70 6.00 9.00 1985 CU55 3.00 2.00 2.00 < 0.20 0.40 < 0.10 < 0.60 17.00 16.00 1986 CUll 5.65 2.32 6.34 < 0.26 0.86 < 0.17 9.01 3.06 49.80 1986 CU22 6.93 3.04 6.49 < 0.42 0.76 < 0.27 14.35 25.82 27.07 1986 CU33 2.92 1.22 3.15 3.26 1.45 < 0.19 7.84 23.33 38.53 1986 CU44 6.74 1.89 7.07 < 0.33 0.72 < 0.21 12.60 38.45 66.50 1986 CU55 3.82 2.27 4.03 0.36 0.83 < 0.13 5.16 14.23 27.67
Mid Chesapeake Bay
1985 CM1 1.00 < 0.20 < 0.20 < 0.20 < 0.10 < 0.10 < 0.50 < 0.20 0.60 1985 CM2 0.60 < 0.10 < 0.08 < 0.10 < 0.07 < 0.07 < 0.30 < 0.10 < 0.10 1985 CM3 0.20 < 0.20 < 0.10 < 0.10 < 0.10 < 0.10 < 0.40 < 0.20 0.20 1985 CM4 0.50 < 0.30 0.20 < 0.20 <0.20 < 0.20 < 0.60 < 0.30 1.40 1986 CMl 4.07 < 0.34 0.94 < 0.27 < 0.24 < 0.17 15.72 19.82 47.06 1986 CM2 0.30 < 0.18 < 0.17 < 0.14 < 0.13 < 0.09 < 0.42 0.52 1.69 1986 CM3 0.40 < 0.20 < 0.18 < 0.15 < 0.14 < 0.10 < 0.44 0.81 1.50 1986 CM4 0.68 < 0.30 < 0.27 < 0.24 < 0.21 < 0.15 0.70 2.29 1.63
Lower Chesapeake Bay
1984 CL1 0.23 < 0.08 < 0.06 < 0.05 < 0.04 < 0.04 < 0.20 1.22 1.12 1984 CL3 1.80 < 0.10 1.20 1.84 < 0.05 < 0.06 4.20 1.86 8.67 1985 CL1 1.00 < 0.10 < 0.10 < 0.10 0.30 < 0.10 < 0.40 5.00 6.00 1985 CL2 0.40 < 0.20 < 0.10 < 0.10 0.10 < 0.10 2.00 4.00 6.00 1985 CL3 2.00 < 0.20 0.50 < 0.20 0.30 < 0.10 < 0.60 2.00 15.00 1986 CL1 0.33 < 0.21 < 0.19 < 0.16 < 0.15 < 0.10 < 0.47 0.16 1.10 1986 CL2 0.24 < 0.18 < 0.16 < 0.14 < 0.13 < 0.09 < 0.40 0.15 0.23 1986 CL3 1.21 < 0.23 0.31 < 0.18 < 0.17 < 0.12 < 0.53 2.93 2.23
Elizabeth River
1986 ER1 3.94 < 0.40 1.87 < 0.35 0.74 < 0.22 <1.04 6.38 26.40 1986 ER2 7.22 4.76 8.51 2.05 1.26 < 0.18 1.63 10.33 28.47 1986 ER3 4.45 3.59 11.44 < 0.50 1.90 < 0.31 7.69 16.31 23.94
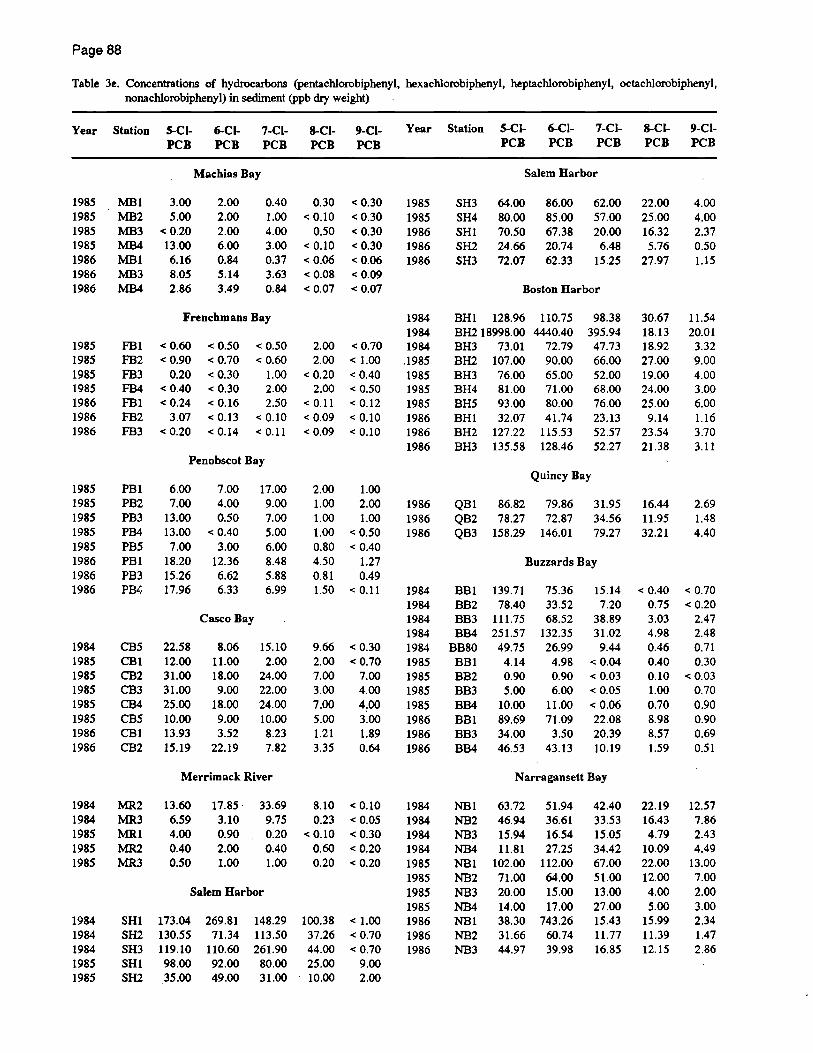
Page 88
Table 3e. Concentrations of hydrocarbons (pentachlorobiphenyl, hexachlorobiphenyl, heptachlorobiphenyl, octachlorobiphenyl, nonachlorobiphenyl) in sediment (ppb dry weight)
Year Station S-CI- 6-CI- 7-CI- 8-CI- 9-CI-
1985 1985 1985 1985 1986 1986 1986
1985 1985 1985 1985 1986 1986 1986
1985 1985 1985 1985 1985 1986 1986 1986
1984 1985 1985 1985 1985 1985 1986 1986
1984 1984 1985 1985 1985
1984 1984 1984 1985 1985
MB1 MB2 MB3 MB4 MB1 MB3 MB4
FBI FB2 FB3 FB4 FBI FB2 FB3
PBI PB2 PB3 PB4 PBS PBl PB3 PB4
CBS CB1 CB2 CB3 CB4 CBS CBl CB2
MR2 MR3 MR1 MR2 MR3
SHI SH2 SH3 SH1 SH2
PCB PCB PCB PCB PCB
Machias Bay
3.00 5.00
< 0.20
2.00 2.00 2.00 6.00 0.84 5.14 3.49
0.40 0.30 < 0.30 1.00 < 0.10 < 0.30 4.00 0.50 < 0.30
13.00 6.16 8.05 2.86
3.00 < 0.10 < 0.30 0.37 < 0.06 < 0.06 3.63 < 0.08 < 0.09 0.84 < 0.07 < 0.07
Frenchmans Bay
< 0.60 < 0.50 < 0.50 < 0.90 < 0.70 < 0.60
0.20 < 0.30 1.00 < 0.40 < 0.30 2.00 < 0.24 < 0.16 2.50
3.07 < 0.13 < 0.10 < 0.20 < 0.14 < 0.11
Penobscot Bay
6.00 7.00
13.00 13.00 7.00
18.20 15.26 17.96
22.58 12.00 31.00 31.00 25.00 10.00 13.93 15.19
7.00 4.00 0.50
< 0.40 3.00
12.36 6.62 6.33
Casco Bay
8.06 11.00 18.00 9.00
18.00 9.00 3.52
22.19
17.00 9.00 7.00 5.00 6.00 8.48 5.88 6.99
15.10 2.00
24.00 22.00 24.00 10.00 8.23 7.82
Merrimack River
13.60 6.59 4.00 0.40 0.50
17.85· 3.10 0.90 2.00 1.00
33.69 9.75 0.20 0.40 1.00
Salem Harbor
173.04 269.81 148.29 130.55 71.34 113.50 119.10 110.60 261.90 98.00 92.00 80.00 35.00 49.00 31.00
2.00 2.00
< 0.20 2.00
< 0.11 < 0.09 < 0.09
2.00 1.00 1.00 1.00 0.80 4.50 0.81 LSO
9.66 2.00 7.00 3.00 7.00 5.00 1.21 3.35
8.10 0.23
< 0.10 0.60 0.20
100.38 37.26 44.00 25.00 10.00
< 0.70 <1.00 < 0.40 < 0.50 < 0.12 < 0.10 < 0.10
1.00 2.00 1.00
< 0.50 < 0.40
1.27 0.49
< 0.11
< 0.30 < 0.70
7.00 4.00 4.00 3.00 1.89 0.64
< 0.10 < 0.05 < 0.30 < 0.20 < 0.20
<1.00 < 0.70 < 0.70
9.00 2.00
Year Station S-CI- 6-CI- 7-CI- 8-CI- 9-CI-
1985 1985 1986 1986 1986
1984 1984 1984 1985 1985 1985 1985 1986 1986 1986
1986 1986 1986
1984 1984 1984 1984 1984 1985 1985 1985 1985 1986 1986 1986
1984 1984 1984 1984 1985 1985 1985 1985 1986 1986 1986
PCB PCB PCB PCB PCB
Salem Harbor
SH3 SH4 SH1 SH2 SH3
64.00 80.00 70.50 24.66 72.07
86.00 85.00 67.38 20.74 62.33
62.00 57.00 20.00
6.48 15.25
Boston Harbor
BH1 128.96 BH218998.00 BH3 73.01 BH2 107.00 BH3 76.00 BH4 81.00 Bill 93.00 BH1 32.07 BH2 127.22 BH3 135.58
QB1 QB2 QB3
86.82 78.27
158.29
110.75 4440.40
72.79 90.00 65.00 71.00 80.00 41.74
115.53 128.46
98.38 395.94 47.73 66.00 52.00 68.00 76.00 23.13 52.57 52.27
Quincy Bay
79.86 31.95 72.87 34.56
146.01 79.27
Buzzards Bay
BB1 BB2 BB3 BB4
BB80 BB1 BB2 BB3 BB4 BB1 BB3 BB4
NBI NB2 NB3 NB4 NBI NB2 NB3 NB4 NB1 NB2 NB3
139.71 78.40
111.75 251.57
49.75 4.14 0.90 5.00
10.00 89.69 34.00 46.53
75.36 15.14 33.52 7.20 68.52 38.89
132.35 31.02 26.99 9.44
4.98 < 0.04 0.90 < 0.03 6.00 < 0.05
11.00 < 0.06 71.09 22.08
3.50 20.39 43.13 10.19
Narragansett Bay
63.72 46.94 15.94 11.81
102.00 71.00 20.00
51.94 36.61 16.54 27.25
112.00 64.00 15.00
14.00 17.00 38.30 743.26 31.66 60.74 44.97 39.98
42.40 33.53 15.05 34.42 67.00 51.00 13.00 27.00 15.43 11.77 16.85
22.00 25.00 16.32 5.76
27.97
30.67 18.13 18.92 27.00 19.00 24.00 25.00
9.14 23.54 21.38
16.44 11.95 32.21
< 0.40 0.75 3.03 4.98 0.46 0.40 0.10 1.00 0.70 8.98 8.57 1.59
22.19 16.43 4.79
10.09 22.00 12.00 4.00 5.00
15.99 11.39 12.15
4.00 4.00 2.37 0.50 1.15
1LS4 20.01
3.32 9.00 4.00 3.0.0 6.00 1.16 3.70 3.11
2.69 1.48 4.40
< 0.70 < 0.20
2.47 2.48 0.71 0.30
< 0.03 0.70 0.90 0.90 0.69 0.51
12.57 7.86 2.43 4.49
13.00 7.00 2.00 3.00 2.34 1.47 2.86

Page 89
Table 3e. Continued.
Year Station S.Cl- 6-CI- 7-CI- 8-CI- 9-Cl- Year Station S-CI- 6-CI- 7-CI- S.Cl- 9-CI-PCB PCB PCB PCB PCB PCB PCB PCB PCB PCB
Eutem Long Island Sound Delaware Bay
1984 ELI 1 0.20 0.26 < 0.03 < 0.03 < 0.05 1985 DB15 88.00 36.00 9.00 2.00 1.00 1984 ELI2 < 0.07 < 0.07 < 0.05 < 0.03 < 0.06 1985 DB16 22.00 43.00 5.00 0.30 1.00 1984 ELI3 1.40 1.70 0.20 0.50 0.80 1986 OBI 5.68 2.56 1.91 1.70 0.42 1985 ELI 1 5.00 1.00 0.70 0.40 < 0.10 1986 DB15 15.10 8.15 5.54 3.27 0.60 1985 ELI2 < 0.40 1.00 1.00 1.00 <0.20 1986 DB16 13.00 14.90 4.02 2.36 0.68 1985 ELI3 3.00 2.00 2.00 0.20 < 0.10 1985 ELI5 0.50 8.00 1.00 0.10 < 0.10 Baltimore Harbor 1986 ELI 1 2.43 0.61 0.45 < 0.05 < 0.05 1986 ELI2 3.70 2.11 0.73 0.34 0.11 1986 BAHI 126.98 126.42 127.80 34.85 6.65 1986 ELI3 0.21 < 0.07 < 0.06 < 0.05 < 0.05 1986 BAH2 157.50 217.18 158.08 54.90 7.08
1986 BAH3 111.28 106.70 46.21 22.22 4.08 Western Long Island Sound
Upper Chesapeake Bay 1984 WLII 47.26 24.76 15.08 3.94 7.72 1984 WLI2 57.62 32.69 16.02 2.65 6.50 1985 CUll 16.00 10.00 17.00 4.00 6.00 1985 WLll 21.00 18.00 24.00 11.00 4.00 1985 CU22 34.00 11.00 21.00 9.00 9.00 1985 WLI2 30.00 23.00 26.00 12.00 5.00 1985 CU33 12.00 6.00 9.00 1.00 0.70 1985 WLI3 34.00 28.00 32.00 12.00 4.00 1985 CU44 25.00 15.00 31.00 9.00 10.00 1985 WLI4 66.00 37.00 48.00 14.00 5.00 1985 CU55 23.00 9.00 23.00 7.00 9.00 1986 WLI9 9.20 3.10 1.50 1.20 0.28 1986 CUll 18.14 15.85 7.52 4.43 2.55 1986 WLI2 10.49 19.82 12.77 5.14 1.49 1986 CU22 39.04 24.97 9.98 6.73 3.97 1986 WLI4 60.06 71.81 42.93 19.84 3.80 1986 CU33 69.92 177.74 89.85 38.54 3.94
1986 CU44 24.73 16.73 9.33 10.22 6.42 Raritan Bay 1986 CU55 18.88 13.42 7.97 4.61 2.93
1984 RBI 126.47 86.99 37.20 29.92 9.67 Mid Chesapeake Bay 1984 RB2 139.92 100.44 44.96 29.99 13.96 1984 RB3 144.29 91.62 41.93 21.09 7.39 1985 CMl 5.00 4.00 < 0.20 < 0.10 < 0.30 1984 RB5 105.76 72.63 34.14 21.24 6.12 1985 CM2 2.00 3.00 < 0.10 < 0.06 < 0.20 1985 RBI 185.00 220.00 140.00 70.00 27.00 1985 CM3 0.40 0.60 < 0.10 < 0.10 < 0.20 1985 RB2 119.00 139.00 54.00 31.00 8.00 1985 CM4 2.30 0.70 < 0.20 < 0.10 < 0.40 1985 RB3 170.00 171.00 80.00 42.00 13.00 1986 CMl 10.82 1.54 2.45 1.67 0.72 1985 RB4 23.00 42.00 7.00 14.00 2.00 1986 CM2 0.50 < 0.10 < 0.09 < 0.08 < 0.07 1985 RB5 105.00 91.00 60.00 46.00 14.00 1986 CM3 0.69 0.54 0.55 < 0.08 0.23 1986 RBI 204.02 105.14 31.75 22.75 4.23 1986 CM4 1.70 1.52 3.75 < 0.13 0.23 1986 RB2 238.04 145.66 35.50 26.44 4.28 1986 RB3 134.90 87.83 28.29 36.64 8.79 Lower Chesapeake Bay 1986 RB4 51.26 36.13 8.52 8.64 1.04
1984 CLI 3.68 0.20 < 0.05 0.19 0.37 Great Bay 1984 CL3 10.90 9.29 59.62 1.09 0.39
1985 CLI 9.00 2.00 4.00 1.00 0.40 1985 GBI 13.00 11.00 6.00 4.00 1.00 1985 CL2 3.00 0.60 3.00 2.00 0.30 1985 GB2 10.00 10.00 8.00 5.00 1.00 1985 CL3 19.00 3.00 6.00 2.00 0.60 1985 GB3 23.00 20.00 21.00 12.00 5.00 1986 CLI 1.70 2.50 2.61 < 0.09 < 0.08 1985 GB4 8.00 5.00 8.00 7.00 3.00 1986 CL2 0.91 0.14 0.13 < 0.08 < 0.07 1986 GBI 19.03 20.72 9.06 5.69 0.61 1986 CL3 3.11 0.50 0.71 < 0.10 0.20 1986 GB2 15.14 7.04 3.39 3.02 0.31 1986 GB3 17.02 9.23 3.11 3.10 0.48 Elizabeth River
Delaware Bay 1986 ERI 30.84 14.09 7.79 3.74 0.46 1986 ER2 54.86 41.02 19.85 8.90 1.21
1984 OBI 1.18 1.32 0.33 < 0.04 0.50 1986 ER3 62.61 49.21 45.36 30.17 4.99 1984 DB9 1.23 0.90 < 0.10 1.66 1.23 1984 DBll 0.80 < 0.08 < 0.07 <0.04 < 0.07 1985 OBI 223.00 96.00 7.00 3.00 2.00 1985 DB2 63.00 38.00 7.00 3.00 2.00

Page 90
Table4a.Concentrationsofmetals(silver,cadmiwn,chromiwn,copper,nickel,lead,zinc, iron. manganese) insediment (ppmciry weight, except where noted)
Year Station Ag Cd Cr Cu Ni Pb Zn Fe('ll ) Mn
Machias Bay
1984 MBI 0.040 0.060 80.40 11.30 20.60 17.70 54.00 2.680 605.0 1985 MBl 0.037 0.056 73.80 10.50 18.70 19.40 49.90 2.510 576.0 1985 MB3 0.053 0.075 67.00 10.70 22.00 21.70 62.10 2.820 486.0 1985 MB4 0.047 0.074 69.80 10.50 20.80 21.70 59.30 2.780 583.0 1986 MBI 0.034 0.087 53.80 12.20 19.90 18.50 46.30 2.570 592.0 1986 MB3 0.061 0.091 51.60 11.70 24.70 21.30 63.30 2.940 498.0 1986 MB4 Om5 0.043 44.90 8.48 18.10 16.70 43.40 2.360 505.0
Frenchmans Bay
1985 FBI 0.090 0.132 97.60 17.70 30.20 23.00 110.00 3.980 521.0 1985 FB2 0.097 0.175 95.40 18.00 38.20 28.90 112.00 4.440 550.0 1985 FB3 0.094 0.174 77.30 14.00 27.30 26.40 86.70 3.450 504.0 1986 FBI 0.094 0.258 86.00 18.60 73.10 29.60 116.00 4.480 538.0 1986 FB2 0.110 0.228 81.20 19.00 40.30 28.80 . 108.00 4.380 513.0 1986 FB3 0.072 0.113 60.30 15.50 32.30 30.70 82.00 3.700 455.0
Penobscot Bay
1985 PBl 0.112 0.115 118.00 21.40 38.90 34.30 114.00 4.280 518.0 1985 PB3 0.105 0.078 108.00 21.10 25.30 23.00 118.00 4.250 594.0 1985 PB4 0.097 0.132 92.20 15.20 33.60 28.30 109.00 3.710 528.0 1986 PBl 0.134 0.130 102.00 22.40 44.20 35.10 123.00 4.450 581.0 1986 PB3 0.112 0.112 96.30 21.20 42.90 33.20 122.00 4.870 601.0 1986 PB4 0.112 0.176 85.50 15.80 35.20 32.60 109.00 4.180 520.0
Casco Bay
1984 CB14 0.060 0.100 87.70 15.10 23.60 25.30 73.20 3.230 1010.0 1984 CB15 0.090 0.110 107.00 16.90 22.80 33.10 76.50 2.890 579.0 1984 CB5 0.110 0.230 81.60 18.90 23.30 29.00 79.10 2.650 595.0 1985 CBl 0.116 0.268 96.70 21.70 30.30 25.90 105.00 3.970 618.0 1985 CB2 0.200 0.354 102.00 22.30 36.70 38.00 117.00 3.920 563.0 1985 CB4 0.316 0.374 80.40 29.10 26.90 38.60 108.00 2.990 541.0 1986 CBl ·0.127 0.341 92.00 19.10 32.60 34.00 108.00 4.110 573.0 1986 CB2 0.229 0.487 97.10 27.80 37.40 54.60 128.00 4.190 518.0 1986 CB4 0.493 0.673 85.30 32.70 37.10 56.10 128.00 3.670 528.0
Merrimack River
1984 MR2 0.050 0.110 38.40 7.82 6.82 23.20 34.80 1.980 1070.0 1984 MR3 0.050 < 0.030 43.90 5.12 6.26 23.30 36.70 2.050 1420.0 1985 MRI < 0.020 < 0.052 12.89 3.54 4.74 21.60 21.50 1.150 502.0 1985 MR2 0.011 < 0.053 9.16 3.59 2.28 19.00 17.90 0.530 89.4 1985 MR3 0.016 < 0.053 20.70 3.57 3.45 18.40 24.50 1.290 805.0
Salem Harbor
1984 SHI 1.510 4.020 1830.00 109.00 31.80 201.00 216.00 3.470 454.0 1984 SH2 1.580 4.140 2110.00 69.20 28.50 166.00 203.00 2.520 464.0 1984 SH3 2.410 9.440 2950.00 107.00 30.80 192.00 295.00 2.900 417.0 1985 SHI 1.280 5.380 1710.00 109.00 41.90 123.00 219.00 3.620 411.0 1985 SH2 0.970 2.830 968.00 39.90 22.80 93.90 128.00 2.390 368.0 1985 SH3 2.110 8.730 2570.00 74.40 26.50 173.00 239.00 2.780 369.0 1985 SH4 2.150 7.960 2260.00 94.00 39.30 177.00 230.00 3.520 411.0
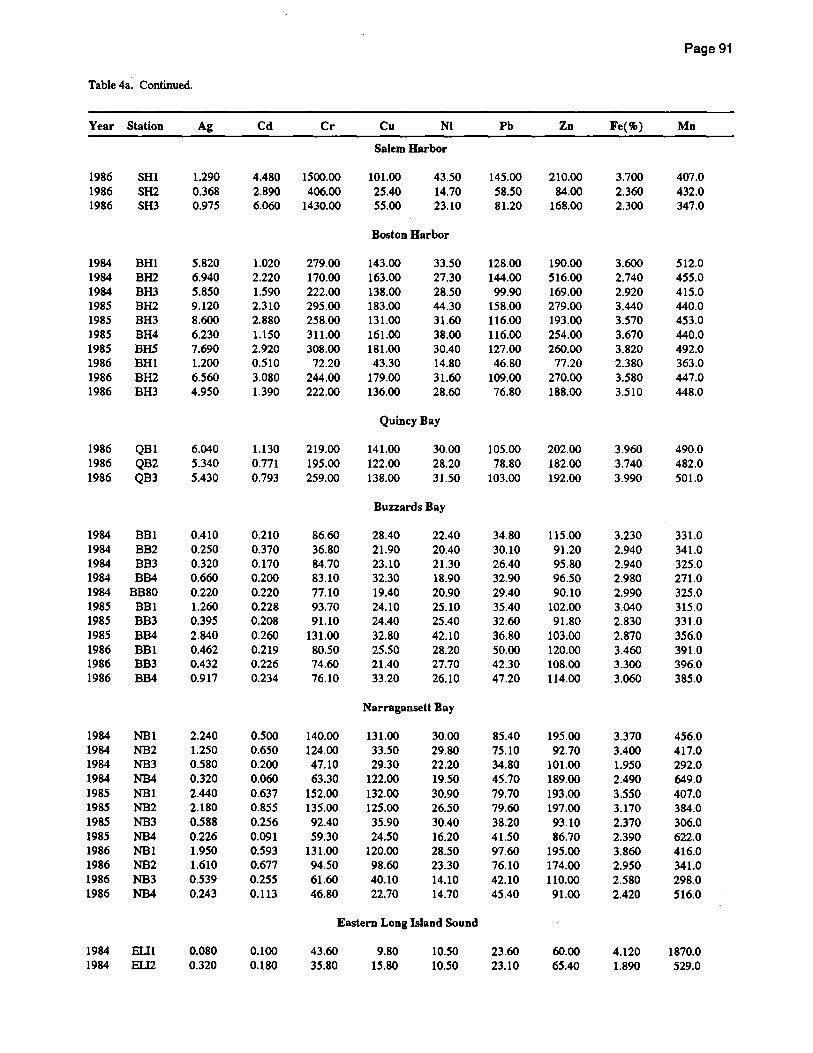
Page 91
Table 4a. Continued.
Year Station Ag Cd Cr Cu Ni Pb Zn Fe(%) Mn
Salem Harbor
1986 SHI 1.290 4.480 1500.00 101.00 43.50 145.00 210.00 3.700 407.0 1986 SH2 0.368 2.890 406.00 25.40 14.70 58.50 84.00 2.360 432.0 1986 SH3 0.975 6.060 1430.00 55.00 23.10 81.20 168.00 2.300 347.0
Boston Harbor
1984 BHl 5.820 1.020 279.00 143.00 33.50 128.00 190.00 3.600 512.0 1984 BH2 6.940 2.220 170.00 163.00 27.30 144.00 516.00 2.740 455.0 1984 BH3 5.850 1.590 222.00 138.00 28.50 99.90 169.00 2.920 415.0 1985 BH2 9.120 2.310 295.00 183.00 44.30 158.00 279.00 3.440 440.0 1985 BH3 8.600 2.880 258.00 131.00 31.60 116.00 193.00 3.570 453.0 1985 BH4 6.230 1.150 311.00 161.00 38.00 116.00 254.00 3.670 440.0 1985 BHS 7.690 2.920 308.00 181.00 30.40 127.00 260.00 3.820 492.0 1986 BHl 1.200 0.510 72.20 43.30 14.80 46.80 77.20 2.380 363.0 1986 BH2 6.560 3.080 244.00 179.00 31.60 109.00 270.00 3.580 447.0 1986 BH3 4.950 1.390 222.00 136.00 28.60 76.80 188.00 3.510 448.0
Quincy Bay
1986 QBl 6.040 1.130 219.00 141.00 30.00 105.00 202.00 3.960 490.0 1986 QB2 5.340 0.771 195.00 122.00 28.20 78.80 182.00 3.740 482.0 1986 QB3 5.430 0.793 259.00 138.00 31.50 103.00 192.00 3.990 501.0
Buzzards Bay
1984 BBI 0.410 0.210 86.60 28.40 22.40 34.80 115.00 3.230 331.0 1984 BB2 0.250 0.370 36.80 21.90 20.40 30.10 91.20 2.940 341.0 1984 BB3 0.320 0.170 84.70 23.10 21.30 26.40 95.80 2.940 325.0 1984 BB4 0.660 0.200 83.10 32.30 18.90 32.90 96.50 2.980 271.0 1984 BB80 0.220 0.220 77.10 19.40 20.90 29.40 90.10 2.990 325.0 1985 BBI 1.260 0.228 93.70 24.10 25.10 35.40 102.00 3.040 315.0 1985 BB3 0.395 0.208 91.10 24.40 25.40 32.60 91.80 2.830 331.0 1985 BB4 2.840 0.260 131.00 32.80 42.10 36.80 103.00 2.870 356.0 1986 BBI 0.462 0.219 80.50 25.50 28.20 50.00 120.00 3.460 391.0 1986 BB3 0.432 0.226 74.60 21.40 27.70 42.30 108.00 3.300 396.0 1986 BB4 0.917 0.234 76.10 33.20 26.10 47.20 114.00 3.060 385.0
Narragansett Bay
1984 NBI 2.240 0.500 140.00 131.00 30.00 85.40 195.00 3.370 456.0 1984 NB2 1.250 0.650 124.00 33.50 29.80 75.10 92.70 3.400 417.0 1984 NB3 0.580 0.200 47.10 29.30 22.20 34.80 101.00 1.950 292.0 1984 NB4 0.320 0.060 63.30 122.00 19.50 45.70 189.00 2.490 649.0 1985 NBI 2.440 0.637 152.00 132.00 30.90 79.70 193.00 3.550 407.0 1985 NB2 2.180 0.855 135.00 125.00 26.50 79.60 197.00 3.170 384.0 1985 NB3 0.588 0.256 92.40 35.90 30.40 38.20 93.10 2.370 306.0 1985 NB4 0.226 0.091 59.30 24.50 16.20 41.50 86.70 2.390 622.0 1986 NBI 1.950 0.593 131.00 120.00 28.50 97.60 195.00 3.860 416.0 1986 NB2 1.610 0.677 94.50 98.60 23.30 76.10 174.00 2.950 341.0 1986 NB3 0.539 0.255 61.60 40.10 14.10 42.10 110.00 2.580 298.0 1986 NB4 0.243 0.113 46.80 22.70 14.70 45.40 91.00 2.420 516.0
Eastern Long Island Sound
1984 Ell 1 0.080 0.100 43.60 9.80 10.50 23.60 60.00 4.120 1870.0 1984 ELI2 0.320 0.180 35.80 15.80 10.50 23.10 65.40 1.890 529.0

Page 92
Table 4a, Continued,
Year Station Ag Cd Cr Cu Ni Ph Zn Fe(%) Mn
Eastern Long Island Sound
1984 EU3 0,060 0,060 33,50 8,19 11.30 19,70 51.10 2,510 1160,0 1985 Ell 1 0.038 0,131 48,50 7,24 8,30 19,50 49,50 4.520 2760,0 1985 . EU2 0,042 0,064 24,00 6,96 5,82 19.80 53.20 2.010 674,0 1985 EU5 0.010 0,074 43.20 3.50 12.20 15,40 41.20 2,830 1930,0 1986 Ell 1 0.028 0,142 82,30 5,58 20.60 13,30 75,20 4,290 2180.0 1986 EU2 0,063 0.079 40,00 8,78 8,84 20.20 77.90 2.980 1510,0 1986 Ell3 0,048 0,059 29,90 5.41 4,26 11.90 37.30 2,300 1410.0
Western Long Island Sound
1984 WLIl 1.060 0.540 140,00 113.00 33.50 64.90 230.00 3.890 1310.0 1984 WLI2 1.590 0.920 123,00 109.00 32.80 74.60 256.00 3,580 974.0 1985 WLIl 1.870 0.574 123,00 93.00 30.10 52.40 193.00 3,580 1000.0 1985 WLI2 1,420 0.968 128.00 102.00 34.90 74,80 237.00 3.740 924.0 1985 WLI4 2,260 1.080 157.00 129.00 35.00 88.60 255.00 3.870 1100.0 1986 WLI2 1.590 1.050 108.00 180.00 32.80 117.00 268.00 3.510 899.0 1986 WLI4 2,790 1.790 154.00 168.00 46.90 123.00 321.00 4.480 1130.0 1986 WU9 0,304 0,140 42.90 26.00 14.70 29.00 87.70 2.180 614.0
Raritan Bay
1984 RBI 5.420 3.450 196,00 215,00 44,50 193,00 550,00 5,690 512.0 1984 RB2 4,180 2,390 170,00 185,00 35,70 178,00 451.00 4,240 487.0 1984 RB3 6.180 2,870 217,00 203,00 43.90 220,00 472.00 5.010 654.0 1984 RB5 3.440 2,260 141.00 121.00 31.10 133,00 262.00 3,150 600.0 1985 RBI 6.500 4.000 237,00 234,00 49.40 223.00 617,00 5,770 586.0 1985 RB2 4,300 2.610 181.00 183,00 40.90 178.00 398.00 4.250 454.0 1985 RB3 4,500 2.950 219,00 175.00 40,00 198.00 401.00 4.260 512,0 1985 RB5 2,930 2.160 150,00 108,00 29.00 135,00 221.00 2.950 543.0 1986 RBI 5,140 4.830 208,00 214,00 50.60 137.00 593.00 5.710 485,0 1986 RB2 4,690 2.510 179,00 219,00 43.50 137,00 443.00 4,760 517,0 1986 RB3 4,210 1.560 166.00 150.00 37.70 124,00 336.00 4,250 851.0 1986 RB4 1,580 0.694 71.70 49.80 18.50 54.50 123,00 2.050 445.0
Great Bay
1985 GBI 0,416 0.376 102.00 22.20 24,10 33.20 115,00 3.250 555.0 1985 GB2 0,682 0.494 120.00 31.70 27.90 37.60 174,00 4.700 496,0 1985 GB3 0,694 0.667 124,00 40,10 25.40 38.90 188.00 4.150 515,0 1986 GBI 0.489 0,331 87.90 19.00 27,70 38.00 111.00 3.340 541.0 1986 GB2 0.981 0.705 108.00 32.50 36.10 64.60 185.00 4.540 469.0 1986 GB3 0.876 0,624 104.00 32.20 36,00 51.30 163.00 4.060 474,0
Delaware Bay
1984 DBI 0.150 0,610 52,80 12,20 15.40 21.30 85.30 1.930 445.0 1984 DB 11 < 0.060 < 0.030 5.59 3.85 0.83 5.03 9,79 0.190 53,1 1984 DB9 0,110 0,070 24,90 8.98 6.49 18,80 53,90 1.410 240.0 1985 DBI 0.199 0.282 57,50 14,70 17,50 22,80 102.00 2.160 580.0 1985 DB15 0,208 0,389 56,80 10,90 13.50 20,70 100.00 1.820 515.0 . 1985 DB16 0,070 0,180 40,50 7.21 10,20 17.10 56,10 1.480 404.0 1986 DBI 0.159 0,192 42,70 5,35 12.80 19.50 77.10 1.690 392.0 1986 DBI5 0.297 0,267 62,00 11.90 21.30 29,90 103.00 2.400 496.0 1986 DB16 0,429 0,717 71.20 19.00 27,00 37,00 144.00 2.940 616.0
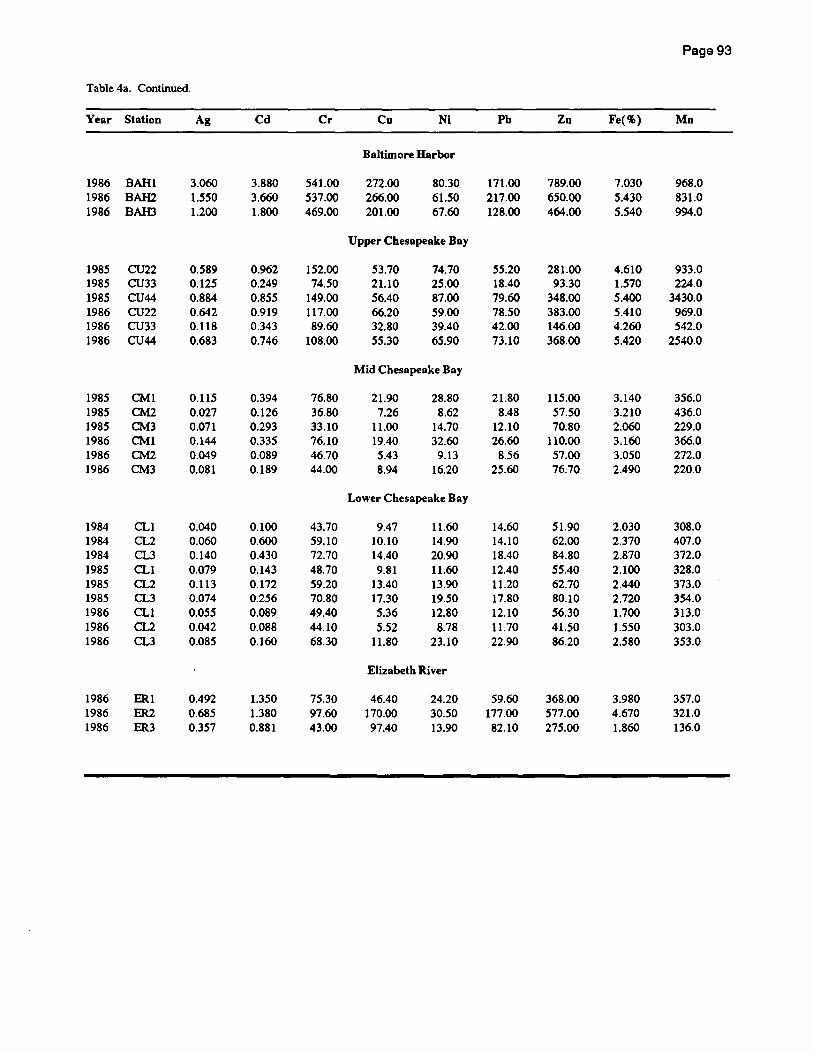
Page 93
Table 4a. Continued.
Year Station Ag Cd Cr Cu NI Pb Zn Fe(~) Mn
Baltimore Harbor
1986 BAH 1 3.060 3.880 541.00 272.00 80.30 171.00 789.00 7.030 968.0 1986 BAH2 1.550 3.660 537.00 266.00 61.50 217.00 650.00 5.430 831.0 1986 BAH3 1.200 1.800 469.00 201.00 67.60 128.00 464.00 5.540 994.0
Upper Chesapeake Bay
1985 CU22 0.589 0.962 152.00 53.70 74.70 55.20 281.00 4.610 933.0 1985 CU33 0.125 0.249 74.50 21.10 25.00 18.40 93.30 1.570 224.0 1985 CU44 0.884 0.855 149.00 56.40 87.00 79.60 348.00 5.400 3430.0 1986 CU22 0.642 0.919 117.00 66.20 59.00 78.50 383.00 5.410 969.0 1986 CU33 0.118 0.343 89.60 32.80 39.40 42.00 146.00 4.260 542.0 1986 CU44 0.683 0.746 108.00 55.30 65.90 73.10 368.00 5.420 2540.0
Mid Chesapeake Bay
1985 CMl 0.115 0.394 76.80 21.90 28.80 21.80 115.00 3.140 356.0 1985 CM2 0.027 0.126 36.80 7.26 8.62 8.48 57.50 3.210 436.0 1985 CM3 0.071 0.293 33.10 11.00 14.70 12.10 70.80 2.060 229.0 1986 CMl 0.144 0.335 76.10 19.40 32.60 26.60 110.00 3.160 366.0 1986 CM2 0.049 0.089 46.70 5.43 9.13 8.56 57.00 3.050 272.0 1986 CM3 0.081 0.189 44.00 8.94 16.20 25.60 76.70 2.490 220.0
Lower Chesapeake Bay
1984 CLI 0.040 0.100 43.70 9.47 11.60 14.60 51.90 2.030 308.0 1984 CL2 0.060 0.600 59.10 10.10 14.90 14.10 62.00 2.370 407.0 1984 CL3 0.140 0.430 72.70 14.40 20.90 18.40 84.80 2.870 372.0 1985 CLI 0.079 0.143 48.70 9.81 11.60 12.40 55.40 2.100 328.0 1985 CL2 0.113 0.172 59.20 13.40 13.90 11.20 62.70 2.440 373.0 1985 CL3 0.074 0.256 70.80 17.30 19.50 17.80 80.10 2.720 354.0 1986 CLI 0.055 0.089 49.40 5.36 12.80 12.10 56.30 1.700 313.0 1986 CL2 0.042 0.088 44.10 5.52 8.78 11.70 41.50 1.550 303.0 1986 CL3 0.085 0.160 68.30 11.80 23.10 22.90 86.20 2.580 353.0
Elizabeth River
1986 ERI 0.492 1.350 75.30 46.40 24.20 59.60 368.00 3.980 357.0 1986 ER2 0.685 1.380 97.60 170.00 30.50 177.00 577.00 4.670 321.0 1986 ER3 0.357 0.881 43.00 97.40 13.90 82.10 275.00 1.860 136.0

Page 94
Table 4b. Concentrations of metals (thallium, aluminum, silicon, arsenic, mercury, selenium, tin, antimony) in sediment (ppm dry weight, except where noted)
Year Station TI AI(%) Si(%) As Hg Se Sn Sb
Machias Bay
1984 MB1 0.390 5.470 34.30 8.56 < 0.090 0.120 2.580 0.430 1985 MB1 0.373 4.940 35.10 6.47 < 0.075 < 0.219 2.060 0.382 1985 MB3 0.463 6.090 33.00 8.34 < 0.076 < 0.222 2.450 0.294 1985 MB4 0.455 5.630 33.40 9.09 < 0.075 < 0.219 2.270 0.426 1986 MB1 0.378 4.680 35.00 5.76 0.029 < 0.486 1.490 0.481 1986 MB3 0.430 5.870 35.60 8.29 0.040 < 0.467 1.770 0.807 1986 MB4 0.462 5.200 36.80 6.42 0.027 < 0.465 1.290 0.345
Frenchmans Bay
1985 FBI 0.754 8.560 28.60 9.80 0.021 0.554 4.300 0.663 1985 FB2 0.682 7.750 26.60 10.70 < 0.077 0.414 4.160 0.533 1985 FB3 0.744 7.140 31.60 9.51 < 0.075 0.305 3.600 0.471 1986 FBI 0.651 7.910 27.50 11.80 0.125 < 0.479 3.570 0.710 1986 FB2 0.666 7.500 27.40 11.60 0.100 < 0.490 3.570 0.726 1986 FB3 0.589 6.580 32.10 8.62 0.041 < 0.485 3.310 0.840
Penobscot Bay
1985 PBl 0.674 7.240 34.00 14.50 0.340 0.508 4.320 0.387 1985 PB3 0.541 9.330 27.60 8.55 0.115 0.453 3.980 0.474 1985 PB4 0.628 7.100 26.30 10.80 0.043 < 0.237 3.300 0.561 1986 PBl 0.633 7.830 26.80 12.10 0.390 < 0.493 3.850 0.852 1986 PB3 0.563 8.040 28.00 11.50 0.204 < 0.465 3.890 0.919 1986 PB4 0.673 7.200 27.70 9.29 0.149 < 0.496 3.380 0.857
Casco Bay
1984 CB14 0.350 6.120 31.20 9.22 0.090 0.300 2.680 0.630 1984 CB15 0.370 6.410 30.80 7.59 0.140 < 0.040 3.380 0.700 1984 CB5 < 0.280 6.740 30.60 9.76 0.140 0.040 3.200 0.550 1985 CBl 0.664 7.690 28.40 14.30 0.059 0.548 4.120 0.198 1985 CB2 0.746 7.690 35.40 16.60 0.160 0.682 6.080 0.404 1985 CB4 0.817 9.310 29.50 8.53 0.264 < 0.227 7.130 0.348 1986 CB1 0.634 7.410 27.60 12.70 0.177 < 0.494 4.000 0.488 1986 CB2 0.705 7.370 26.20 15.30 0.226 < 0.469 5.260 0.811 1986 CB4 0.708 7.240 27.00 13.20 0.366 < 0.495 6.600 0.611
Merrimack River
1984 MR2 0.400 4.570 37.90 6.83 0.060 0.040 4.400 < 0.060 1984 MR3 0.390 5.150 35.30 2.41 < 0.100 0.040 7.580 < 0.060 1985 MRI 0.419 4.330 37.00 3.56 < 0.076 < 0.221 < 1.650 < 0.458 1985 MR2 0.552 3.820 34.20 5.56 < 0.077 < 0.224 1.600 < 0.464 1985 MR3 0.211 4.070 30.60 2.54 < 0.076 < 0.223 2.160 < 0.461
Salem Harbor
1984 SHI 0.890 6.480 20.80 20.20 0.890 1.330 4.840 2.700 1984 SH2 0.820 6.240 22.40 11.60 1.210 0.990 10.600 2.230 1984 SH3 1.140 5.730 18.80 15.90 1.470 1.350 14.400 5.770 1985 SHI 0.870 6.430 24.10 21.20 1.140 0.637 15.600 2.690 1985 SH2 0.686 6.090 29.70 8.11 0.666 0.516 8.530 1.560 1985 SH3 1.060 6.440 30.50 9.58 1.140 0.650 15.700 3.640 1985 SH4 0.853 6.650 22.90 12.10 1.110 1.080 16.900 3.380
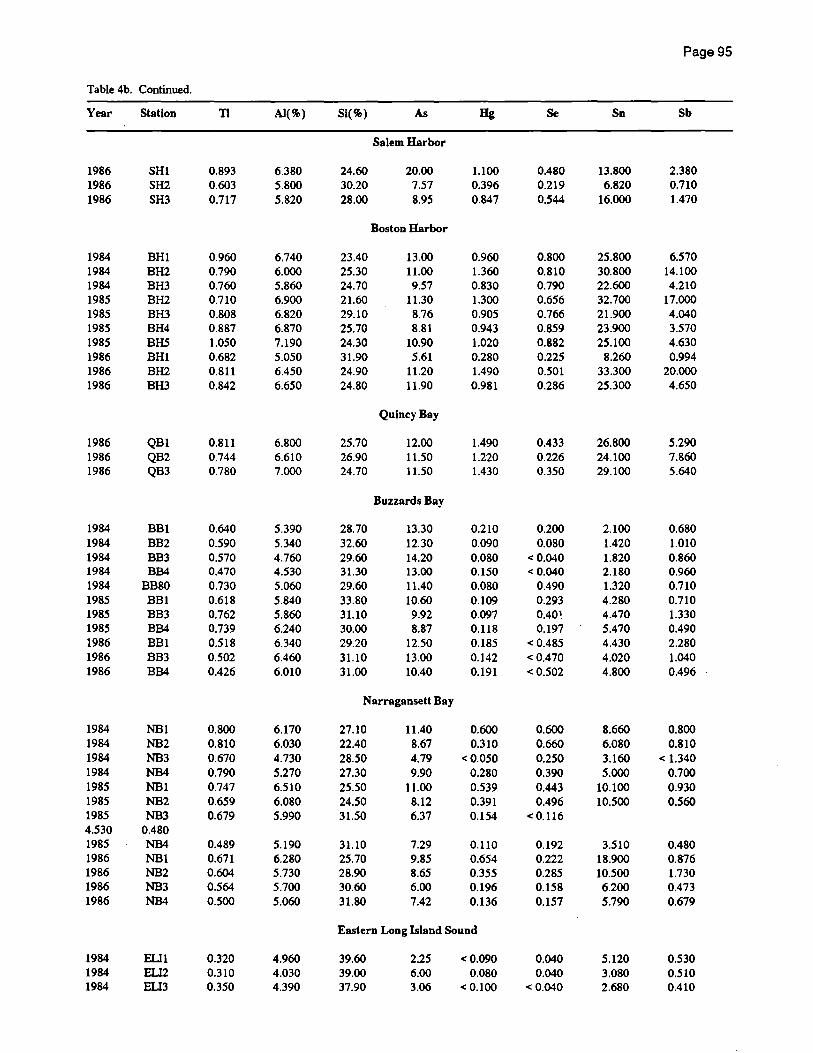
Page 95
Table 4b. Continued.
Year Station TI AI(%) Si(%) As Hg Se Sn Sb
Salem Harbor
1986 SHI 0.893 6.380 24.60 20.00 1.100 0.480 13.800 2.380 1986 SH2 0.603 5.800 30.20 7.57 0.396 0.219 6.820 0.710 1986 SH3 0.717 5.820 28.00 8.95 0.847 0.544 16.000 1.470
Boston Harbor
1984 BHl 0.960 6.740 23.40 13.00 0.960 0.800 25.800 6.570 1984 BH2 0.790 6.000 25.30 11.00 1.360 0.810 30.800 14.100 1984 BH3 0.760 5.860 24.70 9.57 0.830 0.790 22.600 4.210 1985 BH2 0.710 6.900 21.60 11.30 1.300 0.656 32.700 17.000 1985 BH3 0.808 6.820 29.10 8.76 0.905 0.766 21.900 4.040 1985 BH4 0.887 6.870 25.70 8.81 0.943 0.859 23.900 3.570 1985 BHS 1.050 7.190 24.30 10.90 1.020 0.882 25.100 4.630 1986 BHl 0.682 5.050 31.90 5.61 0.280 0.225 8.260 0.994 1986 BH2 0.811 6.450 24.90 11.20 1.490 0.501 33.300 20.000 1986 BH3 0.842 6.650 24.80 11.90 0.981 0.286 25.300 4.650
Quincy Bay
1986 QBl 0.811 6.800 25.70 12.00 1.490 0.433 26.800 5.290 1986 QB2 0.744 6.610 26.90 11.50 1.220 0.226 24.100 7.860 1986 QB3 0.780 7.000 24.70 11.50 1.430 0.350 29.100 5.640
Buzzards Bay
1984 BBI 0.640 5.390 28.70 13.30 0.210 0.200 2.100 0.680 1984 BB2 0.590 5.340 32.60 12.30 0.090 0.080 1.420 1.010 1984 BB3 0.570 4.760 29.60 14.20 0.080 < 0.040 1.820 0.860 1984 BB4 0.470 4.530 31.30 13.00 0.150 < 0.040 2.180 0.960 1984 BB80 0.730 5.060 29.60 11.40 0.080 0.490 1.320 0.710 1985 BBI 0.618 5.840 33.80 10.60 0.109 0.293 4.280 0.710 1985 BB3 0.762 5.860 31.10 9.92 0.097 0.40 1. 4.470 1.330 1985 BB4 0.739 6.240 30.00 8.87 0.118 0.197 5.470 0.490 1986 BBI 0.518 6.340 29.20 12.50 0.185 < 0.485 4.430 2.280 1986 BB3 0.502 6.460 31.10 13.00 0.142 < 0.470 4.020 1.040 1986 BB4 0.426 6.010 31.00 10.40 0.191 < 0.502 4.800 0.496
Narragansett Bay
1984 NBI 0.800 6.170 27.10 11.40 0.600 0.600 8.660 0.800 1984 NB2 0.810 6.030 22.40 8.67 0.310 0.660 6.080 0.810 1984 NB3 0.670 4.730 28.50 4.79 < 0.050 0.250 3.160 < 1.340 1984 NB4 0.790 5.270 27.30 9.90 0.280 0.390 5.000 0.700 1985 NB1 0.747 6.510 25.50 11.00 0.539 0.443 10.100 0.930 1985 NB2 0.659 6.080 24.50 8.12 0.391 0.496 10.500 0.560 1985 NB3 0.679 5.990 31.50 6.37 0.154 < 0.116 4.530 0.480 1985 NB4 0.489 5.190 31.10 7.29 0.110 0.192 3.510 0.480 1986 NB1 0.671 6.280 25.70 9.85 0.654 0.222 18.900 0.876 1986 NB2 0.604 5.730 28.90 8.65 0.355 0.285 10.500 1.730 1986 NB3 0.564 5.700 30.60 6.00 0.196 0.158 6.200 0.473 1986 NB4 0.500 5.060 31.80 7.42 0.136 0.157 5.790 0.679
Eastern Long Island Sound
1984 WI 0.320 4.960 39.60 2.25 < 0.090 0.040 5.120 0.530 1984 ELl2 0.310 4.030 39.00 6.00 0.080 0.040 3.080 0.510 1984 ELl3 0.350 4.390 37.90 3.06 < 0.100 < 0.040 2.680 0.410
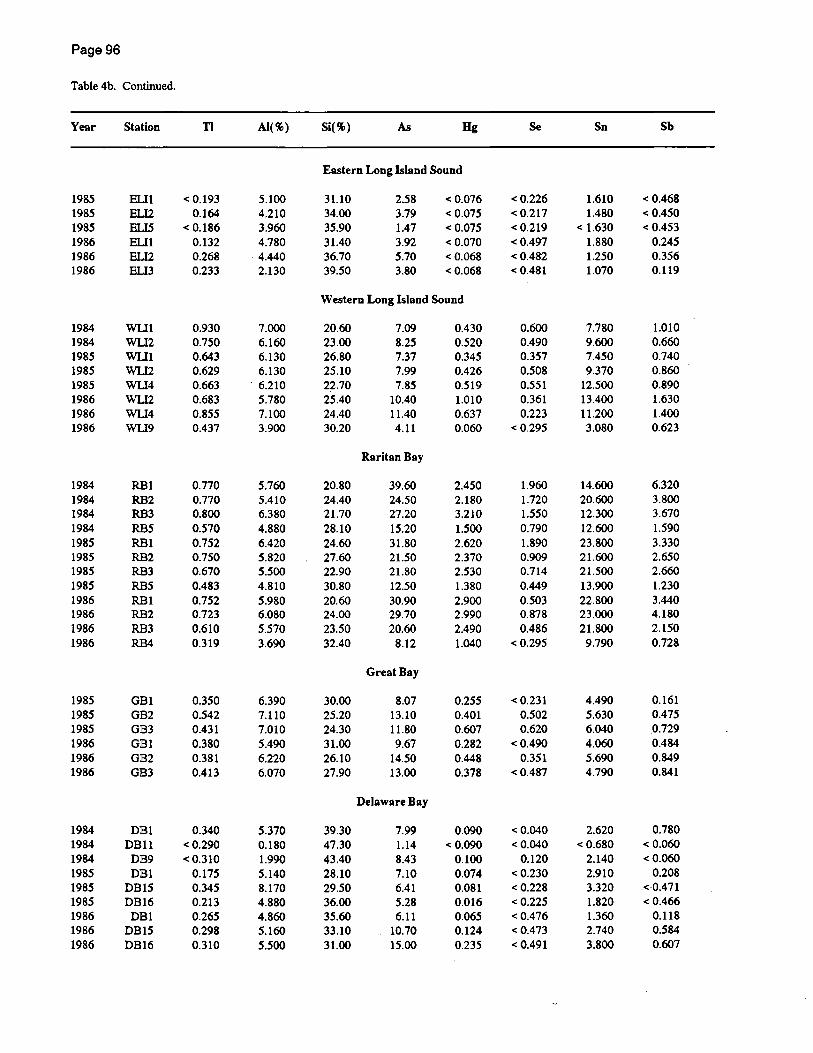
Page 96
Table 4b. Continued.
Year Station TI AI(%) Si(%) As Hg Se Sn Sb
Eastern Long Island Sound
1985 Ell 1 < 0.193 5.100 31.10 2.58 < 0.076 < 0.226 1.610 < 0.468 1985 EU2 0.164 4.210 34.00 3.79 < 0.075 < 0.217 1.480 < 0.450 1985 ELI5 < 0.186 3.960 35.90 1.47 < 0.075 < 0.219 < 1.630 < 0.453 1986 Elll 0.132 4.780 31.40 3.92 < 0.070 < 0.497 1.880 0.245 1986 EU2 0.268 4.440 36.70 5.70 < 0.068 < 0.482 1.250 0.356 1986 Ell3 0.233 2.130 39.50 3.80 < 0.068 < 0.481 1.070 0.119
Western Long Island Sound
1984 WUl 0.930 7.000 20.60 7.09 0.430 0.600 7.780 1.010 1984 WU2 0.750 6.160 23.00 8.25 0.520 0.490 9.600 0.660 1985 Will 0.643 6.130 26.80 7.37 0.345 0.357 7.450 0.740 1985 WU2 0.629 6.130 25.10 7.99 0.426 0.508 9.370 0.860 1985 WU4 0.663 . 6.210 27-70 7.85 0.519 0.551 12.500 0.890 1986 WLI2 0.683 5.780 25.40 10.40 1.010 0.361 13.400 1.630 1986 Wil4 0.855 7.100 24.40 11.40 0.637 0.223 11.200 1.400 1986 WU9 0.437 3.900 30.20 4.11 0.060 < 0.295 3.080 0.623
Raritan Bay
1984 RBI 0.770 5.760 20.80 39.60 2.450 1.960 14.600 6.320 1984 RB2 0.770 5.410 24.40 24.50 2.180 1.720 20.600 3.800 1984 RB3 0.800 6.380 21.70 27.20 3.210 1.550 12.300 3.670 1984 RB5 0.570 4.880 28.10 15.20 1.500 0.790 12.600 1.590 1985 RBI 0.752 6.420 24.60 31.80 2.620 1.890 23.800 3.330 1985 RB2 0.750 5.820 27.60 21.50 2.370 0.909 21.600 2.650 1985 RB3 0.670 5.500 22.90 21.80 2.530 0.714 21.500 2.660 1985 RB5 0.483 4.810 30.80 12.50 1.380 0.449 13.900 1.230 1986 RBI 0.752 5.980 20.60 30.90 2.900 0.503 22.800 3.440 1986 RB2 0.723 6.080 24.00 29.70 2.990 0.878 23.000 4.180 1986 RB3 0.610 5.570 23.50 20.60 2.490 0.486 21.800 2.150 1986 RB4 0.319 3.690 32.40 8.12 1.040 < 0.295 9.790 0.728
Great Bay
1985 GBI 0.350 6.390 30.00 8.07 0.255 < 0.231 4.490 0.161 1985 GB2 0.542 7.110 25.20 13.10 0.401 0.502 5.630 0.475 1985 GB3 0.431 7.010 24.30 11.80 0.607 0.620 6.040 0.729 1986 GBI 0.380 5.490 31.00 9.67 0.282 < 0.490 4.060 0.484 1986 GB2 0.381 6.220 26.10 14.50 0.448 0.351 5.690 0.849 1986 GB3 0.413 6.070 27.90 13.00 0.378 < 0.487 4.790 0.841
Delaware Bay
1984 OBI 0.340 5.370 39.30 7.99 0.090 < 0.040 2.620 0.780 1984 DB 11 < 0.290 0.180 47.30 1.14 < 0.090 < 0.040 < 0.680 < 0.060 1984 OB9 < 0.310 1.990 43.40 8.43 0.100 0.120 2.140 < 0.060 1985 OBI 0.175 5.140 28.10 7.10 0.074 < 0.230 2.910 0.208 1985 OB15 0.345 8.170 29.50 6.41 0.081 < 0.228 3.320 <0.471 1985 OB16 0.213 4.880 36.00 5.28 0.016 < 0.225 1.820 <0.466 1986 OBI 0.265 4.860 35.60 6.11 0.065 < 0.476 1.360 0.118 1986 OB15 0.298 5.160 33.10 10.70 0.124 < 0.473 2.740 0.584 1986 OB16 0.310 5.500 31.00 15.00 0.235 < 0.491 3.800 0.607

Page 97
Table 4b. Continued.
Year Station TI AI(tl ) Si(tl ) As Hg Se Sn Sb
Baltimore Harbor
1986 BAH 1 0.957 9.100 20.50 31.10 0.729 1.400 64.600 22.000 1986 BAH2 1.180 7.700 23.50 37.80 0.802 1.800 137.000 123.000 1986 BAH3 0.862 8.600 22.50 22.40 0.664 1.580 20.900 6.850
Upper Chesapeake Bay
1985 CU22 0.808 7.240 22.90 15.40 0.278 1.130 6.820 1.190 1985 CU33 0.166 1.910 41.00 5.54 0.085 0.195 2.430 0.340 1985 CU44 0.973 8.910 24.50 19.80 0.273 1.060 7.110 4.660 1986 CU22 0.967 8.770 20.70 17.80 0.381 0.821 6.570 1.340 1986 CU33 0.618 5.990 29.50 10.30 0.088 0.224 2.600 0.728 1986 CU44 0.836 8.380 21.10 13.90 0.520 0.809 7.180 1.220
Mid Chesapeake Bay
1985 CMl 0.432 6.010 28.70 9.49 0.062 0,420 2.660 0.254 1985 CM2 < 0.193 2.180 38.00 5.17 < 0.078 < 0.227 1.320 < 0.469 1985 CM3 0.173 3.060 33.10 6.88 < 0.078 < 0.228 1.260 0.301 1986 CMl 0.389 5.900 24.40 9.40 0.082 0.358 2.730 0.371 1986 CM2 0.094 1.950 38.90 8.11 0.029 < 0.483 0.858 0.358 1986 CM3 0.238 2.930 38.10 7.74 0.042 < 0.490 1.050 0.605
Lower Chesapeake Bay
1984 CLI 0.260 3.760 34.40 5.15 < 0.090 < 0.040 1.780 0.380 1984 CL2 0.480 5.200 35.90 6.53 < 0.100 < 0.040 1.210 0.670 1984 CL3 0.480 5.690 34.10 9.81 0.120 0.040 1.120 0.510 1985 CLI 0.352 4.690 41.60 3.49 0.042 < 0.115 1.850 0.530 1985 CL2 0.442 6.460 39.30 4.13 0.059 0.192 1.840 0.480 1985 CL3 0.494 5.800 34.70 6.53 0.091 0.141 2.890 0.580 1986 CLI 0.266 4.310 32.90 4.24 0.028 < 0.478 1.720 0.118 1986 CL2 0.202 3.670 41.70 3.39 < 0.069 0.281 1.230 0.121 1986 CL3 0.331 4.800 31.80 5.57 0.040 < 0.471 2.000 0.349
Elizabeth River
1986 ERI 0.677 6.550 25.20 11.00 0.257 0.291 4.430 1.200 1986 ER2 0.743 7.440 22.50 13.00 0.836 0.294 7.900 1.520 1986 ER3 0.379 3.430 28.80 7.75 0.829 < 0.295 9.790 1.350
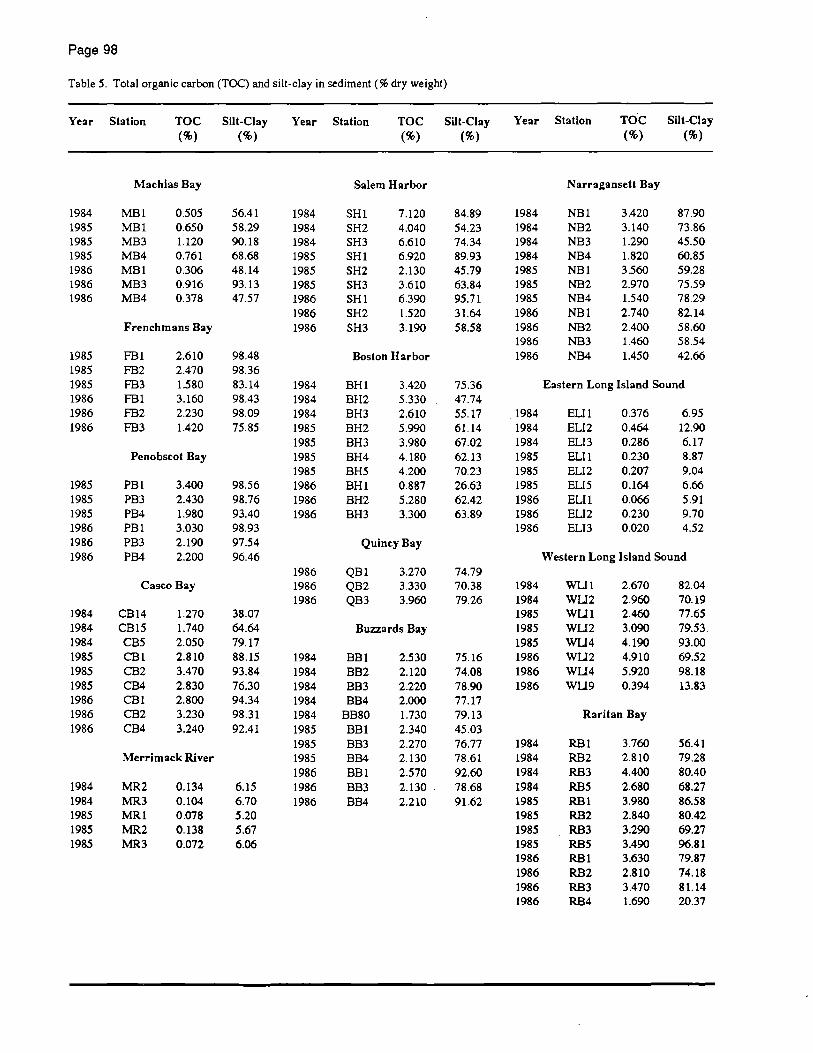
Page 98
Table 5. Total organic carbon (TOC) and silt-clay in sediment (% dry weight)
Year Station TOC Silt-Clay Year Station TOC Silt-Clay Year Station TOC Silt-Clay (%) (%) (%) (%) (%) (%)
Machias Bay Salem Harbor Narragansett Bay
1984 MBI 0.505 56.41 1984 SHI 7.120 84.89 1984 NBI 3.420 87.90 1985 MBI 0.650 58.29 1984 SH2 4.040 54.23 1984 NB2 3.140 73.86 1985 MB3 1.120 90.18 1984 SH3 6.610 74.34 1984 NB3 1.290 45.50 1985 MB4 0.761 68.68 1985 SH1 6.920 89.93 1984 NB4 1.820 60.85 1986 MB1 0.306 48.14 1985 SH2 2.130 45.79 1985 NB1 3.560 59.28 1986 MB3 0.916 93.13 1985 SH3 3.610 63.84 1985 NB2 2.970 75.59 1986 MB4 0.378 47.57 1986 SHI 6.390 95.71 1985 NB4 1.540 78.29
1986 SH2 1.520 31.64 1986 NBI 2.740 82.14 Frenchmans Bay 1986 SH3 3.190 58.58 1986 NB2 2.400 58.60
1986 NB3 1.460 58.54 1985 FBI 2.610 98.48 Boston Harbor 1986 NB4 1.450 42.66 1985 FB2 2.470 98.36 1985 FB3 1.580 83.14 1984 BHl 3.420 75.36 Eastern Long Island Sound 1986 FBI 3.160 98.43 1984 BH2 5.330 47.74 1986 FB2 2.230 98.09 1984 BH3 2.610 55.17 1984 ELl 1 0.376 6.95 1986 FB3 1.420 75.85 1985 BH2 5.990 61.14 1984 ELl 2 0.464 12.90
1985 BH3 3.980 67.02 1984 ELl 3 0.286 6.17 Penobscot Bay 1985 BH4 4.180 62.13 1985 ELl 1 0.230 8.87
1985 BH5 4.200 70.23 1985 ELl 2 0.207 9.04 1985 PBl 3.400 98.56 1986 BHl 0.887 26.63 1985 ELl 5 0.164 6.66 1985 PB3 2.430 98.76 1986 BH2 5.280 62.42 1986 ELl 1 0.066 5.91 1985 PB4 1.980 93.40 1986 BH3 3.300 63.89 1986 ELl 2 0.230 9.70 1986 PBl 3.030 98.93 1986 ELI 3 0.020 4.52 1986 PB3 2.190 97.54 Quincy Bay 1986 PB4 2.200 96.46 Western Long Island Sound
1986 QB1 3.270 74.79 Casco Bay 1986 QB2 3.330 70.38 1984 WU1 2.670 82.04
1986 QB3 3.960 79.26 1984 WU2 2.960 70.19 1984 CB14 1.270 38.07 1985 WU1 2.460 77.65 1984 CB15 1.740 64.64 Buzzards Bay 1985 WU2 3.090 79.53. 1984 CB5 2.050 79.17 1985 WU4 4.190 93.00 1985 CB1 2.810 88.15 1984 BB1 2.530 75.16 1986 WU2 4.910 69.52 1985 CB2 3.470 93.84 1984 BB2 2.120 74.08 1986 WU4 5.920 98.18 1985 CB4 2.830 76.30 1984 BB3 2.220 78.90 1986 WU9 0.394 13.83 1986 CB1 2.800 94.34 1984 BB4 2.000 77.17 1986 CB2 3.230 98.31 1984 BB80 1.730 79.13 Raritan Bay 1986 CB4 3.240 92.41 1985 BBI 2.340 45.03
1985 BB3 2.270 76.77 1984 RBI 3.760 56.41 Merrimack River 1985 BB4 2.130 78.61 1984 RB2 2.810 79.28
1986 BB1 2.570 92.60 1984 RB3 4.400 80.40 1984 MR2 0.134 6.15 1986 BB3 2.130 78.68 1984 RB5 2.680 68.27 1984 MR3 0.104 6.70 1986 BB4 2.210 91.62 1985 RBI 3.980 86.58 1985 MR1 0.078 5.20 1985 RB2 2.840 80.42 1985 MR2 0.138 5.67 1985 RB3 3.290 69.27 1985 MR3 0.072 6.06 1985 RB5 3.490 96.81
1986 RBI 3.630 79.87 1986 RB2 2.810 74.18 1986 RB3 3.470 81.14 1986 RB4 1.690 20.37

Page 99
Table 5. Continued.
Year Station TOC Silt-Clay Year Station TOC Silt-Clay Year Station TOC Silt-Clay (%) (%) (%) (%) (%) (%)
Great Bay Baltimore Harbor Lower Chesapeake Bay
1985 GB1 1.670 55.77 1986 BAH 1 4.460 99.08 1984 CL1 0.481 31.55 1985 GB2 4.190 79.77 1986 BAH2 3.440 81.67 1984 CL2 0.646 40.83 1985 GB3 4.090 78.59 1986 BAH3 3.410 97.63 1984 CL3 1.100 78.91 1986 GB1 1.730 57.70 1985 CL1 0.664 33.50 1986 GB2 4.260 95.85 Upper Chesapeake Bay 1985 CL2 0.736 45.78 1986 GB3 3.620 93.85 1985 CL3 1.000 67.80
1985 CU22 3.780 96.50 1986 CL1 0.432 30.25 Delaware Bay 1985 CU33 1.420 26.68 1986 CL2 0.220 18.56
1985 CU44 3.790 95.88 1986 CL3 1.010 75.83 1984 OBI 0.644 28.35 1986 CUll 3.550 98.94 1984 DBll 0.089 3.62 1986 CU22 3.340 99.49 Elizabeth River 1984 DB9 0.823 19.09 1986 CU33 1.990 55.41 1985 OBI 1.410 68.17 1986 CU44 3.730 99.20 1986 ER1 2.530 69.26 1985 DB15 1.070 42.49 1986 ER2 4.230 95.84 1985 DB16 0.314 12.40 Mid Chesapeake Bay 1986 ER3 3.760 33.02 1986 OBI 0.988 36.23 1986 DB15 1.600 46.86 1985 CM1 1.330 69.58 1986 DB16 2.750 64.60 1985 CM2 1.100 9.69
1985 CM3 1.040 26.53 1986 CM1 2.490 98.36 1986 CM2 0.166 7.22 1986 CM3 0.977 20.57 1986 CM4 1.250 79.90
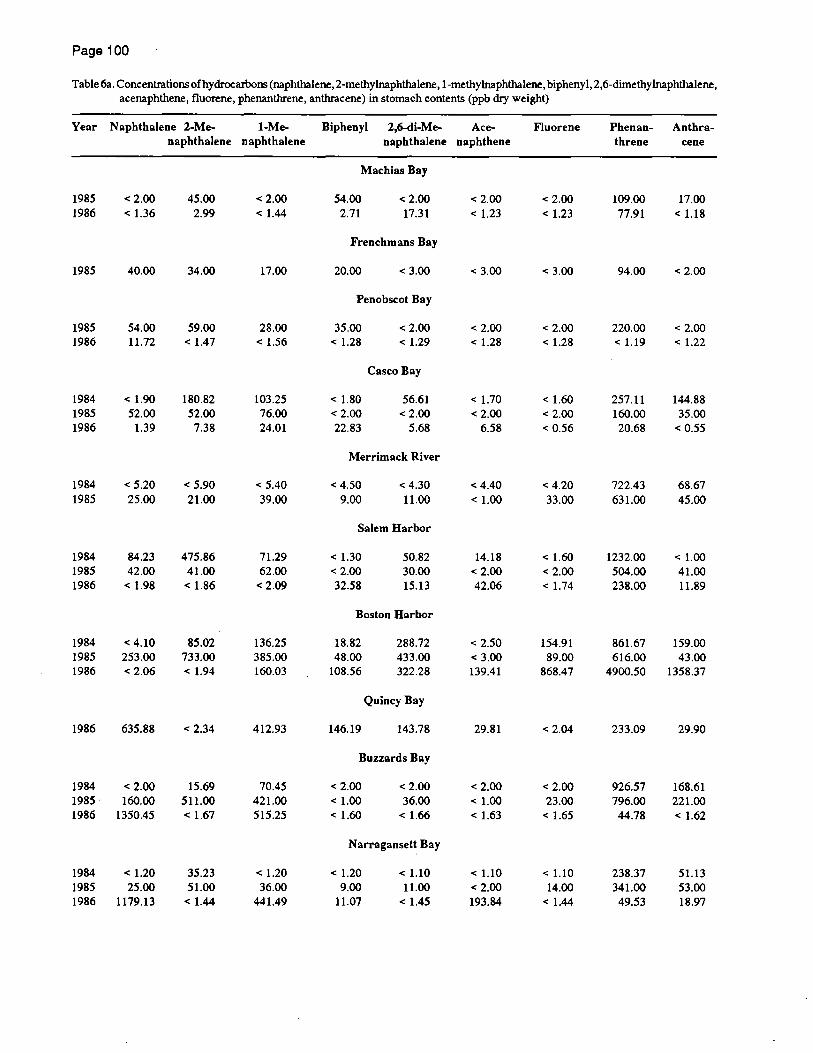
Page 100
Table 6a. Concentrations of hydrocarbons (naphthalene, 2-methylnaphthalene, I-methylnaphthalene, biphenyl, 2,6-dimethylnaphthalene, acenaphthene, fluorene, phenanthrene, anthracene) in stomach contents (ppb dry weight)
Year Naphthalene 2-Me- I-Me- Biphenyl 2,6-di-Me- Ace- Fluorene Phenan- Anthra-naphthalene naphthalene naphthalene naphthene threne cene
Machias Bay
1985 < 2.00 45.00 < 2.00 54.00 < 2.00 < 2.00 < 2.00 109.00 17.00 1986 < 1.36 2.99 <1.44 2.71 17.31 < 1.23 < 1.23 77.91 < 1.18
Frenchmans Bay
1985 40.00 34.00 17.00 20.00 < 3.00 < 3.00 < 3.00 94.00 < 2.00
Penobscot Bay
1985 54.00 59.00 28.00 35.00 < 2.00 < 2.00 < 2.00 220.00 < 2.00 1986 11.72 < 1.47 < 1.56 < 1.28 < 1.29 < 1.28 < 1.28 < 1.19 < 1.22
Casco Bay
1984 < 1.90 180.82 103.25 < 1.80 56.61 < 1.70 <1.60 257.11 144.88 1985 52.00 52.00 76.00 < 2.00 < 2.00 < 2.00 < 2.00 160.00 35.00 1986 1.39 7.38 24.01 22.83 5.68 6.58 < 0.56 20.68 < 0.55
Merrimack River
1984 < 5.20 < 5.90 < 5.40 < 4.50 < 4.30 < 4.40 < 4.20 722.43 68.67 1985 25.00 21.00 39.00 9.00 11.00 <1.00 33.00 631.00 45.00
Salem Harbor
1984 84.23 475.86 71.29 < 1.30 50.82 14.18 <1.60 1232.00 <1.00 1985 42.00 41.00 62.00 < 2.00 30.00 < 2.00 < 2.00 504.00 41.00 1986 < 1.98 < 1.86 < 2.09 32.58 15.13 42.06 < 1.74 238.00 11.89
Boston Harbor
1984 < 4.10 85.02 136.25 18.82 288.72 < 2.50 154.91 861.67 159.00 1985 253.00 733.00 385.00 48.00 433.00 < 3.00 89.00 616.00 43.00 1986 < 2.06 < 1.94 160.03 108.56 322.28 139.41 868.47 4900.50 1358.37
Quincy Bay
1986 635.88 < 2.34 412.93 146.19 143.78 29.81 < 2.04 233.09 29.90
Buzzards Bay
1984 < 2.00 15.69 70.45 < 2.00 < 2.00 < 2.00 < 2.00 926.57 168.61 1985 160.00 511.00 421.00 <1.00 36.00 <1.00 23.00 796.00 221.00 1986 1350.45 < 1.67 515.25 <1.60 <1.66 < 1.63 < 1.65 44.78 < 1.62
Narragansett Bay
1984 < 1.20 35.23 < 1.20 < 1.20 < 1.10 < 1.10 < 1.10 238.37 51.13 1985 25.00 51.00 36.00 9.00 11.00 < 2.00 14.00 341.00 53.00 1986 1179.13 <1.44 441.49 11.07 < 1.45 193.84 <1.44 49.53 18.97
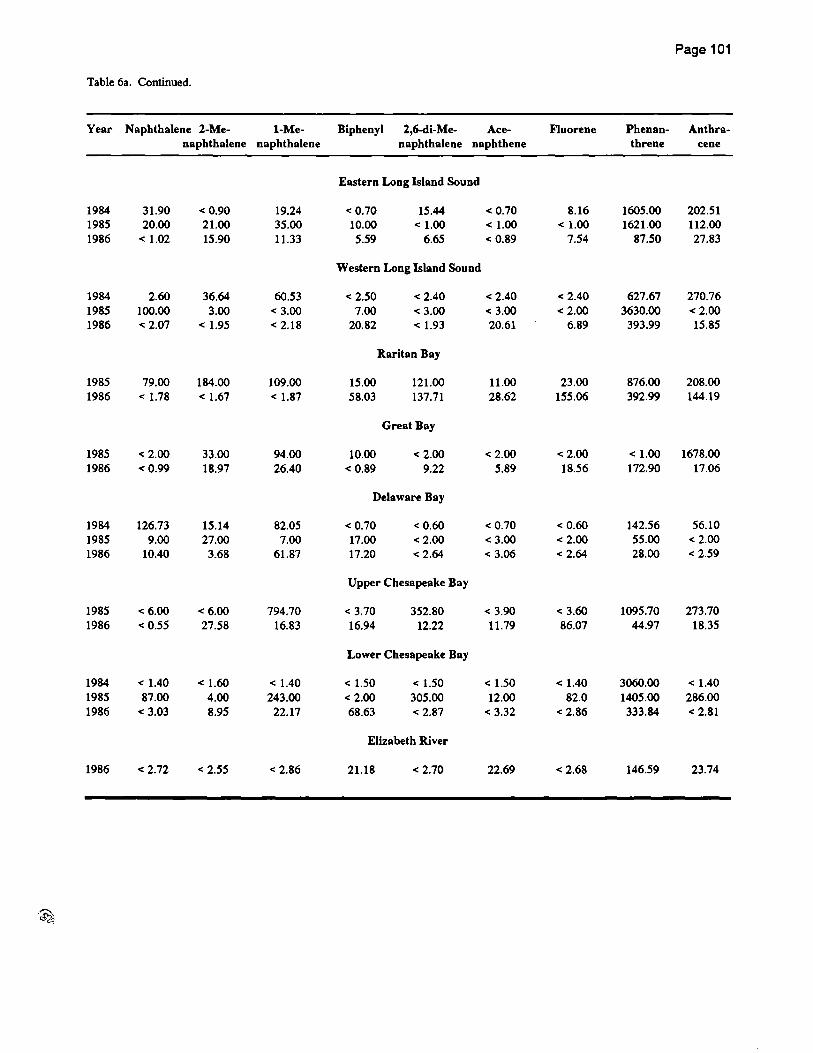
Page 101
Table 6a. Continued.
Year Naphthalene 2-Me- I-Me- Biphenyl 2,6-di-Me- Ace- Fluorene Phenan- Anthra-naphthalene naphthalene naphthalene naphthene threne cene
Eastern Long Island Sound
1984 31.90 <0.90 19.24 < 0.70 15.44 < 0.70 8.16 1605.00 202.51 1985 20.00 21.00 35.00 10.00 <1.00 <1.00 <1.00 1621.00 112.00 1986 < 1.02 15.90 11.33 5.59 6.65 < 0.89 7.54 87.50 27.83
Western Long Island Sound
1984 2.60 36.64 60.53 < 2.50 < 2.40 < 2.40 < 2.40 627.67 270.76 1985 100.00 3.00 < 3.00 7.00 < 3.00 < 3.00 <2.00 3630.00 <2.00 1986 < 2.07 < 1.95 < 2.18 20.82 < 1.93 20.61 6.89 393.99 15.85
Raritan Bay
1985 79.00 184.00 109.00 15.00 121.00 11.00 23.00 876.00 208.00 1986 < 1.78 < 1.67 < 1.87 58.03 137.71 28.62 155.06 392.99 144.19
Great Bay
1985 < 2.00 33.00 94.00 10.00 < 2.00 < 2.00 <2.00 <1.00 1678.00 1986 <0.99 18.97 26.40 < 0.89 9.22 5.89 18.56 172.90 17.06
Delaware Bay
1984 126.73 15.14 82.05 < 0.70 < 0.60 < 0.70 < 0.60 142.56 56.10 1985 9.00 27.00 7.00 17.00 < 2.00 < 3.00 < 2.00 55.00 < 2.00 1986 10.40 3.68 61.87 17.20 < 2.64 < 3.06 < 2.64 28.00 < 2.59
Upper Chesapeake Bay
1985 < 6.00 < 6.00 794.70 < 3.70 352.80 < 3.90 < 3.60 1095.70 273.70 1986 < 0.55 27.58 16.83 16.94 12.22 11.79 86.07 44.97 18.35
Lower Chesapeake Bay
1984 < 1.40 <1.60 <1.40 < 1.50 < 1.50 < 1.50 < 1.40 3060.00 < 1.40 1985 87.00 4.00 243.00 < 2.00 305.00 12.00 82.0 1405.00 286.00 1986 < 3.03 8.95 22.17 68.63 < 2.87 < 3.32 < 2.86 333.84 < 2.81
Elizabeth River
1986 < 2.72 < 2.55 < 2.86 21.18 < 2.70 22.69 < 2.68 146.59 23.74
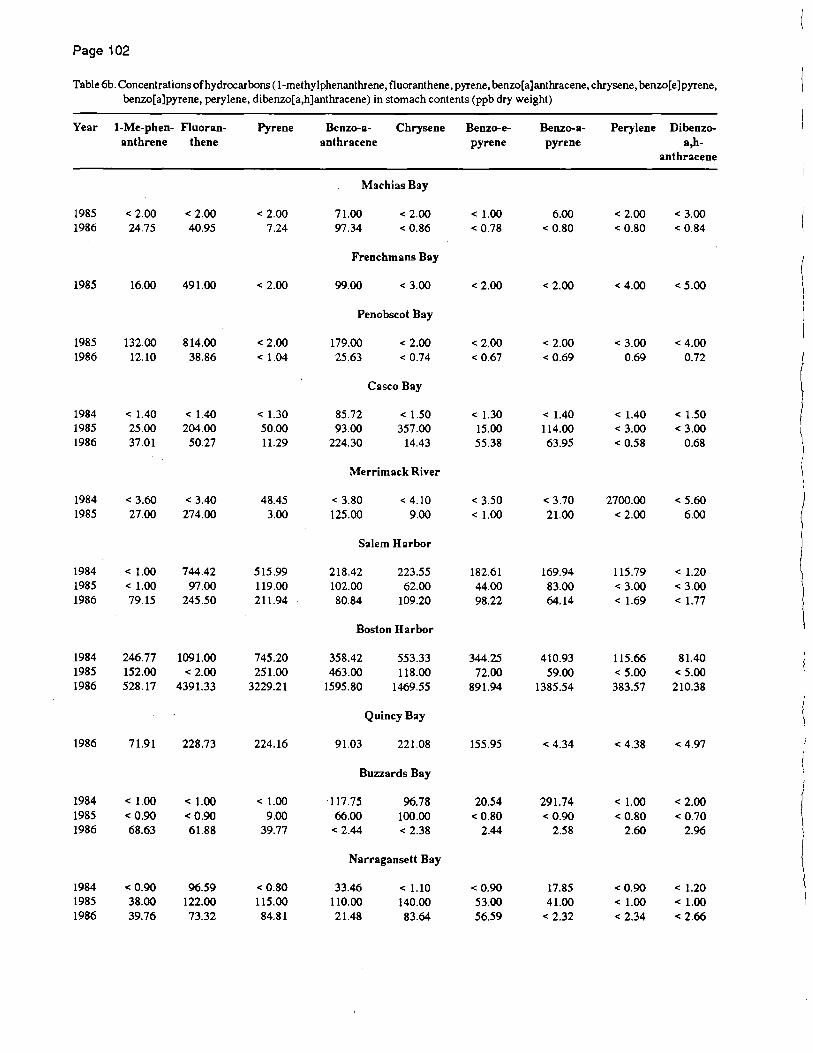
Page 102
Table 6b. Concentrations of hydrocarbons (l-methylphenanthrene, fluoranthene, pyrene, benzo[a]anthracene, chrysene, benzo[e]pyrene, benzo[a]pyrene, perylene, dibenzo[a,h]anthracene) in stomach contents (ppb dry weight)
Year I-Me-phen- Fluoran- Pyrene Benzo-a- Chrysene Benzo-e- Benzo-a- Perylene Dibenzo-anthrene thene anthracene pyrene pyrene a,h-
anthracene
Machias Bay
1985 < 2.00 < 2.00 < 2.00 71.00 < 2.00 <1.00 6.00 < 2.00 < 3.00 1986 24.75 40.95 7.24 97.34 < 0.86 < 0.78 < 0.80 < 0.80 < 0.84
Frenchmans Bay
1985 16.00 491.00 < 2.00 99.00 < 3.00 < 2.00 < 2.00 < 4.00 < 5.00
Penobscot Bay
1985 132.00 814.00 < 2.00 179.00 < 2.00 < 2.00 < 2.00 < 3.00 < 4.00 1986 12.10 38.86 < 1.04 25.63 < 0.74 < 0.67 < 0.69 0.69 0.72
Casco Bay
1984 < 1.40 < 1.40 < 1.30 85.72 < 1.50 < 1.30 < 1.40 < 1.40 < 1.50 1985 25.00 204.00 50.00 93.00 357.00 15.00 114.00 < 3.00 < 3.00 1986 37.01 50.27 11.29 224.30 14.43 55.38 63.95 < 0.58 0.68
Merrimack River
1984 < 3.60 < 3.40 48.45 < 3.80 < 4.10 < 3.50 < 3.70 2700.00 < 5.60 1985 27.00 274.00 3.00 125.00 9.00 <1.00 21.00 < 2.00 6.00
Salem Harbor
1984 < 1.00 744.42 515.99 218.42 223.55 182.61 169.94 115.79 < 1.20 1985 < 1.00 97.00 119.00 102.00 62.00 44.00 83.00 < 3.00 < 3.00 1986 79.15 245.50 211.94 80.84 109.20 98.22 64.14 < 1.69 <1.77
Boston Harbor
1984 246.77 1091.00 745.20 358.42 553.33 344.25 410.93 115.66 81.40 1985 152.00 < 2.00 251.00 463.00 118.00 72.00 59.00 < 5.00 < 5.00 1986 528.17 4391.33 3229.21 1595.80 1469.55 891.94 1385.54 383.57 210.38
Quincy Bay
1986 71.91 228.73 224.16 91.03 221.08 155.95 < 4.34 < 4.38 < 4.97
Buzzards Bay
1984 <1.00 <1.00 <1.00 117.75 96.78 20.54 291.74 <1.00 < 2.00 1985 < 0.90 <0.90 9.00 66.00 100.00 < 0.80 < 0.90 < 0.80 < 0.70 1986 68.63 61.88 39.77 < 2.44 < 2.38 2.44 2.58 2.60 2.96
Narragansett Bay
1984 < 0.90 96.59 < 0.80 33.46 < 1.10 < 0.90 17.85 < 0.90 < 1.20 1985 38.00 122.00 115.00 110.00 140.00 53.00 41.00 <1.00 <1.00 1986 39.76 73.32 84.81 21.48 83.64 56.59 < 2.32 < 2.34 < 2.66

Page 103 -- - ---------- ..
Table 6b. Continued.
Year I-Me-phen- Fluoran- Pyrene Benzo-a- Chrysene Benzo..e- Benzo-a- Perylene Dibenzo-anthrene thene anthracene pyrene pyrene a,h-
anthracene
Eastern Long Island Sound
1984 < 0.60 < 0.50 < 0.50 48.44 21.25 < 0.50 64.11 < 0.50 10.88 1985 40.00 117.00 249.00 409.00 <2.00 40.00 <1.00 < 2.00 < 2.00 1986 81.49 120.53 169.38 159.52 34.21 77.45 47.25 < 0.57 15.37
Western Long Island Sound
1984 < 1.90 < 1.80 < 1.70 < 2.40 < 2.60 2.20 147.86 < 2.20 < 2.60 1985 153.00 < 2.00 474.00 1281.00 419.00 74.00 231.00 < 4.00 47.00 1986 105.59 774.73 526.10 72.07 229.45 117.77 67.98 < 1.91 < 2.01
Raritan Bay
1985 72.00 535.00 535.00 558.00 582.00 328.00 299.00 269.00 80.00 1986 238.06 690.48 846.78 312.07 488.88 568.02 470.00 211.17 78.07
Great Bay
1985 15.00 51.00 <1.00 146.00 < 2.00 27.00 <1.00 24.00 < 2.00 1986 1.20 191.87 125.64 92.36 86.78 59.98 24.63 47.21 < 0.57
Delaware Bay
1984 39.10 134.12 8.19 72.68 <0.60 < 0.60 20.69 < 0.60 < 1.90 1985 29.00 39.00 14.00 107.00 < 3.00 < 2.00 < 2.00 <4.00 44.00 1986 144.52 62.36 < 2.45 254.21 20.41 < 2.32 < 2.42 < 2.42 < 2.81
Upper Chesapeake Bay
1985 586.70 286.60 < 3.00 3958.00 < 5.20 < 2.40 26.80 < 7.50 < 7.10 1986 89.33 53.03 16.92 569.18 49.73 4.81 2.20 1154.63 < 0.61
Lower Chesapeake Bay
1984 < 1.30 < 1.20 < 1.20 < 1.40 < 1.50 < 1.30 < 1.40 < 1.50 < 1.70 1985 403.00 866.00 31.00 1818.00 <2.00 13.00 177.00 < 3.00 < 3.00 1986 140.54 < 2.68 < 2.65 332.72 69.46 < 2.06 < 2.15 < 2.15 < 2.50
Elizabeth River
1986 32.25 209.91 371.84 64.55 149.20 184.26 119.73 < 2.71 < 2.85
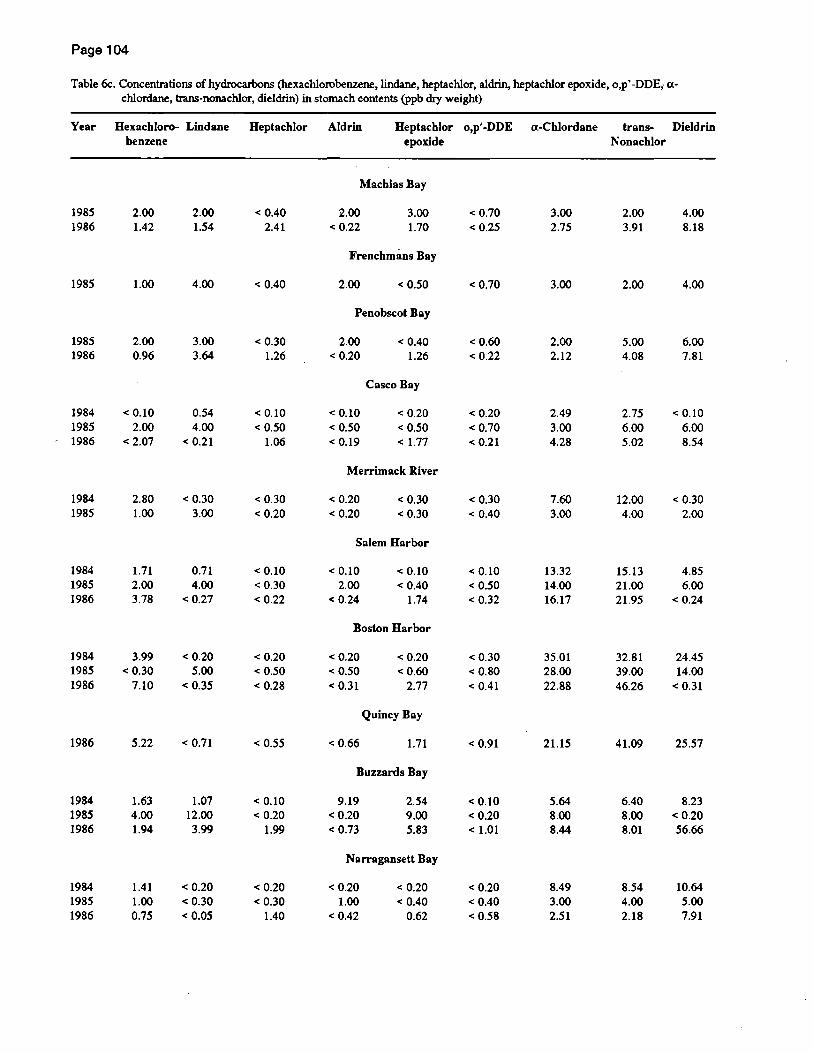
Page 104
Table 6c. Concentrations of hydrocarbons (hexachlorobenzene, lindane, heptachlor, aldrin, heptachlor epoxide, o,p' -DDE,. a-chlordane, trans-nonachlor, dieldrin) in stomach contents (ppb dry weight)
Year Hexlilchioro- Lindane Heptachlor Aldrin Heptachlor o,p/-DDE a-Chlordane trans- Dieldrin benzene epoxide Nonachlor
Machias Bay
1985 2.00 2.00 < 0.40 2.00 3.00 < 0.70 3.00 2.00 4.00 1986 1.42 1.54 2.41 < 0.22 1.70 < 0.25 2.75 3.91 8.18
Frenchmans Bay
1985 1.00 4.00 < 0.40 2.00 < 0.50 < 0.70 3.00 2.00 4.00
Penobscot Bay
1985 2.00 3.00 < 0.30 2.00 < 0.40 < 0.60 2.00 5.00 6.00 1986 0.96 3.64 1.26 < 0.20 1.26 < 0.22 2.12 4.08 7.81
Casco Bay
1984 < 0.10 0.54 < 0.10 < 0.10 < 0.20 < 0.20 2.49 2.75 < 0.10 1985 2.00 4.00 < 0.50 < 0.50 < 0.50 < 0.70 3.00 6.00 6.00 1986 < 2.07 < 0.21 1.06 < 0.19 <1.77 < 0.21 4.28 5.02 8.54
Merrimack River
1984 2.80 < 0.30 < 0.30 < 0.20 < 0.30 < 0.30 7.60 12.00 < 0.30 1985 1.00 3.00 < 0.20 < 0.20 < 0.30 < 0.40 3.00 4.00 2.00
Salem Harbor
1984 1.71 0.71 < 0.10 < 0.10 < 0.10 < 0.10 13.32 15.13 4.85 1985 2.00 4.00 < 0.30 2.00 < 0.40 < 0.50 14.00 21.00 6.00 1986 3.78 < 0.27 < 0.22 < 0.24 1.74 < 0.32 16.17 21.95 < 0.24
Boston Harbor
1984 3.99 < 0.20 < 0.20 < 0.20 < 0.20 < 0.30 35.01 32.81 24.45 1985 < 0.30 5.00 < 0.50 < 0.50 < 0.60 < 0.80 28.00 39.00 14.00 1986 7.10 < 0.35 < 0.28 < 0.31 2.77 < 0.41 22.88 46.26 < 0.31
Quincy Bay
1986 5.22 < 0.71 < 0.55 < 0.66 1.71 < 0.91 21.15 41.09 25.57
Buzzards Bay
1984 1.63 1.07 < 0.10 9.19 2.54 < 0.10 5.64 6.40 8.23 1985 4.00 12.00 < 0.20 < 0.20 9.00 < 0.20 8.00 8.00 < 0.20 1986 1.94 3.99 1.99 < 0.73 5.83 < 1.01 8.44 8.01 56.66
Narragansett Bay
1984 1.41 < 0.20 < 0.20 < 0.20 < 0.20 < 0.20 8.49 8.54 10.64 1985 1.00 < 0.30 < 0.30 1.00 < 0.40 < 0.40 3.00 4.00 5.00 1986 0.75 < 0.05 1.40 < 0.42 0.62 < 0.58 2.51 2.18 7.91
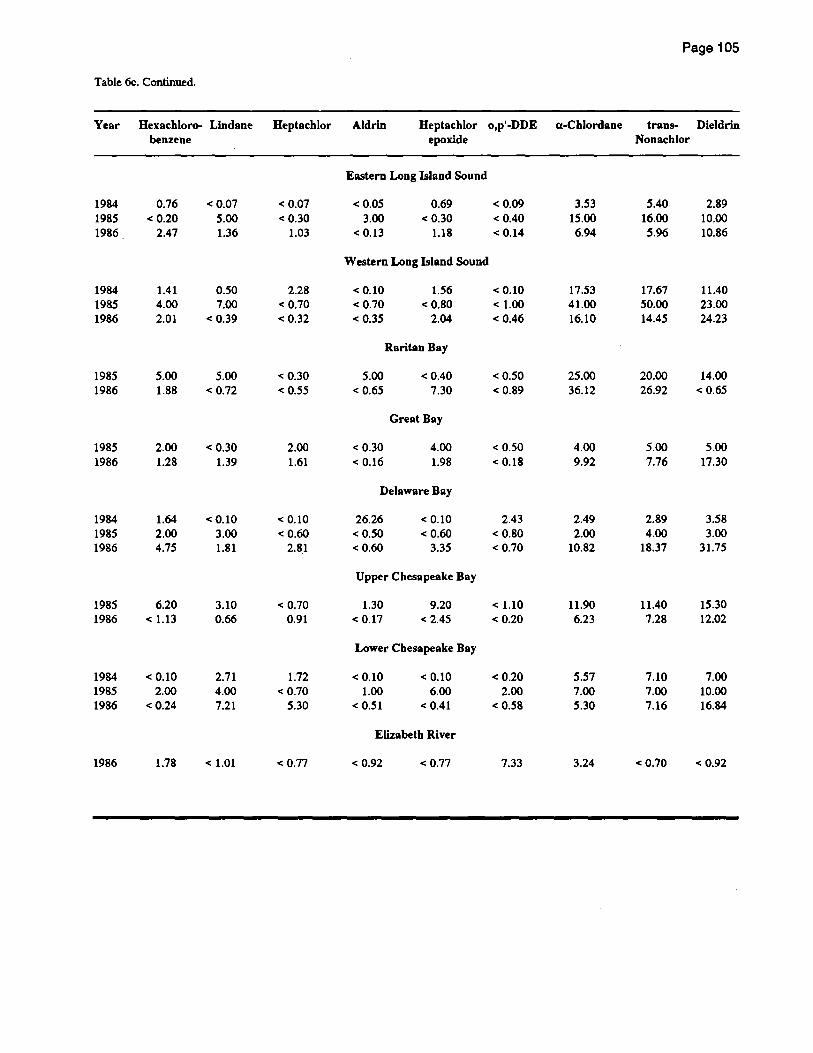
Page 105
Table 6c. Continued.
Year Hexachloro- Lindane Heptachlor Aldrin Heptachlor o,p'-DDE a-Chlordane trans- Dieldrin benzene epoxide Nonachlor
Eastern Long Island Sound
1984 0.76 <0.07 < 0.07 < 0.05 0.69 <0.09 3.53 5.40 2.89 1985 < 0.20 5.00 < 0.30 3.00 < 0.30 < 0.40 15.00 16.00 10.00 1986 2.47 1.36 1.03 < 0.13 1.18 < 0.14 6.94 5.96 10.86
Western Long Island Sound
1984 1.41 0.50 2.28 < 0.10 1.56 < 0.10 17.53 17.67 11.40 1985 4.00 7.00 < 0.70 < 0.70 < 0.80 <1.00 41.00 50.00 23.00 1986 2.01 < 0.39 < 0.32 < 0.35 2.04 < 0.46 16.10 14.45 24.23
Raritan Bay
1985 5.00 5.00 < 0.30 5.00 < 0.40 < 0.50 25.00 20.00 14.00 1986 1.88 < 0.72 < 0.55 < 0.65 7.30 < 0.89 36.12 26.92 < 0.65
Great Bay
1985 2.00 < 0.30 2.00 < 0.30 4.00 < 0.50 4.00 5.00 5.00 1986 1.28 1.39 1.61 < 0.16 1.98 < 0.18 9.92 7.76 17.30
Delaware Bay
1984 1.64 < 0.10 < 0.10 26.26 < 0.10 2.43 2.49 2.89 3.58 1985 2.00 3.00 <0.60 <0.50 < 0.60 < 0.80 2.00 4.00 3.00 1986 4.75 1.81 2.81 <0.60 3.35 < 0.70 10.82 18.37 31.75
Upper Chesapeake Bay
1985 6.20 3.10 < 0.70 1.30 9.20 < 1.10 11.90 11.40 15.30 1986 < 1.13 0.66 0.91 < 0.17 < 2.45 < 0.20 6.23 7.28 12.02
Lower Chesapeake Bay
1984 < 0.10 2.71 1.72 < 0.10 < 0.10 < 0.20 5.57 7.10 7.00 1985 2.00 4.00 < 0.70 1.00 6.00 2.00 7.00 7.00 10.00 1986 < 0.24 7.21 5.30 < 0.51 < 0.41 < 0.58 5.30 7.16 16.84
Elizabeth River
1986 1.78 < 1.01 < 0.77 < 0.92 < 0.77 7.33 3.24 < 0.70 < 0.92

Page 106
Table 6d. Concentrations of hydrocarbons (p,p'-DDE, o,p'-DDD, p,p'-DDD, o,p'-DDT, p,p'-DDT, mirex, dichlorobiphenyl, trichlorobiphenyl, tetrachlorobiphenyl) in stomach contents (Ppb dry weight)
Year p,p'-DDE o,p'-DDD p,p'DDD o,p'-DDT p,p'-DDT Mirex 2-CI-PCB 3-CI-PCB 4-CI-PCB
Machias Bay
1985 2.00 < 0.60 4.00 < 0.90 18.00 < 0.50 14.00 6.00 5.00 1986 9.53 < 0.25 < 0.35 2.12 2.31 1.41 31;67 12.89 2.94
Frenchmans Bay
1985 1.00 < 0.70 < 0.90 < 0.60 1.00 < 0.40 20.00 6.00 14.00
Penobscot Bay
1985 6.00 < 0.60 8.00 < 0.50 2.00 < 0.30 15.00 10.00 26.00 1986 16.91 2.23 8.37 0.87 0.50 2.39 9.94 7.09 21.32
Casco Bay
1984 1.47 < 0.20 < 0.20 < 0.20 < 0.20 < 0.10 < 0.50 < 0.20 3.23 1985 8.00 < 0.80 <1.00 < 0.60 5.00 < 0.40 8.00 13.00 13.00 1986 13.75 2.28 < 11.74 1.38 3.05 < 0.17 29.42 22.33 45.12
Merrimack River
1984 7.40 < 0.40 < 0.40 < 0.40 < 0.30 < 0.20 < 0.90 < 0.30 9.02 1985 5.00 < 0.40 6.00 < 0.30 3.00 < 0.20 11.00 11.00 7.00
Salem Harbor
1984 27.24 54.19 < 0.10 19.47 < 0.10 0.44 < 0.30 2.90 6.80 1985 55.00 15.00 41.00 < 0.50 3.00 < 0.30 20.00 15.00 46.00 1986 57.93 10.24 69.12 10.38 2.33 1.70 < 0.10 210.27 379.76
Boston Harbor
1984 20.03 11.15 60.14 < 0.30 2.40 2.89 2.85 35.50 251.89 1985 34.00 14.00 28.00 < 0.70 11.00 4.00 18.00 86.00 178.00 1986 26.59 8.96 54.38 4.85 7.38 3.44 65.95 405.71 911.44
Quincy Bay
1986 53.34 4.96 55.28 3.76 2.98 1.26 519.12 179.72 258.06
Buzzards Bay
1984 11.87 < 0.10 7.51 3.64 1.05 1.64 6.56 19.41 116.21 1985 8.00 < 0.30 10.00 24.00 6.00 < 0.10 231.00 117.00 238.00 1986 91.30 7.90 < 1.41 17.51 2.85 < 0.56 6.83 123.77 649.17
Narragansett Bay
1984 20.52 4.21 < 0.40 2.85 1.51 0.78 1.36 3.86 45.90 1985 20.00 6.00 9.00 < 0.40 1.00 1.00 9.00 3.00 31.00 1986 11.43 1.04 7.16 1.09 1.65 0.62 32.08 25.89 51.17
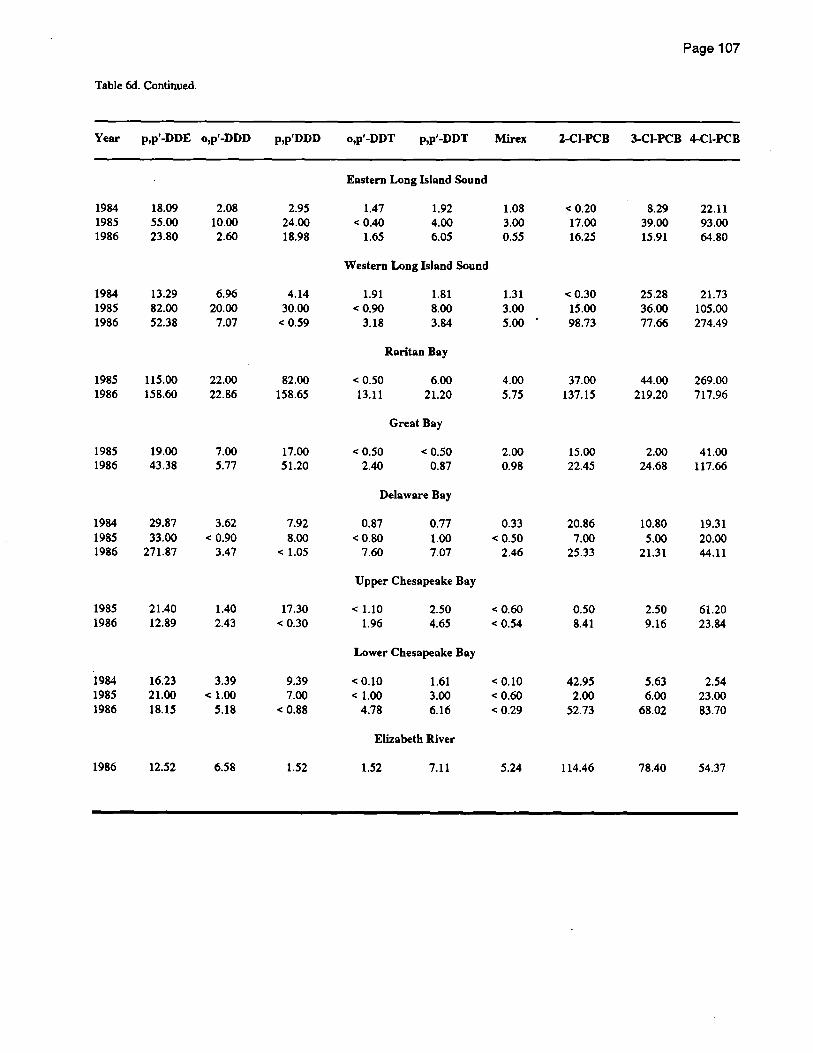
Page 107
Table 6d. Continued.
Year p,P'-DDE o,P'-DDD p,P'DDD o,P'-DDT p,P'-DDT Mirex 2-CI-PCB 3-CI-PCB 4-CI-PCB
Eastern Long Island Sound
1984 18.09 2.08 2.95 1.47 1.92 1.08 < 0.20 8.29 22.11 1985 55.00 10.00 24.00 < 0.40 4.00 3.00 17.00 39.00 93.00 1986 23.80 2.60 18.98 1.65 6.05 0.55 16.25 15.91 64.80
Western Long Island Sound
1984 13.29 6.96 4.14 1.91 1.81 1.31 < 0.30 25.28 21.73 1985 82.00 20.00 30.00 <0.90 8.00 3.00 15.00 36.00 105.00 1986 52.38 7.07 < 0.59 3.18 3.84 5.00 98.73 77.66 274.49
Raritan Bay
1985 115.00 22.00 82.00 < 0.50 6.00 4.00 37.00 44.00 269.00 1986 158.60 22.86 158.65 13.11 21.20 5.75 137.15 219.20 717.96
Great Bay
1985 19.00 7.00 17.00 < 0.50 < 0.50 2.00 15.00 2.00 41.00 1986 43.38 5.77 51.20 2.40 0.87 0.98 22.45 24.68 117.66
Delaware Bay
1984 29.87 3.62 7.92 0.87 0.77 0.33 20.86 10.80 19.31 1985 33.00 < 0.90 8.00 < 0.80 1.00 < 0.50 7.00 5.00 20.00 1986 271.87 3.47 < 1.05 7.60 7.07 2.46 25.33 21.31 44.11
Upper Chesapeake Bay
1985 21.40 1.40 17.30 < 1.10 2.50 < 0.60 0.50 2.50 61.20 1986 12.89 2.43 < 0.30 1.96 4.65 < 0.54 8.41 9.16 23.84
Lower Chesapeake Bay
1984 16.23 3.39 9.39 < 0.10 1.61 < 0.10 42.95 5.63 2.54 1985 21.00 <1.00 7.00 <1.00 3.00 < 0.60 2.00 6.00 23.00 1986 18.15 5.18 < 0.88 4.78 6.16 < 0.29 52.73 68.02 83.70
Elizabeth River
1986 12.52 6.58 1.52 1.52 7.11 5.24 114.46 78.40 54.37

Page 108
Table 6e. Concentrations of hydrocarbons (pentachlorobiphenyl, hexachlorobiphenyl, heptachlorobiphenyl, octachlorobiphenyl, nonachlorobiphenyl) in stomach contents (ppb dry weight)
Year S-Cl- 6-CI- 7-Cl- 8-CI- 9-CI- Year S-CI- 6-CI- 7-CI- 8-CI- 9-CI-PCB PCB PCB PCB PCB PCB PCB PCB PCB PCB
Machias Bay Narragansett Bay
1985 15.00 35.00 15.00 2.00 5.00 1984 181.09 210.52 105.79 4.41 13.06 1986 15.32 15.83 9.97 7.57 1.41 1985 105.00 181.00 89.00 6.00 13.00
1986 75.86 86.30 39.84 15.08 3.30 Frenchmans Bay
1985 12.00 5.00 4.00 < 0.40 < 0.90 Eastern Long Island Sound
1984 104.10 119.00 59.12 3.96 6.39 Penobscot Bay 1985 197.00 181.00 75.00 9.00 15.00
1986 51.09 55.74 22.04 12.16 2.50 1985 70.00 42.00 37.00 3.00 8.00 1986 10.98 21.20 58.39 7.91 1.21 Western Long Island Sound
Casco Bay 1984 168.40 192.69 108.26 7.21 9.26 1985 421.00 578.00 284.00 18.00 23.00
1984 18.17 49.09 30.79 < 0.10 < 0.20 1986 116.44 140.17 77.11 29.60 3.82 1985 68.00 80.00 49.00 3.00 2.00 1986 27.87 29.44 17.20 < 0.08 0.57 Raritan Bay
Merrimack River 1985 469.00 308.00 55.00 12.00 18.00 1986 414.34 375.64 196.14 65.23 7.12
1984 145.84 436.94 2358.00 < 0.20 < 0.30 1985 57.00 87.00 39.00 < 0.20 < 0.40 Great Bay
Salem Harbor 1985 87.00 95.00 63.00 3.00 3.00 1986 55.03 215.31 124.10 24.03 1.48
1984 14.40 42.80 < 0.10 5.28 9.31 1985 193.00 225.00 51.00 6.00 8.00 Delaware Bay 1986 159.88 181.40 68.33 27.41 2.64
1984 48.21 40.29 10.56 0.56 1.97 Boston Harbor 1985 75.00 89.00 24.00 2.00 7.00
1986 222.00 274.87 80.06 20.73 2.27 1984 417.31 221.80 153.18 8.55 6.05 1985 283.00 298.00 79.00 12.00 16.00 Upper Chesapeake Bay 1986 212.42 259.15 107.46 29.83 3.36
1985 80.60 74.50 64.80 4.40 < 1.30 Quincy Bay 1986 35.04 51.06 22.08 9.34 3.92
1986 339.90 409.99 134.29 3.41 3.02 Lower Chesapeake Bay
Buzzards Bay 1984 25.78 28.17 105.20 1.61 4.09 1985 45.00 57.00 22.00 4.00 <1.00
1984 295.64 295.27 103.77 4.59 4.02 1986 55.13 85.66 23.56 0.84 0.40 1985 515.00 562.00 99.00 7.00 13.00 1986 861.97 1051.47 184.06 34.19 3.40 Elizabeth River
1986 48.52 84.28 63.55 28.41 7.14

Page 109
Table 7. Concentrations of metals in stomach contents (ppm dry weight)
Yeor Ag Cd Cr Cu Ni Pb Zo Fe Mo As Hg Se So
MochillS Boy
1985 l.01 0.43 5.64 25.4 < 4.71 0.81 81.9 1730 64.5 11.10 0.17 2.55 < 0.74
Frenchmans Boy
1985 0.47 < 0.25 5.22 20.1 8.07 l.59 78.5 2660 55.5 5.27 0.10 3.30 < 0.73
Penobscot Boy
1985 0.65 0.98 < 2.94 23.5 6.31 l.08 83.1 1020 33.5 10.40 2.16 < 0.73
Casco Bay
1984 0.09 0.18 < 25.90 8.1 12.20 23.20 63.3 16100 2850.0 14.86 0.06 < 2.33 0.63 1985 0.22 0.75 5.55 10.7 8.19 7.87 210.0 2750 69.1 13.50 0.17 5.70 < 0.80
Merrimock River
1984 0.11 < 0.16 8.68 6.0 < 2.88 9.77 25.6 4620 281.0 4.39 0.06 < 0.81 0.48 1985 0.17 0.16 26.90 8.9 8.01 22.10 42.0 19500 1180.0 4.97 0.07 < 0.70 2.88
Salem Harbor
1984 2.28 2.62 135.00 86.5 18.60 77.10 187.0 16900 256.0 10.40 0.81 2.23 13.40 1985 l.22 l.06 184.00 45.0 6.20 25.00 158.0 24500 102.0 10.60 0.19 3.05 1.80
Bostoo Harbor
1984 2.16 1.76 141.00 109.0 23.60 77.50 178.0 20500 ·305.0 9.85 l.29 2.59 16.10 1984 1.94 3.23 198.00 91.0 20.30 100.00 214.0 18000 288.0 14.20 0.92 3.20 17.50 1985 3.90 0.74 43.30 60.7 9.10 26.00 115.0 7420 115.0 9.49 0.42 3.21 6.57
Buzzords Boy
1984 0.65 0.54 < 3.47 9.5 < 5.50 4.94 148.0 1530 33.0 83.20 0.11 4.76 < 0.86 1985 0.90 0.77 8.99 19.9 14.40 9.61 97.9 4980 84.8 24.80 0.19 3.98 < 0.79
Narrogansett Bay
1985 0.50 < 0.24 17.10 25.2 11.30 26.90 75.4 12400 198.0 21.10 0.18 4.15 1.66
Eastern Long Island Sound
1984 0.86 1.03 21.80 30.5 8.29 18.90 105.0 10800 518.0 7.73 0.12 3.64 0.83 1985 0.86 0.33 14.60 25.1 7.14 15.70 83.9 11800 424.0 21.50 0.15 3.77 0.66
Western Long Island Sound
1984 l.38 0.59 15.50 69.9 6.00 9.21 102.0 8680 2430.0. 7.48 0.21 3.50 1.35 1985 1.40 0.63 5.73 30.5 < 5.29 7.63 92.9 1920 146.0 10.90 0.37 4.15 < 0.83
Raritan Bay
1985 1.67 0.42 21.10 50.5 5.64 44.30 95.9 7700 801.0 10.70 0.52 2.56 4.55
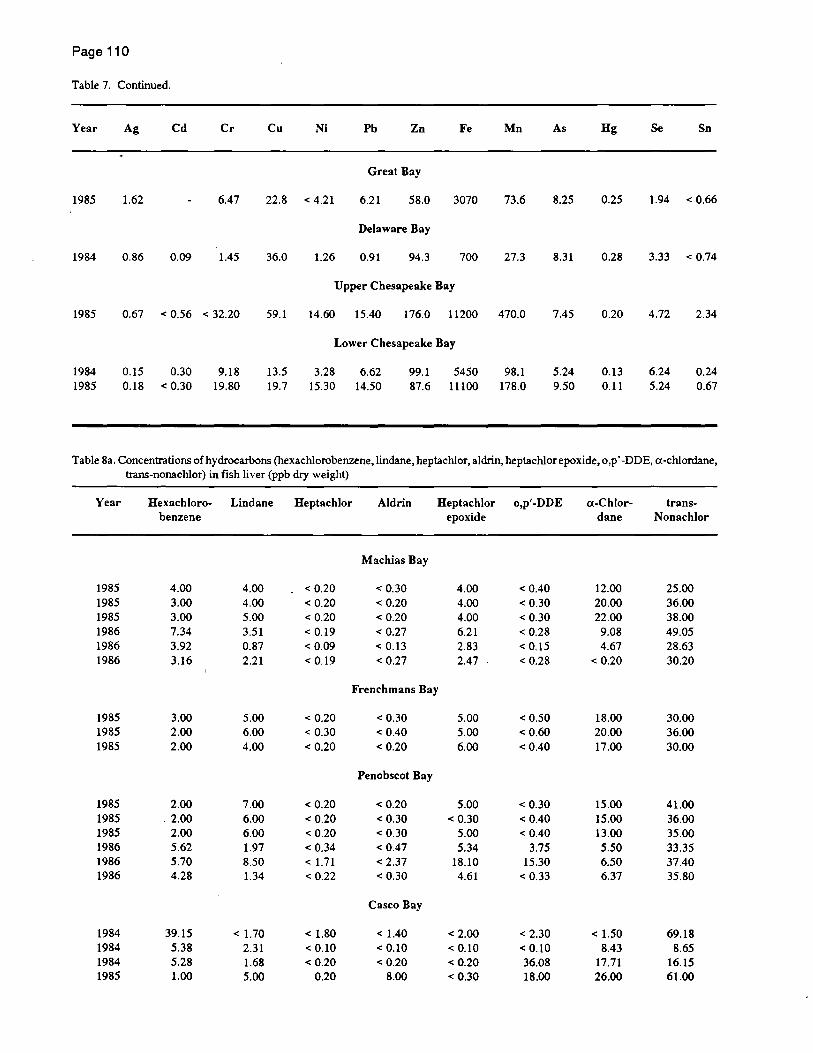
Page 110
Table 7. Continued.
Year Ag Cd Cr Cu Ni Ph Zn Fe Mn As Hg Se Sn
Great Bay
1985 1.62 6.47 22.8 < 4.21 6.21 58.0 3070 73.6 8.25 0.25 1.94 < 0.66
Delaware Bay
1984 0.86 0.09 1.45 36.0 1.26 0.91 94.3 700 27.3 8.31 0.28 3.33 < 0.74
Upper Chesapeake Bay
1985 0.67 < 0.56 < 32.20 59.1 14.60 15.40 176.0 11200 470.0 7.45 0.20 4.72 2.34
Lower Chesapeake Bay
1984 0.15 0.30 9.18 13.5 3.28 6.62 99.1 5450 98.1 5.24 0.13 6.24 0.24 1985 0.18 < 0.30 19.80 19.7 15.30 14.50 87.6 11100 178.0 9.50 0.11 5.24 0.67
Table 8a. Concentrations of hydrocarbons (hexachlorobenzene, lindane, heptachlor, aldrin, heptachlor epoxide, o,p' -DDE, a-chlordane, trans-nonachlor) in fish liver (ppb dry weight)
Year Hexachloro- Lindane Heptachlor Aldrin Heptachlor o,p'-DDE a-Chlor- trans-benzene epoxide dane Nonachlor
Machias Bay
1985 4.00 4.00 < 0.20 < 0.30 4.00 < 0.40 12.00 25.00 1985 3.00 4.00 < 0.20 < 0.20 4.00 < 0.30 20.00 36.00 1985 3.00 5.00 < 0.20 < 0.20 4.00 < 0.30 22.00 38.00 1986 7.34 3.51 < 0.19 < 0.27 6.21 < 0.28 9.08 49.05 1986 3.92 0.87 < 0.09 < 0.13 2.83 < 0.15 4.67 28.63 1986 3.16 2.21 < 0.19 < 0.27 2.47 < 0.28 < 0.20 30.20
Frenchmans Bay
1985 3.00 5.00 < 0.20 < 0.30 5.00 < 0.50 18.00 30.00 1985 2.00 6.00 < 0.30 < 0.40 5.00 < 0.60 20.00 36.00 1985 2.00 4.00 < 0.20 < 0.20 6.00 < 0.40 17.00 30.00
Penobscot Bay
1985 2.00 7.00 < 0.20 < 0.20 5.00 < 0.30 15.00 41.00 1985 2.00 6.00 < 0.20 < 0.30 < 0.30 < 0.40 15.00 36.00 1985 2.00 6.00 < 0.20 < 0.30 5.00 < 0.40 13.00 35.00 1986 5.62 1.97 < 0.34 < 0.47 5.34 3.75 5.50 33.35 1986 5.70 8.50 <1.71 < 2.37 18.10 15.30 6.50 37.40 1986 4.28 1.34 < 0.22 < 0.30 4.61 < 0.33 6.37 35.80
Casco Bay
1984 39.15 < 1.70 < 1.80 <1.40 < 2.00 < 2.30 < 1.50 69.18 1984 5.38 2.31 < 0.10 < 0.10 < 0.10 < 0.10 8.43 8.65 1984 5.28 1.68 < 0.20 < 0.20 < 0.20 36.08 17.71 16.15 1985 1.00 5.00 0.20 8.00 < 0.30 18.00 26.00 61.00
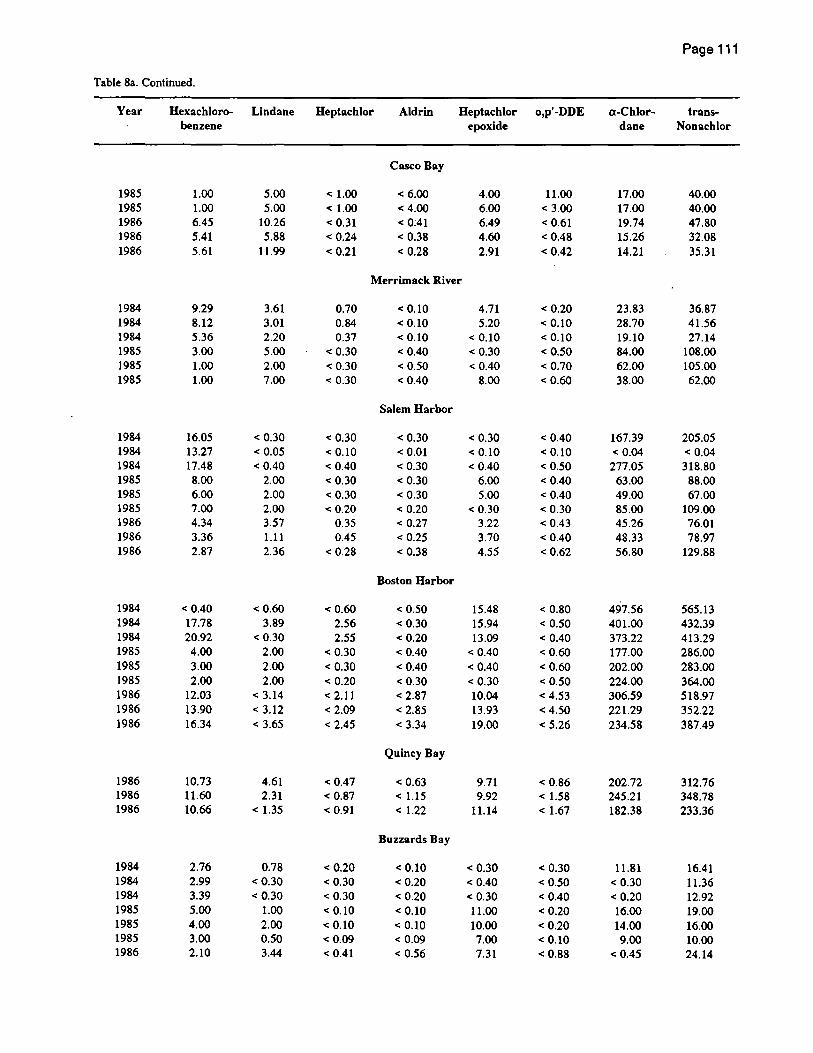
Page 111
Table 8a. Continued.
Year Hexachloro- Lindane Heptachlor Aldrin Heptachlor o,p'-DDE a-Chlor- trans-benzene epoxide dane Nonachlor
Casco Bay
1985 1.00 5.00 <1.00 < 6.00 4.00 11.00 17.00 40.00 1985 1.00 5.00 <1.00 < 4.00 6.00 < 3.00 17.00 40.00 1986 6.45 10.26 < 0.31 < 0:41 6.49 < 0.61 19.74 47.80 1986 5.41 5.88 < 0.24 < 0.38 4.60 < 0.48 15.26 32.08 1986 5.61 11.99 < 0.21 < 0.28 2.91 < 0.42 14.21 35.31
Merrimack River
1984 9.29 3.61 0.70 < 0.10 4.71 < 0.20 23.83 36.87 1984 8.12 3.01 0.84 < 0.10 5.20 < 0.10 28.70 41.56 1984 5.36 2.20 0.37 < 0.10 < 0.10 < 0.10 19.10 27.14 1985 3.00 5.00 < 0.30 < 0.40 < 0.30 < 0.50 84.00 108.00 1985 1.00 2.00 < 0.30 < 0.50 < 0.40 < 0.70 62.00 105.00 1985 1.00 7.00 < 0.30 < 0.40 8.00 < 0.60 38.00 62.00
Salem Harbor
1984 16.05 < 0.30 < 0.30 < 0.30 < 0.30 < 0.40 167.39 205.05 1984 13.27 < 0.05 < 0.10 < 0.01 < 0.10 < 0.10 < 0.04 < 0.04 1984 17.48 < 0.40 < 0.40 < 0.30 < 0.40 < 0.50 277.05 318.80 1985 8.00 2.00 < 0.30 < 0.30 6.00 < 0.40 63.00 88.00 1985 6.00 2.00 < 0.30 < 0.30 5.00 < 0.40 49.00 67.00 1985 7.00 2.00 < 0.20 < 0.20 < 0.30 < 0.30 85.00 109.00 1986 4.34 3.57 0.35 < 0.27 3.22 < 0.43 45.26 76.01 1986 3.36 1.11 0.45 < 0.25 3.70 < 0.40 48.33 78.97 1986 2.87 2.36 < 0.28 < 0.38 4.55 < 0.62 56.80 129.88
Boston Harbor
1984 < 0.40 < 0.60 < 0.60 < 0.50 15.48 < 0.80 497.56 565.13 1984 17.78 3.89 2.56 < 0.30 15.94 < 0.50 401.00 432.39 1984 20.92 < 0.30 2.55 <0.20 13.09 < 0.40 373.22 413.29 1985 4.00 2.00 < 0.30 < 0.40 < 0.40 < 0.60 177.00 286.00 1985 3.00 2.00 < 0.30 < 0.40 < 0.40 < 0.60 202.00 283.00 1985 2.00 2.00 < 0.20 < 0.30 < 0.30 < 0.50 224.00 364.00 1986 12.03 < 3.14 < 2.11 < 2.87 10.04 < 4.53 306.59 518.97 1986 13.90 < 3.12 < 2.09 < 2.85 13.93 < 4.50 221.29 352.22 1986 16.34 < 3.65 < 2.45 < 3.34 19.00 < 5.26 234.58 387.49
Quincy Bay
1986 10.73 4.61 < 0.47 < 0.63 9.71 < 0.86 202.72 312.76 1986 11.60 2.31 < 0.87 < 1.15 9.92 < 1.58 245.21 348.78 1986 10.66 < 1.35 < 0.91 < 1.22 11.14 < 1.67 182.38 233.36
Buzzards Bay
1984 2.76 0.78 < 0.20 < 0.10 < 0.30 < 0.30 11.81 16.41 1984 2.99 < 0.30 < 0.30 < 0.20 < 0.40 < 0.50 < 0.30 11.36 1984 3.39 < 0.30 < 0.30 < 0.20 < 0.30 < 0.40 < 0.20 12.92 1985 5.00 1.00 < 0.10 < 0.10 11.00 < 0.20 16.00 19.00 1985 4.00 2.00 < 0.10 < 0.10 10.00 < 0.20 14.00 16.00 1985 3.00 0.50 <0.09 < 0.09 7.00 < 0.10 9.00 10.00 1986 2.10 3.44 < 0.41 < 0.56 7.31 < 0.88 < 0.45 24.14
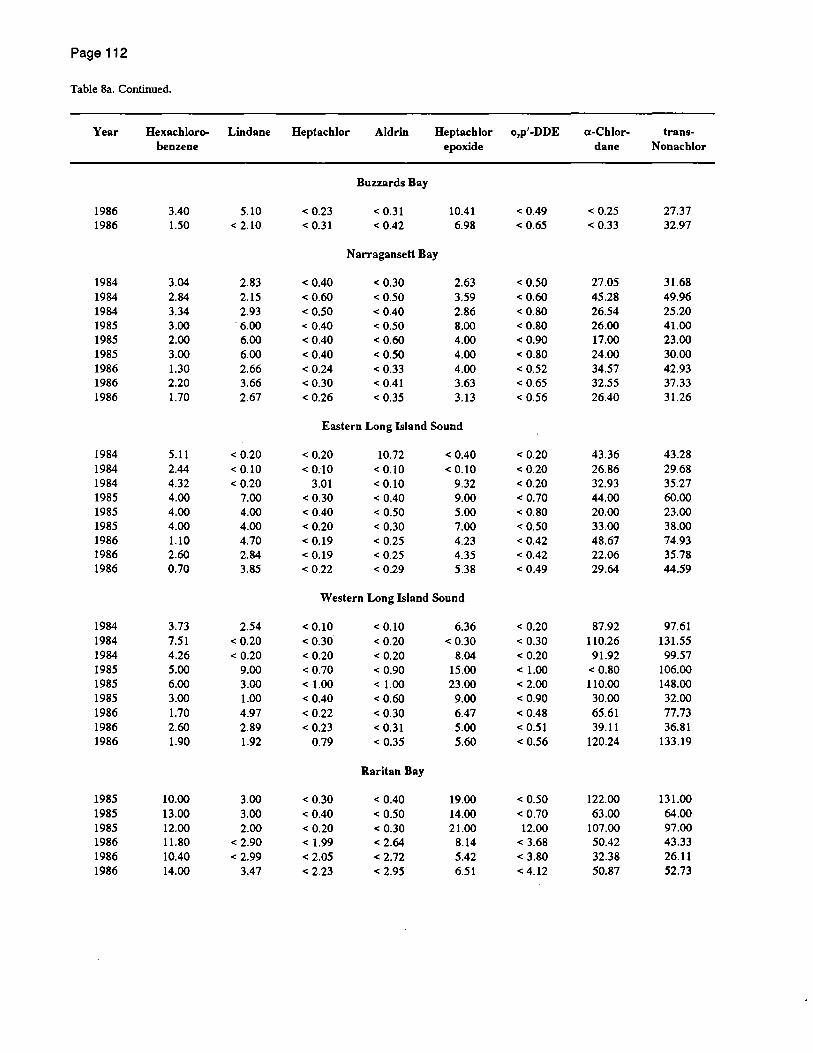
Page 112
Table 8a. Continued.
Year Hexachloro- Lindane Heptachlor Aldrin Heptachlor o,p'-DDE a-Chlor- trans-benzene epoxide dane Nonachlor
Buzzards Bay
1986 3.40 5.10 < 0.23 < 0.31 10.41 < 0.49 < 0.25 27.37 1986 1.50 < 2.10 < 0.31 < 0.42 6.98 < 0.65 < 0.33 32.97
Narragansett Bay
1984 3.04 2.83 < 0.40 < 0.30 2.63 < 0.50 27.05 31.68 1984 2.84 2.15 < 0.60 < 0.50 3.59 < 0.60 45.28 49.96 1984 3.34 2.93 < 0.50 < 0.40 2.86 < 0.80 26.54 25.20 1985 3.00 ·6.00 < 0.40 < 0.50 8.00 < 0.80 26.00 41.00 1985 2.00 6.00 < 0.40 < 0.60 4.00 < 0.90 17.00 23.00 1985 3.00 6.00 < 0.40 < 0.50 4.00 < 0.80 24.00 30.00 1986 1.30 2.66 < 0.24 < 0.33 4.00 < 0.52 34.57 42.93 1986 2.20 3.66 < 0.30 < 0.41 3.63 < 0.65 32.55 37.33 1986 1.70 2.67 < 0.26 < 0.35 3.13 < 0.56 26.40 31.26
Eastern Long Island Sound
1984 5.11 < 0.20 < 0.20 10.72 < 0.40 < 0.20 43.36 43.28 1984 2.44 < 0.10 < 0.10 < 0.10 < 0.10 < 0.20 26.86 29.68 1984 4.32 < 0.20 3.01 < 0.10 9.32 < 0.20 32.93 35.27 1985 4.00 7.00 < 0.30 < 0.40 9.00 < 0.70 44.00 60.00 1985 4.00 4.00 < 0.40 < 0.50 5.00 < 0.80 20.00 23.00 1985 4.00 4.00 < 0.20 < 0.30 7.00 < 0.50 33.00 38.00 1986 1.10 4.70 < 0.19 < 0.25 4.23 < 0.42 48.67 74.93 1986 2.60 2.84 < 0.19 < 0.25 ·4.35 < 0.42 22.06 35.78 1986 0.70 3.85 < 0.22 < 0.29 5.38 < 0.49 29.64 44.59
Western Long Island Sound
1984 3.73 2.54 < 0.10 < 0.10 6.36 < 0.20 87.92 97.61 1984 7.51 < 0.20 < 0.30 < 0.20 < 0.30 < 0.30 110.26 131.55 1984 4.26 < 0.20 < 0.20 < 0.20 8.04 < 0.20 91.92 99.57 1985 5.00 9.00 < 0.70 < 0.90 15.00 <1.00 < 0.80 106.00 1985 6.00 3.00 <1.00 <1.00 23.00 < 2.00 110.00 148.00 1985 3.00 1.00 < 0.40 < 0.60 9.00 < 0.90 30.00 32.00 1986 1.70 4.97 < 0.22 < 0.30 6.47 < 0.48 65.61 77.73 1986 2.60 2.89 < 0.23 < 0.31 5.00 < 0.51 39.11 36.81 1986 1.90 1.92 0.79 < 0.35 5.60 < 0.56 120.24 133.19
Raritan Bay
1985 10.00 3.00 < 0.30 < 0.40 19.00 < 0.50 122.00 131.00 1985 13.00 3.00 < 0.40 < 0.50 14.00 < 0.70 63.00 64.00 1985 12.00 2.00 < 0.20 < 0.30 21.00 12.00 107.00 97.00 1986 11.80 < 2.90 < 1.99 < 2.64 8.14 < 3.68 50.42 43.33 1986 10.40 < 2.99 < 2.05 < 2.72 5.42 < 3.80 32.38 26.11 1986 14.00 3.47 < 2.23 <: 2.95 6.51 < 4.12 50.87 52.73
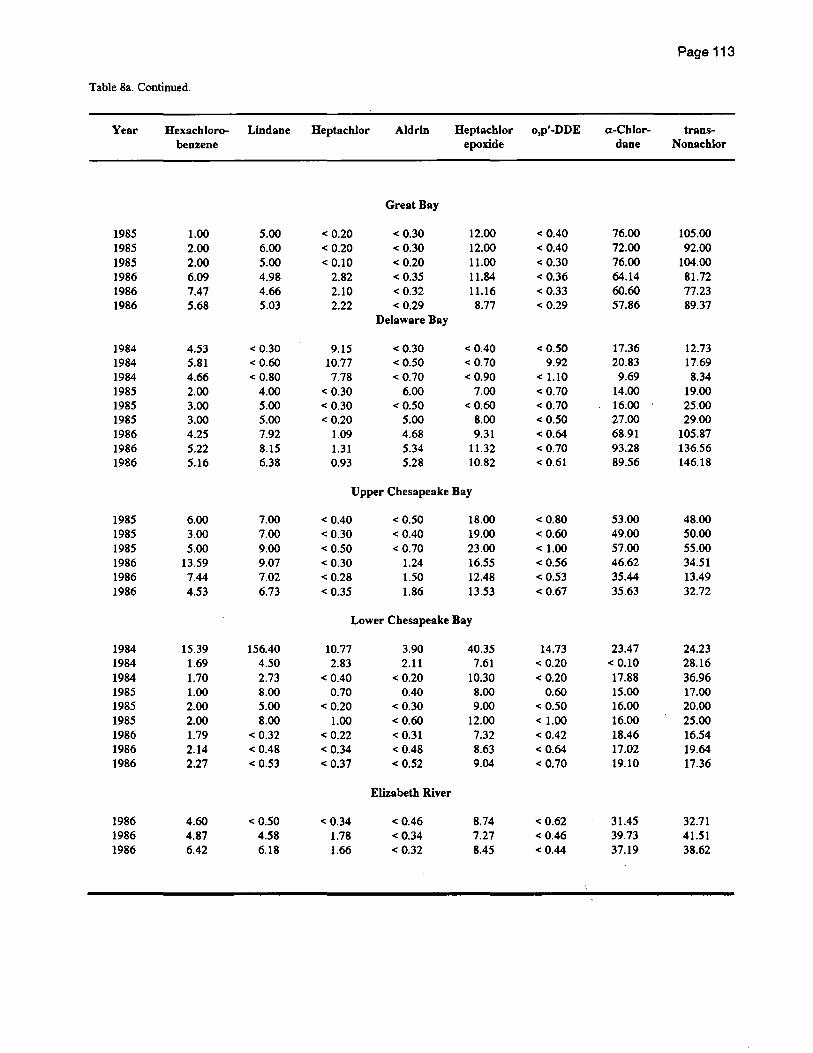
Page 113
Table 8a. Continued.
Year Hexacbloro- Lindane Heptachlor Aldrin Heptacblor o,p'-DDE a-Cblor- trans-benzene epoxide dane Nonacblor
Great Bay
1985 1.00 5.00 < 0.20 < 0.30 12.00 < 0.40 76.00 105.00 1985 2.00 6.00 < 0.20 < 0.30 12.00 < 0.40 72.00 92.00 1985 2.00 5.00 < 0.10 < 0.20 11.00 < 0.30 76.00 104.00 1986 6.09 4.98 2.82 < 0.35 11.84 < 0.36 64.14 81.72 1986 7.47 4.66 2.10 < 0.32 11.16 < 0.33 60.60 77.23 1986 5.68 5.03 2.22 < 0.29 8.77 < 0.29 57.86 89.37
Delaware Bay
1984 4.53 < 0.30 9.15 < 0.30 < 0.40 < 0.50 17.36 12.73 1984 5.81 < 0.60 10.77 < 0.50 < 0.70 9.92 20.83 17.69 1984 4.66 < 0.80 7.78 < 0.70 < 0.90 < 1.10 9.69 8.34 1985 2.00 4.00 < 0.30 6.00 7.00 <0.70 14.00 19.00 1985 3.00 5.00 < 0.30 < 0.50 < 0.60 <0.70 16.00 25.00 1985 3.00 5.00 < 0.20 5.00 8.00 < 0.50 27.00 29.00 1986 4.25 7.92 1.09 4.68 9.31 < 0.64 68.91 105.87 1986 5.22 8.15 1.31 5.34 11.32 < 0.70 93.28 136.56 1986 5.16 6.38 0.93 5.28 10.82 < 0.61 89.56 146.18
Upper Cbesapeake Bay
1985 6.00 7.00 < 0.40 < 0.50 18.00 < 0.80 53.00 48.00 1985 3.00 7.00 < 0.30 < 0.40 19.00 < 0.60 49.00 50.00 1985 5.00 9.00 < 0.50 < 0.70 23.00 <1.00 57.00 55.00 1986 13.59 9.07 < 0.30 1.24 16.55 < 0.56 46.62 34.51 1986 7.44 7.02 < 0.28 1.50 12.48 < 0.53 35.44 13.49 1986 4.53 6.73 < 0.35 1.86 13.53 < 0.67 35.63 32.72
Lower Cbesapeake Bay
1984 15.39 156.40 10.77 3.90 40.35 14.73 23.47 24.23 1984 1.69 4.50 2.83 2.11 7.61 < 0.20 < 0.10 28.16 1984 1.70 2.73 < 0.40 < 0.20 10.30 < 0.20 17.88 36.96 1985 1.00 8.00 0.70 0.40 8.00 0.60 15.00 17.00 1985 2.00 5.00 < 0.20 < 0.30 9.00 < 0.50 16.00 20.00 1985 2.00 8.00 1.00 <0.60 12.00 <1.00 16.00 25.00 1986 1.79 < 0.32 < 0.22 < 0.31 7.32 < 0.42 18.46 16.54 1986 2.14 < 0.48 < 0.34 < 0.48 8.63 < 0.64 17.02 19.64 1986 2.27 < 0.53 < 0.37 < 0.52 9.04 < 0.70 19.10 17.36
Elizabetb River
1986 4.60 < 0.50 < 0.34 < 0.46 8.74 < 0.62 31.45 32.71 1986 4.87 4.58 1.78 < 0.34 7.27 < 0.46 39.73 41.51 1986 6.42 6.18 1.66 < 0.32 8.45 < 0.44 37.19 38.62

Page 114
Table 8b. Concentrations of hydrocarbons (dieldrin, p,p'-DDE, o,p'-DDD, p,p'-DDD, o,p'-DDT, p,p'-DDT, mirex, dichlorobiphenyl) in fish liver (ppb dry weight)
Year Dieldrin p,p'-DDE o,p'-DDD p,p'-DDD o,p'-DDT p,p'-DDT Mirex 2-CI-PCB
Machias Bay
1985 8.00 101.00 < 0.50 6.00 4.00 11.00 5.00 <0.80 1985 16.00 145.00 4.00 15.00 8.00 23.00 6.00 <0.60 1985 15.00 127.00 < 0.40 14.00 9.00 21.00 4.00 <0.60 1986 19.91 165.89 3.42 < 0.45 5.07 31.93 3.40 84.98 1986 11.19 148.38 0.99 < 0.23 2.38 23.43 2.50 17.44 1986 11.94 152.82 2.78 < 0.45 2.64 25.91 4.11 55.40
Frenchmans Bay
1985 17.00 129.00 < 0.60 12.00 5.00 11.00 4.00 < 0.90 1985 18.00 160.00 < 0.70 11.00 7.00 13.00 6.00 <1.00 1985 18.00 121.00 < 0.50 13.00 8.00 12.00 5.00 < 0.60
Penobscot Bay
1985 23.00 181.00 4.00 22.00 8.00 14.00 4.00 < 0.60 1985 17.00 173.00 3.00 20.00 9.00 15.00 4.00 < 0.70 1985 18.00 164.00 5.00 14.00 6.00 13.00 4.00 < 0.70 1986 20.71 164.10 5.58 32.83 6.67 22.14 8.79 50.31 1986 57.50 81.70 < 2.50 < 3.60 14.60 36.00 4.20 212.10 1986 18.09 174.48 3.47 < 0.45 4.53 14.34 5.60 24.70
Casco Bay
1984 41.78 65.23 < 2.90 < 2.90 < 2.50 < 2.20 < 1.50 6.20 1984 < 0.10 11.24 < 0.20 < 0.20 < 0.10 < 0.10 1.31 < 0.30 1984 < 0.20 15.69 < 0.40 6.06 5.07 < 0.30 < 0.20 < 0.80 1985 26.00 402.00 21.00 79.00 54.00 16.00 9.00 166.00 1985 18.00 231.00 9.00 56.00 27.00 20.00 6.00 < 4.00 1985 15.00 258.00 7.00 33.00 14.00 22.00 4.00 < 15.00 1986 27.11 317.51 9.40 < 0.85 9.49 45.99 8.54 10.07 1986 17.70 201.89 5.56 < 0.67 5.80 23.58 2.35 4.39 1986 20.51 218.79 5.90 < 0.59 5.65 23.48 4.14 9.90
Merrimack River
1984 14.26 36.15 4.43 18.08 5.76 9.78 3.20 < 0.50 1984 17.03 41.26 6.08 31.19 8.04 19.08 < 0.10 < 0.30 1984 11.13 29.72 3.84 15.48 4.78 < 0.10 2.21 < 0.40 1985 33.00 340.00 11.00 59.00 45.00 37.00 5.00 < 0.90 1985 26.00 365.00 17.00 29.00 13.00 31.00 5.00 <1.00 1985 27.00 420.00 14.00 44.00 30.00 50.00 6.00 <1.00
Salem Harbor
1984 36.33 401.23 < 0.50 199.48 13.84 15.73 4.93 < 1.10 1984 < 0.10 < 0.04 < 0.10 222.34 < 0.10 < 0.10 <0.04 < 0.20 1984 794.38 547.45 < 0.60 297.22 26.28 28.19 11.42 < 1.20 1985 24.00 274.00 11.00 42.00 11.00 20.00 5.00 19.00 1985 15.00 208.00 5.00 18.00 4.00 7.00 3.00 20.00 1985 < 0.30 322.00 9.00 37.00 8.00 9.00 4.00 23.00 1986 55.68 379.27 7.68 < 0.50 4.83 11.92 2.93 < 0.80 1986 61.07 370.95 10.25 < 0.46 8.28 21.51 3.90 < 0.70 1986 78.93 543.62 12.85 < 0.72 8.32 19.79 4.18 < 1.20
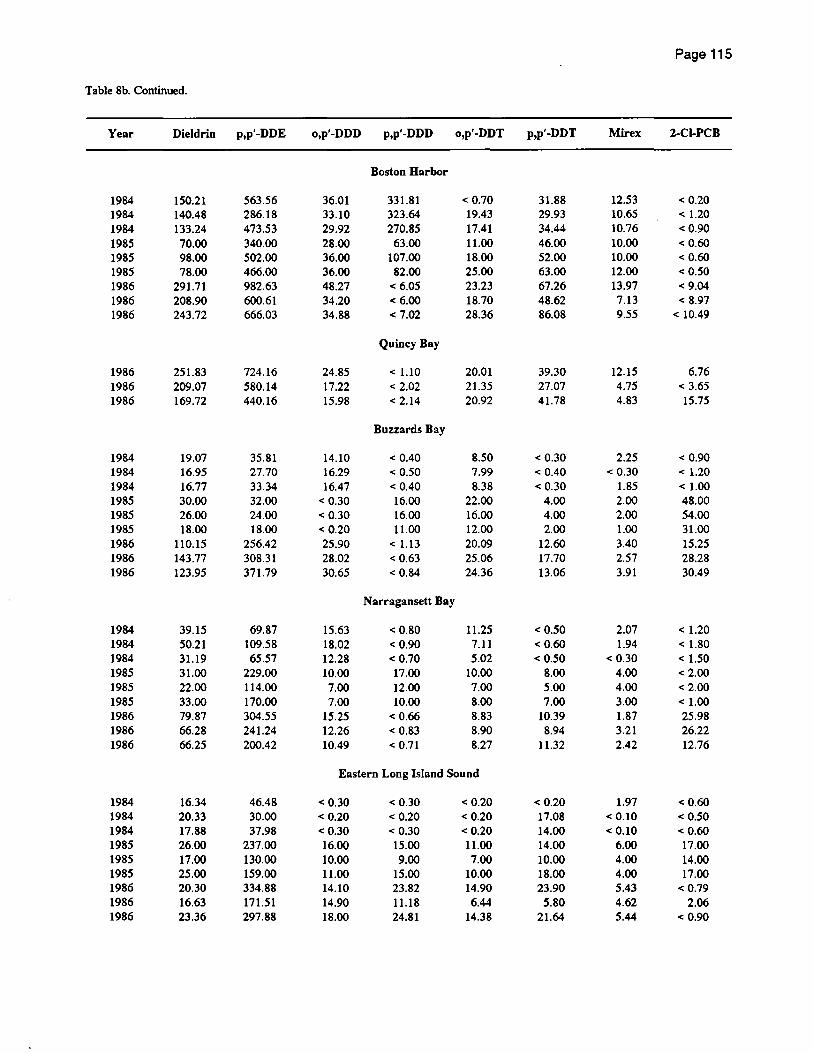
Page 115
Table 8b. Continued.
Year Dieldrin p,p'-DDE o,p'-DDD p,p'-DDD o,p'-DDT p,p'-DDT Mirex 2-CI-PCB
Boston Harbor
1984 150.21 563.56 36.01 331.81 < 0.70 31.88 12.53 < 0.20 1984 140.48 286.18 33.10 323.64 19.43 29.93 10.65 < 1.20 1984 133.24 473.53 29.92 270.85 17.41 34.44 10.76 < 0.90 1985 70.00 340.00 28.00 63.00 11.00 46.00 10.00 <0.60 1985 98.00 502.00 36.00 107.00 18.00 52.00 10.00 < 0.60 1985 78.00 466.00 36.00 82.00 25.00 63.00 12.00 < 0.50 1986 291.71 982.63 48.27 < 6.05 23.23 67.26 13.97 < 9.04 1986 208.90 600.61 34.20 < 6.00 18.70 48.62 7.13 < 8.97 1986 243.72 666.03 34.88 < 7.02 28.36 86.08 9.55 < 10.49
Quincy Bay
1986 251.83 724.16 24.85 < 1.10 20.01 39.30 12.15 6.76 1986 209.07 580.14 17.22 < 2.02 21.35 27.07 4.75 < 3.65 1986 169.72 440.16 15.98 < 2.14 20.92 41.78 4.83 15.75
Buzzards Bay
1984 19.07 35.81 14.10 < 0.40 8.50 < 0.30 2.25 < 0.90 1984 16.95 27.70 16.29 < 0.50 7.99 < 0.40 < 0.30 < 1.20 1984 16.77 33.34 16.47 < 0.40 8.38 < 0.30 1.85 <1.00 1985 30.00 32.00 < 0.30 16.00 22.00 4.00 2.00 48.00 1985 26.00 24.00 < 0.30 16.00 16.00 4.00 2.00 54.00 1985 18.00 18.00 < 0.20 11.00 12.00 2.00 1.00 31.00 1986 110.15 256.42 25.90 < 1.13 20.09 12.60 3.40 15.25 1986 143.77 308.31 28.02 < 0.63 25.06 17.70 2.57 28.28 1986 123.95 371.79 30.65 < 0.84 24.36 13.06 3.91 30.49
Narragansett Bay
1984 39.15 69.87 15.63 < 0.80 11.25 < 0.50 2.07 < 1.20 1984 50.21 109.58 18.02 < 0.90 7.11 < 0.60 1.94 < 1.80 1984 31.19 65.57 12.28 < 0.70 5.02 < 0.50 < 0.30 < 1.50 1985 31.00 229.00 10.00 17.00 10.00 8.00 4.00 < 2.00 1985 22.00 114.00 7.00 12.00 7.00 5.00 4.00 < 2.00 1985 33.00 170.00 7.00 10.00 8.00 7.00 3.00 <1.00 1986 79.87 304.55 15.25 < 0.66 8.83 10.39 1.87 25.98 1986 66.28 241.24 12.26 < 0.83 8.90 8.94 3.21 26.22 1986 66.25 200.42 10.49 < 0.71 8.27 11.32 2.42 12.76
Eastern Long Island Sound
1984 16.34 46.48 < 0.30 < 0.30 < 0.20 < 0.20 1.97 < 0.60 1984 20.33 30.00 < 0.20 < 0.20 < 0.20 17.08 < 0.10 < 0.50 1984 17.88 37.98 < 0.30 < 0.30 < 0.20 14.00 < 0.10 < 0.60 1985 26.00 237.00 16.00 15.00 11.00 14.00 6.00 17.00 1985 17.00 130.00 10.00 9.00 7.00 10.00 4.00 14.00 1985 25.00 159.00 11.00 15.00 10.00 18.00 4.00 17.00 1986 20.30 334.88 14.10 23.82 14.90 23.90 5.43 < 0.79 1986 16.63 171.51 14.90 11.18 6.44 5.80 4.62 2.06 1986 23.36 297.88 18.00 24.81 14.38 21.64 5.44 < 0.90
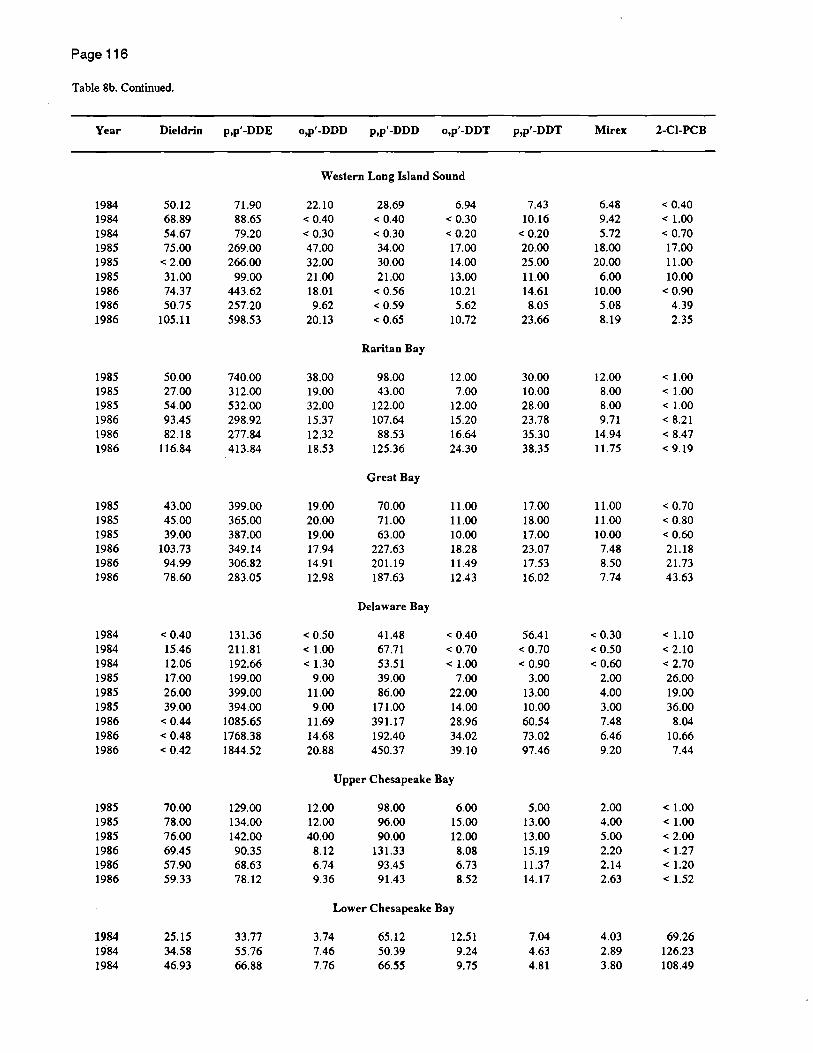
Page116
Table 8b. Continued.
Year Dieldrin p,p'-DDE o,p'-DDD p,p'-DDD o,p'-DDT p,p'-DDT Mirex 2-CI-PCB
Western Long Island Sound
1984 50;12 71.90 22.10 28.69 6.94 7.43 6.48 < 0.40 1984 68.89 88.65 < 0.40 < 0.40 < 0.30 10.16 9.42 <1.00 1984 54.67 79.20 < 0.30 < 0.30 < 0.20 < 0.20 5.72 < 0.70 1985 75.00 269.00 47.00 34.00 17.00 20.00 18.00 17.00 1985 < 2.00 266.00 32.00 30.00 14.00 25.00 20.00 11.00 1985 31.00 99.00 21.00 21.00 13.00 11.00 6.00 10.00 1986 74.37 443.62 18.Ql < 0.56 10.21 14.61 10.00 < 0.90 1986 50.75 257.20 9.62 < 0.59 5.62 8.05 5.08 4.39 1986 105.11 598.53 20.13 < 0.65 10.72 23.66 8.19 2.35
Raritan Bay
1985 50.00 740.00 38.00 98.00 12.00 30.00 12.00 <1.00 1985 27.00 312.00 19.00 43.00 7.00 10.00 8.00 <1.00 1985 54.00 532.00 32.00 122.00 12.00 28.00 8.00 <1.00 1986 93.45 298.92 15.37 107.64 15.20 23.78 9.71 < 8.21 1986 82.18 277.84 12.32 88.53 16.64 35.30 14.94 < 8.47 1986 116.84 413.84 18.53 125.36 24.30 38.35 11.15 < 9.19
Great Bay
1985 43.00 399.00 19.00 70.00 11.00 17.00 11.00 < 0.70 1985 45.00 365.00 20.00 71.00 11.00 18.00 11.00 < 0.80 1985 39.00 387.00 19.00 63.00 10.00 17.00 10.00 < 0.60 1986 103.73 349.14 17.94 227.63 18.28 23.07 7.48 21.18 1986 94.99 306.82 14.91 201.19 11.49 17.53 8.50 21.73 1986 78.60 283.05 12.98 187.63 12.43 16.02 7.74 43.63
Delaware Bay
1984 < 0.40 131.36 < 0.50 41.48 < 0.40 56.41 < 0.30 < 1.10 1984 15.46 211.81 <1.00 67.71 < 0.70 < 0.70 < 0.50 < 2.10 1984 12.06 192.66 < 1.30 53.51 <1.00 < 0.90 < 0.60 < 2.70 1985 17.00 199.00 9.00 39.00 7.00 3.00 2.00 26.00 1985 26.00 399.00 11.00 86.00 22.00 13.00 4.00 19.00 1985 39.00 394.00 9.00 171.00 14.00 10.00 3.00 36.00 1986 < 0.44 1085.65 11.69 391.17 28.96 60.54 7.48 8.04 1986 < 0.48 1768.38 14.68 192.40 34.02 73.02 6.46 10.66 1986 < 0.42 1844.52 20.88 450.37 39.10 97.46 9.20 7.44
Upper Chesapeake Bay
1985 70.00 129.00 12.00 98.00 6.00 5.00 2.00 <1.00 1985 78.00 134.00 12.00 96.00 15.00 13.00 4.00 <1.00 1985 76.00 142.00 40.00 90.00 12.00 13.00 5.00 < 2.00 1986 69.45 90.35 8.12 131.33 8.08 15.19 2.20 < 1.27 1986 57.90 68.63 6.74 93.45 6.73 11.37 2.14 < 1.20 1986 59.33 78.12 9.36 91.43 8.52 14.17 2.63 < 1.52
Lower Chesapeake Bay
1984 25.15 33.77 3.74 65.12 12.51 7.04 4.03 69.26 1984 34.58 55.76 7.46 50.39 9.24 4.63 2.89 126.23 1984 46.93 66.88 7.76 66.55 9.75 4.81 3.80 108.49

Page 117
Table 8b. Continued.
Year Dieldrin p,p'.DDE o,p'·DDD p,p'·DDD o,p'·DDT p,p'.DDT Mirex 2·CI·PCB
Lower Chesapeake BIlY
1985 30.00 44.00 9.00 20.00 3.00 5.00 3.00 1.00 1985 34.00 41.00 17.00 20.00 5.00 5.00 3.00 < 0.90 1985 32.00 39.00 <1.00 28.00 <1.00 14.00 9.00 < 2.00 1986 30.98 73.53 4.54 41.16 2.46 12.22 1.82 < 0.96 1986 28.91 82.02 7.92 39.99 6.05 19.56 2.31 < 1.46 1986 37.29 70.89 7.41 41.22 5.61 15.47 1.74 < 1.59
Elizabeth River
1986 39.26 86.23 6.03 82.67 8.28 10.06 4.21 4.60 1986 41.67 136.83 4.44 ll2.50 3.89 8.00 2.45 6.66 1986 42.32 122.90 5.21 104.90 4.46 7.28 2.00 8.87
Table 8c. Concentrations of hydrocarbons (trichlorobiphenyl, tetrachlorobiphenyl, pentachlorobiphenyl, hexachlorobiphenyl, heptachlorobiphenyl, octachlorobiphenyl, nonachlorobiphenyl) in fish liver (ppb dry weight)
Year J·CI·PCB 4·CI·PCB 5·CI-PCB 6-CI-PCB '-CI-PCB 8-Cl-PCB 9-CI-PCB
Machias Bay
1985 8.00 37.00 44.00 ll3.oo 68.00 3.00 5.00 1985 8.00 49.00 87.00 213.00 ll9.oo 5.00 7.00 1985 8.00 56.00 61.00 145.00 82.00 3.00 4.00 1986 18.72 72.32 54.36 121.03 59.93 27.02 6.62 1986 153.69 ·27.98 43.75 117.14 0.98 15.86 2.52 1986 18.07 51.73 60.26 135.45 65.23 20.14 5.55
Frenchmans BIlY
1985 21.00 53.00 53.00 124.00 69.00 3.00 4.00 1985 18.00 54.00 63.00 145.00 79.00 4.00 5.00 1985 11.00 55.00 66.00 136.00 86.00 4.00 5.00
Penobscot Bay
1985 27.00 78.00 108.00 197.00 667.00 52.00 11.00 1985 29.00 80.00 96.00 196.00 580.00 53.00 12.00 1985 27.00 79.00 110.00 189.00 561.00 45.00 10.00 1986 33.56 89.98 129.21 180.97 601.93 57.49 7.61 1986 22.70 280.10 222.60 84.40 319.90 34.00 5.60 1986 13.79 46.16 99.97 174.46 499.09 35.51 5.09
Casco Bay
1984 32.90 54.60 381.87 822.37 350.00 < 1.30 < 2.30 1984 4.69 11.97 49.44 128.15 82.85 < 0.07 < 0.10 1984 16.06 92.12 238.17 499.94 284.95 <0.20 < 0.30 1985 22.00 288.00 106.00 547.00 428.00 115.00 33.00 1985 24.00 92.00 172.00 308.00 261.00 89.00 23.00 1985 27.00 71.00 159.00 343.00 231.00 52.00 18.00 1986 29.40 143.17 220.19 434.56 552.18 116.13 3.85 1986 21.63 94.00 117.20 195.24 197.13 49.68 14.01 1986 26.86 70.20 137.53 260.95 314.94 89.33 21.50

Page 118
Table Sc. Continued.
Year 3-CI-PCB 4-CI-PCB 5-CI-PCB 6-CI-PCB 7-CI-PCB 8-CI-PCB 9-CI-PCB
Merrimack River
1984 1.53 58m 420.72 740.66 449.28 < 0.10 < 0.20 1984 .1.84 62.75 496.82 553.32 73.88 < 0.10 < 0.10 1984 1.49 50.15 326.37 548.61 328.20 < 0.10 < 0.10 1985 89.00 549.00 1295.00 1013.00 577.00 139.00 17.00 1985 83.00 506.00 983.00 1158.00 796.00 206.00 27.00 1985 93.00 583.00 937.00 1157.00 974.00 247.00 34.00
Salem Harbor
1984 < 0.50 39.20 125.70 598.80 35.70 54.05 58.36 1984 < 0.10 71.50 < 0.10 < 0.10 < 0.05 49.03 68.36 1984 < 0.60 77.40 194.50 871.00 31.20 85.72 145.79 1985 52.00 193.00 615.00 1066.00 477.00 28.00 24.00 1985 27.00 100.00 323.00 618.00 286.00 19.00 20.00 1985 50.00 241.00 822.00 1055.00 507.00 29.00 24.00 1986 26.71 227.75 . 556.12 720.04 371.27 112.72 7.94 1986 36.25 278.01 574.18 79L88 437.92 142.05 12.01 1986 34.30 296.91 883.59 1323.38 753.90 243.64 21.66
Boston Harbor
1984 426.06 1196.00 4430.00 3977.00 2163.00 110.68 94.14 1984 318.68 952.95 3641.00 3124.00 1656.00 87.99 79.13 1984 310.26 918.74 3347.00 2955.00 1525.00 78.06 70.05 1985 110.00 644.00 1226.00 1411.00 981.00 36.00 28.00 1985 190.00 1006.00 1666.00 1583.00 1199.00 34.00 26.00 1985 122.00 1757.00 1564.00 1690.00 1003.00 47.00 34.00 1986 236.34 1481.18 2867.44 4449.24 2030.13 486.49 48.76 1986 255.12 1236.28 1781.56 2292.59 894.53 225.95 28.28 1986 251.59 1628.48 2337.55 3394.47 1461.34 293.12 41.66
Quincy Bay
1986 139.81 753.34 2198.41 3218.59 1340.43 359.49 29.13 1986 137.38 724.80 1665.53 1959.54 706.75 143.02 11.98 1986 149.09 671.17 1446.81 1868.89 763.07 171.18 16.47
Buzzards Bay
1984 31.52 249.47 796.08 1025.00 330.41 15.83 21.86 1984 47.98 342.24 958.07 1041.00 352.08 17.18 32.27 1984 35.57 273.89 1008.00 1243.00 457.05 17.93 29.03 1985 12.00 402.00 1453.00 1418.00 297.00 18.00 26.00 1985 132.00 409.00 1032.00 1155.00 280.00 16.00 20.00 1985 60.00 270.00 962.00 764.00 210.00 12.00 15.00 1986 156.36 1037.50 2068.16 1208.67 443.02 88.43 8.71 1986 192.15 1352.47 2615.97 1515.22 554.73 104.95 10.77 1986 133.05 1043.43 2317.90 1404.19 542.40 110.95 11.25
Narragansett Bay
1984 5.98 197.93 609.64 861.84 456.15. 25.36 62.07 1984 7.94 298.27 936.65 967.39 442.96 19.16 62.68
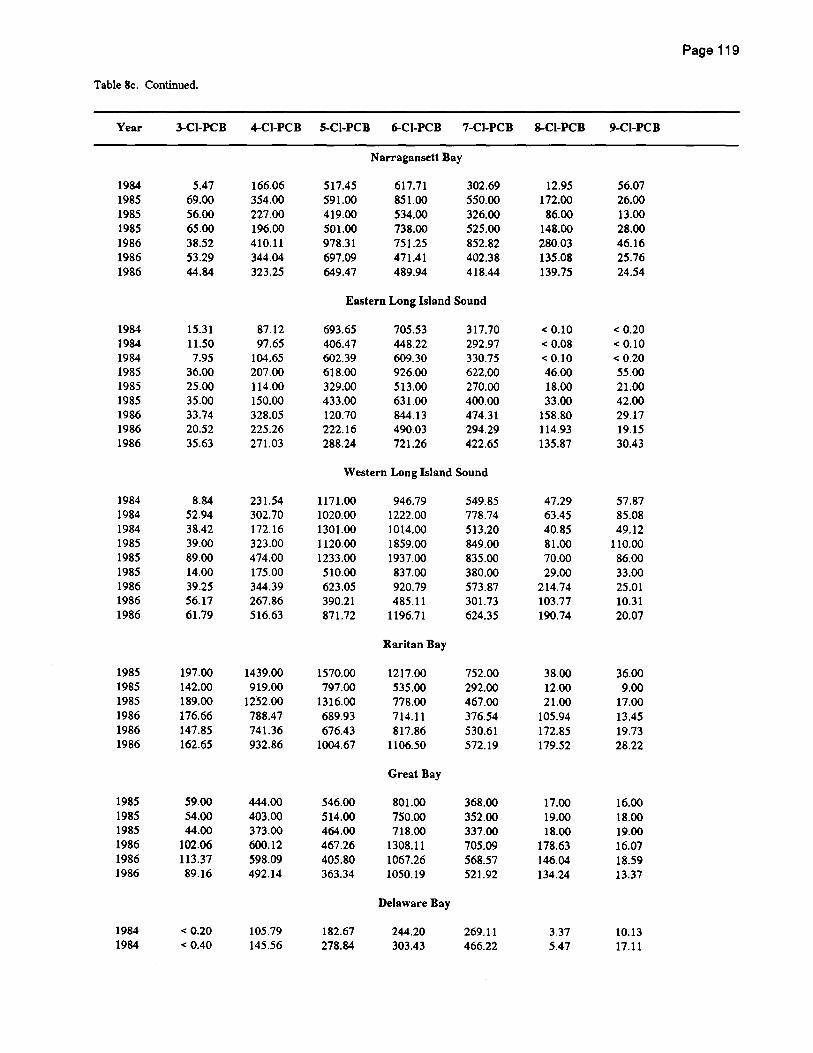
Page 119
Table 8e. Continued.
Year 3-CI-PCB 4-CI-PCB S-CI-PCB 6-CI-PCB 7-CI-PCB 8-CI-PCB 9-CI-PCB
Narragansett Bay
1984 5.47 166.06 517.45 617.71 302.69 12.95 56.07 1985 69.00 354.00 591.00 851.00 550.00 172.00 26.00 1985 56.00 227.00 419.00 534.00 326.00 86.00 13.00 1985 65.00 196.00 501.00 738.00 525.00 148.00 28.00 1986 38.52 410.11 978.31 751.25 852.82 280.Q3 46.16 1986 53.29 344.04 697.09 471.41 402.38 135.08 25.76 1986 44.84 323.25 649.47 489.94 418.44 139.75 24.54
Eastern Long Island Sound
1984 15.31 87.12 693.65 705.53 317.70 < 0.10 < 0.20 1984 11.50 97.65 406.47 448.22 292.97 < 0.08 < 0.10 1984 7.95 104.65 602.39 609.30 330.75 < 0.10 < 0.20 1985 36.00 207.00 618.00 926.00 622.00 46.00 55.00 1985 25.00 114.00 329.00 513.00 270.00 18.00 21.00 1985 35.00 150.00 433.00 631.00 400.00 33.00 42.00 1986 33.74 328.05 120.70 844.13 474.31 158.80 29.17 1986 20.52 225.26 222.16 490.03 294.29 114.93 19.15 1986 35.63 271.03 288.24 721.26 422.65 135.87 30.43
Western Long Island Sound
1984 8.84 231.54 1171.00 946.79 549.85 47.29 57.87 1984 52.94 302.70 1020.00 1222.00 778.74 63.45 85.08 1984 38.42 172.16 1301.00 1014.00 513.20 40.85 49.12 1985 39.00 323.00 1120.00 1859.00 849.00 81.00 110.00 1985 89.00 474.00 1233.00 1937.00 835.00 70.00 86.00 1985 14.00 175.00 510.00 837.00 380.00 29.00 33.00 1986 39.25 344.39 623.05 920.79 573.87 214.74 25.01 1986 56.17 267.86 390.21 485.11 301.73 103.77 10.31 1986 61.79 516.63 871.72 1196.71 624.35 190.74 20.07
Raritan Bay
1985 197.00 1439.00 1570.00 1217.00 752.00 38.00 36.00 1985 142.00 919.00 797.00 535.00 292.00 12.00 9.00 1985 189.00 1252.00 1316.00 778.00 467.00 21.00 17.00 1986 176.66 788.47 689.93 714.11 376.54 105.94 13.45 1986 147.85 741.36 676.43 817.86 530.61 172.85 19.73 1986 162.65 932.86 1004.67 1106.50 572.19 179.52 28.22
Great Bay
1985 59.00 444.00 546.00 801.00 368.00 17.00 16.00 1985 54.00 403.00 514.00 750.00 352.00 19.00 18.00 1985 44.00 373.00 464.00 718.00 337.00 18.00 19.00 1986 102.06 600.12 467.26 1308.11 705.09 178.63 16.07 1986 113.37 598.09 405.80 1067.26 568.57 146.04 18.59 1986 89.16 492.14 363.34 1050.19 521.92 134.24 13.37
Delaware Bay
1984 < 0.20 105.79 182.67 244.20 269.11 3.37 10.13 1984 < 0.40 145.56 278.84 303.43 466.22 5.47 17.11
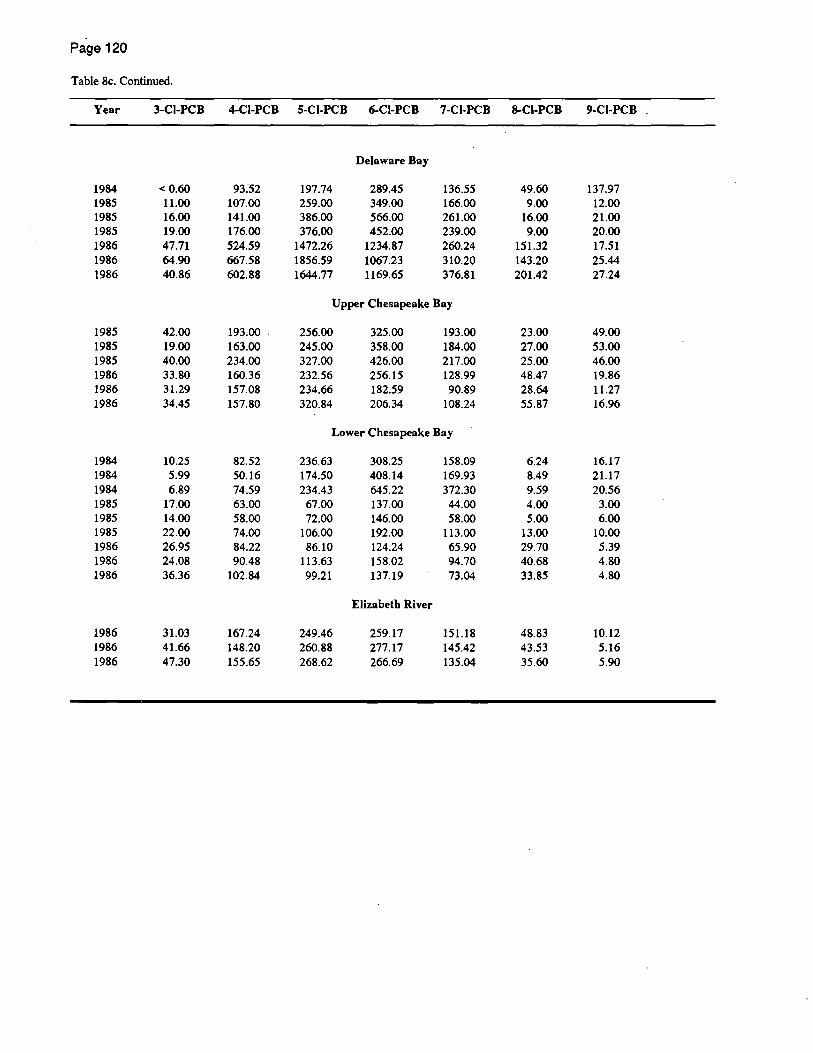
Page 120
Table 8e. Continued.
Year 3-CI-PCB 4-CI-PCB 5-CI-PCB 6-CI-PCB 7-CI-PCB 8-CI-PCB 9-CI-PCB .
Delaware Bay
1984 < 0.60 93.52 197.74 289.45 136.55 49.60 137.97 1985 11.00 107.00 259.00 349.00 166.00 9.00 12.00 1985 16.00 141.00 386.00 566.00 261.00 16.00 21.00 1985 19.00 176.00 376.00 452.00 239.00 9.00 20.00 1986 47.71 524.59 1472.26 1234.87 260.24 151.32 17.51 1986 64.90 667.58 1856.59 1067.23 310.20 143.20 25.44 1986 40.86 602.88 1644.77 1169.65 376.81 201.42 27.24
Upper Chesapeake Bay
1985 42.00 193.00 256.00 325.00 193.00 23.00 49.00 1985 19.00 163.00 245.00 358.00 184.00 27.00 53.00 1985 40.00 234.00 327.00 426.00 217.00 25.00 46.00 1986 33.80 160.36 232.56 256.15 128.99 48.47 19.86 1986 31.29 157.08 234.66 182.59 90.89 28.64 11.27 1986 34.45 157.80 320.84 206.34 108.24 55.87 16.96
Lower Chesapeake Bay
1984 10.25 82.52 236.63 308.25 158.09 6.24 16.17 1984 5.99 50.16 174.50 408.14 169.93 8.49 21.17 1984 6.89 74.59 234.43 645.22 372.30 9.59 20.56 1985 17.00 63.00 67.00 137.00 44.00 4.00 3.00 1985 14.00 58.00 72.00 146.00 58.00 5.00 6.00 1985 22.00 74.00 106.00 192.00 113.00 13.00 10.00 1986 26.95 84.22 86.10 124.24 65.90 29.70 5.39 1986 24.08 90.48 113.63 158.02 94.70 40.68 4.80 1986 36.36 102.84 99.21 137.19 73.04 33.85 4.80
Elizabeth River
1986 31.03 167.24 249.46 259.17 151.18 48.83 10.12 1986 41.66 148.20 260.88 277.17 145.42 43.53 5.16 1986 47.30 155.65 268.62 266.69 135.04 35.60 5.90

Page 121
Table 9a. Concentrations of metals (silver, cadmium. chromium. copper, nickel, lead, zinc, iron) in fish liver (ppm dry weight)
Year Samplei Ag Cd Cr Cu Ni Ph Zn Fe
Machias Bay
1985 28907 0.079 2.340 0.366 5.71 < 0.432 0.293 120.0 227.0 1985 28917 0.100 2.500 < 0.222 8.73 < 0.279 0.331 110.0 212.0 1985 28942 2.470 12.400 < 0.406 36.30 < 0.512 0.347 235.0 433.0 1985 28962 0.049 0.563 < 0.158 4.78 < 0.199 0.337 66.4 49.4 1985 28967 0.444 5.840 0.282 15.00 0.210 0.872 199.0 198.0 1985 28982 0.731 1.170 < 0.247 5.25 < 0.312 0.370 104.0 144.0 1985 28997 0.651 0.791 0.261 9.61 < 0.400 0.203 106.0 90.7 1985 29017 0.091 0.929 0.166 6.91 < 0.287 0.146 84.4 77.4 1985 29027 0.088 1.050 0.058 6.31 < 0.119 < 0.121 76.4 101.0 1985 29032 0.391 2.010 < 0.420 12.70 < 0.530 0.180 116.0 97.8 1986 31200 0.512 2.928 0.096 8.43 0.124 0.065 106.8 225.6 1986 31205 2.070 5.581 < 0.420 25.49 0.355 < 0.181 196.4 853.9 1986 31215 0.164 2.149 < 0.276 8.61 0.105 0.168 157.7 258.1 1986 31220 0.971 5.428 < 0.259 27.24 < 0.209 0.253 187.5 601.1 1986 31225 0.395 8,020 < 0.132 16.45 0.165 < 0.057 135.7 357.1 1986 31240 0.117 0.805 < 0.078 5.12 < 0.063 < 0.034 58.6 5.3 1986 31245 0.688 4.966 < 0.374 15.33 0.185 < 0.161 212.7 534.5 1986 31265 0.525 3.491 <0.151 19.63 0.137 < 0.065 150.6 297.3 1986 31280 0.570 7.082 < 0.731 19.20 0.319 < 0.315 243.7 760.8 1986 31285 0.796 6.020 < 0.331 16.85 0.376 < 0.143 154.5 861.8
Frenchmans Bay
1985 29047 0.040 0.197 0.319 < 1.61 0.751 0.284 60.2 35.0 1985 29057 0.070 0.254 0.107 4.13 < 0.313 0.318 63.8 64.3 1985 29017 0.348 0.375 0.202 3.12 0.257 0.200 73.3 73.6 1985 29097 0.059 0.296 < 0.344 12.00 < 0.433 0.440 132.0 61.5 1985 29122 0.442 0.347 0.097 3.56 < 0.269 0.045 73.4 113.0 1985 29132 0.130 0.290 < 0.137 4.15 < 0.172 0.234 75.7 68.5 1985 29162 0.021 0.203 < 0.521 < 2.52 < 0.657 < 0.667 63.7 55.0 1985 29167 0.115 0.347 0.252 4.20 < 0.317 0.269 94.8 153.0 1985 29172 0.028 0.370 < 0.258 4.30 0.136 0.110 89.0 122.0 1985 29182 0.081 0.429 < 0.096 5.10 0.226 0.288 102.0 131.0
Penobscot Bay
1985 28752 0.171 0.883 < 0.397 8.42 < 0.500 0.593 93.4 199.0 1985 28757 0.120 0.976 < 0.109 3.32 < 0.138 0.514 68.7 149.0 1985 28762 0.130 0.566 0.071 4.43 < 0.115 0.390 65.4 60.5 1985 28767 0.121 2.030 < 0.217 6.57 0.105 0.741 109.0 277.0 1985 28772 0.122 0.372 0.083 4.21 < 0.206 0.629 59.8 46.8 1985 28717 0.043 0.455 < 0.128 3.87 < 0.161 1.200 57.7 70.7 1985 28792 0.154 0.510 0.117 5.00 < 0.297 0.352 69.4 67.4 1985 28822 0.246 0.191 0.264 3.82 < 0.289 0.440 64.4 65.5 1985 28847 0.129 0.586 0.079 4.44 < 0.185 0.313 85.7· 168.0 1985 28882 0.060 0.597 < 0.120 3.08 < 0.151 0.409 94.8 98.4 1986 31396 0.389 3.888 < 0.211 11.80 0.376 0.107 126.5 587.7 1986 31426 0.432 3.015 < 0.230 17.40 0.168 0.116 222.6 517.8 1986 31446 0.432 1.847 < 0.358 5.87 < 0.289 < 0.154 112.6 220.0 1986 31451 0.265 3.259 < 0.369 15.13 0.913 0.244 176.7 828.4 1986 31461 0.151 0.847 0.260 5.74 0.165 < 0.116 100.9 156.0 1986 31471 0.157 3.062 < 0.719 11.79 0.481 < 0.310 266.3 288.9 1986 31486 0.512 3.603 < 0.342 19.08 0.289 < 0.147 195.2 792.5 1986 31496 0.089 0.756 0.086 3.96 0.057 < 0.065 81.7 124.7 1986 31506 0.184 4.620 < 0.347 7.42 0.395 < 0.150 181.5 287.7 1986 31516 0.198 2.066 1.397 6.78 0.139 < 0.137 154.9 285.4

Page 122
Table 9a. Continued.
Year SampleN Ag Cd Cr Cu Ni Pb Zn Fe
Casco Bay
1984 21993 2.430 1.490 0.454 102.00 < 3.040 2.000 226.0 262.0 1984 22023 0.529 0.859 0.176 29.70 < 2.220 1.670 146.0 290.0 1984 22028 1.390 0.715 0.964 48.00 < 2.460 1.040 168.0 745.0 1984 22043 3.090 1.610 < 1.340 121.00 0.818 5.140 207.0 255.0 1984 22053 0.637 1.180 0.125 30.10 < 3.980 < 1.560 155.0 361.0 1984 22058 2.260 0.793 < 1.670 108.00 < 3.020 1.130 192.0 176.0 1984 22088 1.060 0.556 < 1.950 39.40 < 3.530 2.780 155.0 276.0 1984 22093 1.420 1.540 0.103 65.70 1.970 1.720 206.0 153.0 1984 22098 2.310 1.690 0.080 103.00 < 3.540 1.890 220.0 106.0 1984 22113 0.724 0.923 0.478 42.90 < 4.330 56.600 166.0 313.0 1985 28607 0.757 0.200 1.310 2.63 < 0.263 < 0.316 48.5 104.0 1985 28632 0.264 0.592 0.520 7.24 0.132 0.398 166.0 336.0 1985 28652 0.201 0.477 0.902 5.95 0.286 0.289 99.8 129.0 1985 28662 0.243 0.592 2.990 5.73 0.551 0.428 99.7 153.0 1985 28667 0.377 0.758 3.270 5.86 0.179 0.206 143.0 178.0 1985 28672 0.106 0.178 1.550 2.21 0.075 0.122 80.3 49.0 1985 28682 0.235 2.051 3.465 8.71 0.438 0.226 192.4 420.5 1985 28692 0.153 0.154 2.005 2.29 0.019 < 0.075 61.8 84.6 1985 28697 0.250 0.643 0.459 4.83 0.148 0.270 99.4 67.5 1985 28737 0.770 1.460 0.152 20.50 0.135 0.697 163.0 168.0 1986 31587 0.089 0.426 0.112 6.85 0.116 < 0.082 98.0 237.8 1986 31592 0.090 0.322 0.054 2.73 < 0.071 0.044 64.3 66.3 1986 31597 0.079 0.687 0.094 4.31 0.040 < 0.045 87.4 169.0 1986 31602 0.295 0.888 < 0.115 5.29 0.091 0.136 79.3 328.4 1986 31607 0.034 0.299 < 0.121 3.19 0.103 0.093 96.5 169.5 1986 31612 0.092 1.375 < 0.140 5.74 0.126 0.063 96.0 210.2 1986 31642 0.044 0.721 < 0.088 2.30 0.069 0.072 41.7 230.8 1986 31647 0.067 0.336 < 0.107 2.80 < 0.086 < 0.046 65.1 118.7 1986 31652 0.190 0.812 < 0.124 4.48 0.076 0.095 46.7 287.8 1986 31672 0.436 1.338 < 0.211 7.64 0.080 0.129 197.7 257.6
Merrimack River
1984 21827 1.270 0.515 0.150 39.50 < 0.750 0.337 104.0 200.0 1984 21862 2.090 0.383 < 0.267 74.80 0.522 0.331 297.0 395.0 1984 21882 0.580 1.550 0.093 131.00 < 0.714 0.347 111.0 258.0 1984 21892 2.330 1.130 0.139 36.50 < 1.220 0.889 130.0 786.0 1984 21897 0.755 0.216 0.062 38.80 < 0.345 0.620 194.0 163.0 1984 21903 1.540 0.395 0.069 79.60 < 0.697 0.296 126.0 276.0 1984 21912 1.360 0.578 < 0.634 57.50 0.645 1.230 197.0 546.0 1984 21917 1.000 0.254 0.056 43.80 1.430 0.483 205.0 166.0 1984 21922 < 0.054 0.639 < 0.665 17.70 0.541 0.840 154.0 349.0 1984 21927 1.620 1.190 0.040 41.00 0.420 0.296 95.3 516.0 1985 28422 0.226 0.286 < 0.145 17.20 0.275 1.300 150.0 752.0 1985 28432 0.171 0.603 0.329 9.96 0.912 3.110 117.0 2090.0 1985 28442 2.360 0.529 < 0.074 85.60 0.333 0.234 238.0 637.0 1985 28447 0.325 0.257 < 0.051 26.20 0.063 0.441 143.0 197.0 1985 28457 3.000 0.234 < 0.222 61.50 0.140 3.150 124.0 578.0 1985 28462 2.730 0.556 < 0.167 43.90 0.424 8.080 156.0 1000.0 1985 28492 0.321 0.176 0.115 20.60 0.558 2.380 129.0 392.0 1985 28512 5.350 2.390 0.135 77.30 0.554 1.070 153.0 1960.0 1985 28522 0.997 1.530 < 0.098 44.40 0.686 0.267 113.0 534.0 1985 28527 0.514 0.347 0.161 29.20 0.241 0.730 148.0 112.0

Page 123
Table 9a. Continued.
Year SampleH Ag Cd Cr Cu Ni Pb Zn Fe
Salem Harbor
1984 33284 1.730 0.107 0.322 23.60 0.942 0.941 122.0 496.0 1984 33290 0.821 0.097 0.237 19.60 0.306 0.656 91.3 204.0 1984 33292 0.145 0.116 0.276 2.78 0.251 0.548 56.3 13.7 1984 33294 0.326 0.056 0.427 7.69 0.311 0.389 94.3 365.0 1984 33296 0.061 0.079 0.842 2.25 0.241 0.340 72.7 320.0 1984 33298 1.020 0.071 1.310 22.60 0.471 0.464 89.6 302.0 1984 33300 0.265 0.047 0.801 4.83 0.299 0.390 68.6 231.0 1984 33302 0.323 0.117 1.000 10.70 0.377 0.662 61.7 225.0 1984 33306 0.409 0.074 1.480 6.78 0.350 0.437 99.4 269.0 1984 33328 0.018 0.061 0.770 3.16 0.234 0.470 62.0 220.0 1985 27335 0.776 0.318 0.382 15.60 0.246 0.263 114.0 545.0 1985 27346 0.249 0.066 0.115 19.10 0.279 0.933 108.0 338.0 1985 27355 1.650 0.554 0.527 34.60 1.500 0.520 123.0 546.0 1985 27370 0.830 0.280 0.110 36.90 0.276 0.288 176.0 543.0 1985 27385 4.090 0.805 0.117 83.70 0.458 9.450 123.0 927.0 1985 27390 3.510 0.242 0.185 75.30 0.119 1.220 129.0 828.0 1985 27395 0.949 0.179 0.062 27.30 < 0.295 1.410 137.0 500.0 1985 27420 0.696 0.489 0.574 19.70 1.420 2.540 98.0 1750.0 1985 27435 0.223 0.152 0.195 7.77 0.232 0.528 115.0 388.0 1985 27460 0.018 0.547 0.425 11.00 0.918 0.398 110.0 1130.0 1986 31009 2.383 0.226 < 0.073 57.72 0.148 1.345 156.9 1020.9 1986 31014 1.522 0.133 0.168 34.10 0.223 3.927 132.7 749.2 1986 31019 0.546 0.186 0.097 13.77 0.314 0.674 123.7 812.4 1986 31024 0.309 0.765 0.253 11.00 1.221 3.553 116.6 2150.7 1986 31029 0.094 0.263 0.070 6.54 < 0.213 1.478 137.1 862.1 1986 31034 0.190 0.430 0.146 8.53 0.531 3.615 112.9 839.0 1986 31039 0.504 0.318 < 0.093 17.27 0.419 1.884 120.4 1068.8 1986 31044 0.974 0.258 0.093 34.99 0.145 0.595 151.7 702.1 1986 31049 0.241 0.269 0.153 14.55 0.213 1.023 145.2 943.0 1986 31074 0.933 1.777 0.338 22.43 1.982 3.378 127.4 2178.5
Boston Harbor
1984 33340 0.585 0.113 0.254 4.68 0.188 0.592 51.1 23.1 1984 33342 0.895 0.267 0.274 22.70 0.295 0.921 139.0 323.0 1984 33346 0.415 0.129 0.385 13.50 0.324 0.710 73.1 333.0 1984 33348 0.752 0.208 0.354 22.30 0.276 0.843 138.0 641.0 1984 33350 1.230 0.079 0.712 20.60 0.480 0.848 83.2 321.0 1984 33356 1.250 0.322 0.237 18.70 0.220 0.618 66.1 258.0 1984 33358 0.545 0.094 < 0.159 15.10 0.237 0.342 89.8 319.0 1984 33360 0.878 0.114 < 0.216 19.50 0.260 0.893 80.7 282.0 1984 33362 0.079 0.067 0.431 0.44 0.377 0.180 65.3 5.0 1984 33396 0.405 0.056 < 0.160 13.50 0.226 0.343 74.5 129.0 1985 27175 0.279 1.330 0.293 15.30 0.984 1.730 102.0 1630.0 1985 27185 3.150 1.250 2.600 60.10 0.316 1.810 128.0 583.0 1985 27200 1.280 0.882 0.307 10.60 < 0.569 0.861 77.0 733.0 1985 27205 0.262 0.670 0.293 13.30 0.682 2.250 114.0 1810.0 1985 27210 1.610 0.947 0.570 21.60 0.564 3.300 96.4 1610.0 1985 27220 0.281 0.738 0.412 13.80 0.606 1.960 97.9 1590.0 1985 27230 0.745 0.444 0.156 20.90 0.180 1.180 97.2 1080.0 1985 27275 1.520 0.635 0.266 34.60 0.454 2.410 105.0 772.0 1985 27295 4.350 0.889 0.429 47.90 0.501 4.200 114.0 820.0 1985 27320 0.360 0.250 0.143 8.81 < 0.262 0.778 73.3 335.0 1986 30637 0.991 0.366 0.271 7.05 0.444 0.508 90.5 1193.0 1986 30647 0.732 0.506 0.100 13.21 0.178 0.896 78.4 1138.4 1986 30657 0.809 0.599 0.150 26.22 0.149 2.478 104.4 1144.4
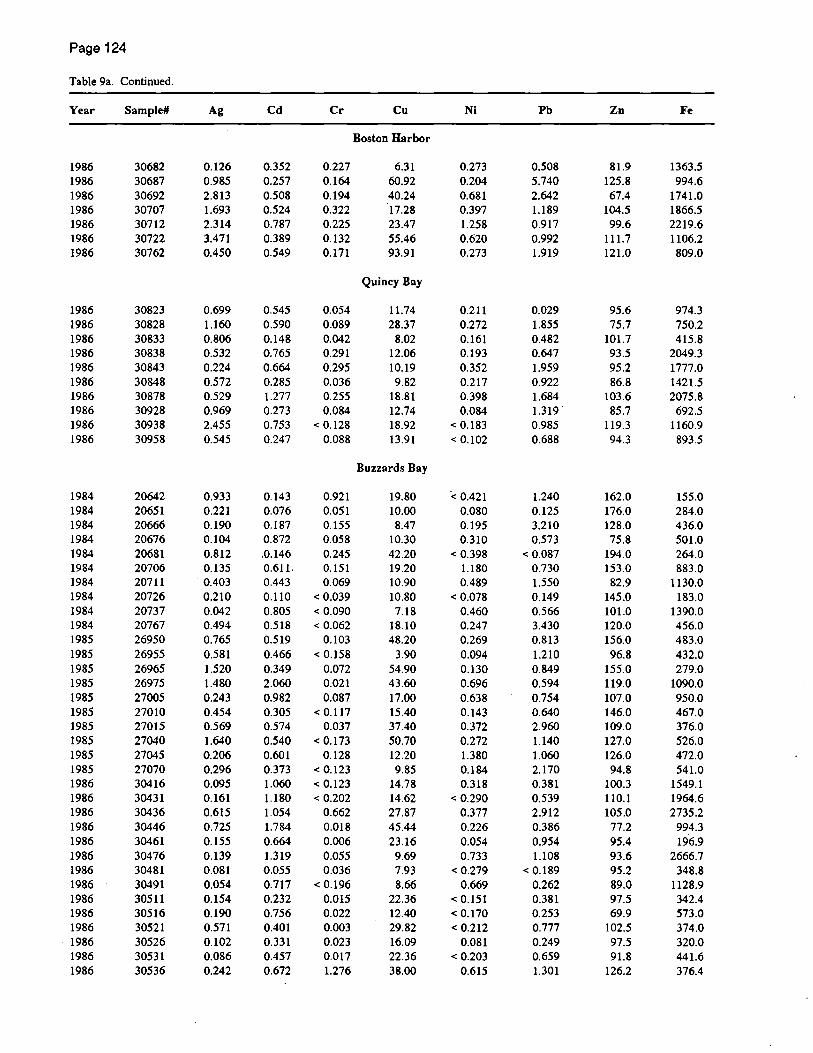
Page 124
Table 9a. Continued.
Year Sample# Ag Cd Cr Cu Ni Pb Zn Fe
Boston Harbor
1986 30682 0.126 0.352 0.227 6.31 0.273 0.508 81.9 1363.5 1986 30687 0.985 0.257 0.164 60.92 0.204 5.740 125.8 994.6 1986 30692 2.813 0.508 0.194 40.24 0.681 2.642 67.4 1741.0 1986 30707 1.693 0.524 0.322 17.28 0.397 1.189 104.5 1866.5 1986 30712 2.314 0.787 0.225 23.47 1.258 0.917 99.6 2219.6 1986 30722 3.471 0.389 0.132 55.46 0.620 0.992 111.7 1106.2 1986 30762 0.450 0.549 0.171 93.91 0.273 1.919 121.0 809.0
Quincy Bay
1986 30823 0.699 0.545 0.054 11.74 0.211 0.029 95.6 974.3 1986 30828 1.160 0.590 0.089 28.37 0.272 1.855 75.7 750.2 1986 30833 0.806 0.148 0.042 8.02 0.161 0.482 101.7 415.8 1986 30838 0.532 0.765 0.291 12.06 0.193 0.647 93.5 2049.3 1986 30843 0.224 0.664 0.295 10.19 0.352 1.959 95.2 1777.0 1986 30848 0.572 0.285 0.036 9.82 0.217 0.922 86.8 1421.5 1986 30878 0.529 1.277 0.255 18.81 0.398 1.684 103.6 2075.8 1986 30928 0.969 0.273 0.084 12.74 0.084 1.319 85.7 692.5 1986 30938 2.455 0.753 < 0.128 18.92 < 0.183 0.985 119.3 1160.9 1986 30958 0.545 0.247 0.088 13.91 < 0.102 0.688 94.3 893.5
Buzzards Bay
1984 20642 0.933 0.143 0.921 19.80 '< 0.421 1.240 162.0 155.0 1984 20651 0.221 0.076 0.051 10.00 0.080 0.125 176.0 284.0 1984 20666 0.190 0.187 0.155 8.47 0.195 3.210 128.0 436.0 1984 20676 0.104 0.872 0.058 10.30 0.310 0.573 75.8 501.0 1984 20681 0.812 ,0.146 0.245 42.20 < 0.398 < 0.087 194.0 264.0 1984 20706 0.135 0.611. 0.151 19.20 1.180 0.730 153.0 883.0 1984 20711 0.403 0.443 0.069 10.90 0.489 1.550 82.9 1130.0 1984 20726 0.210 0.110 < 0.039 10.80 < 0.078 0.149 145.0 183.0 1984 20737 0.042 0.805 < 0.090 7.18 0.460 0.566 101.0 1390.0 1984 20767 0.494 0.518 < 0.062 18.10 0.247 3.430 120.0 456.0 1985 26950 0.765 0.519 0.103 48.20 0.269 0.813 156.0 483.0 1985 26955 0.581 0.466 < 0.158 3.90 0.094 1.210 96.8 432.0 1985 26965 1.520 0.349 0.072 54.90 0.130 0.849 155.0 279.0 1985 26975 1.480 2.060 0.021 43.60 0.696 0.594 119.0 1090.0 1985 27005 0.243 0.982 0.087 17.00 0.638 0.754 107.0 950.0 1985 27010 0.454 0.305 < 0.117 15.40 0.143 0.640 146.0 467.0 1985 27015 0.569 0.574 0.037 37.40 0.372 2.960 109.0 376.0 1985 27040 1.640 0.540 < 0.173 50.70 0.272 1.140 127.0 526.0 1985 27045 0.206 0.601 0.128 12.20 1.380 1.060 126.0 472.0 1985 27070 0.296 0.373 < 0.123 9.85 0.184 2.170 94.8 541.0 1986 30416 0.095 1.060 < 0.123 14.78 0.318 0.381 100.3 1549.1 1986 30431 0.161 1.180 < 0.202 14.62 < 0.290 0.539 110.1 1964.6 1986 30436 0.615 1.054 0.662 27.87 0.377 2.912 105.0 2735.2 1986 30446 0.725 1.784 0.018 45.44 0.226 0.386 77.2 994.3 1986 30461 0.155 0.664 0.006 23.16 0.054 0.954 95.4 196.9 1986 30476 0.139 1.319 0.055 9.69 0.733 1.108 93.6 2666.7 1986 30481 0.081 0.055 0.036 7.93 < 0.279 < 0.189 95.2 348.8 1986 30491 0.054 0.717 < 0.196 8.66 0.669 0.262 89.0 1128.9 1986 30511 0.154 0.232 0.015 22.36 < 0.151 0.381 97.5 342.4 1986 30516 0.190 0.756 0.022 12.40 < 0.170 0.253 69.9 573.0 1986 30521 0.571 0.401 0.003 29.82 < 0.212 0.777 102.5 374.0 1986 30526 0.102 0.331 0.023 16.09 0.081 0.249 97.5 320.0 1986 30531 0.086 0.457 0.017 22.36 < 0.203 0.659 91.8 441.6 1986 30536 0.242 0.672 1.276 38.00 0.615 1.301 126.2 376.4
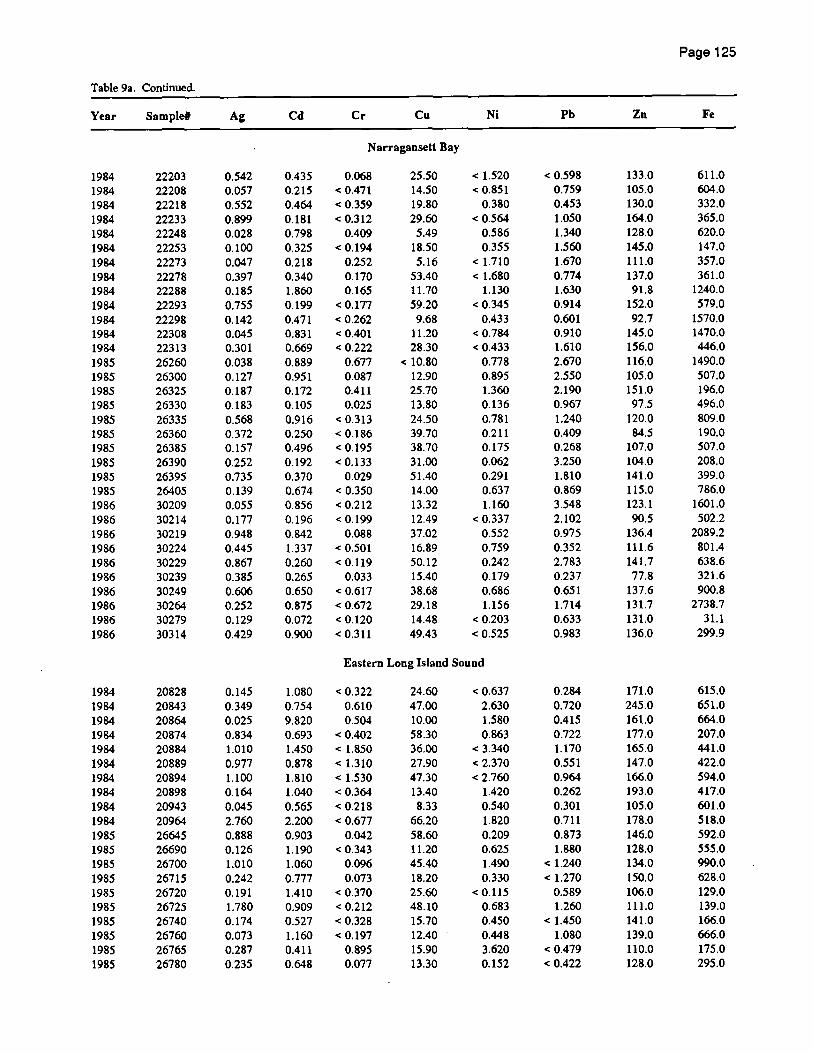
Page 125
Table 9a. Continued.
Year Sample# Ag Cd Cr Cu Ni Ph Zn Fe
Narragansett Bay
1984 22203 0.542 0.435 0.068 25.50 < 1.520 < 0.598 133.0 611.0 1984 22208 0.057 0.215 < 0.471 14.50 < 0.851 0.759 105.0 604.0 1984 22218 0.552 0.464 < 0.359 19.80 0.380 0.453 130.0 332.0 1984 22233 0.899 0.181 < 0.312 29.60 < 0.564 1.050 164.0 365.0 1984 22248 0.028 0.798 0.409 5.49 0.586 1.340 128.0 620.0 1984 22253 0.100 0.325 < 0.194 18.50 0.355 1.560 145.0 147.0 1984 22273 0.047 0.218 0.252 5.16 < 1.710 1.670 111.0 357.0 1984 22278 0.397 0.340 0.170 53.40 < 1.680 0.774 137.0 361.0 1984 22288 0.185 1.860 0.165 11.70 1.130 1.630 91.8 1240.0
1984 22293 0.755 0.199 < 0.177 59.20 < 0.345 0.914 152.0 579.0
1984 22298 0.142 0.471 < 0.262 9.68 0.433 0.601 92.7 1570.0 1984 22308 0.045 0.831 < 0.401 11.20 < 0.784 0.910 145.0 1470.0 1984 22313 0.301 0.669 < 0.222 28.30 < 0.433 1.610 156.0 446.0
1985 26260 0.038 0.889 0.677 < 10.80 0.778 2.670 116.0 1490.0 1985 26300 0.127 0.951 0.087 12.90 0.895 2.550 105.0 507.0 1985 26325 0.187 0.172 0.411 25.70 1.360 2.190 151.0 196.0 1985 26330 0.183 0.105 0,025 13.80 0.136 0.967 97.5 496.0 1985 26335 0.568 0.916 < 0.313 24.50 0.781 1.240 120.0 809.0 1985 26360 0.372 0.250 < 0.186 39.70 0.211 0.409 84.5 190.0 1985 26385 0.157 0.496 < 0.195 38.70 0.175 0.268 107.0 507.0
1985 26390 0.252 0.192 < 0.133 31.00 0.062 3.250 104.0 208.0 1985 26395 0.735 0.370 0.029 51.40 0.291 1.810 141.0 399.0 1985 26405 0.139 0.674 < 0.350 14.00 0.637 0.869 115.0 786.0 1986 30209 0.055 0.856 < 0.212 13.32 1.160 3.548 123.1 1601.0 1986 30214 0.177 0.196 < 0.199 12.49 < 0.337 2.102 90.5 502.2 1986 30219 0.948 0.842 0.088 37.02 0.552 0.975 136.4 2089.2 1986 30224 0.445 1.337 < 0.501 16.89 0.759 0.352 111.6 801.4 1986 30229 0.867 0.260 < 0.119 50.12 0.242 2.783 141.7 638.6 1986 30239 0.385 0.265 0.033 15.40 0.179 0.237 77.8 321.6 1986 30249 0.606 0.650 < 0.617 38.68 0.686 0.651 137.6 900.8 1986 30264 0.252 0.875 < 0.672 29.18 1.156 1.714 131.7 2738.7 1986 30279 0.129 0.072 < 0.120 14.48 < 0.203 0.633 131.0 31.1 1986 30314 0.429 0.900 < 0.311 49.43 < 0.525 0.983 136.0 299.9
Eastern Long Island Sound
1984 20828 0.145 1.080 < 0.322 24.60 < 0.637 0.284 171.0 615.0 1984 20843 0.349 0.754 0.610 47.00 2.630 0.720 245.0 651.0 1984 20864 0.025 9.820 0.504 10.00 1.580 0.415 161.0 664.0 1984 20874 0.834 0.693 < 0.402 58.30 0.863 0.722 177.0 207.0 1984 20884 1.010 1.450 < 1.850 36.00 < 3.340 1.170 165.0 441.0 1984 20889 0.977 0.878 < 1.310 27.90 < 2.370 0.551 147.0 422.0 1984 20894 1.100 1.810 < 1.530 47.30 < 2.760 0.964 166.0 594.0 1984 20898 0.164 1.040 < 0.364 13.40 1.420 0.262 193.0 417.0 1984 20943 0.045 0.565 < 0.218 8.33 0.540 0.301 105.0 601.0 1984 20964 2.760 2.200 < 0.677 66.20 1.820 0.711 178.0 518.0 1985 26645 0.888 0.903 0.042 58.60 0.209 0.873 146.0 592.0 1985 26690 0.126 1.190 < 0.343 11.20 0.625 1.880 128.0 555.0 1985 26700 1.010 1.060 0.096 45.40 1.490 < 1.240 134.0 990.0 1985 26715 0.242 0.777 0.073 18.20 0.330 < 1.270 150.0 628.0 1985 26720 0.191 1.410 < 0.370 25.60 < 0.115 0.589 106.0 129.0 1985 26725 1.780 0.909 < 0.212 48.10 0.683 1.260 111.0 139.0 1985 26740 0.174 0.527 < 0.328 15.70 0.450 < 1.450 141.0 166.0 1985 26760 0.073 1.160 < 0.197 12.40 0.448 1.080 139.0 666.0 1985 26765 0.287 0.411 0.895 15.90 3.620 < 0.479 110.0 175.0 1985 26780 0.235 0.648 0.077 13.30 0.152 < 0.422 128.0 295.0

Page 126
Table 9a. Continued.
Year
1986 1986 1986 1986 1986 1986 1986 1986 1986 1986 1986 1986 1986 1986
1984 1984 1984 1984 1984 1984 1984 1984 1984 1984 1985 1985 1985 1985 1985 1985 1985 1985 1985 1985 1986 1986 1986 1986 1986 1986 1986 1986 1986 1986 1986 1986 1986
1985 1985 1985
Sample#
30008 30013 30018 30028 30033 30038 30048' 30058 30063 30073 30098 30108 30118 30148
21383 21388 21393 21404 21414 21419 21428 21453 21468 21509 26515 26535 26540 26555 26590 26595 26600 26605 26610 26625 29827 29837 29842 29847 29852 29857 29867 29886 29891 29901 29931 29961 29966
27607 27632 27642
Ag
0.515 1.903 0.652 0.292 0.217 0.588 0.293 0.250 0.173 0.226 0.480 0.266 0.699 0.174
0.449 0.240 0.209 0.488 0.027 0.022 0.038 0.065 0.070
< 0.167 0.265 0.374 1.630 0.268 0.086 0.436 0.182 0.599 0.370 0.691 0.294 0.413 0.549 0.525 0.759 0.243 0.198 0.175 0.597 0.661 0.147 0.415 0.272
1.260 1.160 1.080
Cd Cr Cu Ni
Eastern Long Island Sound
1.423 2.381 0.926 1.195 0.151 1.777 0.402 0.328 0.284 0.230 0.272 0.311 0.804 0.146
0.018 < 0.613 < 0.060 < 0.558
0.002 < 0.423 < 0.253
0.026 0.013 0.012 0.017
< 0.045 0.009 0.118
10.43 21.27 64.49
< 9.13 9.82
22.66 23.15 11.60 8.58 6.01
15.40 10.99 34.39 10.60
< 0.248 < 0.881 <0.417 < 0.802 < 0.157
0.740 < 0.364 < 0.464 < 0.130
0.091 0.043
< 0.312 0.287 0.'172
Western Long Island Sound
1.820 0.805 0.118 1.140 0.578 0.719 0.857 0.735 0.296 0.726 2.430 0.744 2.830 1.360 1.300 0.950 2.380 0.432 1.050 0.614 0.677 1.509 0.588 0.835 1.792 1.045 1.183 1.648 0.964 0.683 0.474 1.038 2.703
0.742 < 0.256
0.139 < 0.386 < 0.237 < 0.159 < 0.411 < 0.697 < 0.787 < 2.070 < 0.548
0.242 0.394
< 0.734 0.050 1.980
<0.814 0.020 1.760 1.930 0.050 0.Q15
< 0.084 0.033 0.065 0.005
< 0.294 0.088
< 0.101 < 0.375
0.066 < 0.139 < 1.319
0.720 0.185 0.532 < 0.194 0.190 0.296
25.50 20.40 20.60 49.00 12.20 6.20 8.24 8.01
19.60 12.60 26.20 19.10 69.50 20.20
. 8.87 21.90
< 16.30 23.30 64.40 17.70 26.05 28.22 12.75 16.63 28.51 27.62 18.55 29.13
. 42.02 27.22
8.35 24.31
< 21.60
Raritan Bay
92.60 20.00 36.10
4.740 3.010 0.319 1.080 1.050 0.988 2.360
< 1.260 < 1.420 < 3.740
0.383 1.220 1.130 0.438 0.936 0.391 2.400 0.121 0.406 0.507 0.224
< 0.540 < 0.590 < 0.585 < 1.140 < 0.347
0.759 < 1.025 < 0.711
0.554 0.175
< 0.972 < 1.896
< 1.440 < 0.518
0.302
Ph
< 0.169 < 0.252
0.437 < 0.230
0.103 2.478 0.260 0.441 0.057
< 0.097 0.065
< 0.212 0.555 0.127
2.170 0.480 0.232 0.469 0.249 0.458 0.397 0.635 0.534 1.690 2.720
< 1.530 3.910 2.430 1.480 0.435 9.130 0.677 0.927
12.000 0.462 0.460 0.331 0.499 0.639 0.178 0.484 1.599
< 0.483 0.772
< 0.312 < 0.660
0.543
5.580 1.500 1.510
Zn
103.8 83.3
135.3 94.7 83.3
119.2 118.4
88.7 51.9 72.3 71.5 57.8
111.1 72.5
85.6 132.0 117.0 264.0 112.0
73.3 75.8
116.0 141.0 103.0 141.0 121.0 153.0 83.0
124.0 99.6
101.0 . 105.0
131.0 119.0 119.6 117.2 100.5 111.9 109.5 117.4 116.9 120.1 143.0 124.9 82.3
135.3 108.8
160.0 116.0 134.0
Fe
304.8 839.7 152.9 749.7 111.7
1244.3 283.7 400.1 131.9 160.1 163.7 168.1 403.4 163.5
2940.0 869.0 265.0 312.0 309.0
1220.0 1550.0 1110.0
179.0 504.0 561.0
1190.0 1200.0 1240.0 825.0 869.0
3620.0 353.0
1070.0 934.0 551.1 442.1
1043.5 1538.7 2555.5
261.8 2116.8
795.5 352.5
1374.9 425.6
1089.9 3187.5
3380.0 800.0 777.0

Page 127
Table 9a. Continued.
Year SarnpleH Ag Cd Cr Cu Ni Pb Zn Fe
Raritan Bay
1985 27667 1.680 1.080 0.153 51.00 < 1.520 1.540 112.0 1710.0 1985 27672 1.210 0.311 < 0.288 37.10 0.346 1.510 107.0 1540.0 1985 27677 0.787 0.664 0.187 65.60 < 0.690 2.800 135.0 1070.0 1985 27702 0.248 0.986 < 0.760 68.20 < 2.030 4.430 160.0 1870.0 1985 27707 2.750 1.400 < 0.751 72.10 < 2.010 2.810 200.0 626.0 1985 27712 0.148 0.511 < 0.734 65.90 < 1.960 1.980 148.0 902.0 1985 27727 8.800 1.150 < 0.571 35.40 0.399 13.800 123.0 2570.0 1986 29245 2.694 0.679 0.188 65.47 0.128 4.081 129.9 627.9 1986 29250 0.516 0.311 0.058 18.42 0.085 0.710 91.2 818.9 1986 29265 0.339 0.486 0.084 54.94 0.277 0.529 129.7 926.2 1986 29270 0.819 0.262 0.062 34.52 0.055 3.188 141.2 430.3 1986 29280 0.251 0.832 0.066 14.05 0.673 2.032 114.6 1626.3 1986 29305 0.868 0.279 0.094 62.71 0.108 1.362 156.8 230.2 1986 29335 1.087 0.366 0.066 69.84 0.080 4.409 123.4 1064.1 1986 29340 0.120 1.236 0.256 11.07 0.619 0.936 115.5 1667.3 1986 29370 0.537 0.589 0.092 34.29 0.246 1.071 120.9 889.1 1986 29375 0.213 0.420 0.124 10.35 0.246 0.640 112.0 1412.4
Great Bay
1985 27812 0.329 0.206 0.186 16.10 0.176 0.792 106.0 229.0 1985 27822 0.749 0.186 0.017 37.90 < 0.227 0.835 117.0 128.0 1985 27837 0.436 0.077 0.055 25.00 < 0.168 0.414 70.9 57.3 1985 27842 0.465 0.223 0.051 27.40 0.269 2.070 155.0 268.0 1985 27862 0.358 0.123 < 0.095 25.80 < 0.183 0.553 82.8 43.2 1985 27867 0.647 0.160 < 0.205 43.60 < 0.064 1.180 139.0 147.0 1985 27887 2.660 0.258 < 0.288 58.70 < 0.090 0.675 162.0 111.0 1985 27897 0.407 0.270 0.041 16.90 < 0.347 0.360 138.0 232.0 1985 27907 1.110 0.135 < 0.051 47.30 < 0.136 0.226 113.0 42.0 1985 27912 0.453 0.085 < 0.069 27.50 < 0.185 1.160 111.0 98.8 1986 29645 1.548 0.114 0.061 27.70 < 0.230 2.010 130.4 159.5 1986 29650 2.688 0.553 0.075 62.14 0.717 2.391 177.5 207.3 1986 29665 1.448 0.546 0.075 62.14 0.239 1.638 137.3 941.3 1986 29680 1.183 0.829 0.013 50.64 0.173 1.662 121.5 156.9 1986 29690 0.253 0.345 0.047 15.32 1.308 0.325 92.9 479.3 1986 29700 0.193 0.338 0.031 15.39 0.269 0.797 102.8 464.4 1986 29715 1.242 0.198 0.019 47.28 0.225 0.124 92.8 251.1 1986 29720 2.195 0.544 0.034 112.46 0.149 0.322 151.3 549.7 1986 29735 0.246 0.228 0.037 11.70 0.349 0.712 103.9 319.0 1986 29745 0.407 0.113 0.044 21.96 0.190 2.877 126.6 188.5
Delaware Bay
1984 21564 0.084 0.212 < 0.336 8.48 3.470 0.297 84.8 489.0 1984 21574 0.627 0.241 < 1.180 22.40 < 2.130 0.744 150.0 286.0 1984 21585 0.123 0.053 < 0.311 12.90 0.838 < 0.145 85.7 211.0 1984 21589 0.171 0.050 < 0.263 11.90 < 0.520 0.189 75.7 209.0 1984 21595 0.187 0.143 < 0.489 18.00 < 0.968 0.634 94.9 282.0 1984 21600 0.258 0.318 < 0.565 21.40 < 1.020 < 0.223 132.0 365.0 1984 21639 0.126 0.117 < 1.700 20.30 < 3.080 < 0.672 141.0 139.0 1984 21655 0.287 0.091 < 0.449 22.70 0.914 < 0.209 93.0 200.0 1984 21660 0.157 0.227 0.581 17.70 4.550 < 0.250 • 97.2 247.0 1984 21680 0.188 0.060 < 0.594 22.30 1.210 < 0.277 108.0 231.0 1985 24769 0.448 0.074 < 1.550 40.00 < 1.960 < 1.990 143.0 278.0 1985 24789 0.084 0.059 < 0.145 10.90 0.149 0.128 90.9 199.0 1985 24794 0.250 0.107 < 0.416 35.90 0.113 < 1.530 182.0 342.0
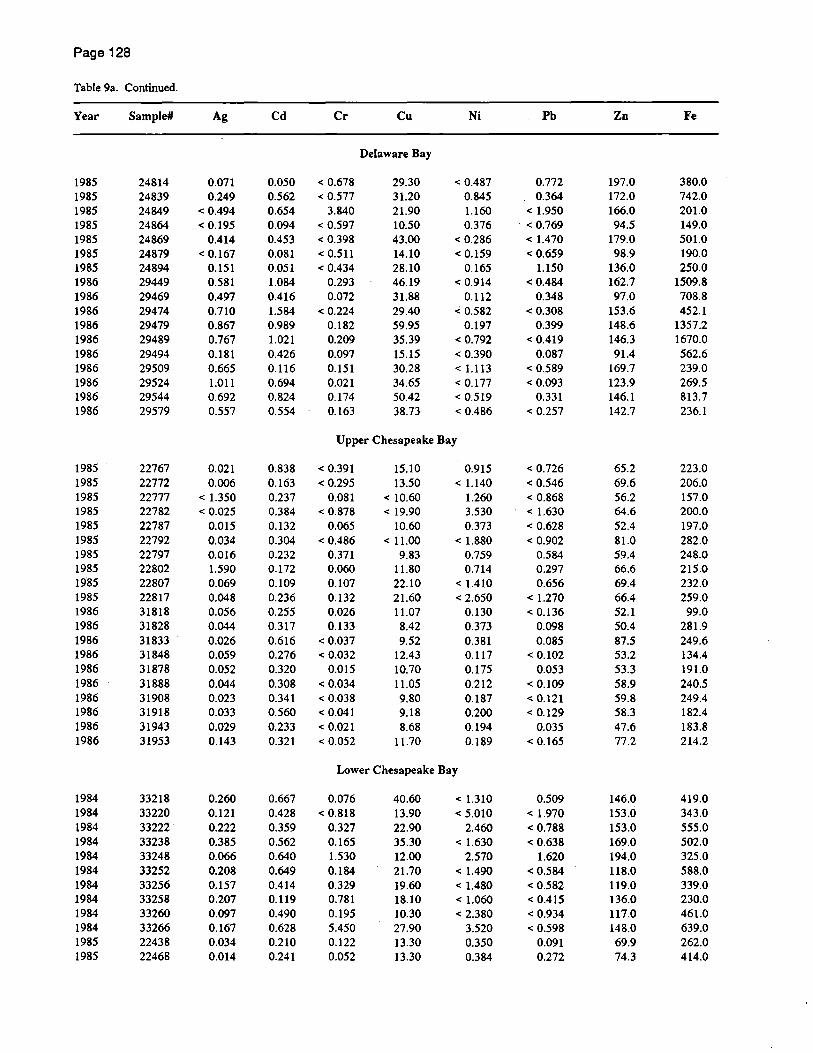
Page 128
Table 9a. Continued.
Year Sample# Ag Cd Cr Cu Ni Pb Zn Fe
Delaware Bay
1985 24814 0.071 0.050 < 0.678 29.30 < 0.487 0.772 197.0 380.0 1985 24839 0.249 0.562 < 0.577 31.20 0.845 0.364 172.0 742.0 1985 24849 < 0.494 0.654 3.840 21.90 1.160 < 1.950 166.0 201.0 1985 24864 < 0.195 0.094 < 0.597 10.50 0.376 < 0.769 94.5 149.0 1985 24869 0.414 0.453 < 0.398 43.00 < 0.286 < 1.470 179.0 501.0 1985 24879 < 0.167 0.081 < 0.511 14.10 < 0.159 < 0.659 98.9 190.0 1985 24894 0.151 0.051 < 0.434 28.10 0.165 1.150 136.0 250.0 1986 29449 0.581 1.084 0.293 46.19 < 0.914 < 0.484 162.7 1509.8 1986 29469 0.497 0.416 0.072 31.88 0.112 0.348 97.0 708.8 1986 29474 0.710 1.584 < 0.224 29.40 . ..: 0.582 < 0.308 153.6 452.1 1986 29479 0.867 0.989 0.182 59.95 0.197 0.399 148.6 1357.2 1986 29489 0.767 1.021 0.209 35.39 < 0.792 < 0.419 146.3 1670.0 1986 29494 0.181 0.426 0.097 15.15 < 0.390 0.087 91.4 562.6 1986 29509 0.665 0.116 0.151 30.28 <1.113 < 0.589 169.7 239.0 1986 29524 1.011 0.694 0.021 34.65 < 0.177 < 0.093 123.9 269.5 1986 29544 0.692 0.824 0.174 50.42 < 0.519 0.331 146.1 813.7 1986 29579 0.557 0.554 0.163 38.73 < 0.486 < 0.257 142.7 236.1
Upper Chesapeake Bay
1985 22767 0.021 0.838 < 0.391 15.10 0.915 < 0.726 65.2 223.0 1985 22772 0.006 0.163 < 0.295 13.50 < 1.140 < 0.546 69.6 206.0 1985 22777 < 1.350 0.237 0.081 < 10.60 1.260 < 0.868 56.2 157.0 1985 22782 < 0.025 0.384 < 0.878 < 19.90 3.530 < 1.630 64.6 200.0 1985 22787 0.Q15 0.132 0.065 10.60 0.373 < 0.628 52.4 197.0 1985 22792 0.034 0.304 < 0.486 < 11.00 < 1.880 < 0.902 81.0 282.0 1985 22797 0.016 0.232 0.371 9.83 0.759 0.584 59.4 248.0 1985 22802 1.590 0.172 0.060 11.80 0.714 0.297 66.6 215.0 1985 22807 0.069 0.109 0.107 22.10 < 1.410 0.656 69.4 232.0 1985 22817 0.048 0.236 0.132 21.60 < 2.650 < 1.270 66.4 259.0 1986 31818 0.056 0.255 0.026 11.07 0.130 < 0.136 52.1 99.0 1986 31828 0.044 0.317 0.133 8.42 0.373 0.098 50.4 281.9 1986 31833 0.026 0.616 < 0.037 9.52 0.381 0.085 87.5 249.6 1986 31848 0.059 0.276 < 0.032 12.43 0.117 < 0.102 53.2 134.4 1986 31878 0.052 0.320 0.015 10.70 0.175 0.053 53.3 191.0 1986 31888 0.044 0.308 < 0.034 11.05 0.212 < 0.109 58.9 240.5 1986 31908 0.023 0.341 < 0.038 9.80 0.187 < 0.121 59.8 249.4 1986 31918 0.033 0.560 < 0.041 9.18 0.200 < 0.129 58.3 182.4 1986 31943 0.029 0.233 < 0.021 8.68 0.194 0.035 47.6 183.8 1986 31953 0.143 0.321 < 0.052 11.70 0.189 < 0.165 77.2 214.2
Lower Chesapeake Bay
1984 33218 0.260 0.667 0.076 40.60 < 1.310 0.509 146.0 419.0 1984 33220 0.121 0.428 < 0.818 13.90 < 5.Q10 < 1.970 153.0 343.0 1984 33222 0.222 0.359 0.327 22.90 2.460 < 0.788 153.0 555.0 1984 33238 0.385 0.562 0.165 35.30 < 1.630 < 0.638 169.0 502.0 1984 33248 0.066 0.640 1.530 12.00 2.570 1.620 194.0 325.0 1984 33252 0.208 0.649 0.184 21.70 < 1.490 < 0.584 118.0 588.0 1984 33256 0.157 0.414 0.329 19.60 < 1.480 < 0.582 119.0 339.0 1984 33258 0.207 0.119 0.781 18.10 < 1.060 < 0.415 136.0 230.0 1984 33260 0.097 0.490 0.195 10.30 < 2.380 < 0.934 117.0 461.0 1984 33266 0.167 0.628 5.450 27.90 3.520 < 0.598 148.0 639.0 1985 22438 0.034 0.210 0.122 13.30 0.350 0.091 69.9 262.0 1985 22468 0.014 0.241 0.052 13.30 0.384 0.272 74.3 414.0
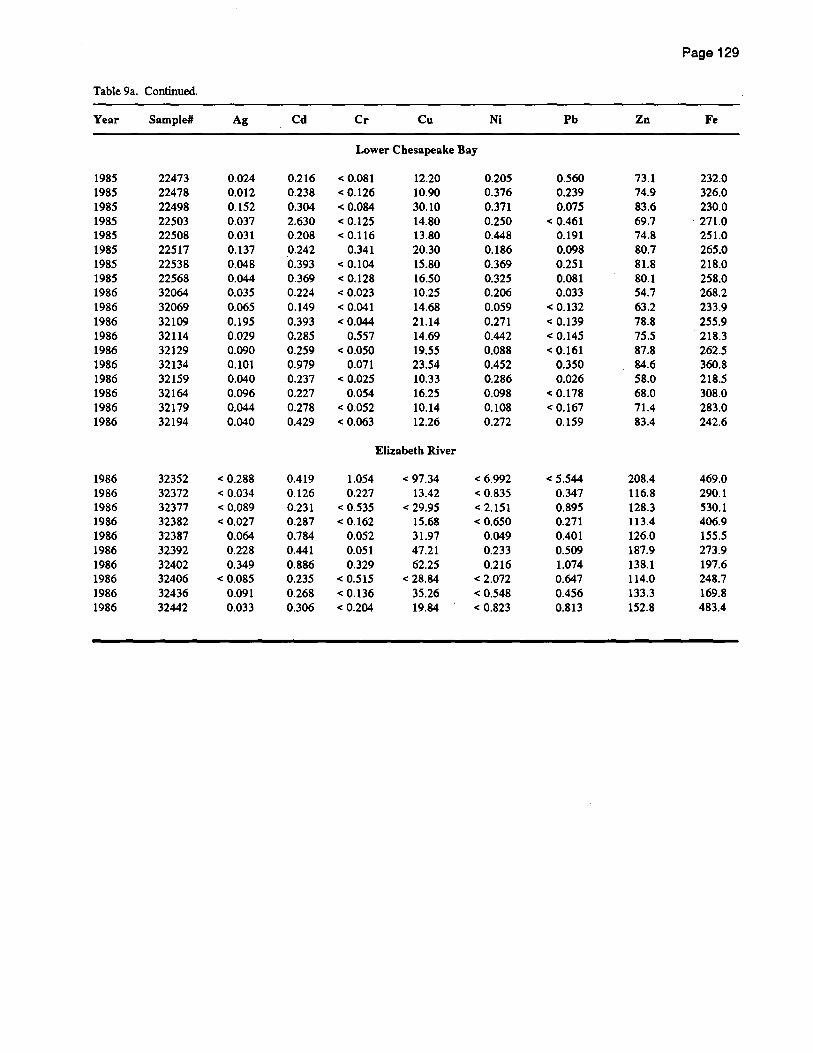
Page 129
Table 9a. Continued.
Year Sample# Ag Cd Cr Cu Ni Pb Zn Fe
Lower Chesapeake Bay
1985 22473 0.024 0.216 < 0.081 12.20 0.205 0.560 73.1 232.0 1985 22478 0.012 0.238 < 0.126 10.90 0.376 0.239 74.9 326.0 1985 22498 0.152 0.304 < 0.084 30.10 0.371 0.075 83.6 230.0 1985 22503 0.037 2.630 < 0.125 14.80 0.250 < 0.461 69.7 ' 271.0 1985 22508 0.031 0.208 < 0.116 13.80 0.448 0.191 74.8 251.0 1985 22517 0.137 0.242 0.341 20.30 0.186 0.098 80.7 265.0 1985 22538 0.048 0.393 < 0.104 15.80 0.369 0.251 81.8 218.0 1985 22568 0.044 0.369 < 0.128 16.50 0.325 0.081 80.1 258.0 1986 32064 0.Q35 0.224 < 0.023 10.25 0.206 0.033 54.7 268.2 1986 32069 0.065 0.149 < 0.041 14.68 0.059 < 0.132 63.2 233.9 1986 32109 0.195 0.393 < 0.044 21.14 0.271 < 0.139 78.8 255.9 1986 32114 0.029 0.285 0.557 14.69 0.442 < 0.145 75.5 218.3 1986 32129 0.090 0.259 < 0.050 19.55 0.088 < 0.161 87.8 262.5 1986 32134 0.101 0.979 0.071 23.54 0.452 0.350 84.6 360.8 1986 32159 0.040 0.237 < 0.025 10.33 0.286 0.026 58.0 218.5 1986 32164 0.096 0.227 0.054 16.25 0.098 < 0.178 68.0 308.0 1986 32179 0.044 0.278 < 0.052 10.14 0.108 < 0.167 71.4 283.0 1986 32194 0.040 0.429 < 0.063 12.26 0.272 0.159 83.4 242.6
Elizabeth River
1986 32352 < 0.288 0.419 1.054 < 97.34 < 6.992 < 5.544 208.4 469.0 1986 32372 < 0.034 0.126 0.227 13.42 < 0.835 0.347 116.8 290.1 1986 32377 < 0.089 0.231 < 0.535 < 29.95 <2.151 0.895 128.3 530.1 1986 32382 < 0.027 0.287 < 0.162 15.68 < 0.650 0.271 113.4 406.9 1986 32387 0.064 0.784 0.052 31.97 0.049 0.401 126.0 155.5 1986 32392 0.228 0.441 0.051 47.21 0.233 0.509 187.9 273.9 1986 32402 0.349 0.886 0.329 62.25 0.216 1.074 138.1 197.6 1986 32406 < 0.085 0.235 < 0.515 < 28.84 < 2.072 0.647 114.0 248.7 1986 32436 0.091 0.268 < 0.136 35.26 < 0.548 0.456 133.3 169.8 1986 32442 0.033 0.306 < 0.204 19.84 < 0.823 0.813 152.8 483.4
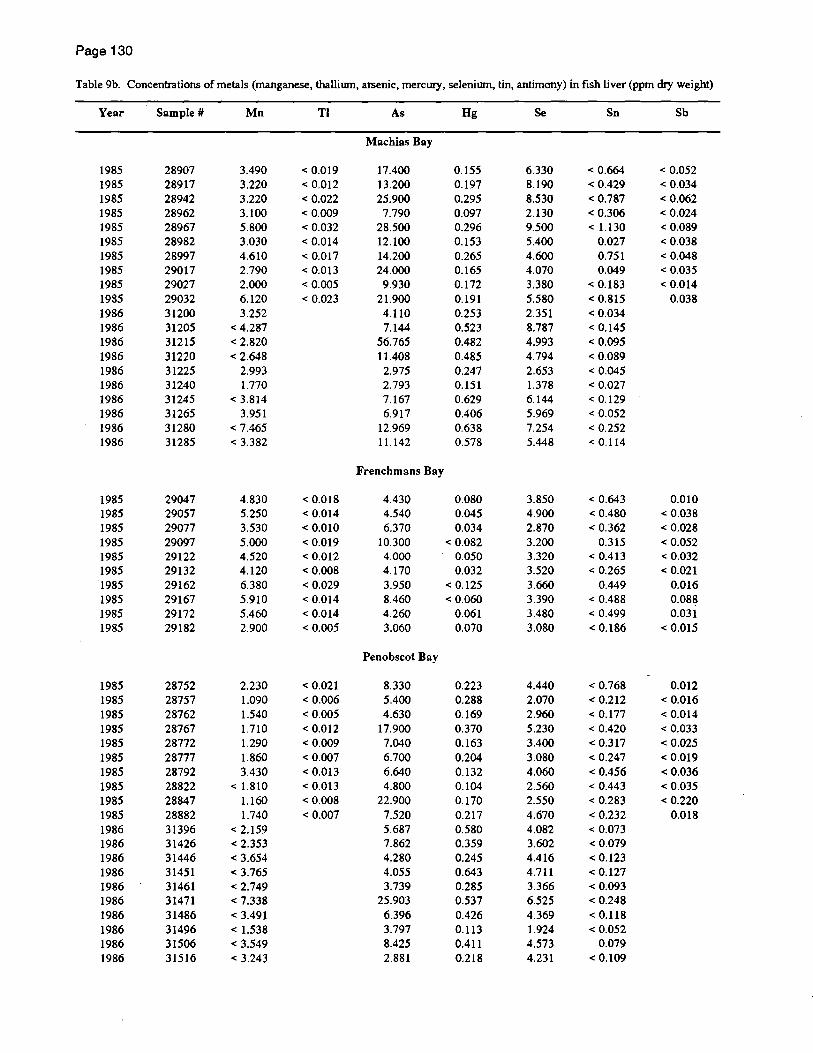
Page 130
Table 9b. Concentrations of metals (manganese, thallimn, arsenic, mereUI)', selenium, tin, antimony) in fish liver (ppm dry weight)
Year Sample # Mn TI As Hg Se Sn Sb
Machias Bay
1985 28907 3.490 < 0.019 17.400 0.155 6.330 < 0.664 < 0.052 1985 28917 3.220 < 0.012 13.200 0.197 8.190 < 0.429 < 0.034 1985 28942 3.220 < 0.022 25.900 0.295 8.530 < 0.787 < 0.062 1985 28962 3.100 < 0.009 7.790 0.097 2.130 < 0.306 < 0.024 1985 28967 5.800 < 0.032 28.500 0.296 9.500 < 1.130 < 0.089 1985 28982 3.030 < 0.014 12.100 0.153 5.400 0.027 < 0.038 1985 28997 4.610 < 0.017 14.200 0.265 4.600 0.751 < 0.048 1985 29017 2.790 < 0.013 24.000 0.165 4.070 0.049 < 0.035 1985 29027 2.000 < 0.005 9.930 0.172 3.380 < 0.183 < 0.014 1985 29032 6.120 < 0.023 21.900 0.191 5.580 < 0.815 0.038 1986 31200 3.252 4.110 0.253 2.351 < 0.034 1986 31205 < 4.287 7.144 0.523 8.787 < 0.145 1986 31215 < 2.820 56.765 0.482 4.993 < 0.095 1986 31220 < 2.648 11.408 0.485 4.794 < 0.089 1986 31225 2.993 2.975 0.247 2.653 < 0.045 1986 31240 1.770 2.793 0.151 1.378 < 0.027 1986 31245 < 3.814 7.167 0.629 6.144 < 0.129 1986 31265 3.951 6.917 0.406 5.969 < 0.052 1986 31280 < 7.465 12.969 0.638 7.254 < 0.252 1986 31285 < 3.382 11.142 0.578 5.448 < 0.114
Frenchmans Bay
1985 29047 4.830 < 0.018 4.430 0.080 3.850 < 0.643 0.010 1985 29057 5.250 < 0.014 4.540 0.045 4.900 < 0.480 < 0.038 1985 29077 3.530 < 0.010 6.370 0.034 2.870 < 0.362 < 0.028 1985 29097 5.000 < 0.019 10.300 < 0.082 3.200 0.315 < 0.052 1985 29122 4.520 < 0.012 4.000 0.050 3.320 < 0.413 < 0.032 1985 29132 4.120 < 0.008 4.170 0.032 3.520 < 0.265 < 0.021 1985 29162 6.380 < 0.029 3.950 < 0.125 3.660 0.449 0.016 1985 29167 5.910 < 0.014 8.460 < 0.060 3.390 < 0.488 0.088 1985 29172 5.460 < 0.014 4.260 0.061 3.480 < 0.499 0.031 1985 29182 2.900 < 0.005 3.060 0.070 3.080 < 0.186 < 0.QI5
Penobscot Bay
1985 28752 2.230 < 0.021 8.330 0.223 4.440 < 0.768 0.012 1985 28757 1.090 < 0.006 5.400 0.288 2.070 < 0.212 < 0.016 1985 28762 1.540 < 0.005 4.630 0.169 2.960 < 0.177 < 0.014 1985 28767 1.710 < 0.012 17.900 0.370 5.230 < 0.420 < 0.033 1985 28772 1.290 < 0.009 7.040 0.163 3.400 <0.317 < 0.025 1985 28777 1.860 < 0.007 6.700 0.204 3.080 < 0.247 < 0.019 1985 28792 3.430 < 0.013 6.640 0.132 4.060 < 0.456 < 0.036 1985 28822 < 1.810 < 0.013 4.800 0.104 2.560 < 0.443 < 0.035 1985 28847 1.160 < 0.008 22.900 0.170 2.550 < 0.283 < 0.220 1985 28882 1.740 < 0.007 7.520 0.217 4.670 < 0.232 0.018 1986 31396 < 2.159 5.687 0.580 4.082 < 0.073 1986 31426 < 2.353 7.862 0.359 3.602 < 0.079 1986 31446 < 3.654 4.280 0.245 4.416 < 0.123 1986 31451 < 3.765 4.055 0.643 4.711 < 0.127 1986 31461 < 2.749 3.739 0.285 3.366 < 0.093 1986 31471 < 7.338 25.903 0.537 6.525 < 0.248 1986 31486 < 3.491 6.396 0.426 4.369 < 0.118 1986 31496 < 1.538 3.797 0.113 1.924 < 0.052 1986 31506 < 3.549 8.425 0.411 4.573 0.079 1986 31516 < 3.243 2.881 0.218 4.231 < 0.109
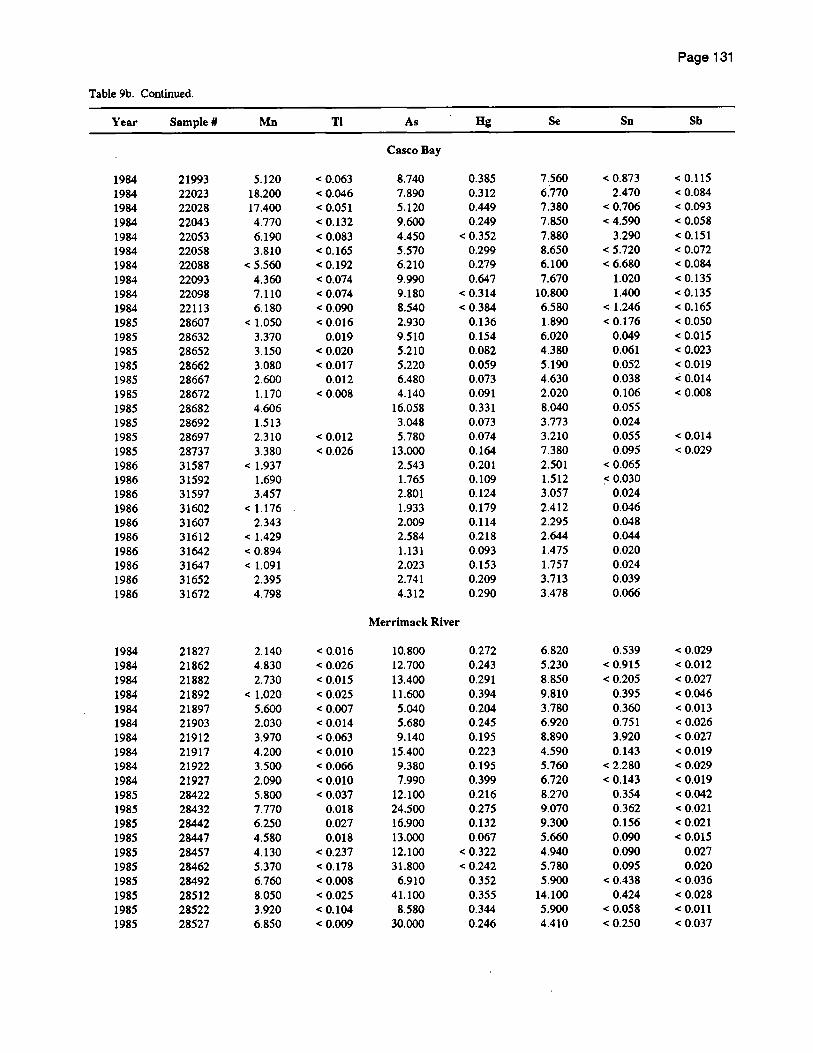
Page 131
Table 9b. Continued.
Year Sample II Mn TI As Hg Se Sn Sb
Casco Bay
1984 21993 5.120 < 0.063 8.740 0.385 7.560 < 0.873 < 0.115 1984 22023 18.200 < 0.046 7.890 0.312 6.770 2.470 < 0.084 1984 22028 17.400 < 0.051 5.120 0.449 7.380 < 0.706 < 0.093 1984 22043 4.770 < 0.132 9.600 0.249 7.850 < 4.590 < 0.058 1984 22053 6.190 < 0.083 4.450 < 0.352 7.880 3.290 < 0.151 1984 22058 3.810 < 0.165 5.570 0.299 8.650 < 5.720 < 0.072 1984 22088 < 5.560 < 0.192 6.210 0.279 6.100 < 6.680 < 0.084
1984 22093 4.360 < 0.074 9.990 0.647 7.670 1.020 < 0.135 1984 22098 7.110 < 0.074 9.180 < 0.314 10.800 1.400 < 0.135 1984 22113 6.180 < 0.090 8.540 < 0.384 6.580 < 1.246 < 0.165 1985 28607 < 1.050 < 0.016 2.930 0.136 1.890 < 0.176 < 0.050 1985 28632 3.370 0.019 9.510 0.154 6.020 0.049 < 0.Ql5 1985 28652 3.150 < 0.020 5.210 0.082 4.380 0.061 < 0.023 1985 28662 3.080 < 0.017 5.220 0.059 5.190 0.052 < 0.019 1985 28667 2.600 0.012 6.480 0.073 4.630 0.038 < 0.014 1985 28672 1.170 < 0.008 4.140 0.091 2.020 0.106 < 0.008 1985 28682 4.606 16.058 0.331 8.040 0.055 1985 28692 1.513 3.048 0.073 3.773 0.024 1985 28697 2.310 < 0.012 5.780 0.074 3.210 0.055 < 0.014 1985 28737 3.380 < 0.026 13.000 0.164 7.380 0.095 < 0.029 1986 31587 < 1.937 2.543 0.201 2.501 < 0.065 1986 31592 1.690 1.765 0.109 1.512 :c 0.030 1986 31597 3.457 2.801 0.124 3.057 0.024 1986 31602 < 1.176 1.933 0.179 2.412 0.046 1986 31607 2.343 2.009 0.114 2.295 0.048 1986 31612 < 1.429 2.584 0.218 2.644 0.044 1986 31642 < 0.894 1.131 0.093 1.475 0.020 1986 31647 < 1.091 2.023 0.153 1.757 0.024 1986 31652 2.395 2.741 0.209 3.713 0.039 1986 31672 4.798 4.312 0.290 3.478 0.066
Merrimack River
1984 21827 2.140 < 0.016 10.800 0.272 6.820 0.539 < 0.029 1984 21862 4.830 < 0.026 12.700 0.243 5.230 < 0.915 < 0.012 1984 21882 2.730 < 0.Ql5 13.400 0.291 8.850 < 0.205 < 0.027 1984 21892 < 1.020 < 0.025 11.600 0.394 9.810 0.395 < 0.046 1984 21897 5.600 < 0.007 5.040 0.204 3.780 0.360 < 0.013 1984 21903 2.030 < 0.014 5.680 0.245 6.920 0.751 < 0.026 1984 21912 3.970 < 0.063 9.140 0.195 8.890 3.920 < 0.027 1984 21917 4.200 < 0.010 15.400 0.223 4.590 0.143 < 0.019 1984 21922 3.500 < 0.066 9.380 0.195 5.760 < 2.280 < 0.029 1984 21927 2.090 < 0.010 7.990 0.399 6.720 < 0.143 < 0.019 1985 28422 5.800 < 0.037 12.100 0.216 8.270 0.354 < 0.042 1985 28432 7.770 0.018 24.500 0.275 9.070 0.362 < 0.021 1985 28442 6.250 0.027 16.900 0.132 9.300 0.156 < 0.021 1985 28447 4.580 0.018 13.000 0.067 5.660 0.090 < 0.015 1985 28457 4.130 < 0.237 12.100 < 0.322 4.940 0.090 0.027 1985 28462 5.370 < 0.178 31.800 < 0.242 5.780 0.095 0.020 1985 28492 6.760 < 0.008 6.910 0.352 5.900 < 0.438 < 0.036 1985 28512 8.050 < 0.025 41.100 0.355 14.100 0.424 < 0.028 1985 28522 3.920 < 0.104 8.580 0.344 5.900 < 0.058 < 0.011 1985 28527 6.850 < 0.009 30.000 0.246 4.410 < 0.250 < 0.037
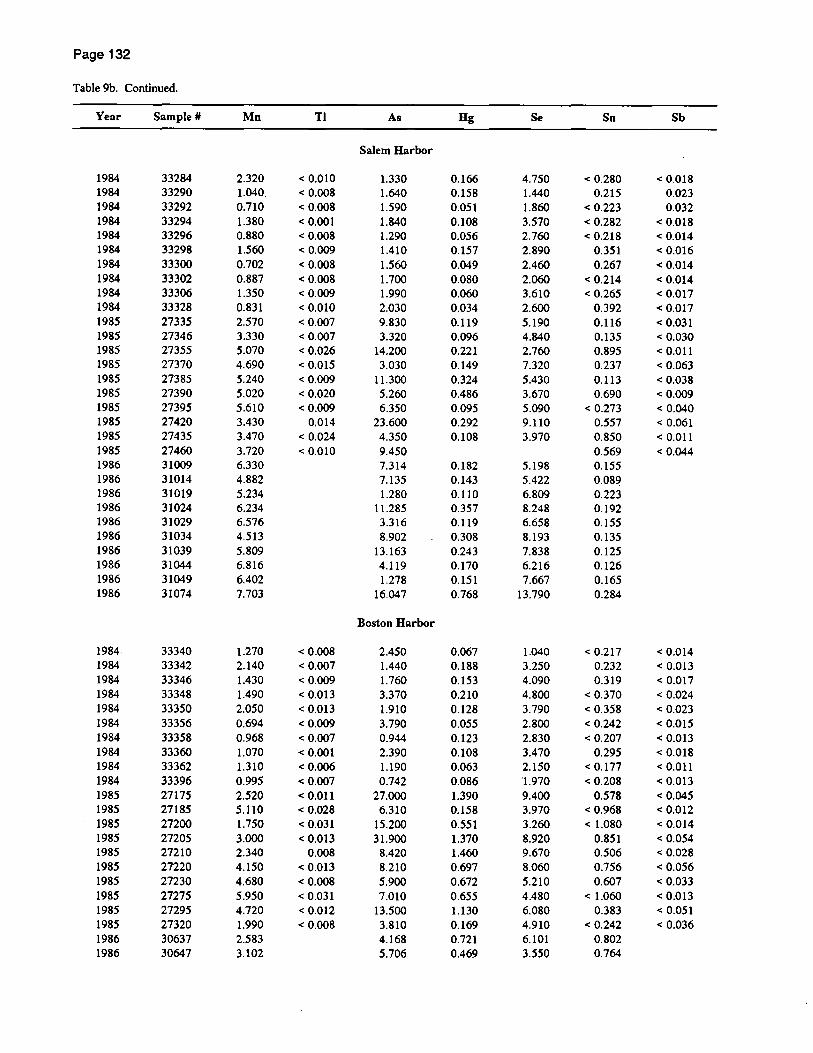
Page 132
Table 9b. Continued.
Year Sample #I Mn TI As Hg Se Sn Sb
Salem H9rbor
1984 33284 2.320 < 0.010 1.330 0.166 4.750 < 0.280 < 0.018 1984 33290 1.040. < 0.008 1.640 0.158 1.440 0.215 0.023 1984 33292 0.710 < 0.008 1.590 0.051 1.860 < 0.223 0.032 1984 33294 1.380 < 0.001 1.840 0.108 3.570 < 0.282 < 0.018 1984 33296 0.880 < 0.008 1.290 0.056 2.760 < 0.218 < 0.014 1984 33298 1.560 < 0.009 1.410 0.157 2.890 0.351 < 0.016 1984 33300 0.702 < 0.008 1.560 0.049 2.460 0.267 < 0.014 1984 33302 0.887 < 0.008 1.700 0.080 2.060 < 0.214 < 0.014 1984 33306 1.350 < 0.009 1.990 0.060 3.610 < 0.265 < 0.017 1984 33328 0.831 < 0.010 2.030 0.034 2.600 0.392 < 0.017 1985 27335 2.570 < 0.007 9.830 0.119 5.190 0.116 < 0.031 1985 27346 3.330 < 0.007 3.320 0.096 4.840 0.135 < 0.030 1985 27355 5.070 < 0.026 14.200 0.221 2.760 0.895 < O.Qll 1985 27370 4.690 < 0.015 3.030 0.149 7.320 0.237 < 0.063 1985 27385 5.240 < 0.009 11.300 0.324 5.430 0.113 . < 0.038 1985 27390 5.020 < 0.020 5.260 0.486 3.670 0.690 < 0.009 1985 27395 5.610 < 0.009 6.350 0.095 5.090 < 0.273 < 0.040 1985 27420 3.430 0.014 23.600 0.292 9.110 0.557 < 0.061 1985 27435 3.470 < 0.024 4.350 0.108 3.970 0.850 < 0.011 1985 27460 3.720 < 0.010 9.450 0.569 < 0.044 1986 31009 6.330 7.314 0.182 5.198 0.155 1986 31014 4.882 7.135 0.143 5.422 0.089 1986 31019 5.234 1.280 0.110 6.809 0.223 1986 31024 6.234 11.285 0.357 8.248 0.192 1986 31029 6.576 3.316 0.119 6.658 0.155 1986 31034 4.513 8.902 0.308 8.193 0.135 1986 31039 5.809 13.163 0.243 7.838 0.125 1986 31044 6.816 4.119 0.170 6.216 0.126 1986 31049 6.402 1.278 0.151 7.667 0.165 1986 31074 7.703 16.047 0.768 13.790 0.284
Boston Harbor
1984 33340 1.270 < 0.008 2.450 0.067 1.040 < 0.217 < 0.014 1984 33342 2.140 < 0.007 1.440 0.188 3.250 0.232 < 0.013 1984 33346 1.430 < 0.009 1.760 0.153 4.090 0.319 < 0.017 1984 33348 1.490 < 0.013 3.370 0.210 4.800 < 0.370 < 0.024 1984 33350 2.050 < 0.013 1.910 0.128 3.790 < 0.358 < 0.023 1984 33356 0.694 < 0.009 3.790 0.055 2.800 < 0.242 < 0.015 1984 33358 0.968 < 0.007 0.944 0.123 2.830 < 0.207 < 0.013 1984 33360 1.070 < 0.001 2.390 0.108 3.470 0.295 < 0.018 1984 33362 1.310 < 0.006 1.190 0.063 2.150 < 0.177 < 0.011 1984 33396 0.995 < 0.007 0.742 0.086 1.970 < 0.208 < 0.013 1985 27175 2.520 < 0.011 27.000 1.390 9.400 0.578 < 0.045 1985 27185 5.110 < 0.028 6.310 0.158 3.970 < 0.968 < 0.012 1985 27200 1.750 < 0.031 15.200 0.551 3.260 < 1.080 < 0.014 1985 27205 3.000 < 0.013 31.900 1.370 8.920 0.851 < 0.054 1985 27210 2.340 0.008 8.420 1.460 9.670 0.506 < 0.028 1985 27220 4.150 < 0.013 8.210 0.697 8.060 0.756 < 0.056 1985 27230 4.680 < 0.008 5.900 0.672 5.210 0.607 < 0.033 1985 27275 5.950 < 0.031 7.010 0.655 4.480 < 1.060 < 0.013 1985 27295 4.720 < 0.012 13.500 1.130 6.080 0.383 < 0.051 1985 27320 1.990 < 0.008 3.810 0.169 4.910 < 0.242 < 0.036 1986 30637 2.583 4.168 0.721 6.101 0.802 1986 30647 3.102 5.706 0.469 3.550 0.764

Page 133
Table 9b. Continued.
Ye~r Sample II Mn TI As Hg Se Sn Sb
Boston Harbor
1986 30657 4.386 9.761 0.899 5.426 1.028 1986 30682 3.399 3.146 0.521 5.364 0.837 1986 30687 4.958 3.336 0.413 5.031 0.935 1986 30692 5.387 4.476 0.453 7.539 1.058 1986 30707 4.419 1.579 0.536 5.682 0.881 1986 30712 5.048 2.911 0.990 7.477 1.450 1986 30722 6.454 4.906 1.099 8.861 0.823 1986 30762 4.667 1.860 0.455 5.744 0.361
Quincy Bay
1986 30823 3.238 7.232 0.828 5.402 0.116 1986 30828 5.960 13.419 1.116 4.330 0.261 1986 30833 2.566 3.126 0.169 3.572 0.083 1986 30838 4.606 5.545 0.705 6.221 0.192 1986 30843 3.705 6.316 0.928 6.682 0.171 1986 30848 4.294 23.125 1.052 7.415 0.221 1986 30878 6.405 11.249 1.144 8.421 0.270 1986 30928 2.872 21.602 0.341 3.776 0.071 1986 30938 6.443 30.910 0.804 9.100 0.234 1986 30958 8.760 9.472 0.684 3.666 0.235
Buzzards Bay
1984 20642 6.070 < 0.023 12.200 0.085 1.740 < 0.797 < 0.010 1984 20651 5.590 < 0.015 18.100 0.062 3.230 0.130 < 0.012 1984 20666 7.050 < 0.024 9.260 0.192 2.970 < 0.843 < 0.011 1984 20676 3.190 < 0.015 37.400 0.306 4.530 0.237 0.058 1984 20681 6.810 < 0.022 22.900 0.047 2.980 < 0.754 < 0.009 1984 20706 4.140 < 0.055 11.800 0.478 7.680 0.800 0.051 1984 20711 2.660 < 0.025 49.000 0.233 5.430 0.276 0.046 1984 20726 6.000 < 0.016 13.600 0.098 3.520 < 0.127 < 0.013 1984 20737 3.450 < 0.037 15.400 0.383 6.310 0.475 < 0.029 1984 20767 3.180 < 0.025 14.800 0.186 6.190 0.433 < 0.020 1985 26950 4.200 < 0.010 46.100 0.244 3.720 < 0.422 < 0.041 1985 26955 4.220 < 0.169 87.300 < 0.230 3.440 < 0.094 < 0.017 1985 26965 5.590 < 0.006 10.100 0.190 4.180 < 0.251 < 0.025 1985 26975 5.910 < 0.007 26.600 0.181 7.650 < 0.308 < 0.030 1985 27005 4.630 < 0.016 20.500 0.225 8.720 < 0.670 < 0.065 1985 27010 1.940 < 0.009 17.600 0.081 6.200 < 0.362 < 0.035 1985 27015 4.650 < 0.005 15.400 0.101 4.540 < 0.225 < 0.022 1985 27040 5.730 < 0.185 20.100 < 0.252 4.740 0.098 < 0.019 1985 27045 < 3.610 < 0.023 6.270 0.184 5.650 < 0.943 < 0.092 1985 27070 5.090 < 0.131 18.400 < 0.171 3.490 0.060 < 0.014 1986 30416 < 5.326 48.734 0.352 8.182 0.105 1986 30431 < 8.704 37.731 0.381 7.736 0.132 1986 30436 < 9.307 85.164 0.538 9.690 0.205 1986 30446 5.440 141.497 0.358 4.049 0.365 1986 30461 3.855 71.878 0.520 5.455 < 0.027 1986 30476 4.911 96.122 1.130 9.195 0.246 1986 30481 3.382 8.632 0.127 5.457 < 0.053 1986 30491 < 8.468 78.509 0.205 6.882 0.109 1986 30511 4.440 16.912 0.200 4.382 0.090 1986 30516 4.349 90.819 0.225 4.325 0.102 1986 30521 4.994 23.933 0.214 4.612 0.110

Page 134
Table 9b. Continued.
Year Sample ## Mn TI As Hg Se Sn Sb
Buzzards Bay
1986 30526 4.588 24.998 0.163 4.641 0.121 1986 30531 5.176 41.985 0.117 4.694 0.121 1986 30536 6.249 39.511 0.158 5.596 0.095
Narragansett Bay
1984 22203 3.260 < 0.032 5.840 0.322 0.394 0.440 < 0.058 1984 22208 4.220 < 0.046 25.400 0.209 2.800 < 1.610 < 0.020 1984 22218 4.810 < 0.035 8.820 0.295 2.680 < 1.230 < 0.016 1984 22233 4.840 < 0.031 16.800 0.136 2.280 < 1.070 < 0.014 1984 22248 3.600 < 0.036 16.700 0.342 5.530 1.030 < 0.066 1984 22253 3.660 < 0.031 ·76.500 0.197 3.230 < 0.863 < 0.055 1984 22273 7.520 < 0.036 33.900 0.504 3.260 1.170 < 0.065 1984 22278 6.200 < 0.035 34.800 0.425 2.930 2.830 < 0.064 1984 22288 4.270 < 0.043 9.420 0.342 5.490 < 1.220 < 0.078 1984 22293 5.750 < 0.028 57.800 0.241 5.810 < 0.785 < 0.050 1984 22298 3.710 < 0.403 20.100 0.297 5.520 < 1.170 < 0.075 1984 22308 4.920 < 0.063 7.060 0.314 7.460 < 1.790 < 0.114 1984 22313 4.710 < 0.035 22.200 0.251 7.960 < 0.986 < 0.063 1985 26260 8.930 < 0.040 27.200 0.232 11.300 < 1.660 < 0.162 1985 26300 5.320 < 0.024 87.500 0.166 8.990 < 0.990 < 0.096 1985 26325 3.910 < 0.018 13.000 0.122 7.550 < 0.728 < 0.071 1985 26330 9.810 < 0.006 11.100 0.175 1.890 0.843 < 0.024 1985 26335 6.680 < 0.024 61.500 0.217 8.050 < 0.968 < 0.094 1985 26360 4.700 < 0.199 13.600 < 0.271 3.940 0.076 0.031 1985 26385 5.730 < 0.208 9.420 < 0.283 3.580 0.158 < 0.022 1985 26390 7.440 < 0.142 57.000 < 0.193 2.660 0.130 0.018 1985 26395 7.940 < 0.008 15.300 0.132 5.690 0.198 < 0.031 1985 26405 7.460 < 0.026 11.800 0.212 6.760 0.283 < 0.105 1986 30209 6.003 37.773 0.277 9.434 0.862 1986 30214 5.631 8.356 0.122 11.340 0.626 1986 30219 6.628 31.781 0.223 11.069 0.693 1986 30224 < 10.952 52.058 < 0.411 11.045 0.307 1986 30229 5.274 7.926 0.252 4.892 0.805 1986 30239 2.429 5.448 0.064 2.481 0.267 1986 30249 < 13.502 11.133 0.308 9.187 0.520 1986 30264 < 14.711 28.542 < 0.552 8.401 0.721 1986 30279 7.848 9.562 0.101 3.705 0.377 1986 30314 < 6.798 16.980 0.155 5.369 0.404
Eastern Long Island Sound
1984 20828 6.180 < 0.132 < 9.490 0.450 7.780 < 1.040 < 0.102 1984 20843 8.940 < 0.191 < 13.700 0.525 8.090 2.610 < 0.147 1984 20864 7.960 < 0.176 < 12.600 0.426 9.280 1.500 < 0.136 1984 20874 4.080 < 0.165 16.100 0.672 7.510 1.410 < 0.127 1984 20884 8.420 < 0.182 40.400 0.211 9.560 < 0.080 1984 20889 5.040 < 0.129 9.950 0.197 7.330 2.650 < 0.057 1984 20894 8.040 < 0.151 15.100 0.284 11.800 < 5.230 < 0.066 1984 20898 6.290 < 0.150 < 10.700 0.460 7.260 < 1.180 < 0.115 1984 20943 4.760 < 0.090 26.200 0.542 7.680 1.150 < 0.069 1984 20964 5.560 < 0.278 < 20.000 0.398 11.500 < 2.190 < 0.215 1985 26645 6.020 < 0.015 13.800 0.304 7.030 < 0.604 < 0.059 1985 26690 < 4.070 < 0.026 374.000 0.208 9.370 < 1.060 < 0.103 1985 26700 < 3.310 < 0.021 26.200 0.169 14.800 < 0.864 < 0.084

Page 135
Table 9b. Continued.
Year Sample #I Mn TI As Hg Se Sn Sb
Eastern Long Island Sound
1985 26715 4.770 < 0.022 5.480 0.124 13.400 < 0.890 < 0.087 1985 26720 5.450 < 0.396 17.800 < 0.537 4.280 < 0.219 < 0.041 1985 26725 4.830 < 0.227 15.600 < 0.308 4.960 < 0.125 < 0.023 1985 26740 < 3.880 < 0.025 2.460 0.085 6.070 < 1.010 < 0.099 1985 26760 4.210 < 0.Q15 74.500 0.205 8.570 < 0.610 < 0.059 1985 26765 4.700 < 0.397 14.400 < 0.540 10.800 0.211 < 0.041 1985 26780 2.940 < 0.007 7.760 0.066 4.290 < 0.295 < 0.029 1986 30008 8.230 10.006 0.328 3.964 0.537 1986 30013 < 26.479 16.966 0.419 10.153 0.522 1986 30018 6.653 14.585 0.241 5.387 0.311 1986 30028 < 24.103 40.057 0.247 9.977 0.475 1986 30033 3.106 1.166 0.039 3.283 0.141 1986 30038 < 18.252 18.822 0.442 16.223 0.526 1986 30048 < 10.930 5.143 0.173 6.384 0.191 1986 30058 4.736 4.439 0.326 6.928 0.415 1986 30063 2.076 1.979 0.048 2.371 0.078 1986 30073 2.551 2.018 0.171 4.072 0.394 1986 30098 4.655 1.864 0.086 3.913 0.100 1986 30108 2.587 2.691 0.064 3.609 < 0.119 1986 30118 6.765 15.757 0.103 5.402 0.163 1986 30148 7.191 3.102 0.063 3.949 0.178
Western Long Island Sound
1984 21383 8.180 < 0.294 < 21.100 0.613 11.800 3.260 < 0.227 1984 21388 8.390 < 0.105 < 7.540 0.427 4.880 0.984 < 0.081 1984 21393 2.510 < 0.049 4.040 0.134 4.370 0.414 < 0.038 1984 21404 9.420 < 0.159 17.000 0.436 6.390 1.350 < 0.122 1984 21414 5.320 < 0.097 < 6.980 0.331 6.330 0.828 < 0.075 1984 21419 4.300 < 0.065 < 4.700 0.266 7.510 0.727 < 0.051 1984 21428 4.700 < 0.169 < 12.100 0.464 9.410 3.030 < 0.130 1984 21453 6.850 < 0.069 5.470 0.144 7.340 < 2.380 < 0.030 1984 21468 9.190 < 0.078 5.880 0.090 6.220 < 2.690 < 0.034 1984 21509 < 5.880 < 0.204 4.950 0.148 8.220 < 7.070 < 0.090 1985 26515 9.100 < 0.041 60.200 0.284 10.600 < 1.690 < 0.165 1985 26535 < 4.100 < 0.026 13.500 0.299 6.680 0.773 < 0.104 1985 _ 26540 < 11.700 < 0.074 102.000 0.595 10.400 < 3.040 < 0.296 1985 26555 7.610 < 0.784 125.000 < 1.070 9.320 < 0.434 < 0.081 1985 26590 3.960 < 0.014 39.300 0.321 8.650 0.221 < 0.056 1985 26595 7.110 < 0.483 34.000 < 0.656 5.480 < 0.267 < 0.050 1985 26600 < 9.650 < 0.061 8.620 0.493 10.600 < 2.520 < 0.245 1985 26605 5.560 < 0.006 103.000 0.131 3.770 0.155 < 0.023 1985 26610 10.700 < 0.351 182.000 < 0.477 6.390 0.160 < 0.036 1985 26625 7.330 < 0.033 40.700 0.191 6.790 0.695 < 0.133 1986 29827 5.343 2.917 0.273 7.042 0.986 1986 29837 11.707 6.974 0.312 6.004 1.490 1986 29842 8.285 50.413 0.195 6.963 0.440 1986 29847 7.092 2.538 0.145 4.412 0.436 1986 29852 7.273 5.556 0.565 6.553 1.105 1986 29857 5.536 4.298 0.086 4.871 0.440 1986 29867 < 12.703 37.898 0.343 18.064 0.453 1986 29886 6.540 19.433 0.254 5.892 0.459 1986 29891 5.896 3.942 0.235 5.042 1.061 J986 29901 < 16.207 3.278 0.257 4.033 0.541 1986 29931 2.929 1.437 0.095 4.490 0.411
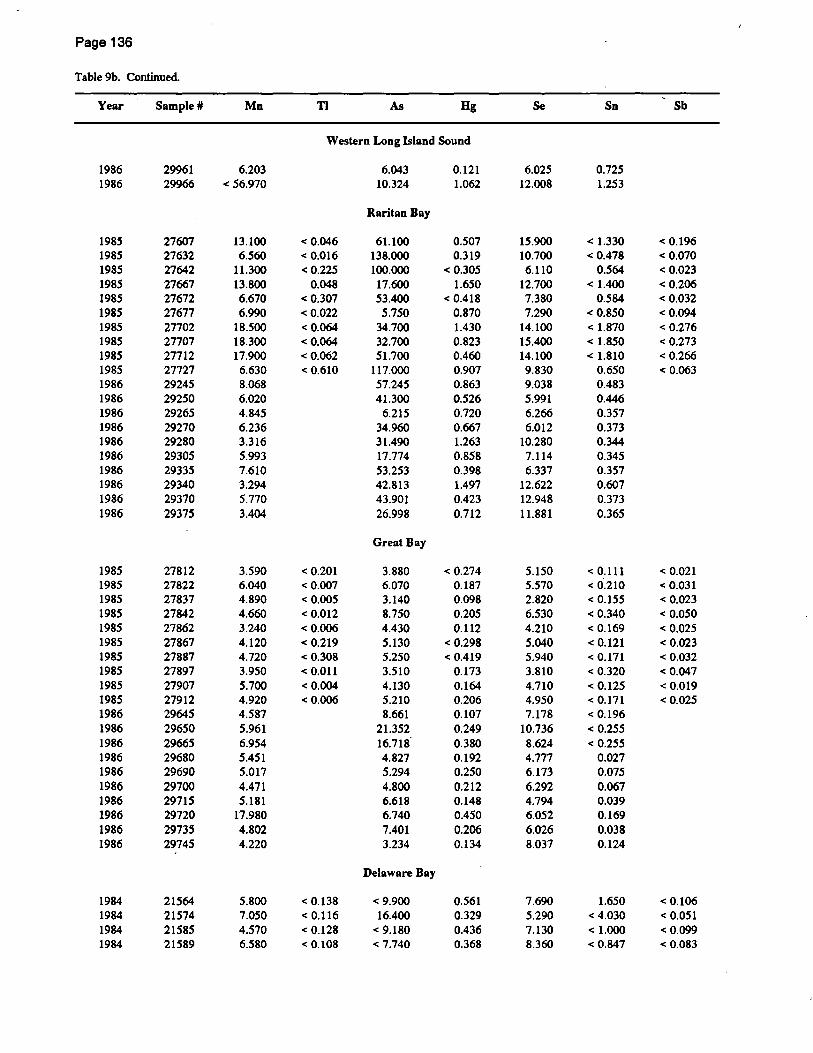
Page 136
Table 9b. Continued.
Year Sample. Mn TI As Hg Se Sn Sb
Western Long Island Sound
1986 29961 6.203 6.043 0.121 6.025 0.125 1986 29966 < 56.970 10.324 1.062 12.008 1.253
Raritan Bay
1985 27607 13.100 < 0.046 61.100 0.507 15.900 < 1.330 < 0.196 1985 27632 6.560 < 0.016 138.000 0.319 10.700 < 0.478 < 0.070 1985 27642 11.300 < 0.225 100.000 < 0.305 6.110 0.564 < 0.023 1985 27667 13.800 0.048 17.600 1.650 12.700 < 1.400 < 0.206 1985 27612 6.670 < 0.307 53.400 < 0.418 7.380 0.584 < 0.032 1985 27677 6.990 < 0.022 5.750 0.870 7.290 < 0.850 < 0.094 1985 27702 18.500 < 0.064 34.700 1.430 14.100 < 1.870 < 0.276 1985 27707 18.300 < 0.064 32.700 0.823 15.400 < 1.850 < 0.273 1985 27712 17.900 < 0.062 51.700 0.460 14.100 < 1.810 < 0.266 1985 27127 6.630 < 0.610 117.000 0.907 9.830 0.650 < 0.063 1986 29245 8.068 57.245 0.863 9.038 0.483 1986 29250 6.020 41.300 0.526 5.991 0.446 1986 29265 4.845 6.215 0.120 6.266 0.357 1986 29270 6.236 34.960 0.667 6.012 0.373 1986 29280 3.316 31.490 1.263 10.280 0.344 1986 29305 5.993 17.774 0.858 7.114 0.345 1986 29335 7.610 53.253 0.398 6.337 0.357 1986 29340 3.294 42.813 1.497 12.622 0.607 1986 29370 5.770 43.901 0.423 12.948 0.373 1986 29375 3.404 26.998 0.712 11.881 0.365
Great Bay
1985 27812 3.590 < 0.201 3.880 < 0.274 5.150 < 0.111 < 0.021 1985 27822 6.040 < 0.007 6.070 0.187 5.570 < 0.210 < 0.031 1985 27837 4.890 < 0.005 3.140 0.098 2.820 < 0.155 < 0.023 1985 27842 4.660 < 0.012 8.750 0.205 6.530 < 0.340 < 0.050 1985 27862 3.240 < 0.006 4.430 0.112 4.210 < 0.169 < 0.025 1985 27867 4.120 < 0.219 5.130 < 0.298 5.040 < 0.121 < 0.023 1985 27887 4.120 < 0.308 5.250 < 0.419 5.940 < 0.171 < 0.032 1985 27897 3.950 < 0.011 3.510 0.173 3.810 < 0.320 < 0.047 1985 27907 5.700 < 0.004 4.130 0.164 4.710 < 0.125 < 0.019 1985 27912 4.920 < 0.006 5.210 0.206 4.950 < 0.171 < 0.025 1986 29645 4.587 8.661 0.107 7.178 < 0.196 1986 29650 5.961 21.352 0.249 10.736 < 0.255 1986 29665 6.954 16.718 0.380 8.624 < 0.255 1986 29680 5.451 4.827 0.192 4.777 0.027 1986 29690 5.017 5.294 0.250 6.173 0.075 1986 29700 4.471 4.800 0.212 6.292 0.067 1986 29715 5.181 6.618 0.148 4.794 0.039 1986 29120 17.980 6.740 0.450 6.052 0.169 1986 29735 4.802 7.401 0.206 6.026 0.Q38 1986 29745 4.220 3.234 0.134 8.037 0.124
Delaware Bay
1984 21564 5.800 < 0.138 < 9.900 0.561 7.690 1.650 < 0.106 1984 21574 7.050 < 0.116 16.400 0.329 5.290 < 4.030 < 0.051 1984 21585 4.570 < 0.128 < 9.180 0.436 7.130 <1.000 < 0.099 1984 21589 6.580 < 0.108 < 7.740 0.368 8.360 < 0.847 < 0.083
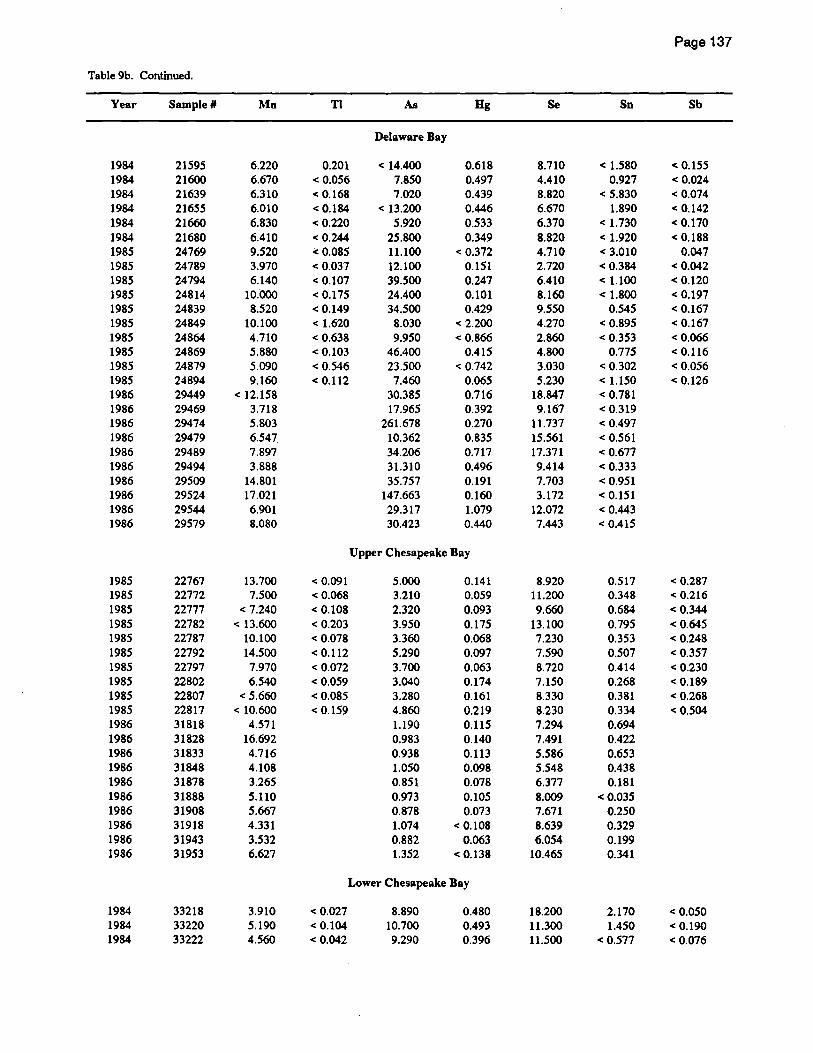
Page 137
Table 9b. Continued.
Year Sample * Mn TI As Hg Se SD Sb
Delaware Bay
1984 21595 6.220 0.201 < 14.400 0.618 8.710 < 1.580 < 0.155 1984 21600 6.670 < 0.056 7.850 0.497 4.410 0.927 < 0.024 1984 21639 6.310 < 0.168 7.020 0.439 8.820 < 5.830 < 0.074 1984 21655 6.010 < 0.184 < 13.200 0.446 6.670 1.890 < 0.142 1984 21660 6.830 < 0.220 5.920 0.533 6.370 < 1.730 < 0.170 1984 21680 6.410 < 0.244 25.800 0.349 8.820 < 1.920 < 0.188 1985 24769 9.520 < 0.085 11.100 < 0.372 4.710 < 3.010 0.047 1985 24789 3.970 < 0.037 12.100 0.151 2.720 < 0.384 < 0.042 1985 24794 6.140 < 0.107 39.500 0.247 6.410 <1.100 < 0.120 1985 24814 10.000 < 0.175 24.400 0.101 8.160 < 1.800 < 0.197 1985 24839 8.520 < 0.149 34.500 0.429 9.550 0.545 < 0.167 1985 24849 10.100 < 1.620 8.030 < 2.200 4.270 < 0.895 < 0.167 1985 24864 4.710 < 0.638 9.950 < 0.866 2.860 < 0.353 < 0.066 1985 24869 5.880 < 0.103 46.400 0.415 4.800 0.775 < 0.116 1985 24879 5.090 < 0.546 23.500 < 0.742 3.030 < 0.302 < 0.056 1985 24894 9.160 < 0.112 7.460 0.065 5.230 < 1.150 < 0.126 1986 29449 < 12.158 30.385 0.716 18.847 < 0.781 1986 29469 3.718 17.965 0.392 9.167 < 0.319 1986 29474 5.803 261.678 0.270 11.737 < 0.497 1986 29479 6.547 10.362 0.835 15.561 < 0.561 1986 29489 7.897 34.206 0.717 17.371 < 0.677 1986 29494 3.888 31.310 0.496 9.414 < 0.333 1986 29509 14.801 35.757 0.191 7.703 < 0.951 1986 29524 17.021 147.663 0.160 3.172 < 0.151 1986 29544 6.901 29.317 1.079 12.072 < 0.443 1986 29579 8.080 30.423 0.440 7.443 < 0.415
Upper Chesapeake Bay
1985 22767 13.700 < 0.091 5.000 0.141 8.920 0.517 < 0.287 1985 22772 7.500 < 0.068 3.210 0.059 11.200 0.348 < 0.216 1985 22777 < 7.240 < 0.108 2.320 0.093 9.660 0.684 < 0.344 1985 22782 < 13.600 < 0.203 3.950 0.175 13.100 0.795 < 0.645 1985 22787 10.100 < 0.078 3.360 0.068 7.230 0.353 < 0.248 1985 22792 14.500 < 0.112 5.290 0.097 7.590 0.507 < 0.357 1985 22797 7.970 < 0.072 3.700 0.063 8.720 0.414 < 0.230 1985 22802 6.540 < 0.059 3.040 0.174 7.150 0.268 < 0.189 1985 22807 < 5.660 < 0.085 3.280 0.161 8.330 0.381 < 0.268 1985 22817 < 10.600 < 0.159 4.860 0.219 8.230 0.334 < 0.504 1986 31818 4.571 1.190 0.115 7.294 0.694 1986 31828 16.692 0.983 0.140 7.491 0.422 1986 31833 4.716 0.938 0.113 5.586 0.653 1986 31848 4.108 1.050 0.098 5.548 0.438 1986 31878 3.265 0.851 0.078 6.377 0.181 1986 31888 5.110 0.973 0.105 8.009 < 0.035 1986 31908 5.667 0.878 0.073 7.671 0.250 1986 31918 4.331 1.074 < 0.108 8.639 0.329 1986 31943 3.532 0.882 0.063 6.054 0.199 1986 31953 6.627 1.352 < 0.138 10.465 0.341
Lower Chesapeake Bay
1984 33218 3.910 < 0.027 8.890 0.480 18.200 2.170 < 0.050 1984 33220 5.190 < 0.104 10.700 0.493 11.300 1.450 < 0.190 1984 33222 4.560 < 0.042 9.290 0.396 11.500 < 0.577 < 0.076

Page 138
Table 9b. Continued.
Year Sample * Mn Tl As Hg Se Sn Sb
Lower Chesapeake Bay
1984 33238 4.640 < 0.034 13.600 0.618 15.900 0.937 < 0.062 1984 33248 5.260 < 0.085 7.540 < 1.110 12.600 2.630 < 0.154 1984 33252 4.340 < 0.031 8.240 0.570 12.000 < 0.428 < 0.057 1984 33256 4.710 < 0.031 10.400 0.397 13.600 1.170 < 0.056 1984 33258 2.810 < 0.022 6.920 0.366 11.300 < 0.304 < 0.040 1984 33260 3.700 < 0.050 7.800 0.652 15.900 . < 0.684 < 0.090 1984 33266 5.430 < 0.032 11.000 0.584 16.700 < 0.438 < 0.058 1985 22438 3.450 < 0.026 9.460 0.183 10.300 0.301 < 0.030 1985 22468 3.460 < 0.026 8.720 0.244 12.900 0.798 0.030 1985 22473 3.230 < 0.021 7.760 0.192 8.480 0.761 < 0.023 1985 22478 3.450 < 0.033 8.490 0.281 9.850 0.854 < 0.036 1985 22498 3.380 < 0.022 8.130 0.239 7.930 1.110 < 0.024 1985 22503 2.630 < 0.032 8.250 0.278 10.000 0.866 < 0.036 1985 22508 2.460 < 0.030 9.020 0.277 9.630 0.848 < 0.034 1985 22517 2.330 <-0.029 9.940 0.181 9.140 1.170 < 0.032 1985 22538 2.860 < 0.027 10.300 0.187 9.350 1.320 < 0.030 1985 22568 2.690 < 0.033 7.000 0.171 10.600 1.400 < 0.037 1986 32064 l.936 6.972 0.191 7.963 0.092 1986 32069 2.645 1.871 0.111 7.035 0.063 1986 32109 2.794 7.071 0.285 10.450 0.155 1986 32114 3.884 7.221 0.331 8.958 0.115 1986 32129 4.306 7.505 < 0.134 6.979 0.051 1986 32134 4.667 3.013 0.140 6.400 0.074 1986 32159 3.150 5.449 0.160 8.115 0.062 1986 32164 4.773 2.514 < 0.149 8.182 0.113 1986 32179 3.351 9.518 0.261 7.520 0.106 1986 32194 5.402 2.720 0.243 8.082 0.128
Elizabeth River
1986 32352 < 64.328 < 9.507 < 4.624 14.816 2.643 1986 32372 8.869 2.267 < 0.552 14.374 0.736 1986 32377 22.855 < 2.925 < 1.423 2l.655 l.084 1986 32382 10.365 2.195 < 0.430 11.198 0.738 1986 32387 7.923 2.762 0.308 9.054 0.626 1986 32392 8.914 2.440 0.187 12.038 0.634 1986 32402 10.666 2.384 < 0.190 7.788 0.506 1986 32406 22.009 < 2.817 < 1.370 11.524 1.305 1986 32436 14.565 2.031 < 0.363 17.431 0.553 1986 32442 13.108 2.098 < 0.544 19.065 0.829
-/:( u. S. GOVERNMENT PRINTING OFFICE: 1992--500-031--'+0003
Related Documents