FINAL REPORT to Mr. Richard Greene Delaware Department of Natural Resources and Environmental Control Division of Water Resources Watershed Assessment Branch 820 Silver Lake Blvd., Suite 220 Dover, DE 19904-2464 Contaminant Sediment Profiles of the St. Jones River Marsh, Delaware: A Historical Analysis PCER Report No. 07-05 By Drs. David Velinsky, Don Charles and Jeffrey Ashley 1 Patrick Center for Environmental Research The Academy of Natural Sciences Philadelphia, PA 19103 1 Philadelphia University, Philadelphia, PA May 2007 (FINAL)

Welcome message from author
This document is posted to help you gain knowledge. Please leave a comment to let me know what you think about it! Share it to your friends and learn new things together.
Transcript

FINAL REPORT
to
Mr. Richard Greene Delaware Department of Natural Resources and Environmental Control
Division of Water Resources Watershed Assessment Branch
820 Silver Lake Blvd., Suite 220 Dover, DE 19904-2464
Contaminant Sediment Profiles of the St. Jones River Marsh, Delaware: A Historical Analysis
PCER Report No. 07-05
By Drs. David Velinsky, Don Charles and Jeffrey Ashley1
Patrick Center for Environmental Research The Academy of Natural Sciences
Philadelphia, PA 19103
1Philadelphia University, Philadelphia, PA
May 2007 (FINAL)

2
TABLE OF CONTENTS Page List of Tables 3 List of Figures 4 Executive Summary 6 A Introduction 8 A1 Background 8 A2 Objectives of Study 9 A3 Study Area 9 B Field and Laboratory Methods 11 B1 Field Sampling and Methods 11 B2 Laboratory Analysis and Methods 11 B2.1. Total Carbon and Nitrogen 12 B2.2. Total Phosphorus 12 B2.3. Stable Isotopes of Carbon and Nitrogen 12 B2.4. Diatoms 12 B2.5. Sediment Organic Analyses 13 C Results and Discussion 13 C1. Sediment Carbon, Nitrogen and Phosphorus 13 C2. Stable Isotopes of Carbon and Nitrogen 13 C3. Diatom Analysis 14 C4. Polycyclic Aromatic Hydrocarbons 14 C5. Polychlorinated Biphenyls 16 C6. DDT and Chlordane 17 C7. Historical Analysis of Chemical Contaminants and Diatoms 18 D Summary and Conclusions 22 E Acknowledgements 24
3
TABLE OF CONTENTS (cont)
Page F References 46 G Appendices 52 Appendix I: Data Tables Compositional data for PAHs G-I Appendix II: Data Tables Compositional data for PCBs and OCPs G-II Appendix III: Diatom taxa list G-III

4
LIST OF TABLES Table 1: Summary data for St. Jones Estuary core WC-1…….…… ...........................................25 Table 2: Summary data for St. Jones Estuary core WC-2 .............................................................26 Table 3: Summary data for St. Jones Estuary core LH-2 ..............................................................27 Table 4: Summary data for diatom metrics in the St Jones Estuary ..............................................28 Table 5: List of PAH compounds for analysis...............................................................................29 Table 6: Selected sediment contaminant data from previous study...............................................30
5
LIST OF FIGURES
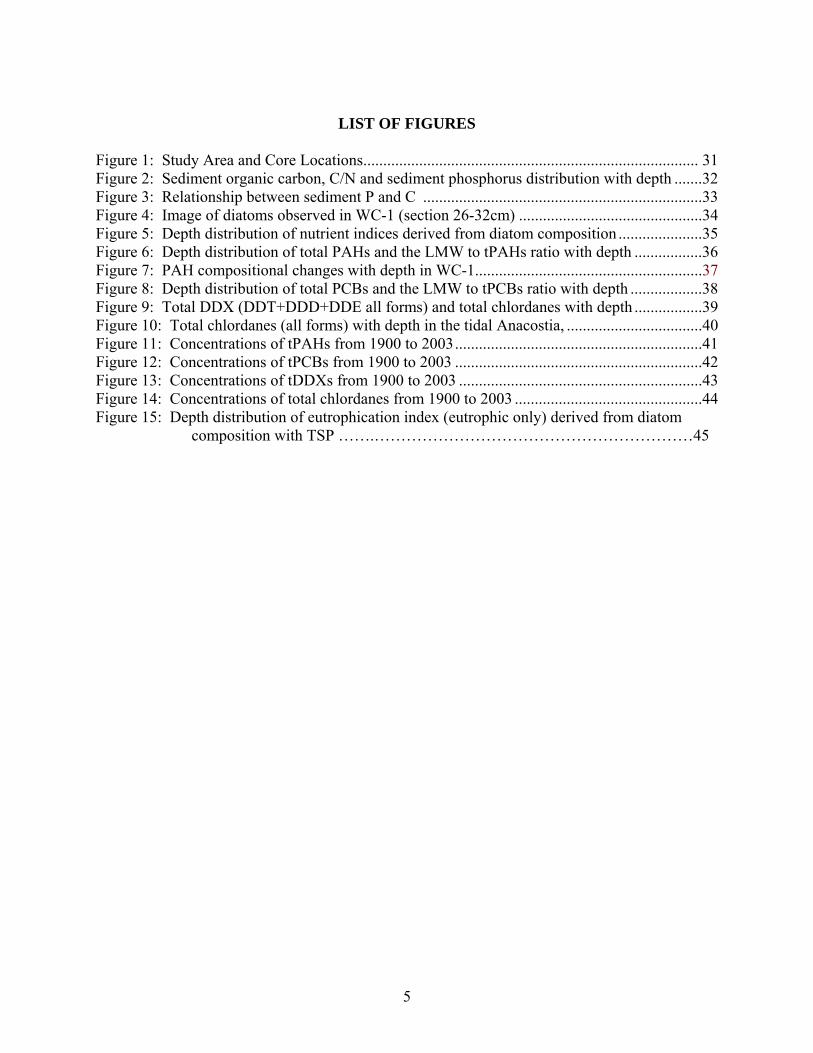
Figure 1: Study Area and Core Locations.................................................................................... 31 Figure 2: Sediment organic carbon, C/N and sediment phosphorus distribution with depth .......32 Figure 3: Relationship between sediment P and C ......................................................................33 Figure 4: Image of diatoms observed in WC-1 (section 26-32cm) ..............................................34 Figure 5: Depth distribution of nutrient indices derived from diatom composition .....................35 Figure 6: Depth distribution of total PAHs and the LMW to tPAHs ratio with depth .................36 Figure 7: PAH compositional changes with depth in WC-1.........................................................37 Figure 8: Depth distribution of total PCBs and the LMW to tPCBs ratio with depth ..................38 Figure 9: Total DDX (DDT+DDD+DDE all forms) and total chlordanes with depth .................39 Figure 10: Total chlordanes (all forms) with depth in the tidal Anacostia, ..................................40 Figure 11: Concentrations of tPAHs from 1900 to 2003..............................................................41 Figure 12: Concentrations of tPCBs from 1900 to 2003 ..............................................................42 Figure 13: Concentrations of tDDXs from 1900 to 2003 .............................................................43 Figure 14: Concentrations of total chlordanes from 1900 to 2003 ...............................................44 Figure 15: Depth distribution of eutrophication index (eutrophic only) derived from diatom composition with TSP …….……………………………………………………45

6
Executive Summary This study involved the chemical analysis of three dated sediment cores taken from the upper
tidal St. Jones Estuary. The cores were obtained and chronologies calculated by Dr. Christopher
Sommerfield (CMES, University of Delaware). The main objective was to evaluate historical
trends in organic chemical contaminants (e.g., polychlorinated biphenyls, chlordanes, and
polycyclic aromatic hydrocarbons) and nutrients (i.e., sediment phosphorus and nitrogen). An
additional objective was to evaluate if a historical record of eutrophication can be derived from
algal analysis, i.e., diatoms, from the sediments along with other indicators of ecosystem change
(e.g., δ13C-OM and δ15N-TN).
Organic contaminants, notably PCBs, DDX, PAHs, and chlordanes show distinct profiles in
the sediments, suggesting changes in the source and deposition over time. For example, total
PCBs showed higher concentrations at depth with decreasing concentrations towards the surface.
Total PCBs, DDX and chlordane concentrations showed a sharp maximum at similar depths
decreasing towards the surface; especially in the upper sections (near the 1960s or 1970s). The
congener composition of the PCBs showed a shift from mid to higher molecular weight
compounds (i.e., homologs 5+6+7) to lower molecular weight compounds (i.e., homologs
3+4+5) from the upper sections to the lower sections. While post-depositional alterations may
have occurred, these changes can also be due to changes in the type, use, source and importantly,
degradation of PCBs over time.
Total PAHs showed a distinct peak concentrations at depth in two cores (WC-1 and LH-2),
with low and little trend in WC-2. In LH-2, total PAH concentrations were some of the highest
observed (Kennish, 1992 and others). Sources in WC-1 suggest petrogenic inputs while in LH-2,
sources appear to be mostly combustion products. Further analysis will be undertaken to help
evaluate the inputs at these depths.
Preliminary analysis of the diatom assemblages and metrics indicate a shift toward more
eutrophic species starting in the late 1940s. Only in WC-1 was there a possible relationship
between total sediment P and diatom metrics, suggesting nutrient enrichment also impacted the
diatom community composition. While diatom indices in WC-2 remain constant from the 1950s
to the present, the eutrophic index in WC-1 and LH-2 shows some sign of decrease, possibly
related to nutrient controls and treatment.

7
Overall, this study documents the chemical analysis of three cores taken around the upper
tidal St. Jones Estuary. Changes were observed in contaminant levels across time that reflect
usage globally and most likely locally. In one core there was a clear shift towards diatom species
that reflect eutrophic conditions and this correlates to some degree with sediment P levels,
suggesting that phosphorus levels could be more limiting to species development and growth in
the long term. Further analysis of the data will be undertaken to better quantify observed
relationships. Additionally, isotopic analysis of C and N, to be completed in the future, will help
this interpretation process.
8
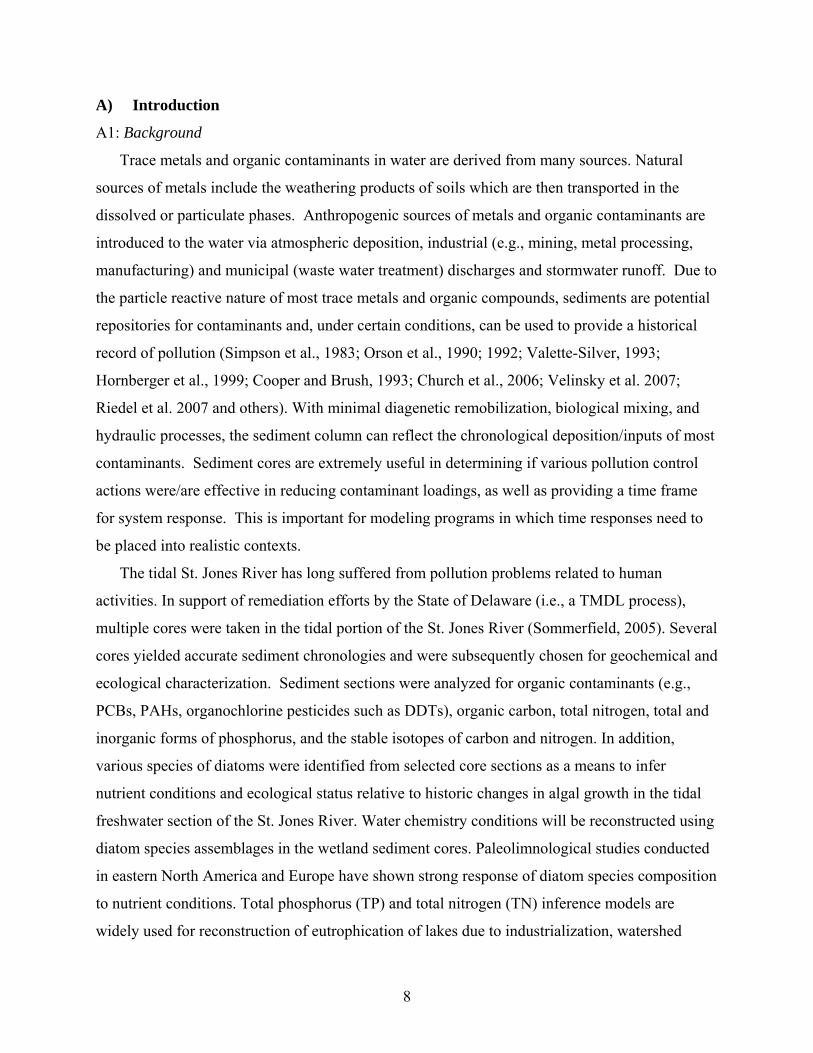
A) Introduction
A1: Background
Trace metals and organic contaminants in water are derived from many sources. Natural
sources of metals include the weathering products of soils which are then transported in the
dissolved or particulate phases. Anthropogenic sources of metals and organic contaminants are
introduced to the water via atmospheric deposition, industrial (e.g., mining, metal processing,
manufacturing) and municipal (waste water treatment) discharges and stormwater runoff. Due to
the particle reactive nature of most trace metals and organic compounds, sediments are potential
repositories for contaminants and, under certain conditions, can be used to provide a historical
record of pollution (Simpson et al., 1983; Orson et al., 1990; 1992; Valette-Silver, 1993;
Hornberger et al., 1999; Cooper and Brush, 1993; Church et al., 2006; Velinsky et al. 2007;
Riedel et al. 2007 and others). With minimal diagenetic remobilization, biological mixing, and
hydraulic processes, the sediment column can reflect the chronological deposition/inputs of most
contaminants. Sediment cores are extremely useful in determining if various pollution control
actions were/are effective in reducing contaminant loadings, as well as providing a time frame
for system response. This is important for modeling programs in which time responses need to
be placed into realistic contexts.
The tidal St. Jones River has long suffered from pollution problems related to human
activities. In support of remediation efforts by the State of Delaware (i.e., a TMDL process),
multiple cores were taken in the tidal portion of the St. Jones River (Sommerfield, 2005). Several
cores yielded accurate sediment chronologies and were subsequently chosen for geochemical and
ecological characterization. Sediment sections were analyzed for organic contaminants (e.g.,
PCBs, PAHs, organochlorine pesticides such as DDTs), organic carbon, total nitrogen, total and
inorganic forms of phosphorus, and the stable isotopes of carbon and nitrogen. In addition,
various species of diatoms were identified from selected core sections as a means to infer
nutrient conditions and ecological status relative to historic changes in algal growth in the tidal
freshwater section of the St. Jones River. Water chemistry conditions will be reconstructed using
diatom species assemblages in the wetland sediment cores. Paleolimnological studies conducted
in eastern North America and Europe have shown strong response of diatom species composition
to nutrient conditions. Total phosphorus (TP) and total nitrogen (TN) inference models are
widely used for reconstruction of eutrophication of lakes due to industrialization, watershed

9
development, and for lake management purposes (Dixit and Smol, 1994; Reavie et al., 1995;
Hall and Smol, 1999; Bennion et al., 2000; 2001; Bradshaw and Anderson, 2001). Using this
inference-model approach, the results of this study will help with management decisions and
resource protection efforts, as well as with establishment of reference conditions and nutrient
criteria for other systems.
A2: Objectives of Study
The objective of this study was to analyze previously-collected sediment cores from the tidal
freshwater region of the St. Jones River (near Dover, DE) and determine the chronology of
chemical contaminant deposition, nutrient loadings and related ecological response.
To meet this objective, we analyzed the chemical characteristics of sediment cores collected
within the tidal St. Jones River (Sommerfield, 2005). Cores from approximately Court Street
(LH-1) to Lebanon (DE), near the Wildcat landfill (WC-1 and WC-2), were analyzed, while
other cores that were collected remain preserved at -10oC for possible future analyses. This study
aims to quantify the magnitude and extent of sediment contamination in the upper tidal river and
estimates the contaminant deposition rate in the upper tidal marshes of the St. Jones watershed.
A3: Study Area
Much of the physical setting of the St. Jones watershed and estuary are described in
Sommerfield (2005), DNREC (1999) HydroQual (2006), and Moskalski (2005). Below is a
summary from those documents.
The St. Jones River watershed drains a portion of the coastal plain in central Kent County,
DE, including the city of Dover, industrial areas, agricultural areas and Dover Air Force Base.
The upper St. Jones is impounded by a dam 17 km upstream from the Bay to form Silver Lake.
The estuarine portion of the watershed is 17 km long from the approximate head of tides in
Dover to Delaware Bay (Figure 1). The river-estuary occupies a Pleistocene-aged river valley
that flooded with rising sea level during the Holocene and has been filled over time with muddy,
peat-rich sediments from the watershed (Wilson, 2005; Moskalski, 2005; Leorri et al. 2006). The
watershed of the tidal river occupies an area of ~15 km2 with salinities varying tidally and
seasonally, but is generally within the 5-8 psu range (DNREC, 1999).
10
Land use in the lower St. Jones River watershed is dominated by agriculture (48%) with a
smaller fraction of urbanized (25%) and undeveloped cover (27%). In undeveloped areas, the
predominant vegetation is salt marsh cordgrass (Spartina alterniflora) at 62% by area. The
common reed (Phragmites australis) occupies 13%, and the remaining area is covered by other
forms of Spartina and various marsh shrubs (DNREC, 1999). Non-vegetated, intertidal waters
are characterized by muddy tidal channel banks and flats. Sources of fine-grained, inorganic
sediment include delivery from the upland watershed, within-estuary marsh and tidal channel
erosion, and tidal influx from Delaware Bay (Wilson, 2004; Sommerfield 2005).
There are multiple sources of chemical contaminants to the tidal St. Jones Estuary. Sources
of chemical contaminants and nutrients to the tidal waters are both from the surrounding non-
tidal and tidal land areas and include current and previous industrial activity (Kennish, 2004),
atmospheric deposition (Goel et al., 2006), stormwater runoff and groundwater discharge from
Dover and other developed areas (e.g., Hinaman and Tenbus, 2000), and runoff from agricultural
areas. The City of Dover discharged effluent from its waste water treatment plant (WWTP) to
the upper St. Jones River up to the early 1970s, after which its discharge was directed to the
Muderkill River. Currently, the State of Delaware has listed specific segments of this river
system as impaired water bodies (i.e., 303(d) list) due to low dissolved oxygen and high bacteria
concentrations resulting from high levels of nitrogen and phosphorus (DNREC, 1999;
HydroQual, 2006; U.S. EPA 2006). As such, load allocations for both nitrogen and phosphorus
are currently being developed to help reduce ambient levels and to improve water quality.
In addition, there are four noted Superfund sites located in the tidal river watershed. These
include Dover Air Force Base, Fraizers and Wildcat Landfills and Dover Gas and Light
Company. Kennish (2004) reviewed some of the characteristics of these sites and their impact to
the river. While the Air Force Base is a source of volatile chemicals, both the Wildcat Landfill
and Dover Gas and Light are large sources of PCBs, PAHs (coal tar) and other chemicals to the
tidal river. The Wildcat Landfill, located 2.5 km downstream of Dover, is a 44-acre site which
operated from approximately 1962 to 1973. Groundwater and subsurface sediments are
contaminated with a variety of heavy metals, volatile organic compounds (e.g., benezene), and
moderate levels of polychlorinated biphenyls (PCBs).
These sources have lead to various biotic impacts in the river. While Pinkney and
Harshberger (2004) found no evidence of tumors in various species of fish, fish burdens of

11
chemicals are elevated. The State maintains fish consumption advisories on fish caught from the
tidal St. Jones River due to PCBs and dioxin (State of Delaware, 2006). As a result of the
advisory, Delaware listed the area in question on its Clean Water Act Section 303(d) list of
impaired waters. A PCB TMDL for this reach is currently scheduled to be completed by the end
of 2011. Given the nature of the sources and their historical impact, sediment cores from marshes
in the river provide an excellent means for documenting long-term (e.g., decadal scales)
chemical loadings and related ecological parameters. Chronologies could help provide an
understanding of whether or not source reduction programs (i.e., wastewater treatment; landfill
remediation, source reductions) are successful and under what time scales a river-estuarine-wide
response can be detected.
Selected sections from three cores, collected in Sommerfield’s study (2005), were analyzed
for a suite of organic contaminants and ancillary parameters (e.g., sediment C, N and P). In
addition, stables isotopes of C and N were determined as well as diatom community structure.
Cores WC-1 and WC-2 near the Wildcat Landfill as well as LH-2, near Court Street, Legislative
House, were selected (Figure 1). The LH-2 core, located in downtown Dover, contained 1-5 cm
of thick beds of sand, interbedded with clayey silt, probably derived from upstream sources
(Sommerfield, 2005). Cores WC-1 and WC-2, located downstream from Dover, and contained
clayey silt with either gas inclusions or peat fragments (Sommerfield, 2005).
B) Field and Laboratory Methods
B1: Field Sampling
Sediment cores were collected in 2003 by University of Delaware staff (Sommerfield, 2005)
at locations in the tidal river (Figure 1). For a complete discussion of field collection and
analysis see Sommerfield (2005). Samples were stored in pre-cleaned jars at -10oC at DNREC
facilities. Chain-of custody procedures were followed from the time of collection, shipping and
until the analyses were completed.
B2: Laboratory Methods
Organic contaminant clean-techniques were used throughout and are well published (Ashley
and Baker, 1999; others) and are similar to those used by EPA and NOAA (U.S. EPA, 1987;
NOAA, 1993; Wade et al., 1994). All materials coming in contact with the samples were either
12
glass or metal that was cleaned of any contaminants prior to use. Sample ID forms were used
and each sample was given a unique laboratory number for sample tracking.
Sediments were analyzed for the following parameters at laboratories operated by the
Academy of Natural Sciences (Patrick Center): carbon, nitrogen and phosphorus, PAHs (41+
compounds), total PCBs (100+ congeners), selected pesticides including DDTs and chlordane,
and stable isotopes of carbon and nitrogen. In addition, specific sections were analyzed for
diatoms via sample digestion, mounting and glass slide light microscopy. Below are brief
descriptions of each chemical or physical method:
B2.1: Total Organic Carbon and Total Nitrogen Total organic carbon and total nitrogen was measured using a CE Flash Elemental Analyzer following the guidelines in EPA 440.0, manufacturer instructions and ANSP-PC SOP. Samples were pre-treated with acid to remove inorganic carbon. B2.2: Total Phosphorus Total sediment phosphorus was determined using a dry oxidation method modified from Aspila et al. (1976) and Ruttenberg (1992). Solubilized inorganic phosphorus was measured with standard phosphate procedures using an Alpkem Rapid Flow Analyzer. Standard reference material (spinach leaves) and procedural blanks were analyzed periodically during this study. All concentrations were reported on a dry weight basis. B2.3: Stable Isotopes of Carbon and Nitrogen The stable isotopic composition of sediments was analyzed using a Finnigan Delta XL coupled to an NA2500 Elemental Analyzer (EA-IRMS). Samples were run in duplicate or triplicate with the results reported in the standard δ (‰) notation: δX = (Rsample/Rstandard) - 1) X 1000; where X is either 13C or 15N and R is either 13C/12C or 15N/14N. The δ15N standard was air (δ15N = 0), and for δ13C the standard is the Vienna PeeDee Belemite (VPDB) limestone that has been assigned a value of 0.0 ‰. Analytical accuracy was based on the standardization of the UHP N2 and CO2 used for continuous flow-IRMS with IAEA N-1 and N-2 for nitrogen and IAEA sucrose for carbon, respectively. An in-house calibrated sediment standard was analyzed every tenth sample. Generally, precision based on replicate sample analysis was better than 0.2‰ for carbon and 0.6‰ for nitrogen. B2.4: Diatoms Core sediment was collected (≈1g) and the organic component was oxidized with 70% nitric acid while heated in a CEM microwave (165ºC) for an hour and a half. Diatoms were settled and supernatant was decanted until it reached a neutral pH. A measured amount of digested sample was dripped onto a microscope coverslip and dried. Coverslips were then mounted onto slides using a high refractive index mounting media (Naphrax™). Diatoms were counted and identified using a Zeiss Axioskop with DIC optics. Three hundred valves were counted on 1000x magnification. Identifications were made using the extensive diatom library at ANSP. Several diatom community metrics were calculated based on species autecological preferences

13
based on van Dam et al. (1994). Metrics were calculated using the Phyco-Aide program developed at ANSP. B2.5: Sedimentary Organics Prior to organic contaminant analyses, samples were kept frozen at -20 oC. Standard operating procedures for the extraction, clean-up and quantification of organic contaminants in sediments are summarized in their respective operating procedure. Briefly, sediment samples were extracted with dichloromethane for 24 hr using a Soxhlet apparatus. PAHs were quantified using a capillary gas chromatograph coupled with a mass spectrometer in the electron impact mode after a clean-up procedure employing liquid-solid chromatography with alumina as the stationary phase (Ashley and Baker, 1999). After PAH determination, samples were further cleaned-up using liquid-solid chromatography with florisil as the stationary phase. Congener-specific PCBs and OCPs were analyzed using a gas chromatograph equipped with a 63Ni electron capture detector (Ashley and Baker, 1999; Kucklick et al., 1996). C) Results C1: Sediment Organic Carbon, Total Nitrogen and Total Phosphorus
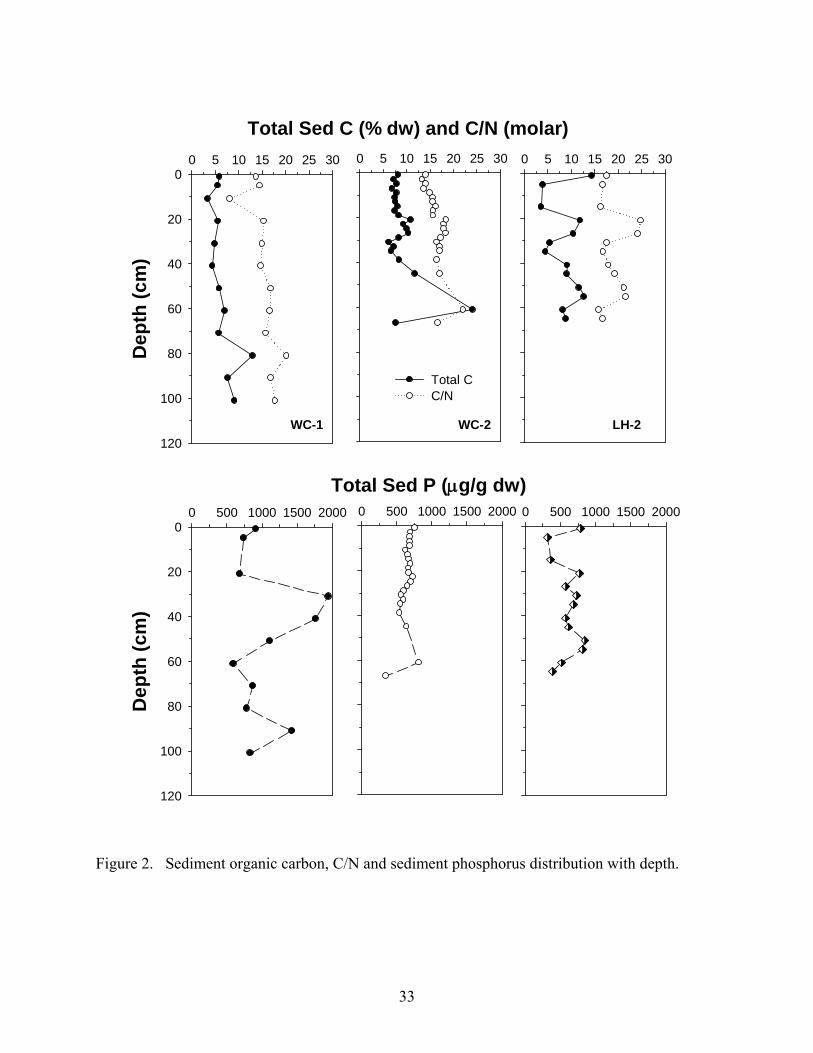
Sediment carbon (SC) concentrations for all cores ranged between <3.6 and 24.1 % on a dry
weight basis (dw) with an average of 8.5 ± 3.4 %OC (± standard deviation; Tables 1-3; Figure
2). Similarly, total nitrogen ranged from 0.25 to 1.27 %N with an overall average of 0.57%;
while total sediment phosphorus (TSP) ranged from 319 to 1944 μg/g dw with an overall average
of 735 μg/g dw.
In the WC cores, SC was near constant with depth and exhibited a maximum at depth
(Figure 2). In core WC-1, the maximum was centered on 80 cm while in WC-2 the depth of
maximum concentration was centered at 60 cm. In core LH-2, SC was highest near the surface
decreasing to a minimum at 14-16 cm below which there are two sub-surface maximums (Figure
2). The C to N ratio (molar) reflected changes in SC and exhibited similar distributions with
depth. TSP in WC-1 showed a distinct maximum centered around 30-32 cm, while in WC-2 and
LH-2, the TSP distribution was similar to TC (Figure 2). For cores WC-2 and LH-2 there was a
positive relationship between TSP and SC concentrations (r2 = 0.304; n = 34), while for WC-1
there was no relationship (Figure 3).
C2: Stable Isotopes of Carbon and Nitrogen: To be completed
14
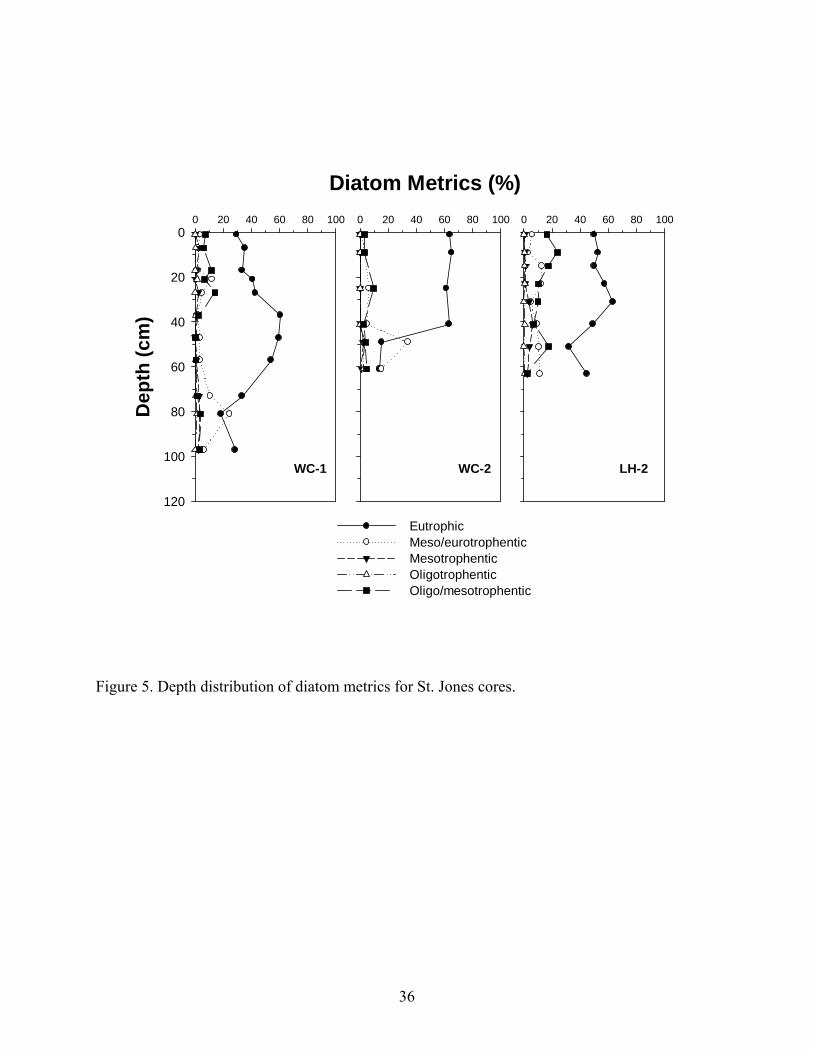
C3: Diatom Analysis and Assemblages
Samples from 25 sections were analyzed for diatom composition from the 3 cores. At least
300 valves were counted for each sample and over 136 taxa (e.g., Figure 4; Appendix III) were
identified from the samples allowing a robust analysis for salinity and nutrient conditions.
Below is a brief discussion related to the nutrient conditions derived from the cores.
Four different autecological metrics were calculated including, salinity, pH, nitrogen uptake
metabolism, and the trophic state (van Dam et al., 1994; Table 4; Figure 5). It appears that the
area is elevated in nutrients overall. The diatom community composition shows that at the
bottom and top of the cores the nutrient levels are lower and are highest in the mid-section. The
bottoms of the cores seem to show the lowest nutrient levels. The bottom sections of the cores
had the lowest percentage of eutrophentic taxa and had the highest percentage of oligotrophentic
indicators (Table 5). Samples taken from 36 cm and 56 cm in WC-1 have the highest percentage
of eutrophentic indicators, 60% and 54% respectively.
C4: Polycyclic Aromatic Hydrocarbons
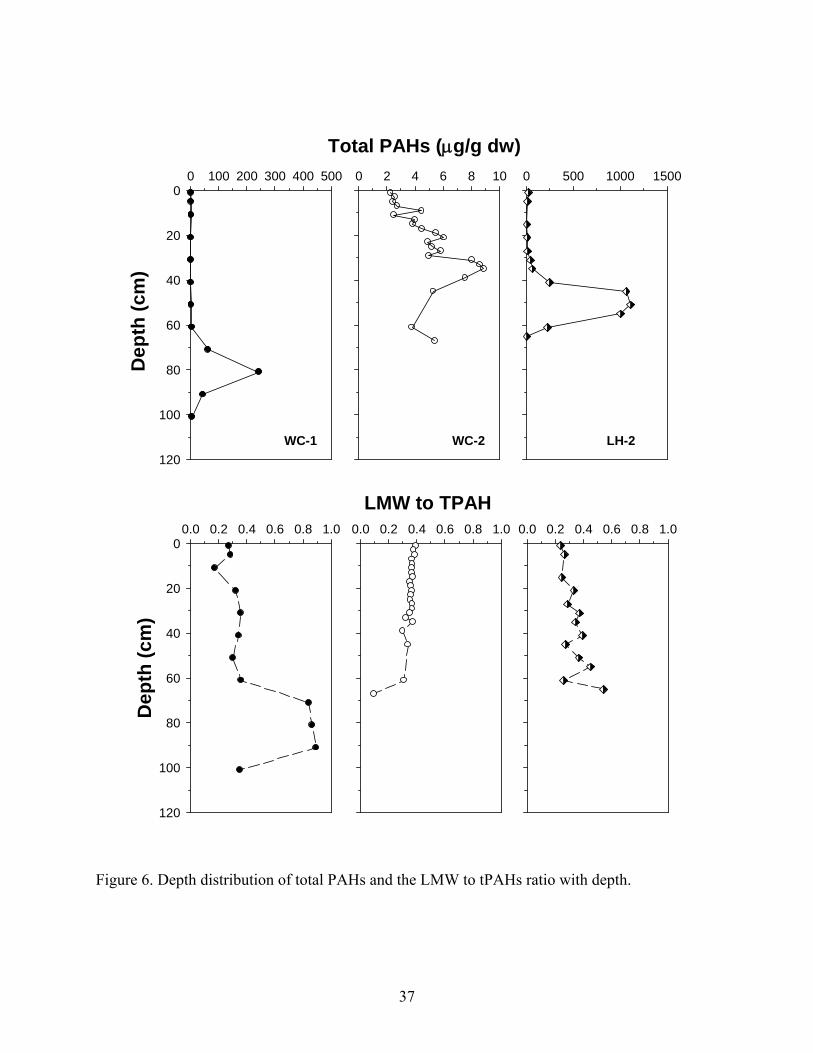
Polycyclic aromatic hydrocarbons (PAHs) were detected in all samples analyzed. The PAHs
for this analysis comprised 34 individual compounds ranging from the low molecular weight
naphthalene and phenanthrene (2- and 3-rings) to high molecular weight compounds with 4- and
5- rings, including pyrene and dibenz[a,h]anthracene. Total PAHs (methyl-substituted and
unsubstituted forms) ranged from 0.84 to 1111 μg/g dw (note unit conversion from Tables 1-3;
Appendix I) with generally similar profiles for most cores (Tables 1-3). Concentrations in Core
WC-2 were lowest followed by WC-1 and then LH-2. In Cores WC-1, WC-2 and LH-2
concentrations were lowest near the surface increasing to a subsurface maximum centered at 80-
82 cm, 34-36cm, and 50-52 cm, respectively (Figure 6). The concentrations at the maxima
varied widely between the three cores. The highest concentration (1110 μg/g dw) was found in
LH-2. The concentrations between 40 and 60 cm within this core are substantially higher than
any values observed from sediment cores within the Anacostia River and Baltimore Harbor
(Wade et al., 1994; Ashley and Baker, 1999; Riedel et al., 2007).
There were 34 individual compounds that were summed to comprise the PAH fraction.
These compounds ranged from 2-ring compounds such as naphthalene to 5-ring aromatic
compounds such as di-benzo[a,h]anthracene (Tables 1-3; Appendix I). Also included within the
15
34 individual PAHs are 6 methyl-substituted forms including methylnaphthalene,
methylfluorene, and methylphenanthrene. Both the distribution of parent PAHs and methyl-
substituted PAHs can be used to determine the sources of hydrocarbons to the tidal river (i.e.,
combustion or petrogenic).
The phenanthrene to anthracene ratio can be used to help distinguish between combustion
(pyrogenic) versus direct oil (petrogenic) sources in aquatic systems as undegraded oil has a very
high ratio (50) compared to combustion sources (ca. 0.3; Wakeham et al., 1980; Wade et al.,
1994; O’Malley et al., 1994; 1996). In WC-1, the phenanthrene to anthracene ratio ranged from
0.6 to 3 for all sections analyzed which is characteristic and typical of many urban environments
having a preponderance of combustion sources (Gschwend and Hites, 1981; Hoffman et al.,
1984; Van Metre et al., 2000). The highest ratio was at the concentration maximum at 80-82 cm,
suggesting more of a petrogenic source to this horizon. This is further supported by the ratio of
low molecular weight PAHs to total parent PAHs (LMW:tPAHp; Figures 6-7; Tables 1-3 and
5, Appendix I). In the upper section of this core the ratio ranged from 0.2 to 0.4, suggesting a
combustion source, while at maximum concentration the ratio increased to 0.90, more of
petrogenic source. For core WC-2, the phenanthrene to anthracene ratio did not vary
substantially with depth and averaged 1.1 ± 0.2, while in LH-2 the ratio was slightly higher (2.3
± 0.8) indicating slightly more petrogenic hydrocarbons, however there was not a large
difference between sites. Interestingly, the ratio of LMW to tPAHp, in both cores did not
increase at the concentration maxima as in WC-1 (Figures 6-7), possibly due to a different
source of hydrocarbons at these sites.
Overall, there are both pyrogenic and petrogenic sources of PAHs to the sub-surface
sediments of the tidal St. Jones River. Sources of PAHs related to urban areas include tire wear,
crankcase oil, and car soot and exhaust (Wakeham et al., 1980; O’Malley et al., 1994; Van Metre
et al, 2000). In addition, in core WC-1, there also appears to be a substantial input of petrogenic
hydrocarbons dominated by low molecular weight compounds such as phenanthrene, anthracene,
and fluoranthene as well as a number of methyl-substituted compounds like 2-
methylphenanthrene, 2-methylanthracene, 1-methylanthracene, 1-methylphenanthrene, 9-
methylanthracene and 4,5-methylenephenanthrene.

16
C5: Polychlorinated Biphenyls
Total polychlorinated biphenyls (tPCBs) were composed of approximately 110 congeners
(compounds) that were quantified either individually or co-eluted with multiple (2 or 3)
congeners (Tables 1-3; Appendix II). Congeners 1 and 3 (compounds with 1 chlorine group)
were excluded from the totals due to analytical difficulties in accurately quantifying their
presence. Concentrations of tPCBs ranged from 4.2 ng/g dw (near the method detection limit of
.1.2 ng/g dw; calculated as the mean plus three times the SD of the blanks) to approximately
782 ng/g dw with a median concentration of 101 ng/g dw (Tables 1-3; Figure 8). Surface
concentrations ranged from 39 to 166 ng/g dw increasing to either a sharp concentration
maximum (at approximately 26-28 cm in WC-2 and 20-22 cm in LH-2) or a broad maximum as
seen in WC-1 (e.g., 140 ng/g dw centered around 40 to 50 cm; Figure 8). Total PCBs were low
throughout the bottom section of the cores, decreasing to the lowest levels by 100-102 cm in
WC-1 (4 ng/g dw), 66-68 cm in WC-2 (14 ng/g dw) and 64-66 cm in LH-2 (35ng/g dw).
The 110 congeners (excluding congener 1 and 3; monochlorinated biphenyls) determined in
the study were grouped into homolog groups (from 1 to 10) based on the number of chlorine
atoms substituted on the biphenyl ring (e.g., homolog group H5 contains measured congeners
with 5 chlorines; Appendix II). In addition, the homologs were summarized into low molecular
weight congeners (LMW; i.e., H1 to H5) and high molecular weight congeners (HMW; i.e., H6
to H10). Important in this analysis is the assessment of blank levels, given an MDL for tPCBs
of approximately 1.2 ng/g dw, we assume that that congener pattern will be sufficiently biased
by the blank for concentrations below a value 10 times the MDL or approximately 10 ng/g dw.
Therefore samples near the bottom of the cores (those with lower concentrations) may have
biased patterns but are still shown for completeness in the following analysis.
For simplicity, the ratio of the LMW PCBs to the total PCBs are presented in Figure 8. The
changes in the LMW to tPCB ratio along with homolog patterns reveal some interesting changes
with depth in many of the cores. In most cores, the LMW to tPCB ratio was approximately 0.5 to
0.6 in the upper sections, increasing with depth. The increase in LMW/tPCBs occurred just
below the peak in concentration.
To further illustrate the compositional change in each core with depth, the homolog patterns
for selected sections are presented in Figure 8. In the surface sections the H4 is the dominant
PCB group followed by H5 to H7. This pattern (as reflected in the LMW to tPCB ratio) is

17
similar with depth to the peak in concentration. Below this peak the homolog pattern shifts to
lower molecular weight congeners (H2 to H4). Degradation of the PCB molecule is suspected,
as there is a shift from higher molecular weight congeners to lower molecular weight congeners
over time (and depth) (Brown et al., 1984;1987; Quensen et al., 1988; 1990). This is evident in
the patterns from the St. Jones cores.
C6: DDT and Chlordane
The parent and breakdown products of DDT and chlordane were detectable in all sediment
layers, especially in the upper, more fine-grained sections of each core (Tables 1-3; Appendix
II). Total DDX (all forms; tDDX) ranged from < 2 to approximately 430 ng/g dw (median of 64
ng/g dw), while total chlordanes ranged from < 1 to 88 ng/g dw (median of 7.3 ng/g dw).
The distribution with depth of both groups of pesticides was slightly different from each
other (Figures 9-10). In WC-1, tDDX and total chlordanes (tChl) concentrations were low
throughout the core and exhibited peak concentration centered on 50 cm for tDDX and 80 cm for
tChl, respectively. For WC-2, concentrations of both groups of compounds exhibited distinct
maxima with depth with one group higher just above the other (Figures 9-10). Concentrations of
tDDX were highest (363 ng/g dw) at 32-33 cm while tChl concentrations were highest (40 ng/g
dw) at 26-28 cm. The layering of the two groups was also evident in LH-2 in that highest
concentrations of tDDX were below peak concentrations of tChl. Concentrations in the deepest
sections were near the detection limit for all cores.
In summary there was a wide range in concentrations of these parameters with depth and
somewhat spatially (i.e., upstream to downstream). For comparison, NOAA sampled the tidal
St. Jones River in 2000 (Hartwell et al., 2001) at three stations (Table 6). One station was
located in the upper tidal reach (near LH; 89), one was located in the middle tidal reach (near
Barkers Landing; 90), and one was located near the mouth (Sta. 88). The data for the core tops
from this study are in fairly good agreement compared to Hartwell et al. (2001; Table 6). While
the agreement is good, three points need to be stated that could impact this comparison. These
include the interval sampled (0-2 cm versus 0 to ~ 6cm), locations are not exactly the same, and
the total concentrations are the sum of a different number of compounds. For example, Hartwell
et al. (2001) summed 28 congeners to obtained total PCBs while in the current study, 110
congeners were analyzed and summed. Given these caveats, there is a good overall agreement.

18
C7: Historical Analysis of Chemical Contaminants
The activity of 210Pb and 137Cs (reported as disintegrations per minute per gram of sediment;
dpm/g) with depth can be used to determine the sedimentation rate and historical record of
contaminants in sediments (Simpson et al., 1983; Orson et al., 1990; 1992; Valette-Silver, 1993;
Appleby, 2001; Smol, 2002; Ridgway and Shimmield, 2002; Sommerfield, 2005). This
information can be used for the construction of sediment budgets (Schubel and Hirschberg, 1977;
Brush et al., 1982; Officer et al., 1984) and to understand chemical contaminant accumulation in
aquatic environments (Cornwell et al., 1996; Latimer and Quinn, 1996; Van Metre et al., 1997;
Church et al., 2006). Also, dated sediment cores can provide information as to the changes in
loadings of contaminants over time (e.g., Gevo et al., 1997). Such information is especially
useful in tracking the effectiveness of various management actions designed to reduce inputs to
specific areas (Owens and Cornwell, 1995; Zhang et al., 1993). However, there are many
variables that can affect the usefulness of 210Pb and 137Cs dating in a given area (Appleby and
Oldfield, 1978; Crusius and Anderson, 1991; Appleby, 2001). These include mixing of the
sediment by benthic organisms (i.e., burrowing organisms), physical mixing from dredging and
storm events, post-depositional movement of contaminants and of the 210Pb or 137Cs, and
additional inputs of 210Pb from sources in the urban landscape (i.e., urban sediment focusing).
Sommerfield (2005) presented this information and discussion for the cores analyzed in this
study. In summary, sedimentation rates for WC-1, WC-2 and LH-2 for 210Pb and 137Cs ranged
from 0.96-1.2 cm/yr, 0.94-0.92 cm/yr and 0.84-0.78 cm/yr, respectively. For the historical
analysis, the average of the 210Pb and 137Cs rates was used for time chronologies.
Total PAHs: Total PAH concentrations in WC-1 were highest in the early 1920s (245 μg/g dw)
decreasing to lower levels by 1940 and remaining nearly constant (0.85 to 2.2 μg/g dw) to the
present (Figure 11). At WC-2, the chronology only goes back to the 1930s and as such does not
show the 1920s peak concentration. In this core, tPAH concentrations were highest (8.9 μg/g
dw) in the mid-1960s decreasing to < 3 μg/g dw by 2003. Concentrations in core LH-2 were
highest (> 1000 μg/g dw) in the early 1940s decreasing to 56 μg/g dw by 1960. After this date,
concentrations decrease to a minimum of 8 μg/g dw in the late 1970s, increasing slightly to the
present.
19
It is difficult to determine the exact source(s) of PAHs to these cores, but the LH-2 site may be
influenced by runoff, either surface or subsurface, from a contaminated site in Dover, DE.
Importantly, a coal-gasification facility (Dover Gas Light Company) was located approximately
2.5 km southwest of the LH-2 site and is currently under clean up action (Superfund site) from
the US EPA (US EPA, 1994 and other documents). From 1859 to 1948 the facility produced gas
from coal which was used for street lamps and other purposes. While the plant was closed in
1948, it left behind substantial contamination in the soils and in groundwater of coal oil and/or
coal tar (US EPA, 1994). Given the substantial levels of tPAHs, the high molecular weight of the
PAHs and peak concentration in the early to mid-1940s, the data suggests that the PAHs present
in the bottom of LH-2 are derived from the old Dover Gas Light site.
For core WC-1, the molecular distribution of PAHs indicates that a direct hydrocarbon spill or
intentional discharge occurred over many years. As opposed to the more recent sediments at the
surface the sections deeper down were dominated by low molecular weight compounds which
suggest petrogenic sources.
Total PCBs: Polychlorinated biphenyls (PCBs) were mainly produced by the Monsanto
Corporation from 1930 to 1977 and it is estimated that 5.4 x 10⁸ kg has been produced within the
United States (Kennish, 1992). These compounds have been fully regulated since 1976 and
while their manufacture in the U.S. ceased since 1977, they are still in use as electrical insulators
in many transformers. They are also used as a fire retardant, and additives to oils and paints.
Persistence of PCBs in aquatic sediments is due to their slow rate of degradation and
vaporization, low water solubility, and partitioning to particles and organic carbon. Bacteria
degrade PCB, with the rate dependent on the position and degree of chlorination of the biphenyl
ring and in many cases the absolute concentration present in the sediments (see Kennish, 1992
and others). Current sources to this area are thought to be from contaminated sediments, runoff
from old landfills, accidental spills (e.g., transformer fluids) and atmospheric deposition.
Concentrations of tPCBs in all cores started to increase after 1930 with highest values after
1960 (Figure 12). Total PCB concentrations in WC-1 were highest in the late 1950s and early
1960s, decreasing to < 50 ng/g dw by 2003 (Figure 12), while in both WC-2 and LH-2,
concentrations generally were highest in the late 1970s to early 1980s. Concentrations in all
cases decreased towards the surface illustrating that most likely usage and regulations have been
20
effective in the input of PCBs over time. The differences in historical structure of tPCBs in each
core may be due to site-specific differences in sedimentation (i.e., averaging over specific time
intervals), more local inputs (i.e., WC-1 is within a know landfill) and post-depositional
migration. It is doubtful that atmospheric deposition of PCBs would be a major contributor to
the concentration gradient. Also, the cores were sampled at 2-cm intervals but not every section
was analyzed for contaminants. Therefore the resolution of the profile may be altered dependent
on the section analyzed, and as such, analysis of the un-analyzed sections is warranted.
Total DDX and Chlordanes: DDT and its breakdown products (2,4'+ 4,4' forms of DDT (1,1'-
(2,2,2-trichloroethylidene)bis[4-chlorobenzene]; DDE (1,1'-(2,2,2-trichloroethenylidene)bis[4-
chlorobenzene]) and DDD (1,1'-(2,2-dichloroethylidene)bis[4-chlorobenzene]) was used for
insect controls starting in the mid-1940s. DDT was banned in 1972 and has been found to have
an approximate environmental half-life of 10 to 20 years (Woodwell et al., 1971). While it was
banned nearly 30 years ago, parent DDT is still detectable (and in substantial concentrations) in
the sedimentary material collected from various locations (Wade et al., 1994).
Chlordane is a multi-component mixture of polychloro-methanoindenes (e.g., oxy-, γ-, and α-
chlordane, heptachlor, heptachlor epoxide and cis+trans-nonachlor). Technical grade chlordane
contains more than 140 components of which only 120 compounds can be resolved by current
analytical techniques. Alpha (α)-chlordane, gamma (γ)-chlordane, heptachlor and trans-
nonachlor are the dominant constituents (Dearth and Hites, 1991), and are used to control
termites and ants. Because of the toxicity, potential carcinogenicity and environmental
persistence of these components and/or metabolites, e.g., heptachlor, heptachlor epoxide and
oxychlordane, the use of chlordane is under federal regulation. The use of chlordane was halted
in 1988 after a phased reduction in use since approximately 1975. The half-life of chlordane is
similar to that of DDT (i.e., approximately 10 to 20 years), and therefore its persistence is to be
expected for many years. However, while the large scale use of chlordane decreased in the late
1980s, it was not fully phased out and was still used in the area.
Similar temporal distributions of tChl were observed as tDDX in WC-2 and LH-2, but the
date of peak concentrations were shifted from one another (Figures 13-14). In WC-2, highest
concentrations of tDDX were observed in the mid-1960s, compared to the mid-1970s for tChl
(Figures 13-14). In LH-2 there was a bimodal distribution of both pesticide groups, again with a

21
shift in the date of peak concentrations. For tDDX, concentrations were highest around 1940 and
mid-1960s (Figures 13-14) while for tChl, peak concentrations were observed in the early 1950s
and early 1980s (Figures 13-14).
It is not clear why the two distributions are shifted, but the most likely reason is the use
history for each class of pesticides and specifically the use/disposal history in this area (i.e.,
which could be different from other locations). For tDDXs, both cores showed a peak in the
1960s with decreasing concentrations to the present. While there was a ban in DDT use in the
early 1970s, there could be a more local decrease in usage starting at an earlier date. While for
tChl, both cores exhibited a peak in concentration in the late 1970s or early 1980s in agreement
with the phased ban starting in 1975. The earlier peaks in time for both pesticides in 1940s and
1950s are interesting and may be the result of limited use as these chemicals became available.
Only with specific historical use records from the area could the distributions observed in these
cores be verified.
Diatom Metrics: The eutrophentic metrics were plotted along with the total sediment phosphorus
concentrations (TSP) to understand if P appears to be causing a shift in diatoms species over
time, resulting in more eutrophentic conditions (Figure 15). It should be noted that phosphorus
undergoes substantial diagenetic remobilization (Berner, 1980; Burdige, 2006). In this regard,
phosphate was shown to have a substantial movement out of the sediments in core incubations
by Owens and Cornwell (2003). As such, only in specific cases (see for example Church et al.,
2006) does the sedimentary record reflect sources and inputs. At this stage of the analysis there
appears to be a good relationship between the diatom index of eutrophentic conditions and TSP
for WC-1 and possibly WC-2, but not for LH-2. Concentrations of nutrients, as indicated by the
diatoms, seem to have peaked in the 1950s and 1960s, have dropped off since, and were lowest
from 1900 to 1920. For WC-2, there was a large shift to eutrophentic species between 1951 and
1965, and it appears that nutrients (phosphorus?) have stayed high ever since. The shifting of the
City of Dover’s WWTP in the early 1970s may not have impacted the change in diatoms even 30
years later. A similar result is observed in LH-2 but there is little trend based on TSP. This
suggests that nutrients, including phosphorus and nitrogen, are a key parameter that results in an
ecological shift in diatom assemblages. Further analysis of the data is currently in progress to

22
evaluate this trend and the mechanism of change. This may be supported by the analysis of the
stable isotopes of C and N (Church et al., 2006 and others).
23
D) Summary and Conclusions
This study involved the chemical analysis of three dated sediment cores taken from the upper
tidal St. Jones Estuary. The cores were obtained and chronologies calculated by Dr. Christopher
Sommerfield (CMES, University of Delaware). The main objective was to evaluate historical
trends in organic chemical contaminants (e.g., polychlorinated biphenyls, chlordanes, and
polycyclic aromatic hydrocarbons) and nutrients (i.e., sediment phosphorus and nitrogen). An
additional objective was to evaluate if a historical record of eutrophication can be derived from
algae analysis, i.e., diatoms, from the sediments along with other indicators of ecosystem change
(e.g., δ13C-OM and δ15N-TN).
Organic contaminants, notably PCBs, DDX, PAHs, and chlordanes show distinct profiles in
the sediments suggesting changes in the source and deposition over time. For example, total
PCBs showed higher concentrations at depth with decreasing concentrations towards the surface.
Total PCBs, DDX and chlordane concentrations showed a sharp maximum at similar depths
decreasing towards the surface; especially in the upper sections (near the 1960s or 1970s). The
congener composition of the PCBs showed a shift from mid to higher molecular weight
compounds (i.e., homologs 5+6+7) to lower molecular weight compounds (i.e., homologs
3+4+5) from the upper sections to the lower sections. While post-depositional alterations may
have occurred, these changes can also be due to changes in the type, use, source and importantly
degradation of PCBs over time.
Total PAHs showed a distinct peak concentrations are depth in two cores (WC-1 and LH-2)
with low and little trend in WC-2. In LH-2, total PAH concentrations were some of the highest
concentrations observed (Kennish, 1992 and others) and maybe related to an adjacent
contaminated site (US EPA, 1994). Sources in WC-1 suggest petrogenic inputs while in LH-2,
sources appear to be mostly combustion products. Further analysis will be undertaken to help
evaluate the source of these inputs to these depths.
Preliminary analysis of the diatom assemblages and metrics indicate a shift toward more
eutrophic species starting in the late 1940s. Only in WC-1 was there a possible relationship
between total sediment P and diatom metrics, suggesting nitrogen enrichment is also causing an
impact to the diatom community. While diatom indices in WC-2 remain constant from the 1950s
24
to the present, the eutrophic index in WC-1 and LH-2 shows some sign of decreasing possibly
related to nutrient controls and treatment.
Overall, this study documents the chemical analysis of three cores taken around the upper
tidal St. Jones Estuary. Changes were observed in contaminant levels across time that reflect
usage globally and most likely locally. There was in one core a clear shift in diatom species that
reflect eutrophic conditions and this correlates to some degree with sediment P levels suggesting
that phosphorus levels could be more limiting to species development and growth in the long
term. Further analysis of the data will be undertaken to better quantify relationships observed in
the data. Additionally, isotopic data of C and N, to be completed in the future, will help this
interpretation process.
25
E) Acknowledgments
We would like to thank Don Charles, Paul Kiry, Amy Farrell, Olivia Gibb, Mike Schafer, and
Linda Zaoudeh for laboratory assistance and data interpretation. Jason Zalack did diatom counts
and calculated diatom metrics. Roger Thomas assisted in final report preparation.

Table 1. Concentrations of various parameters for Core WC-1.
Core ID
Depth Interval
Mid Point
Chem ID#
Approx Date SN SC C/N δ15N δ13C TSP
Total PAHs
Total PCBs
Total DDX
Total Chlordanes
cm cm yr % % molar permil permil μg/g μg/g ng/g ng/g ng/g
WC 1 0-2 1 6127 2003 0.50 5.86 13.7 ND ND 912 1.06 39.3 20.25 3.64
WC 1 4-6 5 6129 1998 0.44 5.50 14.6 ND ND 735 1.85 78.5 23.59 3.58
WC 1 10-12 11 6132 1992 0.48 3.35 8.10 ND ND ND 2.22 31.5 15.55 2.17
WC 1 20-22 21 6137 1981 0.42 5.59 15.4 ND ND 679 0.95 88.6 19.63 3.09
WC 1 30-32 31 6142 1971 0.38 4.92 15.0 ND ND 1944 0.84 100.8 24.41 7.30
WC 1 40-42 41 6147 1960 0.34 4.36 14.8 ND ND 1759 1.15 139.3 38.04 1.99
WC 1 50-52 51 6152 1950 0.41 5.86 16.8 ND ND 1108 2.25 138.6 165.4 2.20
WC 1 60-62 61 6157 1939 0.49 7.00 16.7 ND ND 591 4.14 35.4 6.40 0.96
WC 1 70-72 71 6162 1929 0.43 5.79 15.8 ND ND 868 62.4 7.8 1.55 0.89
WC 1 80-82 81 6167 1919 0.75 12.96 20.2 ND ND 780 243 37.9 54.43 16.07
WC 1 90-92 91 6172 1908 0.53 7.66 16.9 ND ND 1425 43.8 5.5 2.02 0.90
WC 1 100-102 101 6177 1898 0.59 9.08 17.8 ND ND 832 5.65 4.2 1.81 1.07 Concentrations on a dry weight basis. ND- Not determined, NC – Not calculated. . Total PAHs is the sum of 39 individual compounds, total PCBs is the sum of 110 congeners, total DDX is the sum of o,p+pp forms of DDD, DDE, and DDT, and total chlordane is the sum of alpha+gamma chlordane, heptachlor, heptachlor epoxide, oxychlordane, nonachlor and nonachlor epoxide (See Appendix XX).
27
Table 2. Concentrations of various parameters for Core WC-2.
Core ID Depth
Interval Mid
Point Chem ID#
Approx Date SN SC C/N δ15N δ13C TSP
Total PAHs
Total PCBs
Total DDX
Total Chlordanes
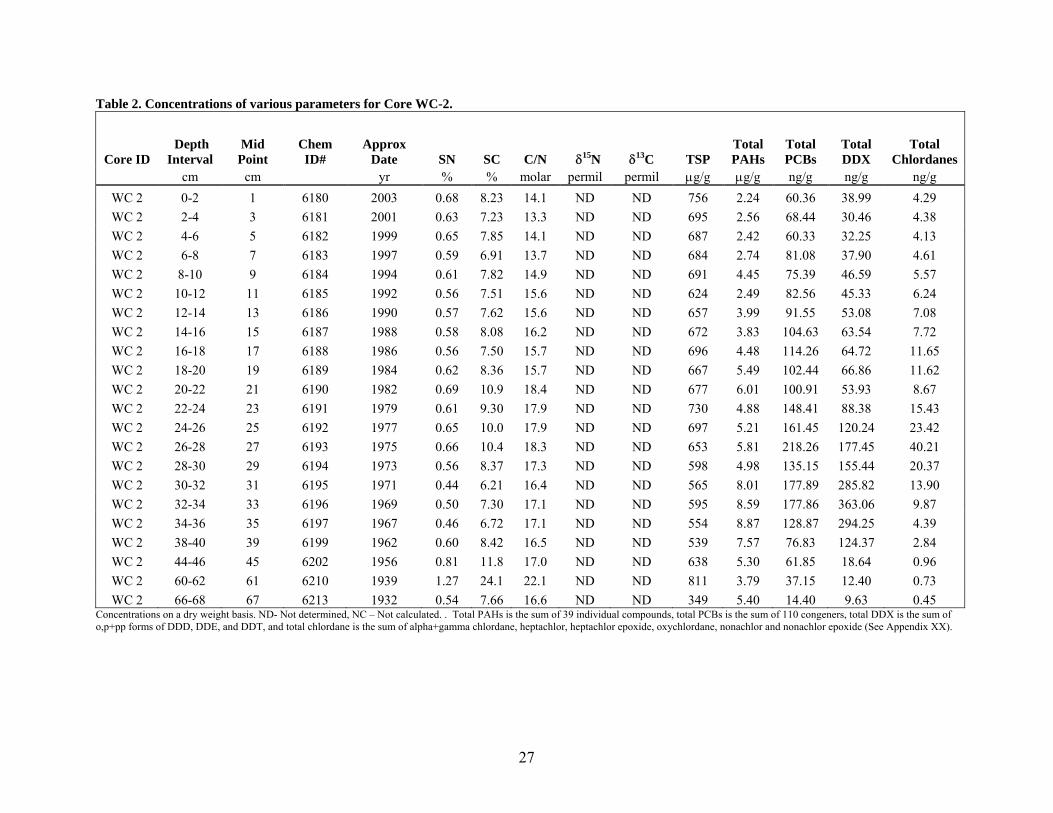
cm cm yr % % molar permil permil μg/g μg/g ng/g ng/g ng/g WC 2 0-2 1 6180 2003 0.68 8.23 14.1 ND ND 756 2.24 60.36 38.99 4.29 WC 2 2-4 3 6181 2001 0.63 7.23 13.3 ND ND 695 2.56 68.44 30.46 4.38 WC 2 4-6 5 6182 1999 0.65 7.85 14.1 ND ND 687 2.42 60.33 32.25 4.13 WC 2 6-8 7 6183 1997 0.59 6.91 13.7 ND ND 684 2.74 81.08 37.90 4.61 WC 2 8-10 9 6184 1994 0.61 7.82 14.9 ND ND 691 4.45 75.39 46.59 5.57 WC 2 10-12 11 6185 1992 0.56 7.51 15.6 ND ND 624 2.49 82.56 45.33 6.24 WC 2 12-14 13 6186 1990 0.57 7.62 15.6 ND ND 657 3.99 91.55 53.08 7.08 WC 2 14-16 15 6187 1988 0.58 8.08 16.2 ND ND 672 3.83 104.63 63.54 7.72 WC 2 16-18 17 6188 1986 0.56 7.50 15.7 ND ND 696 4.48 114.26 64.72 11.65 WC 2 18-20 19 6189 1984 0.62 8.36 15.7 ND ND 667 5.49 102.44 66.86 11.62 WC 2 20-22 21 6190 1982 0.69 10.9 18.4 ND ND 677 6.01 100.91 53.93 8.67 WC 2 22-24 23 6191 1979 0.61 9.30 17.9 ND ND 730 4.88 148.41 88.38 15.43 WC 2 24-26 25 6192 1977 0.65 10.0 17.9 ND ND 697 5.21 161.45 120.24 23.42 WC 2 26-28 27 6193 1975 0.66 10.4 18.3 ND ND 653 5.81 218.26 177.45 40.21 WC 2 28-30 29 6194 1973 0.56 8.37 17.3 ND ND 598 4.98 135.15 155.44 20.37 WC 2 30-32 31 6195 1971 0.44 6.21 16.4 ND ND 565 8.01 177.89 285.82 13.90 WC 2 32-34 33 6196 1969 0.50 7.30 17.1 ND ND 595 8.59 177.86 363.06 9.87 WC 2 34-36 35 6197 1967 0.46 6.72 17.1 ND ND 554 8.87 128.87 294.25 4.39 WC 2 38-40 39 6199 1962 0.60 8.42 16.5 ND ND 539 7.57 76.83 124.37 2.84 WC 2 44-46 45 6202 1956 0.81 11.8 17.0 ND ND 638 5.30 61.85 18.64 0.96 WC 2 60-62 61 6210 1939 1.27 24.1 22.1 ND ND 811 3.79 37.15 12.40 0.73 WC 2 66-68 67 6213 1932 0.54 7.66 16.6 ND ND 349 5.40 14.40 9.63 0.45
Concentrations on a dry weight basis. ND- Not determined, NC – Not calculated. . Total PAHs is the sum of 39 individual compounds, total PCBs is the sum of 110 congeners, total DDX is the sum of o,p+pp forms of DDD, DDE, and DDT, and total chlordane is the sum of alpha+gamma chlordane, heptachlor, heptachlor epoxide, oxychlordane, nonachlor and nonachlor epoxide (See Appendix XX).

28
Table 3. Concentrations of various parameters for Core LH-2.
Core ID
Depth Interval
Mid Point
Chem ID#
Approx Date SN SC C/N δ15N δ13C TSP
Total PAHs
Total PCBs
Total DDX
Total Chlordanes
cm cm yr % % molar permil permil μg/g μg/g ng/g ng/g ng/g
LH 2 0-2 1 6214 2003 0.96 14.4 17.5 ND ND 785 19.5 166.1 114.1 48.4
LH 2 4-6 5 6216 1998 0.27 3.90 16.7 ND ND 319 11.5 147.8 112.6 25.5
LH 2 14-16 15 6221 1986 0.25 3.56 16.3 ND ND 357 5.8 213.0 76.7 50.5
LH 2 20-22 21 6224 1979 0.56 11.9 24.8 ND ND 767 8.2 782.0 206.2 88.4
LH 2 26-28 27 6227 1971 0.50 10.4 24.3 ND ND 575 14.9 453.8 314.9 16.3
LH 2 30-32 31 6229 1966 0.36 5.39 17.6 ND ND 730 41.4 267.0 427.2 15.8
LH 2 34-36 35 6231 1961 0.31 4.46 16.8 ND ND 681 60.9 242.7 227.3 8.8
LH 2 40-42 41 6234 1954 0.59 9.11 17.9 ND ND 572 246 278.9 78.9 67.4
LH 2 44-46 45 6236 1949 0.55 9.01 19.3 ND ND 608 1063 388.5 158.2 27.7
LH 2 50-52 51 6239 1942 0.64 11.7 21.3 ND ND 847 1111 282.1 331.3 13.6
LH 2 54-56 55 6241 1937 0.68 12.7 21.7 ND ND 817 1006 412.3 336.0 22.6
LH 2 60-62 61 6244 1929 0.60 8.19 15.8 ND ND 510 223 100.2 222.4 23.9
LH 2 64-66 65 6246 1924 0.61 8.84 16.8 ND ND 383 5.5 34.9 17.2 2.9 Concentrations on a dry weight basis. ND- Not determined, NC – Not calculated. . Total PAHs is the sum of 39 individual compounds, total PCBs is the sum of 110 congeners, total DDX is the sum of o,p+pp forms of DDD, DDE, and DDT, and total chlordane is the sum of alpha+gamma chlordane, heptachlor, heptachlor epoxide, oxychlordane, nonachlor and nonachlor epoxide (See Appendix XX).
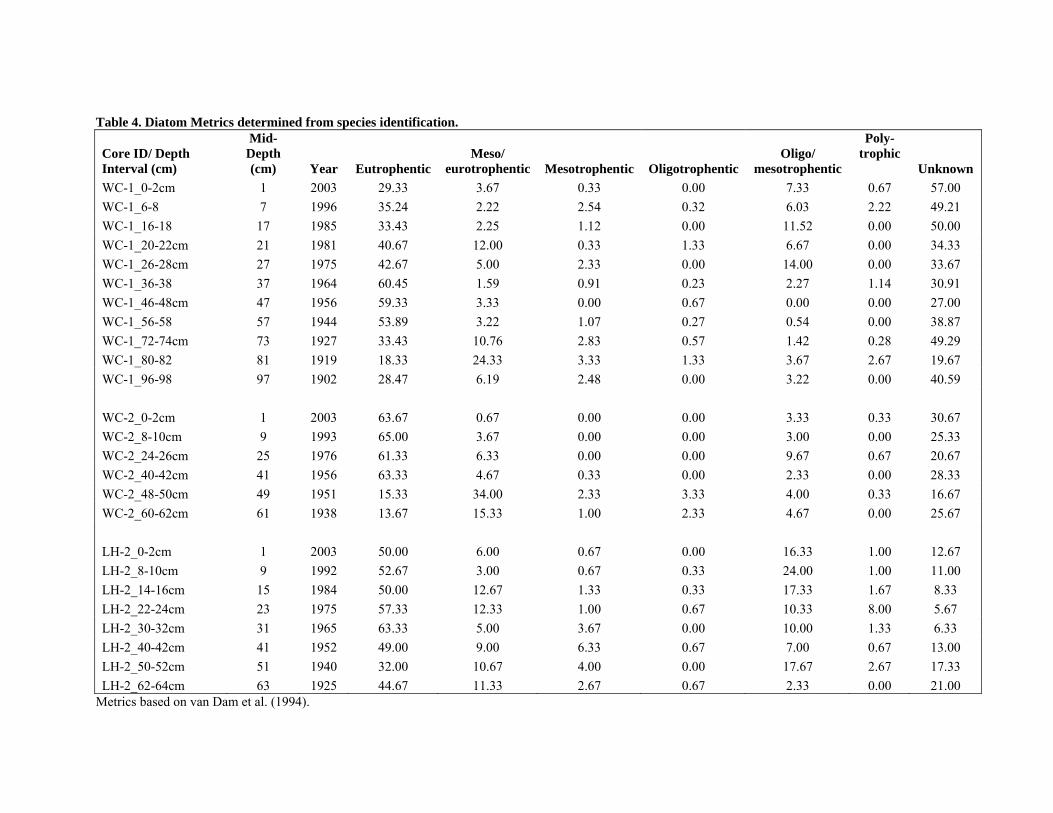
Table 4. Diatom Metrics determined from species identification.
Core ID/ Depth Interval (cm)
Mid-Depth (cm) Year Eutrophentic
Meso/ eurotrophentic Mesotrophentic Oligotrophentic
Oligo/ mesotrophentic
Poly- trophic
Unknown WC-1_0-2cm 1 2003 29.33 3.67 0.33 0.00 7.33 0.67 57.00 WC-1_6-8 7 1996 35.24 2.22 2.54 0.32 6.03 2.22 49.21 WC-1_16-18 17 1985 33.43 2.25 1.12 0.00 11.52 0.00 50.00 WC-1_20-22cm 21 1981 40.67 12.00 0.33 1.33 6.67 0.00 34.33 WC-1_26-28cm 27 1975 42.67 5.00 2.33 0.00 14.00 0.00 33.67 WC-1_36-38 37 1964 60.45 1.59 0.91 0.23 2.27 1.14 30.91 WC-1_46-48cm 47 1956 59.33 3.33 0.00 0.67 0.00 0.00 27.00 WC-1_56-58 57 1944 53.89 3.22 1.07 0.27 0.54 0.00 38.87 WC-1_72-74cm 73 1927 33.43 10.76 2.83 0.57 1.42 0.28 49.29 WC-1_80-82 81 1919 18.33 24.33 3.33 1.33 3.67 2.67 19.67 WC-1_96-98 97 1902 28.47 6.19 2.48 0.00 3.22 0.00 40.59 WC-2_0-2cm 1 2003 63.67 0.67 0.00 0.00 3.33 0.33 30.67 WC-2_8-10cm 9 1993 65.00 3.67 0.00 0.00 3.00 0.00 25.33 WC-2_24-26cm 25 1976 61.33 6.33 0.00 0.00 9.67 0.67 20.67 WC-2_40-42cm 41 1956 63.33 4.67 0.33 0.00 2.33 0.00 28.33 WC-2_48-50cm 49 1951 15.33 34.00 2.33 3.33 4.00 0.33 16.67 WC-2_60-62cm 61 1938 13.67 15.33 1.00 2.33 4.67 0.00 25.67 LH-2_0-2cm 1 2003 50.00 6.00 0.67 0.00 16.33 1.00 12.67 LH-2_8-10cm 9 1992 52.67 3.00 0.67 0.33 24.00 1.00 11.00 LH-2_14-16cm 15 1984 50.00 12.67 1.33 0.33 17.33 1.67 8.33 LH-2_22-24cm 23 1975 57.33 12.33 1.00 0.67 10.33 8.00 5.67 LH-2_30-32cm 31 1965 63.33 5.00 3.67 0.00 10.00 1.33 6.33 LH-2_40-42cm 41 1952 49.00 9.00 6.33 0.67 7.00 0.67 13.00 LH-2_50-52cm 51 1940 32.00 10.67 4.00 0.00 17.67 2.67 17.33 LH-2_62-64cm 63 1925 44.67 11.33 2.67 0.67 2.33 0.00 21.00
Metrics based on van Dam et al. (1994).
30
Table 5. List of compounds in Figure 7.
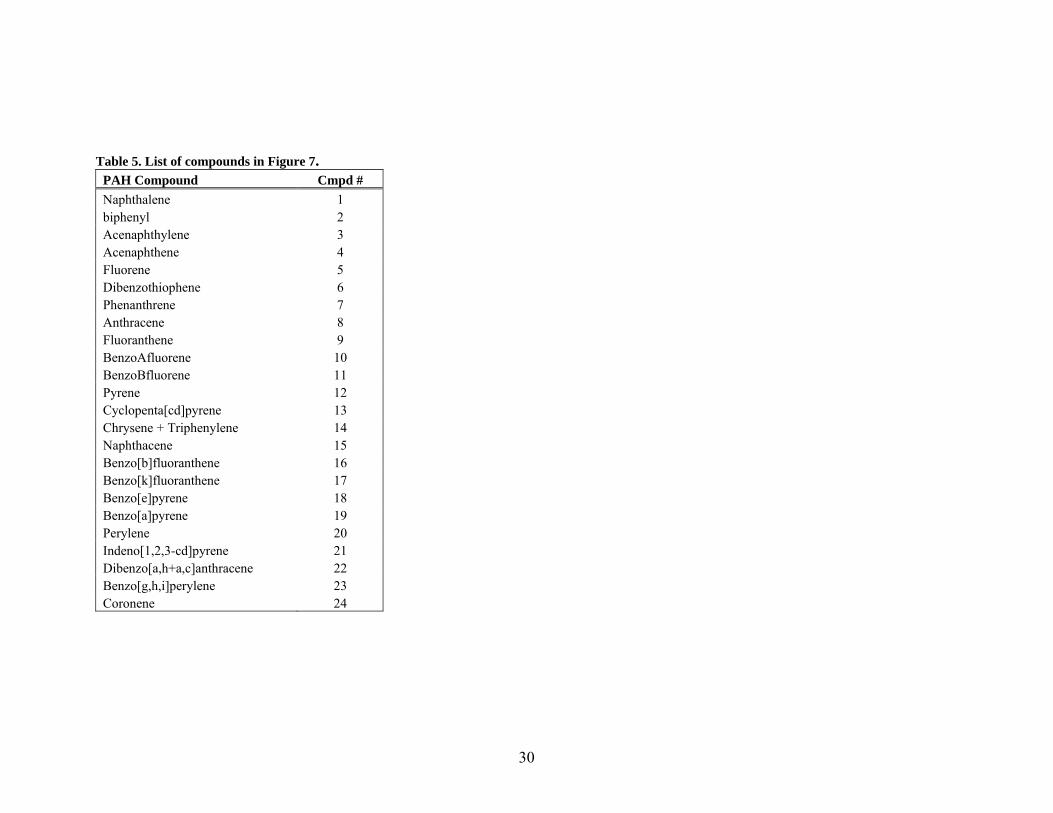
PAH Compound Cmpd # Naphthalene 1 biphenyl 2 Acenaphthylene 3 Acenaphthene 4 Fluorene 5 Dibenzothiophene 6 Phenanthrene 7 Anthracene 8 Fluoranthene 9 BenzoAfluorene 10 BenzoBfluorene 11 Pyrene 12 Cyclopenta[cd]pyrene 13 Chrysene + Triphenylene 14 Naphthacene 15 Benzo[b]fluoranthene 16 Benzo[k]fluoranthene 17 Benzo[e]pyrene 18 Benzo[a]pyrene 19 Perylene 20 Indeno[1,2,3-cd]pyrene 21 Dibenzo[a,h+a,c]anthracene 22 Benzo[g,h,i]perylene 23 Coronene 24

31
Table 6. Selected sediment data for the tidal Saint Jones River as presented in Hartwell, et.al., 2001.
PCB PAH DDT Chlordane TOC Station Description (ug/kg dw) (ug/kg dw) (ug/kg dw) (ug/kg dw) (%)
89 upper tidal 415.7 10977 170.0 74.6 20.5 90 mid tidal 50.4 1742 30.9 6.62 3.9 88 lower tidal 11.6 1178 9.32 2.12 5.07
PCB PAH DDT Chlordane TOC Station Description (ug/kg dw) (ug/kg dw) (ug/kg dw) (ug/kg dw) (%) LH-2 This Study 166.1 19500 114 48.4 14.4 WC-1 This Study 39.3 1060 20.3 3.64 5.86 WC-2 This Study 60.4 2240 39.0 4.29 8.23
Note: the individual compounds that are summed for the totals for both studies are slightly different.

32
Figure 1. Study area showing locations of cores analyzed in this study (Sommerfield, 2005).
33
0 5 10 15 20 25 30D
epth
(cm
)0
20
40
60
80
100
120
Total Sed C (% dw) and C/N (molar)0 5 10 15 20 25 30
Total CC/N
0 5 10 15 20 25 30
0 500 1000 1500 2000
Dep
th (c
m)
0
20
40
60
80
100
120
Total Sed P (μg/g dw)0 500 1000 1500 2000 0 500 1000 1500 2000
WC-1 WC-2 LH-2
Figure 2. Sediment organic carbon, C/N and sediment phosphorus distribution with depth.

34
Organic C (%)
0 5 10 15 20 25 30
Tota
l Sed
. P ( μ
g/g
dw)
500
1000
1500
2000
2500
WC-1WC-2LH-2
Figure 3. Relationship between sediment P and C.

35
Figure 4. Image of diatom assemblage from core LH-1 (16-20 cm).
36
0 20 40 60 80 100
Dep
th (c
m)
0
20
40
60
80
100
120
EutrophicMeso/eurotrophenticMesotrophenticOligotrophenticOligo/mesotrophentic
Diatom Metrics (%)0 20 40 60 80 100 0 20 40 60 80 100
WC-2WC-1 LH-2
Figure 5. Depth distribution of diatom metrics for St. Jones cores.
37
0 100 200 300 400 500
Dep
th (c
m)
0
20
40
60
80
100
120
Total PAHs (μg/g dw)0 2 4 6 8 10 0 500 1000 1500
0.0 0.2 0.4 0.6 0.8 1.00
20
40
60
80
100
120
LMW to TPAH0.0 0.2 0.4 0.6 0.8 1.0 0.0 0.2 0.4 0.6 0.8 1.0
WC-1 WC-2 LH-2
Dep
th (c
m)
Figure 6. Depth distribution of total PAHs and the LMW to tPAHs ratio with depth.

38
Compound Number1 2 3 4 5 6 7 8 9 10 11 12 13 14 15 16 17 18 19 20 21 22 23 24
0.0
0.5
1.0
0.0
0.5
1.0
0.0
0.5
1.0
0.0
0.5
1.0
0.0
0.5
1.0
0.0
0.5
1.0Rel
ativ
e Pe
rcen
t of T
otal
0.0
0.5
1.0
0.0
0.5
1.00.0
0.5
1.00-2 cm
2-4 cm
20-22 cm
50-52 cm
70=72 cm
80-82 cm
90-92 cm
100-102 cm
100-102 cm Dup
Figure 7. PAH compositional changes with depth in WC-1.

39
0 50 100 150 200D
epth
(cm
)0
20
40
60
80
100
1200.4 0.6 0.8 1.0
Total PCB (ng/g dw)0 50 100 150 200
LMW:tPCBs (X)0.4 0.6 0.8 1.0
0 500 1000
0.4 0.6 0.8 1.0
WC-1 WC-2 LH-2
25
500-2 cm4-6 cm
%TP
CB
s 25
5040-42 cm50-52 cm
25
5060-62 cm70-72 cm
1 2 3 4 5 6 7 8 9 10
25
5080-82 cm
Col 20 vs Col 3 0-2 cm4-6 cm
26-28 cm30-32 cm
34-36 cm38-40 cm
1 2 3 4 5 6 7 8 9 10
60-62 cm66-68 cm
0-2 cm4-6 cm
26-2830-32
40-42 cm44-46 cm
1 2 3 4 5 6 7 8 9 10
54-56 cm60-62 cm
Homlog Groupings Figure 8. Depth distribution of total PCBs and the LMW to tPCBs ratio with depth.

40
0 100 200 300 400 500
Dep
th (c
m)
0
20
40
60
80
100
120
Total DDX (ng/g dw)0 100 200 300 400 500 0 100 200 300 400 500
WC-1 WC-2 LH-2
Figure 9. Total DDX (DDT+DDD+DDE all forms) with depth in the St Jones Estuary.

41
0 10 20 30 40 50
Dep
th (c
m)
0
20
40
60
80
100
120
Total Chlordanes (ng/g dw)0 10 20 30 40 50 0 20 40 60 80 100
WC-1 WC-2 LH-2
Figure 10. Total chlordanes (all forms) with depth in the St Jones Estuary.

42
1880 1900 1920 1940 1960 1980 20000
50
100
225250
1880 1900 1920 1940 1960 1980 2000Tota
l PAH
s ( μ
g/g
dw)
0
5
10
15
20
Year1880 1900 1920 1940 1960 1980 20000
200
400
1000
1200
WC-1
WC-2
LH-2
Figure 11. Concentrations of tPAHs from 1900 to 2003.

43
1880 1900 1920 1940 1960 1980 20000
50
100
150
200
250
1880 1900 1920 1940 1960 1980 2000Tota
l PC
Bs
(ng/
g dw
)
0
50
100
150
200
250
Year1880 1900 1920 1940 1960 1980 20000
200
400
600
800
1000
WC-1
WC-2
LH-2
Figure 12. Concentrations of tPCBs from 1900 to 2003.

44
1880 1900 1920 1940 1960 1980 20000
100
200
300
400
500
1880 1900 1920 1940 1960 1980 2000Tota
l DD
X (n
g/g
dw)
0
100
200
300
400
500
Year1880 1900 1920 1940 1960 1980 20000
100
200
300
400
500
WC-1
WC-2
LH-2
Figure 13. Concentrations of tDDXs from 1900 to 2003.

45
1880 1900 1920 1940 1960 1980 20000
20
40
60
80
100
1880 1900 1920 1940 1960 1980 2000
Tota
l Chl
orda
nes
(ng/
g dw
)
0
20
40
60
80
100
Year1880 1900 1920 1940 1960 1980 20000
20
40
60
80
100
WC-1
WC-2
LH-2
Figure 14. Concentrations of total chlordanes from 1900 to 2003.

46
1880 1900 1920 1940 1960 1980 20000
20
40
60
80
100
0
500
1000
1500
2000
2500Diatom MetricTSP
1880 1900 1920 1940 1960 1980 2000
Dia
tom
Met
rics
(Eut
roph
ic %
)
0
20
40
60
80
100
0
500
1000
1500
2000
Diatom MetricTSP
Year1880 1900 1920 1940 1960 1980 20000
20
40
60
80
100 Tota
l Sed
imen
t P (m
g/g
dw)
0
200
400
600
800
1000
Diatom MetricTSP
WC-1
WC-2
LH-2
Figure 15. Depth distribution of eutrophication index (eutrophic only) derived from diatom composition with total sediment P.
47
F) References
Appleby, P.G. 2001. Chronostratigraphic techniques in recent sediments: Chapter 9. In: W.M. Last and J.P. Smol (eds). Tracking Environmental Change Using Lake Sediments Volume 1: Basin Analysis, Coring, and Chronological Techniques. Kluwer Academic Publishers, Dordrecht, The Netherlands. Appleby P.G and F. Oldfield. 1978. The calculation of lead-210 dates assuming a constant rate of supply of unsupported 210Pb to the sediment. Catena 5: 1-8. Ashley, J.T.F. and J.E. Baker. 1999. Hydrophobic organic contaminants in surficial sediments of Baltimore Harbor: Inventories and sources. Environ. Toxicol. Chem. 18: 838–849. Aspila,K.I, Aspila, H., Agemian A. and Chau, S.Y.,1976. A semi-automated method for the determination of inorganic and total phosphate in sediments. Analyst 101: 187-197. Bennion, H., P.G. Appleby, and G.L. Phillips. 2001. Reconstructing nutrient histories in the Norfolk Broads: implications for the application of diatom-phosphorus transfer functions to shallow lake management. Journal of Paleolimnology 26:181-204. Bennion, H., D. Monteith and G. Appleby. 2000. Temporal and geographical variation in lake trophic status in the English Lake District: evidence from (sub)fossil diatoms and aquatic macrophytes. Freshwater Biology 45:394-412. Berner, R. 1980. Early Diagenesis: A Theoretical Approach. Princeton University Press, 241 pp. Bradshaw, E.G. and N.J. Anderson. 2001. Validation of a diatom-phosphorus calibration set for Sweden. Freshwater Biology 46:1035-1048. Brown, J. F., D. L. Bedard, M. J. Brennan, J. C. Carnahan, H. Feng, and R. E. Wagner. 1987. Polychlorinated biphenyl dechlorination in aquatic sediments. Science 236:709-712. Brown, J. F., R. E. Wagner, D. L. Bedard, M. J. Brennan, J. C. Carnahan, R. J. May, and T. J. Tofflemire. 1984. PCB transformations in upper Hudson sediments. Northeast. Environ. Sci. 3:167-179. Brush G.S. 1984. Patterns of recent sediment accumulation in Chesapeake Bay (Virginia-Maryland, U.S.A) tributaries. Chemical Geology 44:227-242. Brush, G.S., E.A. Martin, R.S. DeFries, and C.A. Rice 1982. Comparisons of 210Pb and pollen methods for determining rates of estuarine sediment accumulation". Quaternary Research. 18: 196 - 217. Burdige, D.J. 2006. Geochemistry of Marine Sediments. Princeton University Press. 630 pp.
48
Church, T.M., C. Sommerfield, D.J. Velinsky, D. Point, C. Benoit, D. Amouroux, D. Plaa and O. Donard. 2006. Marsh sediments as records of sedimentation, eutrophication and metal pollution in the urban Delaware Estuary. Marine Chemistry 102(1-2):72-95 Cooper, S. R. and G.S. Brush. 1993. A 2,500-year history of anoxia and eutrophication in Chesapeake Bay Estuaries 16: 617-626. Cornwell J.C., J.C. Stevenson J.C., D.J. Conley D.J. and M. Owens. 1996. A sediment chronology of Chesapeake Bay eutrophication. Estuaries 19:488-499. Crusius, J. and R.F. Anderson. 1991. Core compression and surficial sediment loss of lake sediments of high porosity caused by gravity coring. Limnol. Oceanogr. 36:1021-1031.
Delaware Department of Natural Resources and Environmental Control (DNREC). 1999. Delaware National Estuarine Research Reserve: Estuarine Profiles: Dover, DE, DNREC, 164 pp. Dearth, M.A. and R.A. Hites. 1991. Complete analysis of technical chlordane using negative ionization mass spectrometry. Environ. Sci. Technol. 25:245-254. Dixit, S. S., and J. P. Smol. 1994. Diatoms and indicators in the environmental monitoring and assessment program-surface waters (EMAP-SW). Environmental Monitoring and Assessment. 31:275-306. Goel, A., L.L. Mcconnell, A. Torrents, J.R. Scudlark, and S. Simonich. 2006. Spray irrigation of treated municipal wastewater as a potential source of atmospheric PBDEs. Environ. Sci. Technol. 40:2142-2148. Gevo, B., J. Hamilton-Taylor, C. Murdoch, K.C. Jones, M. Kelly and B.J. Tabner. 1997. Depositional time trends and remobilization of PCBs in lake sediments. Environ. Sci. Technol. 31:3274-3280. Gschwend, P.M.and R.A. Hites 1981. Fluxes of PAHs to marine and lacustrine sediments in the NE United States. Geochim. Cosmochim. Acta. 45: 2359-2367 Hall, R.I., and J.P. Smol. 1992. A weighted-averaging regression and calibration model for inferring total phosphorus concentration from diatoms in British Columbia (Canada) lakes. Freshwater Biology. 27:417-434. Hartwell, S.I., J. Hameedi, and M. Harmon. 2001. Magnitude and extent of contaminated sediment and toxicity in Delaware Bay. NOAA Tech. Mem. NOS ORCA 148. NOAA, Silver Spring, MD. Hinaman, K.C. and F.J. Tenbus. 2000. Hydrogeology and Simulation of Ground-Water Flow at Dover Air Force Base, Delaware. Water-Resources Investigations Report 99-4224. USGS, Department of Interior, Baltimore, MD.

49
Hoffman, E.J., G.L. Mills, J.S. Latimer,and J.G. Quinn. 1984. Urban runoff as a source of polycyclic aromatic hydrocarbons to coastal waters. Environ. Sci. Technol. 18: 580-586. Hornberger, M.L., S.N. Luoma, A.Green, C. Fuller, and R. Anima. 1999. Historical trends of metals in the sediments of San Francisco Bay, California. Marine Chemistry. 64:39-55. Hydroqual. 2006. St. Jones Watershed Proposed TMDLs. DNRE0060; August 2006. Prepared for the Delaware Department of Natural Resources and Environmental Control, Dover DE. 67 pp. Kennish, M.J. 2004. Estuarine Research, Monitoring, and Resource Protection. ed: M.J. Kennish, CRC Press, Inc. Boca Raton, FL. Chapter 4. Kennish, M.J. 1992. Ecology of Estuaries: Anthropogenic Effects. ed: M.J. Kennish, CRC Press, Inc. Boca Raton, FL. 494 pp. Kucklick, J.R., H.R. Harvey, P.H. Ostrom, N.E. Ostrom, and J.E. Baker. 1996. Organochlorine dynamics in the pelagic food web of Lake Baikal. Environ. Toxicol. Chem. 15:1388-1400. Latimer, J.S. and J.G. Quinn. 1996. Historical trends and current inputs of HOCs in an urban estuary: The sedimentary record. Environ. Sci. Technol. 30:623-633. Leorri, E., R. Martin and P. MacLaughlin. 2006. Holocene environmetal and parasequence development of St. Jones Estuary, Delaware (USA): Formainiferal proxies of natural climatic and anthropogenic change. Palaeogeo. Palaeoclim. Palaeoecol. 241: 590-607. Moskalski, S.M. 2005. Palynologic Determination of Historical Sediment Accumulation Rates and Paleoecological Variation in Marshes on the St. Jones River, DE USA. MS Thesis Submitted to University of Delaware, Department of Geology, Newark, DE. National Oceanic and Atmospheric Administration (NOAA). 1993. National Status and Trends Program. Sampling and Analytical Methods of the National Status and Trends Program, National Benthic Surveillance and Mussel Watch Project 1984-1992, Volume III Comprehensive Description of Elemental Analytical Methods . NOAA Tech. Mem. NOS ORCA 71, National Ocean Service, Silver Spring, MD. Officer, C.B., D.R. Lynch, G.H. Setlock and G.R. Helz G.R.1984. Recent sedimentation rates in Chesapeake Bay. In: Kennedy VS (ed.). The Estuary as a Filter. Academic Press, New York, pp 131-157. O´Malley, V.P., Abrajano, T.A. and Hellou, J. 1996. Stable carbon isotopic apportionment of individual polycyclic aromatic hydrocarbons in St. John’s harbour, Newfoundland. Environ. Sci. Technol. 30:634-639. O’Malley, V.P., T.A. Abrajano and J. Hellou. 1994. Determination of 13C/12C ratios of individual PAH from environmental samples: Can PAH sources be source apportioned?

50
Org. Geochem. 21:809-815. Orson, R.A., R.L. Simpson and R.E. Good. 1992. A mechanism for accumulation and retention of heavy metals in tidal freshwater marshes of the upper Delaware River Estuary. Estuar. Coast. Shelf Sci. 34:171-186. Orson, R.A., R.L. Simpson and R.E. Good. 1990. Rates of sediment accumulation in a tidal freshwater marsh. J. Sed. Petrology. 60: 859-869. Owens, M. and J.C. Cornwell. 1995. Sedimentary evidence for decreased heavy metal inputs to the Chesapeake Bay. Ambio 24:24-27. Owens, M. and J.C. Cornwell. 2003. Delaware Tidal River Sediment-Water Exchange Study Interpretive Report Data Report to: DNREC March 2003, 22 pp. Pinkney, A.E. and J.C. Harshberger. 2004. Evaluation of Tumor Prevalence in Mummichogs (Fundulus heteroclitus) from the Delaware Estuary Watershed. Final Report CBFO-C04-04.US Fish and Wildlife Service, Annapolis, MD. Quensen, J.F., III, S.A. Boyd, and J.M. Tiedje. 1990. Dechlorination of four commercial polychlorinated biphenyl mixtures (Aroclors) by anaerobic microorganisms from sediments. Appl. Environ. Microbiol. 56:2360-2369. Quensen, J.F., III, J.M. Tiedje, and S.A. Boyd. 1988. Reductive dechlorination of polychlorinated biphenyls by anaerobic microorganisms from sediments. Science. 242:752-754. Reavie, E.D., R.I. Hall, and J.P. Smol. 1995. An expanded weighted-averaging model for inferring past total phosphorus concentrations from diatom assemblages in eutrophic British Columbia (Canada) lakes. Journal of Paleolimnology. 14:49-67. Ridgeway, J. and G. Shimmield. 2002. Estuaries as repositories of historical contamination and their impact on shelf seas. Estuar. Coast. Shelf Sci. 55:903-928. Riedel, G.R., D.J. Velinsky, J.T.F. Ashley and J.Cornwell. 2007. River Sediment Investigation near Poplar Point in the tidal Anacostia River, Washington, DC. Aquatic Geochemistry. (submitted). Ruttenberg, K.C. 1992. Development of a sequential extraction method for different forms of phosphorus in marine sediments. Limnol. Oceanogr. 37: 1460-1482. Schubel, J.R. and D.J. Hirschberg 1977. 210Pb determined sedimentation rate, and accumulation of metals in sediments at a station in Chesapeake Bay. Chesapeake Science. 18:379-382. Simpson, R.L., R.E. Good, R. Walker and B.R. Frasco. 1983. The role of Delaware River freshwater tidal wetlands in the retention of nutrients and heavy metals. J. Environ. Qual. 12:41-48.
51
Smol, J.P. 2002. Pollution of Lakes and Rivers: A Paleoenvironmetal Perspective. Arnold Press and Oxford University Press, NY. Sommerfield, C.K. 2005. Radioisotope Geochronology of St. Jones River Marsh Sediments, Delaware. Final Report Submitted to Delaware Department of Natural Resources and Environmental Control, Dover DE. State of Delaware; Division of Fish and Wildlife (2006). Fish Consumption Advisories (www.fw.delaware.gov/Fisheries/Advisories.htm). United States Environmental Protection Agency (U.S. EPA). 2006. Decision Rationale Total Maximum Daily Loads (TMDLs) for Bacteria and Nutrient Impairments on the St. Jones River Watershed, Delaware. US EPA, Region III. Dec. 2006. United States Environmental Protection Agency (U.S. EPA). 1994. EPA Superfund Record of Decision: DOVER GAS LIGHT CO. EPA ID: DED980693550. EPA/ROD/R03-94/186. US Environmental Protection Agency, Washington, DC, 73p. United States Environmental Protection Agency (U.S. EPA). 1987. Guidance for Sampling of and Analyzing for Organic Contaminants in Sediments. Office of Water Regulations and Standards, Criteria and Standards Division, Washington, D.C. Valette-Silver , N.J. 1993. The use of sediment cores to reconstruct historical trends in contamination of estuarine and coastal sediments. Estuaries. 16: 577-588. Van Metre, P.C., B.J. Mahler, and E.T. Furlong. 2000. Urban sprawl leaves its PAH signature. Environ. Sci. Technol. 34:4064-4070. van Dam, H., A.Mertens, and J. Sinkeldam. 1994. A coded checklist and ecological indicator values of freshwater diatoms from The Netherlands. Neth. J. Aquat. Ecol. 28:117–133. Velinsky, D.J., J.T.F. Ashley and G.R.Riedel. 2007. Sediment Contaminants in the upper Tidal Potomac River; Washington, DC: Spatial and Temporal Trends. Final Report submitted to Department of the Environment, District of Columbia. Wade, T.L., D.J. Velinsky, E. Reinharz, and C.E. Schlekat. 1994. Tidal river sediments in the Washington, D.C. area. II. Distribution and sources of chlorinated and non-chlorinated aromatic hydrocarbons. Estuaries. 17:321-333. Wakeham S.G., C. Schaffner and W. Giger. 1980. Polycyclic aromatic hydrocarbons in recent lake sediments—II. Compounds derived from biogenic precursors during early diagenesis. Geochim Cosmochim Acta. 44:415–429. Wilson, B. 2005. The paleoenvironmental history of the St Jones Estuary.: pre-Holocene to present. M.S. Thesis, University of Delaware, Newark, DE.

52
Woodwell, G.M., P.P. Craig and H.A. Johnson. 1971. DDT in the biosphere: Where does it go? Science. 174:1101-1107. Zhang, X., E.R. Christensen and M.F. Gin. 1993. Polycyclic aromatic hydrocarbons in dated sediments from Green Bay and Lake Michigan. Estuaries. 16:638-652.

53
Appendices
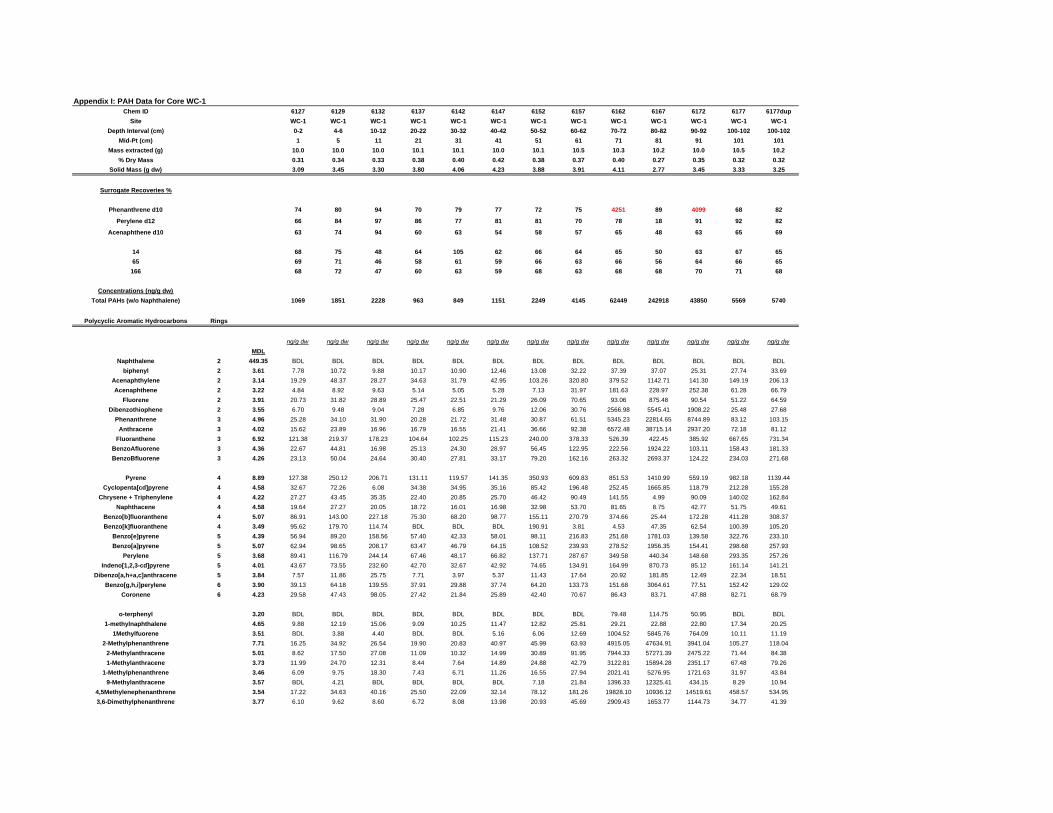
Appendix I: PAH Data for Core WC-1Chem ID 6127 6129 6132 6137 6142 6147 6152 6157 6162 6167 6172 6177 6177dup
Site WC-1 WC-1 WC-1 WC-1 WC-1 WC-1 WC-1 WC-1 WC-1 WC-1 WC-1 WC-1 WC-1Depth Interval (cm) 0-2 4-6 10-12 20-22 30-32 40-42 50-52 60-62 70-72 80-82 90-92 100-102 100-102
Mid-Pt (cm) 1 5 11 21 31 41 51 61 71 81 91 101 101Mass extracted (g) 10.0 10.0 10.0 10.1 10.1 10.0 10.1 10.5 10.3 10.2 10.0 10.5 10.2
% Dry Mass 0.31 0.34 0.33 0.38 0.40 0.42 0.38 0.37 0.40 0.27 0.35 0.32 0.32Solid Mass (g dw) 3.09 3.45 3.30 3.80 4.06 4.23 3.88 3.91 4.11 2.77 3.45 3.33 3.25
Surrogate Recoveries %
Phenanthrene d10 74 80 94 70 79 77 72 75 4251 89 4099 68 82pPerylene d12 66 84 97 86 77 81 81 70 78 18 91 92 82y
Acenaphthene d10 63 74 94 60 63 54 58 57 65 48 63 65 69
14 68 75 48 64 105 62 66 64 65 50 63 67 6565 69 71 46 58 61 59 66 63 66 56 64 66 65
166 68 72 47 60 63 59 68 63 68 68 70 71 68
Concentrations (ng/g dw)Total PAHs (w/o Naphthalene) 1069 1851 2228 963 849 1151 2249 4145 62449 242918 43850 5569 5740
Polycyclic Aromatic Hydrocarbons Rings
ng/g dw ng/g dw ng/g dw ng/g dw ng/g dw ng/g dw ng/g dw ng/g dw ng/g dw ng/g dw ng/g dw ng/g dw ng/g dwMDL
Naphthalene 2 449.35 BDL BDL BDL BDL BDL BDL BDL BDL BDL BDL BDL BDL BDLbiphenyl 2 3.61 7.78 10.72 9.88 10.17 10.90 12.46 13.08 32.22 37.39 37.07 25.31 27.74 33.69
Acenaphthylene 2 3.14 19.29 48.37 28.27 34.63 31.79 42.95 103.26 320.80 379.52 1142.71 141.30 149.19 206.13Acenaphthene 2 3.22 4.84 8.92 9.63 5.14 5.05 5.28 7.13 31.97 181.63 228.97 252.38 61.28 66.79
Fluorene 2 3.91 20.73 31.82 28.89 25.47 22.51 21.29 26.09 70.65 93.06 875.48 90.54 51.22 64.59Dibenzothiophene 2 3.55 6.70 9.48 9.04 7.28 6.85 9.76 12.06 30.76 2566.98 5545.41 1908.22 25.48 27.68
Phenanthrene 3 4.96 25.28 34.10 31.90 20.28 21.72 31.48 30.87 61.51 5345.23 22814.65 8744.89 83.12 103.15Anthracene 3 4.02 15.62 23.89 16.96 16.79 16.55 21.41 36.66 92.38 6572.48 38715.14 2937.20 72.18 81.12
Fluoranthene 3 6.92 121.38 219.37 178.23 104.64 102.25 115.23 240.00 378.33 526.39 422.45 385.92 667.65 731.34BenzoAfluorene 3 4.36 22.67 44.81 16.98 25.13 24.30 28.97 56.45 122.95 222.56 1924.22 103.11 158.43 181.33BenzoBfluorene 3 4.26 23.13 50.04 24.64 30.40 27.81 33.17 79.20 162.16 263.32 2693.37 124.22 234.03 271.68
Pyrene 4 8.89 127.38 250.12 206.71 131.11 119.57 141.35 350.93 609.83 851.53 1410.99 559.19 982.18 1139.44Cyclopenta[cd]pyrene 4 4.58 32.67 72.26 6.08 34.38 34.95 35.16 85.42 196.48 252.45 1665.85 118.79 212.28 155.28
Chrysene + Triphenylene 4 4.22 27.27 43.45 35.35 22.40 20.85 25.70 46.42 90.49 141.55 4.99 90.09 140.02 162.84Naphthacene 4 4.58 19.64 27.27 20.05 18.72 16.01 16.98 32.98 53.70 81.65 8.75 42.77 51.75 49.61
Benzo[b]fluoranthene 4 5.07 86.91 143.00 227.18 75.30 68.20 98.77 155.11 270.79 374.66 25.44 172.28 411.28 308.37Benzo[k]fluoranthene 4 3.49 95.62 179.70 114.74 BDL BDL BDL 190.91 3.81 4.53 47.35 62.54 100.39 105.20
Benzo[e]pyrene 5 4.39 56.94 89.20 158.56 57.40 42.33 58.01 98.11 216.83 251.68 1781.03 139.58 322.76 233.10Benzo[a]pyrene 5 5.07 62.94 98.65 208.17 63.47 46.79 64.15 108.52 239.93 278.52 1956.35 154.41 298.68 257.93
Perylene 5 3.68 89.41 116.79 244.14 67.46 48.17 66.82 137.71 287.67 349.58 440.34 148.68 293.35 257.26Indeno[1,2,3-cd]pyrene 5 4.01 43.67 73.55 232.60 42.70 32.67 42.92 74.65 134.91 164.99 870.73 85.12 161.14 141.21
Dibenzo[a,h+a,c]anthracene 5 3.84 7.57 11.86 25.75 7.71 3.97 5.37 11.43 17.64 20.92 181.85 12.49 22.34 18.51Benzo[g,h,i]perylene 6 3.90 39.13 64.18 139.55 37.91 29.88 37.74 64.20 133.73 151.68 3064.61 77.51 152.42 129.02
Coronene 6 4.23 29.58 47.43 98.05 27.42 21.84 25.89 42.40 70.67 86.43 83.71 47.88 82.71 68.79
o-terphenyl 3.20 BDL BDL BDL BDL BDL BDL BDL BDL 79.48 114.75 50.95 BDL BDL1-methylnaphthalene 4.65 9.88 12.19 15.06 9.09 10.25 11.47 12.82 25.81 29.21 22.88 22.80 17.34 20.25
1Methylfuorene 3.51 BDL 3.88 4.40 BDL BDL 5.16 6.06 12.69 1004.52 5845.76 764.09 10.11 11.192-Methylphenanthrene 7.71 16.25 34.92 26.54 19.90 20.83 40.97 45.99 63.93 4915.05 47634.91 3941.04 105.27 118.04
2-Methylanthracene 5.01 8.62 17.50 27.08 11.09 10.32 14.99 30.89 91.95 7944.33 57271.39 2475.22 71.44 84.381-Methylanthracene 3.73 11.99 24.70 12.31 8.44 7.64 14.89 24.88 42.79 3122.81 15894.28 2351.17 67.48 79.26
1-Methylphenanthrene 3.46 6.09 9.75 18.30 7.43 6.71 11.26 16.55 27.94 2021.41 5276.95 1721.63 31.97 43.849-Methylanthracene 3.57 BDL 4.21 BDL BDL BDL BDL 7.18 21.84 1396.33 12325.41 434.15 8.29 10.94
4,5Methylenephenanthrene 3.54 17.22 34.63 40.16 25.50 22.09 32.14 78.12 181.26 19828.10 10936.12 14519.61 458.57 534.953,6-Dimethylphenanthrene 3.77 6.10 9.62 8.60 6.72 8.08 13.98 20.93 45.69 2909.43 1653.77 1144.73 34.77 41.39

Appendix I: PAH Data for Core WC-2Chem ID 6180 6181 6182 6183 6184 6185 6185Rdup 6185Rtrip 6186 6187 6188 6189 6189dup 6189trip 6190 6191 6192 6193 6194 6195 6196 6197 6199 6202 6210 6210dup 6213
Site WC-2 WC-2 WC-2 WC-2 WC-2 WC-2 WC-2 WC-2 WC-2 WC-2 WC-2 WC-2 WC-2 WC-2 WC-2 WC-2 WC-2 WC-2 WC-2 WC-2 WC-2 WC-2 WC-2 WC-2 WC-2 WC-2 WC-2Depth Interval (cm) 0-2 2-4 4-6 6-8 8-10 10-12 10-12 10-12 12-14 14-16 16-18 18-20 18-20 18-20 20-22 22-24 24-26 26-28 28-30 30-32 32-34 34-36 38-40 44-46 60-62 60-62 66-68
Mid-Pt (cm) 1 3 5 7 9 11 11 11 13 15 17 19 19 19 21 23 25 27 29 31 33 35 39 45 61 61 67Mass extracted (g) 2.073 1.932 1.953 1.942 1.997 1.902 2.063 2.067 2.199 2.113 2.061 2.109 2.114 2.048 1.841 1.993 2.003 2.217 2.001 2.087 2.048 2.005 2.118 1.983 2.106 1.996 2.063
% Dry Mass 0.31 0.33 0.31 0.31 0.30 0.30 0.30 0.30 0.29 0.29 0.33 0.32 0.32 0.32 0.48 0.27 0.27 0.28 0.36 0.36 0.34 0.38 0.34 0.35 0.15 0.15 0.38Solid Mass (g dw) 0.64 0.64 0.60 0.60 0.61 0.58 0.63 0.63 0.64 0.61 0.68 0.67 0.67 0.65 0.89 0.53 0.55 0.61 0.72 0.75 0.70 0.76 0.72 0.70 0.32 0.30 0.78
Surrogate Recoveries %
Phenanthrene d10 67 83 91 94 45 67 79 94 84 70 91 75 83 76 69 83 66 73 67 77 81 62 102 102 60 83 62pPerylene d12 43 78 82 94 32 68 98 98 87 80 83 87 87 74 73 85 69 76 71 82 71 69 87 87 61 80 98y
Acenaphthene d10 79 95 81 84 29 72 78 101 85 76 85 80 86 73 66 77 64 76 71 72 72 68 96 88 65 76 74
14 90 86 89 86 90 84 87 87 84 90 82 81 86 89 85 82 80 88 86 81 82 90 83 84 86 88 9065 91 91 90 87 90 84 88 88 84 90 80 79 87 88 86 83 80 85 86 80 82 88 84 85 85 88 90166 95 91 88 90 93 84 92 91 85 91 80 80 89 93 88 88 83 86 91 77 81 91 84 87 90 90 92
Concentrations (ng/g dw)Total PAHs (w/o Naphthalene) 2019 2178 2200 2459 3820 2303 2406 2551 3812 3835 4046 5012 5123 4105 3502 4786 4555 4605 4026 6711 9097 8006 6675 3770 4711 5772 4840
Polycyclic Aromatic Hydrocarbons Rings
ng/g dw ng/g dw ng/g dw ng/g dw ng/g dw ng/g dw ng/g dw ng/g dw ng/g dw ng/g dw ng/g dw ng/g dw ng/g dw ng/g dw ng/g dw ng/g dw ng/g dw ng/g dw ng/g dw ng/g dw ng/g dw ng/g dw ng/g dw ng/g dw ng/g dw ng/g dw ng/g dwMDL
Naphthalene 2 2032 BDL BDL BDL BDL BDL BDL BDL BDL BDL BDL BDL BDL BDL BDL BDL BDL BDL BDL BDL BDL BDL BDL BDL BDL BDL 2256.31 BDLbiphenyl 2 16.34 56.77 58.86 61.42 60.67 68.09 64.31 59.45 60.14 63.77 66.58 60.74 61.30 61.31 63.44 46.09 77.60 74.60 66.50 57.51 56.77 62.08 57.96 74.09 56.00 123.45 130.91 45.62
Acenaphthylene 2 14.22 47.00 47.21 50.77 51.25 64.29 52.52 49.38 51.04 60.51 62.33 58.70 58.02 57.59 59.60 43.04 72.30 70.05 62.93 54.03 53.82 62.94 55.05 92.68 58.15 116.30 122.38 36.93Acenaphthene 2 14.58 51.81 51.93 54.10 54.55 62.47 56.34 54.34 52.64 58.96 63.31 56.65 57.72 57.29 58.67 43.27 73.25 70.41 63.42 53.89 52.35 57.19 55.45 67.57 56.43 115.99 122.38 41.15
Fluorene 2 17.68 60.80 63.42 65.59 68.44 65.28 69.69 63.77 66.04 64.39 69.53 65.12 65.03 64.88 65.43 48.13 81.95 78.78 73.17 64.75 63.99 75.15 75.69 168.99 92.62 119.72 126.64 47.54Dibenzothiophene 2 16.07 55.99 57.28 61.09 61.00 55.69 62.41 57.85 58.22 53.06 55.78 51.83 52.50 52.23 53.30 39.43 65.49 62.95 56.42 48.60 49.80 54.89 51.74 71.87 57.29 102.93 108.93 45.62
Phenanthrene 3 22.42 55.37 59.96 61.76 71.58 60.32 61.88 65.21 72.42 55.70 61.18 68.33 60.71 59.37 60.98 43.38 70.98 65.50 57.24 50.69 59.84 82.48 62.20 125.98 83.28 70.90 74.81 33.61Anthracene 3 18.19 48.08 49.73 52.27 54.88 46.77 54.26 52.10 53.60 44.22 46.95 48.04 45.94 44.04 46.23 33.44 56.59 56.04 48.46 40.94 47.80 70.27 58.23 122.23 63.18 78.67 83.34 36.81
Fluoranthene 3 31.29 113.54 123.85 121.35 154.89 130.23 124.64 141.92 166.69 134.21 130.71 147.18 134.54 131.24 123.03 92.19 152.74 136.28 132.36 125.88 181.81 324.32 261.09 698.99 420.57 103.24 111.22 42.30BenzoAfluorene 3 19.71 53.51 55.71 58.09 59.51 62.64 60.32 60.73 57.58 58.65 61.35 56.51 57.27 57.14 58.83 42.70 71.17 68.96 60.81 52.63 53.55 78.03 62.06 165.24 88.45 109.46 115.49 42.68BenzoBfluorene 3 19.26 56.93 58.86 62.59 64.30 68.25 65.35 62.01 64.44 65.32 68.87 62.64 62.79 62.79 63.90 47.22 80.44 77.14 68.46 58.76 60.38 83.49 73.58 206.31 104.82 120.65 126.32 45.88
Pyrene 4 40.22 117.73 123.85 122.35 159.52 139.48 128.10 150.55 182.96 140.26 142.32 155.94 142.44 145.08 138.85 98.06 163.15 150.47 146.99 144.81 193.46 338.69 273.79 778.21 562.44 101.37 105.97 43.58Cyclopenta[cd]pyrene 4 20.69 59.25 64.21 63.59 67.28 74.86 68.13 63.13 72.26 69.35 73.29 66.73 67.12 66.81 70.50 48.47 84.41 81.51 71.06 61.13 61.85 89.24 70.40 272.08 95.20 125.01 132.55 47.03
Chrysene + Triphenylene 4 19.10 50.26 52.88 55.10 58.68 67.92 56.68 55.30 63.17 64.70 66.42 61.47 61.75 62.65 63.13 44.63 75.71 74.60 64.72 55.28 57.57 85.64 64.05 311.62 124.78 111.01 118.11 37.32Naphthacene 4 20.72 66.39 62.32 65.09 72.07 76.19 68.13 63.61 63.80 73.54 74.43 72.28 72.64 69.79 74.65 52.76 84.04 85.51 74.31 64.61 65.47 70.70 61.80 162.19 83.57 139.31 145.67 48.69
Benzo[b]fluoranthene 4 22.93 77.87 102.13 97.88 129.60 130.23 99.85 141.44 139.57 123.97 121.87 136.67 127.38 130.05 119.50 82.81 141.76 146.83 115.61 99.28 140.31 330.65 175.87 359.76 164.41 111.01 120.74 42.56Benzo[k]fluoranthene 4 15.76 61.42 74.91 64.42 86.62 80.48 72.11 87.58 94.11 72.61 70.51 79.43 81.29 70.83 70.96 53.21 91.99 81.69 70.24 64.89 85.01 149.01 81.78 127.09 64.90 109.15 117.46 43.07
Benzo[e]pyrene 5 19.87 71.82 83.56 78.90 97.37 100.81 83.73 101.17 115.49 94.18 93.57 99.87 95.91 90.92 91.70 63.38 109.59 101.71 87.32 82.29 105.50 182.21 113.27 463.26 206.19 109.77 120.41 44.22Benzo[a]pyrene 5 22.91 75.07 87.03 82.56 103.15 94.20 87.37 105.32 136.86 103.64 101.59 108.05 102.17 105.20 96.46 67.78 121.32 116.26 97.07 89.26 113.26 231.93 134.32 615.47 234.77 116.92 127.30 46.26
Perylene 5 16.63 66.70 87.18 80.73 110.59 80.81 94.13 129.45 107.67 108.14 110.42 149.52 132.60 123.50 117.19 112.52 199.49 187.95 147.32 101.09 146.06 138.81 127.17 478.66 270.09 712.41 1034.49 1611.77Indeno[1,2,3-cd]pyrene 5 18.11 53.67 64.99 66.58 75.55 75.69 67.61 74.80 78.48 71.68 74.76 73.30 74.73 70.38 71.88 50.73 87.25 83.51 71.87 65.86 70.42 102.46 72.78 226.15 100.80 123.45 168.97 42.68
Dibenzo[a,h+a,c]anthracene 5 17.39 54.44 56.81 59.26 58.85 61.97 61.19 57.22 56.94 58.03 61.67 56.07 56.38 56.25 58.37 42.59 70.98 68.23 60.98 52.08 50.34 57.19 50.42 64.24 55.71 122.21 156.83 45.24Benzo[g,h,i]perylene 6 17.62 60.18 66.88 67.25 74.06 74.04 69.17 71.76 79.60 68.11 69.36 75.34 68.31 67.41 67.89 48.69 80.82 81.69 68.94 64.19 70.42 99.44 70.66 227.40 105.25 111.95 115.16 45.11
Coronene 6 19.11 63.28 66.73 69.58 71.91 69.91 72.81 71.44 72.42 63.77 63.47 63.22 61.90 62.94 64.05 44.74 73.63 78.05 62.93 59.60 59.44 73.86 55.84 92.13 ND 114.43 118.44 50.86
o-terphenyl 14.48 47.15 49.41 51.60 50.58 49.08 53.04 48.90 48.49 46.08 48.75 43.51 44.60 44.04 46.08 33.21 55.83 53.49 48.62 41.49 39.49 42.82 39.30 41.07 42.22 92.04 97.44 39.111-methylnaphthalene 21.04 58.79 60.59 61.42 61.49 72.72 63.79 62.49 62.05 67.65 71.00 65.12 65.18 65.92 68.35 49.14 83.09 78.24 72.03 63.22 60.65 67.25 62.72 79.08 68.35 129.98 136.82 43.32
1Methylfuorene 15.89 57.86 59.80 61.76 63.31 54.04 65.18 59.77 59.66 50.42 53.17 53.00 51.01 50.59 53.30 38.41 66.06 64.23 56.59 49.01 46.59 52.74 47.77 ND ND 105.41 113.85 48.052-Methylphenanthrene 34.86 56.62 56.18 59.93 62.49 53.88 61.88 58.49 62.37 55.85 74.11 56.80 58.02 58.33 49.92 44.40 74.38 1911.49 58.54 54.44 56.23 56.04 108.51 106.42 78.69 655.50 1127.34 43.58
2-Methylanthracene 22.66 57.08 58.54 58.76 62.32 59.83 61.02 60.09 65.88 56.94 60.20 56.51 60.26 57.29 57.91 44.40 67.38 64.77 58.05 50.82 55.83 69.69 54.52 84.22 69.07 103.55 109.91 43.071-Methylanthracene 16.86 54.13 57.44 59.09 58.02 58.17 62.23 56.10 56.47 55.70 57.42 51.54 54.59 52.38 55.29 41.69 67.76 66.23 56.91 50.41 52.08 61.36 51.34 65.35 72.94 110.39 116.47 44.47
1-Methylphenanthrene 15.63 55.06 55.40 58.09 59.51 36.69 63.10 56.26 59.66 34.29 35.99 35.19 35.35 33.93 33.18 24.85 41.64 38.57 37.07 32.86 34.01 41.10 35.20 62.16 56.57 63.12 65.29 43.839-Methylanthracene 16.13 52.43 56.02 58.09 58.35 57.35 59.98 56.42 55.67 52.44 56.44 50.52 52.65 52.38 53.14 37.62 63.97 61.68 55.28 47.06 46.99 49.72 44.20 47.03 55.14 103.55 111.22 44.35
4,5Methylenephenanthrene 15.99 50.41 51.78 54.27 61.49 45.45 54.78 54.82 61.25 43.75 48.09 50.23 43.70 42.56 44.24 34.23 60.00 56.58 50.89 44.84 55.43 66.24 79.40 162.88 125.78 75.25 81.04 39.743,6-Dimethylphenanthrene 17.04 51.34 52.72 55.10 55.05 55.20 57.20 53.06 53.28 51.82 54.64 49.21 50.71 49.85 51.76 37.73 63.59 60.77 54.96 47.20 46.46 51.01 46.32 54.66 51.84 102.93 108.27 41.79
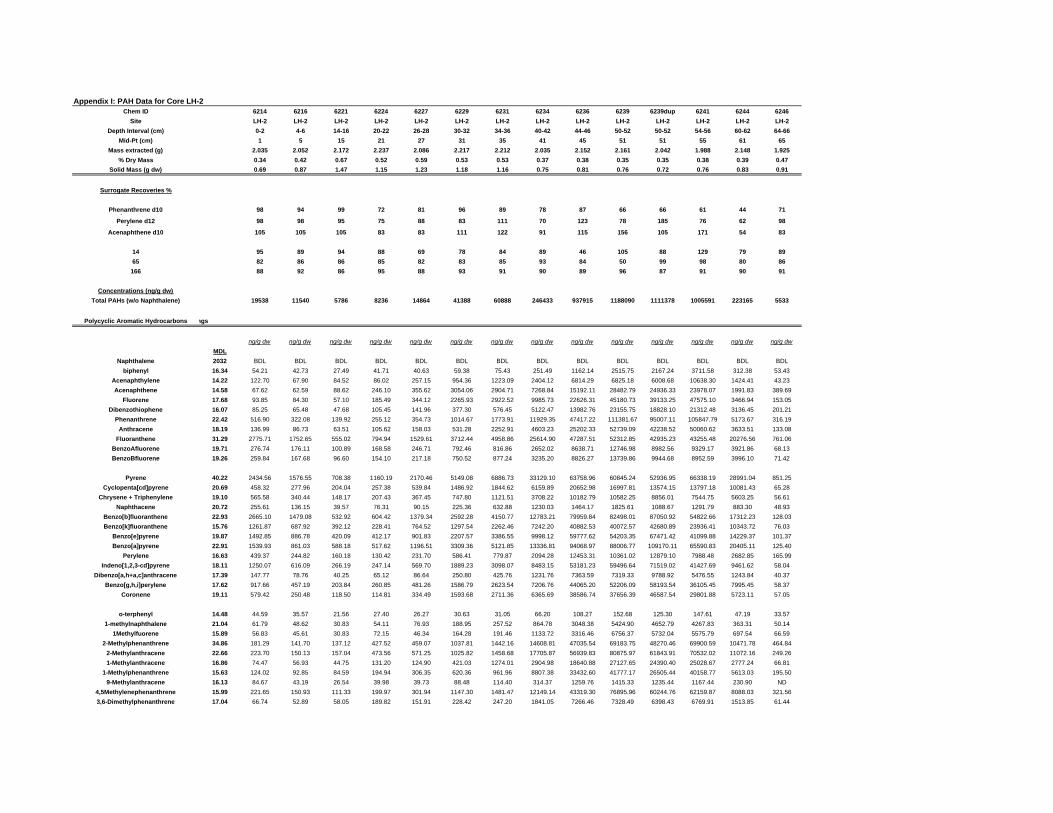
Appendix I: PAH Data for Core LH-2Chem ID 6214 6216 6221 6224 6227 6229 6231 6234 6236 6239 6239dup 6241 6244 6246
Site LH-2 LH-2 LH-2 LH-2 LH-2 LH-2 LH-2 LH-2 LH-2 LH-2 LH-2 LH-2 LH-2 LH-2Depth Interval (cm) 0-2 4-6 14-16 20-22 26-28 30-32 34-36 40-42 44-46 50-52 50-52 54-56 60-62 64-66
Mid-Pt (cm) 1 5 15 21 27 31 35 41 45 51 51 55 61 65Mass extracted (g) 2.035 2.052 2.172 2.237 2.086 2.217 2.212 2.035 2.152 2.161 2.042 1.988 2.148 1.925
% Dry Mass 0.34 0.42 0.67 0.52 0.59 0.53 0.53 0.37 0.38 0.35 0.35 0.38 0.39 0.47Solid Mass (g dw) 0.69 0.87 1.47 1.15 1.23 1.18 1.16 0.75 0.81 0.76 0.72 0.76 0.83 0.91
Surrogate Recoveries %
Phenanthrene d10 98 94 99 72 81 96 89 78 87 66 66 61 44 71pPerylene d12 98 98 95 75 88 83 111 70 123 78 185 76 62 98y
Acenaphthene d10 105 105 105 83 83 111 122 91 115 156 105 171 54 83
14 95 89 94 88 69 78 84 89 46 105 88 129 79 8965 82 86 86 85 82 83 85 93 84 50 99 98 80 86
166 88 92 86 95 88 93 91 90 89 96 87 91 90 91
Concentrations (ng/g dw)Total PAHs (w/o Naphthalene) 19538 11540 5786 8236 14864 41388 60888 246433 937915 1188090 1111378 1005591 223165 5533
Polycyclic Aromatic Hydrocarbons ngs
ng/g dw ng/g dw ng/g dw ng/g dw ng/g dw ng/g dw ng/g dw ng/g dw ng/g dw ng/g dw ng/g dw ng/g dw ng/g dw ng/g dwMDL
Naphthalene 2032 BDL BDL BDL BDL BDL BDL BDL BDL BDL BDL BDL BDL BDL BDLbiphenyl 16.34 54.21 42.73 27.49 41.71 40.63 59.38 75.43 251.49 1162.14 2515.75 2167.24 3711.58 312.38 53.43
Acenaphthylene 14.22 122.70 67.90 84.52 86.02 257.15 954.36 1223.09 2404.12 6814.29 6825.18 6008.68 10638.30 1424.41 43.23Acenaphthene 14.58 67.62 62.59 88.62 246.10 355.62 3054.06 2904.71 7268.84 15192.11 28482.79 24936.33 23978.07 1991.83 389.69
Fluorene 17.68 93.85 84.30 57.10 185.49 344.12 2265.93 2922.52 9985.73 22626.31 45180.73 39133.25 47575.10 3466.94 153.05Dibenzothiophene 16.07 85.25 65.48 47.68 105.45 141.96 377.30 576.45 5122.47 13982.76 23155.75 18828.10 21312.48 3136.45 201.21
Phenanthrene 22.42 516.90 322.08 139.92 255.12 354.73 1014.67 1773.91 11929.35 47417.22 111381.67 95007.11 105847.79 5173.67 316.19Anthracene 18.19 136.99 86.73 63.51 105.62 158.03 531.28 2252.91 4603.23 25202.33 52739.09 42238.52 50060.62 3633.51 133.08
Fluoranthene 31.29 2775.71 1752.65 555.02 794.94 1529.61 3712.44 4958.86 25614.90 47287.51 52312.85 42935.23 43255.48 20276.56 761.06BenzoAfluorene 19.71 276.74 176.11 100.89 168.58 246.71 792.46 816.86 2652.02 8638.71 12746.98 8982.56 9329.17 3921.86 68.13BenzoBfluorene 19.26 259.84 167.68 96.60 154.10 217.18 750.52 877.24 3235.20 8826.27 13739.86 9944.68 8952.59 3996.10 71.42
Pyrene 40.22 2434.56 1576.55 708.38 1160.19 2170.46 5149.08 6886.73 33129.10 63758.96 60845.24 52936.95 66338.19 28991.04 851.25Cyclopenta[cd]pyrene 20.69 458.32 277.96 204.04 257.38 539.84 1486.92 1844.62 6159.89 20652.98 16997.81 13574.15 13797.18 10081.43 65.28
Chrysene + Triphenylene 19.10 565.58 340.44 148.17 207.43 367.45 747.80 1121.51 3708.22 10182.79 10582.25 8856.01 7544.75 5603.25 56.61Naphthacene 20.72 255.61 136.15 39.57 76.31 90.15 225.36 632.88 1230.03 1464.17 1825.61 1088.67 1291.79 883.30 48.93
Benzo[b]fluoranthene 22.93 2665.10 1479.08 532.92 604.42 1379.34 2592.28 4150.77 12783.21 79959.84 82498.01 87050.92 54822.66 17312.23 128.03Benzo[k]fluoranthene 15.76 1261.87 687.92 392.12 228.41 764.52 1297.54 2262.46 7242.20 40882.53 40072.57 42680.89 23936.41 10343.72 76.03
Benzo[e]pyrene 19.87 1492.85 886.78 420.09 412.17 901.83 2207.57 3386.55 9998.12 59777.62 54203.35 67471.42 41099.88 14229.37 101.37Benzo[a]pyrene 22.91 1539.93 861.03 588.18 517.62 1196.51 3309.36 5121.85 13336.81 94068.97 88006.77 109170.11 65590.83 20405.11 125.40
Perylene 16.63 439.37 244.82 160.18 130.42 231.70 586.41 779.87 2094.28 12453.31 10361.02 12879.10 7988.48 2682.85 165.99Indeno[1,2,3-cd]pyrene 18.11 1250.07 616.09 266.19 247.14 569.70 1889.23 3098.07 8483.15 53181.23 59496.64 71519.02 41427.69 9461.62 58.04
Dibenzo[a,h+a,c]anthracene 17.39 147.77 78.76 40.25 65.12 86.64 250.80 425.76 1231.76 7363.59 7319.33 9788.92 5476.55 1243.84 40.37Benzo[g,h,i]perylene 17.62 917.66 457.19 203.84 260.85 481.26 1586.79 2623.54 7206.76 44065.20 52206.09 58193.54 36105.45 7995.45 58.37
Coronene 19.11 579.42 250.48 118.50 114.81 334.49 1593.68 2711.36 6365.69 38586.74 37656.39 46587.54 29801.88 5723.11 57.05
o-terphenyl 14.48 44.59 35.57 21.56 27.40 26.27 30.63 31.05 66.20 108.27 152.68 125.30 147.61 47.19 33.571-methylnaphthalene 21.04 61.79 48.62 30.83 54.11 76.93 188.95 257.52 864.78 3048.38 5424.90 4652.79 4267.83 363.31 50.14
1Methylfuorene 15.89 56.83 45.61 30.83 72.15 46.34 164.28 191.46 1133.72 3316.46 6756.37 5732.04 5575.79 697.54 66.592-Methylphenanthrene 34.86 181.29 141.70 137.12 427.52 459.07 1037.81 1442.16 14608.81 47035.54 69183.75 48270.46 69900.59 10471.78 464.84
2-Methylanthracene 22.66 223.70 150.13 157.04 473.56 571.25 1025.82 1458.68 17705.87 56939.83 80875.97 61843.91 70532.02 11072.16 249.261-Methylanthracene 16.86 74.47 56.93 44.75 131.20 124.90 421.03 1274.01 2904.98 18640.88 27127.65 24390.40 25028.67 2777.24 66.81
1-Methylphenanthrene 15.63 124.02 92.85 84.59 194.94 306.35 620.36 961.96 8807.38 33432.60 41777.17 26505.44 40158.77 5613.03 195.509-Methylanthracene 16.13 84.67 43.19 26.54 39.98 39.73 88.48 114.40 314.37 1259.76 1415.33 1235.44 1167.44 230.90 ND
4,5Methylenephenanthrene 15.99 221.65 150.93 111.33 199.97 301.94 1147.30 1481.47 12149.14 43319.30 76895.96 60244.76 62159.87 8088.03 321.563,6-Dimethylphenanthrene 17.04 66.74 52.89 58.05 189.82 151.91 228.42 247.20 1841.05 7266.46 7328.49 6398.43 6769.91 1513.85 61.44

Appendix G-II Concentrations of PCBs in Sediment CoresChem ID 6127 6129 6132 6137 6142 6147 6152 6157 6162 6167 6172 6177 6177dupSite WC-1 WC-1 WC-1 WC-1 WC-1 WC-1 WC-1 WC-1 WC-1 WC-1 WC-1 WC-1 WC-1Depth Interval (cm) 0-2 4-6 10-12 20-22 30-32 40-42 50-52 60-62 70-72 80-82 90-92 100-102 100-102Mid-Pt (cm) 1 5 11 21 31 41 51 61 71 81 91 101 101Mass extracted (g) 10.02 10.0 10.0 10.1 10.1 10.0 10.1 10.5 10.3 10.2 10.0 10.5 10.2% Dry Mass 0.31 0.34 0.33 0.38 0.40 0.42 0.38 0.37 0.40 0.27 0.35 0.32 0.32Solid Mass (g dw) 3.11 3.51 3.32 3.54 4.04 4.01 3.93 4.09 3.81 2.76 3.20 3.14 3.07
3.11Surrogate Recoveries %PCB 14 68 75 48 64 105 62 66 64 65 50 63 67 65PCB 65 69 71 46 58 61 59 66 63 66 56 64 66 65PCB 166 68 72 47 60 63 59 68 63 68 68 70 71 68
Concentrations (ng/g dw)Total PCBs 43.94 84.81 35.44 98.92 135.28 148.55 145.26 36.15 10.19 40.76 7.00 5.16 5.90
Polychlorinated Biphenyls MDL ng/g dw ng/g dw ng/g dw ng/g dw ng/g dw ng/g dw ng/g dw ng/g dw ng/g dw ng/g dw ng/g dw ng/g dw ng/g dw1 0.525 1.541 1.681 0.715 2.622 5.381 0.679 1.693 BDL 0.903 0.991 0.737 0.650 BDL3 3.014 3.150 4.702 3.200 7.811 29.098 8.721 4.972 BDL BDL BDL BDL BDL BDL4+10 0.093 0.109 0.193 BDL 0.223 0.100 ND 0.204 0.288 0.361 1.748 0.166 0.112 0.1287 0.020 0.025 0.046 BDL 0.037 1.725 0.046 0.030 0.021 0.048 0.029 BDL BDL 0.0276 0.038 0.060 0.051 BDL 0.113 0.720 0.113 0.100 BDL 0.058 0.083 0.066 BDL BDL8+5 0.211 1.224 5.427 0.371 18.851 0.578 BDL 0.827 2.208 1.374 11.266 1.165 0.409 0.45619 0.023 0.083 0.052 0.035 0.032 0.123 0.033 0.052 BDL 0.033 0.649 0.067 0.028 0.03612+13 0.063 0.069 0.166 0.082 0.194 0.436 0.148 0.146 BDL 0.076 0.304 0.073 BDL BDL18 0.075 0.369 0.773 0.260 0.493 0.430 0.846 0.490 BDL 0.088 0.629 0.093 BDL BDL17 0.064 0.258 0.624 0.205 0.475 0.485 0.595 0.321 0.094 0.162 0.573 0.077 BDL BDL24+27 0.087 BDL BDL BDL BDL BDL BDL BDL BDL BDL BDL BDL BDL BDL16+32 0.091 0.259 0.661 0.290 0.492 0.686 0.926 0.638 BDL BDL 1.668 BDL BDL BDL29 0.035 0.097 0.046 BDL BDL BDL 0.070 BDL BDL 0.057 1.034 0.047 BDL 0.03926 0.017 0.183 0.221 0.113 0.489 0.320 0.380 0.203 0.020 0.038 0.175 0.050 0.022 0.03425 0.014 0.163 0.159 0.075 0.261 0.279 0.266 0.169 0.021 0.029 0.091 0.033 0.020 0.02531+28 0.186 1.270 2.350 1.233 1.953 2.634 3.431 2.186 BDL BDL 0.595 BDL BDL BDL53+33+21 0.094 0.310 0.783 0.375 0.733 1.187 2.054 1.385 BDL BDL 0.259 BDL BDL BDL22 0.099 0.379 0.559 0.293 0.235 0.189 0.332 0.220 BDL BDL 0.787 BDL BDL BDL45 0.030 0.095 ND 0.090 0.254 0.233 0.368 0.994 0.034 0.191 0.634 0.142 0.033 0.09546 0.122 BDL 0.125 BDL 0.160 0.370 0.236 0.167 BDL BDL 0.856 BDL BDL BDL52 0.057 0.483 1.593 0.556 2.130 2.226 3.813 3.079 0.302 0.091 0.427 0.103 BDL 0.15549 0.046 0.633 1.420 0.695 2.284 2.854 4.143 3.477 0.254 BDL 0.203 BDL BDL BDL47 0.390 BDL 0.858 0.405 1.463 1.966 2.567 2.010 BDL BDL BDL BDL BDL BDL48 0.272 BDL 0.286 BDL BDL BDL BDL BDL BDL BDL BDL BDL BDL BDL44 0.075 0.480 1.296 0.507 1.323 1.350 2.489 1.979 0.187 0.089 0.280 0.081 BDL 0.10237+42 0.073 0.363 0.868 0.361 0.937 1.317 1.654 1.654 0.109 BDL 0.142 BDL BDL BDL41+71 0.086 0.468 1.656 0.409 1.022 0.833 1.792 1.238 0.104 BDL 0.178 BDL BDL BDL64 0.561 0.979 1.657 BDL ND 1.622 1.548 1.877 1.870 0.597 4.216 0.584 0.577 0.82440 0.025 0.159 0.612 0.164 1.039 3.005 1.223 0.990 0.062 0.090 0.213 0.064 BDL 0.035100 0.028 0.098 0.142 0.046 0.100 0.251 ND 0.058 0.052 0.042 2.057 0.038 BDL 0.04163 0.022 0.070 0.134 BDL ND 0.037 0.063 ND 0.102 0.106 4.715 0.119 0.041 0.10674 0.051 0.295 0.570 0.256 0.440 0.521 0.970 0.536 0.118 0.070 0.470 BDL BDL BDL70+76 0.086 1.126 2.346 0.975 2.297 3.259 5.202 4.427 0.418 0.132 0.228 BDL BDL BDL66 0.106 1.456 2.199 1.208 2.558 3.581 4.881 4.070 0.222 BDL 0.159 BDL BDL BDL95 0.040 0.672 2.134 0.603 1.992 2.603 4.974 4.107 0.324 0.046 0.108 BDL BDL 0.05991 0.032 0.276 0.480 0.149 0.860 1.379 1.849 1.660 0.106 0.047 0.049 BDL BDL BDL56+60 0.178 2.955 6.759 3.363 10.134 19.648 19.258 31.393 3.897 BDL 0.392 BDL BDL BDL101 0.026 0.794 1.933 0.745 1.639 2.153 4.361 4.074 0.385 0.041 0.101 0.041 BDL BDL99 0.028 0.918 1.629 0.663 1.814 2.572 3.141 2.652 0.216 BDL 0.068 0.029 BDL BDL83 0.012 0.027 0.072 0.027 ND 0.056 0.160 0.222 0.040 0.014 0.077 0.026 ND 0.01397 0.022 0.196 0.569 0.172 0.438 0.607 1.274 1.118 0.078 BDL 0.086 0.027 BDL 0.02587+81 0.227 0.273 0.663 BDL BDL BDL 0.535 0.438 BDL BDL BDL BDL BDL BDL85 0.004 0.985 1.333 0.825 1.056 1.014 1.938 2.504 0.237 0.010 0.005 ND ND ND136 0.016 0.063 0.311 0.090 0.307 0.496 0.721 0.592 2.375 0.020 0.100 0.027 ND 0.01877+110 0.046 1.124 2.761 0.956 1.998 2.559 5.522 4.822 0.139 BDL 0.158 BDL BDL BDL82 0.020 0.059 0.181 0.027 0.030 0.044 0.159 0.081 0.342 BDL 0.100 BDL BDL BDL151 0.026 0.257 0.472 0.188 0.279 0.310 0.925 0.664 BDL BDL 0.079 BDL BDL BDL135+144 0.014 0.184 0.419 0.125 0.279 0.321 0.776 0.640 0.086 BDL 0.058 0.015 ND BDL107 0.008 0.088 0.126 0.042 0.111 0.084 0.268 0.235 0.065 BDL 0.027 0.012 ND ND149 0.032 1.044 2.281 0.896 2.289 3.297 4.960 4.317 0.043 0.039 0.140 BDL BDL BDL118 0.080 0.716 1.701 0.590 1.256 1.561 3.205 2.529 0.480 BDL BDL BDL BDL BDL134 0.025 BDL 0.030 BDL 0.040 0.027 BDL 0.090 0.125 BDL 0.118 BDL BDL 0.030131 0.006 0.025 0.045 0.016 0.023 0.040 0.065 0.847 0.025 ND 0.034 ND ND ND146 0.018 0.369 0.715 0.286 0.674 0.791 1.208 1.022 BDL BDL 0.034 0.030 ND BDL153+132+105 0.087 2.653 5.154 2.260 4.958 6.926 10.076 8.371 0.769 BDL BDL BDL BDL BDL141 0.019 0.152 0.278 0.088 0.251 0.252 0.485 0.564 0.086 BDL 0.039 0.025 BDL 0.021137+176 0.015 0.022 0.135 0.051 0.114 0.085 0.455 0.266 BDL 0.024 BDL BDL 0.021 BDL163+138 0.045 1.799 3.527 1.332 2.015 2.272 5.690 4.536 0.353 BDL BDL BDL ND BDL158 0.154 0.200 0.430 BDL BDL 0.154 0.518 0.335 BDL BDL BDL BDL BDL BDL129+178 0.016 0.175 0.381 0.144 0.267 0.250 0.474 0.393 0.074 BDL 0.044 0.019 0.037 0.021187+182 0.119 1.020 1.125 0.497 0.976 1.250 1.822 1.398 0.392 BDL BDL BDL BDL ND183 0.021 0.243 0.492 0.217 0.413 0.507 1.004 0.889 0.372 0.024 0.036 0.033 0.050 0.060128 0.018 0.260 0.588 0.189 0.213 0.255 0.911 0.687 0.023 BDL 0.023 0.026 0.075 0.048185 0.010 0.023 0.059 0.025 0.060 0.041 0.136 0.103 BDL BDL 0.016 0.012 0.024 0.026174 0.025 0.314 0.615 0.231 0.404 0.557 1.214 1.100 0.095 BDL 0.033 0.046 0.049 0.061177 0.013 0.305 0.522 0.249 0.441 0.525 0.860 0.723 0.047 BDL 0.022 0.018 0.020 0.026202+171 0.134 0.324 0.431 0.174 0.413 0.424 0.573 0.500 0.303 BDL BDL BDL BDL BDL157+200 0.019 0.192 0.271 0.093 0.260 0.357 0.345 0.548 0.404 0.021 0.033 0.039 0.053 0.067172+197 0.018 0.089 0.180 0.069 ND 0.177 0.381 0.263 0.019 BDL BDL 0.029 0.038 0.023180 0.061 1.185 1.968 0.879 1.713 1.972 3.495 2.851 0.251 BDL BDL BDL BDL BDL193 0.018 0.176 0.162 0.081 0.158 0.167 0.343 0.239 0.020 BDL 0.022 0.042 0.047 0.036191 0.015 0.040 0.053 0.046 0.080 0.045 0.091 0.100 BDL BDL 0.016 0.017 0.025 0.024199 0.007 0.019 0.034 0.020 0.025 0.037 0.080 0.054 0.037 ND 0.007 BDL 0.019 0.010170+190 0.022 0.805 1.405 0.561 1.159 1.456 2.493 2.091 0.086 BDL 0.024 BDL BDL 0.028198 0.012 BDL BDL 0.013 ND 0.026 0.041 0.048 0.026 BDL BDL 0.025 0.018 0.016201 0.017 0.838 1.238 0.663 1.183 1.483 1.906 2.066 1.529 0.157 0.019 0.028 0.035 0.034203+196 0.021 0.854 1.299 0.669 1.338 1.611 2.019 2.367 2.560 0.182 0.042 0.037 0.037 0.042189 0.024 0.037 0.111 0.046 0.093 0.082 0.251 0.171 0.045 BDL 0.071 0.029 0.043 0.050208+195 0.024 1.516 1.998 1.052 1.941 2.272 2.670 3.524 3.823 0.494 0.050 0.077 0.093 0.038207 0.011 0.174 0.222 0.125 0.246 0.270 0.288 0.485 0.855 0.123 0.023 0.044 0.045 0.029194 0.011 0.313 0.470 0.231 0.484 0.640 0.766 0.703 0.180 0.016 0.020 0.019 0.019 0.020205 0.019 0.058 0.053 0.038 0.088 0.109 0.106 0.122 0.032 BDL BDL BDL BDL 0.033206 0.016 1.452 1.740 0.977 1.805 2.149 2.454 3.479 4.061 0.629 0.043 0.071 0.043 0.058209 0.074 0.796 0.959 0.540 1.006 1.093 1.277 1.855 2.431 0.618 0.158 0.298 0.261 0.245
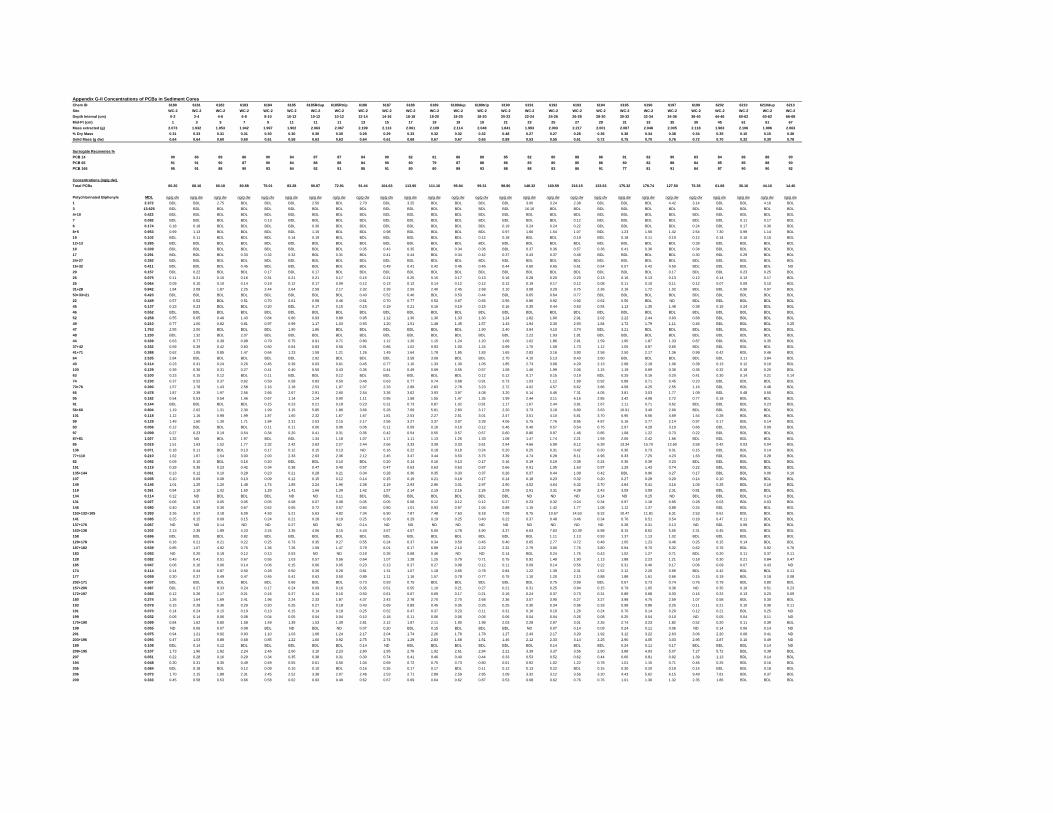
Appendix G-II Concentrations of PCBs in Sediment CoresChem ID 6180 6181 6182 6183 6184 6185 6185Rdup 6185Rtrip 6186 6187 6188 6189 6189dup 6189trip 6190 6191 6192 6193 6194 6195 6196 6197 6199 6202 6210 6210dup 6213Site WC-2 WC-2 WC-2 WC-2 WC-2 WC-2 WC-2 WC-2 WC-2 WC-2 WC-2 WC-2 WC-2 WC-2 WC-2 WC-2 WC-2 WC-2 WC-2 WC-2 WC-2 WC-2 WC-2 WC-2 WC-2 WC-2 WC-2Depth Interval (cm) 0-2 2-4 4-6 6-8 8-10 10-12 10-12 10-12 12-14 14-16 16-18 18-20 18-20 18-20 20-22 22-24 24-26 26-28 28-30 30-32 32-34 34-36 38-40 44-46 60-62 60-62 66-68Mid-Pt (cm) 1 3 5 7 9 11 11 11 13 15 17 19 19 19 21 23 25 27 29 31 33 35 39 45 61 61 67Mass extracted (g) 2.073 1.932 1.953 1.942 1.997 1.902 2.063 2.067 2.199 2.113 2.061 2.109 2.114 2.048 1.841 1.993 2.003 2.217 2.001 2.087 2.048 2.005 2.118 1.983 2.106 1.996 2.063% Dry Mass 0.31 0.33 0.31 0.31 0.30 0.30 0.30 0.30 0.29 0.29 0.33 0.32 0.32 0.32 0.48 0.27 0.27 0.28 0.36 0.36 0.34 0.38 0.34 0.35 0.15 0.15 0.38Solid Mass (g dw) 0.64 0.64 0.60 0.60 0.61 0.58 0.63 0.63 0.64 0.61 0.68 0.67 0.67 0.65 0.89 0.53 0.55 0.61 0.72 0.75 0.70 0.76 0.72 0.70 0.32 0.30 0.78
Surrogate Recoveries %PCB 14 90 86 89 86 90 84 87 87 84 90 82 81 86 89 85 82 80 88 86 81 82 90 83 84 86 88 90PCB 65 91 91 90 87 90 84 88 88 84 90 80 79 87 88 86 83 80 85 86 80 82 88 84 85 85 88 90PCB 166 95 91 88 90 93 84 92 91 85 91 80 80 89 93 88 88 83 86 91 77 81 91 84 87 90 90 92
Concentrations (ng/g dw)Total PCBs 60.20 68.16 60.18 80.88 75.01 83.28 90.87 72.91 91.44 104.63 113.90 111.16 95.84 99.31 98.80 148.32 160.59 216.15 133.63 175.32 178.74 127.50 76.35 61.68 30.16 44.16 14.40
Polychlorinated Biphenyls MDL ng/g dw ng/g dw ng/g dw ng/g dw ng/g dw ng/g dw ng/g dw ng/g dw ng/g dw ng/g dw ng/g dw ng/g dw ng/g dw ng/g dw ng/g dw ng/g dw ng/g dw ng/g dw ng/g dw ng/g dw ng/g dw ng/g dw ng/g dw ng/g dw ng/g dw ng/g dw ng/g dw1 2.372 BDL BDL 2.75 BDL BDL BDL 2.50 BDL 2.70 BDL 3.25 BDL BDL BDL BDL 3.00 3.24 2.38 BDL BDL BDL 4.42 3.14 BDL BDL 4.16 BDL3 13.625 BDL BDL BDL BDL BDL BDL BDL BDL BDL BDL BDL BDL BDL BDL BDL 16.16 BDL BDL BDL BDL BDL BDL BDL BDL BDL BDL BDL4+10 0.422 BDL BDL BDL BDL BDL BDL BDL BDL BDL BDL BDL BDL BDL BDL BDL BDL BDL BDL BDL BDL BDL BDL BDL BDL BDL BDL BDL7 0.092 BDL BDL BDL BDL 0.13 BDL BDL BDL BDL BDL BDL BDL BDL BDL BDL BDL BDL 0.12 BDL BDL BDL BDL BDL BDL 0.11 0.17 BDL6 0.174 0.18 0.18 BDL BDL BDL BDL 0.30 BDL BDL BDL BDL BDL BDL BDL 0.19 0.24 0.24 0.22 BDL BDL BDL BDL 0.24 BDL 0.17 0.36 BDL8+5 0.953 0.99 1.13 BDL BDL BDL BDL 1.15 BDL BDL 0.98 BDL BDL BDL BDL 0.97 1.66 1.54 1.07 BDL 1.23 1.56 1.42 2.54 7.30 0.99 1.14 BDL19 0.102 BDL 0.11 BDL BDL BDL 0.14 0.19 BDL BDL BDL BDL BDL BDL 0.12 0.18 BDL BDL 0.19 BDL 0.18 0.11 0.19 0.12 0.14 0.16 0.15 BDL12+13 0.285 BDL BDL BDL BDL BDL BDL BDL BDL BDL BDL BDL BDL BDL BDL BDL BDL BDL BDL BDL BDL BDL BDL 0.39 BDL BDL BDL BDL18 0.339 BDL BDL BDL BDL BDL BDL BDL BDL 0.35 0.43 0.35 BDL 0.34 0.36 BDL 0.37 0.36 0.57 0.36 0.41 0.36 BDL 0.34 BDL BDL BDL BDL17 0.291 BDL BDL BDL 0.33 0.32 0.32 BDL 0.31 BDL 0.41 0.44 BDL 0.34 0.42 0.37 0.43 0.37 0.46 BDL BDL BDL BDL 0.30 BDL 0.29 BDL BDL24+27 0.392 BDL BDL BDL BDL BDL BDL BDL BDL BDL BDL BDL BDL BDL BDL BDL BDL BDL BDL BDL BDL BDL BDL BDL BDL BDL BDL BDL16+32 0.411 BDL BDL BDL 0.45 BDL BDL BDL BDL BDL 0.49 0.41 0.42 0.45 0.46 0.44 0.60 0.65 0.61 0.54 0.57 0.42 0.50 BDL BDL BDL BDL ND29 0.157 BDL 0.22 BDL BDL 0.17 BDL 0.17 BDL BDL BDL BDL BDL BDL BDL BDL BDL BDL BDL BDL BDL BDL 0.17 BDL BDL 0.23 0.25 BDL26 0.075 0.11 0.21 0.15 0.16 0.31 0.21 0.21 0.17 0.15 0.21 0.20 0.15 0.17 0.13 0.16 0.28 0.20 0.23 0.13 0.16 0.13 0.13 0.12 0.14 0.13 0.17 BDL25 0.064 0.09 0.10 0.10 0.14 0.19 0.12 0.17 0.09 0.12 0.13 0.12 0.14 0.12 0.12 0.12 0.19 0.17 0.12 0.08 0.11 0.10 0.11 0.12 0.07 0.09 0.10 BDL31+28 0.842 1.84 2.08 1.87 2.25 2.44 2.64 2.59 2.17 2.32 2.39 2.55 2.40 2.45 2.68 2.10 3.08 3.29 3.75 2.36 2.16 1.72 1.02 BDL BDL 0.90 0.97 BDL53+33+21 0.423 BDL BDL BDL BDL BDL BDL BDL BDL 0.43 0.52 0.46 BDL 0.53 0.44 BDL 0.65 0.64 0.77 BDL BDL BDL BDL BDL BDL BDL BDL BDL22 0.449 0.57 0.52 BDL 0.51 0.70 0.61 0.58 0.46 0.61 0.70 0.77 0.52 0.67 0.66 0.56 0.86 0.92 0.92 0.62 0.56 BDL ND BDL BDL BDL BDL BDL45 0.137 0.23 0.23 BDL BDL 0.20 BDL 0.17 0.15 0.15 0.19 0.21 0.16 0.19 0.15 0.16 0.35 0.44 0.63 0.54 1.13 1.35 1.48 0.38 0.15 0.24 BDL BDL46 0.552 BDL BDL BDL BDL BDL BDL BDL BDL BDL BDL BDL BDL BDL BDL BDL BDL BDL BDL BDL BDL BDL BDL BDL BDL BDL BDL BDL52 0.258 0.55 0.65 0.49 1.43 0.84 0.80 0.93 0.89 0.95 1.12 1.30 1.30 1.33 1.30 1.24 1.82 1.90 2.91 2.02 2.22 2.44 0.93 0.68 BDL BDL BDL BDL49 0.210 0.77 1.00 0.82 0.81 0.97 0.99 1.17 1.03 0.93 1.20 1.51 1.48 1.45 1.57 1.43 1.94 2.30 2.93 1.84 1.72 1.79 1.11 0.46 BDL BDL BDL 0.2547 1.763 2.55 2.00 BDL BDL BDL 1.90 1.86 BDL BDL BDL BDL BDL BDL 1.90 2.40 3.94 4.10 3.74 BDL 3.21 BDL BDL BDL BDL BDL BDL BDL48 1.230 BDL 1.32 BDL 2.07 BDL BDL BDL BDL BDL BDL BDL BDL BDL BDL BDL 2.22 1.93 1.81 BDL BDL BDL BDL BDL BDL BDL BDL BDL44 0.339 0.63 0.77 0.39 0.98 0.79 0.75 0.91 0.71 0.80 1.12 1.26 1.15 1.24 1.20 1.06 1.62 1.86 2.91 1.59 1.95 1.87 1.33 0.87 BDL BDL 0.35 BDL37+42 0.332 0.59 0.39 0.42 0.83 0.60 0.64 0.83 0.56 0.91 0.86 1.02 0.93 1.00 1.24 0.99 1.70 1.58 1.73 1.12 1.05 0.97 0.65 BDL BDL BDL BDL BDL41+71 0.388 0.62 1.05 0.85 1.47 0.64 1.23 1.59 1.21 1.26 1.49 1.64 1.78 1.85 1.83 1.65 2.83 3.16 3.90 2.58 2.50 2.17 1.36 0.99 0.42 BDL 0.46 BDL64 2.535 2.84 BDL BDL BDL BDL BDL 2.92 BDL BDL BDL 3.58 3.09 BDL BDL 2.70 4.10 5.13 8.43 3.60 BDL BDL BDL BDL BDL 3.11 3.84 BDL40 0.114 0.23 0.31 0.24 0.26 0.45 0.39 0.63 0.61 0.45 0.77 1.10 1.33 1.30 1.05 1.85 2.73 3.68 4.29 2.13 2.68 2.18 1.06 0.38 0.13 0.12 0.16 BDL100 0.129 0.39 0.36 0.31 0.27 0.41 0.40 0.50 0.43 0.36 0.44 0.49 0.69 0.55 0.57 1.08 1.46 1.99 2.06 1.15 1.19 0.69 0.36 0.36 0.32 0.18 0.20 BDL63 0.100 0.23 0.15 0.12 BDL 0.11 BDL BDL 0.12 BDL BDL BDL BDL BDL 0.12 0.12 0.17 0.15 0.19 BDL 0.25 0.16 0.20 0.41 0.30 0.14 0.21 0.1474 0.230 0.37 0.52 0.37 0.62 0.59 0.58 0.83 0.50 0.46 0.63 0.77 0.74 0.68 0.91 0.73 1.03 1.12 1.69 0.92 0.88 0.71 0.45 0.23 BDL BDL BDL BDL70+76 0.390 1.57 1.78 1.43 2.58 2.16 2.18 2.53 1.97 2.07 2.33 2.89 2.83 2.78 3.23 2.72 4.02 4.57 6.62 3.86 4.58 4.25 2.55 1.16 BDL BDL 0.48 BDL66 0.478 1.87 2.39 1.97 2.56 2.66 2.67 2.91 2.60 2.54 3.36 3.62 3.93 3.97 4.08 3.20 5.14 5.46 7.31 4.05 3.81 3.03 1.77 1.09 BDL 0.48 0.55 BDL95 0.182 0.54 0.53 0.54 1.46 0.67 1.14 1.24 0.90 1.11 0.95 1.58 1.55 1.47 1.35 1.99 2.44 3.11 4.16 2.85 3.42 4.08 2.72 0.77 0.18 BDL BDL BDL91 0.144 BDL BDL BDL BDL 0.15 0.23 0.21 0.18 0.23 0.31 0.73 0.87 1.02 0.91 1.17 1.67 2.44 3.91 1.67 1.11 0.71 0.62 BDL BDL BDL 0.23 BDL56+60 0.804 1.19 2.62 1.31 2.30 1.99 3.15 5.85 1.86 3.66 5.28 7.69 5.81 2.83 3.17 2.20 3.73 3.18 6.80 3.63 10.91 3.49 2.90 BDL BDL BDL BDL BDL101 0.118 1.12 1.16 0.98 1.99 1.87 1.60 2.32 1.67 1.67 1.81 2.53 2.27 2.51 3.01 2.47 3.51 4.10 5.81 3.70 5.95 6.56 4.69 1.54 0.28 BDL BDL BDL99 0.129 1.49 1.60 1.30 1.71 1.84 2.31 2.53 2.15 2.17 2.56 3.27 3.37 3.07 3.39 4.06 5.75 7.76 8.95 4.87 5.16 3.77 2.14 0.97 0.17 BDL 0.14 BDL83 0.056 0.12 BDL BDL BDL 0.11 0.11 0.06 0.06 0.06 0.11 0.09 0.16 0.16 0.12 0.46 0.40 0.57 0.54 0.75 2.97 4.28 3.19 0.66 BDL BDL 0.09 BDL97 0.099 0.27 0.23 0.19 0.54 0.34 0.20 0.41 0.31 0.35 0.42 0.54 0.55 0.57 0.57 0.60 0.80 0.97 1.46 0.85 1.08 1.22 0.73 0.22 BDL BDL BDL BDL87+81 1.027 1.32 ND BDL 1.97 BDL BDL 1.34 1.18 1.07 1.17 1.11 1.13 1.25 1.33 1.08 1.47 1.74 2.21 1.93 2.06 2.42 1.66 BDL BDL BDL BDL BDL85 0.019 1.51 1.63 1.52 1.77 2.32 2.42 2.63 2.27 2.44 2.66 3.33 3.39 3.33 3.61 2.94 4.66 5.99 8.12 6.39 13.34 15.70 12.60 3.58 0.42 0.03 0.04 BDL136 0.071 0.18 0.11 BDL 0.13 0.17 0.12 0.15 0.13 ND 0.16 0.22 0.18 0.18 0.24 0.20 0.25 0.31 0.42 0.30 0.36 0.73 0.31 0.15 BDL BDL 0.14 BDL77+110 0.210 1.62 1.87 1.54 3.00 2.00 2.33 2.63 2.36 2.12 2.45 3.47 3.44 3.53 3.75 3.39 4.74 6.28 8.11 4.96 6.33 7.25 4.23 1.63 BDL BDL 0.28 BDL82 0.092 0.09 0.10 BDL 0.16 0.20 BDL BDL 0.10 BDL 0.20 0.14 0.16 0.13 0.17 0.16 0.19 0.19 0.38 0.24 0.36 0.39 0.23 BDL BDL BDL BDL BDL151 0.119 0.29 0.35 0.23 0.42 0.34 0.38 0.47 0.40 0.57 0.47 0.63 0.63 0.63 0.67 0.66 0.91 1.05 1.63 0.97 1.29 1.43 0.74 0.22 BDL BDL BDL BDL135+144 0.061 0.13 0.12 0.10 0.28 0.23 0.21 0.28 0.21 0.34 0.28 0.36 0.35 0.33 0.37 0.26 0.37 0.44 1.08 0.42 BDL 0.96 0.27 0.17 BDL BDL 0.06 0.10107 0.035 0.10 0.09 0.08 0.13 0.09 0.12 0.15 0.12 0.14 0.15 0.19 0.21 0.18 0.17 0.14 0.18 0.23 0.32 0.20 0.27 0.28 0.20 0.14 0.10 BDL BDL BDL149 0.146 1.01 1.25 1.20 1.48 1.74 1.85 2.24 1.96 2.38 2.19 2.93 2.96 3.01 2.97 2.90 4.02 4.64 6.32 3.70 4.84 5.41 3.16 1.06 0.25 BDL 0.19 BDL118 0.361 0.84 1.10 1.02 1.60 1.29 1.41 1.66 1.39 1.42 1.57 2.14 2.19 2.16 2.26 2.09 2.91 3.31 4.38 2.43 3.09 3.59 2.31 0.81 BDL BDL BDL BDL134 0.114 0.12 ND BDL BDL BDL ND ND 0.11 BDL BDL BDL BDL BDL BDL BDL ND ND ND 0.14 ND 0.15 ND BDL BDL BDL 0.14 BDL131 0.027 0.06 0.07 0.05 0.05 0.05 0.08 0.07 0.08 0.05 0.05 0.08 0.12 0.12 0.12 0.27 0.23 0.32 0.24 0.34 0.97 1.18 0.95 0.28 0.03 BDL 0.03 BDL146 0.080 0.40 0.39 0.30 0.67 0.62 0.65 0.72 0.57 0.84 0.80 1.01 0.93 0.97 1.04 0.88 1.15 1.42 1.77 1.08 1.12 1.37 0.89 0.24 BDL BDL BDL BDL153+132+105 0.393 3.26 3.57 3.18 6.09 4.93 5.21 5.63 4.82 7.34 6.90 7.87 7.48 7.63 8.18 7.09 9.75 10.67 14.53 9.32 10.47 11.81 6.31 2.53 0.61 BDL BDL BDL141 0.085 0.25 0.15 0.09 0.15 0.24 0.21 0.28 0.19 0.25 0.30 0.29 0.19 0.25 0.40 0.22 0.37 0.48 0.46 0.34 0.76 0.51 0.54 0.18 0.47 0.11 BDL BDL137+176 0.067 ND ND 0.14 ND ND 0.27 ND ND 0.14 ND ND ND ND ND ND ND ND ND ND 0.28 0.31 0.13 ND BDL 0.08 BDL BDL163+138 0.202 2.13 2.36 1.89 4.23 3.24 3.35 4.06 3.15 4.44 3.67 4.67 5.00 4.78 4.90 4.37 6.63 7.63 10.39 6.98 8.15 8.62 5.55 2.31 0.45 BDL BDL BDL158 0.696 BDL BDL BDL 0.82 BDL BDL BDL BDL BDL BDL BDL BDL BDL BDL BDL BDL 1.11 1.13 0.93 1.37 1.13 1.02 BDL BDL BDL BDL BDL129+178 0.074 0.16 0.21 0.21 0.22 0.25 0.73 0.35 0.27 0.55 0.24 0.37 0.34 0.50 0.45 0.40 0.65 2.77 0.72 0.48 1.05 1.23 0.46 0.25 0.15 0.14 BDL BDL187+182 0.539 0.85 1.07 4.92 0.76 1.36 7.26 1.59 1.47 3.79 6.01 6.17 6.99 2.10 2.22 2.32 2.79 3.60 7.76 3.80 5.94 9.70 5.32 0.62 0.76 BDL 0.92 0.76183 0.093 ND 0.20 0.18 0.12 0.13 0.53 ND ND 0.19 0.35 0.68 0.46 ND ND 0.14 BDL 0.24 1.75 0.43 1.52 1.27 0.71 BDL 0.20 0.11 0.37 0.11128 0.082 0.43 0.41 0.51 0.67 0.55 1.03 0.57 0.56 0.64 1.07 1.28 1.25 0.79 0.71 0.75 0.92 1.49 1.90 1.13 1.88 2.23 1.21 0.18 0.30 0.21 0.84 0.47185 0.047 0.06 0.16 0.06 0.14 0.06 0.15 0.06 0.05 0.23 0.13 0.37 0.27 0.08 0.12 0.11 0.09 0.14 0.56 0.22 0.31 0.40 0.17 0.06 0.09 0.07 0.43 ND174 0.114 0.14 0.44 0.87 0.50 0.28 0.50 0.26 0.26 0.81 1.31 1.07 1.18 0.65 0.78 0.84 1.22 1.39 2.31 1.52 2.12 2.20 0.96 BDL 0.42 BDL BDL 0.11177 0.059 0.30 0.37 0.49 0.47 0.45 0.41 0.63 0.50 0.89 1.11 1.16 1.57 0.78 0.77 0.75 1.10 1.20 2.13 0.88 1.88 1.61 0.66 0.15 0.19 BDL 0.18 0.08202+171 0.607 BDL BDL BDL BDL BDL 0.66 BDL BDL 0.73 0.93 0.75 BDL BDL BDL BDL BDL 0.75 0.99 BDL 0.67 0.73 0.74 0.76 0.79 BDL 0.80 BDL157+200 0.087 BDL 0.27 0.33 0.24 0.17 0.24 0.09 0.16 0.35 0.51 0.55 1.10 0.21 0.27 0.21 0.31 0.25 0.94 0.15 0.79 1.05 0.36 ND 0.35 0.19 0.51 0.23172+197 0.083 0.12 0.26 0.17 0.21 0.16 0.27 0.14 0.15 0.50 0.61 0.67 0.69 0.17 0.21 0.16 0.24 0.37 0.73 0.31 0.89 0.68 0.33 0.16 0.22 0.13 0.23 0.09180 0.274 1.26 1.64 1.69 2.41 1.96 2.24 2.33 1.87 4.37 2.43 2.78 2.70 2.70 2.68 2.36 3.57 3.90 5.27 3.27 3.98 4.75 2.59 1.07 0.58 BDL 0.30 BDL193 0.079 0.15 0.28 0.36 0.29 0.20 0.25 0.27 0.18 0.43 0.69 0.89 0.45 0.35 0.25 0.25 0.30 0.34 0.96 0.33 0.98 0.86 0.25 0.11 0.21 0.10 0.36 0.11191 0.070 0.14 0.24 0.15 0.19 0.13 0.15 0.14 0.18 0.25 0.52 0.47 0.37 0.23 0.11 0.31 0.16 0.19 1.26 0.24 0.70 0.14 0.20 0.12 0.21 BDL 0.25 ND199 0.032 0.06 0.14 0.06 0.08 0.04 0.05 0.04 0.04 0.10 0.18 0.11 0.06 0.06 0.06 0.06 0.04 0.04 0.26 0.08 0.25 0.04 0.10 ND 0.05 0.04 0.11 ND170+190 0.099 0.84 1.62 0.80 1.58 1.49 1.39 1.53 1.39 2.81 2.12 1.87 2.11 1.90 1.98 2.03 2.28 2.97 3.01 2.35 2.74 3.23 1.82 0.52 0.20 0.11 0.39 BDL198 0.055 ND 0.06 0.07 0.08 BDL ND BDL ND 0.07 0.20 BDL 0.15 BDL BDL BDL ND 0.07 0.14 0.09 0.24 0.11 0.06 ND 0.14 0.06 0.14 ND201 0.075 0.94 1.21 0.92 0.93 1.10 1.03 1.68 1.24 2.17 2.04 1.74 2.26 1.78 1.78 1.27 2.43 2.17 3.29 1.92 3.12 3.22 2.63 3.06 2.20 0.08 0.41 ND203+196 0.093 0.47 1.03 0.88 0.68 0.85 1.22 1.60 0.92 2.75 2.74 1.29 2.83 1.68 1.51 1.46 2.12 2.33 3.14 2.25 2.90 4.05 3.03 2.95 2.87 0.10 0.49 ND189 0.108 BDL 0.14 0.12 BDL BDL BDL BDL BDL 0.14 ND BDL BDL BDL BDL BDL BDL 0.14 BDL BDL 0.24 0.11 0.17 BDL BDL BDL 0.14 ND208+195 0.107 1.73 1.96 1.82 2.24 2.46 2.60 3.10 2.23 2.80 2.95 2.78 1.92 2.61 2.84 2.21 3.39 3.37 3.56 2.90 3.88 4.93 5.07 7.27 5.72 BDL 0.38 BDL207 0.051 0.22 0.28 0.16 0.29 0.34 0.35 0.38 0.31 0.30 0.74 0.41 0.46 0.40 0.44 0.33 0.53 0.52 0.62 0.44 0.66 0.81 0.92 1.39 1.13 BDL 0.14 BDL194 0.048 0.30 0.31 0.35 0.49 0.49 0.55 0.61 0.50 1.04 0.69 0.72 0.75 0.73 0.80 0.61 0.92 1.02 1.22 0.78 1.01 1.15 0.71 0.46 0.25 BDL 0.16 BDL205 0.084 BDL 0.18 BDL 0.12 0.09 0.10 0.10 BDL 0.16 0.35 0.17 0.17 BDL 0.11 0.12 0.13 0.22 BDL 0.15 0.30 0.20 0.18 0.14 BDL BDL 0.18 BDL206 0.073 1.70 2.15 1.88 2.31 2.45 2.52 3.38 2.07 2.46 2.53 2.71 2.89 2.59 2.85 2.09 3.32 3.12 3.56 3.20 4.43 5.62 6.15 9.49 7.81 BDL 0.37 BDL209 0.333 0.45 0.58 0.53 0.66 0.58 0.62 0.93 0.49 0.62 0.67 0.69 0.64 0.62 0.87 0.53 0.68 0.62 0.76 0.76 1.01 1.30 1.32 2.35 1.86 BDL BDL BDL

Appendix G-II Concentrations of PCBs in Sediment CoresChem ID 6214 6216 6221 6224 6227 6229 6231 6234 6236 6239 6239dup 6241 6244 6246Site LH-2 LH-2 LH-2 LH-2 LH-2 LH-2 LH-2 LH-2 LH-2 LH-2 LH-2 LH-2 LH-2 LH-2Depth Interval (cm) 0-2 4-6 14-16 20-22 26-28 30-32 34-36 40-42 44-46 50-52 50-52 54-56 60-62 64-66Mid-Pt (cm) 1 5 15 21 27 31 35 41 45 51 51 55 61 65Mass extracted (g) 2.035 2.052 2.172 2.237 2.086 2.217 2.212 2.035 2.152 2.161 2.042 1.988 2.148 1.925% Dry Mass 0.34 0.42 0.67 0.52 0.59 0.53 0.53 0.37 0.38 0.35 0.35 0.38 0.39 0.47Solid Mass (g dw) 0.69 0.87 1.47 1.15 1.23 1.18 1.16 0.75 0.81 0.76 0.72 0.76 0.83 0.91
Surrogate Recoveries %PCB 14 95 89 94 88 69 78 84 89 46 105 88 129 79 89PCB 65 82 86 86 85 82 83 85 93 84 50 99 98 80 86PCB 166 88 92 86 95 88 93 91 90 89 96 87 91 90 91
Concentrations (ng/g dw)Total PCBs 166.01 147.32 211.72 782.08 454.55 268.87 243.18 278.81 388.53 303.88 260.40 412.26 100.16 34.90
Polychlorinated Biphenyls MDL ng/g dw ng/g dw ng/g dw ng/g dw ng/g dw ng/g dw ng/g dw ng/g dw ng/g dw ng/g dw ng/g dw ng/g dw ng/g dw ng/g dw1 2.37 BDL BDL BDL BDL BDL BDL BDL BDL 2.70 BDL 3.64 2.82 BDL 2.633 13.62 BDL BDL BDL BDL 15.58 BDL 60.83 BDL 14.69 BDL BDL BDL BDL BDL4+10 0.42 BDL BDL BDL BDL 0.44 1.38 3.45 1.16 3.46 4.30 8.24 4.90 0.55 BDL7 0.09 BDL BDL BDL BDL BDL 0.13 0.26 BDL 0.14 0.60 0.97 1.03 BDL 0.116 0.17 BDL BDL BDL BDL 0.38 BDL 0.62 0.18 0.63 1.56 1.29 1.47 0.77 0.238+5 0.95 BDL 3.47 2.36 BDL 5.40 9.97 17.95 41.79 64.32 ND ND ND ND 9.6419 0.10 BDL 0.42 0.14 ND BDL 0.28 0.99 2.59 1.74 ND 5.07 3.23 2.44 0.2112+13 0.28 0.54 1.28 0.76 BDL 0.51 0.30 0.68 1.43 2.25 1.43 2.47 4.61 1.08 BDL18 0.34 0.67 1.84 0.98 2.21 1.47 0.50 0.77 2.47 3.06 1.81 7.36 8.14 2.39 BDL17 0.29 BDL 0.70 0.81 2.03 1.02 0.42 0.99 1.85 2.73 4.92 5.30 4.76 2.44 BDL24+27 0.39 BDL BDL BDL BDL BDL BDL 0.88 8.50 14.97 13.86 27.40 18.93 3.06 BDL16+32 0.41 0.99 0.75 1.31 4.64 2.97 2.00 1.71 12.75 24.82 15.50 48.72 18.54 4.49 BDL29 0.16 BDL 0.16 BDL 0.28 0.18 0.42 0.51 3.30 6.02 1.18 9.01 2.62 0.94 BDL26 0.07 0.20 0.26 0.28 1.02 0.65 0.18 0.32 1.54 1.48 5.61 2.98 2.01 0.70 0.1125 0.06 0.12 0.22 0.22 0.54 0.43 0.17 0.20 0.96 1.88 1.67 3.09 2.62 0.43 0.0931+28 0.84 3.16 1.92 4.10 14.78 8.53 1.45 1.13 2.69 13.48 32.92 30.77 29.68 1.74 BDL53+33+21 0.42 0.72 0.74 1.30 5.30 2.34 0.71 0.54 1.67 4.64 5.14 15.91 5.69 1.05 BDL22 0.45 1.11 1.03 1.17 4.30 2.32 0.87 1.36 3.61 3.55 6.95 6.33 5.46 2.74 BDL45 0.14 0.19 0.76 0.44 1.11 0.87 0.78 1.41 3.49 ND ND ND ND 1.69 BDL46 0.55 BDL 0.58 BDL 1.23 0.61 BDL 0.83 1.20 1.56 2.61 10.05 5.64 1.54 BDL52 0.26 1.75 1.97 3.40 17.45 10.00 5.04 5.31 3.73 1.47 1.45 6.45 3.37 1.22 BDL49 0.21 4.29 4.40 2.60 10.75 6.52 2.10 25.00 2.30 0.69 1.17 2.46 0.91 ND BDL47 1.76 BDL BDL 2.03 5.57 3.81 BDL BDL 1.80 BDL 1.81 2.23 BDL 2.21 BDL48 1.23 BDL BDL BDL 1.97 1.47 BDL BDL 1.76 BDL 1.62 1.62 1.53 1.83 BDL44 0.34 2.21 1.32 3.31 13.88 7.19 4.88 2.65 2.22 1.97 1.20 1.92 1.08 0.80 BDL37+42 0.33 1.63 0.99 2.27 6.97 3.20 0.68 0.51 1.16 1.34 0.83 0.68 0.67 0.39 BDL41+71 0.39 5.42 2.88 3.76 10.51 7.40 2.27 0.62 1.40 1.61 1.21 ND 1.22 BDL BDL64 2.54 17.55 5.85 18.93 34.43 7.48 3.83 8.69 28.22 32.06 28.71 12.06 11.26 4.79 BDL40 0.11 2.27 1.43 2.12 10.22 2.36 1.32 0.86 1.56 1.70 1.41 0.75 0.80 0.23 BDL100 0.13 6.32 3.32 1.88 5.86 1.45 2.51 3.17 28.03 95.50 130.27 ND 135.78 24.66 0.2663 0.10 0.77 0.69 0.55 0.98 1.41 1.89 2.11 20.68 61.70 2.49 ND 94.75 11.64 0.1974 0.23 0.79 0.93 2.05 7.30 3.44 2.07 1.13 5.78 4.95 8.95 ND 3.17 2.28 BDL70+76 0.39 3.27 3.18 6.90 29.73 15.40 9.75 3.73 2.65 ND 1.78 1.31 2.45 0.82 BDL66 0.48 3.12 3.28 8.09 23.79 11.16 4.25 1.83 2.26 ND ND 2.35 0.83 0.90 BDL95 0.18 2.57 2.85 4.63 28.55 15.32 9.43 3.41 1.93 ND ND 1.16 0.35 0.63 BDL91 0.14 0.42 0.53 1.02 4.74 2.37 1.72 0.41 ND 0.59 0.35 0.89 0.53 0.58 BDL56+60 0.80 2.64 2.55 5.99 17.87 8.17 3.40 1.52 3.02 1.50 1.24 5.09 2.09 2.47 BDL101 0.12 2.65 3.28 5.26 27.63 15.42 10.29 4.73 2.41 0.26 0.14 1.30 0.55 0.24 BDL99 0.13 10.26 8.17 7.46 25.73 8.63 5.71 2.13 1.29 0.23 0.18 0.54 0.44 ND BDL83 0.06 0.34 0.15 0.39 2.81 2.02 0.98 0.51 0.28 0.72 0.64 0.97 2.13 0.19 BDL97 0.10 0.69 0.77 1.63 8.63 4.57 3.45 1.34 0.43 1.25 1.41 2.22 3.05 0.40 BDL87+81 1.03 BDL 1.71 2.30 10.40 6.22 4.49 1.99 2.01 BDL BDL BDL ND BDL BDL85 0.02 2.29 2.17 2.77 8.57 11.53 9.58 5.97 0.80 0.06 0.07 0.09 0.12 0.04 BDL136 0.07 0.64 0.41 0.78 4.23 2.59 1.88 1.46 3.98 0.20 0.54 0.84 1.15 0.35 BDL77+110 0.21 4.76 4.98 8.47 43.16 22.58 14.94 5.03 1.87 BDL BDL 0.62 0.37 0.48 BDL82 0.09 0.25 0.34 0.70 3.69 1.71 1.14 0.37 0.53 1.01 0.90 2.06 0.59 0.26 BDL151 0.12 1.34 1.35 1.97 8.32 5.26 2.72 0.85 0.60 0.46 0.71 0.97 0.61 0.30 BDL135+144 0.06 0.67 0.70 1.34 6.57 3.59 1.91 0.42 0.31 0.13 0.19 0.29 0.26 0.26 BDL107 0.03 0.30 0.21 0.53 2.78 1.40 1.15 0.89 0.22 0.28 0.23 0.61 0.36 0.13 BDL149 0.15 4.67 4.27 6.64 29.41 16.69 9.34 2.98 1.59 0.66 0.41 0.94 0.94 0.26 BDL118 0.36 2.76 2.68 5.08 27.15 13.18 9.25 3.24 0.87 BDL BDL ND BDL BDL BDL134 0.11 0.32 BDL 0.18 0.58 0.21 0.12 ND 0.59 0.35 0.29 ND 0.28 0.55 ND131 0.03 0.17 0.25 0.19 1.14 0.98 0.56 0.26 0.07 0.05 BDL 0.19 0.06 0.05 BDL146 0.08 1.59 1.26 2.17 9.67 5.37 2.71 0.92 0.42 0.11 BDL 0.22 0.14 0.13 0.10153+132+105 0.39 11.00 9.90 15.40 68.68 38.36 22.39 7.96 3.29 BDL BDL 0.66 0.45 BDL BDL141 0.09 0.53 0.55 0.89 3.34 2.31 1.15 0.47 0.60 0.14 ND 0.39 0.31 0.32 BDL137+176 0.07 ND ND 0.28 1.26 0.77 0.20 0.10 ND 0.16 ND 0.22 BDL 0.17 ND163+138 0.20 8.86 8.45 12.13 57.86 29.81 17.66 6.23 2.42 0.25 BDL 0.45 BDL 0.27 BDL158 0.70 1.15 1.29 1.67 9.50 4.93 5.46 7.19 BDL BDL ND BDL BDL BDL BDL129+178 0.07 0.66 1.02 0.71 3.04 2.33 1.20 0.36 0.51 2.64 1.82 2.48 4.41 0.62 0.08187+182 0.54 6.05 4.67 7.69 21.89 15.09 8.10 2.83 14.27 0.59 0.59 0.57 BDL 0.63 BDL183 0.09 0.88 0.83 2.15 7.77 5.14 0.21 0.56 0.90 0.42 0.23 0.35 0.23 0.44 BDL128 0.08 1.32 1.29 2.22 11.13 5.09 3.05 0.80 0.42 0.10 0.10 0.32 0.26 0.43 BDL185 0.05 0.34 0.25 0.40 1.22 0.88 0.48 0.37 2.06 0.83 BDL 1.10 2.68 0.19 BDL174 0.11 1.30 0.85 2.48 8.38 6.84 2.89 1.12 1.03 0.29 0.12 0.27 0.35 0.36 BDL177 0.06 1.17 0.91 1.70 5.94 4.21 1.97 0.78 0.84 0.11 0.08 ND 0.09 0.25 0.08202+171 0.61 0.65 BDL 0.81 2.62 1.50 1.15 0.67 0.69 BDL BDL BDL BDL BDL BDL157+200 0.09 0.38 0.23 0.48 0.64 0.59 0.45 0.29 0.41 BDL 0.11 0.16 0.13 0.60 BDL172+197 0.08 0.57 0.47 0.74 2.57 1.79 0.82 0.34 0.47 0.14 BDL 0.13 BDL 0.13 ND180 0.27 8.03 6.40 7.39 25.12 17.40 9.02 3.40 2.85 BDL ND BDL BDL BDL BDL193 0.08 0.76 0.44 0.68 2.54 1.61 0.69 0.36 0.28 0.17 ND BDL BDL 0.24 0.08191 0.07 0.20 0.42 0.29 1.01 0.59 0.49 0.30 1.21 0.11 BDL 0.10 BDL 0.09 BDL199 0.03 0.04 0.12 0.08 0.40 0.30 0.15 0.18 0.82 0.05 BDL BDL BDL 0.05 BDL170+190 0.10 4.56 5.43 6.13 20.78 12.56 5.96 1.77 1.11 0.18 BDL BDL BDL BDL BDL198 0.05 0.10 0.14 0.17 0.43 0.36 0.61 1.00 0.17 BDL BDL 0.05 BDL 0.06 BDL201 0.07 2.56 1.94 3.22 8.04 6.59 4.44 2.34 3.26 0.10 BDL 0.09 BDL 0.12 BDL203+196 0.09 3.06 2.94 3.15 9.80 7.54 4.49 2.52 3.01 0.11 BDL 0.10 0.10 BDL 0.11189 0.11 0.17 0.16 0.17 0.63 0.38 0.24 0.21 0.22 BDL ND BDL BDL BDL BDL208+195 0.11 1.85 1.35 1.53 5.47 4.59 3.71 2.52 5.12 BDL BDL BDL BDL BDL BDL207 0.05 0.11 0.36 0.29 0.26 0.29 0.79 1.34 0.52 BDL ND BDL BDL BDL BDL194 0.05 1.27 1.13 1.47 4.50 3.40 ND 0.90 0.80 ND ND BDL BDL BDL BDL205 0.08 0.59 0.42 0.90 1.15 1.47 0.58 0.48 1.85 BDL ND BDL ND BDL BDL206 0.07 1.20 1.17 0.83 3.01 2.72 3.75 2.83 5.21 ND ND 0.09 ND 0.08 BDL209 0.33 BDL BDL BDL BDL BDL BDL 0.97 2.00 ND ND BDL ND BDL BDL

Appendix G-II Concentrations of OC Pesticides in Sediment CoresChem ID 6127 6129 6132 6137 6142 6147 6152 6157 6162 6167 6172 6177Site WC-1 WC-1 WC-1 WC-1 WC-1 WC-1 WC-1 WC-1 WC-1 WC-1 WC-1 WC-1Depth Interval (cm) 0-2 4-6 10-12 20-22 30-32 40-42 50-52 60-62 70-72 80-82 90-92 100-102Mid-Pt (cm) 1 5 11 21 31 41 51 61 71 81 91 101Mass extracted (g) 10.02 10.0 10.0 10.1 10.1 10.0 10.1 10.5 10.3 10.2 10.0 10.5% Dry Mass 0.31 0.34 0.33 0.38 0.40 0.42 0.38 0.37 0.40 0.27 0.35 0.32Solid Mass (g dw) 3.11 3.51 3.32 3.54 4.04 4.01 3.93 4.09 3.81 2.76 3.20 3.14
3.11Surrogate Recoveries %PCB 14 68 75 48 64 105 62 66 64 65 50 63 67PCB 65 69 71 46 58 61 59 66 63 66 56 64 66PCB 166 68 72 47 60 63 59 68 63 68 68 70 71
Concentrations (ng/g dw)Total DDXs 20.14 23.59 15.55 19.63 24.41 36.06 165.35 6.40 1.55 54.43 2.02 1.68Total Chlordanes 3.72 4.23 2.49 4.40 14.76 4.75 4.23 1.13 1.06 16.94 1.05 1.14
Organochlorine Pesticides
ng/g dw ng/g dw ng/g dw ng/g dw ng/g dw ng/g dw ng/g dw ng/g dw ng/g dw ng/g dw ng/g dw ng/g dwopDDE 0.03 1.19 1.73 0.67 1.66 2.12 2.98 4.23 0.37 0.04 0.13 0.04 BDLppDDE 0.04 8.87 12.00 7.42 9.50 9.13 17.44 22.53 2.14 0.09 0.05 BDL BDLo,p DDT 0.90 1.49 BDL BDL BDL 1.01 BDL BDL BDL BDL 4.47 BDL BDLp,p DDT 2.90 BDL BDL BDL BDL BDL BDL 99.77 BDL BDL 45.09 BDL BDLo,p DDD 0.06 1.48 1.56 0.98 1.30 1.39 1.05 4.67 0.68 0.17 1.57 0.08 0.16p.p DDD 0.07 5.65 6.23 3.85 5.57 8.96 12.72 33.31 1.54 0.08 3.12 BDL 0.17
alpha BHC 0.03 0.11 0.11 0.06 0.18 0.45 0.21 0.17 0.21 0.25 4.11 0.20 0.14beta BHC 0.28 BDL BDL BDL BDL BDL BDL BDL 0.36 0.32 12.07 BDL 0.41delta BHC 0.07 BDL BDL BDL BDL BDL BDL BDL BDL BDL 0.13 BDL BDLlindane 0.04 BDL 0.14 BDL 0.10 0.13 0.35 0.06 0.13 0.12 0.22 BDL 0.05
heptaclor 0.10 BDL 0.65 0.31 1.31 7.47 2.86 2.04 0.17 0.16 0.87 0.15 BDLheptachlor epoxide 0.03 0.22 0.23 0.04 0.26 1.38 0.69 0.46 0.22 0.17 11.41 0.23 0.23oxychlordane 0.05 0.22 0.12 0.07 0.09 0.52 0.11 0.10 0.16 0.26 0.62 0.08 0.29gamma chlordane 0.04 1.47 1.61 1.04 1.56 3.06 0.52 1.01 0.30 0.29 3.05 0.29 0.39alpha chlordane 0.03 0.99 0.84 0.66 0.62 1.09 0.29 0.33 0.20 0.14 0.80 0.25 0.15cis nonachlor 0.03 0.05 0.20 BDL 0.12 0.28 0.17 0.21 0.04 BDL 0.09 0.03 BDLtrans nonachlor 0.02 0.67 0.58 0.32 0.44 0.97 0.11 0.09 0.05 0.02 0.10 0.02 BDL
dieldrin 0.05 0.58 0.31 0.12 0.14 0.42 1.24 0.74 0.20 0.19 0.45 0.13 BDLendrin 0.38 3.76 4.73 8.43 3.24 2.47 2.91 5.17 11.05 12.36 4.79 8.89 14.33aldrin 0.02 0.03 0.04 BDL 0.02 0.09 0.37 0.13 0.05 0.05 0.33 0.05 0.04endosulfan I 0.04 0.06 BDL BDL BDL 0.12 BDL BDL 0.07 ND 0.38 BDL BDLendosulfan II 0.07 BDL BDL BDL BDL 0.28 0.08 0.31 0.21 0.13 1.60 BDL BDL

Appendix G-II Concentrations of OC Pesticides in Sediment CoresChem ID 6180 6181 6182 6183 6184 6185 6185Rdup 6185Rtrip 6186 6187 6188 6189 6189dup 6189trip 6190 6191 6192 6193 6194 6195 6196 6197 6199 6202 6210 6210dup 6213Site WC-2 WC-2 WC-2 WC-2 WC-2 WC-2 WC-2 WC-2 WC-2 WC-2 WC-2 WC-2 WC-2 WC-2 WC-2 WC-2 WC-2 WC-2 WC-2 WC-2 WC-2 WC-2 WC-2 WC-2 WC-2 WC-2 WC-2Depth Interval (cm) 0-2 2-4 4-6 6-8 8-10 10-12 10-12 10-12 12-14 14-16 16-18 18-20 18-20 18-20 20-22 22-24 24-26 26-28 28-30 30-32 32-34 34-36 38-40 44-46 60-62 60-62 66-68Mid-Pt (cm) 1 3 5 7 9 11 11 11 13 15 17 19 19 19 21 23 25 27 29 31 33 35 39 45 61 61 67Mass extracted (g) 2.073 1.932 1.953 1.942 1.997 1.902 2.063 2.067 2.199 2.113 2.061 2.109 2.114 2.048 1.841 1.993 2.003 2.217 2.001 2.087 2.048 2.005 2.118 1.983 2.106 1.996 2.063% Dry Mass 0.31 0.33 0.31 0.31 0.30 0.30 0.30 0.30 0.29 0.29 0.33 0.32 0.32 0.32 0.48 0.27 0.27 0.28 0.36 0.36 0.34 0.38 0.34 0.35 0.15 0.15 0.38Solid Mass (g dw) 0.64 0.64 0.60 0.60 0.61 0.58 0.63 0.63 0.64 0.61 0.68 0.67 0.67 0.65 0.89 0.53 0.55 0.61 0.72 0.75 0.70 0.76 0.72 0.70 0.32 0.30 0.78
Surrogate Recoveries %PCB 14 90 86 89 86 90 84 87 87 84 90 82 81 86 89 85 82 80 88 86 81 82 90 83 84 86 88 90PCB 65 91 91 90 87 90 84 88 88 84 90 80 79 87 88 86 83 80 85 86 80 82 88 84 85 85 88 90PCB 166 95 91 88 90 93 84 92 91 85 91 80 80 89 93 88 88 83 86 91 77 81 91 84 87 90 90 92
Concentrations (ng/g dw)Total DDXs 36.53 28.95 30.45 35.75 44.19 44.04 43.69 41.74 50.12 59.76 61.50 64.18 67.68 58.82 51.49 84.17 114.28 168.01 146.32 270.69 342.50 277.47 115.58 17.17 13.99 8.40 8.68Total Chlordanes 5.02 5.68 4.62 4.71 6.87 6.89 7.39 6.23 7.32 7.71 11.63 12.37 11.66 12.37 9.33 16.99 26.95 46.38 25.34 20.14 15.93 9.38 5.45 1.55 1.84 1.22 0.42
Organochlorine Pesticides
MDL ng/g dw ng/g dw ng/g dw ng/g dw ng/g dw ng/g dw ng/g dw ng/g dw ng/g dw ng/g dw ng/g dw ng/g dw ng/g dw ng/g dw ng/g dw ng/g dw ng/g dw ng/g dw ng/g dw ng/g dw ng/g dw ng/g dw ng/g dw ng/g dw ng/g dw ng/g dw ng/g dwopDDE 0.12 0.80 0.78 0.62 0.50 1.76 1.54 1.89 1.46 1.48 1.83 2.53 2.58 2.67 3.47 2.97 4.39 6.73 9.94 6.84 14.36 16.13 13.10 4.15 0.25 BDL BDL BDLppDDE 0.17 13.60 14.64 13.69 15.90 20.88 21.80 23.67 20.41 21.93 23.93 30.01 30.55 30.00 32.52 26.49 41.92 53.93 73.08 57.47 120.10 141.31 113.41 32.25 3.77 0.23 0.34 BDLo,p DDT 4.08 4.85 BDL BDL 5.96 7.60 BDL BDL BDL BDL 7.53 BDL 4.97 4.39 BDL BDL BDL BDL BDL BDL 6.76 7.68 6.79 10.57 BDL 5.03 BDL BDLp,p DDT 13.10 BDL BDL BDL BDL BDL BDL BDL BDL BDL BDL BDL BDL BDL BDL BDL BDL BDL BDL 15.32 15.46 27.56 22.59 BDL BDL BDL BDL BDLo,p DDD 0.27 1.54 2.25 2.02 2.37 2.83 3.80 3.96 3.73 9.18 3.62 5.57 4.98 5.47 4.92 4.16 7.98 12.97 19.61 17.98 30.51 41.11 33.32 16.86 1.98 0.33 0.55 BDLp.p DDD 0.30 6.92 7.94 7.33 8.68 10.55 12.26 12.92 11.88 12.33 13.66 17.44 16.47 16.49 16.87 14.68 25.99 43.71 60.89 53.87 98.62 129.28 105.04 54.05 7.33 0.32 0.32 BDL
alpha BHC 0.16 BDL BDL BDL BDL BDL BDL BDL BDL BDL BDL BDL BDL BDL BDL BDL BDL BDL BDL BDL BDL BDL BDL BDL BDL BDL BDL BDLbeta BHC 1.29 BDL 1.51 1.79 BDL BDL BDL BDL BDL BDL BDL BDL BDL BDL BDL BDL BDL BDL BDL 1.46 2.26 4.38 2.60 1.60 BDL BDL BDL BDLdelta BHC 0.31 BDL BDL BDL BDL BDL BDL BDL BDL BDL BDL BDL BDL BDL BDL BDL BDL BDL 0.63 1.02 3.25 4.08 3.20 3.09 1.21 1.15 1.36 BDLlindane 0.18 BDL BDL BDL 0.19 BDL BDL BDL BDL 0.26 0.32 ND 0.20 0.49 BDL BDL 0.21 0.19 0.29 0.21 0.59 0.78 0.37 BDL BDL 0.18 0.65 0.34
heptaclor 0.47 1.07 1.65 0.82 0.49 1.77 1.18 1.36 0.85 0.86 0.65 0.97 1.73 1.16 1.60 1.31 2.80 5.44 9.42 6.63 7.39 6.94 5.38 2.87 0.67 1.08 0.64 NDheptachlor epoxide 0.12 0.22 0.19 0.16 0.27 0.24 0.23 BDL 0.17 0.28 0.27 0.39 0.84 0.51 0.47 0.33 0.50 0.84 1.23 1.16 0.59 0.36 0.28 0.12 BDL 0.14 BDL BDLoxychlordane 0.21 0.27 0.27 0.31 0.24 0.27 0.27 0.27 0.32 0.53 0.50 0.62 0.55 0.66 0.53 0.27 0.22 0.31 0.83 0.51 0.28 0.64 0.25 0.32 0.39 BDL BDL BDLgamma chlordane 0.17 1.85 1.84 1.70 2.09 2.63 3.13 3.20 2.75 3.24 3.81 5.68 5.48 5.43 5.63 4.28 8.26 12.52 19.79 9.99 7.11 5.15 2.43 1.27 BDL BDL BDL 0.19alpha chlordane 0.15 1.08 1.18 1.19 1.30 1.56 1.71 2.03 1.71 2.14 2.03 3.26 3.06 3.17 3.20 1.62 3.41 5.41 10.72 4.92 3.51 2.65 0.81 0.86 0.30 0.25 BDL BDLcis nonachlor 0.13 0.16 0.16 BDL 0.23 0.18 0.14 0.21 0.21 0.19 0.20 0.33 0.33 0.30 0.37 0.66 0.69 0.69 0.83 0.66 0.37 0.27 0.30 BDL BDL BDL BDL BDLtrans nonachlor 0.07 0.70 0.74 0.67 0.48 0.68 0.75 0.81 0.72 0.70 0.92 1.37 1.38 1.41 1.55 1.52 2.36 3.64 6.82 3.12 2.05 0.79 0.32 0.15 BDL ND 0.16 BDL
dieldrin 0.22 0.98 1.00 0.95 0.41 0.25 BDL BDL BDL 0.22 0.24 0.27 BDL 0.25 BDL BDL 0.32 0.36 0.37 0.25 0.29 BDL BDL 0.35 BDL BDL BDL BDLendrin 1.70 3.56 2.32 2.00 5.73 5.77 3.73 BDL 3.16 4.21 5.63 5.79 4.63 5.78 BDL 3.35 4.27 7.34 3.38 4.87 5.65 23.33 15.01 48.78 18.31 4.62 BDL BDLaldrin 0.08 0.09 0.09 BDL BDL BDL BDL BDL BDL 0.08 0.11 0.08 BDL 0.17 BDL BDL BDL BDL BDL BDL BDL 0.09 BDL 0.11 BDL 0.08 BDL BDLendosulfan I 0.18 BDL BDL BDL BDL BDL BDL BDL BDL BDL BDL BDL BDL BDL BDL BDL BDL BDL BDL BDL BDL BDL BDL BDL BDL 0.26 BDL BDLendosulfan II 0.30 BDL BDL BDL BDL BDL BDL BDL BDL BDL BDL BDL BDL BDL BDL BDL BDL BDL BDL BDL BDL BDL BDL BDL BDL BDL BDL BDL

Appendix G-II Concentrations of OC Pesticides in Sediment CoresChem ID 6214 6216 6221 6224 6227 6229 6231 6234 6236 6239 6239dup 6241 6244 6246Site LH-2 LH-2 LH-2 LH-2 LH-2 LH-2 LH-2 LH-2 LH-2 LH-2 LH-2 LH-2 LH-2 LH-2Depth Interval (cm) 0-2 4-6 14-16 20-22 26-28 30-32 34-36 40-42 44-46 50-52 50-52 54-56 60-62 64-66Mid-Pt (cm) 1 5 15 21 27 31 35 41 45 51 51 55 61 65Mass extracted (g) 2.035 2.052 2.172 2.237 2.086 2.217 2.212 2.035 2.152 2.161 2.042 1.988 2.148 1.925% Dry Mass 0.34 0.42 0.67 0.52 0.59 0.53 0.53 0.37 0.38 0.35 0.35 0.38 0.39 0.47Solid Mass (g dw) 0.69 0.87 1.47 1.15 1.23 1.18 1.16 0.75 0.81 0.76 0.72 0.76 0.83 0.91
Surrogate Recoveries %PCB 14 95 89 94 88 69 78 84 89 46 105 88 129 79 89PCB 65 82 86 86 85 82 83 85 93 84 50 99 98 80 86PCB 166 88 92 86 95 88 93 91 90 89 96 87 91 90 91
Concentrations (ng/g dw)Total DDXs 114.08 112.58 76.73 206.21 314.90 427.23 227.28 78.86 158.19 331.34 8.29 336.01 222.42 17.17Total Chlordanes 54.30 30.37 66.10 125.38 28.77 31.97 18.46 105.10 41.77 22.44 26.56 39.34 28.18 3.20
Organochlorine Pesticides
MDL ng/g dw ng/g dw ng/g dw ng/g dw ng/g dw ng/g dw ng/g dw ng/g dw ng/g dw ng/g dw ng/g dw ng/g dw ng/g dw ng/g dwopDDE 0.12 14.45 8.92 6.19 19.41 13.05 9.26 5.66 1.50 0.61 0.44 0.89 0.46 0.30 BDLppDDE 0.17 20.65 19.57 24.94 77.13 103.79 86.23 53.71 7.24 0.58 0.63 0.84 1.10 0.36 BDLo,p DDT 4.08 33.09 10.47 BDL 19.17 16.33 164.55 88.50 6.77 35.43 41.11 BDL 97.95 BDL BDLp,p DDT 13.10 17.10 51.42 BDL 27.27 29.88 55.62 30.31 53.24 107.51 276.79 BDL 221.09 208.92 BDLo,p DDD 0.27 6.00 3.88 7.73 13.57 30.89 24.62 12.91 9.26 0.95 2.02 1.12 1.48 5.10 BDLp.p DDD 0.30 22.81 18.33 29.85 49.67 120.96 86.95 36.18 0.84 13.11 10.34 BDL 13.92 5.01 BDL
alpha BHC 0.16 0.16 BDL 0.23 0.16 0.23 1.72 2.35 5.73 7.78 3.94 249.57 16.72 3.42 0.75beta BHC 1.29 BDL BDL 3.05 14.08 6.19 2.88 2.95 12.86 23.69 58.99 40.41 45.73 5.46 BDLdelta BHC 0.31 BDL BDL 0.45 1.24 1.74 0.99 BDL 0.46 0.98 0.41 1.57 0.40 BDL BDLlindane 0.18 BDL BDL 0.57 0.36 0.47 10.75 9.79 0.39 0.63 1.20 0.32 1.22 0.20 BDL
heptaclor 0.47 5.93 4.92 15.63 37.01 12.49 16.15 9.62 37.67 14.08 8.82 18.11 16.72 4.27 BDLheptachlor epoxide 0.12 2.06 0.42 0.86 2.26 0.70 0.90 0.47 1.65 9.45 BDL 3.88 9.13 1.52 BDLoxychlordane 0.21 0.43 BDL 0.52 1.48 0.34 1.42 0.45 0.46 4.20 4.59 2.18 3.46 0.50 0.34gamma chlordane 0.17 17.27 9.33 25.08 41.44 5.77 5.35 0.22 1.21 13.03 8.35 0.80 8.32 0.18 0.32alpha chlordane 0.15 16.46 6.08 12.57 19.72 7.58 6.71 7.46 63.13 0.29 0.49 BDL 0.81 21.42 2.08cis nonachlor 0.13 0.58 0.89 0.51 4.17 ND ND ND 0.51 0.39 0.20 0.76 0.51 0.15 BDLtrans nonachlor 0.07 11.57 8.53 10.91 19.29 1.90 1.44 0.23 0.48 0.32 ND 0.73 0.41 0.14 BDL
dieldrin 0.22 7.91 0.64 0.27 0.26 1.35 0.59 1.46 1.55 0.40 0.81 1.33 0.72 BDL 0.31endrin 1.70 10.55 31.04 19.52 49.63 62.14 122.11 17.24 39.30 48.51 22.13 12.91 97.28 22.27 14.26aldrin 0.08 3.29 0.67 0.27 2.33 0.82 0.45 0.58 8.04 2.76 0.40 0.58 0.32 4.98 0.63endosulfan I 0.18 BDL BDL BDL 0.70 BDL BDL BDL 0.40 0.51 0.20 0.38 0.60 BDL BDLendosulfan II 0.30 0.32 BDL 0.30 BDL ND 0.85 0.44 1.32 1.39 3.77 1.04 3.20 BDL BDL

TAXA_2 (2)Appendix III: Taxa List
SpeciesNumber of
valves counted
Species Number of valves counted Species Number of
valves counted SpeciesNumber of
valves counted
Species Number of valves counted
Achnanthes brevipes Agardh 9
Diploneis interrupta (Kützing) Cleve 1 Navicula globulifera Hüstedt 1
Odontella aurita (Lyngbye) Agardh 8
Surirella robusta Ehrenberg 1
Achnanthes levanderi Hustedt 1
Diploneis smithii (Brébisson ex Smith) Cleve 23 Navicula gregaria Donkin 120 Opephora sp. 1 ? 1
Surirella striatula Turpin 1
Achnanthes ventralis (Krasske) Lange-Bertalot 2 Diploneis subovalis Cleve 11
Navicula hanseatica Lange-Bertalot et Stachura 5
Paralia sulcata (Ehrenberg) Cleve 62
Synedra acus Kützing 23
Achnanthidium exiguum (Grunow) Czarnecki 18
Discostella stelligera (Hustedt) Houk et Klee 51 Navicula ingrata Krasske 16
Parlibellus crucicula (Smith) Witkowski, Lange- 4
Synedra parasitica (Smith) 13
Achnanthidium minutissimum (Kützing) 24
Encyonema silesiacum (Bleisch) Mann 11
Navicula lanceolata (Agardh) Ehrenberg 1
Pinnuavis elegans (W.Smith) Okuno 2
Synedra ulna (Nitzsch) 13
Actinoptychus senarius (Ehrenberg) Ehrenberg 5
Entomoneis ornata (Bailey) Reimer 2
Navicula menisculus Schumann 2
Pinnularia acrosphaeria (Brébisson) Smith 3
Tabellaria flocculosa (Roth) 21
Amphora acutiuscula Kützing 9
Eunotia bilunaris (Ehrenberg) Mills 10 Navicula minima Grunow 49
Pinnularia borealis Ehrenberg 1
Thalassionema nitzschioides 239
Amphora coffeaeformis (Agardh) Kützing 23
Eunotia fallax var. groenlandica (Grunow) Lange- 4
Navicula peregrina (Ehrenberg) Kützing 46
Pinnularia gibba Ehrenberg 6
Thalassiosira cf. lineata 100
Amphora copulata (Kützing) Schoeman et Archibald 9 Eunotia formica Ehrenberg 6
Navicula pseudoventralis Hüstedt 3
Pinnularia ignobilis (Krasske) Cleve-Euler 6
Thalassiosira eccentrica 50
Amphora pediculus (Kützing) Grunow 9
Eunotia implicata Nörpel, Lange-Bertalot et Alles 43
Navicula recens Lange-Bertalot 2
Pinnularia interrupta Smith 16
Thalassiosira oestrupii 6
Asterionella formosa Hassal 6Eunotia incisa Smith ex Gregory 2
Navicula rhynchocephala Kützing 13 Pinnularia lundii Hüstedt 4
Trachyneis aspera 1
Aulacoseira ambigua (Grunow) Simonsen 813
Eunotia praerupta var. bidens (Ehrenberg) Grunow 2 Navicula rostellata Kützing 24
Pinnularia microstauron (Ehrenberg) Cleve 3
Tryblionella apiculata Gregory 52
Aulacoseira crassipunctata Krammer 24
Eunotia serra var. diadema (Ehrenberg) Patrick 3
Navicula ruttnerii var. capitata Hüstedt 9
Pinnularia nodosa (Ehrenberg) Smith 2
Tryblionella calida (Grunow ex Cleve 27
Aulacoseira crenulata (Ehrenberg) Thwaites 6
Fallacia omissa (Hüstedt) Mann 2 Navicula salinarum Grunow 508
Pinnularia obscura Krasske 5
Tryblionella coarctata 6
Aulacoseira granulata (Ehrenberg) Simonsen 332
Fallacia pygmaea (Kützing) Stickle et Mann 34
Navicula schroeteri var. escambia Patrick 8
Pinnularia parvulissima Krammer 1
Tryblionella compressa 2
Aulacoseira islandica (Müller) Simonsen 2 Fallacia sp. 1 331 Navicula sp. 1 35
Pinnularia subcapitata Gregory 6
Tryblionella debilis Arnott 26
Aulacoseira italica (Ehrenberg) Simonsen 25
Fallacia tenera (Hüstedt) Mann 1 Navicula sp. 2 8
Pinnularia viridis (Nitzsch) Ehrenberg 2
Tryblionella levidensis Smith 9
Aulacoseira muzzanensis (Meister) Krammer 77
Fragilaria improbula Witkowski et Lange-Bertalot 1 Navicula sp. 3 21
Placoneis clementis (Grunow) Cox 3
Tryblionella littoralis (Grunow) 27
Aulacoseira perglabra (Østrup) Haworth 2
Fragilaria vaucheriae (Kützing) Petersen 34 Navicula symmetrica Patrick 20
Placoneis elginensis (Gregory) Cox 16
Tryblionella victoriae Grunow 9
Aulacoseira pfaffiana (Reinsch) Krammer 23
Fragilariforma lata (Cleve-Euler) Williams et Round 37 Navicula tenelloides Hüstedt 18 Placoneis sp. 1 4
Undetermined Pennate sp. 1 125
Aulacoseira subarctica (Müller) Haworth 515
Frustulia crassinervia (Brebisson) Lange-Bertalot et 4
Navicula tripunctata (Müller) Bory 2
Plagiotropis lepidoptera var. proboscidea (Cleve) 1
Undetermined Pennate sp. 2 34
Aulacoseira valida (Grunow) Krammer 159
Frustulia vulgaris (Thwaites) deToni 12 Navicula veneta Kützing 3
Planothidium apiculatum (Patrick) Lange-Bertalot 2
Bacillaria paradoxa Gmelin 127Geissleria aikenensis (Patrick) Torgan et Olivera 2
Neidium affine (Ehrenberg) Pfitzer 6
Planothidium delicatulum (Kützing) Round et 14
Biremis circumtexta (Meister ex Hustedt) Lange-Bertalot 55
Gomphonema acuminatum Ehrenberg 2
Neidium bisulcatum (Lagerstedt) Cleve 2
Planothidium frequentissimum (Lange- 50
Brachysira vitrea (Grunow) Ross 1 Gomphonema affine Kützing 9
Neidium iridis var. ampliatum (Ehrenberg) 3
Planothidium granum (Hohn et Hellerman) 7
Caloneis bacillum (Grunow) Cleve 29
Gomphonema angustatum (Kützing) Rabenhorst 17
Nitzschia acidoclinata Lange-Bertalot 15
Planothidium lanceolatum (Brébisson ex Kützing) 2
Caloneis hyalina Hüstedt 6Gomphonema parvulum (Kützing) Kützing 32 Nitzschia amphibia Grunow 3
Planothidium peragalli var. parvulum (Patrick) 1
Capartogramma crucicula (Grunow ex Cleve) Ross 5
Gyrosigma acuminatum (Kützing) Rabenhorst 8
Nitzschia archibaldii Lange-Bertalot 2
Planothidium rostratum (Østrup) Lange-Bertalot 18
Chamaepinnularia sp. 1 2Gyrosigma attenuatum (Kützing) Rabenhorst 1
Nitzschia brevissima Grunow ex Van Heurck 320 Planothidium sp. 1 17
Cocconeis placentula var. lineata (Ehrenberg) Van 1
Gyrosigma nodiferum (Grunow) Reimer 5 Nitzschia capitellata Hüstedt 9
Platessa conspicua (Mayer) Lange-Bertalot 12
Cocconeis scutellum Ehrenberg 1
Gyrosigma parkerii (Harrison) Elmore 3 Nitzschia clausii Hantzsch 37
Psammothidium chlidanos (Hohn et Hellerman) 9
Cosmioneis pusilla (Smith) Mann et Stickle 5
Hantzschia amphioxys (Ehrenberg) Grunow 1
Nitzschia dissipata (Kützing) Grunow 36 Psammothidium sp. 1 5
Craticula accomodiformis Lange-Bertalot 2 Hantzschia sp. 1 3
Nitzschia fasciculata (Grunow) Grunow 1
Pseudostaurosira brevistriata (Grunow) 431
Craticula cuspida (Kützing) Mann 1
Hippodonta capitata (Ehrenberg) Lange-Bertalot, 42
Nitzschia filiformis (Smith) Van Heurck 4
Pseudostaurosira brevistriata var. 0A UL 4
Craticula halophila (Grunow) Mann 2
Hippodonta hungarica (Grunow) Lange-Bertalot, 17 Nitzschia fonticola Grunow 4
Rhaphoneis amphiceros (Ehrenberg) Ehrenberg 21
Craticula molestiformis (Hüstedt) Lange-Bertalot 3
Karayevia laterostrata (Hustedt) Round et 1 Nitzschia gessneri Hustedt 4
Rhopalodia acuminata Krammer 2
Cyclotella meneghiniana Kützing 571
Lemnicola hungarica (Grunow) Round et Basson 2
Nitzschia granulata Grunow ex Cleve et Möller 7
Rhopalodia gibberula (Ehrenberg) Müller 3
Cyclotella ocellata Pantocsek 4
Luticola mutica (Kützing) Mann 57
Nitzschia heufleriana Grunow 4
Rhopalodia musculus (Kützing) Müller 2
Cyclotella striata (Kützing) Grunow 97 Melosira varians Agardh 5
Nitzschia inconspicua Grunow 15
Sellaphora americana (Ehrenberg) Mann 2
Cymatosira belgica Grunow 26Meridion circulare (Greville) Agardh 8
Nitzschia intermedia Hantzsch ex Cleve et 6
Sellaphora bacillum (Ehrenberg) Mann 1
Cymbella cuspidata Kützing 2Meridion circulare var. constrictum (Ralfs) Van 8 Nitzschia laevis Hustedt 8
Sellaphora laevissima (Kützing) Mann 1
Cymbella gracilis (Ehrenberg) Kützing 15 Navicula canalis Patrick 5
Nitzschia liebethruthii Rabenhorst 2
Sellaphora pupula (Kützing) Meresckowsky 89
Cymbella norvegica Grunow 5Navicula cincta (Ehrenberg) Ralfs 64
Nitzschia microcephala Grunow 22
Sellaphora seminulum (Grunow) Mann 8
Cymbella subcuspidata Krammer 1
Navicula cryptotenella Lange-Bertalot ex Krammer et Lange- 56
Nitzschia nana Grunow ex Van Heurck 22
Skeletonema costatum (Greville) Cleve 30
Decussata placenta (Ehrenberg) Lange-Bertalot 5
Navicula erifuga Lange-Bertalot 13 Nitzschia obtusa Smith 1
Stauroneis agrestis Petersen 2
Delphineis minutissima (Hustedt) Simonsen 77
Navicula geronimensis Potapova 2
Nitzschia palea (Kützing) Smith 65
Stauroneis anceps Ehrenberg 22
Denticula subtilis Grunow 21Nitzschia recta Hantzsch ex Rabenhorst 14
Stauroneis kriegeri Patrick 10
Diadesmis confervacea Kützing 32
Nitzschia sigma (Kützing) Smith 71
Stauroneis phoenicenteron (Nitzsch) 4
Diatoma mesodon (Ehrenberg) Kützing 4 Nitzschia siliqua Archibald 3 Stauroneis smithii Grunow 4Diploneis elliptica (Kützing) Cleve 17 Nitzschia sp. 1 24
Staurosira construens var. venter (Ehrenberg) 336
Nitzschia sp. 2 5Staurosirella pinnata (Ehrenberg) Williams et 19
Nitzschia sp. 3 1 Surirella angusta Kützing 1Nitzschia subacicularis Hüstedt 21
Surirella brebissonii var. kuetzingii Krammer et 9
Nitzschia subconstricta Grunow 1 Surirella brightwellii Smith 2
Nitzschia umbilicata Hustedt 2 Surirella linearis Smith 8
Page 1
Related Documents