Consumers’ quantitative inflation perceptions and expectations in the euro area: an evaluation (*) Gianluigi Ferrucci (ECB), Olivier Biau (EC), Heinz Dieden (ECB), Roberta Friz (EC), Staffan Linden (EC) Conference on Consumer Inflation Expectations Federal Reserve Bank of New York, 18-19 November (*) The views expressed in this presentation are those of the authors and do not necessarily reflect those of the European Central Bank, the Eurosystem or the European Commission.

Welcome message from author
This document is posted to help you gain knowledge. Please leave a comment to let me know what you think about it! Share it to your friends and learn new things together.
Transcript

Consumers’ quantitative inflation perceptions and expectations in the
euro area: an evaluation(*)
Gianluigi Ferrucci (ECB), Olivier Biau (EC),
Heinz Dieden (ECB), Roberta Friz (EC), Staffan Linden (EC)
Conference on Consumer Inflation Expectations
Federal Reserve Bank of New York, 18-19 November
(*) The views expressed in this presentation are those of the authors and do not necessarily reflect those of the European Central Bank, the Eurosystem or the European Commission.
Motivation of the study
Quantitative inflation expectations based on consumer surveys relatively little analysed in the euro area
This study assesses the information content of a dataset collected for research purposes by the European Commission
Aim is twofold• discuss the usefulness of the data• refine the monitoring of survey-based consumers’
inflation expectations in the euro area
Outline
Main features of the survey
Key results
Why do euro area consumers overestimate inflation?- role of outliers- data quality- design of the survey questionnaire
Conclusions and future research
The quantitative dataset
Quantitative information on consumers’ inflation expectations (and perceptions) in the euro area is provided by the European Commission
Quantitative survey is part of the “Joint EU Harmonised Programme of Business and Consumer Survey”
• Consistent methodology across countries• Reliability of the data
Dataset is experimental• no official release following each data collection;• dissemination of the data is limited

Main features of the experimental survey
• National samples, focus on the euro area (all countries except NL)
• In total ca. 23,000 randomly selected consumers take part in the survey every month (for the euro area)
• Monthly frequency starting in May 2003 (to June 2010)
The quantitative questions
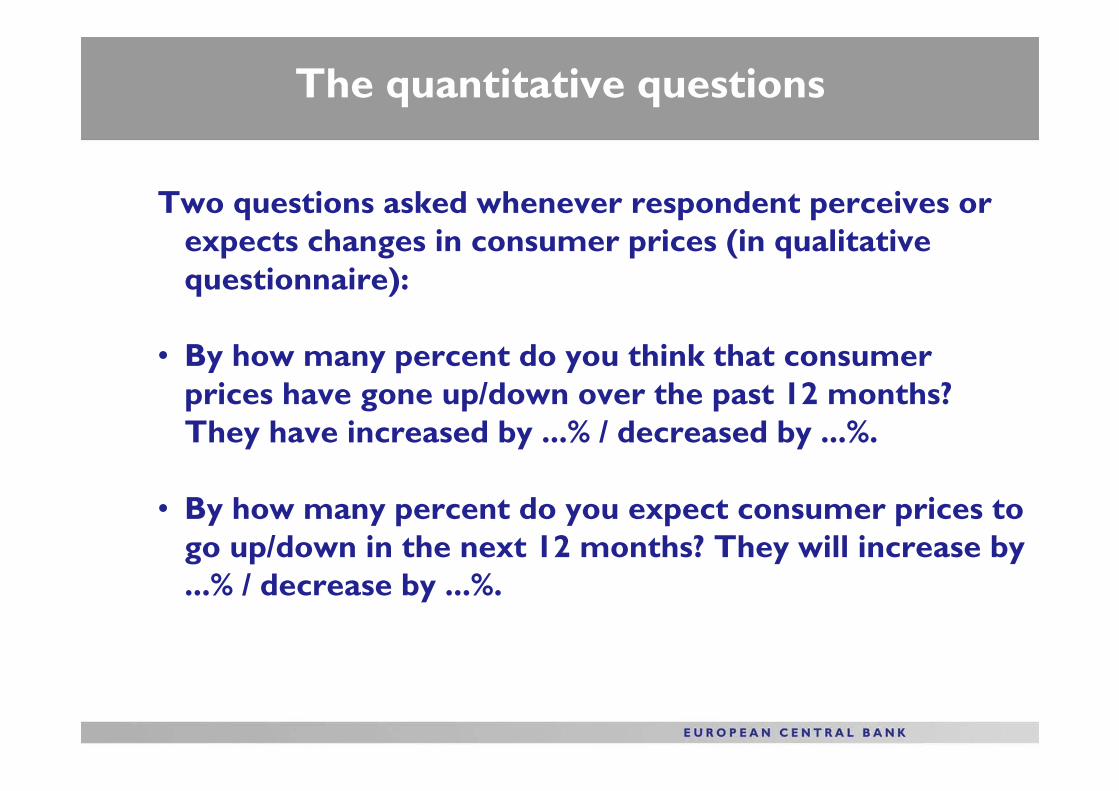
Two questions asked whenever respondent perceives or expects changes in consumer prices (in qualitative questionnaire):
• By how many percent do you think that consumer prices have gone up/down over the past 12 months? They have increased by ...% / decreased by ...%.
• By how many percent do you expect consumer prices to go up/down in the next 12 months? They will increase by ...% / decrease by ...%.
Notable features of the survey questions
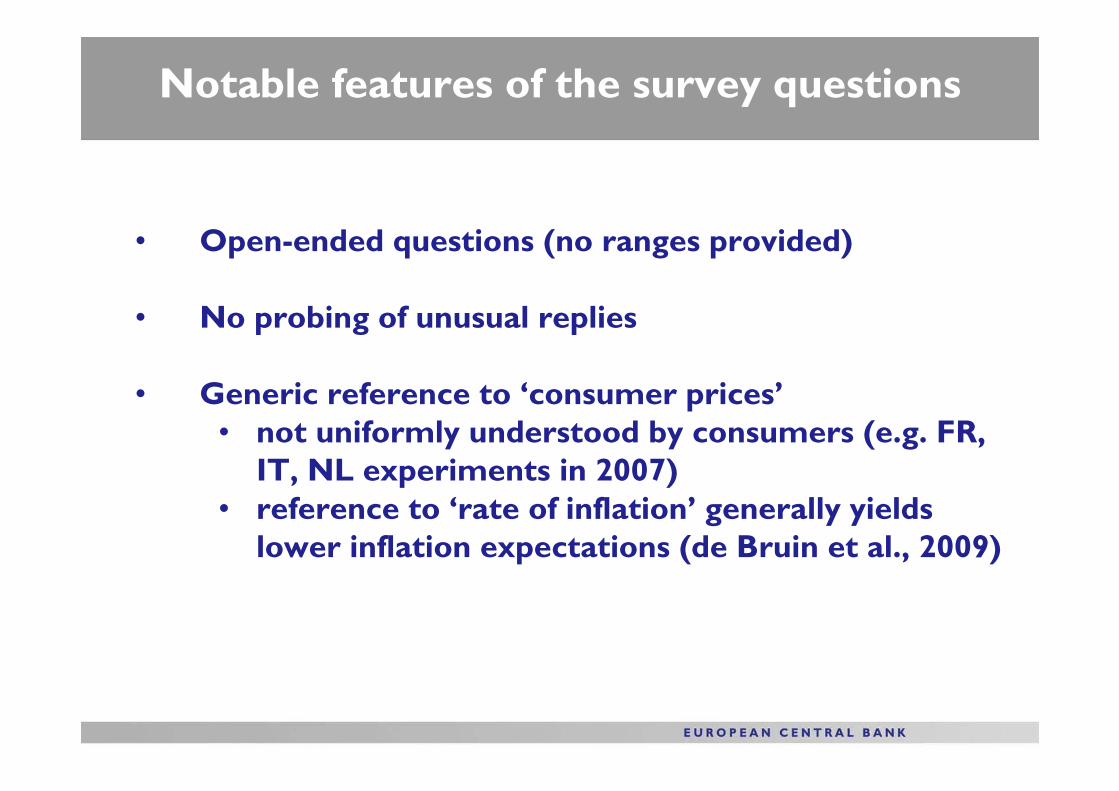
• Open-ended questions (no ranges provided)
• No probing of unusual replies
• Generic reference to ‘consumer prices’• not uniformly understood by consumers (e.g. FR,
IT, NL experiments in 2007)• reference to ‘rate of inflation’ generally yields
lower inflation expectations (de Bruin et al., 2009)

(percent )
•Response rate of arund 75% for the euro area•But rather diverse picture cross countries
Source: European Commission.Note: as a percentage of respondents who believe that the inflation rate has changed or will change; average response rates
over the period May 2003 to June 2010.
Response rates to quantitative questions
0
1 0
2 0
3 0
4 0
5 0
6 0
7 0
8 0
9 0
1 0 0
A T B E D E E L E S F I F R I E I T L U P T SI C Y M T SK E A
I n f l a t i o n p e r c e p t i o n I n f l a t i o n e x p e c t a t i o n

Main findings
- Overestimation
- Dispersion across countries
- Demographics
Survey results: overestimation of inflation
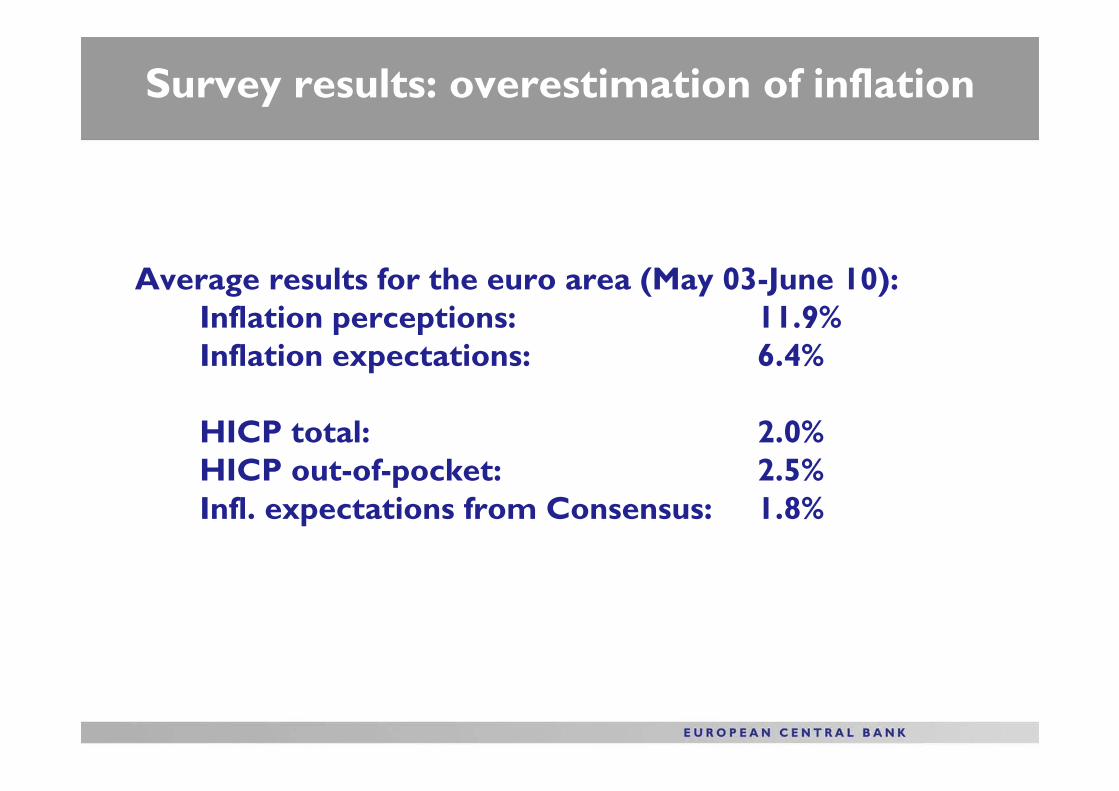
Average results for the euro area (May 03-June 10):Inflation perceptions: 11.9%Inflation expectations: 6.4%
HICP total: 2.0%HICP out-of-pocket: 2.5%Infl. expectations from Consensus: 1.8%

(annual percentage changes)
Sources: European Commission and Eurostat.Note: last observation: June 2010.
Evolution of households’ inflation estimates
-2
0
2
4
6
8
10
12
14
16
18
20
2003 2004 2005 2006 2007 2008 2009 2010
inflation perceptions
inflation expectations
HICP inflation
Comparison with other surveys
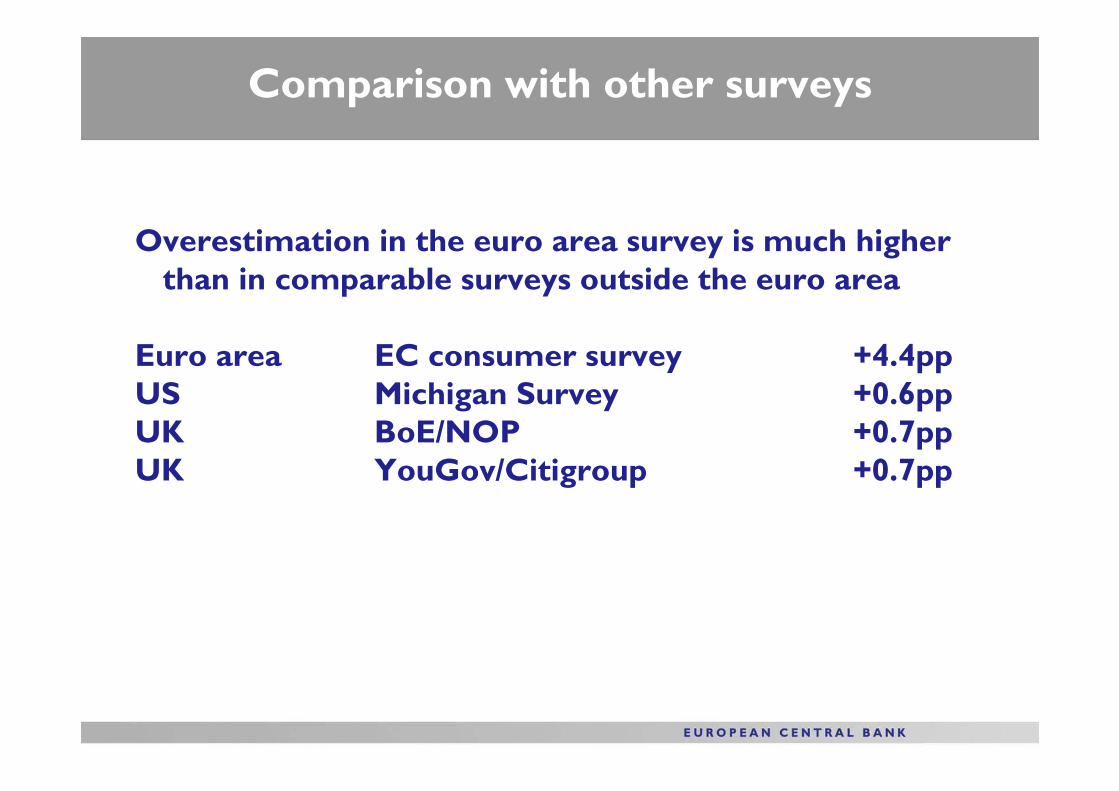
Overestimation in the euro area survey is much higher than in comparable surveys outside the euro area
Euro area EC consumer survey +4.4ppUS Michigan Survey +0.6ppUK BoE/NOP +0.7ppUK YouGov/Citigroup +0.7pp
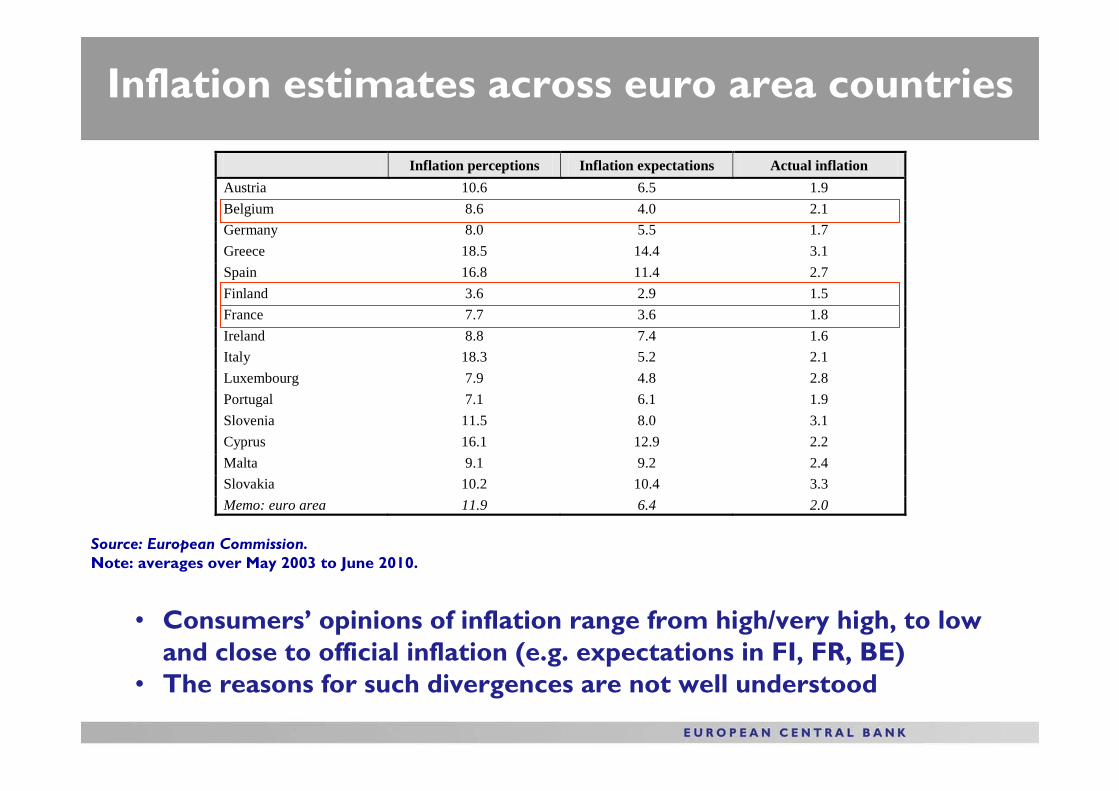
Inflation estimates across euro area countries
• Consumers’ opinions of inflation range from high/very high, to low and close to official inflation (e.g. expectations in FI, FR, BE)
• The reasons for such divergences are not well understood
Source: European Commission.Note: averages over May 2003 to June 2010.
Inflation perceptions Inflation expectations Actual inflation Austria 10.6 6.5 1.9 Belgium 8.6 4.0 2.1 Germany 8.0 5.5 1.7 Greece 18.5 14.4 3.1 Spain 16.8 11.4 2.7 Finland 3.6 2.9 1.5 France 7.7 3.6 1.8 Ireland 8.8 7.4 1.6 Italy 18.3 5.2 2.1 Luxembourg 7.9 4.8 2.8 Portugal 7.1 6.1 1.9 Slovenia 11.5 8.0 3.1 Cyprus 16.1 12.9 2.2 Malta 9.1 9.2 2.4 Slovakia 10.2 10.4 3.3 Memo: euro area 11.9 6.4 2.0
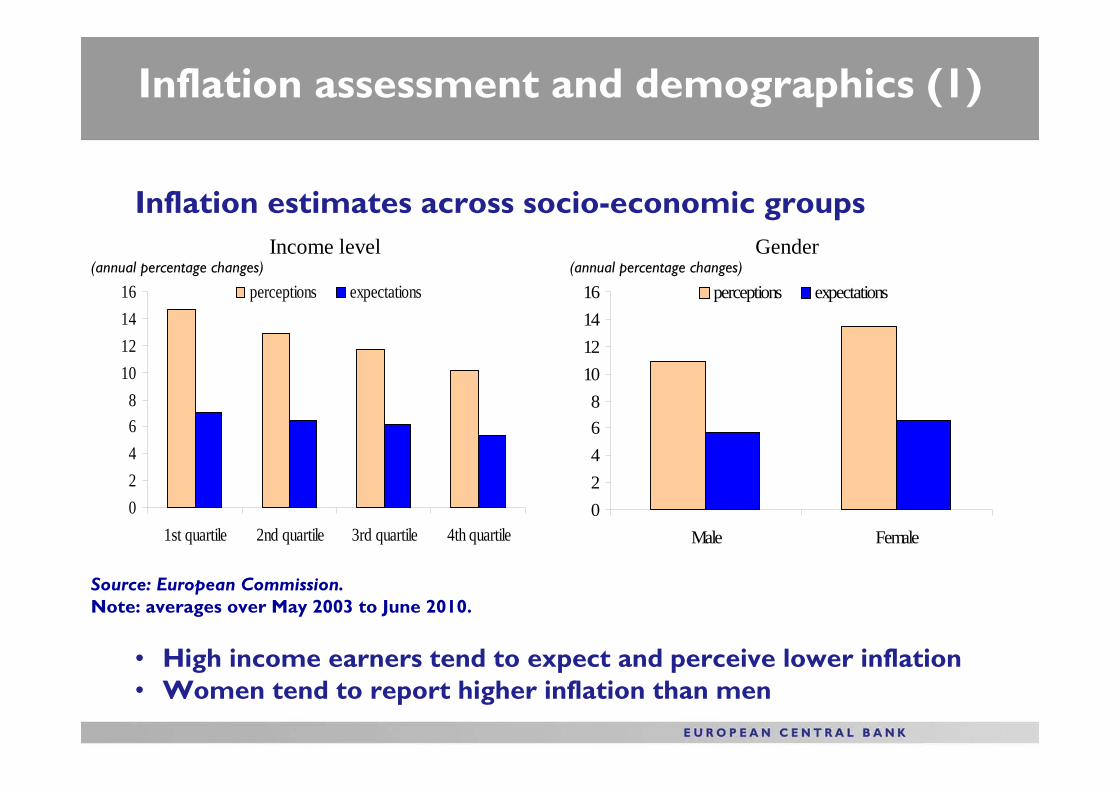
Inflation assessment and demographics (1)
Inflation estimates across socio-economic groups
• High income earners tend to expect and perceive lower inflation• Women tend to report higher inflation than men
Source: European Commission.Note: averages over May 2003 to June 2010.
Income level
02468
10121416
1st quartile 2nd quartile 3rd quartile 4th quartile
perceptions expectations
Gender
02468
10121416
Male Female
perceptions expectations
(annual percentage changes) (annual percentage changes)
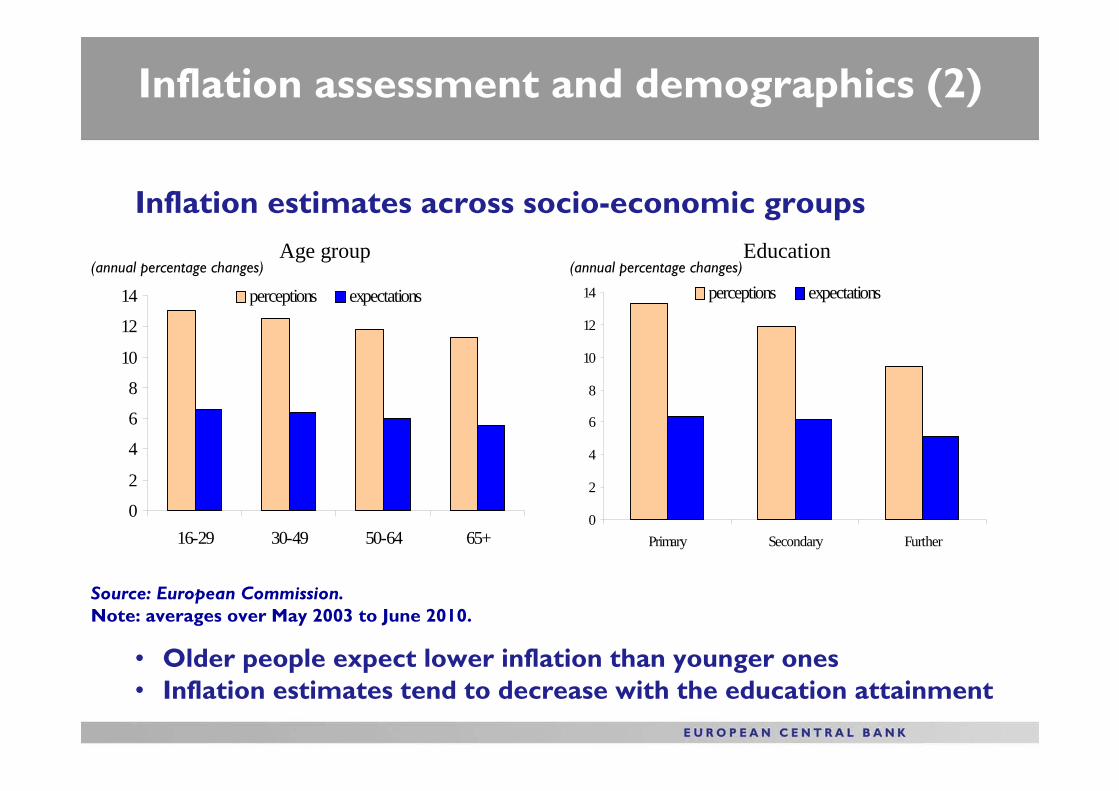
Inflation assessment and demographics (2)
Inflation estimates across socio-economic groups
• Older people expect lower inflation than younger ones• Inflation estimates tend to decrease with the education attainment
Source: European Commission.Note: averages over May 2003 to June 2010.
Age group
0
2
4
6
8
10
12
14
16-29 30-49 50-64 65+
perceptions expectations
Education
0
2
4
6
8
10
12
14
Primary Secondary Further
perceptions expectations
(annual percentage changes) (annual percentage changes)

Reasons for overestimation
Possible impact of:- Outliers- Data quality- Survey design

Reasons for overestimation: outliers?
Wide range of replies
For example:minimum expected rate of inflation: -200%maximum expected rate of inflation: 800%
…but the number of such extreme replies is small
Digit preference e.g. 0%, 2%, 5%, 10%, 20%
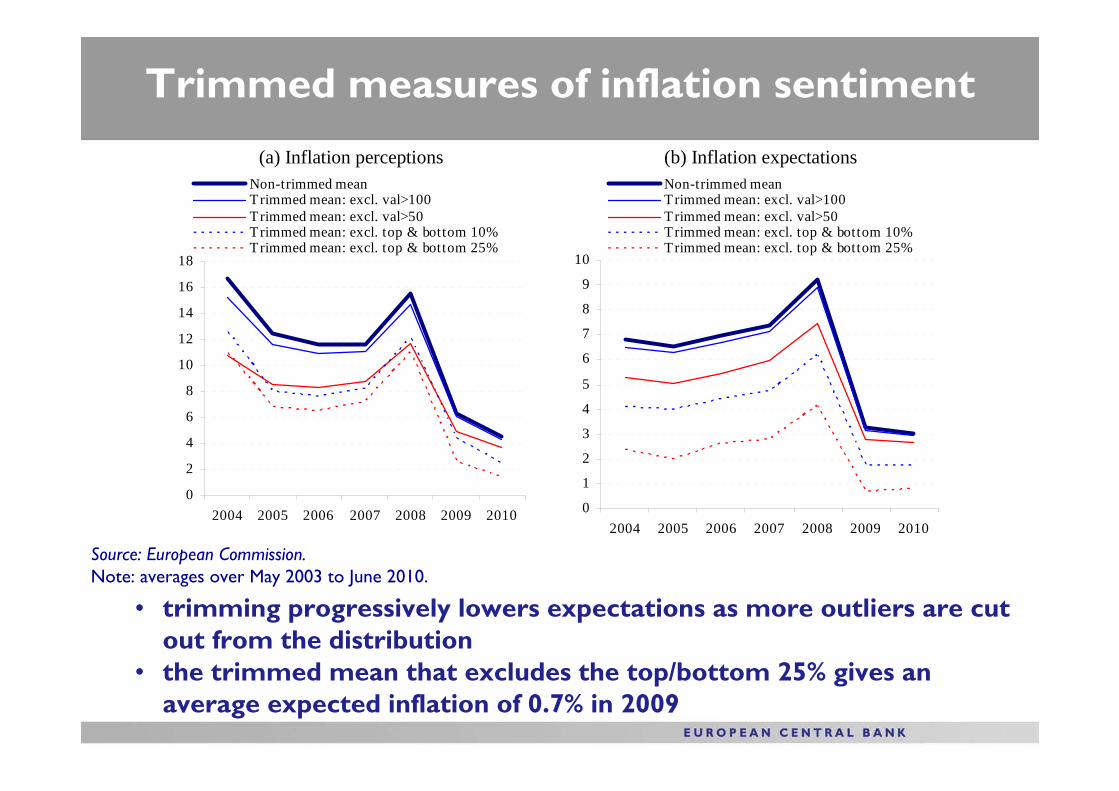
Trimmed measures of inflation sentiment
• trimming progressively lowers expectations as more outliers are cut out from the distribution
• the trimmed mean that excludes the top/bottom 25% gives an average expected inflation of 0.7% in 2009
Source: European Commission.Note: averages over May 2003 to June 2010.
(a) Inflation perceptions
0
2
4
6
8
10
12
14
16
18
2004 2005 2006 2007 2008 2009 2010
Non-trimmed meanTrimmed mean: excl. val>100Trimmed mean: excl. val>50Trimmed mean: excl. top & bottom 10%Trimmed mean: excl. top & bottom 25%
(b) Inflation expectations
0
1
2
3
4
5
6
7
8
9
10
2004 2005 2006 2007 2008 2009 2010
Non-trimmed meanTrimmed mean: excl. val>100Trimmed mean: excl. val>50Trimmed mean: excl. top & bottom 10%Trimmed mean: excl. top & bottom 25%

Controlling for outliers: the median
Median of consumers’ inflation assessment in the euro area
• The median as a summary statistic that is less sensitive to outliers• Owing to the prevalence of round digits, median tends to exhibit
discrete jumps
Source: European Commission.
-2.0
0.0
2.0
4.0
6.0
8.0
10.0
12.0
2004 2005 2006 2007 2008 2009 2010
median perceptionsmedian expectationsHICP inflation
Reasons for overestimation: data quality?
Possible measurement and data quality issues:“data entry” errorsin the validation processes in the data collection
Question misunderstood?Concept “annual percentage change” unknown?
CheckData entry and validation processes Methods for outlier correction, e.g. “probing question”
Reasons for overestimation: survey design?
Michigan survey in the US probes unusual replies
BoE/NOP and YouGov/Citigroup surveys for the UK provide brackets of responses
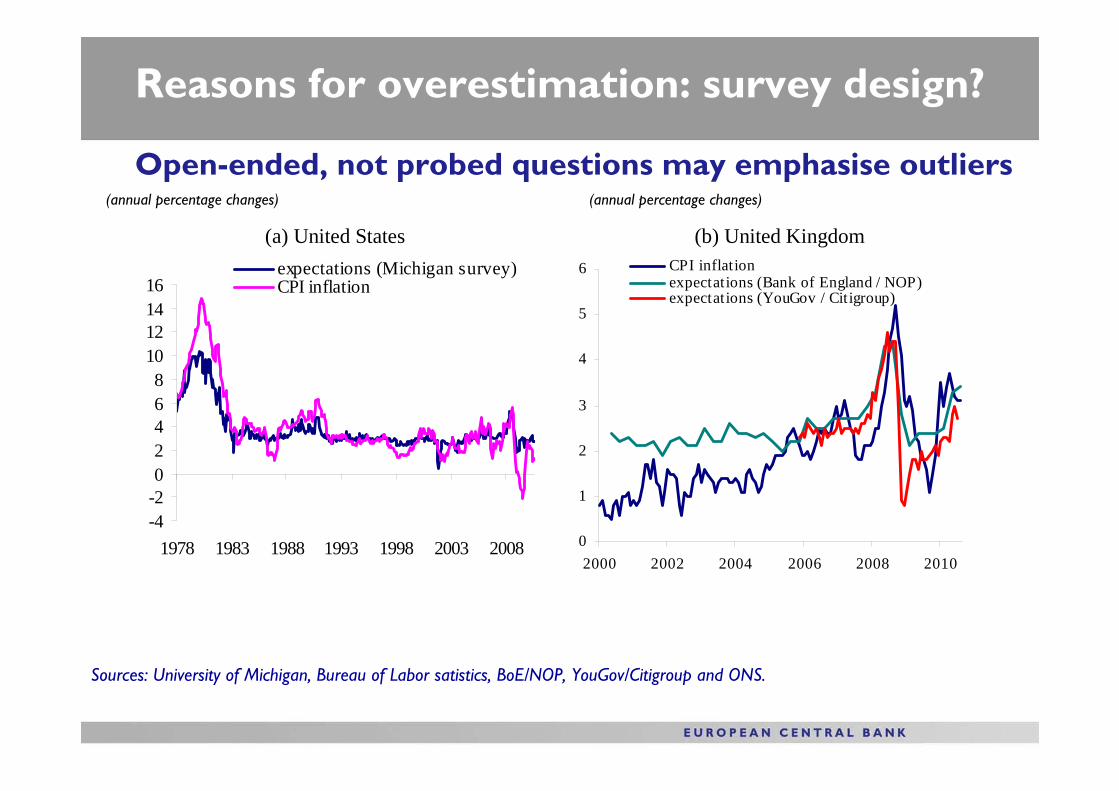
Reasons for overestimation: survey design?
Open-ended, not probed questions may emphasise outliers
(a) United States
-4-202468
10121416
1978 1983 1988 1993 1998 2003 2008
expectations (Michigan survey)CPI inflation
(b) United Kingdom
0
1
2
3
4
5
6
2000 2002 2004 2006 2008 2010
CPI inflationexpectations (Bank of England / NOP)expectations (YouGov / Citigroup)
Sources: University of Michigan, Bureau of Labor satistics, BoE/NOP, YouGov/Citigroup and ONS.
(annual percentage changes) (annual percentage changes)

Reasons for overestimation: survey design?
UK consumers’ estimates of inflation expectations
• UK as a natural experiment to test the effect of ranges of reply• Expectations tend to track actual inflation closely when consumers
select their replies from given ranges
Sources: European Commission, BoE/NOP and ONS.
0
2
4
6
8
1 0
1 2
1 4
2 0 0 0 2 0 0 2 2 0 0 4 2 0 0 6 2 0 0 8 2 0 1 0
C P I i n f l a t i o ne x p e c t a t i o n s ( B a n k o f E n g l a n d / N O P )e x p e c t a t i o n s ( E C C o n s u m e r S u r v e y )

Conclusions
Tentative evidence that overestimation of inflation by euro area consumers is affected by the survey design (no probing question) and heterogeneous interpretation of survey question
Outliers play a more modest role
Euro area consumers hold very different opinions of inflation depending on their income, age, education and gender
Wide dispersion of responses across countries
Future research
• Trial ‘probing question’ (as in the US survey)
• Ranges of responses (as in the UK surveys) might reduce the overestimation, but do they add a different bias?
• Refer to ‘rate of inflation’ (as opposed to ‘prices in general’; see van der Klaauw et al, 2008)
• Investigate why answers are closer to the official inflation rate in some countries than in others
• Monitor inflation expectations in the medium term (2 to 5 years ahead)
Related Documents