Jurnal Psikologi Malaysia 32 (2) (2018): 1-11 ISSN-2289-817 15 Consumers’ Buying Motive Assessment Tool: Rational versus Emotional Mollika Roy 1 Arobindu Dash 2 Muhammad Salim Hossain 1 1 Department of Psychology, University of Dhaka 2 School of Business & Economics, United International University Corresponding author: [email protected] Now-a-days, understanding consumers’ buying motive is much more important for the marketers. As there is very limited literature in this field and no full version of psychometric tool are available for measuring consumer buying motive, we have taken initiative to develop ‘Consumers’ Buying Motive Assessment Tool’ (CBMAT). 388 early adult respondents were used in this study. In EFA, we found two-dimensional model of CBMAT having three factor at each dimension, comprising 26 items which explained 53.63% of sub-total variance of ‘Emotional’ dimension and 50.90% of sub-total variance of ‘Rational’ dimension. In both dimension, the reliability was high enough (Cronbach’s α of ‘Emotional’ = .826 and .837 for the ‘Rational’ dimension). We found high convergent validity within the same dimensional factors and high discriminant validity among different dimensional factors. By considering cutoff point (39), buyers’ motive can be low or high in both dimensions which comprises four types buyer motive such as ‘Equivocal’; ‘Utilitarian’; ‘Affective’ and ‘Indifferent’. These findings help to gain the psychometric properties of CBMAT which also support the ‘Dual Process Theory’. This study opens the door of further research on consumer buying motive. Key words: motivation, consumers’ buying motive, economic view, emotional view Why do people buy? What is the motive behind the purchase behavior? Now-a-days, it’s very crucial for the marketers to explore their consumers buying motive which will help them to reach their target consumers more effectively and if their products/services offer match with their target consumers, it will help in product positioning and gain competitive advantage. That’s why Consumer behavior anal ysts give much more emphasis to explore consumers’ buying motive. According to Consumer Characteristics Approach, five major components (Attitude, Learning, Perception, Personality and Motivation) affect our buying behavior. In Purchase Decision Making Process Model, it is clear that consumers’ motivation is just the immediate stage before buying decision (action). So, understanding buyers’ motive will help the marketers to manipulate buyer’s decision. Consumer motivation acts as a driving force within consumers that impels them to make purchase decision (action). There are two types of consumer buying motives: Product Motives (driving forces and considerations which make the buyer purchase a specific product) and Patronage Motives (driving forces and considerations which persuade the buyer to patronage specific shops). This study focuses on the product motive perspective which can be two types: Emotional Product Motives: Emotional Motives (persuade the

Welcome message from author
This document is posted to help you gain knowledge. Please leave a comment to let me know what you think about it! Share it to your friends and learn new things together.
Transcript
Jurnal Psikologi Malaysia 32 (2) (2018): 1-11 ISSN-2289-817 15
Consumers’ Buying Motive Assessment Tool: Rational versus Emotional
Mollika Roy1
Arobindu Dash2
Muhammad Salim Hossain1
1 Department of Psychology, University of Dhaka
2School of Business & Economics, United International University
Corresponding author: [email protected]
Now-a-days, understanding consumers’ buying motive is much more important for the
marketers. As there is very limited literature in this field and no full version of psychometric tool
are available for measuring consumer buying motive, we have taken initiative to develop
‘Consumers’ Buying Motive Assessment Tool’ (CBMAT). 388 early adult respondents were
used in this study. In EFA, we found two-dimensional model of CBMAT having three factor at
each dimension, comprising 26 items which explained 53.63% of sub-total variance of
‘Emotional’ dimension and 50.90% of sub-total variance of ‘Rational’ dimension. In both
dimension, the reliability was high enough (Cronbach’s α of ‘Emotional’ = .826 and .837 for the
‘Rational’ dimension). We found high convergent validity within the same dimensional factors
and high discriminant validity among different dimensional factors. By considering cutoff point
(39), buyers’ motive can be low or high in both dimensions which comprises four types buyer
motive such as ‘Equivocal’; ‘Utilitarian’; ‘Affective’ and ‘Indifferent’. These findings help to
gain the psychometric properties of CBMAT which also support the ‘Dual Process Theory’. This
study opens the door of further research on consumer buying motive.
Key words: motivation, consumers’ buying motive, economic view, emotional view
Why do people buy? What is the motive
behind the purchase behavior? Now-a-days,
it’s very crucial for the marketers to explore
their consumers buying motive which will
help them to reach their target consumers
more effectively and if their
products/services offer match with their
target consumers, it will help in product
positioning and gain competitive advantage.
That’s why Consumer behavior analysts
give much more emphasis to explore
consumers’ buying motive. According to
Consumer Characteristics Approach, five
major components (Attitude, Learning,
Perception, Personality and Motivation)
affect our buying behavior. In Purchase
Decision Making Process Model, it is clear
that consumers’ motivation is just the
immediate stage before buying decision
(action). So, understanding buyers’ motive
will help the marketers to manipulate
buyer’s decision. Consumer motivation acts
as a driving force within consumers that
impels them to make purchase decision
(action). There are two types of consumer
buying motives: Product Motives (driving
forces and considerations which make the
buyer purchase a specific product) and
Patronage Motives (driving forces and
considerations which persuade the buyer to
patronage specific shops). This study
focuses on the product motive perspective
which can be two types: Emotional Product
Motives: Emotional Motives (persuade the
Jurnal Psikologi Malaysia 32 (2) (2018): 1-11 ISSN-2289-817 16
consumers on the basis of their emotions
and they doesn’t try to reason out or
logically analyses the need for purchase.
They make a buying to satisfy pride, sense
of ego, urge to initiate others, and desire to
be unique) and Rational Motives (impulses
in consumer which arise on the basis of
logical analysis and proper evaluation. The
buyer makes rational decision after chief
evaluation of the purpose, alternatives
available, cost benefit, and such valid
reasons). A motive is that drive or urge for
which an individual seeks satisfaction (W.J.
Stanton, 1995). When consumers seek
satisfaction through the purchase of
something, it remarks as buying motive.
From marketing perspective, rational motive
includes object related criteria (size, weight,
price etc.) and emotional motive includes
subject/personal related criteria (pride, fear,
affection or status etc.). In reality, both
object and subject related criteria should be
matched for making purchase decision and
later, to bring post-purchase satisfaction.
It has been a great debate among
consumer researchers whether consumers
are directed by emotional
(Modern/Emotional View) or Rational
(Traditional/Economic View) buying
motives. Traditional/Economic View is
supported by classical economists and
considers the consumer as a ‘rational
economic man’. ‘Utility Theory (the most
prevalent model from economic view)
proposes that consumers make choices
based on the expected outcomes of their
decisions. Consumers are viewed as rational
decision makers who are only concerned
with self-interest. In contrast,
Modern/Emotional View is supported by
psychologists and behavioral economists
and considers the consumer as an
‘emotionally driven man’. Emotional
motives prompt a prospect to act because of
an appeal to some emotion (fun, fear, love,
prestige, hope etc.). Philosophically,
Emotional motives usually stem more from
the heart than the head and often involve
little logic and reasons and less pre-purchase
information search. There is enough
evidence for both ideas (Economic vs.
Emotional View) and against them. Finally,
both of these views and their debates are
aggregated by ‘Dual Process Theory’. This
theory believes that human beings may be
dominated by either rational or emotional
thoughts but both thoughts simultaneously
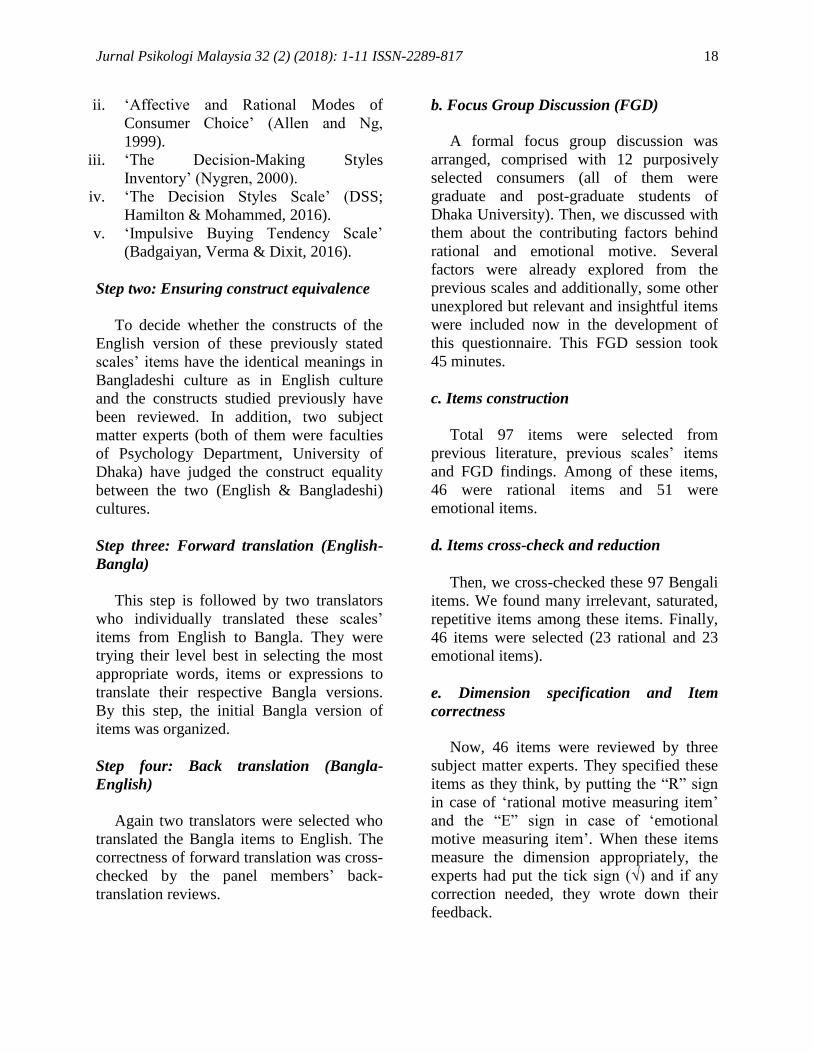
exist in human beings. The purchase action
of consumers is based on emotional drive
with rational modifications (Fig. 1).
Emotional motive back the initiation of the
purchase decision and final action both.
Emotion-based drive Rational processing Emotional motive
Rational motive
Shaped by emotional determinants Purchase
Figure 1: The Emotional Appeals That Make People Buy (Hoque et. al., 2012)
These two processes consist of an
emotional (automatic), unconscious process
and a rational (controlled), conscious
process (Posner & Snyder, 1975). A number
of theorists have mapped these dual
processes on to two distinct cognitive
systems and have been given various names
including experiential-rational (Epstein,
1994), heuristic-analytic (Evans, 1989),
heuristic-systematic (Chen &Chaiken,
1999), implicit- explicit (Evans & Over,
1996), associative and rule-based (Sloman,
Jurnal Psikologi Malaysia 32 (2) (2018): 1-11 ISSN-2289-817 17
1996) and the neutral System 1 and System
2 (Stanovich, 1999) reflective and impulsive
processing (Strack & Deutsch, 2004),
reflective and reflexive processing
(Lieberman et al., 2002), and System 1
versus System 2 processing (Kahneman,
2003; Stanovich & West, 2000).
On the basis of this ‘Dual Process
Theory’, it is needed to measure consumers
buying motive as having both rational and
emotional motive and identify which
consumer is triggered by which kind of
motive. As there is very limited literature in
this field and no full version of
psychometric tool are available for
measuring consumer buying motive, we
have taken initiative to develop ‘Consumers’
Buying Motive Assessment Tool’ to classify
both rational and emotional dominated
consumers by considering previous literature
reviews and available different subscales
and following standard procedures
Method
Respondents
A total of 388 early adult respondents
were used in this study. Three divisions
(Dhaka, Chittagong and Sylhet) were
selected randomly (lottery technique) from 8
divisions. After getting the divisional city,
we used convenience sampling. The age of
the respondents ranged from 18 to 30 years
(Early adult consumers are more
independent decision maker), the mean age
being 24.65 years with SD= 3.39. Among
388 respondents, 194 (50%) were males and
194 (50%) were females. Most of the
respondents (92.63%) were students. The
perceived social statuses of these
respondents 52 (13.40%) were belong to
upper class, 247 (63.66%) were belong to
the middle class and rest 89 (22.94%) were
in the lower class group. Respondents in
Dhaka city were 167 (43.00%), Chittagong
city were 110 (28.04%), Sylhet city were
111 (28.06%). The Cross-Sectional survey
sample size determination test statistic was
used here proposed by Aday and Cornelius
(2006).
Design
Cross-sectional survey design was used in
this study.
Item Formation Procedures
Items of the Consumers’ Buying Motive
Assessment Tool (CBMAT) was constructed
by following steps;
i. Questionnaire formation:
a. Previous scales’ items
On the basis of the guideline Howard,
Cole & Maxwell, (1987), the following
questionnaire development steps were
followed.
Step one: Past literature reviews based
items
At the very first of this questionnaire
development, several questionnaires were
considered which were previously used to
partially explore this consumer buying
motive field. In case of consideration, we
give priority only on the subscales/ sub
dimensions of these scales which reflect our
present study’s desired content
(rational/emotional). The questionnaires are
as follows:
i. ‘The Utilitarian Meaning and Piecemeal
Judgement’ (rational focused scale) and
‘The Affective Judgement and
Symbolic Meaning’ (emotional focused
scale) (Mittal, 1988).
Jurnal Psikologi Malaysia 32 (2) (2018): 1-11 ISSN-2289-817 18
ii. ‘Affective and Rational Modes of
Consumer Choice’ (Allen and Ng,
1999).
iii. ‘The Decision-Making Styles
Inventory’ (Nygren, 2000).
iv. ‘The Decision Styles Scale’ (DSS;
Hamilton & Mohammed, 2016).
v. ‘Impulsive Buying Tendency Scale’
(Badgaiyan, Verma & Dixit, 2016).
Step two: Ensuring construct equivalence
To decide whether the constructs of the
English version of these previously stated
scales’ items have the identical meanings in
Bangladeshi culture as in English culture
and the constructs studied previously have
been reviewed. In addition, two subject
matter experts (both of them were faculties
of Psychology Department, University of
Dhaka) have judged the construct equality
between the two (English & Bangladeshi)
cultures.
Step three: Forward translation (English-
Bangla)
This step is followed by two translators
who individually translated these scales’
items from English to Bangla. They were
trying their level best in selecting the most
appropriate words, items or expressions to
translate their respective Bangla versions.
By this step, the initial Bangla version of
items was organized.
Step four: Back translation (Bangla-
English)
Again two translators were selected who
translated the Bangla items to English. The
correctness of forward translation was cross-
checked by the panel members’ back-
translation reviews.
b. Focus Group Discussion (FGD)
A formal focus group discussion was
arranged, comprised with 12 purposively
selected consumers (all of them were
graduate and post-graduate students of
Dhaka University). Then, we discussed with
them about the contributing factors behind
rational and emotional motive. Several
factors were already explored from the
previous scales and additionally, some other
unexplored but relevant and insightful items
were included now in the development of
this questionnaire. This FGD session took
45 minutes.
c. Items construction
Total 97 items were selected from
previous literature, previous scales’ items
and FGD findings. Among of these items,
46 were rational items and 51 were
emotional items.
d. Items cross-check and reduction
Then, we cross-checked these 97 Bengali
items. We found many irrelevant, saturated,
repetitive items among these items. Finally,
46 items were selected (23 rational and 23
emotional items).
e. Dimension specification and Item
correctness
Now, 46 items were reviewed by three
subject matter experts. They specified these
items as they think, by putting the “R” sign
in case of ‘rational motive measuring item’
and the “E” sign in case of ‘emotional
motive measuring item’. When these items
measure the dimension appropriately, the
experts had put the tick sign (√) and if any
correction needed, they wrote down their
feedback.
Jurnal Psikologi Malaysia 32 (2) (2018): 1-11 ISSN-2289-817 19
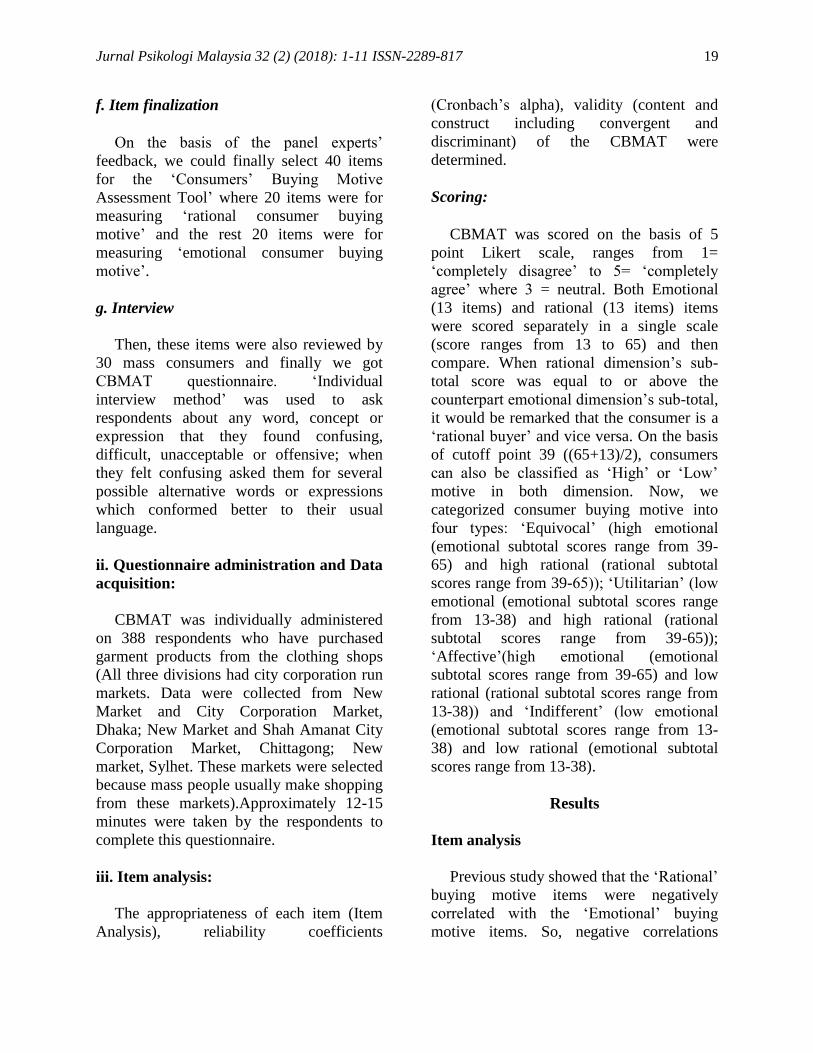
f. Item finalization
On the basis of the panel experts’
feedback, we could finally select 40 items
for the ‘Consumers’ Buying Motive
Assessment Tool’ where 20 items were for
measuring ‘rational consumer buying
motive’ and the rest 20 items were for
measuring ‘emotional consumer buying
motive’.
g. Interview
Then, these items were also reviewed by
30 mass consumers and finally we got
CBMAT questionnaire. ‘Individual
interview method’ was used to ask
respondents about any word, concept or
expression that they found confusing,
difficult, unacceptable or offensive; when
they felt confusing asked them for several
possible alternative words or expressions
which conformed better to their usual
language.
ii. Questionnaire administration and Data
acquisition:
CBMAT was individually administered
on 388 respondents who have purchased
garment products from the clothing shops
(All three divisions had city corporation run
markets. Data were collected from New
Market and City Corporation Market,
Dhaka; New Market and Shah Amanat City
Corporation Market, Chittagong; New
market, Sylhet. These markets were selected
because mass people usually make shopping
from these markets).Approximately 12-15
minutes were taken by the respondents to
complete this questionnaire.
iii. Item analysis:
The appropriateness of each item (Item
Analysis), reliability coefficients
(Cronbach’s alpha), validity (content and
construct including convergent and
discriminant) of the CBMAT were
determined.
Scoring:
CBMAT was scored on the basis of 5
point Likert scale, ranges from 1=
‘completely disagree’ to 5= ‘completely
agree’ where 3 = neutral. Both Emotional
(13 items) and rational (13 items) items
were scored separately in a single scale
(score ranges from 13 to 65) and then
compare. When rational dimension’s sub-
total score was equal to or above the
counterpart emotional dimension’s sub-total,
it would be remarked that the consumer is a
‘rational buyer’ and vice versa. On the basis
of cutoff point 39 ((65+13)/2), consumers
can also be classified as ‘High’ or ‘Low’
motive in both dimension. Now, we
categorized consumer buying motive into
four types: ‘Equivocal’ (high emotional
(emotional subtotal scores range from 39-
65) and high rational (rational subtotal
scores range from 39-65)); ‘Utilitarian’ (low
emotional (emotional subtotal scores range
from 13-38) and high rational (rational
subtotal scores range from 39-65));
‘Affective’(high emotional (emotional
subtotal scores range from 39-65) and low
rational (rational subtotal scores range from
13-38)) and ‘Indifferent’ (low emotional
(emotional subtotal scores range from 13-
38) and low rational (emotional subtotal
scores range from 13-38).
Results
Item analysis
Previous study showed that the ‘Rational’
buying motive items were negatively
correlated with the ‘Emotional’ buying
motive items. So, negative correlations
Jurnal Psikologi Malaysia 32 (2) (2018): 1-11 ISSN-2289-817 20
based items exclusion will not be
appropriate strategy in item analysis. This is
why; we have to prepare two correlation
matrices: one for ‘Emotional’ and another
for ‘Rational’. In the correlation matrix of
CBMAT: Emotional (not shown) didn’t
have any negative values and among 190
(‘Emotional’=20 items) inter-item
correlation coefficients 160 were significant
with average coefficient being .20. In item-
subtotal (item-emotional total) correlations,
13 corrected-item subtotal correlations were
significant (r >.30) which ranged from .38 to
.57 with a mean of .48. So, we have to
exclude 7 items from emotional subscale. In
the correlation matrix of CBMAT: Rational
(not shown), there were 22 negative values
and among 190 (‘Rational’=20 items) inter-
item correlation coefficients 146 were
significant with average coefficient being
.18. 2 items (item no. 16 and 22) were
excluded because of negative inter-item
correlations. In item-subtotal (item-rational
total) correlations, 13 corrected-item
subtotal correlations were significant (r
>.30) which ranged from .35 to .60 with a
mean of .44. So, we have to exclude 7 items
from rational subscale.
Factor analysis
Before conducting Exploratory Factor
Analysis (EFA), we checked whether data
were suitable for factor analysis. We could
conclude that the sample size was adequate
enough because the ‘Kaiser-Meyer-Olkin
(KMO) Measure of Sampling Adequacy’
was .87 which exceeded .60 (Kaiser, 1970)
and in the Bartlett's Test of Sphericity, the x²
value was 2875.89 (p<.001). In 26-item
CBMAT (13 ‘Rational’ and 13
‘Emotional’), substantial number (22.72%)
of coefficients .30 and above and the
determinant was .001 (>.00001, Field,
2005), so we could conclude that there was
no multicolinearity or singularity problem.
This finding supported our factorability of
the R-matrix.
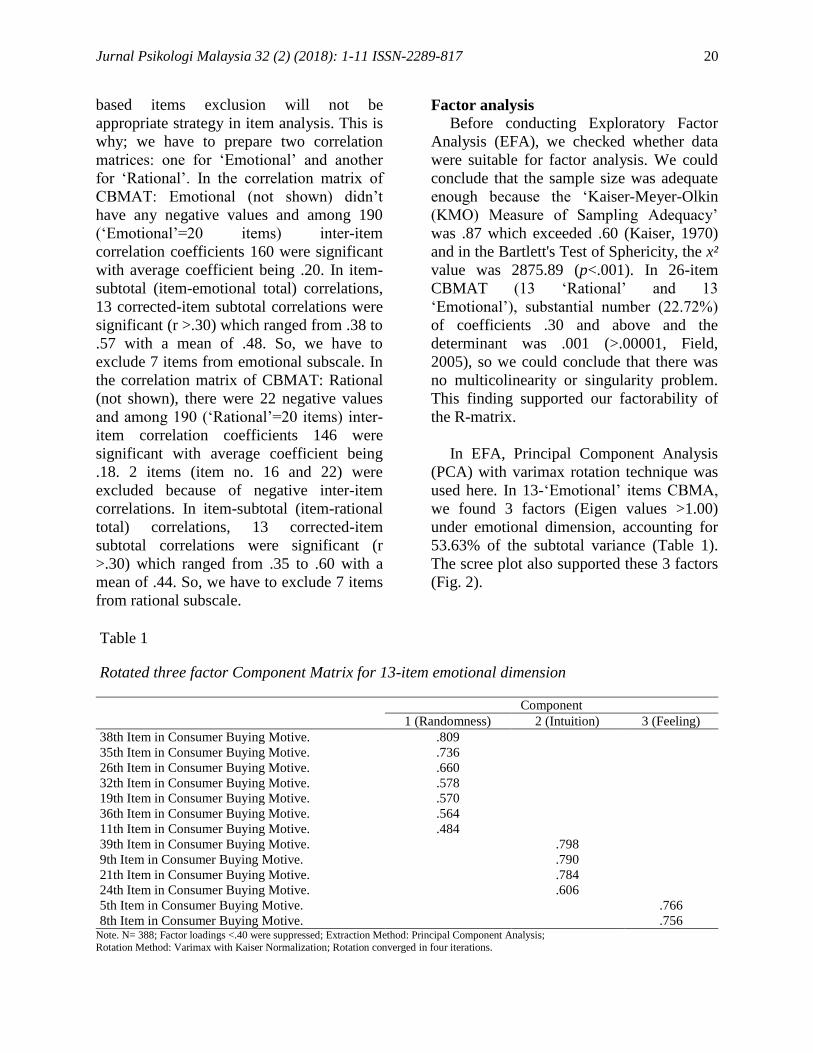
In EFA, Principal Component Analysis
(PCA) with varimax rotation technique was
used here. In 13-‘Emotional’ items CBMA,
we found 3 factors (Eigen values >1.00)
under emotional dimension, accounting for
53.63% of the subtotal variance (Table 1).
The scree plot also supported these 3 factors
(Fig. 2).
Table 1
Rotated three factor Component Matrix for 13-item emotional dimension
Component
1 (Randomness) 2 (Intuition) 3 (Feeling)
38th Item in Consumer Buying Motive. .809
35th Item in Consumer Buying Motive. .736
26th Item in Consumer Buying Motive. .660
32th Item in Consumer Buying Motive. .578
19th Item in Consumer Buying Motive. .570
36th Item in Consumer Buying Motive. .564
11th Item in Consumer Buying Motive. .484
39th Item in Consumer Buying Motive. .798
9th Item in Consumer Buying Motive. .790
21th Item in Consumer Buying Motive. .784
24th Item in Consumer Buying Motive. .606
5th Item in Consumer Buying Motive. .766
8th Item in Consumer Buying Motive. .756 Note. N= 388; Factor loadings <.40 were suppressed; Extraction Method: Principal Component Analysis;
Rotation Method: Varimax with Kaiser Normalization; Rotation converged in four iterations.
Jurnal Psikologi Malaysia 32 (2) (2018): 1-11 ISSN-2289-817 21
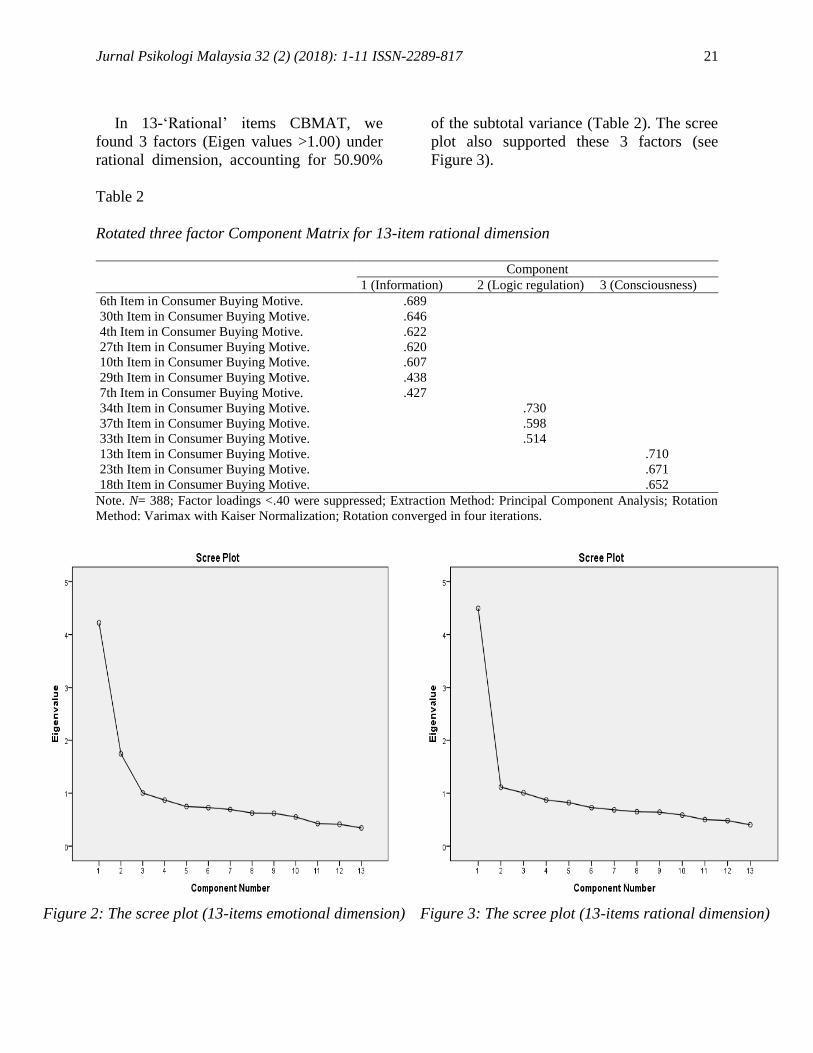
In 13-‘Rational’ items CBMAT, we
found 3 factors (Eigen values >1.00) under
rational dimension, accounting for 50.90%
of the subtotal variance (Table 2). The scree
plot also supported these 3 factors (see
Figure 3).
Table 2
Rotated three factor Component Matrix for 13-item rational dimension
Component
1 (Information) 2 (Logic regulation) 3 (Consciousness)
6th Item in Consumer Buying Motive. .689
30th Item in Consumer Buying Motive. .646
4th Item in Consumer Buying Motive. .622
27th Item in Consumer Buying Motive. .620
10th Item in Consumer Buying Motive. .607
29th Item in Consumer Buying Motive. .438
7th Item in Consumer Buying Motive. .427
34th Item in Consumer Buying Motive. .730
37th Item in Consumer Buying Motive. .598
33th Item in Consumer Buying Motive. .514
13th Item in Consumer Buying Motive. .710
23th Item in Consumer Buying Motive. .671
18th Item in Consumer Buying Motive. .652
Note. N= 388; Factor loadings <.40 were suppressed; Extraction Method: Principal Component Analysis; Rotation
Method: Varimax with Kaiser Normalization; Rotation converged in four iterations.
Figure 2: The scree plot (13-items emotional dimension) Figure 3: The scree plot (13-items rational dimension)
Jurnal Psikologi Malaysia 32 (2) (2018): 1-11 ISSN-2289-817 22
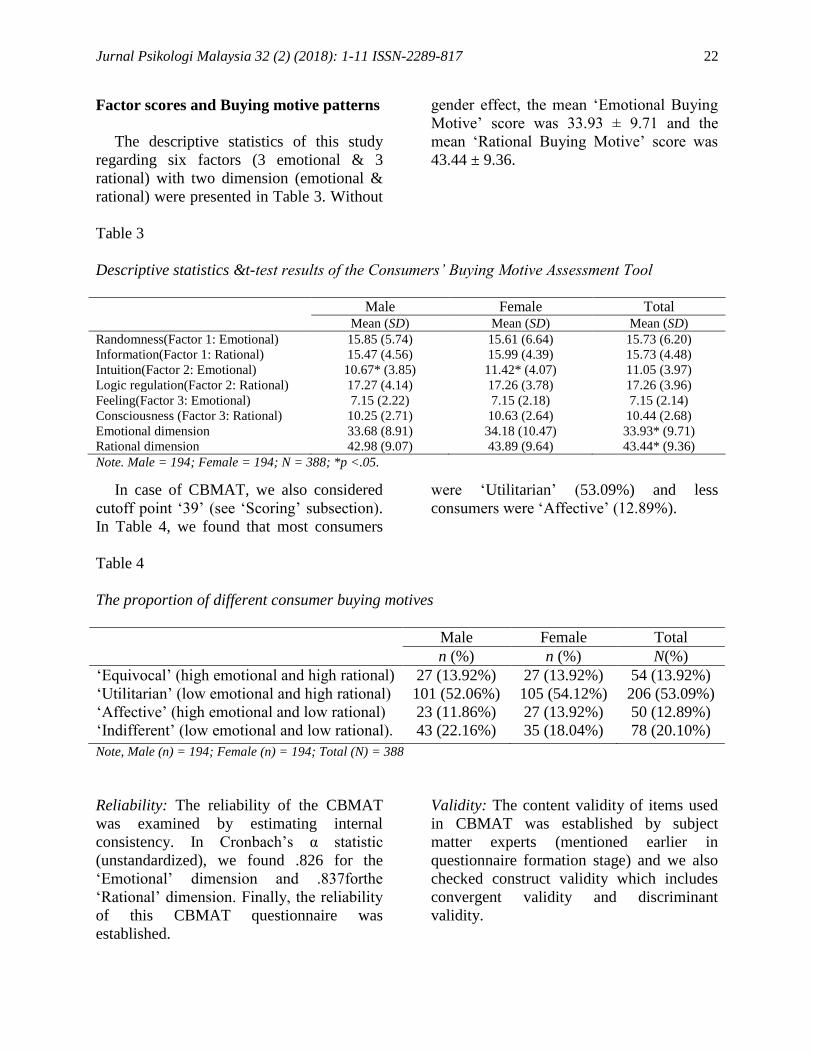
Factor scores and Buying motive patterns
The descriptive statistics of this study
regarding six factors (3 emotional & 3
rational) with two dimension (emotional &
rational) were presented in Table 3. Without
gender effect, the mean ‘Emotional Buying
Motive’ score was 33.93 ± 9.71 and the
mean ‘Rational Buying Motive’ score was
43.44 ± 9.36.
Table 3
Descriptive statistics &t-test results of the Consumers’ Buying Motive Assessment Tool
Male Female Total Mean (SD) Mean (SD) Mean (SD)
Randomness(Factor 1: Emotional) 15.85 (5.74) 15.61 (6.64) 15.73 (6.20) Information(Factor 1: Rational) 15.47 (4.56) 15.99 (4.39) 15.73 (4.48) Intuition(Factor 2: Emotional) 10.67* (3.85) 11.42* (4.07) 11.05 (3.97) Logic regulation(Factor 2: Rational) 17.27 (4.14) 17.26 (3.78) 17.26 (3.96) Feeling(Factor 3: Emotional) 7.15 (2.22) 7.15 (2.18) 7.15 (2.14) Consciousness (Factor 3: Rational) 10.25 (2.71) 10.63 (2.64) 10.44 (2.68)
Emotional dimension 33.68 (8.91) 34.18 (10.47) 33.93* (9.71) Rational dimension 42.98 (9.07) 43.89 (9.64) 43.44* (9.36) Note. Male = 194; Female = 194; N = 388; *p <.05.
In case of CBMAT, we also considered
cutoff point ‘39’ (see ‘Scoring’ subsection).
In Table 4, we found that most consumers
were ‘Utilitarian’ (53.09%) and less
consumers were ‘Affective’ (12.89%).
Table 4
The proportion of different consumer buying motives
Male Female Total
n (%) n (%) N(%)
‘Equivocal’ (high emotional and high rational) 27 (13.92%) 27 (13.92%) 54 (13.92%)
‘Utilitarian’ (low emotional and high rational) 101 (52.06%) 105 (54.12%) 206 (53.09%)
‘Affective’ (high emotional and low rational) 23 (11.86%) 27 (13.92%) 50 (12.89%)
‘Indifferent’ (low emotional and low rational). 43 (22.16%) 35 (18.04%) 78 (20.10%)
Note, Male (n) = 194; Female (n) = 194; Total (N) = 388
Reliability: The reliability of the CBMAT
was examined by estimating internal
consistency. In Cronbach’s α statistic
(unstandardized), we found .826 for the
‘Emotional’ dimension and .837forthe
‘Rational’ dimension. Finally, the reliability
of this CBMAT questionnaire was
established.
Validity: The content validity of items used
in CBMAT was established by subject
matter experts (mentioned earlier in
questionnaire formation stage) and we also
checked construct validity which includes
convergent validity and discriminant
validity.
Jurnal Psikologi Malaysia 32 (2) (2018): 1-11 ISSN-2289-817 23
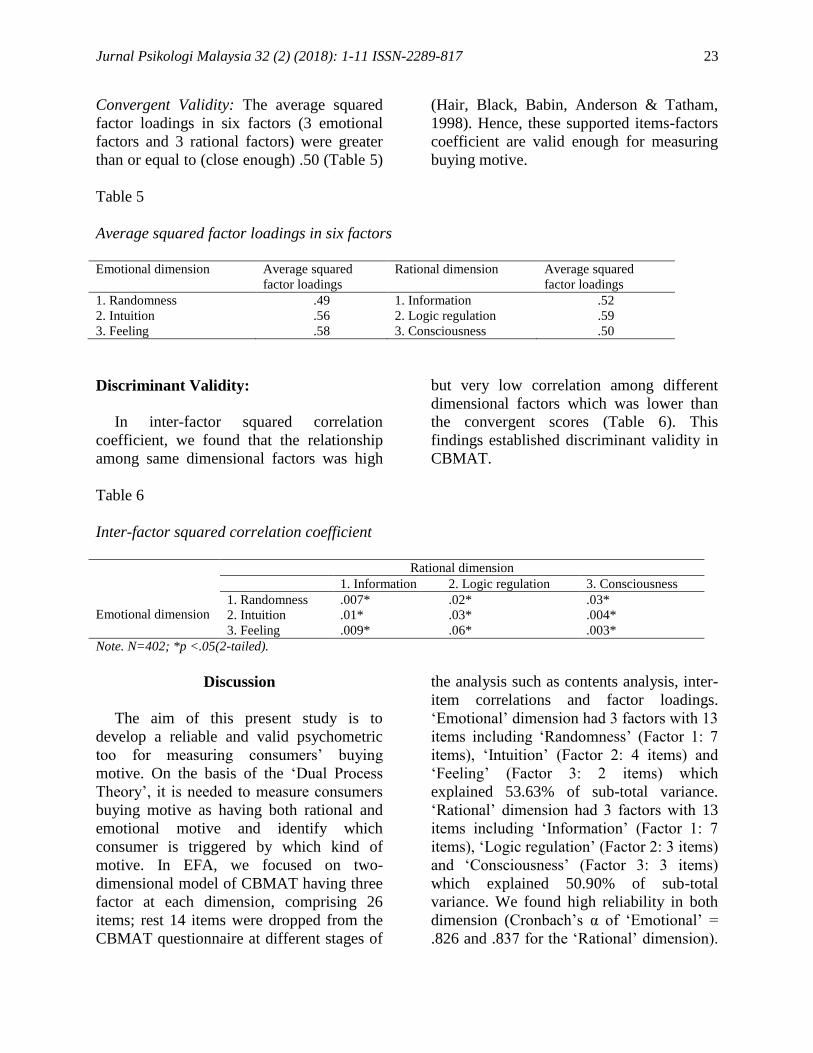
Convergent Validity: The average squared
factor loadings in six factors (3 emotional
factors and 3 rational factors) were greater
than or equal to (close enough) .50 (Table 5)
(Hair, Black, Babin, Anderson & Tatham,
1998). Hence, these supported items-factors
coefficient are valid enough for measuring
buying motive.
Table 5
Average squared factor loadings in six factors
Emotional dimension Average squared
factor loadings
Rational dimension Average squared
factor loadings
1. Randomness .49 1. Information .52
2. Intuition .56 2. Logic regulation .59
3. Feeling .58 3. Consciousness .50
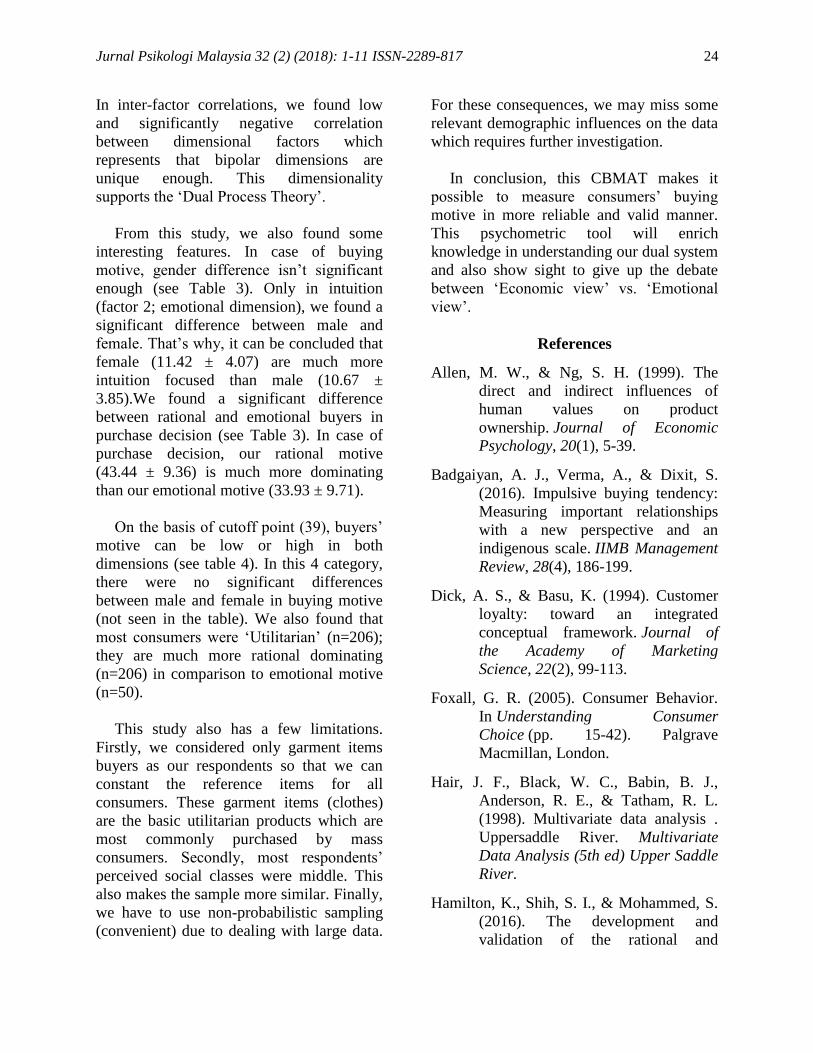
Discriminant Validity:
In inter-factor squared correlation
coefficient, we found that the relationship
among same dimensional factors was high
but very low correlation among different
dimensional factors which was lower than
the convergent scores (Table 6). This
findings established discriminant validity in
CBMAT.
Table 6
Inter-factor squared correlation coefficient
Rational dimension
Emotional dimension
1. Information 2. Logic regulation 3. Consciousness
1. Randomness .007* .02* .03*
2. Intuition .01* .03* .004*
3. Feeling .009* .06* .003*
Note. N=402; *p <.05(2-tailed).
Discussion
The aim of this present study is to
develop a reliable and valid psychometric
too for measuring consumers’ buying
motive. On the basis of the ‘Dual Process
Theory’, it is needed to measure consumers
buying motive as having both rational and
emotional motive and identify which
consumer is triggered by which kind of
motive. In EFA, we focused on two-
dimensional model of CBMAT having three
factor at each dimension, comprising 26
items; rest 14 items were dropped from the
CBMAT questionnaire at different stages of
the analysis such as contents analysis, inter-
item correlations and factor loadings.
‘Emotional’ dimension had 3 factors with 13
items including ‘Randomness’ (Factor 1: 7
items), ‘Intuition’ (Factor 2: 4 items) and
‘Feeling’ (Factor 3: 2 items) which
explained 53.63% of sub-total variance.
‘Rational’ dimension had 3 factors with 13
items including ‘Information’ (Factor 1: 7
items), ‘Logic regulation’ (Factor 2: 3 items)
and ‘Consciousness’ (Factor 3: 3 items)
which explained 50.90% of sub-total
variance. We found high reliability in both
dimension (Cronbach’s α of ‘Emotional’ =
.826 and .837 for the ‘Rational’ dimension).
Jurnal Psikologi Malaysia 32 (2) (2018): 1-11 ISSN-2289-817 24
In inter-factor correlations, we found low
and significantly negative correlation
between dimensional factors which
represents that bipolar dimensions are
unique enough. This dimensionality
supports the ‘Dual Process Theory’.
From this study, we also found some
interesting features. In case of buying
motive, gender difference isn’t significant
enough (see Table 3). Only in intuition
(factor 2; emotional dimension), we found a
significant difference between male and
female. That’s why, it can be concluded that
female (11.42 ± 4.07) are much more
intuition focused than male (10.67 ±
3.85).We found a significant difference
between rational and emotional buyers in
purchase decision (see Table 3). In case of
purchase decision, our rational motive
(43.44 ± 9.36) is much more dominating
than our emotional motive (33.93 ± 9.71).
On the basis of cutoff point (39), buyers’
motive can be low or high in both
dimensions (see table 4). In this 4 category,
there were no significant differences
between male and female in buying motive
(not seen in the table). We also found that
most consumers were ‘Utilitarian’ (n=206);
they are much more rational dominating
(n=206) in comparison to emotional motive
(n=50).
This study also has a few limitations.
Firstly, we considered only garment items
buyers as our respondents so that we can
constant the reference items for all
consumers. These garment items (clothes)
are the basic utilitarian products which are
most commonly purchased by mass
consumers. Secondly, most respondents’
perceived social classes were middle. This
also makes the sample more similar. Finally,
we have to use non-probabilistic sampling
(convenient) due to dealing with large data.
For these consequences, we may miss some
relevant demographic influences on the data
which requires further investigation.
In conclusion, this CBMAT makes it
possible to measure consumers’ buying
motive in more reliable and valid manner.
This psychometric tool will enrich
knowledge in understanding our dual system
and also show sight to give up the debate
between ‘Economic view’ vs. ‘Emotional
view’.
References
Allen, M. W., & Ng, S. H. (1999). The
direct and indirect influences of
human values on product
ownership. Journal of Economic
Psychology, 20(1), 5-39.
Badgaiyan, A. J., Verma, A., & Dixit, S.
(2016). Impulsive buying tendency:
Measuring important relationships
with a new perspective and an
indigenous scale. IIMB Management
Review, 28(4), 186-199.
Dick, A. S., & Basu, K. (1994). Customer
loyalty: toward an integrated
conceptual framework. Journal of
the Academy of Marketing
Science, 22(2), 99-113.
Foxall, G. R. (2005). Consumer Behavior.
In Understanding Consumer
Choice (pp. 15-42). Palgrave
Macmillan, London.
Hair, J. F., Black, W. C., Babin, B. J.,
Anderson, R. E., & Tatham, R. L.
(1998). Multivariate data analysis .
Uppersaddle River. Multivariate
Data Analysis (5th ed) Upper Saddle
River.
Hamilton, K., Shih, S. I., & Mohammed, S.
(2016). The development and
validation of the rational and
Jurnal Psikologi Malaysia 32 (2) (2018): 1-11 ISSN-2289-817 25
intuitive decision styles
scale. Journal of Personality
Assessment, 98(5), 523-535.
Hoque, M. R., Islam, S.,& Khan, N. A.
(2012). Consumer Motives Toward
Apartment Purchase: A Study From
Consumers’ Perspective. Journal of
Business Studies, 33(1), 194-195.
Howard, G. S., Cole, D. A., & Maxwell, S.
E. (1987). Research productivity in
psychology based on publication in
the journals of the American
psychological association. American
Psychologist, 42(11), 975.
Jantzen, C., Fitchett, J., Østergaard, P., &
Vetner, M. (2012). Just for fun? The
emotional regime of experiential
consumption. Marketing
Theory, 12(2), 137-154.
Jones, T. M. (1991). Ethical decision
making by individuals in
organizations: An issue contingent
model. Academy of Management
Review, 16(2), 366-395.
Katona, G. (1953). Rational behavior and
economic behavior. Psychological
Review, 60(5), 307.
Lancaster, K. J. (1966). A new approach to
consumer theory. Journal of
Political Economy, 74(2), 132-157.
Mittal, B. (1988). The role of affective
choice mode in the consumer
purchase of expressive
products. Journal of Economic
Psychology, 9(4), 499-524.
Padel, S., & Foster, C. (2005). Exploring the
gap between attitudes and behaviour:
Understanding why consumers buy
or do not buy organic food. British
Food Journal, 107(8), 606-625.
Pincus, J. (2004). The consequences of
unmet needs: The evolving role of
motivation in consumer
research. Journal of Consumer
Behaviour, 3(4), 375-387.
Stanton, W. J., Buskirk, R. H., Spiro, R. L.,
& Stanton, W. J.
(1995). Management of the Sales
Force. Chicago: Irwin.
Stoeva, M. (2017). Emotional Branding
Online: Case study: Nike. Retrieved
from
https://www.theseus.fi/bitstream/han
dle/10024/136114/Stoeva_Margarita
_Emotional_Branding_Online.pdf?se
quence=1.
Related Documents