Sari Ollila Consumers’ attitudes towards food prices ACADEMIC DISSERTATION To be presented, with the permission of the Faculty of Agriculture and Forestry of the University of Helsinki, for public examination in lecture room C1, Viikki, on Wednesday, December 7, 2011 at 12 p.m. Helsinki 2011 University of Helsinki Department of Economics and Management Publication Nr. 52, Food Economics

Welcome message from author
This document is posted to help you gain knowledge. Please leave a comment to let me know what you think about it! Share it to your friends and learn new things together.
Transcript

1
Sari Ollila
Consumers’ attitudes towards food prices
ACADEMIC DISSERTATION
To be presented, with the permission of the Faculty of Agriculture and Forestry of the University of Helsinki, for public examination in lecture room C1, Viikki,
on Wednesday, December 7, 2011 at 12 p.m.
Helsinki 2011
University of Helsinki Department of Economics and Management Publication Nr. 52, Food Economics

2
Custos: Professor Markku Koskela Department of Economics and Management University of Helsinki Helsinki, Finland
Supervisor: D.Sc. Sirpa Tuomi-Nurmi Department of Economics and Management University of Helsinki Helsinki, Finland
Reviewers: Docent Matti Tuominen Department of Marketing Aalto University of School of Economics Helsinki, Finland
Docent Sami Kajalo Senior Lecturer Department of Marketing Aalto University of School of Economics Helsinki, Finland
Opponent: Professor Outi Uusitalo Department of Marketing University of Jyväskylä Jyväskylä, Finland
ISBN 978-952-10-7379-3 (paperpack)ISBN 978-952-10-7380-9 (pdf)ISSN 1235-2241
AM digipaino / AM Print OyHelsinki 2011

3
University of HelsinkiDepartment of Economics and ManagementPublication Nr. 52, Food Economics, 340 p.
Consumers’ attitudes towards food prices
Sari Ollila
Abstract. High food prices can be a barrier to healthy eating if food products are perceived as expensive and the consumers are not willing to accept the higher prices. Understanding the role of price in food purchase situations is important, but only a few studies document attitudes towards expensiveness or cheapness in foods. In this thesis, the role of food price in food choice and consumers’ attitudes towards food prices were investigated and the aim was to measure the food price attitudes. Food price attitudes were hypothesized to have an impact on consumers’ willingness to pay judgements and their willingness to buy premium-priced food products. First, using qualitative data consisting of 40 thematic interviews the experiences of the expensiveness and cheapness in foods were explored by using functional food products as a target product category. Second, a Food Price Attitude Scale was developed using four quantitative surveys representing Finnish consumers (2001 N=1158; 2002 N=1156; 2004a N=1113; 2004b N=1027).
Food price attitudes were confirmed to compose a multidimensional construct and consumers may perceive positive and negative attitudes towards both high and low food prices. Finnish consumers were clustered into four groups based on their food price attitudes. In the first group, 29% of respondents were negative towards high food prices and they were willing to seek low food prices, whereas respondents in another group (22%) were positive towards high food prices. Additionally, in the third group consumers (17%) were willing to pay for high quality but still looked for low food prices. In the fourth group, consumers (32%) were willing to look for low food prices, unwilling to pay for high quality, but high-priced food was appreciated if offered to others. It was found in qualitative data that consumers’ willingness to accept high prices in foods was connected to price fairness and to justifications. Feelings of fairness or unfairness might be a core element of food price attitudes. Using quantitative methods, it was confirmed that positive attitudes towards high food prices in terms of high quality enhanced consumers’ willingness to buy food products with certain benefits (e.g., a health claim). Additionally, the favourable attitude towards low food prices lowered the willingness to pay estimates. This type of tendency, however, can create a possible bias in small convenient samples. In the food price-related research, it is advisable to take into account food price attitudes as possible background variables. The Food Price Attitude Scale needs further development to increase construct validity even though, in the present study, it was shown to be a reliable measure with good predictive and discriminant validity. The theoretical and managerial implications of the results for a better understanding of the role of price in consumers’ food purchases are discussed.
Keywords: food prices, attitudes, consumers

4
Helsingin yliopistoTaloustieteen laitos
Julkaisu nro. 52, Elintarvike-ekonomia
Kuluttajien asenteet ruoan hintaa kohtaan
Sari Ollila
Tiivistelmä. Kallista elintarvikkeen hintaa voidaan mahdollisesti pitää esteenä terveellisten elintarvikkeiden säännölliselle käytölle, mikäli kuluttajat pitävät niiden hintoja kalliina eivätkä kuluttajat halua hyväksyä kallista hintaa ruoassa. Tässä tutkimuksessa tutkittiin hinnan merkitystä ja kuluttajien asenteita ruoan hintaa kohtaan ja tavoitteena oli kehittää ruoan hintaan soveltuva hinta-asennemittaristo. Haastatteluaineistosta (N=40) tutkittiin, miten kalleus ja halpuus ruoassa koettiin ja miten terveysvaikutteisten elintarvikkeiden hintoihin suhtauduttiin. Laadullisen tutkimuksen pohjalta elintarvikkeiden hintoihin kohdistuvaa hinta-asennemittaristoa kehitettiin neljän suomalaisista kuluttajista koostuvan kyselyaineiston avulla (2001 N=1158; 2002 N=1156; 2004a N=1113; 2004b N=1027).
Hinta-asenne on moniulotteinen käsite ja kuluttajat voivat kokea sekä positiivisia että negatiivisia asenteita niin halpaa kuin kallistakin ruoan hintaa kohtaan. Kehitetyn mittariston avulla kuluttajia jaettiin neljään ryhmään sen mukaan, miten he suhtautuivat elintarvikkeiden hintoihin. Osa tutkituista kuluttajista (29%) suhtautui negatiivisesti kalliiseen ruoan hintaan eikä ollut halukas maksamaan enemmän paremmasta laadusta. Toinen kuluttajaryhmä (22%) oli halukas maksamaan hyvästä ruoan laadusta tai he pitivät kalliin ruoan tarjoamista vieraille tärkeänä. He suhtautuivat positiivisesti kalliiseen ruoan hintaan. Kolmas ryhmä (17%) oli halukas etsimään halpoja elintarvikkeita, mutta myös maksamaan hyvästä laadusta, kun taas neljännen ryhmän kuluttajat (32%) eivät uskoneet, että kallis hinta merkitsee parempaa elintarvikkeen laatua. Halpa hinta ruoassa oli heille tärkeää, mutta he kokivat, että vieraille tulisi tarjota tavanomaista kalliimpaa ruokaa. Laadulliset tulokset osoittivat, että hinnan oikeudenmukaisuus saattaa olla yksi hinta-asenteen peruselementeistä. Kallis hinta voidaan ehkä hyväksyä, mikäli sille löytyy hyväksyttävät perustelut. Halpa hintakin voidaan kokea negatiivisena, mikäli se koetaan epäreiluna. Tilastollisten tulosten mukaan positiivinen asenne kallista hintaa kohtaan saattaa edistää halukkuutta ostaa kalliimpi elintarvike, mikäli tuotteeseen liittyy jokin lisäarvo. Toisaalta positiivinen asenne halpaa ruoan hintaa kohtaan saattaa alentaa annettuja hinta-arvioita maksuhalukkuuteen liittyvissä tutkimuksissa. Mikäli tuotekehityksen yhteydessä käytetään valikoituneita vastaajajoukkoja, hinta-asenne voisi olla suositeltava uusi taustamuuttuja. Tässä tutkimuksessa kehitetty hinta-asennemittaristo on luotettava mittaamisen työkalu, mutta mittaria tulee edelleen kehittää nimenomaan rakennevaliditeetin lisäämiseksi.
Avainsanat: ruoan hinta, asenteet, kuluttajat

5
Acknowledgements
This thesis is the sum of much work done by many contributing individuals, thus it is impossible to acknowledge all and everyone here. I would like to extend my sincere gratitude to all who in different ways have contributed to this work. At different stages different individuals have had important roles in the making of this thesis. Even if not all of you are mentioned here by name, I trust that each one of you will know how important you are to me.
I am especially grateful to my supervisor D.Sc. Sirpa Tuomi-Nurmi for all the support, encouragement, guidance and supervision that was given unselfishly. It seemed that you always had time for me and my thoughts. I also wish to express thanks to professor Markku Koskela for all of his support. Thank you for arranging time for me to work undisturbed especially during the final hectic stages of the work. I thank the reviewers docent Matti Tuominen and docent Sami Kajalo for their encouraging remarks which enabled me to finalize the work. This work would not be without the input of Lic.Sc. Helena Immonen whose relentless travail has secured many of our department’s projects. A special thank to the English reviser for making the text understandable. A special thank also to Lis.Sc. Eeva Lindroth, whose valuable work with the student tutoring enables us others to concentrate on our research activities. I also value greatly the assistance I have received from our secretaries Nina Niemeläinen and Outi Pajunen. I would like to thank Aimo Immonen, Heikki Mäkinen and Tuulikki Parviainen, all doctors-to-be, for the discussions we had, especially at times when the work seemed to have come to a dead end. I would also like to take the opportunity to encourage them in their work and remind them that mutually, I am always prepared to assist. I also extend a huge thank you to all of my colleagues for their support and optimism.
No research is possible without economic support. I therefore extend my sincere gratitude to the Foundation for Economic Education and the Finnish Cultural Foundation for the grants which enabled me to finish this work. My gratitude also goes to the Finnish Funding Agency for Technology and Innovation, TEKES and the whole research team which during 2001-2004 worked on the research project, of which this thesis is a part. In this context, a special thank goes to professor Hely Tuorila, D.Sc. Liisa Lähteenmäki, D.Sc. Nina Urala and D.Soc.Sc. Anna Bäckström, with whom I had the privilege to cooperate. I also thank M.Sc. Niina Hautala, who carried on the research during my maternity leave.
A warm thank also to all my close and dear ones, who helped me with encouragement and support in numerous ways during this considerable undertaking. A special thank is reserved my parents and siblings and their families. An affectionate thank goes to you Quije and Matilda. To Quije a special thank for preparing my thesis for print. To Matilda – thank you, just for being.
Vantaa 20.11.2011 Sari Ollila

6

7
Contents
1 Introduction 11
1.1 Consumers’ price perception and price attitude 12
1.2 Objectives of the study 15
1.3 Definition of the concepts 19
2 Food price in attitude and marketing research 23
2.1 Food Choice and price 24
2.2 Price judgements 29
2.2.1 The price-quality relationship 31
2.2.2 The cheap-expensive relationship and the reference price 38
2.2.3 The prospect theory 41
2.2.4 Fair price experience 45
2.2.5 Consumer differences in price perceptions 48
2.3 Attitude 52
2.3.1 Attitudes and evaluation system 55
2.3.2 Attitude and price 60
2.4 Measuring price attitude 64
3 Framing food price attitudes 69
3.1 Design of the qualitative study 70
3.1.1 Subjects 70
3.1.2 Interview procedure 72
3.1.3 Analysing the qualitative data 74
3.2 Results of the qualitative study 76
3.2.1 Perceptions of food prices in Finland 77

8
3.2.2 Buying food is different from buying other commodities 79
3.2.3 Price perceptions of functional food products 88
3.2.4 Qualitative statements and domains related to price perception 91
3.3 Theoretical conclusions of the qualitative results 95
3.4 The theoretical and operational framework for the study 104
4 Quantitative survey studies 119
4.1 The materials and methods of the surveys 119
4.1.1 Survey samples 120
4.1.2 Post mail surveys 123
4.1.3 Pretesting the food price attitude measurements 123
4.2 Data analysis methods 124
4.2.1 Exploratory factor analysis 125
4.2.2 Confirmatory factor analysis and SEM 128
4.2.3 Logistic regression analysis 135
4.2.4 Cluster analysis 136
5 Results of the surveys 139
5.1 Developing the Food Price Attitude Scale 139
5.1.1 Price attitude in general or the food price attitude 142
5.1.2 Developing the final measurement 150
5.1.3 Description of the dimensions 152
5.1.4 Confirmation and purification of the Food Price Attitude Scale 154
5.1.5 Purification of the model and SEM 159
5.2 Relationship between price estimations and the food price attitudes 167
5.3 Explaining buying behaviour 172
5.4 Differences between consumers based on the food price attitude 177
9
5.4.1 Exploring the optimum cluster solution 178
5.4.2 Describing the Food Price Attitude groups 179
5.4.3 Validation of the cluster structure 183
5.5 Summary of the quantitative results 187
6 Discussion and contributions 192
6.1 Main findings of the study 192
6.1.1 The importance of price 193
6.1.2 Quality perceptions and price 199
6.1.3 Food Price Attitudes 201
6.1.4 The impact of food price attitudes on behaviour 208
6.2 Conclusions and contributions 212
6.2.1 Theoretical contributions 213
6.2.2 Methodological contributions 219
6.2.3 Managerial contributions 221
6.3 Limitations of the study and future research 222
6.3.1 The reliability and validity of the study 224
6.3.2 Future research 226
References 230
Appendices 249
Appendix 1: Price Perception Scale items 249
Appendix 2: Themes of discussion during the personal interviews 251
Appendix 3: Frequencies of background variables in the survey samples in 2001, 2002, 2004a, and 2004b 253
Appendix 4: Food survey questions in 2002 255
Appendix 5: The Food Price Attitude statements in the survey 2004a 259
Appendix 6: Food survey questions in 2004b 260
10
Appendix 7: Comparisons between the segmented groups based on the age groups, education, profession, income level, and assets for daily use 261
Appendix 8: Compared means and ANOVA results based on the food price attitude dimensions and background variables 266
Appendix 9: Results of the confirmatory factor analysis 273
Appendix 10: Results of the structural equation modelling 284
Appendix 11: Results of the one-way analysis of variance between price estimations and background variables 300
Appendix 12: Results of the K-means cluster analysis in 2002, 2004a and 2004b based on the food price attitude dimensions 326
Appendix 13: Results of the K-means cluster analysis in 2002 based on the willingness to buy higher priced food product with different quality benefits and the results of the T-test 330
Appendix 14: Results of the logistic regression analysis 334
11
1 Introduction
Food prices frequently arouse consumers’ attention. Increase in food prices usually generates a public debate on consumers’ resistance to high food prices, the demand for low-priced food, or the unfairness of premium pricing, and attitudinal evaluations related to these factors are usually included. According to neoclassical economic theory consumers are willing to make rational choices and maximize utility by looking for the lowest acceptable price. However, some consumers seem to make irrational choices preferring high-priced products to ones with a lower price (Thaler 1985), or perhaps may even refuse the deal totally if the price is perceived as unfair (Kahneman et al. 1986). Understanding the consumers’ subjective price evaluations is challenging. From the 1950s onwards a growing interest in individual differences has turned the focus on psychological and behavioural processes in the field of economics (Katona 1977) and especially in marketing.
Consumers’ ability to search for price information and to remember earlier prices has been a matter of academic theoretical investigation for several decades. Results have confirmed that consumers’ price knowledge seems to be quite limited especially with low-involved products such as foods (see Monroe 1973; Rao and Monroe, 1988; Monroe and Lee, 1999). Similarly, for several decades marketers and marketing researchers have been trying to understand consumers’ price evaluations in order to predict consumers’ buying behaviour more accurately. Therefore, consumers’ acceptance of prices is an important issue to consider in competitive pricing strategies. However, in Finland, using price as a competitive attribute in food markets became relevant as recently as 1988 when a general price control was abandoned and food was allowed to have price alterations (Reimavuo 2003, 56).
In Finland, one may think by reading the newspapers that food is perceived as somewhat expensive, and that Finnish consumers demand low food prices. This may give the impression that Finnish consumers only value low-priced food. For example, the recent global increase of food prices in 2007 evoked an interesting media discussion on food prices and the competitive ability of Finnish food chain. Low food prices were seen as a threat to Finnish food production and the discussion of high-priced food was considered necessary to increase the profile of Finnish food (Korhonen 2007). Similar concerns have emerged globally. Declining food prices have been considered a threat to the food quality and safety, national agriculture, the environment, or animal welfare. Low food prices are said to be the consequence of pressures created by consumers who are unwilling to pay high prices, as well as price competitions between retailers and producers (Appelby et al. 2003).
There are also global concerns related to high food prices. For example, high prices have been found to be a barrier to eating more organically produced meat (McEachern and

12
Schröder 2001), fish (Verbeke and Vackier 2005) or fruits and vegetables (Ard et al. 2007). Additionally, high prices have been assumed to be a barrier to meeting dietary guidelines (Cassady et al. 2007). In several studies, the relationship between a low income level and a poor diet quality has been detected, and the importance of low food prices to the low-income families is clear (Drewnowski et al., 2004; Andrieu et al. 2006; Bowman 2006; Cassady et al. 2007; Ard et al. 2007). However, Blaylock et al. (1999) argues that food is more affordable than ever to American consumers, yet they still do not make healthy choices. Nevertheless, 51% of American consumers think that price can be a barrier to healthy eating because they have perceived special healthy products to be expensive. Also, in Finland, special health products are perceived as expensive and the unwillingness to buy these products is, in many cases, related to price (Ollila et al. 2004). However, in Europe, only 15% of consumers think that maintaining a healthy diet is related to price, but there is a considerable amount of variance between subgroups in the EU population. Therefore, it is assumed that some people are more affected by the price than others. (Kearny and McElhone 1999, S135.) Some consumers are willing to pay more for better taste, better nutritional value, and are concern with ethical issues (Appelby et al. 2003), and such consumers are not looking for the lowest possible food prices. Consumers’ attitudes towards high or low food prices are probably multidimensional including both favourable and unfavourable considerations and there are differences between consumers.
In the dual situation between low- and high-priced food, the Finnish food industry has to make strategic decisions. On the one hand, it has pressures to invest more in mass production in order to decrease food prices and preserve compatibility. However, the pressure to import cheap food from low-cost-countries is increasing (Korhonen 2007), and it may be difficult to make profits with cost effective strategies. On the other hand, Finland has an opportunity to develop high value food products in order to respond to the global differentiated demand. However, new food innovations or special production conditions most likely increase costs increasing food prices as a consequence. Before launching a new product at a premium price the targeted consumers should be willing to pay for it if the product is to succeed. Undoubtedly, the consumers’ willingness to accept expensive food is an important question. However, there is not as yet sufficient research on this topic and more understanding of the role of price in purchasing food is clearly required.
1.1 Consumers’ price perception and price attitude
The effect of price on consumers’ buying behaviour has been frequently researched for several decades, and price has been considered an information cue concerning products (see Monroe 1973; Rao and Monroe, 1988; Monroe and Lee, 1999). However, little is known how and in what form consumers restore, categorize, evaluate and retrieve price information and what can be predicted based on this knowledge (Jacoby and Olson 1977; Zeithaml 1988; Monroe and Lee 1999). Price has also been widely studied as an extrinsic cue in food choice experiments carried

13
out by sensory, consumer and food scientists (Köster 2009). However, results concerning the role of price in food choice are somewhat heterogeneous.
Buying a product is a complex situation with a great variety of different stimuli to be taken into account before a decision is made. Quite often price is operationalized as a given component in order to get something (Leavitt 1969; Monroe 2003). Moreover, price perception has been regarded in earlier studies as a one-dimensional construct (Padula and Busacca 2005, 30) according to which low price is favourably and high price unfavourably interpreted (Steptoe et al. 1995). This is in accordance with the principle of the economic rationality of the consumer. However, several studies have shown that consumers can make irrational choices in buying higher priced products instead of lower priced ones (e.g., Leavitt 1969; Thaler 1985) and price can be a multi-dimensional construct including, for example, fairness assumptions (Padula and Busacca 2005, 46). Consumers’ responses to price information can be related to quality information and information uncertainty (e.g., Emery 1969; Huber and McCann 1982; Tellis and Gaeth 1990 Urbany and Bearden 1997).
Consumers are individual in their perception of prices and price-quality relations, and several product attributes (e.g., familiarity, a brand name, involvement, information, and a product category) are used to explain these differences (Zeithaml 1988). Moreover, consumers make different price judgements with different food items. Money spent on bread is valued differently than money spent on meat (Cooper 1969, 122-135). Socio-demographic factors are widely used to explain the differences between consumers and their behaviour. Rosa-Diaz (2004) showed that consumers tended to underestimate the actual price, but only a little of the variance was explained by socio-demographic variables or attitudinal variables, such as a self-reported price importance or a price knowledge certainty. In the previous price research, individual price perceptions are related to the internal (prior prices in the minds of consumers) and external (other prices perceived around the observed price) reference price information (Kalyanaram and Winer 1995; Kumar et al. 1998). However, little is explained what affects the reference price and price estimations. The role of price in product choice has been related to emotions (O’Neill and Lambert 2001, 232), and, other affective evaluations may be involved.
Consumers may have attitudes towards both the objective (visual observation of the actual price) and the perceived price (subjective evaluation of the actual price) (Jacoby and Olson 1977, 82), but how these attitudes affect buying behaviour is not well known despite numerous investigations from the1940s to the present day. Consumers create subjective perceptions of the observed price; one can judge the price as cheap, expensive or be neutral towards it. Quite often the attitudes towards price have been related to the upper and lower limits of prices beyond which consumers find the price unacceptable (Stoetzel 1969, 70-74; Adam 1969, 75-88; Gabor and Granger 1969b, 134-137). These ultimate limits are referred as “too cheap” and “too expensive” and consumers usually reject a product priced outside of these reference points (Gabor and Granger 1969b). At the same time, there seems to be a range of tolerance (called

14
an acceptable price range or latitude of acceptance by Helson 1964; Sherif 1963) in which consumers may perceive the product as acceptable (Emery 1969, 100).
According to previous studies quality assessments are inevitably connected to price information to some extent (Emery 1969; Gabor and Granger, 1969a; Leavitt, 1969; Stoetzel 1969). Consumers’ price judgements are relative, and further, both the use-value of the product and the value of the money spent on that product are largely subjective in nature (Cooper 1969, 112-131; Padula and Busacca 2005, 30). According to Steenkamp and van Trijp (1989, 12) quality consciousness (the subject’s ability and willingness to perceive quality differences) is a product-specific concept and is perceived differently in foods and non-foods (in case of cars see Erickson and Johansson 1985). If a person is quality conscious, he or she is willing to pay a higher price for higher quality, thus possessing favourable attitudes towards high food prices (Steenkamp and van Trijp 1989, 19-20; Lichtenstein et al. 1993). Favourable attitudes towards expensiveness in foods may enhance consumers’ willingness to buy value-added foods at premium price, and, for this reason, these attitudes might play a role in developing and marketing new food innovations.
During the recent years, food products with a higher health-related value have caught public and scholarly attention. Functional food products are a relatively new innovative category of food, and these products are considered to have increased in importance (Verschuren 2001). The food industry is looking for better profits because the demand for functional food products is expected to increase in volume, and compared to the price of regular food products, that of corresponding functional foods is higher (Consumer Agency 2004). However, developing a new functional food product might be time-consuming and expensive, and consumers should be willing to pay a premium price for foods with health effects in order for these products to yield profits. Additionally, in order to improve consumers’ health these products should be regularly consumed. Regular consumption increases the total costs of food budgets, thus making them unattractive to some consumers (Ollila et al. 2004). Even if some consumers were willing to pay a little more for functional food products, the acceptable price level might fail to meet the revenue expectations and the product could be unsuccessful (Bower et al. 2003).
Product success or failure is difficult to forecast, especially if new innovative food products are developed. Thereby, in order to predict consumers’ responses several consumer tests are conducted as a part of the product development process. With these consumer tests manufacturers are trying to guarantee the success of the product and attempting to predict the demand. Due to cost reasons, the scales and measurements used in these tests are designed to be short and effective (Reardon et al. 1995). Similarly, consumer tests are often made using small consumer panels collected by convenience sampling methods. In such cases, consumer differences may bias the results, and more accuracy would be needed to describe the attitudinal perceptions among the panellists. To measure the attitudinal

15
perceptions towards functional food products was one of the aims of the research project “Tools for consumer-oriented product development” which was ongoing during 2001-2004 and which this study belonged to. All the data, used in this thesis, was collected for purposes of this research project. In this project, the measurements were developed for the purpose of product testing and for predicting the consumers’ acceptance of the new and innovative food products. The research project was executed with three research establishments (VTT Biotechnology, the University of Helsinki the Department of Food Technology and the Department of Economics and Management) and five companies from the food industry. The project was funded by TEKES (the Finnish Funding Agency for Technology and Innovation), VTT (the Technical Research Centre of Finland), the University of Helsinki, and by the industrial partners.
1.2 Objectives of the study
Although previous literature has shown that there are differences in price perceptions between consumers, little attention has been focused on consumers having different attitudinal opinions towards cheapness and expensiveness. Jacoby and Olson (1977, 84) observed three decades ago that only a few studies stressed price attitudes, and that fundamental research concerning price attitude structure and its impact on behavioural intentions has been almost completely overlooked. The investigated knowledge of the differences between consumers’ price attitudes is lacking especially in the food context. Besides, little is known what kind of an effect price attitudes can have on buying behaviour or willingness to pay judgements. Price judgements are usually asked for during the product development processes for price setting purposes. Because attitudes can be used as substitutes in a difficult evaluation task (Kahneman 2003, 701), attitudes towards food prices can have an effect on price evaluations. This is especially true when consumers lack price knowledge or have difficulties in retrieving previous price information from memory (Gabor and Gadner 1969a; Dickson and Sawyer 1990; Rosa-Diaz 2004).
The purpose of this study is to understand the role of price in food purchase situations, and what kind of meaning consumers give to food prices. The stated importance of price has been measured in several studies (e.g., Steptoe et al. 1995; Eartmans et al. 2006; Chen 2007), but little is known what kind of motivation lies behind it. The aim of this study is to gain better knowledge of attitudinal opinions towards expensiveness and cheapness in foods, and thus construct a model of food price attitudes. Additionally, the objective is to investigate how Finnish consumers perceive high food prices and how a premium price in foods would be found acceptable by using functional food products as a target food category. The main research questions are derived from these objectives:

16
1. Whatistheroleofpriceinfoods,andhowimportanttoconsumersispriceinfoodpurchasesituations?
2. How do consumers perceive expensiveness and cheapness in foods, and doconsumershaveattitudinalperceptionstowardsfoodprices?
Further, it is assumed here that consumers interpret perceived expensiveness and cheapness in foods individually. Thus describing the differences relating to food price attitudes among Finnish consumers is one of the interests of this study. Equally, it is investigated how the food price attitude affects consumers’ food purchase behaviour or price judgements. Accordingly, the following questions can be drawn from these assumptions:
a. How do Finnish consumers differ in their attitudes towards expensiveness andcheapnessinfoods?
b. Howdofoodpriceattitudesaffectconsumers’willingnesstobuypremium-pricedfoodproductsorpricejudgements?
Because of the arguments that food price attitudes affect behaviour, there is a need for food price attitude measurements. In this study, developing a measurement scale for food price attitudes is based on the Price Perception Scale by Lichtenstein et al. (PPS; 1993). In their two-dimensional model, positive attitudinal opinions towards prices were relating to high price as a sign of a quality (cf. quality consciousness by Steenkamp and van Trijp 1985) or gained prestige. Quality and prestige inferences from high price were also included in Anttila’s (1990, 120) the quality mindedness attitude scale. The negative attitudinal opinion statements in PPS were related to looking for low prices, buying on sales, or looking for the best value for money (see also Anttila’s (1990, 97) the price mindedness attitude). Based on Steenkamp and van Trijp’s (1985) study some consumers are willing to pay higher than the regular food price, and thus they may have a positive attitude towards high food prices. Some consumers have a tendency to focus only on low prices and are actively looking out for them (Lichtenstein et al. 1993), and, consequently, these consumers may possess a negative attitude towards high food prices or at least they are positive towards low food prices. It is therefore proposed here that consumers’ willingness to buy premium-priced food products can vary based on positive or negative attitudes towards high or low food prices as the first hypothesis states:
H1:Consumerswithpositiveattitudes towardshigh foodpricesaremorewilling tobuyfoodproductsatapremiumpricethanthosewithpositiveattitudestowardslowfoodprices.
There is no clear evidence in which form consumers process and recall price information, whether they store observed prices in a numerical form or just according to evaluative words like “cheap” or “expensive” (Jacoby and Olson 1977; Xia 2003). However, acceptable price

17
estimates are widely used in price-related studies. Consumers are often asked when using the method of contingent valuation “how much would you be willing to pay”, or “at what price would you be willing to buy or accept” a target product (Park and MacLachlan 2008). In other methods of research, consumers are asked to evaluate at what price the product is perceived to be cheap, expensive, too cheap, or too expensive in order to discover price thresholds (Stoetzel 1969; Adam 1969: Gabor and Granger 1969b; Westendorp 1976). However, the reliability of these price estimations should be carefully considered if consumers remember poorly (Dickson and Saywer 1990), evaluate food prices unconsciously (Monroe and Lee 1999) or are unable to name any price for a product just bought (Rosa-Diaz 2004). If a person is lacking price knowledge the price estimations may be affected by feelings of price fairness (Padula and Busacca 2005) or other attitudinal opinions towards prices. According to Rosa-Diaz (2004, 413), people with poor price knowledge had a strong tendency to underestimate prices, and, none of the socio-demographical variables but gender had a statistically significant effect on underestimation. Based on the results of Steenkamp and van Trijp (1985, 19) the higher the quality consciousness of a person the greater price judgements (the willingness to pay estimations). According to Grunert et al.’s (2009) study, value consciousness (a tendency to look for the best value for money) affected willingness to pay estimations. Therefore, it is expected that negative and positive attitudes towards high and low food prices would have an impact on price judgements, as the second hypothesis proposes:
H2:Consumers’ foodpriceattitudeshaveaneffecton statedacceptableprices:positiveattitudes towards high food prices increase the willingness to pay estimations whereaspositiveattitudestowardslowfoodpricesdecreasethem.
It is predicted that consumers’ food price attitudes may alter the price estimations and willingness to buy statements. This type of tendency can cause a bias in the research situation if small sample sizes and convenience sampling methods are used. Many of the consumer behaviour studies in marketing are done based on experimentations using student samples (Winer 1999). Similarly, fixed consumer panels are frequently used in developing new food innovations and conducting consumer tests of price acceptability. If price evaluations or buying intentions are biased because of food price attitudes the results will probably signal the false level of acceptability. For this reason, food price attitudes should be measured as possible background variables. It is hoped that this thesis may help price researchers and marketing administrators to understand more about attitudinal perceptions towards food prices.
In this study, the role of food prices and the consumers’ attitudinal opinions towards them are investigated empirically using both qualitative and quantitative methods. Even though the qualitative approach is explorative in order to give a good description of the phenomena, the study is hypothetic-deductive by nature. In order to test the hypotheses and answer the

18
research question a reliable measurement to capture the essence of food price attitudes had to be created. The data collection and analyses were conducted as follows:
• First, the role of food prices was approached inductively with 40 in-depth interviews in 2001. With this preliminary study attitudinal dimensions of food price perceptions were explored. In addition, the Price Perception Scale introduced by Lichtenstein et al. (1993) was evaluated to fit the food context. The qualitative results were content analysed.
• Two sets of measurements (general price attitudes and food price attitudes) were created by exploratory factor analysis, and the scales were compared to each other (consumer survey data 2001, N = 1158) in order to investigate whether there was a need for the food-specific measure.
• The measurements of food price attitudes were further developed and the relationship between food price attitudes and the willingness to buy premium-priced food products was investigated (testing hypothesis 1) by logistic regression analysis (consumer survey data 2002, N = 1156).
• Differences between consumers based on the food price attitude dimensions were investigated by using cluster analysis with three large consumer survey samples 2002 (N = 1156), 2004a, (N = 1113) and 2004b (N = 1027). Equally, it was tested whether the Food Price Attitude Scale was able to discriminate between consumers based on the food price attitude dimensions and to give comparable results.
• The Food Price Attitude Scale was purified with confirmatory factor analysis (a subsample of 399 from consumer survey data 2004b, N = 1027), and the relationship between the food price attitude dimensions and price judgements was investigated (testing hypothesis 2) using structural equation modelling (a subsample of 400 from consumer survey data 2004b, N = 1027).
The structure of this thesis is based on these phases. The previous research related to attitude, food choice and price perceptions is summarized in chapter 2. In chapter 3 the results of the qualitative approach are reported and the theoretical framework of the study is outlined. The materials, samples and methods of analysis are presented in chapter 4. The development of the price attitude measurement is reported and the hypotheses were tested in chapter 5. Conclusions are discussed in chapter 6.

19
1.3 Definition of the concepts
Price
In this study, the concept of price is defined as an amount of money a buyer has to pay in order to get a commodity in a transaction with a vendor. The price can be set by a vendor based on costs or other pricing elements (see Kopalle et al. 2009 for a review of retail pricing). On some occasions, the price can be set by buyers as in the case of auctions. In this thesis, the concept of a price is not investigated from a vendor’s viewpoint. Rather, price is seen as an actual market price which buyers can perceive. The focus is placed on the consumers’ perceptions of prices and attitudinal opinions towards these perceptions, and, therefore, a price perse is not an issue here. This viewpoint is close to the psychological approach in which a price is seen and interpreted as a symbol. In the marketing literature a price is perceived as one of the extrinsic attributes connected to a commodity among many other attributes (e.g., package, ingredients, country of origin), and, therefore, it can be perceived as one piece of product information. Information can be interpreted subjectively, and, thus, the observed price always has subjective internal characteristics (Jacoby and Olson, 1977, 74).
Price perception
A price perception is defined here as the consumer’s subjective interpretation of the objective price (Jacoby and Olson 1977, 74). An objective price is the price a consumer observes in relation to the commodity usually in a numerical form. The objective price is then interpreted according to evaluative terms in the mind of the consumer, and, thus, a perceived price is “acognitiverepresentationoftheobjectiveprice” (what Jacoby and Olson (1977, 74) also call a psychological price). A person may interpret and label the objective price (e.g. 3.45 €) as a high price, an expensive price, a moderate price, a fair price, a just price, a low price, or a value 3.45 €. The dynamics of how consumers store, process, interpret, or recall price information is unclear, though, there are several theories to explain price perceptions: adaptation-level theory (Helson 1964), range theory (Volkmann 1951), range-frequency theory (Parducci 1965) to name only a few. According to the definition of price perception, a food price perception is defined here as a person’s subjective evaluation of the objective food price. A consumer’s judgment of an objective food price can also be referred as a psychological food price.
Reference price and reservation price
In contemporary price research, a reference price is generally accepted concept which affects the choice (see Kalyanaram and Winer 1995, and Monroe and Lee 1999 for literature

20
reviews). A reference price can be defined as: “theinternalstandard [price] againstwhichobserved prices are compared” (Kalyanaram and Winer 1995, G161; also Kumar et al. 1998, 403). A reference price can be divided into an internal and external reference price and these concepts may have a different influence on the consumers’ brand choice (Kumar et al. 1998). The internal reference price is widely investigated in behavioural pricing studies. In this study it is defined as a subjective cognitive reservation of prices stored in the memory, and thus, it is based on previous price experiences but does not necessarily correspond with any actual price in the market (Monroe 1990; Monroe and Lee 1999). Equally, consumers observe a great variety of prices in the choice situation, and thus an objective price may be compared to other observed prices. Therefore, any other observed price can be defined as an external reference price (Kumar et al. 1998). The concept of a reservation price has been defined as “aprice lowenough to result thepurchase” (Jacobson and Obermiller 1990, 421). Similarly, according to Nagle and Holden (1995, 100), a reservation price can be defined as the highest price a person is willing to pay in order to make a purchase.
Price knowledge, price consciousness
There are several concepts related to reference price and price judgments. However, clear definitions are seldom given in the research reports, and, consequently, some results can be confusing. The concepts of price knowledge (how well respondents know actual prices) and price awareness (respondents’ ability to remember prices) are well established (Monroe and Lee 1999, 211). On the other hand, these concepts have often been used as synonyms to each other (e.g., Aalto-Setälä and Raijas 2003) without considering the difference between knowing and remembering (see discussion by Monroe and Lee 1999, 214-215). Both the concepts of a price consciousness and price sensitivity refer to the same process of retrieval price knowledge from the memory. They also include a tendency to react to a price or to a price change. If a consumer is judged to be price conscious or sensitive to prices he or she is aware of prices and responses to change in price stimulus. The assumptions of price elasticity are usually embedded in these definitions, and overall it is argued that a price increase leads to a decrease in demand.
Attitude
In this thesis, the definition of an attitude is borrowed from the literature of contemporary psychology of attitudes. Attitude is defined here as “a psychological tendency that isexpressedbyevaluatingaparticularentitywithsomedegreeoffavourordisfavour”(Eagly and Chaiken 1993, 1). Olson and Fazio (2009, 20) emphasize the association in memory between an object and one’s evaluation of it. According to Haddock and Huskinson (2004, 36), an attitude is a multicomponent model including affective responses, cognitions and behavioural information. Attitudes are latent hypothetical characteristics which can only

21
be accessed indirectly, and consequently external observable cues are used to capture them (Ajzen 2005, 2). In contemporary attitude literature, theorists discuss whether attitudes should be measured explicitly or implicitly, and sometimes distinctions are made between explicit and implicit attitudes. An implicit measure is conducted indirectly and a respondent is unaware of the attitude in question. In the explicit measures respondents self-report their attitudes, and they can be fully aware of the interest of the investigators (Petty et al. 2009, 3-4). The most used explicit measures of attitudes are the Likert scale (Likert 1932), the Thurstone scale (Thurstone 1931), and the semantic differential scale (Osgood et al. 1965).
Price attitude
The concept of a price attitude is challenging. According to Jacoby and Olson (1977, 74), psychological price (subjective interpretation of the observed price) may “possess anevaluativeoraffectiveaspect”, and therefore it can be defined as a price attitude. The price attitude reflects how the respondent feels in the evaluative sense. For example, an observed price is 3.45 € and a person perceives it as a low price, being favourable towards it if he or she is evaluating the low price as a good thing. A person might be unfavourable towards that price if he or she thinks, for example, that a low price means low quality. Interestingly, concept of price attitude does not emerge from the price perception studies, and clear definition of price attitude was difficult to find.
Similar to the concept of the price attitude is the price mindedness attitude defined by Anttila (1990, 97): “permanent attitudes towards prices in general in an individual’smind”. In addition, Anttila’s (1990, 120) concept of the quality mindedness attitude was measured in her study. Both of these mindedness attitudes can also be found in Lichtenstein et al.’s (1993) price perception measure (PPS). In PPS price can be seen in a negative role (e.g., domains of price consciousness and sale proneness) and in a positive role (domains of price-quality schema and prestige sensitivity). Similar to quality mindedness attitude and domain of the price-quality schema is Steenkamp and van Trijp’s (1989, 12) definition of quality consciousness: “amentalpredispositiontorespondinaconsistentwaytoquality-relatedaspectswhichisorganizedthroughlearningandinfluencesbehaviour”. In this thesis, the concept of price attitude is based on these ideas.
In this thesis, the concept of price attitude is used to describe the consumers’ favourable or unfavourable opinions towards perceived expensive or cheap prices. It is defined as follows: price attitude is a person’s evaluation of perceived cheapness or expensiveness with some degree of favour or disfavour (modified from Eagly and Chaiken’s (1993, 1) definition of attitudes). It follows that the distinction between price perception and price attitude is made: a price perception means that a price is considered cheap or expensive, and a price attitude means that perceived cheapness or expensiveness is evaluated to be a ‘good’ or ‘bad’ thing. A price perception is a subjective evaluation of an objective price and may be expressed in

22
relative terms, whereas a price attitude is an affective evaluation of this perception. These attitudinal judgements are probably based on past experiences, feelings and cognitions. Accordingly, a food price attitude is defined in this thesis as a person’s evaluation of cheapness or expensiveness of food prices with some degree of favour or disfavour. Consumers may perceive food prices as low or high, but a food price attitude expresses whether the low or the high food price is favourably or unfavourably interpreted.

23
2 Food price in attitude and marketing research
Western countries, food choice is much more than just the recognition of hunger or thirst and the willingness to fulfil this need. A great deal of research executed by sensory scientists, food scientists, behavioural scientists, marketing scientists, and economists exists in order to grasp the dimensions of food choice behaviour, and, hence, be able to predict it. One problem, however, is the isolation in which each of these disciplines usually operates (Köster 2009, 71). In the food choice tradition, the properties of food products, as well as physiological, biological, sociological and environmental factors are investigated. The impacts of sensory perceptions and pleasurable ratings are noted. In that tradition, a price is considered one of the environmental factors affecting choice (Köster, 2009, 70). In the price-related marketing literature, food products are usually examples of low-involvement target products used in empirical experiments. In this tradition, a price is considered a product attribute affecting a brand choice along with many other attributes. In addition, patterns of consumer behaviour are important issues in marketing. Economists are also interested in food prices, but, they place less emphasis on individual food consumption or the role of price in subjective decision-making and emphasize more a group behaviour or price change effects (Steenkamp 1997, 165). According to many economic theories, prices are affected by changes in supply and demand, and thus price is taken as a result of the functions of the markets. In marketing, a price is a decision of the vendor based not only on the economic foundations, but also on psychological aspects of consumer decision making (Monroe 2003, 20-22).
Individual decision making and general choice behaviour can be approached by using two different theoretical foundations, both based on psychology: 1) research on judgement and decision making (JDM), and 2) research on attitudes and persuasion (A&P), even though the research in these fields is usually kept distinct from each other (Wegener et al. 2010, 5). Similarly, in the marketing literature, few results concerning attitudes are presented, whereas in the food choice literature, the concept of attitude is widely investigated. Food consumption and food choice include unconscious and habitual patterns of behaviour (Honkanen, et al. 2005; Hamlin 2010) and consumers may find it easier to express attitudes than direct behaviour, especially if they are executing difficult judgement tasks (Kahneman 2003, 710) in research experiments. Therefore, attitudes may be valid cues to predicting behaviour in complex choice situations (Steenkamp 1997, 151). In this thesis, investigations of the role of price in foods as well as the impact of food price attitudes on behavioural intentions cross the conventions between the marketing approach and food science tradition. Even though the concept of attitude fails to emerge from the price-related marketing literature, several attitudinal aspects can be indentified in price-related studies (Jacoby and Olson 1977).

24
2.1 Food Choice and price
Several models exist to clarify the complex phenomenon of food choice. In this thesis, a descriptive frame is outlined instead of presenting an extensive view of food choice literature. In 1957, one of the earliest models was introduced by Pilgrim (Pilgrim 1957, ref. Steenkamp 1997), and it included three factors affecting food choice: the physiological effects of the food, the perception of sensory attributes, and the environmental influence. Since then, food choice models have been developed further and have been modified to cover even more detailed factors. Three kinds of dimensions are usually distinguished (see Figure 1). Firstly, person-related factors are usually including psychological and biological aspects of humans, for example, a satiation, or an appetite. Secondly, properties of food are also considered, for example, the taste and a smell of the food products. Environmental factors include, for example, the marketing practices of vendors, the economic situation of a person, the economic situation of the markets, and the cultural boundaries of the society. (Steenkamp 1997, 144-145.) The descriptions of food choice behaviour and identified factors affecting choice can vary based on the research traditions. The more multidisciplinary approaches are included in food-choice models, the more complex the models introduced. An example of a complex model is presented by Köster (2009, 72), which connects several influential factors to food choice: experienced intrinsic product characteristics (e.g., appearance, taste, and texture), expected extrinsic product characteristics (e.g., health claims, package information), socio-cultural factors (e.g., cultural and economic situations, trust, norms, and attitudes), situational factors (e.g., time, physical surroundings, habituation), psychological factors (e.g., memory, learning, motivation, cognition, emotion), and biological factors (e.g., age, gender, physiology, genetic factors). The most demanding aspect of food choice models is to describe the dynamic nature of the food choice. An interaction occurs between the factors related to a product, a person, and an environment in each choice situation. Moreover, each of the choice tasks is a dynamic process of decision making.
In Steenkamp’s (1977, 144) model (see Figure 1), the consumers’ decision process begins with the recognition of a need. The need for food can be trigged by hunger, a mood, or other states of being. In addition, a need can be influenced by environmental factors such as advertising or cultural trends. Similarly, the perceived properties of a food product may generate the need for the search for another food product. Consumers search for information in order to fulfil a need because they are willing to change the actual situation. An information search may occur internally (recalling past experiences), or externally (e.g., reading package information). However, several factors probably impair the consumers’ external information search, such as time constraints. Consequently, available information on the possible solutions to satisfy the need is evaluated, and consumers have to make decisions on what grounds the overall judgement should be made. Perceptions of the quality can be based on direct observation, such as smelling or tasting the product. Evaluative perceptions can also be

25
constructed based on information gained externally, for example, package information or a brand name, thus some of the quality perceptions can be inferred from external information. In attitude formation, several perceptions of different criteria are integrated and evaluated in terms of preferences. The importance of the evaluated criteria during the time of the decision process can affect overall attitudes towards alternatives. (Attitudes are discussed at greater length in chapter 2.3.) It would be tempting to believe that the most positively evaluated product will be chosen. However, the most preferred product may not be available or a person might be unable to afford it even if the price is acceptable. The economic aspect of price is an important environmental factor affecting consumers’ decision process along with cultural and marketing functions. (Steenkamp 1997, 144-178.)
Person-related factors
Biological
Psychological
Socio-demographic
Properties of the food
Physiological effects
Sensory perceptions
Decision process
Need recognition
Search for information
Evaluation of alternatives (Criteria, attributes, values,
attitudes)
Food choice
Environmental factors
Economic
Cultural
Marketing
Figure 1. Construct model of food choice behaviour (Steenkamp 1997, 144).
Several consumer studies document the important role of food prices in food choice. Steenkamp (1997, 147) showed that in 1992 a product quality was the most important evaluative criteria among consumers of six European countries and price was second. Brunsø and Grunert (1998) found that price was the important criteria in food shopping situations in France, German, Great Britain and Denmark. However, the importance of price is relative to other product attributes, especially the quality attributes of products. In foods, taste is one of the most important dimensions. Steptoe et al. (1995) developed a Food Choice Questionnaire (FCQ) in order to investigate important factors in food choice. The discovered factors were sensory appeal, health, price, convenience, natural content, weight control, mood, familiarity, and ethical concern. Importance of a price was measured in terms

26
of one dimensional component, namely the importance of low price. They found out that the sensory appeal of food was the most important factor in the United Kingdom, and that low price was second in importance. The importance of low price varied according to gender and income in their study. Eartmans et al. (2006) cross-validated the FCQ and investigated the importance of food choice factors in Italy, Belgium and Canada. In Belgium, low price was the second most important factor, whereas in Italy and in Canada it was in fourth place. Sensory appeal was more important factor than low price in all of these three countries. Similarly, in Finland the importance of low price measured by the FCQ was in third place, sensory appeal being the most important factor and healthiness second (Pohjanheimo et al. 2010).
The importance of the price can vary based on the operationalization (how questions are posed) and this can cause difficulties in comparing results. Results may differ if the importance of price is asked in connection with the likelihood of buying, using or consuming the food (Jaeger 2006, 132). Moreover, reports can vary in relation to the product type used in the study (Steenkamp 1997, 146-148). Even within the same product category differences can emerge (Steenkamp and van Trijp 1989). For example, in Ireland, price was one of the most important determinants in consuming poultry but it was less important with regard to pork (MacCarthy et al. 2004). According to Webber et al. (2010) consumers may evaluate the role of price in terms of the importance of the food product, which is relative, because it is compared to the importance of other foods included in the family budget.
Because taste is probably the most important factor in food choice, the role of price in food choice or in quality judgements may vary if the product is tasted or not in the research situation. In Lange et al.’s (2000) experimental study choices made about orange juice without tasting were more rapid and were less affected by liking scores than choices made with tasting. Additionally, responses can change in different conditions. For example, in Dransfield et al.’s (1998) study two-thirds of subjects preferred the lower-priced sirloin steaks without tasting, yet, after tasting, subjects chose the more tender steaks even at the higher price. In the food-choice situation, consumers need to evaluate or infer the quality of the food in order to make a judgement decision. Tasting enhances the importance of sensory attributes and also strongly affects responses. In an experiment by Bower et al. (2003) tasting of various spreads significantly affected buying intentions. Even if affective ratings such as self-reported liking or pleasantness are evaluated without tasting, the expected likes and dislikes have an impact on self-reported buying intentions (Tuorila et al. 2008). In real shopping situations, tasting is often impossible before purchase, and in most cases consumers have to make food choices and quality inferences without tasting.
Consumers use a variety of cues in evaluating food product quality other than tasting, and price is one extrinsic cue consideration as further discussed in chapter 2.2.1 (see also Grunert 2002, 276-277, for issues in the formation of quality expectations). The importance of price

27
is relative to the importance of other products attributes in the evaluating process and thus it may be the reason for different results in research reports. In some experiments, price has an important effect on food choice with, for example, vegetables and fruits (see van der Pol and Ryan 1996). Increased price is usually assumed to decrease buying or use intentions as discovered in the case of chocolate bars (DiMonaco et al. 2004). Whereas, in some choice-based experiments (e.g., Enneking et al.’s 2007 study of soft drinks) no effect is found (see also Pieniak et al.’s 2009 study of traditional foods in six European countries). According to Chocarro et al. (2009), familiarity and expertise have an important moderating effect on food choice in respect to price. They also concluded that price always has some importance at all levels of product knowledge with other product attributes.
The importance of low price has been related to several socio-demographical characteristics. Females tend to react more to food prices than men, but, price seems to be important to both (e.g., Solheim and Lawless 1996). Steptoe et al. (1995) found that women regard low price in foods as more important than men. Guinard and Marty (1997) observed males’ unwillingness to pay more for low-fat products, whereas females were willing to pay more for low-fat milk, mayonnaise and pastry (similarly Helgesen et al. 1998 in the choice of lamb sausages). Income level probably has an impact on price importance suggesting that the importance of low prices increases if the income level decreases (Steptoe et al. 1995), and, the willingness to pay higher prices increases if the income level increases (Steenkamp and van Trijp 1989).
In many food-choice studies it is assumed that a low price is perceived favourably and a high price unfavourably in the minds of consumers. High price has been found to be a barrier to eating more fish (Verbeke and Vackier 2005), and meat (McEachern and Schröder 2001), or it is assumed to be one of the reasons why fruits and vegetables are not consumed (Drewnowski et al., 2004; Andrieu et al. 2006; Bowman 2006; Cassady et al. 2007). However, according to Ard et al. (2007, 370), there are fruits and vegetables available with high and low prices, and only the high priced items decreased the predicted consumption of fruits and vegetables in American families. In addition, special health products are perceived as expensive (Blaylock et al. 1999; Ollila et al. 2004) and high prices have been found to be one of the reasons why food products with proven health benefits are not purchased (Bower et al. 2003, Ollila et al. 2004). However, a health claim in functional food products is one of the credence characteristics because it is difficult to ascertain (Grunert 2002, 280) and thus an expensive price might be favourably interpreted if it is related to the value of the credence quality. However, a high price in functional food products failed to improve the experience of the healthiness among the consumers in Finland, Denmark and the USA (Bech-Larsen and Grunert 2003). Moreover, only 15% of European consumers think that eating a healthy diet is related to price, but there are great differences between subgroups in the EU population (Kearny and McElhone 1999, S135). The negative effect of high price

28
can be reduced if the high price is combined to a high degree of liking (Bower et al. 2003), or other justifications for the high price, such as perceived high quality (Steenkamp and van Trijp 1989) or some value-adding features (Grunert et al. 2009).
Choice of the functional food products
Functional foods, which are the target products in this study, constitute a relatively new food product category. Functional foods have higher prices than similar food products without health claims. According to a price comparison survey made by Consumer Agency in Finland (2004), the prices of functional food products were 20% to even 500% higher than corresponding products without health claims. The official definition of functional foods is lacking in many countries, including Finland. Functional food products include (or are lacking in) ingredients which modify the products to enhance health or to reduce the risk of disease besides the normal nutritional function (Saba et al. 2010, 385; see Robensfroid 2002 for a review of definitions). Some functional food products are marketed to prevent nutrition-related diseases while others are promoted by a health image to enhance general well-being. Consumers may be more willing to accept products promoting general health than products with serious claims to prevent to disease (Siró et al. 2008, 462). The lack of an official definition together with a great variety of health-related messages may be reasons why these products are not easily perceived as one homogenous food category. Consumers perceive functional food products as special health products within the corresponding food category (e.g., a margarine lowering cholesterol is a special health product within the category of margarines) and compare these products to similar kinds of products without health claims (Urala and Lähteenmäki 2003; Korzen-Bohr and O’Doherty Jensen 2006; Niva 2007).
Finnish consumers might have some concerns about the safety and trustworthiness of functional food products (Niva 2007, 390-391). According to Ollila et al. (2004, 47), a high price is one of the reasons why Finnish consumers may be unwilling to buy certain products regularly. In 2001, about half of Finnish consumers (58%) considered the prices of functional foods to be expensive and 20% extremely expensive (Ollila et al. 2004, 40). In addition, some consumers were afraid that total food expenses would increase too much if functional food products were bought regularly. Along with price, the lack of need (no perceived risk of disease), lack of interest, and the lack of knowledge about the products were reasons for an unwillingness to buy functional food products (Ollila et al. 2004, 45-47; similarly reported by Niva 2006, 21 in Finland; Korzen-Bohr and O’Doherty Jensen 2006, among British and Danish women). If consumers choose among functional food products, price probably has a similar effect on choice than if consumers choose among food products without health claims (see e.g., Ares et al.’s 2010 study of the impact of price and brand name with functional yogurts). In the laddering study by Urala and Lähteenmäki (2003) price was an important dimension behind investigated functional food choices apart from

29
sweets. Price-related reasons behind choices were connected to consumers’ concern to keep their finances in balance, to quality of the products and value of the choice, and to familiarity in order to avoid the disappointment (knowing what one gets for one’s money).
2.2 Price judgements
Food purchase is a typical choice task with several attributes to be evaluated in order to choose one product over a variety of others. A price can be seen as an extrinsic cue to be evaluated along with many other attributes. Thus, a price is one piece of product information compared to other information when the value of a product is evaluated. In evaluating different food products, consumers judge price information comparing internal or external reference prices and other available information in order to evaluate the value of the choice (Monroe 2003, 103). Choices are most often made according to preferences, and preferences involve value judgements (Kahneman 2003; Weber and Johnson 2009). The concept of rational choice behaviour is a core assumption of neoclassical economic theories; however, over the last few decades the growing interest in individual differences has begun to focus on psychological and behavioural processes even in the field of economics (Katona 1977). Yang and Lester (2008, 1218), for example, have argued that “rationalityineconomicdecision-makingmaybetheexceptionratherthanthenorm”. The criticism against the traditional theory of rationality concerns the unavailability of perfect information about prices and quality. Moreover, consumers may lack the capability to process price information or even their own preferences (Monroe 2003, 104). However, in different disciplines there are different definitions of rationality, irrationality, and many other concepts, and therefore new behavioural findings do not easily contribute to existing economic theories.
Neoclassical economic theories of pricing and consumer behaviour are seen as important foundations, although these theories are not in focus in this thesis, and are thus not explained more deeply (see Monroe 2003, 26-54). Instead, the focus has been placed on psychological approaches to consumer behaviour. In marketing, most behavioural foundations are based on psychology. Behavioural economics is a promising field of science, but it does not represent a unified theory. Rather, it is a collection of many new ideas and tools to understand individual decision-making (Yang and Lester 2008, 1230). However, Thaler (2008) argues that, in the field of marketing, behavioural economics is mostly rejected because is not carried out according to psychological conventions. Nevertheless, a lot of research related to price exists in the fields of marketing and behavioural economics, which are both based on psychological theories. According to Zeithaml (1988, 2), marketing research reports contain inconsistencies in definitions and in operationalizations of concepts related to price, quality and value, which make it difficult to compare the results. Possibly, such inconsistencies

30
are due to different theoretical foundations on which previous studies are based, and these foundations are expressed unclearly in the reported results.
Judgement and decision-making (JDM) research began in the 1950s and focused on economics and statistics. The contemporary line of JDM research is based on cognitive psychology and deals with preferences, beliefs and decisions when uncertain (Weber and Johnson 2009). It lies behind prospect theory (Kahneman and Tversky 1979) and many others such as decision field theory, and query theory related to information processing and memory (Weber and Johnson 2009, 61-63). A major contribution to consumer choice research has been made by information processing theory (by Bettman 1979; ref. Holbrook and Hirschman 1982, 132). The economics of information theory is related to consumers’ ability to know, search for, process and use price information, and price perceptions are also related to consumers’ ability to learn from experience (for a theoretical review, see Monroe 2003, 55-76). Although a great deal of consumer behaviour can be explained by the information process approach, it ignores the experiential aspects of consumption as the emotions, hedonic sensory experiences, or symbolic meanings of products, all of which are included within the experiential perspective (Holbrook and Hirchman 1982, 137-139).
Price perception research in marketing is strongly influenced by psychophysics (Monroe 2003, 108-109). This theoretical foundation originated from quantitative relationships between physical information and psychological responses (e.g., Weber’s Law concerning the perception of changes or differences in a stimulus, or the Weber-Fechner Law representing a function of the response to a stimulus) (see Monroe and Lee 1999; Monroe 2003 for this theoretical foundation). The research investigating how consumers react to price changes, how prices are remembered, how price information is processed, or how price differences are notified, is based on psychophysical assumptions. However, Kamen and Toman (1970 and 1971) contradicted Weber’s Law in the price context. They argued that consumers have a preconceived idea of what is a reasonable (or fair) price and they are willing to pay that price or less. The critical comments were related to just-noticeable differences. A price is a fundamentally different type of stimulus to those used in psychophysical experiments, and thus even marginal differences in terms of money are perceivable (Stapel 1972; Lambert 1978; Janiszewski and Lichtenstein 1999). Therefore, differential thresholds in perception of prices would have a weak theoretical foundation. However, in the field of markets, consumers are surrounded by many attributes to be noticed, thus small price differences may be ignored (Lambert 1978) and the theoretical foundation of Weber’s basic law has been widely supported also in price context.
The buyer’s subjective perception of prices has been in focus ever since the post-Second World War period, when the number of brands increased rapidly. Consumers have been observed to behave inconsistently, selecting brands with higher price instead of low-priced brands, and perceiving price information differently and deficiently. Previous research related

31
to consumers’ subjective judgements or perceptions of price information is plentiful, and, it has been reviewed in several publications: see Monroe (2003) for the theoretical foundations of pricing, Monroe (1973) for a literature review of empirical research from 1940 to 1970; Jacoby and Olson (1977) for price research with an information-processing approach; Zeithaml (1988) for discussion of the relationships between perceived price, quality and value; and Monroe and Lee (1999) for reviewed findings from early behavioural research in economics to behavioural price research in the post-1970s, emphasizing the processing of price information. However, despite the large number of investigations, researchers are still looking for answers how observed prices affect consumers’ choices, and, further, purchase behaviour.
2.2.1 The price-quality relationship
Consumers perceive various quality dimensions during the consumption of foods. However, if a food product is new or tasting is impossible, the quality of the food must be inferred somehow before a purchase. Before a purchase and consumption consumers create quality expectations, and after consumption they have quality experience (Grunert 2002, 275). Perceived price information is one of the components which affects quality expectations. The relationship between price and quality has been of interest in marketing, because understanding consumers’ value perceptions is a key function of pricing. However, researchers have published contradictory results related to price-quality inferences. One reason for heterogeneous findings might be related to insufficient definitions of the concept of quality, incomparable methodological solutions, and, further, inadequate explanations how quality is perceived by consumers (see Zeithaml 1988 for a discussion of perceived quality and a literature review of the price-quality relationship).
In economic theories, a price is seen as a function of monetary sacrifice and a rational consumer chooses a brand with the lowest price and the greatest satisfaction (Monroe 2003, 104). However, since the 1950s marketing researchers were able to show that consumers associated a price with more than one meaning. Leavitt (1969) discovered in an experimental study that higher price can sometimes increase the readiness to buy, rather than decrease it (also Lambert 1972). Applied to foods, McConnel (1968) demonstrated that quality differences were experienced among three brands of beer according to price information, even though no quality differences existed. The relationship between food price and quality was found to be positive and linear. Price was also the only cue to be taken account of except for brand names. However, Peterson (1970) added several variables (name, firm, available flavours, number of servings per can, and price) to the experiment when investigating price-quality relationships with a soft-drink concentrate. He discovered that subjects interpreted quality differently, and that the price-quality relationship was nonlinear. The logarithmic

32
nature of price responses was suggested in studies by Stoetzel (1969), Adam (1969), Gabor and Granger (1969), and Fouilhé (1969). All these early findings support the assumption that consumers perceive price and quality information in individual ways, and, thus different perceptions generate different kinds of behaviour. Indeed, related to demand functions and consumers’ reactions towards price change, researchers have introduced several different models to predict demand. High price is likely to increase the demand if high quality is related to a high price, otherwise high prices will decrease the demand. Ding et al. (2010, 77-78) discovered several different empirically tested utility functions related to quality (high price increases utility if related to high quality and decreases it if related to monetary loss) in different food categories: 1) a curvilinear inverted U-shape function, 2) a linear upward slope function, 3) a curvilinear inverted N-shape function, and 4) a curvilinear M-shape function. However, a linear downward slope function (traditional utility function) was unsupported in an empirical experiment concerning food categories with low unit prices.
Price, when it is the only cue available, is generally accepted to have a direct relationship with quality (Jacoby et al. 1971; Monroe 1973; Woodside 1974). However, adding more variables to research designs, a direct relationship has been hard to prove because all attributes are relative. In a study by Jacoby et al. (1971), a brand image had a stronger effect on quality perceptions than the price in the case of beers (see Monroe 1973 for other studies). In Guinard et al.’s (2001) experiment with beers, information on brand and price even affected liking preferences (sensory quality) especially for consumers in their twenties. Further, price and liking preferences probably affect purchase intentions, and the use of other product attributes as quality cues is mediated through liking (Mueller and Szolnoki 2010). Results can be heterogeneous in terms of sensory properties. In the field of food sciences, tasting is often included in experiments and subjects can experience the actual quality, whereas, in the field of marketing or economics, sensory characteristics are excluded and subjects can only evaluate the expected quality.
Consumers might infer expected quality based on quite unexpected extrinsic cues, such as colours, smell, or thickness in relation to quality dimensions which are not affected by these properties (Grunert 2002, 277). Price is an important extrinsic cue in expected quality, and, further, it affects choice. In a household survey by Bello Acebrón and Calvo Dopico (2000), consumers used price information as an expected quality cue of beef and higher quality was inferred from higher price. Additionally, expected quality affected experienced quality, but sensory characteristics were essential predictors of future choice (see also McEachern and Schröder 2001, meat choice in Scotland). In Figure 2, the model of food quality perceptions related to beef is presented as one descriptive example of the possible process of consumers’ quality perceptions in foods (see also Grunert 2002, 276, for The Total Food Quality Model).

33
Figure 2. Perception of quality for beef (Wierenga 1982, ref. and modified by Bello Acebrón and Calvo Dopico 2000, 233).
Besides the experienced quality, some of the food products might have credence characteristics which have probably not been experienced, for example, consumers are unable to confirm the health claim of a functional food product, or the healthiness of an organically produced food item. Consumers’ willingness to rely on information introduced by manufacturers is a key issue in the acceptability of credence quality attributes. The credibility and reliability of the product communication is also related to the consumers’ knowledge and ability to process information (Grunert 2002, 280-282). According to Vlaev et al. (2009), consumers’ price-quality inferences can be affected by external plausible reasons, and thus communicating reliable reasons behind the pricing decisions is important. If the communication is perceived to be unreliable, it might affect price judgements, generating feelings of unfairness or other emotional responses just because credence attributes are hard to ascertain at the cognitive level. According to Luce et al. (2000), negative emotions are created by perceiving unfavourable quality attributes, and, thus consumers tend to reduce the unpleasant feeling by maximizing the quality instead of minimizing the price and keeping the unfavourable quality attributes.
Consumers use price information in individual ways and buyers are affected by the price to different degrees (Grunert 2002, 278). Fouilhè (1969) emphasized that price-quality inferences were affected by differences in consumers’ familiarity with the target products (also Woodside 1974; Rao & Monroe 1988; or consumer’s experience by Lambert 1972). According to Chocarro et al. (2009) familiarity and consumers’ knowledge including experience and expertise in foods have an important moderating effect on food choice, and on the use of extrinsic cues such as brand, origin and price to judge the quality. They failed
Perceived quality attributes
Sensory impression
Experienced quality
Extrinsic cues: Brand, price, place of origin
Presentation (layout), advertising, packaging
Perceived extrinsic quality
cues
Perceived intrinsic quality
cues
Visual impression
Expected qualityProducts’
physiochemical characteristics (pH values, intramuscular fat, blood, water binding)
Intrinsic cues: Colour, visible fat, cut

34
to prove that consumers with a lack of expertise or familiarity would use price information as a quality cue more than consumers with expertise, as has been reported in other studies. Locksin et al. (2006) discovered that subjects with low involvement with wine used price information more in choice situations than subjects more interested in wine (confirmed by Hollebeek et al. 2007). In the case of wine, expertise seemed to reduce the number of cues used in evaluating the product quality (Mueller and Szolnoki 2010). Pettit et al. (1985) found out that frugality (the willingness to spare money) had an effect on price-quality relationships. Non-frugal consumers were more likely to consider low-priced brands as low quality in the case of ice-creams than frugal subjects. Tull et al. (1969) suggested that consumers rely on price when uncertain about quality. Consumers may have difficulties in judging quality or have limited information about the product quality (low quality knowledge) (see also Lambert 1972, with non-durables). Zeithaml (1988, 12-13) assumed that different levels of price awareness may cause individual differences in price-quality inferences. However, in the case of running shoes, price knowledge (how well consumers know, remember, or are aware of prices) had no effect on price-quality inferences (Lichtenstein et al. 1988).
There are quality and price differences between product categories and within product categories, and thus the tendency to use price as a quality cue may vary (Zeithaml 1988). Cooper (1969) emphasized that consumers might have a subjective value for money, and introduced “the begrudging index” meaning ease or lack of ease with spending. Money spent on bread is evaluated differently than money spent on meat. Consumers seem to have preconceptions that quality differences exist more in some product categories than in others, and, therefore, price-quality inferences are made differently and differences in results may exist (Leavitt 1969; Lambert 1972). Riez (1979) reported nearly zero correlations between price and quality with packaged food products, correlations being lowest for convenience foods. Based on an analysis of 679 brands of packaged food products, more than 43 per cent of all frozen food product classes showed a negative relationship between price and quality. In the case of cars, however, price had a strong influence on quality beliefs, and, further, high quality beliefs affected high price perceptions even in a multi-attribute experiment (Erickson and Johansson 1985). Lichtenstein and Burton (1989) argued that with durables consumers lack knowledge and make infrequent purchases, and, therefore, they rely more on price information in order to infer quality. Usually durables cost more than non-durables, and therefore the level of price may function as a moderator.
Emery (1969, 100-104) proposed the conceptual frame of how a person might process the objective price and quality information in order to evaluate the price-quality relationships. He suggested that consumers are mapping both objective price and objective quality into subjective categories. This mapping is probably done spontaneously when recognizing the product. The subjective evaluation of price-quality relationship occurs when subjectively categorized price and quality perceptions are verified against each other (Figure 3).

35
Figure 3. The subjective mapping of price and quality dimensions by Emery (1969, 104).
Consumers may perceive product as overpriced (negative slope) or underpriced (positive slope) if the subjective perceptions are not matched. He also suggested that consumers seemed to have a normal or standard price to each noticeable level of quality. Accordingly, consumers probably have a range of tolerance at the acceptable price level and quality perceptions may vary (Emery 1969, 100).
Differences exist whether quality is inferred from price information or price is inferred from quality information. These processes cannot be reversed symmetrically (Emery 1969; Huber and McCann 1982). If quality is better known than price (as can be the case in flea markets), it is quite easy to believe that you have to pay for high quality. However, if price is known, quality is not similarly inferred from price. There are other factors which affect the product evaluation because the perception of overall quality has so many dimensions. Likewise, the assumptions of “high price equals high quality” and “low price equals low quality” are not perceived in similar ways by consumers (Emery 1969, 105). Subjects in the ice cream study believed that a low price is an indicator of low quality, but they did not believe that a high price is an indicator of superior quality (Huber and McCann 1982).
Objective price
Subjective price
categories
extravagant
Subjective quality
categories
(matching)
dear
good
dirt cheap
superlative
Objective product quality
(mapping) (mapping)
cheap passable
poor
reasonable
the standard
superior
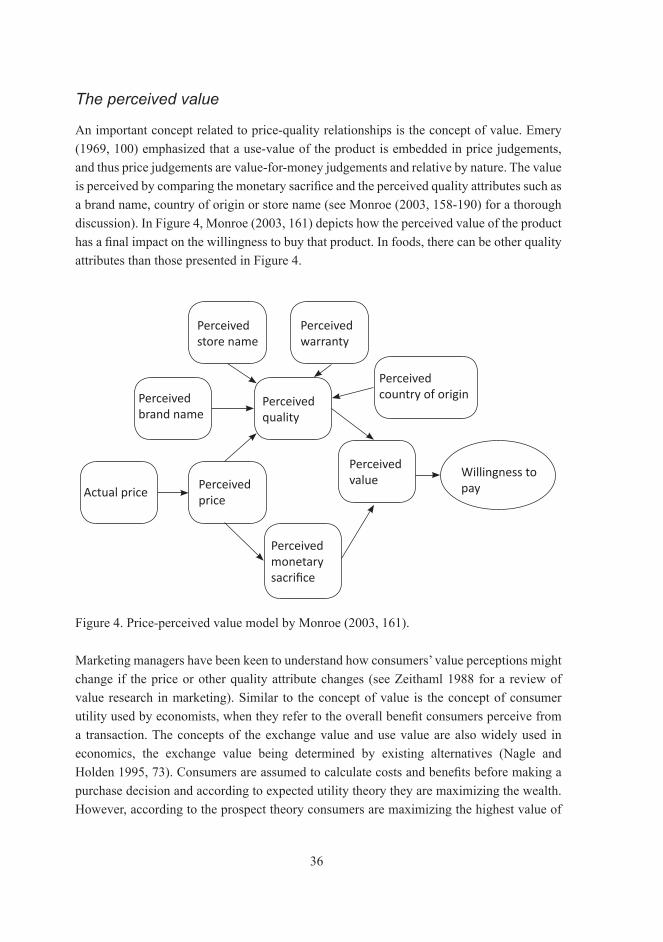
36
The perceived value
An important concept related to price-quality relationships is the concept of value. Emery (1969, 100) emphasized that a use-value of the product is embedded in price judgements, and thus price judgements are value-for-money judgements and relative by nature. The value is perceived by comparing the monetary sacrifice and the perceived quality attributes such as a brand name, country of origin or store name (see Monroe (2003, 158-190) for a thorough discussion). In Figure 4, Monroe (2003, 161) depicts how the perceived value of the product has a final impact on the willingness to buy that product. In foods, there can be other quality attributes than those presented in Figure 4.
Figure 4. Price-perceived value model by Monroe (2003, 161).
Marketing managers have been keen to understand how consumers’ value perceptions might change if the price or other quality attribute changes (see Zeithaml 1988 for a review of value research in marketing). Similar to the concept of value is the concept of consumer utility used by economists, when they refer to the overall benefit consumers perceive from a transaction. The concepts of the exchange value and use value are also widely used in economics, the exchange value being determined by existing alternatives (Nagle and Holden 1995, 73). Consumers are assumed to calculate costs and benefits before making a purchase decision and according to expected utility theory they are maximizing the wealth. However, according to the prospect theory consumers are maximizing the highest value of
Willingness to pay
Perceived brand name
Perceived store name
Perceived warranty
Perceived country of originPerceived
quality
Perceived value
Perceived monetary sacrifice
Perceived price
Actual price

37
each possible prospect of choice. (Kahneman and Tversky 1979.) The prospect theory is discussed in more detail in chapter 2.2.3.
Based on the prospect theory, Thaler (1985) described the transaction utility theory by distinguishing two kinds of utilities: an acquisition utility (the value of a commodity received or value for money), and a transaction utility (the value of the deal). Total utility is the sum of acquisition utility and transaction utility. Transaction utility is the difference between the reference or expected price and the price actually paid. Acquisition utility is the net value resulting from getting a commodity and paying the price. Similarly, Monroe (2002, 176-179) described the acquisition value as a trade-off between perceived quality and the price, whereas the transaction value is the perceived benefit in accepting an offer. Urbany and Bearden (1997) suggested that the acquisition utility dominates the explanation of choice, and the transaction utility is a less important factor in predicting the choice if quality is uncertain. Consumers may have a tendency to evaluate the value of a commodity first, and, the value of a deal (the money to be sacrificed) comes second if quality is guaranteed. If the quality is uncertain, the price will be evaluated first and perhaps quality evaluations are inferred from the price. Similarly, according to Tellis and Gaeth (1990), information on quality increases the rational choice of the best value. If the quality was uncertain but important, the highest price would be accepted in order to maximize the quality. If the quality was unimportant, the lowest price would be chosen in order to minimize the costs.
Despite the fact that the concept of value is highly important in price-related studies; in this thesis, the theorization of a value is limited. Because of the multidimensional meaning of the value to each consumer and the difficulties to operationalize the high abstraction levels related to value perceptions (Zeithaml 1988, 17), the value is not the key concept of this study. According to Zeithaml (1988, 14-15), perceived value is a higher level concept than the perceived quality because it requires higher level of abstraction and non-monetary sacrifices are also included. Perceived value can vary in different contexts, and at different times according to the meaning of the product or the end-users’ needs (Zeithaml 1988, 15). Consumers are also forced to take into account the budget constraints in making their value judgements (Zeithaml 1988, 16). Higher-level abstraction can mean that a perceived value is influenced by some overall experience other than integrated perceptions of prices and product quality attributes. According to Kerin et al. (1992), a general shopping experience was a more important indicator of perceived value than perceived prices or the experienced quality features. Furthermore, research concerning the value perceptions and how value is related to price is still somewhat unclear. The role of emotions, for example, will possibly affect value perceptions. Weber et al. (2007) found neurophysiologic support for the assumption that in terms of monetary loss the relationships between an experienced product value and an experienced monetary sacrifice are separate functions. They demonstrated that evaluations concerning the product to be possessed and the money to be sacrificed are

38
processed differently in the brains. In the selling situation, subjects had negative emotions about losing a commodity (the affective relationship of possessing goods or evaluations the worth of goods) but not about losing money (buying the goods). Different parts of the brain were activated. Higher satisfactions were also experienced in possessing the goods if high prices were presented as a reference price. This suggests that with a high price consumers probably experience a greater value in having the product than selling it, even if selling the product at a high price would generate a sense that the deal was of good value. This is probably true with durables, but with food, the investigated knowledge is lacking whether consumers would experience greater value by possessing an expensive food product (e.g., a bottle of exclusive champagne) rather than consuming it.
If economists like to assume that consumers will buy the products at the lowest price, it is perhaps natural for marketing practitioners to assume that consumers would prefer to buy high quality products. However, Ölander (1969, 65) makes the point assuming that “lowpricecanmakeevenbadqualityattractive”. The price affecting attractiveness of a product (the price-quality relationship) should be distinguished from the attractiveness of the purchase offer (price as a sacrifice). Real purchase decisions balance between these different attractiveness functions. Quality refinements or high-quality strategies are beneficial only if consumers are willing to pay for better quality, and it seems that not all consumers have similar quality beliefs (Steenkamp and van Trijp 1989). Consumer differences in relation to quality and price perceptions are discussed in more detail in chapter 2.2.5.
2.2.2 The cheap-expensive relationship and the reference price
Perceptions of cheapness or expensiveness are relative price evaluations following the inevitable question: “Compared to what?” Monetary- and use-value judgements are also embedded in these evaluations (Emery 1969; Zeithaml 1988; Kahneman 2003; Weber and Johnson 2009). Cheap-expensive evaluations are related to quality and value judgements partly or at least indirectly, as has been previously discussed. According to Scitovsky, in 1945, consumers have two prices for observed products: an actual price and a fair price expressing the products’ worth, and further, consumers evaluate cheapness to mean inferior quality and expensiveness to mean superior quality (ref. Monroe 2003, 128-129). From the 1940s price perception studies have been developed to capture subjective price perceptions.
Consumers’ reactions towards price information have been approached by price limits beyond which a purchase of the target product was not acceptable (e.g. pioneers Stoetzel 1969; Adam 1969; Gabor and Granger 1969b; Fouilhé 1969). The lower limits were bounded to unacceptable quality (too cheap, poor quality). The upper limits were bounded to maximum tolerance of monetary sacrifice or perceived value (too expensive, not worth it). Also, it was assumed that consumers have a norm price (standard price, fair price, just

39
price) against which the observed price is compared (Emery 1969; Kamen and Toman 1970; Jacoby and Olson 1977). Points of tolerance are found among the range of prices: “not too cheap” and “not too expensive” implying an acceptable price range. Somewhere within the acceptable price range is a turning point of which evaluations such as neutral or fair (similar to the standard), or cheap (lower than the standard), or expensive (higher than the standard) are reflected. This turning point can be defined as a reference price.
Reference price
The concept of reference price is generally accepted and well-defined in marketing literature (Kalyanaram and Winer 1995), and it has it theoretical foundation in Helson’s (1964) adaptation level theory (see Monroe 2003, 130-133 for a description). According to the adaptation level theory a new stimulus is evaluated and compared against past and present experiences. Subjects have a continuum of different prices encountered in the past (a reference scale). These previous experiences determine the reference point against which judgements are made. Accordingly, the centre of the price range is important (the subjective average), and it changes with time as new stimuli are added to previous experiences. An anchoring effect means that a new price stimulus affects the adaptation level price, moving it to the direction of that stimulus (Monroe 2002, 131). According to Sherif’s (1963) assimilation-contrast theory only plausible prices will be added to the adaptation level price range (latitude of acceptance), while implausible prices are rejected. An assimilation effect occurs if a reference scale moves towards a new stimulus and a contrast effect occurs if a reference scale moves away from a new stimulus. Other theoretical assumptions have been emerged such as range theory (Volkmann 1951; Janizewski and Lichtenstein 1999) and range-frequency theory (Parduzzi 1965; Niedrich et al. 2001). According to range theory end-points determine the reference price instead of the centre of the price range (the average). Consumers anchor subjective scales according to minimum and maximum contextual values (Janizewski and Lichtenstein 1999, 354-355). The range-frequency model supports the idea that extreme values determine the judgement scale, moreover, a “frequency principal” suggests that the reference price is “weighted” according to the location (or rank, or frequency) of the observed price within this scale and the subjective price judgement is mentally affected by the range and the frequency (Niedrich et al. 2009). Because all these theories define a reference price differently, Niedrich et al. (2001) tested them against empirical data in several experiments. The range-frequency model explained the effects of price distribution more accurately than other models in the case of airline tickets. Furthermore, Niedrich et al. (2009) investigated the range-frequency theory applied to grocery shopping and found both a range effect and a frequency effect on reference price formation. Yet, in real life situations consumers may not be aware, how the reference price is conceived in their minds. However, these theoretical discussions are important if mathematical models are developed to predict the behaviour.
40
An internal reference price means “the standard price against which a consumerevaluates the actual price of the product” (Kumar et al. 1998, 403). It is located in the mind of a consumer and can be related to previous prices paid, quality judgements, or other preconceptions, such as the expected future price (Jacobson and Obermiller 1990). The concept of external reference price reflects the prices perceived in the environment. It may be the price of another product, the price variety within the product category, or the price seen at promotion brochure. The impact of external reference price has been of interest to marketing managers because consumers can be affected by price levels within the store, or the other prices consumers are exposed to (see Alford and Engelland 2000 for advertised prices). According to Kumar et al. (1998), an external reference price had a stronger impact on brand choice than an internal reference price. Yadav and Seiders (1998) reported that both inexperienced and experienced shoppers relied more on price claims presented (an external price information) in the study than prior price beliefs (an internal reference price). In the shopping situation, external reference prices affect consumer price expectations (Kopalle and Lindsey-Mullikin 2003). Consumers probably use both internal (memorizing) and external (looking around) reference prices when shopping, yet consumers’ price knowledge has been found to have only a week effect if any on internal reference price propensity (Yin and Paswan 2007, 275-276). Consumers probably use different strategies in order to make price judgements. According to Moon and Voss (2009), consumers were segmented based on the reference price strategy they used and differences in behaviour were found between “internal reference price shoppers”, “external reference price shoppers” and “price range shoppers”. Price range shoppers were less loyal than others, and they reacted more strongly to promotions than others in the toilet tissue category.
Price perceptions or price judgements have a long history of research within the theory of information processing (which include three memory systems: sensory memory, short term memory, and long term memory) and learning (Jacoby and Olson 1977, 74-76), hence consumers’ ability to remember prices (price awareness) has been focused on (see Monroe and Lee 1999 for a literature review). However, consumers seem to have little knowledge of previous prices paid and they use deficiently previous price information (e.g., Gabor & Granger 1969a; Dickson and Sawyer 1990; McGoldrick et al. 1999; Roza-Diaz 2004). In Rosa-Diaz’s (2004, 412-413) study, 78.3% of respondents were able to name the price (any price, even an incorrect one) for the product just bought. However, only 25.5% of these judgements were correct. Similarly, 73.1% of the subjects were able to rank three products in price order (in any order), and 46% ranked all three products correctly implying that consumers may be more accurate in relative than in absolute judgements. According to Ofir et al. (2008), consumers tend to store relative evaluations, such as “inexpensive” into the memory and not exact prices, and these memories have an effect on store price image (also McGoldrick et al. 1999). Ease of recall was a more important moderator in store price judgements than actual product prices (Ofir et al. 2008).

41
In the food context or grocery shopping context, a low information search (Sinha and Uniyal 2005), negative correlations between price and quality (Riez 1979), low relationships between reference price and price involvement (Grunert et al. 2009), or poor knowledge of food prices (Dickson and Sawyer 1990; McGoldrick et al. 1999; Roza-Diaz 2004) have been reported. Monroe and Lee (1999) suggested that price information is more often unconsciously processed than has been previously expected, and, therefore, according to the memory research approach, the price knowledge (implicit memory, unconscious recollection) should be distinguished from the process how consumers remember prices (explicit memory, conscious recollection) (see also Jacoby and Olson 1977). Additionally, price information has proven to be less helpful in learning or remembering quality differences between the products within the same product category (Warlop et al. 2005). Aalto-Setälä and Raijas (2003) argued that in Finland consumers are exposed to a large variety of food prices for similar products in different stores and at different times, and thus it is hard to remember them. Consumers buy several food products based on habits (Honkanen et al. 2005). As Hamlin (2010, 94-95) argues, in food categories and in the shopping situation consumers are barely aware which cues they use in order to make a product choice, and the process probably lasts only a few seconds. After the choice is made, the array of cues is immediately discarded and replaced with new ones when consumers continue their shopping tasks.
2.2.3 The prospect theory
The concept of reference price is central in the theoretical foundations of the prospect theory (Kahneman and Tversky 1979). Price perceptions are reference dependent, like all perceptions, creating the reference value (an adaptation level or an acceptable price range according to Helson’s 1964 adaptation level theory) which forms the “background” against which comparisons are made. The prospect theory is originally developed to understand risky choices, and it proposes that preferences are affected by attitudes to gains and losses (changes in stimulus), rather than states of wealth (status quo in a stimulus) (Kahneman 2003, 704), and therefore it challenges the expected utility theory. The expected utility theory approach has been considered normative, deductive and inadequate to explain certain behaviour, whereas the prospect theory, based on behavioural observations, was found to be inductive (Newman 1980). The prospect theory has also been considered to be more adequate to explain multiple criteria choices than traditional value models, and to be more realistic in describing human decision making (Salminen and Wallenius 1993, 291). However, the prospect theory has been criticized conceptually as being too close to traditional utility theory and as not including enough neurobiological factors related to human behaviour (Nwogugu 2006).

42
The prospect theory has its roots in psychophysics (Weber’s Law) and cognitive psychology. Originally the prospect theory was concerned with deals and evaluative judgements of future outcomes (prospects). It has however been applied to price gains and price losses related to reference price models (Thaler 1985; Han et al. 2001). As has been previously discussed a reference price have been defined as a general price expectation, but Thaler (1985) refers that a fair price expectation (like Kamen and Toman 1970) is different in different context (namely a seller context). Similarly, Ranyard et al. (2001) confirmed that an internal reference price and the seller context (for example, fair price expectations for a bottle of beer are different at the hotel bar from food shops) affected respondents’ willingness to pay estimations, but the seller context was weak. Urbany and Dickson (1990) indicated that implementing prospect theory into pricing issues is challenging because all losses and gains involved in the same situations are multidimensional varying in importance and in monetary values.
According to the prospect theory there are two phases in a choice process: 1) framing and editing a problem, and 2) evaluating the possible outcomes. Evaluations are related to the value given to each possible prospect, and on this basis the prospect of highest value is chosen (Tversky and Kahneman 1986, S257). The value function of the prospect theory describes how perceived value changes with different probable outcomes relative to the reference point (or the goal), and it has three principles (Heath et al. 1999, 82):
1. The reference point is used by subjects to categorize deals into areas of gains and losses (success or failures).
2. The loss aversion effect means that subjects react more strongly to losses than to gains. The pain derived from losses is greater than the pleasure derived from gains; therefore, subjects are more eager to avoid losses than to seek gains.
3. Diminishing sensitivity means that the more distance there is to a reference point the weaker the reactions are. The perceived loss of 5 € is not the same when 200 € as opposed to 20 € is concerned.
The value function is concave above the reference point and convex below the reference point because of the loss aversion effect (describing the asymmetrical relationship between losses and gains) (Tversky and Kahneman 1986, S258-S259). However, the shape of the value function is related to the location of a reference alternative, and thus a value function can be linear if the lowest (or highest) value is included into the reference point and everything above is a gain (or a loss) (Salminen and Wallenius 1993, 290). Asymmetry has also been found in food choice experiments related to expectations and purchase intentions (Schifferstein et al. 1999) when negative disconfirmations (product worse than expected) are regarded as “losses” and positive disconfirmations (product better than expected) are regarded as “gains”.

43
A reference point may be individual and change, and thus in the research situation an operationalization of the reference alternatives is demanding and the location of the reference point affects the value function (Salminen and Wallenius 1993, 291). Wicker and Hamman (1995) discovered that loss aversion was related to the perceived necessity of the goals. Han et al. (2001) suggested that subjects differed in their reaction to gains and losses according to the latitude of price thresholds (price sensitive consumers had small thresholds for losses and gains). According to Weber et al. (2007), people perceive loss aversion for goods but not for money. Selling the commodity evokes an emotional negative reaction, whereas giving away money (buying the commodity) does not. Moreover, higher external reference prices activated a reward process and higher satisfaction levels were scored compared to lower reference prices. Possibly the worth of a product is inferred from the reference price, which increases a negative emotion when sold.
In terms of the prospect theory and the asymmetry (between loss and gain) embedded in it, the importance of price-quality evaluations in foods is understandable. If a high price evokes high quality expectations and these are disconfirmed, a person may experience strong feelings of loss. If expectations are high and they are met, feelings of happiness occur, but probably less strongly. According to Swinyard and Whitlark (1994), feelings of dissatisfaction were twice as great as feelings of satisfaction. A low price may evoke low quality expectations and if these are disconfirmed, feelings of loss probably occur, but in the case of a small monetary sacrifice this is not experienced as strongly as with high expectations and high prices. Loss aversion has been reported in foods by Schifferstein et al. (1999) with sensory quality expectations. The perceived risk of a bad choice may be a key question in accepting a high price for a food product. The willingness to avoid bad choices may possibly occur when consumers select unfamiliar food products. Repurchase will probably be made based on experienced quality perceptions, and experienced satisfaction or dissatisfaction is related to the expectations either confirmed or disconfirmed. However, in the experimental research designs, food products with some product attributes are evaluated in isolation, though experiences of loss aversion has been found to be different in isolated than in aggregated situations (Langer and Weber 2001), as food choices can be made in a store. This may mean that one at a time evaluations are made differently than evaluations that are part of the shopping basket or total food expenses. According to Thaler (1985) subjects keep a mental track of multiple losses and gains using the prospect theory value function and outcomes can be evaluated jointly or separately including budget constraints. Thaler’s (1985) model of consumer choice behaviour based on prospect theory and transaction utility theory is called mental accounting.

44
Mental accounting
By mental accounting Thaler (1985) means that consumers are mentally coding possible outcomes from transactions as gains and losses, and, further, they evaluate these outcomes as a function of perceived value. Tversky and Kahneman (1986) use mental accounting in a narrow sense, namely a frame in which an evaluation occurs. Mental accounting in the larger context is a descriptive framework how consumers evaluate, organize and control financial transactions (Thaler 1999, 186). Thaler (1999, 183) argues that mental accounting affects choice, and therefore it represents an important model. According to the theory of planned behaviour, attitudes and subjective norms affect behavioural intentions together with behavioural control (Fisbein and Ajzen 1975; Ajzen 2005). Mental accounting offers an interesting framework how consumers execute this control in financial transactions and purchase situations.
According to mental accounting by Thaler (1999), consumers code, evaluate and categorize financial transactions into different accounts, such as food expenses into a food account, rent payments into a housing account, and theatre tickets into an entertainment account. Several different accounts can be relevant to an individual. Accounts can be balanced daily, weekly or even over longer periods, and, further, accounts can be opened and closed. This kind of mental “book keeping” enables consumers to keep track of expenses and budgets. Monetary budgets may be implicit or explicit; nevertheless, they influence consumers’ willingness to use these accounts (Thaler 1999). Money can be perceived in three different categories: expenses (money used), wealth (money saved) and income (money reserved). All these categories can be divided into different budgets and accounts. Dividing expenses into specific accounts and budgeting facilitates control and helps ensure households’ liquidity with assets. In households with monetary pressures, budgeting can be explicit with tight rules for short periods (Thaler 1999, 193). Heath and Sol (1996) found that students had weekly food budgets but monthly clothing budgets. They also discovered that when students labelled money into categories, under tight self-control, they underconsumed certain categories. This can mean that labelled money is not easily transferred from one account to another. Moreover, incomes can be divided into a regular income and into small windfalls. Small windfalls are probably spent differently and on different products than regular income, as was found by Milkman and Beshears (2009) with online grocery shopping. This may be due to thinking that regular income is budgeted in advance for necessities and small windfalls allow free-spending. Budgeted necessities of household expenses have been discovered to affect significantly consumers’ willingness to avoid monetary losses (Wicker and Hamman 1995).
According to Thaler (1999), consumers make cost-benefit analyses before and after (exante-and expost) transaction decisions and a series of decisions can be grouped together. Consumers can reduce feelings of loss if some purchases can be divided into such small

45
units that they are not accounted for anymore or they can be booked to another accounts still underconsumed. Furthermore, Thaler (1999, 201-202) argues that consumers make different kinds of choices if they are making several choices at the same time or if they are making several separate choices during a certain time period. Losses and gains are perceived differently if they are analysed jointly or separately (also Langer and Weber 2001).
Some irrationalities in consumers’ behaviour in financial transactions may be explained by the mental accounting approach such as buying on bargains products not needed, trying to use expensive shoes even if they hurt, paying premium for smaller quantity, or avoiding small-scale attractive bets (Thaler 1999, 191, 195, 198, 202). Mental accounting tries to understand how consumers evaluate financial transactions and it analyses the outcomes. Mental accounting is not a theory which explains behaviour but it does give an interesting framework to understand it through transaction utility theory and the perceived value of the prospect. Even though, according to mental accounting, consumers sometimes seem to interpret the perceived value or utility (net gain or net loss) irrationally, the prospect theory and the transaction utility theory include the prevalent assumption that a higher price than expected or compared to a standard is low value or a bad deal (a loss, disadvantaged price inequity) whereas a lower price compared to a standard is good value or a good deal (a gain, advantaged price inequity), and consumers try to avoid losses and obtain gains. However, a good deal is not always perceived as a fair deal (Xia and Monroe 2010) and feelings of fairness can also have an effect on consumer choices (Kahneman et al. 1986).
2.2.4 Fair price experience
The concept of a fair price is related to the reference price. Kamen and Toman (1970) have suggested that consumers have a fair price in mind, they compare observed prices against it being unwilling to pay higher prices (cf. Thaler (1985) on transaction utility and Scitovsky (1945) on a worth of a product). Kahneman et al. (1986) demonstrated that some consumers wanted to promote fairness and resist unfair deals. They suggested that some consumers are willing to punish unfair firms although this causes loss, and consequently feelings of fairness should be considered in firm’s pricing decisions (also Maxwell 2008). However, understanding price fairness judgements is challenging because they seem to be inconsistent. The rules of fairness (expected ethical ways to behave in transactions) and fairness judgements are sensitive to reference points and to framing effects. Framing effect means that the same price may seem fair or unfair based on the context and the wording used in asking for a judgement. Kahneman et al. (1986) demonstrated that subjects may answer in an experiment that a price is unfair if a vendor thereby secures large profits (personal benefits of the vendor), whereas, the same price from the same transaction may be judged fair if it is justified by paying salaries and keeping people employed (benefits to employees).
46
A size effect also can be found. Large price differences probably generate more feelings of unfairness than small price differences. Grewal et al. (2004) discovered that subjects paying a higher than normal price assumed that firms were making bigger profits, and greater feelings of being cheated by the firm were detected. Bolton et al. (2003) discovered that equal profits were judged as fair or unfair according to the store image, quality of the products and the selling strategy.
Maxwell (2002 and 2008) has suggested that a concept of price fairness should be understood in a larger context than in the sense of a low price (good deal, gain) only. It has a social utility which is different from the economic utility of a low price. Feelings of fairness stimulate the reward system and enhance happiness (also Weber et al. 2007). Reactions towards fairness are emotional and experienced quickly and automatically, and, consequently, consumers may seem to behave irrationally if feelings take over to cognitions. However, the effect strength varies between consumers. With feelings of fairness, the social consciousness of the consumers and expectations related to social acceptability are emphasized (see Maxwell (2008) for a literature review of fairness in the research of behavioural economists, primate behaviour researchers, and social neuroscientists).
Consumers may feel an entitlement to and a need for justifications. If the price increases it needs to be justified in order to be accepted and to diminish negative feelings of unfairness. Maxwell (2002) has demonstrated that perceived violations of rules of fairness affected consumers’ attitudes towards the seller, and, further, lowered the willingness to make a purchase. According to Bolton et al. (2003), consumers tend to ignore a great variety of vendors’ costs in fairness judgments. According to Grewal et al. (2004), consumers seem to tolerate disadvantageous price differences better if the reason is internal (related to the actions of the subject) than if the reason is external (related to the actions of a vendor). Based on a large survey conducted in the USA, price unfairness was related to large profits for firms, an inability to understand the cost structure of the firm, and the assumption of unethical or immoral actions by the firm (Bechwati et al. 2009).
Diller (2008) has emphasized the power asymmetry in price fairness. Consumers consider themselves to be “the weaker player” in the market position at least in terms of pricing and the lack of information. In asymmetrical positions, the more powerful partner is expected to behave fairly, and not to take advantage of others. Using superiority (giving insufficient quality information, lacking real competition in price setting) to gain more profit is most likely to be judged as an unfair policy. Diller (2008, 354) summarizes the components of price fairness in Figure 5.

47
Figure 5. Components of price fairness according to Diller (2008, 354).
In Figure 5, consistency means that vendors obey the conventional standards and no changes are made without letting others know. Distributive fairness means that one player should not gain by causing a loss to others. Price honesty is related to the truth and clarity of reasons behind the price. Price reliability is related to the partners’ trust in keeping prices unchanged, at least those agreed in advance. Influence is related to the partners making compromises and decisions concerning the price. The possibility of affecting price decisions increases the level of acceptability. Fair dealing reflects the ability to reconsider the agreements and react flexibly when sudden changes in circumstances occur. It may include guarantees beyond the legal demand. By “Personal respect and regard for the partner” Diller means a fundamental attitude of respect towards others. (Diller 2008.)
Maxwell (2008) has pointed out that a feeling of fairness has connections to the social consciousness and to social acceptability. Consumers may not perceive the transaction to be fair even if they accept it. A transaction can be favourable but unfair if it is against a person’s moral judgements. Xia and Monroe (2010) emphasized that consumers evaluate the value of the transaction in a large context which include other subjects. They have made also a distinction between price fairness and transaction value. Even though some subjects gained positive transaction value by receiving a price advantage over the other subjects, they perceived the price to be less fair (Xia and Monroe 2010). It is possible that feelings of price fairness in foods can include other subjects but also other dimensions. For example, higher price in foods can be justified by using acceptable explanations related to animal welfare, animal treatment, or other ethical or environmental issues associated with food production. A high price in Fair Trade products may be considered fair if consumers value the notion of better salaries and working conditions in developing countries. However, Fair
Components of price fairness
Distributive fairness
Price honesty
Consistent behaviour
(of partners)
Influence / right of co-
determination
Price reliability
Fair dealingPersonal respect
and regard for the partner
48
Trade products might be perceived as unfair if consumers believe that higher prices mainly benefit distributive trade partners and not producers.
2.2.5 Consumer differences in price perceptions
In behavioural or psychological approaches to economic functions, researchers are interested in individual differences and subjective perceptions of consumers. However, the individual behaviour of a particular consumer is unimportant to marketing managers. Instead, finding distinguishable subgroups based on behavioural patterns is considered to be of value. Consequently, there have been serious attempts to segment consumers according to different characteristics related to purchase behaviour. In segmentations based on buying intentions, low prices are significant and consumers with a tendency to be economical have been discovered (Sinha and Uniyal 2005).
As was briefly discussed in chapter 2.2.1 consumers make subjective perceptions of price-quality relationships, and several consumer characteristics have been found to be related to them such as frugality, ease of spending, product involvement, and product familiarity. Some consumers who are quality conscious take a high price to be an indicator of high quality but this is not true of all consumers and not within all product categories (Steenkamp and van Trijp 1989). Consumers’ reactions towards price fairness or unfairness are emotional and spontaneous, and the strength of these feelings varies between people based on neurophysiological functions (Maxwell 2008). A reference price is a core element in price perceptions and has a unique value in consumers’ minds; price perceptions are also unique as well.
In an economic approach, consumer differences are mainly related to price sensitivity. Price sensitivity means that a person reacts to price changes and reduces buying intentions if the price increases. According to Nagle and Holden (1995, 100), price sensitivity is related to the highest price that a consumer would pay to buy the desired quantity of the product (a reservation price). A reservation price is a similar concept to the upper boundaries of an acceptable price range (i.e. the notion of “too dear”; see Stoetzel 1969; Adam 1969; Gabor and Granger 1969b; and Fouilhé 1969). Consumers’ price sensitivity in economics is most often related to a product’s price elasticity: a change in price affects the change in unit sales. Consumers’ propensity to react to price changes is individual, and therefore marketers apply different pricing strategies into different consumer segments. Nagle and Holden (1995, 77-94) have identified several factors influencing consumer price sensitivity, which are presented briefly in Table 1.

49
Table 1. Effects on consumers’ price sensitivity according to Nagle and Holden (1995, 77-94).
Perceived substitute effect Consumers are sensitive to price differences between the products they perceive as substitutes.
price-quality effect Consumers are less sensitive to prices if they perceive specific quality features of the product.
Unique value effect Consumers are less sensitive to prices if they value unique features of the product
Switching cost effect Consumers are less sensitive to price changes if the costs of switching the brand are high.
Difficult to compare effect Consumers are less sensitive to price changes if it is difficult to compare prices or products.
Expenditure effect Consumers are more sensitive to prices if the total expenses are high in relation to income or the household budget.
Price fairness effect Consumers who perceive the price as fair are less sensitive to price changes.
End-benefit effect Consumers are less sensitive to prices if they focus on the end-benefits of the product, e.g., by eating healthy products it is possible to lose weight and be popular among one’s peers.
Shared-cost effect Consumers not using their own money in the purchase situations are not as sensitive to prices as consumers who pay their own bills.
Inventory effect If consumers are able to stock the product for later use, consumers may be sensitive to temporary price changes.
Price-quality relationships and price fairness effects have been previously discussed, but other features can also be easily attached to foods. If consumers perceive no differences in taste, the lowest priced brand can be chosen as a substitute. If functional food products are

50
valued and a health benefit is found as a unique attribute, the high price of that product may be accepted. Health-related foods have, moreover, been marketed with an end-benefit effect. Food costs may be the biggest expense of the household budget, and thus the expenditure effect may increase the price sensitivity towards certain food products which are regularly consumed.
Strong well-known brands have been assumed to decrease the price sensitivity of the consumers. Hansen et al. (2006, 88), for example, discovered that consumers buying national brands in foods were less price sensitive than consumers buying store brands. This assumption is probably based on the effect of brand credibility and consumers’ willingness to avoid bad choices (Lambert 1992). According to Erdem et al. (2002), consumers’ price sensitivity decreased when brand credibility increased in all investigated product categories: juice, shampoo, jeans, and personal computers. The authors assumed that the impact of the credibility of the brand is related to the perceived quality uncertainty (the low or high risk of making a bad choice). Urbany et al. (1989) found two types of pre-purchase uncertainty: knowledge uncertainty related to the product features, and choice uncertainty related to choice task. The difficulty of choosing increased the search, whereas uncertainty to product features decreased the search behaviour. Price sensitivity (the propensity to respond to price change), price consciousness (the unwillingness to pay high prices), and price awareness (the ability to remember prices) are all related to the consumers’ tendency to search for price information and to how much weight this knowledge is given.
An information search and a low risk of making a bad choice have been related to product involvement (the importance of the product) (Erdeem et al. 2002). High involvement seems to increase the importance of product information, brand preferences, and the perceived differences between brands in the purchase decision (Zaichkowsky 1985), and it probably decreases the importance of price. Ramirez and Goldsmith (2009) found price sensitivity to be negatively related to product involvement as well as to innovativeness and brand loyalty. The price was a more important product cue for low-involved subjects than in high-involved subjects in case of wine (Locksin et al. 2006; Hollebeek et al. 2007). The more involved consumers are able to perceive differences between brands, and thus they concentrate less on merely the price information (see also Lambert 1972). However, in brand choice situations and in low involvement categories, for example in foods, full search is limited and probably evaluation is made between only a few brands (Dickson and Sawyer 1990; Bronnenberg and Vanhonacker 1996; Hamlin 2010).
In economics, a brand choice and brand preferences are assumed to be logically inferred from the perceived utilities of the product. However, in psychology, preferences are understood to be constructed based on a variety of dimensions, including personal psychological processes (Weber and Johnson 2009, 55). Consequently, the importance of the price can be related to social judgements made by other people. Some people may believe that choosing

51
a high-priced product affects other people’s social perception of them (Lambert 1972, 40). Lichtenstein et al. (1993, 236) defined this kind of behaviour as prestige sensitivity. Consumers with high prestige sensitivity tend to favour high-priced brands because, on the one hand, they probably believe that a high price is a cue to high quality, but, on the other hand, they believe that other people will evaluate them based on this purchase. Also, they believe that a high-priced product will signal high social status to others. In a field survey by Lichtenstein et al. (1993) prestige-sensitive consumers were unwilling to redeem grocery coupons, and they thus assumed that redeeming coupons reflected a fear of being judged as “poor” as an inference from “cheap”. Most of us want to give a good impression to others; consequently, a lot of our behaviour may be influenced by the intention to appear in a good light. Prestige sensitivity may be related to the need to maintain a positive self-image. Johansson-Stenman and Martinsson (2006) reported in a survey that some consumers (e.g. males and small-town citizens) were more concerned about the status-value when buying a car than others (e.g. females, the old, the university educated).
The dual role of price was also reported by Erickson and Johansson (1985, 198): price had a direct negative effect on purchase intentions. Additionally, it had an indirect positive effect on purchase intentions through quality inferences. However, price had no direct effect on the attitudes towards the product, although positive attitudes towards products were inferred through quality perceptions. Lichtenstein et al. (1993) developed further the dual role of price. They found consumer differences in five dimensions reflecting the negative role of price and in two dimensions reflecting the positive role of price. Five factors of price perceptions in its negative role included: 1) price consciousness (similar to price sensitivity, the willingness to look for the lowest possible prices), 2) value consciousness (the willingness to look for the best value for money), 3) coupon proneness (the willingness to redeem coupons and get discounts), 4) sale proneness (the willingness to buy at sales, the sale prices affecting purchase intentions), and 5) price mavenism (the willingness to tell others of good bargains and the lowest prices). Two factors concerning price in its positive role were: 1) price-quality schema (the willingness to pay a high price and inferring the high quality from this price), and 2) prestige sensitivity (the willingness to signal high status to others by buying high-priced products). In the field survey (Lichtenstein et al. 1993), they were able to observe that the Coupon proneness factor was related to redeeming coupons; the Price consciousness factor was related to searching for price information; the Price-quality schema factor was related to the reduced ability to recall price information, and the Value consciousness factor was related to the increased ability to recall prices.
If consumer is price sensitive, he or she is assumed to be willing to look for low prices and unwilling to pay high prices. A price-sensitive consumer is also assumed to change the brand or the quantity if the price increases. These consumers perceive the price in its negative role namely as a sacrifice (Lichtenstein et al. 1993). Similarly, a quality-conscious person

52
is assumed to be willing to pay high prices for high quality where differences in quality are perceived and valued (Steenkamp and van Trijp 1989). According to Monroe (2003, 173), consumers are probably either price sensitive (using price as a cue for sacrifice) or quality conscious (using price as a cue for quality signal). Moreover, if a subject is quality conscious he or she is less sensitive to price changes.
The price perception scale introduced by Lichtenstein et al. (1993) has been modified and used in several contexts. Grunert et al. (2009), for example, used a modified price perception scale as a price involvement scale and classified food shoppers into four subgroups according to deal proneness, price mavenism, value consciousness, and perceived budget constraints. Classifying consumers into different segments, and showing how detailed subgroups are developed, is based on the operationalizations made by researchers. The deal proneness dimension, for example, can be divided into more specific subgroups (Martinez and Montaner 2006). However, meaningful segmentations must be proportional to marketing practices. In small markets, specific subgroups even with some behavioural differences might be irrelevant in terms of marketing communication. Yet, in developing new food products especially with high quality features and launching these into the markets, it would be good to be aware whether the targeted consumers use price information mainly as an indicator of quality or of sacrifice. In the actual food purchase situations, consumers’ motivations to process price information might be limited. Increased time pressure has been discovered to increase quality perceptions in case of high priced products, but quality perceptions decreased if low priced products were evaluated (Monroe 2003, 174). This was supported by Oliviera-Castro’s (2003, 649) study discovering that a high price increased the search duration in foods. However, most of the food bought for daily use is probably based on past experiences and habits (Honkanen et al. 2005; Hamlin 2010), and thus price information might be ignored or processed unconsciously.
2.3 Attitude
Consumer attitudes are of interest to marketing practitioners because it is assumed that behaviour may be predicted based on attitudes (Fisbein and Ajzen 1975, 14-15). In food choice situations the number of attributes to be evaluated is immense and quite impossible to be operationalized in one experiment. Therefore, expressing overall attitude may be a simpler and more reliable measure of food preference than asking the respondent to evaluate a large set of product attributes (Steenkamp 1997, 145-151).
There has been a number of different definitions for an attitude over the decades in the social sciences (Osgood et al. 1965; Fisbein and Ajzen 1975). All definitions include the description of the negative or positive evaluation of some object. It is also agreed that attitudes are learned, and they are inferred states of the organism (Osgood et al. 1965, 189). Attitudes can

53
be derived from feelings and cognitive beliefs towards objects, and from past experiences, and attitudes can change (Kantz 1960, 168; Haddock and Maio 2004, 1). Attitudes enable us to avoid things that are harmful to us and approach those that are beneficial to us (Maio et al. 2004, 12). Another concept close to attitudes is trait, but it differs from attitudes in that it can be described as the tendency to behave in a certain way in certain circumstances and it can be used to classify people in different personality types (Ajzen 2005, 6). Attitudes are the subject’s evaluations of the object, whereas traits reflect the subject. A person has several specific attitudes and a hierarchical construction of these attitudes forms a person’s value system (Kantz 1960, 168).
Attitude is defined here as “thepsychological tendencythat isexpressedbyevaluatingaparticularentitywithsomedegreeof favourordisfavour” (Eagly and Chaiken 1993, 1). Attitude is a multicomponent model including affective responses, cognitions and behavioural information (Haddock and Huskinson 2004, 36). These different dimensions of attitudes have different kinds of effects on a person’s value system and behaviour. The strength of an attitude is related to intensity, which in turn refers to the strength of an affective component of an attitude, and expresses how strongly favourable or unfavourable the feeling is that a person has towards the object (Kantz 1960, 168). Using measurement scales, attitudes can be located somewhere along a strength continuum, relatively strong attitudes being considered stable as well as better predictors of behaviour (Olson and Fazio 2009, 20). However, the attitude change is related to the cognitive structure of an attitude. According to Kanz (1960, 168-169) attitudes include several cognitive beliefs, and the simpler the structure of beliefs the easier the change. If one item of belief is changed the attitude may change if the attitude is based on only a few items. Additionally, the importance of a specific attitude in the value system (the hierarchical construct of several attitudes) affects the change in attitude; inhibiting the change if it is a core element of the value system. Moreover, the centrality of an attitude and the value system within the person’s self-concept makes the predictions of attitude change more difficult.
Attitudes are latent hypothetical characteristics which cannot be accessed directly, thus external observable cues are used to capture it. In order to measure attitudes they can be inferred from cognitive (as statements of beliefs), affective (as feelings or emotions) or conative (as behavioural intentions) responses (Ajzen 2005, 2, 4-5). Previous researchers have discovered low correlations between components of attitudes (affect, cognition, and behaviour) and the overall attitude (Orbell 2004, 147-150; Ajzen 2005, 100-101; Webb and Scheeran 2006). Some attitudes are related mostly to feelings, whereas other attitudes can be uniquely related to beliefs about the object. Motivational goals are influenced by three components (Figure 6), but unfortunately no prior theory exists to predict or explain why and when some component affects one attitude more than another (Maio et al. 2004, 10-15). Both affections and cognitions are important in predicting attitudes: affective information is

54
probably related to favourable attitude formation, whereas cognitive information is attached to negative evaluations (Haddock and Huskinson 2004, 37).
Behaviour:
experiences
Motivations
Cognition:
beliefs
Attitude
Affection:
feelings
Figure 6. The function-structure model of attitudes: motivations influence the behavioural, cognitional and affection components (Maio et al. 2004, 11).
In marketing literature, the term affect may include several mental processes such as emotions, moods, feelings and even attitudes (see Bagozzi et al. 1999 for a review of emotional behaviour in marketing) and sometimes it is unclearly defined what concept has been measured. However, people differ in the degree to which they rely on cognitive (beliefs) or affective (feelings) information: some people are “feelers” rather than “thinkers” and vice versa (Haddock and Huskinson 2004, 40-46, 48-53). Behavioural intentions or actual behaviour occur when cognitions are translated into affections, or affections into cognitions (Trafimow and Sheeran 2004, 63, also Loewenstein et al. 2001; Storbeck et al. 2006; Buchanan 2008), however, it seems that no clear understanding exists on which component (affection or cognition) is activated first or affects behaviour most. Marketing managers are interested in knowing whether to use emotional (affective) or informational (cognitive) messages in order to get consumers to accept new products or brands, and thus they are willing to encourage favourable attitudes or change unfavourable attitudes towards a product.
According to Kantz (1960, 169), change in one component (e.g., affection) will generate the change in other components (e.g., behavioural beliefs), and, thus, the centrality of a specific attitude within the value system and the complexity of its structure have an impact on actual change. In understanding the attitude change it is important to know why people have attitudes, why they hold on to the attitudes they have, and what function they serve. How attitudes can change, and in which conditions, probably depends on what function they

55
serve. According to Kantz (1960, 170-176) attitudes can be approached by investigating different motivational goals: 1) Attitudes may have a utilitarian function (also called an instrumental or adjustive function). Attitudes help people avoid unpleasant events and approach pleasant ones. Favourable attitudes with a utilitarian function towards a specific object are the results of learning to gain rewards and satisfaction, and, thus, they are affected by previous behavioural experiences. 2) Attitudes may serve an ego-defensivefunction. This means that sometimes people have to hide their true feelings from themselves in order to sustain self-respect. All human beings have negative feelings such as fear, hate, or shame, and sometimes these feelings are not always accepted at the cognitive level. Fear of losing one’s job may generate a negative attitude towards immigrants. Attitudes projected to some other objects (not related to a person’s true feelings) may serve as a defensive mechanism. 3) Attitudes may have a value-expressivefunction. People need to signal values and self-concepts to others in order to find the right reference group; the group they feel they belong to. This group can be defined broadly as one’s own generation or it can be specified to be a particular association. With attitudes one can describe what kind of person he or she is. 4) Attitudes may provide a knowledgefunction. This means that people need to understand the external world, and attitudes help to construct and interpret the meanings of different events that are important to them. According to Kantz (1960, 177), a conflict must appear between an old attitude and a satisfaction received from having it in order for an attitude to change. Change in attitudes may occur if a person is convinced that altering the attitude will once again generate a satisfaction that has been experienced before (Kantz 1960, 178).
In the contemporary attitude literature, theorists discuss whether attitudes should be measured explicitly or implicitly. Moreover, sometimes distinctions are made between explicit and implicit attitudes, or discussions take place whether this kind of distinction is justified. If negative attitudes towards immigrants are in focus, for example, and if these attitudes serve an ego-defensive function, these attitudes may not be captured reliably by self-reported scaling. Explicit measures are operated by self-reporting one’s attitudes, being at the same time fully aware of the interest of the investigators, whereas implicit measures are conducted indirectly and respondents are not aware of the attitude in question (Petty et al. 2009, 3-4). The human behaviour can be impulsive or reflective, and most likely a combination of the two (Olson and Fazio 2009, 23) as may well be the case in food choice situations with different food products.
2.3.1 Attitudes and evaluation system
During the years, many process models have been presented to explain the association between attitudes and behaviour. Using attitudes to predict behaviour is difficult because human behaviour consists of many other components than attitudes. Some of the attitudes
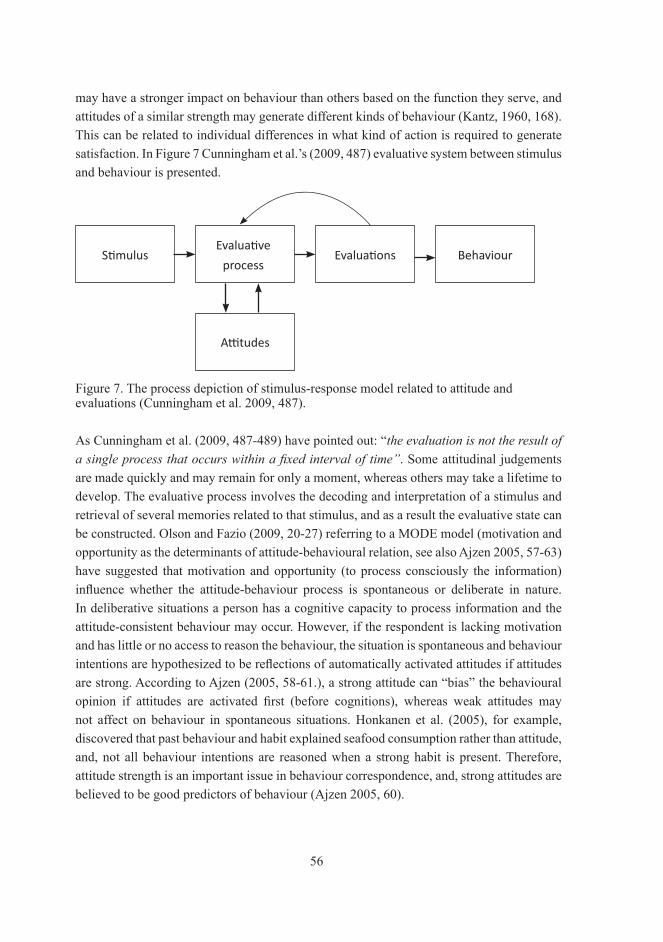
56
may have a stronger impact on behaviour than others based on the function they serve, and attitudes of a similar strength may generate different kinds of behaviour (Kantz, 1960, 168). This can be related to individual differences in what kind of action is required to generate satisfaction. In Figure 7 Cunningham et al.’s (2009, 487) evaluative system between stimulus and behaviour is presented.
StimulusEvaluative
process
Attitudes
BehaviourEvaluations
Figure 7. The process depiction of stimulus-response model related to attitude and evaluations (Cunningham et al. 2009, 487).
As Cunningham et al. (2009, 487-489) have pointed out: “theevaluationisnottheresultofasingleprocessthatoccurswithinafixedintervaloftime”. Some attitudinal judgements are made quickly and may remain for only a moment, whereas others may take a lifetime to develop. The evaluative process involves the decoding and interpretation of a stimulus and retrieval of several memories related to that stimulus, and as a result the evaluative state can be constructed. Olson and Fazio (2009, 20-27) referring to a MODE model (motivation and opportunity as the determinants of attitude-behavioural relation, see also Ajzen 2005, 57-63) have suggested that motivation and opportunity (to process consciously the information) influence whether the attitude-behaviour process is spontaneous or deliberate in nature. In deliberative situations a person has a cognitive capacity to process information and the attitude-consistent behaviour may occur. However, if the respondent is lacking motivation and has little or no access to reason the behaviour, the situation is spontaneous and behaviour intentions are hypothesized to be reflections of automatically activated attitudes if attitudes are strong. According to Ajzen (2005, 58-61.), a strong attitude can “bias” the behavioural opinion if attitudes are activated first (before cognitions), whereas weak attitudes may not affect on behaviour in spontaneous situations. Honkanen et al. (2005), for example, discovered that past behaviour and habit explained seafood consumption rather than attitude, and, not all behaviour intentions are reasoned when a strong habit is present. Therefore, attitude strength is an important issue in behaviour correspondence, and, strong attitudes are believed to be good predictors of behaviour (Ajzen 2005, 60).

57
The theory of planned behaviour
According to Fisbein and Ajzen (1975) behavioural intentions and further behaviour is affected by attitudes towards that behaviour and the subjective norm. The subjective norm means some influence from outside the subject, such as normative social beliefs, or the opinions of other people. This model is known as the theory of reasoned action (TRA). Subsequently, behavioural control was added to the model, and it was modified to form the theory of planned behaviour (TPB), first introduced by Ajzen in 1985 (Ajzen 2005). In the field of marketing and in the food choice literature, the theory of planned behaviour (TPB) and the theory of reasoned actions (TRA) are the dominant theoretical models (see Webb and Sheeran 2006 for a broader literature review and analysis, and Hamlin 2010 for TPB research related to foods).
According to TPB, based on the subjects’ intentions to perform or not to perform certain behaviour can be predicted whether that behaviour will occur (Ajzen 2005; see also Orbell 2004, 146-147 for research related to the relationships between behavioural intentions and behaviour). People are considered to acquire the information related to behaviour and be able to assess the different outcomes. Attitudes are assumed to reflect the intentions, and, therefore, attitudes are measured as prior determinants of behaviour. However, sometimes low correlations between behavioural intentions and actual behaviour have been measured (Ajzen 2005, 100-101, see also Orbell 2004, 147-150 for research related to disconfirmations between intentions and behaviour). According to Webb and Scheeran (2006), the correlation between behavioural intentions and actual behaviour is small, and large changes in behavioural intentions generate only small changes in actual behaviour. If people have control of their behaviour, it is assumed that they behave as they are intended to behave. However, if control is lacking, other explicit and implicit factors may prevent the planned behaviour (Ajzen 2005, 107). According to Orbell (2004, 149), non-intenders are more likely not to behave than intenders are to behave; thus, the major source of consistency in intention-behaviour correlations is based on non-intenders’ ability to behave according to their (non)intentions. Despite the probably weak predicting power, in several studies food consumption or food purchase intentions has been explained by using TPB or TRA structures (see Hamlin 2010 for a review, also Hansen et al. 2004, for TPB model, and McCarthy et al. 2005, with TRA).
Besides attitudes and control, another factor determining behavioural intentions is a subjective norm. Subjects are sensitive to the social pressures of the environment, and, they evaluate whether they should perform or not (Ajzen 2005, 124-125). These three determinants of intentions (attitudes, norms, and control) reflect prior beliefs (Figure 8, Ajzen 2005, 126).

58
Attitude towards the behaviour
Subjective Norm BehaviourIntention
Behavioural beliefs
Perceived behavioural control
Control beliefs
Normative beliefs
Figure 8. Beliefs as the informational foundation of intentions and behaviours according to Ajzen (2005, 126).
However, even if all attitudes include some prior beliefs, not all beliefs are dimensions of attitudes (Kantz 1960, 168). Attitudes are related to the outcomes (positive or negative behavioural beliefs) of certain behaviour. Normative beliefs are a person’s prior assumptions about how other individuals (who are important to the subject) will approve or disapprove certain behaviour. Control beliefs are related to possible obstacles or facilitators to perform certain behaviour, and whether they see themselves as capable of doing what they were intended to do. Behind these behavioural, normative and control beliefs can be a great variety of background factors related to personal (general attitudes, personality traits, values, emotions, intelligence), social (age, gender, race, ethnicity, education, religion income), and informational (experience, knowledge and media exposure) dimensions (Ajzen 2005, 135).
The theory of planned behaviour has been criticized because it emphasizes systematic and volitional behaviour along with the need for knowledge structure in order to be able to reason, and it does not take into account the context in which the behaviour occurs nor the importance of the product (Hamlin 2010). Some food products can have low importance to the subject or the choice among the different brands can be based on past experience or habit without cognitive reasoning in the choice situation (Honkanen et al. 2005).
Habits and intuition
Habits are well-learned, well-practised past behaviour (Oulette and Wood 1998, 54). Oulette and Wood (1998) confirmed that past behaviour along with attitudes and subjective norms contributed to intentions, and, further, behavioural intentions affected future actual behaviour. Moreover, the frequency of past behaviour reflects habit strength and it directly affects future performance in repeating situations. However, if behaviour was not well-

59
learned and the situation was unfamiliar or complicated, cognitive reflection was needed. It seems understandable that consumers may buy some food items based on habit and little effort is made to provide reasons for that choice. If the food item is new, a favourite brand is not available, a food product is not used daily, or even if food is bought from a store which is unfamiliar to the subject, more information is needed and the process may be more cognitive. Fitzsimmons et al. (2002) provided evidence that consumers’ choice is a mix of conscious and unconscious influences and a large part of consumers’ decision making is likely to occur outside of awareness (also Storbeck et al. 2006). Additionally, according to Wilson and Schooler (1991, 185) reasoned evaluations are probably not the most satisfactory ones. In the case of strawberry jams one group of respondents evaluated the jams without any reasoning, and they had similar preference scores as trained sensory experts. On the other hand, the respondents who had the opportunity to reason changed their preferences and the responses corresponded poorly with the opinions of experts. Explaining the reasons behind the choices lowered the quality of those choices increasing the feelings of regret after the choice.
According to Ajzen (2005, 59-60; see also Olson and Fazio 2009, 25), weak attitudes will possibly not affect behaviour in spontaneous situations (little motivation or limited access to find rational explanations), whereas strong attitudes can influence behaviour in such situations. According to Phaf and Rottveel (2005) familiarity and positive feelings may lead to more intuitive judgements, whereas respondents make more analytic judgements with negative feelings and unfamiliar stimuli. Attitudes towards food products can change based on the information (affective or rational) received, but familiarity may delay the attitude change because original attitudes are constructed based on long experience (Millar and Millar 1990).
People want to hold on to prior beliefs and are unwilling to change them (theory of cognitive dissonance by Festinger 1975). If new information is inconsistent with previously stored and processed information, dissonance will exist and efforts will be made to reduce it because dissonance is a negative feeling and causes tension (Kantz 1960, 178). Cognitive dissonance may occur, for example, if the consumer observes the actual price to be much higher than expected, and according to Lindsey-Mullikin (2003), consumers had three ways to reduce the dissonance between expected price and actual price: 1) trivializing the price information, and thereby lowering the importance of the price (price is unimportant), 2) justifying the price by reasoning and actively seeking information to support the justifications (price fairness), or 3) changing prior beliefs and attitudes. The theory of cognitive dissonance has also been used to explain food (taste) expectations (e.g., Cardello and Saywer 1992).
Based on the literature findings presented here one can assume that attitudes towards willingness to buy premium-priced food products probably affect actual buying behaviour along with perceived subjective norms and being controlled by some manners. Buying food

60
can be habitual behaviour in recurring situations which can decrease the influence of the attitude or at least how it is expressed in research situation (if one is forced to reason). Nevertheless, with new foods, such as functional food products, it is more likely that some cognitive reasoning occurs in the buying situations. Attitudes towards the functional food products as well as attitudes towards the willingness to buy these products at premium prices probably influence behaviour through some evaluation system. Evaluations may occur in relation to beliefs and the value system. The high price of foods may need cognitive reasoning and justifications in order to be accepted, thus information delivered through marketing messages can have an influence on an acceptance. However, deliberative reasoning may not guarantee satisfactory food choices and repurchase.
Basic psychological research concerning attitudes usually deals with quite serious moral issues perhaps with ego-defensive functions. The findings of psychological attitude research, however, are often applied in other fields of research without thinking what kind of functions the attitudes serve, how central it is to a person’s self-concept, or how complicated a structure of beliefs lies behind the attitude. Probably, consumers’ attitudes towards purchase behaviour serve utilitarian or knowledge functions, and thus results related to attitudes with other types of functions may make a limited contribution in this context. Consequently, there has been continuous criticism towards different attitude measurements related to capabilities to predict real life behaviour. As Osgood at al. (1965, 198) stated decades ago:“attitudeisone–butonlyone–ofthedimensionsofmeaning,and,hence,providesonlypartoftheinformationnecessaryforprediction”. Furthermore, Ajzen (2005, 39) has concluded that the behavioural inconsistency of human beings is still an embarrassing problem for researches.
2.3.2 Attitude and price
Jacoby and Olson (1977, 73) were surprised how few studies confirmed price-related attitudes influencing consumer response, even though the attitude studies of consumer behaviour is great in number. However, emotional feelings related to price perceptions are a growing area of contemporary research interest in marketing (Bagozzi 1999; O’Neill and Lambert 2001). It has been previously discussed in chapter 2.2.2 that consumers create subjective perceptions of the observed price; one can judge the price as cheap, expensive or be neutral towards it. In previous studies, attitudes towards price has been related to the upper and lower limits of prices beyond which consumers find the price unacceptable (Stoetzel 1969, 70-74; Adam 1969, 75-88; Gabor and Granger 1969b, 134-137; Jacoby and Olson 1977, 79). These ultimate limits have been referred to as “too cheap” and “too expensive” with affective evaluations embedded in them. However, attitudes towards the product should be distinguished from attitudes towards the price and the subject’s willingness to pay that price.

61
Ericsson and Johansson (1985, 198) found that price had only an indirect effect on attitudes towards the product through quality perceptions.
In Jacoby and Olson’s (1977, 73) article the consumers’ reactions and attitudes towards prices were reviewed from an information processing perspective. They represented the conceptual schema of consumers’ reactions towards a price stimulus (Figure 9). The authors emphasized that the schema is not a validated model. It deals with price information processing in different phases. First the information of the objective price is acquired, interpreted and categorized according to the psychological meanings attached to it (P-price in the schema). In this phase, the evaluative judgements of the target product are usually made, and a psychological price can have quality or other non-cost meanings. An evaluation is made between the price and the product. In this schema, a price judgment is stored into the memory according to individual interest, and prior beliefs are re-evaluated. Attitudinal evaluations towards the psychological price are made, and external information of other attributes is integrated into the judgements.
Response (R)
Organism
(O)
Stimulus (S)
Purchase, not purchase, other behaviours
Acquisition of O-price
Encoding: interpretation and assignment of meaning
P-price = psychological price
Storage of P-price, price consciousness, recall ability
Attitude towards P-price
Integration of P-price with other information
O-price = Objective price stimulus
Figure 9. Conceptual schema of consumer’s reactions to price (Jacoby and Olson 1977, 75).

62
According to Jacoby and Olson (1977, 74), psychological price (p-price in the schema) may “possessanevaluativeoraffectiveaspect”, and, therefore it can be then defined as price attitude. Price attitude reflects how a respondent feels in an evaluative sense. If the observed price is, for example, 23.45 € the consumer may perceive it as a high price. However, the high price can be further evaluated creating favourable, unfavourable or neutral attitude towards it. Interestingly, the concept of price attitude does not emerge from price perception studies. Consumers’ favourable or unfavourable perceptions towards high or low prices are included in the distinction whether consumers use a price cue mainly as an indicator of quality (high prices are preferred) or as an indicator of sacrifice (low prices are preferred) (Monroe 2003, 173). The term price attitude has been used as a synonym for the importance of price in Bowman’s (2006) health-related study, and in Rosa-Diaz’s (2004) study of reference prices and price knowledge. Grunert et al. (2009) have used it as a synonym for price perceptions, meaning the comparisons between the reference price and the actual price.
The concept of price attitude can be derived from the definition of thepricemindednessattitude (Anttila 1990, 97) namely “permanent attitudes towardsprices ingeneral inanindividual’smind”.Similarly, the concept of thequalitymindedness attitude was measured in Anttila’s (1990, 120) research. Even though it is well accepted that quality perceptions are embedded in price judgements (see chapter 2.2.1), it is meaningful to see them as separate functions. According to Anttila (1990, 137-137), price attitude did not correlate with quality attitude, as these attitude scales measured different concepts. Anttila’s pricemindednessattitude is a quite similar concept as Lichtenstein et al.’s (1993) negative role of price (e.g., the domains of priceconsciousness, saleproneness,couponproneness,valueconsciousness and pricemavenism), and thequalitymindednessattitude bears similarities with Lichtenstein et al.’s (1993) positive role of price (the domains of price-qualityschema and prestigesensitivity). Additionally, the qualityconsciousness defined by Steenkamp and van Trijp (1989, 12) is similar to the quality mindedness attitude and the domain of price-quality schema: “amentalpredispositiontorespondinaconsistentwaytoquality-relatedaspectswhichisorganizedthroughlearningandinfluencesbehaviour”. All these concepts and domains can be interpreted as consumers’ attitudinal evaluations towards a price. The quality mindedness attitude, quality consciousness, and the positive role of price present consumers’ favourable attitudes towards high prices. The price mindedness attitude and the negative role of price present the favourable attitudes towards low prices. These attitudinal judgements are probably based on past experience, feelings, and cognitions and they are all measured with opinion statements related to behavioural intentions.
In this thesis, the concept of price attitude is used to describe the consumers’ attitudes towards the expensiveness or cheapness of a target product. The definition of food price attitudes is modified from a general definition of attitudes by Eagly and Chaiken (1993, 1). Thefoodpriceattitude is defined in this thesis as a person’sevaluationofcheapnessor

63
expensivenessoffoodpriceswithsomedegreeoffavourordisfavour. A distinction between food price perception (price is considered cheap or expensive) and food price attitude is made (cheapness or expensiveness is considered to be a good or bad thing). Consumers may perceive food prices as low or high, but the food price attitude expresses whether a low or high price in foods is favourably or unfavourably interpreted.
The Price Perception Scale introduced by Lichtenstein et al. (1993) is used here as a model to capture the concept of the food price attitude. Jacoby and Olson (1977, 74) emphasized that price attitudes are hypothetical constructs and usually measured by verbal opinion statements. Because the food price attitude is operationalized in this thesis with opinion statements related to buying behaviour it is difficult to say whether price attitude is a person’s attitude towards a high or low price perse,or whether it describes the person’s attitude towards the willingness to buy the product at a high or low price. However, it may be difficult to separate the attitude towards a price from the willingness to pay it. Moreover, it can be discussed, whether the attitude towards a price perse even exists because it may have no meaning to a person without an impact on behaviour (the willingness to pay the price). Lichtenstein et al. (1993) measured price perceptions related to grocery shopping with statements of behavioural intentions, and in this thesis statements of behavioural intentions are modified to foods. Similarly, Grunert et al. (2009) used statements of behavioural intentions, some of them originating from Price Perception Scale (Lichtenstein et al. 1993) in order to capture price involvement.
Price involvement
The concept of involvement is related to but distinct from attitudes. Involvement has been seen as a complex construct driving consumer attitudes, perceptions and behaviour, and most often it is related to products (Carsky et al. 1994). According to Zaichkowsky (1985, 341), involvement is related to personal relevance and involvement related to different objects generates different kinds of responses, and thus research results can be heterogeneous. Differences in behaviour have been taken as an indicator of different levels of involvement.Involvement as a construct can be defined as: “aperson’sperceivedrelevanceoftheobjectbased on inherent needs, values, and interests” (Zaichkowsky 1985, 342). Involvement is related to three dimensions: 1) personal – different persons have different involvement levels, 2) physical – different characteristics of the object produce different perceptions and interests, and 3) situational – on different occasions persons can perceive different levels of interest. Zaichkowsky (1985) has emphasized that the concept of involvement should be distinguished from the behaviour it may cause, and thus it should be measured without behavioural intentions. Also, a measurement of involvement should detect the differences between persons, objects and situations, and thus Osgood et al.’s (1965) semantic differentiations scale was developed to capture the essence of involvement. Zaichkowsky

64
(1985, 347-349) reported that respondents with high involvement levels were able to see greater differences between brands. They had a preferred brand of product category, and they compared product characteristics more than respondents with a low involvement level. Similarly, low product involvement has been related to the importance of price information in food choice situations, and thus it seems that product involvement is related to the importance of price. In case of wine, highly involved consumers were less affected by price discounts and used less price information as a quality cue than low-involved subjects (Locksin et al. 2006; Hollebeek et al. 2007). Ramirez and Goldsmith (2009) also found negative relationship between the high importance of a low price (price sensitivity) and product involvement (see also Carsky et al. 1994). The importance of price has been taken as measures of price attitudes (e.g., Rosa-Diaz 2004; Bowman 2006), even though it bears more similarities with the concept of the price involvement.
2.4 Measuring price attitude
In order to investigate how Finnish consumers differ in terms of attitudes towards food prices, one of the goals of this study was to operationalize the concept of food price attitude. In frequent studies related to food choice and attitudinal perceptions (see Chen 2007 for a literature review), the food choice questionnaire (FCQ) has been used (Steptoe et al. 1995; Eertmans et al. 2006) to investigate the importance of low price. Typically, in these studies, only one dimension was considered namely price as a sacrifice (Steptoe et al. 1995, 272).However, as has been previously discussed, it is accepted that price has at least two dimensions: price as a sacrifice and price as a quality cue, reflecting the positive and negative roles of price. Attitudes in food-related studies have been measured using semantic differential scales (Osgood et al. 1965) with such dimensions as good–bad, pleasant–unpleasant, and satisfying–unsatisfying (Honkanen et al. 2005, 163) like an involvement concept (Zaichkowsky 1985, 342). Some studies related to food choice and prices are conducted by using auctions (e.g., Vickery auction) with sensory experiments (Lange et al. 2002; Combris et al. 2009). However, according to Kahneman et al. (1986), auctions are perceived as unfair procedure, and thus the emotional responses to the auction designs may introduce unmanageable variation into results. The goal of this study was to measure a general food price attitude without product-specific features, and therefore no sensory evaluations were included in the research design. Hedonic ratings such as degree of liking and perceived pleasantness affect purchase responses (Tuorila et al. 2008), and sensory evaluations such as tasting alter quality perceptions of foods (Dransfield et al. 1998).
In the field of marketing, attitudes and purchase intentions have been investigated using explicit attitude scales. Quite often these approaches are related to the theory of planned behaviour (TPB) and the theory of reasoned action (TRA), especially in the food consumption

65
context (Fisbein and Ajzen 1975; Ajzen 2005; Webb and Sheeran 2006; Hamlin 2010) as discussed in chapter 2.3.1. According to TPB, behavioural intentions can be used as behaviour predictors, and, further, behavioural intentions include reflections of attitudes, subjective norms and behavioural control (Ajzen 2005). With structural equation modelling techniques the relationships (strength and direction) between attitudes, subjective norms, control, and behavioural intentions have been tested in different situations. In food choice situations, for example, according to Hansen et al. (2004), subjective norms influence intentions both directly and through attitudes. Furthermore, according to Tarkiainen and Sundqvist (1995), subjective norms influenced buying intentions concerning organic food products indirectly through attitudes and not directly as the theory assumes. How the concepts of attitude, subjective norms and control have been defined in different studies varies a great deal, and, unfortunately, less importance has been placed in explaining the theoretical foundations behind these operationalizations.
Osgood et al. (1965, 198) have stated that “attitude scores indicate only a dispositiontowardscertainclassesofbehaviour.” They emphasized the situations and the contexts in which the behaviour is about to occur. According to Oulette and Wood (1998), attitudes had a stronger effect on intentions and on behaviour when the context was complicated and less habitual, and a deliberate choice was required. Habits have been found to be important in food consumption context (e.g. Honkanen et al. 2005, Verbeke and Vackier 2005). Habits are automatic processes, and, some food choices are possibly made unconsciously according to habits. Moreover, price information is perhaps unconsciously processed or ignored in grocery shopping situations (Dickson and Saywer 1990; Monroe and Lee 1999). TPB has, however, been criticized for not taking into account low involved food purchase situations (Hamlin 2010) in which there is no time to reason. There has been recent discussion in contemporary attitude research whether attitudes should be measured implicitly, because some results indicate that automatically activated attitudes directly affect behaviour (Perguini and Bagozzi 2004, 170). Perhaps, when habitual purchases of food and prices are concern this can also be the case. The theory of planned behaviour has been under development and automatic, emotional, and motivational processes have been added to theoretical assumptions. The goal-oriented approach suggests that the desire to act is more important than attitudes in predicting behaviour, especially at the implicit level (Perguini and Bagozzi 2004, 174). Nevertheless, food choice tasks and price judgements include both automatic and conscious reflections. In the functional food category with premium-priced products, consumers are likely to frequently deliberate over the purchase choice before the product is accepted into habitual use. Despite the importance of measuring attitudes implicitly, in this thesis, only explicit attitude measurements have been chosen to investigate the consumers’ food price attitude.
66
At times researchers can confuse behavioural intentions to behavioural expectations, for example, an expressed likelihood of buying is different behaviour from the agreed intention to buy, and therefore selecting the right intentional scale is crucial (Davis and Warshaw 1992). In TPB-based research, behavioural intentions are often measured by using likelihood scales, although this has been criticized as being a measurement of predictions and not intentions (Smith 1999). The goal of this thesis was to find well-established explicit measures related to both foods and prices, and attitudes should be measured with behavioural intentions. According to the theory of planned behaviour, there are behavioural beliefs behind the behavioural intentions because the behavioural beliefs are related to possible outcomes, for example, a person believes that he or she will experience good quality if a high-priced food product is purchased. It is not assumed that the food price attitudes defined in this thesis would be sufficient to explain the purchase of the premium-priced food products alone; yet, it would probably have a minor effect on buying behaviour in a category of high priced products.
The price perception measurement (PPS) introduced by Lichtenstein et al. (1993) was chosen because three main requirements were fulfilled: 1) the measure was implemented in grocery shopping, and the relationships between the perceptions and actual behaviour were discovered, 2) the price had two different roles: a price was perceived both in a negative and positive role, and 3) behavioural intentions were measured using a 7-point Likert scale (strongly disagree-strongly agree). The original price perception measurement had 43 items. The items measured seven different domains: 1) five items for price consciousness, 2) seven items for sale proneness, 3) seven items for value consciousness, 4) five items for coupon proneness, 5) six items for price mavenism, 6) four items for price-quality schema, and 7) nine items for prestige sensitivity (see Appendix 1 for the original statements). This measurement has been widely used and tested in different countries and between different cultures. According to Meng and Nasco (2009), the Price Perception Scale has been modified so as to ensure a better fit in the research context of many studies. However, due to modifications behavioural domains can be differently reconstructed in the final results. The development of the Food Price Attitude Scale based on the PPS is explained in chapter 5.
Another aim of this study was to investigate whether the food price attitudes defined in this study had a significant effect on willingness to pay estimations. In marketing and food choice studies acceptable prices are usually measured with questions related to the willingness to pay for the product or the willingness to buy the product. Choice-based experiments in marketing are quite often related to conjoint analysis approach. Conjoint analysis is one of the most commonly used tools in contemporary academic and commercial marketing research (Wittink and Cattin 1989; Carroll and Green 1995). In economics, questions of willingness to pay or willingness to accept are often related contingent valuation approaches (see Park and MacLachlan 2008 for a review related to marketing). Price perceptions have
67
also been investigated by the upper (price too high) and lower (price too low) price limits (e.g., Stoetzel 1969, 70-74; Adam 1969, 75-88; Gabor and Granger 1969b, 134-137). In the NSS price sensitivity measurement (PSM) by van Westendorp (1976) respondents are asked the upper and lower limits and the evaluations of cheap and expensive (e.g., at what price you find this product expensive). Even though stating an acceptable price for buying a product in an experimental setting is important, little research has been done on how consumers process the price information, and on what factors affect willingness to pay estimates (Jacoby and Olson 1977).
In behavioural approaches related to price judgements, the importance of the reference price has been generally accepted (Kalyanaram and Winer 1995). However, another line of research has investigated measures of fair price or price utilities. Lowe and Alpert (2007) discovered that in the categories of new products consumers tend to use fair price assumptions rather than expected price assumptions, and a fair price was a better predictor for the purchase of innovative products than a reference price. On the other hand, in evaluations of existing products (perhaps the products in habitual use) past prices are likely to be remembered and used as a reference price. Grunert et al. (2009) compared willingness to pay answers in different conditions: 1) using a contingent valuation (CV) method, and 2) using an experimental auction (EA) method. There were no significant differences depending on the method used. There has been ongoing debate whether willingness to pay questions in the contingent valuation method should be presented in open-ended (subject gives a price) or dichotomous-choice form (price is given and a subject answers Yes or No) (Bohara et al. 1998). Some evidence has been found to support procedural invariance for public goods but not for private goods (Boyle et al. 1996; Baker et al. 2008). Exaggeration in naming a price is also reported as one of the problems of willingness to pay studies (Park and MacLachlan 2008, 692). Similarly, underestimations have been reported in studies related to the reference price and price recall (Rosa-Diaz 2004). Consumers may have trouble in giving reliable price estimates.
Two processes are probably important in processing numerical information about prices: an ability to calculate numerical difference between two prices, and an ability to process quantities and convert numerals into magnitudes (Monroe 2003, 110). According to Xia (2003), subjects processed information in a similar way whether it was presented as numbers or as prices connected to the products. Processing numbers as well as prices were biased with the distance effect (comparison of numbers with large differences is easier than comparison of numbers with small differences), the magnitude effect (smaller numbers are easier to distinguish than larger numbers), and the serial position effect (differences in first digits are easier to perceive than differences in second digits if the first digits are the same). However, a product context and a monetary ($) sign caused some differences. First, the subjects took longer time to process the information in case of prices. Secondly, if both digits

68
were different, the numbers were related to the product and they processed the price more intentionally, whereas if only one digit was different subjects used automatic processing similar to pure numerical information processing. Some processing of price information might be automatic and some may be related to products (Monroe 2003, 112), but it is not yet clear how consumers encode prices and process price information. They may memorize only the results of the previous judgment (product X is cheaper than product Y) or retrieve prior prices from the memory and then make comparisons (a price of a product X is lower than a price of a product Y) (Xia 2003, 289). Alternatively, processing a price judgements consumers might ignore the numerical value. Baker et al. (2008) discovered that respondents explained their willingness to pay responses with themes like the feelings of fairness, trust or moral issues, that is, issues unrelated to pure numerical processing.

69
3 Framing food price attitudes
The important purpose of this qualitative study is to explore the role of price in foods, an investigation which was approached inductively. Profound understanding was needed in order to operationalize the food price attitude because a clear definition was unavailable. Additionally, some information was required in order to understand how consumers explained price perceptions related to high food prices using functional food products as examples. A qualitative approach was selected for two reasons: 1) during the discussions subjects were able to bring up ideas and thoughts not predicted by the author, and 2) during the discussions the author was able to become familiar with the research themes: how Finnish consumers talked about prices, what food prices meant to them, how they perceived high prices in foods, and how familiar they were with the prices of functional food products.
Another aim of this qualitative approach was to investigate whether it was appropriate to use the Price Perception Scale introduced by Lichtenstein et al. (1993) to capture the food price attitudes. This scale was neither developed nor used to measure the intentions of the food purchase only, and therefore, deeper understanding was needed in order to modify the scale.
Functional foods as a target product category
The functional food category was chosen as a target product category. These new products are of current interest to the food industry and to product development. Functional food products were appropriate for the purpose of this study. As has been previously discussed in chapter 2.1 functional foods have a higher price than similar food products without health claims. According to a price comparison survey made by the National Consumer Council (2002) the prices of functional food products were 20% to even 500% higher than corresponding products without a health claim. According to Urala and Lähteenmäki (2003), Finnish consumers perceived functional food products as special products in a base product category, and a health claim is one of the product attributes. Functional foods are a relatively new food product category, but it was assumed that Finnish consumers were able to discuss them and evaluate the price. According to Niva (2008), Finnish consumers were quite familiar with these products and according to some cross-cultural studies Finnish consumers have been more favourable towards functional food products than consumers in other countries (Jonas and Beckman 1998; Bech-Larsen and Grunert 2003; Saba et al. 2010).
The food industry is interested in developing new functional food products and concerned to know whether consumers are willing to accept the price of these products. During 2001-2004, there was an innovative research programme concerning these products administered by TEKES (the Finnish Funding Agency for Technology and Innovation) including
70
several research projects. This thesis is a part of the research project: Toolsforconsumer-oriented product development. It was executed with three research establishments (VTT Biotechnology, the University of Helsinki the Department of Food Technology and the Department of Economics and Management) and five companies from the food industry. The project was funded by TEKES, VTT (the Technical Research Centre of Finland), the University of Helsinki, and by the industrial partners. The aim of the project was to create qualified measurements for the food industry in order to understand consumers’ willingness to use and buy these new products. The other measures developed in this project besides the food price attitudes were related to novelty (Huotilainen 2005) and attitudes towards functional food products (Urala 2005). The author was one of the researchers of the Department of Economics and Management in this project. From June 2003 to December 2004 Nina Hautala acted as a substitute during the maternity leave of the author and was responsible for the questionnaires in 2004.
3.1 Design of the qualitative study
The semi-structured personal interviews (N=40) were held by the author mainly in June and July 2001 (36) and four supplementary interviews were carried out in January 2002 (see Appendix 2 for the thematic frame of the interviews). A semi-structured interview was chosen because it provides an opportunity to guide the discussion according to the themes of the research interest. Semi-structured interviews are justified if a clear theoretical understanding has been established by a literature review (Lee and Lings 2008, 218). However, the object of this preliminary study was to gain better understanding of how consumers perceived prices in foods and especially in the functional food category, thus avoiding a blocked prior understanding of price perceptions (Gummesson, 1991, 54). During the semi-structured interviews discussions proceeded freely and subjects were able to come up with ideas and issues not predicted by the researcher. An individual interview approach was chosen because functional foods had a close relation to the individual’s personal state of health and need for health products. Moreover, money pressures or the ability to buy premium priced products are highly private issues. It was assumed that gaining a respondent’s trust during the private discussions was needed in order to access these important opinions (Fontana and Frey 1998, 59).
3.1.1 Subjects
The aim of the sampling of the qualitative study was to gain different kinds of experiences and thoughts related to food prices. A part of this sample was purposive. Purposive sampling means collecting the sample with the idea of relevance (Lee and Lings 2008, 213-214).

71
On the one hand, the subjects with different professional backgrounds were looked for, such as professionals in health care, pharmacies, and food-related areas, assuming that people among these professions were more aware of functional food products. On the other hand, a great variety of consumers’ opinions was of interest, and thus the aim was to reach ordinary consumers without any background criteria. Some companies, communities and establishments were contacted by telephone and permissions to interview employees or other members of the establishment were asked for. Subjects were recruited by their immediate superiors at their assignment places, where the interviews took place during the working hours. Seven subjects were recruited with the help of different contact persons. These subjects were not acquaintances with the interviewer and the interviews were held at the subjects’ homes. In the recruiting situation, no special requirements were made. All subjects participated voluntarily and after the interview were given a charity product worth approximately 16 €. Superiors or contact persons were informed about the gift forehand but not the interviewees.
The sample of this preliminary study consisted of 40 Finnish adults, 26 of whom were female. Ages ranged from 19-71 years, with a mean of 37. The subjects were from different areas in Finland, the northern Finland excluded, and they had different professional and educational backgrounds (Table 2).
Table 2. Background information of the qualitative sample 2001-2002 (N=40).
Gender n Age groups n
women 26 under 20 2
men 14 20-29 15
30-39 6
Professional field n 40-39 7
students 3 50-59 5
health care 4 60 or older 5
food service, maintenance 5
pharmacies 4 Education n
building, engineering 4 primary school graduates 3
communication, education 4 secondary school graduates 12
horticulture 3 professional degree 8
office employees 4 technical college degree 7
office managers 3 academic degree 10
pensioners 3
military 3 Region n
Helsinki metropolitan area 8
Southern Finland 16
Western Finland 7
Eastern Finland 9

72
There were 24 females and six males who regarded themselves as the main person in the family responsible for food shopping. Another ten subjects bought food for themselves or for the family occasionally. Only two young persons, living at home with their parents, reported infrequent food buying, yet they admitted to having an effect on their mothers’ decisions. They were also able and willing to discuss shopping for food as well as food prices. The frequency of shopping for food in this data was on average three to four times a week, and 18 of the subjects reported food as the greatest expense in their budgets. Money pressures affected nine of the subjects. There were six regular users of functional food products, and eight of the subjects used some of these products randomly. All subjects were in good health, only four persons informed about problems of high cholesterol, two persons mentioned diabetes as a problem or a risk, and three subjects were concerned about high blood pressure. The need to lose weight was mentioned in all age categories.
In the reported results in chapter 3.3, some references and quotations are made to the subjects. The reported quotations are freely translated into English by the author. The original quotations can be obtained from the author by request. Male subjects are coded with M+number and females with F+number. Any information about age or professional field is not attached to the codes in order to maintain anonymity and secure unrecognizably. Subjects from the same professional field were co-employees and superiors or contact persons would recognize subjects by age or education. Results are not to be generalized and background information was not used in the analysis.
3.1.2 Interview procedure
The role of price was discussed first on the general level and then seven qualitative statements were presented and discussed one statement at the time. The statements were the same for all subjects but they were presented in a random order. It was important that the interviewer presented no product examples, instead the aim was to gain spontaneous responses related to statements. The statements included seven domains based on Lichtenstein et al.’s (1993) Price Perception Scale (see Table 3).
Table 3. Qualitative attitude statements presented to all subjects during the interviews.
Statements (modified from Lichtenstein et al. 1993) Domains (Lichtenstein et al. 1993)
The most expensive brand is the best product. I appreciate those who buy highly-priced brands.
Prestige sensitivity
The price of the product is a good sign of the quality. You can’t get a good product with a low price.
Quality- price schema

73
The low price in products is important to me and I am willing to use time and effort to find the lowest price.
Price consciousness
Although the low price is important, the quality of the product is equally important. I want to get a full value for my money.
Value consciousness
When buying at sale price, I believe I’m getting a good deal. Sale proneness
Getting a discount with coupons is a good and clear practise. I would like to use more of them.
Coupon proneness
I enjoy discussing prices and where to shop in order to get the best buy with my friends.
Price mavenism
After presenting the statements, the discussion was associated with food products and food shopping, then the discussion directed towards the prices of functional foods. Three different functional food samples were demonstrated one by one in order to activate the discussion. Products were bought from the nearest grocery store to the subject. The aim was to provide all subjects with the same products, but because of the differences in the product variety found in the local stores, sometimes similar products were unavailable. All three products presented in the session included different kinds of nutritional claims. First, a Linobene® meal product (pasta with chicken sauce) with fibres and omega 3 fatty acids was presented. The price level was close to normal products and a mean price per package was 2.20 €. Secondly, a Gefilus yoghurt with Lactobacillus GG® (2 dl) to help digestion and intestinal health was presented. The price was approximately 100% higher than yoghurt with no health claim. The average price was 0.60 €. In cases of where yoghurt was unavailable, a package of cheese (300g) with Lactobacillus GG® (to help digestion and intestinal health) was presented instead. The average price for the cheese was 3.80 €, approximately 45% higher than a similar sized cheese package with no health claim. Thirdly, a spread with Pro-Active®-vegetable stanoil (to lower high cholesterol level) in a 250g package was presented. The average price was 3.50 € per package. The price was approximately 300% higher than normal vegetable fat spreads. There were little differences between the prices in different local stores. The results presented in this thesis include only price perceptions of a meal product, yoghurt and a spread.
All interviews lasted approximately 60 to 90 minutes depending whether it was held in the subjects’ home or in the subjects’ workplace. Interviews held at homes lasted longer. All interviews were tape-recorded with the interviewee’s permission. Recoded data was transcribed word-for-word. The summary of each discussion was sent to the subjects for revision. The data was content analysed by using the ATLAS-ti (Archiv fürTechnik,Lebenswelt und Alltagssprache – text interpretieren) computer program. Word-for-word storage of the discussions was chosen in order to be able to re-analyse the data after the survey procedures. The computer software was used to store the large primary data, coding and categorizations for later use.
74
3.1.3 Analysing the qualitative data
The process of analysing the qualitative data involves coding, categorizing and organizing the relevant knowledge into meaningful theoretical frames. There can be a different theoretical paradigm behind the qualitative analysis, and thus the interpreting the data can vary in different research approaches. Roughly speaking, these approaches can be divided into positivism (looking for the facts), interactionism (looking for the experiences and constructs of reality), and ethnomethodology (looking for people’s understanding of reality) (Silverman 1993, 60, 90-100). These different approaches influence the way the data has been treated and what kind of results are drawn from the data. Qualitative analysis has been criticized for being less rigour and less reliable than quantitative analysis (Lee and Lings 2008. 232-233). This kind of criticism is based on the positivistic viewpoint which assumes that numbers reflect meaning better than words and that interpreting numbers is free from bias (Saunders et al. 2007, 472-474). In fact, a critical point of view is needed to make a reliable qualitative analysis. Results drawn from the data have to be made transparent to others and justifications for the conclusions have to be expressed (Lee and Lings 2008, 233).
The basic procedures of analysing the interviewed data are: recording the data, transcribing the data into written form, coding the information from the data, categorizing the coded information, and constructing the relevant knowledge frame from the coded and categorized information. Transcription can be done word-for-word without non-verbal data (pause, sighs, etc.), with non-verbal data, or just those sections relevant to the research purpose (data sampling) (Saunders et al. 2007, 475). Coding is an essential phase in order to organize the large pile of miscellaneous data, and to reduce it to a more manageable form (Lee and Lings 2008, 243-244). Coding can be produced deductively or inductively. Inductive coding means that codes emerge from the data and are categorized later. Deductive coding means that codes and categories are made based on prior knowledge or theories found from the literature, and data is then analysed by searching for a match with these codes. Coding the large transcribed data should be both inductive and deductive at least for pragmatic reasons (Lee and Lings 2008, 246). Being done inductively only, one can end up with an unmanageable group of codes because everything seems to be interesting. On the other hand, deductively made code structures can ignore new insights of the phenomenon which were not predicted by the researcher.
Transcription and coding is different whether discourse analysis, conversation analysis or content analysis is carried out (Lee and Lings 2008, 255, 256). Discourse analysis is heterogeneous range of research to analyse the conversation being interested in activities or objectives found in speech (Silverman 1993, 120-124). Conversation analysis deals with people’s methods for organizing interactions through talking, and, therefore, precise transcripts (with pauses or overlapping) are required (Silverman 1993, 120). In conversation

75
analysis, researchers are interested in how the language is used and what kinds of roles, relationships and social norms emerge from the conversations (Adler and Adler 1998, 99).
Content analysis is most often related to communication analyses. However, its history goes back at least to the eighteenth century in the counting of words of religious hymns and sermons (Rosengren 1981, 9). Content analysis is a systematic evaluation of the symbolic meaning of all forms of recorded information (Kolbe and Burnett 1991, 243). According to Kassarjian (1977, 8-9) there have been several definitions of content analysis used in the social sciences, though, three characteristics have been agreed upon: it is objective, systematic and quantitative. Content analysis is traditionally used to count and quantify the relevant units from the data, though it might fail to capture the context in which the information is produced (Manning and Cullum-Swan 1998, 248). Indeed, there are different theoretical research traditions behind the method of content analysis.
According to Sepstrup (1981, 135-136), the content analysis methods of Scandinavian and Anglo-American communication researchers is based on the positivistic tradition, and the other approach, the qualitative approach, associated with the Marxist/critical tradition is almost completely overlooked. Epistemological differences behind these approaches have kept them in isolation, and qualitative content analysis has been unable to contribute to the social sciences because the results from this research tradition have been regarded as unreliable and insignificant (Sepstrup 1981, 135). According to the positivistic approach, the interest of the subject lies within the text (or talk) and it can be revealed by counting the frequencies of the relevant units. Deductively assumed codes and categorical frames keep the process of analysis external and uninfluenced by the researcher. Reliability can be confirmed if another researcher is able to end up with the same results. (Lindkvist 1981, 34; Kassarjian 1977; Kolbe and Burnett 1991.) However, positivistic content analysis is criticized for dividing the content into isolated pieces of information assuming that summing these pieces together again would create a better overall understanding (Sepstrup 1981, 139).
In Finland, a distinction has been made between content analysis (sisällönerittely) and the analysis of the context (sisällönanalyysi). The analysis of the context means that both the content and the context of the material are described in order to comprehend the phenomenon (Tuomi and Sarajärvi 2002, 106-109). The context analysis bears a similarity with the qualitative approach in the Marxist/critical tradition. According to Sepstrup (1981, 139), the combination of both the positivistic and the critical tradition augments the possibilities to create a better holistic understanding of the phenomena. It can organize large quantities of material in a credible way.
In this thesis, the analysis of the context was more appropriate than the traditional quantitative content analysis alone. The qualitative data was collected to gain a better understanding of the consumers’ food price perceptions. Even though the previous studies related to price

76
perceptions were great in number, some new insights were needed in relation to Finland, functional foods and to the present time. The analysis of the interviewed data consisted of three phases: transcription of the raw data, data reduction by coding and categorization, and abstraction of the categories in order to find the relevant theoretical counterparts. The analysis of the qualitative data was carried out by the author alone despite the requirements of confirming the analysis by other researchers. Nor was the demand for objectivity (category formation as an external process based on theoretical assumptions) completely fulfilled. These reliability limitations are discussed more profoundly in chapter 6.3.1. Technically, the process of the inductive analysis was conducted as follows:
1. Transcribing the recoded interviewed data word-for-word without non-verbal information. The summary of the transcript was sent to the subject for a revision with a prepaid envelope and a return address. Transcription was done by the author alone, as the interviewees had been promised confidentiality about their discussions.
2. Reading the material and becoming familiar with it.
3. Preparing the material for the ATLAS-ti computer program.
4. Looking for codes from the material with the help of the computer program.
5. Listing the codes and combining related codes reducing them to more meaningful unities.
6. Categorizing the codes into relevant categories.
7. Classifying the categories into higher categories.
The results of the preliminary analyses in 2001 were used to develop the first self-administered questionnaire in November 2001. However, more profound analyses were conducted later. The procedure was a long process in which there was a dialogue between theory and empirical data.
3.2 Results of the qualitative study
Results drawn from the rich data included four main rounds of analyses in the form of different questions presented to the data. First, the data was analysed in order to investigate the qualitative statements (modified from Lichtenstein et al. 1993) and how these domains were related to food, because this knowledge was needed to develop the first questionnaire. Second, the data was reanalyzed to seek answers as to how respondents perceived food prices compared to prices of other commodities. Third, the data was analysed in order to
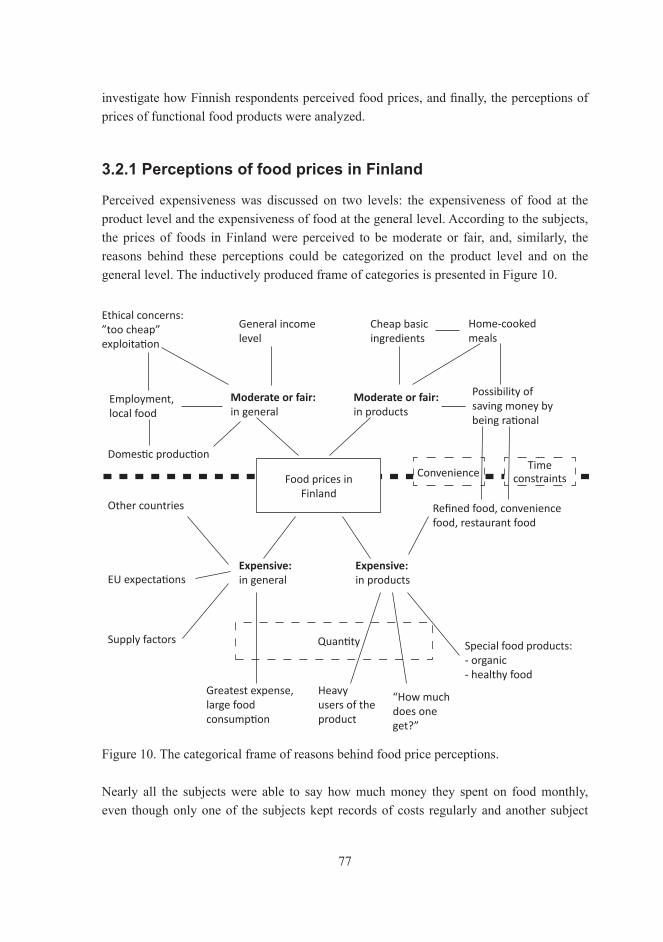
77
investigate how Finnish respondents perceived food prices, and finally, the perceptions of prices of functional food products were analyzed.
3.2.1 Perceptions of food prices in Finland
Perceived expensiveness was discussed on two levels: the expensiveness of food at the product level and the expensiveness of food at the general level. According to the subjects, the prices of foods in Finland were perceived to be moderate or fair, and, similarly, the reasons behind these perceptions could be categorized on the product level and on the general level. The inductively produced frame of categories is presented in Figure 10.
Possibility of saving money by being rational
Domestic production
General income level
Employment, local food
Food prices in Finland
Ethical concerns: ”too cheap” exploitation
Other countries
EU expectations
Supply factors
Greatest expense, large food consumption
“How much does one get?”
Heavy users of the product
Quantity Special food products: - organic - healthy food
Refined food, convenience food, restaurant food
Time constraintsConvenience
Home-cooked meals
Cheap basic ingredients
Expensive: in products
Expensive: in general
Moderate or fair: in products
Moderate or fair: in general
Figure 10. The categorical frame of reasons behind food price perceptions.
Nearly all the subjects were able to say how much money they spent on food monthly, even though only one of the subjects kept records of costs regularly and another subject

78
occasionally. Only eight of the subjects considered food prices somewhat expensive in Finland, referring to the expectations of the price-level decrease during EU membership, an amount of food consumed by teenagers, or the price level in other countries. One of the subjects considered the food prices expensive because she suffered from lactose intolerance and the prices of low- lactose products were higher than the corresponding products with lactose. Even these subjects were eager to specify that not all food products were expensive and one could save some money by making other (more rational) choices. One of the subjects compared store prices to wholesale prices and two of the subjects referred to big price differences between groceries or other places of purchase. Only the two youngest participants said that they did not look at the prices at all and they had difficulties in judging what was expensive or cheap. Even though they made decisions about the brands, they did not personally have to pay the costs of the food products they chose.
Most of the subjects considered food prices in Finland to be moderate or fair. Basic ingredients were perceived as cheap and money could be saved by preparing food at home. Women were expressing the feeling that they should provide more home-cooked meals and hence save money. However, few women from this sample were either able or willing to do that. They were too busy or they did not like cooking. According to Bava et al. (2008), convenience foods are on the rise. Time constraints and lack of cooking skills were recorded as among the reasons why respondents were not able to provide food according to the traditional practices. In everyday life, women were making trade-offs between the taste and the convenience in order to buy time (Bava et al. 2008, 495-496).
Three of the subjects of our qualitative study working within food services highlighted the relationship with food prices, healthy eating, and time constraints. They considered healthy eating as eating according to nutritional recommendations, including vegetables, fresh fruits, milk products, whole-grain bread and other grain products and some low-fat meat, fish or poultry products. “Ofcourseitisexpensiveifyouregularlygoouttoeatoryoubuythoseready-mademealsandyoujustopenthepackageandheatitup.IfyoumakenormalFinnishhome-madefood, it’snotexpensive.” (F19). These food professionals considered basic ingredients to be cheap and healthy. They also considered that titbits and ready-made meals were expensive and not so healthy if regular used: “Ithinkthemostexpensivefoodsarethemostrefinedfoods.Imeancreamybakeryproductsandthosekindsofspecialitieswhich possibly contain a lot of fat and have low nutritional value. Imean those thingsarereallyexpensiveperkilo,likesweetsaswell.” (F13). This is supported by Blaylock et al. (1999) implying that time constraints, the demands of convenience, and the unnoticed number of calories in processed foods are related to the unhealthy eating habits of American consumers.
Despite the general opinion of food being moderately priced in Finland, many of the subjects were able to point out some expensive food products. Special health products were

79
considered expensive (products low in sugar, low in fat, low in lactose) or other specialities (organic, biodynamic, local food). Special health products were also found expensive in the study by Blaylock et al. (1999). Frequently-used products (e.g., coffee, bread) or processed food products were perceived as expensive. Meat and meat products were perceived as somewhat expensive, but it was noted that there were differences in choices of meat (sirloin, roast, or neck) and money could be saved if one had more time to prepare it. Cheese was also mentioned as an expensive basic food product. One of the subjects said that the cost might be related to the supply situation and not necessarily to the product perse. Many of the subjects mentioned peppers as an example of an expensive basic food product: “Ithinkpeppersareagoodexample,duringthewintertheycost35mk/kg[5.89 €/kg]andIdon’tbuythem.Ifeelthatpeppersarelikeabasicvegetableandiftheycostmuchmorethanothervegetablesliketomatoes,courgettesorcauliflowers,it[the price judgement] comesfromthere.Idon’tseepeppersasaluxuryproduct.Itmademethink,hastheyalwaysbeensoexpensiveorisitjustsomeglobalshortageofpeppers?”(M11).
Some of the subjects perceived food prices as fair considering the domestic agricultural conditions and the food production in Finland. One of the subjects said that food is toocheap and consumers are spoiled with such low prices. According to her opinion a low price was always a sign of exploitation of some kind and in the long run it is not in our interest to have low-priced food. Some of the subjects compared food expenses with net income and perceived them as acceptable. The expensiveness of one product could be related to the price of another product, such as the response of one of the mothers who debated with herself why she bought Finnish cucumber at a premium price:“[perception expensiveness] whenIseehowmuchIgetfromthatamountofmoney, butthenIthink:“Heywaitaminute!”,howcanIbuysweetsat50mk/kg[8.41 €/kg],wheninspringtheFinnishcucumberisnomorethan20mk/kg[3.36 €/kg],andatthatpointIstartcomparingthepriceofthecucumber[to the price of sweets]and,I’dratherwantthem[children]toeathealthycucumberthansweets.That’sthewayIthinkofexpensiveness.”(F15).
3.2.2 Buying food is different from buying other commodities
The data was content analysed further in order to investigate how subjects discussed food purchase and food prices. The purpose of this analysis was to reveal the variation of spontaneously emerged ideas of discrepancies between foods and other commodities and to answer the question whether it is different to buy food than other commodities. Subjects also discussed the meaning of food prices in the purchase situation. According to the data, three different interests were discovered which could be related to the involvement construct: high or low interest in shopping for food, high or low interest in food prices and high or

80
low interest in foods (Figure 11), but separating them accurately from each other was complicated.
Discussions related to shopping for food mainly concentrated on the process of selecting food products within one store. These discussions include both product-related and person-related issues but were not greatly concerned with store-level dimensions (e.g., atmosphere, display, personnel). Food buying behaviour was considered to be different than buying other products, as one of the subjects pointed out: “Youbuyfoodwithadifferentattitude” (F11). This idea was related to the relationship between quality and price. With durables it was rational to take a higher price as a guarantee of better quality and the buying decision was more planned beforehand while food buying was a routine.
Taste is crucial - difference in taste is decisive - better taste in organic, healthy or Finnish food - children or spouse are choosy about taste - the wish to indulge oneself with good food
Quality is reliable in Finland
- small differences in quality
- food chain is reliable in Finland
Appreciation - entertaining guests, hospitality - ethical, environmental issues
Necessary day-to-day purchase - fast and easy shopping for food - shopping for food is an every-day task - shopping for basic food products is automatic
Small quantity of money involved - small price differences - price per package/unit is small - no interest in discounts
quality
High/low interest in shopping
Involvement
High/low interest in food prices
High/low interest in food
price
prestige
Figure 11. Themes and coded comments in analysis structure.
81
Involvement in shopping
According to the data, visiting a food store was a necessary day-to-day task which was seen as an obligation. None of the subjects connected pleasure or enjoyment with this ordinary task, but some negative associations were identified as well as neutral attitudes.
Some of the young men responsible for food shopping for the family were interested in food, but they were unwilling to spend time at the food stores: “It’saquickvisit−pickupthethingsyouneedandgetoutasfastasyoucan” (M3). Some mothers with small children were happy to make quick and easy shopping visits, but here inconvenience was associated with the accompanying children and not with shopping for food. Most of the subjects discussed neutrally about the shopping routines. These subjects did not regard themselves as being enthusiastic about food shopping, even though some of them described themselves as “food lovers”. These results are supported by earlier findings. According to Ackerman and Tellis (2001), shopping patterns for food can be culturally bounded, and, in Western culture, the primary function may be to save time. In their study related to unpackaged food items, there was a clear difference between Chinese and American shoppers. Interviewed Chinese subjects described food shopping as fun or entertainment, whereas American subjects considered it to be a chore. Americans used less time at the store and they made fewer evaluations before selecting items than Chinese shoppers.
Brunsø and Grunert (1998) discovered that there are cultural differences between four European countries: France, Germany, Great Britain and Denmark. French and Danish consumers enjoyed food shopping more than others and were keen on using special shops. Chetthamrongchai and Davies (2000) discovered that food shopping behaviour was different within consumer groups segmented by attitudes towards time. The British consumers who scored highly for time pressure and convenience had the lowest scores for enjoyment and regularity of shopping. Elderly citizens enjoyed shopping for food more than others. One of the elderly subjects in our study informed that she made food purchases at different stores and that she was looked for the cheapest food prices. She was ready to travel a long way for discounts. Other subjects (regardless of age) were uninterested in shopping at more than one food store. They normally patronised one or two local stores which were conveniently near or on the way to home from work. The selected store had an acceptable price level and enough variety of products. None of the subjects mentioned loyalty programmes of retail chains as a reason to patronize one particular store. Unlike food shopping, the typical shopping process for clothes or shoes included “tour of shops” in order to find out the alternatives and then decisions were made based on price, model, fit, convenience, and appearance. According to the data, subjects who were frequent shoppers for shoes or clothes (and they liked this shopping) did not show any particular interest in shopping for food. Similar results have been discovered by Webber at al. (2010, 299) reporting that convenience was important
82
in food shopping, and all food was bought from one shop even if money could be saved in seeking low prices. The need to diminish the stress was more important than money saving.
Bell et al. (1998) suggested that consumers are more likely to choose where to shop based on the lowest total shopping costs (fixed costs are independent of the shopping list and variable costs depend on what and how much is purchased). Some of the subjects in our study mentioned “fixed” costs of shopping for food such as time, convenience, willingness to support the local store, variety of foods, and distance. Some of the subjects were annoyed about price differences between groceries or supermarkets. However, they pointed out that there was no use in switching from one shop to another, because the total expense would be the same, but one could always refuse to buy an expensive product:“Evenifit’saquestionofaproductworth10mk[1,80 €]andevenifit’snotalot,onlyfewmarks,butIstillprefernottobuyitonprinciple”(M10).
For some of the subjects the overall judgement of the price level of the store was more important than the prices of food products: “Igotothissamestore.SomehowI’musedtoit-everythingisquitecheapthere...it’snotatleastthemostexpensiveplacetoshop.Idon’tgoto [name of the store and the city]becauseI’venoticedthatit’smoreexpensiveinthere.”(F4). Ofir et al. (2008) implied that consumers make relative evaluations based on memory and not on precise price judgements. The store price image was important (also McGoldrick et al. 1999). They studied the memory-based processes behind store price judgements and discovered that ease of recall was important if subjects had a less objective knowledge of prices.
The importance of food price
One of the subjects was extremely interested in food prices, compared prices and was interested in food discounts. However, many of the subjects said that they looked at the food prices but they did not usually react to them, it was more like a habit (similar results have been found in a large survey study by Dickson and Saywer 1990). Monroe and Lee (1999, 220) have argued that with habitual purchases consumers probably pay minimal attention to the purchase decisions and use little effort in gaining price information, and therefore price information might be perceived unconsciously and processed automatically (also Hamlin 2010). Although consumers may pay very little conscious attention to the food prices, and may not recall exact prices, they still probably make evaluations concerning prices. Price perceptions can be evaluated in relation to quantity especially if the price is higher than expected: “[Interviewer: When do you feel that a food product is expensive?]It’sthepriceperkilo.Youcomparethepricetohowmuchyou’regoingtogetwhenyoucompareittoanotherproduct”(F8).
83
One of the subjects said: “Youcan’tbargainwithfood!” (M9), expressing a low interest in food prices and food sales. A low interest did not mean that subjects did not notice food prices, but price differences did not make them change their routine behaviour, as another subject said:“YesIrememberpricesbecauseIalwayscheckthemevenifitdoesnothaveanymeaning”(M10). A low interest in food prices could be related to food as a necessity, as one of the subjects pointed out: “IfIwantsomefoodIbuyitwhateveritcosts.Ihavefriendsrunningaftersalesbragginghowmuchtheyhavesaved,butI’mnotlikethat.IdowhatIdo,paywhatitcosts;foodmustbeboughtanyway.”(F9). Low interest was also related to familiarity with certain foods and habit: “Inourfamilytheboysdecidewhattheyeat…ifIdon’tknowaboutafoodImaydecidebasedonprice,butItrustearlierexperiencemore.Ibuythefoodthechildrenusuallyeat.” (F21).
Even though subjects compared prices, they said that the price was not a primary reason for a product choice. It had a secondary nature. It was used as a cue if there were similar products to be chosen or there was no prior experience of the product: “[I buy] somebrandwhichwehaveusedbefore.IusuallybuyFinnishevenwithketchupIdon’tliketobuyimported…ifIdon’tknowtheproductmaybethenIgoontheprice.ButIdon’ttrustthat,Itrustexperience.Ifyou’veusedit thenyouknowwhat it’s like.”(F21). According to Webber et al. (2010, 300), subjects remarked that even though prices are important there are other factors which affect the food shopping. In their study, the relationship with the shop environment and the shop’s employees was important, dimensions of which were not expressed by respondents in our study.
The content of the shopping basket had an effect on buying behaviour. According to the data, subjects categorized food products into primary and secondary products. Primary food products were basic products used every day like milk, butter, bread, cheese etc. Secondary products were foods consumed occasionally like chicken, oranges, or potato crisps. Shopping for primary food products was mainly an automatic procedure and it was based on “stock out” situation at home. Similarly, in the study of Webber et al. (2010, 300) subjects divided food items to essential foods and other foods, and the influence of price was related to the importance of the food item in this selection.
Many of the subjects mentioned that they often had a similar shopping tour when they visited their local store. They stopped at the same shelves in the same order picking up the primary food products. They also filled up the basket with secondary food products based on planning but also based on desires or impulses. The number of secondary products was connected with the number of primary products. Some of the subjects mentioned that they had an imaginary budget for a shopping basket, meaning that they had a “feeling” about what would be a reasonable total cost. If the basket was full of primary products there was no room for secondary products, as one of the subjects remarked: “ThewayIthinkisthatthis [shopping basket]isgoingtobetooexpensiveandit’sabovemylimitandthencomes

84
thereaction:‘Hey-it’stoomuch!’IrememberlasttimeIputthegrapesback.”(F15.) This kind of budget thinking was mentioned more often by subjects who had money pressures but it was also familiar to other subjects, especially males. Similarly, Webber et al. (2010, 300) showed that families with limited food budgets were forced to prioritized their food expenditures.
Some of the subjects said that they were ready to save money on foods in order to buy something more enjoyable (clothes, trips, hobbies, entertainment). For other subjects good food was considered one of the joys of life and they were ready to invest time and money in it. However, one could save on food costs without decreasing the quality of the food: “[Interviewer: So, you like to save on food expenses?]Yes,Ido.Ihaveafinedinnerset,whichI’vecollected.It’squiteexpensive.IbuythecheapestjointofmeatandIcanmakegoodsteaksoutofit.Idon’thavetobuysirloinforthat.And,Idon’tvisitatthesupermarketsveryoften.”(F21).
Subjects were asked what they would do if the prices of food increased a lot. Some of them assumed that they would save money from other cost categories (clothes, trips) and there would be no change in food-buying behaviour. Some of them said that they would probably buy food more carefully and omit the luxuries. Some of them said that they would be more careful with the “best before date” and nothing should be wasted. If the prices were lowered and they had more money to spend, some of them assumed that money could be saved for other purposes (trips, a new apartment, a summer cottage). Some of them said that they would be able to buy more expensive food products (roasts, sirloin), they could be able to buy food without considering the price, or they would be able to dine out more often.
Food quality and an involvement with food
Subjects expressed their relations to food in different ways. A low interest in food was expressed by those who saw food as mainly a necessity. The subjects with low food involvement did not mention a need to indulge themselves with food. They were interested in convenience (easy and fast) in preparing the food. However, some of these subjects were interested in testing new flavours of a product or totally new products if these products caught their eye during the quick shopping process. Highly involved subjects said, for example, “Iamagreatgourmet”(M9), “Ilikegoodfood”(M6) or “Idon’twanttosaveonfoodexpenses,greatfoodisapoorman’sluxury”(M11). They were not interested in saving on food costs. However, this did not mean that these persons were uninterested in food prices. With these subjects and for many others taste was more important than price as long as the price was acceptable.
The quality of the food was fluently discussed in relation to price. Issues could be categorized mainly concerning taste and trust. Differences in taste were decisive reasons why one product

85
was selected over another within the product category. If the difference in taste or in other quality features was not observable or great enough, the price became a more important factor, as one of the subjects said: “…ifIcan’tnoticeadifferenceintastewhyshouldIpaymore”(F11). Four of the subjects, professionals within the food service industry, concluded that they compared prices because it was often related to the nutritional value of the food: low price meant low nutritional value. They also admitted that a buyer needs some expertise in food ingredients and nutrition in order to get the best nutritional value for money.
Buying did not always occur according to the buyers’ taste preferences but might follow the preferences of other members of the family. Some female subjects pointed out that the other members of the family, a spouse or the children or both, were choosy about taste and the selection of food products was quite limited. This was supported by two younger subjects who claimed that they decided what the flavour of the yoghurt was or the brand of the bread, and mothers bought the products that other members of the family would like. Some of them reported that children in particular did not prefer to change food products which they were used to consuming:“Forthechildrenitmustbethatsamecheese,Ifinditsodull,butitismildforthem,soIalwaysbuythesame”(F9). Buying food which children did not like was considered a waste of money.Similarly, Stratton and Bromley (1999) investigated the importance of the family in food choice. Mothers had the strongest influence on family food choice, but mothers were influenced by other members of the family. The main worry of the family was to provide food that children would be willing to eat and eat enough of. Health issues in foods are often related to children, thus food buyers might demand high nutritional quality for their children’s sake (Webber et al. 2010, 300).
Quality was also related to trust. The quality of food was considered high and reliable in Finland. Some of the subjects even remarked that everything they sell in food shops in Finland is of good quality. They were confident that food chains in Finland were so closely supervised by the authorities (e.g., production, manufacturing, import, customs, retail selling) that they did not need to worry about the quality. Furthermore, many of the subjects relied on rules related to advertising and they trusted the information on the food packages: “Youcan’tsayanythingwhichisnottrueonthepackageorinanad,canyou?Ofcourse,someoftheproducersmaytrytofindawaytoevadethelaw,butstill.” (M1).
If a food product was produced in Finland it was considered purer and safer (meat products), more tasty and included less preservatives (fresh vegetables), or more suitable to Finnish taste (cheese, sausages, bread) than a similar product imported from other countries. Buying Finnish food products was important to 23 subjects, the others being indifferent. Some of the subjects considered it important to buy Finnish food products because they wanted to support Finnish employment and agriculture. During the winter Finnish vegetables were more expensive than imported products. Even then, some of the subjects expressed their willingness to buy Finnish tomatoes or cucumbers because of the better taste.

86
When subjects discussed sales and discounts of durables they expressed their suspicions about quality. With food products they seemed to trust the quality of the food even at extremely low prices. Their only concerns were related to the best-before-date or the country of origin: “It [a food product]canneverbetoocheap[laughter]evenifitcostsonlyamark[~0.17 €].Okay,Iwouldcheckthedatetoseeifthereissomethingwrongwithit,butthen,Iwouldbuyit–itwouldbeabargain.”(M1).
According to Urbany and Bearden (1997), a transaction utility is more important than an acquisition utility if the quality is trusted. The acquisition utility means that quality received is compared to price given up (called the acquisition value or product value by Monroe 2003). The transaction utility means that the actual price paid is compared to expected price (called the value of the deal by Monroe 2003). If the actual price is lower than the expected price and the expected quality is clear there are no doubts about the product. These subjects said that they put serious trust in the Finnish food chain system: “Youcouldsaythatonereliesuponthebiggersupermarketsothatwhenyouvisitthereyoudon’thavetocheckpricesandyoubuyeverythingfromthere.Theyarebettersupervisedthesefoodproducts.” (M10). Further, Urbany and Bearden (1997) argued that acquisition utility becomes a dominant in choice situations in which the quality is uncertain and consumers compare what they give (price) to what they get (product quality). In our study subjects said that they compared prices when they had to choose a quite new product within unfamiliar food category. Some of the subjects read the package information (ingredients or country of origin) in order to decide what to choose, as was the case with strawberry jam: “IwantedtoknowwhichoneIampayingfor,forstrawberriesorforsugarandwater” (M9). With unfamiliar products a price might be used as if it was an only cue available as one of the subjects explained: “Ifyoudon’tknowtheproductsthenyoujustlookatthepricesandthink:‘thiscoststhismuchandthatcoststhatmuch’,butprobablyIwon’ttakethecheapest,Itakesomethinginthemiddle,sothattherewon’tbeagreatloss.” (F14).This suggests that loss aversion and risk aversion (Tversky and Kahneman 1986, Wicker and Hamman 1995; Thaler 1999) may exist in food choice situations when a product is new and therefore the experienced quality is uncertain.
Subjects reported second thoughts and disappointments with durables if low quality was experienced. In this case a sense of being cheated and money being wasted was felt. With a low food price the risk of “making a bad choice” was very small, especially with familiar products. If the subject perceived the price as expensive and was disappointed, a strong negative feeling of dissatisfaction would be experienced: “Icecream!OnceIboughtsomenewbrandwithafinepackage.Ithoughtthismustbegood.Itcost29Marks[4.88 €],thattinylittlepackage.IdecidedthatIwouldneverbuyitagain,itwassickly-sweet.Youcangetgoodicecreamwith11.90Marks [2.00 €],…,IwassodisappointedwhenIateit.”(F9).

87
Prestige sensitivity
One of the subjects said that on weekends they entertained dinner guests with premium-priced food. Some other subjects confirmed this kind of behaviour, explaining that it is expensive to entertain dinner guests because you have to offer high-priced food to them. “Ifyouhaveguestscomingandyouthinktomakesautéedreindeer,youhavetocalculatehowmuchit’sgoingtocost.Ifitisfortenpersons,well,itisnotacheapmeal.”[Interviewer: When do you find an ingredient too expensive?]“IfIneedsomethingI’llbuyit,itdependsonwhatI’moffering.Youcan’tofferporridge,canyou?”(F18).
One of the subjects considered that by buying higher-priced health products she was investing in health and she felt good about it. Four of the subjects mentioned that they tried to buy naturally-produced food products if they were available and if they could afford to these products. Supporting environmentally-friendly products made them feel good about themselves. It did not mater even if they had money pressures and naturally-produced food products were more expensive than mass-produced products, as one of the subjects remarked: “I was shopping yesterday and I consideredwhether to buy organiceggs,butIhadsolittlemoneythatIdidnotdaretodothat,soIboughtfree-rangeeggsinstead.Theywerestillbetterthannormalones,butstillIthoughtthatIshouldhaveboughtthoseorganiceggsjustbecauseIhadsolittlemoney.”(F12). It may seem that for some people the greater the sacrifice in a good cause the greater the pleasure. Moreover, this behaviour reveals the subject’s tendency to compromise with choices and trying to avoid the least favourable choice “the normal ones” (similarly reported by Webber et al. 2010, 300). Also, an appreciation was given to organic food producers: “[Interviewer: Do you buy organic food because of the good quality?] Ithinkbecausetheyarenaturallyproduced.Thepointisthatpeoplewhostarttoproduceorganicfoodknowtheirresponsibilityandinmyopinionprobablybiodynamicproductsareevenbetterqualitybecausetherethepersonalresponsibilityisevenmorevisible.”(F5).
According to Lichtenstein et al. (1993, 236) a person may perceive high prices positively because buying a premium-priced product he or she signals high status to other persons. Authors define this kind of behaviour as prestigesensitivity.According to Rege (2008), there might be two different motives to signal high social status with the status goods (e.g., well-known luxury brands such as Rolex watches, BMW cars, etc.): 1) a need to signal wealth (how rich I am) or 2) a need to signal ability (how competent I am). This data did not detect clearly such behaviour in the food context. Subjects with a high involvement in foods enjoyed good food, bought high-quality products, or were willing to invest in health, environmental or ethical issues. However, they did not necessarily wish to gain appreciation from others. Some of the subjects enjoyed entertaining dinner guests with premium-priced foods, and thus this kind of behaviour could be interpreted as willingness to signal a high status to others. Thus, a motive might be the willingness to signal wealth or the high competence of

88
a host or a hostess. Alternatively, it might be due to the cultural norms of hospitality or the motive of indulging others with high quality food.
3.2.3 Price perceptions of functional food products
Some of the subjects were familiar with the functional food category. They were able to distinguish between a normal healthy food (low-fat milk or whole grain bread) and products which were modified to have a special health effect (a cholesterol-lowering spread, yoghurt with probiotics), but for most of the subjects this product category was somewhat unclear. Usually subjects considered all products marketed as healthy (low in fat, low in sugar, sugar free, high in fibre etc.) to be functional. Nevertheless, most subjects perceived healthy products to be expensive, even though they were not in the habit of buying them. One of the subjects remarked that even though functional food products are premium-priced products the price per recommended daily intake was not high. She was a professional health care worker and she regarded these products as important tools to get people started in taking care of their health.
Most of the subjects had reservations about the reliability of the health claims and they wondered whether the functional products only benefited manufactures. On the other hand, some of the subjects trusted the information related to these products (Table 4).
Table 4. Total of 144 comments relating to functional foods.
category comments freq.
Reliability (40) - Functional food products are a cheat 10
- It’s pure business, overcharging 9
- It’s the latest craze in the food business 6
+ Functional food products are trustworthy 11
+ Functional food products are safe 4
Normal healthy diet (40) + Eating normal healthy food is the best way to prevent or cure health problems
25
- An easy solution if one is not willing to change one’s wrong eating habits
15
Credibility (25) - Can’t perceive the effect. 8
- I don’t believe it works. 17
Need (21) +/- If you don’t have a problem you don’t need them.
21
Unnatural (14) - Unnatural or technical products 14
Taste (4) - Functional food taste bad 4

89
With these subjects a normal healthy diet (vegetables, fruits, whole grain bread, avoiding fat) was the best solution to any health problem. Some of the subjects thought that functional food products would help if a person was unable or unwilling to change bad habits. Some of the subjects had doubts whether functional products really functioned as the claims implied.
After the general discussion about functional food products, three functional food products were shown one at a time. First subjects were asked whether they were familiar with the product, then they were asked to evaluate the price of the product. After the actual price was told they were asked to evaluate whether they considered the price too expensive, expensive, somewhat expensive, cheap, or too cheap. They were also asked to explain their evaluations. Not all subjects were willing to evaluate the price. The most common reason for refusing to give any opinion was unfamiliarity with the product or unwillingness to use such product.
Interestingly, several viewpoints raised by the data related to perceptions of expensiveness. Some of the subjects wanted it clarified whether they should consider the price in relation to other similar products (price knowledge) or in relation to their willingness to buy the product for their own use. One of the male subjects emphasized several times that expensiveness does not mean that he was unable to afford it, rather, he was not willing to buy it. The expensiveness of the functional product was considered, on the one hand, based on personal need and, on the other hand, based on the trustworthiness of the product:“[Pro-Active spread]It’sexpensive.Iwouldn’tbuyitbecauseIdon’thaveaproblem,tomeit’stooexpensivebutifIhad[a health problem]Iwouldtrytofixitfirstwiththisratherthanwithmedicine.Iwouldstillconsideritexpensive,butnottooexpensiveanymore”(F10).
Results revealed that subjects used a great variety of different kinds of references in making price judgements. Price perceptions were related to familiarity with the product and the price knowledge. One of the subjects evaluated all prices much higher than the actual prices and therefore perceived all actual prices as cheap. Many of the subjects tried to remember prices of the similar products without health claims or the price of their favourite brand. Some of the subjects tried to compare the price with the prices of other speciality products (organic products, low in lactose yoghurt) (see Table 5).

90
Table 5. Price perceptions about the functional food products shown during the interview.
price perception Linobene meal with fibre
~2.20 € (+0%)
number of subjects
Gefilus yoghurt 2.0 dl
~0.60 € (+100%)
number of subjects
Pro-Active spread 250 g
~3.50 € (+300%)
number of subjects
too expensive 2 3 14
expensive 3 10 6
somewhat expensive 12 7 7
fair price 0 1 0
cheap 7 5 2
total of subjects 24 26 29
Reference points: price of the ingredients
similar product without a health effect
own favourite
meal made at home own favourite medicine
contents previous buy similar product without health effect
how filling the meal is novelty value of health effect
lunch at a restaurant health effect butter
meal at the university low in lactose distrust of health claim
previous buy distrust of health claim Benecol spread
bad taste package size need for a health effect
other ready-made meals
technicality organic food
price per kg need for a health effect
better to use no spreads
other sources of fibre good taste speciality
unfamiliarity regular use package size
no difference in price feels cheap
objectionable ingredient
Price evaluations behind Linobene meal were mostly related to value and tradeoffs between “give” and “get” components or other alternatives to a meal (e.g., eating something else for a lunch). Gefilus yoghurt (including Lactobacillus GG) was perceived to be at least somewhat expensive for most subjects. Most of them compared the informed price to their price of the
91
favourite yoghurt without a health claim. Expensiveness was reasoned by unnecessary health benefit and they were not willing to pay for it. The Pro-Active spread was most frequently considered to be too expensive, although, some of the subjects were able to compare the price to the health effect. Two subjects considered the price as cheap given that the product could help with high cholesterol and thus medication would not be needed.
Many of the subjects wondered whether the health claims would lose credibility if the price was lower. However, some of the subjects considered it unfair or immoral to charge such high prices from people with health worries. A high price could be perceived as a signal of cheating: “Inmyopinionitwouldbemuchmorecredibleifithadalowerprice,becauseahighpricefeelslikecheating.Youknow,ifitwascheaperthegovernmentwouldhavesupportedthemanufactures.Thishighpricetellspeoplethattheseproductsarenotsupportedandthereforetheyarenotnecessarilyanyuse.Thisproducthasn’tbeenagreatsuccess,hasit?”(M1).
3.2.4 Qualitative statements and domains related to price perception
In the structural part of the interviews, seven qualitative attitude statements of price perception domains based on Lichtenstein et al. (1993) were asked for. The aim was to discover whether these domains were relevant to Finnish consumers, and therefore should be included in the Food Price Attitude Scale. Subjects considered statements as too categorical. The most frequently given reply was “itdependsontheproduct”. Subjects clarified their opinions by bringing up product examples. Sometimes they used a food product as an example of an opposite opinion to some durable product.
A statement of the coupon proneness presented in this study was “Gettingdiscountwithcouponsisagoodandclearpractise.Iwouldliketousemoreofthem”. According to the data, coupon proneness would not appear to be important to these subjects when they are buying food. Within the food sector (food retailers or food manufacturers) giving product discounts by using coupons is not common in Finland. Only three of the subjects admitted that they have used coupons related to fast food services or some special offer of a durable commodity. Five of the subjects expressed a positive attitude even if they had not redeemed any coupons or were unwilling to use them. Most of the subjects disliked coupons and said that they ignored them even if they were available. “Ihaveneverusedanycoupons,andIdon’tsupportthem,thatis,Idon’tliketocutoutpiecesofpaper.IknowtheyexistandIhavesometimesfeltthat‘okIcouldtakethat’butI’veneverbeenreallybothered” (M9). Surprisingly, all of the female subjects expressed dislike or found coupons inconvenient: “[laughing] Idon’tthinkthatanybodylikescoupons,Idon’tthinkthereareanyorIjustdon’tnoticethem” (F12); “IhatecouponsbecauseifIseethemintheadsIdon’tcutthemout

92
immediatelyandifIdo,IforgotthemathomeandthenIgetannoyed.Imeanthat[cutting out coupons]isarottenjob” (F11).
According to Meng and Nasco (2009), the price perception measurements introduced by Lichtenstein et al. (1993) have been used in modified forms. Jin and Sternquist (2003) and Sternquist et al. (2004) also excluded coupon proneness in their studies because Korean and Chinese consumers seldom use coupons. Similarly, the domain of pricemavenism was excluded in the study of Zhou and Nakamoto (2001).
In this study a statement of the price mavenism presented to the subjects was: “I enjoydiscussing with my friends prices and where to shop to get the best buy”.With pricemavenism Lichtenstein et al. (1993) meant person’s willingness to inform others of low prices or good bargains. According to data, most subjects did not discuss food prices with their friends at all. They reported that food prices were too trivial an issue to be discussed. However, prices or bargains concerning electronics, computer parts, musical instruments, baby clothes, shoes or other durable commodities were discussed. Even the price of petrol was frequently discussed with persons who had similar interests. “Yes sometimes, say,notfood,butelectronicscouldbethatkindofissue[one might discuss],notfoodprices”(M12).“Iusuallytalkaboutwhereyoucangetthingsbutnotusuallytheprice.Orusuallyforclothesand,ohyes,infactifsomeonehasfoundsomethingshesays‘it’sworthgoingthere,it’scheaperthantheother’,butnotforfood…forrestaurantfood,yes…”(F7). Only one of the subjects was willing to inform others and was happy if she was informed about a good food bargains. She was also interested in shopping in different stores in order to buy food as cheaply as possible: “Ohyes,itfeelsgoodtohavefriendswhosay:‘Listen,I’vejustcomefromthereandthepricesweresoreasonable!’IfinditverynicetohavesuchtipsandIgivethemtoo.I’llsay:‘Iboughtfromthereanditwassocheapandsuchgoodquality.”(F24). This subject supported the domain of price mavenism to exist even within the food context.
In this study, a statement of price consciousness presented to the subjects was: “Thelowprice in products is important tome and I amwilling to use time and effort to find thelowestprice”.Price consciousness was a typical domain in which subjects brought up the difference between foods and durables. With big investments subjects were more willing to put some effort into getting something as cheaply as possible, but with food it was different. Food products cost less than durables and the price differences between food products were considered small: “Doesthismeanhigh-orlow-pricedproducts,Imeanarewediscussingaboutthousandsortens? [Interviewer: in which case it means something to you?] Wellsure,ifI’mbuyingacarI’lltrytofindthecheapestplacetobuyitandI’mreadytoputagreatdealofeffortintoit.Withsmallsumsitdoesn’tmakemuchsense.Ifit’sasmallyoghurtI’mnotgoingtoadifferentstoretogetitfor5Marks[0.84 €]ifitis6Marks[1.01 €]inanotherstore,I’mnotgoingtorunaroundforthesakeofoneMark[0.17 €].”(M1).

93
In this study, a qualitative statement of quality-price schema presented to the subjects was:“Thepriceoftheproductisagoodsignofthequality.Youcan’tgetagoodproductwithalowprice”.According to Lichtenstein et al. (1993), the quality-price schema means that a person is willing to pay a higher price for a higher quality. Subjects were unwilling to accept the claim that you cannot get good products at low prices. Some subjects reported their suspicions about premium-priced brands and regarded them as overcharging. Durables were usually mentioned as examples in this domain because durables were expected to last for a long time, and therefore the quality was related to the product’s durability. Some of the subjects felt that food products could be of good quality even at a low price:“Itdependsalotabouttheproduct.Let’ssaythatinthematteroffoodyoucangetgoodqualityatalowprice.Butwithdurables,likeelectronics,bicycles,roller-skaters,youjustcan’tgetgoodqualitywithlowprice.That’snotthecasewithalltheproductsbutitiswithmanyofthem.”(M9).
In this study, a qualitative statement of prestige sensitivity presented to the subjects was: “Themost expensive brand is the best product. I appreciate thosewho buy high-pricedbrands”.According to Lichtenstein at al. (1993) prestige sensitivity means that a person buys high priced brands to signal a high social status to others. In this study, it was assumed that there might well be some hesitation in admitting to the need to show or gain higher social status by buying high-priced products, therefore the statement posed concerned others’ behaviour. Subjects connected this statement to durables such as cars, clothes, shoes, and watches, but no food brand was mentioned. This is in accordance with previous research related to social status and the existence of status goods such as international luxury brands (Armani suits, Rolex watches, e.g., Rege 2008, 234). However, in this study, one subject agreed that organic food was the best purchase and she appreciated persons buying these food products. All subjects disagreed with a statement related to prestige applied to another person relating to products used. It was unsuitable to “showoffwithmoneylikethat” and one cannot evaluate another person based on the products she or he buys. However, a few young men thought it is “okay” to buy the most expensive products such cars or watches if one could afford them, and also it was “okay” to flaunt them. This is in accordance with the previous research related to the motive of signalling wealth by means of status goods (Rege 2008, 240). Perhaps the high appreciation given to the organic foods was related to the motive of making ethical choices and signalling ethical status. No-one (excluding one person who bought organic food products) believed that the premium-priced products would automatically be the best buy: “Well,Idon’tthinkthatpremium-pricedproductwouldbethebest.ImeanitisnotnecessarilythecaseandIdon’tappreciateotherpeoplebasedonwhattheybuy.Thisisnotmykindofthinking.” (F16).
In this study, a statement of value consciousness was presented to the subjects in the following way: “Althoughthelowpriceisimportant,thequalityoftheproductisequallyimportant.Iwanttogetafullvalueformymoney”.This statement seemed to be accepted at the general

94
level: “Well,yes,thereisthepointthatyoufeelthatyou’vemadeagood [deal],oryoufeel,well,notcheated,thatyougetwhatyoupayfor.” (F5). However, value consciousness did not generate much discussion or many explanations: “Itmakessensetome,yesitismykindofthinking,butitdependsontheproductandwhatthatmeanstomeandtheprice” (M7).
In this study, a statement of sale proneness was presented to the subjects in the following way: “Whenbuyingatsales,IbelieveI’mgettingagooddeal”.This statement was considered in the two different situations. Buying at sales was accepted if you really needed a product and you got it cheaper at the sales. If a product was bought just because it was at sales, subjects admitted that they usually had second thoughts or regrets. Women more than men admitted they made unnecessary purchases at sales. In the food context, the subjects sometimes used point-of-purchase discount information as inspiration for meal ideas. Food ads were usually read in advance if a subject was looking for ideas for a dinner, but not when choosing the place of purchase. However, there were a few subjects looking for food bargains. Second thoughts or regrets were seldom related to food products bought sales as it happened with other commodities. Even if the products were disliked serious regrets hardly ever occurred because the price of that product was usually quite small, at least less than it would have been normally.
The results of the qualitative statements revealed that the domains of the Price Perception Scale (Lichtenstein et al. 1993) were discussed differently depending on what product the subject was considering. All subjects were eager to find product samples in order to clarify their thoughts. Quite often they compared durables to food products and described the difference between them. Subjects were not in the habit of using coupons at all and they expressed discomfort related to coupons (coupon proneness). Food prices were not usually discussed with friends; thus the information of cheap food prices was not delivered to others (pricemavenism). The importance of searching for low price (priceconsciousness) or feeling good about buying at sale prices (saleproneness) was related to big “investments” and to durables. The importance of value (valueconsciousness) was expressed in general level applying to all kinds of products and purchase situations. Price as a cue for product quality (price-qualityschema) was connected mainly to durables, and prestige sensitivity was quite often related to luxury goods (watches, cars). All subjects disagreed with the statement that low-priced products cannot be good quality and usually a food example was given. Because one elderly person behaved in a more price conscious and price maven way than the others, four supplementary interviews among senior citizens were held in January 2002. Discussions with these new subjects confirmed that price mavenism is perhaps not related to age or being a pensioner. These new subjects did not inform others about food bargains or discuss food prices with friends any more than younger subjects of this study.

95
3.3 Theoretical conclusions of the qualitative results
There were three main levels of discussions related to price: the person level (how interested subjects were in prices), the product level (how interested subjects were in foods) and the food shopping level (how subjects experienced food shopping). According to this data food was considered to be different in the purchasing situation than other commodities for several reasons: the relatively small monetary sacrifice, food is a necessity, food shopping is an obligation, a taste in foods is a dominant attribute, and the basic quality of foods in Finland is trusted. Moreover, opinions related to food prices in general could be different from opinions related to certain food products. Furthermore, opinions could be product specific even within the food categories. Some of the subjects found it difficult to explain their behaviour during the discussions because they did not think consciously about shopping for food or selecting the products in everyday life. The results of this qualitative approach emphasized the complexity of the food purchase situation which may be partly automatic or unconscious by nature, being based on past experiences and habits. At least, if food products were accepted to daily use, these choices were not reflected upon afterwards. A food choice activated cognitive reasoning if products were unfamiliar to the subject or large price differences (e.g., between food shops) were detected. This is supported by psychological studies related to habitual behaviour and cognitive reasoning (Oulette and Wood 1998), price knowledge and memory processing (Jacoby and Olson 1977; Monroe and Lee 1999) and food-related studies (e.g., Honkanen et al. 2005, Hamlin 2010). In terms of functional foods, price perceptions (reasons behind perceived cheapness or expensiveness) were made with a large repertoire of features as reference points. Apart from the reference price, other product attributes were involved, including value functions, the personal relevance of the health claim, and even feelings of fairness and other emotions. It is evident, based on the results, that any theoretical research related to price and price perceptions can only uncover small insights into this empirical process. A reference point is important in order to make evaluations, yet, according to this data, it is not always some other price in the memory of a consumer (internal reference price) or other prices experienced in the environment (external reference price) against which the observed price is compared to.
Food choice behaviour could be seen as irrational behaviour as one of the subjects said when she explained why she refused to buy peppers at a perceived high price even though the price per kilo of a chocolate bar was higher: “Ithasnothingtodowithcommonsenseifyoubuyachocolatebarandnotthathealthypepper.Itdoesn’tmakeanysense.It’sanintuition-likefeelingthatIhaveayenforthis[chocolate]more” (F14). This data challenges us to take deeper look at this kind of irrationality. A choice of chocolate may be rational in terms of a hedonistic craving for chocolate. The subject may even have a physiological need for it. However, her statement reveals that this subject did not accept her hedonism as rational behaviour when she reflected about it. The definition of rationality by economists

96
(the maximizing of utility and state of wealth) is not perhaps the most relevant and sufficient one in terms of food choice behaviour (see also Arcidiacono (2011) for rationality from a multidisciplinary perspective). However, it might be the economic norm which consumers have internalized and are trying to obey when thinking about their purchase behaviour. According to Elliot (1998, 103), post-hoc rationalization occurs especially if choices are made according to emotions, and cognitive reasoning is needed in order to avoid feelings of regret or guilt. Similarly, Zajonc and Markus (1982) argued that consumers tend to give reasoned answers because they know that they should behave rationally even if they do not behave in that way.
According to these subjects, rationality in food purchase behaviour can have multidimensional meanings. For an understanding of the role of price and food purchase behaviour, it is beneficial to distinguish rationality from intuition and reasoning. It seems that emotional or other intuition-based choices were considered irrational and perhaps therefore intuitions were often ignored. However, according to Kahneman (2003, 699-710), intuitions occur with ease and automatically, whereas reasoning demands more processing, and the process is controlled and slow. Thus, people are content with easily retrieved intuitions. Most subjects said that they thought only a little or not at all in making habitual food choices. If subjects expressed a comment like “buyingfoodmorerationally” they meant that they should make food purchases more consciously, planning in advance what they would prepare for meals, avoiding intuition-based hedonistic choices, preparing meals from basic ingredients, being careful of the quantities consumed, and avoiding wasting food. This kind of behaviour can be related to maximizing utility (saving on food expenses), even though it is not related to a tendency to buy food at the lowest possible price. Rationality is perhaps not always related to the price of the single food product, yet it is probably related to food expenses as a whole. The tendency to make intuition-based choices and give reasoned-based answers in the research situation can introduce some bias into the responses.
The theoretical features discovered in the data are summarized in Figure 12. This data suggests that attitudinal opinions related to food prices are influenced by differences in food involvement and the way subjects controlled the money spent on food perhaps using mental accounting systems. Attitudinal opinions towards high food prices were related to external reasons such as the supply situation, the monetary situation or time constraints. Other external features related to low food prices were also discovered from the data, such as supporting domestic agriculture or employment. Subjects, moreover, explained their price perceptions by referring internal reasons: how they perceived quality in foods, ethical norms or beliefs, or how sensitive they were towards food prices. Special quality features such as a high degree of liking or ethical aspects in foods created the experience of high value for some subjects even at high prices or just because of them. However, the lowest possible food prices produced similar value experience for others if subjects were highly price sensitive.

97
The comment that a good deal means feeling of “notcheated” reveals that value perceptions can be connected with emotions (supported by neurobiological findings of Weber et al. 2007 and Maxwell 2008) and are perhaps more abstract than just calculating sacrifices against the benefits (supported by Zeithaml 1988).
Figure 12. Features emerging from the qualitative data relating to attitudinal opinions of food prices.
The role of price varied in different situations, with different products or product categories and in relation to other attributes (e.g., taste and other quality features, familiarity, information). Subjects with different degrees of involvement in food discussed quality and value issues related to food in different ways. Subjects with a high involvement in food, for example, were eager to buy the luxury food products and they were less eager to save on
Internal reasons or affective
feelings
Quality perceptions
Prestige sensitivity or ethical reasons
Income or disposable assets
ConvenienceTime constraintsSupply
situation etc.
Food Involvement
Control of behaviour: cognitive reasoning (justifications, post-hoc rationality) and mental accounting,
Price sensitivity
The food price attitude (positive or negative attitudes
towards food prices)External reasons

98
food expenses. However, price seemed to have a secondary role in the food choice situations of both low-involved and high-involved subjects. Even though the price of food was considered important, it seldom had a primary effect on food choice (supported by Chocarro et al. 2009). On the one hand, a lack of experience or other knowledge of the product could augment the importance of the price in the choice situation (difficulttocompareeffect by Nagle and Holden 995, 77-94). On the other hand, if the products were close substitutes (e.g., no taste differences could be detected) subjects were sensitive to price, as has been reported by Nagle and Holden (perceivedsubstituteeffect, 1995, 77-94).
Food prices were considered important because food costs were a major part of the household budget. Subjects were aware how much they were spending on food, how much “a food basket” should cost, and they had upper limits on how much food products should cost. They controlled and kept mentally track on their food expenses at the product level, at the shopping level, on a monthly basis, and at income level.
Mental accounts for food
The amount of money paid for a single food product is quite small, and for this reason, the food prices were not considered of great interest to many subjects. However, if food prices were discussed at the budget level (how much money was spent on food monthly) the importance of food prices raised considerably. Data suggests that food prices are interesting, but the price of a single food item is not. According to Thaler (1999, 194), “manysmall,routineexpensesarenotbooked.” Consumers might have a tendency to ignore small costs and purchases. Subjects seldom perceived a single food item as expensive or tooexpensive, but in relation to quantity a single food product could be too expensive, for example, how much of a product the subject was getting for a certain amount of money or how many other products were in the shopping basket. Total costs of the food basket were controlled and mentally calculated during shopping. Some ingredients (e.g., grapes) were returned if a shopping basket was above the limit. Nevertheless, a high price was accepted if the price could be justified. One of the subjects said that premium-priced functional food products were expensive but the price of the recommended daily intake was not. One could reduce the pain of a large sacrifice by reasoning or dividing it to smaller amounts so that it does not appear to cost so much.
Even though only one of the subjects kept an account of food expenses, others tracked food costs mentally. Many of the subjects had an imaginary budget for their total purchases and they kept this in mind while shopping. It seemed that these consumers had different kinds of mental budgets with different time periods for different product categories, and these budgets had limits as discovered by Heath and Soll (1996). In their study, students made weekly food and entertainment budgets, but monthly clothing budgets. Some subjects in this study said that if prices of foods increased, they would decrease the consumption

99
of other product categories (e.g., clothes) because food had to be bought anyway. Some of them would balance the price increase within the “food account” by buying food more consciously (being more rational). Similarly, some subjects assumed that if they were able to save money from the “food account” these funds could be used in another account (e.g., housing), while other subjects would increase the food budget. There has been ongoing debate whether consumers take funds from one account (e.g., clothes) and place them in another (e.g., food) (Thaler, 1999, 194-197; Heath and Soll 1996). This data suggests that there are personal differences. Some mothers assumed they would save money on clothes in order to buy food for the family if the food prices soared. Some subjects were unwilling to juggle with different accounts: “IthinkthatwithclothesIsay‘Oh,howexpensive,Iwon’ttakethat’,butfoodisanecessity.Youhavetobuyfood,andsoIstartskimpingonclotheseventhoughIcouldsavemoneybybuyingfoodmorerationallyandthenIcouldaffordtobuymoreclothes.” (F10).
According to Heath and Soll (1996), people might prefer to use hedonic positioning and replace the overconsumed expenses to other accounts. Some subjects explained that even with monetary pressures they were willing to pay for expensive good quality food and enjoy themselves (e.g., “goodfoodis a poorman’sluxury”). This kind of willingness to pay premium prices even money is short can possibly be explained if the daily food products are placed in the “food account” and the costs of luxury food are assigned to the “entertainment account”, especially if other forms of entertainment costs (e.g., theatre tickets, concerts, DVD movies) are minimized. Many subjects described how they separated primary food products (food products used every day) from secondary or additional products (products used occasionally). The shopping basket was constructed first with primary foods and then filled up with additional items if the shopping basket budget was not exceeded. Even within the food account there can be different categories, as one of the subjects pointed out: “I‘mnotexcessivewithmoney,andifIsavemoneyinbuyingtomatoesthenIcanbuyachocolatebar,forexample,andinprincipleIfeelthatIhaveearnedit.”(F4).
Mental accounts can offer an interesting explanation concerning differences in accepting premium-priced functional food products. Food products with health claims that they lower cholesterol could be seen as a medicine. Should this be placed to the food account or the medicine account? This data revealed that subjects who valued and accepted the health claim of Pro-Active spread perceived it as less expensive if compared to medicines (possibly comparing it with a medicine expense and perhaps placing it in a medicine account). However, automatic mental accounting is probably not easy to change. Foods are generally placed in the food account and medicines bought from pharmacies in the medicine account, as one of the subjects pointed out: “Ifit’samedicineitshouldn’tbeavailableatthefoodshops” (M1). Overall, people are in the habit of evaluating the seriousness of their transactions. Buying food to eat is important (more fundamental than buying clothes) but

100
curing the illness is even more important. Quite possibly for some people these transactions were not easily jointed together, functional products not being easily accepted as medicines. According to Niva (2008), linking food with medicines has been difficult to accept in the minds of Finnish consumers.
Price fairness
Overall, price fairness was strongly related to food prices in this data. Maxwell (2008) has argued that consumers’ notion of price fairness affects transactions (also Kahneman et al. 1986). If a price is perceived as unfair a person may react by shopping elsewhere, even if he or she loss in the transaction. In this data, this reaction was shown with shopping environments (e.g., price differences between stores) and with different product brands. Some subjects were annoyed by price differences between food shops and they refused to buy an expensive product if the same product was cheaper in another store. This was more a matter of principle than a monetary one.
In the case of well-known luxury brands, several comments made on premium prices and overcharging, where prices were perceived as unfair (paying for a brand name rather than the quality of the product). Premium-priced organic foods were considered fair because good ethical reasons could be given for them. Low-priced mass produced food was thought unfair on account of the possible exploitation of natural resources or labour. The prices of Finnish food were perceived as fair because it is important to support Finnish agriculture and employment. In general, premium prices need to be justified in order to be perceived as fair. An expected price is a “fair price” (Jacoby and Olson 1977; Maxwell 2008). If the perception of the observed price is higher (or lower as was a case with mass-produced food products) than expected, a negative emotional response will arise unless there is no cognitive reason to minimize the feeling of unfairness.
Price perceptions related to functional food prices provoked a wide range of judgements concerning fairness. A premium price was considered fair if the need for medication was reduced with help of these products, but only if these products were seen as reliable and the health effect was trusted. A high price was seen as unfair if the subject did not trust the health claim. A fundamental ethical question was whether it was fair to gain benefit from other peoples’ illnesses. Functional food products were assumed to be targeted at senior citizens, who were generally less well off. It was unethical for manufacturers to make money from others’ distress. Some subjects wondered whether the manufacturing of functional foods genuinely cost so much, generating high prices or whether it was simply a matter of overcharging. However, some thoughts related to high costs of product development or finer ingredients were presented. These subjects wanted an explanation for the high prices they perceived. According to Bolton et al. (2003), consumers’ knowledge of prices or seller’s profits and costs account for judgements of price fairness. However, consumers are probably

101
not always aware of all the costs or they are perhaps unwilling to take into account the market situation sellers have to deal with (see also Kahneman et al. 1986; Bechwati et al. 2009).
Quality, value and price
The question of price fairness is related to perceived value (or utility) as well as quality. In this data expectations of higher quality with a higher price were quite often connected to durables and in some cases to nutritional value of the food (e.g., a price of whole grain bread in comparison with that of white bread). However, subjects in general seemed to consider basic food ingredients cheap (and healthy) and processed foods expensive (and unhealthy). Lack of time and lack of inclination to cook forced them to make trade-offs with price and quality. Selecting higher-priced processed foods needed to be justified: saving time, saving effort, and minimizing stress (also reported by Bava et al. 2008).
Steenkamp and van Trijp (1989, 19) reported that consumers perceive quality differently and they vary in terms of quality-consciousness, and thus the more quality-conscious they are, the more willing they are to a pay premium price. In this data, moreover, some consumers were more quality conscious than others and they valued individually different quality attributes. The high price of a food item was not automatically perceived as a sign of high quality. According to some subjects, high prices were not justified if there were no differences in taste. If Finnish cucumber was considered to have a better taste than an imported one during the winter, Finnish cucumber was chosen at a higher price. However, not all subjects were able to perceive the better taste nor they were willing to pay for better taste. Willingness to pay a higher price for foods with better quality attributes varied a lot according to the importance of the food (involvement), hedonic valuations (preferences), nutritional knowledge (expertise), and perhaps also a sense of parental responsibility (the needs of children were important).
This study clearly showed that subjects did not perceive low food price to be a signal of a low food quality. It was noticeable that even extremely low-priced food products were found acceptable if the best before date was not exceeded. This became evident in general discussion but was also shown with given price judgements of functional foods. This can possibly be explained by transaction utility and trust (Thaler 1985; Tellis and Gaeth (1990; Urbany and Bearden 1997). If the quality is certain the value of the product is evaluated first and the price is less important. If the quality is uncertain quality evaluations may be inferred from the price information (see also Lambert 1972; Erickson and Johansson 1985). Subjects in this study trusted the Finnish food chains and relied on the supervision made by food authorities, and therefore the basic quality of the food was certain. The only concerns expressed were related to the best before date. Domestic food products were considered pure, tasty, trustworthy, and by clearly suitable for Finnish consumers. Even though the general

102
attitudes towards Finnish food products were favourable, not all subjects were willing to pay a high price. However, if superior quality was perceived (e.g., better taste) and valued (better taste is important), the subject was willing to pay the premium price.
These findings support the previous findings of asymmetry in quality inferences: high quality is not inferred from a high price in the same way as a high price can be inferred (and accepted) from high quality (Emery 1969; Huber and McCann 1982). Perhaps a food quality is not always inferred from the price information at all because quality has so many dimensions in foods and different food products have differences in price-quality correlations, as reported by Riez (1979). Therefore, it is possible that sometimes low price does not mean low quality nor does high price mean high quality in foods. This qualitative data suggests that basic quality in foods is related to food safety; basic quality means that food is eatable even if it is not highly liked. This basic quality in foods is unrelated to price and even low prices are perceived as acceptable. The importance of value experiences were related to special quality features such as high nutritional value, ethical issues, or hedonic preferences (e.g., a high degree of liking), and these special quality features are individually appreciated and experienced, creating differences in individuals’ willingness to pay premium price. Quality is a subjective term interpreted individually in different contexts and with different products. According to Arcidiacono (2011, 521), when consumers describe quality preferences, they are perhaps defining themselves (what kind of person he or she is) rather than actually selecting quality items. This might be true when a subject is buying an organic food product with a high price even if he or she has little money. This kind of thinking is similar with Kantz’s (1960) value-expressive function of attitudes.
Price sensitivity
According to the data, price had an important role in food choice situations, but it seemed to underlie other attributes or was embedded in value evaluations. As Kopalle et al. (2009, 61) have pointed out that examining solely price as an attribute of a product only tells a part of the story. None of the subjects said that food prices are unimportant to them, though most of them did not make a purchase decision based on price alone. The importance of the price seems to have a secondary role (supported by Steptoe et al. 1995; Eartmans et al. 2006; Chocarro et al. 2009; Pohjanheimo et al. 2010). In this study, subjects assumed that price was an important cue for making purchase decision if a new product category was in question and little product knowledge was available. If the products within the product category had already been in regular use, the past experiences were more important reasons to buy the product than price. However, there was clear evidence of differences in price sensitivity (the tendency to react to price changes and the importance of the price). In this data, some subjects were sensitive to food prices, and they were willing to use price information in making food product choices. One subject was particularly proud of her ability to be economical. Other

103
subjects were more or less unconcerned about food prices, or at least they were willing to give that kind of impression. They were unwilling to shop for different food stores in order to get something at a cheaper price (running after bargains). They were not keen on coupons and discounts. Furthermore, some of the subjects were willing to pay a premium price for hedonic (indulge oneself with good food), ethical or health reasons.
Several factors affecting price sensitivity in foods were found from the data which were similar to the general effects presented by Nagle and Holden (1997, 77-94). Those who valued the health claims of functional food products perhaps found unique value in these products and were less sensitive to prices. Theuniquevalueeffect was also found if the product was perceived as superior to other brands (e.g., children accepted only one brand). Functional food products perhaps possessed theend-benefiteffect in the minds of those subjects who believed the health claims. Where regular use of functional food products would benefit well-being, a high price was regarded as fair and justified. High prices in functional foods were not justified if they caused anexpenditureeffect, meaning that regular use of functional food products would increase overall food expenses too much. The expenditure effect could be related to food prices in general. Total food costs were perceived as expensive if they reduced available funds from other areas of living. Theperceivedsubstituteeffect occurred when no differences in taste were detected. Here a higher price was not justified and a lower price was preferred. If a product was new and the quality was uncertain, subjects admitted that they were then more conscious about price and paid more attention to the price information. According to the data, the importance of price may change in different situations. Some of the subjects were price conscious about food during the weekdays, yet during the weekends no costs were calculated and superior quality foods were enjoyed. Some of the subjects were willing to pay premium prices and go to extra efforts to entertain dinner guests even though food costs in general were otherwise held in check.
Price sensitivity may be due to the income level or disposable assets, but not for all. On the one hand, some of the subjects mentioned that they were forced to be price sensitive even with food because of a low income level or monetary pressures. Some of them said that when they had less money or money pressures they were more sensitive with food prices, but at the time of the interview they were able to buy food without considering the price. These subjects said that they had changed their behaviour. One subject reported that she had learned to be price conscious because being a single mother money was tight, and that she had not changed her behaviour, even though she no longer suffered from money pressures. On the other hand, some subjects with money pressures were not willing to skimp on food and were not particularly interested in low food prices.
The rich data emphasizes differences in consumers’ behaviour in terms of price sensitivity, quality consciousness, mental accounting and food involvement, but the data also shows that consumers may behave differently in different situations and with different products. High

104
food prices needed cognitive reasoning in order to be accepted, though food is most likely bought according to habitual tendencies. If a price was perceived as different from what was expected (higher or lower) then it evoked affective evaluations (e.g., feelings of unfairness). Some consumers valued high-priced food products (justified according to quality, taste, ethical production), expressing positive attitudes towards them. Some consumers did not. Most of the subjects valued low food prices and even very low prices in foods were accepted; thus low quality was probably not inferred from low prices if the best before date was valid. However, only a few of the subjects were eager to look for low food prices in different stores. Low prices in foods were positively appreciated because of the expenditure effect (food budgets were calculated), the perceived substitute effect (no taste or other quality differences were valued) or perhaps it was just learned behaviour. However, a low food price could be negatively appreciated an account of ethical suspicions. All these differences in opinion suggest that consumers may have both negative and positive attitudes (on some level of consciousness) towards high and low food prices. Nevertheless, preferring low food prices could be “aforcemajeure” for some people even if they do not have negative attitudes towards high food prices in general, that is they would like to choose a higher priced brand if they could only afford it. Similarly, even with money pressures some consumers were willing to pay for premium-priced food products if better taste or other quality attributes were valued.
3.4 The theoretical and operational framework for the study
The aim of this qualitative study was to create a better understanding of the role of price in foods in general, and how consumers perceive high food prices, such as the prices of functional foods. The purpose of this qualitative investigation was also to explore attitudinal opinions related to high or low food prices in order to operationalize the measurements of food price attitudes. This section discusses how the food price attitude may be related to behavioural intentions and the consumer’s willingness to buy premium food prices, and a theoretical framework is outlined. It was assumed a priori based on the previous literature and that there are at least two beliefs behind different attitudinal opinions towards food prices: 1) some persons possibly believe that a higher price signals the higher quality (differences in quality consciousness), and 2) some persons possibly believe that the best buy means the lowest possible price (differences in price sensitivity). The results of this qualitative data supported these assumptions. The literature also suggested that positive attitudes towards high prices could be related to the prestige dimension. However, this was not clearly supported in foods in this data even though some issues could be related to appreciation gained from others.

105
The most challenging aspect is to distinguish the attitude towards the food products from the attitudes towards the food prices, because price seems to fade into the background in evaluative processes. However, it is argued here that an attitude towards price is a different evaluative process and can be isolated from the evaluation of the product. If the quality features of a product are valued, one can have a positive attitude towards the product. However, if perceived price is then considered expensive and this expensiveness is unfavourably interpreted, the food price attitude may reduce the shopper’s willingness to buy this product. Therefore, the food price attitude might have a direct relationship with behavioural intentions. Erickson and Johansson (1985, 198) found that price had no direct effect on a product attitude, but price affected indirectly through quality perceptions. Based on the literature and the results of this study, it seems that product attitudes may have on impact on price attitudes and vice versa.
Clear evidence was found that these subjects had different attitudinal opinions related to food prices. Subjects expressed their favourable and unfavourable opinions towards high and low food prices. These attitudinal opinions can be based on behavioural beliefs such as quality consciousness or price sensitivity. Attitudes are agreed to have three components: behaviour (past experiences), cognition (beliefs) and affection (feelings) (e.g., Maio et al. 2004, 11). All these components were identified from the data. Subjects explained their favourable and unfavourable interpretations towards food prices by habits and past experiences. They found reasons for high and low prices based on behavioural beliefs. Price fairness evoked feelings and emotions (see Figure 13). However, favourable or unfavourable attitudes towards high food prices were expressed more often than favourable or unfavourable attitudes towards low food prices. This supports the asymmetry of price perceptions and the multidimensionality of price attitudes (e.g. Emery 1969; Jacoby and Olson 1979; Huber and McCann 1982; Erickson and Johansson 1985; Lichtenstein et al. 1993).

106
Figure 13. Expressed behavioural beliefs behind positive and negative attitudes towards high and low food prices.
Few beliefs were presented in relation to unfavourable attitudes towards low food prices related to the perceived unfairness of low food price (e.g., as a sign of mass production). Otherwise, low food price was generally accepted even if the food itself was not always purchased. There was hardly any food quality suspicions related to even extremely low prices, and food was basically trusted in Finland. Unfavourable and favourable attitudes towards high food prices were expressed quite clearly, and they were related to special quality features (e.g., taste, ethical issues, and healthiness). Positive or negative attitudes towards high food prices were related to how these quality features were valued. Some people perceived quality differences in foods, while others were not able to experience the differences or did not value them. Some people were able to justify a higher than the normal price and accept it. However, accepting a higher price in foods and being favourable towards it did not mean that this person had an unfavourable attitude towards low food prices. Similarly, being favourable towards low prices and being willing to buy low priced food did not mean that this person was unfavourable towards high food prices if a high price was justified.
Exploitation of the natural resources/labour
Behavioural beliefs from past experiences, reasoning, or justifications
Mass production
Quality uncertainty Unfamiliar products
Perceived substitute effect
Monetary pressures
Basic quality is trusted in foods
Low quality in specified features
Perceived unique value effect
Affective component
Price fairness
High food price
Taste: high liking or other hedonic preferences
Being cheated Loss aversion
Negative attitude
Lower quality than expected
Positive attitude
Budget constraints
Low food price
Special quality features: ethical issues or healthiness
Positive attitude
Negative attitude

107
Asymmetry related to quality inferences from price information was also discovered. With food products consumers probably perceive different levels of quality dimensions. The lack of past experiences (quality is uncertain) is assumed to increase the quality inferences from price information as reported by Tellis and Gaeth (1990), and the subject in this study.However, basic quality in foods was trusted and all shopped food was considered edible even if not liked, thus low quality was not inferred from a low price. With a low food price the expected quality is probably low, and if the experienced quality is low that is in accordance with expectations. If the experienced quality is then higher than expected, satisfaction is experienced and the food purchase is considered a good deal, reinforcing a positive attitude towards low food prices. High prices seem to increase quality expectations (e.g.,“in thecaseof icecream”). Dissatisfaction is strong when the experienced quality is lower than expected, reinforcing a negative attitude towards high food prices. Similarly, Schifferstein et al. (1999) reported loss aversion in foods with sensory quality expectations.
According to Ölander (1969) a low price itself might increase the propensity to buy the product even with low quality, but a high price itself hardly have a same effect. If special quality features are valued, such as the production method of organic food products, this product attribute is probably used to justify the high price. However, it would be wrong to say, based on this data, that the high prices of these products increase propensity to buy these products even though it might increase the quality expectations. This data suggested that there are behavioural beliefs behind the positive attitudes towards food products which are related to behavioural intentions, for example, a person’s own willingness to make ethical (or health) choices based on behavioural beliefs that ethical choices (or health choices) are good for him or her, and therefore a high price is justified. Similarly, positive attitudes towards certain food products can be developed even if the benefit of the choice concerned others, for example, a person might be willing to make health (or ethical) choices because it is important to others (e.g., children, animals or Finnish agriculture), and thus a high price is perceived as fair. Consumers may have positive attitudes towards specified quality features of which they highly value, and therefore they also possess positive attitudes towards perceived high food prices. They have probably learned that a high price means the quality they prefer. The positive attitudes towards high food prices will possibly not make the consumers to buy high-priced food products, but these attitudes might help them in accepting high prices in foods. Food price attitudes might also affect how strong justifications are needed before high food prices are accepted.
Based on the results of this qualitative study, food price perceptions are quite person- and product-specific, yet, some general attitudinal opinions can be identified. In order to operationalize the concept of the food price attitude some theorization needs to be done. The theory of planned behaviour (TPB) has been used to explain how food price attitudes may influence the consumers’ willingness to buy premium-priced food products. It is argued here
108
that the food price attitude is probably of little relevance if it is unrelated to the purchase behaviour. According to TPB (Ajzen 2005) the consumer’s attitudes towards certain behaviour reflects to some extent actual behaviour along with the perceived subjective norm and the perceived behavioural control. Behavioural intentions could be predicted and understood by investigating the attitudes towards that behaviour. TPB has been widely used as the dominant model of food choice research. However, it might have several shortcomings, especially with low-involved choice situations as is the case with some food products (Hamlin 2010). Habits have been found to be better predictors of food consumption than attitudes and the ability of TPB models to fit the data has been found to be conflicting (Honkanen et al. 2005). Similarly, the subjects in this study reported habitual tendencies in food purchase situations and they found difficulties to rationally explain their behaviour. Some subjects had low involvement with food, and it is worth to mentioning that actual food purchase behaviour may be different than discussing and rationalizing food purchase in the interview situation. The actual purchase situation may be habitual and information processing is done unconsciously or intuition-based choices are made. However, explaining one’s behaviour in the research situation probably makes the food choices more rational than they are (see post-hoc reasoning by Elliot 1998, also Zajonc and Markus 1982).
The data of this study produced all the elements of the TPB model (Ajzen 2005): attitudinal opinions, some subjective norm-like opinions, and several ways to control over the food purchase behaviour (see Figure 14).
The relevance or importance of a food to subjects (the food involvement) was interesting concept. The differences in the importance of the food were related to hedonic preferences, ethical or health concerns, and how they valued these aspects. Food was considered a necessity, but some subjects attached more importance to food than just the daily nourishment. Food involvement affected quality and value perceptions, thus differences in food involvement influenced a person’s opinions of food prices or his or her willingness to buy high-priced food. Food involvement can be reliably measured with the involvement scale developed by Zaichkowsky (1985), and, the involvement has been theorized as a different concept from attitude. However, this may not be easy to distinguish empirically. An attitude towards food consumption has been measured in previous research using similar semantic differential scale as food involvement (e.g., seafood consumption reported by Honkanen et al. 2005). According to this data, there is enough support to consider food involvement as a different concept than the attitude towards food prices. However, it is impossible to say, based on this empirical data, whether food involvement is a different concept than one’s attitude towards food.

109
Figure 14. Theoretical framework showing consumers’ attitudinal opinions to high or low food prices and behavioural intentions.
The subjects kept the food expenses under control in various ways. Keeping control over finances was important to them and mental accounting-like behaviour emerged from the data. The data suggests that financial control probably affects consumers’ buying behaviour or intentions. Such control was related to rationality and to food budgets. Rationality in food purchases and consumption was manifested in several ways. Being rational food consumer or buyer did not automatically mean that he or she bought food with the lowest possible prices. Being rational included avoiding food waste, saving on food expenses (making meals from basic ingredients), or avoiding intuition-based purchases. Financial control was important, especially if the subject suffered from money pressures, but financial hardship did not always hinder a person’s willingness to buy premium-priced food products (e.g., organic products for ethical reasons) or indulge in delicacies. The control effect may also occur during shopping. Some products may be rejected because the shopping basket has been “overfilled”. This data suggests that financial control affects behavioural intentions, though as such this control is an independent concept. Financial control may explain why
Behaviour: Buying premium(low)-priced food product
Intentions:
Willingness to buy high(low)-priced food Willingness to pay high (low) prices for foods
Attitudes and norms related to price:
Control:
Internal and external control over food
purchase: -mental accounting -learned rationality
-current income level
Behavioural beliefs related to price:
Quality perceptions Price sensitivity
Price justifications Past experiences/behaviour
Attitudes towards food prices, price
fairness
Ethical concerns Hospitality
Family provider
Food involvement:
Food importance
and relevance
or
Attitudes towards foods
including possible
subjective norms

110
some subjects bought low priced food even if they valued premium-priced food products and they were forced to be price sensitive. Thus it might also influence food price attitudes.
According to the TPB theory, behavioural beliefs lie behind attitudes, and, according to this data, several beliefs could be detected, as discussed earlier (see Figure 13). Attitudinal opinions were related to justifications for high food prices. Justifications were needed in order to evaluate price fairness and to accept a high price. Behind justifications may lay such behavioural beliefs as buying healthy food enhances one’s well-being, buying ethically produced food enhances the well-being of the globe, or buying-premium priced cucumber during the winter supports domestic agriculture and provides children with healthy and nutritious food. Based on the results, support is given to the notion that positive attitudes towards high food prices are related to a willingness to buy high priced products based on justifications and feelings of fairness. Consequently, the hypothesis framed in this study was supported in this small sample: favourable attitudes towards high food prices were related to a willingness to buy premium-priced food products. However, this required confirming in the large sample.
Based on the results of this data, it is difficult to classify attitudes and subjective norms into different constructs. According to the TPB theory other peoples’ opinions (a subjective norm) affects behavioural intentions, for example, the willingness to buy ethical food products would be affected by subjective norms. In this data, there was no evidence that healthy or ethical food were bought because of other peoples’ opinions, with the exception of mothers making decisions based on the needs of their children. Similarly, the results did not support the idea that someone would be willing to buy either premium-priced food products or low-priced food products to suit other peoples’ opinions. Thus, a relationship between a subjective norm and the food price attitudes was not detected. However, a strong relationship between a subjective norm and an attitude has been found in the results of previous studies, and thus a norm may have an effect on behaviour indirectly through an attitude (see Hansen et al. 2004; Verbeke and Vackier 2005; Tarkkinen and Sundqvist 2005). The willingness to pay high food prices for ethical reasons could be related to self-respect or the respect received from someone else. However, it is impossible to say, based on this data, whether it reflects an external subjective norm rather than an attitudinal opinion, such as a feeling of fairness. For example, buying high-priced organic food products because they are expensive or because a person wants to impress other people was never mentioned by the subjects. Nevertheless, some evidence was found that buying organic food products was important because subjects wanted to take responsibility for the environment. Unfortunately, however, the data failed to provide a deeper understanding about what kinds of motivations lay behind that responsibility. The subjects did not mention that they bought food at the lowest possible price because someone else required them to do it. Nor did they mention that they preferred high-priced delicacies because someone else expected it of them. Some

111
of them referred to acquaintances that behaved differently, such as those who hunted down food bargains, but no-one mentioned that the behaviour or opinions of others would affect their behaviour. Though, it does not mean that this would never happen. External pressure was only mentioned when mothers said they were affected by their children’s needs, and these comments were related to taste and the brand, not to price.
A need to indulge dinner guests with high-priced food could be related to a willingness to gain respect or prestige from others. However, it is unclear whether it reflects an attitudinal and culturally-bound opinion of hospitality (learned behaviour, a social norm) rather than an external subjective norm (willingness to pay premium prices because of the opinion of the others). Offering high-priced food to guests could be related to a willingness to signal high social status to them (see Lichtenstein et al. (1993) for prestige sensitivity). However, the evidence to support this assumption was not clear in foods. This kind of behaviour was connected in this data to the luxury products and durables as watches or cars, but not with foods (cf. the symbolic meaning of goods reported by Elliot 1998; see Holbrook and Hirchman 1982 for experiential approach; Johansson-Stenmann and Martinsson 2006 for cars; and Rege 2008 for status goods).
Operationalizing the measurements
The theoretical framework suggests that purchase intentions are affected by the attitudes (perhaps including possible subjective norms) and behavioural control. These attitudes can be related to food products in terms of food involvement, and attitudes towards price perceptions (also including possible subjective norms related to price). Consumers’ willingness to pay high food prices was related to justifications for high prices and to feelings of fairness (the affective component of food price attitudes), for example, a high price was favourably interpreted if unique value was experienced. Attitudes towards food prices seem to affect behavioural intentions through quality valuations, and therefore it may explain why some people are favourable towards high-priced food products while others are not. Accordingly, the data suggests that consumers can possibly be categorized into different subgroups based on their food price attitudes. In order to investigate how much food price attitudes affect the behavioural intentions these attitudes should be measured reliably. This data confirmed the Anttila’s (1990) results that attitudes towards prices should not be measured as one dimensional construct with a bi-polar scale imagining that one end of the scale would reflect the unfavourable attitude towards food prices and the other end a favourable attitude. It is assumed, based on this data and the previous literature (e.g. Erickson and Johansson 1985; Lichtenstein et al. 1993), that one can have both a positive and a negative attitude towards low and high food prices at the same time depending on the product, the monetary situation and the reasoning related to those prices.

112
According to the previous literature the Price Perception Scale (PPS) originated by Lichtenstein et al. (1993) was chosen to be an appropriate scale to measure food price attitudes. In this scale a high price can have both a negative and a positive role, and, opinions are measured with behavioural intentions. The original PPS was used in the field study related to grocery shopping and therefore it was assumed to be appropriate to the food context. However, subjects in this study, made a clear difference whether they meant food products or durables during discussions. Food was considered to be different from other commodities because taste was the main attribute in foods, the monetary sacrifice per item was small, food was a necessity, and shopping for food was a habitual function which did not require searching for information about other alternatives. Consequently, it is argued here that in order to understand consumers’ attitudinal opinions towards food prices the opinion statements need to be modified more precisely to apply to food products or food buying intentions, as one of the subjects said: “Youbuyfoodwithadifferentattitude”(F11). However, no evidence exits whether there is a difference between food products and other non-durable daily products, even though toilet paper and washing agents were not mentioned as examples. Grunert et al. (2009) used the modified Price Perception Scale as a price involvement scale, and emphasis was placed on consumers’ motivation to look for price information. Through principal component analysis they defined four dimensions: 1) deal proneness (similar to sale proneness in the original PPS), 2) price mavenism (as in the PPS), 3) perceived budget constraints (unrelated to the PPS), and 4) value consciousness (as in the PPS).
The original PPS included 43 opinion statements producing 7 different dimensions: 1) price consciousness, 2) value consciousness, 3) coupon proneness, 4) sale proneness, 5)price mavenism, 6) price-quality schema, and 7) prestige sensitivity. The evaluation of the appropriateness of these dimensions in the food context was done by discussing about them with the subjects. The statements were considered to be “toogeneral”, and, in addition, subjects made a distinction between foods and durables. Coupon proneness was not supported because coupons were not used in food purchases (as in Korea and China, see Jin and Sternquist 2003; Sternquist et al. 2004). Food prices were not discussed with friends, and, therefore, the domain of price mavenism was excluded (as in China and USA, see Zhou and Nakamoto 2001). However, the data supports the fact that this domain exists. There was one respondent who was willing to discuss food prices and inform others about bargains, and therefore this domain should not be left out of future research even though it was excluded from this scale. Prestige sensitivity was an ambiguous dimension in the food context, but, it was included in the scale. However, deeper qualitative investigation is probably needed in order to operationalize reliably this dimension in the case of foods. In this thesis, five domains were included to the scale development process: 1) price consciousness, 2) value consciousness, 3) sale proneness, 4) price-quality schema, and 5) prestige sensitivity.
113
No clear evidence was received how subjects stored price perceptions either in a verbal form or numerical form. According to this qualitative data, some price perceptions (the evaluations of expensiveness or cheapness) were related to price knowledge or predicted prices, but some evaluations were related to the attractiveness of the product or the function of the product (value of the product). Subjects explained price perceptions related to functional foods in various ways. Some subjects with good knowledge of prices were able to compare the observed price to some other price (e.g., a price previously paid). However, most subjects explained their perceptions in qualitative terms. According to this finding, it was difficult to say in which way consumers evaluate the price, and what would be the best way to ask about the price judgements, such as a willingness to pay question. For those subjects, who could use a reference price as a base of the evaluation, it is probably easy to answer the willingness to pay questions and estimate a price. However, in this small sample they were few, and there is evidence in the previous literature that consumers may have a poor price knowledge especially related to habitual purchase situations (Dickson and Saywer 1990; Monroe and Lee 1999, McGoldrick et al. 1999; Roza-Diaz 2004).
A tendency to prefer easily-recalled attributes generates an attribute substitution bias (Kahneman 2003, 707). This means that judgements can be influenced by attributes other than those actually perceived (e.g., a brand name of the product may evoke quality judgments). Therefore, attitudes may be natural substitutes for difficult attribute evaluations tasks (Kahneman 2003, 701), including the evaluation of a price (e.g., a willingness to pay estimation). It is possible that in the price-related studies, price estimations are not necessarily based on numeric processing (Xia 2003), and the attitudes towards high or low food prices may affect the price estimations as substitute attributes. According to Grunert et al. (2009), value consciousness affected willingness to pay estimations for a basic food product. Thus, it is assumed in this study, that food price attitudes measured with a modified PPS scale will probably have an impact on estimated prices although the effect is weak.
According to Grunert et al. (2009), budget constraints seemed to have an insignificant impact on willingness to pay estimations. This result supports the findings of this data. The prices of single food products were small sacrifices, and even if money was tight, any food price can be seen as acceptable or even meaningless if valued in isolation. The subjects were eager to emphasize that willingness to buy a functional food product or how they perceived the expensiveness was related to whether one is interested in using the product and not whether the price is acceptable perse. It is assumed in this thesis that the willingness to buy the product regularly is related more closely to actual acceptance of the price because it has a stronger impact on the food expenses than a random purchase. Consequently, in the quantitative part of this study, price estimations were asked in two different situations: 1) the willingness to buy the product once in order to try it, and 2) the willingness to buy the product regularly.

114
The limitations and contributions of the qualitative study
The convenience sample of this study was small but produced a great deal of variation. All but two of the subjects shopped for food regularly, even though not all of them were primarily responsible for purchasing food. However, they were all able to discuss about food prices and they had subjective perceptions of food prices which they expressed during discussions. Consequently, the subjects supported the face validity of this study. The results should not be generalized, but they do give interesting insights into the opinions of these consumers.
This qualitative study has its limitations, especially with respect to data analysis. Because of the limited time between this qualitative study and the first quantitative survey the analysis of the data was made by the author alone. After the quantitative results and during the reporting of this study, the reanalyses were also made by just the author. As recommended by the qualitative method literature (Lindkvist 1981, 34; Kassarjian 1977; Kolbe and Burnett 1991) the reliability of results can be enhanced if analyses are made by other researchers and the correspondences of results are reported. However, in this thesis, the original comments and results were reported in order to make the theoretical conclusions transparent to the reader and to enhance the reliability and the validity of the analysis. Quoting freely using many extracts from the “raw” data readers are introduced to the thinking of the subjects and are encouraged not to rely on the author’s interpretations only. Validity in qualitative research is related to the transparency of the grounds on which the results and further conclusions are based (Lee and Lings 2008, 238). In this thesis, a great effort is made to present detailed results, to discuss the results in the light of relevant literature, and to draw conclusions from the results. The reader should be able to follow the path of the analyses and justify whether he or she finds the conclusions credible and reflect the real phenomenon described by the data. In this thesis, some of the results derived from the qualitative analyses are also confirmed with quantitative surveys in order to enhance the validity of the study. Despite the limitations there were several contributions to future research.
The main theoretical contributions
The role of price in foods is an interesting phenomenon. It seems that meaning of the price is different in foods than in durables and perhaps in other non-food products. This can probably be related to how the quality differences are perceived. In foods, the basic quality in Finland is trusted and all food in the food shops was considered edible and trusted even if not liked. Consequently, extremely low-priced food was accepted if the best before date had not expired. Theoretically this is related to quality inferences and their asymmetry. With durables, a low price was expected to signal low quality and a high quality was inferred from a high price. Efforts were made to look for a low price and quality information. With food,

115
quality inferences from a low price were seldom made concerning the basic food quality, and therefore, it is argued here that price has a different kind of role in purchasing food than with other commodities. However, some value-added features in foods may increase the quality expectations and quality inferences are probably made from a price.
Food prices seemed to be important but the price of a single food item is probably not if evaluated in isolation. Food prices can be perceived as both expensive and cheap depending on what the subject is thinking about. Prices of foods were considered important but only a few made a purchase decision based on price information. However, a single food price (even a low one) seems to play an important role if some line of tolerance is crossed, for example, the acceptable cost of the shopping basket. Even if a price is seldom a reason to buy a product it can be a significant reason not to buy it. Food prices are looked at even in a habitual buying situation, but seldom evoke reactions. Justifications are needed if observed prices are perceived as unacceptable. Feelings of fairness are related to the acceptability of prices, thus an experienced feeling of unfairness probably generates the negative attitudes towards price and the product.
The subjects keep financial control over their food expenses despite the habitual food purchase. Food budget control was explained in a same way to what has been described as mental accounting (Tversky and Kahneman 1996; Thaler 1999). Mental accounting in foods was executed at different levels: shopping basket control, and monthly food budget control. Food expenses were compared to income level and to other accounts (budgets for housing, clothing, etc.). Some people can probably take assets from the food account and use them in another account, but perhaps not all people are eager to do that. The mental accounting approach can possibly be used to explain why some consumers are willing to buy premium-priced delicacies even if money is tight. To entertain oneself with luxury food is perhaps acceptable if other accounts for luxury or entertainment are underconsumed. More research is needed in order to find out how much this kind of control affects food buying behaviour and whether mental accounting is a situational feature, something that changes along with the monetary situation, or whether it is a personal feature, something that is learned and is quite stable despite changes in the monetary situation. Both viewpoints were supported by this data.
Theoretically it would be interesting to explore more deeply what lies behind prestige sensitivity and subjective norms in the food context. This study could not ultimately define the symbolic values of the high food prices or the effect of the subjective norms on food purchase. However, some indications were discovered in which the premium-priced food offered to guests could be related to this phenomenon.

116
The main managerial contributions
The consumers’ willingness to pay a high price or accept a high price in foods is an important issue to be considered by food industry executives. There is great variation in how consumers perceive high food prices and there are different attitudinal opinions related to them. Both high and low prices can be justified as fair or unfair and consumers may have favourable or unfavourable attitudes towards them. From the managerial viewpoint, the feelings of unfairness about high-priced food are worth taking into consideration. Justifications are needed in order to accept high prices in foods. Based on the opinions of these subjects the basic quality in foods is trusted and basic ingredients are expected to be low-priced. Only some value-added features can justify the high price. However, this added feature must be communicated in a meaningful manner to consumers. Subjects in this data valued different quality attributes, and the willingness to pay for added features varied among them, although this is not a new finding. Still, in exploring targeted consumer groups by means of consumer surveys, reliable measurements should be used in order to find the subgroups responding favourably to the communicated messages. For example, if quality is measured as a general term, the results might be biased. In foods, the basic quality might be related to food safety and is perceived differently than some value-added features. It is good to remember in carrying out consumer research that perceptions of expensiveness and cheapness are subjective and all consumers probably have a different reference point when forming the perception. According to the subjects involved in this study the reference point in functional food products varied including a variety of explanations. Expensiveness did not only mean a high price but also implied an unwillingness to use a product. Consequently, in conducting the consumer research related to new product development or assessing an acceptable price one should be aware of the motivations behind quality and price perceptions.
The main methodological contributions
In order to develop a reliable measurement scale for food price attitudes some findings are worth to noting.
1. As has been supported by the previous literature, it seems that consumers probably have both negative and positive opinions about food prices, and therefore it might be better to design measurements which included both dimensions separately: a scale for willingness to buy low-priced food, and a scale for willingness to buy high-priced food.
2. Because consumers distinguished between foods and other commodities, especially durables, it is important to design a measurement scale specifically for foods. Buying food was considered a routine task and subjects had difficulty in explaining their behaviour. Buying durables was a more conscious task and the way consumers

117
searched for price and quality information was different than with foods. Thus, it is assumed that if price attitude questions are asked without specifications about foods, more conscious choice situations than habitual food purchases are reflected in answering research questions. Additionally, quality inferences were made differently in relation to foods than other commodities, and therefore food specific scales are required to avoid the possible biases.
3. The price perception scale to be used in this study as a model (for PPS see Lichtenstein et al. 1993) for The Food Price Attitude Scale was supported. However, coupon proneness and price mavenism were excluded from the future measure, even though some tendencies relating to these dimensions were discovered. Possible prestige sensitivity could be related to premium-priced food offered to guests, but it is difficult to say whether this kind of behaviour is motivated by appreciation gained from others or just from quality perceptions together with a culturally-bound hospitality.
4. The subjects seemed to value different kinds of quality features and they experienced quality differences individually. In order to investigate whether consumers are willing to pay for high quality, an array of quality features should be presented instead of only referring to “quality” in general.
5. The manner in which subjects kept costs under control seemed to affect buying behaviour. Thus, it is assumed here that financial control will also affect the acceptable price. The way subjects explained their price perceptions related to functional foods provides reasons to believe that an acceptable price evaluated in isolation is different than an acceptable price for a regularly used product. The stated acceptable price for a regularly used product is probably including some financial control, and therefore it might be closer to real acceptance than the estimated price for a randomly used product.
6. The willingness to look for low food prices may be related to attitudinal opinions but also to the monetary situation, and does not necessarily imply a negative attitude towards high food prices. Along with the income level, the subjective feeling of a monetary situation should be included in the surveys as an additional background variable.
Finally, the results of this qualitative study suggested that consumers’ attitudinal perceptions towards food prices do exist, but in order to confirm this, the Food Price Attitude Scale needs to be developed. Additionally, buying food is probably different than buying other commodities, but this assumption needs to be confirmed in a large generalizable sample. Furthermore, a holistic view is needed to understand the levels at which consumers interpret

118
and give meanings to different quality features. In foods, it seems that there is an abstract “basic quality” which includes expectations of low food prices. This basic food quality in Finland is related to food safety. However, a higher level of quality is related to specified quality features which are probably product specific, and a high price within foods can be justified if these features are experienced and valued. Methodologically it would be useful to explore more profoundly whether “high food quality” as a general definition even exists in the minds of consumers. In order to measure consumers’ willingness to buy premium-priced food products, financial control, feelings of fairness or unfairness and motivations behind price perceptions should be taken into account.

119
4 Quantitative survey studies
In this thesis, one of the aims was to develop food price attitude measurements. The measurement scale was tested in different consumer data sets to see whether it had an ability to discriminate similar subgroups based on food price attitudes on different occasions and in different samples. This measurement testing is related to theory generalization, meaning that some theoretical assumptions are recognised in different real life contexts and not just in one experiment (Lee and Lings 2008, 266-267). Food price attitude measurements were developed and confirmed during 2001-2004 using four survey studies. Subjects in all data sets were classified into different subgroups based on food price attitudes. The relationship between the food price attitude and consumers’ willingness to buy premium-priced food products was investigated in the survey collected in 2002, and the effect on price estimations was studied in the survey carried out in 2004.
The time period for this research project was very challenging. At the beginning of the year 2002 the Finnish currency changed from the Finnish marks (FIM) to euros. One euro was approximately six times the value of the old currency FIM. According to Gamble et al. (2002) people may perceive prices to be lower than the actual monetary value when a currency is changed into euros, creating a money illusion effect. According to Anttila (2004) a money illusion effect was found among Finnish consumers. In her study, carried out just after the currency change in Finland, 23% of subjects reported being misled by the euro and 10% of the respondents perceived prices lower than actual monetary value. However, according to Anttila (2004), consumers used similar strategies in forming price perceptions about euros than the former currency. Gamble et al. (2002) discovered that the euro illusion effect was strong with low-priced products, and if the importance of price was low. In the cases where prices were of high importance respondents made more thorough calculations. According to the National Consumer Research Centre in Finland, Finnish consumers had trouble in learning the value of euro, and their ability to know or remember prices worsened during 2002-2007 due to the fact that the whole pricing system had changed along with the currency (Nikkilä et al. 2008). However, the currency change was not a problem in this investigation because the interest was more in attitudinal opinions towards the expensiveness or cheapness of food in general, and not whether consumers were able to remember prices.
4.1 The materials and methods of the surveys
During this research process (2001-2004) data was collected involving altogether 4,494 Finnish consumers. First, a qualitative data was collected in June-July 2001 and January

120
2002 comprising 40 thematic interviews conducted by the author. The sample, methods and results are reported in chapter 3. Four quantitative survey studies were conducted in November 2001 (N=1158), in December 2002 (N=1156), in May 2004 (N=1113) and in April 2004 (N=1027) by mailed questionnaires.
4.1.1 Survey samples
All the survey data sets used in this thesis were collected by the marketing research company Taloustutkimus Oy and representative consumer samples according to age (15 years or more), gender and place of living were requested. Subjects were selected based on Finnish phonebooks using a random sampling method. Randomly selected subjects from all over Finland were contacted by telephone and their willingness to participate to the survey was asked. The self-administered questionnaires were posted to respondents who were willing to participate. The first post mail survey was conducted in December 2001 (N=1158) with a respondent rate of 60.2%, the second in December 2002 (N=1156) with the response rate of 60.4%, the third was collected in May 2004 (N=1113, referred to in the text as 2004a) with a response rate of 58.9% and the fourth in April 2004 (N=1027, referred to in the text as 2004b) with a response rate of 58.7%. The frequencies of background variables used in this study are presented in Appendix 3 and the percentages of the distribution in Table 6.
The four different data sets were quite similar in terms of background variables, although, slight differences were detected. In order to test how well the samples represented the Finnish consumers some of the background characteristics were compared to the 2004 (Fin 2004) information received from Statistics Finland, the Finnish public authority specifically established to provide statistics. There were some difficulties in comparing the distribution of the study’s subjects and the Finnish statistics due to incompatible scaling. Generalization may be inaccurate due to biased samples in terms of education, gender and age. However, consumer samples which are completely generalizable to consumer census are hard to achieve (Lee and Lings 2008, 268-269). Bias in gender is probably due to women’s more frequent responsibility for food shopping in Finnish households, and therefore they were more eager or capable to answer questions concerning food. There were fewer subjects with only basic education than in the Finnish population in all samples, whereas the number of subjects with intermediate education (including professional education, secondary school graduates, college degree) was higher than in the Finnish population in all samples. Age distribution was quite similar in all samples. In the 2001 sample, ages ranged between 15 and 74 with a mean of 44 years. In the 2002 sample, ages ranged between 15 and 78 with a mean of 44 years. In the 2004a sample, the age-range was from 18 to 80 with a mean of 48.54 being highest of all data sets. In the 2004b sample, ages ranged between 15 and 79 with a mean of 46 years. Furthermore, in 2004a, the subgroup of older subjects (60-80

121
years) was the biggest in that data set and was higher than any of the other samples. Minor errors in representativeness are probably due both to sampling (random sampling based on phonebooks) and non-sampling procedures (e.g., the pre-asked willingness to participate in the food study).
Table 6. Descriptions of the background variables in 2001, 2002, 2004a and 2004b the Survey samples
Gender Fin 2004 2001 2002 2004a 2004bwomen 51% 57% 56% 57% 57%men 49% 42% 44% 41% 43%missing 1% 0% 2% 0%
Age groups Fin 2004 2001 2002 2004a 2004b15–29 24% 20% 20% 13% 16%30–39 16% 18% 20% 15% 18%40–49 18% 22% 22% 20% 16%50–59 20% 17% 18% 18% 16%60–80 22% 18% 21% 26% 23%missing 5% 0% 8% 11%
Occupational group/profession 2001 2002 2004a 2004bexecutive or business owner 9% 9% 12% 11%managerial official 8% 10% 9% 0%official 15% 14% 13% 23%worker 25% 25% 22% 24%pensioner 20% 22% 27% 25%student 9% 10% 8% 7%non-working 10% 9% 8% 8%missing 4% 0% 1% 2%
Highest education levelFin
20042001 2002 2004a 2004b
basic education 37% 22% 24% 23% 20%
intermediate grades 38% 60% 60% 55% 58%
higher education 25% 17% 16% 20% 20%
missing 1% 0% 1% 2%
Place of living 2001 2002 2004a 2004bMetropolitan area - 18% 19% 21%Large city (>40 000 citizens) - 26% 27% 24%Town or minor city (< 40 000 citizens) - 38% 32% 34%Countryside/rural area - 18% 21% 21%missing - 0% 1% 0%
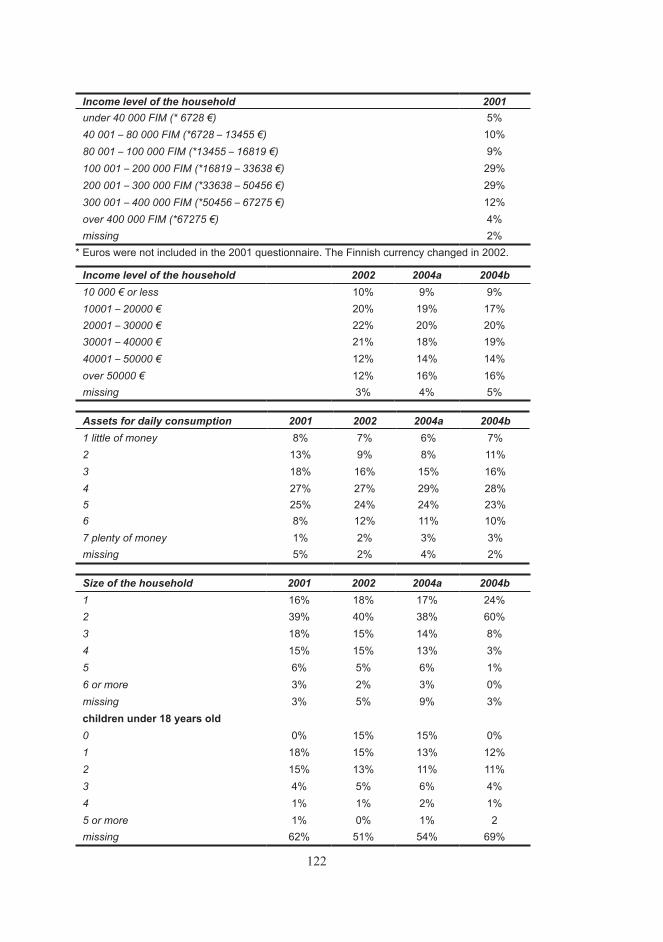
122
Income level of the household 2001under 40 000 FIM (* 6728 €) 5%40 001 – 80 000 FIM (*6728 – 13455 €) 10%80 001 – 100 000 FIM (*13455 – 16819 €) 9%100 001 – 200 000 FIM (*16819 – 33638 €) 29%200 001 – 300 000 FIM (*33638 – 50456 €) 29%300 001 – 400 000 FIM (*50456 – 67275 €) 12%over 400 000 FIM (*67275 €) 4%missing 2%
* Euros were not included in the 2001 questionnaire. The Finnish currency changed in 2002.
Income level of the household 2002 2004a 2004b10 000 € or less 10% 9% 9%10001 – 20000 € 20% 19% 17%20001 – 30000 € 22% 20% 20%30001 – 40000 € 21% 18% 19%40001 – 50000 € 12% 14% 14%over 50000 € 12% 16% 16%missing 3% 4% 5%
Assets for daily consumption 2001 2002 2004a 2004b1 little of money 8% 7% 6% 7%2 13% 9% 8% 11%3 18% 16% 15% 16%4 27% 27% 29% 28%5 25% 24% 24% 23%6 8% 12% 11% 10%7 plenty of money 1% 2% 3% 3%missing 5% 2% 4% 2%
Size of the household 2001 2002 2004a 2004b1 16% 18% 17% 24%2 39% 40% 38% 60%3 18% 15% 14% 8%4 15% 15% 13% 3%5 6% 5% 6% 1%6 or more 3% 2% 3% 0%missing 3% 5% 9% 3%children under 18 years old0 0% 15% 15% 0%1 18% 15% 13% 12%2 15% 13% 11% 11%3 4% 5% 6% 4%4 1% 1% 2% 1%5 or more 1% 0% 1% 2 missing 62% 51% 54% 69%

123
Slight differences in samples were not a problem in this study. The exploratory goal was to frame the food price attitude measurements, and the role of food price attitudes in consumers’ behavioural intentions was the main focus. Even though consumer classifications were made, the aim of this study was not to generate reliable typologies of different food price attitude groups based on the background variables. This kind of generalization would be more related to an effect generalization, in which case representative and similarly distributed samples should be required (Lee and Lings 2008, 266-267).
4.1.2 Post mail surveys
Four post mailed survey studies were executed during 2001-2004. The survey strategy was chosen because it is an economical and efficient way to collect a reasonably large data within a relatively short time period (Saunders et al. 2007, 138). Structured self-administered postal questionnaires were composed together with two other research partners, and collecting the data was entrusted to the marketing research company Taloustutkimus Oy. In each questionnaire, the partners had their own sections including variables which they used for their own analysis and research reports. Background variables were designed and used by all partners. The final data matrix was delivered to the researchers in the form of the SPSS software.
Questionnaires were large, including 12 pages and 251 variables in 2001 (N=1158), 12 pages and 236 variables in 2002 (N=1156), 13 pages and 198 variables in 2004a (N=1113), and finally 15 pages and 168 variables in 2004b (N=1027). Saunders et al. (2007, 381) argue that questionnaires of between four and eight pages (A4 size) are the most acceptable for self-administered questionnaires. Questionnaires of only a few pages may signal insignificance and questionnaires longer than eight pages are probably a burden. The length of the questionnaires is one weakness of this study and may have reduced the reliability of the results. Only the variables designed and administered by the Department of Economics and Management are reported in this thesis with some of the background variables.
4.1.3 Pretesting the food price attitude measurements
Based on the literature review the Price Perception Scale (PPS, Lichtenstein et al. 1993) was selected to be used to frame the food price attitudes. The original measure comprised of 7 domains including 43 questions (see Appendix 1). According to the qualitative results (in chapter 3.2.4), price mavenisim and coupon proneness domains were excluded from the questionnaires. In spite of the fact that one subject told others about good food offerings and few subjects were positive about coupons, most of the subjects reacted negatively to these

124
ideas especially in the food context. These findings support the previous literature that these domains exist, even though they were excluded from this research.
The questionnaire was constructed and tested in several different phases. In the first phase two senior university lecturers and a researcher formulated two sets of research questions: 1) 30 opinion questions on price perceptions in general (revised from Lichtenstein et al. 1993 without the price mavenism and coupon proneness domains) and 2) 30 opinion questions on price perceptions relating to food. Both sets were first tested with 67 fourth-year food economics students at the University of Helsinki during the course of the survey methods. They answered the questions and then analysed the questions in small groups making suggestions about them. After revision the questionnaire was send to 10 adults (colleagues and friends) to be tested. They answered the questionnaire and were interviewed afterwards. Finally, the questionnaire was tested with 32 adult students from Malmi Open University of Applied Science. After this testing the questionnaire of 15 opinion questions of price perceptions in general and 15 opinion questions relating to food prices were ready. All the questions were measured by a 7 point Likert-scale (1= totally disagree, 7=totally agree, and 4= neither disagree nor agree) (presented in chapter 5.1).
In December 2001, a consumer data with a total sample of 1158 subjects was collected, the main objective being to compare to the general price perception scale with the scale targeted to food. Exploratory factor analysis was used to categorize the variables and reduce them if possible. In 2002, the new data was collected (N=1156) and the variables of the food price attitude measure were chosen based on the results of the 2001 exploratory factor analysis. Seven new questions were added to the measure in order to strengthen the reliability of the quality and prestige dimensions. In 2002, the consumers’ willingness to buy higher-priced food products was tested using logistic regression analysis. With the 2004a (N=1113) and 2004b (N=1027) data sets, the Food Price Attitude Scale was confirmed and no new variables were added. Subgroups based on the Food Price Attitude Scale were classified using K-means cluster analysis in every sample. The theoretical model based on SEM was tested with the 2004b data, and, further, the relationship between food price attitudes and consumers’ price judgements was investigated.
4.2 Data analysis methods
The data sets collected with self-administered questionnaires were quantitatively analysed using several statistical methods of analysis with SPSS (the latest version referred as PASW Statistics 17) software. The structured equation modelling was computed using LISREL (Jöreskog and Sörbom 1993) program (version 8.80).

125
4.2.1 Exploratory factor analysis
The Food Price Attitude Scale was developed and investigated using exploratory factor analysis in several data sets. Factor analysis is actually a collection of methods used to investigate the hidden constructs behind the variables. It is widely used in attitude-related research (Foster et al. 2006, 73). Attitudes are latent constructs which cannot be measured directly. Reflections of attitudes are captured with opinion questions related to different relevant dimensions assumed to construct the attitude. Exploratory factor analysis is used here to investigate what dimensions reflect food price attitudes and what questions measure the same dimension. Factor analysis can also be used to reduce the number of variables and to evaluate the relationships between the variables. For example, in developing the new attitude measurement, factor analysis can be used to evaluate which variables are included in the measure (Bryman and Cramer 1997, 276).
The power of determine what variables measure the same dimension is based on correlations. Correlations (the degree of agreement between two set of scores) are core functions of factor analysis, and patterns of correlations between observed variables are looked for. “Afactormeansaconstructordimensionwhichisacondensedstatementoftherelationshipsbetweena set of variables” (Kline 1994, 5). Some variables may have a high correlation to one factor meaning that there is a similar pattern of variation in the scores. Some variables may correlate with all factors, but one factor may have a higher loading than others.
Explorative factor analysis (EFA) and principal component analysis (PCA) are often seen as similar methods, but they are based for different models and should be used to achieve different objectives (Fabrigar et al. 1999, 275). In principal component analysis, the components are real factors based on measured responses, whereas exploratory factor analysis assumes that the measured responses are based on the hidden latent constructs, i.e. the hypothetical factors (Kline 1994, 36). Furthermore, in PCA all variance is analysed, whereas in EFA error and the variance specific to the variable (together known as unique variance) are removed and only common variance (the variance shared by the scores of respondents) is used in the analyses (Foster et al. 2006, 72). With a great number of observed variables measuring the same latent variable PCA and EFA can be used to reduce them to a smaller set of variables explaining the maximum amount of variance, and with the principal axes method used in EFA the results are almost identical (Kline 1994, 36). If data reduction is the only objective of the analysis, PCA is recommended (Fabrigar et al. 1999; Malhotra and Birks 2003, 578), whereas if there is a need to interpret and analyse the dimensions more theoretically EFA is recommended (Kline 1994, 44). In this thesis, explorative factor analysis was used with the principal axes method instead of PCA. The aim of the factor analysis was to explore how many dimensions were hidden behind the observed attitudinal opinion statements and what observed variables should be included in the scale in order to explain the maximum amount of variance. After selecting EFA it was decided to perform the

126
principal axis factoring (PAF). The maximum likelihood method (ML) is widely used and often recommended, but, it assumes multivariate normality. The distribution of the variables in this study violated this assumption, and therefore a principal factors method was chosen as recommended by Fabrigar et al. (1999, 277, 283).
In exploratory factor analysis, communalities (the amount of variance a variable shares with other variables) are estimated as being less than 1.00 because unique variance is removed. This means that the factors estimated are not completely defined by the variables presented in the data, and factors only partly explain the variance (Kline 1994, 44). This is theoretically more interesting than assuming a perfect measure. Determining the number of factors is crucial for the study (Fabrigar et al. 1999, 278). According to Malhotra and Birks (2003, 580-581) the number of factors can be determined a priori if a good theoretical foundation has been provided. It can also be determined by examining the eigenvalues of the factors in which only factors with eigenvalues greater than 1.00 are included (known as Kaiser’s criterion). Additionally, examining the scree plots (eigenvalues and factors are plotted against each other in graphical form) the number of factors can be concluded, accepting the factors above the greatest threshold (an elbow-like turning point) and leaving the others (the tail) even with eigenvalues above 1.00. According to Iacobucci (1994, 294), Kaiser’s criterion is not recommended because too many factors are usually extracted. On the other hand, the scree plot tests present difficulties because they are subjective and can be poorly grounded (see also Fabrigar et al. 1999, 278-279). However, according to Fabrigar et al. (1999, 278), too few factors is a more severe problem than too many factors, for example if variables are forced to load factors which do not measure the same latent construct. Then, in the rotated solutions, complex patterns are formed and interpretation is difficult. In this thesis, the scree plot test was used to extract the number of factors. These decisions were interpreted and grounded by previous research results found in the literature. Later, the number of factors was determined a priori based on the first exploratory results.
Besides the number of factors, the rotation of factors is important in exploratory factor analysis in order to interpret the factors. Rotation means increasing the number of zero loadings in the factor matrix (Iacobuzzi 1994, 297). Usually most of the variables are loaded to the first general factor, but they are also loaded to some other factors (Bryman and Cramer 1997, 284). In order to clarify the results and to have a simpler structure, transformations are made by rotating the factors. In the rotation process, factors are relocated in factor space to make them fit the data better. Factors can be rotated orthogonally (not letting them correlate to each other), whereas oblique rotation allows for intercorrelations (Iacobuzzi 1994, 297-301; Fabrigar et al. 1999). Determining between these two techniques is important. It has been assumed that uncorrelated factors give simpler constructs, and that uncorrelated factor loadings are easier to interpret (Fabrigar et al. 1999, 281-282). However, this is not always the case. Orthogonal rotation may hide the important information of correlation.

127
In an experiment by Fabrigar et al. (1999, 287), the orthogonal rotation produced many cross-factor loadings, and the oblique rotation produced clearer and simpler structure. Hypothetical factors such as dimensions of attitudes are most likely to correlate, and not allowing them to correlate may violate a true description of the data (Fabrigar et al. 1999, 282). However, in this thesis, the orthogonal rotation (VARIMAX) was computed in order to look for the uncorrelated dimensions of price attitudes to be used in further statistical analysis (avoiding the problem of multicollinearity). According to Iacobuzzi (1994, 300), the oblique (OBLIM) rotation should also be computed and correlations investigated. If any of intercorrelations are high (0.3 or more) the oblique rotation is recommended. In this study, the oblique rotation was tested with the data collected in 2001, and factors were not highly intercorrelated.
Kline (1994, 127) has suggested that in order to have reliable correlations large samples (more than 1000) should be used in the test construction. Although exploratory factor analysis can be computed with small samples (less than 100), the factors emerging from the analysis are unreliable (Bryman and Cramer 1997, 279). In this thesis, large samples were collected (more than 1000) in order to have a reliable factor structure. Furthermore, according to Kline (1994, 127), in constructing the measure there should be twice as many variables as are needed in the test, because then the variables with higher loadings can be selected. In the final measurement there should be five or six variables to measure one dimension, at least more than two (Foster et al. 2006, 74). The original price perception measurement developed by Lichtenstein et al. (1993) included 43 variables. However, due to an agreement with other research partners, all partners had a limited number of variables to be included in the questionnaires, thus there were only 15 variables in each of the scales in 2001 (the price attitude in general and the food price attitude) and only three variables measured each dimension.
Scale development can be perceived differently whether it is done for practical purposes or for theory construction. According to Reardon et al. (1995), when developing an applied scale for practical purposes efficiency should be taken into account. They argued that scales used by retailers must be cost efficient, meaning that validated scales should be developed with a minimum amount of questions. Scale constructs should include no more than 20 questions (Reardon et al. 1995, 87). One of the aims of this research project was to develop reliable and practical measurements for consumer testing purposes in the food industry. One of the demands for the scales was cost efficiency. As far as the price attitude scale was concerned the aim was to create 10 to 15 opinion statements with a capacity to discriminate Finnish consumers based on their favourable or unfavourable attitudes towards food prices. Chapter 6.3.1, the section outlining the limitations of this study discusses in more detail how the number of variables might have affected the reliability of measurements.

128
4.2.2 Confirmatory factor analysis and SEM
According to Fabrigar et al. (1999, 277), it is recommended to use exploratory factor analysis (EFA) to develop the model, and confirmatory factor analysis (CA) to specify the model in another study. This was the procedure in this thesis. In this study, the food price attitude model was assumed to have three dimensions based on exploratory factor analysis of the first data collected in 2001 (N=1158), and factors were interpreted in the light of previous results of other studies found in the literature. The food price attitude model was further developed with new data collected in 2002 (N=1156) and analysed with EFA. Three factors were extracted. In order to confirm the model for food price attitudes a new sample was collected in 2004 (2004b, n=1027). Confirmatory factor analysis was carried out with Lisrel (8.80) software (Jöreskog and Sörbom 1996), with half of the sample (n=399) randomly split using Pasw 17.0 software (former SPSS). Confirming the model was done without exploring it first with EFA as Russell (2002, 1644) thought appropriate. The model fit was retested using the other half of the sample (n=400) and the method of structural equation modelling (SEM) was used to discover the relationship between the food price attitude factors and the price estimations.
The name confirmatory factor analysis comes from the question whether the empirical data confirms the model assumed apriori. Some theoretical assumptions are made to construct the model: relationships and correlations are predicted between latent hypothetical variables (factors) and observed variables. Confirmatory factor analysis (CFA) is a theory-testing model and not a theory-generating model as exploratory factor analysis (EFA), yet, they are both based on correlations and covariance (Hair et al. 2006, 773). Usually CFA begins with correlations or a covariance matrix and the researcher determines the degree of correlations between the factors, between the individual variables, and between the individual variables with one or many factors. In EFA, relationships are also discovered but it does not pay attention to causal directions. In CFA, the causal relationships can be tested.
Confirmatory factor analysis is related to path analysis and it uses the same principles (Kline 1994, 80). With CFA the number of factors assigned apriori is tested, and measurement theory specifies the relationships between the latent variable and the variables with which it has been measured. CFA is related to structural equation modelling because structural equation modelling (SEM) is a method based on factor analysis and linear regression analysis (Hair et al. 2006, 711). With SEM both the measurement theory and the construct theory is used to investigate how well the empirical data fits to the constructed theoretical model (Hair et al. 2006, 774).
In CFA and in SEM, the path diagram is used to structure the model and relationships are described with arrows. Observed or latent variables can be independent (the source of causalities; arrows pointing outwards) or dependent (affected by other variables; arrows

129
pointing inwards). Similarly, in SEM latent variables (factors) can be independent (exogenous constructs) or dependent (endogenous constructs). However, with CFA there is no need to specify endogenous and exogenous latent variables because all constructs are treated as either exogenous or endogenous depending on the theory (reflective versus formative) (Hair et al. 2006, 776). In this thesis, confirmatory factor analysis was used in the 2004b sample for the measurement model specification and to confirm whether the simple three factor model was confirmed by the new consumer data (Hair et al. 2006, 735-737). Structural equation modelling, on the other hand, was used to investigate how latent variables of food price attitudes affected the willingness to pay estimations.
Confirmatory factor analysis is executed by using structural equation modelling principles, but it is closer to measurement modelling. In structural equation modelling, one can perceive six procedural features: 1) defining the constructs and operationalization, 2) developing the measurement model, 3) designing the study in order to gain empirical results, 4) assessing the validity of the model, 5) specifying the structural model, and 6) assessing the structural model validity (Hair et al. 2006, 734, see also Diamantopoulos and Siquaw 2000, 7, for more precise Lisrel modelling tasks). Operationalization of the Food Price Attitude measurement model was carried out based on the previous results of the 2002 exploratory factor analysis, and a simple measurement model was developed with 15 observed variables (Figure 15). The measurement models are usually presented as path diagrams. In Figure 20, “price” (price sensitivity), “quality” (quality consciousness) and “prestige” (prestige sensitivity) are latent variables and V1...15 are observed variables reflecting these latent constructs as indicators. An error term (δ1... δ15) is attached to each of the observed variables (V1...15) because it is impossible to have a perfect measurement (Diamantopoulos and Siquaw 2000, 22). Relationships between latent constructs are correlation not dependence relationships (Hair et al. 2006, 714-715). Each of the arrows in the path diagram represents the estimated parameters. The Food Price Attitude measurement model with 15 observed variables has a total of 33 parameters to be estimated. However, some the variables were removed from the final analysis affecting the number of estimated parameters which are reported in the results.

130
δ1 δ12 δ13δ5 δ11δ10δ9δ8δ7δ6δ4δ3δ2 δ14 δ15
V1 V2 V3 V4 V5 V6 V7 V8 V9 V10
V11
V12
V13
V14
V15
price quality prestige
Figure 15. A path diagram representation of the Food Price Attitude measurement model with 15 observed variables.
A construct like this can be seen as a recursive model with no reciprocal linkages (Diamantopoulos and Siguaw 2008, 18). One important step of Lisrel-modelling is model specification, meaning that the relationships between variables are formulated. The measurement equations of this model can be represented with mathematical symbols:
price: x1 = λ11 ξ1 + δ1,
x2 = λ21 ξ1 + δ2,
x3 = λ31 ξ1 + δ3,
x4 = λ41 ξ1 + δ4,
x5 = λ51 ξ1 + δ5,
x6 = λ61 ξ1 + δ6,
x7 = λ71 ξ1 + δ7,
x8 = λ81 ξ1 + δ8,
quality: x9 = λ92 ξ2 + δ9,
x10 = λ102 ξ2 + δ10,
x11 = λ112 ξ2 + δ11,
x12 = λ122 ξ2 + δ12,
x13 = λ132 ξ2 + δ13,
prestige: x14 = λ143 ξ3 + δ14,
x15 = λ153 ξ3 + δ15.
131
In the equations, there are three latent variables price (ξ1, KSI-1), quality (ξ2, KSI-2), and prestige (ξ3, KSI-3), the relationships between their indicators being values of LAMBDA (λ). For example, λ81 means the loading between the observed variable number eight and the first latent variableprice, and it is the parameter to be estimated in the process. Errors are denoted by DELTA (δ). The correlations between latent variables are denoted by PHI (φ). The same symbols can be found in SIMPLIS – language in the Lisrel program (8.80). The fourth step of Lisrel-modelling is model identification. This means whether there is enough information to produce all the required estimations. The model suggested in this thesis meets the identification requirements. This can be calculated by using the formula:
t ≤ s/2, where t = number of parameters to be estimated (t=33), s=p(p+1)/2, p= number of x-variables, (Diamantopoulos and Siguaw 2008, 48).
In this model, s=120 and it is greater than the parameters to be estimated (33 ≤ 120/2), and, therefore, the degrees of freedom is 87 (df = 120 - 33). The model is overidentified and can produce meaningful information of model fit. This kind of inspection of identification is not a guarantee that the model does not have an identification problem (Diamantopoulos and Siguaw 2008, 52); however, the Lisrel-program is sensitive enough to signal such problems.
When there is a need to specify a dependence relationship between two or more latent constructs, the structural model should be examined. Endogenous constructs are dependent on other constructs which can be either endogenous or exogenous. In this thesis, the structural model included The Food Price Attitude measurement model with three latent variables (price, quality and prestige) and the latent construct related to willingness to pay (WPay). Consumers’ willingness to pay was measured with two observed variables: 1) at what price would a subject be willing to buy the product in order to try it, and 2) at what price would a subject be willing to buy the product regularly. Consumers’ willingness to pay responses (price estimations) were standardized, and these standardized observations were used in the analysis.
Despite the fact that there are several elements which affect purchase situations, only food price attitude dimensions were measured in this model. Therefore, the relationships based on the linear regression were assumed to be weak. Nevertheless, the aim was to examine the isolated impact of the Food Price Attitude Scale on price estimations, however small. All causal relationships should be positive (the stronger the positive attitude towards high food prices the higher the price estimation) expressing the higher observed value. This also includes the attitudes towards the low food prices, because opinion statements in the priceconstruct were reversed to have the same direction as the qualityand the prestige dimensions. This is more thoroughly explained in chapter 5.1.

132
The simple structure was framed and the path diagram of the structural model is presented in Figure 16. Observed variables related to the Food Price Attitude Scale were reduced from 15 to 12 based on the scale development during 2002. In this model, the latent constructs related to quality perceptions (the willingness to a pay high price for quality), prestige (the willingness to pay high price for food offered to others) and price sensitivity (the willingness to look for low food prices) affect price estimations (WPay). Based on the logistic regression analysis in 2002 all factors had a statistically significant impact on willingness to buy premium-priced food products, (see chapter 5.2) and therefore they were assumed to have an effect on price estimations. Moreover, it was assumed that the latent constructs of qualityand prestigewould have a causal relationship with price(the willingness to look for low food prices). This assumption is based on the qualitative results and it means that if a person believes that a higher price is an indication of high quality, he or she is less willing to look for low prices, but, not the way around. A person might be willing to look for low food prices but he or she may still believe that one can get better quality at a higher price. A person can be in a monetary situation in which low food prices are preferred, but, it is unrelated to quality beliefs.
The structural model can be presented in mathematical equations. X-variables are observed variables related to quality perceptions, and thus the latent construct of quality is exogenous by nature, denoted as ξ1, (KSI-1) in SIMPLIS language in the Lisrel program (8.80). The relationships between their indicators are values of LAMBDA (λ). Errors are denoted by DELTA (δ). Measurement equations can be presented as follows:
quality: x1 = λ11 ξ 1 + δ1,
x2 = λ21 ξ1 + δ2,
x3 = λ31 ξ1 + δ3.
Observed y variables are indicators of the endogenous variables prestige(η1 ETA-1), price (η2 ETA-2), and WPay (η3 ETA-3). The parameters to be estimated are also denoted by LAMBDA (λ) between endogenous variables and indicators, but the error terms are presented as EPSILON (ε). Measurement equations for y variables can be presented as follows:
prestige: y1 = λ11 η1 + ε 1,
y2 = λ21 η1 + ε 2,
price: y3 = λ32 η2 + ε 3,
y4 = λ42 η2 + ε 4,
y5 = λ52 η2 + ε 5,
y6 = λ62 η2 + ε 6,
y7 = λ72 η2 + ε 7,

133
y8 = λ82 η2 + ε 8,
y9 = λ92 η2 + ε 9,
Wpay: y10 = λ103 η3 + ε 10,
y11 = λ113 η3 + ε 11.
ε10ε11
δ 1
δ 3
δ 2
λ11
λ31
λ21
EHL1
EHL3
EHL2
λ103 λ113
λ11
λ21
ε1
ε2
ε3
ε4
ε5
ε6
ε7
ε8
ε9
λ32
λ42
λ52
λ62
λ72
λ82
λ92
β31
β32
β21
ζ3 ζ2
ζ1
γ11
γ31
γ21
Quality ξ1
Prestige η1
Price η2
WPay η3
y-variables
x-variablesy-variables
EHA1
EHA3r
EHH1r
EHH3r
EHT2r
EHT3
EHV1r
EHV2
EHV3rZW- regular
ZW- try
Figure 16. A path diagram to illustrate the relationships between latent constructs of the Food Price Attitude (quality, prestige and price) and price estimations (WPay).
The model specification requires the linear equations of the relationships. In this model, it is assumed that all food price attitude dimensions have an effect on price estimations, but also that qualityand prestigemight have an impact on price sensitivity. Quality is an exogenous variable because no arrow points towards it, and thus it is not dependent on other variables. Therefore, quality is only presented with measurement equations. Relationships between endogenous variables and the exogenous variable are denoted by GAMMA (γ). Prestigeand price are both endogenous (prestige depends on quality, and price depends on qualityand

134
prestige) and exogenous (they affect WPay). The relationships between endogenous variables are denoted by BETA (β).WPay is an endogenous variable in this model which depends on the food price attitude dimensions. The error terms related to endogenous variables and to equations are denoted by ZETA (ζ). Structural equations are assumed to be linear in nature, and thus linear functions (f) are specified. Relationships between price estimations (WPay) and other latent constructs can be presented in a mathematical equation as follows:
WPay = f(prestige, price, quality, error), (WPay) η3= β31η1 + β32η2 + γ 31ξ1 + ζ3.
The other structural equations are presented as follows:
(prestige) η1= γ 11ξ1 + ζ1, and(price) η2= β21η1 + γ 21ξ2 + ζ2.
Model identification can be calculated thus according to Diamantopoulos and Siguaw (2008, 54): t≤[(p+q)(p+q+1)]/2, where t= the number of parameters to be estimated, p= number of y-variables and q= the number of x-variables. In this model: 34 ≤ [(11+3)*(11+3+1)]/2, and further 34 <105. The model does not have the identification problem (df = 105-34 = 71).
In the process of parameter estimation, the method of maximum likelihood was chosen. According to Jöreskog and Sörbom (1996, 239) with the maximum likelihood method the goodness-of-fit measures are unreliable if the variables are highly non-normal as was the case with the 2004b sample used in this analysis. They suggested by referring to Browne’s (1984) work that in the case of a highly non-normal distribution the generally weighted least-squares method (WLS) should be used requiring an asymptotic covariance matrix (ref. Jöreskog and Sörbom (1996, 239). However, to calculate asymptotic covariance matrix a large sample is needed (more than a thousand, see Diamantopoulos and Siguaw 2008, 57). Jöreskog and Sörbom (1996, 239) assumed that if the WLS is done with a smaller sample the results are at least as unreliable as when the maximum likelihood method is used. According to Hair et al. (2006, 743), the maximum likelihood method has been discovered to be robust also in the non-normal distribution and reliable results have been attained in different situations.
Sample size has been widely discussed when structural equation modelling is used. The Lisrel program ignores the missing values and if the cases of missing values are great in number the effective sample size may become too small. According to Hair et al. (2006, 741), the recommended sample size is within the range 150-400. With a sample larger than 400 subjects SEM becomes sensitive to all the differences detected in the covariance matrix and it indicates a poor model fit with goodness-of-fit measures. Several large consumer samples were used in this thesis. However, only one was used to confirm the scale. In order to get a

135
test-retest condition, the 2004b sample (N=1027) was split randomly in half using PASW 17.0 software program. First, the total sample was purified from missing values and outliers (the total effective sample size being 799). With the first half (n=399) the measurement model was tested, and with the other half (n= 400) the structural model was confirmed. With this procedure the effect of a large sample size was minimized. However, the possibility of using an asymptotically distribution free estimation method (WLS) was lost.
4.2.3 Logistic regression analysis
The most frequently used statistical method of analysis in social sciences is the regression. It has been used to investigate relationships between variables. In this study, regression analysis was needed to investigate the relationships between the food price attitude factors and the willingness to buy high priced food products. Another approach is multiple discriminant analysis if there is a need for classifications and a predicting power is to be estimated. However, these techniques assume a great deal from the variables and from the data (e.g., a normal distribution). Therefore, when the dependent variable is dichotomous, logistic regression is suggested (Hair et al. 2006, 355). In this thesis, the 2002 data was not suitable for discriminant analysis, and because it was possible to create two clearly separated groups based on the consumers’ willingness to pay premium price, logistic regression analysis was chosen.
Logistic regression analysis deals with predicting group memberships, the groups being able to reflect the outcome of the event. The dependent variable is binary, getting values 1 (e.g. something happens) and 0 (e.g. something does not happen), and in the analysis observations are assigned into groups. In this study, logistic regression is used to answer the question: “Do any of the food price attitude dimensions predict the consumers’ willingness to buy premium-priced food products?” Subjects were divided into two separate groups. In one group, subjects were willing to buy premium-priced food products with different kinds of benefits such as a health effect, better taste, better quality of ingredients, more natural, or more modern technology. In the other group, subjects were unwilling to buy food products with a higher price with any extra benefits. It was investigated using logistic regression analysis whether any of the food price attitude dimensions might be able to predict in which group the subject belonged.
Logistic regression analysis does not assume that a sample must be normally distributed nor does it assume a linear relationships between dependent and independent variables (Foster et al. 2006, 58). Instead, it uses the logistic curve to reflect the relationship between these variables, and for each observation a probability value is predicted (Hair et al. 206, 356). Logistic regression analysis deals with odds and odd ratios (Foster et al. 2006, 59). Computer programs look at the differences between predicted values and observed values

136
(residuals), and then adjust the values to the equations and re-examine the goodness-of-fit with the data (Foster et al. 2006, 59). According to Hair et al. (2006, 361), the goodness-of-fit can be estimated with the likelihood value -2 LL (-2 log likelihood) (like the sum of squares (R2) in the analysis of multiple regression), and, the lower the value the better fitting model. The model fit can be assessed with predictive accuracy similar to the classification matrix in discriminant analysis.
Logistic regression was conducted in order to investigate the predictive power of the Food Price Attitude Scale. The forward stepwise method of estimation was selected because it allows one to investigate separately each of the factors included in an analysis. The factor with the greatest contribution is added first and other independent variables are included if the model becomes better in predicting memberships (Hair et al. 2006, 209-213). The main purpose of multiple and logistic regression analysis is to find the best group of independent variables with the most accurate predictive ability. One could also add several background variables as independent variables into the model in order to describe relationships between food price attitudes and socio-demographical variables. However, this was not done in this study. A large variety of independent variables can cause the problem of multicollinearity and direct correlations may affect the final regression model in a way which is not beneficial to the theory. Moreover, the large variety of variables will always generate a loss of control because every variable added to the regression equations will affect the other variables, and one can end up with only a few theoretically meaningless variables with some predictive accuracy (Hair et al. 2006, 212-213). In order to avoid the problem of multicollinearity between the food price attitude dimensions the original orthogonally rotated factor scores were used in the analysis. The food price attitude dimensions were investigated in isolation in order to purify the impact of each of the factors and to investigate the predictive power of the factors separately.
4.2.4 Cluster analysis
Cluster analysis is one of the multivariate techniques used to group cases based on some features they possess. The aim of cluster analysis is to classify cases into groups in a manner in which one group is internally homogenous and heterogeneous compared to other groups. Cluster analysis has been criticized for its lack of statistical foundation in forming groups and no unique solutions are guaranteed. Clusters are created even if no real structure exists in the data (Hair et al. 2004, 560-561). Thus, according to Hair et al. (2004, 581-582), every effort should be taken to guarantee that the sample is representative and the multicollinearity should be avoided. Despite this criticism cluster analysis is a useful tool for making differences within the respondents transparent and cluster analysis is used here as a descriptive tool.

137
In this study, the aim was to investigate how Finnish consumers differed based on the food price attitude dimensions. Further, it sought to test to what extent the Food Price Attitude Scale developed here was able to capture the differences and similarities between consumers in several consumer data sets. Because these measurements were under developing process, it was not thought possible to definitely identify the food price attitudinal segments of Finnish consumers or make far-reaching claims about the profiles of those segments. However, even though there was no need for generalize the results, all three samples analyzed using cluster analysis were somewhat representative and orthogonally rotated factor scores of food price attitude dimensions were used to avoid the possible problem of multicollinearity.
In cluster analysis, the major task is to measure similarity. Groups are based on the similarity of the observations. Similarity is measured by pair-wise comparisons and the degree of correspondence among the objects (Hair et al. 2006, 563). Clusters can be produced hierarchically using a stepwise method beginning with the closest observations and combining them with others (Hair et al. 2006, 564). In this thesis, the hierarchical cluster analysis with Ward’s Method was used first in order to investigate the optimum number of clusters related to the food price attitude dimensions. The similarity measured in Ward’s method is actually the sum of squares value, and the clusters are formed by optimizing the minimal increase in total sum of squares among all variables. Hierarchical clustering generates all possibilities from one-member clusters to one-cluster solutions, and thus investigating the optimum cluster solution is possible.
Unfortunately, there are no statistical tests to identify the optimum number of clusters, and researchers must make that decision by evaluating many possibilities. According to Hair et al. (2006, 594-595) several rules are to be taken into account: 1) extremely small clusters should be avoided, 2) the number of clusters can be identified by studying the rate of change in heterogeneity (e.g. agglomeration coefficiences in SPSS programs), 3) all clusters are significantly different from each other, 4) all clusters should always have some theoretical validity. In this thesis agglomeration coefficiences were studied and the “ad hoc stopping rule” was used by detecting the critical points of large increases (Hair et al. 2006, 594). This method suggested three to five cluster solutions. These cluster solutions were further evaluated by studying the differences between the clusters. A four-cluster solution was chosen because all clusters were significantly different and it produced theoretically solid groups. Clusters were equal in size, and a four-cluster solution was the most descriptive.
K-mean cluster analysis (using SPSS software) was used in order to form the four clusters in each of the three consumer samples 2002 (N=1156), 2004a (N=1113), and 2004b (N=1027) based on the food price attitudes. It was also used in 2002 to identify significantly different consumer groups based on their willingness to buy food products at a premium price. This method of analysis is a non-hierarchical cluster procedure with two functions: 1) selecting cluster seeds, 2) classifying observations on cluster seeds based on similarity (Hair et al.

138
2006, 589). In the SPSS program, the cluster seeds are picked randomly from the data, and thus the replication of the clusters is not guaranteed either in the different samples or in the same sample. One cluster seed has a certain distance to other seeds and the similarity of the observations is measured with the distance to the cluster seeds. Cluster seeds are the centre points around which observations are assigned to by using clustering algorithms (K-means clustering). One of the clustering algorithms is named optimization (in SPSS) and with this method observations can be reassigned to another cluster seed if that cluster comes closer than the original cluster. This is the main benefit of the non-hierarchical method. The analysis is in continuous change during the clustering procedure, and some comparisons made at the beginning will probably be changed by the end of the process. In the hierarchical method this is not possible. (Hair et al. 589-590.)
Both hierarchical and non-hierarchical methods of clustering have advantages and disadvantages and a combination of both methods has been suggested by Hair et al. (2006, 590-593). In this study, the advantages of both methods have been utilized. First, the hierarchical method produced the entire range of cluster solutions and the optimum cluster solution was investigated. However, the consumer samples were large (more than thousand), and therefore a non-hierarchical method was used to investigate the similarities of the consumers and to produce more accurate cluster memberships.
The nature of the cluster analysis is descriptive and it requires some other support to achieve relevance. The cluster seeds are randomly chosen by SPSS software program (QUICK CLUSTER), and thus there is no guarantee that the cluster seeds are similar in each procedure. Therefore, validation of the clusters based on the Food Price Attitude Scale was essential; this was done in this study by clustering different consumer samples. In this thesis, initial clustering was conducted with a consumer sample collected in 2002 (N=1156). A four-cluster solution was chosen and described. Cluster profiles relating to socio-demographical variables were also explored. This has been explained in chapter 5.3 in more detail. In addition, two other consumer samples were collected in spring 2004 (2004a in May, N=1113, and 2004b in April, N=1027), and K-means cluster analyses were similarly carried out in order to explore whether the cluster structure was found and supported within these new data samples. In all data samples, the same cluster structure was detected and described (see results in chapter 5.3.3), and thus confirmed.

139
5 Results of the surveys
Results of several analyses are presented in this chapter: a preliminary study to define the measures of food price attitudes, the development of these measures, and a confirmation and a purification of the Food Price Attitude Scale. The first quantitative data (N=1158) representing Finnish consumers was collected in December 2001. With this survey, the preliminary work for constructing the Food Price Attitude Scale was completed and comparisons to the General Price Attitude Scale were made. Exploratory factor analysis was used to identify dimensions relating to food price attitudes. The second data representing Finnish consumers was collected in December 2002 (N=1156) in order to develop the Food Price Attitude Scale by means of exploratory factor analysis. Logistic regression analysis was also conducted in order to investigate whether consumers with positive attitudes towards high food prices were more willing to buy premium-priced food products (hypothesis H1) than others. The Food Price Attitude Scale was confirmed a new data sample collected in April 2004 (2004b, N=1027) with confirmatory factor analysis (Lisrel 8.80). Scale confirmation was made with the other half of the data sample (n=399) while structural model was tested with the other half (n=400). It was also investigated whether there is a relationship between price attitude dimensions and given price estimations (hypothesis H2) using the structural equation modelling method. K-means cluster analysis was used to investigate how consumers differed based on the food price attitude dimensions, and the discriminant validity of the scale was tested with different data samples (2002, 2004a, and 2004b).
5.1 Developing the Food Price Attitude Scale
The Food Price Attitude Scale was developed in several phases. In chapter 4.1.3, the process of testing the first survey questions is described. As was previously discussed in chapter 2.4 the development of the Food Price Attitude Scale was based on the Price Perception Scale (PPS) introduced by Lichtenstein et al. (1993). The original PPS included seven separate dimensions measured with 43 questions (Appendix 1). In the survey carried out in 2001, all statements were revised to fit better to local consumers as has been done in previous research related to the PPS (Meng and Nasco 2009, 508), and therefore no similar dimensional structure was guaranteed. Additionally, reducing opinion statements from 43 to 15 would change the structure of the dimensions in exploratory analysis. In the final questionnaire, 15 statements on price attitudes in general (Table 7) and 15 statements related to food price attitudes (Table 8) were presented in the same questionnaire with some distance between, and they were analyzed by using exploratory factor analysis (SPSS software).

140
Table 7. Opinion statements relating to price attitudes in general (all statements were presented to the subjects only in Finnish) adapted from Lichtenstein et al. (1993).
GENERAL PRICE ATTITUDE
Consumers’ willingness to look for low prices (price consciousness)
YHH1R Looking for low priced products is worth the trouble.
YHH2Looking for bargains from different stores one saves so little that it is not worth it.
YHH3 I don’t bother to look for low-priced products.
Consumers’ willingness to search for value for money (value consciousness)
YHV1 R Even though a low price is important to me I don’t bargain with quality.
YHV2 R I generally shop around for products with the best price-quality relationship.
YHV3 R I try to buy products at the best value for money.
Consumers’ willingness to buy products at sales (sale proneness)
YHT1 I seldom buy products at sales.YHT2 R If the product is on sale it’s worth buying it.YHT3 R I buy unnecessary products at sales.
Consumers’ beliefs that good quality costs money (price-quality schema)
YHL1 You have to pay more to get the best quality
YHL2The old saying: “You can’t get good quality at a cheap price” is generally true.
YHL3 In general, the higher the price the better the quality.Consumers’ beliefs that premium-priced brands are appreciated (prestige sensitivity)
YHA1 People notice a high-priced brand.YHA2 I get better service if I buy a high-priced brand.
YHA3 R It doesn’t make any difference whether I buy a high-priced brand or a cheaper product.xR = reversed opinion statement
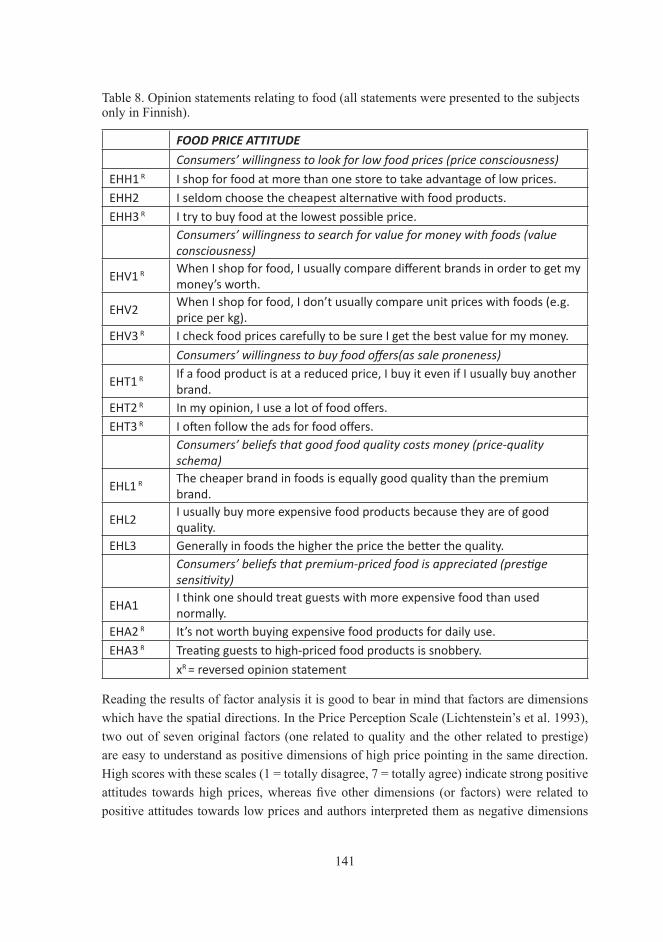
141
Table 8. Opinion statements relating to food (all statements were presented to the subjects only in Finnish).
FOOD PRICE ATTITUDE
Consumers’ willingness to look for low food prices (price consciousness)
EHH1 R I shop for food at more than one store to take advantage of low prices.EHH2 I seldom choose the cheapest alternative with food products.EHH3 R I try to buy food at the lowest possible price.
Consumers’ willingness to search for value for money with foods (value consciousness)
EHV1 R When I shop for food, I usually compare different brands in order to get my money’s worth.
EHV2When I shop for food, I don’t usually compare unit prices with foods (e.g. price per kg).
EHV3 R I check food prices carefully to be sure I get the best value for my money.
Consumers’ willingness to buy food offers(as sale proneness)
EHT1 R If a food product is at a reduced price, I buy it even if I usually buy another brand.
EHT2 R In my opinion, I use a lot of food offers.EHT3 R I often follow the ads for food offers.
Consumers’ beliefs that good food quality costs money (price-quality schema)
EHL1 R The cheaper brand in foods is equally good quality than the premium brand.
EHL2I usually buy more expensive food products because they are of good quality.
EHL3 Generally in foods the higher the price the better the quality.Consumers’ beliefs that premium-priced food is appreciated (prestige sensitivity)
EHA1I think one should treat guests with more expensive food than used normally.
EHA2 R It’s not worth buying expensive food products for daily use.EHA3 R Treating guests to high-priced food products is snobbery.
xR = reversed opinion statement
Reading the results of factor analysis it is good to bear in mind that factors are dimensions which have the spatial directions. In the Price Perception Scale (Lichtenstein’s et al. 1993), two out of seven original factors (one related to quality and the other related to prestige) are easy to understand as positive dimensions of high price pointing in the same direction. High scores with these scales (1 = totally disagree, 7 = totally agree) indicate strong positive attitudes towards high prices, whereas five other dimensions (or factors) were related to positive attitudes towards low prices and authors interpreted them as negative dimensions

142
of price. According to Lichtenstein’s et al. (1993) a respondent scoring high with these dimensions would have a favourable attitude to cheap prices, and thus unfavourable attitude towards high prices. Therefore, these factors would point in the opposite direction. However, it is important for technical reasons to have factors which point in the same direction in order to investigate the same latent variable. In order to get all factors to point in the same direction, all positively formulated statements relating to positive attitudes towards low prices were reversed. Similarly, all negative opinion statements relating to positive attitudes towards high prices were reversed. With these modifications all scales had the same direction and measured unfavourable or favourable attitudes towards high prices. For example, a subject totally agrees (scores 7) with the question “Itrytobuyfoodatthelowestpossibleprice.”This means that person has a strong positive opinion towards a low food price. By reversing it to totally disagree (scores 1) it describes that this person has an unfavourable opinion or is indifferent towards high prices. If another person totally disagrees with this statement (scores 1 with the Likert scale) expressing no interest in looking for cheap prices, it can be reversed to 7 to indicate an opinion either neutral or strongly favourable towards high prices.
In some previous research, the meaning of price has been measured with one dimensional scale (e.g., the Food Choice Questionnaire by Steptoe et al. 1995) with the assumption that a low price is favourably interpreted (high importance scores) and a high price is unfavourably interpreted (low importance scores). In this thesis, the multidimensionality of price perceptions has been taken into account. The seven point Likert scales (1 = totally disagree, 7 = totally agree) used in these opinion statements express the strength of attitudes towards high or low prices separately. However, there is no guarantee that strong disagreement, for example in negative attitudes towards low prices, is a strong statement of agreement in the case of positive attitudes towards high prices, even though this is assumed by Lichtenstein et al. (1993). In this thesis, the results of the qualitative data suggest that one can have positive attitudes towards both low and high prices, and being positive towards low food prices does not mean that one is negative towards high prices.
5.1.1 Price attitude in general or the food price attitude
According to the qualitative study, the subjects made a difference whether they talked about the prices of food products or the prices of durables. This was confirmed in the large sample, and one aim of the quantitative study in 2001 was to investigate whether there was a need for specific questions relating to food in order to measure food price attitudes. From this data, the differences between consumers’ price attitudes in general and those related to foods were analysed. First, the observed variables towards price perceptions in general were factor analysed using principal axis factoring and Varimax-rotation with PASW 17.0 software. The theoretical assumptions behind these methods of analyses are discussed in chapter 4.2.1.
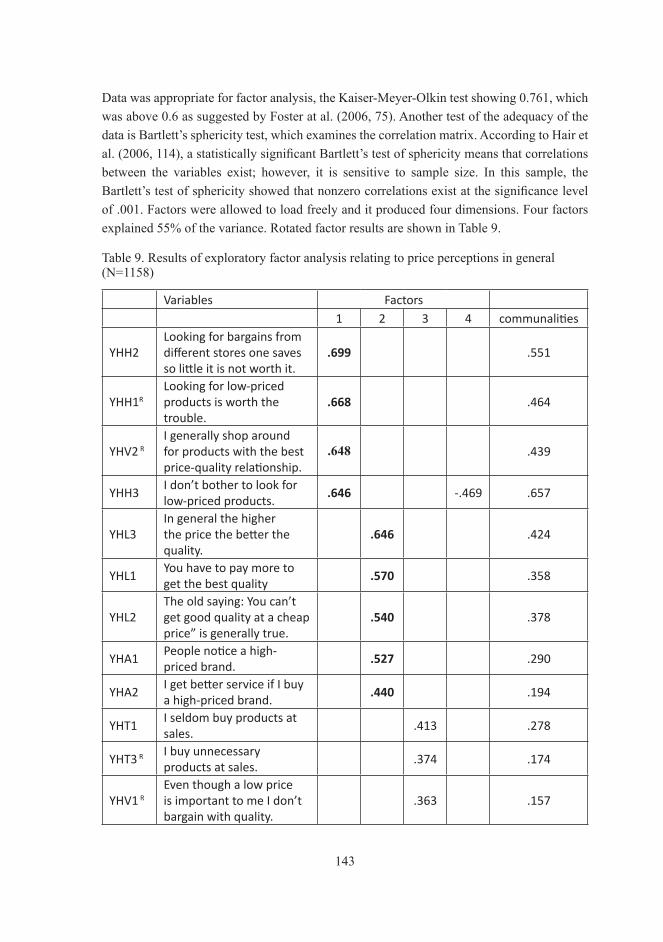
143
Data was appropriate for factor analysis, the Kaiser-Meyer-Olkin test showing 0.761, which was above 0.6 as suggested by Foster at al. (2006, 75). Another test of the adequacy of the data is Bartlett’s sphericity test, which examines the correlation matrix. According to Hair et al. (2006, 114), a statistically significant Bartlett’s test of sphericity means that correlations between the variables exist; however, it is sensitive to sample size. In this sample, the Bartlett’s test of sphericity showed that nonzero correlations exist at the significance level of .001. Factors were allowed to load freely and it produced four dimensions. Four factors explained 55% of the variance. Rotated factor results are shown in Table 9.
Table 9. Results of exploratory factor analysis relating to price perceptions in general (N=1158)
Variables Factors1 2 3 4 communalities
YHH2Looking for bargains from different stores one saves so little it is not worth it.
.699 .551
YHH1R
Looking for low-priced products is worth the trouble.
.668 .464
YHV2 R
I generally shop around for products with the best price-quality relationship.
.648 .439
YHH3I don’t bother to look for low-priced products.
.646 -.469 .657
YHL3In general the higher the price the better the quality.
.646 .424
YHL1You have to pay more to get the best quality
.570 .358
YHL2The old saying: You can’t get good quality at a cheap price” is generally true.
.540 .378
YHA1People notice a high-priced brand.
.527 .290
YHA2I get better service if I buy a high-priced brand.
.440 .194
YHT1I seldom buy products at sales.
.413 .278
YHT3 R I buy unnecessary products at sales.
.374 .174
YHV1 R
Even though a low price is important to me I don’t bargain with quality.
.363 .157
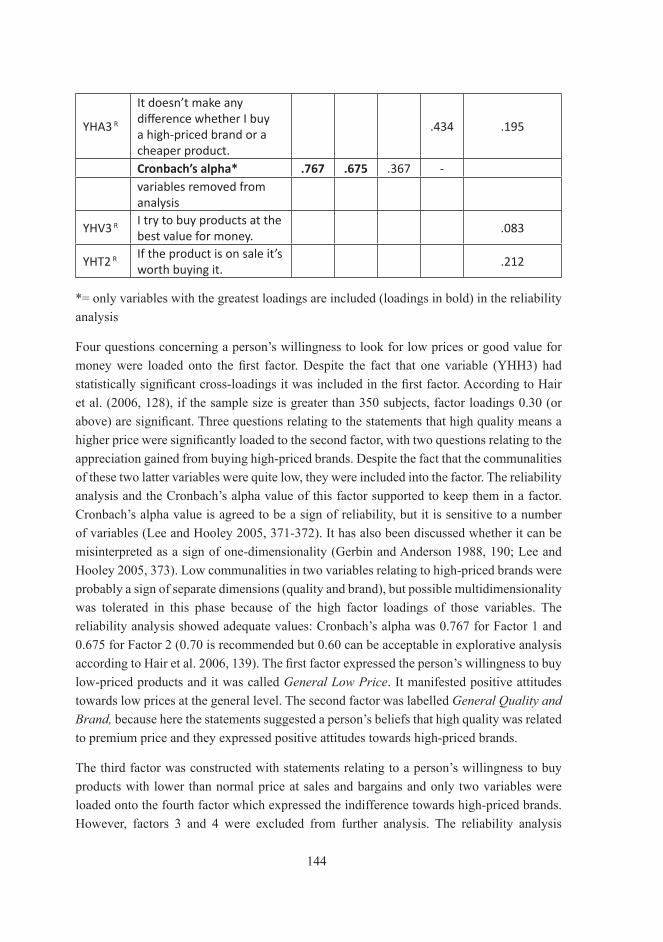
144
YHA3 R
It doesn’t make any difference whether I buy a high-priced brand or a cheaper product.
.434 .195
Cronbach’s alpha* .767 .675 .367 -variables removed from analysis
YHV3 R I try to buy products at the best value for money.
.083
YHT2 R If the product is on sale it’s worth buying it.
.212
*= only variables with the greatest loadings are included (loadings in bold) in the reliability analysis
Four questions concerning a person’s willingness to look for low prices or good value for money were loaded onto the first factor. Despite the fact that one variable (YHH3) had statistically significant cross-loadings it was included in the first factor. According to Hair et al. (2006, 128), if the sample size is greater than 350 subjects, factor loadings 0.30 (or above) are significant. Three questions relating to the statements that high quality means a higher price were significantly loaded to the second factor, with two questions relating to the appreciation gained from buying high-priced brands. Despite the fact that the communalities of these two latter variables were quite low, they were included into the factor. The reliability analysis and the Cronbach’s alpha value of this factor supported to keep them in a factor. Cronbach’s alpha value is agreed to be a sign of reliability, but it is sensitive to a number of variables (Lee and Hooley 2005, 371-372). It has also been discussed whether it can be misinterpreted as a sign of one-dimensionality (Gerbin and Anderson 1988, 190; Lee and Hooley 2005, 373). Low communalities in two variables relating to high-priced brands were probably a sign of separate dimensions (quality and brand), but possible multidimensionality was tolerated in this phase because of the high factor loadings of those variables. The reliability analysis showed adequate values: Cronbach’s alpha was 0.767 for Factor 1 and 0.675 for Factor 2 (0.70 is recommended but 0.60 can be acceptable in explorative analysis according to Hair et al. 2006, 139). The first factor expressed the person’s willingness to buy low-priced products and it was called GeneralLowPrice. It manifested positive attitudes towards low prices at the general level. The second factor was labelled GeneralQualityandBrand,because here the statements suggested a person’s beliefs that high quality was related to premium price and they expressed positive attitudes towards high-priced brands.
The third factor was constructed with statements relating to a person’s willingness to buy products with lower than normal price at sales and bargains and only two variables were loaded onto the fourth factor which expressed the indifference towards high-priced brands. However, factors 3 and 4 were excluded from further analysis. The reliability analysis

145
revealed low Cronbach’s alpha value in the third factor, and, additionally, the communalities of the variables in the third factor were low. The fourth factor consisted of only one variable (another variable had a stronger cross-loading to the first factor). Interpreting these factors was also difficult. It was impossible to say whether the statements relating to bargains in the third factor expressed a negative or positive attitude towards the high prices. A person may be positive towards high prices and quite pleased if he or she gets the high-priced brand at a reduced price. The variable relating to the fourth factor expressed indifference towards high-priced brands, but it would be difficult to say whether this means negative attitudes towards high prices or indifference towards brands. Additionally, one item factor is not recommended (Kline 1994; Borsboom et al. 2003).
The food-related opinion questions were also investigated using exploratory factor analysed (principal axis factoring and Varimax rotation). The data was adequate for the analysis because the Keiser-Meyer-Olkin measure was 0.825, and the Bartlett’s test of sphericity was significant. Variables explained 59% of the total variance. Factors were allowed to load freely. The orthogonally rotated factor solution produced four dimensions: 1) eight questions concerning a willingness to look for cheap food prices or food offers and a willingness to get value for money were loaded onto the first factor, 2) four questions relating to the high food prices and high food quality were loaded onto the second factor, and 3) two questions relating to entertaining others using premium-priced food were loaded onto the third factor. There were several cross-loadings as was a case with the general questions. Only one variable loaded to the fourth factor with several cross-loaded variables. Factor loadings, communalities and Cronbach’s alpha values are presented in Table 10.

146
Table 10. Factor loadings of variables relating to food price attitudes
Variables relating to food price attitudes
Factors
1 2 3 4 communalities
EHV3rI check food prices carefully to be sure I get the best value for my money.
.749 .565
EHT2rIn my opinion I use a lot of food offers.
.730 .239 .610
EHV1When I shop for food, I usually compare different brands in order to get my money’s worth.
.681 .492
EHT3I often follow the ads for food offers.
.670 .507
EHH1I shop for food at more than one store to take advantage of low prices.
.638 .440
EHV2When I shop for food, I don’t usually compare unit prices in foods (e.g. price per kg).
.506 .326 -.283 .445
EHT1If the food product is on offer, I buy it even if I usually buy another brand.
.490 .211 .304 .381
EHH3rI try to buy food at the lowest possible price.
.490 .422 .475
EHL2I usually buy more expensive food products because they are of good quality.
.678 .540
EHL3Generally in foods the higher the price the better the quality.
.493 .272
EHH2rI seldom choose the cheapest alternative with food products.
.298 .444 .297
EHL1rThe cheaper brand in foods is equally good in quality than the premium brand.
.209 .282 .173
EHA3rTreating guests to high-priced food products is snobbery.
.218 .760 .650
EHA1I think one should treat guests to more expensive food than used normally.
.704 .512
EHA2rIt’s not worth buying expensive food products for daily use.
.593 .364
Cronbach’s alpha* .843 .549 .689 -
*= only variables with the greatest loadings are included (loadings in bold) in the reliability analysis

147
The first factor showed good reliability (Cronbach’s alpha value 0.843), and the alpha value of the third factor (0.689)was adequate. However, Cronbach’s alpha value for the second factor (0.549) indicated some inconsistency. Item-total statistics did not suggest that any of the items should be removed from the analysis in order to improve the alpha value. The second and third factor had lower alpha values than the major factor (according to Bryman and Cramer 1997, 284, the first general factor usually explains the biggest variance), but Cronbach’s alpha value is also related to a number of items (Lee and Hooley 2005, 371-372). As can be seen from Table 10, some of the variables loaded onto several factors, meaning that the variables can be interpreted in many ways and do not exclusively measure only one dimension. This can also affect the reliability. Cross-loadings are probably due to orthogonal rotation (Fabrigar et al. 1999, 287). Forcing the factors on orthogonal positions creates the situation that variables can have a distance of the same length onto two factors.
The first factor comprising eight items was named Low Food Price. The second factor was named FoodQuality and the third FoodPrestige. The third factor was interpreted as respondents’ willingness to offer high-priced food to guests in order to impress them and gain appreciation from others. The fourth factor was not included in the further analysis because a factor with only one variable is neither meaningful nor reliable in manifesting a latent variable (Borsboom et al. 2003).
Summed variables were computed based on the results of exploratory factor analysis and the mean scores were calculated (Table 11). It must be notified that the mean value of the LowFoodPrice (3.63) is actually the reversed value of the positive attitudes towards low food prices due to reversing of the positive opinion statements. By reversing it again from 3.63 to 4.37 it shows the strength of the positive attitudes towards low food prices. Similarly, the mean value of the GeneralLowPrice dimension (3.74) is actually 4.26 when it expresses the strength of the positive attitude towards low prices in general. In 2001, Finnish consumers were quite neutral about both negative and positive attitudes towards high food prices. However, standard deviations suggested that further inspection was needed. Furthermore, consumers seemed to be more positive about high prices in general than they were in the food context. The correlation between low price measurements was high and significant. The correlation between quality dimensions was also statistically significant. However, in the large data sets even small correlations easily become statistically significant (Hair et al. 2004).

148
Table 11. Statistical measures of location and correlations between summed variables of the general price attitudes and food price attitudes among Finnish consumers in 2001 (N=1158).
Food price dimensions/factors mean sd mode medianLow Food Price (reversed mean 4,37) (LFPRICE)
3.63 1.29 4 3.63
Food Quality (FQUALITY) 3.91 1.05 4 4,00Food Prestige (FPRESTIGE) 3.79 1.62 4 4,00General price dimensions/factorsGeneral Low Price (reversed mean 4,26) (GLOWPRICE)
3.74 1.30 5 3.80
General Quality and Brand (GQUALITY) 4.56 1.18 5 4,60
Correlations of dimensionsSpearman’s correlation
sig.
Low food Price → General Low Price .585** .000Food Quality → General Quality and Brand
.384** .000
Food Quality → Low food price .308** .000
Food Quality → General Low Price .213** .000
Food Quality → Food Prestige .201** .000Food Prestige → General Quality and Brand
.169** .000
Low food price → General Quality and Brand
.058 .049
Low food price → Food Prestige .049 .096General Low Price → General Quality and Brand
.041 .161
General Low Price → Food Prestige .024 .409
** significant at the level p< 0.001
The high correlation between the Low Food Price and General Low Price dimensions suggested that subjects answered the questions relating to low prices without product specifications (general price) in the same way than the questions relating to low food prices. Significant correlation between the GeneralQualityandBrand and FoodQuality dimensions indicates that respondents answered the questions relating to food quality and quality without product specifications (general quality) in a same way, but not that strongly.
The correlations between the scales did not support the assumptions that food specific scale was needed. However, the differences between the quality dimensions were further explored. Subjects were divided into two groups based on the values given to the summed variable of GeneralQualityandBrand dimension. It was investigated how the subjects with
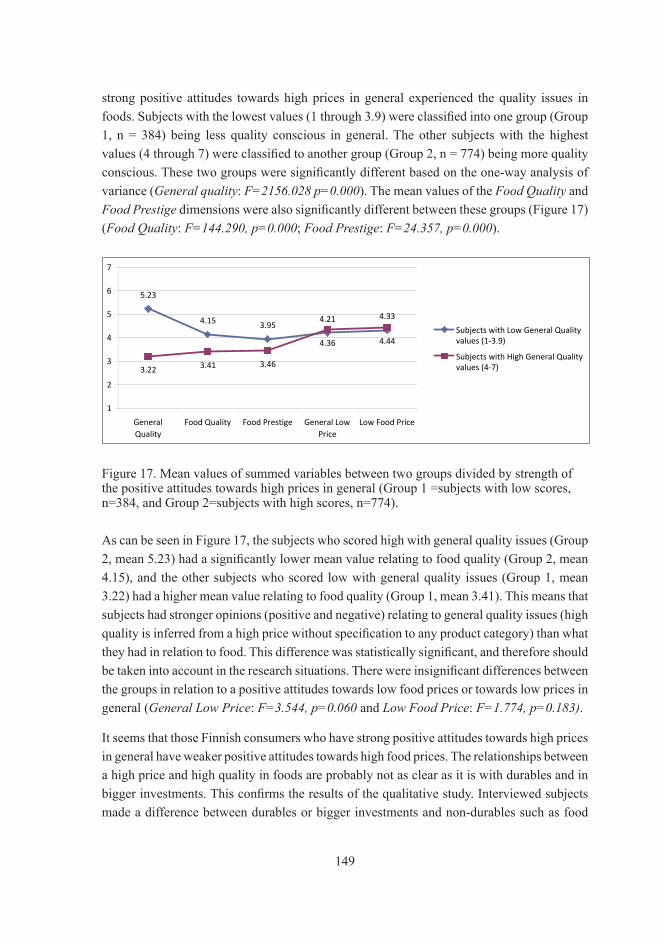
149
strong positive attitudes towards high prices in general experienced the quality issues in foods. Subjects with the lowest values (1 through 3.9) were classified into one group (Group 1, n = 384) being less quality conscious in general. The other subjects with the highest values (4 through 7) were classified to another group (Group 2, n = 774) being more quality conscious. These two groups were significantly different based on the one-way analysis of variance (Generalquality: F=2156.028p=0.000). The mean values of the FoodQuality and FoodPrestige dimensions were also significantly different between these groups (Figure 17) (FoodQuality: F=144.290,p=0.000; FoodPrestige: F=24.357,p=0.000).
11 % 17 % 21 % 23 % 12 % 15 %
7 % 19 % 17 % 25 % 15 % 17 %
13 % 28 % 26 % 17 % 10 % 6 %
10 % 18 % 22 % 23 % 12 % 16 %
0 % 20 % 40 % 60 % 80 % 100 %
Group 1 (n=383)
Group 2 (n=111)
Group 3 (n=417)
Group 4 (n=245)
under 10000 €
10001-20000 €
20001-30000 €
30001-40000 €
40001-50000 €
over 50000 €
31 % 24 % 45 %
20 % 29 % 51 %
47 % 28 % 25 %
28 % 31 % 41 %
0 % 20 % 40 % 60 % 80 % 100 %
Group 1 (n=383)
Group 2 (n=111)
Group 3 (n=417)
Group 4 (n=245)
little of money ( 1-3)
neutral (4)
plenty of money (5-7)
5.23
4.15 3.954.21 4.33
3.22 3.41 3.46
4.36 4.44
1
2
3
4
5
6
7
GeneralQuality
Food Quality Food Prestige General LowPrice
Low Food Price
Subjects with Low General Qualityvalues (1-3.9)
Subjects with High General Qualityvalues (4-7)
Figure 17. Mean values of summed variables between two groups divided by strength of the positive attitudes towards high prices in general (Group 1 =subjects with low scores, n=384, and Group 2=subjects with high scores, n=774).
As can be seen in Figure 17, the subjects who scored high with general quality issues (Group 2, mean 5.23) had a significantly lower mean value relating to food quality (Group 2, mean 4.15), and the other subjects who scored low with general quality issues (Group 1, mean 3.22) had a higher mean value relating to food quality (Group 1, mean 3.41). This means that subjects had stronger opinions (positive and negative) relating to general quality issues (high quality is inferred from a high price without specification to any product category) than what they had in relation to food. This difference was statistically significant, and therefore should be taken into account in the research situations. There were insignificant differences between the groups in relation to a positive attitudes towards low food prices or towards low prices in general (GeneralLowPrice: F=3.544,p=0.060and LowFoodPrice: F=1.774,p=0.183).
It seems that those Finnish consumers who have strong positive attitudes towards high prices in general have weaker positive attitudes towards high food prices. The relationships between a high price and high quality in foods are probably not as clear as it is with durables and in bigger investments. This confirms the results of the qualitative study. Interviewed subjects made a difference between durables or bigger investments and non-durables such as food

150
if they were asked to explain the meaning of the price and price differences. In the research situations if statements are presented at a general level without specifying the product category, it is difficult to know what commodities respondents are thinking about while answering the questions. Directing the questions to consider food and food purchase one can probably reduce the degree of error. Moreover, based on this analysis and the correlations, there seems to be only little difference whether positive attitudes towards low prices are asked at a general level or in relation to foods. Perhaps attitudes towards low prices are more general and applied similarly to different kinds of commodities. Additionally, it was interesting to discover that subjects in Group 1 (with less positive attitudes towards high prices in general) were not significantly more positive towards low prices than subjects in the Group 2 (with stronger positive attitude towards high prices). The difference between these two groups was very small. This supports the argument of multidimensionality explored with the qualitative approach. A strong indication of positive attitudes towards high prices does not automatically mean a strong statement of negative attitudes towards low prices. Subjects are probably not solely positive or negative towards high prices rather they can be both depending on the circumstances. The results of this analysis suggest that the opinion statements relating general quality issues and food quality issues are measuring different attitudes. In addition, the statements relating favourable attitudes towards high prices and favourable attitudes towards low prices are measuring different attitudes. However, the statements relating to favourable attitudes towards low prices produce the similar results whether they are specified to foods or not.
5.1.2 Developing the final measurement
The results of the preliminary studies suggested that there are differences between consumer’s attitudes towards high prices in relation to quality issues depending on the product category. Therefore, only statements which related to food prices were developed further. The second data (N=1156) was collected in 2002 (see Appendix 4 for the questionnaire variables). Some new questions were added in the measurements in order to enhance reliability, especially in the FoodQuality dimension and the FoodPrestige dimension. These questions are marked as “new” in Table 12.
The principal axis factoring with Varimax rotation was executed as in the previous analyses. Three factors were decided aprioribased on the previous analyses. The data was appropriate to the factor analysis Kaiser-Meyer-Olkin test showing 0.847 and the Bartlett’s test of sphericity was significant. The three factors solution explained 46% of the variance. Rotated factor results are shown in Table 12.

151
Table 12. Results of the principal factoring (2002, N=1156).
Variables relating to food price attitudes Factors1 2 3 communalities
EHT2R In my opinion I use a lot of food offers. .750 .600
EHV3RI check food prices carefully to be sure I get the best value for my money.
.714 .516
EHH3RI try to buy food at the lowest possible price.
.643 .470
EHT3 I seldom follow the ads for food offers. .611 .396
EHV1RWhen I shop for food, I usually compare different brands in order to get my money’s worth.
.610 .382
EHH1RI shop for food at more than one store to take advantage of low prices.
.586 .367
new
EHV2
When shopping for food comparing prices is a waste of time.
.556 .345
EHT1If a food product is on offer, I buy it even if I usually buy another brand.
.431 .203
EHL2I usually buy more expensive food products because they are of good quality.
.721 .276 .606
new
EHL3
Generally in foods the higher the price the better the quality.
.544 .332
new
EHL1
When I shop for food I require the best possible quality and I am ready to pay a higher price for it.
.487 .278
EHH2I seldom choose the cheapest alternative of food products.
.387 .446 .349
new
EHL4R
The cheaper brand in foods is of equally good quality than the premium brand.
.412 .234 .250
EHA3Treating guests with high-priced food products is snobbery.
.751 .372
EHA1I think one should treat guests to more expensive food than used normally.
.580 .575
Cronbach’s alpha .835 .703 .665variables rejected from measurements
new
EHA2
Occasionally, I indulge myself and my family (or friends) with premium -priced foods.
.354 .153
new
EHA4RI don’t value premium brands in foods. .272 .321 .124
new
EHA5
It is more recognized if you buy food from the luxury store than from the bargain store.
.319 .180
Variables loaded to these three factors similarly as they did in the previous data sample in 2001. The first factor was constructed with statements relating to positive attitudes towards low food prices. Subjects looked for low food prices, were willing to compare food prices

152
and were eager to look for food offers. This factor was labelled LowFoodPrice. The first factor relating to positive attitudes towards low food prices can be considered as reliable with Cronbach’s alpha value 0.835. According to Bryman and Cramer (1997, 64) Cronbach’s α should be greater than 0.8. All factor loadings were significant. According to Hair et al. (2006, 128) loading are significant if they are above .30 in larger sample size than 350. The second factor was constructed with statements relating to the subject’s willingness to pay higher price in order to get high food quality. All factor loadings were also significant. This factor was labelled FoodQuality and at 0.703 the Cronbach’s alpha value was adequate (0.70 is recommended by Hair et al. 2006, 139). The variables related to the subject’s willingness to offer high-priced food to guests was loaded onto the third factor and was labelled FoodPrestige. In this data set, some of the new variables relating to appreciation given to premium-priced food brands were removed because of the low communalities (EHA2, EHA4 and EHA5), suggesting that these variables shared a low amount of variance with the other variables. Even though the loadings onto the FoodPrestige factors were significant (above 0.3 as suggested by Kline 1994; Hair et al. 2006) the Cronbach’s alpha value of this factor improved if these items were removed from the reliability analysis. The reliability analysis showed Cronbach’s alpha value of 0.665 to be moderate with only two variables (0.60 is acceptable in exploratory analysis according to Hair et al. 2006, 139). However, Cronbach’s alpha value is affected by number of items (Lee and Hooley 2005, 371-372). According to Hair et al. (2006, 130) the individual factor loadings lower than 0.50 express the insufficient explanation power of the variable and these should be removed even if the loading is significant, and some of the loadings related to FoodQuality factor were lower than 0.50. However, Kline (1994) suggests that there should be at least three variables in a factor, and, therefore the factor loadings above 0.4 were kept in the scale.
There were several cross-loadings expressing how differently these questions can be interpreted. For example, the variable EHH2 had significant loadings both for the LowFoodPrice and FoodQuality dimensions, even though these factors measured different attitudes. This variable was first designed to measure positive attitudes towards low food prices by using negative wording “Ichooseseldomthelowestpricedfoodproduct.” However, it had a significant and even greater loading to the FoodQuality factor, suggesting that it can be understood as a willingness to pay more – perhaps for better quality – even if it is not included in the wording of the statement. Cross-loadings are probably due to the orthogonal rotation method as was previously discussed in chapters 4.2.1 and 5.1.1.
5.1.3 Description of the dimensions
Dimensions of the food price attitudes were explored further in order to find out whether the variance in the attitudinal dimensions will possibly be explained by socio-demographical

153
variables. (The results of the one-way analysis of variance are reported in Appendix 8). One-way analysis of variance showed statistically significant differences within some of the socio-demographical variables explaining only a little of the variance (from 0.08% to 6.2%) Gender had a statistically significant impact on the LowFoodPrice dimension (F(1,1154)=9.768, p=0.002, η2=0.008) and the FoodQuality dimension (F(1,1154)=14.513, p=0.000,η2=0.012), but not on the FoodPrestige dimension (F(1,1154)=0.009,p=0.923). Men were more positive towards high prices and less positive towards low food prices. Age groups had a statistically significant impact on the LowFoodPrice dimension (F(4,1155)=4.760,p=0.001,η2=0.016) and the FoodQuality dimension (F(4,1155)=4.817,p=0.001,η2=0.016), but not on the FoodPrestige dimension (F(4,1154)=0.720, p=0.578). The higher the age the more positive the subjects were towards low food prices, but they were also more positive towards high food prices in quality issues. The place of living had a statistically significant impact on the FoodQualitydimension (F(3,1152)=3.215,p=0.022,η2=0.008) and the FoodPrestige dimension (F(3,1152)=12.965,p=0.000,η2=0.033), but not on the LowFoodPrice dimension (F(3,1152)=2.081,p=0.101). Subjects living in the Helsinki metropolitan area believed that one should offer premium-priced food products to guests more than subjects living in the country. Education had a statistically significant impact on the LowFoodPrice dimension (F(7,1152)=3.920,p=0.000,η2=0.023), the FoodQuality dimension (F(7,1152)=2.574,p=0.012,η2=0.015), and also on the FoodPrestige dimension (F(7,1152)=10.317, p=0.000, η2=0.059). The highest mean of the FoodPrestige dimension was among subjects with a higher academic degree and the lowest mean was among subjects with vocational education. Subjects with only basic education were the most positive towards low food prices. Additionally, profession had a statistically significant impact on the LowFoodPrice dimension (F(8,1154)=6.242,p=0.000,η2=0.042), the FoodQuality dimension (F(8,1154)=4.566,p=0.000,η2=0.031), and the FoodPrestige dimension (F(8,1154) = 4.829, p =0.000, η2=0.033). Executives had the most positive attitudes towards high food prices because they had the lowest scores for the LowFoodPrice and the highest scores for the FoodQuality dimensions. Full-time mothers or fathers were the most negative towards high food prices because they had the highest scores for the LowFoodPrice dimension and the lowest scores for the FoodQuality dimension. The unemployed had the lowest mean value in the FoodPrestige dimension and the managerial officers had the highest mean in this dimension. Subjects evaluated the taxable income levels of the household in six categories. Income level had a statistically significant impact on the LowFoodPrice dimension (F(5,1126)=8.440,p=0.000,η2=0.036), the FoodQuality dimension (F(5,1126) = 7.647, p =0.000, η2=0.033), and the Food Prestige dimension (F(5,1126)=11.189,p=0.000,η2=0.048). The most positive attitudes towards high food prices were found in the group of subjects with the highest income level. However, the most positive attitudes towards low food prices were among subjects with incomes ranging 10 000 € – 20 000 € and not at the lowest income level. Subjective opinion on disposable assets for

154
daily consumption had a statistically significant impact on the LowFoodPrice dimension (F(6,1133)=7.773,p=0.000,η2=0.040) and the FoodQuality dimension (F(6,1133)=11.548,p=0.000,η2=0.058), and also, on the FoodPrestige dimension (F(6,1133)=12.310,p=0.000,η2=0.062). The most positive attitudes towards low food prices were found among subjects with the least money, and subjects with the most money had the most positive attitudes towards high food prices. Possible interactions were also studied between age and gender and between income level and assets for daily consumption with means of variance analysis, but no interactions were found.
5.1.4 Confirmation and purification of the Food Price Attitude Scale
The new data sample was collected in 2004 (2004b, N=1027) in order to confirm the Food Price Attitude Scale developed during 2001-2002 and to test the hypothesis relating to the relationship between the food price attitudes and the stated acceptable price (see Appendix 5 for questions relating to price estimations and the product information presented in the study). Before any of the analyses were made respondents unwilling to give any price estimations (missing values) and those who give 0.00 € to questions relating to willingness to buy the product once or regularly were excluded. When excluding these cases the sample size was 853 subjects. The total effective sample size was 799 because of the missing values of the attitudinal opinion questions. Then the data sample was randomly split in half using the PASW 17.0 software program. Confirmatory factor analysis was carried out (with LISREL 8.80 program) in order to confirm how well the Food Price Attitude construct fitted to the new data. This was tested with the first half of the sample (n=399). The other aim of this survey was to confirm the relationship between the food price attitude dimensions and price estimations using a structural equation model. This was tested with the remaining half of the sample (n=400).
Previous analysis suggested that there were eight variables manifesting positive attitudes towards low food prices (a latent variable LowFoodPrice, referred to later as price), five variables relating to positive attitudes towards high food prices (a latent variable FoodQuality, referred to later as quality), and two variables manifesting another dimension of positive attitudes towards high food prices (a latent variable FoodPrestige, referred to later as prestige). However, three of the observed variables with factor loadings below 0.50 were removed from this analysis as recommended by Hair et al. (2006, 130). One of the variables (EHT1) related to a positive attitude towards low food price also had the lowest communality value (0.203). EHH2 was troublesome with large cross-loadings to both the LowFoodPrice and the FoodQualityfactors, and therefore it was removed from the confirmatory analysis. Another variable related to FoodQuality (EHL4r) was also removed because of the cross-
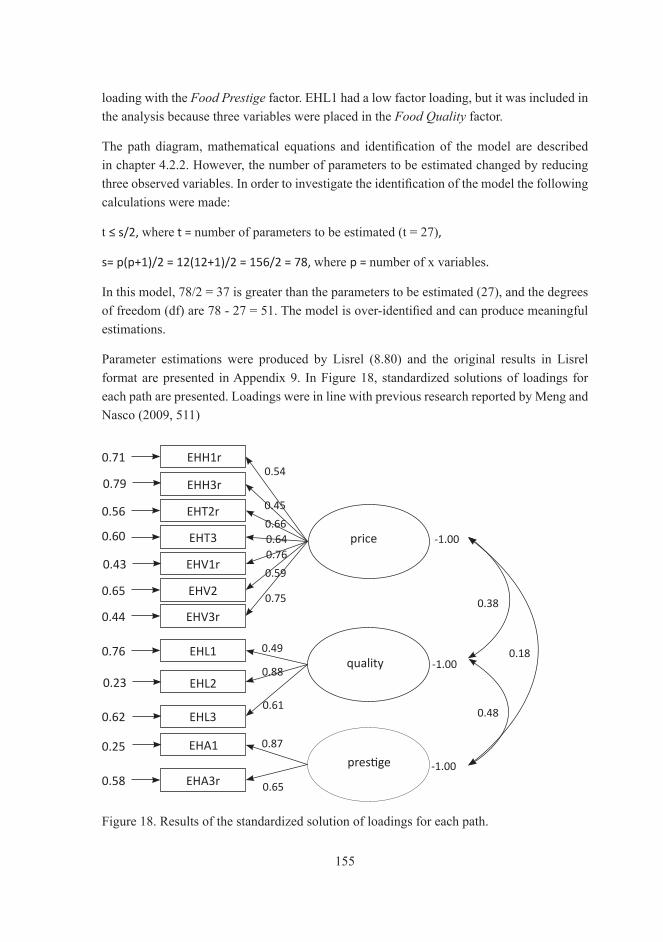
155
loading with the FoodPrestige factor. EHL1 had a low factor loading, but it was included in the analysis because three variables were placed in the FoodQuality factor.
The path diagram, mathematical equations and identification of the model are described in chapter 4.2.2. However, the number of parameters to be estimated changed by reducing three observed variables. In order to investigate the identification of the model the following calculations were made:
t ≤ s/2, where t = number of parameters to be estimated (t = 27),
s= p(p+1)/2 = 12(12+1)/2 = 156/2 = 78, where p = number of x variables.
In this model, 78/2 = 37 is greater than the parameters to be estimated (27), and the degrees of freedom (df) are 78 - 27 = 51. The model is over-identified and can produce meaningful estimations.
Parameter estimations were produced by Lisrel (8.80) and the original results in Lisrel format are presented in Appendix 9. In Figure 18, standardized solutions of loadings for each path are presented. Loadings were in line with previous research reported by Meng and Nasco (2009, 511)
price
quality
prestige
0.71
0.79
0.56
0.60
0.43
0.65
0.44
0.76
0.23
0.62
0.25
0.58
EHH3r
EHH1r
EHT2r
EHT3
EHV1r
EHV2
EHV3r
EHL1
EHL2
EHL3
EHA1
EHA3r
0.54
0.45
0.660.640.76
0.59
0.75
0.49
0.88
0.61
0.87
0.65
-1.00
-1.00
-1.00
0.18
0.38
0.48
Figure 18. Results of the standardized solution of loadings for each path.

156
All estimated free parameters were significantly different from zero (t values relating to the LAMBDA-X variables range from 6.635 to 13.868, and t values relating to the correlations between latent constructs (PHI) range from 2.897 to 8.143 (Table 14). This provides some evidence of the construct validity. Squared multiple correlations (R2) of x variables were quite low or moderate, ranging between 0.206 (EHH3r) and 0.770 (EHL2). These values indicated that observed variables were only moderate measures of the latent variables, and, there was considerable amount of measurement error. In evaluating the reliability of the measurements the composite reliability and the average variance extracted were investigated. The composite reliability value was calculated to each of the latent variable (price, quality, and prestige) from the values of completely standardized solutions using the formula by Diamantopoulos and Siguaw (2008, 90):
ρc = (∑λ)2/[(∑λ)2+∑(δ)],
where ρc= composite reliability,
λ = loadings of paths,
δ = error variance.
The values of the composite reliability of the latent variables are presented in Table 13. The composite reliability (ρc) values greater than 0.6 reflect adequate reliability and the measures were adequate (price ρc= 0.8216, quality ρc= 0.7080, and prestige ρc= 0.7349). Another measure to assess the reliability is the value of the average variance extracted (ρv). This can be calculated by using the formula (Diamantopoulos and Siguaw 2008, 91):
ρv = (∑λ2)/[(∑λ2+∑(δ))],
where ρv = average variance extracted,
λ = loadings of paths,
δ = error variance.
The values of average variance extracted should be over 0.5, meaning that the latent variable accounts for greater amount of the variance and not the measurement error. The effect of the error variance exists within the measures; price ρv = 0.4031, quality ρv = 0.4615 and prestige ρv = 0.5859 (Table 13).
The next step of the procedure was to assess the model and how it was supported by the data. Chi-square statistics (minimum fit function chi-square = 168.089, p=0.00) implied an imperfect fit and suggested that the model should be rejected. However, the root mean square error of approximation (RMSEA) was 0.0761 indicating a reasonable fit. According to Diamantopoulos and Siguaw (2008, 85), values less than 0.05 means a good fit, values

157
between 0.05-0.08 show a reasonable fit, values between 0.08-0.10 are a mediocre fit, and values over 0.10 can be regarded as a poor fit. According to Hair et al. (2006, 753), with 12 observed variables and a sample size larger than 250, RMSEA value <0.07 with comparative fit index (CFI) value greater than .92 can be regarded as a good fit as was the case in this model. The standardized root mean square residual (standardized RMR) was greater than 0.05 (it was 0.0589) indicating a close fit of the model (Diamantopoulos and Siguaw 2008, 85). Similarly, according to Hair et al. (2006, 753), in this kind of setting SRMR < 0.08 with CFI > 0.92 is acceptable. The Goodness-of-fit index was (GFI) 0.934 and was thus acceptable, but the adjusted goodness-of-fit index (AGFI) was 0.899, suggesting some difficulty with model fit. The critical N (CN=183.162) was lower than recommended (CN>200) suggesting that the model have some troubles in representing the data (Diamantopoulos and Siguaw 2008, 88). Other fit indices are presented in Table 13.
Table 13. Results of the confirmatory factor analysis (data sample 2004b) (Lisrel 8.80)
original measurement model
modified measurement model
sample size (n) 399 399number of observed
variables12 9
df 51 24
Chi-square168.533 (p=0.00)
94.692 (p=0.00)
RMSEA 0.0761 0.0868RMR (standardized) 0.0589 0.0441
GFI 0.934 0.949AGFI 0.899 0.905PGFI 0.611 0.506NFI 0.925 0.934
NNFI 0.930 0.924CFI 0.946 0.950IFI 0.946 0.950RFI 0.903 0.901
significant N 183.162 181.650ρc price 0.8216 0.8140
ρc quality 0.7080 0.7109ρc prestige 0.7349 0.7400
ρv price 0.4031 0.4690ρv quality 0.4615 0.5542
ρv prestige 0.5859 0.5938

158
The goodness-of-fit measures showed acceptable fit with some difficulties with large error terms. Inspection of squared multiple correlations showed that there were low values in some indicators. The confirmatory factor analysis is only meant to confirm the theory, and therefore all model modifications should be justified. Inspection of modification indices and statistics for standardized residuals suggested that removing three of the observed variables (EHH1R, EHH3R and EHL1) would improve the measurements. However, this kind of modification is not theoretically sustainable and makes the analysis explorative. All EHH variables were related closely to consumers’ willingness to buy food at the lowest possible price, and were essential in this dimension. Furthermore, the large error terms within the pricefactor loadings were probably due to having three originally different dimensions in constructing the one dimension. However, those variables were removed and the modified model was tested. The goodness-of-fit measures showed only minor improvements to the model fit (Table 13). This kind of modification is not stable and the model may not fit to the other data sample, and therefore it needed to be further tested with a new sample (Diamantopoulos and Siguaw 2008, 102).
Table 14. Path loadings of the original observed variables of the Food Price Attitude measurement before modifications.
pathunstandardized
parameter estimates
completely standardized
parameter estimates
t values(critical t value,
one-tailed t ± 1,96)
EHH1r price 1.034 0.539 9.967
EHH3r price 0.682 0.454 8.372
EHT2r price 0.922 0.662 12.227
EHT3 price 1.159 0.636 11.766
EHV1r price 0.876 0.756 13.868
EHV2 price 0.617 0.589 10.881
EHV3r price 1.00 0.751 --
EHL1 quality 0.568 0.488 8.055
EHL2 quality 1.00 0.877 --
EHL3 quality 0.830 0.614 9.400
EHA1 prestige 1.00 0.867 --
EHA3R prestige 0.778 0.648 6.635
price price 8.180 1.000 10.339
price quality 2.031 0.384 5.774
price prestige 1.256 0.182 2.897

159
quality quality 5.489 1.000 8.104
quality prestige 3.441 0.482 6.951
prestige prestige 9.289 1.000 5.987
5.1.5 Purification of the model and SEM
In the 2004b questionnaire, a colour picture of a new drinkable snack product with product information was presented, and the respondents estimated what price they would be willing to pay for the product presented in the picture. The questions were asked as follows: “Assumingthatyouarewillingtobuythisproduct…1)atwhatpricewouldyoubewillingtotrythisproduct?, and 2) atwhatpricewouldyoubewillingtobuythisproductregularly?” Space was left to give price estimations with the abbreviations “eur” (Euro) and “cnt” (cents) (Appendix 6). After this the variables of the Food Price Attitude Scale were asked (Appendix 4). The total effective sample size was 799 because of the missing values of attitudinal opinion questions, and the sample was randomly split in half using the PASW-17.0 software program. With one half (n=399) the measurement model was confirmed as reported previously, and the structural equation model was tested with the remaining half (n=400). In this analysis, a new latent variable (WPay) was created: standardized observations of two price estimation variables related to buying the product in order to try it (ZWtry) and buying the product regularly (ZWregular). The confirmatory factor analysis made with the first half of the data suggested that some of the observed variables should be removed in order to make the model fit better. However, these modifications made only minor improvements to the model fit measures. In this analysis, the original measurement model without any modifications was used. In the structural model, all dimensions of the food price attitudes affected price estimations (WPay), and moreover, the dimension of the positive attitudes towards high food prices related to quality affected both the prestige dimension and the price dimension. It was assumed that the prestige dimension also had an effect on the price sensitivity. The path diagram of the structural equation model is presented in chapter 4.2.2 with detailed information of denotations of SIMPLIS language used by the Lisrel 8.80 program. The model was over-identified with 71 degrees of freedom. Figure 19 presents estimated parameters with standardized solutions.
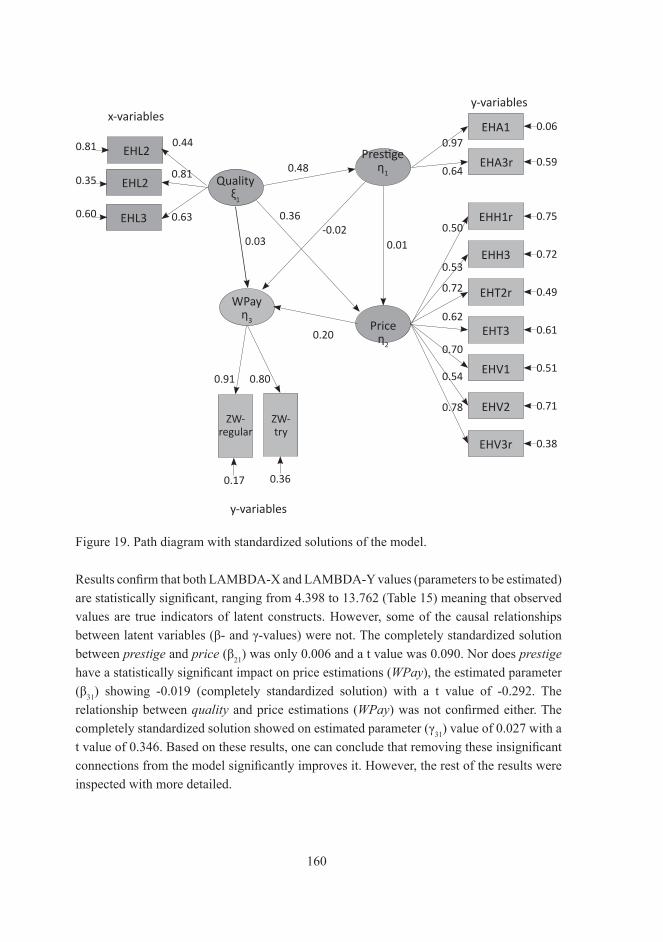
160
0.17 0.36
0.60
0.35
0.63
0.81
EHL3
EHL2
0.91 0.80
0.97
0.64
0.06
0.59
0.75
0.72
0.49
0.61
0.51
0.71
0.38
0.50
0.53
0.72
0.62
0.70
0.54
0.78
0.20
0.48Quality
ξ1
Prestige η1
Price η2
WPay η3
y-variables
x-variablesy-variables
EHA1
EHA3r
EHH1r
EHH3
EHT2r
EHT3
EHV1
EHV2
EHV3r
ZW- regular
ZW- try
EHL20.81 0.44
0.36-0.02
0.03 0.01
Figure 19. Path diagram with standardized solutions of the model.
Results confirm that both LAMBDA-X and LAMBDA-Y values (parameters to be estimated) are statistically significant, ranging from 4.398 to 13.762 (Table 15) meaning that observed values are true indicators of latent constructs. However, some of the causal relationships between latent variables (β- and γ-values) were not. The completely standardized solution between prestige and price (β21) was only 0.006 and a t value was 0.090. Nor does prestigehave a statistically significant impact on price estimations (WPay), the estimated parameter (β31) showing -0.019 (completely standardized solution) with a t value of -0.292. The relationship between quality and price estimations (WPay) was not confirmed either. The completely standardized solution showed on estimated parameter (γ31) value of 0.027 with a t value of 0.346. Based on these results, one can conclude that removing these insignificant connections from the model significantly improves it. However, the rest of the results were inspected with more detailed.
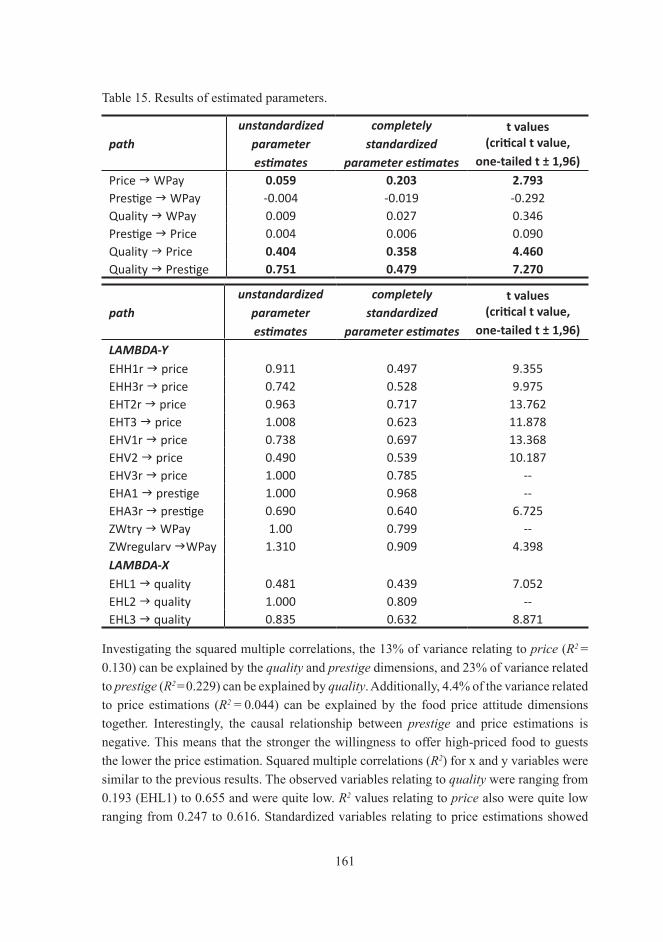
161
Table 15. Results of estimated parameters.
pathunstandardized
parameter estimates
completely standardized
parameter estimates
t values(critical t value,
one-tailed t ± 1,96)
Price WPay 0.059 0.203 2.793Prestige WPay -0.004 -0.019 -0.292Quality WPay 0.009 0.027 0.346Prestige Price 0.004 0.006 0.090Quality Price 0.404 0.358 4.460Quality Prestige 0.751 0.479 7.270
pathunstandardized
parameter estimates
completely standardized
parameter estimates
t values(critical t value,
one-tailed t ± 1,96)
LAMBDA-YEHH1r price 0.911 0.497 9.355EHH3r price 0.742 0.528 9.975EHT2r price 0.963 0.717 13.762EHT3 price 1.008 0.623 11.878EHV1r price 0.738 0.697 13.368EHV2 price 0.490 0.539 10.187EHV3r price 1.000 0.785 --EHA1 prestige 1.000 0.968 --EHA3r prestige 0.690 0.640 6.725ZWtry WPay 1.00 0.799 --ZWregularv WPay 1.310 0.909 4.398LAMBDA-XEHL1 quality 0.481 0.439 7.052EHL2 quality 1.000 0.809 --EHL3 quality 0.835 0.632 8.871
Investigating the squared multiple correlations, the 13% of variance relating to price (R2=
0.130) can be explained by the qualityand prestigedimensions, and 23% of variance related to prestige (R2=0.229) can be explained by quality. Additionally, 4.4% of the variance related to price estimations (R2=0.044) can be explained by the food price attitude dimensions together. Interestingly, the causal relationship between prestige and price estimations is negative. This means that the stronger the willingness to offer high-priced food to guests the lower the price estimation. Squared multiple correlations (R2) for x and y variables were similar to the previous results. The observed variables relating to quality were ranging from 0.193 (EHL1) to 0.655 and were quite low. R2 values relating toprice also were quite lowranging from 0.247 to 0.616. Standardized variables relating to price estimations showed
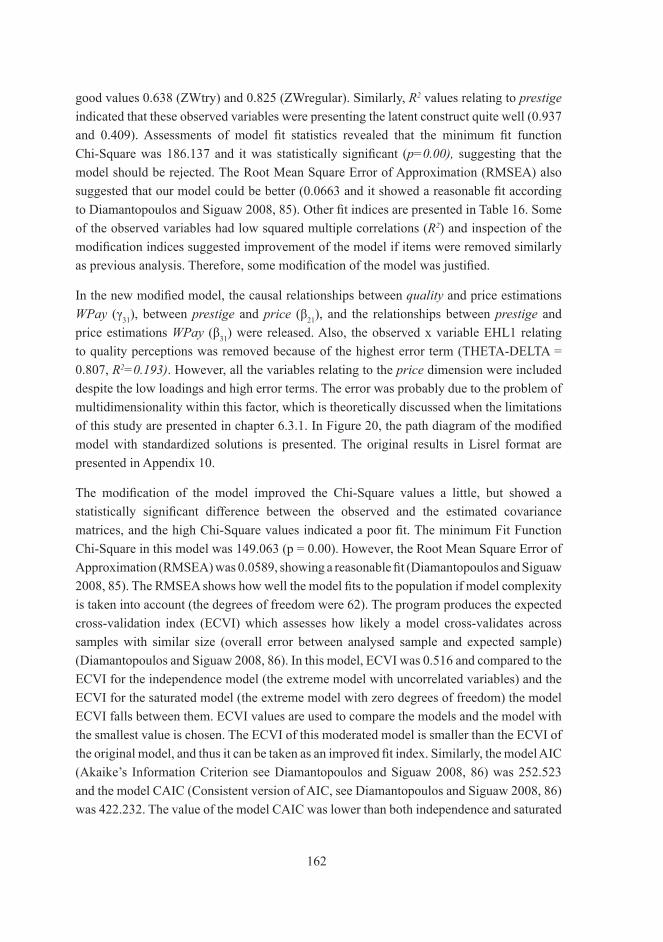
162
good values 0.638 (ZWtry) and 0.825 (ZWregular). Similarly, R2 values relating to prestige indicated that these observed variables were presenting the latent construct quite well (0.937 and 0.409). Assessments of model fit statistics revealed that the minimum fit function Chi-Square was 186.137 and it was statistically significant (p=0.00), suggesting that the model should be rejected. The Root Mean Square Error of Approximation (RMSEA) also suggested that our model could be better (0.0663 and it showed a reasonable fit according to Diamantopoulos and Siguaw 2008, 85). Other fit indices are presented in Table 16. Some of the observed variables had low squared multiple correlations (R2) and inspection of the modification indices suggested improvement of the model if items were removed similarly as previous analysis. Therefore, some modification of the model was justified.
In the new modified model, the causal relationships between quality and price estimations WPay (γ31), between prestige and price (β21), and the relationships between prestige and price estimations WPay (β31) were released. Also, the observed x variable EHL1 relating to quality perceptions was removed because of the highest error term (THETA-DELTA = 0.807, R2=0.193). However, all the variables relating to the pricedimension were included despite the low loadings and high error terms. The error was probably due to the problem of multidimensionality within this factor, which is theoretically discussed when the limitations of this study are presented in chapter 6.3.1. In Figure 20, the path diagram of the modified model with standardized solutions is presented. The original results in Lisrel format are presented in Appendix 10.
The modification of the model improved the Chi-Square values a little, but showed a statistically significant difference between the observed and the estimated covariance matrices, and the high Chi-Square values indicated a poor fit. The minimum Fit Function Chi-Square in this model was 149.063 (p = 0.00). However, the Root Mean Square Error of Approximation (RMSEA) was 0.0589, showing a reasonable fit (Diamantopoulos and Siguaw 2008, 85). The RMSEA shows how well the model fits to the population if model complexity is taken into account (the degrees of freedom were 62). The program produces the expected cross-validation index (ECVI) which assesses how likely a model cross-validates across samples with similar size (overall error between analysed sample and expected sample) (Diamantopoulos and Siguaw 2008, 86). In this model, ECVI was 0.516 and compared to the ECVI for the independence model (the extreme model with uncorrelated variables) and the ECVI for the saturated model (the extreme model with zero degrees of freedom) the model ECVI falls between them. ECVI values are used to compare the models and the model with the smallest value is chosen. The ECVI of this moderated model is smaller than the ECVI of the original model, and thus it can be taken as an improved fit index. Similarly, the model AIC (Akaike’s Information Criterion see Diamantopoulos and Siguaw 2008, 86) was 252.523 and the model CAIC (Consistent version of AIC, see Diamantopoulos and Siguaw 2008, 86) was 422.232. The value of the model CAIC was lower than both independence and saturated

163
CAIC value which was a good sign, but, the model AIC was greater than saturated AIC (Diamantopoulos and Siguaw 2008, 86), and moreover, these were higher than the model AIC and the model CAIC in the original model. However, according to Diamantopoulos and Siguaw (2008, 86) it takes a number of estimated parameters into account and they were less in this modified model. Also, it is sensitive to violations of normality.
0.17 0.37
0.48
0.500.72
0.70
EHL3
EHL2
0.91 0.80
0.95
0.65
0.10
0.57
0.75
0.72
0.49
0.61
0.51
0.71
0.38
0.50
0.53
0.72
0.62
0.70
0.54
0.79
0.21
0.54
0.36
Quality ξ1
Prestige η1
Price η2
WPay η3
y-variables
x-variablesy-variables
EHA1
EHA3r
EHH1r
EHH3
EHT2r
EHT3
EHV1
EHV2
EHV3r
ZW- regular
ZW- try
Figure 20. Path diagram with standardized solutions of the modified model.
The root mean square residual (RMR) is an average of the differences between both the observed and the estimated covariance and variance (Hair et al. 2006, 747). Standardized RMR can be calculated if the standardized residuals are divided by the fitted residuals with the standard errors, and with this procedure the measurement unit effect related to RMR can be avoided (Diamantopoulos and Siguaw 2008, 87). According to Diamantopoulos and Siquaw (2008, 87), lower values of SRMR than 0.05 are a sign of acceptable fit (also Hair et al. 2006, 747). In this modified model, the model RMR was 0.485 and the standardized RMR was 0.0468, indicating an acceptable fit.

164
In order to assess the model fit the absolute fit indices are inspected. The Goodness-of-Fit Index (GFI) of this model was 0.946 and adjusted with the degrees of freedom (df = 62) (AGFI) was 0.921, both indicating acceptable fit (above .90 according to Diamantopoulos and Siquaw 2008, 87 and Hair et al. 2006, 747). GFI compares the predicted covariance to those in the sample and shows how well the model can produce the predicted covariance from the estimated parameters and how close they are to those of the sample. According to Diamantopoulos and Siquaw (2008, 88), GFI is regarded as the most reliable measure of absolute fit.
The relative fit indices assess how much better the model fits the data compared to the model with no correlations between the variables (the independence model), and values close to 1 signal good fit (Diamantopoulos and Siquaw 2008, 88). The Normed Fit Index (NFI) is a difference between the c2 value of the fitted model and an independence model divided by the c2 value of the independence model. An NFI value of 1 is a perfect fit (Hair et al. 2006, 749). In this model, the NFI value was 0.936. The Non-Normed Fit Index (NNFI) was 0.952, the Comparative Fit Index (CFI) was 0.962, and the Relative Fit Index (RFI) was 0.920, all being above the critical .90 showing a reasonable relative fit over the independence model.
According to Hair et al. (2006, 749-750) the third group of fit indices is the Parsimony Fit Indices. These measures take account of the complexity of the model. The more complex models usually fit the data better, and therefore the complexity of the model has to be taken into account before comparisons between models can be made. The Parsimony Goodness-of-Fit Index (PGFI) adjusts the GFI with the parsimony ratio (PR, the ratio of degrees of freedom used by a model to the total degrees of freedom available). The Parsimony Fit Indices usually has lower values than indices without adjustments, but relatively higher values are an indication of a better fit. Similarly, Parsimony Normed Fit Index (PNFI) adjusts the NFI with PR. Parsimony fit indices are usually inspected in evaluating competing models. According to Diamantopoulos and Siquaw (2008, 87) lower values are accepted for parsimony fit indices than absolute fit indices, and a PGFI value above 0.50 is acceptable. In this model the PGFI was 0.645 and the PNFI was 0.744.
All the fit statistics indicated reasonable absolute and relative fit of the model as can be seen in Table 16. The final measure of fit is critical N (CN) expressing the critical sample size in order to accept the model fit on a statistical basis, and if the CN is greater than 200 one can assume that the model reasonably represents the data (Diamantopoulos and Siquaw 2008, 88.) In this model, the CN was 244.053.
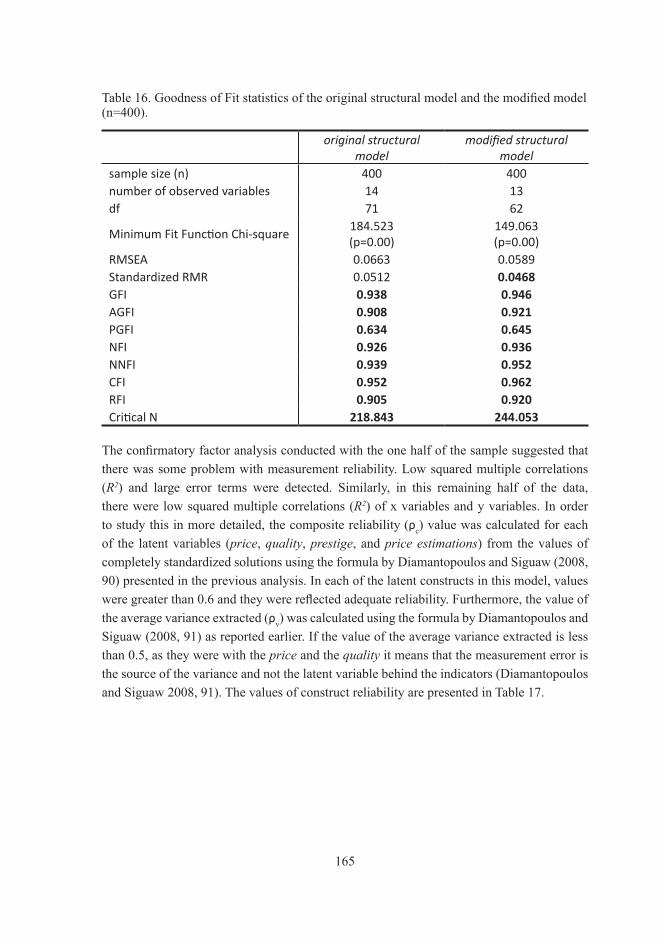
165
Table 16. Goodness of Fit statistics of the original structural model and the modified model (n=400).
original structural model
modified structural model
sample size (n) 400 400number of observed variables 14 13df 71 62
Minimum Fit Function Chi-square184.523 (p=0.00)
149.063 (p=0.00)
RMSEA 0.0663 0.0589Standardized RMR 0.0512 0.0468GFI 0.938 0.946AGFI 0.908 0.921PGFI 0.634 0.645NFI 0.926 0.936NNFI 0.939 0.952CFI 0.952 0.962RFI 0.905 0.920Critical N 218.843 244.053
The confirmatory factor analysis conducted with the one half of the sample suggested that there was some problem with measurement reliability. Low squared multiple correlations (R2) and large error terms were detected. Similarly, in this remaining half of the data, there were low squared multiple correlations (R2) of x variables and y variables. In order to study this in more detailed, the composite reliability (ρc) value was calculated for each of the latent variables (price, quality, prestige, and priceestimations) from the values of completely standardized solutions using the formula by Diamantopoulos and Siguaw (2008, 90) presented in the previous analysis. In each of the latent constructs in this model, values were greater than 0.6 and they were reflected adequate reliability. Furthermore, the value of the average variance extracted (ρv) was calculated using the formula by Diamantopoulos and Siguaw (2008, 91) as reported earlier. If the value of the average variance extracted is less than 0.5, as they were with the price and the quality it means that the measurement error is the source of the variance and not the latent variable behind the indicators (Diamantopoulos and Siguaw 2008, 91). The values of construct reliability are presented in Table 17.

166
Table 17. The values of composite reliability and average variance extracted calculated from completely standardized solutions of the original model and the modified model (n=400).
construct reliability of the latent variables original model modified modelρc price 0.8215 0.8214ρc quality 0.6685 0.6726ρc prestige 0.7981 0.7922ρc WPay 0.8554 0.8450ρv price 0.4030 0.4028ρv quality 0.4156 0.5067ρv prestige 0.6731 0.6636ρv WPay 0.7317 0.7325
As can be seen in Table 17, the average variance extracted relating to price sensitivity is below the adequate value. Measurement error accounts for a large amount of the total variance. Additionally, large error terms can be seen in path diagrams relating to each of the indicators. Reducing the “bad variables” with large error terms one can improve the construct reliability, as was done with the quality dimension (EHL1 was removed and it improved the ρv quality value in the modified model). However, this kind of modification is not justified without thinking theoretically of the consequences of the modification. All these observed variables were operationalized to measure some behavioural intention reflecting the food price attitudes. Low reliability values and large error terms are important pieces of information. Reducing “bad items” in order to get a better fit would violate the confirmatory nature of the analysis. A low amount of variance reflecting the latent constructs reveal the multidimensional nature of the food price attitudes. In this study, the attempt to capture the true essence of this attitudinal construct succeeded to some extent, but not completely. Thus, the scale needs to be developed further, and operationalization should perhaps be more detailed as discussed in chapter 6.
Inspection of the squared multiple correlations of this modified model gave no new information about the explanatory power of the food price attitude dimensions. 13% of the variance of price sensitivity (R2=0.129) was explained by the qualitydimension. The quality dimension was able to explain 29% (R2=0.288) of the variance relating to the prestige, meaning that willingness to offer high-priced food to guests is significantly related to quality perceptions (how strongly one believes that a high price indicates high quality food). In addition, 4.4% of the variance relating to priceestimations (R2=0.044) can be explained by price sensitivity alone. This means that positive attitudes towards high food prices, if measured with quality and prestige scales, have no impact on price estimations. In this modified model, all the estimated parameters were statistically significant and the values are presented in Table 18.
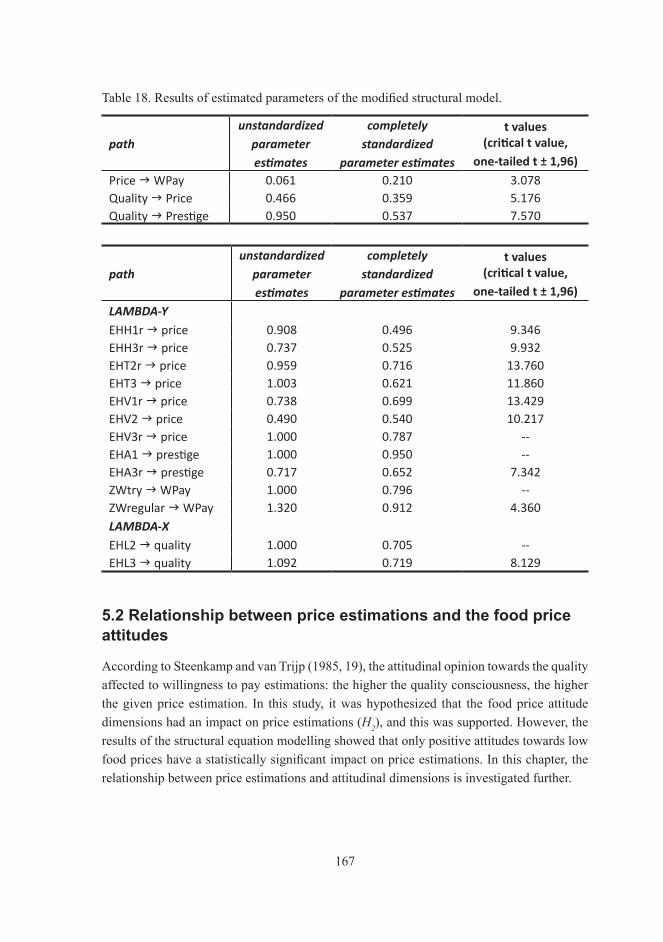
167
Table 18. Results of estimated parameters of the modified structural model.
pathunstandardized
parameter estimates
completely standardized
parameter estimates
t values(critical t value,
one-tailed t ± 1,96)
Price WPay 0.061 0.210 3.078Quality Price 0.466 0.359 5.176Quality Prestige 0.950 0.537 7.570
pathunstandardized
parameter estimates
completely standardized
parameter estimates
t values(critical t value,
one-tailed t ± 1,96)
LAMBDA-YEHH1r price 0.908 0.496 9.346EHH3r price 0.737 0.525 9.932EHT2r price 0.959 0.716 13.760EHT3 price 1.003 0.621 11.860EHV1r price 0.738 0.699 13.429EHV2 price 0.490 0.540 10.217EHV3r price 1.000 0.787 --EHA1 prestige 1.000 0.950 --EHA3r prestige 0.717 0.652 7.342ZWtry WPay 1.000 0.796 --ZWregular WPay 1.320 0.912 4.360LAMBDA-XEHL2 quality 1.000 0.705 --EHL3 quality 1.092 0.719 8.129
5.2 Relationship between price estimations and the food price attitudes
According to Steenkamp and van Trijp (1985, 19), the attitudinal opinion towards the quality affected to willingness to pay estimations: the higher the quality consciousness, the higher the given price estimation. In this study, it was hypothesized that the food price attitude dimensions had an impact on price estimations (H2), and this was supported. However, the results of the structural equation modelling showed that only positive attitudes towards low food prices have a statistically significant impact on price estimations. In this chapter, the relationship between price estimations and attitudinal dimensions is investigated further.

168
In the questionnaire, a coloured picture of a new drinkable snack product with product information was presented. First a description of the product (what it was and how it was meant to be consumed) was informed. Then the size of the package and the origin of the country were presented. Information was given on the ingredients and the nutritional content (per 100g). The product was free from lactose and gluten. It was a new product which was not available to the consumers, and therefore none of the subjects were familiar with it. In the questionnaire, respondents estimated at what price they were willing to buy the product once (in order to try it) and regularly (see Appendix 6 for the questions presented to the subjects). After the price judgements the questions of the Food Price Attitude Scale were asked for. Other questions in the questionnaire mostly relating to conjoint analysis were asked, but those results are not reported here. The mean values of the willingness to pay estimations are presented in Table 19. As can be seen in the mean values, subjects gave 22% higher estimations when they assumed they would buy the product once in order to try it than if they were buying the product regularly.
Table 19. Descriptive information of the price estimations to the new food product (n=853).
price estimations mean sd median mode min maxbuying the product to try it 1.09 € 0.67 1.00 € 1,00 € 0.05 € 5.50 €buying the product regularly 0.89 € 0.51 0.80 € 0.50 € 0.05 € 3.50 €
The result of the SEM analysis can be described better by comparing the mean values of summed variables relating to the food price attitude factors. Summed variables included the observed variables of the original measurement model. The subjects were divided into four different categories based on the price estimations they had given. About 26% of all subjects (n = 221) gave the lowest price estimations ranging from 0.05 € to 0.50 € in a situation where they would try the product. These subjects had the highest mean value of the LowFoodPrice dimension (4.95 in Figure 21), meaning that they had the strongest positive attitudes towards low food prices. The mean values of the positive attitudes towards low food prices decrease when the price estimations increase. Differences in positive attitude towards the low food prices between the groups were statistically significant (F(3,834)=34.488,p=0.000). However, there were no statistically significant differences between the mean values of positive attitudes towards high food prices even though a slight increase was found (FoodQuality:F(3,832)=1.833,p=0.140;FoodPrestige:F(3,845)=0.910,p=0.435).
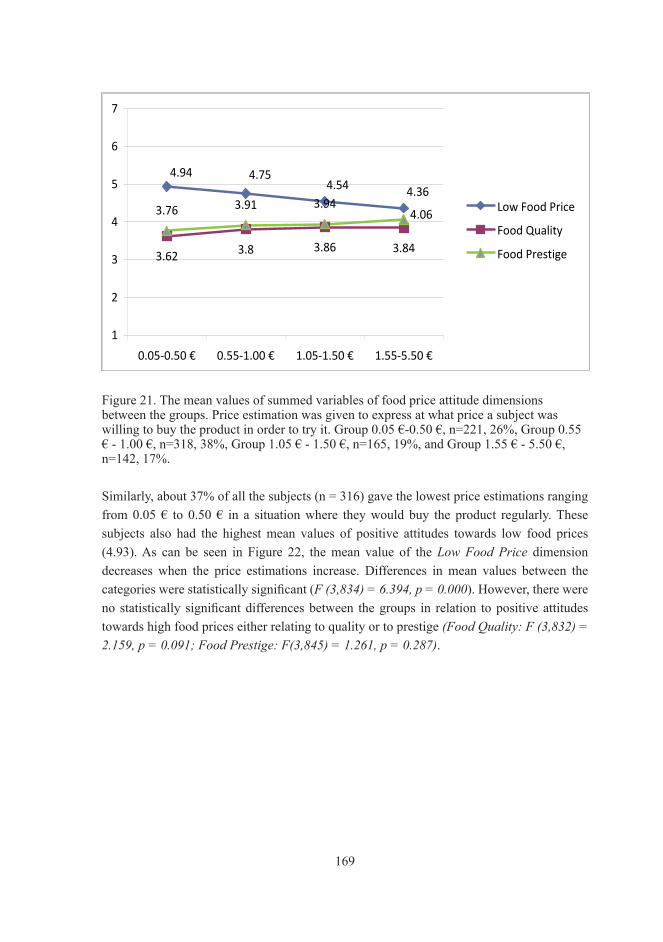
169
3.62 3.8 3.86 3.84
3.76 3.91 3.94
4.94 4.754.54 4.36
4.06
1
2
3
4
5
6
7
0.05-0.50 € 0.55-1.00 € 1.05-1.50 € 1.55-5.50 €
Low Food Price
Food Quality
Food Prestige
4.934.61 4.49 4.44
3.65 3.82 3.99 4.02
3.78 3.95 3.954.19
1
2
3
4
5
6
7
0.05-0.50 € 0.55-1.00 € 1.05-1.50 € 1.55-3.50 €
Low Food Price
Food Quality
Food Prestige
Figure 21. The mean values of summed variables of food price attitude dimensions between the groups. Price estimation was given to express at what price a subject was willing to buy the product in order to try it. Group 0.05 €-0.50 €, n=221, 26%, Group 0.55 € - 1.00 €, n=318, 38%, Group 1.05 € - 1.50 €, n=165, 19%, and Group 1.55 € - 5.50 €, n=142, 17%.
Similarly, about 37% of all the subjects (n = 316) gave the lowest price estimations ranging from 0.05 € to 0.50 € in a situation where they would buy the product regularly. These subjects also had the highest mean values of positive attitudes towards low food prices (4.93). As can be seen in Figure 22, the mean value of the LowFoodPrice dimension decreases when the price estimations increase. Differences in mean values between the categories were statistically significant (F(3,834)=6.394,p=0.000). However, there were no statistically significant differences between the groups in relation to positive attitudes towards high food prices either relating to quality or to prestige (FoodQuality:F(3,832)=2.159,p=0.091;FoodPrestige:F(3,845)=1.261,p=0.287).

170
3.62 3.8 3.86 3.84
3.76 3.91 3.94
4.94 4.754.54 4.36
4.06
1
2
3
4
5
6
7
0.05-0.50 € 0.55-1.00 € 1.05-1.50 € 1.55-5.50 €
Low Food Price
Food Quality
Food Prestige
4.934.61 4.49 4.44
3.65 3.82 3.99 4.02
3.78 3.95 3.954.19
1
2
3
4
5
6
7
0.05-0.50 € 0.55-1.00 € 1.05-1.50 € 1.55-3.50 €
Low Food Price
Food Quality
Food Prestige
Figure 22. The mean values of summed variables of food price attitude dimensions between the groups. Price estimation was given to express at what price a subject was willing to buy the product regularly. Group 0.05 €-0.50 €, n=316, 37%, Group 0.55 € - 1.00 €, n=307, 36%, Group 1.05 € - 1.50 €, n=161, 19%, and Group 1.55 € - 3.50 €, n=61, 8%.
Additionally, one-way analysis of variance was used to test whether some of the background variables could be statistically significant in order to explain the variance of price estimations (see results in Appendix 11). Price estimations were significantly different in different age groups (F(5,771)totry=13.788,p=0.000;F(5,771)regularly=11.084,p=0.000) explaining about 8% of the variance. Subjects from 15 to 29 years gave the highest estimations (meantotry=1.50€andmeanregularly=1.13€), and the subjects from 50 to 59 years old gave the lowest estimations (meantotry=0.95 €) about trying the product once, whereas, the subjects from 60 to 69 years old gave the lowest estimations (meanregularly=0.66€) about buying the product regularly.
Women gave higher price estimations than men (F(1,852)totry=8.641,p=0.003;F(1,852)regularly=11.084,p=0.000), and gender was explaining about 1% of the variance. The mean price for buying the product once was 1.15 € for women and 1.02 € for men. The mean price for buying the product regularly was 0.93 € for women and 0.82 € for men.
Place of living was statistically significant in both cases (F(3,852)totry=4.531,p=0.004;F(3,852)regularly=6.229,p=0.000) explaining about 2% of the variance. The subjects living in a metropolitan area gave the highest mean prices (meantotry=1.22€andmeanregularly=0.99€). The subjects living in small cities (<40 000 citizens) gave the lowest prices about trying
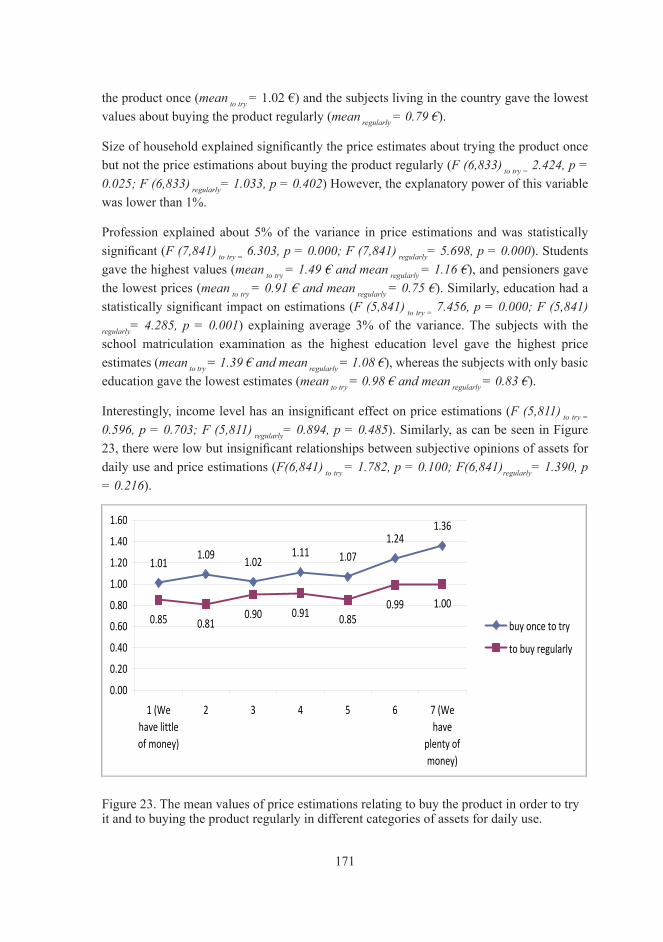
171
the product once (meantotry=1.02 €) and the subjects living in the country gave the lowest values about buying the product regularly (meanregularly=0.79€).
Size of household explained significantly the price estimates about trying the product once but not the price estimations about buying the product regularly (F(6,833)totry=2.424,p=0.025;F(6,833)regularly=1.033,p=0.402) However, the explanatory power of this variable was lower than 1%.
Profession explained about 5% of the variance in price estimations and was statistically significant (F(7,841)totry=6.303,p=0.000;F(7,841)regularly=5.698,p=0.000). Students gave the highest values (meantotry=1.49€andmeanregularly=1.16€), and pensioners gave the lowest prices (meantotry=0.91€andmeanregularly=0.75€). Similarly, education had a statistically significant impact on estimations (F(5,841)totry=7.456,p=0.000;F(5,841)regularly= 4.285, p= 0.001) explaining average 3% of the variance. The subjects with the school matriculation examination as the highest education level gave the highest price estimates (meantotry=1.39€andmeanregularly=1.08€), whereas the subjects with only basic education gave the lowest estimates (meantotry=0.98€andmeanregularly=0.83€).
Interestingly, income level has an insignificant effect on price estimations (F(5,811)totry=0.596,p=0.703;F(5,811)regularly=0.894,p=0.485). Similarly, as can be seen in Figure 23, there were low but insignificant relationships between subjective opinions of assets for daily use and price estimations (F(6,841)totry=1.782,p=0.100;F(6,841)regularly=1.390,p=0.216).
1.011.09
1.021.11 1.07
1.241.36
0.85 0.810.90 0.91 0.85
0.99 1.00
0.00
0.20
0.40
0.60
0.80
1.00
1.20
1.40
1.60
1 (Wehave littleof money)
2 3 4 5 6 7 (Wehave
plenty ofmoney)
buy once to try
to buy regularly
Figure 23. The mean values of price estimations relating to buy the product in order to try it and to buying the product regularly in different categories of assets for daily use.
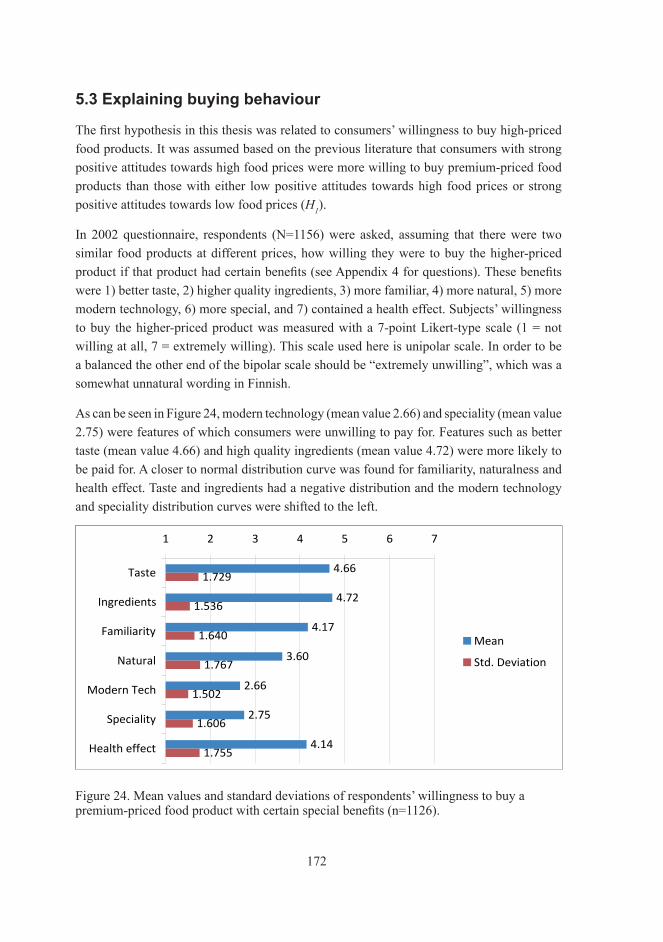
172
5.3 Explaining buying behaviour
The first hypothesis in this thesis was related to consumers’ willingness to buy high-priced food products. It was assumed based on the previous literature that consumers with strong positive attitudes towards high food prices were more willing to buy premium-priced food products than those with either low positive attitudes towards high food prices or strong positive attitudes towards low food prices (H1).
In 2002 questionnaire, respondents (N=1156) were asked, assuming that there were two similar food products at different prices, how willing they were to buy the higher-priced product if that product had certain benefits (see Appendix 4 for questions). These benefits were 1) better taste, 2) higher quality ingredients, 3) more familiar, 4) more natural, 5) more modern technology, 6) more special, and 7) contained a health effect. Subjects’ willingness to buy the higher-priced product was measured with a 7-point Likert-type scale (1 = not willing at all, 7 = extremely willing). This scale used here is unipolar scale. In order to be a balanced the other end of the bipolar scale should be “extremely unwilling”, which was a somewhat unnatural wording in Finnish.
As can be seen in Figure 24, modern technology (mean value 2.66) and speciality (mean value 2.75) were features of which consumers were unwilling to pay for. Features such as better taste (mean value 4.66) and high quality ingredients (mean value 4.72) were more likely to be paid for. A closer to normal distribution curve was found for familiarity, naturalness and health effect. Taste and ingredients had a negative distribution and the modern technology and speciality distribution curves were shifted to the left.
4.66
4.72
4.17
3.60
2.66
2.75
4.14
1.729
1.536
1.640
1.767
1.502
1.606
1.755
1 2 3 4 5 6 7
Taste
Ingredients
Familiarity
Natural
Modern Tech
Speciality
Health effect
Mean
Std. Deviation
Figure 24. Mean values and standard deviations of respondents’ willingness to buy a premium-priced food product with certain special benefits (n=1126).
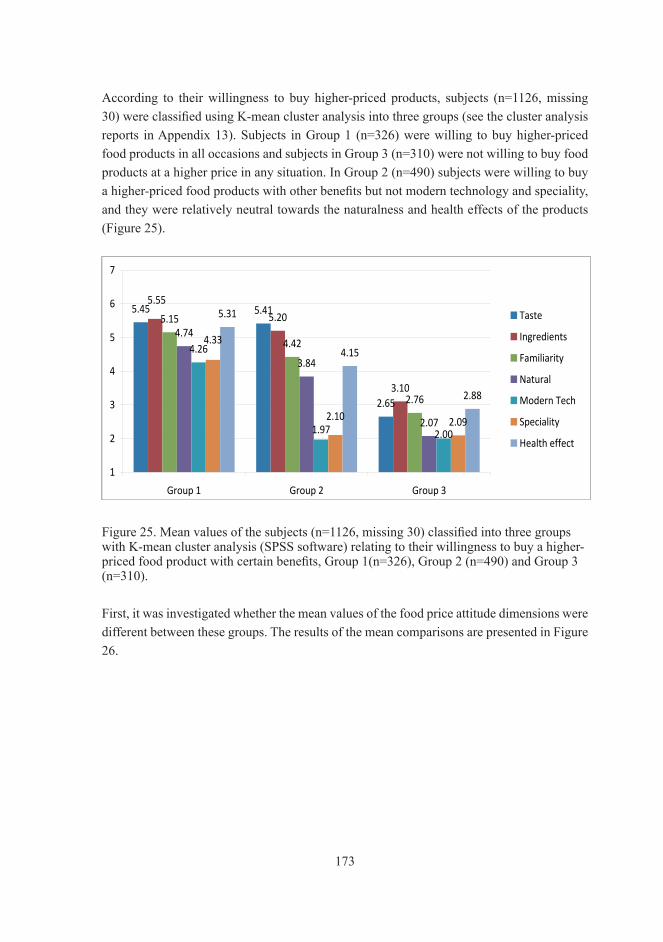
173
According to their willingness to buy higher-priced products, subjects (n=1126, missing 30) were classified using K-mean cluster analysis into three groups (see the cluster analysis reports in Appendix 13). Subjects in Group 1 (n=326) were willing to buy higher-priced food products in all occasions and subjects in Group 3 (n=310) were not willing to buy food products at a higher price in any situation. In Group 2 (n=490) subjects were willing to buy a higher-priced food products with other benefits but not modern technology and speciality, and they were relatively neutral towards the naturalness and health effects of the products (Figure 25).
5.45 5.41
2.65
5.20
3.10
5.15
4.42
2.76
4.74
3.84
2.07
4.26
2.09
5.31
4.15
2.88
5.55
1.97 2.00
4.33
2.10
1
2
3
4
5
6
7
Group 1 Group 2 Group 3
Taste
Ingredients
Familiarity
Natural
Modern Tech
Speciality
Health effect
Figure 25. Mean values of the subjects (n=1126, missing 30) classified into three groups with K-mean cluster analysis (SPSS software) relating to their willingness to buy a higher-priced food product with certain benefits, Group 1(n=326), Group 2 (n=490) and Group 3 (n=310).
First, it was investigated whether the mean values of the food price attitude dimensions were different between these groups. The results of the mean comparisons are presented in Figure 26.
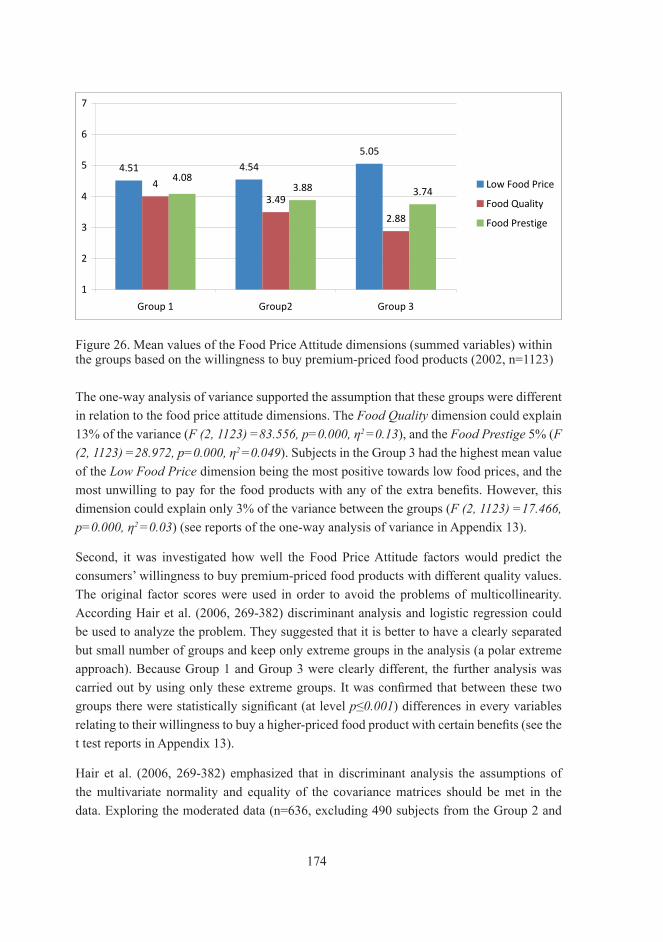
174
4.51 4.54
5.05
4
3.49
2.88
3.88 3.744.08
1
2
3
4
5
6
7
Group 1 Group2 Group 3
Low Food Price
Food Quality
Food Prestige
4.67
3.48
3.74
4.71
3.4
4
1.34
1.18
1.68
1 2 3 4 5 6 7
Low Food Price
Food Quality
Food Prestige
mean
median
sd
4.06
5.71 5.62
3.54
2.96
4.60
2.88
4.91
2.59 2.57
4.31
5.10
1
2
3
4
5
6
7
Group 1 (n=383) Group 2 (n=111) Group 3 (n=417) Group 4 (n=245)
Low Food Price
Food Quality
Food Prestige
Figure 26. Mean values of the Food Price Attitude dimensions (summed variables) within the groups based on the willingness to buy premium-priced food products (2002, n=1123)
The one-way analysis of variance supported the assumption that these groups were different in relation to the food price attitude dimensions. The FoodQuality dimension could explain 13% of the variance (F(2,1123)=83.556,p=0.000,η2=0.13), and the FoodPrestige 5% (F(2,1123)=28.972,p=0.000,η2=0.049). Subjects in the Group 3 had the highest mean value of the LowFoodPrice dimension being the most positive towards low food prices, and the most unwilling to pay for the food products with any of the extra benefits. However, this dimension could explain only 3% of the variance between the groups (F(2,1123)=17.466,p=0.000,η2=0.03) (see reports of the one-way analysis of variance in Appendix 13).
Second, it was investigated how well the Food Price Attitude factors would predict the consumers’ willingness to buy premium-priced food products with different quality values. The original factor scores were used in order to avoid the problems of multicollinearity. According Hair et al. (2006, 269-382) discriminant analysis and logistic regression could be used to analyze the problem. They suggested that it is better to have a clearly separated but small number of groups and keep only extreme groups in the analysis (a polar extreme approach). Because Group 1 and Group 3 were clearly different, the further analysis was carried out by using only these extreme groups. It was confirmed that between these two groups there were statistically significant (at level p≤0.001) differences in every variables relating to their willingness to buy a higher-priced food product with certain benefits (see the t test reports in Appendix 13).
Hair et al. (2006, 269-382) emphasized that in discriminant analysis the assumptions of the multivariate normality and equality of the covariance matrices should be met in the data. Exploring the moderated data (n=636, excluding 490 subjects from the Group 2 and

175
30 missing values) with discriminant analysis using SPSS software, the M Box’s test of equality revealed that this data was unsuitable for discriminant analysis. M Box’s test rejects the data when the data is large, but further inspection of the log determinants showed that the covariance matrices were not equal, and variables were not normally distributed. Because two of the most important assumptions were not met and there were only two groups to be examined (categorical dependent variable) the logistic regression was used instead (see Appendix 14 for a full report of the logistic regression results).
Logistic regression explains and predicts the probability of an event occurring (subjects willing to buy a premium-priced food product = 1 as in Group 1, and subjects unwilling to buy a premium-priced food product = 0 as in Group 3). Groups were mutually exclusive and collectively exhaustive. One subject could belong only to the one group.
Results showed that all persons willing to buy a high-priced product were correctly classified in the right group, but all unwilling persons were classified incorrectly. First the constant term is tested by logistic regression analysis. In this case, the constant was not a statistically significant term to use as an explanatory variable (B=.050, Wald=.402, p=.526, Exp (B) =1.052). Using a forward-stepping method, all factors were included in the explanatory model. In the omnibus test of model coefficients chi-square values were calculated for every step (adding variables into the equation) and the significance of this change was tested. Three procedures were carried out as three factors were entered into the model. All these steps were statistically significant at the level p≤0.01 (step 1: p=0.000, step 2: p=0.000 and step 3: p=0.009) meaning that all factors improve the model. In the logistic regression analysis (SPSS-software), -2LL Log likelihood (deviance) is used to calculate Nagelkerke R Square (Nummenmaa 2004, 326). This value (like a coefficient of determination R² in linear regression analysis) can be used to investigate to what extent our model explains the variance. Results of the model summary are presented in Table 20.
Table 20. Results of the model summary: in Step 1 “Food Quality” factor, in Step 2 “Food Prestige” factor, and in Step 3 “Low Food Price” factor were entered in to the model.
Step -2LL Cox & Snell R² Nagelkerke R²Step 1 749.942 .187 .249Step 2 734.146 .207 .275Step 3 727.402 .215 .287
From the results it can be seen that by entering one variable (the FoodQuality factor) into the model 25% (100 x Nagelkerke R²) of the variance would be explained. Entering other variables into the model augments the degree of explanation a little. Based on these results the model can explain 29% of the variance in this data. Using the Hosmer and Lemeshow test one can explore how good the model is in predicting the right groups. If the model is not

176
good, the chi-square values are high and p-values are less than 0.05. This model seems to have quite good predicting power (Table 21).
Table 21. The results of the Hosmer and Lemeshow test.
Chi-Square df sig.
Step 1 4.427 8 .817Step 2 10.488 8 .232Step 3 11.088 8 .197
In the classification table (Table 22), it is possible to investigate how the subjects were classified when more variables were added to the model. The model was able to predict the right group in 68.7% of the cases (n=636). Interestingly, the FoodQuality factor alone was able to predict 71% of subjects unwilling and 67% of subjects willing to buy higher-priced food products. Having all three factors in the model 70% of subjects unwilling and 67% of subjects willing to buy premium-priced food products were classified into right groups.
Table 22. Results of the classification.
Observed unwilling to buy (0) willing to buy (1) % correct
Step 1 unwilling (0) willing (1)
221 108
89 218
71.3% 66.9%
Step 2 unwilling (0) willing (1)
221 114
89 212
71.3% 65.0%
Step 3 unwilling (0) willing (1)
218 107
92 219
70.3% 67.2%
Logistic regression calculates the likelihood ratios and model coefficients with test statistics. Odd ratios (exp (B)) in Table 23 explain the change in B-values. All factors were significant in explaining the variance in the data. The FoodQuality factor and the FoodPrestige factor were significant at level p≤0.001 and the LowFoodPrice factor at level p≤0.01, thus they all improved the model.
Exploring the changes in beta-values reveals that the change in FoodQuality scores has the biggest effect on the buying intentions. Because the original factor scores were used, the LowFoodPrice factor indicated a reversed positive attitude towards low prices, and the relationship is positive as with the other factors (pointing in the same direction). Therefore, the result can be interpreted as subjects who are less negative towards high food prices (the value of the reversed Low Food Price scores increases) are more willing to buy premium-priced food products (the value of the willingness to buy scores also increases) and B-value (original logistic coefficient) is positive. The value of the exponentiated coefficient (Exp

177
(B)) reflects the magnitude of this change. As can be seen in Table 23, one unit change in LowFoodPrice scores will cause the 29.7% change in odds.
Table 23. Results of the likelihood ratios and model coefficients with test statistics.
B S.E. Wald df Sig. Exp(B)
Step 1a Food Quality 1.171 ,117 100.845 1 .000 3.225Constant .105 .089 1.401 1 .237 1.111
Step 2b
Food Quality 1.135 .118 93.175 1 .000 3.112Food Prestige .425 .108 15.515 1 .000 1.529Constant .143 .091 2.487 1 .115 1.154
Step 3c
Low Food Price
.260 .101 6.673 1 .010 1.297
Food Quality 1.118 .118 90.468 1 .000 3.059Food Prestige .423 .108 15.233 1 .000 1.526Constant .157 .091 2.945 1 .086 1.170
a. Variable(s) entered on step 1: Food Quality factor.b. Variable(s) entered on step 2: Food Quality factor, Food Prestige factor.c. Variable(s) entered on step 3: Low Food Price factor, Food Quality factor, Food Prestige factor.
The results of the logistic regression analysis suggest that the FoodQuality factor is the most powerful predictor of all these three factors and can on its own explain 25% of the variance. Moreover, consumers’ willingness to buy premium-priced food products can be predicted correctly in 67% of all cases by this measurement. The most effective explanatory power is understandable because all the observed variables were directly related to quality features (e.g., higher quality ingredients, better taste etc.). The other two factors can be included to the model and they significantly improve it. Based on these results, one of our hypotheses (H1)was supported. It was assumed that consumers with stronger positive attitude towards high prices were more willing to buy food products at a premium price than others. It seems that it is not related to a certain benefit, because, there were subjects willing to pay extra for all of the benefits named in this study. For these subjects it seems to be more a general opinion related to positive attitudes towards high food prices, meaning that they probably believe that a high price is an indicator of high quality and one must pay more to gain better benefits.
5.4 Differences between consumers based on the food price attitude
One of the aims of this study was to explore how Finnish consumers differed based on their attitudinal perceptions towards food prices. It was also investigated whether consumers can

178
be categorized into different subgroups based on the Food Price Attitude Scale developed in this thesis. Methodologically, it was of interest that how this scale was able to detect differences in different data sets and on different occasions. It was assumed that based on the food price attitudes, subjects can be characterized similarly in different data sets. This was examined by using cluster analysis and several large consumer samples. The methods of cluster analyses are described in more detail in chapter 4.2.3. First, the optimum cluster solution was explored in the data sample collected in 2002 (N=1156). Second, the cluster structure was validated with two large consumer samples collected in 2004 (2004a, N=1113, and 2004b, N=1027) within a short period of time.
The sample of 1156 subjects in 2002 had quite neutral attitudinal values towards food prices when measured with the Food Price Attitude Scale. In general (based on the total mean values), consumers were quite positive towards low food prices and quite neutral towards high food prices as can be seen in Figure 27. However, standard deviations revealed differences between subjects.
4.51 4.54
5.05
4
3.49
2.88
3.88 3.744.08
1
2
3
4
5
6
7
Group 1 Group2 Group 3
Low Food Price
Food Quality
Food Prestige
4.67
3.48
3.74
4.71
3.4
4
1.34
1.18
1.68
1 2 3 4 5 6 7
Low Food Price
Food Quality
Food Prestige
mean
median
sd
4.06
5.71 5.62
3.54
2.96
4.60
2.88
4.91
2.59 2.57
4.31
5.10
1
2
3
4
5
6
7
Group 1 (n=383) Group 2 (n=111) Group 3 (n=417) Group 4 (n=245)
Low Food Price
Food Quality
Food Prestige
Figure 27. The mean, median and standard deviation values based on summed variables composed by Food Price Attitude factors.
5.4.1 Exploring the optimum cluster solution
In 2002, all cases (N=1156) were first clustered hierarchically with using Ward’s method. In order to find the best cluster solution the stopping rule was used in order to calculate the measure of heterogeneity change (Hair et al. 2004, 594). The agglomeration coefficients were studied to find thresholds, the points at which the change in coefficiencies makes a sudden leap (Figure 28). Favourable group solutions can be calculated by reducing the cases

179
in which the threshold exists from the number of all cases. Results suggested three- or five-group-solutions (1156 – 1153 = 3 and 1156 – 1150 = 5).
0
100
200
300
400
500
600
700
1148 1149 1150 1151 1152 1153 1154 1155
Series2
Figure 28. The agglomeration coefficiencies from Ward’s hierarchical cluster analysis.
In order to study the different cluster solutions the K-means cluster analysis (by SPSS software) was computed by using factor scores from exploratory factor analysis. Subjects were divided into three, four, five, and six groups. All these solutions were studied descriptively comparing group sizes and the mean values of summed variables, as recommended by Hair et al. (2006, 594-595). It was decided to divide subjects into four groups because all these groups were clearly different from each other. These groups were equal in size, and the several combinations of the Food Price Attitude dimensions became visible.
5.4.2 Describing the Food Price Attitude groups
The subjects of the sample collected in 2002 (N=1156) were divided into four groups based on Food Price Attitude factor scores by K-means cluster analysis (using SPSS software, see the quick cluster report in Appendix 12). Further, it was investigated how consumers differed based on the food price attitude dimensions by comparing the mean values. Compared means of summed variables are shown in Figure 29. These mean scores are absolute means without loadings with factor scores. Within each of the groups, subjects had a unique combination of ways in which they valued high and low food prices. There were clear differences in mean values compared to the total sample (Low Food Price mean = 4.67; Food Quality mean = 3.48; Food Prestige mean = 3.74).

180
4.51 4.54
5.05
4
3.49
2.88
3.88 3.744.08
1
2
3
4
5
6
7
Group 1 Group2 Group 3
Low Food Price
Food Quality
Food Prestige
4.67
3.48
3.74
4.71
3.4
4
1.34
1.18
1.68
1 2 3 4 5 6 7
Low Food Price
Food Quality
Food Prestige
mean
median
sd
4.06
5.71 5.62
3.54
2.96
4.60
2.88
4.91
2.59 2.57
4.31
5.10
1
2
3
4
5
6
7
Group 1 (n=383) Group 2 (n=111) Group 3 (n=417) Group 4 (n=245)
Low Food Price
Food Quality
Food Prestige
Figure 29. Mean values of summed variables in four different consumer groups (N=1156).
Differences in background variables between the groups were studied by cross tabulation, and statistical significance was evaluated using chi-square tests. There was a statistical significant difference between the groups according to age (p=0.005), gender (p=0.010), place of living (p=0.001), education (p=0.000), profession (p=0.000), level of household income (p=0.000), and assets available for daily consumption (p=0.000). Interestingly, the size of the household was not statistically significant (p=0.295). Even though some of the background variables were statistically significant it does not prove that groups could be characterized based on these variables, for in a big data sample even small differences become significant. By studying these groups using cross tabulation it became evident that subjects with different socio-demographical characteristics were quite equally distributed between all groups. For example, 60% of all subjects had intermediate education and they were equally distributed in different subgroups (Group 1 = 60%, Group 2 = 64%, Group 3 = 51%, and Group 4 = 63% of all group members had intermediate education). Nevertheless, some differences exist and some classifications can be made.
Group 1 (n=383, 33%) could be characterized as the most negative group towards high food prices and could be called high price avoiders. Even though they were quite neutral towards low food prices, they were clearly negative both in the quality and prestige dimensions. The mean age was 43.25 and the largest age group was 30-39 years (23% of this group). 51% of these subjects were men, and 64% lived in a small city or town (less than 40,000 inhabitants) or in the countryside. The biggest group of managers or business owners were placed in this group (34% of all managers and business owners in the sample). However, 31% of the members of this group were workers. There were no great differences between levels of education. This group contained subjects from all income levels, although 23% of all

181
these members had an income level of 30,000 € - 40,000 €, this being the biggest subgroup (see Figure 30). Group 1 members mostly agreed that they had a good amount of money available for daily use (mean value 4.19 with standard deviation 1.438) (see Figure 31).
Group 2 (n=111, 10%) could be characterized by their wish for quality and low prices. They were willing to seek low prices on foods but they were also willing to pay more for good food quality. They were not convinced that dinner guests would be more pleased with premium-priced foods than normal-priced food. Within this group the mean age was 45.85 and the largest age group was 60-78 years (25%). 61% of these subjects were women, 45% lived in the metropolitan area or in a big city (more than 40,000 inhabitants) and 21% lived in the countryside. Most of the unwaged (46% of all unemployed subjects or the home mothers or fathers in this sample) were classified in this group. However, the biggest professional groups were pensioners (25%) and workers (28%). Most of the subjects with only basic education were classified in this group (35% of all subjects with only basic education in the sample). Members of this group had relatively low income level. 13% of all subjects in this group had the income level under 10,000 € (Figure 30). These members mostly agreed that they were not well off with money (mean value 3.51 with standard deviation 1.457) (see Figure 31).
Group 3 (n=417, 36%) could be characterized as careful with money but generous to others. They considered that low food prices were important to them and were not willing to pay for better quality, though they were willing to treat guests to expensive food. Within this group the mean age was 47.85 and the largest age group was 60-78 years (27%). 55% were women, 48% lived in the metropolitan area or in a big city (more than 40,000 inhabitants) and only 14% lived in the countryside. Most of the executive officers (34% of all executive officers) were placed in this group. However, the largest professional subgroup was pensioners (31% of the group members). Most of the subjects with higher education were classified into this group (31% of all subjects in the sample with higher education). This group included more subjects with a higher income level than other groups (Figure 30). These members mostly agreed that they had a good amount of money for daily use (mean value 4.43 with a standard deviation of 1.351) (see Figure 31).
Group 4 (n=245, 21%) could be characterized as the most positive group towards high food prices and could be called quality seekers. They appreciated good quality and were willing to pay for it. They also believed that they needed to offer high-priced food to guests. They did not actively seek out cheap food prices. The mean age was 44.81 and the greatest age group was 15-29 years (24%). 59% were women, 48% lived in the metropolitan area or in a big city (more than 40,000 inhabitants) and only 13% lived in the countryside. The most of the students were classified into this group (35% of all students in the sample). However, the largest professional subgroup was workers (24% of all members of this group). 11% of the subjects in this group had an income level under 10 000 € and 15% of the group members

182
had an income level over 50,000 € (Figure 30). These members mostly agreed that they had a good amount of money for daily use (mean value 4.07 with standard deviation 1.441) (Figure 31).
11 % 17 % 21 % 23 % 12 % 15 %
7 % 19 % 17 % 25 % 15 % 17 %
13 % 28 % 26 % 17 % 10 % 6 %
10 % 18 % 22 % 23 % 12 % 16 %
0 % 20 % 40 % 60 % 80 % 100 %
Group 1 (n=383)
Group 2 (n=111)
Group 3 (n=417)
Group 4 (n=245)
under 10000 €
10001-20000 €
20001-30000 €
30001-40000 €
40001-50000 €
over 50000 €
31 % 24 % 45 %
20 % 29 % 51 %
47 % 28 % 25 %
28 % 31 % 41 %
0 % 20 % 40 % 60 % 80 % 100 %
Group 1 (n=383)
Group 2 (n=111)
Group 3 (n=417)
Group 4 (n=245)
little of money ( 1-3)
neutral (4)
plenty of money (5-7)
5.23
4.15 3.954.21 4.33
3.22 3.41 3.46
4.36 4.44
1
2
3
4
5
6
7
GeneralQuality
Food Quality Food Prestige General LowPrice
Low Food Price
Subjects with Low General Qualityvalues (1-3.9)
Subjects with High General Qualityvalues (4-7)
Figure 30. The distribution of income level in each group 2002 (n=1127).
The mean values of subjective opinion of monetary situation (assets for daily consumption) were quite close to neutral in each of the groups ranging from 3.51 to 4.43 with a sample mean of 4.01. Consequently a more detailed analysis was made to investigate how subjects were divided based on low (1-3) and high (5-7) scores (see Figure 31).
11 % 17 % 21 % 23 % 12 % 15 %
7 % 19 % 17 % 25 % 15 % 17 %
13 % 28 % 26 % 17 % 10 % 6 %
10 % 18 % 22 % 23 % 12 % 16 %
0 % 20 % 40 % 60 % 80 % 100 %
Group 1 (n=383)
Group 2 (n=111)
Group 3 (n=417)
Group 4 (n=245)
under 10000 €
10001-20000 €
20001-30000 €
30001-40000 €
40001-50000 €
over 50000 €
31 % 24 % 45 %
20 % 29 % 51 %
47 % 28 % 25 %
28 % 31 % 41 %
0 % 20 % 40 % 60 % 80 % 100 %
Group 1 (n=383)
Group 2 (n=111)
Group 3 (n=417)
Group 4 (n=245)
little of money ( 1-3)
neutral (4)
plenty of money (5-7)
5.23
4.15 3.954.21 4.33
3.22 3.41 3.46
4.36 4.44
1
2
3
4
5
6
7
GeneralQuality
Food Quality Food Prestige General LowPrice
Low Food Price
Subjects with Low General Qualityvalues (1-3.9)
Subjects with High General Qualityvalues (4-7)
Figure 31. Distribution of scores related to the opinion statement of assets for daily use (7 point Likert-type scale, 1= We have little money, 7 = We have plenty of money). Subjects who scored low values probably had money pressures. Subjects scoring 4 had a neutral monetary situation, and subjects who were in a good monetary situation gave the highest values 5-7).

183
Group 2 members had the strongest positive attitudes towards the low food prices and they were clearly experienced more money pressures than the members of the other groups. Nevertheless, they had quite strong positive attitudes towards high food prices if it meant high quality. Group 1 members had the most negative attitudes towards high food prices. This group contained many subjects at the highest income level, the most of the executives or business owners were members of this group, and the most of them had a good monetary situation. Group 3 subjects had strong positive attitudes towards low food prices and were not eager to pay for better food quality. However, they felt that higher-priced food was needed if guests came. These subjects were the most satisfied into their monetary situation feeling less money pressures than any other subjects. Group 4 subjects were clearly younger than members of the other groups. Consequently many subjects felt monetary pressures, although they had the most positive attitudes towards high food prices and they were the less positive towards low food prices than members of any other group.
5.4.3 Validation of the cluster structure
Two years later two new consumer data samples were separately collected (2004a collected in May 2004, N= 1113 and 2004b in April 2004, N=1027) in order to validate the cluster structure found in the previous survey. The idea was to collect similar data sets within a short time period and reduce the effect of the time from the analysis. No new variables were added to the measurements and the Food Price Attitude Scale was the same as in 2002 (see questions in Appendix 5). According to Hair et al. (2004, 560-561), cluster analysis does not necessarily create similar solutions in different data sets because it selects the cluster seeds randomly. Therefore new samples were collected and cluster analysis was performed in order to test whether clustered structure really exists in the different data sets. In Table 24, the mean and median values of each summed variable are presented, and only minor differences between the samples were found. It is assumed, based on this finding, that food price attitudes might be quite stable constructs. However, there was a minor increase in positive attitudes towards high food prices in 2004.
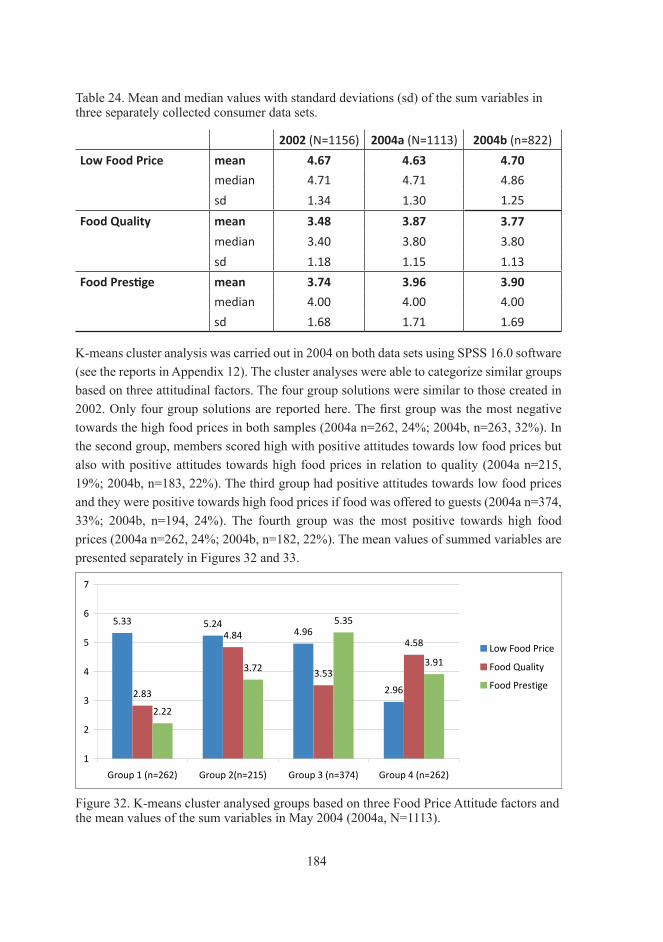
184
Table 24. Mean and median values with standard deviations (sd) of the sum variables in three separately collected consumer data sets.
2002 (N=1156) 2004a (N=1113) 2004b (n=822)
Low Food Price mean 4.67 4.63 4.70
median 4.71 4.71 4.86
sd 1.34 1.30 1.25
Food Quality mean 3.48 3.87 3.77
median 3.40 3.80 3.80
sd 1.18 1.15 1.13
Food Prestige mean 3.74 3.96 3.90
median 4.00 4.00 4.00
sd 1.68 1.71 1.69
K-means cluster analysis was carried out in 2004 on both data sets using SPSS 16.0 software (see the reports in Appendix 12). The cluster analyses were able to categorize similar groups based on three attitudinal factors. The four group solutions were similar to those created in 2002. Only four group solutions are reported here. The first group was the most negative towards the high food prices in both samples (2004a n=262, 24%; 2004b, n=263, 32%). In the second group, members scored high with positive attitudes towards low food prices but also with positive attitudes towards high food prices in relation to quality (2004a n=215, 19%; 2004b, n=183, 22%). The third group had positive attitudes towards low food prices and they were positive towards high food prices if food was offered to guests (2004a n=374, 33%; 2004b, n=194, 24%). The fourth group was the most positive towards high food prices (2004a n=262, 24%; 2004b, n=182, 22%). The mean values of summed variables are presented separately in Figures 32 and 33.
5.33 5.244.96
2.962.83
4.84
3.53
4.58
2.22
3.72
5.35
3.91
1
2
3
4
5
6
7
Group 1 (n=262) Group 2(n=215) Group 3 (n=374) Group 4 (n=262)
Low Food Price
Food Quality
Food Prestige
5.18 5.045.30
2.992.86
4.78
3.36
4.52
2.35
3.90
5.35
4.62
1
2
3
4
5
6
7
Group 1 (n=263) Group 2(n=183) Group 3 (n=194) Group 4 (n=182)
Low Food Price
Food Quality
Food Prestige
Figure 32. K-means cluster analysed groups based on three Food Price Attitude factors and the mean values of the sum variables in May 2004 (2004a, N=1113).

185
5.33 5.244.96
2.962.83
4.84
3.53
4.58
2.22
3.72
5.35
3.91
1
2
3
4
5
6
7
Group 1 (n=262) Group 2(n=215) Group 3 (n=374) Group 4 (n=262)
Low Food Price
Food Quality
Food Prestige
5.18 5.045.30
2.992.86
4.78
3.36
4.52
2.35
3.90
5.35
4.62
1
2
3
4
5
6
7
Group 1 (n=263) Group 2(n=183) Group 3 (n=194) Group 4 (n=182)
Low Food Price
Food Quality
Food Prestige
Figure 33. K-means cluster analysed groups based on three Food Price Attitude factors and the mean values of the factors in April 2004 (2004b, n=822).
Despite the fact that these groups were quite similar in relation to attitudinal dimensions, there were some differences based on the background variables. Socio-demographic distributions were analysed using cross tabulation and the statistical significance was tested using the chi-square test. In the data sample 2004a (N=1113) there were no statistically significant differences between the four groups by gender (p=0.423) or place of living (p=0.667) as there were in the sample collected in 2002. Otherwise, similar statistically significant differences were discovered with age groups (p=0.000), profession (p=0.000), education (p=0.000), income level of household (p=0.000), and assets for daily use (p=0.000). In the 2004b data sample (n=822), there were statistically significant differences between the groups by gender (p=0.013), age groups (p=0.003), profession (p=0.001), education (p=0.000), income level of household (p=0.000), and assets for daily use (p=0.000).
Compared to all samples there were only minor differences between the mean ages within the groups (Figure 34) but when classifying subjects into different age groups differences between the groups were noticeable (Figure 35).
There were more young subjects (24%) in Group 4 in 2002 than in the samples collected in 2004a (10%) and 2004b (13%). Older citizens (over 60 years old) were the largest age group in Group 2 in 2004a and 2004b samples but in 2002 there largest group of older citizens were in Group 3 (Figure 35).

186
43.2545.85
41.92
47.12
54.12
46.8 4843.41
50.28 47.85
43.2646.78
0
10
20
30
40
50
60
Group 1 Group 2 Group 3 Group 4
2002
2004a
2004b
Figure 34. Differences in mean age within the groups in three different data samples 2002 (N=1156, sample mean age 44.81), 2004a (n=1024, sample mean age 48.54) and 2004b (n=746, sample mean age 45.64).
22 %
17 %
22 %
19 %
11 %
12 %
16 %
17 %
25 %
24 %
10 %
13 %
23 %
17 %
22 %
18 %
9 %
16 %
15 %
17 %
21 %
23 %
19 %
24 %
22 %
22 %
18 %
22 %
17 %
17 %
22 %
23 %
18 %
22 %
23 %
21 %
17 %
17 %
21 %
16 %
20 %
21 %
21 %
17 %
13 %
17 %
25 %
19 %
17 %
27 %
17 %
25 %
44 %
33 %
27 %
26 %
23 %
14 %
22 %
24 %
0 % 10 % 20 % 30 % 40 % 50 % 60 % 70 % 80 % 90 % 100 %
2002
2004a
2004b
2002
2004a
2004b
2002
2004a
2004b
2002
2004a
2004b
Gro
up 1
Gro
up 2
Gro
up 3
Gro
up 4
15-29
30-39
40-49
50-59
over 60
Figure 35. Distributions of age groups within the groups in three different data samples: 2002 (N=1156), 2004a (n=1024) and 2004b (n=746).
The variable related to assets for daily use was distributed with some differences between the groups in three different data sets. In Group 4, subjects had the best monetary situation

187
in both data samples collected in 2004. This was the group with the most positive attitudes towards high food prices. However, subjects in Group 1, who had the most negative attitudes towards high food prices, had a better monetary situations in 2002 than in 2004a and 2004b (Figure 36).
There were also minor differences between the groups in relation to other socio-demographic variables which are reported in an Appendix 7 (see for comparisons between income levels, assets for daily use, education, and profession in three different data samples).
4.19
3.51
4.434.07
3.694.01 4.02
4.49
3.563.93
3.72
4.64
.00
.50
1.00
1.50
2.00
2.50
3.00
3.50
4.00
4.50
5.00
Group 1 Group 2 Group 3 Group 4
2002
2004a
2004b
Figure 36. Mean values of the statement “Assets for daily use” within the groups in three different data samples: 2002 (n=1134, total sample mean 4.01), 2004a (n=1067, total sample mean 4.05) and 2004b (n=812, total sample mean 3.92). Likert-type scale 1-7 (1=We have little of money, 7= We have plenty of money).
5.5 Summary of the quantitative results
The main aims of the quantitative studies were 1) to explore the differences between Finnish consumers in relation to attitudinal opinions towards low and high food prices, 2) to investigate whether attitudes towards high and low food prices had an impact on willingness to buy food products at a high price, and 3) to explore whether attitudes towards low and high food prices had an impact on willingness to pay estimations given in the research situation. In order to investigate these questions the Food Price Attitude scale was developed and three separate dimensions were found using exploratory factor analysis: 1) positive attitudes towards low food prices (LowFoodPrice, eight variables), 2) positive attitudes towards high prices in relation to quality (FoodQuality, four variables), and 3) positive attitudes towards high prices in relation to food offered to quests (FoodPrestige, two variables). However,

188
confirmatory factor analysis and further the results of the structural equation modelling revealed that there were several observed variables which shared only a little of the common variance and there was a problem with the measurement error. The problem of measurement error indicates probably the multidimensionality of the Food Price Attitude Scale within the dimensions discovered in this study. The operationalization of these attitudinal dimensions requires further development.
Only a little of the variance related to the Food Price Attitude factors was explained by socio-demographics (from 0.08% to 6.2%), even though some background variables had a statistically significant effect on the Food Price Attitude dimensions. Age groups and gender had a significant impact on the LowFoodPrice and FoodQuality dimensions, but not on FoodPrestige. Place of living affected FoodPrestige but only weakly with FoodQuality and insignificantly with LowFoodPrice. Education, profession, income level, and subjective opinion of assets for daily use had statistically significant effect on all food price attitude dimensions. No interaction effect was found between age groups and gender or between income level and assets for daily use. Consumers were quite neutral to these attitudes, but standard deviations revealed that there were differences between consumers.
How do Finnish consumers differ according to the Food Price Attitude Scale?
In several different data samples (2002, N=1156; 2004a, N=1113; 2004b, N=1027) similar consumer groups were identified based on the Food Price Attitude Scale by K-means cluster analysis (PASW 17.0 software) and the discriminating power of the scale was tested. The results of these analyses revealed that consumers possess different combinations of positive attitudes towards high and low food prices. With hierarchical cluster analysis the optimum cluster solutions were explored and the four-group solution was chosen. Four similar groups were found in three different data samples (Figure 37).
4.06
5.33 5.185.71
5.24 5.045.62
3.542.96 2.992.96 2.83 2.86
4.60
2.883.53 3.36
4.58
2.22 2.35 2.57
3.72 3.904.31
5.35 5.10
3.91
4.96 5.304.84 4.78 4.91
4.52
2.59
5.354.62
1
2
3
4
5
6
7
2002 2004a 2004b 2002 2004a 2004b 2002 2004a 2004b 2002 2004a 2004b
Group 1 Group 2 Group 3 Group 4
Low Food Price Food Quality Food Prestige
Figure 37. The four cluster structures in three different consumer samples with the mean values of the Food Price Attitude measurements.

189
In Group 1, subjects had positive attitudes towards low food prices but they were the less positive towards high food prices than subjects in any other group. In Group 2, consumers were willing to buy food at low prices, but they were also willing to pay for better quality, having a positive attitude towards both low and high prices. In Group 3, consumers were willing to buy food with low prices, but they were also willing to offer premium-priced food to quests. They were not eager to pay for better quality. In Group 4, consumers had the most positive attitudes towards high food prices relating to quality and to prestige, and they were not interested in seeking out low food prices. All groups were quite similar in size in all different data samples (Table 25).
Table 25. Sizes of the subsamples in four cluster solutions.
group2002
(N=1156)
2004a
(N=1113)
2004b
(n=822)total average
negative to high food
prices1 383; 33% 262; 24% 263; 32% 303; 29%
positive to low and high
food prices (quality)2 111; 10% 215; 19% 183; 22% 170; 17%
positive to low and high
food prices (prestige)3 417; 36% 374; 33% 194; 24% 328; 32%
positive to high food
prices4 245; 21% 262; 24% 182; 22% 229; 22%
Statistically significant differences between the groups were found in 2002 according to age (p=0.005), gender (p=0.010), place of living (p=0.001), education (p=0.000), profession (p=0.000), level of household income (p=0.000), and assets available for daily consumption (p=0.000). However, all the samples were large and even minor differences may easily become significant. Even though there were statistically significant differences in background variables within clustered groups, typologies were difficult to create because of the differences in groups between the samples. All the survey samples used in this thesis were somewhat representative with minor exceptions; however, generalization was not the main focus. Differences between the groups in different samples suggested that the Food Price Attitude Scale can possible classify psychographical groups which cannot be sufficiently explained by socio-demographic variables, and, therefore it is argued that the scale developed in this study had good discriminant validity. The results of this study confirmed that the four cluster structure exists among the Finnish consumers and that there are consumers who have positive attitudes towards both low and high food prices at the same time.

190
Are consumers with positive attitudes towards high food prices willing to buy high priced food products?
It was hypothesized that positive attitudes towards high food prices would affect to consumers’ willingness to buy premium-priced food. This was supported by the results of ANOVA and logistic regression analysis in this study. In 2002 consumers were asked whether they were willing to pay a higher price for food products which had some extra benefit. Comparing the means of the summed variables of the food price attitude dimensions, the highest scores in positive attitudes towards high food prices were among subjects who were most willing to pay a higher price for products which had certain benefits. The highest mean value of the LowFoodPrice dimension was found among the subjects who were least willing to buy premium-priced food products with any of the benefits. Differences between the subjects based on the food price attitudes were statistically significant. According to the logistic regression results the FoodQuality factor could explain 25% of the variance of willingness to pay a premium price. The FoodPrestige factor was able to improve the explanatory power of the model by 3%, and the LowFoodPrice factor with 1% (29% for the total). Moreover, consumers’ willingness to buy premium-priced food products can be predicted correctly in 67% of all cases by this measurement. All factors improved the model significantly, although the FoodQuality factor was the best predictor. This supports the fact that the Food Price Attitude Scale has adequate predictive validity.
Does the Food Price Attitude affect price estimations in the research situation?
According to the qualitative study, the subjects kept a control on their food costs during the shopping, and it was assumed that consumers may evaluate a price differently depending on whether they are thinking of random purchases or regular purchases because of the cost control effect. The results confirmed that subjects give 22% higher estimates if they were asked to consider at what price they were willing to buy the product in order to try it (a random purchase) than if they were buying a product regularly.
The second hypothesis of the study was whether the food price attitudes can have an effect on price estimations. This was supported based on the results of the structural equation modelling indicating that 4.4% of the variance related to willingness to pay estimations was explained by the positive attitudes towards low food prices (the LowFoodPrice dimension). Even though this had a minor impact on price estimations, it was statistically significant. Purchase behaviour in general is a complex situation in which different attributes need to be evaluated, thus a weak relationship was expected. Positive attitudes towards the high food prices relating to quality (FoodQuality) or to willingness to offer premium-priced food to guests (FoodPrestige) had a statistically insignificant relationship on price estimations.

191
However, theFoodQualitydimension had a significant impact on price sensitivity (LowFoodPrice), and probably affects price estimations indirectly.
The relationship between price estimates and the Food Price Attitude Scale was inspected further by categorizing subjects into four groups based on the given price estimations. Subjects with the lowest price estimates (prices ranged from 0.05 € to 0.50 €) had the strongest positive attitudes (mean to try = 4.94 € and mean regularly = 4.93 €) towards low food prices. On the other hand, subjects with the highest price estimates (prices ranged from 1.55 € to 5.50 €) had the lowest mean values of positive attitudes towards low food prices (mean to try = 4.36 € and mean regularly = 4.44 €). These differences were statistically significant. The mean values relating to positive attitudes towards high food prices had minor but statistically insignificant differences between price categories. Therefore, the claim that subjects giving higher price estimates would have stronger positive attitudes towards high food prices than those who give lower price estimates was not statistically supported even if the results were in line with this prediction. Furthermore, one-way analysis of variance was used to test how much the socio-demographic variables were able to explain the variance of price estimations. Age groups explained 8% of the variance and profession about 5% in both estimates, namely to try the product once and to buy the product regularly. Gender (1%), education (3%), and place of living (2%) had a minor but significant effect on both price estimates. Income level and subjective opinion of assets for daily use had insignificant effect on price estimations. Compared to these socio-demographic variables, the positive attitudes towards low food prices equally explained (4.4%) of the variance in price estimations, and therefore should be taken into account in research situations as a possible new background variable.

192
6 Discussion and contributions
In this thesis, the consumers’ attitudes towards food prices were explored. The aim of the study was to understand the role of price in foods and, more accurately, how consumers perceive expensiveness and cheapness in foods, how consumers differ based on their attitudinal perceptions of cheapness and expensiveness, and what kind of impact these attitudes may have on behaviour. It was hypothesized that attitudes towards cheapness and expensiveness have an effect on willingness to buy premium-priced food products (H1), and they also affect willingness to pay estimations (H2). According to the results, both hypotheses were supported. Both qualitative and quantitative research methods were used to investigate the problem, and five samples were collected involving altogether 4,494 Finnish consumers. The qualitative approach gave a large theoretical framework how expensiveness and cheapness in foods were experienced. The Food Price Attitude Scale was developed by means of quantitative studies, and the hypotheses were confirmed. The differences between Finnish consumers based on food price attitudes were described with several large consumer samples.
The main framework of food price perceptions was difficult to outline even though the literature in this field is large. Collecting results from different research conventions and trying to create a unity was challenging. With thematic interviews, subjects gave the guidelines to comprehend the important dimensions in food price perceptions. After presenting the results of the qualitative study, the theoretical discussion is given in chapter 3.3. A summary of the main quantitative results is presented in chapter 5.5. In this final chapter, these findings are theoretically discussed further, the limitations of the study are considered and the ideas for future research are given.
6.1 Main findings of the study
The main findings of this study are related to the meaning of food price and the understanding of quality inferences derived from food prices. Additionally, the attitudinal structure of food price perceptions is constructed by developing the Food Price Attitude Scale. Furthermore, the differences between consumers based on the food price attitudes, and the impact of the food price attitude on behavioural intentions were analyzed. One important contribution of this study is methodological, and it is to be hoped that most of the findings will be of significance in future food price research. The aim of this thesis was to create a better understanding of consumers’ attitudinal perceptions of food prices, and, as a result, these findings may help us to learn more of this complex phenomenon.

193
6.1.1 The importance of price
In this thesis, the meaning of price is outlined through the importance or significance of food prices (similarly by Osgood et al. 1965), and the role of price in food purchase is discussed. The importance is often related to the concept of involvement. Involvement concerns about the relevance of the object based on interests, needs and values (Zaichkowsky 1985, 342) and food involvement was clearly observed from the qualitative data. Differences between the subjects based on interests were identified with food, food shopping and food prices. The interviewed subjects contained people with high and low involvement in foods. The low-involved subjects considered food as necessity and the high-involved subjects were eager to indulge themselves or others with good food. Similar results has been reported by Bäckström et al. (2003, 304). Pleasure gained from consuming good food in good company was mostly related to weekends or celebrations, and everyday cooking was regarded as a necessity. However, in this sample, there were differences among the subjects how the pleasure gained from food consumption was valued and emphasized. Most of the subjects with low involvement in food shopping perceived a food shopping as a necessary task to be performed, even if some of them were highly involved in food. This can be due to the valuation of time and time constraints in Western cultures, as has been reported by Ackerman and Tellis (2001).
The importance of food prices was an ambiguous dimension. The concept of price involvement in this study bears a similarity to the concepts of price sensitivity and price consciousness. A subject was highly involved in food prices if he or she was interested in low food prices, valued low food prices and he or she was willing to look for price information, albeit there were few such subjects in this study. Most of the subjects were interested in food prices even though they were not eager to actively seek out low food prices and compare price information. The low importance of food prices would appear to be related to the small monetary sacrifice of a single food product and the habitual nature of food purchase. Otherwise, food prices were highly important when food expenses were on focus. The subjects chose certain places at which to shop based on the store price image, the store price image being more important than the price of certain food products (also McGoldrick et al. 1999; Ofir et al. 2008). Quality differences were claimed to be quite small, and thus similar products were easily considered to be acceptable substitutes.
According to Osgood et al. (1965, 198) attitude is one of the dimensions of the meaning, and perhaps because of that, importance has been seen as a reflection of the attitudes behind it. The importance of price has been used to signal the attitudes towards the food prices and it has been taken as a synonym for attitude (e.g. Rosa-Diaz 2004; Bowman 2006). Consequently, in earlier studies the importance of price has been perceived as a one-dimensional construct including the importance of low prices in choice situation (e.g. Steptoe et al. 1995; Eertmans et al. 2006; Chen 2007). This is based on neoclassical economic theory according to which

194
consumers are willing to search for price information and willing to buy products at the lowest possible prices, and this kind of behaviour was indeed observed in relation to foods in this study. The main aspect in foods which is related to attitudes, but which is not directly visible in the concept of importance, is experienced quality. In this study, some consumers had favourable attitudes towards high-priced food products and they were uninterested in searching for price information or looking for the lowest possible prices, as has been reported by the previous studies (e.g. Lambert 1972; Steenkamp and van Trijp 1985; Erickson and Johansson 1985; Lichtenstein et al. 1993; Grunert et al. 2009). Food prices might be important for all at some level (as assumed by Chocarro et al. 2009) even if the price of a certain food product is not. Therefore, it is argued in this thesis that the importance of the price is probably not the best indicator of attitudes towards food prices.
The findings of the first quantitative survey (2001, N=1158) supported the assumption that price perception is a multidimensional concept (also e.g., Lichtenstein et al. 1993; Monroe 2003, 172-173) and the importance of a low price does not tell the whole story because perceptions towards high prices cannot be predicted from perceptions towards low prices. In the 2001 survey, favourable attitudes towards high prices did not mean unfavourable attitudes towards low prices. Consumers (n=774) willing to pay for high quality at the general level had favourable attitudes towards high prices (a mean value of 5.23), but, they were quite neutral towards low prices (a mean value of 4.21). Additionally, they gave similar scores for low prices than consumers (n=384) who were less favourable towards high prices in general (a mean value of 3.22 concerning high prices and a mean value of 4.36 concerning low prices). There was a statistically insignificant difference between the groups in terms of low prices even though they valued high prices differently (at the 0.001 level of significance). Consumers can perceive the price in its positive role (as a quality cue or prestige cue) and in its negative role (as a sacrifice) (Lichtenstein et al. 1993). Traditionally, consumers are categorized as being prone in one direction (Monroe 2003, 168-173). However, as will be discussed later in chapter 6.1.3 consumers can possess positive attitudes towards both low and high food prices at the same time.
The importance of food prices can also be evaluated by investigating the role of price in the food purchase situation. Based on the qualitative results, although food prices were important, and were looked at, in general prices had no primary effect on a food choice. In most of the purchase situations price seemed to have a secondary role in a food choice, as has been reported by early studies in several countries (e.g. Steptoe et al. 1995; Eertmans et al. 2006; Chen 2007; Pohjanheimo et al. 2010). The importance of low prices is usually investigated in its positive role, when they lead to a willingness to buy the product. As has been reported in previous studies (e.g., Fouilhé 1969; Lambert 1972; Woodside 1974; Rao and Monroe 1988; Chocarro et al. 2009), familiarity probably affects the role of price in a food choice. Subjects in this study assumed that in selecting an unfamiliar product in the

195
store, price was used as a cue. The product was chosen from the middle of the price range in order to minimize a “bad” choice. The consumers’ willingness to avoid bad choices has been widely discussed in prospect theory which claims that people are more willing to avoid losses than acquire gains (lossaversion e.g., Thaler 1985; Tversky and Kahneman 1986; Salminen and Wallenius 1993), and this loss aversion might be related to quality uncertainty (Tellis and Gaeth 1990; Urbany and Bearden 1997). When choosing an unfamiliar product in the middle of the price range, subjects probably optimized the most favourable prospect: the lowest possible price might mean inadequate quality and the highest possible price might mean overcharging. In both cases, there is a possibility that the experienced quality of the product is worse than expected, and therefore these can be regarded as losses. According to Schiffestein et al. (1999) losses in foods are generated if the expected quality is unverified by the experienced quality of the food product. Therefore, the price may have a primary role in the food purchase situation if a price is the only meaningful quality cue available. Available means that other information related to products may pass unnoticed if consumers are not motivated to search for such information or are perhaps feeling time constraints (Monroe 2003, 174-175). However, subjects in the qualitative study reported that they seldom experience such situations where no previous information is available and they would only use price information. Food was mainly bought based on past experiences and habits (as reported by Honkanen et al. 2005; Hamlin 2010). Cognitive reasoning was needed if an unfamiliar product was to be chosen, as has been reported by Oulette and Wood (1998).
In this study, it is suggested that even with familiar food products price can play a primary role in preventing a purchase, and this can be explained by mental accounting or perceived fairness of prices. This study showed a great deal of evidence in the qualitative data to suggest that consumers keep a track of their expenses by means of mental accounting (described by Thaler 1985; 1999; also Tversky and Kahneman 1986). Subjects in this study had mental limits to shopping baskets, to monthly food expenses, or when food budgets were compared with income level. The price of an individual food item is a small sacrifice and was perceived relatively insignificant if valued in isolation, but that small price could be too expensive if the shopping basket was above the limit. According to Thaler (1999, 194) small monetary sacrifices can be ignored, but evaluations are different in isolated as opposed to aggregated situations (Langer and Weber 2001), and consumers keep track of multiple costs including budget constraints (Thaler 1985). Therefore, if the importance of the price is evaluated in isolation without a connection to a food budget or the purchase intentions, the results can vary a great deal.
The difference between isolated and multiple evaluations in willingness to pay estimations was confirmed by the quantitative data. When subjects (in 2004b survey, N=1027) were asked how much they were willing to pay for a new snack product (unfamiliar to all the respondents), the subjects gave 22% higher estimations when trying the product rather
196
than to buying it regularly. These estimations were unconnected to the monetary situation because neither the income level nor the stated opinions of available assets for daily use had a significant effect on price evaluations. Respondents were probably evaluating an isolated impact when stating the price for buying a product once. The regular use of a product will possibly increase the food expenses and the impact on food costs would be stronger. This result suggests that at some level subjects might keep a mental account of total costs. Moreover, this might explain the early findings related to functional food products. The one of the major reasons for unwillingness to accept these products in daily use was related to the increasing impact on food expenses (Ollila et al. 2004) or a need to keep the finances in balance (Urala and Lähteenmäki 2003).
The role of price can be related to the importance of a particular food product in relation to other food products accepted for household use (Webber et al. 2010). In this study, the prices of the chosen products affected the choice of other products in other categories. According to qualitative results, food products were divided into two categories: 1) primary basic products (e.g. bread, spreads, cheese or cold cuts, tomatoes) consumed every day, and 2) secondary additional food products consumed occasionally (e.g. chicken, pork cuts, potato crisps, muffins) (as also reported by Webber et al. 2010). Basic food products were chosen based on habits without much information search for other alternatives, as reported by Hamlin (2010, 94-95), who describes the food shopping based on the cue-based decision making model. However, according to the subjects of this study, additional food products were chosen more consciously even when familiar products were concerned, but the choice was between product categories not between brands. Some of the subjects said that additional food products were bought if the shopping basket was not above the limit. The costs of shopping baskets were controlled, and the products already selected had an impact on how many additional products were chosen. The costs of the shopping basket were mentally tracked, though this was more an intuition-based feeling than an exact sum of money.
With habitual purchases, subjects said that even if the prices were looked at they had no effect on the choice. This is probably due to acceptance of those prices and it is in accordance with Helson’s (1964, 33) adaptation-level theory and assimilation (Sherif 1963). Consumers probably have a neutral zone between the experienced expensiveness and cheapness, and when a new price stimulus is close to past experiences the differences are minimized (a new price is assimilated into the latitude of acceptance), whereas large price differences are exaggerated (a new price is contrasted and rejected). Therefore, a high price or a large price difference in the light of past experience can prevent the purchase, as reported in the qualitative data. As discussed by Sherif (1963, 155-156), a person may buy a high-priced product once even if the price would normally be rejected if he or she is exposed to even higher prices (an external reference price effect, as reported by Weber et al. 2007; Grunert et al. 2009), but the previous latitude of acceptance will most likely return to the normal position

197
after a person has left that situation. Possibly there are different latitudes of acceptance at the different budget levels (the product level, the food basket level, the food expenses level). Otherwise it would be difficult to understand why a person decides to put back a selected food product (e.g. grapes) when it is considered too expensive on some occasions (above the limit of the food basket budget) even though it is accepted on other occasions. This kind of behaviour can be explained by the mental account approach based on prospect theory. A low price can prevent the purchase if it is not accepted by food costs control at some level. It is agreed that most basic food products are chosen without recognition of price, and small changes in prices are assimilated within the latitude of acceptance. However, it is suggested that a price stimulus can be evaluated in an aggregated context and it may be affected by cost control at some level, particularly in the case of additional food products.
Expensiveness and cheapness in foods
Based on the results of this study, any generalizations about how Finnish consumers perceive food prices should be made with great caution. The expensiveness and cheapness of foods were discussed at the product level and at the general level, and these perceptions were the most relative by nature. According to Jacoby and Olson (1977) consumers evaluate observed prices subjectively, and prices are interpreted as cheap, expensive or consumers can be neutral towards them, in accordance with Helson’s (1964) adaptation-level theory. Subjects in this study, considered food prices expensive if one was thinking of some special food products (e.g., healthy or naturally produced food), convenience food, frequently used food products or if the quantity one gets was compared with the price in some food category (e.g., cheese or meat). However, only a few of the subjects claimed food was expensive in Finland, it was more a matter of the choices to be made. Behind these claims of expensiveness were comparisons made with other countries, different seasons or the global supply situation. Food was considered expensive at the general level if one was thinking of food as the greatest expense of the household. However, the same subjects were able to define food as moderate or cheap if one was thinking of basic ingredients, home-made meals, and rationality in shopping and avoiding food waste. One could save on food expenses if one paid more attention to food shopping. In addition, subjects made trade-offs with a price and ease-of-shopping. Similarly, at the general level, food in Finland was considered cheap if one was thinking of domestic employment, willingness to support Finnish agriculture, ethical concerns, or willingness to eat locally produced food. As will be discussed later in chapter 6.1.3, based on the Food Price Attitude Scale Finnish consumers (2002, N=1156; 2004a, N=1113; 2004b, n=822) were quite neutral towards food prices. The mean value of attitudes towards low food prices was 4.67, and the mean value of attitudes towards high food prices were 3.71 (food quality) and 3.87 (food prestige). However, standard deviations suggested large individual differences among Finnish consumers.

198
Based on the qualitative results, expensiveness and cheapness were not just the evaluations of the observed price against the reference price, instead these judgements were related to the evaluations of the attractiveness of the product and the personal need for the product (cf. Ölander 1969). In the case of functional food products, some of the subjects wanted to emphasize that expensiveness does not mean that they could not afford to buy it, rather that they had no need for the product (the attractiveness of the product) nor they were willing to sacrifice money on that product (the attractiveness of the deal). Therefore, the kind of motivations that lie behind these perceptions should be further investigated as suggested by psychologists (Tresselt and Volkmann 1942; Maio et al. 2004; Ajzen 2005; Olson and Fazio 2009). The perceptions of cheapness and expensiveness were different when a different reference base was used. If the price of the functional food product was compared with a health claim without a personal health problem the price was perceived as tooexpensive, but if the same person compared the price with medicines it was only perceived as expensive. With a different reference base probably a different value scale was applied in order to evaluate the price, and according to the principals of judgement scales can shift along with the stimuli (Tresselt and Volkmann 1942; Sherif 1963). A large variation of references was expressed in the case of functional food products. The prices of the functional food products could be compared with other alternatives for similar function, price versus content, benefits of the product, or price fairness.
Price fairness
When food price prevents a purchase it is possible that feelings of unfairness are involved. Based on the qualitative data, price differences between stores generated the feelings of unfairness and in such cases a subject might refuse to buy a product. This would be more a matter of principal than of monetary value. Feelings of fairness or unfairness can affect consumers’ price perceptions and further buying behaviour (Kahneman et al.1986). Price fairness not only concerns low prices, but involves expected ethical ways of behaving in a purchase situation (Maxwell 2002; Diller 2008; Maxwell 2008). Feelings of fairness are connected to social consciousness, and evaluations of fairness can be made in a larger context which includes other consumers, for example, if a price is unfair to someone else (Maxwell 2008; Xia and Monroe 2010). In this study, expensiveness was unfavourably interpreted if it was related to feelings of unfairness: “ahighpricefeelslikecheating”(M1). This quotation was related to prices of functional food products. The fairness of a high price in functional food products evoked moral discussion about making money from people’s distress; for example, functional food products were targeted at senior citizens, who were generally less well off. Cheapness was also considered unfair if it was related to the exploitation of natural resources, labour or the mass production of food, and ethical concerns were embedded in these interpretations. This is supported by Baker et al. (2008), who report that explanations relating to the willingness to pay expressed fairness assumptions, as well as trust and moral

199
concerns. According to Lowe and Alpert (2007), the fairness of a price was a better predictor of the purchase of new innovative products than the expected price. This may be related to the uncertainty of the quality and the price worthiness of the unique product value. In the case of unfamiliar products and new innovations, such as functional food products, past experiences are perhaps unavailable or reference scales are hard to find. If there are insufficient cues for making quality judgements based on reasoning, affective evaluations may occur (Kahneman 2003), and feelings of price fairness can serve that function (Kahneman et al.1986; Maxwell 2002; 2008).
6.1.2 Quality perceptions and price
Taste and hedonic preferences are probably the most important quality features in foods. The extent to which some food products are accepted into habitual use, is probably based on positive experiences of taste, a price and other product attributes over a long period of time. In this study, consumers’ willingness to value or their ability to experience quality differences varied individually, and how willing they were to pay for perceived quality differences was different among the subjects. According to the survey results (2002, N=1156), consumers were willing to pay a higher price for the better ingredients (with a 7 point Likert-type scale the mean value of 4.72) and better taste (a mean value of 4.66), if they had to choose between two differently priced products, but this was not the case for modern technology (a mean value of 2.66) nor if the product was described as just “special” (a mean value of 2.75). Clustering the subjects into three different groups established that there were subjects (n = 326) who were willing to pay a higher price for all the quality features (a mean scores ranging from 4.26 to 5.55) and subjects (n = 310) who were unwilling to pay for any of the features (a mean scores ranging from 2.00 to 3.10). There were also subjects (n = 490) who were willing to pay a higher price for taste (mean 5.41), better ingredients (mean 5.20), familiarity (mean 4.42) and health effect (mean 4.15), but not for naturalness (mean 3.84), modern technology (mean 1.97) and speciality (mean 2.10).
According to previous studies (e.g. Leavitt 1969; Lambert 1972; Riez 1979; Zeithaml 1988), consumers expect to perceive more quality differences in some product categories than in others. Based on the qualitative results, the subjects made a difference between food and durables as one of the subjects reported: “Youbuy foodwith a different attitude” (F11), meaning that with durables subjects found it only natural to compare prices and other quality attributes but not with food. Subjects in this study supported the statement that with durables one has to pay more to get better quality and that they were willing to search the price information in order to optimize the value of the deal. However, with food this was seldom the case. Subjects in the qualitative study claimed that with clothes, cars, shoes or other durables they were eager to save money in order to get good quality at the lowest
200
price and they actively sought price information by visiting several outlets or gathering information from the internet. However, the premium-priced brand of durables was not always agreed to have the highest quality only the image. The frequency of purchase of durables was low, and therefore the choice was perhaps made more consciously (as has been reported by Lichtenstein and Burton 1989). Also, with larger investments one was able to save greater sums of money with bargains than with small purchases. In foods, subjects were eager to select the brand with the lowest price if differences in taste were not experienced, and products were perceived as substitutes as reported by Nagle and Holden (1997, price sensitivity 77-94). Also, Riez (1979) reported nearly zero or negative correlations between a price and quality in some of the food categories.
Assumptions that consumers are less willing to pay more for better quality in foods than in other commodities, was confirmed by quantitative analysis. In the first survey (2001, N=1158), there were statistically significant differences (p<0.001) in strength how subjects scored the scales relating to willingness to pay more for better quality at the general level and with foods Those who scored high (a mean of 5.23) with these questions at the general level had lower scores (a mean of 4.15) in relation to foods. Similarly, those who scored low (a mean of 3.22) in these questions at the general level had higher scores (a mean of 3.41) in relation to foods. This means that subjects had significantly weaker attitudinal opinions if the scale was related to foods than if the statements were asked at the general level. Food choices are probably habitual and unconsciously made. Moreover, in the research situation, if opinion statements are asked for at the general level, subjects will possibly answer based on more consciously made prior choices, and results can perhaps create a bias if implemented into the food context.
In this thesis, it is suggested that with foods consumers perceive quality at two levels: 1) the basic quality relating to food safety, 2) the specific quality relating to some value adding features. Food in Finland is basically trusted, and all the food available in the Finnish food markets was considered safe (or at least edible if not liked) if the best-before had not expired. Subjects in the qualitative study trusted the Finnish food authorities and they reported that food chains in Finland were closely supervised. Similar results among Finnish consumers have been found by Latvala (2009). The high trust to food authorities is probably based on the consumers’ awareness that no major food crises have occurred in Finland to date. Basic ingredients and basic foods were expected to be cheap or at least available at a reasonable price, whereas a high price was perceived as a signal of high quality if related to special quality features. Some subjects believed that a high price indicates high quality if the quality was related to taste, ethical issues, healthiness or the nutritional content of the product. Professionals in the field of food services were connected higher price to the higher nutritional value of the product, but they assumed that in order to make comparisons of this kind one must have expertise or an interest in nutrition. Some of the subjects were

201
willing to pay a higher price in cucumbers during the winter because of the better taste, but not all of the subjects were willing to pay more for better taste as was confirmed by the quantitative results discussed previously. These findings support the results of the earlier studies according to which the valuation of quality features can be product specific and individually made (Zeithaml 1988; Steenkamp and van Trijp 1989).
According to some previous studies, quality is not inferred similarly with low and high price causing asymmetry in quality inferences (Emery 1969; Huber and McCann 1982). Moreover, the relationship between price and quality has been found to be nonlinear (e.g., Adam 1969; Gabor and Granger 1969b; Ding 2010). However, previous experiments have emphasized that low quality is inferred from a low price, but high quality is not similarly inferred from a high price (Huber and McCann 1982). According to Monroe (2003, 172-173), consumers weight quality more than price with the low-priced products. In this study, low food quality was not inferred from low food prices even though some inference of high quality was made from high prices. This is understandable if food quality is inferred differently from a price at the basic level than at the specific level. At the basic level, quality in foods was trusted and accepted even at extremely low prices. If the specific quality feature (e.g., high nutritional value, organic food production, free from lactose, high degree of liking, country of origin) is perceived and valued, higher quality can be inferred from the higher price, and a price can be used as a quality cue, as reported in this study and in some previous studies (e.g., Emery 1969; Zeithaml 1988; Steenkamp and van Trijp 1989). Additionally, asymmetry in quality inferences can be related to the risk of making a bad choice. With unfamiliar food products, subjects assumed that they would probably avoid the lowest and the highest price and select a product from the middle price range in order to minimize the possible loss (for lossaversion see Thaler 1985; Tversky and Kahneman 1986; Salminen and Wallenius 1993). A price would be used as a cue, when quality is uncertain (as discussed by Urbany and Bearden 1997). The possible feelings of loss (experienced quality is worse than expected, Schifferstein et al. 1999) were diminished if the price was low. A low price would not create the strong feelings of disappointment because expectations are low and a sacrifice is small in monetary terms. Hedonic preferences, such as liking, are important quality features. However, with extremely low prices, the lack of high liking might be accepted in a random purchase even if the product fails to be accepted in regular use. Additionally, strong feelings of price unfairness can emerge if expectations are high, for example, a high price of an ice cream created great disappointment in terms of liking because expectations were high.
6.1.3 Food Price Attitudes
It has been argued previously that the food price attitude is something more than just the importance of the food price, and discrepancies in the valuation of food quality will possibly

202
create attitudinal perceptions of different kinds towards food prices. A clear definition of food price attitudes is difficult to find, but based on the previous literature, the food price attitude was defined in this thesis as a person’s evaluations of cheapness and expensiveness of food prices with some degree of favour or disfavour (this is similar to the definition of an attitude according to Eagly and Chaiken 1993, 1) including at least two dimensions: price sensitivity and quality consciousness. According to Jacoby and Olson (1977, 74), if a subjective interpretation of an observed price includes an evaluative or affective aspect, it can be described as a price attitude, and several affective favourable and unfavourable aspects were recognized in the qualitative data.
On the one hand, expensiveness was favourably interpreted if it was related to the quality features such as taste, nutritional value, or ethical issues, as has been previously discussed. Behind these favourable interpretations were behavioural beliefs that a higher price was related to higher quality features, and it would be worth paying a high price if the quality feature was perceived and valued. Favourable attitudes towards expensiveness needed to be justified. For example, a higher price for functional food products would be accepted if the high price was compared with medicines. On the other hand, expensiveness would be unfavourably interpreted if it was related to affective feelings of price unfairness. Expensiveness would also be unfavourably experienced if a health effect was not needed or the health effect was not perceived. Similarly, cheapness in foods would be unfavourably interpreted if it was related to the exploitation of natural resources or labour, the mass production of food, or cruelty to animals, and in such situations the cheap prices were perceived as unfair. However, the cheapness in foods was favourably evaluated in most cases, especially if related to the quality of basic foods.
Evaluating something as fair requires justifications, and with price, justifications will probably be made by using reasons. Reasoning requires cognitive thinking and emotions might well be ignored. Thus, in the research situation when subjects are forced to provide reasons, the rational justifications are expressed rather than the feelings which evaluations may generate. According to Haddock and Huskinson (2004, 37), affections may be related to the formation of positive attitudes, and cognitions are possibly related to the formation of negative attitudes. However, there is no exact theory to confirm this, and some attitudes are perhaps more related to affections than others are related to prior beliefs (Maio et al. 2004). Feelings of fairness enhance happiness and create favourable perceptions, whereas perceived unfairness activates an automatic emotional response which bypasses the cognitions (Weber et al. 2007; Maxwell 2008). In this study, price unfairness was related to negative feelings towards cheapness and expensiveness, whereas positive evaluations were more cognitively reasoned and feelings were not expressed. Perhaps perceived unfairness was based on feelings of fear or shame about being cheated (making a bad choice, a high price harmful to oneself), or a price was considered unfair because it was harmful to someone else, thus creating the

203
feelings of dislike or sadness. Favourable evaluations of cheapness and expensiveness were not explained by feelings of fairness even if these kinds of feelings were perhaps embedded in value evaluations. One function of an attitude is to guide people to avoid harmful things, and food price unfairness also serves that function. The food price fairness or unfairness is affective and perhaps the core component of food price attitudes.
Feelings are affective components of attitudes and the intensity of these feelings has an important impact on the strength of attitudes (Kantz 1960). One of the reasons why positive feelings about a fair price did not emerge from the data may also be explained by the adaptation level theory (Helson 1964) and by cognitive dissonance (Festinger 1975). If subjects perceived low or high food prices favourably, these prices would be within their acceptable price range (the latitude of acceptance). If the price was perceived as acceptable, it would be in accordance with prior beliefs. People want to hold on to prior beliefs, but if new information contradicts the existing knowledge, a person will react. A discrepancy between the prior knowledge and new information will cause dissonance and produce a negative feeling. Therefore, if price becomes “too cheap” or “too expensive”, these prices are not tolerated and the negative feelings of dissonance will appear.
The dimensions of the food price attitudes
After exploring with the qualitative approach whether the attitudes towards food prices existed and what aspects are relevant in this context, one further aim of this thesis was to develop the measurement in order to capture food price attitudes reliably. However, as Jacoby and Olson (1977, 84) stated, fundamental research on price attitudes was lacking. Later several research reports were published including attitudinal dimensions relating to high and low prices (e.g., Erickson and Johansson 1985; Steenkamp and van Trijp 1985; Anttila 1990; Lichtenstein et al. 1993). Based on the results of qualitative data, negative and positive attitudes towards low and high food prices were expressed giving external and internal reasons (or behavioural beliefs as described by Ajzen 2005). Subjects’ willingness to favour or disfavour the subjectively perceived price was related to, for example, the supply situation, income level, or time constraints, and thus due to external reasons a price was unacceptable (e.g., a basic vegetable was expensive due to aglobalshortage,or cheap food isasignofexploitation) or acceptable (e.g., no time for meal preparation and willingness to use ready-made meals). Time constraints, another external reason, had as a counterpart internal reasons relating to convenience (ease of preparing). Subjects expressed attitudes towards prices in terms of internal reasons, for example, how they perceived and valued quality features, ethical issues, treating guests to high-priced food, or price sensitivity. In this study, only the internal issues were developed into indicators of food price attitude measurements. The Price Perception Scale (Lichtenstein et al. 1993) was used as a foundation because it had a multidimensional structure (e.g., the valuation of quality issues, price sensitivity, value

204
for money), but in this study, statements were modified to concern food only. Statements measured several behavioural intentions relating to prior behavioural beliefs (based on the theory of planned behaviour by Ajzen 2005).
The multidimensionality of the food price attitude structure was defined by exploratory factor analyses which were confirmed using further statistical analyses. Based on the results of this study, the concept of food price attitudes included three dimensions. One dimension was related to favourable attitudes towards low food prices, and the two other dimensions were related to favourable attitudes towards high food prices. One of the positive attitudes towards high food prices was related to quality, and another dimension was related to offering the premium-priced food to others.
Development of the measurements was carried out in several phases and with different data samples. Based on the exploratory factor analysis all eight statements relating to favourable attitudes towards low food prices were loaded onto one factor forming one latent variable LowFoodPrice, as reported by Sternquist et al. (2004; ref. Meng and Nasco 2009, 508), instead of three as was suggested by Lichtenstein et al. (1993; supported by Meng and Nasco 2009). The statements reflected respondents’ willingness to seek out low food prices and to buy low-priced food from different stores, to buy food when on offer, to compare food price information between brands, and willingness to search for price information in order to get one’s money’s worth. Cronbach’s alpha value of .835 (in the 2002 data) of this LowFoodPrice factor suggested good reliability. Correlational relationships were confirmed by the measurement modelling of the confirmatory factor analysis. Thus the low squared multiple correlations indicated that some of the opinion statements were only moderate measures of this latent variable. However, similar path estimates has been reported by Meng and Nasco (2009, 513) among American, Chinese and Japanese consumers, and Moore et al. (2003, 277) among Polish and American consumers. The value of composite reliability related to this factor was good (0.822), but the value of average variance extracted (0.403) was below the adequate level of 0.50 (Diamantopoulos and Siguaw 2008, 91). This means that this latent construct is not one-dimensional, even though significant correlations between statements exist. Grunert et al. (2009) found with the modified price involvement scale (also based on the PPS by Lichtenstein et al. 1993) that deal proneness, value consciousness and price mavenism were separate dimensions which all related to attitudinal perceptions towards low food prices. Moore et al. (2003) reported that price consciousness, sale proneness and price mavenism were separate factors among Polish and American consumers.
The two dimensions of favourable attitudes towards high food prices were related to the valuation of quality issues (the FoodQuality measured with five statements, Cronbach’s alpha value of .703) and the importance of offering premium-priced food to others (the FoodPrestige measured with two statements, Cronbach’s alpha value .665). The values of composite reliability relating to the FoodQuality factor (0.708) and to the FoodPrestige

205
factor (0.735) were adequate (Diamantopoulos and Siguaw 2008, 90). The values of average variance extracted were acceptable in the FoodPrestige factor (0.664 in the final model) and moderate in the FoodQuality factor (0.507 in the final model).
These three dimensions were confirmed with confirmatory factor analysis (2004b, n = 399) and the final model was tested using the structural equation modelling method (2004b, n = 400). The results of the measurement modelling and an inspection of modification indices suggested that the model might be improved by excluding some of the variables from the measurements. In the final model, seven statements of the Low Food Price dimension, two statements of the FoodQuality dimension and two statements of the FoodPrestige dimension were confirmed.
Besides the correlations between three attitudinal dimensions, a causal structure was identified. According to structural equation modelling (2004b, n = 400) the FoodQuality dimension explained 13% of the variance of the LowFoodPrice dimension. This may mean that if a person believes that a high price is related to high quality and he or she is willing to pay a high price, then, he or she is probably not willing to look for low prices or seek out for food offers. No reciprocal linkage was found. Alternatively, this can possibly be explained by the situational effect. In the situation of money pressures, a person may be forced to look for low food prices, even if he or she values high food prices and have quality beliefs related to them. Thus, behaviour of this kind does not reflect a particular attitude but instead it might reflect tight money control. According to the qualitative results, young subjects, who are generally well off, were the most willing to buy naturally produced food products, and they valued ethical issues in food production. Whenever possible they bought these higher-high priced food products, but if they had little money, they bought food at lower price. In situations of this kind respondents are willing to buy low priced food, even though they might have a positive attitude towards high food prices. Some of the subjects confirmed that they had changed their food-buying behaviour when they had a better monetary situation, and then they were unwilling to look for the lowest food prices as they had done before. However, not all subjects were willing to change their behaviour, even though they had more money to use on food than before. Therefore, it might be difficult to distinguish whether behavioural intentions relating to low food prices reflect attitudes or whether they reflect control.
The FoodQuality dimension explained 29% of the variance of the FoodPrestige dimension suggesting that consumers’ willingness to offer premium-priced food to others is partly based on quality beliefs. High-priced food is worth offering because high priced food is high in quality. In the original price perception scale (Lichtenstein et al. 1993), the prestige domain was related to perceived high social status (cf. symbolic meaning of goods reported by Elliot 1998; Johansson-Stenmann and Martinsson 2006 in the case of cars). In food context, this was difficult to operationalize and measure. According to the interviews, subjects did not

206
pay much attention to price in food purchasing situations, as food shopping was considered a routine. Overall, food products were not flaunted or even discussed with friends. Buying and consuming food products were private issues. However, the data showed that some of the subjects liked to entertain dinner guests with premium food products and this can be interpreted as a willingness to show higher social status with high-priced food ingredients. Alternatively, consumers’ willingness to pay a high price for foods offered to others can be related to the cultural norms of hospitality. Respondents (2002, n= 744) living in the country and small towns (less than 40,000 citizens) were less willing to offer premium-priced food to their guests, and subjects in the Helsinki metropolitan area (n=205) were the most generous in offering high-priced food. A great effort was made during the survey studies to operationalize this dimension further. Unfortunately, the variables developed to measure other forms of possible prestige sensitivity in foods were not confirmed.
The total mean values of the Food Price Attitude Scale in three consumer samples (2002, N=1156; 2004a, N=1113; 2004b, n = 822) suggested that Finnish consumers had stronger positive attitudes towards low food prices than high food prices. However, the mean values of the food price attitude dimensions showed that opinions were quite neutral in all three consumer samples: the mean values of the LowFoodPrice dimension ranged from 4.63 to 4.70; the mean values of the FoodQuality dimension ranged from 3.48 to 3.87; the mean values of the FoodPrestige dimension ranged from 3.74 to 3.96. However, standard deviations revealed that there were differences among the respondents. Some of the socio-demographical variables significantly explained the variance (2002, N=1156, from 0.08% to 6.2%) of the food price attitude dimensions. Older consumers had a more positive attitude towards low food prices than younger consumers, and men had stronger positive attitudes towards low food prices than women. Older consumers may have learned to prefer low food prices. They have lived through times when money has been scarce and food products have not been as available as they are today. Younger consumers were not especially interested in seeking out price information and making price comparisons. This may be due to time constraints and inconvenience or perhaps unfamiliarity with food prices. Additionally, younger people may have a different kind of attitude towards money and spending than older people. Older consumers had more positive attitudes towards high food prices if the quality issues were concern than younger consumers, men being more positive than women. In addition, older consumers were not convinced that high-priced food needs to be offered to guests and women expressed more positive attitudes in this issue than men. Willingness to offer high-priced food to others was the strongest among 30-39-year-old consumers. Without conducting longitudinal studies it is impossible to say whether the food price attitude dimensions are dependent on age and change with age. Perhaps attitudinal perceptions towards food prices are part of the value system and one’s personality (as Kantz 1960 states), and thus they may reflect the values of a particular generation or the values of an individual.

207
The positive attitudes towards low food prices were strongest among those who had little money for daily use and the low income level, and, thus the attitudes towards low food prices may be the situational factor. Both positive attitude dimensions towards high food prices (the FoodQualityand the FoodPrestige) were the highest among subjects with the highest income level and with plenty of money for daily consumption. It seems that the willingness to pay high food prices is related to a high income. However, the subjects with the lowest income level were not the most negative towards high food prices even if they had the most positive attitudes towards low food prices. This may due to possibility that subjects within the lowest income level (of household) are younger students or adults living alone. This can also reflect the situation in which low-priced food was bought because this group of subjects had little money, even though some of them believed that a higher price would indicate higher quality food.
Differences in consumers’ food price attitudes
Based on the qualitative study, the subjects expressed both favourable and unfavourable attitudes towards high and low food prices. Therefore, it was assumed that consumers could be positive towards low and high prices at the same time. Willingness to buy food at a low price did not exclude positive attitudes towards high food prices. One of the goals in this study was to investigate whether differences that existed between consumers were based on the food price attitudes. A total of 3091 Finnish consumers in three different data samples were categorized into four similar subgroups based on the food price attitude dimensions using non-hierarchical cluster analysis. However, this did not imply that consumers could only be divided into four groups. Other cluster structures were explored, but the four-cluster solution was the most consistent in the three samples. Four groups were selected because then the multidimensionality of the food price attitudes became transparent, the clusters were clearly separate, and the groups were equal in size, as suggested by Hair et al. (2006, 594-595).
In all three data samples (2002, N=1156; 2004a, N=1113, 2004b, N=1027) four similar clusters were discovered. In the first segmented group, about 29% of the consumers had the most negative attitudes towards high food prices and they could be named as high price avoiders or low price seekers. They did not believe that a high price would be worth paying in order to get high quality and they were not interested in offering premium-priced food to others. They also had favourable attitudes towards low food prices. In the second group, 17% of the consumers had strong favourable attitudes towards low food prices, yet they had strong behavioural beliefs that high prices are related to high quality, and they could be characterized as value seekers. They wanted to get their money’s worth and looked out for low prices, but they were also willing to pay for quality. However, they were not interested in offering premium-priced food to guests. In the third group, 32% of the consumers had

208
favourable attitudes towards low food prices, but they did not believe that a high price signals high quality. However, they were eager to offer premium-priced food to guests and they could be described as careful with money but generous. In the fourth group, 22% of the consumers were the most positive towards high food prices believing that high quality is related to a high price and they were willing to pay for quality. They were labelled as quality seekers. Additionally, they believed that high-priced food was important if offered to others. They were not interested in seeking out low food prices, buying food on offer, or searching for price information in order to get the best value for money.
The formation of generalizable typologies for each of the groups based on socio-demographic variables was difficult. There were statistically significant differences between the groups in all samples by age, education, profession, income level, and assets for daily use. Gender and place of living were only statistically significant in the consumer sample collected in 2002. Even though groups were similar based on the food price attitude dimensions in three consumer samples, there were differences based on socio-demographic variables. For example, in the 2002 sample, the mean age was lowest in the fourth group (the most positive towards high food prices), but, in the samples of 2004a and 2004b, the lowest mean age was in the third group (the positive attitudes towards low food prices and high food prices if related to offering premium priced food to guests). It is possible that attitudes changed over the two years explaining the differences between the samples collected in 2002 and in 2004. The mean values of the total samples suggested that consumers’ were more positive towards high food prices in 2004 than in 2002. However, how food price attitudes change over time cannot be confirmed without longitudinal studies. It is assumed here, that the Food Price Attitude Scale creates groups based on attitudinal characteristics which vary in different samples because they contain different people. One of the demands for the discriminative validity of the measurement scale is that no other variables or scales can explain or produce the similar structure (Hair et al. 2006, 139).
6.1.4 The impact of food price attitudes on behaviour
Investigating attitudinal perceptions towards food prices would be of little value if the food price attitudes had an insignificant impact on behaviour. The theoretical framework to explain attitudes which affect behaviour was based on Fisbein’s and Ajzen’s (1975) theory of reasoned action (TRA) and the theory of planned behaviour (TPB) (Ajzen 2005). Even if these theoretical approaches have been criticized in the food context for lacking credibility in explaining habitual and unconscious purchase behaviour (e.g., Hamlin 2010), the empirical findings of the qualitative data supported the framework of the TPB.
According to TPB, behavioural intentions are affected by attitudes towards that behaviour, subjective norms, and control. Behind attitudes, norms and control are subjective beliefs

209
which are related to them. (Ajzen 2005, 129.) In this study, all these elements were found. It has been discussed previously how subjects kept the control of food budgets by the manners of mental accounting, and how attitudes towards food (food involvement) were affecting the willingness to buy high-priced food. In the discussions in chapter 3.4, it was deliberated in more detail whether entertaining dinner guests with premium-priced food, or buying premium-priced organic food would be guided by subjective norms or whether subjective norms even existed in foods. According to TPB (Ajzen 2005), a subjective norm means that some other people relevant to the subject or the culturally bounded social agreements affect a person’s behaviour by setting some behavioural standards or norms how to behave. According to the qualitative results, no evidence was found that subjects were willing either to buy low-priced food products or to prefer high prices because someone else wanted them to do that, nor did they felt any pressures from society. Nevertheless, this does not eliminate the possibility that the effect of a subjective norm related to food purchase exists. Previous studies have shown that attitudes might reflect the subjective norm which is embedded in it (Hansen et al. 2004), for example, the subjective norm influenced the intentions to buy organic food products through attitudes and not directly as the TPB theory assumes (Tarkiainen and Sundqvist 1995).
The willingness to buy high-priced food products
In this study, it was hypothesized that if subjects had positive attitudes towards high food prices they were more eager to buy high-priced food products, and this hypothesis was supported. Similarly, it was confirmed that the scale developed in this study seems to have an adequate predicting power. In the 2002 survey, consumers were asked whether they would be willing to buy a product at a higher price if it had certain benefits. Several benefits were presented rather than simply “general quality” because, based on the results of the qualitative study, subjects valued differently different kinds of quality features. The respondents (2002, N=1156) were divided into two groups based on their willingness to buy a higher-priced food product. In one group, subjects (n = 326) were willing to buy premium priced food products with benefits, and in the other group, subjects (n = 310) were unwilling to buy premium priced food products despite all extra benefits. Results of logistic regression analysis revealed that the FoodQuality factor alone explained 25% of the variance whether respondents were willing to buy a higher priced food product with some extra benefit or not. The model with three factors explained 29% of the variance. Based on the FoodQuality dimension alone 67% of the subjects willing to buy and 71% of the subjects unwilling to buy a higher-priced food product were correctly classified. Three dimensions improved the predicting power a little. Based on these results it seems that behavioural beliefs related to quality issues are the most powerful predictors in consumers’ willingness to buy high-priced food products. Similar results have been reported by Steenkamp and van Trijp (1985). However, the research design in this situation emphasized the special quality features, and
210
thereby justifications for higher prices were perhaps sought from behavioural beliefs related to quality issues. The LowFoodPrice factor improved the model by only 1% but it had a statistically significant (p=0.01) effect on willingness to buy higher-priced products.
Food price attitudes affect price estimations
In research situations, consumers are often asked at what price they would be willing to buy the product presented in the study. Based on the previous results, consumers remember poorly past experienced prices, and thus it can be difficult for them to give reliable price estimates (Dickson and Sawyer 1990; Monroe and Lee 1999; Rosa-Diaz 2004). In this thesis, it was hypothesized that attitudinal perceptions towards food prices may have an impact on price estimations especially in the food context. Food purchase is done perhaps mostly based on habitual tendencies (e.g., Honkanen et al. 2005; Hamlin 2010). According to Kahneman (2003), the ease in which ideas and thoughts come to mind are essential in directing the behaviour and, further, intuitive judgements are easy to retrieve from the memory. Therefore, it was assumed, in this study, that automatically activated attitudes may have an effect on behaviour like making price judgements. Results of this study were supporting the hypothesis according to which consumers’ attitudinal perceptions towards food prices affected their willingness to pay estimations.
Consumers were asked at what price they were willing to buy a new snack product presented in the questionnaire. They were asked to give price estimations in two situations, whether to buy the product once to try it, or at what price they were willing to buy the product regularly. As has been previously discussed the consumers gave a 22% higher price estimate when trying than when buying the product regularly. The difference might be due to budget control and respondents’ mental processes related to it. The regular purchase will possibly have a greater effect on the food budget, and therefore an acceptable price was set lower than the price of a random purchase. Alternatively, the lower estimations can be related to the willingness to use the product regularly. According to the qualitative results, price perceptions were related to the attractiveness of the product and the attractiveness of the deal. Because no-one can have past experiences of the new non-existent product, the information on quality in terms of liking was uncertain. Setting the lower price for regular purchase, the respondents were perhaps reducing the quality expectations and minimizing the possible feelings of loss (see loss aversion by Tversky and Kahneman 1986). As Ölander (1969) stated a price low enough can make possible low quality appealing.
An analysis of structural equations modelling it showed that positive attitudes towards low food prices explained 4.4% of the variance in willingness to pay estimations. However, direct causal relationships from the dimensions of positive attitudes towards high food prices (FoodQuality and FoodPrestige) to price estimations were insignificant. This means that consumers’ willingness to look for low food prices would have minor albeit significant impact

211
on price judgements. These relationships were further investigated by means of one-way-analysis of variance. Subjects giving the lowest price estimations had the highest mean value for the LowFoodPrice dimension, and subjects giving the highest price estimations scored the lowest mean value for the LowFoodPrice dimension. Differences were statistically significant, whereas differences for mean values of the FoodQuality and the FoodPrestige dimensions were statistically insignificant. According to Steenkamp and van Trijp (1985) quality consciousness affects price estimations, increasing them if quality was strongly appreciated, but this was unsupported by these results. However, the operationalization of quality consciousness and the product-specific context of their study can be the reason for dissimilarities. In the Food Price Attitude scale, the willingness to pay premium for high food quality was asked at the general level without a product-specific connection.
This study also investigated whether there were variables explaining the variance of price estimations other than the LowFoodPrice dimension. Age had the most powerful effect on price estimations, being able to explain 8% of the variance. Younger subjects gave higher estimations than older subjects, and it would be natural to conclude that younger subjects were willing to pay more for the food product or they valued the new snack product more than others. Alternatively, this may suggest that younger respondents have a different approach to money than the older generation. Older people may have experienced the depression of the 1990s or perhaps they remembered the post-war shortages. It is also possible that younger subjects are less knowledgeable about food prices than older respondents, or the way in which they keep track of food expenses is less accurate. However, it is impossible to say whether the willingness to pay estimations is age-dependent without longitudinal investigations.
Women gave higher price estimations than men, but gender explained only 1% of the variance. The place of living was statistically significant and subjects living in the metropolitan area gave higher price estimations than the subjects who lived in the country or small cities (less than 40,000 citizens). Profession and education had a statistically significant effect on price estimations. Subjects with only basic education gave the lowest price estimations. Among the subjects with different professions, students gave the highest price estimations.
In the survey study in 2002 (N=1156), the subjective opinion of assets available for daily consumption was able to explain significantly (p<0.001) from 4% to 6.2% of the variance related to food price attitudes and the income level explained significantly (p<0.001) from 3.3% to 4.8% of the variance. In some previous studies, an income effect on food buying intentions have also been found (e.g. Steptoe et al. 1995; Drewnowsky et al. 2004; Andrieu et al. 2006; Bowman 2006; Cassady et al. 2007). However, in 2004 (2004b n=853), neither the opinion of assets available to daily consumption nor the income level had a significant impact on willingness to pay estimations (assets: ptotry=0.100 and pregularly=0.216; income level: ptotry=0.703 and pregularly=0.485). This result suggests that when consumers state

212
the acceptable price in the research situation and in the product-specific context, they are probably doing so in isolation without connecting the possible purchase with the monetary situation. This is supported by the qualitative results. The price of the single food product if valued in isolation can be seen as unimportant because it is so small in monetary terms.
It seems that some of the background variables were able to explain a little of the variance of the price estimations: age (8%), profession (5%), education (3%), place of living (2%), and gender (1%). Age was correlating with education and profession and there were mutual correlations to the LowFoodPrice and other attitudinal dimensions. The LowFoodPrice dimension was able to explain 4.4% of the variance, and thus it might be an equally important background variable as some of the socio-demographics. Rosa-Diaz (2004) reported consumers’ tendency to underestimate the actual price and little of the variance was explained by the socio-demographic variables. The tendency to underestimate prices is possibly related to favourable attitudes towards low prices.
6.2 Conclusions and contributions
In this thesis, the role of price in foods and food purchase behaviour was illustrated from various perspectives. The rich qualitative data gave good insight into the phenomenon, even though the aspects identified inductively from the data were not always new findings. The subjects discussed similar ideas about food purchase and food prices as has been reported and discussed in previous studies (see Steenkamp 1977; Zeithaml 1988 for a review of quality perceptions; Monroe and Lee 1999 for a review of price perceptions; Webber et al. 2010 for a qualitative report of food shopping). The qualitative data documents how expensiveness or cheapness in foods can be experienced and the picture painted in this report is diverse and complex. Consumers probably experience moral judgements and social contexts quite strongly through price fairness evaluations, and thus traditional information processing models may fail to predict actual purchase behaviour as assumed by Holbrook and Hirschman (1982). Not all consumers are the likely or willing to buy only cheap food, neither are they all willing to pay more for better quality. Consumers’ perceptions about cheapness and expensiveness in foods vary and the multidimensionality of price perceptions was confirmed. Quality in foods is experienced differently at the basic level and at the special value adding level and quality inferences based on price is made differently within these levels. Also, quality is inferred from price differently with foods than with durables which should be taken into account in food related measurements.
Rational behaviour in food purchasing is something more than just looking for the lowest possible food prices. Food prices are important, but in isolated situations the price of a food product might feel insignificant because it is a small monetary sacrifice, but even a low price can be a barrier to a purchase in certain situations. Mental cost control might have an impact

213
on food purchase behaviour, and this has seldom been taken into account in price-related studies. Price judgements in isolated situations and in aggregated situations are different and the results gained from isolated research situations can give false signals of consumers’ willingness to pay judgements. Some of the subjects seemed to have better price knowledge and better memory of past experienced prices, while others might have poor knowledge of prices and the reference points they used to evaluate the object price were something other than price. This is in accordance with the earlier results of the limited price knowledge of the consumers (Gabor and Gadner 1969a; Dickson and Sawyer 1990; Rosa-Diaz 2004). The affective evaluations of expensiveness and cheapness supported the existence of food price attitudes, and the structure of the food price attitudes was outlined and quantitatively confirmed. It is important to take into account food price attitudes in price-related studies because food purchase is most likely based on habitual tendencies, and attitudes are more easily retrieved from the memory than, for example, past prices. This study confirmed that food price attitudes affect the behavioural intentions, and this is especially true in isolated research designs. This is important if small consumer samples are used, for example, for price-setting purposes. All these conclusions can offer some theoretical, methodological, and managerial contributions. However, potential theoretical assumptions should be further investigated, and these are presented in the section on future research.
6.2.1 Theoretical contributions
The main theoretical contributions are related to the heterogeneous role of price in foods, quality inferences from food prices, and to the consumers’ willingness to pay high food prices or accept premium-priced food products in regular use. The findings of this study give interesting viewpoints on theoretical frameworks related to the asymmetry of quality inferences, mental accounting, price fairness, and a reference price.
The results of this study confirmed the idea that consumers probably purchase food and perceive food prices differently than the prices of other commodities such as durables. Finnish consumers had positive attitudes towards high prices in relation to quality at the general level, but, they were less favourable towards high food prices in relation to food quality. Also, quality differences were perceived differently in different food products (as suggested by Zeithaml 1988). Furthermore, quality differences are valued individually according to differences in food involvement (supporting the reports of Zaichkowsky 1985). One explanation for the differences between foods and durables might be related to the idea that consumers perceive food quality at two different levels: the basic level quality including food safety and food as daily nourishment (low food involvement), and the higher quality level including some value adding features (high food involvement). At the basic level, food quality is certain and quality inferences are not made from price. At the basic quality level
214
without any risk relating to food safety, quality is not probably inferred from the price at all, as reported by Riez (1979), with zero or negative correlations between a price and quality in some of the food categories. At the higher level of quality, value evaluations demand price-quality comparisons. Asymmetry in quality inferences have been reported earlier (Emery 1969; Huber and McCann 1982) and it is assumed that low quality can be inferred from a low price, but, high quality is not inferred similarly from a high price. In this data, the premium priced brands (with a high price image) were regarded with reservations even if a high price in durables was generally accepted as a signal of high quality. Additionally, high quality can be inferred from a high price with some food products including value adding features (e.g., a high nutritional value, an ethical method of production, a health effect). However, this study did not support that low food quality is inferred from price at the basic quality level.
According to the prospect theory, a gain is a price below the reference point (cheap) and a loss is a price above the reference point (expensive) (e.g., Tversky and Kahneman 1986; Kalyanaram and Winer 1995). Perhaps, at the basic food quality level, all food prices above 0 € are gains, as has been discussed by Salminen and Wallenius (1993) in relation to the asymmetry of the value function in prospect theory. If the all prices above the zero are gains there is no risk of making a bad choice. An explanation for differences between durables and foods can also be related to the risk aversion of consumers (e.g., Thaler 1985; Tversky and Kahneman 1986; see Kalyanaram and Winer 1995 for several empirical findings concerning loss aversion with food brands). If the basic level of quality is certain and the monetary sacrifice is small in foods, the risk of a bad choice is minimized. With durables, the monetary sacrifice is large and durability is one of the attributes which is difficult to assess in advance, thus there is a multiple risk of making a bad choice. However, even with foods low quality can be inferred from a low price, and a low price in foods might not be accepted if the price is perceived as unfair (e.g., if a too low food price is seen as a sign of an exploration of natural resources). Thus, low-priced food can be a bad choice in terms of ethical norms.
The theoretical aspects of prospect theory seem to fit quite well with the empirical findings of this study. Loss aversion (consumers’ willingness to avoid losses more than get gains, e.g. Thaler 1985; Tversky and Kahneman 1986) can probably be related to the differences in price-quality comparisons between foods and durables, but it can also have an effect on the willingness to accept high prices in foods. If new food product innovations such as functional food products entered the food markets at a premium price, the consumers’ willingness to take the risk of a high-priced choice might be limited. The risk is probably perceived because the quality of the new product is unknown. Credence characteristics such as health effects cannot be experienced either advance or after consumption (Grunert 2002, 281), and therefore the quality of a premium-priced food is probably evaluated based on preferences and the trustworthiness of the claim. A high price increases the quality expectations, but

215
also the risk of loss. According to prospect theory, avoiding losses are more appealing than possible gains, and consumers’ willingness to take risks, even small ones, are rare (Thaler 1985). If expectations are not met (e.g., health effects cannot be easily perceived), the strong feelings of disappointment might occur if the price is high. Feelings of unfairness can affect future decisions and future purchase (Maxwell 2008).
Traditionally, attitudes towards actual prices have been regarded as the upper or lower limits at which a consumer will not accept a price and refuses to buy a product (e.g., Adam 1969; Fouilhé 1969; Gabor and Granger 1969b: Stoetzel 1969; Monroe 2003). This was confirmed in this study. However, this study also suggests that attitudes towards cheapness and expensiveness can be found within the latitude of acceptance. Feelings of unfairness or unacceptability about prices were embedded in evaluations “too expensive” and “too cheap”. Based on the qualitative results, these feelings of unfairness were identified in both evaluations. Price fairness is probably the core element of food price attitudes, being formed by previous experiences and behavioural beliefs. If the communicative message fails to convince the buyer to accept the perceived expensive (or cheap) price, the feelings of unfairness will probably prevent the purchase. The rules of fairness in foods might be related to various aspects including animal welfare, domestic food production, trustworthiness of the health claim, or high degree of liking. Based on the qualitative results, social consciousness, as suggested by Maxwell (2002; 2008; also Xia and Monroe 2010), was confirmed in the food context. Price fairness addressed moral issues and the ethical concerns. Power asymmetry in the food markets makes consumers weaker players without the possibility of influencing the food prices. The moral rule of fairness includes the idea that a more powerful player does not take advantage of others (Diller 2008). Therefore, negative feelings of unfairness will be easily aroused if violations of the rules are observed, as was reported with functional food products in the qualitative results. Feelings of unfairness are said to be automatic emotional responses which are bypassing the cognitive reasoning (Maxwell 2008; Weber et al. 2007). Thus an impact of the negative feelings on the willingness to buy premium-priced food products brought onto the markets can be extremely adverse.
The reference price construct is strongly supported by marketing literature and it has been accepted that prior prices form the basis of a reference price or latitude of acceptance around the reference price (Kalyanaram and Winer 1995). Expensiveness and cheapness are subjective evaluations of an observed price requiring the reference point against which evaluations occur. Additionally, previous reports suggested that reference prices affect willingness to pay estimations (Grunert et al. 2009), value inferences and satisfaction received from the deals (Weber et al. 2007), or shopping behaviour (Niedrich et al. 2009; Moon and Voss 2009). All of these results have been obtained in the research experiments. However, in the actual purchase situation, it is difficult to estimate how important reference price information is to the consumers. In this study, external reference prices affected the

216
price image in a patronized store, and the place of shopping was selected based on the price image rather than actual prices (supporting the results reported by McGoldrick et al. 1999; Ofir et al. 2008). The internal reference price effect was also observed in price perceptions concerning functional food products in the qualitative data. However, according to the qualitative findings, another price is not always used as a reference point, or at least, the explanations behind the perceptions of expensiveness and cheapness varied. A reference point can be related to another alternative to give the same effect. For example, if a meal contained fibre, the price could be perceived as expensive if other sources of fibre were preferred and perceived as cheaper (e.g., wholemeal bread). Also, the willingness to use the product and the need for the product was related to the experienced expensiveness and this could be used as a reference point. Reference points can be identified in isolated situations and with cognitive reasoning but, how the reference point affects behaviour in an actual shopping situation is still unknown. Based on the results of this study, it is assumed that if the reference price is presented in an isolated judgement task or past prices are remembered, a reference price might be used in order to simplify the task. Otherwise, consumers probably make subjective price perceptions based on various qualitative cues (perhaps value evaluations) and, based on the qualitative data, price perceptions might be different if different reference points are used.
As mentioned previously, a gain is a price below the reference price (cheap) and a loss is a price above the reference price (expensive) (e.g., Tversky and Kahneman 1986) and instead of a single reference price there seems to be a wide latitude of acceptance around the reference price about which subjects are perhaps indifferent (Sherif 1963; Kalyanaram and Winer 1995). However, it is claimed in this study that within the acceptable price range (the latitude of acceptance) consumers affectively evaluate the subjectively perceived price (the perceived cheapness and expensiveness) attaching favourable or unfavourable labels to their price perceptions. Thereby, consumers are perhaps not indifferent towards the perceived expensiveness or cheapness within their latitude of acceptance; rather they can have attitudes towards cheapness and expensiveness, and this was confirmed in this study. If consumers have attitudes towards the price perceptions, one could debate whether a high price can be interpreted as a loss if expensiveness is favourably experienced, or whether a cheap price can be regarded as a gain if cheapness is unfavourably interpreted. This is not necessarily against prospect theory if price evaluations (cheap-expensive) are separated from final value evaluations (gain-loss).
The results of this study support the conceptual schema of consumers’ reactions to price presented by Jacoby and Olson (1977, 75). Consumers interpret the objective price and perceive it subjectively (e.g., too cheap, cheap, neutral, expensive, too expensive), and the subjects in the qualitative study expressed various explanations behind these perceptions. However, it is still unknown whether consumers bear in mind the price perceptions in

217
numerical form or in verbal labels. The ability to recall previous price information seemed to influence the price perceptions. Consequently, attitudes towards price perceptions (cheapness or expensiveness) might affect the motivation to process other product information. If cheapness or expensiveness is unfavourably interpreted and if this product is preferred otherwise, a consumer will want to know more about the product in order to reduce his negative feelings.
According to the theory of planned behaviour (Ajzen 2005), attitudes affect the behaviour, and this was indeed confirmed in this study. Based on the qualitative data, the several affective evaluations related to food prices were documented and feelings of price unfairness emerged. In addition, behavioural beliefs were also identified, and attitudes towards price perceptions could be documented and the multidimensional structure of food price attitudes was outlined. Positive attitudes towards low food prices include behavioural intentions to look for low food prices, to buy food on offers, and to make value evaluations in order to get one’s money’s worth. Positive attitudes towards high food prices include behavioural beliefs that in order to get high quality in foods one has to pay a higher price. High prices in foods are also favourably evaluated if it is important to a person to offer high-priced food to guests. This study confirmed that food price attitudes had an effect on buying intentions and stated acceptable price judgements. Favourable attitudes towards high food prices had an impact on the willingness to buy premium-priced food products and how consumers valued certain quality features, whereas, favourable attitudes towards low food prices affected willingness to pay estimations. Even though food price attitudes affected willingness to buy statements and price estimations, it is not claimed here that food price attitudes make a person buy the premium-priced food products in actual shopping situations. Rather, the food price attitudes reflect the way in which value added quality features are perceived and how perceived expensiveness or cheapness might affect the choice. Attitudes are useful in guiding us to avoid harmful things and to approach beneficial ones (Kantz 1960; Maio et al. 2004). Attitudes can make a decision easier for us, for example, if these attitudes have a knowledge function (Kantz 1960, 170-176). If the price is perceived as cheap (or expensive), negative attitudes towards low (or high) food prices probably prevent purchase intentions, whereas, the positive attitudes can reduce barriers of this kind if this product is otherwise preferred.
The theory of planned behaviour suggests that attitudes, subjective norms, and a control have an impact on behavioural intentions and actual behaviour (Ajzen 2005). Hamlin (2010) criticized this in the food context, arguing that consumers often buy food based on habits and make unconscious evaluations of various cues in order to make a choice (see also Monroe and Lee (1999) with reference to price information). These kinds of habitual tendencies were observed empirically in this study and consumers found difficulties in rationalizing a routine food purchase (this is also supported by Oulette and Wood 1998), especially when basic food

218
products were purchased. However, in this study, the subjects kept a control over costs even in habitual shopping situations, and if the price of a food product made the shopping basket to exceed the budget, the low-priced product could be rejected.
The mental accounting approach in tandem with prospect theory (Tversky and Kahneman 1986; Thaler 1999) can provide an interesting explanation about the ways in which consumers are able to check the food costs and keep food budgets in balance. Mental accounting like behaviour was identified by empirical findings, especially at the shopping basket level. The shopping basket budget was described as “an intuitive feeling” which can cause a reaction preventing a purchase if costs run over the mental budget. Thereby, the mentally kept control of food costs can explain why food prices sometimes seem to have an unimportant role having no effect on a food choice, whereas in the actual purchase situation, a price can be a barrier to buying a certain food product. The control does not perhaps focus on a product price, but rather on the costs of a shopping basket and the shopping basket selection. Previous researchers (e.g. Heath and Sol 1996; Thaler 1999) have suggested that consumers have different kinds of rules when using mental accounts and it is still unknown whether consumers are able to place costs in other accounts if one account is over-consumed. Variations existed among the interviewed subjects and both kinds of behaviour were reported. Some of the subjects were able to transfer money from one account to another, but not all. According to the mental accounting framework, experienced losses or gains will possibly be experienced differently if evaluations are made separately than if the evaluations are made at the aggregated level (Langer and Weber 2001), as can be done in the isolated research situations and in the real shopping situations. Thereby, consumers’ willingness to pay premium price should be investigated in a larger context and with the impact of cost control.
The utility theory in economics suggests that consumers behave rationally and are willing to maximize utility, and in many cases this means the willingness to buy products at the lowest acceptable price. In this research, when subjects were forced to rationalize their food choices, subjects mentioned their willingness to behave rationally (similar to the post-hoc rationality discussed by Elliot 1998). However, the kind of rationality expressed in a food purchase included many other things than the willingness to buy food products at the lowest possible price. Rational behaviour in a food purchase situation was related to more conscious choices in order to avoid food waste, having more time to prepare meals from basic ingredients (more conscious food preparing), making trade-offs with low prices and ease of shopping, and avoiding the intuition based purchases such as hedonic cravings. Intuition-based purchases are perhaps made based on feelings, and they may be accompanied by a sense of losing control if rationalized afterwards. However, they are probably not booked to the budget control and thus to be avoided.

219
6.2.2 Methodological contributions
Based on the results of this study several methodological issues should be taken account in the food research. In the food context, the major challenge is to understand what a consumer is thinking about in the research situation. According to the qualitative results, there is clear support for habitual food purchase (also Honkanen et al. 2005; Hamlin 2010). The strength of a habit is related to former experiences, and only a lack of former experiences activates the reasoning in choice situations as reported by Oulette and Wood (1998). However, in research situations, subjects are forced to provide reasons for behaviour which they normally pay less attention to. Therefore, the reasoned answers may be more rational than the actual behaviour because consumers know that their actions should be rational (Zajonc and Markus 1982).
One important methodological aspect is related to quality and the way in which quality information is inferred differently with foods than with other commodities. This study showed that consumers had weaker attitudes related to food quality than to quality at the general level. A great proportion of food purchases is based on habitual tendencies, and therefore quality evaluations may occur without noticed. If the research questions or opinion statements are not specified to the food domain, the respondents are probably thinking about something else than food. It is easier to remember the more consciously made choice than food choice.
Another aspect related to operationalization is the different levels of quality in foods. In the food choice experiments, it is good to bear in mind that consumers trust the food products in Finland and food safety is taken for granted at the basic quality level. In some food products, the differences in quality are difficult to notice and basic quality is accepted even at an extremely low price. Thus, the role of a price might even seem unimportant. Different quality features are individually valued, and thus the quality inference is made individually from the price information. In foods, general quality is probably too nebulous a concept and it should be described more accurately in the research experiments. At least, in the research situation, a difference ought to be made whether subjects should considering the basic quality of the food product or whether they should consider some special quality features.
In research reports, price-related operationalizations should be made transparent to readers. Concepts of price involvement, price attitude, or price importance should be clearly defined and theoretically explained. In price-related studies, the importance of price is often asked. However, the importance of price can be ambiguous as a variable and it should be carefully considered what is concluded from this measure. A price of a particular food item is probably unimportant, but the prices of food products are perhaps important to all consumers at some level. Additionally, if only the importance of low prices is asked, the multidimensional meaning of prices might be ignored. Another important variable is the role of price in the purchase situation and how much consumers rely on price information. However, this may be

220
different in different choice situations depending whether the respondents are familiar with the products, and whether other information is available. In this thesis, it is recommended that if price perceptions are in focus attitudinal perceptions towards food prices should be measured including favourable and unfavourable evaluations in both high and low food prices. Perceiving a price as cheap or expensive does not reveal whether perceived cheapness or expensiveness is favourably or unfavourably interpreted.
One of the major methodological contributions of this study is constructing the Food Price Attitude Scale and confirming the reliability and validity of the scale (see chapter 6.3.1). However, in this thesis, the Food Price Attitude Scale measured attitudes at the general food purchase level. The attitudes towards high or low prices may be different if different food products are specified on the scale. Quality features are perhaps valued and a high price is differently appreciated in different kinds of food products even within the same product category (as reported by Steenkamp and van Trijp 1985). The Food Price Attitude Scale constructed in this study gives a good starting point for the further development and limitations of this scale are discussed in more detail in chapter 6.3.
It is recommended here that in price-related studies attitudinal beliefs towards low and high food prices should be investigated as background variables. Food price attitudes might be as important background variables as some of the socio-demographic variables because positive attitudes towards low food prices could explain 4.4% of the variance of the willingness to pay estimations while age was explaining 8%, gender 1%, education 3%, and profession 5%. Food price attitudes affected consumers’ willingness to buy premium priced food products, with different value adding benefits being able to explain 29% of the variance. If small convenience samples were used, the impact of food price attitudes on behaviour would be important in the experimental designs. During the food product development processes consumer panels are often used to explore consumers’ willingness to buy new food products. Quite often these consumer panels are convenience samples and sometimes young students are used as respondents. According to this study, younger subjects, especially students, gave the highest price estimations. Also, based on the Food Price Attitude Scale, younger subjects may have more negative attitudes towards low food prices than older subjects. Additionally, from the methodological perspective, it was interesting to note that respondents gave 22% higher willingness to pay estimations if they were considering the random purchase rather than the regular purchase. This should also be taken into account in the price-related studies.
According to the empirically formed framework based on the qualitative results, the consumers’ willingness to buy premium-priced food products is connected to attitudes towards food products (or food involvement), attitudes towards food prices, cost control and perhaps some subjective norms. Methodologically, it would be challenging to operationalize these components and test the framework. Feelings of price fairness or unfairness are also

221
important variables to be included in the experiments and surveys relating to acceptable prices.
6.2.3 Managerial contributions
Marketing managers and researchers are interested in consumers’ willingness to pay more for value adding features and how reliably actual behavioural can be predicted based on the results of consumer studies. As was discussed in the methodological section, if the scales and statements are specifically directed towards foods (or towards food products), the results can likely to be more reliable.
Measuring attitudes towards price perceptions might be important in price setting and for consumer segmentation purposes. As mentioned earlier, food price attitudes probably do not make people buy a premium-priced food product, but food price attitudes probably have an effect on interpretations of expensiveness and cheapness. The positive attitudes towards high food prices may have an important effect on choosing a food product at a premium price and reducing the possible barrier of a high price. Negative attitudes towards high food prices may generate a strong need to justify the experienced high price and in this case the buying behaviour becomes more deliberate. Based on the results of this study, consumers could be segmented based on food price attitudes. This knowledge might be important when new food products are targeted towards specific consumer groups. In the early phases of the product development processes, the targeted consumers would be worth investigating according to their food price attitudes. If the targeted consumers were highly negative towards high food prices (29% of the investigated consumers), the premium price would probably not be the best launching strategy. If the segmented consumers were highly positive towards high food prices (22% of the investigated consumers), the low price would possibly signal the low image of the product. Also for price-setting purposes, it is good to bear in mind, that food price attitudes might have an effect on willingness to pay estimations as discussed previously.
Consumers seem to keep an eye on their food costs and the regular use of a product has a larger impact on food budgets than a random purchase. In this study, consumers gave 22% higher price estimations for a random purchase than a regular purchase. Hence, isolated evaluations relating to food price acceptance might be unreliable, because these evaluations are probably not connected with an actual monetary situation and the evaluated price is probably so small that is not added into the control system (as discussed by Thaler 1999). Food cost control is worth taking into account in investigating whether the price of a product is acceptable and whether the product is accepted for daily use. A high price in foods can be barrier to a regular use if food expenses are expected to increase. Food cost control might also affect purchase intentions independently of the product price. A low and acceptable

222
price can be considered too much in some occasions because of the selection of other food products in the shopping basket.
This study confirmed some previous practices already known by food managers. Price in foods is ambiguous. On the one hand, it is an effective competitive attribute in terms of offers and bargains because low prices are acceptable in foods, and thus the risk of a bad choice is quite small. On the other hand, a price is of secondary importance when making a food choice if other quality attributes are available or if past experiences are called upon. A high price probably has a negative impact on purchase behaviour being a possible barrier to buying certain food products. However, high prices can be accepted if the possible risk of loss is minimized and the quality of the product is made known to consumers (e.g., by doing food tastings at the store). High prices should also be justified in a manner which is valued by the consumers. The marketing messages delivered by the products should be targeted to match the hierarchical structure of the values and needs of the consumers. A high price might generate feelings of unfairness because there can be a risk of being cheated (a higher price than perceived value) or it is against the consumers’ moral judgements (a more powerful actor takes advantage of a weaker player). Feelings of unfairness should be carefully avoided because violations of moral rules of fairness might well be harmful to the supplier, as has been reported by Maxwell (2002; also Kahneman et al. 1986). In this study, the negative feelings of unfairness in some subjects aroused willingness to punish the firm by refusing to buy unfairly priced products.
Based on the qualitative results, the subjects were not good at remembering the prices of food products, although they did select the places where they shopped based on the store price image, as has been previously reported (e.g.McGoldric et al. 1999; Ofir et al. 2008). The ease of recalling information or making judgements is important (Kahneman 2003). All messages related to the store price image or price justifications should be easy to understand and to remember. Consumers need to know why food costs what it does, and a negative interpretation of the price requires justifying. In order to simplify the judgement task of the subject, it might be good to offer reference points to the consumers in the choice situations. Consumers can use all kinds of reference points in making price evaluations without any guidance, but with targeted information relating to the product consumers can perhaps focus on the benefits of the product and justify the premium price.
6.3 Limitations of the study and future research
It was challenging to explore the role of price in purchase behaviour in the food context. The literature related to food choice, price, quality perceptions, and purchase behaviour is extensive and involves several different research traditions: sensory science, economics, behavioural economics, marketing, and psychology. Psychological literature relating to

223
attitudes, judgments and decision making or behaviour is impressive in its breadth and content, and knowledge was gained from different traditions of psychologists. However, there is always a risk of misconstruing theoretical foundations when the research conventions of disciplines are crossed.
One of the limitations of this study is related to the time period of the investigations. The currency of Finland changed at the beginning of 2002. The interviews were held before the change in currency, and, thus the new euro currency did not confuse the perceptions of the subjects. However, the currency change may have had an uncontrolled impact on price perceptions in survey studies especially, willingness to pay estimations in 2004. Other limitations of the study are related to the questionnaires and scales used in the study. The questionnaires were large including between 12 and 15 pages with a range of from 168 to 251 variables. Long questionnaires may generate inconsistencies in respondents’ answers, and thus reliability may be diminished. According to Saunders et al. (2007), the self-administrated questionnaires more than eight pages long are tiresome. It is likely that respondents suffered from a lack of concentration in answering the final questions of a questionnaire as long as 15 pages.
In the questionnaires, a seven point Likert scales was used to measure the strength of an attitude towards food prices, this being an ordinal scale. In order to make multivariate analyses, interval or ratio scales should be used (e.g., Hair et al. 2006; Saunders et al. 2007; Lee and Lings 2008). However, according to Foster et al. (2006, 4) there are few real interval or ratio scales in the social sciences and sometimes the data has been analysed as quantifiable data even when multi-item scales are used. In many research situations in social sciences, Likert-type scales have been regarded as interval scales if the gap sizes between the categories are assumed to be similar (Saunders et al. 2007). This assumption was made in this study and the multivariate analyses were performed. However, the type of scales is one of the limitations to be notified because one can always question whether the gaps between the scales measuring buying intentions are of the same size. According to Bryman and Cramer (1997, 57) there are no exact rules about whether the data received by the ordinal scales can be treated as quantifiable data in research practices. If the gaps between the categories are clearly unequal the Likert-type scale should not be used as an interval scale (Lee and Lings 2008, 146).
In the qualitative study, the subjects were interviewed individually because of the private nature of monetary and health issues. In order to gain the subject’s trust the absolute confidentiality was promised and the transcribed data was only analyzed by the author. However, the reliability of the analyses and the results should be confirmed by another researcher (Lindkvist 1981; Kassarjian 1977; Kolbe and Burnett 1991). In this thesis, a confirmation from other researches is lacking and this might weaken the reliability. On the other hand, great effort was made to present the details of the data including illustrative

224
quotations in order to make the foundations of the results transparent to readers. Thus, it should be possible for readers to confirm or contradict the results of the qualitative analyses.
6.3.1 The reliability and validity of the study
The measurement reliability and validity of the Food Price Attitude Scale is an important issue. The scale was tested with several large consumer samples and it produced consistent and comparable results, and it can therefore be considered as a reliable measure. The Food Price Attitude Scale developed in this thesis had good discriminative validity. The subjects of three different consumer samples were divided into four groups based on the scale. Even though cluster analysis is not a robust method and equal cluster structures are not guaranteed, a similar structure was achieved in each of the samples and the cluster structure was validated. Even though some of the socio-demographical variables were significant in explaining the variance between the groups, the clusters were perhaps unique attitudinal groups. Additionally, the Food Price Attitude scale had good predictive validity. Based on the results of logistic regression, 70% of the subjects unwilling to buy premium-priced food products and 67% of the subjects willing to buy premium-priced food products with some extra benefits were classified into the right groups. The Food Quality factor was the best predictor. Even though it is possible to identify and discriminate consumers with different attitudinal perceptions towards food prices with the scale, the measurement error in the scale indicated some problems with construct validity.
The Food Price Attitude scale was developed in several phases and it was based on the Price Perception Scale (PPS) by Lichtenstein et al. (1993). This scale was chosen in order to have a tested measure and a study of the theoretical foundations of the scale was carried out carefully. The PPS consisted of five dimensions related to the favourable perceptions of a low price: 1) price consciousness, 2) value consciousness, 3) coupon proneness, 4) sale proneness, and 5) price mavenism. Two dimensions related to the favourable perception of a high price: 6) price-quality schema and 7) prestige sensitivity. These dimensions were discussed with interviewed subjects in the food context and dimensions were reduced to five. Coupon proneness and price mavenism were excluded from the further studies, because coupons are seldom used in Finland, and most of the subjects had clearly negative attitudes towards coupons. Price mavenism was also excluded from the measurement because most of the subjects did not discuss food prices with others. However, this dimension is worth exploring more deeply and it should perhaps be included in the food price attitude measurements because one of the subjects behaved in this way, and because price mavenism has also been identified in other studies (e.g., Grunert et al. 2009 in the food context).
Three opinion statements were created to measure each of the five dimensions. All the statements related to favourable attitudes towards low food prices were loaded onto one factor

225
forming one latent variable, namely the LowFoodPrice. In this factor, three dimensions were united: 1) price consciousness, 2) sale proneness, and 3) value consciousness. This dimension included eight items with Cronbach’s alpha value 0.835 (2002, N=1156) which indicated reliable consistency. However, the low factor loadings and high error terms found by confirmatory factor analysis confirmed possible multidimensionality. Multidimensionality suggests that within this latent variable there are still separate dimensions. One explanation for low factor loadings was related to orthogonal rotation and the fact that there were too few variables within each of the dimensions. Orthogonal Varimax rotation during the exploratory factor analysis was chosen in order to create factors without high mutual correlation. This was done because in the further statistical analyses the problem of multicollinearity was to be avoided. However, orthogonal rotation can generate cross-loadings when variables normally correlate but are forced to be separate (Fabrigar et al. 1994). Large measurement errors are probably due to correlations between the variables and cross-loadings with several factors. Developing the measurement scale it is important to have a large variety of statements to begin with. In the development of the Food Price Attitude Scale, three statements in each of the dimensions were too few. According to Kline (1994), there should be twice as many variables as are needed in the final measurement and the final measurement should include five or six variables (Foster et al. 2006). Because the number of variables measuring each of the dimensions was reduced from 43 (original PPS) to 15 in 2001 it was assumed that the dimensional structure of the scale would change. Because of the mutual correlations of the statements, the principal factor analysis reduced the dimensions from five to three uniting all the statements related to positive attitudes towards low food prices. If more variables were added to each of the dimensions, the factoring the variables would probably create a different and more specific dimensional structure.
In the first survey, the FoodQuality factor had only one variable with sufficient explanation power (above 0.05 as suggested by Hair et al. 2006, 130), and both the FoodQuality and FoodPrestige dimensions had only a few statements. During the scale development, efforts were made to improve the FoodQuality (Cronbach’s alpha value of 0.703 in 2002) and Food Prestige (Cronbach’s alpha value of 0.665 in 2002) factors, but only with minor success. Even though Cronbach’s alpha values and, also, the values of composite reliability for each of the factors were adequate, the values of average variance of extracted showed inconvenient error variance within the factors. Based on the results of the structural equation modelling, some of the variables needed to be removed in order to improve the model fit, and in the final model only two observed variables reflected the FoodQuality and FoodPrestige dimensions. According to Forster et al. (2006), two variables are not enough. However, according to Reardon et al. (1995), when developing the applied scale for practical purposes there should be a minimum number of variables to provide reliable results, and the Food Price Attitude Scale consisted, in its most reduced form, of only eleven variables. However, these dimensions are worth being developed further.

226
Possible prestige gained from others with premium-priced food products was ambiguous dimension, and after all the investigations, it is still unknown whether it exists in the food context. It might just be related to the culturally learned norms of hospitality or it might reflect the high appreciation of quality issues. According to qualitative data, the prestige gained from others was possibly related to premium-priced food offered to guests. This was measured with two opinion statements. However, there might be more related to that dimension than treating guests with good food. It was assumed that perhaps buying food from special food shops and avoiding bargain stores would reflect this dimension, but factor loadings were low. Additionally, it was assumed that respondents would value premium-priced food brands for social status reasons, but these variables shared little of the common variance with the original two variables. Therefore, premium-price food offered to others might reflect different dimension than premium-price food consumed by the subject himself. The FoodQuality dimension explained 29% of the variance of FoodPrestigedimension suggesting that consumers’ willingness to offer premium priced food to others is partly based on quality beliefs. Moreover, future inspections might show that the willingness to offer premium-priced food to others does not reflect the willingness to gain prestige from others, and therefore the FoodPrestige factor might lack face validity and should be relabelled.
However, the most important question is whether the dimensions of the Food Price Attitude Scale are sufficient measures of food price attitudes. Moreover, there might be other important indicators of food price attitudes to be included in the scale in order to improve the measurement validity.
6.3.2 Future research
The Food Price Attitude scale was developed and tested with different data samples, but further development is naturally needed. However, larger theoretical investigations would be necessary than scale testing in different contexts and with different samples. According to qualitative results, attitudinal perceptions towards food prices might have other dimensions than those measured by the Food Price Attitude Scale. Subjects expressed internal and external reasons for attitudinal perceptions, but, only internal behavioural beliefs were included in the scale. However, it would be interesting to investigate to what extent perceived external reasons (e.g. seasonal factors, the supply situation) would affect food price attitudes and explain behavioural intentions. Price fairness is an important affective component in food price attitudes. Further investigations are needed in order to decide how price fairness or unfairness might be included in the measures. Behavioural beliefs, relating to high price and high quality, were measured at the general level in the Food Price Attitude Scale, and only two of the statements had high path loadings. The quality issues were domain specific being perceived differently in foods than in other products. Moreover, basic food quality

227
is probably unconnected to high price, and price-quality relationships might be product specific. Therefore, the scale should perhaps be modified to fit the context of different target products. Additionally, justifications of a high price relating to ethical reasons, health issues, convenience, or other specific quality features would perhaps be included in the measures with more detailed statements. Similarly, the operationalization of the possible prestige gained from others needs further investigation, as has been previously discussed. This may lead to the possibility that prestige gained from others is one dimension, but appreciation of oneself, if using premium-priced food products, is another. Furthermore, familiarity or past experiences may have some impact on behavioural beliefs and further the formation of food price attitudes.
One possible area of future research and to gain more understanding about the food price attitude structure would be Kantz’s (1960, 170-176) functional approach to attitudes. With this approach it would be possible to explore if attitudes towards the food prices served different functions. Perhaps the multidimensionality of the attitudes towards high and low food prices reflects the different functions. Prestige gained from others may signal the value-expressive function, and the willingness to buy food at the lowest possible prices can be based on the utility function. Positive attitudes towards high food prices in relation to high quality might be related to the knowledge function, because it is difficult to organize the large combinations of different quality attributes.
In-depth research is needed to confirm the theoretical framework which results from the qualitative study. It would be interesting to investigate the impact of food involvement (a product attitude) together with food price attitudes on behavioural intentions and even actual behaviour. Food cost control should be also included in the model. Operationalizations of mental accounting and the different forms of food purchase rationality would require in-depth investigations. The way in which consumers control their food purchases should also be included in these investigations. Based on the qualitative results, it was difficult to separate subjective norms and attitudes. Strong ethical concerns may create unfavourable attitudes towards low food prices, and high prices in foods might be justified with ethical issues. However, it is difficult to say whether ethical issues are just specified quality features and only one aspect of the positive attitude towards high-priced food (FoodQuality), or perhaps the valuation of ethical issues is a person’s response to subjective norms. Subjective norms in this case might be the mutual interests of friends. In some of the previous studies relating to the theory of planned behaviour, researchers have found a strong relationship between subjective norms and attitudes. Norms have been found to have an indirect impact on behavioural intentions through attitudes in the product context (e.g. Hansen et al. 2004; Verbeke and Vackier 2005; Tarkkinen and Sundqvist 2005). A challenging area for future research might be to explore how much willingness to buy food products at high or low prices is affected by other people, perhaps by other members of the family. These opinions

228
may create subjective norms which impact on behavioural intentions as has been theorized in the theory of planned behaviour (Ajzen 2005). For example, if someone else required a person to buy food with the lowest possible price, it would not necessarily reflect the buyer’s attitudes, rather it might be a norm adopted from others. In this study, the effect of others was not identified, yet it might exist.
The hypotheses of this study were tested in isolation and the cognitively reasoned results might be different than the actual habitual behaviour. It was confirmed in this thesis that consumers evaluate single food prices in isolation without connecting the possible purchase with the monetary situation. The monetary situation seemed to have an effect on a person’s situational necessity to buy low priced food products and it had a significant impact on the food price attitude dimensions. In developing the Food Price Attitude Scale further, the situational necessity to value low-priced food should be distinguished from the positive attitudes towards low food prices. Moreover, the income level of the household and the opinion of the assets available for daily consumption had an insignificant impact on willingness to pay estimations. Future research is required in order to understand how consumers make price judgements in the research situation and how reliable these are in the actual purchase context. Similarly, more accurate measures are needed to describe the actual monetary situation. In this study, with the variable of the assets for daily consumption it was possible to capture a subjective feeling of the actual monetary situation. Although it is an important feeling and had a significant effect on food price attitudes, it does not reveal how much money respondents have for daily use. For one person a small amount of money for daily use may feel like “plenty” and for another person the same amount is “little”.
This study challenges researchers to continue investigations into consumers’ attitudes towards food prices. Some important dimensions were identified and confirmed. However, a more precise structure for the measurement model might increase the validity of the scale. Investigation is also needed to confirm the impact of food price attitudes on actual purchase behaviour. Moreover, it is necessary to investigate whether attitudes towards food prices are permanent attitudes related to personality or whether they change if monetary or other situations change. Both of these assumptions were supported by the qualitative results.
The importance of exploring the concept of food price attitudes further is related to consumers’ willingness to accept high prices in foods. In Finland, domestic food production cannot compete with so called low-cost countries and producing high quality food products is probably impossible with cost-effective strategies. Consumers need justifications in order to accept high food prices and they need to understand why food costs what it does. Feelings of unfairness may have a strong impact on actual behaviour, but what generates feelings of unfairness in foods and how feelings of unfairness are measured reliably should be further explored. Acceptable reasons for high food prices in different food categories can vary. A willingness to promote Finnish agriculture and Finnish food production were expressed in this

229
study, and thus some people might accept high food prices in order to avoid mass production and imported food. However, the media would appear to be quite negative towards high food prices, especially towards food price increases. Increase of food prices may create the strong feelings of unfairness because they are most often announced by big retail groups against which consumers possess weak negotiation power. Because of the concentration of food retailers in Finland (there are only a few large retail groups in the Finnish food markets) consumers probably feel that by increasing retail prices these companies are taking advantage of weaker partners like consumers and Finnish farmers. Additionally, an increase in food prices destroys the mental system of cost control. The household budgets must be reformulated, which perhaps creates negative feelings of insecurity. When marketing the premium priced food products, it would be important to understand what kinds of messages prevent feelings of unfairness and promote the acceptability. However, not all consumers have positive attitudes towards high food prices. Thus, future research is required to understand the mechanism how food price attitudes might be changed, that is if they can be changed.
230
References
Aalto-Setälä, V. & Raijas, A. 2003. Actual market prices and consumer price knowledge. Journal of Product & Brand Management 12(3):180-192.
Ackerman, D. & Tellis, G. 2001. Can culture affect prices? Journal of Retailing 77:57-82.
Adam, D. 1969. Consumer reactions to price. In publication: Taylor, B. & Wills, G. (eds.) 1969. Pricing strategy. Stables Press Ltd. London. 75-88.
Adler, P. A. & Adler, P. 1998. Observational techniques. In publication: Denzin, N. K. & Lincoln, Y. S. (eds.) 1998. Collecting and interpreting qualitative materials. p. 79-109. Sage publications, Thousand Oaks, California. 462 p.
Ajzen, I. 2005. Attitudes, personality, and behavior. 2 nd eds. Open University Press, Berkshire, UK. 178 p.
Alford, B. L. & Engelland, B. T. 2000. Advertised reference price effects on consumer price estimates, value perception, and search information. Journal of Business Research, 48:93-100.
Andrieu, E., Darmon, N. & Drewnowski, A. 2006. Low-cost diets: more energy, fewer nutrients. European Journal of Clinical Nutrition, 60:434-436.
Anttila, M. 1990. Consumer price perception and preference. Publications of the Helsinki school of Economics, series A:73. Helsinki. 312 p.
Anttila, M. 2004. Consumer price perceptions after translation to Euro currency. Journal of Product & Brand Management, 13(1):47-55.
Appelby, M. C., Cutler, N., Gazzrd, J., Goddard, P., Milne, J. A., Morgan, C. & Redfern, A. 2003. What price cheap food? Journal of Argicultural and Environmental Ethics, 16(4):395-408.
Ard, J. D., Fitzpatrick, S., Desmond, R. A., Sutton, B. S., Pisu, M., Allison, D. B., Franklin, F. & Baskin, M. L. 2007. The impact of cost on the availability of fruits and vegetables in the homes of schoolchildren in Birmingham, Alabama. American Journal of Public Health, 97(2):367-372.
Arcidiacono, D. 2011. Consumer rationality in a multidisciplinary perspective. The Journal of Socio-Economics, 40:516-522.
Ares, G., Giménez, A. & Deliza, R. 2010. Influence of three non-sensory factors on consumer choice of functional yogurts over regular ones. Food Quality and Preference, 21:361-367.
Bagozzi, R. P. (ed.) 1994. Principles of marketing research. Blackwell Publishers. Cambridge. 430 p.

231
Bagozzi, R. P., Gopinath, M. & Nyer, P. U. 1999. The role of emotions in marketing. Journal of Academy of Marketing Science, 27(2):184-206.
Baker, R., Robinson, A. & Smith, R. 2008. How respondents explain WTP responses? A review of the qualitative evidence. Journal of Socio-Economics 37:1427-1442.
Bava, C. M., Jaeger, S. R. & Park, J. 2008. Constraints upon food provisioning practices in ”busy” women’s lives: trade-offs which demand convenience. Appetite, 50:486-498.
Bech-Larsen, T. & Grunert, K. G. 2003. The perceived healthiness of functional foods: a conjoint study of Danish, Finnish, ans American consumers’ perception of functional foods. Appetite, 40(1):9-14.
Bechwati, N. N., Sisodia, R. S. & Sheth, J. N. 2009. Developing a model of antecedents to consumers’ perceptions and evaluations of price unfairness. Journal of Business Research, 62:761-767.
Bell, D. R., Ho, T-C. & Tang, C. 1998. Determining where to shop: fixed and variable costs of shopping. Journal of Marketing Research, 35(3):352-369.
Bello Acebrón, L. & Calvo Dopico, D. 2000. The importance of intrinsic and extrinsic cues to expected and experienced quality: an empirical application for beef. Food Quality and Preference 11:229-238.
Bettman, J. R. 1979. An information processing theory of consumer choice. Addison-Wesley Publication Co. Reading, MA. 402 p.
Blaylock , J., Smallwood, D., Kassel, K., Variyam, J. & Aldrich L. 1999. Economics, food choice, and nutrition. Food Policy, 24:269-286.
Bohara, A. K., McKee, M., Berrens, R. P., Jenkins-Smith, H., Silva, C. L. & Brookshire, D. S. 1998. Effects of total cost and group-size information on willingness to pay responses: open ended vs. dichotomous choice. Journal of Environmental Economics and Management, 35:142-163.
Bolton, L. E., Warlop, L. & Alba, J. W. 2003. Consumer perception of price (un)fairness. Journal of consumer research, 29(March):474-491.
Borsboom, D., Mellenbergh, G. J. & van Heerden, J. 2003. The theoretical status of latent variables. Psychological Review, 110(2):203-219.
Bower, J. A., Saadat, M. A. & Whitten, C. 2003. Effect of liking, information and consumer characteristics on purchase intention and willingness to pay more for a fat spread with a proven health benefit. Food Quality and Preference, 14(1):65-74.
Bowman, S. A. 2006. A comparison of the socioeconomic characteristics, dietary practices, and health status of women food shoppers with different food price attitudes. Nutrition Research, 26:318-324.
232
Boyle, K. J., Johnson, F. R., McCollum, D. W., Desvousges, W. H., Dunford, R. W. & Hudson, S. P. 1996. Valuing public goods: discrete versus continuous contingent-valuation responses. Land Economic, 72(3):381-396.
Bronnenberg, B. J. & Vanhonacker, W. R. 1996. Limited choice sets, local price response, and implied measures of price competition. Journal of Marketing Research, 28(May):163-173.
Browne, M. W. 1984. Asymptotically distribution-free methods for the analysis of covariance structures. British Journal of Mathematical and Statistical Psychology, 37:62-83.
Brunsø, K. & Grunert, K. G. 1998. Cross-cultural similarities and differences in shopping for food. Journal of Business Research, 42:145-150.
Bryman, A. & Cramer, D. 1997. Quantitative data analysis with SPSS for Windows: a guide for social scientists. Routledge. London. 318 p.
Buchanan, T. W. 2008. Retrieval of emotional memories. Psychological Bulletin, 133(5):761-779.
Bäckstöm, A., Pirttilä-Backman, A.-M., Tuorila, H. 2003. Dimensions of novelty: a social representation approach to new foods. Appetite 40:299-307.
Cardello, A. V. & Sawyer, F. M. 1992. Effects of disconfirmed consumer expectations on food acceptability. Journal of Sensory Studies, 7:253-277.
Carroll, J. D. & Green, P. E. 1995. Psychometric methods in marketing research: Part I, Conjoint analysis. Journal of Marketing Research, 28(November):385-391.
Carsky, M. L., Smith, M. F. & Dickinson, R. A. 1994. Measuring the involvement construct: a cross cultural examination of food shopping behavior. Journal of International Food & Agribusiness Marketing, 6(4):71-102.
Cassady, D., Jetter, K. M. & Culp, J. 2007. Is price a barrier to eating more fruits and vegetables for low-income families? Journal of American Dietic Association, 107:1909-1915.
Chen, M-F. 2007. Consumer attitudes and purchase intentions in relation to organic foods in Taiwan: moderating effects of food-related personality traits. Food Quality and Preference, 18:1008-1021.
Chetthamrongchai, P. & Davies, G. 2000. Segmenting the market for food shoppers using attitudes to shopping and to time. British Food Journal, 102(2):81-101.
Chocarro, R., Cortinas, M. & Elorz, M. 2009. The impact of product category knowledge on consumer use of extrinsic cues – a study involving agrifood products. Food Quality and Preference, 20:176-186.

233
Combris, P., Bazoche, P., Giraud-Héraud, E. & Issanchou, S. 2009. Food choice: what do we learn from combining sensory and economic experiments? Food Quality and Preference, 20:550-557.
Consumer Agency 2004. Survey of the price of functional foods: prices are not always in line with benefits. Consumer Agency Price Comparisons 1/2004 (3.5.2004).
Cooper, P. 1969. Subjective economics: factors in a psychology of spending. In publication: Taylor, B. & Wills, G. (eds.) 1969. Pricing strategy. Stables Press Ltd, London. 112-121.
Cunningham, W. A., Packer, D. J., Kesek, A. & van Bavel, J. J. 2009. Implicit measurement of attitudes: a psychological approach. In publication: Petty, R. E., Fazio, R. H. & Brinõl, P. (eds.) 2009. Attitudes: insights from the new implicit measures. Psychology Press, New York. 485-512.
Davis, F. D. & Warshaw, P. R. 1992. What do intention scales measure? Journal of General Psychology, 119(4):391-407.
Denzin, N. K. & Lincoln, Y. S. (eds.) 1998. Collecting and interpreting qualitative materials. Sage publications, Thousand Oaks, California. 462 p.
Diamantopoulos, A. & Siguaw, J. 2008. Intoducing Lisrel. ISM Sage Publications, London. 171 p.
Dickson, P. R. & Sawyer, A. G. 1990. The price knowledge and search of supermarket shoppers. Journal of Marketing, 54(3):42-53.
Diller, H. 2008. Price fairness. Journal of Product & Brand Management, 17(5):353-355.
DiMonaco, R., Ollila, S. & Tuorila, H. 2004. Effect of price on pleasantness ratings and use intentions for a chocolate bar in the presence and absence of a health claim. Journal of Sensory Studies, 20:1-16.
Ding, M., Ross Jr., W. T. & Rao, V. R. 2010. Price as an indicator of quality: implications for utility and demand functions. Journal of Retailing, 86(1):69-84.
Dransfield, E., Zamora, F. & Bayle, M-C. 1998. Consumer selection of steaks as influenced by information and price index. Food Quality and Preference, 9(5):321-326.
Drewnowski, A., Darmon, N. & Briend, A. 2004. Replacing fats and sweets with vegetables and fruits – a question of cots. American Journal of Public Health, 94(9):1555-1559.
Eagly, A. H. & Chaiken, S. 1993. The psychology of attitudes. Fort Worth; Hartcourt, Brace, Jovanovich.
Eertmans, A., Victoir, A., Notelaers, G., Vansant, G. & Van den Bergh, O. 2006. The food choice questionnaire: factorial invariant over western urban populations? Food Quality and Preference, 17:344-352.5

234
Elliot, R. 1998. A model of emotion-driven choice. Journal of Marketing Management, 14:95-108.
Emery, F. 1969. Some psychological aspects of price. In publication: Taylor, B. & Wills, G. (eds.) 1969. Pricing strategy. Stables Press Ltd, London. 98-111.
Enneking, U., Neumann, C. & Henneberg, S. 2007. How important intrinsic and extrinsic product attributed affect purchase decision. Food Quality and Preference, 18:133-138.
Erdem, T., Swait, J. & Louviere, J. 2002. The impact of brand credibility on consumer price sensitivity. International Journal of Research in Marketing, 19:1-19.
Erickson, G. M. & Johansson, J. K. 1985. The role of price in multi-attribute product evaluations. Journal of Consumer Research, 12(2):195-199.
Fabrigar, L. R., Wegener, D. T., MacCallum, R. C. & Strahan, E. J. 1999. Evaluating the use of exploratory factor analysis in psychological research. Psychological Methods, 4(3):272-299.
Festinger, L. 1957. A theory of cognitive dissonance. Standford University Press, CA.
Finnish Competition Authority 2003. Yearbook. Helsinki. 90 p. http://kilpailuvirasto.fi/tiedostot/vuosikirja-2003-englanti.pdf [www-document, last read 15.4.2011].
Fisbein, W. A. & Ajzen, I. 1975. Belief, attitude, intention and behvior: in introduction to theory and research. Reading, MA, Addison-Wesley.
Fitzsimons, G. J., Hutchinson, J. W., Williams, P, Alba, J. W., Chartrand, T. L., Huber, J., Kardes, F. R., Menon, G., Raghubir, P., Russo, J. E., Shiv. B. & Tavassoli, N. T. 2002. Non-conscious influences on consumer choice. Marketing Letters, 13(3):269-279.
Fontana, A. & Frey, J. H. 1998. Interviewing: the art of science. In publication: Denzin, N. K. & Lincoln, Y. S. (eds.) Collecting and interpreting qualitative materials. Sage publication, Thousans Oaks, CA. p.47-78.
Foster, J., Barkus, E. & Yavorsky, C. 2006. Understanding and using advanced statistics. Sage publications. London. 178 p.
Fouilhé, P. 1969. The subjective evaluation of price: methodological aspects. In publication: Taylor, B. & Wills, G. (eds.) 1969. Pricing strategy. Stables Press Ltd, London. 89-97.
Gabor, A. & Granger, C. 1969a. Price consciousness of consumers. In publication: Taylor, B. & Wills, G. (eds.) 1969. Pricing strategy. Stables Press Ltd, London. 5-25.
Gabor, A. & Granger, C. 1969b. The attitude of the consumer to price. In publication: Taylor, B. & Wills, G. (eds.) 1969. Pricing strategy. Stables Press Ltd, London. 132-146.
235
Gamble, A. , Gärling, T., Charlton, J. & Ranyard, R. 2002. Euro Illusion: psychological insights into price evaluations with unitary currency. European Psychologist, 7(4):302-311.
Gerbing, D. W. & Anderson, J. C. 1988. An updated paradigm for scale development incorporating undimensionality and its assessments. Journal of Marketing Research, 25(2):186-192.
Grewal, D., Hardesty, D. M. & Iyer, G. R. 2004. The effects of buyer identification and purchase timing on consumers’ perceptions of trust, price fairness, and repurchase intentions. Journal of Interactive Marketing, 18(4):87-100.
Grunert, K. G. 2002. Current issues in the understanding of consumer food choice. Trends in Food Science & Technology, 13:275-285.
Grunert, K. G., Juhl, H. J., Esbjerg, L., Jensen, B. B., Bech-Larsen, T., Brunsø, K. & Madsen, C. Ø. 2009. Comparing methods for measuring consumer willingness to pay for a basic and improved ready made soup product. Food Quality and Preference, 20:607-619.
Guinard, J-X. & Marty C. 1997. Acceptability of fat-modified foods to children, adolescents and their parents: effect of sensory properties, nutritional information and price. Food Quality and Preference, 8(3):223-231.
Guinard, J-X., Uotani, B. & Schlich, P. 2001. Internal and external mapping of preferences for commercial lager beers: comparison of hedonic ratings by consumers blind versus with knowledge of brand and price. Food Quality and Preference, 12:243-255.
Gummesson, E. 1991. Qualitative methods in management research. Revised edition. Sage publications, California. 212 p.
Haddock, G. & Huskinson, T. L. H. 2004. Individual differences in attitude structure. In publication: Haddock, G. & Maio, G. R. (eds.) 2004. Contemporary perspectives on the psychology of attitudes. Psychology Press. Hove. 35-56.
Haddock, G. & Maio, G. R. (eds.) 2004. Contemporary perspectives on the psychology of attitudes. Psychology Press. Hove. 469 p.
Hair, J. F., Black, W. C., Babin, B. J., Andersson, R. E. & Tatham, R. L. 2006. Multivariate data analysis. 6th ed. Prentice Hall, New Jersey. 889 p.
Hamlin, R. P. 2010. Cue-based decision making. A new framework for understanding the uninvolved food consumer. Appetite 55:89-98.
Han, S., Gupta, S. & Lehmann, D. R. 2001. Consumer price sensitivity and price thresholds. Journal of Retailing, 77:435-456.
Hansen, K., Singh, V. & Chintagunta, P. 2006. Understanding store-brand purchase behaviour across categories. Marketing Science, 25(1):75-90.

236
Hansen, T., Jensen, J. M., Solgaard, H. S. 2004. Predicting online grocery buying intentions: a comparison of the theory of reasoned action and the theory of planned behaviour. International Journal of Information Management, 24:539-550.
Heath, C. & Soll, J. B. 1996. Mental budgeting and consumer decisions. Journal of Consumer Research, 23(June):40-52.
Heath, C., Larrick, R. P. & Wu, G. 1999. Goals as reference points. Cognitive Psychology, 38:79-109.
Helgesen, H., Solheim, R. & Næs, T. 1998. Consumer purchase probabilities of dry fermented lamb sausages. Food Quality and Preference, 9(5):295-301.
Helson, H. 1964. Current trends and issues in Adaptation-level theory. American Psychologist, 19(1):26-38.
Holbrook, M. B. & Hirschman, E. C. 1982. The experimental aspects of consumption: consumer fantasies, feelings and fun. Journal of Consumer Research, 9:132-139.
Hollebeek, L. D., Jaeger, S. R., Brodie, R. J. & Balemi, A. The influence of involvement on purchase intentions for new world wine. Food Quality and Preference, 18:1033-1049.
Honkanen, P., Olsen, S. O. & Verplanken, B. 2005. Intention to consumer seafood – the importance of habit. Appetite, 45:161-168.
Huber, J. & McCann, J. 1982. The impact of inferential beliefs on product evaluations. Journal of Marketing Research, 19(August):324-333.
Huotilainen, A. 2005. Dimensions of novelty: social representations of new foods. University of Helsinki, ETK-series 1335. Helsinki.
Iacobucci, D. 1994. Classic factor analysis. In publication: Bagozzi, R. P. (ed.) 1994. Principles of marketing research. Blackwell Publishers. Cambridge. 279-316.
Jacobson, R. & Obermiller, C. 1990. The formation of expected future price: a reference price for forward looking consumers. Journal of Consumer Research, 16(March):420-432.
Jacoby, J., Olson, J. C. & Haddock, R. A. 1971. Price, brand name, and product composition characteristics as determinants of perceived quality. Journal of Applied Psychology, 55(6):570-579.
Jacoby, J. & Olson, J. C. 1977. Consumer response to price: an attitudinal, information processing perspective. In publication: Wind, Y. & Greenberg, M. G. (eds.) 1977. Moving a head with attitude research. American Marketing Association. Chicago. 73-86.
Jaeger, S. R. 2006. Non-sensory factors in sensory science research. Food Quality and Preference, 17:132-144.

237
Janiszewski, C. & Lichtenstein, D. R. 1999. A range theory account of price perception. Journal of Consumer Research, 25(March):353-368.
Jin, B. & Sternquist, B. (2003). The influence of retail environment on price perceptions: an exploratory study of US and Korean students. International Marketing Review, 20(6):643-660.
Johansson-Stenman, O. & Martinsson, P. 2006. Honestly, why are you driving a BMW? Journal of Economic Behaviour & Organization, 60:129-146.
Jonas, M.S. & Beckmann, S.C. (1998) Functional foods: Consumer perceptions in Denmark and England. MAPP Working Paper no 55, the Aarhus School of Business, Aarhus.
Jöreskog, K. G. & Sörbom, D. 1996. LISREL 8. User’s reference guide. Scientific Software International. Chicago.
Kahneman, D. 2003. A perspective on judgment and choice: mapping bounded rationality. American Psychologist, 58(9):697-720.
Kahneman, D. & Tversky, A. 1979. Prospect theory: an analysis of decisions under risk. Econometrica, 47:263-291.
Kahneman, D, Knetsch, J. L. & Thaler, R. H. 1986. Fairness and the assumptions of economics. Journal of Business, 59(4):S285-S300.
Kalyanaram, G & Winer, R. S. 1995. Empirical generalizations from reference price research. Marketing Science, 14(3):G161-G169.
Kamen, J. M. & Toman, R. J. 1970. Psychophysics of prices. Journal of Marketing Research, 7(February):27-35.
Kamen, J. M. & Toman, R. J. 1971. Psychophysics of prices: a reaffirmation. Journal of Marketing Research, 8(May):252-257.
Kantz, D. 1960. The functional approach to the study of attitudes. The Public Opinion Quartely, 24(2):163-204.
Kassarjian, H. H. 1977. Content analysis in consumer research. Journal of Consumer Research, 4(June):8-18.
Katona, G. 1977. Psychological economic. Elsevier Scientific Publishing, New York. 3rd
editon. 438 p.
Kearney, J. M. & McElhone, S. 1999. Perceived barriers in trying to eat healthier – results of the pan-EU consumer attitude survey. British Journal of Nutrition 81(suppl. 2):S133-S137.
Kerin, R.A., Jain, A. & Howard, D. J. 1992. Store shopping experience and consumer price-quality-value perceptions. Journal of Retailing, 68(4):376-396.

238
Kline, P. 1994. An easy guide to factor analysis. Routledge, London. 194 p.
Kolbe, R. H. & Burnett, M. S. 1991. Content-analysis research: an examination of applications with directives for improving research reliability and objectivity. Journal of Consumer Research, 18(2):243-250.
Kopalle, P. K. & Lindsey-Mullikin, J. 2003. The impact of external reference price on consumer price expectations. Journal of Retailing, 79:225-236.
Kopalle, P., Biswas, D., Chintagunta, P. K., Fan, J., Pauwels, K., Ratchford, B. T. & Sills, J. A. 2009. Retailer Pricing and competitive effects. Journal of Retailing, 85(1):56-70.
Korhonen, R. 2007. Ruoasta tuli keinottelun kohde. Talouselämä. Published 28.9.2007. http.//www.talouselama.fi/uutiset/article161392.ece [www-document, last read 23.6.2011].
Korzen-Bohr, S. & O’Doherty Jensen, K. 2006. Heart disease among post-menopausal women: acceptability of functional foods as a preventive measure. Appetite, 46:152-163.
Kumar, V., Karande, K. & Reinartz, W. J. 1998. The impact of internal and external reference price on brand choice: the moderating role of contextual variables. Journal of Retailing, 74(3):401-426.
Köster, E. P. 2009. Diversity in the determinants of food choice: a psychological perspective. Food Quality and Preference, 20:70-82.
Lambert, Z. V. 1972. Price and choice behavior. Journal of Marketing Research, 9 (February):35-40.
Lambert, Z. V. 1978. Differential thresholds in consumer perception of retail prices. The Journal of Psychology, 100:139-150.
Lange, C., Issanchou, S. & Combris, P. 2000. Expected versus experienced quality: a trade-off with price. Food Quality and Preference, 11:289-297.
Lange, C., Martin, C., Chabanet, C., Combris, P. & Issanchou, S. 2002. Impact of the information provided to consumers on their willingness to pay for champagne: comparison with hedonic scores. Food Quality and Preference, 13:597-608.
Langer, T. & Weber, M. 2001. Prospect theory, mental accounting, and differences in aggregated and segregated evaluations of lottery portfolios. Management Science, 47(5):716-733.
Latvala, T. 2009. Information, risk and trust in food chain: ex-ante valuation of consumer willingness to pay for beef quality information using the contingent valuation method. Pellervo Economic Research Institute, publications 20. Helsinki. 117 p.

239
Leavitt, H. J. 1969. Experimental findings about meaning of price. In publication: Taylor, B. & Wills, G. (eds.) 1969. Pricing strategy. Stables Press Ltd, London. 37-43.
Lee, N. & Hooley, G. 2005. The evolution of “classical mythology” within marketing measure development. European Journal of Marketing, 39(3/4):365-385.
Lee, N. & Lings, I. 2008. Doing business research: a guide to theory and practice. Sage Publications, London. 423 p.
Lichtenstein, D. R., Bloch, P. H. & Black, W. C. 1988. Correlates of price acceptability. Journal of Consumer Research, 15(2):243-252.
Lichtenstein, D. R. & Burton, S. 1989. The relationship between perceived and objective price-quality. Journal of Marketing Research, 26(4):429-443.
Lichtenstein, D. R., Ridgway, N. M. & Netemeyer, R. G. 1993 Price perceptions and consumer shopping behavior: a field study. Journal of Marketing Research, 30(2):234-245.
Likert, R. 1932. A technique for the measurement of attitudes. Archives of psychology, 140:5-53.
Lindkvist, K. 1981. Approaches to textual analysis. In publication: Rosengren, K. E. 1981 (ed.). Advances in content analysis. Sage Annual Reviews of Communication Research volume 9, Bevery Hills, California. 23-42.
Lindsey-Mullikin, J. 2003. Beyond reference price: understanding consumers’ encounters with unexpected prices. Journal of Product & Brand Management, 12(3):140-153.
Locksin, L., Jarvis, W., d’Hauteville, F. & Perrouty, J-P. 2006. Using simulations from discrete choice experiments to measure consumer sensitivity to brand, region, price, and awards in wine choice. Food Choice and Preference 17:166-178.
Loewenstein, G. F., Weber, E. U., Hsee, C. K. & Welch, N. 2001. Risk as a feeling. Psychological Bulletin, 127(2):267-286.
Lowe, B. & Alpert, F. 2007. Measuring reference price perceptions for new product categories: which measure is best? Journal of Product & Brand Management, 16(2):132-141.
Luce, M. F., Payne, J. W. & Bettman, J. R. 2000. Coping with unfavourable attribute values in choice. Organizational Behaviour and Human Decision Processes, 81(2):274-299.
Malhotra, N. K. & Birks, D. F. 2003. Marketing research: an applied approach. 2nd European ed. Prentice Hall. Essex.786 p.
Manning, P. K. & Cullum-Swan, B. 1998. Narrative, content, and semiotic analysis. In publication: Denzin, N. K. & Lincoln, Y. S. (eds.) 1998. Collecting and interpreting qualitative materials. Sage publications, Thousand Oaks, California. 246-274.
240
Martinez, E. & Montaner, T. 2006. The effect of consumer’s psychographic variables upon deal-proneness. Journal of Retailing and Consumer Services, 13:157-168.
Maxwell. S. 2002. Rule-based price fairness and its effects on willingness to purchase. Journal of Economic Psychology, 23:191-212.
Maxwell, S. 2008. Fair price: research outside marketing. Journal of Product & Brand Management, 17(7):497-503.
Maio, G. R., Esses, V. M., Arnold, K. & Olson, J. M. 2004. The function-structure model of attitudes: incorporating the need for affect. In publication: Haddock, G. & Maio, G. R. (eds.) 2004. Contemporary perspectives on the psychology of attitudes. Psychology Press. Hove. 9-33.
McCarthy, M., O’Reilly, S., Cotter, L. & de Boer, M. 2004. Factors influencing consumption of pork and poultry in the Irish market. Appetite 43:19-28.
McConnel, J. D. 1968. The price-quality relationship in an experimental setting. Journal of Marketing Research, 5(August):300-303.
McEachern, M. G. & Schröder, M. J. A. 2002. The role of lifestock production ethics in consumer values towards meat. Journal of Agricultural and Environmental Ethics, 15(2):221-237.
McGoldrick, P. J., Betts, E. J. & Wilson A. F. 1999. Modelling consumer price cognition: evidence from discount and superstore sectors. The Service Industries Journal, 19(1):171-193.
Meng, J. & Nasco, S. A. (2009). Cross-cultural equivalence of price perceptions across American, Chinese, and Japanese consumers. Journal of Product & Brand Management, 18(7):506-516.
Milkman, K. & Beshears, J. 2009. Mental accounting and small windfalls: evidence from a online grocer. Journal of Economics Behaviour & Organization, 71:384-394.
Millar, M.G. & Millar, K. U. 1990. Attitude change as a function of attitude type and argument type. Journal of Personality and Social Psychology, 59(2):217-228.
Monroe, K. B. 1973. Buyers’ subjective perceptions of price. Journal of Marketing Research, 10(February):70-80.
Monroe, K. B. 2003. Pricing: Making profitable decisions. International editions. 3 rd ed. McGraw-Hill Education (Asia), Taipei.658 p.
Monroe, K. B. & Lee, A. Y. 1999. Remembering versus knowing: issues in buyers processing of price information. Journal of Academy of Marketing Science, 27(2):207-225.
Moon, S. & Voss, G. 2009. How do price range shoppers differ from reference point shoppers. Journal of Business Research, 62:31-38.

241
Moore, M., McGowan Kennedy, K. & Farihurst, A. 2003. Cross-cultural equivalence of price perceptions between US and Polish consumers. International Journal of Retail & Distribution Management, 31(5):268-279.
Mueller, S. & Szolnoki, G. 2010. The relative influence of packaging, labelling, branding and sensory attributes on liking and purchase intent: consumers differ in their responsiveness. Food Quality and Preference, 21:774-783.
Nagle, T. T. & Holden, R. K. 1995. The strategy and tactics of pricing. 2nd edition. Prentice Hall, New Jersey. 409 p.
Newman, P. D. 1980. Prospect theory: implications for information evaluation. Accounting, Organizations and Society, 5(2):217-230.
Niedrich, R. W., Sharma, S. & Wedell, D. H. 2001. Reference price and price perceptions: a comparison of alternative models. Journal of Consumer Research, 28(December): 339-354.
Niedrich, R. W., Weathers, R, Hill, R. C. & Bell, D. R. 2009. Specifying price judgments with range-frequency theory in models of brand choice. Journal of Marketing Research, 46(October):693-702.
Nikkilä, M., Raijas, A. & Aalto-Setälä, V. 2008. Kuluttajien käsityksiä hinnoista euroaikana. Työselosteita ja esitelmiä, 109. Kuluttajatutkimuskeskus, Helsinki. (Only in Finnish.)
Niva, M. 2007. All foods affect health: understandings of functional foods and healthy eating among health-oriented Finns. Appetite 48:384-393.
Niva, M. 2008. Consumers and the conceptual and practical appropriation of functional foods. National Consumer Research Centre. Academic dissertation 3. Helsinki. 163 p.
Nummenmaa 2004. Käyttäytymistieteiden tilastolliset menetelmät. Tammi. Vammala. 420 p.
Nwogugu, M. 2006. A further critique of cumulative prospect theory and related approaches. Applied Mathematics and Computation, 179:451-465.
Ofir, C., Raghubir, P., Brosh, G., Monroe, K. B. & Heiman, A. 2008. Memory-based store price judgments: the role of knowledge and shopping experience. Journal of Retailing, 84(4):414-423.
Ollila, S., Tuomi-Nurmi, S. & Immonen, H. 2004. Suomalaisten kuluttajien halukkuus ostaa terveysvaikutteisia elintarvikkeita. VTT Research notes 2241 (in Finnish, abstract in English). Espoo

242
Olson, M. A. & Fazio, R. H. 2009. Implicit and explicit measures of attitudes: The perspective of the MODE model. In publication: Petty, R. E., Fazio, R. H. & Brinõl, P. (eds.) 2009. Attitudes: insights from the new implicit measures. Psychology Press, New York. 19-63.
Oliveira-Castro, J. M. 2003. Effects of base price upon search behaviour of consumers in a supermarket: an operational analysis. Journal of Economic Psychology, 24:637-652.
O’Neill, R. M. & Lambert, D. R. 2001. The emotional side of price. Psychology & Marketing, 18(3):217-237.
Orbell, S. 2004. Intention-behavior relations: a self-regulation perspective. In publication: Haddock, G. & Maio, G. R. (eds.) 2004. Contemporary perspectives on the psychology of attitudes. Psychology Press. Hove. 145-168.
Oulette, J. A. & Wood, W. 1998. Habit and intention in everyday life: the multiple process by which past behavior predicts future behavior. Psychological Bulletin, 124(1):54-74.
Osgood, C. E., Suci, G. J. & Tannenbaum, P. H. 1965. The measurement of meaning. University of Illinois Pres, Urbana. 5th edition. 342 p.
Padula, G. & Busacca, B. 2005. The asymmetric impact of price-attribute performance on overall price evaluation. International Journal of Service Industry Management, 16(1):28-54.
Parduzzi, A. 1965. Category judgment: a range-frequency model. Psychological Review, 72(November):407-418.
Park, J. H. & MacLachlan, D. L. 2008. Estimating willingness to pay with exaggeration bias-corrected contingent valuation method. Marketing Science, 27(4):691-698.
Perugini, M. & Bagozzi, R. P. 2004. An alternative view of pre-volitional process in decision making: conceptual issues and empirical evidence. In publication: Haddock, G. & Maio, G. R. (eds.) 2004. Contemporary perspectives on the psychology of attitudes. Psychology Press. Hove. 169-201.
Peterson, R. A. 1970. The price-perceived quality relationship: experimental evidence. Journal of Marketing Research, 7(November):525-528.
Pettit, K. L., Sawa, S. L. & Sawa, G. H. 1985. Frugality: a cross-national moderator of the price-quality relationship. Psychology & Marketing, 2(4):253-265.
Petty, R. E., Fazio, R. H. & Brinõl, P. 2009. The new implicit measures: an overview. In publication: Petty, R. E., Fazio, R. H. & Brinõl, P. (eds.) 2009. Attitudes: insights from the new implicit measures. Psychology Press, New York. 3-18.
Petty, R. E., Fazio, R. H. & Brinõl, P. (eds.) 2009. Attitudes: insights from the new implicit measures. Psychology Press, New York. 544 p.

243
Phaf, R.H. & Rotteveel, M. 2005. Affective modulation of recognition bias. Emotion, 5(3):309-318.
Pieniak, Z., Verbeke, W., Vanhonacker, F., Guerrero, L. & Hersleth, M. 2009. Association between traditional food consumption and motives for food choice in six European countries. Appetite, 53:101-108.
Pilgrim, F. J. 1957. The components of food acceptance and their measurement. American Journal of Clinical Nutrition, 5:171-175.
Pohjanheimo, T., Paasovaara, R., Luomala, H. & Sandell, M. 2010. Food choice motives and bread liking of consumers embracing hedonistic and traditional values. Appetite 54:170-180.
Pol, van der M. & Ryan, M. 1996. Using conjoint analysis to establish consumer preferences for fruits and vegetables. British Food Journal, 98(8):5-12.
Ramirez, E. & Goldsmith, R. E. 2009. Some antecedents of price sensitivity. Journal of Marketing Theory and Practice, 17(3):199-213.
Ranyard, R., Charlton, J. P. & Williamson, J. 2001. The role of the internal reference prices in consumers’ willingness to pay judgments: Thaler’s beer pricing task revisited. Acta Psychologica, 16:265-283.
Rao, A. R. & Monroe, K. B. 1988. The Moderating effect of prior knowledge on cue utilization in product evaluations. Journal of Consumer Research, 15(September):253-264.
Reardon, J., Miller, C. E. & Coe, B. 1995. Applied Scale Development: Measurement of store image. Journal of Applied Business Research. 11(4):85-93.
Rege, M. 2008. Why do people care about social status? Journal of Economic Behaviour & Organization, 66:233-242.
Reimavuo, S. 2003. Competition acts as the engine for regulation reform in Finland. In publication: Finnish Competition Authority, Yearbook 2003. Helsinki. 55-60.
Riez, P. C. 1979. Price-quality correlations for packaged food products. The Journal of Consumer Affairs, 13(2):236-247.
Robensfroid, M. B. 2002. Global view on functional foods: European perspectives. British Journal of Nutrition, 2:S133-S138.
Rohrer. J. H. & Sherif, M. (eds.) 1951. Social psychology at the crossroads. Harper & Row, New York.
Rosa-Díaz, I. M. 2004. Price knowledge: effects of consumers’ attitudes towards prices, demographiques, and sosio-cultural characteristics. Journal of Product & Brand Management, 13(6):406-428.

244
Rosengren, K. E. 1981. Advances in Scandinavian content analysis: an introduction. In publication: Rosengren, K. E. 1981 (ed.). Advances in content analysis. Sage Annual Reviews of Communication Research volume 9, Bevery Hills, California. 9-19.
Rosengren, K. E. 1981 (ed.). Advances in content analysis. Sage Annual Reviews of Communication Research volume 9. Bevery Hills, California. 283 p.
Russell, D. W. 2002. In search of underlying dimensions: the use (and abuse) of factor analysis in Personality and Social Psychology Bulletin. Personality and Social Psychology Bulletin, 28:1629-1646.
Saba, A., Vasallo, M., Shepherd, R., Lampila, P., Arvola, A., Dean, M., Winkelman, M., Claupein, E. & Lähteenmäki, L. 2010. Country-wise differences in perception of health-related messages in cereal-based products. Food Quality and Preference, 21:385-393.
Salminen, P. & Wallenius, J. 1993. Testing prospect theory in a deterministic multiple criteria decision-making environment. Decision Sciences, 24(2):279-294.
Saunders, M., Lewis, P. & Thornhill, A. 2007. Research methods for business students. 4th ed. Prentice Hall, Essex. 624 p.
Schifferstein, H. N. J., Kole, A. P. & W. Mojet, J. 1999. Asymmetry in the disconfirmation of expectations for natural yogurt. Appetite, 32:307-329.
Scitovsky, T. 1945. Some consequences of the habit of judging quality by price. Review of Economic Studies, 12(2):100-105.
Sepstrup. P. 1981. Methodological developments in content analysis. In publication: Rosengren, K. E. 1981 (ed.). Advances in content analysis. Sage Annual Reviews of Communication Research volume 9. Bevery Hills, California.133-158 .
Sherif, C. 1963. Social categorization as a function of latitude acceptance and series range. Journal of Abnormal and Social Psychology, 67(2):148-156.
Silverman, D. 1993. Interpreting qualitative data: methods for analyzing talk, text, and interaction. Sage publication. London. 224 p.
Sinha, P. K. & Uniyal, D. P. 2005. Using observational research for behavioural segmentation of shoppers. Journal of Retailing and Consumer Services, 12:35-48.
Siró, I., Kápolna, E., Kápolna, B. & Lugasi, A. 2008. Functional food. Product development, marketing and consumer acceptance – a review. Appetite 51:456-467.
Smith, J. L. 1999. An agentic psychology model based on the paradigmatic repositioning of the theory of planned behavior. Theory & Psychology, 9(5):679-700.

245
Solheim, R. & Lawless, H. T. 1996. Consumer purchase probability affected by attitude towards low-fat foods, liking, private body consciousness and information on fat and price. Food Quality and Preference, 7(2):137-143.
Stapel, J. 1972. “Fair” or “psychological” pricing? Journal of Marketing Research, 9(February): 109-110.
Steenkamp, J-B. E. M. 1997. Dynamics in consumer behavior with respect to agricultural and food products. In publication: Wierenga et al. (eds) 1997. Agricultural marketing and consumer behavior in changing world. Kluwert Academic Publishers. Dordrecht, The Netherlands. 143-188.
Steenkamp, J-B. & van Trijp, H.C. M. 1989. A methodology for estimating the maximum price consumers are willing to pay in relation to perceived quality and consumer characteristics. Journal of International Food & Agribusiness Marketing, 1(2):7-24.
Steptoe, A., Pollard, T. M. & Wardle, J. 1995. Development of a measure of the motives underlying the selection of food: the food choice questionnaire. Appetite, 25:267-284.
Sternquist, B., Brend, S. B. & Jin B. 2004. The dimensionality of price perceptions: a cross-cultural comparison of Asian consumers. International Review of Retail, Distribution & Consumer Research, 14(1):83-100.
Storbeck, J., Robinson, M. D. & McCourt, M. E. 2006. Semantic processing precedes affect retrieval: the neurological case for cognitive primacy in visual processing. Review of General Psychology, 10(1):41-55.
Stoetzel, J. 1969. Psychological/sociological aspects of price. In publication: Taylor, B. & Wills, G. (eds.) 1969. Pricing strategy. Stables Press Ltd, London. 70-74.
Stratton, P. & Bromley, K. 1999. Families’ accounts of the causal processes in food choice. Appetite 33:89-108.
Swinyard, W. R. & Whitlark, D. B. 1994. The effect of customer dissatisfaction on store repurchase intentions: a little goes a long way. International Review of Retail Distribution and Consumer Research, 4(3):329-344.
Tarkiainen, A. & Sundqvist, S. 2005. Subjective norms, attitudes and intentions of Finnish consumers in buying organic food. British Food Journal, 107(11):808-822.
Taylor, B. & Wills, G. (eds.) 1969. Pricing strategy. Stables Press Ltd, London. 565 p.
Tellis, G. J. & Gaeth, G. J. 1990. Best value, price-seeking, and price aversion: the impact of information and learning on consumer choices. Journal of Marketing, 54(2):34-45.
Thaler, R. H. 1985. Mental accounting and consumer choice. Marketing Science, 4(3):199-214.

246
Thaler, R. H. 1999. Mental accounting matters. Journal of Behavioral Decision Making, 12:183-206.
Thaler, R. H. 2008. Mental accounting and consumer choice: anatomy of failure. Marketing Science, 27(1):12-14.
Thurstone L. L. 1931. The measurement of social attitudes. Journal of Abnormal and Social Psychology, 26:249-269.
Trafimow, D. & Sheeran, P. 2004. A theory about the translation of cognition into affect and behavior. In publication: Haddock, G. & Maio, G. R. (eds.) 2004. Contemporary perspectives on the psychology of attitudes. Psychology Press. Hove. 57-76.
Tresselt, M. E. & Volkmann, J. 1942. The production of uniform opinion by non-social stimulation. The Journal of Abnormal & Social Psychology, 37(2):234-243.
Tull, D. S., Boring, R.A. & Gonsior, M. H. 1969. The relationship of price and imputed quality. In publication: Taylor, B. & Wills, G. (eds.) 1969. Pricing strategy. Stables Press Ltd, London. 44-49.
Tuomi, J. & Sarajärvi, A. 2002. Laadullinen tutkimus ja sisällönanalyysi. Tammi. Helsinki. 159 p.
Tuorila, H., Huotilainen, A., Lähteenmäki, L., Ollila, S., Tuomi-Nurmi, S. & Urala, N. 2008. Comparison of affective rating scales and their relationship to variables reflecting food consumption. Food Quality and Preference, 19:51-61.
Tversky, A. & Kahneman, D. 1986. Rational choice and the framing decisions. Journal of Business, 56(4):S251-S278.
Urala, N. & Lähteenmäki, L. 2003. Reasons behind consumers’ functional food choices. Nutrition & Food Science 33(4):148-158.
Urala, N. 2005. Functional foods in Finland: consumers’ views, attitudes and willingness to use. Technical Research Centre of Finland. VTT publications 581. Helsinki.
Urbany, J. E., Dickson, P. R. & Wilkie, W. L. 1989. Buyer uncertainty and information search. Journal of Consumer Research, 16(September):208-215.
Urbany, J. E. & Dickson, P. R. 1990. Prospect theory and pricing decisions. Journal of Behavioral Economics, 19(1):69-80.
Urbany, J. E. & Bearden, W. O. 1997. Transaction utility effects when quality is uncertain. Journal of Academy of Marketing Science, 25(1):45-55.
Verbeke, W. & Vackier, I. 2005. Individual determinants of fish consumption: application of the theory of planned behaviour. Appetite, 44:67-82.

247
Verschuren, P. M. 2002. Functional foods – scientific and global perspectives. Summary reports of an international symposium held in October 2001, Paris, France. ILSI Europe Report Series.
Vlaev, I., Chater, N., Lewis, R. & Davies, G. 2009. Reason-based judgements: using reasons to decouple perceived price-quality correlations. Journal of Economic Psychology, 30:721-731.
Volkmann, J. 1951. Scales of judgment and their implications for social psychology. In publication: Rohrer. J. H. & Sherif, M. (eds.) 1951. Social Psychology at the crossroads. Harper & Row, New York. 273-294.
Warlop, L., Ratneshwar, S. & van Osselaer, S. M. J. 2005. Distinctive brand cues and memory for product consumption experiences. International of Research Marketing, 22:27-44.
Webb, T. L. & Sheeran P. 2006. Does changing behavioral intentions engender behavior change? A meta-analysis of the experimental evidence. Psychological Bulletin, 132(2):249-268.
Webber, C. B., Sobal, J. & Dollahite, J. S. 2010. Shopping for fruits and vegetables. Food and retail qualities of importance to low-income households at the grocery store. Appetite, 54:297-303.
Weber, B., Aholt, A., Neuhaus, C., Trautner, P., Elger, C. E. & Teichert, T. 2007. Neural evidence for reference-dependence in real-market-transactions. NeuroImage, 35:441-447.
Weber, E. U. & Johnson, E. J. 2009. Mindful judgment and decision making. Annual Review of Psychology, 60:53-85.
Wegener, D. T., Petty, R. E., Blankenship, K. L. & Detweiler-Bedell, B. 2010. Elaboration and numerical anchoring: implications of attitude theories for consumer judgment and decision making. Journal of Consumer Psychology, 20:5-16.
Westendorp van, P. H. 1976. NSS - Price sensitivity meter - a new approach to study consumer perception of prices. E.S.O.M.A.R. congress proceedings 5th-9th September, Venice.
Wicker, F. W. & Hamman, D. 1995. Studies of loss aversion and perceived necessity. Journal of Psychology, 129(1):75-89.
Wierenga, B., Tilburg van, A., Grunert, K., Steenkamp, J-B. E. M. & Wedel M. (eds) 1997. Agricultural marketing and consumer behavior in changing world. Kluwert Academic Publishers. Dordrecht, The Netherlands. 314 p.
Wierenga, B. 1982. Model and measurement methodology for the analysis of consumer choice of food products. Journal of Food Quality, 6:119-137.
248
Wilson, T.D. & Schooler, J. W. 1991. Thinking too much: Introspection can reduce the quality of preferences and decisions. Journal of Personality and Social Psychology, 60(2):181-192.
Wind, Y. & Greenberg, M. G. (eds.) 1977. Moving a head with attitude research. American Marketing Association. Chicago. 201 p.
Winer, R. S. 1999. Experimentation in 21st century: the importance of external validity. Journal of the Academy of Marketing Science, 27(3):349-358.
Wittink, D. R. & Cattin, P. 1989. Commercial use of conjoint analysis: an update. Journal of Marketing, 53(July):91-96.
Woodside, A. G. 1974. Relation of price to perception of quality of new products. Journal of Applied Psychology, 59(1):116-118.
Xia, L. 2003. Consumers’ judgments of numerical and price information. Journal of Product and Brand Management, 12(5):275-292.
Xia, L. & Monroe, K. B. 2010. Is a good deal always fair? Examining the concepts of transaction value and price fairness. Journal of Economic Psychology, 31(6):884-894.
Yang, B. & Lester, D. 2008. Reflections on rational choice – the existence of systematic irrationality. The Journal of Socio-Economic, 37:1218-1233.
Yadav, M. S. & Seiders, K. 1998. Is the price right? Understanding contingent processing in reference price formation. Journal of Retailing, 74(3):311-329.
Yin, T. & Paswan, A. K. 2007. Antecedents to consumer reference price orientation: an exploratory investigation. Journal of Product & Brand Management, 16(4):269-279.
Zaichkowsky, J. L. 1985. Measuring the involvement construct. Journal of Consumer Research, 12(3):341-352.
Zajonc, R. B. & Markus, H. 1982. Affective and cognitive factors in preferences. Journal of Consumer Research, 9:123-131.
Zeithaml, V. A. 1988. Consumer perceptions of price, quality, and value: a means-end model and synthesis of evidence. Journal of Marketing, 52(July):2-22.
Zhou, Z. & Nakamoto, K. 2001. Price perceptions: a cross-national study between American and Chinese young consumers. Advances in Consumer Research, 28(1):161-168.
Ölander, F. 1969. The influence of price on the consumer’s evaluation of products and purchases. In publication: Taylor, B. & Wills, G. (eds.) 1969. Pricing strategy. Stables Press Ltd, London. 50-69.
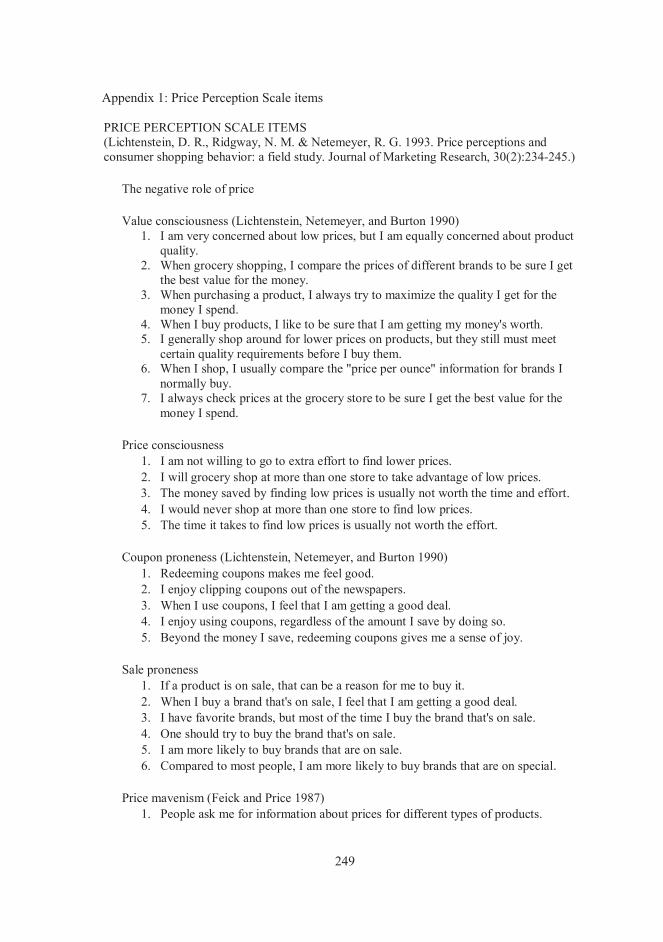
249
PRICE PERCEPTION SCALE ITEMS (Lichtenstein, D. R., Ridgway, N. M. & Netemeyer, R. G. 1993. Price perceptions and consumer shopping behavior: a field study. Journal of Marketing Research, 30(2):234-245.)
The negative role of price
Value consciousness (Lichtenstein, Netemeyer, and Burton 1990) 1. I am very concerned about low prices, but I am equally concerned about product
quality. 2. When grocery shopping, I compare the prices of different brands to be sure I get
the best value for the money. 3. When purchasing a product, I always try to maximize the quality I get for the
money I spend. 4. When I buy products, I like to be sure that I am getting my money's worth. 5. I generally shop around for lower prices on products, but they still must meet
certain quality requirements before I buy them. 6. When I shop, I usually compare the "price per ounce" information for brands I
normally buy. 7. I always check prices at the grocery store to be sure I get the best value for the
money I spend.
Price consciousness 1. I am not willing to go to extra effort to find lower prices. 2. I will grocery shop at more than one store to take advantage of low prices. 3. The money saved by finding low prices is usually not worth the time and effort. 4. I would never shop at more than one store to find low prices. 5. The time it takes to find low prices is usually not worth the effort.
Coupon proneness (Lichtenstein, Netemeyer, and Burton 1990) 1. Redeeming coupons makes me feel good. 2. I enjoy clipping coupons out of the newspapers. 3. When I use coupons, I feel that I am getting a good deal. 4. I enjoy using coupons, regardless of the amount I save by doing so. 5. Beyond the money I save, redeeming coupons gives me a sense of joy.
Sale proneness 1. If a product is on sale, that can be a reason for me to buy it. 2. When I buy a brand that's on sale, I feel that I am getting a good deal. 3. I have favorite brands, but most of the time I buy the brand that's on sale. 4. One should try to buy the brand that's on sale. 5. I am more likely to buy brands that are on sale. 6. Compared to most people, I am more likely to buy brands that are on special.
Price mavenism (Feick and Price 1987) 1. People ask me for information about prices for different types of products.
Appendix 1: Price Perception Scale items
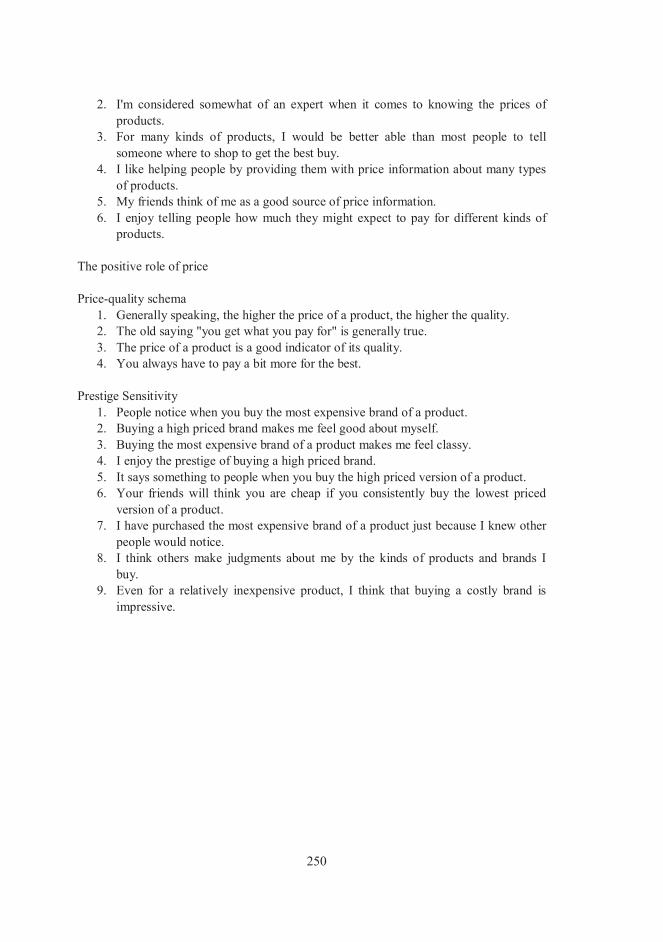
250
2. I'm considered somewhat of an expert when it comes to knowing the prices of products.
3. For many kinds of products, I would be better able than most people to tell someone where to shop to get the best buy.
4. I like helping people by providing them with price information about many types of products.
5. My friends think of me as a good source of price information. 6. I enjoy telling people how much they might expect to pay for different kinds of
products.
The positive role of price
Price-quality schema 1. Generally speaking, the higher the price of a product, the higher the quality. 2. The old saying "you get what you pay for" is generally true. 3. The price of a product is a good indicator of its quality. 4. You always have to pay a bit more for the best.
Prestige Sensitivity 1. People notice when you buy the most expensive brand of a product. 2. Buying a high priced brand makes me feel good about myself. 3. Buying the most expensive brand of a product makes me feel classy. 4. I enjoy the prestige of buying a high priced brand. 5. It says something to people when you buy the high priced version of a product. 6. Your friends will think you are cheap if you consistently buy the lowest priced
version of a product. 7. I have purchased the most expensive brand of a product just because I knew other
people would notice. 8. I think others make judgments about me by the kinds of products and brands I
buy. 9. Even for a relatively inexpensive product, I think that buying a costly brand is
impressive.
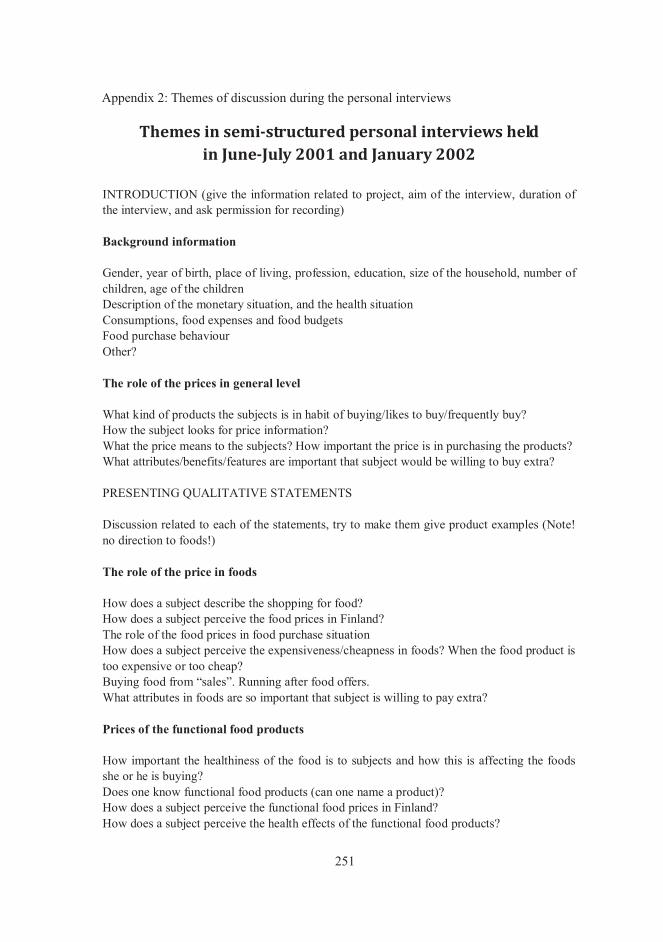
251
Themes in semi-structured personal interviews held in June-July 2001 and January 2002
INTRODUCTION (give the information related to project, aim of the interview, duration of the interview, and ask permission for recording)
Background information
Gender, year of birth, place of living, profession, education, size of the household, number of children, age of the children Description of the monetary situation, and the health situation Consumptions, food expenses and food budgets Food purchase behaviour Other?
The role of the prices in general level
What kind of products the subjects is in habit of buying/likes to buy/frequently buy? How the subject looks for price information? What the price means to the subjects? How important the price is in purchasing the products? What attributes/benefits/features are important that subject would be willing to buy extra?
PRESENTING QUALITATIVE STATEMENTS
Discussion related to each of the statements, try to make them give product examples (Note! no direction to foods!)
The role of the price in foods
How does a subject describe the shopping for food? How does a subject perceive the food prices in Finland? The role of the food prices in food purchase situation How does a subject perceive the expensiveness/cheapness in foods? When the food product is too expensive or too cheap? Buying food from “sales”. Running after food offers. What attributes in foods are so important that subject is willing to pay extra?
Prices of the functional food products
How important the healthiness of the food is to subjects and how this is affecting the foods she or he is buying? Does one know functional food products (can one name a product)? How does a subject perceive the functional food prices in Finland? How does a subject perceive the health effects of the functional food products?
Appendix 2: Themes of discussion during the personal interviews
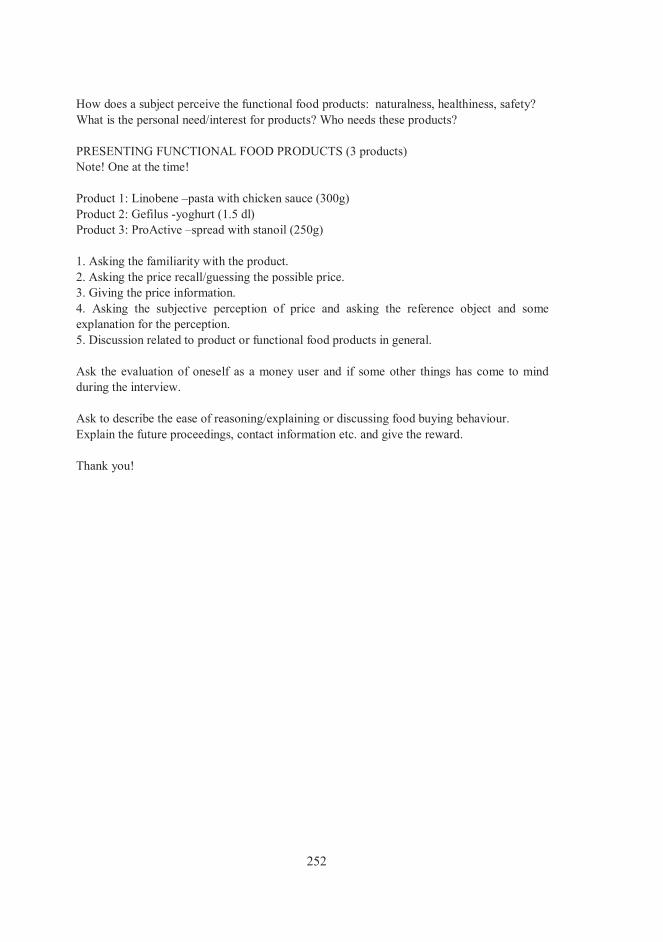
252
How does a subject perceive the functional food products: naturalness, healthiness, safety? What is the personal need/interest for products? Who needs these products?
PRESENTING FUNCTIONAL FOOD PRODUCTS (3 products) Note! One at the time!
Product 1: Linobene –pasta with chicken sauce (300g) Product 2: Gefilus -yoghurt (1.5 dl) Product 3: ProActive –spread with stanoil (250g)
1. Asking the familiarity with the product. 2. Asking the price recall/guessing the possible price. 3. Giving the price information. 4. Asking the subjective perception of price and asking the reference object and some explanation for the perception. 5. Discussion related to product or functional food products in general.
Ask the evaluation of oneself as a money user and if some other things has come to mind during the interview.
Ask to describe the ease of reasoning/explaining or discussing food buying behaviour. Explain the future proceedings, contact information etc. and give the reward.
Thank you!

253
Frequencies of background variables in Survey samples 2001, 2002, 2004a and 2004b
Gender 2001 2002 2004a 2004bwomen 657 651 637 587men 484 504 454 440missing 17 1 22 0total 1158 1156 1113 1027
Age groups 2001 2002 2004a 2004b15-29 235 232 145 16130-39 210 226 163 18340-49 252 252 223 16850-59 194 203 200 16760-80 210 243 293 235missing 57 0 89 113total 1158 1156 1113 1027
Occupational group/profession 2001 2002 2004a 2004bexecutive or business owner 104 105 130 108managerial official 96 114 104 0official 173 163 145 236worker 286 294 246 242pensioner 233 256 299 260student 109 114 87 77non-working 113 109 88 87missing 44 1 14 17total 1158 1156 1113 1027
Highest education level 2001 2002 2004a 2004bbasic education and grammar school 249 283 261 209Vocational school 304 296 249 288
Matriculation examination 116 124 101 113
College degree 277 269 263 194
Lower academic degeree 96 86 104 84
Higher academic degree 99 95 122 122
missing 17 3 13 17total 1158 1156 1113 1027
Place of living 2001 2002 2004a 2004bMetropolitan area - 205 211 220Large city (>40 000 citizens) - 304 304 242Town or minor city (< 40 000 citizens) - 440 361 349Countryside/rural area - 204 229 216missing - 3 8 0total - 1156 1113 1027
Appendix 3: Frequencies of background variables in the survey samples in 2001, 2002, 2004a, and 2004b
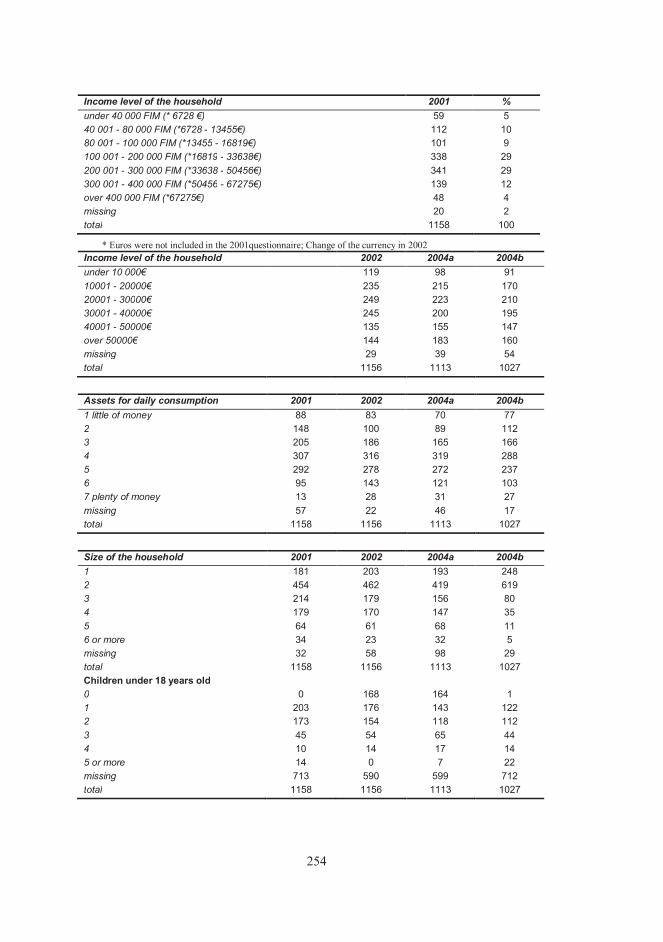
254
Income level of the household 2001 %under 40 000 FIM (* 6728 €) 59 540 001 - 80 000 FIM (*6728 - 13455€) 112 1080 001 - 100 000 FIM (*13455 - 16819€) 101 9100 001 - 200 000 FIM (*16819 - 33638€) 338 29200 001 - 300 000 FIM (*33638 - 50456€) 341 29300 001 - 400 000 FIM (*50456 - 67275€) 139 12over 400 000 FIM (*67275€) 48 4missing 20 2total 1158 100
* Euros were not included in the 2001questionnaire; Change of the currency in 2002 Income level of the household 2002 2004a 2004bunder 10 000€ 119 98 9110001 - 20000€ 235 215 17020001 - 30000€ 249 223 21030001 - 40000€ 245 200 19540001 - 50000€ 135 155 147over 50000€ 144 183 160missing 29 39 54total 1156 1113 1027
Assets for daily consumption 2001 2002 2004a 2004b1 little of money 88 83 70 772 148 100 89 1123 205 186 165 1664 307 316 319 2885 292 278 272 2376 95 143 121 1037 plenty of money 13 28 31 27missing 57 22 46 17total 1158 1156 1113 1027
Size of the household 2001 2002 2004a 2004b1 181 203 193 2482 454 462 419 6193 214 179 156 804 179 170 147 355 64 61 68 116 or more 34 23 32 5missing 32 58 98 29total 1158 1156 1113 1027Children under 18 years old0 0 168 164 11 203 176 143 1222 173 154 118 1123 45 54 65 444 10 14 17 145 or more 14 0 7 22missing 713 590 599 712total 1158 1156 1113 1027

255
Food survey 2002
Questions are translated from Finnish by the author. Original questions used in this study were presented in Finnish in this order and are available from the author by request.
Following statements are related to buying food products and the food prices.
1. Evaluate how well the statements correspond to your opinions. If you can’t say whether you agree or disagree with the statements, please, answer 4 from the scale. Please, answer all statements.
1totally
disagree
2almost
disagree
3totally
disagree
4neither
disagree nor
agree
5slightly agree
6almostagree
7totally agree
EHV2 When shopping for food comparing prices is a waste of time.
1 2 3 4 5 6 7
EHA1 I think one should treat guests to more expensive food than used normally.
1 2 3 4 5 6 7
EHH2r I seldom choose the cheapest alternative of food products.
1 2 3 4 5 6 7
EHL3 Generally in foods the higher the price the better the quality.
1 2 3 4 5 6 7
EHT1r If a food product is on offer, I buy it even if I usually buy another brand.
1 2 3 4 5 6 7
EHA5 It is more recognized if you buy food from the luxury store than from the bargain store.
1 2 3 4 5 6 7
EHV1r When I shop for food, I usually compare different brands in order to get my money's worth.
1 2 3 4 5 6 7
EHA2r Occasionally, I indulge myself and my family (or friends) with premium -priced foods.
1 2 3 4 5 6 7
EHL4r The cheaper brand in foods is of equally good quality than the premium brand.
1 2 3 4 5 6 7
EHT2r In my opinion I use a lot of food offers.
1 2 3 4 5 6 7
EHH1r I shop for food at more than one store to take advantage of low prices.
1 2 3 4 5 6 7
EHH3r I try to buy food at the lowest possible price.
1 2 3 4 5 6 7
Appendix 4: Food survey questions in 2002

256
EHA3r Treating guests with high-priced food products is snobbery.
1 2 3 4 5 6 7
EHT3 I seldom follow the ads for food offers.
1 2 3 4 5 6 7
EHL2 I usually buy more expensive food products because they are of good quality.
1 2 3 4 5 6 7
EHA4r I don’t value premium brands in foods.
1 2 3 4 5 6 7
EHL1 When I shop for food I require the best possible quality and I am ready to pay a higher price for it.
1 2 3 4 5 6 7
EHV3 I check food prices carefully to be sure I get the best value for my money.
1 2 3 4 5 6 7
In the following part, we ask you to consider the situation in which you buy food for daily use. Imagine that you are choosing between two similar food products with different prices.
2. Evaluate how willing you would be to buy the more expensive food product based on several product benefits.
1not
willing at all
2 3 4 5 6 7extremely
willing
Taste: a higher-priced product would taste better.
1 2 3 4 5 6 7
Ingredients: higher quality ingredients are used to make a higher-priced product.
1 2 3 4 5 6 7
Familiarity: a higher-priced product would be more familiar to me meaning that I have prior experience or I have heard someone else’s experiences.
1 2 3 4 5 6 7
Naturalness: a higher-priced product would feel more natural food product to me.
1 2 3 4 5 6 7
Modern technology: in manufacturing a higher-priced food product the modern technology is used.
1 2 3 4 5 6 7
Speciality: a higher-priced food product would be clearly more special.
1 2 3 4 5 6 7
Health effect: a higher-priced food product would have a health claim.
1 2 3 4 5 6 7

257
Background information from the questionnaire 2002 used in this thesis
I am a)woman b)man
Year of birth …..
Do you live mainly in…?
HelsinkimetropolitanareaLargecityortown(>40000citizens)Smalltown(<40000citizens)Countryside
Where do you live ordinarily?
CountyofSouthernFinlandCountyofWesternFinlandCountyofEasternFinlandCountyofOuluCountyofLapland
Your highest education level:
Basiceducation(perus-taikansakoulu)Grammarschool(keskikoulu)Vocationalschool(ammatillinenkoulu)Matriculationexamination(ylioppilastutkinto)Collegedegree(opistotasontutkinto)Loweracademicdegeree(alempikorkeakoulututkinto)Degreeofappliedscience(ammattikorkeakoulututkinto)Higheracademicdegree(ylempikorkeakoulututkinto)
Occupational group you belong to:
ExecutivepersonnelManagerialofficersLowerlevelofficersWorkingpersonnelEntrepreneurorapersonpractisingaprofessionStudentUnemployedPensionerFull-timemotherorfather

258
Note! Following questions concern your household.
In our household there are ……. persons of which children under 18 years old ……..
How would you evaluate the disposable assets of your household for daily consumption?
Wehavelittleofmoney.1234567Wehaveplentyofmoney.
Evaluate the taxable income level of your household (e.g. under year 2001)
under10000€10001–20000€20001–30000€30001–40000€40001–50000€over50001€

259
The Food Price Attitude statements in the survey questionnaire in 2004a
Questions are translated from Finnish by the author and are available from the author by request.
Following statements are related to buying food products and the food prices. 1. Evaluate how well the statements correspond to your opinions. If you can’t say whether
you agree or disagree with the statements, please, answer 4 from the scale. Please, answer to all statements.
1totally
disagree
2almost
disagree
3totally
disagree
4neither
disagree nor
agree
5slightly agree
6almostagree
7totally agree
EHV2 When shopping for food comparing prices is a waste of time.
1 2 3 4 5 6 7
EHL1 When I shop for food I require the best possible quality and I am ready to pay a higher price for it.
1 2 3 4 5 6 7
EHA1 I think one should treat guests to more expensive food than used normally.
1 2 3 4 5 6 7
EHT2r In my opinion I use a lot of food offers.
1 2 3 4 5 6 7
EHH2r I seldom choose the cheapest alternative of food products.
1 2 3 4 5 6 7
EHL3 Generally in foods the higher the price the better the quality.
1 2 3 4 5 6 7
EHV1r When I shop for food, I usually compare different brands in order to get my money's worth.
1 2 3 4 5 6 7
EHL4r The cheaper brand in foods is of equally good quality than the premium brand.
1 2 3 4 5 6 7
EHH1r I shop for food at more than one store to take advantage of low prices.
1 2 3 4 5 6 7
EHA3r Treating guests with high-priced food products is snobbery.
1 2 3 4 5 6 7
EHH3r I try to buy food at the lowest possible price.
1 2 3 4 5 6 7
EHT3 I seldom follow the ads for food offers.
1 2 3 4 5 6 7
EHL2 I usually buy more expensive food products because they are of good quality.
1 2 3 4 5 6 7
EHV3 I check food prices carefully to be sure I get the best value for my money.
1 2 3 4 5 6 7
Appendix 5: The Food Price Attitude statements in the survey 2004a

260
Food survey questionnaire 2004b, variables used in this thesis
Questions are translated by the author and are available in Finnish from the author by request.
The statements of the Food Price Attitude scale were the same as in the survey 2004a (see Appendix 5).
Snack food product presented in the questionnaire (due to agreement with the manufacturing company the product details are not published here):
Product description: “Ready to use” snack product. Can be enjoyed chilled or in roomtemperature.Packagesize:2.5dlCountryofmanufacturing:FinlandFreeinlactoseandgluten.Ingredientsandnutritionalcontent:[not published here]
Assuming that you are willing to buy this product…
1. Atwhatpricewouldyoubewillingtotrythisproduct?_______eur_______cnt
2. Atwhatpricewouldyoubewillingtobuythisproductregularly?______eur______cnt
Background information
Background questions were the same as in the survey 2002 (see Appendix 2).
Appendix 6: Food survey questions in 2004b

261
Comparisons of some background variables between food price attitude segments
Age groups of the subjects within the attitude groups
22 %
12 %
25 %
13 %
22 %
16 %
21 %
24 %
18 %17 % 18 %
21 %21 % 21 %
13 %
19 %
12 %
27 %
21 %
18 %
6 %7 %
2 %
5 %
0 %
5 %
10 %
15 %
20 %
25 %
30 %
Group 1 Group 2 Group 3 Group 4
15-29
30-39
40-49
50-59
60-69
over 70
22 %19 %
16 %
24 %23 %
18 %
15 %
23 %22 % 22 % 22 % 22 %
17 %16 %
21 %
17 %17 %
25 %27 %
14 %
0 %
5 %
10 %
15 %
20 %
25 %
30 %
Group 1 Group 2 Group 3 Group 4
15-29
30-39
40-49
50-59
60-78
2002 (n=1156)
17 %
11 %
17 %
10 %
17 %
9 %
17 %
19 %
22 %
17 %
23 % 23 %
17 %
20 %
17 %
25 %
18 %
26 %
18 %
15 %
9 %
18 %
8 %7 %
0 %
5 %
10 %
15 %
20 %
25 %
30 %
Group 1 Group 2 Group 3 Group 4
15-29
30-39
40-49
50-59
60-69
70-80
2004a (n=1024)
2004b (n=746)
Appendix 7: Comparisons between the segmented groups based on the age groups, education, profession, income level, and assets for daily use

262
The highest education level of the subjects
2002 (n=1153)
2004a (n=1100)
2004b (n=812)
23 %28 % 28 %
18 %
60 %64 %
51 %
63 %
17 %
8 %
21 % 19 %
0 %
10 %
20 %
30 %
40 %
50 %
60 %
70 %
Group 1 Group 2 Group 3 Group 4
basic education
intermedian grades
higher education
25 %
34 %
20 % 19 %
58 %53 %
57 %53 %
17 %13 %
23 %27 %
0 %
10 %
20 %
30 %
40 %
50 %
60 %
70 %
Group 1 Group 2 Group 3 Group 4
basic education
intermedian grades
higher education
24 % 22 %16 %
13 %
60 %63 % 65 %
53 %
16 % 15 %19 %
33 %
0 %
10 %
20 %
30 %
40 %
50 %
60 %
70 %
Group 1 Group 2 Group 3 Group 4
basic education
intermedian grades
higher education
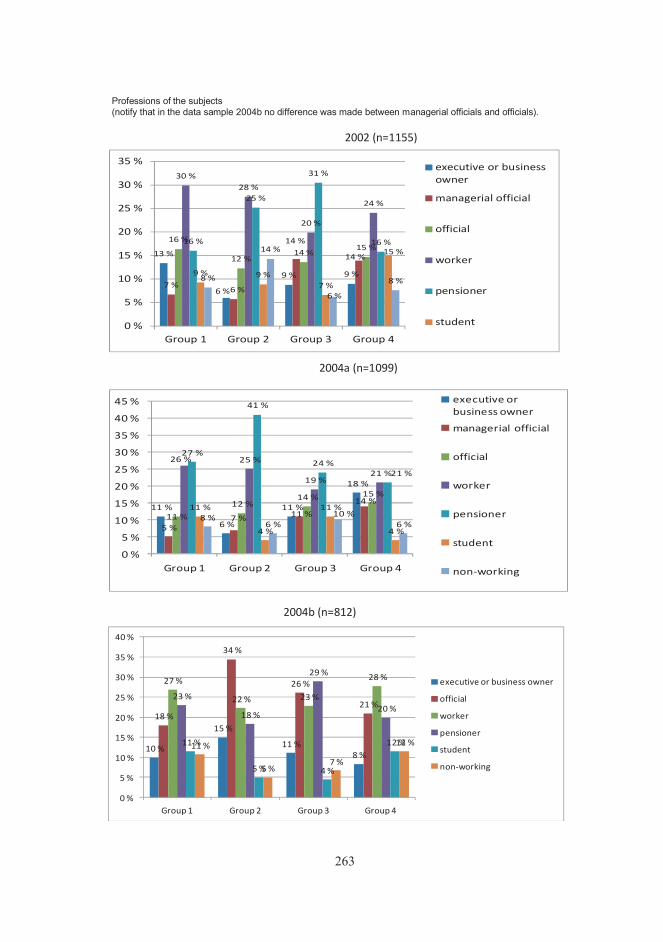
263
13 %
6 %
9 % 9 %7 % 6 %
14 %
14 %
16 %
12 %14 %
15 %
30 %28 %
20 %
24 %
16 %
25 %
31 %
16 %
9 % 9 %7 %
15 %
8 %
14 %
6 %
8 %
0 %
5 %
10 %
15 %
20 %
25 %
30 %
35 %
Group 1 Group 2 Group 3 Group 4
executive or business owner
managerial official
official
worker
pensioner
student
Professions of the subjects (notify that in the data sample 2004b no difference was made between managerial officials and officials).
2002 (n=1155)
2004a (n=1099)
10 %
15 %
11 %8 %
18 %
34 %
26 %
21 %
27 %
22 % 23 %
28 %
23 %
18 %
29 %
20 %
11 %
5 % 4 %
12 %11 %
5 %7 %
12 %
0 %
5 %
10 %
15 %
20 %
25 %
30 %
35 %
40 %
Group 1 Group 2 Group 3 Group 4
executive or business owner
official
worker
pensioner
student
non-working
2004b (n=812)
11 %
6 %
11 %
18 %
5 %7 % 11 %
14 %
11 %
12 %14 % 15 %
26 % 25 %
19 %21 %
27 %
41 %
24 %21 %
11 %
4 %
11 %
4 %
8 %6 %
10 %6 %
0 %
5 %
10 %
15 %
20 %
25 %
30 %
35 %
40 %
45 %
Group 1 Group 2 Group 3 Group 4
executive or business owner
managerial official
official
worker
pensioner
student
non-working

264
9 %
14 %
9 %
4 %
25 % 25 %
16 %
18 %
20 %19 %
23 %
19 %
24 %
18 % 18 %
15 %
11 %
14 % 15 %17 %
11 % 10 %
19 %
26 %
0 %
5 %
10 %
15 %
20 %
25 %
30 %
Group 1 Group 2 Group 3 Group 4
under 10000€
10001-20000€
20001-30000€
30001-40000€
40001-50000€
over 50000€
Income level of household
2002 (n=1127)
2004a (n=1074)
2004b (n=783)
10 %
13 %
7 %
11 %
18 %
28 %
19 %17 %
22 %
26 %
17 %
21 %23 %
17 %
25 %
23 %
12 %10 %
15 %
12 %
16 %
6 %
17 %15 %
0 %
5 %
10 %
15 %
20 %
25 %
30 %
Group 1 Group 2 Group 3 Group 4
under 10 000€
10001-20000€
20001-30000€
30001-40000€
40001-50000€
over 50000€
9 %10 %
12 %
5 %
20 %
15 %
18 %
12 %
23 %
26 %
19 %20 %
21 % 21 %
25 %
19 %19 %
14 %
16 %
12 %
10 %
15 %
10 %
32 %
0 %
5 %
10 %
15 %
20 %
25 %
30 %
35 %
Group 1 Group 2 Group 3 Group 4
under 10000€
10001-20000€
20001-30000€
30001-40000€
40001-50000€
over 50000€

265
Assets for daily use; Likert-type scale 1-7 (1= We have little of money, 7= We have plenty of money)
2002 (n=1134)
2004a (n=1067)
2004b (n=812)
28 %
47 %
20 %
31 %31 %28 % 29 %
24 %
41 %
25 %
51 %
45 %
0 %
10 %
20 %
30 %
40 %
50 %
60 %
Group 1 Group 2 Group 3 Group 4
1-3
4
5-7
43 %
33 %
41 %
16 %
28 %
34 %
28 %23 %
29 %
34 %31 %
61 %
0 %
10 %
20 %
30 %
40 %
50 %
60 %
70 %
Group 1 Group 2 Group 3 Group 4
1-3
4
5-7
37 %
31 % 33 %
22 %
34 % 36 %
27 %24 %
29 %33 %
40 %
54 %
0 %
10 %
20 %
30 %
40 %
50 %
60 %
Group 1 Group 2 Group 3 Group 4
1-3
4
5-7

266
Results of One-way analysis of variance (data 2002) Compared means of food price attitude dimensions (sum variables) and gender: EHH means Low Food Price dimension, EHL means Food Quality and EHA means Food Prestige
Report
Gender Low Food
price Food
Quality Food
Prestige
Woman Mean 3,2188 3,3637 3,7335
N 651 651 651
Std. Deviation 1,32001 1,18966 1,68752
man Mean 3,4668 3,6286 3,7431
N 504 504 504
Std. Deviation 1,36026 1,14790 1,66741
Total Mean 3,3270 3,4793 3,7377
N 1155 1155 1155
Std. Deviation 1,34279 1,17847 1,67805
ANOVA Table
Sum of Squares df Mean Square F Sig.
EHH * Gender Between Groups (Combined) 17,479 1 17,479 9,768 ,002
Within Groups 2063,285 1153 1,789
Total 2080,764 1154
EHL * Gender Between Groups (Combined) 19,922 1 19,922 14,513 ,000
Within Groups 1582,733 1153 1,373
Total 1602,655 1154
EHA * Gender Between Groups (Combined) ,026 1 ,026 ,009 ,923
Within Groups 3249,486 1153 2,818
Total 3249,512 1154
Measures of Association
Eta Eta Squared
EHH * gender ,092 ,008EHL * gender ,111 ,012EHA * gender ,003 ,000
Appendix 8: Compared means and ANOVA results based on the food price attitude dimensions and background variables

267
Compared means of food price attitude dimensions (sum variables) and age groups: EHH means Low Food Price dimension, EHL means Food Quality and EHA means Food Prestige
Report
age groups EHH EHL EHA
15 - 29 Mean 3,4655 3,2345 3,6918
N 232 232 232
Std. Deviation 1,25016 1,16419 1,63261
30 - 39 Mean 3,4924 3,4389 3,8628
N 226 226 226
Std. Deviation 1,33442 1,10139 1,61486
40 - 49 Mean 3,3668 3,4571 3,7718
N 252 252 252
Std. Deviation 1,37975 1,19557 1,77424
50 - 59 Mean 3,2949 3,6365 3,7660
N 203 203 203
Std. Deviation 1,43211 1,25187 1,72508
60 - 78 Mean 3,0218 3,6494 3,6152
N 243 243 243
Std. Deviation 1,27674 1,14597 1,64238
Total Mean 3,3260 3,4808 3,7396
N 1156 1156 1156
Std. Deviation 1,34266 1,17904 1,67865
ANOVA Table
Sum of Squares df Mean Square F Sig.
EHH * age groups Between Groups (Combined) 33,884 4 8,471 4,760 ,001
Within Groups 2048,280 1151 1,780
Total 2082,165 1155
EHL * age groups Between Groups (Combined) 26,437 4 6,609 4,817 ,001
Within Groups 1579,176 1151 1,372
Total 1605,614 1155
EHA * age groups Between Groups (Combined) 8,124 4 2,031 ,720 ,578Within Groups 3246,501 1151 2,821
Total 3254,625 1155
Measures of Association
Eta Eta Squared
EHH * age groups ,128 ,016EHL * age groups ,128 ,016EHA * age groups ,050 ,002

268
Compared means of food price attitude dimensions (sum variables) and place of living: EHH means Low Food Price dimension, EHL means Food Quality and EHA means Food Prestige
Report
place of living EHH EHL EHA
metropolitan area Mean 3,5254 3,6449 4,0610
N 205 205 205
Std. Deviation 1,32377 1,27107 1,64345
large city (> 40 000) Mean 3,2415 3,3243 3,9276
N 304 304 304
Std. Deviation 1,34024 1,17631 1,71521
small city or town (< 40000) Mean 3,3140 3,4968 3,7420
N 440 440 440
Std. Deviation 1,31214 1,12935 1,67521
countryside Mean 3,2619 3,5176 3,1348
N 204 204 204
Std. Deviation 1,41593 1,17741 1,52652
Total Mean 3,3233 3,4814 3,7402
N 1153 1153 1153
Std. Deviation 1,34235 1,17981 1,68066
ANOVA Table
Sum of Squares df Mean Square F Sig.
EHH * place of living Between Groups (Combined) 11,215 3 3,738 2,081 ,101
Within Groups 2064,568 1149 1,797
Total 2075,783 1152
EHL * place of living Between Groups (Combined) 13,350 3 4,450 3,215 ,022
Within Groups 1590,179 1149 1,384
Total 1603,529 1152
EHA * place of living Between Groups (Combined) 106,542 3 35,514 12,965 ,000
Within Groups 3147,411 1149 2,739
Total 3253,953 1152
Measures of Association
Eta Eta Squared
EHH * place of living ,074 ,005EHL * place of living ,091 ,008EHA * place of living ,181 ,033

269
Compared means of food price attitude dimensions (sum variables) and education: EHH means Low Food Price dimension, EHL means Food Quality and EHA means Food Prestige
Report
highest education level EHH EHL EHA
basic educaton Mean 3,1304 3,4774 3,4587
N 230 230 230
Std. Deviation 1,35783 1,15646 1,65318
grammar school Mean 3,0027 3,7132 3,9623
N 53 53 53
Std. Deviation 1,50809 1,27913 1,71769
vocational school Mean 3,2365 3,3689 3,3311
N 296 296 296
Std. Deviation 1,33383 1,17919 1,62924
matriculation examination Mean 3,4309 3,3516 4,0484
N 124 124 124
Std. Deviation 1,18827 1,16462 1,60970
college degree Mean 3,3771 3,4387 3,8253
N 269 269 269
Std. Deviation 1,33237 1,18712 1,65244
Lower academic degree Mean 3,2747 3,5333 3,6667
N 39 39 39
Std. Deviation 1,42382 1,26602 1,71039
applied science degree Mean 3,6930 3,5362 4,0213
N 47 47 47
Std. Deviation 1,29875 1,01305 1,66472
higher academic degree Mean 3,8226 3,8821 4,7895
N 95 95 95
Std. Deviation 1,30411 1,08862 1,46698
Total Mean 3,3265 3,4755 3,7376
N 1153 1153 1153
Std. Deviation 1,34302 1,17489 1,67870
ANOVA Table
Sum of Squares df Mean Square F Sig.
EHH * highest education level
Between Groups (Combined) 48,630 7 6,947 3,920 ,000
Within Groups 2029,229 1145 1,772
Total 2077,860 1152
EHL * highest education level
Between Groups (Combined) 24,636 7 3,519 2,574 ,012
Within Groups 1565,560 1145 1,367
Total 1590,195 1152
EHA * highest education level
Between Groups (Combined) 192,618 7 27,517 10,317 ,000
Within Groups 3053,769 1145 2,667
Total 3246,386 1152
Measures of Association
Eta Eta Squared
EHH * highest education level ,204 ,042EHL * highest education level ,176 ,031EHA * highest education level ,181 ,033

270
Compared means of food price attitude dimensions (sum variables) and profession: EHH means Low Food Price dimension, EHL means Food Quality and EHA means Food Prestige
Report
occupational group EHH EHL EHA
executive personnel Mean 4,2414 4,0966 4,3276
N 29 29 29
Std. Deviation 1,36122 1,26222 1,67586
managerial officers Mean 3,5764 3,6754 4,3991
N 114 114 114
Std. Deviation 1,20275 1,10906 1,56734
officiers Mean 3,4952 3,5264 4,0092
N 163 163 163
Std. Deviation 1,36039 1,12172 1,62871
working personnel Mean 3,3484 3,3959 3,5833
N 294 294 294
Std. Deviation 1,34516 1,16946 1,74110
entrepreneur or a person practising a profession
Mean 3,6598 3,6342 3,5066
N 76 76 76
Std. Deviation 1,47542 1,29507 1,70195
student Mean 3,3947 3,1667 3,8202
N 114 114 114
Std. Deviation 1,27681 1,09315 1,55023
unemployed Mean 3,0952 3,3683 3,3016
N 63 63 63
Std. Deviation 1,51577 1,19418 1,60528
pensioner Mean 2,9771 3,6133 3,5918
N 256 256 256
Std. Deviation 1,22905 1,18500 1,66932
full -time mother or father Mean 2,9317 2,9391 3,4130
N 46 46 46
Std. Deviation 1,28721 1,15921 1,58921
Total Mean 3,3264 3,4810 3,7407
N 1155 1155 1155
Std. Deviation 1,34317 1,17952 1,67898
ANOVA Table
Sum of Squares df Mean Square F Sig.
EHH * occupational group Between Groups (Combined) 86,935 8 10,867 6,242 ,000
Within Groups 1995,010 1146 1,741
Total 2081,945 1154
EHL * occupational group Between Groups (Combined) 49,597 8 6,200 4,566 ,000
Within Groups 1555,938 1146 1,358
Total 1605,535 1154
EHA * occupational group Between Groups (Combined) 106,090 8 13,261 4,829 ,000
Within Groups 3146,997 1146 2,746
Total 3253,087 1154

271
Measures of Association
Eta Eta Squared
EHH * Ammattiryhmä, johon katsot lähinnä kuuluvasi:
,204 ,042
EHL * Ammattiryhmä, johon katsot lähinnä kuuluvasi:
,176 ,031
EHA * Ammattiryhmä, johon katsot lähinnä kuuluvasi:
,181 ,033
Compared means of food price attitude dimensions (sum variables) and income level: EHH means Low Food Price dimension, EHL means Food Quality and EHA means Food Prestige
Report
Income level of household EHH EHL EHA
under 10 000 € Mean 3,1705 3,1630 3,2605
N 119 119 119
Std. Deviation 1,29993 1,20450 1,60356
10 001-20 000 € Mean 3,0426 3,2791 3,4979
N 235 235 235
Std. Deviation 1,33546 1,14281 1,59225
20 001-30 000 € Mean 3,3178 3,3751 3,5582
N 249 249 249
Std. Deviation 1,36215 1,21118 1,67092
30 001-40 000 € Mean 3,3137 3,6024 3,8776
N 245 245 245
Std. Deviation 1,23605 1,14912 1,67102
40 001-50 000 e Mean 3,4159 3,6563 3,8111
N 135 135 135
Std. Deviation 1,26583 1,08164 1,65816
over 50 000 € Mean 3,9177 3,8472 4,5556
N 144 144 144
Std. Deviation 1,40394 1,14903 1,62165
Total Mean 3,3324 3,4761 3,7413
N 1127 1127 1127
Std. Deviation 1,33922 1,17698 1,67665
ANOVA Table
Sum of Squares df Mean Square F Sig.
EHH * Income level of household
Between Groups (Combined) 73,266 5 14,653 8,440 ,000
Within Groups 1946,241 1121 1,736
Total 2019,507 1126
EHL * Income level of household
Between Groups (Combined) 51,448 5 10,290 7,647 ,000
Within Groups 1508,380 1121 1,346
Total 1559,828 1126
EHA * Income level of household
Between Groups (Combined) 150,459 5 30,092 11,189 ,000
Within Groups 3014,894 1121 2,689
Total 3165,353 1126

272
Measures of Association
Eta Eta Squared
EHH * Income level of household ,190 ,036EHL * Income level of household ,182 ,033EHA * Income level of household ,218 ,048
Compared means of food price attitude dimensions (sum variables) and assets for daily use: EHH means Low Food Price dimension, EHL means Food Quality and EHA means Food Prestige
Report
assets for daily consumption EHH EHL EHA
We are pressed for money Mean 2,7349 2,9205 2,9699
N 83 83 83
Std. Deviation 1,28651 1,20767 1,58950
2 Mean 3,0014 3,0960 3,4550
N 100 100 100
Std. Deviation 1,23367 1,00724 1,53921
3 Mean 3,1705 3,1903 3,2876
N 186 186 186
Std. Deviation 1,27460 1,11409 1,56285
4 Mean 3,3653 3,5209 3,6361
N 316 316 316
Std. Deviation 1,29992 1,13460 1,67299
5 Mean 3,3926 3,6878 4,1025
N 278 278 278
Std. Deviation 1,30232 1,15515 1,61092
6 Mean 3,6933 3,8210 4,1713
N 143 143 143
Std. Deviation 1,46227 1,22318 1,67847
We have plenty of money Mean 4,0816 3,9571 4,8393
N 28 28 28
Std. Deviation 1,54813 1,44771 1,82601
Total Mean 3,3209 3,4748 3,7257
N 1134 1134 1134
Std. Deviation 1,34130 1,18301 1,67525
ANOVA Table
Sum of Squares df Mean Square F Sig.
EHH * assets for daily consumption
Between Groups (Combined) 80,999 6 13,500 7,773 ,000
Within Groups 1957,376 1127 1,737
Total 2038,375 1133
EHL * assets for daily consumption
Between Groups (Combined) 91,836 6 15,306 11,548 ,000
Within Groups 1493,822 1127 1,325
Total 1585,659 1133
EHA * assets for daily consumption
Between Groups (Combined) 195,568 6 32,595 12,310 ,000
Within Groups 2984,140 1127 2,648
Total 3179,708 1133
Measures of Association
Eta Eta Squared
EHH * assets for daily consumption ,199 ,040EHL * assets for daily consumption ,241 ,058EHA * assets for daily consumption ,248 ,062

273
Appendix 9: results of the confirmatory factor analysis
DATE: 4/ 1/2011 TIME: 12:02
L I S R E L 8.80
BY
Karl G. Jöreskog and Dag Sörbom
This program is published exclusively by Scientific Software International, Inc. 7383 N. Lincoln Avenue, Suite 100 Lincolnwood, IL 60712, U.S.A. Phone: (800)247-6113, (847)675-0720, Fax: (847)675-2140 Copyright by Scientific Software International, Inc., 1981-2006 Use of this program is subject to the terms specified in the Universal Copyright Convention. Website: www.ssicentral.com
The following lines were read from file D:\LS\2004b\test0.SPJ:
!2004 Niinan datasta kaikki hinta-asennemuuttujat !split 50% random sample test0.sav
Observed Variables
EHH1R EHH3R EHT2R EHT3 EHV1R EHV2 EHV3R EHH2 EHL1 EHL2 EHL3 EHA1 EHA3R EHL4R ZKOKEILU ZTOISTU
Covariance Matrix from File d: Means from File d: Standard Deviations from File d:
Sample size =399
Latent Variables: Price Quality Prestige
Relationships:
!EHH2 = Quality EHL1 = Quality EHL2 = 1*Quality EHL3 = Quality !EHL4R = Quality
EHA1 = 1*Prestige EHA3R= Prestige
EHH1R = Price
Appendix 9: Results of the confirmatory factor analysis

274
EHH3R = Price EHT2R = Price EHT3 = Price EHV1R = Price EHV2 = Price EHV3R = 1*Price
Path Diagram Wide Print Print Residuals Number of Decimals = 3 Method of Estimation: Maximum Likelihood LISREL OUTPUT: RS MI SS SC TO AD=OFF IT=1000
! HINTA-ASENNEMUUTTUJAT
Covariance Matrix
EHH1R EHH3R EHT2R EHT3 EHV1R EHV2 -------- -------- -------- -------- -------- -------- EHH1R 18.765 EHH3R 4.623 11.538 EHT2R 4.952 3.048 9.933 EHT3 6.870 2.968 7.199 16.938 EHV1R 4.734 3.198 3.504 4.723 6.859 EHV2 3.047 1.790 2.717 3.858 2.861 5.614 EHV3R 4.556 3.436 4.789 5.132 5.018 3.233 EHL1 2.609 3.490 1.548 1.875 1.539 0.847 EHL2 2.172 2.721 1.918 2.925 1.471 1.332 EHL3 1.370 1.807 1.408 2.172 1.078 0.780 EHA1 1.434 1.557 1.163 2.027 1.004 0.774 EHA3R 1.633 2.134 1.772 0.526 0.826 -0.127
Covariance Matrix
EHV3R EHL1 EHL2 EHL3 EHA1 EHA3R -------- -------- -------- -------- -------- -------- EHV3R 9.072 EHL1 1.413 7.439 EHL2 1.532 3.170 7.132 EHL3 0.637 2.155 4.585 10.032 EHA1 0.579 1.562 3.302 3.820 12.349 EHA3R 1.485 1.403 2.658 2.280 7.223 13.365
! HINTA-ASENNEMUUTTUJAT
Parameter Specifications
LAMBDA-X
Price Quality Prestige -------- -------- -------- EHH1R 1 0 0 EHH3R 2 0 0 EHT2R 3 0 0 EHT3 4 0 0 EHV1R 5 0 0 EHV2 6 0 0 EHV3R 0 0 0 EHL1 0 7 0 EHL2 0 0 0 EHL3 0 8 0 EHA1 0 0 0 EHA3R 0 0 9

275
PHI
Price Quality Prestige -------- -------- -------- Price 10 Quality 11 12 Prestige 13 14 15
THETA-DELTA
EHH1R EHH3R EHT2R EHT3 EHV1R EHV2 -------- -------- -------- -------- -------- -------- 16 17 18 19 20 21
THETA-DELTA
EHV3R EHL1 EHL2 EHL3 EHA1 EHA3R -------- -------- -------- -------- -------- -------- 22 23 24 25 26 27
! HINTA-ASENNEMUUTTUJAT
Number of Iterations = 9
LISREL Estimates (Maximum Likelihood)
LAMBDA-X
Price Quality Prestige -------- -------- -------- EHH1R 1.034 - - - - (0.104) 9.967 EHH3R 0.682 - - - - (0.081) 8.372 EHT2R 0.922 - - - - (0.075) 12.227 EHT3 1.159 - - - - (0.098) 11.766 EHV1R 0.876 - - - - (0.063) 13.868 EHV2 0.617 - - - - (0.057) 10.881 EHV3R 1.000 - - - - EHL1 - - 0.568 - - (0.070) 8.055 EHL2 - - 1.000 - - EHL3 - - 0.830 - - (0.088) 9.400 EHA1 - - - - 1.000 EHA3R - - - - 0.778 (0.117) 6.635
PHI
Price Quality Prestige -------- -------- -------- Price 5.110
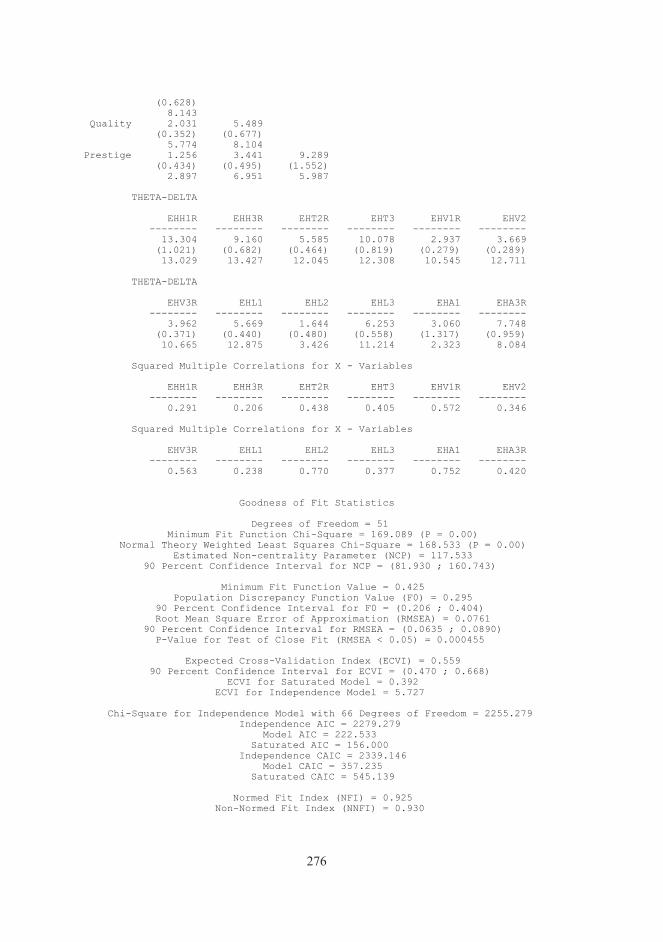
276
(0.628) 8.143 Quality 2.031 5.489 (0.352) (0.677) 5.774 8.104 Prestige 1.256 3.441 9.289 (0.434) (0.495) (1.552) 2.897 6.951 5.987
THETA-DELTA
EHH1R EHH3R EHT2R EHT3 EHV1R EHV2 -------- -------- -------- -------- -------- -------- 13.304 9.160 5.585 10.078 2.937 3.669 (1.021) (0.682) (0.464) (0.819) (0.279) (0.289) 13.029 13.427 12.045 12.308 10.545 12.711
THETA-DELTA
EHV3R EHL1 EHL2 EHL3 EHA1 EHA3R -------- -------- -------- -------- -------- -------- 3.962 5.669 1.644 6.253 3.060 7.748 (0.371) (0.440) (0.480) (0.558) (1.317) (0.959) 10.665 12.875 3.426 11.214 2.323 8.084
Squared Multiple Correlations for X - Variables
EHH1R EHH3R EHT2R EHT3 EHV1R EHV2 -------- -------- -------- -------- -------- -------- 0.291 0.206 0.438 0.405 0.572 0.346
Squared Multiple Correlations for X - Variables
EHV3R EHL1 EHL2 EHL3 EHA1 EHA3R -------- -------- -------- -------- -------- -------- 0.563 0.238 0.770 0.377 0.752 0.420
Goodness of Fit Statistics
Degrees of Freedom = 51 Minimum Fit Function Chi-Square = 169.089 (P = 0.00) Normal Theory Weighted Least Squares Chi-Square = 168.533 (P = 0.00) Estimated Non-centrality Parameter (NCP) = 117.533 90 Percent Confidence Interval for NCP = (81.930 ; 160.743)
Minimum Fit Function Value = 0.425 Population Discrepancy Function Value (F0) = 0.295 90 Percent Confidence Interval for F0 = (0.206 ; 0.404) Root Mean Square Error of Approximation (RMSEA) = 0.0761 90 Percent Confidence Interval for RMSEA = (0.0635 ; 0.0890) P-Value for Test of Close Fit (RMSEA < 0.05) = 0.000455
Expected Cross-Validation Index (ECVI) = 0.559 90 Percent Confidence Interval for ECVI = (0.470 ; 0.668) ECVI for Saturated Model = 0.392 ECVI for Independence Model = 5.727
Chi-Square for Independence Model with 66 Degrees of Freedom = 2255.279 Independence AIC = 2279.279 Model AIC = 222.533 Saturated AIC = 156.000 Independence CAIC = 2339.146 Model CAIC = 357.235 Saturated CAIC = 545.139
Normed Fit Index (NFI) = 0.925 Non-Normed Fit Index (NNFI) = 0.930
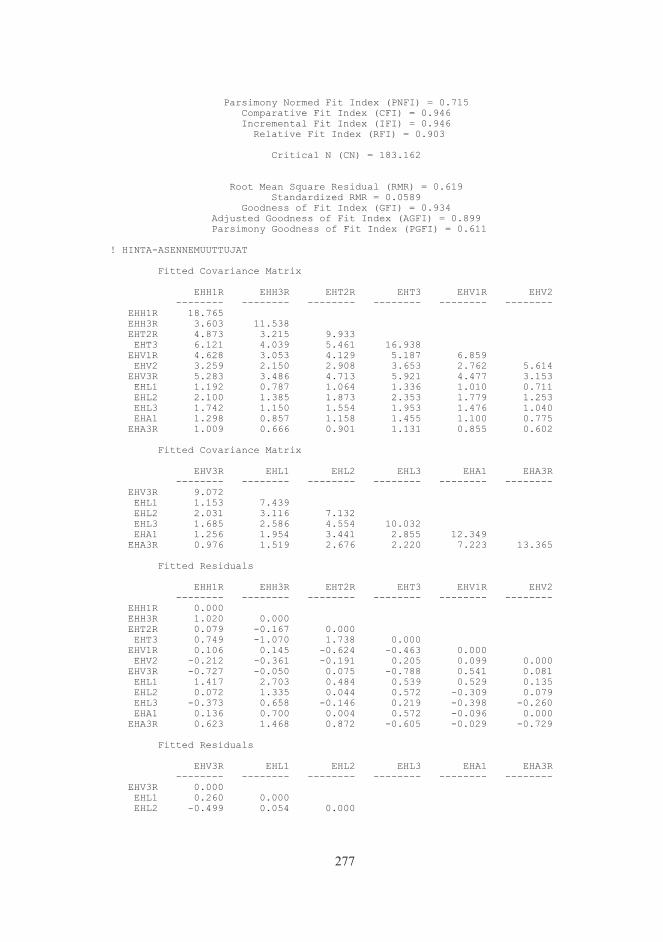
277
Parsimony Normed Fit Index (PNFI) = 0.715 Comparative Fit Index (CFI) = 0.946 Incremental Fit Index (IFI) = 0.946 Relative Fit Index (RFI) = 0.903
Critical N (CN) = 183.162
Root Mean Square Residual (RMR) = 0.619 Standardized RMR = 0.0589 Goodness of Fit Index (GFI) = 0.934 Adjusted Goodness of Fit Index (AGFI) = 0.899 Parsimony Goodness of Fit Index (PGFI) = 0.611
! HINTA-ASENNEMUUTTUJAT
Fitted Covariance Matrix
EHH1R EHH3R EHT2R EHT3 EHV1R EHV2 -------- -------- -------- -------- -------- -------- EHH1R 18.765 EHH3R 3.603 11.538 EHT2R 4.873 3.215 9.933 EHT3 6.121 4.039 5.461 16.938 EHV1R 4.628 3.053 4.129 5.187 6.859 EHV2 3.259 2.150 2.908 3.653 2.762 5.614 EHV3R 5.283 3.486 4.713 5.921 4.477 3.153 EHL1 1.192 0.787 1.064 1.336 1.010 0.711 EHL2 2.100 1.385 1.873 2.353 1.779 1.253 EHL3 1.742 1.150 1.554 1.953 1.476 1.040 EHA1 1.298 0.857 1.158 1.455 1.100 0.775 EHA3R 1.009 0.666 0.901 1.131 0.855 0.602
Fitted Covariance Matrix
EHV3R EHL1 EHL2 EHL3 EHA1 EHA3R -------- -------- -------- -------- -------- -------- EHV3R 9.072 EHL1 1.153 7.439 EHL2 2.031 3.116 7.132 EHL3 1.685 2.586 4.554 10.032 EHA1 1.256 1.954 3.441 2.855 12.349 EHA3R 0.976 1.519 2.676 2.220 7.223 13.365
Fitted Residuals
EHH1R EHH3R EHT2R EHT3 EHV1R EHV2 -------- -------- -------- -------- -------- -------- EHH1R 0.000 EHH3R 1.020 0.000 EHT2R 0.079 -0.167 0.000 EHT3 0.749 -1.070 1.738 0.000 EHV1R 0.106 0.145 -0.624 -0.463 0.000 EHV2 -0.212 -0.361 -0.191 0.205 0.099 0.000 EHV3R -0.727 -0.050 0.075 -0.788 0.541 0.081 EHL1 1.417 2.703 0.484 0.539 0.529 0.135 EHL2 0.072 1.335 0.044 0.572 -0.309 0.079 EHL3 -0.373 0.658 -0.146 0.219 -0.398 -0.260 EHA1 0.136 0.700 0.004 0.572 -0.096 0.000 EHA3R 0.623 1.468 0.872 -0.605 -0.029 -0.729
Fitted Residuals
EHV3R EHL1 EHL2 EHL3 EHA1 EHA3R -------- -------- -------- -------- -------- -------- EHV3R 0.000 EHL1 0.260 0.000 EHL2 -0.499 0.054 0.000

278
EHL3 -1.048 -0.431 0.031 0.000 EHA1 -0.677 -0.392 -0.139 0.965 0.000 EHA3R 0.508 -0.116 -0.017 0.060 0.000 0.000
Summary Statistics for Fitted Residuals
Smallest Fitted Residual = -1.070 Median Fitted Residual = 0.000 Largest Fitted Residual = 2.703
Stemleaf Plot
- 1|10 - 0|87776655 - 0|4444433222111100000000000000000000 0|111111111111223 0|555556667779 1|0034 1|57 2| 2|7
Standardized Residuals
EHH1R EHH3R EHT2R EHT3 EHV1R EHV2 -------- -------- -------- -------- -------- -------- EHH1R - - EHH3R 1.979 - - EHT2R 0.211 -0.524 - - EHT3 1.467 -2.468 5.588 - - EHV1R 0.425 0.678 -4.239 -2.283 - - EHV2 -0.675 -1.353 -0.988 0.780 0.780 - - EHV3R -2.495 -0.199 0.436 -3.316 5.002 0.541 EHL1 2.639 6.270 1.295 1.093 1.780 0.468 EHL2 0.165 3.614 0.160 1.529 -1.622 0.346 EHL3 -0.628 1.364 -0.362 0.410 -1.277 -0.820 EHA1 0.222 1.359 0.012 1.092 -0.359 -0.002 EHA3R 0.888 2.573 1.832 -0.958 -0.079 -1.950
Standardized Residuals
EHV3R EHL1 EHL2 EHL3 EHA1 EHA3R -------- -------- -------- -------- -------- -------- EHV3R - - EHL1 0.758 - - EHL2 -2.250 1.081 - - EHL3 -2.908 -1.938 0.939 - - EHA1 -2.167 -1.143 -1.798 2.997 - - EHA3R 1.198 -0.300 -0.181 0.160 - - - -
Summary Statistics for Standardized Residuals
Smallest Standardized Residual = -4.239 Median Standardized Residual = 0.000 Largest Standardized Residual = 6.270
Stemleaf Plot
- 4|2 - 2|3955332 - 0|9986431008765443221000000000000000 0|2222234445578889911123445588 2|06606 4|06 6|3 Largest Negative Standardized Residuals Residual for EHV1R and EHT2R -4.239 Residual for EHV3R and EHT3 -3.316

279
Residual for EHL3 and EHV3R -2.908 Largest Positive Standardized Residuals Residual for EHT3 and EHT2R 5.588 Residual for EHV3R and EHV1R 5.002 Residual for EHL1 and EHH1R 2.639 Residual for EHL1 and EHH3R 6.270 Residual for EHL2 and EHH3R 3.614 Residual for EHA1 and EHL3 2.997
! HINTA-ASENNEMUUTTUJAT
Qplot of Standardized Residuals
3.5.......................................................................... . .. . . . . . . . . . . . . . . . . . . . . . . . x . . . . . x . . x . . x . . x x . N . . x x . o . . x xx . r . . *x . m . . xxx . a . . * * . l . . ** . . . xx . Q . . *xx . u . . x . a . .x*x . n . .xx . t . xxxx . i . x* . . l . x xx . . e . * x . . s . xx . . . x x . . . x . . . x . . . x . . . . . x . . . . . . . . . . . . . . . . . . . . . . . -3.5.......................................................................... -3.5 3.5 Standardized Residuals
! HINTA-ASENNEMUUTTUJAT
Modification Indices and Expected Change
Modification Indices for LAMBDA-X
Price Quality Prestige

280
-------- -------- -------- EHH1R - - 0.201 0.223 EHH3R - - 18.102 5.048 EHT2R - - 0.109 0.360 EHT3 - - 2.430 0.588 EHV1R - - 1.800 0.224 EHV2 - - 0.008 0.298 EHV3R - - 6.979 2.759 EHL1 7.121 - - 1.090 EHL2 0.181 - - 2.515 EHL3 2.571 - - 6.593 EHA1 0.603 0.595 - - EHA3R 0.603 0.607 - -
Expected Change for LAMBDA-X
Price Quality Prestige -------- -------- -------- EHH1R - - 0.045 0.034 EHH3R - - 0.349 0.132 EHT2R - - 0.022 0.029 EHT3 - - 0.140 0.049 EHV1R - - -0.071 -0.018 EHV2 - - 0.005 -0.021 EHV3R - - -0.161 -0.072 EHL1 0.183 - - -0.061 EHL2 -0.036 - - -0.120 EHL3 -0.126 - - 0.176 EHA1 -0.083 -12.898 - - EHA3R 0.065 10.128 - -
Standardized Expected Change for LAMBDA-X
Price Quality Prestige -------- -------- -------- EHH1R - - 0.105 0.103 EHH3R - - 0.817 0.401 EHT2R - - 0.052 0.088 EHT3 - - 0.329 0.150 EHV1R - - -0.166 -0.054 EHV2 - - 0.011 -0.063 EHV3R - - -0.377 -0.219 EHL1 0.414 - - -0.184 EHL2 -0.081 - - -0.366 EHL3 -0.284 - - 0.535 EHA1 -0.188 -30.217 - - EHA3R 0.146 23.727 - -
Completely Standardized Expected Change for LAMBDA-X
Price Quality Prestige -------- -------- -------- EHH1R - - 0.024 0.024 EHH3R - - 0.240 0.118 EHT2R - - 0.017 0.028 EHT3 - - 0.080 0.036 EHV1R - - -0.063 -0.021 EHV2 - - 0.005 -0.027 EHV3R - - -0.125 -0.073 EHL1 0.152 - - -0.068 EHL2 -0.030 - - -0.137 EHL3 -0.090 - - 0.169 EHA1 -0.054 -8.599 - - EHA3R 0.040 6.490 - -
No Non-Zero Modification Indices for PHI
Modification Indices for THETA-DELTA

281
EHH1R EHH3R EHT2R EHT3 EHV1R EHV2 -------- -------- -------- -------- -------- -------- EHH1R - - EHH3R 3.915 - - EHT2R 0.044 0.275 - - EHT3 2.151 6.089 31.228 - - EHV1R 0.180 0.460 17.969 5.213 - - EHV2 0.455 1.831 0.977 0.608 0.609 - - EHV3R 6.225 0.040 0.190 10.996 25.024 0.293 EHL1 3.447 22.951 0.065 1.020 0.728 1.020 EHL2 0.147 1.629 0.003 1.686 2.818 1.072 EHL3 0.155 0.107 0.129 0.415 0.047 0.116 EHA1 0.019 0.797 0.961 4.164 0.310 2.744 EHA3R 0.337 2.952 3.967 7.370 0.345 9.745
Modification Indices for THETA-DELTA
EHV3R EHL1 EHL2 EHL3 EHA1 EHA3R -------- -------- -------- -------- -------- -------- EHV3R - - EHL1 0.056 - - EHL2 0.431 1.168 - - EHL3 3.095 3.756 0.882 - - EHA1 6.165 1.206 2.883 9.841 - - EHA3R 7.413 0.079 0.368 1.803 - - - -
Expected Change for THETA-DELTA
EHH1R EHH3R EHT2R EHT3 EHV1R EHV2 -------- -------- -------- -------- -------- -------- EHH1R - - EHH3R 1.176 - - EHT2R 0.105 -0.211 - - EHT3 0.968 -1.320 2.541 - - EHV1R 0.167 0.214 -1.186 -0.837 - - EHV2 -0.263 -0.429 -0.264 0.275 0.166 - - EHV3R -1.134 -0.073 0.140 -1.399 1.352 0.133 EHL1 0.860 1.819 -0.079 -0.417 0.202 -0.248 EHL2 -0.147 0.399 -0.014 0.444 -0.333 0.210 EHL3 -0.197 -0.134 0.120 0.288 0.056 -0.090 EHA1 -0.073 -0.387 -0.349 0.966 0.152 0.466 EHA3R 0.330 0.801 0.758 -1.377 -0.171 -0.943
Expected Change for THETA-DELTA
EHV3R EHL1 EHL2 EHL3 EHA1 EHA3R -------- -------- -------- -------- -------- -------- EHV3R - - EHL1 -0.065 - - EHL2 -0.151 0.511 - - EHL3 -0.522 -0.776 0.746 - - EHA1 -0.785 -0.390 -0.700 1.260 - - EHA3R 0.916 0.105 0.242 -0.549 - - - -
Completely Standardized Expected Change for THETA-DELTA
EHH1R EHH3R EHT2R EHT3 EHV1R EHV2 -------- -------- -------- -------- -------- -------- EHH1R - - EHH3R 0.080 - - EHT2R 0.008 -0.020 - - EHT3 0.054 -0.094 0.196 - - EHV1R 0.015 0.024 -0.144 -0.078 - - EHV2 -0.026 -0.053 -0.035 0.028 0.027 - - EHV3R -0.087 -0.007 0.015 -0.113 0.171 0.019 EHL1 0.073 0.196 -0.009 -0.037 0.028 -0.038 EHL2 -0.013 0.044 -0.002 0.040 -0.048 0.033

282
EHL3 -0.014 -0.012 0.012 0.022 0.007 -0.012 EHA1 -0.005 -0.032 -0.031 0.067 0.017 0.056 EHA3R 0.021 0.065 0.066 -0.091 -0.018 -0.109
Completely Standardized Expected Change for THETA-DELTA
EHV3R EHL1 EHL2 EHL3 EHA1 EHA3R -------- -------- -------- -------- -------- -------- EHV3R - - EHL1 -0.008 - - EHL2 -0.019 0.070 - - EHL3 -0.055 -0.090 0.088 - - EHA1 -0.074 -0.041 -0.075 0.113 - - EHA3R 0.083 0.011 0.025 -0.047 - - - -
Maximum Modification Index is 31.23 for Element ( 4, 3) of THETA-DELTA
! HINTA-ASENNEMUUTTUJAT
Standardized Solution
LAMBDA-X
Price Quality Prestige -------- -------- -------- EHH1R 2.337 - - - - EHH3R 1.542 - - - - EHT2R 2.085 - - - - EHT3 2.619 - - - - EHV1R 1.980 - - - - EHV2 1.395 - - - - EHV3R 2.261 - - - - EHL1 - - 1.330 - - EHL2 - - 2.343 - - EHL3 - - 1.944 - - EHA1 - - - - 3.048 EHA3R - - - - 2.370
PHI
Price Quality Prestige -------- -------- -------- Price 1.000 Quality 0.384 1.000 Prestige 0.182 0.482 1.000
! HINTA-ASENNEMUUTTUJAT
Completely Standardized Solution
LAMBDA-X
Price Quality Prestige -------- -------- -------- EHH1R 0.539 - - - - EHH3R 0.454 - - - - EHT2R 0.662 - - - - EHT3 0.636 - - - - EHV1R 0.756 - - - - EHV2 0.589 - - - - EHV3R 0.751 - - - - EHL1 - - 0.488 - - EHL2 - - 0.877 - - EHL3 - - 0.614 - - EHA1 - - - - 0.867 EHA3R - - - - 0.648
PHI

283
Price Quality Prestige -------- -------- -------- Price 1.000 Quality 0.384 1.000 Prestige 0.182 0.482 1.000
THETA-DELTA
EHH1R EHH3R EHT2R EHT3 EHV1R EHV2 -------- -------- -------- -------- -------- -------- 0.709 0.794 0.562 0.595 0.428 0.654
THETA-DELTA
EHV3R EHL1 EHL2 EHL3 EHA1 EHA3R -------- -------- -------- -------- -------- -------- 0.437 0.762 0.230 0.623 0.248 0.580
Time used: 0.016 Seconds

284
Appendix 10: results of the structural equation modelling
DATE: 4/19/2011 TIME: 13:19
L I S R E L 8.80
BY
Karl G. Jöreskog and Dag Sörbom
This program is published exclusively by Scientific Software International, Inc. 7383 N. Lincoln Avenue, Suite 100 Lincolnwood, IL 60712, U.S.A. Phone: (800)247-6113, (847)675-0720, Fax: (847)675-2140 Copyright by Scientific Software International, Inc., 1981-2006 Use of this program is subject to the terms specified in the Universal Copyright Convention. Website: www.ssicentral.com
The following lines were read from file D:\LS\2004b\test1.SPJ:
!2004b datasta kaikki hinta-asennemuuttujat !split 50% random sample test1.sav
Observed Variables
EHH1R EHH3R EHT2R EHT3 EHV1R EHV2 EHV3R EHH2 EHL1 EHL2 EHL3 EHA1 EHA3R EHL4R ZKOKEILU ZTOISTU
Covariance Matrix from File d: Means from File d: Standard Deviations from File d:
Sample size =400
Latent Variables: Price Quality Prestige WPay
Relationships:
!EHH2 = Quality !EHL1 = Quality EHL2 = 1*Quality EHL3 = Quality !EHL4R = Quality
EHA1 = 1*Prestige EHA3R= Prestige
EHH1R = Price
Appendix 10: Results of the structural equation modelling

285
EHH3R = Price EHT2R = Price EHT3 = Price EHV1R = Price EHV2 = Price EHV3R = 1*Price
ZKOKEILU = 1*WPay ZTOISTU = WPay
Price = Quality !Price = Prestige Prestige = Quality WPay = Price !WPay = Quality !WPay = Prestige
Path Diagram Wide Print Print Residuals Number of Decimals = 3 Method of Estimation: Maximum Likelihood LISREL OUTPUT: RS MI SS SC TO AD=OFF IT=1000
! HINTA-ASENNEMUUTTUJAT
Covariance Matrix
EHH1R EHH3R EHT2R EHT3 EHV1R EHV2 -------- -------- -------- -------- -------- -------- EHH1R 20.968 EHH3R 6.263 12.307 EHT2R 5.264 3.993 11.211 EHT3 6.757 4.634 6.995 16.312 EHV1R 3.521 3.449 3.930 4.378 6.971 EHV2 2.735 1.329 2.908 3.546 2.413 5.147 EHV3R 5.071 4.586 6.298 5.333 5.146 2.985 EHA1 1.466 1.641 0.973 1.955 1.518 1.415 EHA3R 1.948 1.566 0.926 0.755 1.361 0.249 ZKOKEILU 0.722 0.398 0.327 0.268 0.159 0.130 ZTOISTU 0.620 0.444 0.386 0.409 0.272 0.198 EHL2 2.409 2.931 1.828 2.291 1.286 1.175 EHL3 2.286 2.355 1.079 1.546 1.161 1.587
Covariance Matrix
EHV3R EHA1 EHA3R ZKOKEILU ZTOISTU EHL2 -------- -------- -------- -------- -------- -------- EHV3R 10.102 EHA1 0.845 12.854 EHA3R 1.150 8.313 14.019 ZKOKEILU 0.452 0.002 0.282 0.825 ZTOISTU 0.635 0.104 0.409 0.690 1.095 EHL2 1.338 3.392 2.175 0.128 0.193 7.463 EHL3 1.180 4.002 3.069 0.118 0.170 4.036
Covariance Matrix
EHL3 -------- EHL3 8.546
! HINTA-ASENNEMUUTTUJAT
Parameter Specifications
LAMBDA-Y

286
Price Prestige WPay -------- -------- -------- EHH1R 1 0 0 EHH3R 2 0 0 EHT2R 3 0 0 EHT3 4 0 0 EHV1R 5 0 0 EHV2 6 0 0 EHV3R 0 0 0 EHA1 0 0 0 EHA3R 0 7 0 ZKOKEILU 0 0 0 ZTOISTU 0 0 8
LAMBDA-X
Quality -------- EHL2 0 EHL3 9
BETA
Price Prestige WPay -------- -------- -------- Price 0 0 0 Prestige 0 0 0 WPay 10 0 0
GAMMA
Quality -------- Price 11 Prestige 12 WPay 0
PHI
Quality -------- 13
PSI
Price Prestige WPay -------- -------- -------- 14 15 16
THETA-EPS
EHH1R EHH3R EHT2R EHT3 EHV1R EHV2 -------- -------- -------- -------- -------- -------- 17 18 19 20 21 22
THETA-EPS
EHV3R EHA1 EHA3R ZKOKEILU ZTOISTU -------- -------- -------- -------- -------- 23 24 25 26 27
THETA-DELTA
EHL2 EHL3 -------- -------- 28 29

287
! HINTA-ASENNEMUUTTUJAT
Number of Iterations = 13
LISREL Estimates (Maximum Likelihood)
LAMBDA-Y
Price Prestige WPay -------- -------- -------- EHH1R 0.908 - - - - (0.097) 9.346 EHH3R 0.737 - - - - (0.074) 9.932 EHT2R 0.959 - - - - (0.070) 13.760 EHT3 1.003 - - - - (0.085) 11.860 EHV1R 0.738 - - - - (0.055) 13.429 EHV2 0.490 - - - - (0.048) 10.217 EHV3R 1.000 - - - - EHA1 - - 1.000 - - EHA3R - - 0.717 - - (0.098) 7.342 ZKOKEILU - - - - 1.000 ZTOISTU - - - - 1.320 (0.303) 4.360
LAMBDA-X
Quality -------- EHL2 1.000 EHL3 1.092 (0.134) 8.129
BETA
Price Prestige WPay -------- -------- -------- Price - - - - - - Prestige - - - - - - WPay 0.061 - - - - (0.020) 3.078
GAMMA
Quality -------- Price 0.466 (0.090) 5.176 Prestige 0.950 (0.125)
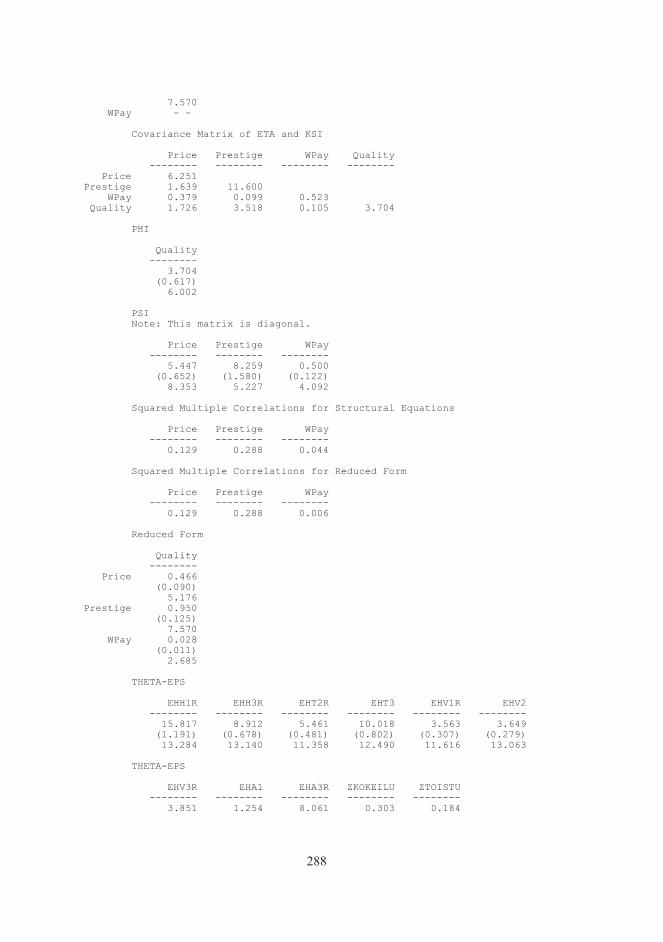
288
7.570 WPay - -
Covariance Matrix of ETA and KSI
Price Prestige WPay Quality -------- -------- -------- -------- Price 6.251 Prestige 1.639 11.600 WPay 0.379 0.099 0.523 Quality 1.726 3.518 0.105 3.704
PHI
Quality -------- 3.704 (0.617) 6.002
PSI Note: This matrix is diagonal.
Price Prestige WPay -------- -------- -------- 5.447 8.259 0.500 (0.652) (1.580) (0.122) 8.353 5.227 4.092
Squared Multiple Correlations for Structural Equations
Price Prestige WPay -------- -------- -------- 0.129 0.288 0.044
Squared Multiple Correlations for Reduced Form
Price Prestige WPay -------- -------- -------- 0.129 0.288 0.006
Reduced Form
Quality -------- Price 0.466 (0.090) 5.176 Prestige 0.950 (0.125) 7.570 WPay 0.028 (0.011) 2.685
THETA-EPS
EHH1R EHH3R EHT2R EHT3 EHV1R EHV2 -------- -------- -------- -------- -------- -------- 15.817 8.912 5.461 10.018 3.563 3.649 (1.191) (0.678) (0.481) (0.802) (0.307) (0.279) 13.284 13.140 11.358 12.490 11.616 13.063
THETA-EPS
EHV3R EHA1 EHA3R ZKOKEILU ZTOISTU -------- -------- -------- -------- -------- 3.851 1.254 8.061 0.303 0.184

289
(0.390) (1.435) (0.931) (0.120) (0.206) 9.863 0.874 8.656 2.525 0.895
Squared Multiple Correlations for Y - Variables
EHH1R EHH3R EHT2R EHT3 EHV1R EHV2 -------- -------- -------- -------- -------- -------- 0.246 0.276 0.513 0.386 0.489 0.291
Squared Multiple Correlations for Y - Variables
EHV3R EHA1 EHA3R ZKOKEILU ZTOISTU -------- -------- -------- -------- -------- 0.619 0.902 0.425 0.633 0.832
THETA-DELTA
EHL2 EHL3 -------- -------- 3.758 4.128 (0.493) (0.574) 7.618 7.188
Squared Multiple Correlations for X - Variables
EHL2 EHL3 -------- -------- 0.496 0.517
Goodness of Fit Statistics
Degrees of Freedom = 62 Minimum Fit Function Chi-Square = 149.063 (P = 0.00) Normal Theory Weighted Least Squares Chi-Square = 147.875 (P = 0.00) Estimated Non-centrality Parameter (NCP) = 85.875 90 Percent Confidence Interval for NCP = (54.098 ; 125.358)
Minimum Fit Function Value = 0.374 Population Discrepancy Function Value (F0) = 0.215 90 Percent Confidence Interval for F0 = (0.136 ; 0.314) Root Mean Square Error of Approximation (RMSEA) = 0.0589 90 Percent Confidence Interval for RMSEA = (0.0468 ; 0.0712) P-Value for Test of Close Fit (RMSEA < 0.05) = 0.110
Expected Cross-Validation Index (ECVI) = 0.516 90 Percent Confidence Interval for ECVI = (0.436 ; 0.615) ECVI for Saturated Model = 0.456 ECVI for Independence Model = 5.940
Chi-Square for Independence Model with 78 Degrees of Freedom = 2344.129 Independence AIC = 2370.129 Model AIC = 205.875 Saturated AIC = 182.000 Independence CAIC = 2435.018 Model CAIC = 350.627 Saturated CAIC = 636.223
Normed Fit Index (NFI) = 0.936 Non-Normed Fit Index (NNFI) = 0.952 Parsimony Normed Fit Index (PNFI) = 0.744 Comparative Fit Index (CFI) = 0.962 Incremental Fit Index (IFI) = 0.962 Relative Fit Index (RFI) = 0.920
Critical N (CN) = 244.053

290
Root Mean Square Residual (RMR) = 0.485 Standardized RMR = 0.0468 Goodness of Fit Index (GFI) = 0.946 Adjusted Goodness of Fit Index (AGFI) = 0.921 Parsimony Goodness of Fit Index (PGFI) = 0.645
! HINTA-ASENNEMUUTTUJAT
Fitted Covariance Matrix
EHH1R EHH3R EHT2R EHT3 EHV1R EHV2 -------- -------- -------- -------- -------- -------- EHH1R 20.968 EHH3R 4.182 12.307 EHT2R 5.442 4.418 11.211 EHT3 5.694 4.623 6.016 16.312 EHV1R 4.190 3.402 4.427 4.632 6.971 EHV2 2.778 2.255 2.935 3.071 2.260 5.147 EHV3R 5.675 4.607 5.995 6.273 4.616 3.060 EHA1 1.488 1.208 1.572 1.645 1.210 0.802 EHA3R 1.066 0.866 1.127 1.179 0.867 0.575 ZKOKEILU 0.344 0.280 0.364 0.381 0.280 0.186 ZTOISTU 0.454 0.369 0.480 0.502 0.370 0.245 EHL2 1.567 1.272 1.655 1.732 1.274 0.845 EHL3 1.711 1.389 1.808 1.891 1.392 0.923
Fitted Covariance Matrix
EHV3R EHA1 EHA3R ZKOKEILU ZTOISTU EHL2 -------- -------- -------- -------- -------- -------- EHV3R 10.102 EHA1 1.639 12.854 EHA3R 1.175 8.313 14.019 ZKOKEILU 0.379 0.099 0.071 0.825 ZTOISTU 0.501 0.131 0.094 0.690 1.095 EHL2 1.726 3.518 2.521 0.105 0.138 7.463 EHL3 1.885 3.842 2.754 0.114 0.151 4.046
Fitted Covariance Matrix
EHL3 -------- EHL3 8.546
Fitted Residuals
EHH1R EHH3R EHT2R EHT3 EHV1R EHV2 -------- -------- -------- -------- -------- -------- EHH1R 0.000 EHH3R 2.081 0.000 EHT2R -0.178 -0.425 0.000 EHT3 1.063 0.012 0.980 0.000 EHV1R -0.669 0.048 -0.497 -0.254 0.000 EHV2 -0.043 -0.927 -0.026 0.475 0.154 0.000 EHV3R -0.604 -0.021 0.303 -0.939 0.530 -0.076 EHA1 -0.022 0.433 -0.599 0.310 0.307 0.613 EHA3R 0.882 0.700 -0.201 -0.424 0.493 -0.326 ZKOKEILU 0.378 0.118 -0.037 -0.113 -0.121 -0.056 ZTOISTU 0.165 0.075 -0.094 -0.093 -0.097 -0.047 EHL2 0.843 1.659 0.173 0.559 0.011 0.331 EHL3 0.574 0.966 -0.728 -0.346 -0.231 0.664
Fitted Residuals
EHV3R EHA1 EHA3R ZKOKEILU ZTOISTU EHL2 -------- -------- -------- -------- -------- -------- EHV3R 0.000 EHA1 -0.795 0.000
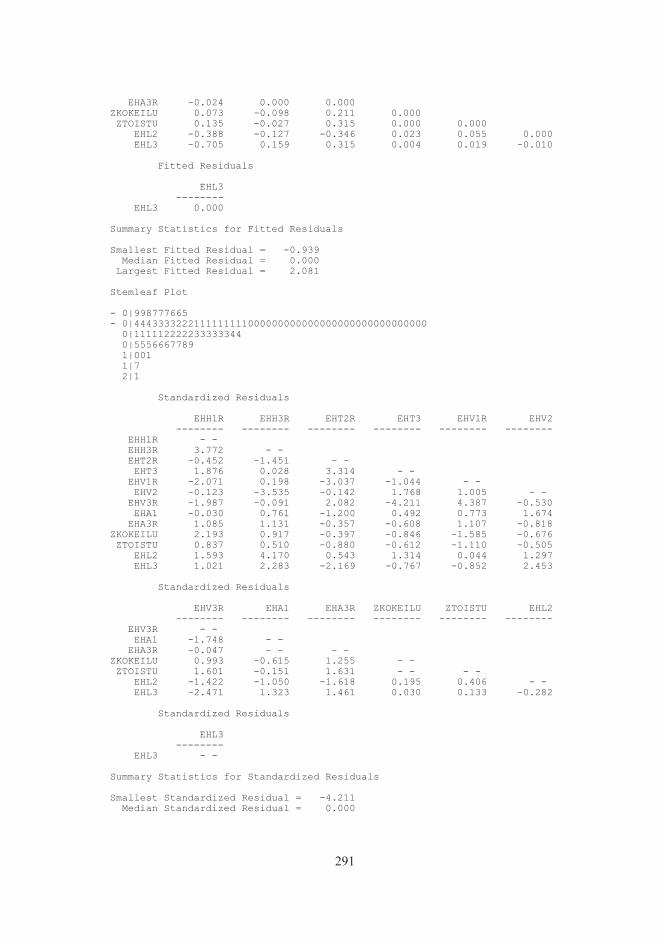
291
EHA3R -0.024 0.000 0.000 ZKOKEILU 0.073 -0.098 0.211 0.000 ZTOISTU 0.135 -0.027 0.315 0.000 0.000 EHL2 -0.388 -0.127 -0.346 0.023 0.055 0.000 EHL3 -0.705 0.159 0.315 0.004 0.019 -0.010
Fitted Residuals
EHL3 -------- EHL3 0.000
Summary Statistics for Fitted Residuals
Smallest Fitted Residual = -0.939 Median Fitted Residual = 0.000 Largest Fitted Residual = 2.081
Stemleaf Plot
- 0|998777665 - 0|4443333222111111111000000000000000000000000000000 0|111112222233333344 0|5556667789 1|001 1|7 2|1
Standardized Residuals
EHH1R EHH3R EHT2R EHT3 EHV1R EHV2 -------- -------- -------- -------- -------- -------- EHH1R - - EHH3R 3.772 - - EHT2R -0.452 -1.451 - - EHT3 1.876 0.028 3.314 - - EHV1R -2.071 0.198 -3.037 -1.044 - - EHV2 -0.123 -3.535 -0.142 1.768 1.005 - - EHV3R -1.987 -0.091 2.082 -4.211 4.387 -0.530 EHA1 -0.030 0.761 -1.200 0.492 0.773 1.674 EHA3R 1.085 1.131 -0.357 -0.608 1.107 -0.818 ZKOKEILU 2.193 0.917 -0.397 -0.846 -1.585 -0.676 ZTOISTU 0.837 0.510 -0.880 -0.612 -1.110 -0.505 EHL2 1.593 4.170 0.543 1.314 0.044 1.297 EHL3 1.021 2.283 -2.169 -0.767 -0.852 2.453
Standardized Residuals
EHV3R EHA1 EHA3R ZKOKEILU ZTOISTU EHL2 -------- -------- -------- -------- -------- -------- EHV3R - - EHA1 -1.748 - - EHA3R -0.047 - - - - ZKOKEILU 0.993 -0.615 1.255 - - ZTOISTU 1.601 -0.151 1.631 - - - - EHL2 -1.422 -1.050 -1.618 0.195 0.406 - - EHL3 -2.471 1.323 1.461 0.030 0.133 -0.282
Standardized Residuals
EHL3 -------- EHL3 - -
Summary Statistics for Standardized Residuals
Smallest Standardized Residual = -4.211 Median Standardized Residual = 0.000

292
Largest Standardized Residual = 4.387
Stemleaf Plot
- 4|2 - 3|50 - 2|5210 - 1|766542100 - 0|998887666555443211100000000000000000000 0|12245558889 1|00011133335666789 2|1235 3|38 4|24 Largest Negative Standardized Residuals Residual for EHV1R and EHT2R -3.037 Residual for EHV2 and EHH3R -3.535 Residual for EHV3R and EHT3 -4.211 Largest Positive Standardized Residuals Residual for EHH3R and EHH1R 3.772 Residual for EHT3 and EHT2R 3.314 Residual for EHV3R and EHV1R 4.387 Residual for EHL2 and EHH3R 4.170
! HINTA-ASENNEMUUTTUJAT
Qplot of Standardized Residuals
3.5.......................................................................... . .. . . . . . . . . . . . . . . . . . . . . x . . . . . x . . . . . x x . . x . . . xx . N . . xx x . o . . *x . r . . x xx . m . . x x . a . . x* . l . . x*x . . . xx . Q . *x* . u . xxx . a . xx* . n . ** . t . xxx. . i . xx. . l . x*. . e . xx x . . s . x * . . . xx . . . x . . . x x . . . . . x . . . . . x . . . . . . . .

293
. . . . . . . . . . . . -3.5.......................................................................... -3.5 3.5 Standardized Residuals
! HINTA-ASENNEMUUTTUJAT
Modification Indices and Expected Change
Modification Indices for LAMBDA-Y
Price Prestige WPay -------- -------- -------- EHH1R - - 0.080 1.702 EHH3R - - 1.481 0.446 EHT2R - - 1.880 0.622 EHT3 - - 0.386 0.522 EHV1R - - 1.572 1.759 EHV2 - - 3.424 0.347 EHV3R - - 5.464 2.305 EHA1 0.346 - - 2.741 EHA3R 0.294 - - 5.080 ZKOKEILU - - 0.427 - - ZTOISTU - - 0.281 - -
Expected Change for LAMBDA-Y
Price Prestige WPay -------- -------- -------- EHH1R - - 0.018 0.409 EHH3R - - 0.059 0.158 EHT2R - - -0.056 -0.157 EHT3 - - 0.033 -0.186 EHV1R - - 0.041 -0.211 EHV2 - - 0.058 -0.090 EHV3R - - -0.085 0.273 EHA1 -0.039 - - -0.329 EHA3R 0.039 - - 0.494 ZKOKEILU - - -0.006 - - ZTOISTU - - 0.006 - -
Standardized Expected Change for LAMBDA-Y
Price Prestige WPay -------- -------- -------- EHH1R - - 0.062 0.296 EHH3R - - 0.202 0.114 EHT2R - - -0.190 -0.114 EHT3 - - 0.112 -0.135 EHV1R - - 0.139 -0.153 EHV2 - - 0.197 -0.065 EHV3R - - -0.290 0.197 EHA1 -0.097 - - -0.238 EHA3R 0.097 - - 0.357 ZKOKEILU - - -0.022 - - ZTOISTU - - 0.020 - -
Completely Standardized Expected Change for LAMBDA-Y
Price Prestige WPay -------- -------- -------- EHH1R - - 0.014 0.065 EHH3R - - 0.058 0.033 EHT2R - - -0.057 -0.034 EHT3 - - 0.028 -0.033

294
EHV1R - - 0.053 -0.058 EHV2 - - 0.087 -0.029 EHV3R - - -0.091 0.062 EHA1 -0.027 - - -0.066 EHA3R 0.026 - - 0.095 ZKOKEILU - - -0.024 - - ZTOISTU - - 0.020 - -
No Non-Zero Modification Indices for LAMBDA-X
Modification Indices for BETA
Price Prestige WPay -------- -------- -------- Price - - 0.080 0.046 Prestige 0.080 - - 0.053 WPay - - 0.003 - -
Expected Change for BETA
Price Prestige WPay -------- -------- -------- Price - - -0.015 -0.131 Prestige -0.023 - - -0.055 WPay - - -0.001 - -
Standardized Expected Change for BETA
Price Prestige WPay -------- -------- -------- Price - - -0.002 -0.073 Prestige -0.003 - - -0.023 WPay - - 0.000 - -
Modification Indices for GAMMA
Quality -------- Price - - Prestige - - WPay 0.046
Expected Change for GAMMA
Quality -------- Price - - Prestige - - WPay 0.006
Standardized Expected Change for GAMMA
Quality -------- Price - - Prestige - - WPay 0.015
No Non-Zero Modification Indices for PHI
Modification Indices for PSI
Price Prestige WPay -------- -------- -------- Price - - Prestige 0.080 - - WPay 0.046 0.033 - -

295
Expected Change for PSI
Price Prestige WPay -------- -------- -------- Price - - Prestige -0.126 - - WPay -0.066 -0.023 - -
Standardized Expected Change for PSI
Price Prestige WPay -------- -------- -------- Price - - Prestige -0.015 - - WPay -0.036 -0.009 - -
Modification Indices for THETA-EPS
EHH1R EHH3R EHT2R EHT3 EHV1R EHV2 -------- -------- -------- -------- -------- -------- EHH1R - - EHH3R 14.229 - - EHT2R 0.204 2.106 - - EHT3 3.518 0.001 10.983 - - EHV1R 4.287 0.039 9.225 1.090 - - EHV2 0.015 12.499 0.020 3.126 1.010 - - EHV3R 3.949 0.008 4.336 17.734 19.247 0.281 EHA1 1.331 0.583 0.725 2.626 0.802 7.568 EHA3R 1.559 0.319 0.012 3.188 0.513 9.059 ZKOKEILU 5.193 0.622 0.111 0.340 1.275 0.203 ZTOISTU 1.110 0.045 0.722 0.000 0.002 0.001
Modification Indices for THETA-EPS
EHV3R EHA1 EHA3R ZKOKEILU ZTOISTU -------- -------- -------- -------- -------- EHV3R - - EHA1 3.516 - - EHA3R 1.856 - - - - ZKOKEILU 0.048 0.980 0.477 - - ZTOISTU 1.606 0.072 0.941 - - - -
Expected Change for THETA-EPS
EHH1R EHH3R EHT2R EHT3 EHV1R EHV2 -------- -------- -------- -------- -------- -------- EHH1R - - EHH3R 2.416 - - EHT2R -0.248 -0.604 - - EHT3 1.314 0.015 1.537 - - EHV1R -0.905 0.066 -0.905 -0.384 - - EHV2 -0.051 -1.099 -0.038 0.602 0.214 - - EHV3R -0.998 -0.035 0.754 -1.825 1.248 -0.131 EHA1 -0.628 -0.314 -0.290 0.720 0.244 0.724 EHA3R 0.749 0.255 0.041 -0.874 0.215 -0.874 ZKOKEILU 0.292 0.076 0.027 -0.061 -0.073 -0.028 ZTOISTU -0.155 -0.023 -0.079 -0.001 0.003 -0.002
Expected Change for THETA-EPS
EHV3R EHA1 EHA3R ZKOKEILU ZTOISTU -------- -------- -------- -------- -------- EHV3R - - EHA1 -0.568 - - EHA3R 0.454 - - - - ZKOKEILU -0.016 -0.082 0.063 - - ZTOISTU 0.106 -0.026 0.102 - - - -

296
Completely Standardized Expected Change for THETA-EPS
EHH1R EHH3R EHT2R EHT3 EHV1R EHV2 -------- -------- -------- -------- -------- -------- EHH1R - - EHH3R 0.150 - - EHT2R -0.016 -0.051 - - EHT3 0.071 0.001 0.114 - - EHV1R -0.075 0.007 -0.102 -0.036 - - EHV2 -0.005 -0.138 -0.005 0.066 0.036 - - EHV3R -0.069 -0.003 0.071 -0.142 0.149 -0.018 EHA1 -0.038 -0.025 -0.024 0.050 0.026 0.089 EHA3R 0.044 0.019 0.003 -0.058 0.022 -0.103 ZKOKEILU 0.070 0.024 0.009 -0.017 -0.031 -0.014 ZTOISTU -0.032 -0.006 -0.023 0.000 0.001 -0.001
Completely Standardized Expected Change for THETA-EPS
EHV3R EHA1 EHA3R ZKOKEILU ZTOISTU -------- -------- -------- -------- -------- EHV3R - - EHA1 -0.050 - - EHA3R 0.038 - - - - ZKOKEILU -0.006 -0.025 0.019 - - ZTOISTU 0.032 -0.007 0.026 - - - -
Modification Indices for THETA-DELTA-EPS
EHH1R EHH3R EHT2R EHT3 EHV1R EHV2 -------- -------- -------- -------- -------- -------- EHL2 0.625 9.363 1.102 1.127 0.701 0.463 EHL3 0.853 1.061 3.191 1.020 0.223 6.272
Modification Indices for THETA-DELTA-EPS
EHV3R EHA1 EHA3R ZKOKEILU ZTOISTU -------- -------- -------- -------- -------- EHL2 2.527 0.081 1.618 0.000 0.021 EHL3 0.597 0.003 1.034 0.022 0.001
Expected Change for THETA-DELTA-EPS
EHH1R EHH3R EHT2R EHT3 EHV1R EHV2 -------- -------- -------- -------- -------- -------- EHL2 0.370 1.079 0.309 0.406 -0.197 -0.154 EHL3 0.460 0.387 -0.560 -0.412 -0.118 0.604
Expected Change for THETA-DELTA-EPS
EHV3R EHA1 EHA3R ZKOKEILU ZTOISTU -------- -------- -------- -------- -------- EHL2 -0.417 0.128 -0.492 -0.001 0.012 EHL3 -0.216 0.027 0.427 0.011 -0.002
Completely Standardized Expected Change for THETA-DELTA-EPS
EHH1R EHH3R EHT2R EHT3 EHV1R EHV2 -------- -------- -------- -------- -------- -------- EHL2 0.030 0.113 0.034 0.037 -0.027 -0.025 EHL3 0.034 0.038 -0.057 -0.035 -0.015 0.091
Completely Standardized Expected Change for THETA-DELTA-EPS
EHV3R EHA1 EHA3R ZKOKEILU ZTOISTU -------- -------- -------- -------- -------- EHL2 -0.048 0.013 -0.048 0.000 0.004 EHL3 -0.023 0.003 0.039 0.004 -0.001

297
Modification Indices for THETA-DELTA
EHL2 EHL3 -------- -------- EHL2 - - EHL3 0.080 - -
Expected Change for THETA-DELTA
EHL2 EHL3 -------- -------- EHL2 - - EHL3 -0.310 - -
Completely Standardized Expected Change for THETA-DELTA
EHL2 EHL3 -------- -------- EHL2 - - EHL3 -0.039 - -
Maximum Modification Index is 19.25 for Element ( 7, 5) of THETA-EPS
! HINTA-ASENNEMUUTTUJAT
Standardized Solution
LAMBDA-Y
Price Prestige WPay -------- -------- -------- EHH1R 2.270 - - - - EHH3R 1.843 - - - - EHT2R 2.398 - - - - EHT3 2.509 - - - - EHV1R 1.846 - - - - EHV2 1.224 - - - - EHV3R 2.500 - - - - EHA1 - - 3.406 - - EHA3R - - 2.441 - - ZKOKEILU - - - - 0.723 ZTOISTU - - - - 0.954
LAMBDA-X
Quality -------- EHL2 1.925 EHL3 2.102
BETA
Price Prestige WPay -------- -------- -------- Price - - - - - - Prestige - - - - - - WPay 0.210 - - - -
GAMMA
Quality -------- Price 0.359 Prestige 0.537 WPay - -
Correlation Matrix of ETA and KSI

298
Price Prestige WPay Quality -------- -------- -------- -------- Price 1.000 Prestige 0.192 1.000 WPay 0.210 0.040 1.000 Quality 0.359 0.537 0.075 1.000
PSI Note: This matrix is diagonal.
Price Prestige WPay -------- -------- -------- 0.871 0.712 0.956
Regression Matrix ETA on KSI (Standardized)
Quality -------- Price 0.359 Prestige 0.537 WPay 0.075
! HINTA-ASENNEMUUTTUJAT
Completely Standardized Solution
LAMBDA-Y
Price Prestige WPay -------- -------- -------- EHH1R 0.496 - - - - EHH3R 0.525 - - - - EHT2R 0.716 - - - - EHT3 0.621 - - - - EHV1R 0.699 - - - - EHV2 0.540 - - - - EHV3R 0.787 - - - - EHA1 - - 0.950 - - EHA3R - - 0.652 - - ZKOKEILU - - - - 0.796 ZTOISTU - - - - 0.912
LAMBDA-X
Quality -------- EHL2 0.705 EHL3 0.719
BETA
Price Prestige WPay -------- -------- -------- Price - - - - - - Prestige - - - - - - WPay 0.210 - - - -
GAMMA
Quality -------- Price 0.359 Prestige 0.537 WPay - -
Correlation Matrix of ETA and KSI
Price Prestige WPay Quality

299
-------- -------- -------- -------- Price 1.000 Prestige 0.192 1.000 WPay 0.210 0.040 1.000 Quality 0.359 0.537 0.075 1.000
PSI Note: This matrix is diagonal.
Price Prestige WPay -------- -------- -------- 0.871 0.712 0.956
THETA-EPS
EHH1R EHH3R EHT2R EHT3 EHV1R EHV2 -------- -------- -------- -------- -------- -------- 0.754 0.724 0.487 0.614 0.511 0.709
THETA-EPS
EHV3R EHA1 EHA3R ZKOKEILU ZTOISTU -------- -------- -------- -------- -------- 0.381 0.098 0.575 0.367 0.168
THETA-DELTA
EHL2 EHL3 -------- -------- 0.504 0.483
Regression Matrix ETA on KSI (Standardized)
Quality -------- Price 0.359 Prestige 0.537 WPay 0.075
Time used: 0.016 Seconds

300
Results of the one-way analysis of variance (data 2004b)
ANOVA with age groups and random purchase Descriptives
At what price would you try this product?
age group N Mean Std. Deviation Std. Error
15 - 29 146 1,4968 ,75744 ,0626930 - 39 157 1,0897 ,55291 ,0441340 - 49 143 1,0374 ,54787 ,0458150 - 59 143 ,9500 ,59741 ,0499660 - 69 141 ,9677 ,77354 ,06514over 70 42 ,9940 ,73602 ,11357Total 772 1,1037 ,68321 ,02459Model Fixed Effects ,65652 ,02363
Random Effects ,09222
DescriptivesAt what price would you try this product?
95% Confidence Interval for Mean
Minimum Maximum
Between- Component
Variance Lower Bound Upper Bound
15 - 29 1,3730 1,6207 ,20 5,0030 - 39 1,0026 1,1769 ,05 3,0040 - 49 ,9468 1,1280 ,10 3,0050 - 59 ,8512 1,0488 ,10 3,5060 - 69 ,8389 1,0965 ,15 5,50Yli 70 ,7647 1,2234 ,05 3,45Total 1,0554 1,1519 ,05 5,50Model Fixed Effects 1,0573 1,1501
Random Effects ,8666 1,3407 ,04365
Test of Homogeneity of VariancesAt what price would you try this product? Levene Statistic df1 df2 Sig.
3,427 5 766 ,005
ANOVAAt what price would you try this product?
Sum of Squares df Mean Square F Sig.
Between Groups 29,716 5 5,943 13,788 ,000Within Groups 330,164 766 ,431
Total 359,880 771
Appendix 11: Results of the one-way analysis of variance between price estimations and background variables

301
Means Plots
ANOVA with gender and random purchase Descriptives
At what price would you try this product?
N Mean Std. Deviation Std. Error
woman 497 1,1515 ,74046 ,03321man 356 1,0151 ,55107 ,02921Total 853 1,0946 ,67101 ,02297Model Fixed Effects ,66802 ,02287
Random Effects ,06889
DescriptivesAt what price would you try this product?
95% Confidence Interval for Mean
Minimum Maximum
Between- Component
Variance Lower Bound Upper Bound
woman 1,0862 1,2167 ,05 5,50man ,9577 1,0726 ,10 3,45Total 1,0495 1,1397 ,05 5,50Model Fixed Effects 1,0497 1,1395
Random Effects ,2193 1,9699 ,00822
Test of Homogeneity of VariancesAt what price would you try this product? Levene Statistic df1 df2 Sig.
23,864 1 851 ,000

302
ANOVAAt what price would you try this product?
Sum of Squares df Mean Square F Sig.
Between Groups 3,856 1 3,856 8,641 ,003Within Groups 379,756 851 ,446Total 383,612 852
Means Plots
ANOVA with place of living and random purchase
DescriptivesAt what price would you try this product?
N Mean Std. Deviation Std. Error
metropolitan area 185 1,2194 ,68942 ,05069large city > 40 000 208 1,1483 ,66452 ,04608small city or town < 40 000 284 1,0162 ,65867 ,03908country side 176 1,0265 ,65869 ,04965Total 853 1,0946 ,67101 ,02297Model Fixed Effects ,66687 ,02283
Random Effects ,04961

303
DescriptivesAt what price would you try this product?
95% Confidence Interval for Mean
Minimum Maximum Lower Bound Upper Bound
metropolitan area 1,1194 1,3194 ,15 5,00large city > 40 000 1,0574 1,2391 ,10 3,45small city or town < 40 000 ,9392 1,0931 ,05 5,50country side ,9285 1,1245 ,05 5,00Total 1,0495 1,1397 ,05 5,50Model Fixed Effects 1,0498 1,1394
Random Effects ,9367 1,2525
DescriptivesAt what price would you try this product?
Between- Component
Variance
Model Random Effects ,00746
Test of Homogeneity of VariancesAt what price would you try this product?
Levene Statistic df1 df2 Sig.
1,521 3 849 ,208
ANOVAAt what price would you try this product?
Sum of Squares df Mean Square F Sig.
Between Groups 6,045 3 2,015 4,531 ,004Within Groups 377,568 849 ,445
Total 383,612 852
Means Plots

304
ANOVA with size of the household and random purchase Descriptives
At what price would you try this product?
N Mean Std. Deviation Std. Error
1 207 1,2265 ,71767 ,049882 508 1,0370 ,65654 ,029133 74 1,0634 ,60867 ,070764 32 1,1641 ,58368 ,103185 10 1,3000 ,59067 ,186796 2 ,6000 ,56569 ,400007 1 1,0000 . .Total 834 1,0933 ,66839 ,02314Model Fixed Effects ,66499 ,02303
Random Effects ,06420
DescriptivesAt what price would you try this product?
95% Confidence Interval for Mean
Minimum Maximum
Between- Component
Variance Lower Bound Upper Bound
1 1,1282 1,3249 ,05 5,50
2 ,9798 1,0942 ,05 5,00
3 ,9224 1,2044 ,20 3,00
4 ,9536 1,3745 ,50 2,50
5 ,8775 1,7225 ,50 2,00
6 -4,4825 5,6825 ,20 1,00
7 . . 1,00 1,00
Total 1,0479 1,1387 ,05 5,50
Model Fixed Effects 1,0481 1,1385
Random Effects ,9362 1,2504 ,00812
Test of Homogeneity of VariancesAt what price would you try this product?
Levene Statistic df1 df2 Sig.
,842a 5 827 ,520a. Groups with only one case are ignored in computing the test of homogeneity of variance for At what price would you try this product?
ANOVAAt what price would you try this product?
Sum of Squares df Mean Square F Sig.
Between Groups 6,433 6 1,072 2,424 ,025Within Groups 365,705 827 ,442
Total 372,138 833
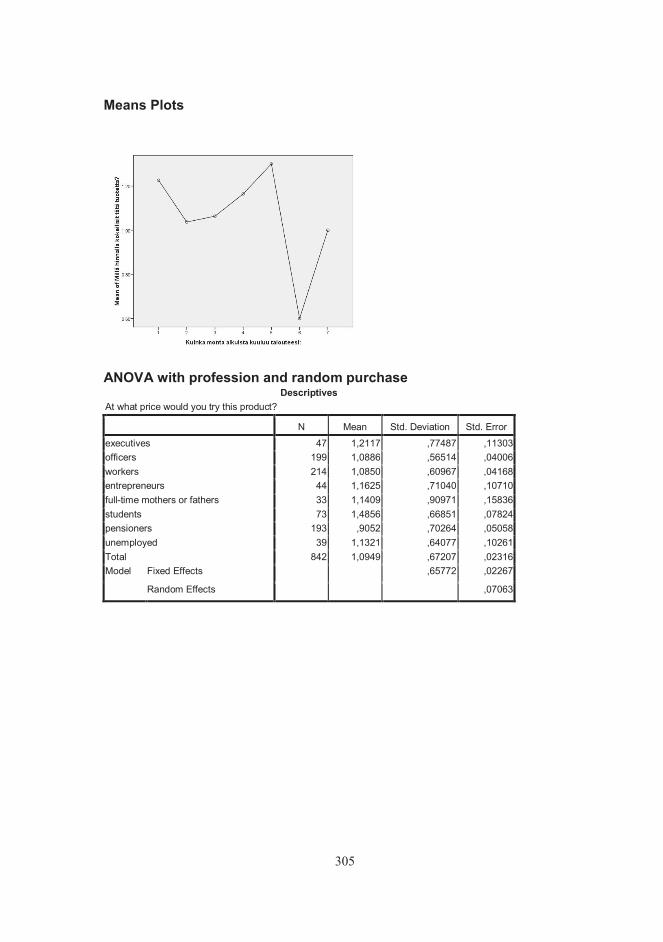
305
Means Plots
ANOVA with profession and random purchase Descriptives
At what price would you try this product?
N Mean Std. Deviation Std. Error
executives 47 1,2117 ,77487 ,11303officers 199 1,0886 ,56514 ,04006workers 214 1,0850 ,60967 ,04168entrepreneurs 44 1,1625 ,71040 ,10710full-time mothers or fathers 33 1,1409 ,90971 ,15836students 73 1,4856 ,66851 ,07824pensioners 193 ,9052 ,70264 ,05058unemployed 39 1,1321 ,64077 ,10261Total 842 1,0949 ,67207 ,02316Model Fixed Effects ,65772 ,02267
Random Effects ,07063

306
DescriptivesAt what price would you try this product?
95% Confidence Interval for Mean
Minimum Maximum Lower Bound Upper Bound
executives ,9842 1,4392 ,20 3,00officers 1,0096 1,1676 ,05 3,45workers 1,0028 1,1672 ,05 3,00entrepreneurs ,9465 1,3785 ,30 3,50full-time mothers or fathers ,8183 1,4635 ,20 5,00students 1,3296 1,6416 ,30 3,50pensioners ,8054 1,0049 ,05 5,50unemployed ,9243 1,3398 ,40 3,00Total 1,0494 1,1403 ,05 5,50Model Fixed Effects 1,0504 1,1394
Random Effects ,9279 1,2619
DescriptivesAt what price would you try this product?
Between- Component
Variance
Model Random Effects ,02355
Test of Homogeneity of VariancesAt what price would you try this product?
Levene Statistic df1 df2 Sig.
1,609 7 834 ,129
ANOVAAt what price would you try this product?
Sum of Squares df Mean Square F Sig.
Between Groups 19,086 7 2,727 6,303 ,000Within Groups 360,780 834 ,433
Total 379,865 841

307
Means Plots
ANOVA with education and random purchase
DescriptivesAt what price would you try this product?
N Mean Std. Deviation Std. Error
basic education 162 ,9818 ,66922 ,05258vocational education 250 1,0068 ,60624 ,03834matriculation examination 98 1,3872 ,61470 ,06209college degree 162 1,0297 ,66683 ,05239lower academic degree 73 1,2848 ,78375 ,09173higher academic degree 97 1,1638 ,69610 ,07068Total 842 1,0929 ,67111 ,02313Model Fixed Effects ,65859 ,02270
Random Effects ,06769
DescriptivesAt what price would you try this product?
95% Confidence Interval for Mean
Minimum Maximum Lower Bound Upper Bound
basic education ,8780 1,0856 ,10 5,00vocational education ,9312 1,0823 ,10 5,00matriculation examination 1,2640 1,5105 ,15 3,00college degree ,9262 1,1332 ,05 5,50lower academic degree 1,1019 1,4677 ,05 3,50higher academic degree 1,0235 1,3041 ,05 3,50Total 1,0475 1,1382 ,05 5,50Model Fixed Effects 1,0483 1,1374
Random Effects ,9188 1,2669

308
DescriptivesAt what price would you try this product?
Between- Component
Variance Model Random Effects ,02069
Test of Homogeneity of VariancesAt what price would you try this product?
Levene Statistic df1 df2 Sig.
2,582 5 836 ,025
ANOVAAt what price would you try this product?
Sum of Squares df Mean Square F Sig. Between Groups 16,169 5 3,234 7,456 ,000Within Groups 362,606 836 ,434
Total 378,774 841
Means Plots

309
ANOVA with income level and random purchase
DescriptivesAt what price would you try this product?
N Mean Std. Deviation Std. Error
less10 000 73 1,1479 ,66429 ,0777510 001-20 000 € 135 1,1181 ,81474 ,0701220 001-30 000 € 179 1,0992 ,63559 ,0475130 001-40 000 € 169 1,0494 ,64908 ,0499340 001-50 000 € 122 1,1611 ,60146 ,05445more 50 000 € 134 1,0585 ,62765 ,05422Total 812 1,0989 ,66709 ,02341Model Fixed Effects ,66792 ,02344
Random Effects ,02344a
a. Warning: Between-component variance is negative. It was replaced by 0.0 in computing this random effects measure.
DescriptivesAt what price would you try this product?
95% Confidence Interval for Mean
Minimum Maximum Lower Bound Upper Bound
less10 000 ,9930 1,3029 ,10 3,4510 001-20 000 € ,9794 1,2568 ,15 5,5020 001-30 000 € 1,0054 1,1929 ,05 3,5030 001-40 000 € ,9508 1,1480 ,10 5,0040 001-50 000 € 1,0533 1,2689 ,20 2,50more 50 000 € ,9513 1,1658 ,15 3,45Total 1,0530 1,1449 ,05 5,50Model Fixed Effects 1,0529 1,1449
Random Effects 1,0387a 1,1592a
a. Warning: Between-component variance is negative. It was replaced by 0.0 in computing this random effects measure.
DescriptivesAt what price would you try this product?
Between- Component
Variance
Model Random Effects -,00135
Test of Homogeneity of VariancesAt what price would you try this product?
Levene Statistic df1 df2 Sig.
,923 5 806 ,466

310
ANOVAAt what price would you try this product?
Sum of Squares df Mean Square F Sig. Between Groups 1,329 5 ,266 ,596 ,703Within Groups 359,575 806 ,446
Total 360,904 811
Means Plots
ANOVA with assets for daily use and random purchase
DescriptivesAt what price would you try this product?
N Mean Std. Deviation Std. Error
We are pressed with money 65 1,0092 ,66848 ,082912 97 1,0887 ,71678 ,072783 130 1,0230 ,62251 ,054604 236 1,1125 ,62021 ,040375 206 1,0656 ,65536 ,045666 87 1,2418 ,81839 ,08774We have plenty of money 21 1,3643 ,74618 ,16283Total 842 1,0961 ,67210 ,02316Model Fixed Effects ,67023 ,02310
Random Effects ,03364

311
DescriptivesAt what price would you try this product?
95% Confidence Interval for Mean
Minimum Maximum Lower Bound Upper Bound
We are pressed with money ,8436 1,1749 ,05 3,502 ,9442 1,2331 ,10 5,003 ,9150 1,1310 ,15 3,454 1,0329 1,1920 ,10 3,505 ,9756 1,1556 ,05 5,006 1,0674 1,4163 ,20 5,50We have plenty of money 1,0246 1,7039 ,20 3,45Total 1,0507 1,1416 ,05 5,50Model Fixed Effects 1,0508 1,1415
Random Effects 1,0138 1,1784
DescriptivesAt what price would you try this product?
Between- Component
Variance
Model Random Effects ,00310
Test of Homogeneity of VariancesAt what price would you try this product?
Levene Statistic df1 df2 Sig. 1,074 6 835 ,376
ANOVAAt what price would you try this product?
Sum of Squares df Mean Square F Sig.
Between Groups 4,804 6 ,801 1,782 ,100Within Groups 375,088 835 ,449
Total 379,892 841
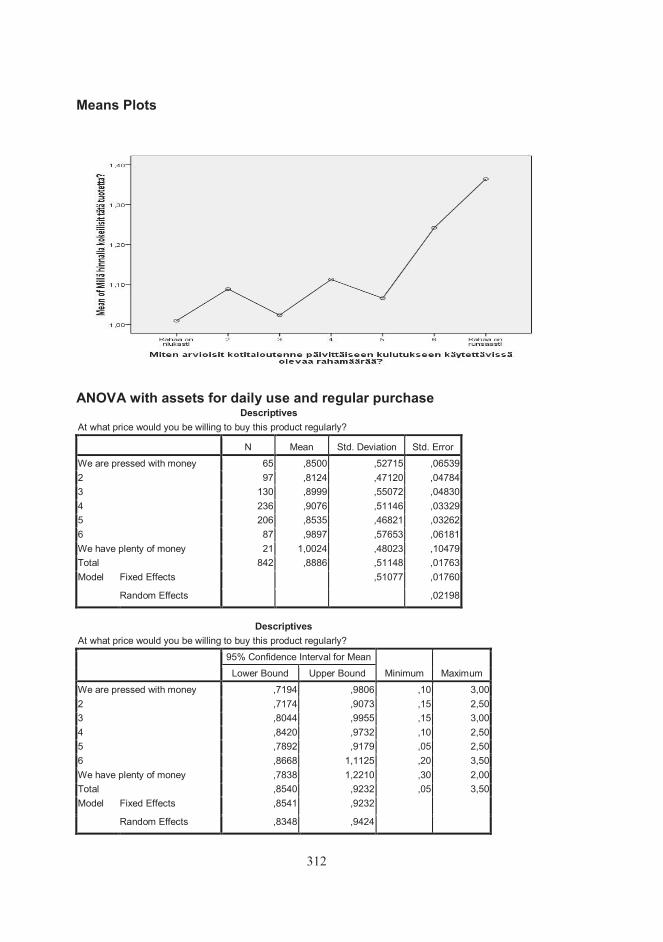
312
Means Plots
ANOVA with assets for daily use and regular purchase Descriptives
At what price would you be willing to buy this product regularly?
N Mean Std. Deviation Std. Error
We are pressed with money 65 ,8500 ,52715 ,065392 97 ,8124 ,47120 ,047843 130 ,8999 ,55072 ,048304 236 ,9076 ,51146 ,033295 206 ,8535 ,46821 ,032626 87 ,9897 ,57653 ,06181We have plenty of money 21 1,0024 ,48023 ,10479Total 842 ,8886 ,51148 ,01763Model Fixed Effects ,51077 ,01760
Random Effects ,02198
DescriptivesAt what price would you be willing to buy this product regularly?
95% Confidence Interval for Mean
Minimum Maximum Lower Bound Upper Bound
We are pressed with money ,7194 ,9806 ,10 3,002 ,7174 ,9073 ,15 2,503 ,8044 ,9955 ,15 3,004 ,8420 ,9732 ,10 2,505 ,7892 ,9179 ,05 2,506 ,8668 1,1125 ,20 3,50We have plenty of money ,7838 1,2210 ,30 2,00Total ,8540 ,9232 ,05 3,50Model Fixed Effects ,8541 ,9232
Random Effects ,8348 ,9424

313
DescriptivesAt what price would you be willing to buy this product regularly?
Between- Component
Variance
Model Random Effects ,00090
Test of Homogeneity of VariancesAt what price would you be willing to buy this product regularly?
Levene Statistic df1 df2 Sig.
,664 6 835 ,679
ANOVAAt what price would you be willing to buy this product regularly?
Sum of Squares df Mean Square F Sig.
Between Groups 2,176 6 ,363 1,390 ,216Within Groups 217,839 835 ,261
Total 220,015 841
Means Plots

314
ANOVA with income and regular purchase Descriptives
At what price would you be willing to buy this product regularly?
N Mean Std. Deviation Std. Error
Alle 10 000 euroa 73 ,8836 ,52195 ,0610910 001-20 000 euroa 135 ,9155 ,58113 ,0500220 001-30 000 euroa 179 ,8654 ,47579 ,0355630 001-40 000 euroa 169 ,8530 ,50541 ,0388840 001-50 000 euroa 122 ,9655 ,51172 ,04633Yli 50 000 euroa 134 ,8786 ,44691 ,03861Total 812 ,8900 ,50579 ,01775Model Fixed Effects ,50595 ,01776
Random Effects ,01776a
a. Warning: Between-component variance is negative. It was replaced by 0.0 in computing this random effects measure.
DescriptivesAt what price would you be willing to buy this product regularly?
95% Confidence Interval for Mean
Minimum Maximum Lower Bound Upper Bound
Alle 10 000 euroa ,7618 1,0053 ,05 3,0010 001-20 000 euroa ,8166 1,0144 ,10 3,5020 001-30 000 euroa ,7952 ,9355 ,05 2,0030 001-40 000 euroa ,7762 ,9297 ,10 2,5040 001-50 000 euroa ,8738 1,0572 ,20 2,50Yli 50 000 euroa ,8022 ,9549 ,15 2,50Total ,8551 ,9248 ,05 3,50Model Fixed Effects ,8551 ,9248
Random Effects ,8443a ,9356a
a. Warning: Between-component variance is negative. It was replaced by 0.0 in computing this random effects measure.
DescriptivesAt what price would you be willing to buy this product regularly?
Between- Component
Variance
Model Random Effects -,00020
Test of Homogeneity of VariancesAt what price would you be willing to buy this product regularly?
Levene Statistic df1 df2 Sig.
1,292 5 806 ,265

315
ANOVAAt what price would you be willing to buy this product regularly?
Sum of Squares df Mean Square F Sig. Between Groups 1,144 5 ,229 ,894 ,485Within Groups 206,326 806 ,256
Total 207,470 811
Means Plots
ANOVA with education and regular purchase
DescriptivesAt what price would you be willing to buy this product regularly?
N Mean Std. Deviation Std. Error
basic education 162 ,8265 ,52918 ,04158vocational education 250 ,8352 ,46976 ,02971matriculation examination 98 1,0755 ,57751 ,05834college degree 162 ,8567 ,50169 ,03942lower academic degree 73 ,9656 ,50519 ,05913higher academic degree 97 ,9246 ,48599 ,04935Total 842 ,8872 ,51081 ,01760Model Fixed Effects ,50589 ,01743
Random Effects ,03905

316
DescriptivesAt what price would you be willing to buy this product regularly?
95% Confidence Interval for Mean
Minimum Maximum Lower Bound Upper Bound
basic education ,7444 ,9086 ,05 2,50vocational education ,7766 ,8937 ,10 2,50matriculation examination ,9597 1,1913 ,10 3,00college degree ,7789 ,9346 ,10 3,50lower academic degree ,8477 1,0835 ,05 2,10higher academic degree ,8267 1,0226 ,05 2,00Total ,8527 ,9218 ,05 3,50Model Fixed Effects ,8530 ,9215
Random Effects ,7869 ,9876
DescriptivesAt what price would you be willing to buy this product regularly?
Between- Component
Variance
Model Random Effects ,00621
Test of Homogeneity of VariancesAt what price would you be willing to buy this product regularly?
Levene Statistic df1 df2 Sig.
,600 5 836 ,700
ANOVAAt what price would you be willing to buy this product regularly?
Sum of Squares df Mean Square F Sig.
Between Groups 5,483 5 1,097 4,285 ,001Within Groups 213,956 836 ,256
Total 219,439 841
Means Plots

317
ANOVA with profession and regular purchase
DescriptivesAt what price would you be willing to buy this product regularly?
N Mean Std. Deviation Std. Error
executives 47 ,9232 ,48756 ,07112officers 199 ,8730 ,46002 ,03261workers 214 ,9450 ,51980 ,03553entrepreneurs 44 ,8398 ,50654 ,07636full-time mothers or fathers 33 ,8742 ,44619 ,07767students 73 1,1596 ,60666 ,07100pensioners 193 ,7484 ,49754 ,03581unemployed 39 ,8718 ,47431 ,07595Total 842 ,8887 ,51196 ,01764Model Fixed Effects ,50223 ,01731
Random Effects ,05110
DescriptivesAt what price would you be willing to buy this product regularly?
95% Confidence Interval for Mean
Minimum Maximum Lower Bound Upper Bound
executives ,7800 1,0663 ,10 2,00officers ,8087 ,9373 ,05 2,50workers ,8750 1,0151 ,05 2,50entrepreneurs ,6858 ,9938 ,20 2,00full-time mothers or fathers ,7160 1,0325 ,15 2,00students 1,0180 1,3011 ,30 3,00pensioners ,6778 ,8191 ,10 3,50unemployed ,7180 1,0255 ,20 2,00Total ,8540 ,9233 ,05 3,50Model Fixed Effects ,8547 ,9226
Random Effects ,7678 1,0095
DescriptivesAt what price would you be willing to buy this product regularly?
Between- Component
Variance
Model Random Effects ,01216
Test of Homogeneity of VariancesAt what price would you be willing to buy this product regularly?
Levene Statistic df1 df2 Sig.
1,150 7 834 ,330

318
ANOVAAt what price would you be willing to buy this product regularly?
Sum of Squares df Mean Square F Sig. Between Groups 10,061 7 1,437 5,698 ,000Within Groups 210,367 834 ,252
Total 220,428 841
Means Plots
ANOVA with size of the household and regular purchase
DescriptivesAt what price would you be willing to buy this product regularly?
N Mean Std. Deviation Std. Error
1 207 ,9529 ,54316 ,037752 508 ,8597 ,49711 ,022063 74 ,8647 ,52644 ,061204 32 ,9250 ,48659 ,086025 10 1,0350 ,46550 ,147216 2 ,9250 ,10607 ,075007 1 ,7000 . .Total 834 ,8878 ,51065 ,01768Model Fixed Effects ,51059 ,01768
Random Effects ,01900
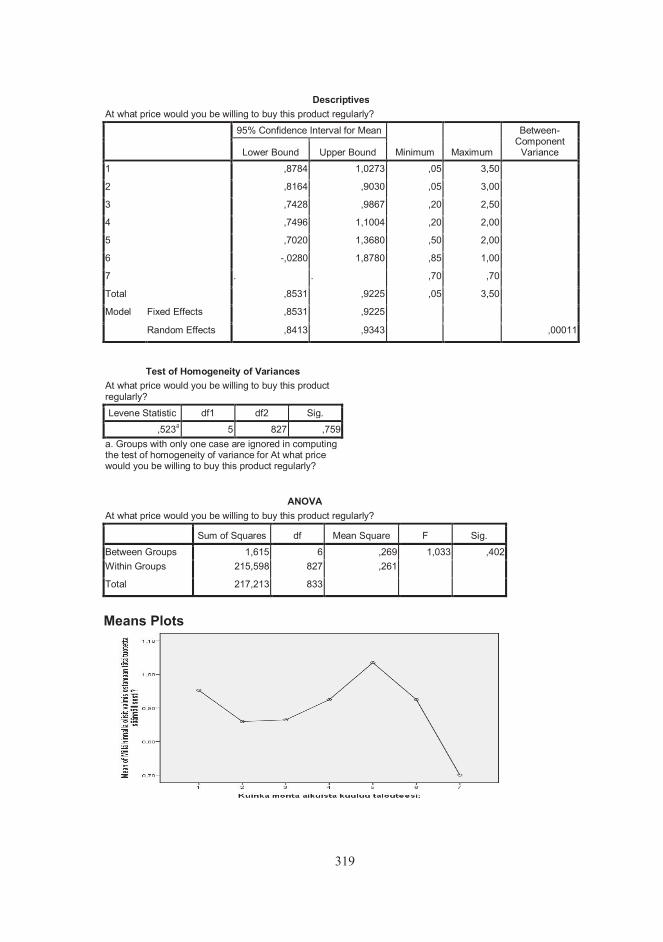
319
DescriptivesAt what price would you be willing to buy this product regularly?
95% Confidence Interval for Mean
Minimum Maximum
Between- Component
Variance Lower Bound Upper Bound
1 ,8784 1,0273 ,05 3,50
2 ,8164 ,9030 ,05 3,00
3 ,7428 ,9867 ,20 2,50
4 ,7496 1,1004 ,20 2,00
5 ,7020 1,3680 ,50 2,00
6 -,0280 1,8780 ,85 1,00
7 . . ,70 ,70
Total ,8531 ,9225 ,05 3,50
Model Fixed Effects ,8531 ,9225
Random Effects ,8413 ,9343 ,00011
Test of Homogeneity of VariancesAt what price would you be willing to buy this product regularly?
Levene Statistic df1 df2 Sig.
,523a 5 827 ,759a. Groups with only one case are ignored in computing the test of homogeneity of variance for At what price would you be willing to buy this product regularly?
ANOVAAt what price would you be willing to buy this product regularly?
Sum of Squares df Mean Square F Sig.
Between Groups 1,615 6 ,269 1,033 ,402Within Groups 215,598 827 ,261
Total 217,213 833
Means Plots

320
ANOVA with place of living and regular purchase
DescriptivesAt what price would you be willing to buy this product regularly?
N Mean Std. Deviation Std. Error
metropolitan area 185 ,9918 ,48897 ,03595large city > 40 000 208 ,9350 ,51473 ,03569small city or town < 40 000 284 ,8454 ,52980 ,03144country side 176 ,7864 ,47387 ,03572Total 853 ,8868 ,51087 ,01749Model Fixed Effects ,50623 ,01733
Random Effects ,04422
DescriptivesAt what price would you be willing to buy this product regularly?
95% Confidence Interval for Mean
Minimum Maximum Lower Bound Upper Bound
metropolitan area ,9209 1,0628 ,15 2,50large city > 40 000 ,8647 1,0054 ,10 3,00small city or town < 40 000 ,7835 ,9072 ,05 3,50country side ,7159 ,8569 ,05 2,50Total ,8525 ,9212 ,05 3,50Model Fixed Effects ,8528 ,9208
Random Effects ,7461 1,0276
DescriptivesAt what price would you be willing to buy this product regularly?
Between- Component
Variance
Model Random Effects ,00637
Test of Homogeneity of VariancesAt what price would you be willing to buy this product regularly?
Levene Statistic df1 df2 Sig.
,813 3 849 ,487
ANOVAAt what price would you be willing to buy this product regularly?
Sum of Squares df Mean Square F Sig.
Between Groups 4,789 3 1,596 6,229 ,000Within Groups 217,570 849 ,256
Total 222,358 852
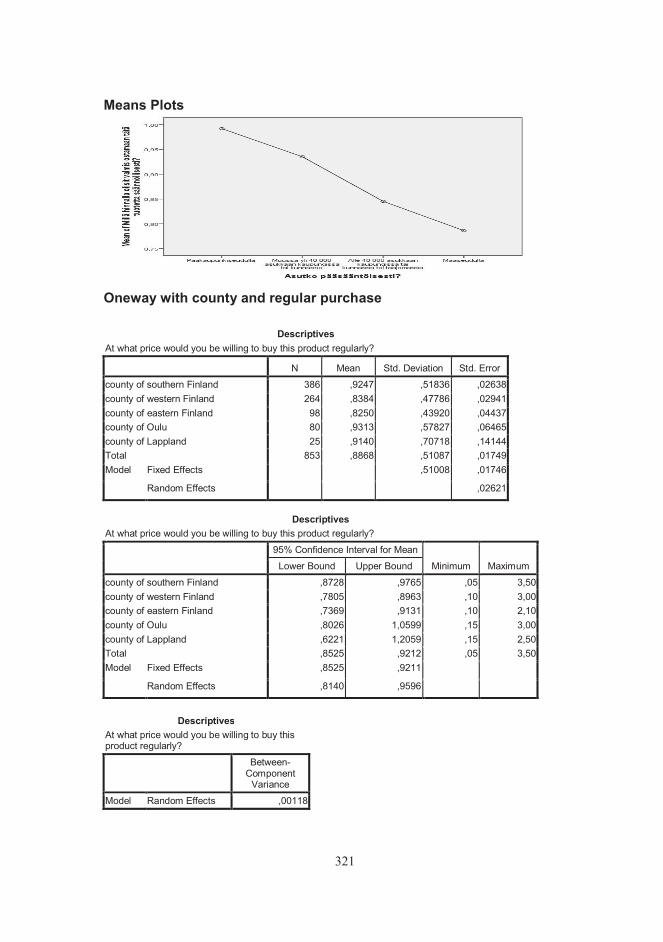
321
Means Plots
Oneway with county and regular purchase
DescriptivesAt what price would you be willing to buy this product regularly?
N Mean Std. Deviation Std. Error
county of southern Finland 386 ,9247 ,51836 ,02638county of western Finland 264 ,8384 ,47786 ,02941county of eastern Finland 98 ,8250 ,43920 ,04437county of Oulu 80 ,9313 ,57827 ,06465county of Lappland 25 ,9140 ,70718 ,14144Total 853 ,8868 ,51087 ,01749Model Fixed Effects ,51008 ,01746
Random Effects ,02621
DescriptivesAt what price would you be willing to buy this product regularly?
95% Confidence Interval for Mean
Minimum Maximum Lower Bound Upper Bound
county of southern Finland ,8728 ,9765 ,05 3,50county of western Finland ,7805 ,8963 ,10 3,00county of eastern Finland ,7369 ,9131 ,10 2,10county of Oulu ,8026 1,0599 ,15 3,00county of Lappland ,6221 1,2059 ,15 2,50Total ,8525 ,9212 ,05 3,50Model Fixed Effects ,8525 ,9211
Random Effects ,8140 ,9596
DescriptivesAt what price would you be willing to buy this product regularly?
Between- Component
Variance
Model Random Effects ,00118

322
Test of Homogeneity of VariancesAt what price would you be willing to buy this product regularly?
Levene Statistic df1 df2 Sig.
2,694 4 848 ,030
ANOVAAt what price would you be willing to buy this product regularly?
Sum of Squares df Mean Square F Sig.
Between Groups 1,722 4 ,431 1,655 ,158Within Groups 220,636 848 ,260
Total 222,358 852
Means Plots
ANOVA with gender and regular purchase
DescriptivesAt what price would you be willing to buy this product regularly?
N Mean Std. Deviation Std. Error
woman 497 ,9316 ,55618 ,02495man 356 ,8243 ,43295 ,02295Total 853 ,8868 ,51087 ,01749Model Fixed Effects ,50842 ,01741
Random Effects ,05420

323
DescriptivesAt what price would you be willing to buy this product regularly?
95% Confidence Interval for Mean
Minimum Maximum
Between- Component
Variance Lower Bound Upper Bound
woman ,8826 ,9806 ,05 3,50
man ,7792 ,8695 ,05 2,50
Total ,8525 ,9212 ,05 3,50
Model Fixed Effects ,8527 ,9210
Random Effects ,1981 1,5755 ,00513
Test of Homogeneity of Variances
At what price would you be willing to buy this product
regularly?
Levene Statistic df1 df2 Sig.
15,775 1 851 ,000
ANOVAAt what price would you be willing to buy this product regularly?
Sum of Squares df Mean Square F Sig.
Between Groups 2,387 1 2,387 9,233 ,002Within Groups 219,972 851 ,258
Total 222,358 852
Means Plots

324
ANOVA with age group and regular purchase
DescriptivesAt what price would you be willing to buy this product regularly?
N Mean Std. Deviation Std. Error
15 - 29 146 1,1345 ,57032 ,0472030 - 39 157 ,9215 ,44817 ,0357740 - 49 143 ,8839 ,50220 ,0420050 - 59 143 ,7769 ,44864 ,0375260 - 69 141 ,7379 ,49641 ,04181over 70 42 ,9107 ,62348 ,09620Total 772 ,8939 ,51855 ,01866Model Fixed Effects ,50238 ,01808
Random Effects ,06322
DescriptivesAt what price would you be willing to buy this product regularly?
95% Confidence Interval for Mean
Minimum Maximum
Between- Component
Variance Lower Bound Upper Bound
15 - 29 1,0412 1,2278 ,10 3,00
30 - 39 ,8509 ,9922 ,05 2,10
40 - 49 ,8009 ,9669 ,15 2,50
50 - 59 ,7027 ,8510 ,10 2,50
60 - 69 ,6553 ,8206 ,10 3,50
over 70 ,7164 1,1050 ,10 2,50
Total ,8573 ,9306 ,05 3,50
Model Fixed Effects ,8584 ,9294
Random Effects ,7314 1,0564 ,02015
Test of Homogeneity of VariancesAt what price would you be willing to buy this product regularly?
Levene Statistic df1 df2 Sig.
2,173 5 766 ,055
ANOVAAt what price would you be willing to buy this product regularly?
Sum of Squares df Mean Square F Sig.
Between Groups 13,988 5 2,798 11,084 ,000Within Groups 193,328 766 ,252
Total 207,315 771

325
Means Plots

326
Results of the cluster analysis based on the Food Price Attitude factors 2002 data: four cluster solution, K-means cluster analysis
Quick Cluster Initial Cluster Centers
Cluster
1 2 3 4
REGR factor score 1 for analysis 2 1,60107 -1,69066 -1,41145 1,42730
REGR factor score 2 for analysis 2 -1,48416 2,56120 -1,29334 2,18686
REGR factor score 3 for analysis 2 -1,31785 -1,44938 1,55105 1,32541
Iteration Historya
Iteration
Change in Cluster Centers
1 2 3 4
1 1,681 1,208 1,436 1,3612 ,409 ,101 ,082 ,1043 ,169 ,051 ,042 ,0764 ,101 ,032 ,035 ,0785 ,041 ,020 ,036 ,0576 ,027 ,026 ,055 ,1017 ,033 ,042 ,032 ,1038 ,033 ,069 ,022 ,1119 ,063 ,041 ,023 ,08810 ,074 ,018 ,028 ,087a. Iterations stopped because the maximum number of iterations was performed. Iterations failed to converge. The maximum absolute coordinate change for any center is ,084. The current iteration is 10. The minimum distance between initial centers is 3,773.
Final Cluster Centers
Cluster
1 2 3 4
REGR factor score 1 for analysis 2 ,51804 -,79747 -,63787 ,63716
REGR factor score 2 for analysis 2 -,42623 ,93760 -,37022 ,87166
REGR factor score 3 for analysis 2 -,57739 -,71788 ,38243 ,57695
ANOVA
Cluster Error
F Sig. Mean Square df Mean Square df
REGR factor score 1 for analysis 2
164,318 3 ,409 1152 402,154 ,000
REGR factor score 2 for analysis 2
150,453 3 ,323 1152 465,604 ,000
REGR factor score 3 for analysis 2
144,804 3 ,331 1152 437,763 ,000
The F tests should be used only for descriptive purposes because the clusters have been chosen to maximize the differences among cases in different clusters. The observed significance levels are not corrected for this and thus cannot be interpreted as tests of the hypothesis that the cluster means are equal.
Appendix 12: Results of the K-means cluster analysis in 2002, 2004a and 2004b based on the food price attitude dimensions

327
Number of Cases in each Cluster
Cluster 1 383,000
2 111,000
3 417,000
4 245,000
Valid 1156,000
Missing ,000
2004a data: four cluster solution, K-means cluster analysis
Quick Cluster Initial Cluster Centers
Cluster
1 2 3 4
REGR factor score 1 for analysis 3 ,19810 ,32080 1,98459 -2,01372REGR factor score 2 for analysis 3 ,61537 -1,45103 1,76630 2,09126REGR factor score 3 for analysis 3 1,56524 -1,56738 -1,67601 -1,27009
Iteration Historya
Iteration
Change in Cluster Centers
1 2 3 4
1 ,970 1,166 1,415 1,5322 ,147 ,141 ,351 ,2583 ,083 ,101 ,201 ,1214 ,080 ,063 ,156 ,1195 ,054 ,040 ,066 ,0666 ,046 ,022 ,053 ,0667 ,046 ,011 ,050 ,0408 ,031 ,015 ,041 ,0169 ,030 ,028 ,043 ,01810 ,020 ,015 ,040 ,009a. Iterations stopped because the maximum number of iterations was performed. Iterations failed to converge. The maximum absolute coordinate change for any center is ,040. The current iteration is 10. The minimum distance between initial centers is 3,624.
Final Cluster Centers
Cluster
1 2 3 4
REGR factor score 1 for analysis 3 -,19881 -,36206 1,14648 -,61006REGR factor score 2 for analysis 3 -,33473 -,73447 ,40055 ,98920REGR factor score 3 for analysis 3 ,92386 -,91681 -,12024 -,34333
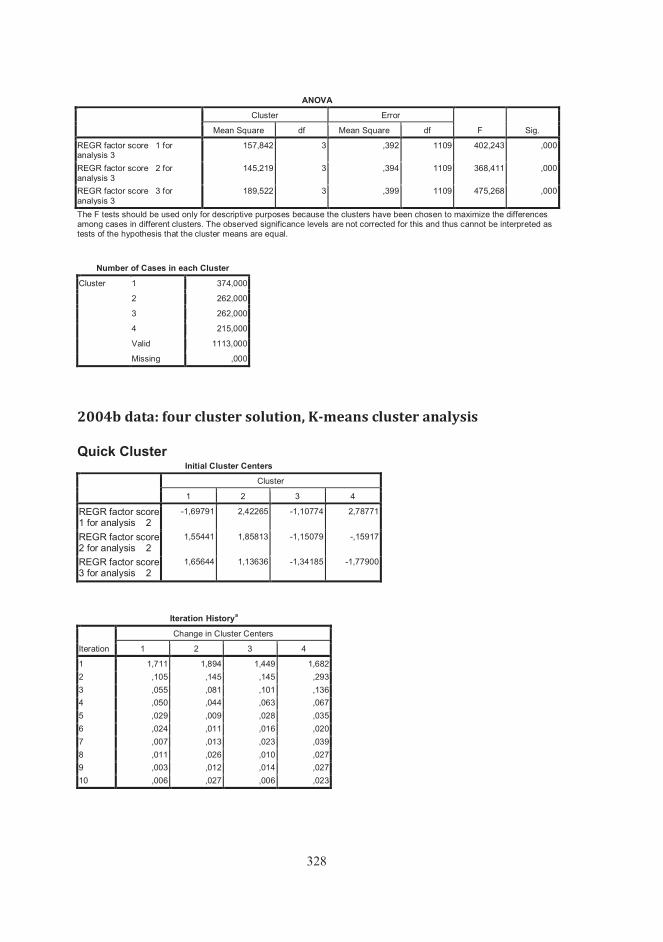
328
ANOVA
Cluster Error
F Sig. Mean Square df Mean Square df
REGR factor score 1 for analysis 3
157,842 3 ,392 1109 402,243 ,000
REGR factor score 2 for analysis 3
145,219 3 ,394 1109 368,411 ,000
REGR factor score 3 for analysis 3
189,522 3 ,399 1109 475,268 ,000
The F tests should be used only for descriptive purposes because the clusters have been chosen to maximize the differences among cases in different clusters. The observed significance levels are not corrected for this and thus cannot be interpreted as tests of the hypothesis that the cluster means are equal.
Number of Cases in each Cluster
Cluster 1 374,000
2 262,000
3 262,000
4 215,000
Valid 1113,000
Missing ,000
2004b data: four cluster solution, K-means cluster analysis
Quick Cluster Initial Cluster Centers
Cluster
1 2 3 4
REGR factor score 1 for analysis 2
-1,69791 2,42265 -1,10774 2,78771
REGR factor score 2 for analysis 2
1,55441 1,85813 -1,15079 -,15917
REGR factor score 3 for analysis 2
1,65644 1,13636 -1,34185 -1,77900
Iteration Historya
Iteration
Change in Cluster Centers
1 2 3 4
1 1,711 1,894 1,449 1,6822 ,105 ,145 ,145 ,2933 ,055 ,081 ,101 ,1364 ,050 ,044 ,063 ,0675 ,029 ,009 ,028 ,0356 ,024 ,011 ,016 ,0207 ,007 ,013 ,023 ,0398 ,011 ,026 ,010 ,0279 ,003 ,012 ,014 ,02710 ,006 ,027 ,006 ,023

329
Iteration Historya
Iteration
Change in Cluster Centers
1 2 3 4
1 1,711 1,894 1,449 1,6822 ,105 ,145 ,145 ,2933 ,055 ,081 ,101 ,1364 ,050 ,044 ,063 ,0675 ,029 ,009 ,028 ,0356 ,024 ,011 ,016 ,0207 ,007 ,013 ,023 ,0398 ,011 ,026 ,010 ,0279 ,003 ,012 ,014 ,02710 ,006 ,027 ,006 ,023a. Iterations stopped because the maximum number of iterations was performed. Iterations failed to converge. The maximum absolute coordinate change for any center is ,022. The current iteration is 10. The minimum distance between initial centers is 3,564.
Final Cluster Centers
Cluster
1 2 3 4
REGR factor score 1 for analysis 2
-,55598 1,12828 -,62498 ,74826
REGR factor score 2 for analysis 2
,40444 ,28775 -,56462 -,03713
REGR factor score 3 for analysis 2
,64962 ,70146 -,56001 -,80050
ANOVACluster Error
F Sig. Mean Square df Mean Square df
REGR factor score 1 for analysis 2
113,033 3 ,379 818 298,418 ,000
REGR factor score 2 for analysis 2
70,049 3 ,447 818 156,669 ,000
REGR factor score 3 for analysis 2
154,685 3 ,263 818 587,650 ,000
The F tests should be used only for descriptive purposes because the clusters have been chosen to maximize the differences among cases in different clusters. The observed significance levels are not corrected for this and thus cannot be interpreted as tests of the hypothesis that the cluster means are equal.
Number of Cases in each Cluster
Cluster 1 254,000
2 153,000
3 249,000
4 166,000Valid 822,000Missing 31,000

330
Results of the Quick Cluster for classifying subjects according the willingness to buy premium priced food products
Initial Cluster Centers
Cluster
1 2 3
taste 7 2 7ingredients 6 7 1familiarity 7 7 1naturalness 6 1 1modern technology 6 1 1speciality 7 1 1health effect 1 7 1
Iteration Historya
Iteration
Change in Cluster Centers
1 2 3
1 5,558 5,419 5,1102 ,347 ,580 ,7023 ,272 ,472 ,4304 ,210 ,267 ,2245 ,126 ,126 ,1386 ,081 ,076 ,0527 ,028 ,030 ,0248 ,015 ,010 ,0009 ,013 ,009 ,00010 ,000 ,000 ,000a. Convergence achieved due to no or small change in cluster centers. The maximum absolute coordinate change for any center is ,000. The current iteration is 10. The minimum distance between initial centers is 11,533.
Final Cluster Centers
Cluster
1 2 3
taste 5 5 3ingredients 6 5 3familiarity 5 4 3naturalness 5 4 2modern technology 4 2 2speciality 4 2 2health effect 5 4 3
Appendix 13: Results of the K-means cluster analysis in 2002 based on the willingness to buy higher priced food product with different quality benefits and the results of the T-test
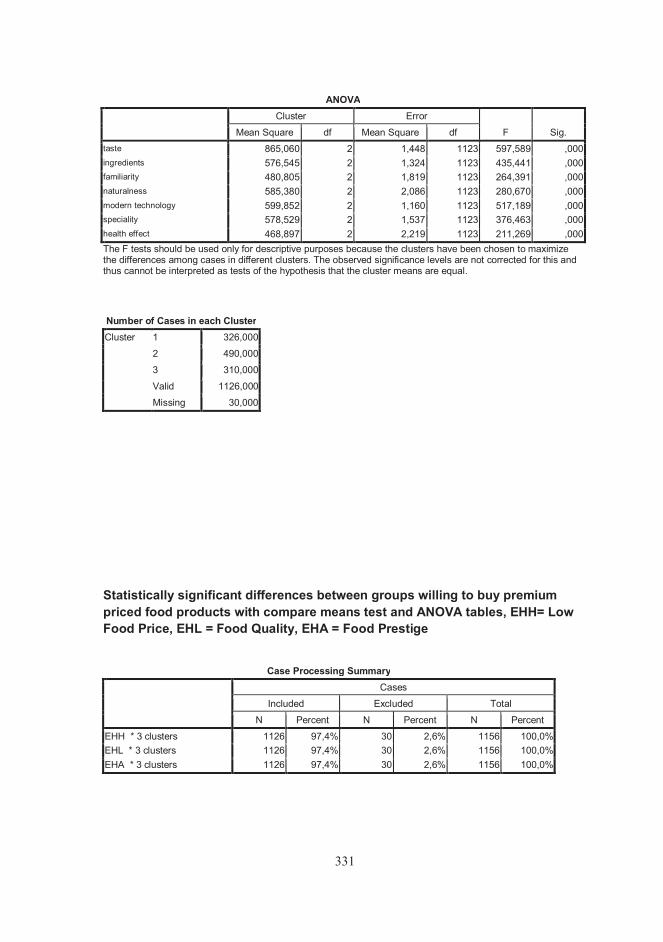
331
ANOVACluster Error
F Sig. Mean Square df Mean Square dftaste 865,060 2 1,448 1123 597,589 ,000ingredients 576,545 2 1,324 1123 435,441 ,000familiarity 480,805 2 1,819 1123 264,391 ,000naturalness 585,380 2 2,086 1123 280,670 ,000modern technology 599,852 2 1,160 1123 517,189 ,000speciality 578,529 2 1,537 1123 376,463 ,000health effect 468,897 2 2,219 1123 211,269 ,000The F tests should be used only for descriptive purposes because the clusters have been chosen to maximize the differences among cases in different clusters. The observed significance levels are not corrected for this and thus cannot be interpreted as tests of the hypothesis that the cluster means are equal.
Number of Cases in each ClusterCluster 1 326,000
2 490,000
3 310,000
Valid 1126,000
Missing 30,000
Statistically significant differences between groups willing to buy premium priced food products with compare means test and ANOVA tables, EHH= Low Food Price, EHL = Food Quality, EHA = Food Prestige
Case Processing SummaryCases
Included Excluded Total
N Percent N Percent N Percent
EHH * 3 clusters 1126 97,4% 30 2,6% 1156 100,0%EHL * 3 clusters 1126 97,4% 30 2,6% 1156 100,0%EHA * 3 clusters 1126 97,4% 30 2,6% 1156 100,0%

332
Report3 clusters EHH EHL EHA
1 Mean 3,4947 4,0025 4,0828
N 326 326 326
Std. Deviation 1,37168 1,22577 1,727842 Mean 3,4630 3,4853 3,8847
N 490 490 490Std. Deviation 1,34111 1,06523 1,62152
3 Mean 2,9539 2,8761 3,1532N 310 310 310Std. Deviation 1,25105 1,00697 1,56206
Total Mean 3,3320 3,4673 3,7407N 1126 1126 1126Std. Deviation 1,34527 1,17696 1,67737
ANOVA TableSum of Squares df
Mean Square F Sig.
EHH * 3 clusters Between Groups
(Combined) 61,353 2 30,677 17,446 ,000
Within Groups 1974,620 1123 1,758
Total 2035,973 1125
EHL * 3 clusters Between Groups
(Combined) 201,862 2 100,931 83,556 ,000
Within Groups 1356,516 1123 1,208
Total 1558,377 1125
EHA * 3 clusters Between Groups
(Combined) 155,306 2 77,653 28,972 ,000
Within Groups 3009,971 1123 2,680
Total 3165,277 1125
Measures of Association
Eta Eta Squared
EHH * 3 clusters ,174 ,030EHL * 3 clusters ,360 ,130EHA * 3 clusters ,222 ,049

333
T-Test between extreme groups Group Statistics
WILLBUY N Mean Std. Deviation Std. Error Mean
taste 1 326 5,45 1,246 ,069
0 310 2,65 1,285 ,073
better ingredients 1 326 5,55 1,062 ,059
0 310 3,10 1,301 ,074
familiarity 1 326 5,15 1,292 ,072
0 310 2,76 1,310 ,074
naturalness 1 326 4,74 1,367 ,076
0 310 2,07 1,168 ,066
modern technology 1 326 4,26 1,209 ,067
0 310 2,00 1,119 ,064
speciality 1 326 4,33 1,412 ,078
0 310 2,09 1,283 ,073
health effect 1 326 5,31 1,153 ,064
0 310 2,88 1,497 ,085
Independent Samples Test
Levene's Test for Equality of Variances t-test for Equality of Means
F Sig. t df Sig. (2-tailed)
Mean Difference
Std. Error Difference
95% Confidence Interval of the
Difference
Lower Upper
taste Equal variances assumed ,058 ,810 27,887 634 ,000 2,799 ,100 2,602 2,996
Equal variances not assumed 27,866 629,849 ,000 2,799 ,100 2,602 2,997
better ingredients Equal variances assumed 7,479 ,006 26,059 634 ,000 2,449 ,094 2,265 2,634
Equal variances not assumed 25,928 596,897 ,000 2,449 ,094 2,264 2,635
familiarity Equal variances assumed ,003 ,958 23,182 634 ,000 2,392 ,103 2,189 2,595
Equal variances not assumed 23,174 631,377 ,000 2,392 ,103 2,189 2,595
naturalness Equal variances assumed 11,964 ,001 26,344 634 ,000 2,662 ,101 2,464 2,860
Equal variances not assumed 26,448 626,892 ,000 2,662 ,101 2,464 2,860
modern technology
Equal variances assumed 2,170 ,141 24,408 634 ,000 2,258 ,092 2,076 2,439
Equal variances not assumed 24,455 633,552 ,000 2,258 ,092 2,076 2,439
speciality Equal variances assumed 3,372 ,067 20,942 634 ,000 2,244 ,107 2,034 2,455
Equal variances not assumed 20,993 632,691 ,000 2,244 ,107 2,034 2,454
health effect Equal variances assumed 9,929 ,002 22,995 634 ,000 2,429 ,106 2,222 2,637
Equal variances not assumed 22,847 580,214 ,000 2,429 ,106 2,220 2,638

334
Results of Logistic Regression
[DataSet1] D:\UserProfiles\saollila\My Documents\2002 log regg.sav
Case Processing Summary
Unweighted Casesa N Percent
Selected Cases Included in Analysis 636 55,0
Missing Cases 520 45,0
Total 1156 100,0
Unselected Cases 0 ,0
Total 1156 100,0a. If weight is in effect, see classification table for the total number of cases.
Dependent Variable Encoding
Original Value Internal Value
0 01 1
Block 0: Beginning Block
Classification Tablea,b
Observed
Predicted
DWBUY
0 1 Percentage Correct
Step 0 DWBUY 0 0 310 ,0
1 0 326 100,0
Overall Percentage 51,3a. Constant is included in the model. b. The cut value is ,500
Variables in the Equation
B S.E. Wald df Sig. Exp(B)
Step 0 Constant ,050 ,079 ,402 1 ,526 1,052
Variables not in the Equation
Score df Sig.
Step 0 Variables FAC1_2 12,876 1 ,000
FAC2_2 119,992 1 ,000
FAC3_2 28,033 1 ,000
Overall Statistics 138,090 3 ,000
Appendix 14: Results of the logistic regression analysis

335
Block 1: Method = Forward Stepwise (Likelihood Ratio)
Omnibus Tests of Model Coefficients
Chi-square df Sig.
Step 1 Step 131,339 1 ,000
Block 131,339 1 ,000
Model 131,339 1 ,000
Step 2 Step 15,795 1 ,000
Block 147,134 2 ,000
Model 147,134 2 ,000
Step 3 Step 6,745 1 ,009
Block 153,879 3 ,000
Model 153,879 3 ,000
Model Summary
Step -2 Log likelihood Cox & Snell R
Square Nagelkerke R
Square
1 749,942a ,187 ,2492 734,146a ,207 ,2753 727,402a ,215 ,287a. Estimation terminated at iteration number 4 because parameter estimates changed by less than ,001.
Hosmer and Lemeshow Test
Step Chi-square df Sig.
1 4,427 8 ,8172 10,488 8 ,2323 11,088 8 ,197

336
Contingency Table for Hosmer and Lemeshow Test
DWBUY = 0 DWBUY = 1
Total Observed Expected Observed Expected
Step 1 1 52 51,856 12 12,144 64
2 42 46,779 22 17,221 64
3 46 42,598 18 21,402 64
4 37 39,272 27 24,728 64
5 39 34,774 25 29,226 64
6 30 30,381 34 33,619 64
7 24 24,922 40 39,078 64
8 21 19,500 43 44,500 64
9 13 13,144 51 50,856 64
10 6 6,775 54 53,225 60Step 2 1 50 53,067 14 10,933 64
2 53 47,374 11 16,626 643 43 43,577 21 20,423 644 33 39,410 31 24,590 645 37 34,905 27 29,095 646 31 30,490 33 33,510 647 29 24,987 35 39,013 648 16 18,261 48 45,739 649 15 12,086 49 51,914 6410 3 5,843 57 54,157 60
Step 3 1 51 53,667 13 10,333 642 52 48,417 12 15,583 643 41 43,848 23 20,152 644 41 39,310 23 24,690 645 31 34,969 33 29,031 646 34 29,635 30 34,365 647 30 24,426 34 39,574 648 11 17,927 53 46,073 649 14 12,140 50 51,860 6410 5 5,660 55 54,340 60
Classification Tablea
Observed
Predicted
DWBUY
0 1 Percentage Correct
Step 1 DWBUY 0 221 89 71,3
1 108 218 66,9
Overall Percentage 69,0
Step 2 DWBUY 0 221 89 71,3
1 114 212 65,0
Overall Percentage 68,1
Step 3 DWBUY 0 218 92 70,3
1 107 219 67,2
Overall Percentage 68,7a. The cut value is ,500

337
Variables in the Equation
B S.E. Wald df Sig. Exp(B)
Step 1a FAC2_2 1,171 ,117 100,845 1 ,000 3,225
Constant ,105 ,089 1,401 1 ,237 1,111Step 2b FAC2_2 1,135 ,118 93,175 1 ,000 3,112
FAC3_2 ,425 ,108 15,515 1 ,000 1,529Constant ,143 ,091 2,487 1 ,115 1,154
Step 3c FAC1_2 ,260 ,101 6,673 1 ,010 1,297FAC2_2 1,118 ,118 90,468 1 ,000 3,059FAC3_2 ,423 ,108 15,233 1 ,000 1,526Constant ,157 ,091 2,945 1 ,086 1,170
a. Variable(s) entered on step 1: FAC2_2. b. Variable(s) entered on step 2: FAC3_2. c. Variable(s) entered on step 3: FAC1_2.
Model if Term Removed
Variable Model Log Likelihood
Change in -2 Log Likelihood df Sig. of the Change
Step 1 FAC2_2 -440,640 131,339 1 ,000Step 2 FAC2_2 -426,411 118,676 1 ,000
FAC3_2 -374,971 15,795 1 ,000Step 3 FAC1_2 -367,073 6,745 1 ,009
FAC2_2 -420,717 114,033 1 ,000FAC3_2 -371,443 15,483 1 ,000
Variables not in the Equation
Score df Sig.
Step 1 Variables FAC1_2 7,055 1 ,008
FAC3_2 15,855 1 ,000
Overall Statistics 22,454 2 ,000Step 2 Variables FAC1_2 6,747 1 ,009
Overall Statistics 6,747 1 ,009

338
Step number: 1
Observed Groups and Predicted Probabilities
20 1
1 1
1 1
F 0 0
R 15 0 0 1 1
E 0 0 1 1
Q 0 1 0 11 1 1 1 1 1
U 0 1 1 0101 11 1 11 1 1 1 1
E 10 01 1 11 0101 11 1 111 1 1 1 1 1 1 1 1 1
N 00 1 1 111 0101111 1 1 111 1 1 1 1 1 1 1 1 1
C 0 000 0 1010100010011011 01100011111011 111 11 1 111 11 11 1 111Y 0 1 000 0 0010100000001011 00100011111010 111 1111 0 011 1 111 11 111 111 1 5 0 0 0001010010100000001001100100010111010 101 111110 011 1 1111111111 111 11
1 0 0 00010100100000000000001001000000010101101 1111101011 1 1111011111 111 11
0010001000000000000000000000000000000000001000001101000100110111001011111111111111 1
00000001000000000000000000000000000000000000000000001000000000001001001100001010111Predicted
Prob:0 ,1 ,2 ,3 ,4 ,5 ,6 ,7 ,8 ,91 Group:0000000000000000000000000000000000000000000000000011111111111111111111111111111111111111111111111111
Predicted Probability is of Membership for 1 The Cut Value is ,50 Symbols: 0 - 0 1 - 1 Each Symbol Represents 1,25 Cases

339
Step number: 2
Observed Groups and Predicted Probabilities
20
1
F 1
R 15 1
E 01
Q 00 1 1 1 1 1
U 1 100 111 1 1 11 1 1
E 10 1 1 1001 11111 1 1 1 111 1 1 1 1
N 1 1 0001 111111 1 11 1 11111 1 1 1 1 1 1 11 1
C 0 01 00 0000101100011 111110101101 011111 111 111 1 111 11 11 1
Y 1 0 01000 0000100100011 111100101101 1011111 111 1111 11 111 111 11 11 5 11 1100 01000 0000100000010 110100001101110110111 011 11 1111 11 1111111111 1111
0000100000000100000000000001000000000001100010001 01111111111111 11111111111111111
0000000000000000000000000000000000000000000000000010001011010011110011100011111111111
1000000000000000000000000000000000000000000000000000100000000000000000001000001110110111
Predicted
Prob: 0 ,1 ,2 ,3 ,4 ,5 ,6 ,7 ,8 ,9 1 Group: 0000000000000000000000000000000000000000000000000011111111111111111111111111111111111111111111111111
Predicted Probability is of Membership for 1 The Cut Value is ,50 Symbols: 0 - 0 1 - 1 Each Symbol Represents 1,25 Cases
Step number: 3
Observed Groups and Predicted Probabilities
20
1
F 1 1
R 15 1 1
E 1 1
Q 0 1 1 11 1 1
U 0 1 1 11 1 1 1
E 10 1 0 1 1 1 111 1 1 1 11 1
N 1 1 0 0 0 1 1 110 111 11 1 111 1101 1 1 1 111 1 C 1 00100 0101011 1111100 101 11 1 111 11101 1 1 1 11 1111 1 11111 1 1 Y 0 0 0000010000001 01100001100 11 01111 1100111 1 1 1111111111 11111111 1 1111
5 011110 0000010000000 00100001000101 01101 1000011011110 1111111111 11111111 1 1111
00101010000000000000 0010000000010010100111000001011110 11111111111 11111111 11 1111
00000000000000000000000000000000000010000010000000011000010101111001101001101111111111
0000000000000000000000000000000000000000000000000000000001000000100000000010101110011111 Predicted
Prob: 0 ,1 ,2 ,3 ,4 ,5 ,6 ,7 ,8 ,9 1 Group: 0000000000000000000000000000000000000000000000000011111111111111111111111111111111111111111111111111

340
Predicted Probability is of Membership for 1 The Cut Value is ,50 Symbols: 0 - 0 1 - 1 Each Symbol Represents 1,25 Cases.
Casewise Listb
Case Selected Statusa
Observed
Predicted Predicted Group
Temporary Variable
DWBUY Resid ZResid
66 S 0** ,876 1 -,876 -2,653332 S 1** ,126 0 ,874 2,632471 S 1** ,135 0 ,865 2,534625 S 0** ,916 1 -,916 -3,302841 S 0** ,926 1 -,926 -3,548a. S = Selected, U = Unselected cases, and ** = Misclassified cases. b. Cases with studentized residuals greater than 2,000 are listed.
Related Documents