1 Krause Fund Research Spring 2015 Consumer Staples Kraft Foods Group, Inc. (NASDAQ: KRFT) Recommendation: SELL Analysts Di Yan [email protected] Leslie Wille [email protected] Yuqing Fang [email protected] Company Overview Kraft Foods Group, Inc. (NASDAQ: KRFT) is one of the largest consumer packaged food and beverage companies in North America and worldwide. Kraft was founded in 1980 and is headquartered in Northfield, Illinois. In March 2014, Kraft Foods Group and H.J. Heinz Company announced that they would merge into The Kraft Heinz Company, becoming the third largest food and beverage company in North America. i Kraft currently operates in seven business segments: Beverages, Cheese, Refrigerated Meals, Meals & Desserts, Enhancers & Snack Nuts, Canada, and Others, all of which are primarily in the United States and Canada. In 2014, Kraft’s net income decreased by 61.6%, but gained a sharp stock appreciation of approximately 38% after the merger announcement. The biggest revenue streams of Kraft are from the cheese and refrigerated meals segments. ii,iii Stock Performance Highlights Market Capitalization $52.05B Share Outstanding 601.4M 52 Week Range $53.33 – $91.32 Beta Value 0.60 Average Daily Volume 6.785M Key Statistics Book Value Per Share $7.43 EPS (ttm) $1.75 Dividend Yield 2.50% Dividend Payout $2.20 Price/Earnings (ttm) 50.79 Price/Sales (ttm) 2.83 Price/Book (mrq) 11.79 Financial Ratios Return on Assets (ttm) 5.41% Return on Equity (ttm) 21.84% Operation Margin (ttm) 10.96% Current Ratio 1.00 Debt to Equity 2.29 Current Price $86.94 Target Price $70.64 Concerns behind the Future No. 5 Food and Beverage Company in the World • Kraft’s stock price soared upwards by 47.71% after the merger with Heinz was announced, but we predict that its stock price will return to normal levels of $65.00-$75.00 when Kraft continues to underperform the market expectation. Although the merger will probably increase international sales due to Heinz’s high international presence and save costs for Kraft as the new company achieves higher level of economies of scale, the appreciation of U.S. dollar can offset part of incremental profits. • Kraft’s revenues have decreased since 2010 and its net income hit a four-year low in 2014. Earnings per share declined by 60.7% during 2014 and Kraft’s relatively high debt to equity ratio demonstrates its potential low liquidity and high default risk. Free cash flow dropped from $4,449 million to $607 million last year. The state of the economy also is expected to improve within the next five years; therefore, we expect Kraft’s net income to grow 1.02% this year, and 2.01% in 2019. • In recent years, Kraft was almost involved in several product recalls due to various food quality issues every year. Since the food products industry is highly competitive and consumers care about the safety of foods, there is no doubt that frequent products recalls can lessen the company’s reputation and shrink the consumer base. • Kraft’s stock price largely underperformed the consumer staples sector market index as well as S&P 500 last year. 12-Month Stock Performance (S&P 500 in Red & Consumer Staples Sector in Black) Figure 1:Source: Yahoo! Finance April April 30, 2015

Welcome message from author
This document is posted to help you gain knowledge. Please leave a comment to let me know what you think about it! Share it to your friends and learn new things together.
Transcript
1
Krause Fund Research Spring 2015
Consumer Staples Kraft Foods Group, Inc. (NASDAQ: KRFT) Recommendation: SELL Analysts Di Yan [email protected] Leslie Wille [email protected] Yuqing Fang [email protected]
Company Overview Kraft Foods Group, Inc. (NASDAQ: KRFT) is one of the largest consumer packaged food and beverage companies in North America and worldwide. Kraft was founded in 1980 and is headquartered in Northfield, Illinois. In March 2014, Kraft Foods Group and H.J. Heinz Company announced that they would merge into The Kraft Heinz Company, becoming the third largest food and beverage company in North America.i Kraft currently operates in seven business segments: Beverages, Cheese, Refrigerated Meals, Meals & Desserts, Enhancers & Snack Nuts, Canada, and Others, all of which are primarily in the United States and Canada. In 2014, Kraft’s net income decreased by 61.6%, but gained a sharp stock appreciation of approximately 38% after the merger announcement. The biggest revenue streams of Kraft are from the cheese and refrigerated meals segments.ii,iii
Stock Performance Highlights Market Capitalization $52.05B Share Outstanding 601.4M 52 Week Range $53.33 – $91.32 Beta Value 0.60 Average Daily Volume 6.785M Key Statistics Book Value Per Share $7.43 EPS (ttm) $1.75 Dividend Yield 2.50% Dividend Payout $2.20 Price/Earnings (ttm) 50.79 Price/Sales (ttm) 2.83 Price/Book (mrq) 11.79 Financial Ratios Return on Assets (ttm) 5.41% Return on Equity (ttm) 21.84% Operation Margin (ttm) 10.96% Current Ratio 1.00 Debt to Equity 2.29
Current Price $86.94
Target Price $70.64
Concerns behind the Future No. 5 Food and Beverage Company in the World
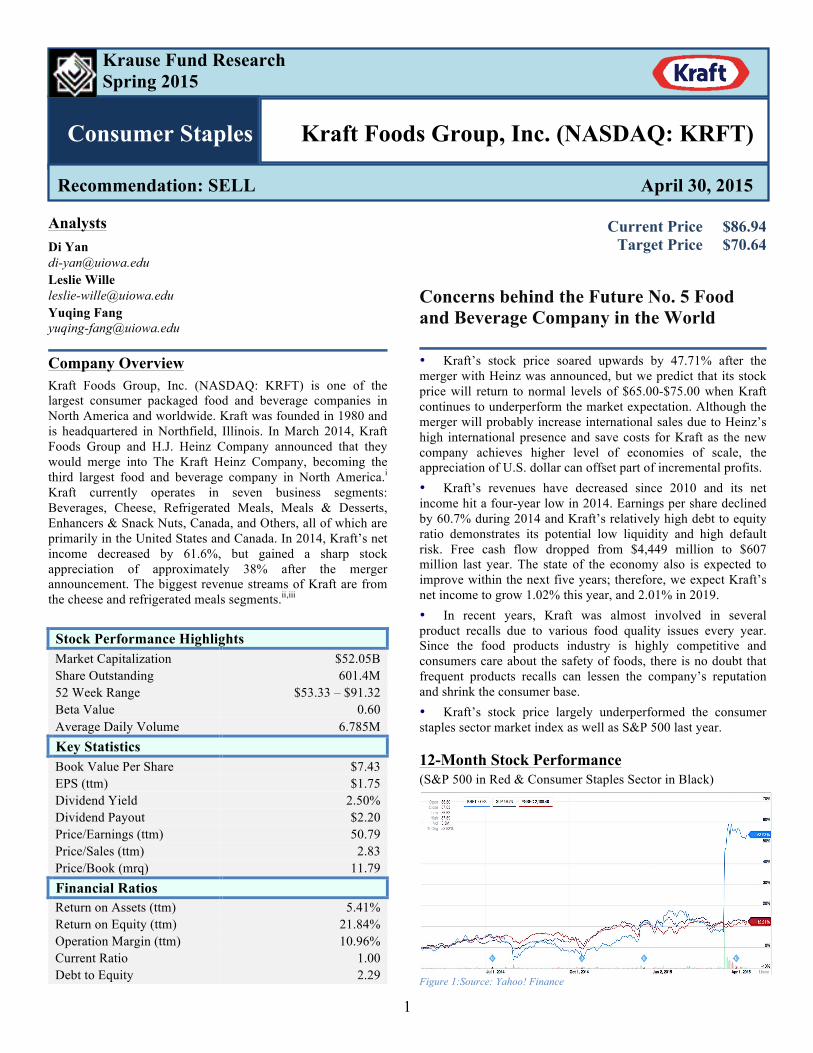
• Kraft’s stock price soared upwards by 47.71% after the merger with Heinz was announced, but we predict that its stock price will return to normal levels of $65.00-$75.00 when Kraft continues to underperform the market expectation. Although the merger will probably increase international sales due to Heinz’s high international presence and save costs for Kraft as the new company achieves higher level of economies of scale, the appreciation of U.S. dollar can offset part of incremental profits. • Kraft’s revenues have decreased since 2010 and its net income hit a four-year low in 2014. Earnings per share declined by 60.7% during 2014 and Kraft’s relatively high debt to equity ratio demonstrates its potential low liquidity and high default risk. Free cash flow dropped from $4,449 million to $607 million last year. The state of the economy also is expected to improve within the next five years; therefore, we expect Kraft’s net income to grow 1.02% this year, and 2.01% in 2019. • In recent years, Kraft was almost involved in several product recalls due to various food quality issues every year. Since the food products industry is highly competitive and consumers care about the safety of foods, there is no doubt that frequent products recalls can lessen the company’s reputation and shrink the consumer base. • Kraft’s stock price largely underperformed the consumer staples sector market index as well as S&P 500 last year.
12-Month Stock Performance (S&P 500 in Red & Consumer Staples Sector in Black)
Figure 1:Source: Yahoo! Finance
April April 30, 2015

2
We recommend selling Kraft Foods Group, Inc. (NASDAQ: KRFT) at this time based on our fundamental analysis and valuation model. Although the Kraft-Heinz merger has pushed Kraft’s stock price up by more than 30%, and the deal can expand Kraft’s international markets and save costs due to higher levels of economies of scale, Kraft’s historical operational performance was quite unsatisfactory to investors. Its revenues have decreased for three years and its net income suffered a sharp decrease in 2014, which gave rise to the cash reserve concern and potential default risk. Furthermore, several recall issues occurred in recent years, which were associated with the increase in commodity prices, which might impact Kraft’s consumer base in the future. Therefore, despite the healthy economic outlook due to increasing GDP, disposable personal income, and the low unemployment rate, we expect Kraft’s revenue growth rate to be similar to the inflation rate of 2%. Finally, the target stock price of $66-$72, compared to the market price at $86.94, leads us to believe that selling Kraft at this time will maximize Krause Fund’s profits.
Gross Domestic Product Real Gross Domestic Product is a vital and commonly used determinant to measure the economic performance of a country. The Real GDP is defined as the nominal GDP adjusted by the inflation rate that reflects the market value of goods and services measured annually.iv Since nearly two-thirds of GDP is driven by individual’s consumption, it is an important indicator of the consumer staples sector. According to the graph below by the Federal Reserve Bank of St. Louis, the U.S. Real GDP has historically remained in an upward trend except during recessions.
Figure 2: Source: Federal Reserve Bank of St. Louisv
Below is a chart showing the percentage change of Real Gross Domestic Product. As seen in the chart, the Real GDP increased by 2.5% on average in 2014, with -2.1%, 4.6%, 5.0%, and 2.2%
in quarters 1-4 respectively.
Figure 3: Source: Federal Reserve Bank of St. Louisvi
Based on the projections of authority institutions, including the International Monetary Fund, the European Commission, and the Federal Reserve, the Real GDP in 2015 will increase approximately 3.15%, and 3.06% in 2016.vii Furthermore, new job openings will give more opportunities to people and boost the economy. However, the impact of the federal funds rate adjustment in 2015 on stocks, along with the economic slowdown in the Eurozone, will also slow down the growth of the U.S. GDP. In addition, the decrease in the CCI in January and soft spending in February indicate that people prefer saving more than spending. So, we predict that the Real GDP will increase by 2.6%, as it did in the last quarter of 2014, within the next six months. We also estimate that the Real GDP will increase approximately 3.0% in the next 2-3 years. Unemployment Rate As seen in the graph below by the Bureau of Labor Statistics, the unemployment rate gradually recovered to a lower rate after the recession in 2008 and 2009.viii
Figure 4: Source: Federal Reserve Bank of St. Louisix
Since 2010, the unemployment rate has continued to decrease by an average of 0.1% each year. Additionally, the unemployment rate decreased to 5.5% by February this year and held steady at 5.5% in March. Based on the projections of International Monetary Fund, European Commission, and the Federal Reserve, the unemployment rate in 2015 will be approximately 5.6%, and 5.4% in 2016.x Referring to the news posted on the Board of Governors of the Federal Reserve
3
System, “labor market conditions have improved further with strong job gains and a lower unemployment rate.” Hence, we predict that the unemployment rate will probably not change a lot in the short term, it will only decrease by 2%, as compared to 5.8% in the fourth quarter of 2014 since jobless people still need time to find work. In the long term, our group predicts that the unemployment rate will remain low and stay around 5.5%.xi We believe that the low unemployment rate will have positive impacts on consumer staple sectors. A lower unemployment rate can indicate an increase in purchasing power for customers, and thus promotes consumer spending. Consumer Price Index The CPI is important for understanding the consumer staples industry because it reflects changes in price due to rising costs of food, beverages, drugs, personal and household items, tobacco, and alcohol.xii The CPI has risen at a relatively steady rate for the last 10 years, due in part to a rise in food and beverage prices. The price of meat, grains, fruits and vegetables, and dairy products have increased in the last several years due to droughts, disease among animals, extremely cold weather, and a citrus greening disease in Florida. In general, the prices of all foods beverages using ingredients from these categories were affected by the calamities. This is because the price of products not directly affected rose when more people started to turn to cheaper options, thusly causing them to go into higher demand.xiii
Since the minimum wage has also increased substantially in the last ten years, prices within the beverage industry have increased because the average American can afford to pay higher prices for their drinks.xiv
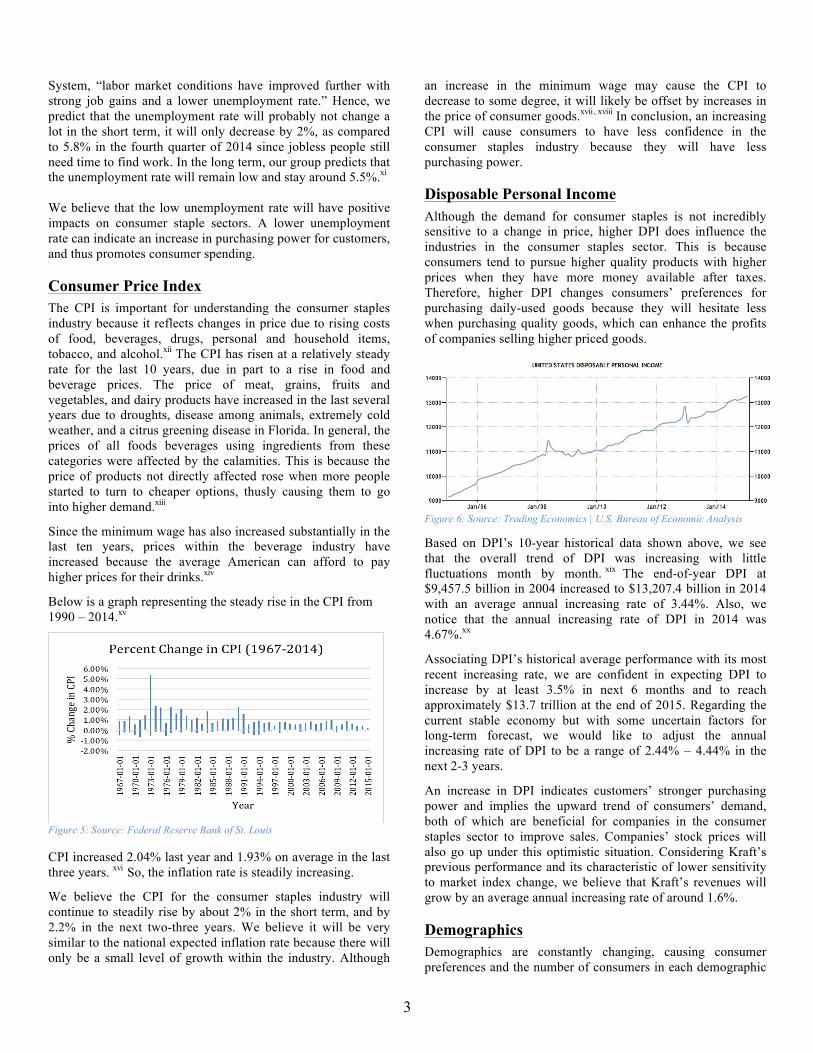
Below is a graph representing the steady rise in the CPI from 1990 – 2014.xv
Figure 5: Source: Federal Reserve Bank of St. Louis
CPI increased 2.04% last year and 1.93% on average in the last three years. xvi So, the inflation rate is steadily increasing.
We believe the CPI for the consumer staples industry will continue to steadily rise by about 2% in the short term, and by 2.2% in the next two-three years. We believe it will be very similar to the national expected inflation rate because there will only be a small level of growth within the industry. Although
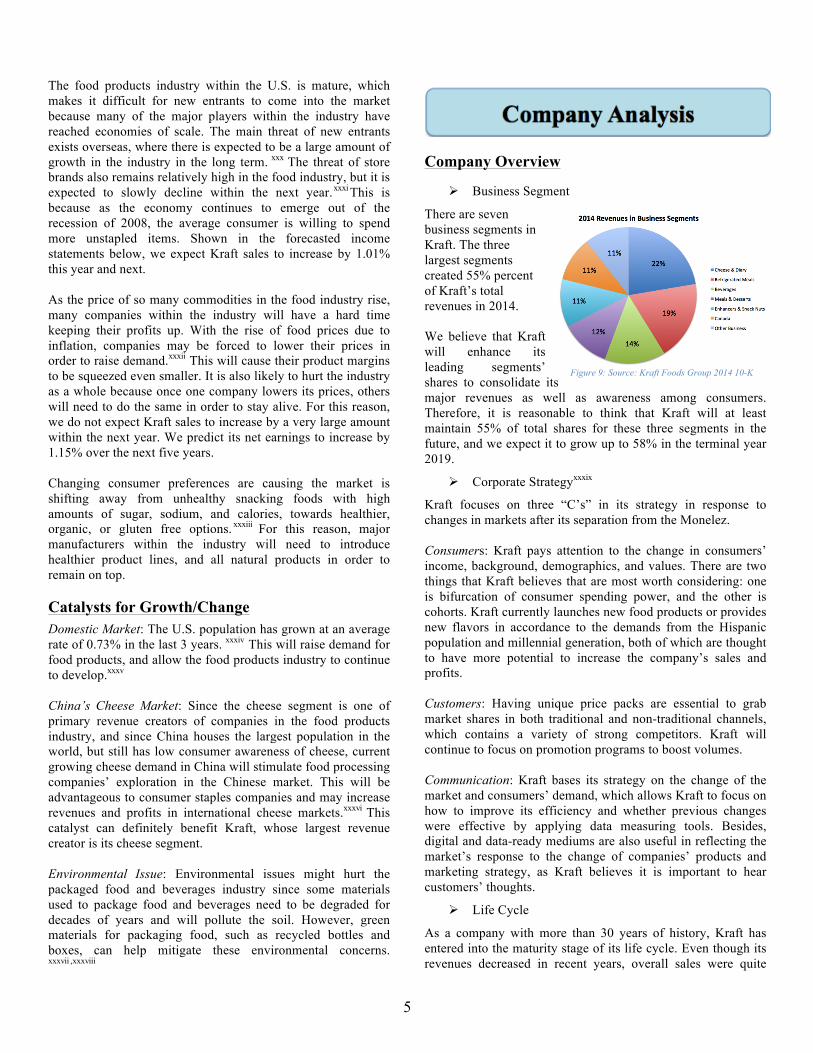
an increase in the minimum wage may cause the CPI to decrease to some degree, it will likely be offset by increases in the price of consumer goods.xvii, xviii In conclusion, an increasing CPI will cause consumers to have less confidence in the consumer staples industry because they will have less purchasing power. Disposable Personal Income Although the demand for consumer staples is not incredibly sensitive to a change in price, higher DPI does influence the industries in the consumer staples sector. This is because consumers tend to pursue higher quality products with higher prices when they have more money available after taxes. Therefore, higher DPI changes consumers’ preferences for purchasing daily-used goods because they will hesitate less when purchasing quality goods, which can enhance the profits of companies selling higher priced goods.
Figure 6: Source: Trading Economics | U.S. Bureau of Economic Analysis
Based on DPI’s 10-year historical data shown above, we see that the overall trend of DPI was increasing with little fluctuations month by month. xix The end-of-year DPI at $9,457.5 billion in 2004 increased to $13,207.4 billion in 2014 with an average annual increasing rate of 3.44%. Also, we notice that the annual increasing rate of DPI in 2014 was 4.67%.xx
Associating DPI’s historical average performance with its most recent increasing rate, we are confident in expecting DPI to increase by at least 3.5% in next 6 months and to reach approximately $13.7 trillion at the end of 2015. Regarding the current stable economy but with some uncertain factors for long-term forecast, we would like to adjust the annual increasing rate of DPI to be a range of 2.44% – 4.44% in the next 2-3 years.
An increase in DPI indicates customers’ stronger purchasing power and implies the upward trend of consumers’ demand, both of which are beneficial for companies in the consumer staples sector to improve sales. Companies’ stock prices will also go up under this optimistic situation. Considering Kraft’s previous performance and its characteristic of lower sensitivity to market index change, we believe that Kraft’s revenues will grow by an average annual increasing rate of around 1.6%. Demographics Demographics are constantly changing, causing consumer preferences and the number of consumers in each demographic

4
to vary. This can affect companies who sell products, which are coming in or out of favor, as well as the money flowing through the industry as the types of products bought and sold change. xxi The population in America is expected to increase by another 100 million people by 2050. The number of people aged 65 and older are expected to increase from 13%-20% by the middle of the century, but the working class is estimated to increase by 42%. Birth rates are also expected to escalate causing a small population bubble. This is because the children of the youngest baby boomers will begin to have children of their own, and the grandchildren of the early baby boomers will begin to have babies as well. Birth rates in the U.S. have been higher in the last decade than they have in the last 45 years. xxii Below is a chart representing expected population growth in the United States between 2010 and 2050. xxiii
Figure 7: Source: The American Century
Greater amounts of consumer goods, namely staple items such as food, beverages, and personal and household products, will need to be produced to support such large population growth. This will cause the consumer staples industry to grow, but it will be at a very gradual rate as the population expands throughout the next 35 years. xxiv We expect the industry to grow by approximately 1.5-2% in the next 2-3 years due the population boom and the rise in Real GDP. Capital Market Outlook The market outlook for the food industry is positive. Real GDP is expected to increase by 3% in the short term, giving rise to a healthier economy. Unemployment is expected to decrease by .2%, which will also give a boost to consumer staples industries and increase purchasing power. CPI is anticipated to increase by 2%, and interest rates will remain low. We believe that the positive changes in Real GDP and unemployment rates will outweigh the effects of a rising CPI and low interest rates on the industry. The population is also expected to grow considerably in the next 20 years, which will raise demand for staple items.xxv For these reasons, we estimate that the food industry will grow by approximately 2% in the next 5 years. We believe it will perform better in 5 years than in the next year because an increase in population and employment rates will take time.
The table below demonstrates how sectors within the consumer staples industry have performed relative to each other in the S&P 500 in the last 5 years. In general, those, which have performed the best, are food and staples retailing, tobacco, beverages, and food products.xxvi
Figure 8: Source: Fidelity, “Consumer Staples”
Industry Overview The food products industry in the consumer staples sector covers seven main product lines: Grains and Pulses, Oilseeds and Nuts, Fruits and Vegetables, Roots and Tubers, Meat and Dairy Products, Honey and Sugar, Spices and Stimulants.xxvii Major players, including Kraft, General Mills, Kellogg, Hershey, and Tyson Foods, in this mature industry compete with each other intensely. However, the food products industry is defensive and it is not sensitive to the changes in economic and financial environment. Companies in this industry create revenues simply by manufacturing and wholesaling. Industry Trends and Recent Developments A recent trend in the food industry is a change in preferences among the millennial generation. According to the latest survey from Mintel, many consumers said store brands match name brands in flavor, packaging and assortment, and 37% of U.S. consumers prefer to buy store brands over national brands. xxviii This has, and will likely continue to harm premium brands such as Kraft. Rising health awareness among consumers is causing them to purchase fresh looking food with low fat and more protein. On the other hand, consumers are also starting to buy more convenient, faster to make, food, and packaged foods are expected to increase in 2015. xxix Healthier foods are usually more expensive than processed foods. In addition, higher convenience foods (i.e. sliced fruits and vegetables, individually packaged foods, ready-to-eat meals) will drive the prices of packaged food up, which is a good sign for companies such as Kraft. Competitive Landscape
5
The food products industry within the U.S. is mature, which makes it difficult for new entrants to come into the market because many of the major players within the industry have reached economies of scale. The main threat of new entrants exists overseas, where there is expected to be a large amount of growth in the industry in the long term. xxx The threat of store brands also remains relatively high in the food industry, but it is expected to slowly decline within the next year.xxxi This is because as the economy continues to emerge out of the recession of 2008, the average consumer is willing to spend more unstapled items. Shown in the forecasted income statements below, we expect Kraft sales to increase by 1.01% this year and next.
As the price of so many commodities in the food industry rise, many companies within the industry will have a hard time keeping their profits up. With the rise of food prices due to inflation, companies may be forced to lower their prices in order to raise demand.xxxii This will cause their product margins to be squeezed even smaller. It is also likely to hurt the industry as a whole because once one company lowers its prices, others will need to do the same in order to stay alive. For this reason, we do not expect Kraft sales to increase by a very large amount within the next year. We predict its net earnings to increase by 1.15% over the next five years. Changing consumer preferences are causing the market is shifting away from unhealthy snacking foods with high amounts of sugar, sodium, and calories, towards healthier, organic, or gluten free options. xxxiii For this reason, major manufacturers within the industry will need to introduce healthier product lines, and all natural products in order to remain on top. Catalysts for Growth/Change Domestic Market: The U.S. population has grown at an average rate of 0.73% in the last 3 years. xxxiv This will raise demand for food products, and allow the food products industry to continue to develop.xxxv China’s Cheese Market: Since the cheese segment is one of primary revenue creators of companies in the food products industry, and since China houses the largest population in the world, but still has low consumer awareness of cheese, current growing cheese demand in China will stimulate food processing companies’ exploration in the Chinese market. This will be advantageous to consumer staples companies and may increase revenues and profits in international cheese markets.xxxvi This catalyst can definitely benefit Kraft, whose largest revenue creator is its cheese segment.
Environmental Issue: Environmental issues might hurt the packaged food and beverages industry since some materials used to package food and beverages need to be degraded for decades of years and will pollute the soil. However, green materials for packaging food, such as recycled bottles and boxes, can help mitigate these environmental concerns. xxxvii ,xxxviii
Company Overview
Ø Business Segment
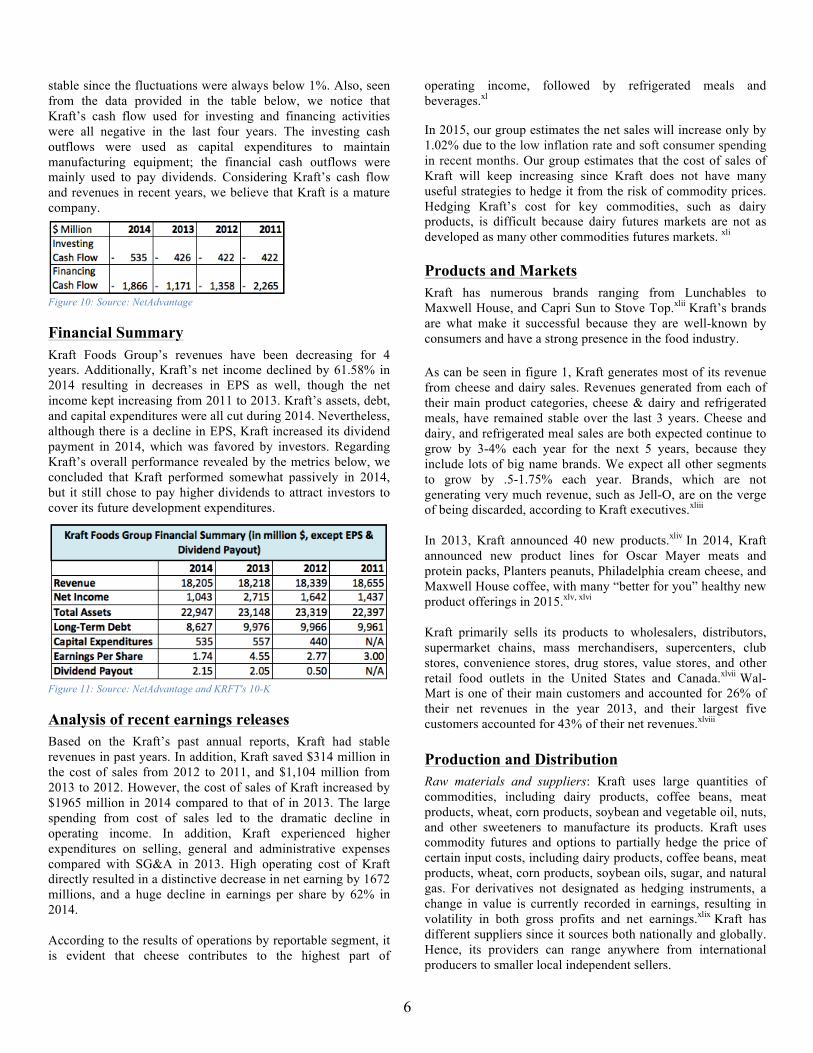
There are seven business segments in Kraft. The three largest segments created 55% percent of Kraft’s total revenues in 2014. We believe that Kraft will enhance its leading segments’ shares to consolidate its major revenues as well as awareness among consumers. Therefore, it is reasonable to think that Kraft will at least maintain 55% of total shares for these three segments in the future, and we expect it to grow up to 58% in the terminal year 2019.
Ø Corporate Strategyxxxix
Kraft focuses on three “C’s” in its strategy in response to changes in markets after its separation from the Monelez. Consumers: Kraft pays attention to the change in consumers’ income, background, demographics, and values. There are two things that Kraft believes that are most worth considering: one is bifurcation of consumer spending power, and the other is cohorts. Kraft currently launches new food products or provides new flavors in accordance to the demands from the Hispanic population and millennial generation, both of which are thought to have more potential to increase the company’s sales and profits. Customers: Having unique price packs are essential to grab market shares in both traditional and non-traditional channels, which contains a variety of strong competitors. Kraft will continue to focus on promotion programs to boost volumes. Communication: Kraft bases its strategy on the change of the market and consumers’ demand, which allows Kraft to focus on how to improve its efficiency and whether previous changes were effective by applying data measuring tools. Besides, digital and data-ready mediums are also useful in reflecting the market’s response to the change of companies’ products and marketing strategy, as Kraft believes it is important to hear customers’ thoughts.
Ø Life Cycle
As a company with more than 30 years of history, Kraft has entered into the maturity stage of its life cycle. Even though its revenues decreased in recent years, overall sales were quite
Figure 9: Source: Kraft Foods Group 2014 10-K
6
stable since the fluctuations were always below 1%. Also, seen from the data provided in the table below, we notice that Kraft’s cash flow used for investing and financing activities were all negative in the last four years. The investing cash outflows were used as capital expenditures to maintain manufacturing equipment; the financial cash outflows were mainly used to pay dividends. Considering Kraft’s cash flow and revenues in recent years, we believe that Kraft is a mature company.
Figure 10: Source: NetAdvantage Financial Summary Kraft Foods Group’s revenues have been decreasing for 4 years. Additionally, Kraft’s net income declined by 61.58% in 2014 resulting in decreases in EPS as well, though the net income kept increasing from 2011 to 2013. Kraft’s assets, debt, and capital expenditures were all cut during 2014. Nevertheless, although there is a decline in EPS, Kraft increased its dividend payment in 2014, which was favored by investors. Regarding Kraft’s overall performance revealed by the metrics below, we concluded that Kraft performed somewhat passively in 2014, but it still chose to pay higher dividends to attract investors to cover its future development expenditures.
Figure 11: Source: NetAdvantage and KRFT's 10-K Analysis of recent earnings releases Based on the Kraft’s past annual reports, Kraft had stable revenues in past years. In addition, Kraft saved $314 million in the cost of sales from 2012 to 2011, and $1,104 million from 2013 to 2012. However, the cost of sales of Kraft increased by $1965 million in 2014 compared to that of in 2013. The large spending from cost of sales led to the dramatic decline in operating income. In addition, Kraft experienced higher expenditures on selling, general and administrative expenses compared with SG&A in 2013. High operating cost of Kraft directly resulted in a distinctive decrease in net earning by 1672 millions, and a huge decline in earnings per share by 62% in 2014. According to the results of operations by reportable segment, it is evident that cheese contributes to the highest part of
operating income, followed by refrigerated meals and beverages.xl In 2015, our group estimates the net sales will increase only by 1.02% due to the low inflation rate and soft consumer spending in recent months. Our group estimates that the cost of sales of Kraft will keep increasing since Kraft does not have many useful strategies to hedge it from the risk of commodity prices. Hedging Kraft’s cost for key commodities, such as dairy products, is difficult because dairy futures markets are not as developed as many other commodities futures markets. xli Products and Markets Kraft has numerous brands ranging from Lunchables to Maxwell House, and Capri Sun to Stove Top.xlii Kraft’s brands are what make it successful because they are well-known by consumers and have a strong presence in the food industry. As can be seen in figure 1, Kraft generates most of its revenue from cheese and dairy sales. Revenues generated from each of their main product categories, cheese & dairy and refrigerated meals, have remained stable over the last 3 years. Cheese and dairy, and refrigerated meal sales are both expected continue to grow by 3-4% each year for the next 5 years, because they include lots of big name brands. We expect all other segments to grow by .5-1.75% each year. Brands, which are not generating very much revenue, such as Jell-O, are on the verge of being discarded, according to Kraft executives.xliii In 2013, Kraft announced 40 new products.xliv In 2014, Kraft announced new product lines for Oscar Mayer meats and protein packs, Planters peanuts, Philadelphia cream cheese, and Maxwell House coffee, with many “better for you” healthy new product offerings in 2015.xlv, xlvi
Kraft primarily sells its products to wholesalers, distributors, supermarket chains, mass merchandisers, supercenters, club stores, convenience stores, drug stores, value stores, and other retail food outlets in the United States and Canada.xlvii Wal-Mart is one of their main customers and accounted for 26% of their net revenues in the year 2013, and their largest five customers accounted for 43% of their net revenues.xlviii Production and Distribution Raw materials and suppliers: Kraft uses large quantities of commodities, including dairy products, coffee beans, meat products, wheat, corn products, soybean and vegetable oil, nuts, and other sweeteners to manufacture its products. Kraft uses commodity futures and options to partially hedge the price of certain input costs, including dairy products, coffee beans, meat products, wheat, corn products, soybean oils, sugar, and natural gas. For derivatives not designated as hedging instruments, a change in value is currently recorded in earnings, resulting in volatility in both gross profits and net earnings.xlix Kraft has different suppliers since it sources both nationally and globally. Hence, its providers can range anywhere from international producers to smaller local independent sellers.

7
Costs: Variable costs are mostly raw and agricultural materials Kraft uses in products. The most significant cost components of Kraft’s cheese products are dairy commodities, including milk and cheese. Market supply and demand, as well as government programs, significantly influences the prices for milk and other dairy products. There are also a lot of external factors that can influence the prices of raw and agricultural materials, such as coffee beans, since Kraft buys them globally. Hence, external factors, such as global competition for resources, currency fluctuations, severe weather or global climate change, consumer, industrial or investment demand, changes in governmental regulation and trade, alternative energy, and agricultural programs can all influence the prices of raw and agricultural materials. l Manufacturing process and distribution: Kraft has its own manufacturing and processing facilities both in the United States and Canada. Since Kraft has different product lines and brands, it distributes its plants almost equally to each type of product. As of December 28, 2013, Kraft distributed it products through 39 distribution centers. In addition, other logistics companies also helped Kraft to facilitate distribution work. li Competition The food products industry is highly competitive. The major competitors of Kraft in this industry are Hershey, Kellogg, General Mills, and Nestle. Due to the recent announcement of the Kraft-Heinz merger, Kraft’s stock price increased by around 30%, which resulted in sharp increases in both P/E ratio and market capitalization. Originally, Kraft’s P/E ratio was 35.6 and its market capitalization was $36.42B, both of which were in the top position among major competitors in food products industry. However, Kraft does not have outstanding EPS and ROE ratios, which reveals that Kraft’s profitability cannot play a significant role in attracting investments, compared with its competitors. Its D/E ratio of 2.30 is also in the second place, implying its potential high risk to raise capital for future development. Therefore, we can infer that Kraft’s high P/E ratio is mainly attributed to its high market expectation, rather than its high growth rate, favored profitability, or low potential risk. Investors perhaps still believe that a giant food producing company is worth holding because of quality goods and brand loyalty despite its recent unsatisfactory financial performance.
Figure 12: Source: Yahoo! Finance
Nevertheless, Kraft’s current high P/E ratio and market capitalization cannot completely be credited to the technical factor that its stock price went up dramatically. In fact, the
Kraft-Heinz merger will be beneficial for increasing market share, cost saving, and product development in the future. Therefore, such a compelling P/E ratio seems reasonable from the merger perspective. Given Kraft’s prior financial performance and its appealing P/E ratio, we expect Kraft to first raise more capital investment from equity, then develop more in operations and obtain more market shares. The graph below shows one-year stock price changes of Kraft and its competitors. Even though Kraft suffered from a decline in net income, it did outperform its competitors with respect to annual stock returns since the beginning of 2015, and the superiority was fairly obvious. The other four companies all had similar stock performance, which made the competition landscape stable but hard to have a breakthrough.
Figure 13: Source: Yahoo! Finance
We believe an analysis of the cheese segment, the largest business segment for Kraft, is necessary to understand Kraft’s performance, compared to its competitors in each sub-industry. Seen from the chart below, Kraft’s superiority in this segment is quite obvious, since its market share is 8.8%, while the other market shares are mainly composed by small companies. Other big companies in the cheese industry includes, Associated Milk Producers Inc., Sargento Foods Inc., Cabot Creamery, which account for 2.8%, 2.2%, and 2.0% of the total sales in the cheese industry respectively. Therefore, although Kraft does not have a very large market share, it still has a strong competitiveness because of its large company size and brand loyalty. Thus, we expect Kraft to continue to focus most on developing this segment to increase profits and market awareness.lii
Figure 14: Source: IBIS WOLRD Cheese Production Industry
One of Kraft’s largest revenue streams is the beverages segment. Kraft is a leading coffee producer and is ranked in fifth place, with 9.6% of the market. In 2010, Starbucks Corporation paid Kraft $2.76 billion for violation of a retailing contract. However, Mondelez International, Inc. received this payment. Therefore, this issue indeed hurt Kraft to some extent since Kraft not only lost profits from collaborating with Starbucks, but also did not receive the compensation fees. Kraft’s previously strong performance in the coffee industry was somewhat affected and that is why it only maintains 9.6%

8
of the market, while other coffee producers all have more than 14% of the market, becoming top choices for consumers. liii
Figure 15: Source: IBIS WOLRD Coffee Production Industry Other Topics • Kraft recently replaced many of its top managers, which
could cause a setback due to the loss of key personnel. However, it could also give the company a fresh outlook and perspective to increase efficiency and revamp advertising. liv
• Since a large portion of Kraft’s sales are in Canada, the
value of the Canadian dollar relative to the U.S. dollar affects Kraft’s revenue. In 2013 net revenue was $73 million less than in 2012 due to foreign exchange rates, and in 2012 it was $21 million less than it was in 2011. lv The value of the U.S. dollar is expected to outperform other developed markets in the next couple of years, which could lead to a larger amount of decreased revenues due to foreign exchange rates for Kraft. lvi
• In March 24, 2015, 3G Capital, a Brazilian private-equity
company, which acquired H.J. Heinz in 2013, announced to acquire Kraft and promote the merger between Kraft and Heinz. The new company, which will be called The Kraft Heinz Company, will become the third largest food and beverage company in North. This deal was also backed by Warren Buffet’s Berkshire Hathaway, Inc. Berkshire and 3G will invest $10 billion in this deal, which values Kraft at about $46 billion. Kraft shareholders will receive a $16.5 special dividend funded by 3G Capital and Berkshire. Also, Buffet and 3G planned to apply their cost cut strategy to Kraft, which suggests Kraft’s appealing prospective in terms of profitability. lvii However, since the merger was announced, Kraft's stock price increased from around $62 to around $88, or 42% within one week, which was mainly due to high expectations surrounding the merger from the market. If expectations drop because of Kraft’s continuously disappointing earning performance, Kraft's stock price will decrease. Kraft’s price has already dropped from the high $90.61 to its current value $86.94. This leads us to believe that the price may continue to fall back towards the same levels it was at before the merger was announced within the next couple of months.
S.W.O.T. Analysis
Ø Strengths
Economies of scales: The announcement of the Kraft-Heinz merger came associated with a cost-saving plan, which aims to achieve an annual reduction in $1.5 billion by the end of 2017. After the merger, Kraft’s market in North America, will realize
higher economies of scales, which will have a big positive influence for Kraft’s credit rating as well as brand loyalty, since this is Kraft’s main market. lviii International markets expansion: Kraft currently operates in 117 different countries worldwide. The extensive and wide geographical presence of the company throughout the globe creates a diversified portfolio of investments and reduces the overall risk of the company.lix Furthermore, the Kraft-Heinz merger also explores more international markets for Kraft since Heinz currently carries wider international awareness – 60% of sales generated from regions other than North America.lx Strong manufacturing and distribution ability: Kraft has 34 manufacturing and processing facilities in the U.S. and 2 in Canada. The company also operates 36 distribution centers in the U.S. and 3 in Canada. Each of these distribution centers includes facilities for storing refrigerated, dry, and frozen goods. Such a strong manufacturing and distribution network allows Kraft has to supply fresh and high quality food and beverages to its customers.lxi
Ø Weaknesses
Cash Reserve Concern: Kraft recorded a sharp drop in free cash flow from $4,379 million in 2013 to $608 million in 2014, which raised a cash reserve concern. Although Kraft increased its dividend payout in 2014 under the burden of limited free cash flow, investors still will doubt whether Kraft can have a good liquidation in the future to avoid credit degrading and to ensure the ability to afford cost of debt and dividend payments. Product Recalls: In March 2015, Kraft recalled 6.5 million cases of its cheese product which were thought to contain metallxii ; in May through June of 2014, Kraft recalled 1.2 million cases of cheese product which were not properly stored and thought to cause illnesslxiii; in October 2013, Kraft recalled 735 thousand varieties of its cheese products which were thought to spoil before expiration datelxiv. Being involved in frequent recall issues in recent years not only might drag the consumers’ satisfaction down and lower Kraft’s reputation, but also can increase its expenses.
Ø Opportunities
Market Expansion Overseas: Currently most of Kraft’s operations are in North America, but since the consumer staples market in North America is mature, opportunities for expansion arise for Kraft in growing economies like China and Latin America. lxv, lxvi
“Better-for-you” Options: In North America increasing demand for healthy foods also poses an opportunity for Kraft as it invests into “better-for-you” options. Kraft has already invested significant research into healthier products, which could put it ahead of its competitors in the short term. lxvii
Ø Threats
Rising price of commodities: In the past few years the price of dairy products, meat, coffee, and beans has risen sharply, which
9
are all part of Kraft’s top 5 revenue producing product categories. In response to the rise, Kraft has raised its prices across 45% of its product portfolio and is leading its competitors in price raises. For this reason, Kraft’s market share may decrease in the product categories most affected, such as cheese and meat. lxviii Rise in private labels: Since private label brands are becoming more plentiful and popular, national brands held by Kraft are receiving lots of downward pricing pressure. Combined with the upward pricing pressure posed by the rise in commodity prices, consumers are likely to turn towards private label companies even more in 2015. lxix, lxx Key Investment Positives and Negatives The positive news for the packaged food market is that the population is expanding both nationally and globally. Hence, there will be an increased demand for food worldwide.lxxi The demand for food will exceed the supply, causing prices to increase. This will benefit investors in the industry because the companies they have invested in will receive higher product margins and therefore earn higher profits. Therefore, as stock prices in the industry rise, investors will receive higher dividends. The negative news for the packaged goods industry is that people are becoming more concerned about the environment, and that the effects of large amounts of plastics and other materials used for packaged foods will harm it. lxxii High competition from store brands will make it harder for Kraft to grow in the future. Catalysts for Growth/Change In 2015, our group expects that Kraft will continue its strategy to invest in high-margin categories and fast-growing, developing markets, including China, India, Turkey and Chile. In addition, since Kraft imports raw materials globally, external factors, including currency, policy change, economic status in countries, will also influence Kraft’s growth to some degree. Domestically, the growing population will increase the demand for food and beverage products. However, Kraft will face fierce challenges from store brands and soft consumer spending nationally. lxxiii Competition will drive Kraft to focus more on cost cutting rather than marketing. lxxiv
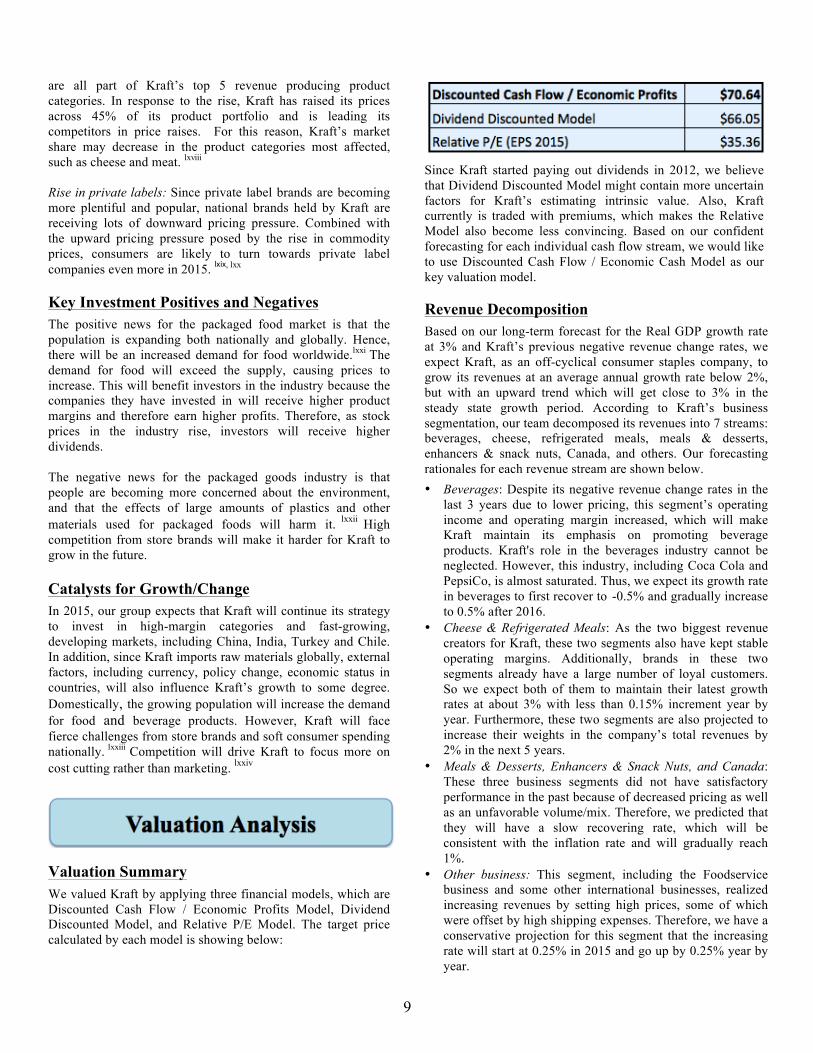
Valuation Summary We valued Kraft by applying three financial models, which are Discounted Cash Flow / Economic Profits Model, Dividend Discounted Model, and Relative P/E Model. The target price calculated by each model is showing below:
Since Kraft started paying out dividends in 2012, we believe that Dividend Discounted Model might contain more uncertain factors for Kraft’s estimating intrinsic value. Also, Kraft currently is traded with premiums, which makes the Relative Model also become less convincing. Based on our confident forecasting for each individual cash flow stream, we would like to use Discounted Cash Flow / Economic Cash Model as our key valuation model. Revenue Decomposition Based on our long-term forecast for the Real GDP growth rate at 3% and Kraft’s previous negative revenue change rates, we expect Kraft, as an off-cyclical consumer staples company, to grow its revenues at an average annual growth rate below 2%, but with an upward trend which will get close to 3% in the steady state growth period. According to Kraft’s business segmentation, our team decomposed its revenues into 7 streams: beverages, cheese, refrigerated meals, meals & desserts, enhancers & snack nuts, Canada, and others. Our forecasting rationales for each revenue stream are shown below. • Beverages: Despite its negative revenue change rates in the
last 3 years due to lower pricing, this segment’s operating income and operating margin increased, which will make Kraft maintain its emphasis on promoting beverage products. Kraft's role in the beverages industry cannot be neglected. However, this industry, including Coca Cola and PepsiCo, is almost saturated. Thus, we expect its growth rate in beverages to first recover to -0.5% and gradually increase to 0.5% after 2016.
• Cheese & Refrigerated Meals: As the two biggest revenue creators for Kraft, these two segments also have kept stable operating margins. Additionally, brands in these two segments already have a large number of loyal customers. So we expect both of them to maintain their latest growth rates at about 3% with less than 0.15% increment year by year. Furthermore, these two segments are also projected to increase their weights in the company’s total revenues by 2% in the next 5 years.
• Meals & Desserts, Enhancers & Snack Nuts, and Canada: These three business segments did not have satisfactory performance in the past because of decreased pricing as well as an unfavorable volume/mix. Therefore, we predicted that they will have a slow recovering rate, which will be consistent with the inflation rate and will gradually reach 1%.
• Other business: This segment, including the Foodservice business and some other international businesses, realized increasing revenues by setting high prices, some of which were offset by high shipping expenses. Therefore, we have a conservative projection for this segment that the increasing rate will start at 0.25% in 2015 and go up by 0.25% year by year.

10
Cost of Goods Sold Kraft included not only has food producing expenditures in cost of goods sold, but also part of commodity contracts, foreign exchange contracts, hedging activities, and postemployment benefit plans. Since PPI is increasing and Kraft bore some losses from those contracts or activities mentioned above, Kraft’s cost of goods sold to sales increased from 60% in 2013 to 71% in 2014. Additionally, such a high percentage can also be attributed to its cost saving initiatives expenses. Nevertheless, the Kraft-Heinz merger improves the economies of scale and the cost saving initiatives will gradually realize its effect in reducing cost of goods sold, so we expect Kraft’s cost of goods sold to sales to reach 69% in 2015 and keep decreasing by 0.5% per year in the future. Selling, General, and Administrative Expense Kraft’s SG&A expenses have reached the highest percentage of sales at 16.24% in recent years. We expect Kraft to spend more on marketing, especially for advertisements, in 2015 to highlight the merger and attract more customers. Our estimation for SG&A to sales in 2015 is 17%, which will be decreased by 0.5% in the later years when the Kraft Heinz Company’s domestic and international awareness are achieved. Capital Expenditures According to Kraft’s estimation for its capital expenditures, which will be approximately $550 million to $600 million, our team used its historical average capital expenditures to gross PP&E to estimate capital expenditures at $564 million in 2015, which accounts for 5.5% of gross PP&E. We also expect that this level of capital expenditures to gross PP&E will be maintained in the next 4 years after 2015 to sustain the necessary physical conditions for manufacturing. Weighted Average Cost of Capital Our weighted average cost of capital estimation is around 4.89% for Kraft. Since Kraft did not issue any preferred stock in recent years, no market value and risk of preferred stock was calculated. We used the Capital Asset Pricing Model (CAPM) to calculate the cost of equity. Kraft has a beta under 1, which means Kraft is relatively stable in the market no matter how markets move. Risk free rate is calculated by using the current yield to maturity (YTM) of the 30-year U.S. Treasury bond. The risk premium is 4.62%, which is the U.S. historical geometric average. Based on the variables in the CAPM, we got the cost of equity of 5.27%. We estimated Kraft’s pre-tax cost of debt by using the YTM of Kraft’s 30-year bond. After taking away the effect of the marginal tax rate of 33%, we calculated the after-tax cost of debt of 3.04%. After using the market value of equity and debt (including the PV of operating lease), we got the final weighted average cost of capital of 4.89%. Dividend Payout Policy
Kraft declared dividends per share at $0.5, $2.05, and $2.15 in 2012, 2013, and 2014 respectively. Although Kraft’s earnings per share decreased in 2014, it still increased its dividends. Thus, we can infer that Kraft tended to use growing dividends to release investors’ concerns about earning profits from Kraft and attract more capital investments. Regarding our forecast for Kraft’s incremental profits, we expect its dividends to increase by 5 cents per year and reach $2.40 in terminal year 2019. Dividend Discount Model (DDM) Our estimation for Kraft’s intrinsic value using DDM is $65.43, adjusted to $ 66.05 as of April 21, 2015. Despite the similarity between the intrinsic values calculated by using the DCF/EP models and the DDM, we put less emphasis on this model since Kraft started paying out dividends in 2012 due to its split-off from Kraft Foods Group, Inc. and Mondelez International. Therefore, Kraft’s dividend policy is subject to change in the next few years. The merger with Heinz can also affect Kraft’s future dividend payout policy. The key assumptions that we made were CV growth rate for EPS of 2% and CV ROE of 34.20%. Since Kraft is a non-cyclical company and its historical profits have decreased for 4 years, we would like to choose an EPS growth rate lower than inflation rate of 3%. Because we still expect the Kraft-Heinz merger can improve Kraft’s profitability, and because we got an increasing rate of net income in terminal year 2019 at around 2%, we would like to assume EPS will keep a 2% growth rate after 2019. Relative Price to Earnings (P/E) Model We believe this model does not provide an accurate estimate of Kraft’s intrinsic value because it gives a very low prediction of the current stock price. We feel that Kraft’s intrinsic value falls between $53.30- $70.00, while the relative P/E yielded a price of $36.45. This is because the earnings of the other companies used had much smaller earnings per share than Kraft had recently. This model gave a P/E for Kraft in 2015 of 51. Since Kraft’s profitability is low, its risk is high, and its growth is low, the P/E is high because consumer expectations for the stock have significantly increased due to the announcement of the merger with Heinz. DCF/ EP Models We believe this model provides the best estimate of Dr Pepper Snapple Group’s intrinsic value because it incorporates most of our expectations about the future growth of DPS, as well as our estimations for the WACC and the current state of the economy. We estimated CV growth of NOPLAT to be approximately 2% because it is not expected to grow very rapidly since the industry is very mature. Growth in the food industry is also expected to be greater than growth in the beverage industry since it is dominated by so few companies, which we anticipated to be 1.4%.lxxv Finally, Real GDP is only expected to increase by 3.15% in 2015, so the CV growth of NOPLAT had to be less than that.

11
We believe the DCF/EP model provides a better estimate than the DDM because we felt we had more control over the assumptions used. We felt more comfortable with our CV growth of NOPLAT than with our CV growth of EPS because more of our own assumptions and forecasts were used to calculate NOPLAT. If we had estimated the CV growth of NOPLAT to be 3% instead of 2%, the intrinsic value in the DCF would have risen by 54.4%. If we had estimated it to be 1%, the intrinsic value would have decreased by 26.71%. We also believe this model provides a better estimate than the relative P/E because the relative P/E yields an intrinsic value which we believe is lower than the appropriate range we believe for the stock.
Beta vs. CV Growth of NOPLAT Beta is an important factor in our analysis because it largely affects the cost of equity. On the other hand, CV growth of NOPLAT largely affects the results of the DCF/EP model. As beta increases by 0.01, the price of the stock decreases by $1.24; as beta decreases by 0.01, the stock price increases by$1.28. In general, firms, which are more diversified, have a beta closer to 1 because they represent the market more closely than smaller, less diversified firms. For this reason, Kraft’s beta is likely to move closer to 1 due to the anticipated merger with Heinz. We believe this will cause Kraft’s stock price to decrease. We also believe Kraft’s stock price will decrease as initial consumer expectations from the merger announcement wear off. Together, we believe the stock price will decrease back to its original value, which was from $60 to $66, before the merger was announced. As the CV growth of NOPLAT increases by 0.25%, the price of the stock increases by $8.42 and vice versa.
CV ROIC vs. Risk Free Rate We assumed CV ROIC to be 24.82% based off of our projections for NOPLAT and invested capital. Since we anticipate an increase in NOPLAT and a decrease in invested capital, we believe the CV of ROIC will be 11.78% greater than the current value. A 0.2% rise in CV ROIC will cause the stock price to rise by $0.06. The risk free rate was assumed to be the same as a 30-year treasury bond for Kraft, which was roughly equal to 2.54%. We assume that interest rates will remain low for the next 2-3 years, but will steadily increase. A 0.2%
increase in the risk free rate will cause Kraft’s stock price to decrease by $5.17 and vice versa. Thus, we can see that Kraft’s stock price is more sensitive to the change in risk free rate than to the same amount change in CV ROIC.
After tax Cost of Debt vs. Cost of Equity The after tax cost of debt and cost of equity are both important assumptions used in the WACC. We predict Kraft’s cost of debt will decrease in the future because the merger with Heinz is likely to lower its level of risk due to a higher level of product diversification. A 0.1% decrease in the after tax cost of debt will cause the intrinsic value of Kraft to rise only by $0.54. Kraft’s cost of equity is also expected to increase because its beta will move closer to 1 after the merger with Heinz is complete due to product diversification. A 0.1% increase in the cost of equity causes Kraft’s stock price to decrease by $2.66. The effect of the higher cost of equity will likely outweigh the effect of a higher cost of debt on Kraft. Therefore, Kraft’s stock price will decrease in the next 2-3 years, and we believe Kraft stock should be sold.
COGS/Sales vs. SGA/Sales The cost of goods sold could rise if the prices of commodities rise. Since we are assuming that commodity prices within the food industry will rise, the cost of goods sold for Kraft will likely rise as well, despite its ability to hedge against changes in commodity prices. A 0.5% increase in the cost of goods sold/sales will cause Kraft’s stock price to decrease by $3.31. Selling and administrative expenses could rise if the corporate structure of Kraft changes due to the merger with Heinz (i.e. more advertising, higher administrative salaries, etc.). A 0.5% rise in selling and administrative expenses/sales will cause Kraft’s stock price to decrease by $3.31.

12
CV Growth of NOPLAT vs. CapEx The CV growth of NOPLAT largely affects the results of the DCF/EP model and will cause Kraft’s stock price to increase by $2.67 as it increases by 0.1%. Kraft’s capital expenditures are subject to change after the merger with Heinz is complete, although it is unclear how they will change at this time. A 0.1% increase in capital expenditures will cause a $0.24 decrease in Kraft’s intrinsic value and vice versa.

13
Important Disclaimer This report was created by students enrolled in the Security Analysis (6F:112) class at the University of Iowa. The report was originally created to offer an internal investment recommendation for the University of Iowa Krause Fund and its advisory board. The report also provides potential employers and other interested parties an example of the students’ skills, knowledge and abilities. Members of the Krause Fund are not registered investment advisors, brokers or officially licensed financial professionals. The investment advice contained in this report does not represent an offer or solicitation to buy or sell any of the securities mentioned. Unless otherwise noted, facts and figures included in this report are from publicly available sources. This report is not a complete compilation of data, and its accuracy is not guaranteed. From time to time, the University of Iowa, its faculty, staff, students, or the Krause Fund may hold a financial interest in the companies mentioned in this report.

14
References: i Kraft Foods Group, Inc., “Press Lease,” http://newscenter.kraftfoodsgroup.com/phoenix.zhtml?c=253200&p=irol-newsArticle&ID=2028345, accessed Apr. 10, 2015. ii United States Securities and Exchange Commission, “Kraft Foods Group, Inc. Form 10-K,” accessed Feb. 13, 2015. iii NetAdvantage, “Kraft Foods Group,” http://www.netadvantage.standardandpoors.com.proxy.lib.uiowa.edu/NASApp/NetAdvantage/CorporationRecords.do, accessed Feb. 13, 2015. iv Applied Equity Valuation, Todd Houge, University of Iowa. v Federal Reserve http://research.stlouisfed.org/fred2/series/GDPC96 vi Federal Reserve vii Bloomberg Software, accessed Jan. 30, 2015. viii Bureau of Labor Statistics, “Databases, Tables & Calculators by Subject. Labor Force Statistics from the Current Population Survey,” http://data.bls.gov/timeseries/LNS14000000, accessed Jan. 30, 2015. ix http://research.stlouisfed.org/fred2/series/UNRATE x Bloomberg Software, accessed Jan. 30, 2015. xi “Board of Governors of the Federal Reserve System,” Federal Reserve. Press release, Jan. 28, 2015, http://www.federalreserve.gov/newsevents/press/monetary/20150128a.htm, accessed Jan. 30, 2015. xii Christos Charalambous, Edge Wealth Management, LLC, “A View on U.S. Consumer Staples,” Jul. 20, 2012, http://www.edgewealth.com/updates/archive/2012/a-view-on-us-consumer-staples/, accessed Jan. 30, 2015. xiii Paul Davidson, USA Today, “Rising Food Prices Bite into Household Budgets,” Mar. 19, 2014, http://www.usatoday.com/story/money/business/2014/03/18/food-prices-rising/6557417/, accessed Jan. 30, 2015. xiv Craig K. Elwell, Congressional Research Service, “Inflation and the Real Minimum Wage: A Fact Sheet,” Jan. 8, 2014, https://www.fas.org/sgp/crs/misc/R42973.pdf, accessed Jan. 30, 2015. xv Economic Research Federal Bank of St. Louis, https://research.stlouisfed.org/fred2/graph/?id=CPIFABNS, accessed Jan. 30, 2015. xvi United States Department of Labor, Bureau of Labor Statistics, “Databases, Tables, and Calculators by Subject,” Jan. 2015, http://data.bls.gov/cgi-bin/surveymost, accessed Jan. 30, 2015. xvii Susan Johnston, U.S. News and World Report, “What Will Cost More in 2015,” Dec. 16, 2014, http://money.usnews.com/money/personal-finance/articles/2014/12/16/what-will-cost-more-in-2015, accessed Jan. 30, 2015. xviii Bruce Albert, the Times-Picayune, “President Obama Expected to Make New Push to Increase Minimum Wage,” Jan. 27, 2015, http://www.nola.com/politics/index.ssf/2014/01/president_obama_expected_to_ma.html, accessed Jan.. 30, 2015. xix FRED Economic Data, “Graph: Real Disposable Personal Income: Per capita,” http://research.stlouisfed.org/fred2/graph/?id=A229RX0,#, accessed Jan. 30, 2015. xx FRED Economic Data, “Disposable Personal Income (DSPI),” http://research.stlouisfed.org/fred2/series/DSPI/downloaddata, accessed Jan. 30, 2015. xxi Joseph Agnese, “Foods and Alcoholic Beverages,”NetAdvantage, Dec. 2014, http://www.netadvantage.standardandpoors.com.proxy.lib.uiowa.edu/NASApp/NetAdvantage/showIndustrySurvey.do?code=fnb, accessed Jan. 28, 2015. xxii Joel Kotkin, “The Changing Demographics of America,” August 2010,
http://www.netadvantage.standardandpoors.com.proxy.lib.uiowa.edu/NASApp/NetAdvantage/showIndustrySurvey.do?code=fnb, accessed Jan. 31, 2015. xxiii Common Sense, “The American Century,” June 4, 2012, http://www.fdbetancor.com/2012/06/04/the-american-century/, accessed Jan. 31, 2015. xxiv Joel Kotkin, “The Changing Demographics of America,” August 2010, http://www.netadvantage.standardandpoors.com.proxy.lib.uiowa.edu/NASApp/NetAdvantage/showIndustrySurvey.do?code=fnb, accessed Jan. 31, 2015. xxv Brad Sorensen, “Consumer Staples Sector Rating: Outperform,” Charles Schwab, January 29, 2015, http://www.schwab.com/public/schwab/nn/articles/Consumer-staples-sector, accessed Feb. 2, 2015. xxvi Fidelity, “Consumer Staples,” 2015, https://eresearch.fidelity.com/eresearch/markets_sectors/sectors/sectors_in_market.jhtml?tab=industries§or=30, accessed Jan. 31, 2015. xxvii Food and Agriculture Organization of the United States, “Food and agriculture industries,” http://www.fao.org/ag/ags/food-and-agricultural-industries/en/, accessed Feb. 8, 2015. xxviiiMonica Watrous, “Why Millennials Love Store Brands,” Apr. 10, 2015, http://www.foodbusinessnews.net/articles/news_home/Consumer_Trends/2015/04/Why_millennials_love_store_bra.aspx?ID=%7B44ECC337-75C5-4647-A302-BBA7B1248ED3%7D, accessed Apr. 15, 2015. xxix Caroline Scott, “Innova predicts top ten food trends for 2015”, November 7, 2014 http://www.foodnavigator.com/Market-Trends/Innova-top-ten-food-trends-2015, accessed Feb. 9, 2015 xxx Joseph Agnese, “Foods and Alcoholic Beverages,”NetAdvantage, Dec. 2014, accessed Feb. 9, 2015. xxxi Joseph Agnese, “Foods and Alcoholic Beverages,”NetAdvantage, Dec. 2014, accessed Feb. 9, 2015. xxxii Paul Davidson, USA Today, “Rising Food Prices Bite into Household Budgets,” Mar. 19, 2014, http://www.usatoday.com/story/money/business/2014/03/18/food-prices-rising/6557417/, accessed Jan. 30, 2015. xxxiii Joseph Agnese, “Foods and Alcoholic Beverages,”NetAdvantage, Dec. 2014, accessed Feb. 9, 2015. xxxiv World Bank, “U.S. Population Growth Rate,” http://www.google.com/publicdata/explore?ds=d5bncppjof8f9_&met_y=sp_pop_grow&idim=country:USA:IND:CAN&hl=en&dl=en#!ctype=l&strail=false&bcs=d&nselm=h&met_y=sp_pop_grow&scale_y=lin&ind_y=false&rdim=region&idim=country:USA:IND:CAN&ifdim=region&hl=en_US&dl=en&ind=false, accessed Mar. 22, 2014. xxxv PRNewswire, “Beverage Packaging Market Forecast 2014 – 2014,” Octtober 20, 2014, http://www.prnewswire.com/news-releases/beverage-packaging-market-forecast-2014-2024-650854520.html, accessed Feb. 9, 2015. xxxvi Cheese Notes, “China’s Growing Cheese Market,” http://cheesenotes.com/post/36977069821/china-cheese-market, accessed Apr. 18, 2015. xxxvii PRNewswire, “Beverage Packaging Market Forecast 2014 – 2014,” October 20, 2014, http://www.prnewswire.com/news-releases/beverage-packaging-market-forecast-2014-2024-650854520.html, accessed Februrary 9, 2015. xxxviii Dennis Salazar, “What’s New in Green Packaging,” May 16, 2013, http://www.environmentalleader.com/2013/05/16/whats-new-in-green-packaging/, accessed Feb. 9, 2015. xxxix Keith Nunes, “The Three ‘Cs’ Driving Kraft’s Go-To-Market Strategy,” Feb. 19, 2014, http://www.foodbusinessnews.net/articles/news_home/Business_News/2014/02/The_three_Cs_driving_Krafts_go.aspx?ID=%7BB1B128D9-
15
2608-47BD-9467-7404036217D3%7D&cck=1, accessed Apr. 20, 2015. xl Yahoo! Finance, “Kraft Foods Group Reports Fourth Quarter and Full Year 2014 Results,” Feb. 12, 2015 http://finance.yahoo.com/news/kraft-foods-group-reports-fourth-210500943.html, accessed Mar. 15, 2015. xli Kraft Foods Group Ins., 10-k, Feb. 21, 2014, http://www.sec.gov/cgi-bin/browse-edgar?action=getcompany&CIK=0001545158&owner=exclude&count=40&hidefilings=0, accessed Feb. 15, 2015. xlii Kraft Foods Group Inc., http://www.kraftfoodsgroup.com/BRANDS/index.aspx, accessed Feb. 15, 2015. xliii E.J. Schultz, “Kraft's New CEO Could Put Marketing Under Microscope,” Advertising Age, Dec. 22, 2014, http://adage.com/article/cmo-strategy/kraft-s-ceo-put-marketing-microscope/296362/, accessed Feb. 15, 2015. xliv Vending MarketWatch.com, “Kraft Foods Announces Over 40 New Products In 2013,” Jan. 3, 2013, http://www.vendingmarketwatch.com/news/10847884/kraft-foods-announces-over-40-new-products-in-2013, accessed Feb. 14, 2015. xlv Kraft Foods Group Inc., “News Releases,” Feb. 15, 2015, http://newscenter.kraftfoodsgroup.com/phoenix.zhtml?c=253200&p=irol-news&nyo=1, accessed Feb. 15, 2015. xlvi Elaine Watson, “New Product Development at Kraft Foods Group: ‘The Days of spray and pray innovation are gone,’” FOODnavigator-usa.com, Sept. 13, 2012, http://www.foodnavigator-usa.com/Manufacturers/New-product-development-at-Kraft-Foods-Group-The-days-of-spray-and-pray-innovation-are-gone, accessed Feb. 15, 2015. xlvii Kraft Foods Group Ins., 10-k, Feb. 21, 2014, http://www.sec.gov/cgi-bin/browse-edgar?action=getcompany&CIK=0001545158&owner=exclude&count=40&hidefilings=0, accessed Feb. 15, 2015. xlviii Kraft Foods Group Ins., 10-k, Feb. 21, 2014, http://www.sec.gov/cgi-bin/browse-edgar?action=getcompany&CIK=0001545158&owner=exclude&count=40&hidefilings=0, accessed Feb. 15, 2015. xlix 10K p12 l Kraft Foods Group, Inc, Raw Materials and Packaging, page 3 http://ir.kraftfoodsgroup.com/secfiling.cfm?filingID=1545158-14-3&CIK=1545158, accessed Feb. 19, 2015 li Kraft Foods Group, Inc, Manufacturing and Processing, Distribution, page 4 http://ir.kraftfoodsgroup.com/secfiling.cfm?filingID=1545158-14-3&CIK=1545158, accessed Feb. 19, 2015 lii IBIS World, “Cheese Production Industry,” accessed Apr. 21, 2015. liii IBIS World, “Coffee Production Industry,” accessed Apr. 21, 2015. liv Kraft Foods Group Inc., “Kraft Foods Group Announces Leadership Changes,” Feb. 15, 2015, http://newscenter.kraftfoodsgroup.com/phoenix.zhtml?c=253200&p=irol-newsArticle&ID=2016432, accessed Feb. 15, 2015. lv Kraft Foods Group Ins., 10-k, Feb.. 21, 2014, http://www.sec.gov/cgi-bin/browse-edgar?action=getcompany&CIK=0001545158&owner=exclude&count=40&hidefilings=0, accessed Feb. 15, 2015. lvi Sam Diedrich, “The Dollar Rally: Where does the Buck Stop?” Forbes, October 14, 2014, http://www.forbes.com/sites/greatspeculations/2014/10/14/the-dollar-rally-where-will-the-buck-stop/, accessed Feb. 15, 2015. lvii Craig Giammona & Matthew Boyle, “Kraft Will Merge With Heinz in Deal Backed by 3G and Buffett,” Mar. 25, 2015, Bloomberg Business, http://www.bloomberg.com/news/articles/2015-03-25/3g-
capital-berkshire-to-buy-kraft-foods-merge-it-with-heinz, accessed Apr. 19, 2015. lviii Trefis Team, “Analysis Of the Kraft-Heinz Merger,” Mar. 30, 2015, Forbes, http://www.forbes.com/sites/greatspeculations/2015/03/30/analysis-of-the-kraft-heinz-merger/, accessed Apr. 19, 2015. lix MarketLine, “Company Profile Kraft Foods Group, Inc.,” October 23, 2014, accessed Feb. 15, 2015. lx http://www.cnbc.com/id/102533328 lxi MarketLine, “Company Profile Kraft Foods Group, Inc.,” October 23, 2014, accessed Feb. 15, 2015. lxii NBC News, “Kraft Recalls 6.5 Million Boxes of Mac and Cheese That Might Have Metal,” http://www.nbcnews.com/news/us-news/kraft-recalls-6-5-million-boxes-mac-cheese-might-have-n325366, accessed Apr. 13, 2015. lxiii Jonel Aleccia, “Kraft Recalls 1.2 Million Cases of Cottage Cheese,” http://www.nbcnews.com/health/health-news/kraft-recalls-1-2-million-cases-cottage-cheese-n108101, accessed Apr. 13, 2015. lxiv U.S. Food and Drug Administration, “Kraft Voluntarily Recalls Some Varieties of Kraft And Polly-O String Cheese And String Cheese Twists Due to Premature Spoilage,” http://www.fda.gov/Safety/Recalls/ucm372320.htm, accessed Apr. 13, 2015. lxv Kraft Foods Group Ins., 10-k, Feb. 21, 2014, http://www.sec.gov/cgi-bin/browse-edgar?action=getcompany&CIK=0001545158&owner=exclude&count=40&hidefilings=0, accessed Feb. 15, 2015. lxvi Joseph Agnese, “Foods and Alcoholic Beverages,” NetAdvantage, Dec. 2014, accessed Februrary 9, 2015. lxvii Kraft Foods Group Ins., 10-k, Feb. 21, 2014, http://www.sec.gov/cgi-bin/browse-edgar?action=getcompany&CIK=0001545158&owner=exclude&count=40&hidefilings=0, accessed Feb. 15, 2015. lxviii Trefis Team, “3 Key Trends Impacting Our $61 Price Estimate for Kraft Foods Group,” Forbes, May 16, 2014, http://www.forbes.com/sites/greatspeculations/2014/05/16/3-key-trends-impacting-our-61-price-estimate-for-kraft-foods-group/, accessed Feb. 15, 2015. lxix Kraft Foods Group Ins., 10-k, Feb. 21, 2014, http://www.sec.gov/cgi-bin/browse-edgar?action=getcompany&CIK=0001545158&owner=exclude&count=40&hidefilings=0, accessed Feb. 15, 2015. lxx Kraft Foods Group, Inc., S&P Capital IQ NetAdvantage, Feb. 15, 2015, https://login.proxy.lib.uiowa.edu/login?url=http://www.netadvantage.standardandpoors.com/NASApp/NetAdvantage/cp/companyIndustryPage.do, accessed Feb. 15, 2015. lxxi PRNewswire, “Beverage Packaging Market Forecast 2014 – 2014,” Oct. 20, 2014, http://www.prnewswire.com/news-releases/beverage-packaging-market-forecast-2014-2024-650854520.html, accessed Feb. 9, 2015. lxxii PRNewswire, “Beverage Packaging Market Forecast 2014 – 2014,” Oct. 20, 2014, http://www.prnewswire.com/news-releases/beverage-packaging-market-forecast-2014-2024-650854520.html, accessed Feb. 9, 2015. lxxiii Erin Lash, “Change Is Brewing at Kraft, but Its Brand Intangible Asset Is Unwavering; Shares a Bit Lofty”, Morningstar, Feb. 2, 2015, accessed Feb. 15, 2015. http://news.morningstar.com/articlenet/article.aspx?id=684487 lxxiv E.J. Schultz, “Kraft's New CEO Could Put Marketing Under Microscope”, Advertising Age, Dec. 22, 2014, accessed Feb. 15, 2015. http://adage.com/article/cmo-strategy/kraft-s-ceo-put-marketing-microscope/296362/

16
lxxv Sarah Day Levesque, “Private Label Beverages,” Mintel Online, Dec. 2013, accessed Apr. 20, 2015.

Kraft Foods Group, Inc.
Key Assumptions of Valuation Model
Ticker Symbol KRFT
Current Share Price $86.94
Current Model Date 4/30/2015
Fiscal Year End December 31
Pre‐Tax Cost of Debt 4.53%
Beta 0.6
Risk‐Free Rate 2.54%
Equity Risk Premium 4.62%
CV Growth of NOPLAT 2.00%
CV Growth of EPS 2.00%
Current Dividend Yield 2.20%
Marginal Tax Rate 35%
Effective Tax Rate
After Tax Debt 2.94%
CV ROIC 24.82%
Cost of Equity 5.31%
SGA/Sales 18.00%
COGS/Sales 69.0%
WACC 4.92%
CapEx/Sales 2.64%

Kraft Foods Group, Inc.
Revenue Decomposition
Fiscal Years Ending December 31 2012 2013 2014 2015E 2016E 2017E 2018E 2019E
Beverages 2,718 2,681 2,637 2,624 2,624 2,637 2,650 2,663
Growth ‐9.10% ‐1.36% ‐1.64% ‐0.50% 0.00% 0.50% 0.50% 0.50%
Cheese 3,829 3,925 4,066 4,216 4,375 4,544 4,723 4,908
Growth 1.08% 2.51% 3.59% 3.69% 3.78% 3.86% 3.93% 3.93%
Refrigerated Meals 3,280 3,334 3,433 3,536 3,643 3,755 3,871 3,991
Growth ‐1.00% 1.65% 2.97% 3.00% 3.03% 3.06% 3.09% 3.12%
Meals & Desserts 2,311 2,305 2,155 2,090 2,059 2,059 2,080 2,100
Growth 1.76% ‐0.26% ‐6.51% ‐3.00% ‐1.50% 0.00% 1.00% 1.00%
Enhancers & Snack Nuts 2,220 2,101 2,062 2,064 2,067 2,070 2,073 2,076
Growth ‐1.73% ‐5.36% ‐1.86% 0.10% 0.14% 0.14% 0.14% 0.14%
Canada 2,010 2,037 1,937 1,931 1,929 1,931 1,937 1,947
Growth 2.19% 1.34% ‐4.91% ‐0.30% ‐0.10% 0.10% 0.30% 0.50%
Other Business 1,903 1,835 1,925 1,930 1,949 1,973 2,003 2,038
Growth ‐4.28% ‐3.57% 4.90% 0.25% 1.00% 1.25% 1.50% 1.75%
Total Net Sales 18,271 18,218 18,205 18,391 18,647 18,969 19,336 19,724
Change in Net Sales ‐1.64% ‐0.29% ‐0.07% 1.02% 1.39% 1.73% 1.93% 2.01%
% of Sales 2012 2013 2014 2015E 2016E 2017E 2018E 2019E
Beverages 14.88% 14.72% 14.49% 14.27% 14.07% 13.90% 13.71% 13.50%
Cheese 20.96% 21.54% 22.33% 22.92% 23.46% 23.96% 24.43% 24.89%
Refrigerated Meals 17.95% 18.30% 18.86% 19.23% 19.54% 19.79% 20.02% 20.24%
Meals & Desserts 12.65% 12.65% 11.84% 11.37% 11.04% 10.85% 10.75% 10.65%
Enhancers & Snack Nuts 12.15% 11.53% 11.33% 11.22% 11.08% 10.91% 10.72% 10.52%
Canada 11.00% 11.18% 10.64% 10.50% 10.35% 10.18% 10.02% 9.87%
Other Business 10.42% 10.07% 10.57% 10.49% 10.45% 10.40% 10.36% 10.33%
Total 100.00% 100.00% 100.00% 100.00% 100.00% 100.00% 100.00% 100.00%
Kraft Foods Group, Inc. 0.6582147 0.6039082 0.7127163 0.6562571 0.6591273 0.6580447 0.6580107 #########
Income Statement 10.00% 9.35% 9.36% 9.30% 9.50% 9.38% 9.38% 9.39%(Millions, except per share data) 16.52% 11.66% 16.24% 15.52% 15.17% 15.02% 14.72% 15.00%
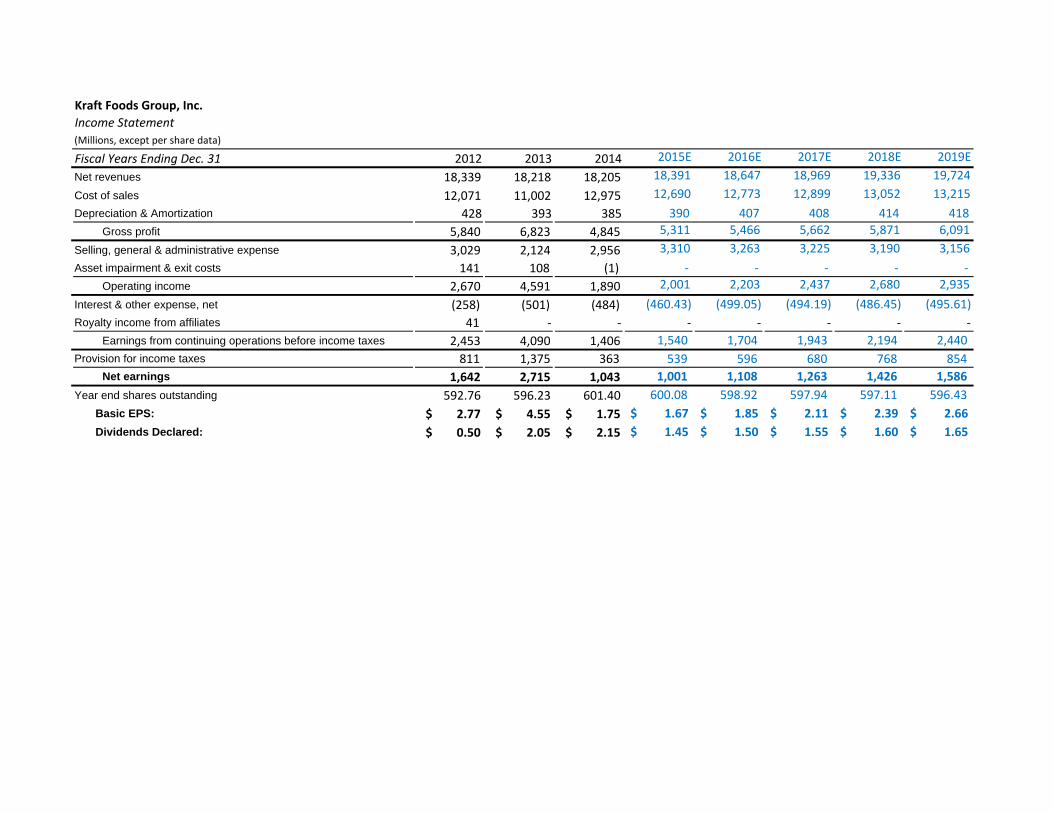
Fiscal Years Ending Dec. 31 2012 2013 2014 2015E 2016E 2017E 2018E 2019E
Net revenues 18,339 18,218 18,205 18,391 18,647 18,969 19,336 19,724
Cost of sales 12,071 11,002 12,975 12,690 12,773 12,899 13,052 13,215
Depreciation & Amortization 428 393 385 390 407 408 414 418
Gross profit 5,840 6,823 4,845 5,311 5,466 5,662 5,871 6,091
Selling, general & administrative expense 3,029 2,124 2,956 3,310 3,263 3,225 3,190 3,156
Asset impairment & exit costs 141 108 (1) ‐ ‐ ‐ ‐ ‐
Operating income 2,670 4,591 1,890 2,001 2,203 2,437 2,680 2,935
Interest & other expense, net (258) (501) (484) (460.43) (499.05) (494.19) (486.45) (495.61)
Royalty income from affiliates 41 ‐ ‐ ‐ ‐ ‐ ‐ ‐
Earnings from continuing operations before income taxes 2,453 4,090 1,406 1,540 1,704 1,943 2,194 2,440
Provision for income taxes 811 1,375 363 539 596 680 768 854
Net earnings 1,642 2,715 1,043 1,001 1,108 1,263 1,426 1,586
Year end shares outstanding 592.76 596.23 601.40 600.08 598.92 597.94 597.11 596.43
Basic EPS: $ 2.77 $ 4.55 $ 1.75 1.67$ 1.85$ 2.11$ 2.39$ 2.66$
Dividends Declared: $ 0.50 $ 2.05 $ 2.15 1.45$ 1.50$ 1.55$ 1.60$ 1.65$
Kraft Foods Group, Inc.
Balance Sheet(Millions)
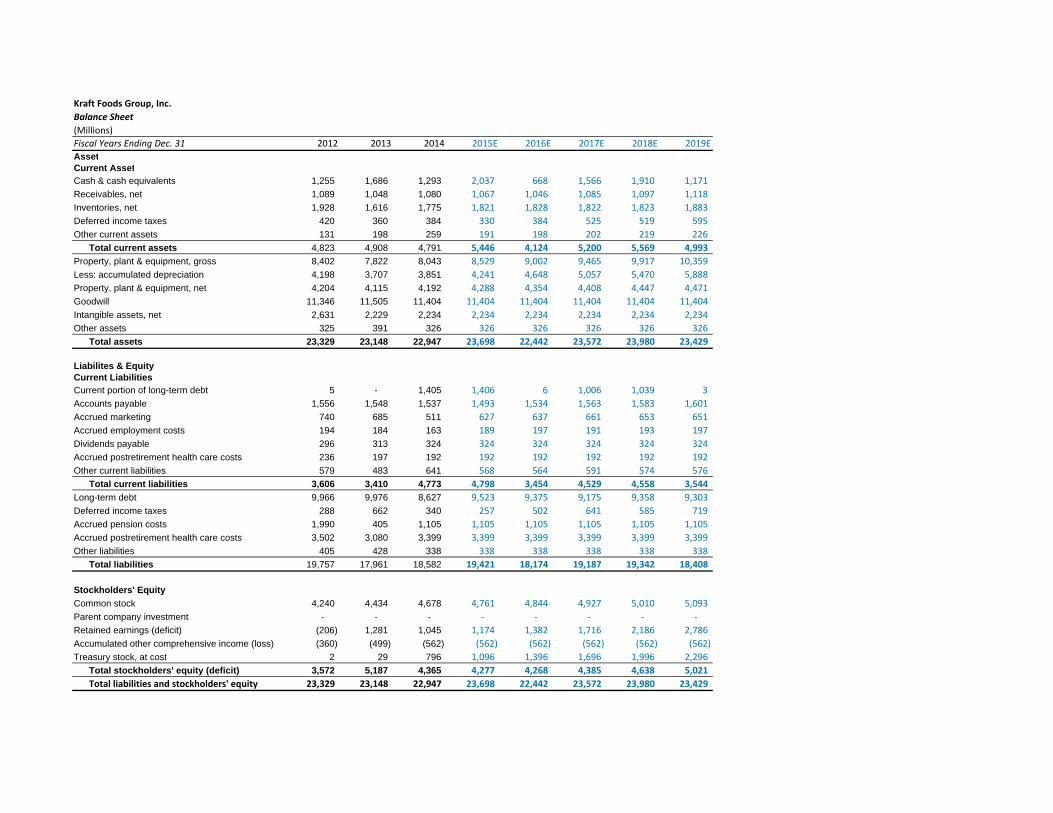
Fiscal Years Ending Dec. 31 2012 2013 2014 2015E 2016E 2017E 2018E 2019E
AssetCurrent AssetCash & cash equivalents 1,255 1,686 1,293 2,037 668 1,566 1,910 1,171
Receivables, net 1,089 1,048 1,080 1,067 1,046 1,085 1,097 1,118
Inventories, net 1,928 1,616 1,775 1,821 1,828 1,822 1,823 1,883
Deferred income taxes 420 360 384 330 384 525 519 595
Other current assets 131 198 259 191 198 202 219 226
Total current assets 4,823 4,908 4,791 5,446 4,124 5,200 5,569 4,993
Property, plant & equipment, gross 8,402 7,822 8,043 8,529 9,002 9,465 9,917 10,359
Less: accumulated depreciation 4,198 3,707 3,851 4,241 4,648 5,057 5,470 5,888
Property, plant & equipment, net 4,204 4,115 4,192 4,288 4,354 4,408 4,447 4,471
Goodwill 11,346 11,505 11,404 11,404 11,404 11,404 11,404 11,404
Intangible assets, net 2,631 2,229 2,234 2,234 2,234 2,234 2,234 2,234
Other assets 325 391 326 326 326 326 326 326
Total assets 23,329 23,148 22,947 23,698 22,442 23,572 23,980 23,429 51.79% 26.18% 105.79% 61.25% 64.41% 77.15% 67.60% 69.72%
Liabilites & EquityCurrent Liabilities 80.71% 95.79% 86.59% 82.01% 83.91% 85.80% 86.82% 85.03%Current portion of long-term debt 5 - 1,405 1,406 6 1,006 1,039 3
Accounts payable 1,556 1,548 1,537 1,493 1,534 1,563 1,583 1,601
Accrued marketing 740 685 511 627 637 661 653 651
Accrued employment costs 194 184 163 189 197 191 193 197
Dividends payable 296 313 324 324 324 324 324 324
Accrued postretirement health care costs 236 197 192 192 192 192 192 192
Other current liabilities 579 483 641 568 564 591 574 576
Total current liabilities 3,606 3,410 4,773 4,798 3,454 4,529 4,558 3,544
Long-term debt 9,966 9,976 8,627 9,523 9,375 9,175 9,358 9,303
Deferred income taxes 288 662 340 257 502 641 585 719
Accrued pension costs 1,990 405 1,105 1,105 1,105 1,105 1,105 1,105
Accrued postretirement health care costs 3,502 3,080 3,399 3,399 3,399 3,399 3,399 3,399
Other liabilities 405 428 338 338 338 338 338 338
Total liabilities 19,757 17,961 18,582 19,421 18,174 19,187 19,342 18,408
Stockholders' Equity Common stock 4,240 4,434 4,678 4,761 4,844 4,927 5,010 5,093
Parent company investment - - - ‐ ‐ ‐ ‐ ‐
Retained earnings (deficit) (206) 1,281 1,045 1,174 1,382 1,716 2,186 2,786
Accumulated other comprehensive income (loss) (360) (499) (562) (562) (562) (562) (562) (562)
Treasury stock, at cost 2 29 796 1,096 1,396 1,696 1,996 2,296
Total stockholders' equity (deficit) 3,572 5,187 4,365 4,277 4,268 4,385 4,638 5,021
Total liabilities and stockholders' equity 23,329 23,148 22,947 23,698 22,442 23,572 23,980 23,429

Kraft Foods Group, Inc. ‐0.0563026 ‐0.049088 ‐0.0523685 ‐0.0712094 ‐0.0665175
Cash Flow Statement
(Millions) ‐2.15% ‐2.40% ‐3.06% ‐2.94%Fiscal Years Ending December 31 2010 2011 2012 2013 2014
Net earnings 3,531 1,839 1,642 2,715 1,043 Depreciation & amortization 354 364 428 393 385 Stock-based compensation 49 51 54 65 95 Deferred income tax provision (benefit) (74) 69 470 708 (361) Losses (gains) on divestitures, net 6 - - - - Gains on discontinued operations (1,596) - - - - Asset impairement, net of cash proceeds - - 28 28 - Market-based impacts to postemployment benefit plans - - - (1,561) 1,341 Other non-cash expense, net 57 58 159 138 67 Receivables, net (80) 238 220 35 (22) Inventories, net (69) (169) 21 235 (53) Accounts payable (5) 226 (241) 45 45 Other current assets (5) (88) (61) (9) (41) Other current liabilities (1,329) 84 205 (217) (164) Change in pension & postretirement assets & liabilities, net (11) (8) 110 (532) (315)
Net cash flows from operating activities 828 2,664 3,035 2,043 2,020 Capital expenditures (448) (401) (440) (557) (535) Proceeds from divestitures 3,698 - - - - Proceeds from sale of property, plant & equipment - - 18 131 2 Other investing activities - - - - (2)
Net cash flows from investing activities 3,250 (401) (422) (426) (535) Long-term debt repaid (9) (9) (8) (4) - Dividends paid - - - (1,207) (1,266) Repurchase of common stock under share repurchase program - - - - (740) Proceeds from stock option exercises - - 14 96 115 Long-term debt proceeds - - 5,963 - - Net transfer to Mondelez International - - (7,210) - - Net transfers to Kraft ParentCo & affiliates (4,037) (2,238) - - - Other financing activities (32) (18) (117) (56) 25
Net cash flows from financing activities (4,078) (2,265) (1,358) (1,171) (1,866) Effect of exchange rate changes on cash & cash equivalents - - - (15) (12)
Net change in cash & cash equivalents - (2) 1,255 431 (393) Cash & cash equivalents - beginning of period 2 2 - 1,255 1,686 Cash & cash equivalents - end of period 2 - 1,255 1,686 1,293
Kraft Foods Group, Inc.
Cash Flow Statement
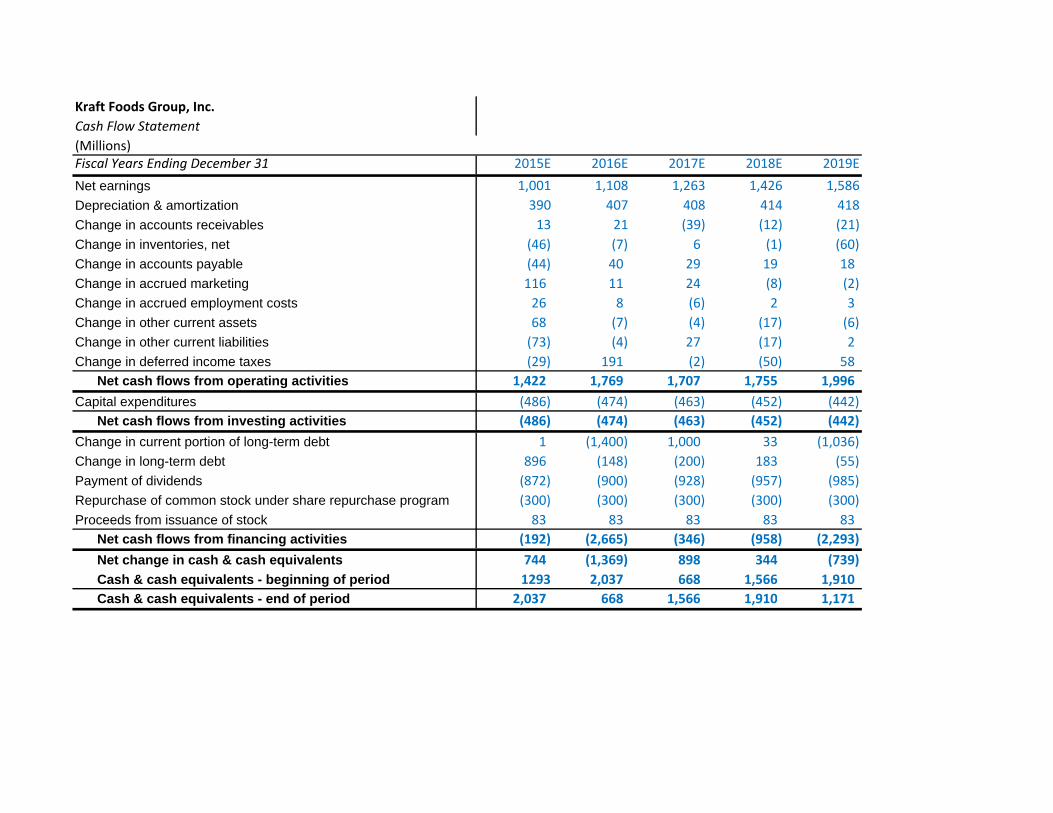
(Millions)Fiscal Years Ending December 31 2015E 2016E 2017E 2018E 2019E
Net earnings 1,001 1,108 1,263 1,426 1,586
Depreciation & amortization 390 407 408 414 418
Change in accounts receivables 13 21 (39) (12) (21)
Change in inventories, net (46) (7) 6 (1) (60)
Change in accounts payable (44) 40 29 19 18
Change in accrued marketing 116 11 24 (8) (2)
Change in accrued employment costs 26 8 (6) 2 3
Change in other current assets 68 (7) (4) (17) (6)
Change in other current liabilities (73) (4) 27 (17) 2
Change in deferred income taxes (29) 191 (2) (50) 58
Net cash flows from operating activities 1,422 1,769 1,707 1,755 1,996
Capital expenditures (486) (474) (463) (452) (442)
Net cash flows from investing activities (486) (474) (463) (452) (442)
Change in current portion of long-term debt 1 (1,400) 1,000 33 (1,036)
Change in long-term debt 896 (148) (200) 183 (55)
Payment of dividends (872) (900) (928) (957) (985)
Repurchase of common stock under share repurchase program (300) (300) (300) (300) (300)
Proceeds from issuance of stock 83 83 83 83 83
Net cash flows from financing activities (192) (2,665) (346) (958) (2,293)
Net change in cash & cash equivalents 744 (1,369) 898 344 (739)
Cash & cash equivalents - beginning of period 1293 2,037 668 1,566 1,910
Cash & cash equivalents - end of period 2,037 668 1,566 1,910 1,171

Kraft Foods Group, Inc.
Common Size Income Statement
(Millions, except per share data)
Fiscal Years Ending Dec. 31 2012 2013 2014 2015E 2016E 2017E 2018E 2019E
Net revenues 100.00% 100.00% 100.00% 100.00% 100.00% 100.00% 100.00% 100.00%
Cost of sales 65.82% 60.39% 71.27% 69.00% 68.50% 68.00% 67.50% 67.00%
Depreciation 2.33% 2.16% 2.11% 2.12% 2.19% 2.15% 2.14% 2.12%
Gross profit 31.84% 37.45% 26.61% 28.88% 29.31% 29.85% 30.36% 30.88%
Selling, general & administrative expense 16.52% 11.66% 16.24% 18.00% 17.50% 17.00% 16.50% 16.00%
Asset impairment & exit costs 0.77% 0.59% ‐0.01% ‐ ‐ ‐ ‐ ‐
Operating income 14.56% 25.20% 10.38% 10.88% 11.81% 12.85% 13.86% 14.88%
Interest & other expense, net ‐1.41% ‐2.75% ‐2.66% ‐2.50% ‐2.68% ‐2.61% ‐2.52% ‐2.51%
Royalty income from affiliates 0.22% ‐ ‐ ‐ ‐ ‐ ‐ ‐
Earnings from continuing operations before income taxes 13.38% 22.45% 7.72% 8.38% 9.14% 10.24% 11.34% 12.37%
Provision for income taxes 4.42% 7.55% 1.99% 2.93% 3.20% 3.58% 3.97% 4.33%
Net earnings 8.95% 14.90% 5.73% 5.44% 5.94% 6.66% 7.37% 8.04%

Kraft Foods Group, Inc.
Common Size Balance Sheet
(% of sales, 2 decimals)Fiscal Years Ending Dec. 31 2012 2013 2014 2015E 2016E 2017E 2018E 2019E
AssetCurrent AssetCash & cash equivalents 6.84% 9.25% 7.10% 11.08% 3.58% 8.26% 9.88% 5.94%
Receivables, net 5.94% 5.75% 5.93% 5.80% 5.61% 5.72% 5.67% 5.67%
Inventories, net 10.51% 8.87% 9.75% 9.90% 9.80% 9.60% 9.43% 9.55%
Deferred income taxes 2.29% 1.98% 2.11% 1.80% 2.06% 2.77% 2.68% 3.02%
Other current assets 0.71% 1.09% 1.42% 1.04% 1.06% 1.06% 1.13% 1.14%
Total current assets 26.30% 26.94% 26.32% 29.61% 22.12% 27.41% 28.80% 25.32%
Property, plant & equipment, gross 45.81% 42.94% 44.18% 46.37% 48.28% 49.90% 51.29% 52.52%
Less: accumulated depreciation 22.89% 20.35% 21.15% 23.06% 25.27% 27.49% 29.74% 32.02%
Property, plant & equipment, net 22.92% 22.59% 23.03% 23.31% 23.67% 23.97% 24.18% 24.31%
Goodwill 61.87% 63.15% 62.64% 62.01% 61.16% 60.12% 58.98% 57.82%
Intangible assets, net 14.35% 12.24% 12.27% 12.15% 11.98% 11.78% 11.55% 11.33%
Other assets 1.77% 2.15% 1.79% 1.77% 1.75% 1.72% 1.69% 1.65%
Total assets 127.21% 127.06% 126.05% 128.85% 120.35% 124.26% 124.02% 118.78%
Liabilites & EquityCurrent LiabilitiesCurrent portion of long-term debt 0.03% - 7.72% 7.64% 0.03% 5.30% 5.37% 0.02%
Accounts payable 8.48% 8.50% 8.44% 8.12% 8.23% 8.24% 8.19% 8.12%
Accrued marketing 4.04% 3.76% 2.81% 3.41% 3.42% 3.49% 3.38% 3.30%
Accrued employment costs 1.06% 1.01% 0.90% 1.03% 1.06% 1.01% 1.00% 1.00%
Dividends payable 1.61% 1.72% 1.78% 1.76% 1.74% 1.71% 1.68% 1.64%
Accrued postretirement health care costs 1.29% 1.08% 1.05% 1.04% 1.03% 1.01% 0.99% 0.97%
Other current liabilities 3.16% 2.65% 3.52% 3.09% 3.02% 3.11% 2.97% 2.92%
Total current liabilities 19.66% 18.72% 26.22% 26.09% 18.53% 23.87% 23.57% 17.97%
Long-term debt 54.34% 54.76% 47.39% 51.78% 50.28% 48.37% 48.40% 47.16%
Deferred income taxes 1.57% 3.63% 1.87% 1.40% 2.69% 3.38% 3.02% 3.65%
Accrued pension costs 10.85% 2.22% 6.07% 6.01% 5.93% 5.83% 5.71% 5.60%
Accrued postretirement health care costs 19.10% 16.91% 18.67% 18.48% 18.23% 17.92% 17.58% 17.23%
Other liabilities 2.21% 2.35% 1.86% 1.84% 1.81% 1.78% 1.75% 1.71%
Total liabilities 107.73% 98.59% 102.07% 105.60% 97.46% 101.15% 100.03% 93.33%
Stockholders' Equity Common stock 23.12% 24.34% 25.70% 25.89% 25.98% 25.97% 25.91% 25.82%
Parent company investment - - - ‐ ‐ ‐ ‐ ‐
Retained earnings (deficit) -1.12% 7.03% 5.74% 6.39% 7.41% 9.05% 11.30% 14.13%
Accumulated other comprehensive income (loss) -2.51% -2.74% -3.09% ‐3.06% ‐3.01% ‐2.96% ‐2.91% ‐2.85%
Treasury stock, at cost 0.01% 0.16% 4.37% 5.96% 7.49% 8.94% 10.32% 11.64%
Total stockholders' equity (deficit) 19.48% 28.47% 23.98% 35.18% 37.86% 41.00% 44.63% 48.74%
Total liabilities and stockholders' equity 127.21% 127.06% 126.05% 140.77% 135.32% 142.14% 144.66% 142.06%

Kraft Foods Group, Inc. 2010 2011 2012 2013 2014Value Driver Estimation 36.90% 38.60% 36.20% 35.60% 33.00% 36.06% 35.89% 35.35% 35.35% 35.13%
Millions
Fiscal Years Ending December 31 2010 2011 2012 2013 2014 2015E 2016E 2017E 2018E 2019E
Net revenue 17,797 18,655 18,339 18,218 18,205 18,391 18,647 18,969 19,336 19,724
Less: Cost of sales 11,424 12,397 12,071 11,002 12,975 12,690 12,773 12,899 13,052 13,215
Less: Selling, general & administrative Expense 3,066 2,973 3,029 2,124 2,956 3,310 3,263 3,225 3,190 3,156
Less: Depreciation 354 364 428 393 385 390 407 408 414 418
Plus: Implied interest on operating lease 43 79 67 22 24 16 16 17 17 17
EBITA 2,996 3,000 2,878 4,721 1,913 2,017 2,220 2,454 2,697 2,952
Provision for income taxes 1,110 1,130 811 1,375 363 539 596 680 768 854
Tax shield on interest expense 3 3 93 178 160 166 179 175 172 174
Tax shield on earnings from discontinued activities 607 ‐ ‐ ‐ ‐ ‐ ‐ ‐ ‐ ‐
Tax shield on interets on PV of operating leases 16 31 24 8 8 6 6 6 6 6
Tax shield on assets impairments (3) (1) 51 38 (0) ‐ ‐ ‐ ‐ ‐
Tax on Royalty income from affiliates 16 21 15 ‐ ‐ ‐ ‐ ‐ ‐ ‐
Total Adjusted Taxes 503 1,141 965 1,600 530 711 782 861 946 1,034
Change in deferred taxes (74) 69 470 708 (361) (29) 191 (2) (50) 58
NOPLAT 2,419 1,928 2,383 3,829 1,022 1,277 1,629 1,591 1,701 1,976
Operating Current Assets
Normal Cash (1% of sales) 178 187 183 182 182 184 186 190 193 197
Accounts Receivable 1,196 903 1,089 1,048 1,080 1,067 1,046 1,085 1,097 1,118
Inventory 1,773 1,943 1,928 1,616 1,775 1,821 1,828 1,822 1,823 1,883
Other operating current assets 165 194 131 198 259 191 198 202 219 226
Operating Current Liabilities
Accounts payable 1,285 1,447 1,556 1,548 1,537 1,493 1,534 1,563 1,583 1,601
Accrued expenses 751 817 934 869 674 815 835 853 846 847
Dividends payable ‐ ‐ 296 313 324 324 324 324 324 324
Net operating working capital 1,276 963 545 314 761 630 566 559 580 651
Net PPE 4,283 4,278 4,204 4,115 4,192 4,288 4,354 4,408 4,447 4,471
Net intangible assets 2,630 2,630 2,631 2,229 2,234 2,234 2,234 2,234 2,234 2,234
Capitalized PV of operating leases 1,319 1,112 367 404 355 363 368 373 376 378
Other operating assets 23 29 325 391 326 326 326 326 326 326
Net other operating assets 3,972 3,771 3,323 3,024 2,915 2,923 2,928 2,933 2,936 2,938
Less: Other operating liablities ‐ ‐ ‐ ‐ ‐ ‐ ‐ ‐ ‐ ‐
Invested Capital 9,531 9,011 8,073 7,453 7,868 7,841 7,848 7,900 7,963 8,061
NOPLAT 2,383 3,829 1,022 1,277 1,629 1,591 1,701 1,976
Beg. Invested Capital 9,011 8,073 7,453 7,868 7,841 7,848 7,900 7,963
ROIC 20.23% 26.44% 47.44% 13.71% 16.23% 20.78% 20.28% 21.53% 24.8%
NOPLAT 2,383 3,829 1,022 1,277 1,629 1,591 1,701 1,976
End. Invested Capital ‐ Begin. Invested Capital (938) (620) 415 (27) 7 52 63 98
FCF 2,448 3,321 4,449 607 1,304 1,622 1,539 1,638 1,879
Beg. Invested Capital 9,011 8,073 7,453 7,868 7,841 7,848 7,900 7,963
ROIC‐WACC 21.52% 42.52% 8.79% 11.31% 15.86% 15.36% 16.61% 19.90%
EP 1,459 1,940 3,432 655 890 1,243 1,205 1,312 1,585

Kraft Foods Group, Inc.
Weighted Average Cost of Capital (WACC) Estimation
WACC 4.92%
Pre‐Tax Cost of Debt 4.53%
Marginal Tax Rate 35.00%
After‐Tax Cost of Debt 2.94%
Beta 0.6
Risk‐Free Rate 2.54%
Equity Risk‐Premium 4.62%
Cost of equity 5.31%
Shares Outstanding 601,403,000
Share Price $86.94
Market value of equity $52,285,976,820
Market Value of Debt (Including PV of Operating Leas $10,386,616,896
Market value of firm $62,672,593,716

Kraft Foods Group, Inc.
Discounted Cash Flow (DCF) and Economic Profit (EP) Valuation Models
(Millions)
Key Inputs:
CV Growth 2.00%
CV ROIC 24.82%
WACC 4.92%
Cost of Equity 5.31%
Fiscal Years Ending Dec. 31 2015E 2016E 2017E 2018E 2019E
DCF Model
Period 1 2 3 4 4
FCF $ 1,304 $ 1,622 $ 1,539 $ 1,638 $ 1,879
Continuing value (CV) $ 62,238
PV of FCF Discounted by WACC $ 1,243 $ 1,473 $ 1,333 $ 1,351 $ 51,361
Value of Operating Assets $ 56,761
Plus: Excess cash 1,111$
Less: Long term Debt 8,627$
Less: Short term Debt 1,405$
Less: ESOP 704$
Less: PV of Operating Leases 355$
Less: Accrued post retirement health care costs 3,591$
Less: Accrued pension costs 1,105$
Value of Equity 42,085$
Shares Outstanding 601.40
Intrinsic Value (per share) 69.98$
Adjusted Value (per share) 70.64$
Fiscal Years Ending 2015E 2016E 2017E 2018E 2019E
EP Model
Period 1 2 3 4 4
Economic Profit to Discount 890$ 1,243$ 1,205$ 1,312$ 1,585$
Continuing Value (CV) 54,275$
PV of FCF Discounted by WACC 848$ 1,129$ 1,043$ 1,083$ 44,789$
PV (Economic Profit) 48,893$
+ Beginning Invested Capital (T=0) 7,868$
Value of Operating Assets 56,761$
Plus: Excess cash 1,111$
Less: Long term Debt 8,627$
Less: Short term Debt 1,405$
Less: ESOP 704$
Less: PV of Operating Leases 355$
Less: Accrued post retirement health care costs 3,591$
Less: Accrued pension costs 1,105$
Value of Equity 42,085$
Shares Outstanding 601.40
Intrinsic Value (per share) 69.98$
Adjusted Value (per share) 70.64$

Kraft Foods Group, Inc.
Dividend Discount Model (DDM) or Fundamental P/E Valuation Model
Fiscal Years Ending December
31 2015E 2016E 2017E 2018E 2019E
EPS 1.67$ 1.85$ 2.11$ 2.39$ 2.66$
Key Assumptions CV growth 2.00%
CV ROE 34.20%
Cost of Equity 5.31%
Future Cash Flows P/E Multiple (CV Year) 28.43
EPS (CV Year) 2.66$
Future Stock Price 75.59$
Dividends Per Share 1.45$ 1.50$ 1.55$ 1.60$ 1.65$
Future Cash Flows 1.45$ 1.50$ 1.55$ 1.60$ 75.59$
Discounted Period 1 2 3 4 4
Discounted Cash Flows 1.38$ 1.35$ 1.33$ 1.30$ 61.45$
Intrinsic Value 65.43$
Adjusted Value (per share) 66.05$

Kraft Foods Group, Inc.Relative Valuation Models
EPS EPS Est. 5yrTicker Company Price 2015E 2016E P/E 15 P/E 16 EPS gr. PEG 15 PEG 16
MDLZ Mondelez International, Inc $38.35 $1.72 $1.99 22.3 19.3 8.74 2.55 2.20
DANOY Danone $14.41 $0.65 $0.70 22.2 20.6 9.90 2.24 2.08
GIS General Mills, Inc. $56.53 $2.83 $2.98 20.0 19.0 5.92 3.37 3.20
HSY The Hershey Company $101.31 $4.36 $4.79 23.2 21.2 9.96 2.33 2.12
K Kellogg Company $66.01 $3.61 $3.83 18.3 17.2 4.40 4.16 3.92 TSN Tyson Foods, Inc. $38.37 $3.43 $3.66 11.2 10.5 19.00 0.59 0.55
Average 21.2 19.4 2.5 2.3
KRFT Kraft Foods Group, Inc. $87.66 $1.67 $1.85 52.5 47.4 8.73 6.0 5.4
Implied Value:
Relative P/E (EPS15) $ 35.36
Relative P/E (EPS16) 35.96$
PEG Ratio (EPS15) 36.99$
PEG Ratio (EPS16) 37.87$

Kraft Foods Group, Inc.
Key Management Ratios
Fiscal Years Ending December
31 2012 2013 2014 2015E 2016E 2017E 2018E 2019E
Liquidity RatiosCurrent Ratio CA/CL 1.34 1.44 1.00 1.14 1.19 1.15 1.22 1.41
Quick Ratio (Cash+ST Secruities+AR)/CL 0.65 0.80 0.50 0.65 0.50 0.59 0.66 0.65
Cash Ratio Cash/CL 0.35 0.49 0.27 0.42 0.19 0.35 0.42 0.33
Activity or Asset‐Management RatiosInventory Turnover Net Sales/AR 16.84 17.38 16.86 17.24 17.83 17.48 17.63 17.64
Receivable Turnover COGS/Inventory 6.26 6.81 7.31 6.97 6.99 7.08 7.16 7.02
Fixed Assets Turnover Net Sales/PPE, net 4.36 4.43 4.34 4.29 4.28 4.30 4.35 4.41
Financial Leverage RatiosDebt Ratio Total Debt/Total Assets 0.43 0.43 0.38 0.40 0.42 0.39 0.39 0.40
D/E Ratio Total Debt/Total SE 2.79 1.92 1.98 2.23 2.20 2.09 2.02 1.85
Interest Coverage EBITA/Interest Expense 11.15 9.42 3.95 4.38 4.45 4.97 5.54 5.96
Profitability RatiosNet Profit Margin Net Income/Revenues 8.95% 14.90% 5.73% 5.44% 5.94% 6.66% 7.37% 8.04%
Gross Profit Margin Gross Porfit/Revenues 31.84% 37.45% 26.61% 28.88% 29.31% 29.85% 30.36% 30.88%
Return on Assets Net Income/Total Assets 7.63% 11.64% 4.51% 4.36% 4.67% 5.63% 6.05% 6.61%
Return on Equity Net Income/Total SE 9.46% 76.01% 20.11% 22.94% 25.90% 29.59% 32.51% 34.20%
Payout Policy RatiosPayout Ratio Div. per share/EPS 18.05% 45.05% 122.86% 86.90% 81.11% 73.39% 67.00% 62.05%
Total Payout Ratio (Dividend + Repurchase)/NI 20.22% 0.30% 1.52% 57.13% 54.18% 49.75% 46.06% 43.21%

Present Value of Operating Lease Obligations (2014) Present Value of Operating Lease Obligations (2013) Present Value of Operating Lease Obligations (2012)
Operating Operating Operating
Fiscal Years Ending Dec. 31 Leases Fiscal Years Ending Leases Fiscal Years Ending Leases
2015 106 2014 109 2013 115
2016 85 2015 85 2014 93
2017 62 2016 71 2015 59
2018 49 2017 56 2016 47
2019 41 2018 49 2017 38
Thereafter 84 Thereafter 126 Thereafter 90
Total Minimum Payments 427 Total Minimum Payments 496 Total Minimum Payments 442
Less: Interest 72 Less: Interest 92 Less: Interest 75
PV of Minimum Payments 355 PV of Minimum Payments 404 PV of Minimum Payments 367
Capitalization of Operating Leases Capitalization of Operating Leases Capitalization of Operating Leases
Pre‐Tax Cost of Debt 6.00% Pre‐Tax Cost of Debt 6.00% Pre‐Tax Cost of Debt 6.00%
Number Years Implied by Year 6 Payment 2.0 Number Years Implied by Year 6 Payment 2.6 Number Years Implied by Year 6 Payment 2.4
Lease PV Lease Lease PV Lease Lease PV Lease
Year Commitment Payment Year Commitment Payment Year Commitment Payment
1 106 100.0 1 109 102.8 1 115 108.5
2 85 75.6 2 85 75.6 2 93 82.8
3 62 52.1 3 71 59.6 3 59 49.5
4 49 38.8 4 56 44.4 4 47 37.2
5 41 30.6 5 49 36.6 5 38 28.4
6 & beyond 41 57.5 6 & beyond 49 84.9 6 & beyond 38 61.0
PV of Minimum Payments 354.6 PV of Minimum Payments 404.0 PV of Minimum Payments 367.4
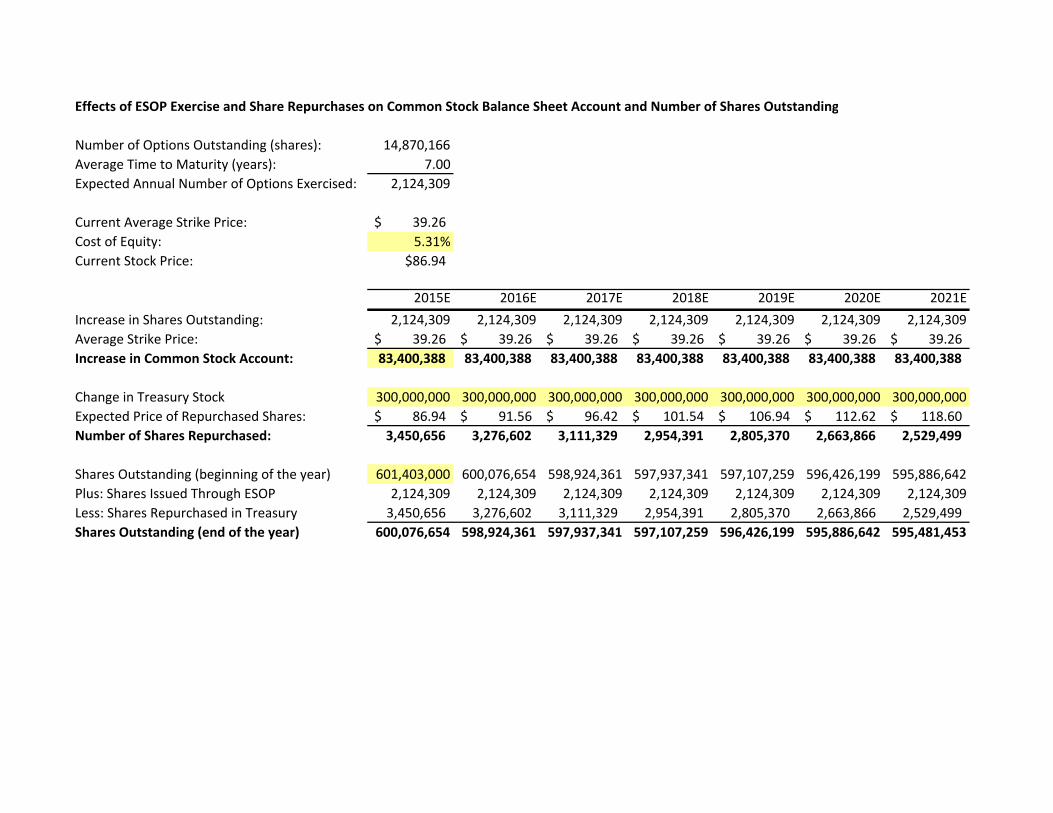
Effects of ESOP Exercise and Share Repurchases on Common Stock Balance Sheet Account and Number of Shares Outstanding
Number of Options Outstanding (shares): 14,870,166
Average Time to Maturity (years): 7.00
Expected Annual Number of Options Exercised: 2,124,309
Current Average Strike Price: 39.26$
Cost of Equity: 5.31%
Current Stock Price: $86.94
2015E 2016E 2017E 2018E 2019E 2020E 2021E
Increase in Shares Outstanding: 2,124,309 2,124,309 2,124,309 2,124,309 2,124,309 2,124,309 2,124,309
Average Strike Price: 39.26$ 39.26$ 39.26$ 39.26$ 39.26$ 39.26$ 39.26$
Increase in Common Stock Account: 83,400,388 83,400,388 83,400,388 83,400,388 83,400,388 83,400,388 83,400,388
Change in Treasury Stock 300,000,000 300,000,000 300,000,000 300,000,000 300,000,000 300,000,000 300,000,000
Expected Price of Repurchased Shares: 86.94$ 91.56$ 96.42$ 101.54$ 106.94$ 112.62$ 118.60$
Number of Shares Repurchased: 3,450,656 3,276,602 3,111,329 2,954,391 2,805,370 2,663,866 2,529,499
Shares Outstanding (beginning of the year) 601,403,000 600,076,654 598,924,361 597,937,341 597,107,259 596,426,199 595,886,642
Plus: Shares Issued Through ESOP 2,124,309 2,124,309 2,124,309 2,124,309 2,124,309 2,124,309 2,124,309
Less: Shares Repurchased in Treasury 3,450,656 3,276,602 3,111,329 2,954,391 2,805,370 2,663,866 2,529,499
Shares Outstanding (end of the year) 600,076,654 598,924,361 597,937,341 597,107,259 596,426,199 595,886,642 595,481,453

VALUATION OF OPTIONS GRANTED IN ESOP
Ticker Symbol KRFT
Current Stock Price $86.94
Risk Free Rate 2.54%
Current Dividend Yield 2.20%
Annualized St. Dev. of Stock Returns 38.80%
Average Average B‐S Value
Range of Number Exercise Remaining Option of Options
Outstanding Options of Shares Price Life (yrs) Price Granted
Range 1 14,870,166 39.26 7.00 47.34$ 704,010,478$
Total 14,870,166 39.26$ 7.00 58.57$ 704,010,478$

$70.64 0.54 0.55 0.56 0.57 0.58 0.59 0.60 0.61 0.62 0.63 0.64 0.65 0.66
0.50% 49.05 48.37 47.70 47.04 46.39 45.75 45.13 44.51 43.91 43.31 42.73 42.15 41.59
0.75% 52.44 51.69 50.94 50.21 49.50 48.79 48.10 47.43 46.76 46.11 45.47 44.84 44.22
1.00% 56.30 55.45 54.62 53.81 53.01 52.23 51.46 50.71 49.97 49.25 48.54 47.85 47.16
1.25% 60.71 59.75 58.82 57.90 57.01 56.13 55.28 54.44 53.61 52.81 52.02 51.24 50.49
1.50% 65.81 64.72 63.66 62.62 61.61 60.62 59.65 58.70 57.78 56.87 55.98 55.11 54.26
1.75% 71.78 70.53 69.31 68.11 66.95 65.82 64.71 63.63 62.58 61.55 60.54 59.56 58.60
2.00% 78.87 77.40 75.97 74.59 73.24 71.92 70.64 69.40 68.18 67.00 65.84 64.72 63.62
2.25% 87.40 85.66 83.97 82.32 80.73 79.18 77.68 76.22 74.80 73.42 72.08 70.78 69.51
2.50% 97.89 95.77 93.72 91.74 89.82 87.97 86.18 84.44 82.75 81.12 79.54 78.00 76.50
2.75% 111.08 108.44 105.90 103.45 101.09 98.82 96.63 94.52 92.47 90.50 88.59 86.75 84.96
3.00% 128.18 124.78 121.52 118.40 115.42 112.55 109.81 107.16 104.63 102.18 99.83 97.56 95.38
3.25% 151.22 146.64 142.30 138.17 134.24 130.50 126.93 123.52 120.26 117.14 114.15 111.29 108.54
3.50% 183.95 177.42 171.29 165.52 160.07 154.94 150.08 145.48 141.11 136.96 133.02 129.27 125.69
$70.64 23.62% 23.82% 24.02% 24.22% 24.42% 24.62% 24.82% 25.02% 25.22% 25.42% 25.62% 25.82% 26.02%
1.34% 119.95 120.06 120.16 120.26 120.36 120.46 120.56 120.65 120.75 120.84 120.93 121.02 121.11
1.54% 108.36 108.46 108.55 108.65 108.74 108.83 108.92 109.00 109.09 109.17 109.26 109.34 109.42
1.74% 98.49 98.58 98.67 98.75 98.84 98.92 99.00 99.08 99.16 99.24 99.31 99.39 99.46
1.94% 89.98 90.06 90.14 90.22 90.30 90.37 90.45 90.52 90.59 90.67 90.74 90.81 90.88
2.14% 82.56 82.63 82.71 82.78 82.85 82.93 83.00 83.06 83.13 83.20 83.27 83.33 83.39
2.34% 76.04 76.11 76.18 76.25 76.31 76.38 76.45 76.51 76.57 76.64 76.70 76.76 76.82
2.54% 70.26 70.32 70.39 70.45 70.52 70.58 70.64 70.70 70.76 70.82 70.88 70.93 70.99
2.74% 65.10 65.16 65.23 65.29 65.35 65.41 65.46 65.52 65.58 65.63 65.68 65.74 65.79
2.94% 60.47 60.53 60.59 60.65 60.70 60.76 60.81 60.87 60.92 60.97 61.02 61.07 61.12
3.14% 56.29 56.35 56.40 56.46 56.51 56.56 56.62 56.67 56.72 56.77 56.81 56.86 56.91
3.34% 52.50 52.55 52.61 52.66 52.71 52.76 52.81 52.85 52.90 52.95 52.99 53.04 53.08
3.54% 49.04 49.09 49.14 49.19 49.24 49.29 49.33 49.38 49.42 49.47 49.51 49.56 49.60
3.74% 45.88 45.93 45.97 46.02 46.07 46.11 46.16 46.20 46.24 46.28 46.33 46.37 46.41
$70.64 2.34% 2.44% 2.54% 2.64% 2.74% 2.84% 2.94% 3.04% 3.14% 3.24% 3.34% 3.44% 3.54%
4.71% 95.41 94.55 93.70 92.86 92.04 91.23 90.43 89.64 88.86 88.09 87.33 86.58 85.84
4.81% 91.23 90.43 89.64 88.86 88.09 87.33 86.58 85.84 85.11 84.39 83.68 82.98 82.29
4.91% 87.33 86.58 85.84 85.11 84.39 83.68 82.98 82.29 81.61 80.93 80.26 79.60 78.95
5.01% 83.69 82.98 82.29 81.61 80.93 80.27 79.61 78.96 78.32 77.68 77.05 76.43 75.82
5.11% 80.27 79.61 78.96 78.32 77.68 77.06 76.44 75.83 75.22 74.62 74.03 73.45 72.87
5.21% 77.06 76.44 75.83 75.23 74.63 74.04 73.45 72.88 72.31 71.75 71.19 70.64 70.09
5.31% 74.04 73.46 72.88 72.31 71.75 71.19 70.64 70.10 69.56 69.03 68.50 67.98 67.47
5.41% 71.20 70.65 70.10 69.56 69.03 68.50 67.98 67.47 66.96 66.46 65.96 65.47 64.98
5.51% 68.51 67.99 67.47 66.96 66.46 65.96 65.47 64.98 64.50 64.02 63.55 63.08 62.62
5.61% 65.97 65.47 64.99 64.50 64.03 63.55 63.09 62.63 62.17 61.71 61.27 60.82 60.38
5.71% 63.56 63.09 62.63 62.17 61.72 61.27 60.83 60.39 59.95 59.52 59.10 58.68 58.26
5.81% 61.28 60.83 60.39 59.96 59.53 59.10 58.68 58.26 57.85 57.44 57.03 56.63 56.23
5.91% 59.11 58.68 58.27 57.85 57.44 57.04 56.64 56.24 55.84 55.45 55.07 54.69 54.31
$70.64 66.00% 66.50% 67.00% 67.50% 68.00% 68.50% 69.00% 69.50% 70.00% 70.50% 71.00% 71.50% 72.00%
15.00% 110.40 107.09 103.77 100.46 97.15 93.83 90.52 87.21 83.89 80.58 77.27 73.95 70.64
15.50% 107.09 103.77 100.46 97.15 93.83 90.52 87.21 83.89 80.58 77.27 73.95 70.64 67.33
16.00% 103.77 100.46 97.15 93.83 90.52 87.21 83.89 80.58 77.27 73.95 70.64 67.33 64.02
16.50% 100.46 97.15 93.83 90.52 87.21 83.89 80.58 77.27 73.95 70.64 67.33 64.02 60.70
17.00% 97.15 93.83 90.52 87.21 83.89 80.58 77.27 73.95 70.64 67.33 64.02 60.70 57.39
17.50% 93.83 90.52 87.21 83.89 80.58 77.27 73.95 70.64 67.33 64.02 60.70 57.39 54.08
18.00% 90.52 87.21 83.89 80.58 77.27 73.95 70.64 67.33 64.02 60.70 57.39 54.08 50.76
18.50% 87.21 83.89 80.58 77.27 73.95 70.64 67.33 64.02 60.70 57.39 54.08 50.76 47.45
19.00% 83.89 80.58 77.27 73.95 70.64 67.33 64.02 60.70 57.39 54.08 50.76 47.45 44.14
19.50% 80.58 77.27 73.95 70.64 67.33 64.02 60.70 57.39 54.08 50.76 47.45 44.14 40.82
20.00% 77.27 73.95 70.64 67.33 64.02 60.70 57.39 54.08 50.76 47.45 44.14 40.82 37.51
20.50% 73.95 70.64 67.33 64.02 60.70 57.39 54.08 50.76 47.45 44.14 40.82 37.51 34.20
21.00% 70.64 67.33 64.02 60.70 57.39 54.08 50.76 47.45 44.14 40.82 37.51 34.20 30.88
70.64 1.40% 1.50% 1.60% 1.70% 1.80% 1.90% 2.00% 2.10% 2.20% 2.30% 2.40% 2.50% 2.60%
2.04% 59.56 61.44 63.42 65.53 67.77 70.16 72.72 75.46 78.39 81.56 84.97 88.67 92.68
2.14% 59.28 61.14 63.12 65.21 67.45 69.83 72.37 75.10 78.02 81.17 84.57 88.25 92.25
2.24% 58.99 60.84 62.81 64.90 67.12 69.49 72.03 74.74 77.65 80.79 84.17 87.84 91.82
2.34% 58.70 60.54 62.50 64.58 66.80 69.16 71.68 74.38 77.28 80.40 83.77 87.42 91.38
2.44% 58.41 60.24 62.20 64.27 66.47 68.82 71.33 74.02 76.91 80.02 83.37 87.01 90.95
2.54% 58.12 59.95 61.89 63.95 66.15 68.49 70.99 73.67 76.54 79.64 82.98 86.59 90.52
2.64% 57.83 59.65 61.58 63.64 65.82 68.15 70.64 73.31 76.17 79.25 82.58 86.18 90.09
2.74% 57.54 59.35 61.28 63.32 65.50 67.82 70.30 72.95 75.80 78.87 82.18 85.76 89.66
2.84% 57.25 59.05 60.97 63.01 65.17 67.48 69.95 72.59 75.43 78.48 81.78 85.35 89.22
2.94% 56.96 58.76 60.66 62.69 64.85 67.15 69.60 72.23 75.06 78.10 81.38 84.93 88.79
3.04% 56.67 58.46 60.36 62.37 64.52 66.81 69.26 71.88 74.69 77.71 80.98 84.52 88.36
3.14% 56.38 58.16 60.05 62.06 64.20 66.47 68.91 71.52 74.32 77.33 80.58 84.10 87.93
3.24% 56.09 57.86 59.74 61.74 63.87 66.14 68.56 71.16 73.95 76.95 80.18 83.69 87.50
Beta
SGA/Sales
CapEx
COGS/Sales
CV Growth of NOPLAT
CV ROIC
After Tax Cost of Debt
Risk Free Rate
Cost of Equity
CV Growth of NOPLAT
Related Documents