Consumer Response to Point of Purchase Advertising for Local Brands Alba J. Collart, Marco A. Palma, and Carlos E. Carpio This study evaluates the effectiveness of a point of purchase advertising program conducted for two local horticultural brands in Texas. The results based on surveys gathered before and after the program was launched suggest that the campaign size was not sufficient to signif- icantly increase brand awareness and overall demand, yet it increased willingness to pay by 5.5% for those consumers aware of one of the brands. A major factor found to increase willingness to pay and likelihood of brand awareness was purchase frequency measured in transactions per month, which suggests that other advertising methods aimed to increase buying frequency might affect demand more effectively. Key Words: brand awareness, ornamental branding, point of purchase advertising, willingness to pay JEL Classifications: D12, M31, Q13 Agricultural brands target consumers’ desire for variety and stimulate financial growth of agri- business companies through higher margins. Although the development of a brand name can be an expensive endeavor, it has gained in- creasing recognition as a marketing instrument to differentiate generic products in the horti- cultural industry (Nijssen and Van Trijp, 1998). Moreover, given the importance of promotion in differentiating a brand from its competitors, various studies in marketing research have fo- cused on investigating how promotion affects consumer preferences toward branding. In the United States, state-sponsored check- off programs for single agricultural commodities (e.g., Florida citrus, Washington apples) have been around since at least the 1930s. More re- cently, broad-based advertising programs that collectively promote a group of agricultural products under a state brand (e.g., Arizona- grown, Jersey Fresh, Go Texan) have become widespread (Patterson, 2006). It is therefore not surprising that a plethora of studies has focused on evaluating the impact of generic advertising for food commodities (Alston, Freebairn, and James, 2001; Moore et al., 2009; Williams, Capps, and Palma, 2008; Williams, Capps, and Trang, 2010) as well as the effectiveness of broad- based advertising of food products marketed under state brands (Carpio and Isengildina- Massa, 2010; Govindasamy, Italia, and Thatch, 1998; Patterson et al., 1999). Recent consumer interest for local products opened the door for the development of state- sponsored branding efforts for nonfood prod- ucts. Brands of ornamental plants that have adapted to the movement of regional branding Alba J. Collart is a doctoral candidate, and Marco A. Palma is an associate professor and extension econ- omist, Department of Agricultural Economics, Texas A&M University, College Station, Texas. Carlos E. Carpio is an associate professor, School of Agricultural, Forest, and Environmental Sciences, Clemson Univer- sity, Clemson, South Carolina. We gratefully acknowledge financial support for this research from the Texas Department of Agricul- ture. We also acknowledge the helpful comments of anonymous referee reviewers. Journal of Agricultural and Applied Economics, 45,2(May 2013):229–242 Ó 2013 Southern Agricultural Economics Association

Welcome message from author
This document is posted to help you gain knowledge. Please leave a comment to let me know what you think about it! Share it to your friends and learn new things together.
Transcript
Consumer Response to Point of Purchase
Advertising for Local Brands
Alba J. Collart, Marco A. Palma, and Carlos E. Carpio
This study evaluates the effectiveness of a point of purchase advertising program conductedfor two local horticultural brands in Texas. The results based on surveys gathered before andafter the program was launched suggest that the campaign size was not sufficient to signif-icantly increase brand awareness and overall demand, yet it increased willingness to pay by5.5% for those consumers aware of one of the brands. A major factor found to increasewillingness to pay and likelihood of brand awareness was purchase frequency measured intransactions per month, which suggests that other advertising methods aimed to increasebuying frequency might affect demand more effectively.
Key Words: brand awareness, ornamental branding, point of purchase advertising,willingness to pay
JEL Classifications: D12, M31, Q13
Agricultural brands target consumers’ desire for
variety and stimulate financial growth of agri-
business companies through higher margins.
Although the development of a brand name can
be an expensive endeavor, it has gained in-
creasing recognition as a marketing instrument
to differentiate generic products in the horti-
cultural industry (Nijssen and Van Trijp, 1998).
Moreover, given the importance of promotion in
differentiating a brand from its competitors,
various studies in marketing research have fo-
cused on investigating how promotion affects
consumer preferences toward branding.
In the United States, state-sponsored check-
off programs for single agricultural commodities
(e.g., Florida citrus, Washington apples) have
been around since at least the 1930s. More re-
cently, broad-based advertising programs that
collectively promote a group of agricultural
products under a state brand (e.g., Arizona-
grown, Jersey Fresh, Go Texan) have become
widespread (Patterson, 2006). It is therefore not
surprising that a plethora of studies has focused
on evaluating the impact of generic advertising
for food commodities (Alston, Freebairn, and
James, 2001; Moore et al., 2009; Williams,
Capps, and Palma, 2008; Williams, Capps, and
Trang, 2010) as well as the effectiveness of broad-
based advertising of food products marketed
under state brands (Carpio and Isengildina-
Massa, 2010; Govindasamy, Italia, and Thatch,
1998; Patterson et al., 1999).
Recent consumer interest for local products
opened the door for the development of state-
sponsored branding efforts for nonfood prod-
ucts. Brands of ornamental plants that have
adapted to the movement of regional branding
Alba J. Collart is a doctoral candidate, and Marco A.Palma is an associate professor and extension econ-omist, Department of Agricultural Economics, TexasA&M University, College Station, Texas. Carlos E.Carpio is an associate professor, School of Agricultural,Forest, and Environmental Sciences, Clemson Univer-sity, Clemson, South Carolina.
We gratefully acknowledge financial support forthis research from the Texas Department of Agricul-ture. We also acknowledge the helpful comments ofanonymous referee reviewers.
Journal of Agricultural and Applied Economics, 45,2(May 2013):229–242
� 2013 Southern Agricultural Economics Association
include Florida Garden Select, Louisiana Se-
lect, Oklahoma Proven, Colorado Plant Select,
Texas Superstar�, Earth-Kind�, among others.
These statewide ornamental branding efforts
seek to promote plants that best adapt to local
weather and soil conditions while enhancing
the profitability of green industry growers.
Previous estimates suggest that the impact of
these programs cannot be overlooked. Re-
tailers of the Oklahoma Proven brand reported
increases in sales of 228% as a consequence of
this program (Anella, Schnelle, and Maronek,
2001). Mackay et al. (2001) also noticed that
consumers returned to the stores based on pre-
vious purchases of Texas Superstar� and esti-
mated that approximately $10 million in new
plant sales were generated as a result of this
program. In addition, these brands encourage
a positive environmental impact from the use
of suitable plants that require lower levels of
water and pesticides.
Although numerous studies have been con-
ducted to evaluate promotion effectiveness for
food commodities, many questions remain re-
garding promotion effectiveness for brands in
the ornamental sector. Given that states and in-
dustry organizations continuously invest in pro-
motion of branded ornamentals, understanding
the impact of advertising is beneficial to pro-
ducers linked to the industry and to the state
promoting the brand. Furthermore, firms often
operate on limited marketing budgets and
must choose between advertising channels to
promote their brands. An examination of con-
sumer response to Point-of-Purchase in-store
advertising (POPA) can help brand managers
adjust marketing channels and rationalize fur-
ther investments.
This study considers an in-store POPA
campaign of two statewide ornamental brands:
Texas Superstar� (TS) and Earth-Kind� (EK).
These brands were developed by scientists and
extension specialists from the Texas A&M Uni-
versity System in conjunction with other state
and private industry stakeholders of the Texas
ornamental industry. Both brands consist of
plant material that has been selected according
to their adaptability to heat, drought, disease,
insect tolerance, and other weather and soil local
conditions. However, each brand offers different
products to some extent. The TS brand includes
plant material that ranges from roses to trees,
whereas the EK brand includes roses and an
environmental stewardship program (i.e., the EK
challenge, plant selector, EK principles) that
encourages the use of efficient, traditional, and
organic gardening techniques.
In 2010, the Texas Department of Agricul-
ture (TDA) launched an advertising campaign,
which consisted of developing on-site pro-
motional materials to include with TS and EK
products at point-of-purchase locations in an
effort to expand consumers’ demand for the
local brands. The promotional materials con-
sisted of plant tags with information about the
brands. The tags were distributed to growers,
retailers, and wholesalers in Texas that carry
the brands. Because the POPA did not include
other forms of mass media advertising, it is
of special interest to measure the effectiveness,
if any, of this type of in-store advertising on
consumer demand. The objectives of this study
are to evaluate the effects of POPA on con-
sumer preferences in terms of brand awareness
and willingness to pay (WTP) and to identify
behavioral and demographic determinants of
consumer preferences for branded ornamental
plants. By evaluating the effects of POPA on
consumer preferences for ornamental brands,
we contribute to the existing promotion litera-
ture in two ways. First, our focus on orna-
mentals helps to better understand consumer
response to promotion efforts, because we may
expect demand for ornamental products to be-
have differently than demand for agricultural
food products. Moreover, the limited amount of
research to date on promotion effectiveness of
ornamentals has focused on aggressive media
campaigns with no attention to smaller adver-
tising programs that still require a sizable
monetary investment.
Literature Review
A promotion program can shift demand, change
price elasticity, or both. The type of demand
response to promotion depends on the com-
ponents of the program including the mes-
sage being spread (e.g., basic publicity vs.
real information), the type of products being
Journal of Agricultural and Applied Economics, May 2013230

advertised (e.g., necessities vs. luxuries), and
the size of the campaign and choice of ad-
vertising channels, among other factors. Johnson
and Myatt (2006) showed that a message that
merely publicizes a product’s existence, price,
and other features that are clearly valued by
all consumers might increase demand, whereas
a message that informs consumers of their
personal match with the characteristics of a
product might change price elasticity of de-
mand. Also, a message containing both basic
publicity and real information may involve a
shift in demand and changes in price elasticity.
With regard to the type of product, Rickard
et al. (2011) evaluated commodity-specific
advertising, which intends to promote a cate-
gory of products (i.e., all types of apples), and
broad-based advertising, which refers to the
promotion of a group of products that may be
substitutes or complements of each other (i.e.,
all fruits and vegetables). By applying the theo-
retical framework developed by Johnson and
Myatt (2006), they showed that commodity-
specific advertising will lead to an upward shift
and more inelastic demand, whereas broad-
based advertising will lead to an upward shift
and more elastic demand.
According to Moore et al. (2009), quanti-
fying the magnitude of such demand responses
is more complex than to measure a potential
increase in sales. Because factors other than
promotion affect sales of a product, statistical
methods need to account for all these factors to
isolate the effects of promotion on demand. For
instance, Rickard et al. (2011) estimated con-
stant and random parameter Tobit models to
evaluate WTP increases as a result of promotion
activities.
Contrary to food, ornamental plants are se-
lected on different quality differentiating attri-
butes such as drought tolerance, light demand,
pest vulnerability, color, etc. They are consumed
because of the satisfaction consumers derive
from their aesthetic characteristics and not to
satisfy nutritional needs (Palma and Ward,
2010). Therefore, consumer responses to orna-
mental promotions may differ compared with
traditional food products. Although many stud-
ies have analyzed the effectiveness of promo-
tion on demand for food products, fewer studies
have focused on floriculture and nursery crops.
Most of the ornamental promotion literature has
focused on the importance of a firm’s choice of
advertising channels and campaign size. Rimal
(1998) analyzed the effects of generic and brand
promotions on sales of fresh cut flowers in the
United States and found that generic pro-
motion efforts generated equal gains among
all participating retail outlets, whereas brand
promotion contributed to an increasing market
share in particular outlets. Ort, Wilder, and
Graham (1998) reported on the effectiveness of
an extensive promotional campaign consisting
of print and media advertising conducted by
independent garden centers in North Carolina.
They found that newspaper advertising for
a specific plant produced the highest recall rates
among consumers. More recently, Palma et al.
(2012) quantified the effectiveness of firm pro-
motion expenditures on sales of green industry
firms accounting for firm size and types of
advertising. Using cost–benefit analysis, they
concluded that for small and medium firms,
Internet-based advertising generates the highest
returns of $5.90 and $7.50 in sales per $1 spent
in advertising, respectively, whereas for large
firms, mass media represents the most important
advertising channel.
Thus far, no research has examined the
impact of low-budget in-store advertising on
consumer preferences for branded ornamentals.
Understanding the reach of in-store promotions
and the main behavioral and demographic
factors determining consumer preferences for
branded products can help ornamental firms
evaluate their marketing mix, optimize their
choice of advertising channels given their bud-
get constraints, and target a more specific pop-
ulation of interest.
Data and Sample Weighting
Data regarding consumer perceptions of brand-
ing efforts and WTP were obtained through two
electronic mail surveys administered to Texas
consumers. The first survey was conducted in
July of 2008, before the POPA program. From
this sample of 800 individuals, approximately
34% were actual consumers of ornamental
products; hence, the final number of usable
Collart, Palma, and Carpio: Consumer Response to Point of Purchase Advertising 231
responses was 273 observations. The second
survey was conducted in August 2010 after the
program was finished and it consisted of a to-
tal of 259 observations. A random sample of
259 observations was taken from the first sur-
vey to balance the preprogram and postpro-
gram observations. Moreover, to ensure that
the two samples were equivalent in terms of
demographic characteristics, each demographic
stratum in the second survey (i.e., gender, age,
income, etc.) was weighted with respect to the
corresponding stratum in the first survey as
follows:
(1) wk 5%(Sub)Populationk
%Samplek
where the numerator indicates the percentage
of stratum k in the population or subpopulation
of interest and the denominator indicates the
percentage of stratum k in the sample. Post-
stratification weighting improves comparabil-
ity of the samples by ensuring that any changes
measured in the statistical models are the re-
sults of the variables measured and not dif-
ferences in the demographics of the two
samples. The pre-POPA program sample and
the weighted post-POPA program sample were
pooled and used to estimate the models of
brand awareness and WTP.1 In all models, a
dummy variable (POPA) is used to differentiate
the preadvertising and postadvertising data (5 1
if postadvertising, zero otherwise). This variable
serves to assess the change in the population
mean WTP and brand awareness as a result
of the advertising campaign. Table 1 provides a
comparison of the survey demographics and the
general Texas population.
Methods
The conceptual framework for this study is
the Random Utility Theory. In this context,
the consumer is rational and has a perfect dis-
crimination capability. However, the analyst
has incomplete information and uncertainty is
taken into account. More specifically, the util-
ity that individual i associates with choice j is
described as:
(2) Uij 5 Vij 1 eij
where Vij is the deterministic component of
utility and eij is an independent and identically
distributed (iid) random error unobserved to the
researcher that reflects characteristics of the
consumer or the products. For the individual eis known, but for the analyst e is an unobserved
random variable with some density f e, which
induces a density on U (Hanemann, 1984).
Using this framework, the utility obtained
from consuming ornamental plants can be
written as:
(3) Uik 5 Vik(xk,si,yi,POPA) 1 eik
where xk is a vector of ornamental products, si
refers to consumer sociodemographic charac-
teristics, yi is income, and eik is a random vector
of consumer characteristics or ornamental plant
features that are unobservable to the econo-
metrician. Moreover, POPA is a level of adver-
tising that is given by the firm to the consumer
and affects consumer preferences (Becker and
Murphy, 1993).
Brand Awareness Models
Thilmany et al. (2011) point out that assessing
the effectiveness of promotional activities should
note the effects of any shift on demand but also
offer insights into the promotion methods that
raise awareness and create demand. In mod-
eling brand awareness, the individual is mod-
eled as being aware or not of a certain brand
instead of choosing one. Specifically, we
model awareness of each brand as a function
of the number of monthly transactions (TRAN),
purpose of the purchase (PUR), post promo-
tion on place dummy (POPA), and several
sociodemographic characteristics, including
1 Similar random sampling and weighting proce-dures were used to obtain the samples used to estimatethe models intended to explain the effect of the pro-motion program on WTP for TS and EK. Because thefirst survey contained a lower number of observationson WTP for both brands, the final samples had a totalof 290 observations used to model WTP for EK and268 observations used to model WTP for TS. Acrossall samples, the data were comparable to the overallTexas population. See Grooves et al. (2009) and Levyand Lemeshow (2008) for a theoretical treatment ofsurvey weights.
Journal of Agricultural and Applied Economics, May 2013232

age, gender, marital status, income, education,
and region (Table 2). Because the dependent
variable is a binary variable indicating aware-
ness of the brand, a Logit model was consid-
ered,2 and the implications for the likelihood
of awareness are interpreted in terms of odds
ratios. The model specification for estimating
the probability of brand awareness of the j brand
(TS or EK) is given by:
(4)
AWAREj 5 aj 1 b1AGE2 1 b2AGE3
1 b3FEMALE 1 b4MARRIED
1 b5EDU2 1 b6EDU3 1 b7REG2
1 b8REG3 1 b9TRAN 1 b10PUR
1 dINC2 1 g1jPOPAj 1 ej
where ej is assumed to follow a standard logistic
distribution. The first hypothesis investigated by
the brand awareness models is whether POPA
advertising will increase the likelihood of brand
awareness (i.e., g1j > 0).
Willingness-to-Pay Models
A rational individual is assumed to consume
product j if the utility from this product is at
least as great as the utility without the product.
Following Rickard et al. (2011), the marginal
value consumer i places on product j 5 1, de-
noted as cij, is defined as the amount of income
that leaves the consumer’s utility at least as great
with or without the consumption of j, that is:
(5)Vij51(x1,z,si,yi � ci1,POPA)
1 ei1 ³ Vij50(x0,z,si,yi) 1 ei0
By the random utility assumption, the con-
sumer’s WTP for j can be solved from the
probability of individual i choosing j:
(6)Pr (xi1) 5 Pr½Vi1(.) 1 ei1 ³ Vi0(.) 1 ei0�
5 Pr (WTPi1 ³ ci1)
which implies that the consumer WTP has to be
at least as great as the marginal value for the
product; otherwise, the product is not consumed.
Different assumptions about the distribution
of the stochastic portion of utility produce
different choice models (McFadden, 1974). If
e is assumed to follow a double exponential
distribution (0,s 5 p2m2=3), where m is the logit
Table 1. Comparison of Demographic Variables from Samples Used and Texas Population
Brand Awareness
(n 5 518)
EK Willingness-
to-Pay (n 5 290)
TS Willingness-
to-Pay (n 5 268) Censusa
Demographic Variables Percentage Percentage Percentage Percentage
Marital status Married 62.0 62.8 61.2 51.5
Not married 38.0 37.2 38.8 48.5
Gender Male 48.1 45.1 46.6 49.6
Female 51.9 54.9 53.4 50.4
Education High school 11.7 13.2 9.8 46.0
College 65.4 65.3 66.9 45.5
Graduate school 23.0 21.5 23.3 8.5
Age (years) Less than 39 35.2 31.3 31.3 59.0
40–55 31.6 34.0 32.8 20.4
Older than 55 33.2 34.7 35.8 20.6
Income Under $25,000 15.8 18.6 16.4 24.8
$25,000–50,000 30.1 29.0 28.4 25.4
$50,001–75,000 20.8 14.5 17.9 18.2
$75,001–99,999 13.5 14.5 14.9 11.8
$100,000 and above 19.7 20.0 22.4 19.8
a Source: U.S. Census Bureau 2010, American Community Survey 2006–2010.
Note: n indicates sample size.
EK, Earth-Kind� ; TS, Texas Superstar� .
2 A two-stage model was also estimated for brandawareness and WTP to account for the potentialendogeneity of brand awareness. The results suggestedthat brand awareness was not an endogenous factorand hence the models were estimated independently.These results are available from the authors on request.
Collart, Palma, and Carpio: Consumer Response to Point of Purchase Advertising 233

scale parameter, and utility of the nonpurchased
option is normalized to 1, the probability of
consuming j becomes:
(7) Pr (WTPi1 ³ ci1) 5 Pr (xi1) 5exp (Vi1=m)
1 1 exp (Vi1=m)
and after applying a logarithmic transformation
on both sides of the odds ratio, we obtain:
(8) lnPr (xi1)
1� Pr (xi1)
� �WTPi1 5 Vi1=m
Finally, assuming utility is additive over its
components, and normalizing m 5 1 without
loss of generality, the estimable equation can
be written as:
(9)Vij(yi,si,POPA,eij) 5
Xl
blsil 1 dyi
1 gPOPA 1 eij
where bl are the coefficients associated with
l sociodemographic characteristics, d is the
coefficient associated with income, g is the
advertising coefficient and eij is the iid error
term. Based on Carpio and Isengildina-Massa
(2010), if WTP elicitation is conducted be-
fore and after an advertisement campaign, the
change in WTP ðDWTPÞmeasured by the ad-
vertising shock g can be interpreted as the direct
effect or shift in the demand curve as a result of
the advertising campaign.
In all WTP models, the dependent variable
is the average percentage price premium the
consumer is willing to pay for the branded
product over a regular unbranded plant and it
ranges from 0% to 41%. Percentage premiums
are used when trying to measure the premium
across aggregate categories of products (Carpio
and Isengildina-Massa, 2010). Because the mean
WTP variable theoretically has a lower thresh-
old of zero, a Tobit specification was used in all
WTP models to account for left-censoring. In
the first two models, explanatory variables in-
clude the number of transactions (TRAN), the
purpose of the purchase (PUR), post promo-
tion on place dummy (POPA), awareness of the
Table 2. Description of Variables Used in the Econometric Analyses
Variable Description
TSAWARE Awareness of Texas Superstar� (5 1 if true and 0 otherwise)
EKAWARE Awareness of Earth-Kind� (5 1 if true and 0 otherwise)
TSWTP Mean WTP for Texas Superstar�
EKWTP Mean WTP for Earth-Kind�
Sociodemographic characteristics
AGE2 Age between 40 and 55 years old (5 1 if true and 0 otherwise)
AGE3 More than 55 years old (5 1 if true and 0 otherwise)
FEMALE Gender is female (5 1 if true and 0 otherwise)
MARRIED Marital status is married (5 1 if true and 0 otherwise)
INC2 Income level (51 if income equal or above $50,000 and 0 otherwise)
EDU2 Education level (5 1 if college degree, and 0 otherwise)
EDU3 Education level (5 1 if graduate school, and 0 otherwise)
Consumer habits
TRAN Number of monthly transactions
PUR Purpose of the purchase (5 1 if self-consumption and 0 otherwise)
POPA Point of Purchase Advertising (5 1 if postadvertising and 0 otherwise)
Region
REG2 Region: Central Texas (5 1 if true and 0 otherwise)
REG3 Region: South Texas (5 1 if true and 0 otherwise)
Dummy variables base levels
AGE1 Age group of 39 years old or younger
INC1 Income group under $50,000
EDU1 Education level is high school or less
REG1 Region is North
Journal of Agricultural and Applied Economics, May 2013234
brand (TS-AWARE or EK-AWARE), and sev-
eral demographic characteristics, including age,
gender, marital status, income, education, and
region (Table 2). The mean WTP for brand j (TS
or EK) can be written as:
(10)
WTP�j 5 aj 1 b1AGE2 1 b2AGE3
1 b3FEMALE 1 b4MARRIED
1 b5EDU2 1 b6EDU3 1 b7REG2
1 b8REG 1 b9AWARE 1 b10TRAN
1 b11PUR 1 dINC2 1 g2jPOPAj 1 ej
WTPj 5 max 0,WTP�j
n o
where ej ; N(0,s2) and WTP� is a latent vari-
able that is observed for values greater than
zero and censored otherwise. The second hy-
pothesis investigated by the WTP models is
whether POPA advertising will lead to a shift in
overall demand for these products (i.e., g2j > 0).
The last two models were estimated for a
subset of the sample that consisted of consumers
aware of each brand. These models were esti-
mated to isolate the effect of the POPA cam-
paign for a specific group of consumers that
has been found to be relevant in other evalua-
tions of promotion effectiveness. For instance,
Carpio and Isengildina-Massa (2010) found that
only individuals previously aware of the South
Carolina-grown promotion campaign expressed
a change in preferences as a response to the
campaign.
The conditional mean WTP for brand j (TS
or EK) can be written as:
(11)
(WTP�j AWARE 5 1)j 5 aj 1 b1AGE2
1 b2AGE3 1 b3FEMALE
1 b4MARRIED 1 b5EDU2
1 b6EDU3 1 b7REG2
1 b8REG 1 b9TRAN
1 b10PUR 1 dINC2
1 g3jPOPAj 1 ej
(WTPj AWARE 5 1j ) 5 max 0,WTP�j AWARE 5 1jn o
where ej ; N(0,s2). The third hypothesis in-
vestigated by the conditional WTP models is
whether POPA advertising will lead to a shift in
demand by individuals aware of the brands
(i.e., g3j > 0).
Results and Discussion
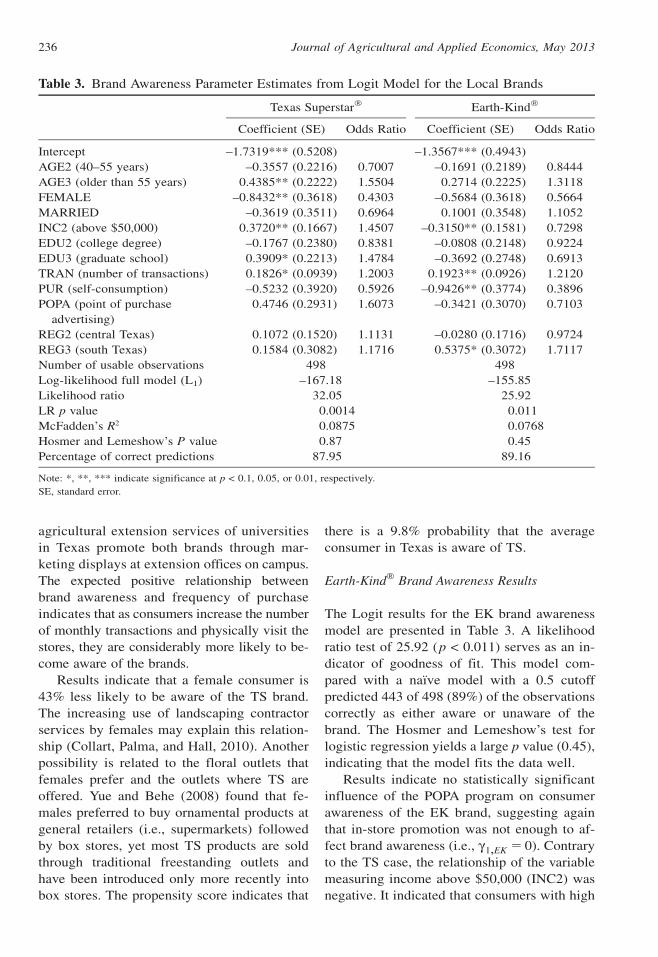
Texas Superstar� Brand Awareness Results
The Logit results for the TS brand awareness
model are presented in Table 3. A likelihood
ratio test of 32.05 (p < 0.0014) is an indication
of the goodness of fit of this model. Moreover,
approximately 438 of 498 (88%) of survey
participants were correctly classified as either
aware or unaware of the brand. The Hosmer
and Lemeshow’s test of goodness of fit for lo-
gistic regression yields a very large p value
(0.87), indicating that the predicted frequency
and observed frequency matched closely.
Results show no statistically significant
influence of the POPA program on raising
awareness of TS (i.e. g1,TS 5 0), indicating
that in-store POPA was not sufficient to im-
pact consumer awareness. The results imply
that consumers with high income, those with a
graduate school degree, and those older than
55 years are approximately 1.5 times more
likely to be aware of the TS brand, whereas an
additional transaction makes a consumer ap-
proximately 1.2 times more likely to be aware
of the TS brand.
These findings are consistent with the soci-
odemographic profile of ornamental consumers
that Yue and Behe (2008) identified. They
found that wealthier consumers were more
likely to choose traditional freestanding floral
outlets (i.e., nurseries and garden centers), where
mean prices and expenditures per transaction
are higher compared with other floral outlets
such as box stores or general retailers. The main
retail outlets for TS products are traditional
freestanding floral outlets and to a lesser ex-
tent box stores or mass merchandisers (i.e.,
Home Depot, Lowe’s). Hence, it is possible
that wealthier consumers might be more likely
to be aware of TS because they are more likely
to visit the floral outlets where the majority
of TS products are sold. Furthermore, high-
income consumers may also be less sensitive to
price premiums of branded ornamentals. With
regard to education, consumers with graduate
degrees might be more likely to be exposed to
sources of information other than seeing the
products at the marketplace. For example,
Collart, Palma, and Carpio: Consumer Response to Point of Purchase Advertising 235
agricultural extension services of universities
in Texas promote both brands through mar-
keting displays at extension offices on campus.
The expected positive relationship between
brand awareness and frequency of purchase
indicates that as consumers increase the number
of monthly transactions and physically visit the
stores, they are considerably more likely to be-
come aware of the brands.
Results indicate that a female consumer is
43% less likely to be aware of the TS brand.
The increasing use of landscaping contractor
services by females may explain this relation-
ship (Collart, Palma, and Hall, 2010). Another
possibility is related to the floral outlets that
females prefer and the outlets where TS are
offered. Yue and Behe (2008) found that fe-
males preferred to buy ornamental products at
general retailers (i.e., supermarkets) followed
by box stores, yet most TS products are sold
through traditional freestanding outlets and
have been introduced only more recently into
box stores. The propensity score indicates that
there is a 9.8% probability that the average
consumer in Texas is aware of TS.
Earth-Kind� Brand Awareness Results
The Logit results for the EK brand awareness
model are presented in Table 3. A likelihood
ratio test of 25.92 (p < 0.011) serves as an in-
dicator of goodness of fit. This model com-
pared with a naı̈ve model with a 0.5 cutoff
predicted 443 of 498 (89%) of the observations
correctly as either aware or unaware of the
brand. The Hosmer and Lemeshow’s test for
logistic regression yields a large p value (0.45),
indicating that the model fits the data well.
Results indicate no statistically significant
influence of the POPA program on consumer
awareness of the EK brand, suggesting again
that in-store promotion was not enough to af-
fect brand awareness (i.e., g1,EK 5 0). Contrary
to the TS case, the relationship of the variable
measuring income above $50,000 (INC2) was
negative. It indicated that consumers with high
Table 3. Brand Awareness Parameter Estimates from Logit Model for the Local Brands
Texas Superstar� Earth-Kind�
Coefficient (SE) Odds Ratio Coefficient (SE) Odds Ratio
Intercept –1.7319*** (0.5208) –1.3567*** (0.4943)
AGE2 (40–55 years) –0.3557 (0.2216) 0.7007 –0.1691 (0.2189) 0.8444
AGE3 (older than 55 years) 0.4385** (0.2222) 1.5504 0.2714 (0.2225) 1.3118
FEMALE –0.8432** (0.3618) 0.4303 –0.5684 (0.3618) 0.5664
MARRIED –0.3619 (0.3511) 0.6964 0.1001 (0.3548) 1.1052
INC2 (above $50,000) 0.3720** (0.1667) 1.4507 –0.3150** (0.1581) 0.7298
EDU2 (college degree) –0.1767 (0.2380) 0.8381 –0.0808 (0.2148) 0.9224
EDU3 (graduate school) 0.3909* (0.2213) 1.4784 –0.3692 (0.2748) 0.6913
TRAN (number of transactions) 0.1826* (0.0939) 1.2003 0.1923** (0.0926) 1.2120
PUR (self-consumption) –0.5232 (0.3920) 0.5926 –0.9426** (0.3774) 0.3896
POPA (point of purchase
advertising)
0.4746 (0.2931) 1.6073 –0.3421 (0.3070) 0.7103
REG2 (central Texas) 0.1072 (0.1520) 1.1131 –0.0280 (0.1716) 0.9724
REG3 (south Texas) 0.1584 (0.3082) 1.1716 0.5375* (0.3072) 1.7117
Number of usable observations 498 498
Log-likelihood full model (L1) –167.18 –155.85
Likelihood ratio 32.05 25.92
LR p value 0.0014 0.011
McFadden’s R2 0.0875 0.0768
Hosmer and Lemeshow’s P value 0.87 0.45
Percentage of correct predictions 87.95 89.16
Note: *, **, *** indicate significance at p < 0.1, 0.05, or 0.01, respectively.
SE, standard error.
Journal of Agricultural and Applied Economics, May 2013236

income are 73% less likely to be aware of EK.
The negative relationship between awareness
of EK and income appears consistent with
consumers’ choices of floral outlets. The main
outlets for EK roses are box stores such as
Wal-Mart and general retailers including super-
markets such as HEB. As income level de-
creases, consumers are more likely to choose
box stores and general retailers as floral out-
lets because of lower prices. Thus, lower-
income consumers might be more likely to be
aware of EK because they are more likely to
use the floral outlets where EK products are
available. Also, high-income level citizens are
increasingly contracting professional lawn care
services (Hall, Hodges, and Haydu, 2006), pos-
sibly because they can afford to make more use
of landscaping contractor services. In turn,
these consumers may be less involved in the
design of their landscape and therefore less
likely to be familiar with the EK challenge, plant
selector, the EK principles to design a sustain-
able landscape, or to actively participate in the
educational component of EK.
The purpose of the purchase for self-
consumption (PUR) also had a negative effect
on awareness. Consumers whose purpose of
purchase is self-consumption are approximately
39% less likely to be aware of EK products. This
result suggests that ornamental consumers may
be inclined to search for generic products that
associate with lower prices when purchasing
roses for self-consumption purposes and care
more about differentiated products when pur-
chasing roses for gifts. The number of trans-
actions per month (TRAN) and the South Texas
region (REG3) appeared to positively affect
awareness of EK, implying that influencing the
frequency of purchase significantly impacts
brand awareness. Estimates suggest that a con-
sumer located in South Texas is 1.7 times more
likely to be aware of EK and that an additional
transaction makes the consumer approximately
1.2 times more likely to be aware of EK. The
propensity score indicates that there is an 8.8%
probability that the average consumer in Texas
is aware of the EK program, a value slightly
lower than that for TS.
Overall results of the brand awareness
models for both TS and EK show that in-store
POPA did not have statistically significant ef-
fects on consumer awareness. Instead, the key
outcomes that seem to influence awareness of
local branded ornamentals are income level and
frequency of buying. As the number of visits
to a store increases, the chances of a consumer
being aware of local brands promoted through
POPA also increase.
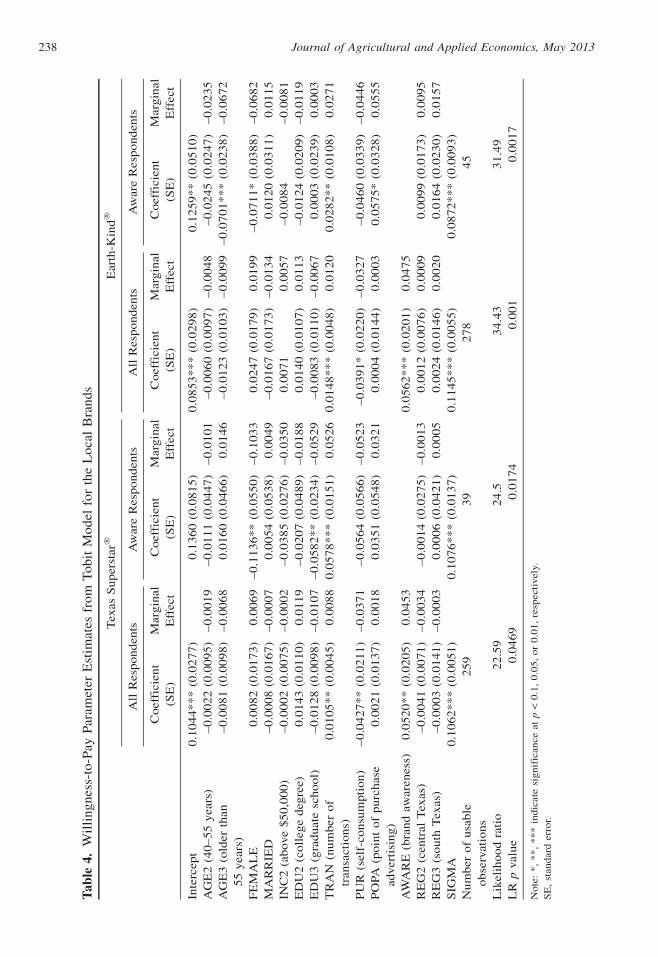
Texas Superstar� Willingness-to-Pay Results
The parameter estimates for the WTP models
for all respondents and respondents aware of
each brand are presented in Table 4. The sigma
parameter that refers to the estimated standard
deviation of the residual shows a censoring of
the data. The mean WTP is measured in per-
centage terms; thus, a positive marginal effect
denotes a price premium for the brand over a
regular plant, whereas a negative marginal ef-
fect denotes a price discount.
Results of the WTP model for TS for all
respondents indicate no statistically significant
influence of POPA or any demographic factors
on WTP, indicating that in-store promotion did
not affect consumer demand for ornamentals
(i.e., g2,TS 5 0). The self-consumption purpose
of the purchase (PUR) had a negative rela-
tionship with WTP. Its marginal effect implies
a price discount of 3.7% if the purpose of the
purchase is self-consumption and a price pre-
mium of 3.7% if the purpose is a gift, which
suggests a predisposition of consumers to save
when purchasing branded ornamentals for self-
use purposes. In contrast, the number of trans-
actions per month (TRAN) and brand awareness
(TS-AWARE) had a positive relationship. No-
tably, the variable with the highest effects on
WTP was brand awareness; consumers aware of
the TS brand are willing to pay a 4.5% price
premium for TS-certified plants compared with
regular unbranded plants. Consumers with an
additional transaction per month are willing to
pay a price premium for branded plants of 1%
over nonbranded plants. Results show that the
average consumer of ornamentals in Texas is
willing to pay a price premium of 10.4% for TS
plants over regular plants.
Furthermore, WTP for TS was also estimated
for a subsample of ornamental consumers aware
Collart, Palma, and Carpio: Consumer Response to Point of Purchase Advertising 237
Tab
le4.
Wil
lingnes
s-to
-Pay
Par
amet
erE
stim
ates
from
Tobit
Model
for
the
Loca
lB
rands
Tex
asS
up
erst
ar�
Ear
th-K
ind
�
All
Res
po
nd
ents
Aw
are
Res
po
nd
ents
All
Res
po
nd
ents
Aw
are
Res
po
nd
ents
Co
effi
cien
t
(SE
)
Mar
gin
al
Eff
ect
Co
effi
cien
t
(SE
)
Mar
gin
al
Eff
ect
Co
effi
cien
t
(SE
)
Mar
gin
al
Eff
ect
Co
effi
cien
t
(SE
)
Mar
gin
al
Eff
ect
Inte
rcep
t0
.10
44
**
*(0
.02
77
)0
.13
60
(0.0
81
5)
0.0
85
3*
**
(0.0
29
8)
0.1
25
9*
*(0
.05
10
)
AG
E2
(40
–5
5y
ears
)–
0.0
02
2(0
.00
95
)–
0.0
01
9–
0.0
11
1(0
.04
47
)–
0.0
10
1–
0.0
06
0(0
.00
97
)–
0.0
04
8–
0.0
24
5(0
.02
47
)–
0.0
23
5
AG
E3
(old
erth
an
55
yea
rs)
–0
.00
81
(0.0
09
8)
–0
.00
68
0.0
16
0(0
.04
66
)0
.01
46
–0
.01
23
(0.0
10
3)
–0
.00
99
–0
.07
01
**
*(0
.02
38
)–
0.0
67
2
FE
MA
LE
0.0
08
2(0
.01
73
)0
.00
69
–0
.11
36
**
(0.0
55
0)
–0
.10
33
0.0
24
7(0
.01
79
)0
.01
99
–0
.07
11
*(0
.03
88
)–
0.0
68
2
MA
RR
IED
–0
.00
08
(0.0
16
7)
–0
.00
07
0.0
05
4(0
.05
38
)0
.00
49
–0
.01
67
(0.0
17
3)
–0
.01
34
0.0
12
0(0
.03
11
)0
.01
15
INC
2(a
bo
ve
$5
0,0
00
)–
0.0
00
2(0
.00
75
)–
0.0
00
2–
0.0
38
5(0
.02
76
)–
0.0
35
00
.00
71
0.0
05
7–
0.0
08
4–
0.0
08
1
ED
U2
(co
lleg
ed
egre
e)0
.01
43
(0.0
11
0)
0.0
11
9–
0.0
20
7(0
.04
89
)–
0.0
18
80
.01
40
(0.0
10
7)
0.0
11
3–
0.0
12
4(0
.02
09
)–
0.0
11
9
ED
U3
(gra
du
ate
sch
oo
l)–
0.0
12
8(0
.00
98
)–
0.0
10
7–
0.0
58
2*
*(0
.02
34
)–
0.0
52
9–
0.0
08
3(0
.01
10
)–
0.0
06
70
.00
03
(0.0
23
9)
0.0
00
3
TR
AN
(nu
mb
ero
f
tran
sact
ion
s)
0.0
10
5*
*(0
.00
45
)0
.00
88
0.0
57
8*
**
(0.0
15
1)
0.0
52
60
.01
48
**
*(0
.00
48
)0
.01
20
0.0
28
2*
*(0
.01
08
)0
.02
71
PU
R(s
elf-
con
sum
pti
on
)–
0.0
42
7*
*(0
.02
11
)–
0.0
37
1–
0.0
56
4(0
.05
66
)–
0.0
52
3–
0.0
39
1*
(0.0
22
0)
–0
.03
27
–0
.04
60
(0.0
33
9)
–0
.04
46
PO
PA
(po
int
of
pu
rch
ase
adver
tisi
ng
)
0.0
02
1(0
.01
37
)0
.00
18
0.0
35
1(0
.05
48
)0
.03
21
0.0
00
4(0
.01
44
)0
.00
03
0.0
57
5*
(0.0
32
8)
0.0
55
5
AW
AR
E(b
ran
daw
aren
ess)
0.0
52
0*
*(0
.02
05
)0
.04
53
0.0
56
2*
**
(0.0
20
1)
0.0
47
5
RE
G2
(cen
tral
Tex
as)
–0
.00
41
(0.0
07
1)
–0
.00
34
–0
.00
14
(0.0
27
5)
–0
.00
13
0.0
01
2(0
.00
76
)0
.00
09
0.0
09
9(0
.01
73
)0
.00
95
RE
G3
(so
uth
Tex
as)
–0
.00
03
(0.0
14
1)
–0
.00
03
0.0
00
6(0
.04
21
)0
.00
05
0.0
02
4(0
.01
46
)0
.00
20
0.0
16
4(0
.02
30
)0
.01
57
SIG
MA
0.1
06
2*
**
(0.0
05
1)
0.1
07
6*
**
(0.0
13
7)
0.1
14
5*
**
(0.0
05
5)
0.0
87
2*
**
(0.0
09
3)
Nu
mb
ero
fu
sab
le
ob
serv
atio
ns
25
93
92
78
45
Lik
elih
oo
dra
tio
22
.59
24
.53
4.4
33
1.4
9
LR
pval
ue
0.0
46
90
.01
74
0.0
01
0.0
01
7
No
te:
*,
**
,*
**
ind
icat
esi
gn
ific
ance
atp
<0
.1,
0.0
5,
or
0.0
1,
resp
ecti
vel
y.
SE
,st
and
ard
erro
r.
Journal of Agricultural and Applied Economics, May 2013238
of the TS brand (Table 4). Results show no
statistically significant influence of the POPA
program on WTP (i.e.,g3,TS 5 0). However,
female consumers aware of TS have a signifi-
cant price discount of approximately 10.3%
for this brand. The previous discussion of TS
awareness indicated that females may have
lower probability of awareness because of their
choice of retail outlets, yet even females aware
of the brand express a price discount, which
exposes the importance of gender and retail
outlet selection for marketing of this brand.
Regarding the frequency of monthly transac-
tions, an additional transaction by consumers
aware of TS is estimated to increase the mean
WTP by 5.3%, implying that purchase fre-
quency plays a role not only in increasing the
likelihood of awareness of TS, but also in in-
ducing price premiums.
Earth-Kind� Willingness-to-Pay Results
Results of the WTP model for EK for all re-
spondents indicate there were no significant
effects of in-store promotion (i.e.,g2,EK 5 0) or
demographic factors, but once more, there
were strong effects from the number of
monthly transactions (TRAN), the purpose of
the purchase (PUR), and brand awareness
(EK-AWARE). The negative sign and sig-
nificance of the variable that measured pur-
pose of the purchase imply a price discount
of 3.3% if the purpose of the purchase is
self-consumption, which validates the pro-
pensity of consumers to save when purchasing
branded plants for self-use. The positive esti-
mate of frequency of purchase (TRAN) indi-
cates that an additional transaction per month
carries an increase of 1.2% in mean WTP for
EK. As in the TS case, the variable with the
highest effect on WTP was brand awareness
(EK-AWARE); consumers aware of the EK
brand are willing to pay a 4.7% price premium
for EK roses compared with regular roses.
Based on the econometric model estimates,
the average consumer of ornamentals in Texas
is willing to pay a price premium of 9.8% for
EK roses, a lower but close estimate to the
premium that consumers are willing to pay for
TS products.
Results of the model examining WTP for
a subsample of consumers aware of the EK
brand (Table 4) show that, for this segment of
the buying population, the POPA program ef-
fectively shifted demand for EK products
(i.e.,g3,EK > 0). Despite being a low-cost in-
store promotion, the program expanded de-
mand for consumers that have been previously
exposed to EK (Table 4). For those consumers,
the magnitude of the increase in WTP is esti-
mated to be approximately 5.5%. This model
also supports a negative relationship between
female consumers aware of branded ornamen-
tals and WTP price premiums, that is, female
consumers aware of EK have price discounts
that reach 6.8%. Finally, frequency of purchase
not only increases the likelihood of awareness
of EK, but also induces price premiums in
consumers aware of the brand; an additional
transaction by aware consumers is estimated to
increase mean WTP by 2.7%.
Industry Implications
Branding, only when combined with effective
marketing, can help agribusiness firms develop
awareness and increase price premiums that
can lead to enhanced profitability. Results
from this study suggest that in-store POPA was
not sufficient to significantly increase brand
awareness and total demand for local ornamen-
tal brands. However, a major factor found to
increase both overall demand and likelihood of
brand awareness was buying frequency, which
suggests that other advertising methods aimed to
increase buying intensity might affect demand
more effectively.
Our findings indicated that female con-
sumers are less likely to be aware of branding
efforts such as TS and those aware expect price
discounts. Also, consumers buying for self-use
are willing to pay less for branded ornamentals.
Previous studies in the literature have found
that buyer frequency in ornamentals increased
with females, self-use purchases, and in certain
months of the year (Palma and Ward, 2010),
which suggests that those consumers that do
most floral transactions per household might be
those that expect price discounts for branded
ornamentals (i.e., females, self-use purchases).
Collart, Palma, and Carpio: Consumer Response to Point of Purchase Advertising 239
This implies that if marketing managers would
like to increase demand for branded ornamentals
among those consumers willing to pay price
premiums, they could personalize their market-
ing strategies to increase buying frequency
among male consumers and those who buy only
for special occasions. An increase in buying
frequency could be accomplished through spe-
cific marketing tools such as loyalty programs or
online retailing. Loyalty programs differ from
other strategies by their emphasis on increasing
repeat-purchase loyalty rather than only on
gaining market share (Sharp and Sharp, 1997).
Their impact on purchase behavior has led to
an increasing popularity across industries,
which has also resulted in the introduction of
new currencies (e.g., frequent flyer miles, re-
wards points) that can lower consumers’ per-
ceived cost for a product (Dreze and Nunes,
2004). However, for a loyalty program to be
a worthy investment that effectively increases
buying intensity, it must be designed in a way
that adds value to consumers. Online retailing
can facilitate the purchase of products by con-
sumers who spend large amounts of time on the
Internet and by time-constrained consumers
(Bellman, Lohse, and Johnson, 1999). In online
retailing, aspects such as an easy returns process
have been shown to positively influence re-
purchase behavior (Griffis et al., 2012).
Another factor that had a strong effect in
consumer WTP was brand awareness. Market-
ing efforts aimed to increase buying frequency
likely increase the level of consumer awareness
and WTP; as consumers make more transactions
and visit the stores, they are more likely to be
exposed to in-store promotion and to become
aware of ornamental brands, which influence
their WTP. However, increasing brand aware-
ness through other types of advertising also has
a direct effect on WTP. For instance, because
consumers with less discretionary time are
turning to the Internet to search for product in-
formation and to make purchases, social media
is playing an increasingly important role as
a source of information with the advantage that
it can be easily tailored to the population of in-
terest at a low cost. Our estimates suggest that
once consumers are aware of a brand, in-store
promotion might help boost demand.
Consumer income also had a significant
effect on brand awareness. Consumers with
relatively high income (above $50,000) are
more likely to be aware of branded ornamentals
sold at traditional freestanding floral outlets,
where average prices are higher, but less likely
to be aware of ornamental brands sold at gen-
eral retailers that include products and educa-
tional components. This implies that marketers
need to tailor their communications intended to
spread brand awareness not only to the product
being offered, but also to consumers’ demo-
graphics and their preferred floral outlets.
Summary and Conclusions
This study analyzed the effects of a low-cost
POPA program launched for the local brands
TS and EK on brand awareness and WTP. The
study used two electronic surveys conducted in
Texas, before and after POPA, to study the
main factors affecting consumer preferences.
Exposure to the POPA did not have significant
effects on overall consumer demand. Instead,
consumer habits of purchase including brand
awareness, the purpose of the purchase, and the
number of transactions had the largest effects
on WTP. We identified a price discount for both
brands when the purpose of the purpose is self-
use and price premiums when the purpose is
a gift and with marginal increases in the num-
ber of transactions.
The POPA program shifted demand solely
for a subpopulation of consumers that have
been previously exposed to the EK brand (i.e.
g3,EK > 0). Given that the consumer is already
aware of EK, the presence of the POPA induces
a price premium of approximately 5.5%. These
conditional models also evidenced a negative
relationship between females and WTP. The
number of transactions positively affected the
likelihood of awareness of branded ornamen-
tals and induced price premiums in respondents
aware and nonaware of TS and EK. With regard
to brand awareness, consumers with relatively
high income (above $50,000) are expected to be
more likely to be aware of TS but less likely to
be aware of brands with educational compo-
nents such as EK. Moreover, older and more
educated consumers are more likely to be aware
Journal of Agricultural and Applied Economics, May 2013240

of TS, whereas females have a lower likelihood
of awareness. Self-use purchases had a signifi-
cant negative effect on awareness of EK,
whereas the South Texas region had a positive
effect on awareness of this brand. Also, an
increasing buying frequency consistently in-
creased awareness of both brands.
These results must be interpreted with cau-
tion because other exogenous factors may have
played a role in promotion effectiveness. The
lack of significance of the POPA parameter
suggests that in-store promotion did not have
an effect on brand awareness or WTP for the
overall population. However, the value of this
parameter measured the difference in the pop-
ulation WTP between the 2008 and 2010 pe-
riods; hence, it might also account for other
exogenous factors. Particularly, the economic
recession of 2009 may have had an effect in
consumer spending in ornamental goods de-
spite advertising efforts by firms and represent
a limitation to our findings. In addition, be-
cause a stated preference method was used to
elicit consumer valuations of branded orna-
mentals, our WTP measures may be an over-
estimate of consumers’ true WTP. However, the
same elicitation method was used to assess
WTP before and after the advertising campaign,
and we focused on the difference in WTP as
a result of in-store promotion rather than the
actual level of WTP. Recent literature that has
also made use of stated preference methods
include Tonsor and Wolf (2012), who admin-
istered an online survey to US consumers to
collect stated WTP for milk attributes, and
Holmquist, McCluskey, and Ross (2012) who
used hypothetical contingent valuation to elicit
WTP for wine attributes. In contrast, the use of
revealed preference methods may provide gains
in accuracy of valuation estimates, yet even in
nonhypothetical settings factors such as partici-
patory fees, bid affiliation, and zero bidders can
potentially introduce bias into the valuations
(Lusk and Hudson, 2004).
The results of this study provide insights
into the effectiveness of in-store advertising for
local branded ornamentals in terms of brand
awareness and WTP. The profile of ornamental
consumers identified in this study can be helpful
in the design of future marketing strategies
aimed to increase buying frequency, which was
found to effectively increase brand awareness
and WTP for branded ornamentals.
[Received April 2012; Accepted November 2012.]
References
Alston, J.M., J.W. Freebairn, and J.S. James.
‘‘Beggar-thy-Neighbor Advertising: Theory
and Application to Generic Commodity Pro-
motion Programs.’’ American Journal of Agri-
cultural Economics 83(2001):888–902.
Anella, L.B., M.A. Schnelle, and D.M. Maronek.
‘‘Oklahoma Proven: A Plant Evaluation and
Marketing Program.’’ HortTechnology 11(2001):
381–84.
Becker, G.S., and K.M. Murphy. ‘‘A Simple Theory
of Advertising as a Good or Bad.’’ The Quarterly
Journal of Economics 108(1993):941–64.
Bellman, S., G.L. Lohse, and E.J. Johnson.
‘‘Predictors of Online Buying Behavior.’’
Communications of the ACM 42(1999):32–38.
Carpio, C.E., and O. Isengildina-Massa. ‘‘To Fund
or Not to Fund: Assessment of the Potential
Impact of a Regional Promotion Campaign.’’
Journal of Agricultural and Resource Eco-
nomics 35(2010):245–60.
Collart, A.J., M.A. Palma, and C.R. Hall.
‘‘Branding Awareness and Willingness-to-Pay
Associated with the Texas Superstar� and
Earth-Kind� Brands in Texas.’’ HortScience
45(2010):1226–31.
Dreze, X., and J.C. Nunes. ‘‘Using Combined-
Currency Prices to Lower Consumers’ Perceived
Cost.’’ JMR, Journal of Marketing Research
41(2004):59–72.
Govindasamy, R., J. Italia, and D. Thatch.
‘‘Consumer Awareness of State Sponsored
Marketing Programs: An Evaluation of the Jersey
Fresh Program.’’ Journal of Food Distribution
Research 29(1998):7–15.
Griffis, S.E., S. Rao, T.J. Goldsby, and T.T.
Niranjan. ‘‘The Customer Consequences of
Returns in Online Retailing: An Empirical
Analysis.’’ Journal of Operations Manage-
ment 30(2012):282–94.
Grooves, R.M., F.J. Fowler Jr., M.P. Couper, J.M.
Leprowski, E. Singer, and R. Tourangeau.
Survey Methodology. Hoboken, NJ: John Wiley
& Sons, 2009.
Hall, C.R., A.W. Hodges, and J.J. Haydu. ‘‘The
Economic Impact of the Green Industry in the
United States.’’ HortTechnology 16(2006):1–9.
Collart, Palma, and Carpio: Consumer Response to Point of Purchase Advertising 241

Hanemann, W.M. ‘‘Discrete/Continuous Models
of Consumer Demand.’’ Econometrica: Journal
of the Econometric Society 52(1984):541–62.
Holmquist, C., J. McCluskey, and C. Ross.
‘‘Consumer Preferences and Willingness to Pay
for Oak Attributes in Washington Chardonnays.’’
American Journal of Agricultural Economics
94(2012):556–61.
Johnson, J.P., and D.P. Myatt. ‘‘On the Simple
Economics of Advertising, Marketing, and
Product Design.’’ The American Economic
Review 96(2006):756–84.
Levy, P.S., and S. Lemeshow. Sampling of Pop-
ulations: Methods and Applications. Hoboken,
NJ: John Wiley & Sons, 2008.
Lusk, J.L., and D. Hudson. ‘‘Willingness-to-Pay
Estimates and Their Relevance to Agribusiness
Decision Making.’’ Review of Agricultural
Economics 26(2004):152–69.
Mackay, W.A., S.W. George, T.D. Davis, M.A.
Arnold, R.D. Lineberger, J.M. Parsons, L.A.
Stein, and G.G. Grant. ‘‘Texas Superstar and
the Coordinated Educational and Marketing
Assistance Program (CEMAP): How We Oper-
ate.’’ HortTechnology 11(2001):389–91.
McFadden, D. ‘‘Conditional Logit Analysis of
Qualitative Choice Behavior.’’ Frontiers in
Econometrics. P. Zarembka, ed. New York, NY:
Academic Press, 1974.
Moore, E.D., G.W. Williams, M.A. Palma, and
L. Lombardini. ‘‘Effectiveness of State-Level
Pecan Promotion Programs: The Case of the
Texas Pecan Checkoff Program.’’ HortScience
44(2009):1914–20.
Nijssen, E.J., and H.C.M. Van Trijp. ‘‘Branding
Fresh Food Products: Exploratory Empirical
Evidence from The Netherlands.’’ European Re-
view of Agriculture Economics 25(1998):228–42.
Ort, J., B. Wilder, and J. Graham. Economic and
Socioeconomic Factors Affecting Consumer
Purchases of Fall Nursery Products. Raleigh,
NC: North Carolina Cooperative Extension
Service, North Carolina Association of Nurs-
erymen, and North Carolina Department of
Agriculture and Consumer Services, Pub. No.
15, 1998.
Palma, M.A., C.R. Hall, B. Campbell, H.
Khachatryan, B. Behe, and S. Barton. ‘‘Measur-
ing the Effects of Firm Promotion Expenditures
on Green Industry Sales.’’ Journal of Environ-
mental Horticulture 30(2012):83–88.
Palma, M.A., and R.W. Ward. ‘‘Measuring De-
mand Factors Influencing Market Penetration
and Buying Frequency for Flowers in the U.S.’’
International Food and Agribusiness Manage-
ment Review 13(2010):65–82.
Patterson, P.M. ‘‘State-Grown Promotion Pro-
grams: Fresher, Better?’’ Choices Magazine
21(2006):41–46.
Patterson, P.M., H. Olofsson, T.J. Richards, and S.
Sass. ‘‘An Empirical Analysis of State Agri-
cultural Product Promotions: A Case Study on
Arizona Grown.’’ Agribusiness 15(1999):179–
96.
Rickard, B.J., J. Liaukonyte, H.M. Kaiser,
and T.J. Richards. ‘‘Consumer Response to
Commodity-Specific and Broad-Based Pro-
motion Programs for Fruit and Vegetables.’’
American Journal of Agricultural Economics
93(2011):1312–27.
Rimal, A.P. ‘‘Effect of Generic and Brand Pro-
motions of Fresh Cut Flowers on the Use of
Retail Flower Outlets.’’ PhD dissertation, Uni-
versity of Florida, Gainesville, FL, 1998.
Sharp, B., and A. Sharp. ‘‘Loyalty Programs and
Their Impact on Repeat-Purchase Loyalty
Patterns.’’ International Journal of Research in
Marketing 14(1997):473–86.
Thilmany, D., M. Sullins, M. Phillips, and A.
Gunter. ‘‘Cost Effective Promotion for Local
Foods and Direct Markets: Evaluation of Col-
orado’s Technical Assistance for Local Food
Supply Chains.’’ Journal of Agribusiness
29(2011):23–40.
Tonsor, G.T., and C.A. Wolf. ‘‘Effect of Video
Information on Consumers: Milk Production
Attributes.’’ American Journal of Agricultural
Economics 94(2012):503–508.
Williams, G., O. Capps, and M.A. Palma. ‘‘Ef-
fectiveness of Marketing Promotion Programs:
The Case of Texas Citrus.’’ HortScience 43(2008):
385–92.
Williams, G., O. Capps, and T. Trang. ‘‘Does Lamb
Promotion Work?’’ Agribusiness 26(2010):
536–56.
Yue, C., and B.K. Behe. ‘‘Estimating U.S. Con-
sumers’ Choice of Floral Retail Outlets.’’
HortScience 43(2008):764–69.
Journal of Agricultural and Applied Economics, May 2013242
Related Documents