HORTSCIENCE 36(4):795–800. 2001. Received for publication 26 Apr. 1999. Accepted for publication 16 Sept. 2000. The cost of publishing this paper was defrayed in part by the payment of page charges. Under postal regulations, this paper therefore must be hereby marked advertisement solely to indicate this fact. 1 Former Graduate Research Assistant. 2 Professor. 3 Assistant Professor; to whom reprint requests should be addressed. Current address: Horticultural Sci- ences Dept., 1241 Fifield Hall, P.O. Box 110690, Univ. of Florida, Gainesville, FL 32611-0690. E- mail address: [email protected] 4 Associate Professor. Current address: Dept. of Horticulture, 216 Plant and Soil Sciences, Michigan State Univ., East Lansing, MI 48824-1325. 5 Assistant Professor. Current address: Dept. of Fam- ily, Youth & Community Sciences, P.O. Box 110310, Univ. of Florida, Gainesville, FL 32611-0310. Consumer Preferences for Color, Price, and Vitamin C Content of Bell Peppers Christopher A. Frank 1 and Robert G. Nelson 2 Department of Agricultural Economics and Rural Sociology, 202 Comer Hall, Auburn University, AL 36849-5406 Eric H. Simonne 3 and Bridget K. Behe 4 Department of Horticulture, 101 Funchess Hall, Auburn University, AL 36849-5408 Amarat H. Simonne 5 Department of Nutrition and Food Science, Spidle Hall, Auburn University, AL 36849-5605 Additional index words. Capsicum annuum, conjoint analysis, market segmentation, multinomial logit Abstract. Most bell peppers (Capsicum annuum L.) produced and consumed are green. However, yellow, red, orange, white, black, and purple bell peppers are also available. While bell pepper consumption in the United States has been increasing in the past 10 years, limited information is available on how their color, retail price, and vitamin C content influence consumer preferences. A conjoint analysis of 435 consumer responses showed that, for the total sample, color was about three times more important than retail price in shaping consumers’ purchase decisions, while vitamin C content was nearly irrelevant. Six distinct consumer segments were identified through cluster analysis. Four segments favored green peppers, while one segment favored yellow and one favored brown. Demographic variables generally were not good predictors of segment member- ship, but several behavioral variables, such as past bell pepper purchases, were signifi- cantly related to segment membership. While green is generally the preferred color, market segments exist for orange, red, yellow, and even brown peppers. Applications to marketing strategies suggested that price sensitivity could explain why green peppers were priced individually, but those of other colors were priced by weight, and that promotion of increased vitamin C content would be most effective if associated specifically with yellow and orange peppers. Bell peppers are becoming an increasingly popular decorative and nutritive food item in the United States. Per capita consumption of bell peppers in the United States nearly tripled in the last three decades, rising from 1.1 kg per capita per year in 1973 to 3.2 in 1996, repre- senting a total value of domestic bell pepper production of $461 million (U.S. Dept. of Agriculture, 1997a). However, there is little published information about consumer prefer- influence of cultivar, price, and longevity on consumer preferences for potted chrysanthe- mums. Gineo (1990) studied rhododendron sales from wholesalers to retail garden centers and landscapers to determine the importance of quality, plant height, container size, price, region of origin, range of products offered, flower color, delivery time, and payment terms. Manalo (1990) evaluated consumer prefer- ences for size, color, price, crispness, and flavor in apples. Townsley-Brascamp and Marr (1995) analyzed consumer preferences for characteristics of outdoor ornamentals, such as plant health, bushiness, height, price, suit- ability for growing conditions, shape, flower color, and leaf color. Behe et al. (1999) evalu- ated consumer preferences for geranium flower color, leaf variegation, and price. A number of attributes may affect con- sumer preferences for bell peppers, including aspect (color, size, shape), nutritive value (vi- tamin C, provitamin A, minerals, fiber), in- tended use (frozen, pre-sliced, or diced for cooking; whole fruits for fresh consumption), and retail price. Since only a few of these attributes could be examined simultaneously, some choices had to be made about which ones to include in this study. Color was an obvious first choice of at- tribute. While green is by far the most pre- ferred color in bell peppers, red and yellow are also popular choices, especially as garnishes. Market shares are roughly 80%, 10%, and 8% for the three colors, respectively. The remain- ing 2% of the market is divided among a variety of other colors, including orange, purple, black, brown, and ivory (Simonne et al., 1997b). Price was another obvious attribute that influences consumers’ preferences for bell peppers. Green bell peppers usually sell for a lower price than peppers of other colors. For example, in Sept. 1997 the Atlanta terminal market wholesale price for a 13-kg box of large green peppers ranged from $8.00 to $10.25, while red, yellow, or orange peppers ranged from $16.00 to $23.50 (U.S. Dept. of Agriculture, 1997b). In 1998, retail prices for green bell peppers in stores in the Auburn, Ala., area typically ranged from $1.52 to $2.18 per kg, while prices for peppers of other colors ranged from $6.57 to $10.98 per kg. These prices appear to reflect differences in con- sumer preferences rather than differences in cost of production. Although bell peppers are primarily cho- sen as a colorful enhancement in food prepa- ration, the fact that bell peppers are an excel- lent source of vitamin C and a good source of vitamin A is less well known. In fact, in a survey of vitamin C content of fruits and vegetables, bell peppers ranked fourth highest out of 42 alternatives (Salunkhe, 1976). Inter- estingly, green bell peppers are lower in vita- min C content than bell peppers of other col- ors. Concentrations of vitamin C range from 980 mg·kg –1 in green peppers to 1080 in or- ange peppers (Simonne et al., 1997a). These factors recommended vitamin C content as a third attribute that might prove useful in dif- ferentiation of bell peppers by consumers. ences for various attributes of bell peppers, such as demographic influences on color choice, the importance of retail price in the purchase decision, and the desirability of cer- tain nutritive qualities. In this study, we use conjoint analysis to examine consumer prefer- ences for some of these attributes, and discuss some marketing implications of our results. Conjoint analysis is useful in determining how various product attributes and their levels influence a consumer’s purchase decision. For example, it can reveal whether one level of an attribute, such as low vitamin content, has a positive or negative influence on a consumer’s purchase decision, or whether a consumer’s preferences are sensitive to price. Larger posi- tive values for one level of an attribute (e.g., yellow color, high vitamin content) indicate that it is preferred more than those with smaller values (e.g., brown color, low vitamin con- tent). Attributes with wider ranges of values across levels have greater “relative impor- tance” in the purchase decision than attributes with narrower ranges of levels. Conjoint analysis has been used in a num- ber of horticultural applications. Robertson and Chatfield (1982) evaluated consumer pref- erences for bunch composition, color, and price in loose-bunch merchandising of fresh flowers. Shafer and Kelly (1986) assessed the

Welcome message from author
This document is posted to help you gain knowledge. Please leave a comment to let me know what you think about it! Share it to your friends and learn new things together.
Transcript
HORTSCIENCE 36(4):795–800. 2001.
Received for publication 26 Apr. 1999. Acceptedfor publication 16 Sept. 2000. The cost of publishingthis paper was defrayed in part by the payment ofpage charges. Under postal regulations, this papertherefore must be hereby marked advertisementsolely to indicate this fact.1Former Graduate Research Assistant.2Professor.3Assistant Professor; to whom reprint requests shouldbe addressed. Current address: Horticultural Sci-ences Dept., 1241 Fifield Hall, P.O. Box 110690,Univ. of Florida, Gainesville, FL 32611-0690. E-mail address: [email protected] Professor. Current address: Dept. ofHorticulture, 216 Plant and Soil Sciences, MichiganState Univ., East Lansing, MI 48824-1325.5Assistant Professor. Current address: Dept. of Fam-ily, Youth & Community Sciences, P.O. Box 110310,Univ. of Florida, Gainesville, FL 32611-0310.
Consumer Preferences for Color, Price,and Vitamin C Content of Bell PeppersChristopher A. Frank1 and Robert G. Nelson2
Department of Agricultural Economics and Rural Sociology, 202 Comer Hall,Auburn University, AL 36849-5406
Eric H. Simonne3 and Bridget K. Behe4
Department of Horticulture, 101 Funchess Hall, Auburn University,AL 36849-5408
Amarat H. Simonne5
Department of Nutrition and Food Science, Spidle Hall, Auburn University,AL 36849-5605
Additional index words. Capsicum annuum, conjoint analysis, market segmentation,multinomial logit
Abstract. Most bell peppers (Capsicum annuum L.) produced and consumed are green.However, yellow, red, orange, white, black, and purple bell peppers are also available.While bell pepper consumption in the United States has been increasing in the past 10years, limited information is available on how their color, retail price, and vitamin Ccontent influence consumer preferences. A conjoint analysis of 435 consumer responsesshowed that, for the total sample, color was about three times more important than retailprice in shaping consumers’ purchase decisions, while vitamin C content was nearlyirrelevant. Six distinct consumer segments were identified through cluster analysis. Foursegments favored green peppers, while one segment favored yellow and one favoredbrown. Demographic variables generally were not good predictors of segment member-ship, but several behavioral variables, such as past bell pepper purchases, were signifi-cantly related to segment membership. While green is generally the preferred color,market segments exist for orange, red, yellow, and even brown peppers. Applications tomarketing strategies suggested that price sensitivity could explain why green peppers werepriced individually, but those of other colors were priced by weight, and that promotionof increased vitamin C content would be most effective if associated specifically with yellowand orange peppers.
Bell peppers are becoming an increasinglypopular decorative and nutritive food item inthe United States. Per capita consumption ofbell peppers in the United States nearly tripledin the last three decades, rising from 1.1 kg percapita per year in 1973 to 3.2 in 1996, repre-senting a total value of domestic bell pepperproduction of $461 million (U.S. Dept. ofAgriculture, 1997a). However, there is littlepublished information about consumer prefer-
influence of cultivar, price, and longevity onconsumer preferences for potted chrysanthe-mums. Gineo (1990) studied rhododendronsales from wholesalers to retail garden centersand landscapers to determine the importanceof quality, plant height, container size, price,region of origin, range of products offered,flower color, delivery time, and payment terms.Manalo (1990) evaluated consumer prefer-ences for size, color, price, crispness, andflavor in apples. Townsley-Brascamp and Marr(1995) analyzed consumer preferences forcharacteristics of outdoor ornamentals, suchas plant health, bushiness, height, price, suit-ability for growing conditions, shape, flowercolor, and leaf color. Behe et al. (1999) evalu-ated consumer preferences for geranium flowercolor, leaf variegation, and price.
A number of attributes may affect con-sumer preferences for bell peppers, includingaspect (color, size, shape), nutritive value (vi-tamin C, provitamin A, minerals, fiber), in-tended use (frozen, pre-sliced, or diced forcooking; whole fruits for fresh consumption),and retail price. Since only a few of theseattributes could be examined simultaneously,some choices had to be made about which onesto include in this study.
Color was an obvious first choice of at-tribute. While green is by far the most pre-ferred color in bell peppers, red and yellow arealso popular choices, especially as garnishes.Market shares are roughly 80%, 10%, and 8%for the three colors, respectively. The remain-ing 2% of the market is divided among avariety of other colors, including orange,purple, black, brown, and ivory (Simonne etal., 1997b).
Price was another obvious attribute thatinfluences consumers’ preferences for bellpeppers. Green bell peppers usually sell for alower price than peppers of other colors. Forexample, in Sept. 1997 the Atlanta terminalmarket wholesale price for a 13-kg box oflarge green peppers ranged from $8.00 to$10.25, while red, yellow, or orange peppersranged from $16.00 to $23.50 (U.S. Dept. ofAgriculture, 1997b). In 1998, retail prices forgreen bell peppers in stores in the Auburn,Ala., area typically ranged from $1.52 to $2.18per kg, while prices for peppers of other colorsranged from $6.57 to $10.98 per kg. Theseprices appear to reflect differences in con-sumer preferences rather than differences incost of production.
Although bell peppers are primarily cho-sen as a colorful enhancement in food prepa-ration, the fact that bell peppers are an excel-lent source of vitamin C and a good source ofvitamin A is less well known. In fact, in asurvey of vitamin C content of fruits andvegetables, bell peppers ranked fourth highestout of 42 alternatives (Salunkhe, 1976). Inter-estingly, green bell peppers are lower in vita-min C content than bell peppers of other col-ors. Concentrations of vitamin C range from980 mg·kg–1 in green peppers to 1080 in or-ange peppers (Simonne et al., 1997a). Thesefactors recommended vitamin C content as athird attribute that might prove useful in dif-ferentiation of bell peppers by consumers.
ences for various attributes of bell peppers,such as demographic influences on colorchoice, the importance of retail price in thepurchase decision, and the desirability of cer-tain nutritive qualities. In this study, we useconjoint analysis to examine consumer prefer-ences for some of these attributes, and discusssome marketing implications of our results.
Conjoint analysis is useful in determininghow various product attributes and their levelsinfluence a consumer’s purchase decision. Forexample, it can reveal whether one level of anattribute, such as low vitamin content, has apositive or negative influence on a consumer’spurchase decision, or whether a consumer’spreferences are sensitive to price. Larger posi-tive values for one level of an attribute (e.g.,yellow color, high vitamin content) indicatethat it is preferred more than those with smallervalues (e.g., brown color, low vitamin con-tent). Attributes with wider ranges of valuesacross levels have greater “relative impor-tance” in the purchase decision than attributeswith narrower ranges of levels.
Conjoint analysis has been used in a num-ber of horticultural applications. Robertsonand Chatfield (1982) evaluated consumer pref-erences for bunch composition, color, andprice in loose-bunch merchandising of freshflowers. Shafer and Kelly (1986) assessed the
While changes in color during fruit devel-opment and nutritional content for differentcolors of bell peppers are well documentedand understood, limited information is avail-able on how consumers evaluate these factorsin making their purchasing decisions. An un-derstanding of consumers’ preferences for bellpeppers would be of interest to breeders, pro-ducers, wholesalers, and retailers. Therefore,the objectives of this study were to: 1) quantifyconsumer preferences for color, retail price,and vitamin C content in bell peppers; 2)identify different segments of consumers withdifferent preferences; and 3) determine howdemographic and behavioral variables affectthe probability of a consumer being in a par-ticular segment.
Materials and Methods
Conjoint analysis was used to identify thestructure of consumer preferences by model-ing their decision-making processes from theirevaluations of the main attributes associatedwith bell peppers (Green and Wind, 1973).First, a set of attributes called a “productprofile” was created by combining attributesat levels that reflected the market ranges con-sumers routinely use to assess bell peppers. Inthis study, the attributes selected were color,retail price, and vitamin C content. Samples ofFancy grade green, brown, red, yellow, andorange bell peppers from the 1996 AuburnUniv. cultivar trials were used (Simonne et al.,1996). Selected prices were $1.52, $3.73, $5.93,and $8.13/kg. Selected vitamin C contents(per serving) were 75%, 100%, and 125% ofthe U.S. Recommended Daily Allowance(RDA). Although these levels may not accu-rately represent the actual ranges of vitamin Cfound in bell peppers, they were subjectivelychosen to elicit preferences for “lower-than-average,” “average,” and “higher-than-aver-age” concentrations of vitamin C.
The survey was conducted on a Saturdayand Sunday in Aug. 1996 in the Auburn, Ala.,area. Bell peppers were displayed in the pro-duce section of two large retail grocery storesof the same chain. Consumers voluntarily par-ticipating in the survey were provided with aclipboard, a pen, instructions, and a question-naire. Several plates, each containing threewhole, fresh bell peppers and a card with aretail price and a vitamin C level, were ran-domly placed on a table. Consumers wereasked to evaluate each plate on a 1-to-5 scaledisplayed on their questionnaire as follows:
reduce the number of profiles to 32, whichwere then randomly subdivided into two setsof 16 each.
Consumers were also asked to providedemographic and behavioral information. De-mographic information included consumer’sage, gender, years of formal education, house-hold size, and income. In reference to pur-chase behavior in the previous 4 weeks, be-havioral information included purchase of anybell peppers, specific colors purchased, esti-mated consumption (in pounds), and methodof preparation (cooked or raw).
Consumers’ preference ratings were ana-lyzed using Bretton-Clark’s Conjoint Ana-lyzer software (Bretton-Clark, 1992). Ratherthan aggregating all participants and obtainingaverage preferences, this program generatedpreference estimates for each participant. Thisindividual-level approach reduces bias in re-sults when researchers have reason to believethat different segments of respondents havemarkedly different preferences (Bretton-Clark,1992). Most previous horticultural applica-tions of conjoint analysis have assumed homo-geneous preferences and have used aggregate-level analysis (Gineo, 1990; Manalo, 1990;Robertson and Chatfield, 1982; Shafer andKelly, 1986; Townsley-Brascamp and Marr,1995).
Before estimating the conjoint model, func-tional forms were selected for each attribute. Adummy variable, or “part-worth,” functionalform was selected for both color and vitamin Ccontent because of its flexibility in approxi-mating the preference function. For color, thechoice was obvious because color is a qualita-tive variable with no prior expectations re-garding the shape of the preference function.In the case of vitamin C content, we wereuncertain whether consumers would prefermore vitamin C (125% RDA) because of itswidely reported health benefits, lower dos-ages (75% RDA), or exactly 100% RDA.Price can be represented with either a linear (or“vector”) model or a quadratic (or “ideal point”)model. A pretest using a full- vs. restricted-model F-test showed no significant differencebetween the two models, so the more parsimo-nious linear model was chosen to conservedegrees of freedom.
The following functional form of the modelwas estimated with ordinary least squares re-gression:
R = α + β1C1 + β2C2 + β3C3 + β4C4 +γP + δ1V1 + δ2V2 + e [1]
where R was the rating assigned by a respon-dent to a particular product combination (i.e.,a plate of three raw peppers of the same color,along with the price and vitamin C content); Ci
represented four of the five colors, designatedby effects-coded indicator variables (Cohenand Cohen, 1983; Hardy, 1993); P representedprice, modeled as a continuous variable; Vi
represented two of the three levels of vitaminC content, also designated by effects-codedindicator variables; and e represented a nor-mally distributed random error term. To facili-tate interpretation of part-worths, the coeffi-cient for the omitted fifth color was calculated
as the negative sum of the included colorcoefficients; similarly for vitamin C content.Since each of the 435 respondents rated 16plates, there were 16 observations available toestimate each individual respondent’s model,with a total of 435 such models estimated.
The estimated part-worth and vector coef-ficients were next analyzed with cluster analy-sis, which aggregated the preferences of indi-viduals into consumer segments based on simi-larity of preferences (Green and Helsen, 1988).The cluster analysis was done using the PROCCLUSTER procedure in SAS (SAS Institute,1996), specifying Ward’s minimum variancemethod. The determination of the number ofclusters was based on local peaks in the cubicclustering criterion and pseudo F statistic atsix clusters, as well as a sharp drop in thepseudo t2 statistic, also at six clusters (SASInstitute, 1996).
After cluster analysis of the part-worths,consumers’ demographic and behavioral vari-ables were analyzed to establish which vari-ables were significant in determining clustermembership, using two different approaches.The first approach was simply to test themeans of each preference segment against theoverall mean. The second approach was torelate consumers’ demographic and behav-ioral variables to their segment membershipby estimating a multinomial logit model usingLIMDEP (Greene, 1995). This method pro-vides a measure of the relative impact of thesevariables on the probability of membership ina particular segment, as well as the change inthat probability given a specific change in theindependent variable of interest (Huang andFu, 1995).
The multinomial logit model determinesthe probability of a respondent belonging to aparticular cluster or consumer segment, and isspecified as:
Prob[segment je
e
B X
B X
j
m
j i
j i
= =+
=
−
∑]
11
1
[2]
j = 1,..., m – 1 i = 1,..., n
where Prob[segment=j] denotes the probabil-ity that a respondent belongs to the jth con-sumer segment, Xi represents a set of n demo-graphic and behavioral characteristics of therespondents, and Bj is a vector of parameters tobe estimated for the m-1 segments. Parametersare estimated for only m-1 segments becauseone of the segments must be normalized tozero in order to fully identify the model (Greene,1995). In interpreting the coefficients, thisomitted segment (in our case, Segment I)becomes the reference for comparison, suchthat the estimates from this model predict theprobability of an individual being in one of them-1 segments and not in the reference group.For example, a positive sign on the coefficientfor gender for Segment IV would indicate thatwomen are more likely to be members ofSegment IV than of Segment I. Because suchinterpretations are conditional on the omittedsegment, they are not useful in relating achange in the probability of segment member-ship to a change in a given socioeconomic
They were also asked to assume that thepeppers were to be used raw. The total numberof possible product combinations was 60 (fivecolors × four prices × three vitamin C levels).To make the number of product profiles andthe length of the questionnaire more manage-able for respondents, a factorial design gener-ated by Bretton-Clark’s Conjoint Designersoftware (Bretton-Clark, 1990) was used to
Definitely would May or Definitely
NOT buy may not buy would buy
1 . . . . . . .2 . . . . . .3 . . . . . . .4 . . . . . . . 5

variable, and for this reason a table of thesecoefficients is not included in this text. How-ever, an analysis of marginal effects doespermit estimation of such changes in probabil-ity, allowing the interpretation that a 1% in-crease in the proportion of females in thesample would change the probability of mem-bership in Segment IV by the value of thecoefficient in a table of marginal probabilities.
The derivation of marginal effects is asfollows:
η ∂∂ji
i
j ji j jij
mProb[segment j
XP B P B= = = −
=
−
∑]
1
1
j = 1,..., m – 1 i = 1,..., n [3]
where ηji represents the change in the prob-ability of a respondent being associated withsegment j with respect to a one-unit change inthe ith socioeconomic characteristic, Xi. Pj isthe observed probability of group member-ship, Prob[segment=j]. Bji is the estimatedregression coefficient associated with Xi forsegment j. The derivative is evaluated at theoverall sample mean of Xi, where the effects ofBji on changes in probability are greatest. Be-cause an increase in the probability of being inone segment must be offset by a decrease in theprobability of being in another segment, themarginal probabilities for a given independentvariable sum to zero.
The demographic variables used in themultinomial logit model were age, income,gender, education, and household size. Gen-der was a binary variable with 1 = “female.”The behavioral variables were: purchase ofany bell peppers within the last month; spe-cific colors purchased within the last month;total weight purchased within the last month;and method of preparation (cooked or raw).Since no respondent had purchased brownpeppers, this variable was omitted.
The level of significance used to interpretall statistical tests was 10% or less. Extrapola-
tion of the results to a wider population isconditional on the representativeness of thesample of participants, so the following re-sults and discussion should be evaluated withthis limitation in mind.
Results and Discussion
Overall panel. A total of 435 consumerscompleted the questionnaire. The followinganalysis of the entire sample (the “overallpanel”) is similar to the aggregate-level ap-proach used in most previous horticulturalapplications of conjoint analysis.
Color was overwhelmingly the most im-portant attribute, with a relative importance of75% (Table 1, last column). The part-worthsfor the levels of color indicated a strong pref-erence for green (with a part-worth of 0.91),while brown had a large negative effect onpreference (–0.85). The overall panel per-ceived red, yellow, and orange as intermediatebetween these two extremes, with similar part-worths. Retail price, with a relative impor-tance of 23%, was only about a third as impor-tant in the buying decision, over this range ofprices. Vitamin C content had an even lowerimportance (2.5%).
The marked preference for green, togetherwith the subordinate influence of price rela-tive to color, suggested that in this market theshares of alternative colors could not be in-creased simply by lowering their retail prices.Also, the low part-worth for brown in theoverall sample suggested that there would beno market for this color. Conversely, consum-ers’ preference for orange, which was similarto that of red and yellow, indicated that orangewas underrepresented in the current marketshare. This may have been due to the limitedavailability of orange cultivars with desirablehorticultural attributes, such as high-yield po-tential, heat tolerance, and disease resistance(Simonne et al., 1997b).
The small relative importance of vitamin Ccontent in overall consumer preferences (2.5%)initially seemed to suggest that this would bean unpromising attribute on which to differen-tiate bell peppers and promote their consump-tion. However, analysis of the six panel seg-ments indicated otherwise.
Panel segments. Cluster analysis revealedthe potential for consumer segmentation strat-egies. Most of the part-worth coefficientswithin each of the six segments were signifi-cantly different from those of the overall panel(see second footnote in Table 1). Sixteen of the18 relative-importance summary statistics, and39 of the 54 part-worths for the six segmentsdiffered significantly from those of the overallsample, confirming that the clustering methodwas efficient in sorting consumers into dis-tinct segments.
Color was still the dominant contributor toconsumer preference in five of the six seg-ments. All but four of the segments’ part-worths for color were significantly differentfrom those of the overall sample. Yet, strongpreferences for green and strong dislikes forbrown were still found in four of the sixsegments (Segments II, III, IV, and V). More-over, in comparison with the overall sample,Segments III and IV showed a much strongerpreference for green peppers.
Segment I represented 10% of the sample,and contained consumers with strong prefer-ences for yellow and, to a lesser extent, or-ange. Brown was the preferred color for Seg-ment VI (8% of the sample), suggesting that asmall market for brown bell peppers may existand that retailers in this location should con-sider stocking a limited quantity of this color.For nearly half of the sample (comprisingSegments I, II, and III), orange had the secondhighest positive part-worth among colors. Redwas neither strongly liked nor disliked by anysegment. Red preference was highest in Seg-ments V and VI, where red had the second
Table 1. Part-worths, relative importance, and adjusted R2 for the six clusters based on preferences for bell pepper attributes.
Segment I Segment II Segment III Segment IV Segment V Segment VI Overall(10.3%) (24.8%) (12.0%) (27.6%) (17.7%) (7.6%) (100%)
Attributes and levels Part-worth Part-worth Part-worth Part-worth Part-worth Part-worth Part-worthColor:
Green –0.15* 0.50*z 1.27*z 2.01*z 0.90z –0.83*z 0.91z
Brown –0.29*z –0.93z –1.54*z –1.30*z –0.55*z 0.67*z –0.85z
Red –0.12* 0.17*z 0.01 –0.22*z 0.25*z 0.23*z 0.03Yellow 0.37*z 0.08*z –0.07 –0.30*z –0.30*z 0.15 –0.08z
Orange 0.19*z 0.19*z 0.34*z –0.18*z –0.29*z –0.22*z –0.01Relative importance (%) 29.5* 59.8* 69.6* 93.2* 45.0* 52.8* 74.6z
Price/kg:Vector –0.25z –0.26*z 0.02* –0.06*z –0.27z –0.34*z –0.18z
$0.69 –0.17 –0.18 0.01 –0.04 –0.19 –0.23 –0.12$1.69 –0.42 –0.44 0.03 –0.10 –0.46 –0.57 –0.30$2.69 –0.67 –0.70 0.05 –0.16 –0.73 –0.91 –0.48$3.69 –0.92 –0.96 0.07 –0.22 –1.00 –1.25 –0.66
Relative importance (%) 33.9* 33.1* 1.2* 5.4* 25.2 35.6* 22.9z
Vitamin C (content)75% –0.42*z 0.09*z –0.54*z –0.03* 0.52*z 0.15*z 0.01100% 0.03 –0.08z –0.10 0.02 –0.07 0.04 –0.03125% 0.40*z –0.01 0.64*z 0.01 –0.44*z –0.18*z 0.03
Relative importance (%) 36.6* 7.1* 29.2* 1.4% 29.8* 11.6* 2.5z
Adjusted R2 0.34 0.44 0.43 0.68 0.43 0.44 0.49zSignificant at the 0.10 level when compared to zero in a two-tail t test.*Significant at the 0.10 level when compared to overall sample in a two-tail t test.
highest part-worth after green and brown, re-spectively.
The relative importance of retail price inthe overall sample (22.9%) was not represen-tative of Segments III or IV, which expressedrelative importance values of only 1.2% and5.4%, respectively. These results, together withthe small coefficients for “Vector” in Table 1,indicate that neither segment was sensitive toprice. The corresponding part-worths for eachof the four test prices shown in Table 1 aresimply the product of the Vector coefficientand the price. For all segments except III, part-worths decreased as retail price increased.This is consistent with the general observationthat consumers prefer lower prices. The smallpositive relationship between price and part-worth in Segment III is not significantly dif-ferent from zero.
With a value of only 2.5%, the relativeimportance of vitamin C content to the overallpanel seemed to indicate that respondents werecompletely indifferent to this attribute. How-ever, these aggregate results masked the com-plexity of preferences with respect to vitaminC content. The cluster analysis revealed thatthree segments (I, III, and V), comprising 40%of the sample, ranked vitamin C content as thefirst or second most important attribute, andthat Segments I and III preferred the highestlevel of vitamin C, while Segment V preferredthe lowest. Only Segments II and IV indicatedno marked preference for this attribute.
Note that most retail stores do not displaythe vitamin C content of bell peppers as promi-nently as their price. Thus, in our study con-sumers were compelled to consider their pref-erences for this attribute more deliberatelythan they might in a normal shopping situa-tion. Also, the vitamin C content provided innutritional information is usually based on acertain serving size of the raw product (e.g.,130% of RDA for a medium-size pepper of148 g). Since many preparations use bell pep-pers steamed, sauteed, or stir-fried, some ofthe vitamin C may be lost in cooking. In thatcase, nutritional information would have to be
adjusted for consumers who keep track of theirdaily nutrient intake.
Demographic and behavioral variables.Segments of the sample were identified on thebasis of their part-worths for color, retail price,and vitamin C content. This section presentsthe demographic and behavioral characteris-tics of the consumers belonging to those dif-ferent segments.
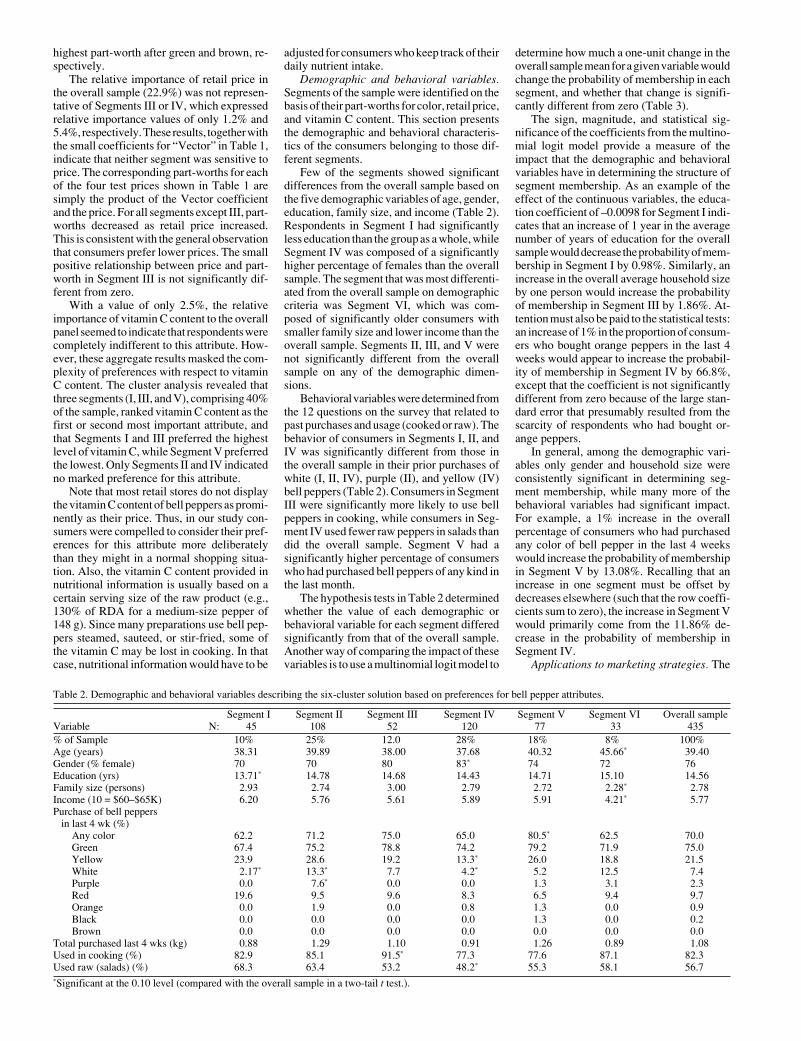
Few of the segments showed significantdifferences from the overall sample based onthe five demographic variables of age, gender,education, family size, and income (Table 2).Respondents in Segment I had significantlyless education than the group as a whole, whileSegment IV was composed of a significantlyhigher percentage of females than the overallsample. The segment that was most differenti-ated from the overall sample on demographiccriteria was Segment VI, which was com-posed of significantly older consumers withsmaller family size and lower income than theoverall sample. Segments II, III, and V werenot significantly different from the overallsample on any of the demographic dimen-sions.
Behavioral variables were determined fromthe 12 questions on the survey that related topast purchases and usage (cooked or raw). Thebehavior of consumers in Segments I, II, andIV was significantly different from those inthe overall sample in their prior purchases ofwhite (I, II, IV), purple (II), and yellow (IV)bell peppers (Table 2). Consumers in SegmentIII were significantly more likely to use bellpeppers in cooking, while consumers in Seg-ment IV used fewer raw peppers in salads thandid the overall sample. Segment V had asignificantly higher percentage of consumerswho had purchased bell peppers of any kind inthe last month.
The hypothesis tests in Table 2 determinedwhether the value of each demographic orbehavioral variable for each segment differedsignificantly from that of the overall sample.Another way of comparing the impact of thesevariables is to use a multinomial logit model to
determine how much a one-unit change in theoverall sample mean for a given variable wouldchange the probability of membership in eachsegment, and whether that change is signifi-cantly different from zero (Table 3).
The sign, magnitude, and statistical sig-nificance of the coefficients from the multino-mial logit model provide a measure of theimpact that the demographic and behavioralvariables have in determining the structure ofsegment membership. As an example of theeffect of the continuous variables, the educa-tion coefficient of –0.0098 for Segment I indi-cates that an increase of 1 year in the averagenumber of years of education for the overallsample would decrease the probability of mem-bership in Segment I by 0.98%. Similarly, anincrease in the overall average household sizeby one person would increase the probabilityof membership in Segment III by 1.86%. At-tention must also be paid to the statistical tests:an increase of 1% in the proportion of consum-ers who bought orange peppers in the last 4weeks would appear to increase the probabil-ity of membership in Segment IV by 66.8%,except that the coefficient is not significantlydifferent from zero because of the large stan-dard error that presumably resulted from thescarcity of respondents who had bought or-ange peppers.
In general, among the demographic vari-ables only gender and household size wereconsistently significant in determining seg-ment membership, while many more of thebehavioral variables had significant impact.For example, a 1% increase in the overallpercentage of consumers who had purchasedany color of bell pepper in the last 4 weekswould increase the probability of membershipin Segment V by 13.08%. Recalling that anincrease in one segment must be offset bydecreases elsewhere (such that the row coeffi-cients sum to zero), the increase in Segment Vwould primarily come from the 11.86% de-crease in the probability of membership inSegment IV.
Applications to marketing strategies. The
Table 2. Demographic and behavioral variables describing the six-cluster solution based on preferences for bell pepper attributes.
Segment I Segment II Segment III Segment IV Segment V Segment VI Overall sampleVariable N: 45 108 52 120 77 33 435% of Sample 10% 25% 12.0 28% 18% 8% 100%Age (years) 38.31 39.89 38.00 37.68 40.32 45.66* 39.40Gender (% female) 70 70 80 83* 74 72 76Education (yrs) 13.71* 14.78 14.68 14.43 14.71 15.10 14.56Family size (persons) 2.93 2.74 3.00 2.79 2.72 2.28* 2.78Income (10 = $60–$65K) 6.20 5.76 5.61 5.89 5.91 4.21* 5.77Purchase of bell peppers
in last 4 wk (%)Any color 62.2 71.2 75.0 65.0 80.5* 62.5 70.0Green 67.4 75.2 78.8 74.2 79.2 71.9 75.0Yellow 23.9 28.6 19.2 13.3* 26.0 18.8 21.5White 2.17* 13.3* 7.7 4.2* 5.2 12.5 7.4Purple 0.0 7.6* 0.0 0.0 1.3 3.1 2.3Red 19.6 9.5 9.6 8.3 6.5 9.4 9.7Orange 0.0 1.9 0.0 0.8 1.3 0.0 0.9Black 0.0 0.0 0.0 0.0 1.3 0.0 0.2Brown 0.0 0.0 0.0 0.0 0.0 0.0 0.0
Total purchased last 4 wks (kg) 0.88 1.29 1.10 0.91 1.26 0.89 1.08Used in cooking (%) 82.9 85.1 91.5* 77.3 77.6 87.1 82.3Used raw (salads) (%) 68.3 63.4 53.2 48.2* 55.3 58.1 56.7*Significant at the 0.10 level (compared with the overall sample in a two-tail t test.).

information from Table 1 can be used to sug-gest possible marketing strategies for this lo-cal market based on combinations of the at-tributes of color, price, and vitamin C content.For example, Segments III and IV exhibitedthe strongest preference for green among allthe segments, with part-worths of 1.27 and2.01, respectively. These two segments alsowere the least sensitive to price, with relativeimportance values of 1.2% and 5.4%, respec-tively. Conversely, Segments I, II, V, and VIall exhibited strong preferences for non-greenbell peppers and were also the most sensitiveto price. This suggested that green peppersmay be underpriced relative to those of othercolors. Interestingly, some grocery stores mayalready be aware of these preference patternsand have responded to them. Certain localretailers now price green bell peppers indi-vidually, while they price others—which aredisplayed in a different part of the producesection—by weight. Thus, green bell peppersat some stores were recently selling at two for$1.28 (or ≈$4.32 per kg, assuming a 148 gmedium bell pepper), which is considerablyhigher than the $1.52 to $2.18 per kg rangepreviously observed.
Another example involves color and vita-min C content. Segments I and III rated vita-min C content as relatively important andpreferred more vitamin C to less. They alsoexhibited stronger preferences for yellow andorange peppers. Together these results suggestthat marketing efforts designed to promote thevitamin C content of bell peppers would havea greater impact if associated specifically withyellow and orange peppers.
Applications to changes in segment mem-bership. When information from Tables 1, 2,and 3 is combined, some insight may be gainedinto the effects that changes in the structure ofsegment membership can have on marketingapplications. The premise is that retailers wouldwant to increase the probability of consumersbecoming members of the segments that havethe greatest revenue potential.
The prospects for this exercise are limitedby the requirement that good candidates forchange should be segment characteristics thatare simultaneously “substantial” and “acces-
sible” (Kotler and Armstrong, 1996). Thismeans that in order to implement a strategythat involves increasing membership in a seg-ment, the potential lies with coefficients inTable 3 that are large, positive, and statisti-cally significant (substantial), and susceptibleto influence by marketing techniques (acces-sible). An example of a strategy that mightmeet all these criteria is a promotional effort toincrease the proportion of females in the over-all buyer population. The interpretation of themarginal probabilities in Table 3 reveals thata promotional effort resulting in a 1% increasein the overall sample mean of females to 77%(Table 2) would increase the probability ofmembership in Segment IV by 17.61%. Table1 reveals that Segment IV preferred green bellpeppers to the exclusion of all other colors,was relatively insensitive to price, and repre-sented slightly more than a quarter of themarket share. Thus, a price increase for greenbell peppers could have a greater impact onrevenues if associated with promotions di-rected at increasing the proportion of femalebuyers. Whether this complex strategy wouldbe compatible with other operative product,pricing and promotional strategies should, ofcourse, be considered in practice.
Conclusions
The overall consumer sample used in thisstudy viewed color as far more important inthe purchase decision than retail price or vita-min C content. The aggregate of respondentsalso indicated a clear preference for green anda strong disinclination toward brown, withred, yellow, and orange intermediate betweenthese two. For the price range used in thisstudy, retail price was a secondary factor com-pared with color, while vitamin C content hada negligible effect on overall consumer prefer-ence.
If aggregate-level analysis rather than in-dividual-level analysis had been used exclu-sively, the above conclusions would have ex-hausted the information content of the data set.Instead, cluster analysis was used to identifysix distinct consumer segments in this market.The smallest of these showed a preference for
brown bell peppers, indicating a limited de-mand for this color even though it is practi-cally unknown in the marketplace. Two price-insensitive segments were identified, both withstrong preferences for green. Consumer per-ceptions toward vitamin C content variedwidely, with some segments favoring higherlevels and others favoring lower levels, whilerelative importance ranged from 1.4% to36.6%. Gender, household size, purchase fre-quency of green and yellow peppers, and useof raw peppers were the demographic andbehavioral variables that determined member-ship in most segments.
Examples of applications suggested that:1) differential price sensitivities could explainthe practice of pricing green peppers individu-ally while pricing those of other colors byweight; and 2) efforts to promote the highlevels of vitamin C would be most effective ifassociated with yellow and orange bell pep-pers.
That producers who supply products withhigh levels of consumer satisfaction have anadvantage in the market is well accepted.Conjoint analysis provides an efficient meansof determining which product attributes givethe highest satisfaction. Knowledge of thestructure of consumer preferences can alsohelp horticulturists develop new cultivars anddevise new field practices that bring to marketbell peppers with the highest degree of con-sumer desirability.
Literature Cited
Behe, B., R. Nelson, S. Barton, C. Hall, C.D. Safley,and S. Turner. 1999. Consumer preferences forgeranium flower color, leaf variegation, andprice. HortScience 34:740–742.
Bretton-Clark. 1990. Conjoint designer, version 3.Bretton-Clark, Morristown, N.J.
Bretton-Clark. 1992. Conjoint analyzer, version 3.Bretton-Clark, Morristown, N.J.
Cohen, J. and P. Cohen. 1983. Applied multipleregression, 2nd ed. Lawrence Erlbaum, Mahwah,N.J.
Gineo, W.M. 1990. A conjoint/logit analysis ofnursery stock purchases. Northeastern J. Agr.Res. Econ. Apr. 1990:49–58.
Green, P.E. and K. Helsen. 1988. Conjoint internalvalidity under alternative profile presentations.J. Consumer Res. 15:392–397.
Green, P.E. and Y. Wind. 1973. Multi attributedecisions in marketing: A measurement ap-proach. Dryden Press, Hinsdale, Ill.
Greene, W.H. 1995. LIMDEP, version 7.0: User’smanual. Econometric Software, Plainview,N.Y.
Hardy, M.A. 1993. Regression with dummy vari-ables. Univ. Paper Ser. on Quantitative Applica-tions in the Social Sciences, 07-093. Univ. ofCalifornia–San Diego, La Jolla.
Huang, C.L. and J. Fu. 1995. Conjoint analysis ofconsumer preferences and evaluations of a pro-cessed meat. J. Intl. Food and AgribusinessMktg. 7(1):35–53.
Kotler, P. and G. Armstrong. 1996. Principles ofmarketing, 7th ed. Prentice Hall, Upper SaddleRiver, N.J.
Manalo, A.B. 1990. Assessing the importance ofapple attributes: An agricultural application ofconjoint analysis. Northeastern J. Agr. ResourceEcon. Oct. 1990:118–124.
Table 3. Estimated marginal probabilities for the six clusters for bell pepper attributes.
Marginal probabilitiesVariable Prob[Y=I] Prob[Y=II] Prob[Y=III] Prob[Y=IV] Prob[Y=V] Prob[Y=VI]Intercept 0.1088** 0.1062 –0.1856*** 0.1494 –0.0492 –0.1297Age –0.0012 0.0011 –0.0005 –0.0022 0.0005 0.0022Income 0.0065* –0.0125* 0.0008 0.0137 0.0027 –0.0112Gender –0.0589*** –0.1128*** 0.0204*** 0.1761*** –0.0166** –0.0082Education –0.0098*** 0.0002 0.0000 0.0007 0.0038 0.0052Household size 0.0063* 0.0159 0.0186*** –0.0167** –0.0139*** –0.0103Peppers bought
in last 4 wkAny 0.0331 –0.0450 0.0604** –0.1186*** 0.1308** –0.0606Green –0.0630*** –0.1292*** –0.0211** 0.2001*** 0.0003 0.0129Yellow 0.0238*** 0.1408*** –0.0443*** –0.1839*** 0.0436*** 0.0199Red 0.1014*** –0.0169 0.0172 0.0842* –0.1574*** –0.0285Orange –0.6828 0.6538 –0.8801 0.6683 0.6066 –0.3658Wt –0.0061*** 0.0042 0.0025* –0.0035 0.0052* –0.0023Cooked 0.0119 0.0813** 0.0893*** –0.1413* –0.0940* 0.0527Raw 0.0346*** 0.1077*** –0.0357*** –0.0607*** –0.0351*** –0.0107
*, **, ***Significantly different from zero at the 0.10, 0.05, or 0.01 level, respectively.

Robertson, J.L. and L.H. Chatfield. 1982. Freshflower merchandising in loose bunches. Hort-Science 17:593–595.
Salunkhe, D.K. 1976. Storage, processing, and nu-tritional quality of fruits and vegetables. CRCPress, Cleveland, Ohio.
SAS Institute Inc. 1996. SAS user’s guide: Statis-tics, version 6.12. SAS Inst., Cary, N.C.
Shafer, B.S. and J.W. Kelly. 1986. The influence ofcultivar, price, and longevity on consumer pref-erences for potted chrysanthemums. HortScience21:1412–1413.
Simonne, E., R. Boozer, J. Little, J. Pitts, and M.Ruf. 1996. Colored pepper varieties responddifferently to bacterial leaf spot infection, p.11–14. In: Alabama. Agr. Expt. Sta. Prog. Rpt.130.
Simonne, A.H., E.H. Simonne, R.R. Eitenmiller,H.A. Mills, and N.R. Green. 1997a. Ascorbicacid and provitamin A contents in unusuallycolored bell peppers (Capsicum annuum L.) J.Food Comp. Anal. 10(4):299–311.
Simonne, E., J. Kemble, and R. Boozer. 1997.Varieties for the Alabama vegetable industry
and the southeast. Alabama. Agr. Expt. Sta. Bul.632.
Townsley-Brascamp, W. and N.E. Marr. 1995.Evaluation and analysis of consumer prefer-ences for outdoor ornamental plants. Acta Hort.391:199–206.
U.S. Dept. of Agriculture. 1997a. Fruit and veg-etable report. Natl Agr. Stat. Serv., Washington,D.C.
U.S. Dept. of Agriculture. 1997b. Market newsreports—Fruit and vegetable. Natl Agr. Stat.Serv., Washington, D.C.
Related Documents