CONSUMER PERCEPTION TOWARDS PRIVATE LABEL BRANDS OF FOUR KEY SUPERMARKETS IN KENYA BY MACHARIA, CATHERINE WANJIKU A RESEARCH PROJECT SUBMITTED IN PARTIAL FULFILLMENT OF THE REQUIREMENTS FOR THE AWARD OF A DEGREE OF MASTER OF BUSINESS ADMINISTRATION SCHOOL OF BUSINESS, UNIVERSITY OF NAIROBI NOVEMBER, 2015

Welcome message from author
This document is posted to help you gain knowledge. Please leave a comment to let me know what you think about it! Share it to your friends and learn new things together.
Transcript
CONSUMER PERCEPTION TOWARDS PRIVATE LABEL
BRANDS OF FOUR KEY SUPERMARKETS IN KENYA
BY
MACHARIA, CATHERINE WANJIKU
A RESEARCH PROJECT SUBMITTED IN PARTIAL
FULFILLMENT OF THE REQUIREMENTS FOR THE AWARD
OF A DEGREE OF MASTER OF BUSINESS ADMINISTRATION
SCHOOL OF BUSINESS, UNIVERSITY OF NAIROBI
NOVEMBER, 2015
i
DECLARATION
This research project is my original work and has not been presented for any award in
any other institution or university.
Signature……………………………. Date…………………………………..
Macharia, Catherine Wanjiku
This project has been submitted for examination with my approval as the University
supervisor.
Signature…………………………… Date…………………………………
Dr. Owino, Joseph
Supervisor

ii
ACKNOWLEDGEMENT
Above all, I give Glory to God Almighty for giving me the strength and ability to
work on this project. My special gratitude to my supervisor Dr Owino Joseph who was
always available for consultation and has guided me tirelessly to ensure that this
project attained professionalism and high academic standards. Special thanks to my
husband who has stood with me throughout this project and really assisted me at each
stage of the project. I would also like to acknowledge all my colleagues who stood by
me, encouraging me and availing their support whenever I needed it.

iii
DEDICATION
This project is dedicated to my loving husband, my children, my dad and my entire
family who always prayed and encouraged me to achieve my dreams. I particularly
and humbly appreciate the invaluable financial and non-financial support and sacrifice
that my husband offered me to ensure that I completed the project within the
stipulated timeframe.

iv
LIST OF TABLES
Table 4.1: Age of respondents……………………………………………….……21
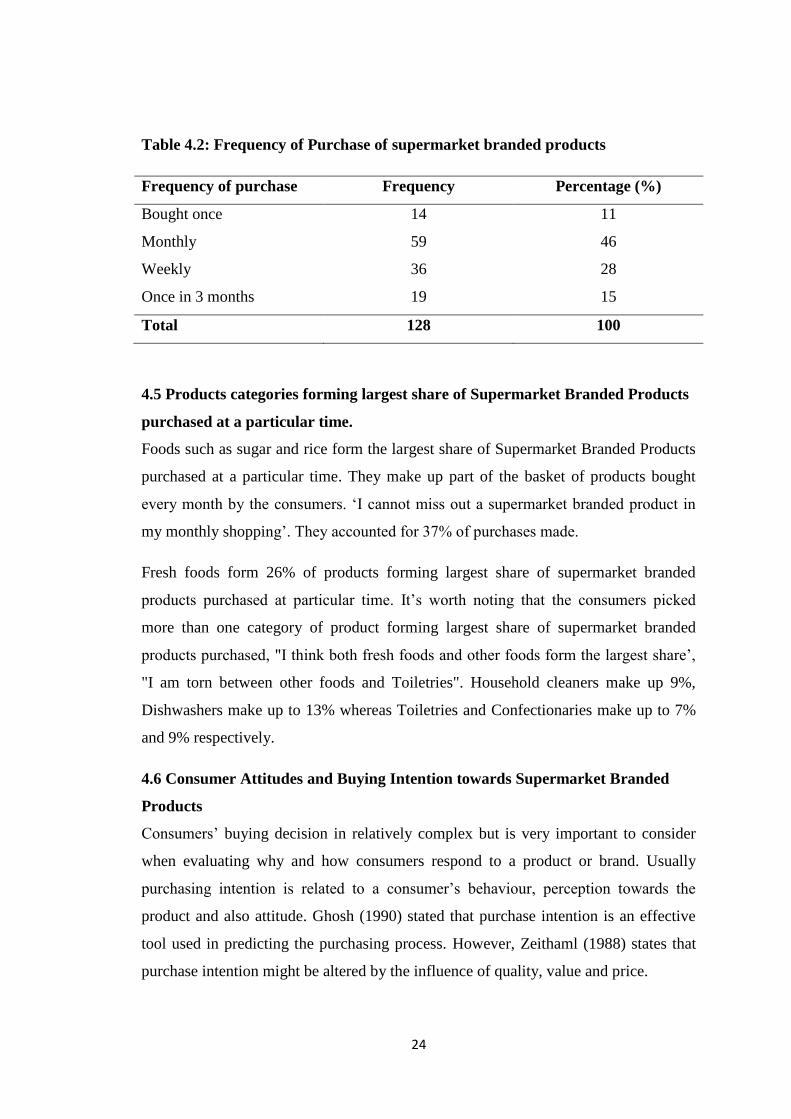
Table 4.2: Frequency of Purchase of supermarket branded products……….……24
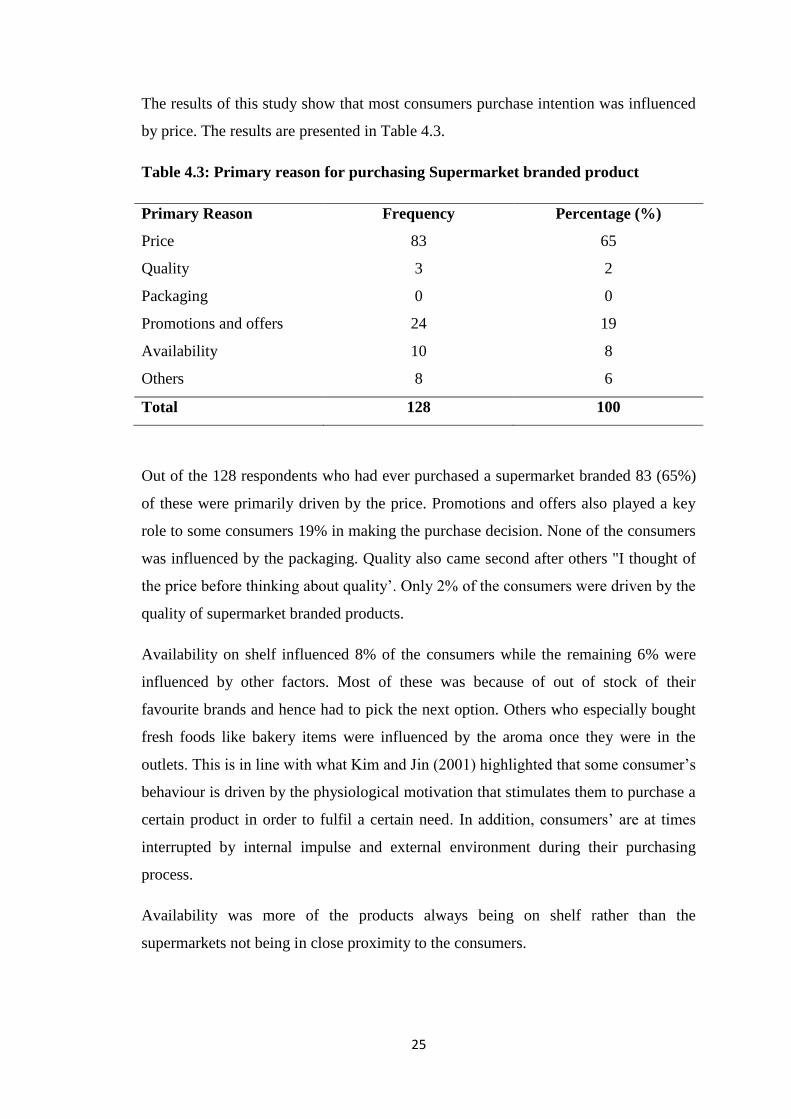
Table 4.3: Primary reason for purchasing Supermarket branded product…….….25
Table 4.4: General thoughts of Supermarket Branded Products………………….28
Table 4.5: Factors that influence preference for supermarket branded products…29

v
LIST OF FIGURES
Figure 4.1: Intention to purchase a supermarket branded product in the next one
month .………………………...…………...………………………..…..23
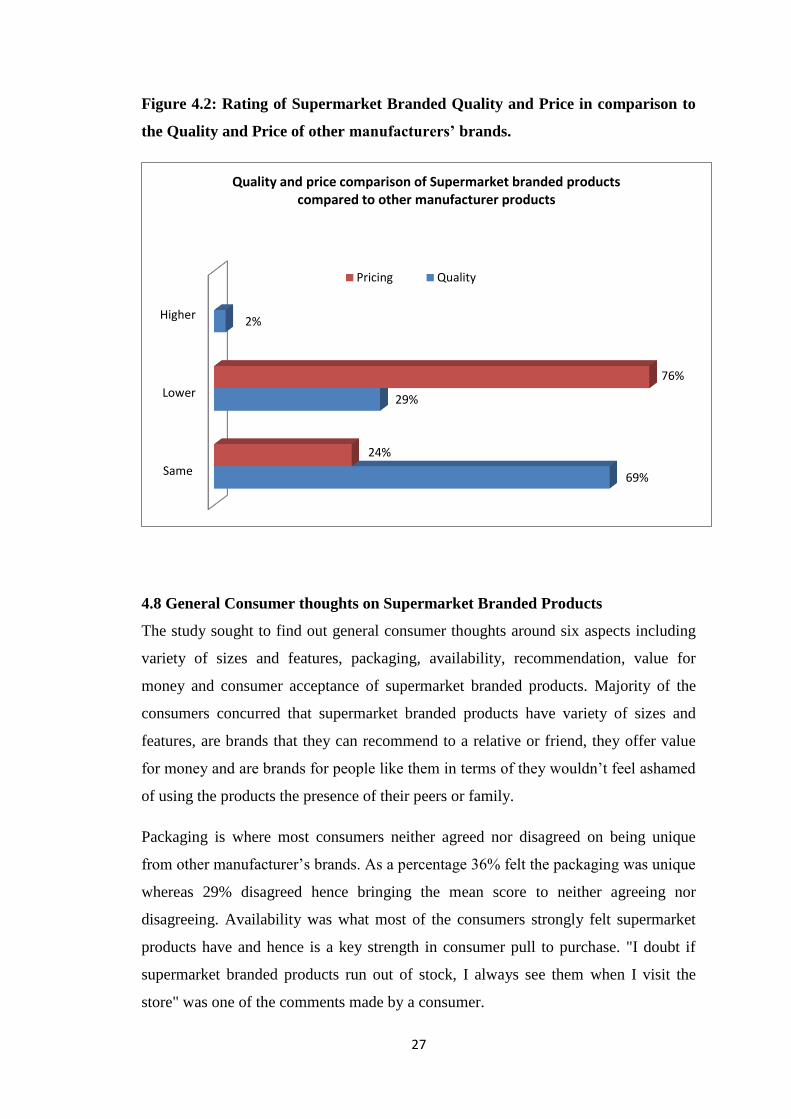
Figure 4.2: Rating of Supermarket Branded Quality and Price in comparison to the
quality and Price of other manufacturers‟ brands ……………………..27

vi
ABBREVIATIONS AND ACRONYMS
PLMA: Private Label Manufacturers Association
UK: United Kingdom
USA: United States of America
vii
TABLE OF CONTENTS
DECLARATION ....................................................................................................... i
ACKNOWLEDGEMENT........................................................................................ ii
DEDICATION ........................................................................................................ iii
LIST OF TABLES ................................................................................................... iv
LIST OF FIGURES .................................................................................................. v
ABBREVIATIONS AND ACRONYMS ................................................................ vi
ABSTRACT ............................................................................................................... x
CHAPTER ONE:INTRODUCTION ...................................................................... 1
1.1 Background of the Study ...................................................................................... 1
1.1.1 The concept of Perception ............................................................................... 1
1.1.2 The Concept of Private Label Brands .............................................................. 2
1.1.3 The Retail Industry .......................................................................................... 3
1.2 Research Problem ................................................................................................. 5
1.3 Research Objectives .............................................................................................. 7
1.4 Value of the study ................................................................................................. 7
CHAPTER TWO:LITERATURE REVIEW ......................................................... 9
2.1 Introduction ........................................................................................................... 9
2.2 Theoretical Foundation of the Study .................................................................... 9
2.2.1 Attribution Theory ........................................................................................... 9
2.2.2 Cue Utilization Theory .................................................................................. 10
2.3. Brand Awareness ............................................................................................... 11
2.3.1 Attaining Brand Awareness for Private Label Brands ................................... 12
2.4 Purchase Triggers for Private Label Brands ....................................................... 13
2.5 Influence of Private Label Brands on Consumers Switching Behaviour ........... 16
viii
CHAPTER THREE:RESEARCH METHODOLOGY ...................................... 19
3.1 Introduction ......................................................................................................... 19
3.2 Research Design ................................................................................................. 19
3.3 Population of the study ....................................................................................... 19
3.4 Sample Design .................................................................................................... 20
3.5 Data Collection ................................................................................................... 20
3.6 Data Analysis ...................................................................................................... 20
CHAPTER FOUR:DATA ANALYSIS, RESULSTS AND DISCUSSION ....... 21
4.1 Introduction ......................................................................................................... 21
4.2 Respondents Profiles........................................................................................... 21
4.3 Awareness of Private Label Brands .................................................................... 22
4.4 Purchase of Supermarket Branded Products ....................................................... 22
4.5 Products categories forming largest share of Supermarket Branded Products
purchased at a particular time. ............................................................................ 24
4.6 Consumer Attitudes and Buying Intention towards Supermarket Branded
products .............................................................................................................. 24
4.7 Rating of Supermarket Branded Products quality and price in comparison to
other manufacturers brands. ................................................................................ 26
4.8 General Consumer thoughts on Supermarket Branded Products ........................ 27
4.9 Consumer switching behaviour .......................................................................... 28
4.10 Discussion ......................................................................................................... 29
CHAPTER FIVE: SUMMARY, CONCLUSION AND RECOMMENDATIONS
………………………………………………………………………………...………30
5.1 Introduction ......................................................................................................... 30
5.2 Summary of Findings.......................................................................................... 30
5.2 Conclusion .......................................................................................................... 31
5.3 Limitations and gaps for future research ............................................................ 32

ix
5.4 Recommendations ............................................................................................... 32
REFERENCES........................................................................................................ 34
APPENDICES ......................................................................................................... 40
Appendix I: Questionnaire ........................................................................................ 40
Appendix II: List of Supermarkets where data was collected .................................. 44
x
ABSTRACT
Supermarket owned products are gaining popularity in Kenya and giving local
manufactures of well-known brands a run for their money. With this new trend,
manufacturers of other brands are not only competing amongst themselves but are
now faced with a bigger challenge of competing with their distributing partners.
However, private label branding is not a new idea in the world, but has been a
common business practice in the United Kingdom and United States of America. This
introduction of private label brands by Nakumatt, Tuskys, Naivas and other chains has
seen some manufacturers of traditional brands crying foul since they have been by-
passed in the conventional production chain. In addition, store branded products are
taking over shelves and key display positions which is deemed by a few as unfair
competition. However, this could be a strategy by the retail chains to increase
consumer loyalty in their outlets even as competition since completion among the
retailers is getting stiffer by day. In January 2013, Nakumatt, the biggest supermarket
chain in Kenya, introduced its private label brand; Blue Label. Each of their products
has a distinctive blue band implying the supermarket‟s commitment to delivery of
high quality products. Other key retail chains including Tuskys, Naivas, Uchumi and
Ukwala have also adopted this global trend especially on edibles including bread,
milk, rice and sugar. The primary aim of the study was to determine consumer
perception towards private label brands of the four key supermarkets in Kenya
including Nakumatt, Tuskys, Naivas and Uchumi. The researcher did a critical
analysis on the variables within consumer perception of private label brands such as
brand awareness, perceived price and quality, consumers switching behaviour and the
impact of pricing on consumers‟ choice for private label brands. From the findings of
this study, the researcher was able to ascertain that consumers are aware of private
label brands and the key purchase driver is price. Perception towards private label
quality, availability, display on shelf and pricing was positive as most consumers still
had an intention of purchasing the brands. The study also gives suggestions for further
research on the future of these private label brands.
1
CHAPTER ONE:INTRODUCTION
1.1 Background of the Study
Supermarket-owned labels are gaining popularity in Kenya and giving local
manufacturers of well-known brands a run for their money. With this shift,
manufacturers of other brands not only have to compete among each other but now
have to compete with retail chains. However, private label branding is not a new idea.
It has been a business practice in some parts of the world such as UK and USA. The
emergence of private label brands can be traced as far back as 1882 when Sainsbury,
the third largest retail chain in UK, started selling own label products in its stores.
Sainsbury‟s aim of introducing private label products was to find a way of providing
more affordable goods in comparison to other retailers without compromising on
quality.
Walmart, an American based corporation and popular store started selling own label
brands in 1991 through the launch of Sam‟s Choice, one of their flagship brands.
Locally, private label branding is still in its infant stages with most of the private label
brands being foodstuffs including sugar, bread and rice. Nakumatt, Kenya‟s biggest
chain of supermarkets introduced their private label brand in January 2013,
(www.nakumatt.net). Since then the outlet has progressively introduced Nakumatt
Blue Label products geared towards providing shoppers with variety and affordable
products.
This introduction of private label brands by Nakumatt, Tuskys, Naivas and other
chains has seen some manufacturers of traditional brands crying foul since they have
been by-passed in the conventional production chain. In addition, store branded
products are taking over shelves and key display positions which is deemed by a few
as unfair competition.
1.1.1 The concept of Perception
Consumers‟ perception on private label brands is a critical issue because it has direct
influence on the brands‟ sales. Porter and Claycomb (1997) argue that consumer
purchase intention and behaviour towards a brand is chiefly driven by the perception
consumers have towards the brand. This is regardless of whether they are
misconceptions of actual events or not. Rai (2008) defines perception as consumer‟s
2
belief concerning a product or a service received or experienced. Perception is also
defined as a process in which people select, sort and interpret outside stimuli into a
coherent picture of the world around them (Schiffmann and Kanuk, 2009). Two
people can be exposed to the same kind of stimuli in similar situations, but end up
with completely different perceptions later on. This is because the way individuals
select, sort and interpret stimuli is dependent on their needs, values, expectations and
so forth all of which are unique to each individual (Schiffmann and Kanuk, 2009).
The process of perception begins with exposure to a stimulus, followed by attention
and then sensation. Exposure occurs when a consumer comes into contact with
environmental stimuli either intentionally or accidentally. It‟s important to note that
not all stimuli that consumers are exposed to get noticed. This means that a consumer
can be exposed to a stimulus and fail to notice it hence affecting the next step of
attention. Attention is the allocation of mental capacity to a stimulus. After being
exposed to a stimulus, a consumer can for some time pay attention to a specific aspect
of the stimulus. Attention can be spontaneous, planned or involuntary. Sensation, on
the other hand, refers to the responses of our sensory receptors comprising of the ears,
eyes, nose, mouth and touch to stimuli and transmission of the same to the brain
(Hanna & Wozniak, 2013). Although sensory receptors play a key role in consumer‟s
perception of an event, one‟s interpretation of a sensation may lead to a false
perception. This is because perception is highly subjective and therefore easily
distorted.
It is therefore vital for marketers to understand consumers‟ perceptions because it
often determines the success or failure of brands in the marketplace. With this
understanding, marketers are more careful on the ads they air, product packaging, size,
colour, packaging design and point of sale materials due to the first impression to
consumer‟s eyes and ears. For consumers who are not brand loyal, a change in
packaging colour of another brand can win the consumer‟s attention and consequently
their consideration for the other brand (New Ideas MSI, 2003).
1.1.2 The Concept of Private Label Brands
Consumer loyalty is not only important for brands but it is also vital for the growth
and success of retail stores. Presently, competition among retailers is getting stiffer
and each of them is working on new strategies to ensure the store‟s sustainability and
3
shopper loyalty. One such marketing strategy is the introduction of private label
brands by the retailers. Kotler and Keller (2012) define private label brands as brands
produced by retailers and wholesalers rather than a manufacturer. Private label brands
are also referred to as store brands, retailer brands or own label brands. According to
Private Label Manufacturers Association (PLMA, 1991) private labels are products
owned by retail stores. These products encompass all merchandise sold under a
retailer‟s brand. The private label brand name can be similar to the retail store‟s name
or different to suit the store‟s needs (www.plma.com)
Introduction of private labels can be attributed to two major factors; consumer pull
and manufacturers push as Datamonitor‟s industry report concluded 4 years ago
(2011). The report states that private labels penetration is outperforming categories
penetration rate due to shoppers turning to store brands and embracing them. Key to
note is, private label brands attract the attention of price sensitive consumers and in
addition they give retailers a competitive edge to negotiate for better trade margins
and offers from manufacturers of other brands. These brands allow retailers to
increase a category‟s sales because they are often competitively priced than other
brands and increase variety offered to consumers.
According to Verhoef, Nijssen, and Sloot (2002) the aim of introducing private label
brands is to increase the retailer‟s presence and profits. However, the growth of these
brands is threated by economies of scale because this is often a requirement for
economically viable production levels (Rabobank, 2011). Nonetheless, private label
market share is predicted to double by 2025 based on consolidation in food retail and
the industry‟s growth (Rabobank, 2011).
1.1.3 The Retail Industry
The entry of private label products is still at its infancy stage in the Kenyan retail
scene and is mostly targeted towards food products. But according to Consumer
Insight (2012) private label brands will upset manufacturer brands in future, propelled
by in-store advertising and promotions which are deemed highly effective. According
Nielsen (2014), Europe is the private label global leader. This means that private label
brands are most developed in Europe as they account for $1 of every $3 spent in
consumer packaged goods. This leadership is largely attributed by Switzerland where
private label share is at 45%. This translates to the highest market share in the region
4
and globally. UK and Spain private labels follow closely at 41% share each. In the
USA, private label share is at 17.5% which is just above the average global share of
16.5%. In the Pacific, specifically Australia and New Zealand the private label share is
at 21% and 13% respectively. The report highlights a significant shift of perceptions
towards private label brands from 2009 to 2014 due to the evolution of private labels
reputation from cheap brands that compromise on quality to good quality and value
for money brands.
According to Nielsen (2014) private label development is still in its early stages in
Africa with the exception of South Africa where private label‟s share is about 18%.
But, the fact that Africa‟s population is a lot younger than the rest of the world is an
important point for retailers to consider. This young population has significantly
different tastes, preferences and aspirations than the older generation and hence likely
to demand a different set of products including private label brands. Private label
brands seem to be doing well in Kenya based on the fact that more and more retail
chains are introducing their own labels from rice to bread, milk and other items.
KPMG (2015) notes that Kenya is Africa‟s second biggest formalized retail economy
after South Africa. The survey was carried out in seven sub-Saharan Africa economies
and showed that 30 per cent of Kenyans shop in formal retail outlets. Kenyan
consumers have increasingly been drawn to the large range of products offered by
hypermarkets and supermarkets mainly because of the relatively lower prices of these
products compared to informal shops. The report further adds that the formal retail
sector in Kenya has grown exponentially in the past three years. Euromonitor report
(2015) had forecasted hypermarkets to be the fastest growing segment in the retail at
about 12 per cent annually from 2010 to 2015. However, the report forecasted a
slower growth 2.2% of the entire Kenyan retail sales during the same period.
Euromonitor (2015) estimates that the Kenyan wholesale and retail trade will maintain
an average of 10.2% contribution to GDP. The report further states that the Kenyan
retail industry remains vibrant with key supermarket chains expanding within the
country and beyond Kenya‟s boundaries. For instance, Nakumatt has opened quite a
number of stores in proximity to residential areas and also in Rwanda, Uganda and
Tanzania, whereas Uchumi and Tuskys have presence in Uganda. Construction of new
shopping malls and expansion of the four leading supermarkets has increased despite
5
setbacks such as the destruction of Nakumatt Westgate mall by terrorist in September
2013. And it is worth to note that the Westgate Mall was re-opened in July 2015 and
still attracted quite a number of shoppers.
In January 2013, Nakumatt, the biggest supermarket chain in Kenya, introduced its
private label brand; Blue Label. Each of their products has a distinctive blue band
implying the supermarket‟s commitment to delivery of high quality products
(www.Nakumatt.net). Other key retail chains including Tuskys, Naivas, Uchumi and
Ukwala have also adopted this global trend especially on edibles including bread,
milk, rice and sugar.
This entry into private label has seen some manufacturers of traditional brands crying
foul since they have been by-passed in the conventional production chain. In addition,
store branded products are taking over shelves and key display positions which is
deemed by a few as unfair competition.
1.2 Research Problem
A study by Deloitte (2010) on consumer perceptions towards private label brands,
notes that majority of consumers are increasingly sensing a diminishing discrepancy
between the quality of manufacturer brands and private label brands. This is attributed
to the retailers increased focus on own brands to garner consumer loyalty. According
to this report, store brands no longer suffer the stigma of inferior quality among
consumers. While learning‟s about private label success in one market can help in
another, there is no clear cut approach for all markets. Private label growth requires
tailored approach for each market since consumer perceptions differ across the global
market.
Furthermore, Nielsen (2014) study on the state of private label around the world notes
that perceptions towards private label brands are favourable. However, value shares
are higher in developed countries including Europe, North America and Australia. The
survey polled more than 30,000 consumers in 60 developed and developing countries
around the world. However, it‟s worth noting that Kenya was not part of the poll. The
study sought to understand consumer perceptions towards private labels‟ quality,
assortment and packaging.
6
Other scholars have attempted to tackle the topic of consumer perception towards
private label brands in different countries and in Kenya. For instance, Nyengerai
(2013) studied the determinants of perception towards private label brands in
Zimbabwe with focus on the role of product category. The study concluded that
consumers have a positive perception for private label brand products that require
further processing and negative perception for those that do not require additional
processing. Gala and Patil (2013) conducted a study in India on consumer attitude
towards private labels in comparison to other manufacturer brands and concluded that
many consumers view private label as low quality products that are bought by low
income group shoppers who aspire for better lifestyle but cannot afford or are not
willing to spend for the same.
This study shows that in consumer perceptions towards private label brands differ
from one country to another. Such a study would be very interesting to carry out in
Kenya to find out how the Kenyan shopper and consumers perceives private labels in
comparison to other manufacturer brands. Additionally, the study would establish how
willing Kenyan‟s are to switch from manufacturer brands to store brands. Bekene
(2009) carried out an exploratory study on consumer perceptions of private label
brands within the retail grocery sector in South Africa. He concluded that consumers
are hesitant to embrace private label brands fully because they are still sceptical of
their quality. Income was found to be the key determinant of purchase of private label
brands versus other manufacturer brands.
Muriithi (2014) assessed the transferability of brand equity to the Blue Label products.
He was seeking to determine consumer perceptions on the quality of Blue Label
products in relation to their pricing. Secondly was assessment of the effect of the
store‟s image and brand awareness of the Blue Label products. The findings of the
study was that consumer perception on blue label products in relation to pricing is
slowly changing although there is still a lingering perception that these products are of
inferior quality.
Walter (2012) established the factors affecting the success of private label bread baked
by large supermarkets in Nairobi Kenya. The primary objective of the study was to
find out how factors such as perceived value, quality, price and perceived risk impact
the purchase intention of private label bread brands. The findings of the study showed
7
that price, quality and value play a key role in the success of private label brands in
large supermarkets.
Although several attempts have been made towards investigating the consumer
perception of private label brands, there are no studies known to the researcher that
have investigated the same in the Kenyan context. Most of the studies including that
done by Gala and Patil (2013); Nyengerai (2013) and Bekene (2009) and many others
have been done outside the East African Region. Considering the consumers differs
across nations there is a probability of getting different findings if such a research was
carried out in Kenya. The current study seeks to address this research gap by assessing
awareness of private label brands in Kenya, establishing the purchase triggers and
finally establishing the influence of private label brands on consumer switching
behaviour. The study will help draw conclusions on this question: what are the
consumer perceptions toward private label brands of key supermarkets in Kenya?
1.3 Research Objectives
The specific objectives of the study were:
i. To find out consumer awareness of the private label brands in Kenya
ii. To establish purchase triggers for private label brands.
iii. To establish the influence of private label brands on consumers switching
behaviour from manufacturers‟ brands.
1.4 Value of the study
The findings from this study will help the policy makers on addressing certain issues
arising with the introduction of private label brands. These include retail competition –
is introducing private labels fair competition. There is also the issue of private label
brands occupying large volumes of the supermarket shelves regardless of their market
share.
Thus this study could help retailers to design marketing strategies that could boost
their sales revenue share through the private label brands by maximizing on the
purchase triggers of private label brands. In addition, it will contribute additional
knowledge on consumer perceptions towards private label brands which can also be

8
used by other players in the FMCG sector in Kenya on ways of addressing this new
phenomenon of private label brands.
It will assist marketers of manufacturer brands to design strategies that address the key
issues causing consumers to switch from their brands to private label brands. This
study will also act as a reference material where future researchers on the subject or
studying related topics can find information from the findings and conclusions of the
report to build into their reports. The study also highlights the research gap in this
subject that will require further research to be carried out in future.
9
CHAPTER TWO:LITERATURE REVIEW
2.1 Introduction
This chapter covers literature and theories related to the topic of study including brand
awareness, purchase intention and brand switching.
2.2 Theoretical Foundation of the Study
To get a better understanding of consumer‟s choice of brands it is imperative to
understand the concept of consumer behaviour and related theories. The next section
will highlight some theories related to the topic of study.
2.2.1 Attribution Theory
Attribution theory (Heider, 1958) addresses the matter of how people deduce, from
limited available evidence, unobservable attributes or dispositions about objects and
organisms in their surroundings (Burnkrant, 1975, p. 465). It also explains how people
assign causality to events and form attitudes based on their own or other people‟s
behaviour (Schiffman, 2008; Wang, 2008). Consumers form attribution towards things
in order to judge products and service. This is because they want to find out why a
product or service meets or does not meet their expectations (Schiffman, 2008).This
theory can be used for explaining consumer behaviour in many situations. Among
other behaviours, the attribution theory can be used to explain how consumers make
purchasing decisions based on inadequate involvement, experience and information of
the products.
That means, when a consumer has no previous knowledge about a product, for
instance from an earlier purchase, the consumer uses other cues to evaluate the
product. The cues used in such a scenario are those that the purchaser has learnt to use
for creating inferences about a product or a brand (Vahie & Paswan, 2006). According
to Vahie and Paswan (2006) the consumer can use product assortment or the products
stocked by the store as a cue to make inferences about the product. Another cue that a
consumer could use is price and additionally, the retail store, such as Nakumatt which
owns the private label. According to Burnkrant (1975), the more consistent the cues
that a consumer uses to make inferences of a certain product the more effective
attribution become.
10
2.2.2 Cue Utilization Theory
Consumers are regularly faced with uncertainty when judging the quality of a brand
the minute they are determining what to buy and in what quantity. It may,
nevertheless, be difficult for consumers to assess the various quality-aspects in
relation to each other and in relation to requirements rooted in the intended use of the
products. According to „cue utilization theory‟ (Olson & Jacoby, 1972; Richardson et
al., 1994) consumers may try to overcome their uncertainty and the lack of
information by selecting one or more cues/stimuli as a basis for their assessment of the
quality of the product.
This theory states that in order to explain a product‟s quality consumers evaluate
products by their intrinsic and extrinsic cues (Collins-Dodd & Lindley, 2003).
Intrinsic cues include a product‟s texture, colour and style. These are tactile factors
that form part of the physical product and cannot be changed without altering the
product itself. Intrinsic factors are part of the product.
Intrinsic factors are connected to physical product characteristics which include
perceived quality, perceived risk and value. Risk has to do with uncertainty or a
mistake where the former arises due to product appearance. Consumers think that
purchasing low priced, simple packaged and unpopular brands poses high risk because
the quality of such products is questionable (Sudhir and Talukdar, 2004). When
consumers are not so familiar with private label brands and do not understand them
they are afraid of making wrong decisions by purchasing them (Batra and Sinha,
2000). On such basis, other manufacturer brands expose the consumer to lower risk
because they are in general more expensive than private label brands hence perceived
to be of higher quality than private label brands.
It is important to take into account how consumers perceive risk when studying
consumer perception towards private label brands. Understandably there is a certain
risk attached to the purchase of private label brands that must be taken into concern
(Richardson et al., 1996; Batra & Sinah, 2000; Gómez & Fernández, 2009;
DelVecchio, 2001; Mieres et al., 2006). Perceived risk can be defined as a consumers
doubt on the result of a decision. According to Aaker D. (2000) and (Chaudhuri, 2002)
consumers reduce their risk by purchasing familiar brands. Consequently, those
consumers who think that private label brands are of lesser quality reduce their risk by
11
purchasing and consuming more expensive products (Yusuf, Fatih, & Hayrettin,
2013). But risk is not just based on quality; rather consumers are exposed to various
types of risk when buying and consuming products.
On the other hand, extrinsic cues stem from the intangible aspect of the product
including the brand name, perceived price, store name, packaging and advertisement.
Extrinsic is defined as not an integral part of the thing or not contain in something
(Free Dictionary, 2011). Extrinsic cues have a greater effect in governing consumers
purchase decisions especially the price, brand name and packaging (Bäckman, 2005;
Dawar & Parker, 1994, Allison & Uhl 1964 in Vahie & Paswan, 2006; Richardson et
al. 1996). According to a research done by Richardson (1997) extrinsic cues play a
vital part in influencing consumers‟ purchase intention than intrinsic cues.
Price is a central cue in the market place and is present each time consumers are
confronted with a purchase decision. Price can be divided into the perceived price and
the objective price. The perceived price is an individual‟s belief on the price in
relation to the product‟s quality. Objective price is the actual price of the product
(Donald, Lichtenstein & Scot, 1989). For most consumers, the perceived price is
different from the objective price. For instance if a litre of milk costs Kshs 53, some
consumers will notice the exact price of Kshs 53 (Objective price) while others will
only recognize the price as cheap or expensive (perceived price) (Zeithaml, 1988).
Price affects consumer behaviour both positively and negatively. Positive effect in the
sense that a higher price signals high quality; negative by the fact that a consumer is
spending money (Bao et al., 2011). Price conscious shoppers are willing to give up
quality and other product attributes in order to pay a lower price.
2.3. Brand Awareness
Brand awareness is defined as the consumers‟ ability to recognize and recall a brand
in different situations (Aaker, 1996). It is also described as the process from where a
brand has become „top of mind‟ meaning the consumers have put the brand on a
higher rank (Aaker, 1991). Brand awareness comprises of brand recognition and brand
recall. Brand recall is when a consumer sees a product class or category he/she
remembers a brand name. For instance, if a consumer is going to buy bread and he
recalls Supa Loaf from memory. On the other hand, brand recognition is the
consumer‟s ability to identify a brand when they are exposed to or given a brand cue.
12
Hoeffler & Keller (2002) point out that brand awareness can be distinguished by width
and depth. Width assumes when a consumer purchases a product, a brand name comes
to mind at once. However, depth is in what way a consumers recalls or identifies a
brand easily. If a brand has both depth and width consumers think of that brand
whenever they want to buy from that product category or class. This means the
product has high brand awareness. According to Davis, Golicic and Marquardt (2008),
a brand name is the most important element of brand awareness.
Brand awareness has to do with communication and is dependent on both the situation
and the achieved level of awareness from being unaware of the brand to having top of
mind awareness. According to Aaker (1991, p 62) there are three levels of brand
awareness. Brand recognition is the first level of brand awareness. It is when
consumers is able to recognize a certain brand among others. The second stage of
awareness is brand recall which is unaided and is vital for regularly purchased
products such as cereals and detergents. Finally there is top of mind awareness. A
brand has „top of mind‟ awareness if it‟s the first brand that a consumer thinks of
within a given product category (Aaker, 1991). The higher the level of awareness the
better because consumers feel that if a brand is well known then it is of high quality.
However, Melin (1999) says that what is even better is not that a brand is well known,
it is what the brand is known for.
According to a recent study done by Muriithi (2014) only 60% of the respondents
were aware of Nakumatt‟s Blue Label brand. Some of these respondents indicated that
they learnt of the brand by visiting the store while others was by seeing them either in
the office, at home or in other occasions including events and parties.
2.3.1 Attaining Brand Awareness for Private Label Brands
Brand awareness is a very important factor for attaining a brand advantage although it
cannot sell a product especially if the product is new (Aaker, 1991). It is therefore
vital for a new product to increase the identity of the brand name and the link between
certain characteristics of an item to the brand. Aaker (1991) has highlighted some of
the ways to achieve brand awareness which include being different and memorable.
This is important because nowadays many products seem alike and have related
communication. By being different, a product differentiates itself from other products
in the same category hence eases brand recall.
13
Secondly, is to involve a slogan or jingle. This gives a strong link with a brand as it
involves a visual feature of the brand making it a powerful way of attaining
awareness. Thirdly is exposing a brand symbol. The advantage of having a known
symbol is that it is easy to memorize and recall a graphical illustration such as a logo
that is connected to the brand. Publicity is the other way to increase brand awareness
because it can be customized to the addresses. Other ways to increase brand awareness
include event sponsorships and brand extension (Aaker, 1991).
Muriithi (2014) notes that although most consumers got to know about Nakumatt Blue
Label through store visits quite a number attained knowledge on the brand from
Nakumatt‟ s social sites and billboards. One of the respondents actually stated to have
known about the brand though Nakumatt‟ s Facebook and twitter account when they
were offering 50% discount on all their products in celebration of 50 years of
independence.
2.4 Purchase Triggers for Private Label Brands
Brand awareness plays a key role on consumer‟s purchase intention because
consumers tend to buy familiar and well known products (Keller, 1993; Macdonald &
Sharp, 2000). Brand awareness helps a consumer recognize a brand from a product
class and make a purchase decision (Percy & Rossiter, 1992). Besides, Aaker and
Keller (1990) stated that a brand with high awareness and good image can encourage
brand loyalty among consumers, and the higher the brand awareness is, the higher
brand trust and consumer purchase intention.
Jin and Yong (2005) note that private label brands success is dependent on several
factors such as the country‟s retail structure, advertising rate of manufacturer‟s brands,
level of retailer concentration, economies of scale and store management.. Baltas
(1997) records other factors that trigger consumers towards purchasing of private label
brands. These include personality traits, past behaviour, socio-economic factors, and
demographic variables. However, consumer perceptions, attitudes and behavioural
variables are more effective in influencing purchase intention of private label brands
(Baltas, 1997). Richardson et al., (1996) identified perceived quality, perceived value
for money, perceived risk, brand familiarity, extrinsic cues and level of income as the
primary factors influencing purchase of private label brands.
14
According to Lee (2004) private label market share growth is largely attributed to
retail chains extension of product offering from just basic products to more
sophisticated ones. Present day retailers are more professional in managing their store
brands. These retailers are investing on attractive product packaging, improving in
product quality and expanding their distribution systems over and above offering
consumer centric sales promotion (Sullivan, 2005).
Besides this, research has brought out other reasons behind the growth of market share
of private label brands. First is the low price of private label brands compared to other
manufacturer brands. According to Grewal and Levy (2009) top retailers set the price
of store brands 10-15 per cent lower than the price charged by other manufacturer
brands. Retailers use their brands as negotiating tools with the manufacturers so they
get more promotional items, better prices and quick deliveries (Chintagunta, Bonfrer
& Song, 2002). Mills (1995) also concurred with this view in his report by noting that
private label brands empower retailers in getting superior deals in form of lower
wholesale prices from manufacturers on other manufacturer brands.
Secondly is the current positioning of own store brands. The modern day retailers are
not just relying on other manufacturer brands to attract consumers and shoppers to
their stores (Roach, 1995). They are diversifying and extending their product offerings
to match and supersede consumer expectations. This has in turn enabled them to
compete more effectively in both existing and new product categories that have been
conventionally dominated by other manufacturer brands.
Private label brands are no longer the low-priced, low-quality, value for money items,
rather one will find premium and luxurious own store brands. The top retailers have
moved from competing with the other manufacturer brands on the basis of quality to
competing on the level of „value for money‟ (Halstead & Ward, 1995). By competing
on this orientation, retailers are aiming at shifting the mind of consumers from the
notion that private label brands are low price goods of poor quality that provide
savings by purchasing them. According to Dhar and Hoch (1997) quality- oriented
strategies are more sustainable than value oriented strategies hence better to ensure the
long run success of private label brands.
Moreover, private label brands have higher gross margin opportunities than
manufacturers‟ brands (Lewison, 1994; Raju, Sethruaman &Dhar, 1995). This
15
opportunity arises from the low marketing costs incurred by retailers (Ailawadi,
Neslin & Gedenk, 2001; Mason, Mayer & Ezell, 1994). According to Hoch and
Banerjee (1993) retailers frequently advertise manufacturers‟ brands in order to attract
shoppers to their stores, and then they sell private label brands which are typically
lower priced than other manufacturer brands to the price-sensitive consumers.
On the contrary, there are some research studies that reveal different findings from the
above perceptions of private label brands. According to Shapiro (1993) previous
studies carried on consumer‟s attitude and perceptions towards private label brands
showed that these brands are rated below the other manufacturer brands on various
factors including quality, appearance, price, packaging, promotions and so forth. On
the basis of price, Private Label Manufactures Association revealed that consumers
prefer private labels because they are lower priced than other manufacturer brands.
Roth (1995) highlights that consumers income pattern is a key aspect relating to
human consumption. If a price conscious consumer‟s income is limited, they will buy
products just to satisfy the most basic functional needs rather than meet the hedonic
needs. Other studies have also shown that the lower the income of a consumer the
higher their price consciousness levels.
In addition, the most price conscious consumers are among those consumers who do
not believe that price and quality are associated (Blois, 2000). These price-conscious
consumers commonly lack knowledge on the different perceived risks involved. They
additionally are less brand loyal, are more attracted to promotional offers, are keen on
saving money and they care less about product quality. On the other hand, consumes
with higher incomes are less price conscious and are less likely to buy private label
brands. The other way to look at it is that private label brands are meant for price
sensitive and budget conscious consumers who seek ways to reduce expenditure
during difficult economic times. However, once the economy picks up, these
consumers go back to other manufacturer brands.
Faria (1997) notes that there is a direct link between price and quality, and they form
the most important features for the purchase of any product. Hoch and Banerji (1993)
and Sethuraman (1992) further add that quality is a major determinant in shopper
purchasing decisions apart from price. Holt, Quelch and Taylor (2003) also note that
quality is the most important factor that drives consumers towards buying and using
16
other manufacturer brands. Consumers make judgments on quality based on the price
rather than the products physical attributes.
Consumers have a common perception that low priced products are of relatively low
quality because they are formulated with poor ingredients and hence lack the
necessary level of quality (Batra & Sinha, 2000). A study conducted by Rubel (2005)
concluded that consumers purchase private label on the basis of both price and quality.
However, if private labels were to offer the same quality as other manufacturer brands
then price would be used as the purchasing parameter at that moment. According to
Steenkamp, Batra & Alden (2003), the quality of private label brands is generally
inferior to other manufacturer brands although it‟s worth noting that some private
label brands quality is at par or above manufacturers‟ brands.
Promotional strategies of private label brands have also affected their off take and
sales. However, retailers do not do large scale advertisements of their brands due to
tight marketing budgets. Instead, they use other sales promotion tactics. On the other
hand, other manufacturer‟s brands implement different promotional strategies which
yield more sales than store brands (Allenby & Rossi, 1991; Bronnenberg & Wathieu,
1996). Manufacturers‟ attract consumers through numerous advertising and sales
promotions.
Other factors include perceived risk and positioning. According to Narasimhan and
Wilcox (1998) consumers prefer other manufacturer brands to consumers‟ brands
when the level of perceived risk in buying these products is high. Furthermore,
products that expose consumers to social ridicule have a high risk even when they are
of low monetary value. On positioning, Chernatony and McDonald (1992) noted that
some own store brands are imitations of other manufacturer brands. This propensity to
introduce imitated products does not lead to clear positioning hence the importance of
retailers identifying a particular and relevant positioning strategy (Omar, 1999).
2.5 Influence of Private Label Brands on Consumers Switching Behaviour
There are many drivers for brands switching such as variety seeking and
dissatisfaction with the current brand (Bawa, 1990; Newman & Werbel, 1973).
Considerable evidence put forward that, even a consumer was satisfied with a
previous choice, he/she would, under certain circumstances, switch to another brand
(Mazursky, LaBarbera & Aiello, 1987).
17
According to McAlister (1982) consumers switch brands for two reasons. One, they
switch brands when seeking information and in order to learn about a product‟s
offering. Secondly, consumers determine their preferred brands yet they still switch to
other brands in order to satisfy their need for variety or to remind themselves of
brands they have used in the past (Keon, 1980).
Trijp, Hoyer, and Inman (1996) concur with the above by highlighting that one major
reason why consumers switch brands is variety seeking and the intrinsic motive to try
out something different. Consumers often engage in such kind of behaviour out of
boredom (Faison, 1977) or satiation with the product‟s attributes (McAlister, 1982;
Givon, 1984). After some time of repetitively consuming a particular product, the
consumer reaches a point where he/she decides to try something different just for the
sake of variety.
Interestingly, younger consumers seem to have a more favourable view towards
private label brands than older consumers (Veloutsou et al., 2004). Moschis (2003)
supports this sentiment by suggesting that older consumers are more brands loyal and
are unlikely to try brands with which they are less familiar. On the other hand,
younger consumers are more willing to try new or unfamiliar products and brands.
One of the key ways that private label brands use to influence consumer switching
from manufacturer brands is through shelf space apportionment. Amrouche and
Zaccour (2006) describe shelf space as “one of the retailer‟s most important assets”.
Shelf space is normally limited and therefore allocations play a key role in the success
of a brand. According to Nogales and Gomez (2005) private label brands are allocated
sizeable shelf spaces sometimes twice the space allocated to manufacturer brands
Furthermore, Suarez (2005) notes that retailers regularly place their private label
brands to more advantageous positions on the shelves. For instance, they place their
own brands to the right of the manufacturer brands they are competing against with a
purpose of influencing consumer behaviour. This is due to the fact that 90% of the
population is right handed and theoretically they are more likely to reach for the
private label alternatives (ibid).
According to Hwang al. (2004) private labels also influence brand switching by
displaying the products at a certain level on the shelf. In most cases, they place their
18
brands on eye-level which falls within the average consumer‟s line of vision. This
attracts the consumer‟s attention and increase the likelihood of the product being
picked. De Wulf et al. (2005) concur with this statement and stresses the influential
role that shelf positioning of a private label brand plays in consumers switching
behaviour.
When a consumer decides to switch to another brand he/she incurs a cost. The cost
incurred due to this process is called switching cost and it makes it difficult for
consumers to switch from one brand to another brand (Feick & Lee, 2001). This
creates a barrier for consumers to switch even when he/she is not satisfied with a
product. The Switching cost can be both financial and non-financial. It can be
emotional cost, learning cost, transactional cost, psychological cost and social cost. It
can also be the time and effort spent on searching for an alternative brand (Burnham &
Mahajan, 2003).
The financial cost can be one off payment and also the additional cost incurred due to
functional updates and additional accessories. A consumer may have to spend lot of
time and energies in learning the functionality of a new brand. There is also a
possibility that switching to another brand can result changes in social status and
consequently can cause adverse psychological effects on the consumer (Burnham &
Mahajan, 2003).The high switching cost minimize consumers switching intentions.
19
CHAPTER THREE:RESEARCH METHODOLOGY
3.1 Introduction
This chapter presents the research methodology that was chosen to answer the
research questions for this study. It focuses on the research design, population, sample
design, data collection and data analysis methods. According to Brannick and Roche
(1997), the method that the researcher chose for their study is influenced by a number
of factors. These include the nature of the research problem, the researcher‟s beliefs
and the status of scientific research and theories in case they are relevant to the
research problem.
3.2 Research Design
This study adopted descriptive cross sectional design. This is because descriptive
studies are normally the best methods for collecting information that will demonstrate
relationships and describe the world as it exists. Bickmann and Rog (2008) states
descriptive studies are useful in answering questions such as „what is‟ and what was.
The researcher recognizes the advantage of using mixed and multi-methods of
research to increase the reliability and credibility of the study but due to time
constraints and available resources this was not possible. Consequently, the time
horizon for this survey was cross-sectional in that it studied consumer perceptions of
private label brands at a particular point in time and not over an extended period of
time (Longitudinal). Cross-sectional surveys are known to be useful in assessing
beliefs, knowledge and attitudes of a population to a particular object.
3.3 Population of the study
The target population or the population to which the results of this study was
extrapolated is the 30% of Kenyans who as reported by KPMG (2015) shopped in
formal retail outlets. This was about 13 million Kenyans with an assumption that the
current population at the time of study was approximately 43 million. The
extrapolation to this population was guided by the fact that the key drivers for private
label brands in Kenya are the key retail chains hypermarkets and supermarkets.
Subsequently, the researcher recognized the importance of knowing if the regular
formal retail shoppers were aware of the introduction of private label brands, whether
they were buying them, their purchase drivers and what factors contributed to
switching from other manufacturer brands to private label brands.
20
3.4 Sample Design
Stratified random sampling method was used for this study. This is because the target
population was segmented into mutually exclusive subgroups then simple random
samples were selected from each of the segment. The strata included shoppers at
Uchumi, Naivas, Nakumatt and Tuskys since these are the leading chains in the
country with private label brands. The study interviewed 139 shoppers of each of the
across the four chains within Nairobi.
3.5 Data Collection
The primary method of data collection used was the use of questionnaires. The choice
of this method is based on the fact that questionnaires are quick and easy to
administer. The questionnaires were self-administered by the researcher in order to
ensure clarification of questions just in case of literacy or numeracy problems with the
respondents. In addition, self-administered questionnaires reduce the level of
nonresponses and mitigate inappropriate responses unlike surveys where the
participants are left to fill the questionnaires on their own. The researcher intercepted
shoppers as they walked in and out of the supermarkets and requested for their time to
assist with the survey. This ensured the relevant sample of the population was picked.
3.6 Data Analysis
Data was analysed using descriptive and inferential statistics to draw conclusions of
the study findings. Descriptive statistics is very important since it makes it easy to
interpret what the data is showing. In addition, descriptive statistics enable us to
present data in a more meaningful way which allows simpler interpretation of data.
Although this method has its limitations it provides a powerful summary that may
enable comparisons across people and other units.
21
CHAPTER FOUR:DATA ANALYSIS, RESULSTS AND
DISCUSSION
4.1 Introduction
This chapter presents the findings of the study established from the questionnaires in
determining consumer perception towards private label brands of four key
supermarkets in Kenya including Nakumatt, Naivas, Uchumi and Tuskys. The
findings of the study were guided by the following specific objectives: finding out
consumer awareness of private label brands, establishing the purchase triggers for
private label brands and establishing the influence of private label brands on
consumers switching behaviour from other manufacturer‟s brands. The chapter also
explains the findings in comparison with the relevant literature as established by other
authors in the same field of study.
4.2 Respondents Profiles
The respondents comprised of shoppers of the four key supermarkets in Nairobi. In
total the researcher randomly reached 139 respondents from 9 supermarkets in Nairobi
(See (Appendix II). 5 of these are Nakumatt supermarkets, 2 Naivas, 1 Tuskys and 1
Uchumi supermarket respectively. 37% of the respondents were male making female
respondents the majority at 63%.
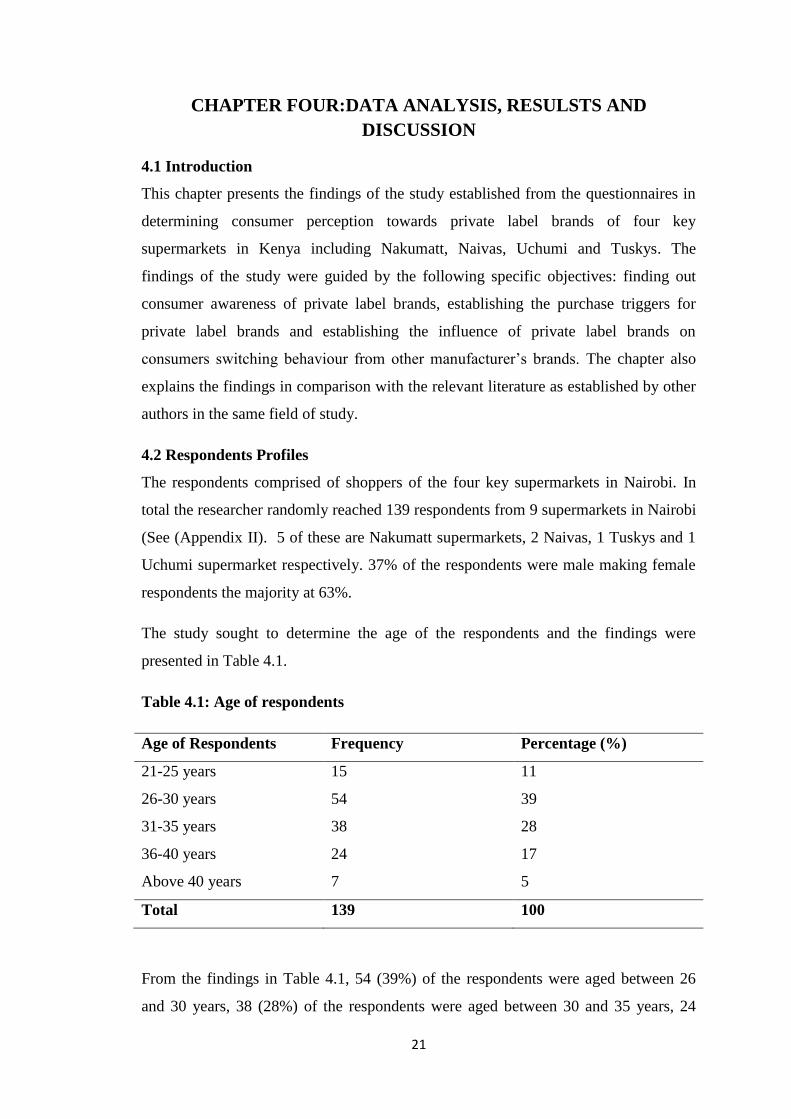
The study sought to determine the age of the respondents and the findings were
presented in Table 4.1.
Table 4.1: Age of respondents
Age of Respondents Frequency Percentage (%)
21-25 years 15 11
26-30 years 54 39
31-35 years 38 28
36-40 years 24 17
Above 40 years 7 5
Total 139 100
From the findings in Table 4.1, 54 (39%) of the respondents were aged between 26
and 30 years, 38 (28%) of the respondents were aged between 30 and 35 years, 24
22
(17%) were aged between 36 to 40 years, 15 (11%) between 21 and 25 years and 7
(5%) of the respondents were aged above 40 years.
4.3 Awareness of Private Label Brands
All the respondents were frequent shoppers of the four key supermarkets and they
were required to indicate their awareness of supermarket branded products. The most
interesting thing is that all the respondents were aware of supermarket branded
products in both unaided and aided guide. Top of mind was fresh foods especially
Naivas, Uchumi and Tuskys bread. Respondents from Nakumatt supermarkets could
easily recall other foods especially sugar.
Tong and Hawley (2009) define brand awareness as a buyer‟s ability to recall or
recognize a brand. On the other hand Hongo (2004) notes that brand awareness is a
consumer‟s ability to retrieve a brand when given the category, the needs met or
fulfilled in by the category or when given a cue of the brand. Brand awareness affects
customers‟ decision making and is one of the aspects that strengthens a brand‟s
performance (Huang & Sarigöllü, 2011).
The high level of awareness could be partly attributed to the high penetration of
modern retail channels in Kenya compared to other African countries. In addition,
there is notable shift to formal retail with 24-hour shopping already being offered by
Nakumatt, Tuskys and Naivas supermarkets. Online shopping is also slowly picking
with Naivas, Uchumi and Nakumatt availing the service to consumers.
4.4 Purchase of Supermarket Branded Products
The study sought to determine how many of the respondents had purchased a
supermarket branded product. 128 (92%) of the respondents had bought a supermarket
branded product with only 11 (8%) having not bought. The 8% mostly comprised of
the male respondents above 40 years. Furthermore, the study sought to find out how
many of the respondents had an intention to purchase supermarket branded products in
the next one month. Although the question was intended for those who had never
purchased supermarket branded products, majority of those that had purchased also
responded on that question. The results are presented in Figure 4.1.
23
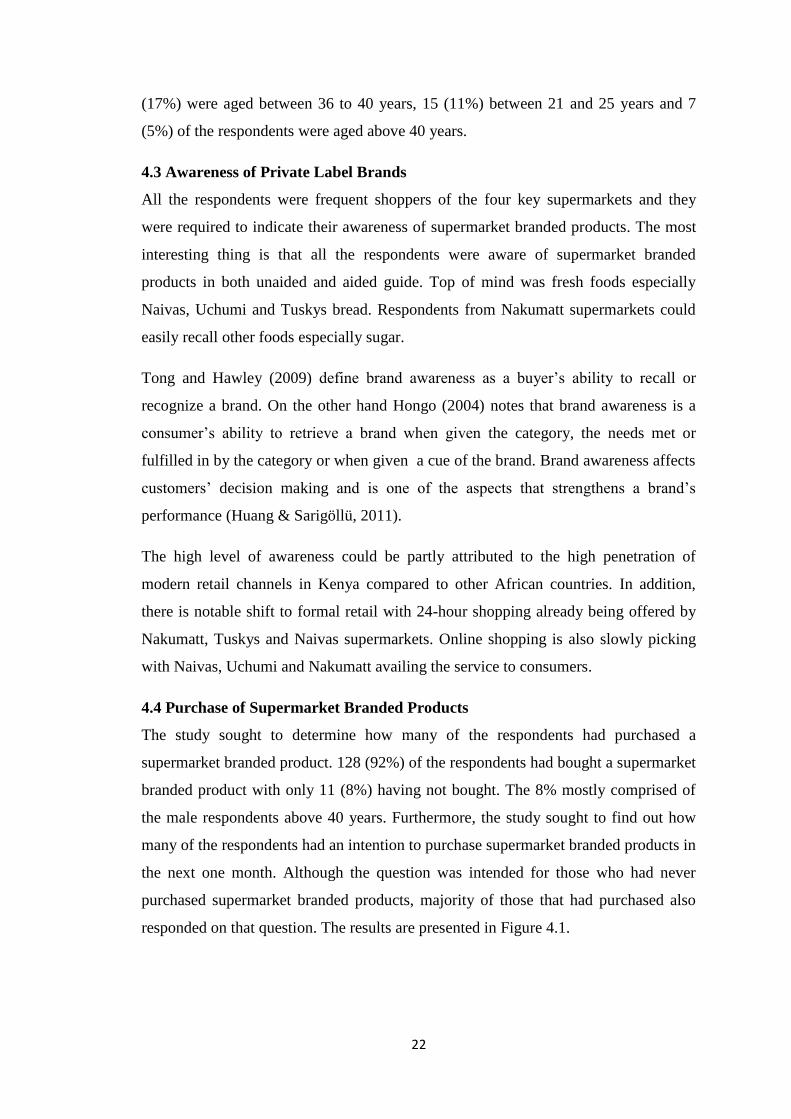
Figure 4.1: Intention to purchase a supermarket branded product in the next one
month
Some of the respondents who had no intention of purchasing indicated that they were
comfortable with the brands they were using hence no intention to purchase
supermarket branded products. The majority of consumers purchasing supermarket
branded products and had the intention to buy were the younger consumers aged
between 26-30 years. This echoes the sentiment that older consumers especially men
are more brand loyal hence likely to prefer brands that they are more familiar with.
Young, independent consumers however are more likely to try new or unfamiliar
products and brands.
Regarding the frequency of purchase of supermarket branded products 59 (46%)
indicated that they purchased these items during their monthly shopping.14 (11%) had
bought just once, 36 (28%) purchased the products during their weekly shopping and
lastly 19 (15%) purchase these products at least once in every 3 months as shown in
Table 4.2. This data suggests that there is substantial potential market for supermarket
branded products in Kenya. This further serves to authenticate consumer perceptions
and attitudes revealed in this study as the majority of respondents have some
experience in respect to supermarket branded products.
Frequency
Percentage
87
74%
31
26%
Do you intend to purchase a supermarket branded product in the next one month?
No
Yes
24
Table 4.2: Frequency of Purchase of supermarket branded products
Frequency of purchase Frequency Percentage (%)
Bought once 14 11
Monthly 59 46
Weekly 36 28
Once in 3 months 19 15
Total 128 100
4.5 Products categories forming largest share of Supermarket Branded Products
purchased at a particular time.
Foods such as sugar and rice form the largest share of Supermarket Branded Products
purchased at a particular time. They make up part of the basket of products bought
every month by the consumers. „I cannot miss out a supermarket branded product in
my monthly shopping‟. They accounted for 37% of purchases made.
Fresh foods form 26% of products forming largest share of supermarket branded
products purchased at particular time. It‟s worth noting that the consumers picked
more than one category of product forming largest share of supermarket branded
products purchased, "I think both fresh foods and other foods form the largest share‟,
"I am torn between other foods and Toiletries". Household cleaners make up 9%,
Dishwashers make up to 13% whereas Toiletries and Confectionaries make up to 7%
and 9% respectively.
4.6 Consumer Attitudes and Buying Intention towards Supermarket Branded
Products
Consumers‟ buying decision in relatively complex but is very important to consider
when evaluating why and how consumers respond to a product or brand. Usually
purchasing intention is related to a consumer‟s behaviour, perception towards the
product and also attitude. Ghosh (1990) stated that purchase intention is an effective
tool used in predicting the purchasing process. However, Zeithaml (1988) states that
purchase intention might be altered by the influence of quality, value and price.
25
The results of this study show that most consumers purchase intention was influenced
by price. The results are presented in Table 4.3.
Table 4.3: Primary reason for purchasing Supermarket branded product
Primary Reason Frequency Percentage (%)
Price 83 65
Quality 3 2
Packaging 0 0
Promotions and offers 24 19
Availability 10 8
Others 8 6
Total 128 100
Out of the 128 respondents who had ever purchased a supermarket branded 83 (65%)
of these were primarily driven by the price. Promotions and offers also played a key
role to some consumers 19% in making the purchase decision. None of the consumers
was influenced by the packaging. Quality also came second after others "I thought of
the price before thinking about quality‟. Only 2% of the consumers were driven by the
quality of supermarket branded products.
Availability on shelf influenced 8% of the consumers while the remaining 6% were
influenced by other factors. Most of these was because of out of stock of their
favourite brands and hence had to pick the next option. Others who especially bought
fresh foods like bakery items were influenced by the aroma once they were in the
outlets. This is in line with what Kim and Jin (2001) highlighted that some consumer‟s
behaviour is driven by the physiological motivation that stimulates them to purchase a
certain product in order to fulfil a certain need. In addition, consumers‟ are at times
interrupted by internal impulse and external environment during their purchasing
process.
Availability was more of the products always being on shelf rather than the
supermarkets not being in close proximity to the consumers.
26
4.7 Rating of Supermarket Branded Products quality and price in comparison to
other manufacturers brands.
Price is a significant and frequent cue in consumer decision making and is always
present every time a consumer is met with a purchase. For every purchase a consumer
must give up a certain amount of money which represents the monetary sacrifice made
in exchange for the product or service (Zeithaml, 1988; Bao et al. 2011). Price has
both positive and negative effects on consumers purchase intention. It is negative in
the sense that it means spending money or sacrificing money, but it‟s positive since
consumers sometimes interpret a higher price as a signal to better product quality.
This means that a high price does not necessarily mean a negative effect on purchase
probability (DelVeccio, 2001).Quality is also a key factor when making a purchase
decision. It is often said that price and quality are two interrelated concepts. Whenever
quality is mentioned, price comes up and thus it‟s hard to separate the two concepts
when discussing supermarket branded products (Jin & Suh, 2005).
The results of this study show that 96 (69%) of the consumers rate the quality of
supermarket branded products to be same or at parity with the quality of other
manufacturers brand. 40 (29%) of the respondents say the quality is lower while only
3 (2%) felt the quality was higher than that of manufacturers brands. The researcher
was able to establish from some of the consumers that they normally check the
manufacturers name on the packaging especially for non-food items. Therefore, they
use the manufacturer‟s name as an important extrinsic cue in assessing the quality of
supermarket branded products.
On pricing, 76% of the consumers stated that the price of supermarket branded
products is lower than that of other manufacturer‟s brands. 24% said that the price is
at par whereas none of the respondents felt that the price is higher. The results are
summarised in Figure 4.2.
27
Figure 4.2: Rating of Supermarket Branded Quality and Price in comparison to
the Quality and Price of other manufacturers’ brands.
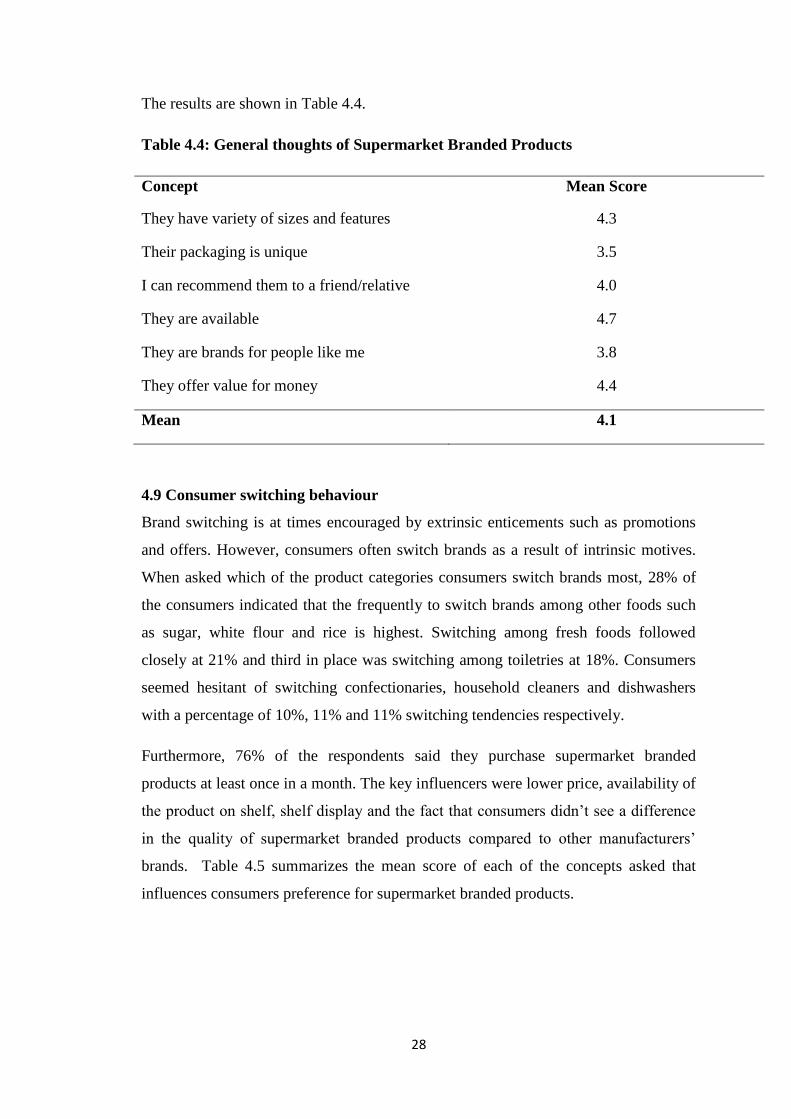
4.8 General Consumer thoughts on Supermarket Branded Products
The study sought to find out general consumer thoughts around six aspects including
variety of sizes and features, packaging, availability, recommendation, value for
money and consumer acceptance of supermarket branded products. Majority of the
consumers concurred that supermarket branded products have variety of sizes and
features, are brands that they can recommend to a relative or friend, they offer value
for money and are brands for people like them in terms of they wouldn‟t feel ashamed
of using the products the presence of their peers or family.
Packaging is where most consumers neither agreed nor disagreed on being unique
from other manufacturer‟s brands. As a percentage 36% felt the packaging was unique
whereas 29% disagreed hence bringing the mean score to neither agreeing nor
disagreeing. Availability was what most of the consumers strongly felt supermarket
products have and hence is a key strength in consumer pull to purchase. "I doubt if
supermarket branded products run out of stock, I always see them when I visit the
store" was one of the comments made by a consumer.
Same
Lower
Higher
69%
29%
2%
24%
76%
Quality and price comparison of Supermarket branded products compared to other manufacturer products
Pricing Quality
28
The results are shown in Table 4.4.
Table 4.4: General thoughts of Supermarket Branded Products
Concept Mean Score
They have variety of sizes and features 4.3
Their packaging is unique 3.5
I can recommend them to a friend/relative 4.0
They are available 4.7
They are brands for people like me 3.8
They offer value for money 4.4
Mean 4.1
4.9 Consumer switching behaviour
Brand switching is at times encouraged by extrinsic enticements such as promotions
and offers. However, consumers often switch brands as a result of intrinsic motives.
When asked which of the product categories consumers switch brands most, 28% of
the consumers indicated that the frequently to switch brands among other foods such
as sugar, white flour and rice is highest. Switching among fresh foods followed
closely at 21% and third in place was switching among toiletries at 18%. Consumers
seemed hesitant of switching confectionaries, household cleaners and dishwashers
with a percentage of 10%, 11% and 11% switching tendencies respectively.
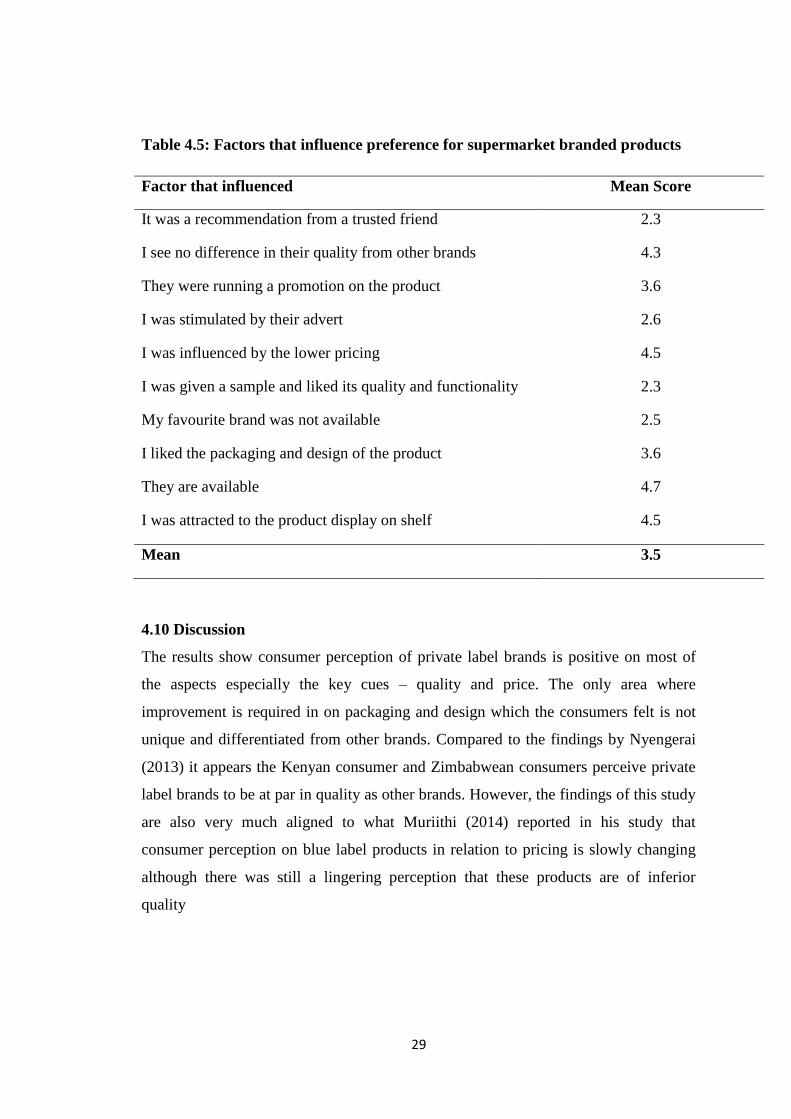
Furthermore, 76% of the respondents said they purchase supermarket branded
products at least once in a month. The key influencers were lower price, availability of
the product on shelf, shelf display and the fact that consumers didn‟t see a difference
in the quality of supermarket branded products compared to other manufacturers‟
brands. Table 4.5 summarizes the mean score of each of the concepts asked that
influences consumers preference for supermarket branded products.
29
Table 4.5: Factors that influence preference for supermarket branded products
Factor that influenced Mean Score
It was a recommendation from a trusted friend 2.3
I see no difference in their quality from other brands 4.3
They were running a promotion on the product 3.6
I was stimulated by their advert 2.6
I was influenced by the lower pricing 4.5
I was given a sample and liked its quality and functionality 2.3
My favourite brand was not available 2.5
I liked the packaging and design of the product 3.6
They are available 4.7
I was attracted to the product display on shelf 4.5
Mean 3.5
4.10 Discussion
The results show consumer perception of private label brands is positive on most of
the aspects especially the key cues – quality and price. The only area where
improvement is required in on packaging and design which the consumers felt is not
unique and differentiated from other brands. Compared to the findings by Nyengerai
(2013) it appears the Kenyan consumer and Zimbabwean consumers perceive private
label brands to be at par in quality as other brands. However, the findings of this study
are also very much aligned to what Muriithi (2014) reported in his study that
consumer perception on blue label products in relation to pricing is slowly changing
although there was still a lingering perception that these products are of inferior
quality
30
CHAPTER FIVE: SUMMARY, CONCLUSION AND
RECOMMENDATIONS
5.1 Introduction
In this chapter, a summary of the study‟s main findings is presented in relation to the
objectives. It covers conclusion and recommendation of the study and also suggestions
for further research.
The purpose of the study was to determine consumer perceptions of towards private
label brands of four key supermarkets in Kenya. The study focussed on the following
specific objectives: to find out consumer awareness of private label brands of the four
key supermarkets in Kenya, to establish purchase triggers for private label brands and
to establish the influence of private label brands on consumer switching behaviour
from other manufactures brands.
5.2 Summary of Findings
The study sought to determine consumers‟ awareness of private label brands or
supermarket branded products. The findings established that consumers are aware of
these brands and majority have bought them whether once, weekly or monthly. Fresh
foods including bread and milk form a considerable share of product categories
frequently purchased by consumers at a particular time. However, other food stuffs
especially sugar and rice form the largest share of supermarket branded products
purchased at a particular time. This could be partly attributed to the commoditisation
of this category and lack of very distinct differentiation among brands.
Majority planned to continue buying private label brands. This means that private
label brands market share will continue rising as majority of the shoppers purchased
these products at least on monthly basis. But, private label share growth and success in
not just dependent on this rather it‟s also influenced by the country‟s retail structure,
the level of retail concentration, economies of scale, advertising rate of manufacturers
and management (Jin & Yong, 2005). The majority of consumers purchasing
supermarket branded products were the younger consumers. This echoes the sentiment
that older consumers especially men are more brand loyal hence likely to prefer
brands that they are more familiar with. Young, independent consumers however are
more likely to try new or unfamiliar products and brands.
31
The primary purchase driver for supermarket branded products was price. Price
represents an extrinsic cue and provides one of the most vital forms of information
available to consumers when making purchasing decisions (Jin & Sternquist, 2002).
The study revealed that consumers‟ perception on the quality of supermarket branded
products was positive in that they felt it‟s the same as the quality of other
manufacturers‟ brands. On pricing majority conquered that supermarket branded
products are lower priced than other brands. To this end price did not appear to be a
leading indicator of quality. The argument was based on the fact that supermarket
branded products are manufactured by the same manufactures of other brands and the
lower pricing of private label brands is justifiable by the fact that there are some
additional expenses that they do not incur unlike other suppliers.
The general perception towards supermarket branded products having variety of sizes
and features was positive. Consumers were however on average neither agreeing nor
disagreeing on uniqueness of packaging of these brands. However, majority of the
consumers agreed to these brands being available on shelf, offering value for money
and hence being brands that suited the consumers‟ preferences and hence could be
recommended to friends and relatives. Consumers indicated that they easily switch
brands among food stuffs both fresh and other foods and hence explains why
foodstuffs form a large basket of the supermarket branded products by consumers at
any particular time. Toiletries also emerged as a key category where consumers switch
brands probably because quality is not the key determinant of making purchasing
decisions in this segment.
Consumers were still willing to buy supermarket branded items in the next one month.
This could be attributed to the reasons they felt made them prefer supermarket
branded products. They could not see any difference in the quality of supermarket
branded products, they felt the brands were available and had attractive display on
shelf. In addition, the lower pricing of supermarket branded products stimulated
purchases from the consumers despite the fact that most of these consumers had not
received a recommendation from a trusted source nor had they been given sample.
5.2 Conclusion
From the findings, it can be concluded that Kenyan consumers were aware of
supermarket branded products and had purchased them at least once. Perceptions
32
towards quality were favourable since most of the consumers felt there was no
difference in quality compared to the quality of other manufacturers brands. Price was
the key driver of purchasing supermarket branded products since most consumers
perceived the pricing of private label brands to be lower than that of other brands. As a
result when asked about offering value for money consumers responded positively and
agreeably that supermarket branded products offered value for money. This relates to
the fact that consumers felt they were offering similar quality as other brands but at a
lower price.
Consumers however felt that supermarket branded products had not been
differentiated in terms of packaging and thus it was not key driver towards purchasing.
But, availability on shelf and commendable product display was one of the things the
influenced consumers preference of private label brands. Consumers appeared to be
more loyal in certain categories especially household cleaners. This could be because
of the risk associated with the category especially bleach and detergent powder. Hence
consumers were hesitant of switching brands in this category.
5.3 Limitations and gaps for future research
Every research has some limitations which might constrain the interpretation of
findings. This was not different for the current study. First, it has to be noted that the
study was carried out within Nairobi only hence the results of the findings might not
be applicable across the country where the key retail chains are not so concentrated.
However the results appear to confirm and support earlier studies like that done by
Muriithi on Transferability of brand equity to blue label products.
Secondly due to time limitation the sample of the current study was limited to 139
respondents only. Consequently, further research should be done across a bigger
sample of more diverse consumer types. This creates a research gap for future
research where awareness and market share of private labels brands in other parts of
the country can be addressed.
5.4 Recommendations
The study made recommendations based on the study findings that the four key chains
should leverage on consumers awareness of their brands. Key here is to take the
consumer through the adoption process of product awareness, product interest,
product evaluation, product trial and finally product adoption. They can generate

33
product interest by differentiating their packaging from that of other brands as most
consumers seemed to see no uniqueness in their packaging. It‟s also very important
for these chains to work in increasing product recommendations as this is one way of
increasing revenue and raising conversion rates of products.
34
REFERENCES
Aaker, D.A., & Keller, K.L. (1990). Consumer evaluations of brand extensions.
Journal of Marketing, 54(1), 27-41.
Aaker, D. A. (1991). Managing brand equity: Capitalizing on the value of a brand
name. New York: Free Press.
Aaker, D. A. (1996). Measuring brand equity across products and markets. California
Management Review, 38(3), 102-20.
Aaker, D. A., & Keller, K. L. (1990). Consumer evaluations of brand extensions.
Amrouche N, Zaccour G (2006). Shelf-space allocation of national and private brands.
European Journal of Operational Research, 180, 648-663.
Anisimova, T.A. (2007). The effects of corporate brand attributes on attitudinal and
behavioural consumer loyalty, Journal of Consumer Marketing, 24/7, 395-405.
Assael, H.(1992). Consumer Behavior and Marketing Action. (4th ed.). Boston: PWS
Bao, Y., Bao. Y., & Sheng, S. (2011). Motivating purchase of private brands: Effects
of store image, product signatureness, and quality variation. Journal of Business
Research, 64, 220–226.
Baltas G (1997). Determinants of store brand choice: a behavioural analysis, Journal
of Product and Brand Management, 6 (5), 315 – 324.
Baltas G (2003). A combined segmentation and demand model for store brands,
European Journal of Marketing, 37 (10): 1499 – 1513.
Batra, R. and Sinha, I. (2000). Consumer-level factors moderating the success of
private label brands. Journal of Retailing, 76(2), pp.175-191.
Bawa, K. (1990). Modeling inertia and variety seeking tendencies in brand choice
behavior, Marketing Science, 9/3, 263-278.
Beneke, J. (2010). Consumer perceptions of private label brands within the retail
grocery sector of South Africa. African Journal of Business Management Vol. 4(2),
pp. 203-220.
Bickman, L., & Rog, D. (Eds.). (2008). The SAGE handbook of applied social
research methods (2nd ed.). Newbury Park, CA: Sage.
Blackwell, R., Miniard, P. & Engel (2001) Consumer behavior. Ohio: South-Western,
The Dryden press.
Brannick, T. & Roche, W. (1997) “Business Research Methods” Oak Tree Press.
Dublin, Ireland
35
Burnham, T. & Mahajan, V. (2003). Consumer switching costs: typology, antecedents,
and consequences; Journal the Academy of Science, 32, (2), 109- 126.
Burnkrant, R.E. (1975). Attribution theory in marketing research: problems and
prospects. Advances in Consumer Research, 2(1), 465-70.
Childers, T.L. & Rao, A.R. (1992). The Influence of familial and peerbased reference
groups on consumer decisions. Journal of Consumer Research, 19(2), 198-211.
Collins-Dodd, C., & Lindley, T. (2003). Store brands and retail differentiation: the
influence of store image and store brand attitude on store own brand perceptions.
Journal of Retailing and Consumer Services, 10(6), 345–352.
Data Monitor Report. 2011 Private Label Alcoholic Beverage Trends: Post-Downturn
Implications and Opportunities. Retrieved from www.Datamonitor.com/store
Dawar, N., & Parker, P. (1994). Marketing universals: consumers‟ use of brand name,
price, physical appearance, and retailer reputation as signals of product quality.
Journal of Marketing, 58(2), 81–95.
Deloitte Review. (2010). The Battle for Brands in world of private labels. Retrieved
from http://www2.deloitte.com/content/dam/Deloitte/xe/Documents/About-
Deloitte/mepovdocuments/mepov3/dtme_mepov3_The%20Battle-for-Brands.pdf
DelVecchio, D. (2001). Consumer perceptions of private label quality: the role of
product category characteristics and consumer use of heuristics. Journal of Retailing
and Consumer Services, 8(5), 239-249.
De Wulf K, Odekerken-Schröder G & Goedertier F (2005). Consumer perceptions of
store brands versus national brands. Journal of Consumer Marketing, 22 (4), 223 –
232.
Dowling, G.R. & Uncles, M. (1997). Do customer loyalty programs really work?
Sloan Management Review, 38/4 (Summer), 71-82.
Engel, J. F. Blackwell, R. D., & Miniard, P. W. (1995). Consumer behavior ( 8th ed.)
New York: Dryden Press. Farr , A., & Hollis, N. (1997). What do you want your
brand to be when it grows up? big and strong? Journal of Advertising Research, 37(6),
23-36.
Euromonitor Report (2015). Retailing in Kenya. Retrieved from
http://www.euromonitor.com/retailing-in-kenya/report.
Feick, L. & Lee, J. (2001). The impact of switching costs on the customer satisfaction-
loyalty link: mobile phone service in France, Journal of Services Marketing, 15, (1),
35-48.
Fornell, C. & Wernerfelt, B. (1987). Defensive marketing strategy by customer
complaint management: A theoretical review. Journal of Marketing Research, 24
(Nov.), 337-346
36
Gala, D., Patil, R.D., and Vidyapeeth, B (2013). Consumer attitude towards private
labels in comparison to other manufacturer brands. Interother manufacturer Journal of
Business and Management Invention.
Ghosh, A. (1990). Retail management. Chicago: Drydden press.
Givon, M. (1984). Variety seeking through brand switching. Marketing Science, 3/1
(Winter), 1-22.
Gómez, M., & Fernández, A. (2009). Consumer-Level Factors That Influence Store
Brand Proneness: An Empirical Study With Spanish Consumers. Journal of
Euromarketing, 18(1), 23- 34.
Herbig, P., & Milewicz, J. (1993). The relationship of reputation and credibility to
brand success. Journal of Consumer Marketing, 10(3), 18-24.
Hoeffler, S., & Keller, K. L. (2002). Building brand equity through corporate societal
marketing. Journal of Public Policy & Marketing, 21(1), 78-89.
Hongo (2004). Customer-based brand equity and improvement strategy for mobile
phone brands: Foreign versus local in the Chinese market. International Management
Review. Vol. 3, Iss. 3; pg. 76-79.
Hoyer Wayne D & Maclnnis Debroah J (2004); Consumer behavior, (3rd ed.).
Houghton Mifflin company.
Huang & Sarigöllü (2011). Managers‟ perception of the impact of sport sponsorship
on brand equity: which aspect of sponsorship matter most? Sport Marketing
Quarterly. Vol. 20, No. 1, Pg. 7-21.
Hwang H, Choi B, Lee M (2004). A model for shelf space allocation and inventory
control considering location and inventory level effect on demand, International
Journal of Production Economics, 97, 185 – 195.
Janiszewski, C., & Van Osselaer, M. J. (2000). A connectionist model of brand-
quality associations. Journal of Marketing Research, 37(3), 331-350.
Jin B, Yong G (2005). Integrating effect of consumer perception factor in predicting
private brand purchase in a Korean discount store context. Journal of Consumer
Marketing, 22(2), 62-71.
Jin, B., & Suh, Y. G. (2005). Integrating effect of consumer perception factors in
predicting private brand purchase in a Korean discount store context. Journal of
Consumer Marketing, 22(2), 62–71.
Keller, K. L. (1993). Conceptualizing, measuring, and managing customer-based
brand equity. Journal of Marketing, 57(1), 1-22.
Keller, K.L. (2003). Brand synthesis: The multidimensionality of brand knowledge.
Journal of Consumer Research, 29 (March), 595-600
37
Kelley H.H. ( 1950) . The warm – Cold Variable in First impressions of Persons.
Journal of Personality, 431-39.
Keon, J.W. (1980). The bargain value model and a comparison of managerial
implications with the linear learning model. Management Science, 26/11 (Nov.),
1117-1130.
Kotler P., Armstrong G., Saunders J. & Wong V. (2001), Principal of Marketing (3rd
ed.). Harlow Pearson Education Limited.
Kotler, P., Bowen, J.T. & Makens, J. (1999). Marketing for hospitality and tourism.
New Jersey: Prentice-Hall.
Kotler, P.and Keller, K. L. (2012). Marketing Management (13th ed.). Pearson
Education, Inc. Prentice Hall.
Lichtenstein, D.R., Ridgway, N.M. & Netemeyer, R.G. (1993). Price perceptions and
consumer shopping behavior: a field study. Journal of Marketing Research, 30(2),
234-45.
Macdonald, E. K., & Sharp, B. M. (2000). Brand awareness effects on consumer
decision making for a common, repeat purchase product: A replication. Journal of
Business Research, 48, 5-15.
Mazursky, D., LaBarbera, P. & Aiello, A. (1987). When consumers switch brands.
Psychology & Marketing, 4/1 (Spring), 17-30.
Veloutsou C, Gioulistanis E, Moutinho L (2004). Own labels choice criteria and
perceived characteristics in Greece and Scotland: Factors influencing the willingness
to buy, Journal of Product and Brand Management. 13 (4), 228-241.
Mowen, J. C., & Minor, M. (2001). Consumer behavior: A framework (2nd ed.).
Upper Saddle River, New Jersey: Prentice-Hall.
Muriithi, J.G. (2014). Transferability of brand equity to the blue label products; a case
study of Nakumatt supermarket in Nairobi Kenya.
Nakumatt unveils private label to boost local industries. (2013). Nakumatt Blog.
Retrieved from http://www.nakumatt.net/blog/nakumatt-unveils-private-label-to-
boost-local-industries/.
New ideas MSI: Color Counts, Marketing Management 12, no. 4 (Aug.2003), p2.
Newman, J.W. & Werbel, R. (1973). Multivariate analysis of brand loyalty for major
household appliances. Journal of Marketing Research, 10 (Nov), 404-409.
Nickels, W.G. & Wood, M.B. (1997). Marketing: Relationships, quality, value. New
York: Worth.
38
Nielsen AC Report. (2015) . Africa how to navigate the retail distribution labyrinth
http://www.nielsen.com/content/dam/nielsenglobal/ssa/docs/reports/2015/africa-
report-navigating-the-retail-dist-labyrinth-feb-2015.pdf
Nielsen AC Report. (2014). How 10 retailers are pushing private label‟s potential.
Retrieved from http://www.nielsen.com/us/en/insights/news/2014/how-10-retailers-
are-pushing-private-labels-potential.html.
Nielsen AC Report. (2014) The state of private label around the world. Retrieved from
http://www.nielsen.com/content/dam/nielsenglobal/kr/docs/global-
report/2014/Nielsen%20Global%20Private%20Label%20Report%20November%202
014.pdf.
Ng‟ang‟a, W.N. (2012). Factors affecting the success of private label Bread brands of
large supermarkets in Nairobi, Kenya.
Nogales F, Suarez G (2005). Shelf space management of private labels: A case study
in Spanish retailing, Journal of retailing and consumer services 12(2), 205-216.
Nyengerai S., Musekiwa A., and Dube T (2013). Determinants of perception toward
private label brands in Zimbabwe. Interother manufacturer Journal of Academic
Research and Social Sciences.
Percy, L., & Rossiter, J. R. (1992). A model of brand awareness and brand attitude
advertising strategies. Psychology & Marketing, 9, 263-274.
Peter, J. Paul, Olson Jerry C, Grunert Klaus G; Consumer behavior and Marketing
strategy; Mc-Graw Hill, 1999
Porter, S.S., and Claycomb, C. (1997) The influence of brand recognition on retail
store image, Journal of Product & Brand Management, 6(6), pp.373-398.
Private label today (n.d.) Industry news. Retrieved from http://www.plmainterother
manufacturer.com/industry-news/private-label-today.
Rabobank Report. (2011) Private label versus Brands, an inseperable combination.
Retrieved
fromhttps://www.rabobank.com/en/press/search/2011/rabobank_report_consolidation
_in_private-label.html.
Richardson, P.S., Jain, A.K., & Dick, A. (1996). Household store brand proneness: a
framework. Journal of Retailing, 72(2), 159-85.
Sainsbury’s humble beginnings 1869-1900. (n.d.) In Sainsbury Living Archive.
Retrieved from http://www.sainsburyslivingarchive.co.uk/collections/sainsburys-
heritage/sainsburys-humble-beginnings-1869-1900.
Sam’s choice. (n.d).In Wikipedia. Retrieved June,16,2015, from
https://en.wikipedia.org/wiki/Sam's_Choice.
39
Schiffman, L.G. & Kanuk, L.L. (1994). Consumer behaviour. New Jersey: Prentice-
Hall.
Sudhir, K & Talukdar, D. (2004). Does store brand patronage improve store
patronage? Review of Industry Organization. Vol. 24(2). pp. 143-160.
Tong, X. & Hawley, J. M. (2009). Measuring customer-based brand equity: empirical
evidence from the sportswear market in China, Journal of Product and Brand
Management, 18(4), 262-271.
Turley, L. W., & Moore, P. A. (1995). Brand name strategies in the service sector.
Journal of Consumer Marketing, 12(4), 42-50.
Vahie, A., & Paswan, A. (2006). Private label brand image: its relationship with store
image and other manufacturer brand. Interother manufacturer Journal of Retail &
Distribution Management, 34(1), 67-84.
Van Trijp, H.C.M., Hoyer, W.D. & Inman, J. (1996). Why switch? Product category-
level explanations for true variety seeking behavior. Journal of Marketing Research,
33/3 (Aug.), 281-292.
Veloutsou C, Gioulistanis E, Moutinho L (2004). Own labels choice criteria and
perceived characteristics in Greece and Scotland: Factors influencing the willingness
to buy, Journal of Product and Brand Management, 13 (4): 228-241.
Verhoef, P. C., Nijssen, E. J., & Sloot, L. M. (2002). Strategic reactions of
nationalbrand manufacturers towards private labels: An empirical study in The
Netherlands.European. Journal of Marketing, 36 (11), 1309-1326.
What are store Brands. (n.d.) Store Brand Facts. Retrieved from
http://plma.com/storeBrands/facts13.html.
Zeithaml, V. A. (1988). Consumer Perceptions of Price, Quality, and Value: A Means-
End Model and Synthesis of Evidence. Journal of Marketing, 52(3), 2-22.
40
APPENDICES
Appendix I: Questionnaire
The following questionnaire was used for data collection
Part 1: Personal Information
1a. Gender
□Male □ Female
1b. Age Range
□ 21-25 □ 26-30 □ 31-35 □ 36-40 □ Above 40
Part 2: Consumer Knowledge and Usage of Supermarket Branded
products.
2a. Are you aware of supermarket branded products?
□Yes □No
2b. Please select the brands that you have seen from the list attached
3a. Have you ever purchased a Supermarket Branded product?
□ Yes □No
3b. If (No to 3a above) do you intend to purchase a supermarket branded product in
the one month
□Yes □No
3c. If yes (to 3a above) how often do you purchase Supermarket branded products?
□ I bought just once
□Monthly shopping
□Weekly shopping
□At least once in every 3 months
4. In which of the product categories listed below form the largest share of
Supermarket branded products purchased by you at a particular time?
□ Fresh Foods (Milk and Bread)
□ Other Foods (Sugar, wheat flour, maize flour grains, rice)
□ Household cleaners (bleach, scouring powder, disinfectants, detergent powder)
□ Dishwashers (Dishwashing Liquid or paste)
□ Toiletries (tissue, serviettes)
□ Confectionaries (Ice cream, crisps, ground nuts)
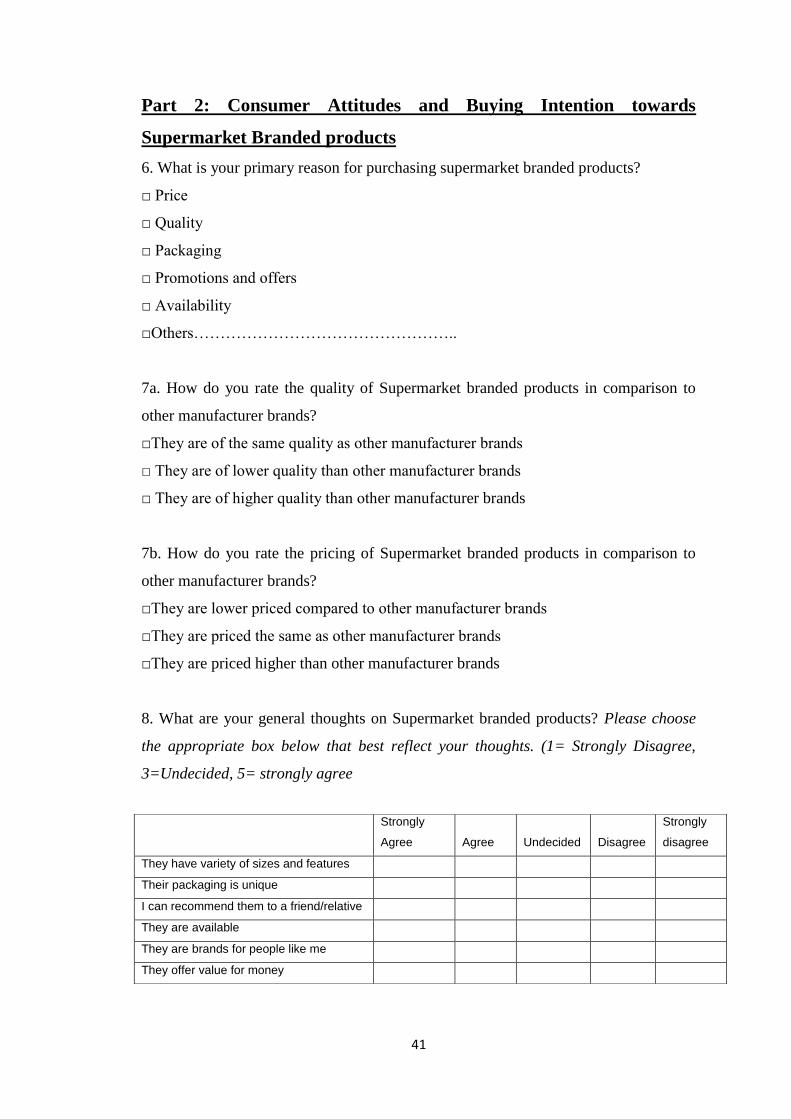
41
Part 2: Consumer Attitudes and Buying Intention towards
Supermarket Branded products
6. What is your primary reason for purchasing supermarket branded products?
□ Price
□ Quality
□ Packaging
□ Promotions and offers
□ Availability
□Others…………………………………………..
7a. How do you rate the quality of Supermarket branded products in comparison to
other manufacturer brands?
□They are of the same quality as other manufacturer brands
□ They are of lower quality than other manufacturer brands
□ They are of higher quality than other manufacturer brands
7b. How do you rate the pricing of Supermarket branded products in comparison to
other manufacturer brands?
□They are lower priced compared to other manufacturer brands
□They are priced the same as other manufacturer brands
□They are priced higher than other manufacturer brands
8. What are your general thoughts on Supermarket branded products? Please choose
the appropriate box below that best reflect your thoughts. (1= Strongly Disagree,
3=Undecided, 5= strongly agree
Strongly
Agree Agree Undecided Disagree
Strongly
disagree
They have variety of sizes and features
Their packaging is unique
I can recommend them to a friend/relative
They are available
They are brands for people like me
They offer value for money
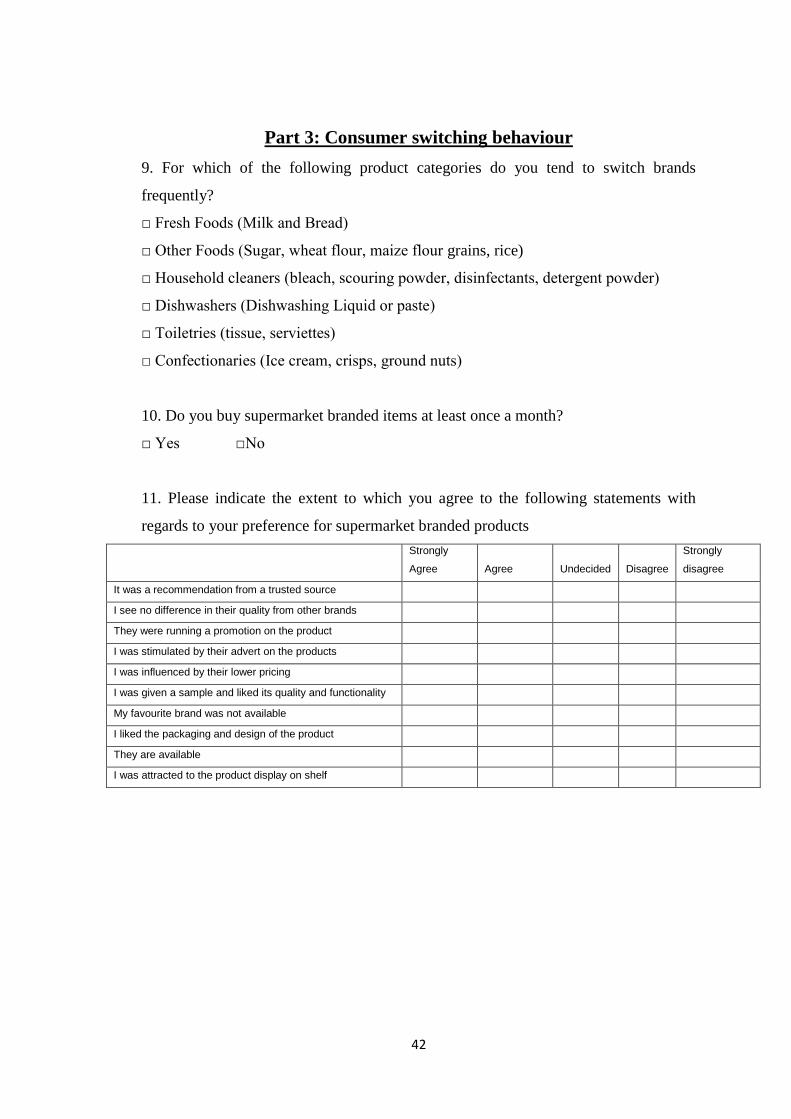
42
Part 3: Consumer switching behaviour
9. For which of the following product categories do you tend to switch brands
frequently?
□ Fresh Foods (Milk and Bread)
□ Other Foods (Sugar, wheat flour, maize flour grains, rice)
□ Household cleaners (bleach, scouring powder, disinfectants, detergent powder)
□ Dishwashers (Dishwashing Liquid or paste)
□ Toiletries (tissue, serviettes)
□ Confectionaries (Ice cream, crisps, ground nuts)
10. Do you buy supermarket branded items at least once a month?
□ Yes □No
11. Please indicate the extent to which you agree to the following statements with
regards to your preference for supermarket branded products
Strongly
Agree Agree Undecided Disagree
Strongly
disagree
It was a recommendation from a trusted source
I see no difference in their quality from other brands
They were running a promotion on the product
I was stimulated by their advert on the products
I was influenced by their lower pricing
I was given a sample and liked its quality and functionality
My favourite brand was not available
I liked the packaging and design of the product
They are available
I was attracted to the product display on shelf
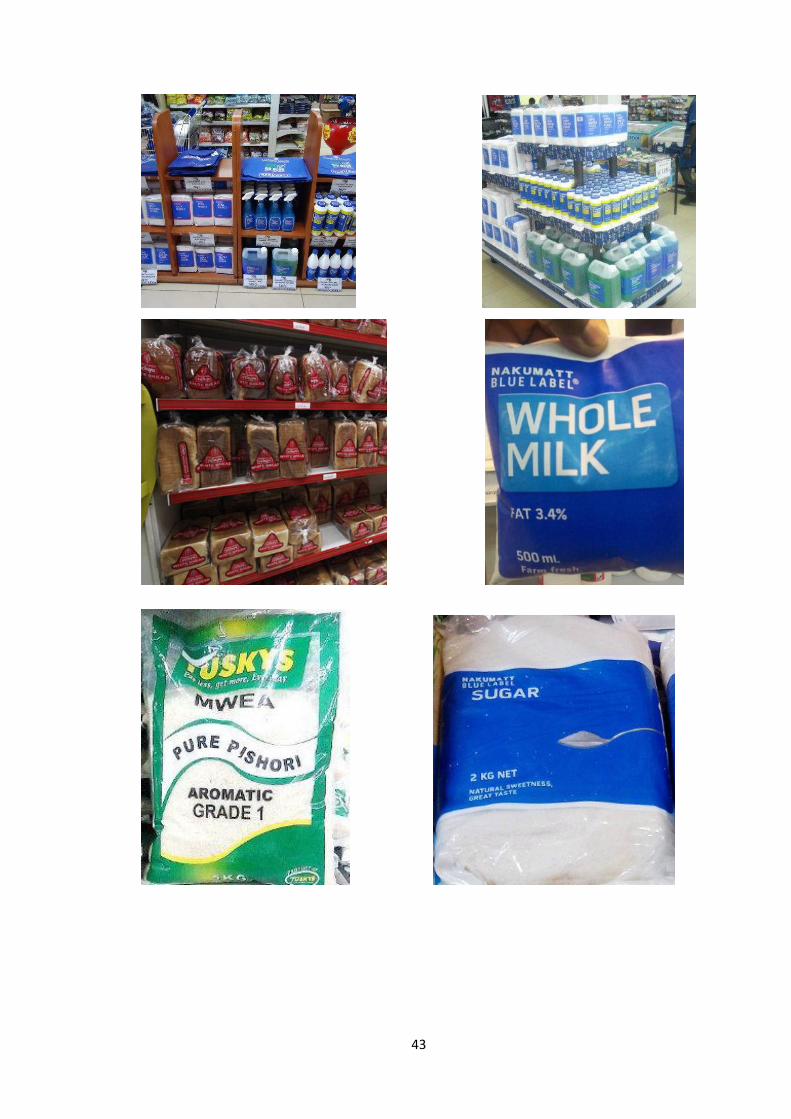
43
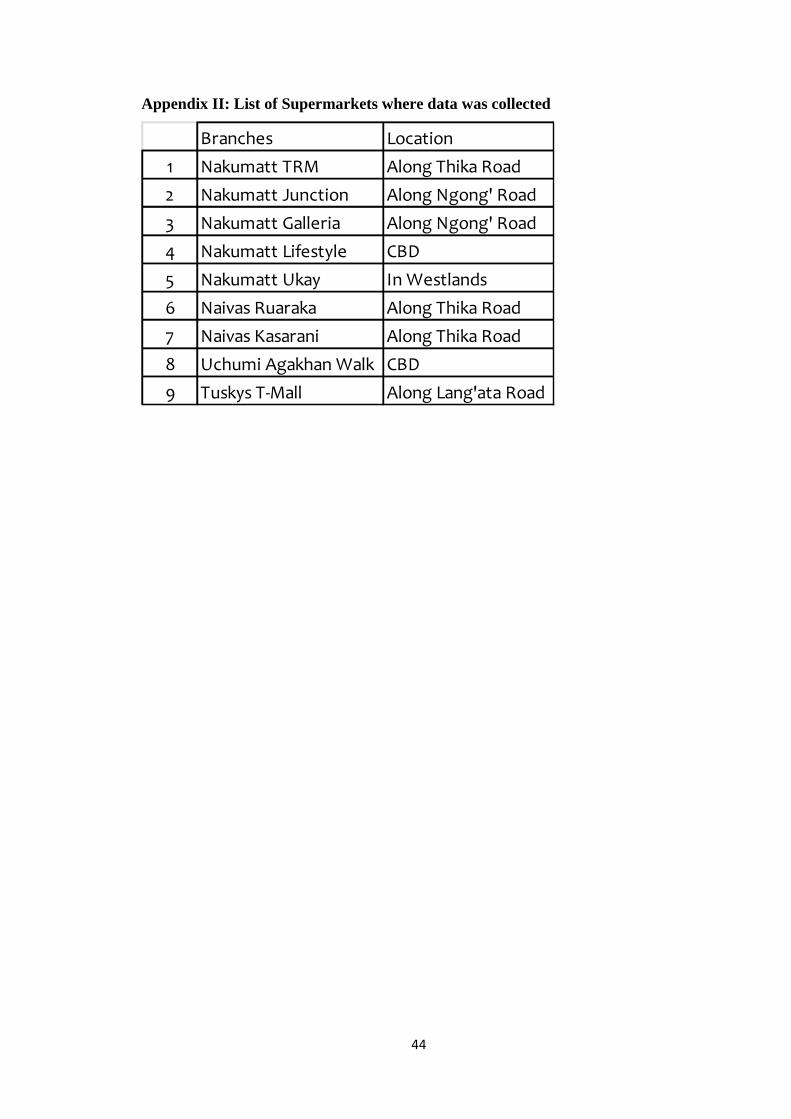
44
Appendix II: List of Supermarkets where data was collected
Branches Location
1 Nakumatt TRM Along Thika Road
2 Nakumatt Junction Along Ngong' Road
3 Nakumatt Galleria Along Ngong' Road
4 Nakumatt Lifestyle CBD
5 Nakumatt Ukay In Westlands
6 Naivas Ruaraka Along Thika Road
7 Naivas Kasarani Along Thika Road
8 Uchumi Agakhan Walk CBD
9 Tuskys T-Mall Along Lang'ata Road
Related Documents