Consumer Neuroscience: Assessing the Brain Response to Marketing Stimuli Using Electroencephalogram (EEG) and Eye Tracking Rami N Khushaba, Chelsea Wise, Sarath Kodagoda, Jordan Louviere, Barbara E. Kahn, and Claudia Townsend Rami Khushaba and Sarath Kodagoda are with the Center for Intelligent Mechatronics Systems, Faculty of Engineering and IT, University of Technology, Sydney (UTS). Email: [email protected], [email protected] Chelsea Wise and Jordan Louviere are with the Centre for the Study of Choice, University of Technology, Sydney (UTS). Email: [email protected], [email protected] Barbara E. Kahn is with the Wharton School, University of Pennsylvania. Email: [email protected] Claudia Townsend is with the School of Business Administration, University of Miami. Email: [email protected] Abstract Application of neuroscience methods to analyze and understand human be- havior related to markets and marketing exchange has recently gained re- search attention. The basic aim is to guide design and presentation of prod- ucts to optimize them to be as compatible as possible with consumer prefer- ences. This paper investigates physiological decision processes while partic- ipants undertook a choice task designed to elicit preferences for a product. The task required participants to choose their preferred crackers described by shape (square, triangle, round), flavor (wheat, dark rye, plain) and top- ping (salt, poppy, no topping). The two main research objectives were 1) to observe and evaluate the cortical activity of the different brain regions and the interdependencies among the Electroencephalogram (EEG) signals from these regions; and 2) unlike most research in this area that has focused mainly on liking/disliking certain products, we provide a way to quantify the importance of different cracker features that contribute to the product design based on mutual information. We used the commercial Emotiv EPOC wire- less EEG headset with 14 channels to collect EEG signals from participants. We also used a Tobii-Studio eye tracker system to relate the EEG data to the Preprint submitted to Expert Systems with Applications December 27, 2012

Welcome message from author
This document is posted to help you gain knowledge. Please leave a comment to let me know what you think about it! Share it to your friends and learn new things together.
Transcript
Consumer Neuroscience: Assessing the Brain Response
to Marketing Stimuli Using Electroencephalogram
(EEG) and Eye Tracking
Rami N Khushaba, Chelsea Wise, Sarath Kodagoda, Jordan Louviere,Barbara E. Kahn, and Claudia Townsend
Rami Khushaba and Sarath Kodagoda are with the Center for Intelligent MechatronicsSystems, Faculty of Engineering and IT, University of Technology, Sydney (UTS).
Email: [email protected], [email protected] Wise and Jordan Louviere are with the Centre for the Study of Choice,University of Technology, Sydney (UTS). Email: [email protected],
[email protected] E. Kahn is with the Wharton School, University of Pennsylvania. Email:
[email protected] Townsend is with the School of Business Administration, University of Miami.
Email: [email protected]
Abstract
Application of neuroscience methods to analyze and understand human be-havior related to markets and marketing exchange has recently gained re-search attention. The basic aim is to guide design and presentation of prod-ucts to optimize them to be as compatible as possible with consumer prefer-ences. This paper investigates physiological decision processes while partic-ipants undertook a choice task designed to elicit preferences for a product.The task required participants to choose their preferred crackers describedby shape (square, triangle, round), flavor (wheat, dark rye, plain) and top-ping (salt, poppy, no topping). The two main research objectives were 1)to observe and evaluate the cortical activity of the different brain regionsand the interdependencies among the Electroencephalogram (EEG) signalsfrom these regions; and 2) unlike most research in this area that has focusedmainly on liking/disliking certain products, we provide a way to quantify theimportance of different cracker features that contribute to the product designbased on mutual information. We used the commercial Emotiv EPOC wire-less EEG headset with 14 channels to collect EEG signals from participants.We also used a Tobii-Studio eye tracker system to relate the EEG data to the
Preprint submitted to Expert Systems with Applications December 27, 2012
specific choice options (crackers). Subjects were shown 57 choice sets; eachchoice set described three choice options (crackers). The patterns of corticalactivity were obtained in the five principal frequency bands, Delta (0-4 Hz),Theta (3-7 Hz), Alpha (8-12 Hz), Beta (13-30 Hz), and Gamma (30-40 Hz).There was a clear phase synchronization between the left and right frontaland occipital regions indicating interhemispheric communications during thechosen task for the 18 participants. Results also indicated that there wasa clear and significant change (p < 0.01) in the EEG power spectral activ-ities taking a place mainly in the frontal (delta, alpha and beta across F3,F4, FC5 and FC6), temporal (alpha, beta, gamma across T7), and occipital(theta, alpha, and beta across O1) regions when participants indicated theirpreferences for their preferred crackers. Additionally, our mutual informa-tion analysis indicated that the various cracker flavors and toppings of thecrackers were more important factors affecting the buying decision than theshapes of the crackers.
Keywords: Choice Modeling, Electroencephalogram (EEG),Neuromarketing.
1. Introduction
Consumer neuroscience is an emerging interdisciplinary field that com-bines psychology, neuroscience, and economics to study how the brain isphysiologically affected by advertising and marketing strategies [1, 2]. Itlinks consumer choices and decision-making to marketing research [3, 4, 5].The general assumption is that human brain activity can provide marketerswith information not obtainable via conventional marketing research meth-ods (e.g., interviews, questionnaires, focus groups)[6]. This is mainly drivenby the fact that people cannot (or do not want to) fully explain their pref-erences when explicitly asked; as human behavior can be (and is) driven byprocesses operating below the level of conscious awareness [7]. In such cases,the effectiveness of the different marketing strategies may be evaluated bymonitoring brain activity resulting from consumers observing different adver-tisements and products [8, 9]. The change in the human brain signal, denotedas Electroencephalogram (EEG), and its main spectral bands of Delta (0-4Hz), Theta (3-7 Hz), Alpha (8-12 Hz), Beta (13-30 Hz), and Gamma (30-40 Hz) is observed to examine consumers’ cognitive or affective processesin response to prefabricated marketing stimuli [10, 11, 12, 13, 14, 15, 16].
2
The main goals in such neuromarketing research are first to detect the smallchanges in commercial stimuli that may prove to have substantial impacts onmarketing efficacy [9]. Secondly, it also aims to explain how changes in thedepiction or presentation of marketing information affect the ways in whichthe brain reacts (changes in the brain signals). It is assumed that the laterprovides information about the process of preference-formation/choice [17].
A number of studies investigated the changes in brain activity whileparticipants observed TV commercials by tracking the cortical activity andchanges in functional connectivity in normal subjects (e.g. Ohme et al. [11],Astolfi et al. [18], Custodio [19] and Vecchiato et al. [20]). These studiesfound that the amount of cortical spectral activity from the frontal areasand parietal areas was higher for TV commercials that were-remembered,compared with the activity elicited by TV commercials that were forgot-ten [11, 18]. Alpha band activity was also observed in the occipital regionsand theta activity in the midline and frontal cortical regions for the well re-membered advertisements [19]. Costa et al. [21] investigated the patterns ofinterdependency between different brain regions as volunteers looked at emo-tional and non-emotional film stimuli. They concluded that sadness yieldeda pattern involving a large exchange of information among frontal channelswhile happiness involved a wider synchronization among frontal and occipitalsites. Nie et al. [22] proposed an approach to identify the relation betweenEEG signals and human emotions while watching movies; they found moreimportance for alpha, beta and gamma than delta and theta bands.
In general, only a limited number of studies have collected both neu-ral (cognitive and emotion) data and preference data, as this is a newlyemerging field of research. Unlike most prior work focusing on the effect ofdifferent advertisements on human brain activity, this paper focuses on ana-lyzing EEG spectral changes in a simple choice (decision) context designedto measure specific features (i.e., shape, topping, and flavor) of the choiceoptions (crackers) that individuals like/dislike when choosing from 57 choicesets of three different crackers. We used a discrete choice experiment (DCE)to measure individuals’ preferences because DCEs simulate typical choicetasks like choosing from a store shelf or a menu; participants in DCEs canindicate what they prefer, but they often find it more difficult to articulatewhy this is the case. DCEs require participants to make a series of choices(in our context they were presented with 57 unique choice sets) and indicatetheir most and their least favorite options. DCEs do not require them torate, rank or articulate why they chose the particular options. This allows
3
us to avoid some of the more restrictive assumptions about how individualscompare competing alternatives (e.g. criticisms of ranking and rating tasks)and issues related to constructed reasoning (e.g. criticisms of retrospectivereporting/thinking aloud tasks).We also investigate changes in EEG spectralactivity in response not only to the presence of three choice options (presentedone at a time), but our analysis recognizes that each choice option (cracker)is described by three specific features (shape, topping, flavor). The partici-pants evaluate the three cracker features to come with an overall evaluationof each cracker. Their choices (favorite and least favorite cracker) providea discrete indicator measure of each participant’s cracker preferences thatcan be decomposed into separate preferences for each cracker feature. TheEEG measurement also allows us to examine associated changes in the EEGspectral activity associated with each cracker feature. Thus, as a first steptoward understanding the role of EEG as a measure of emotional and cogni-tive response in decision making, this paper provides a preliminary study onthe dynamics of EEG measurement during elicitation of preferences.
The structure of this paper is as follows: Section 2 describes the data col-lection procedure including a description of both the eye tracker and EmotivEPOC EEG headset based experiments. Section 3 describes the prepro-cessing and feature extraction steps, and the use of mutual information toidentify associations between preferences and EEG. Section 4 presents theexperimental results; and finally, conclusions are provided in Section 5.
2. Data Collection
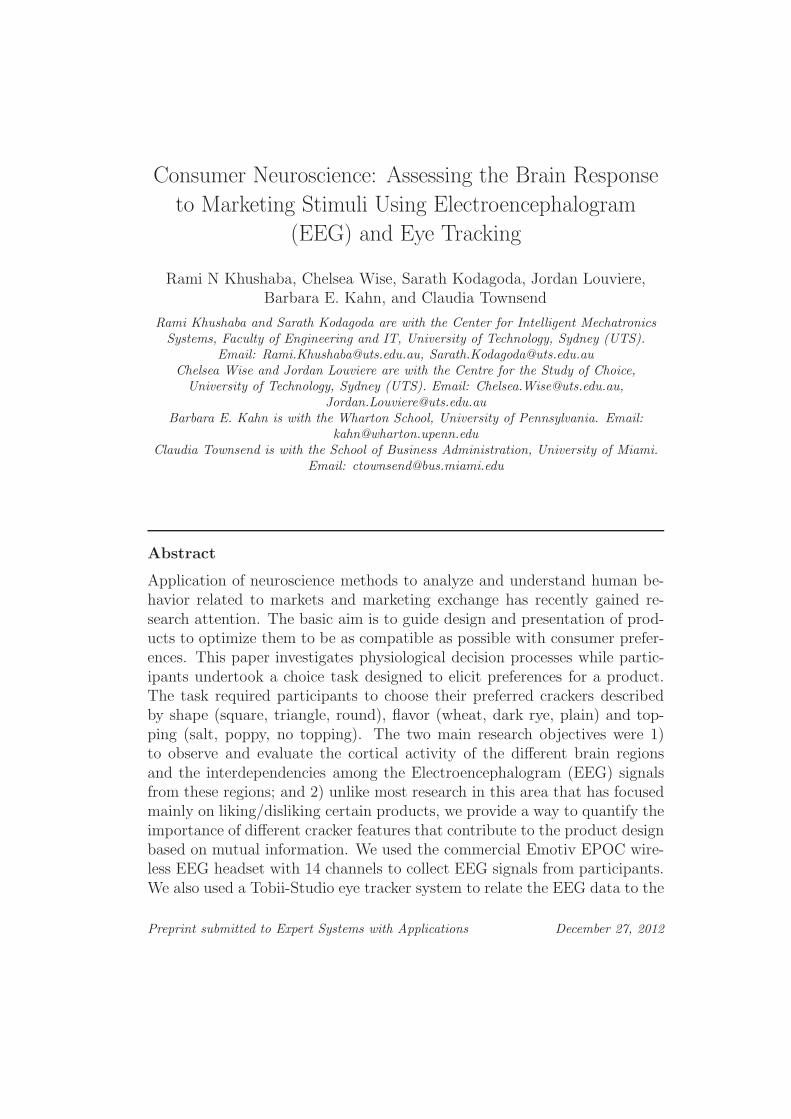
The data collection process employed two sets of equipment; the firstwas a brain signal monitoring system represented by the Emotiv EPOCEEG wireless headset with 14 channels (www.emotiv.com); and the secondis an eye-tracker system from Tobii technology (www.tobii.com), as shownin Fig.1 and described in the following sections.
2.1. Emotiv EPOC-based EEG data collection
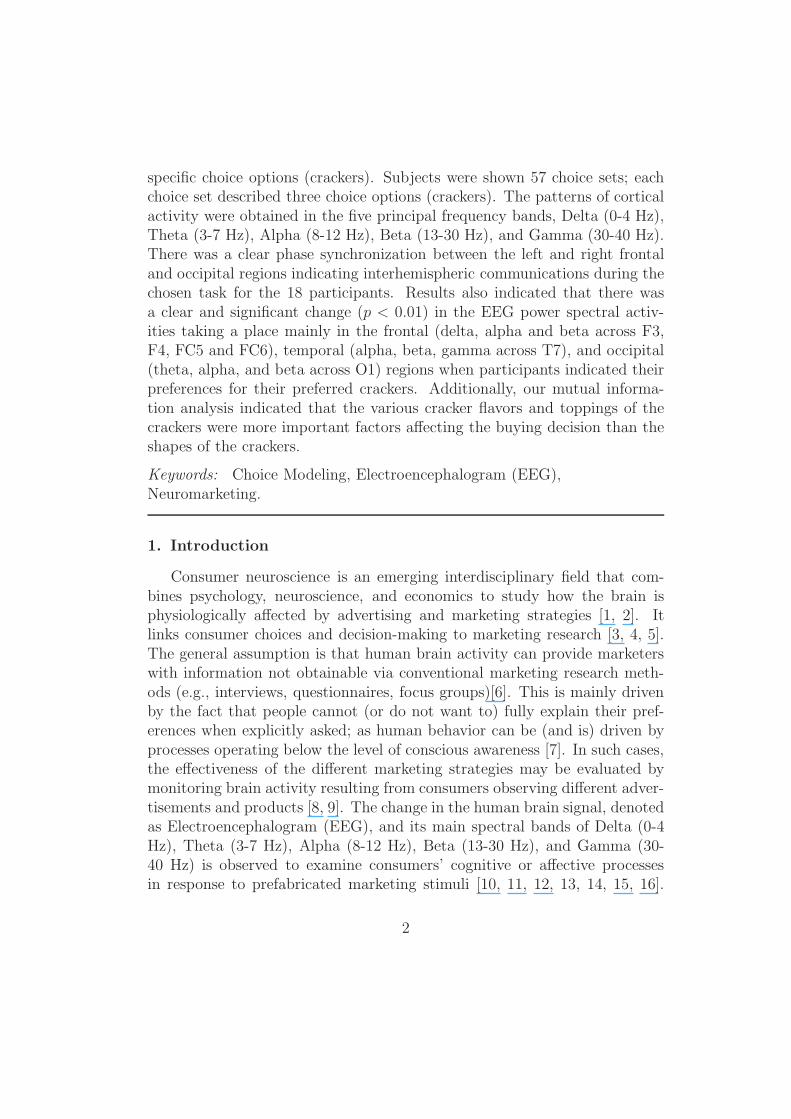
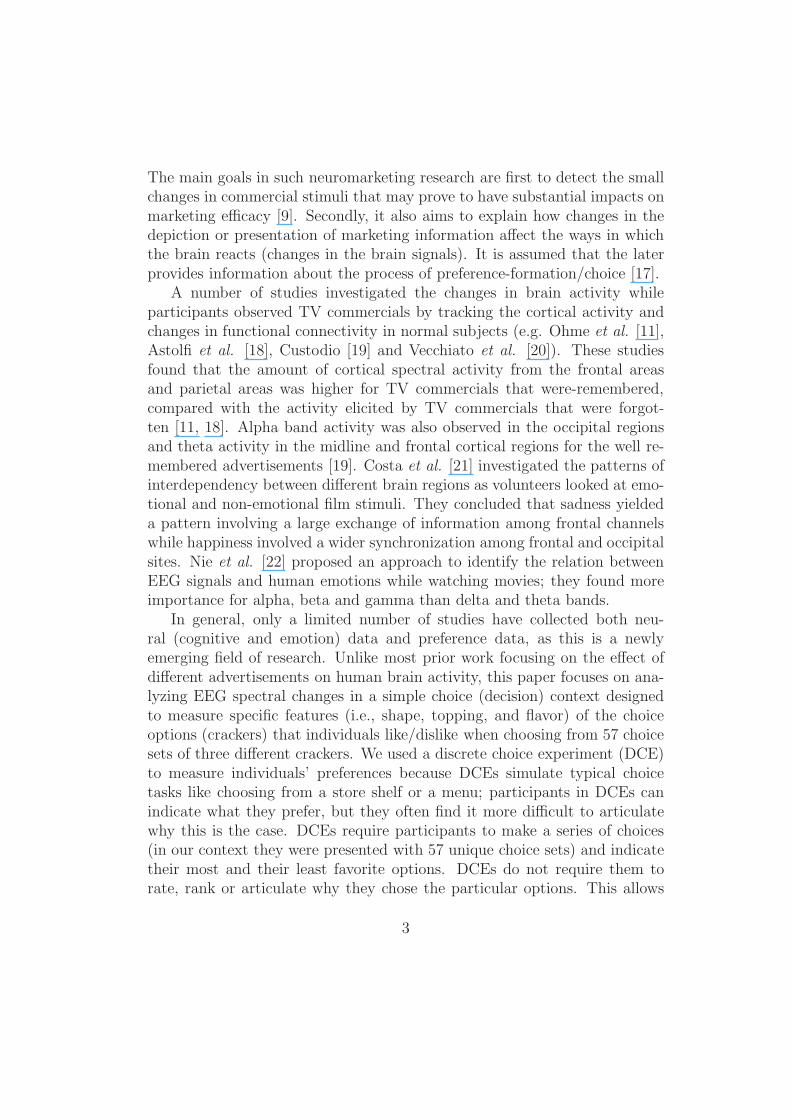
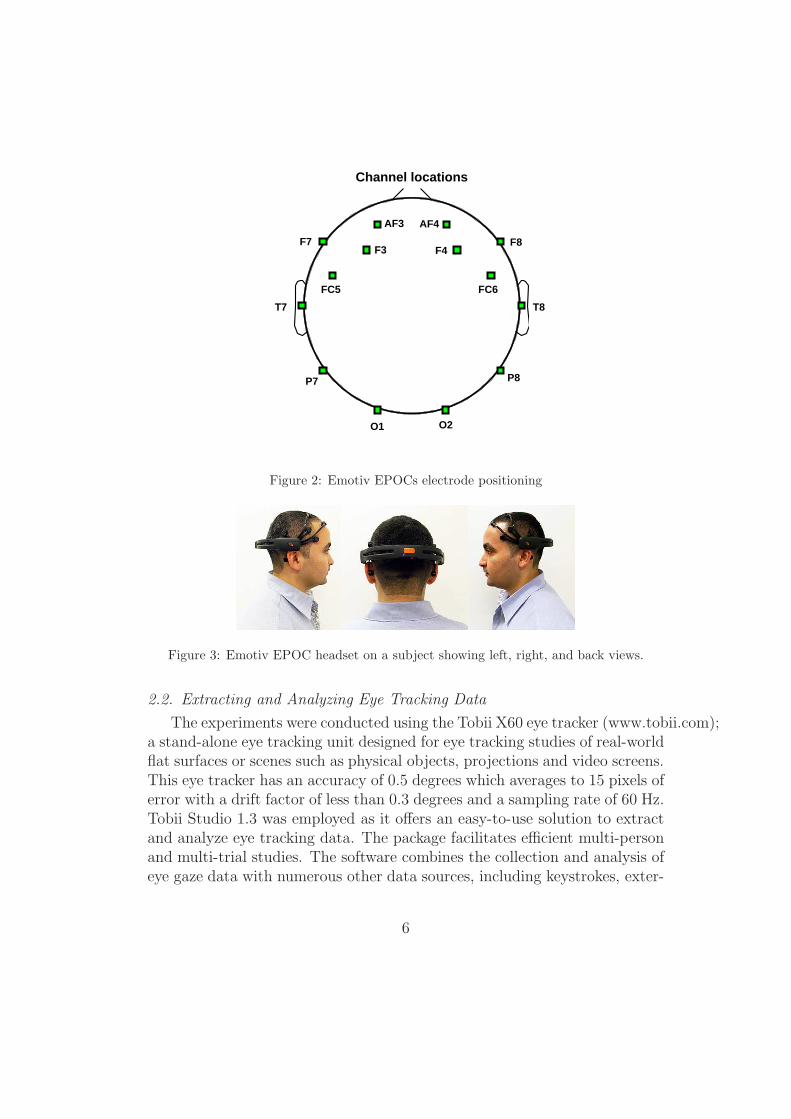
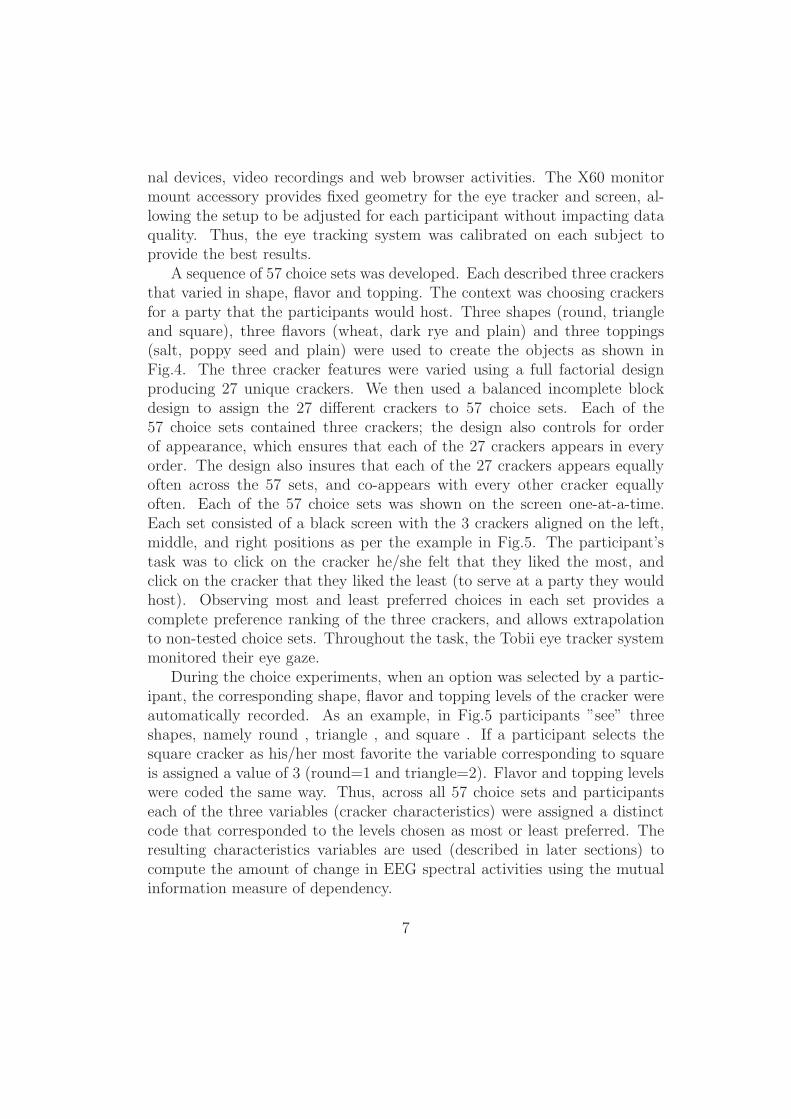
The Emotiv EPOC is a high resolution, neuro-signal acquisition and pro-cessing wireless headset that monitors 14 channels of EEG data and has agyroscope measure for 2 dimensional control. The electrodes are located atthe positions AF3, F7, F3, FC5, T7, P7, O1, O2, P8, T8, FC6, F4, F8, AF4according to the International 10−20 system forming 7 sets of symmetricchannels as shown in Fig.2 and Fig.3. Two electrodes located just above the
4
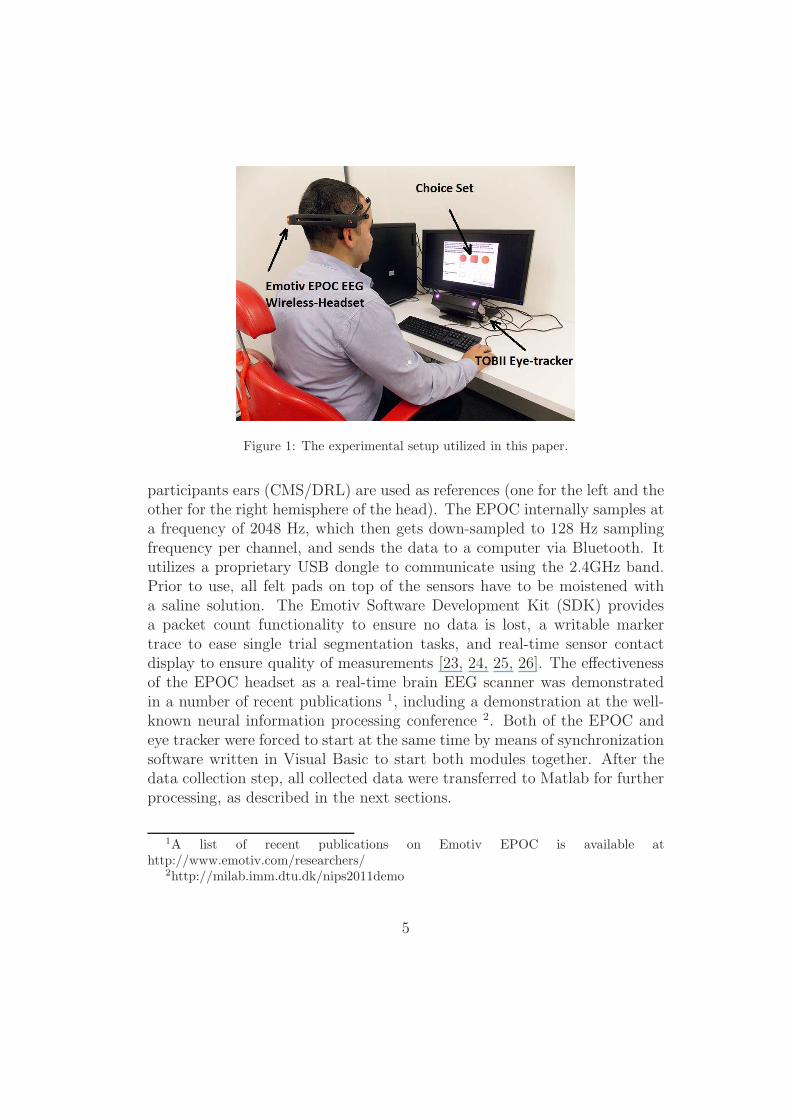
Figure 1: The experimental setup utilized in this paper.
participants ears (CMS/DRL) are used as references (one for the left and theother for the right hemisphere of the head). The EPOC internally samples ata frequency of 2048 Hz, which then gets down-sampled to 128 Hz samplingfrequency per channel, and sends the data to a computer via Bluetooth. Itutilizes a proprietary USB dongle to communicate using the 2.4GHz band.Prior to use, all felt pads on top of the sensors have to be moistened witha saline solution. The Emotiv Software Development Kit (SDK) providesa packet count functionality to ensure no data is lost, a writable markertrace to ease single trial segmentation tasks, and real-time sensor contactdisplay to ensure quality of measurements [23, 24, 25, 26]. The effectivenessof the EPOC headset as a real-time brain EEG scanner was demonstratedin a number of recent publications 1, including a demonstration at the well-known neural information processing conference 2. Both of the EPOC andeye tracker were forced to start at the same time by means of synchronizationsoftware written in Visual Basic to start both modules together. After thedata collection step, all collected data were transferred to Matlab for furtherprocessing, as described in the next sections.
1A list of recent publications on Emotiv EPOC is available athttp://www.emotiv.com/researchers/
2http://milab.imm.dtu.dk/nips2011demo
5
Channel locations
AF3
F7 F3
FC5
T7
P7
O1 O2
P8
T8
FC6
F4 F8
AF4
Figure 2: Emotiv EPOCs electrode positioning
Figure 3: Emotiv EPOC headset on a subject showing left, right, and back views.
2.2. Extracting and Analyzing Eye Tracking Data
The experiments were conducted using the Tobii X60 eye tracker (www.tobii.com);a stand-alone eye tracking unit designed for eye tracking studies of real-worldflat surfaces or scenes such as physical objects, projections and video screens.This eye tracker has an accuracy of 0.5 degrees which averages to 15 pixels oferror with a drift factor of less than 0.3 degrees and a sampling rate of 60 Hz.Tobii Studio 1.3 was employed as it offers an easy-to-use solution to extractand analyze eye tracking data. The package facilitates efficient multi-personand multi-trial studies. The software combines the collection and analysis ofeye gaze data with numerous other data sources, including keystrokes, exter-
6
nal devices, video recordings and web browser activities. The X60 monitormount accessory provides fixed geometry for the eye tracker and screen, al-lowing the setup to be adjusted for each participant without impacting dataquality. Thus, the eye tracking system was calibrated on each subject toprovide the best results.
A sequence of 57 choice sets was developed. Each described three crackersthat varied in shape, flavor and topping. The context was choosing crackersfor a party that the participants would host. Three shapes (round, triangleand square), three flavors (wheat, dark rye and plain) and three toppings(salt, poppy seed and plain) were used to create the objects as shown inFig.4. The three cracker features were varied using a full factorial designproducing 27 unique crackers. We then used a balanced incomplete blockdesign to assign the 27 different crackers to 57 choice sets. Each of the57 choice sets contained three crackers; the design also controls for orderof appearance, which ensures that each of the 27 crackers appears in everyorder. The design also insures that each of the 27 crackers appears equallyoften across the 57 sets, and co-appears with every other cracker equallyoften. Each of the 57 choice sets was shown on the screen one-at-a-time.Each set consisted of a black screen with the 3 crackers aligned on the left,middle, and right positions as per the example in Fig.5. The participant’stask was to click on the cracker he/she felt that they liked the most, andclick on the cracker that they liked the least (to serve at a party they wouldhost). Observing most and least preferred choices in each set provides acomplete preference ranking of the three crackers, and allows extrapolationto non-tested choice sets. Throughout the task, the Tobii eye tracker systemmonitored their eye gaze.
During the choice experiments, when an option was selected by a partic-ipant, the corresponding shape, flavor and topping levels of the cracker wereautomatically recorded. As an example, in Fig.5 participants ”see” threeshapes, namely round , triangle , and square . If a participant selects thesquare cracker as his/her most favorite the variable corresponding to squareis assigned a value of 3 (round=1 and triangle=2). Flavor and topping levelswere coded the same way. Thus, across all 57 choice sets and participantseach of the three variables (cracker characteristics) were assigned a distinctcode that corresponded to the levels chosen as most or least preferred. Theresulting characteristics variables are used (described in later sections) tocompute the amount of change in EEG spectral activities using the mutualinformation measure of dependency.
7
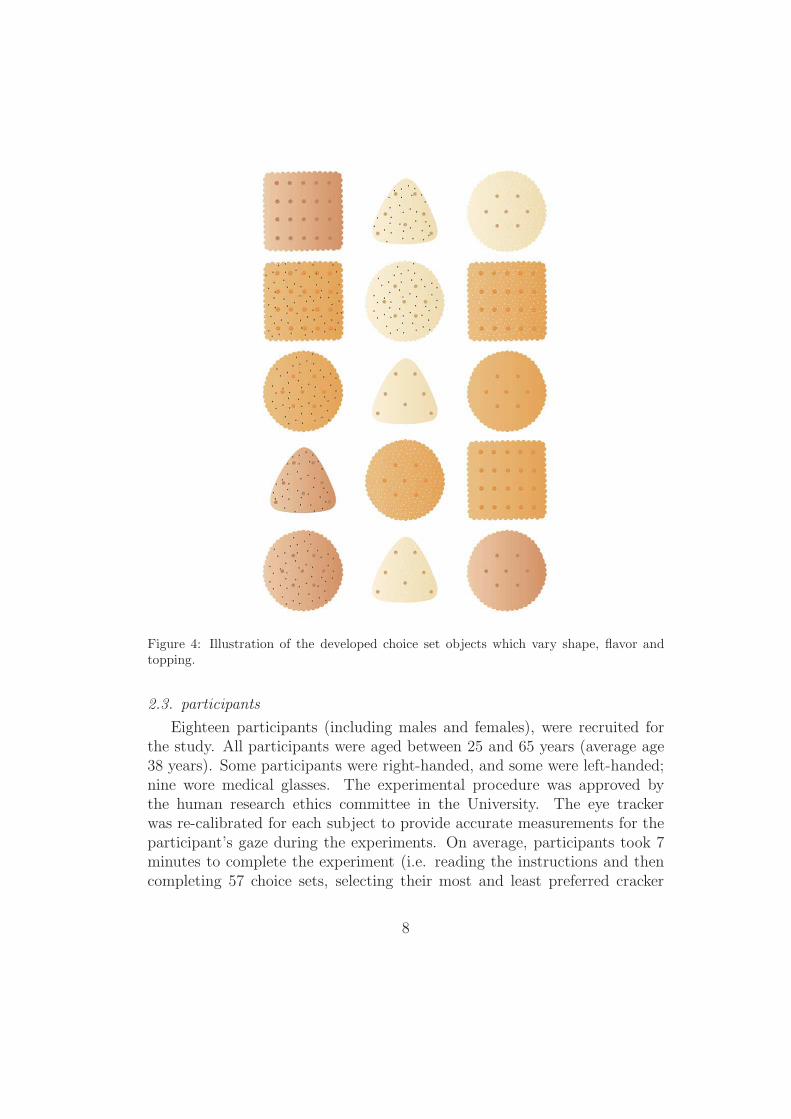
Figure 4: Illustration of the developed choice set objects which vary shape, flavor andtopping.
2.3. participants
Eighteen participants (including males and females), were recruited forthe study. All participants were aged between 25 and 65 years (average age38 years). Some participants were right-handed, and some were left-handed;nine wore medical glasses. The experimental procedure was approved bythe human research ethics committee in the University. The eye trackerwas re-calibrated for each subject to provide accurate measurements for theparticipant’s gaze during the experiments. On average, participants took 7minutes to complete the experiment (i.e. reading the instructions and thencompleting 57 choice sets, selecting their most and least preferred cracker
8
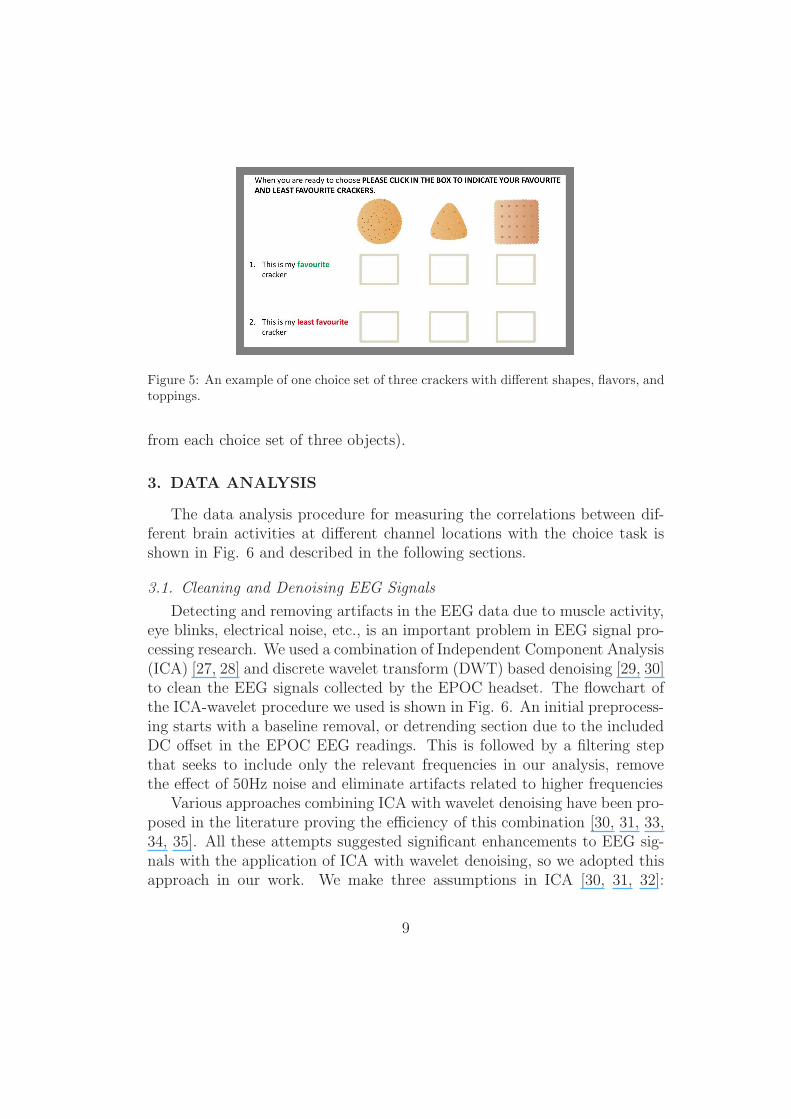
Figure 5: An example of one choice set of three crackers with different shapes, flavors, andtoppings.
from each choice set of three objects).
3. DATA ANALYSIS
The data analysis procedure for measuring the correlations between dif-ferent brain activities at different channel locations with the choice task isshown in Fig. 6 and described in the following sections.
3.1. Cleaning and Denoising EEG Signals
Detecting and removing artifacts in the EEG data due to muscle activity,eye blinks, electrical noise, etc., is an important problem in EEG signal pro-cessing research. We used a combination of Independent Component Analysis(ICA) [27, 28] and discrete wavelet transform (DWT) based denoising [29, 30]to clean the EEG signals collected by the EPOC headset. The flowchart ofthe ICA-wavelet procedure we used is shown in Fig. 6. An initial preprocess-ing starts with a baseline removal, or detrending section due to the includedDC offset in the EPOC EEG readings. This is followed by a filtering stepthat seeks to include only the relevant frequencies in our analysis, removethe effect of 50Hz noise and eliminate artifacts related to higher frequencies
Various approaches combining ICA with wavelet denoising have been pro-posed in the literature proving the efficiency of this combination [30, 31, 33,34, 35]. All these attempts suggested significant enhancements to EEG sig-nals with the application of ICA with wavelet denoising, so we adopted thisapproach in our work. We make three assumptions in ICA [30, 31, 32]:
9
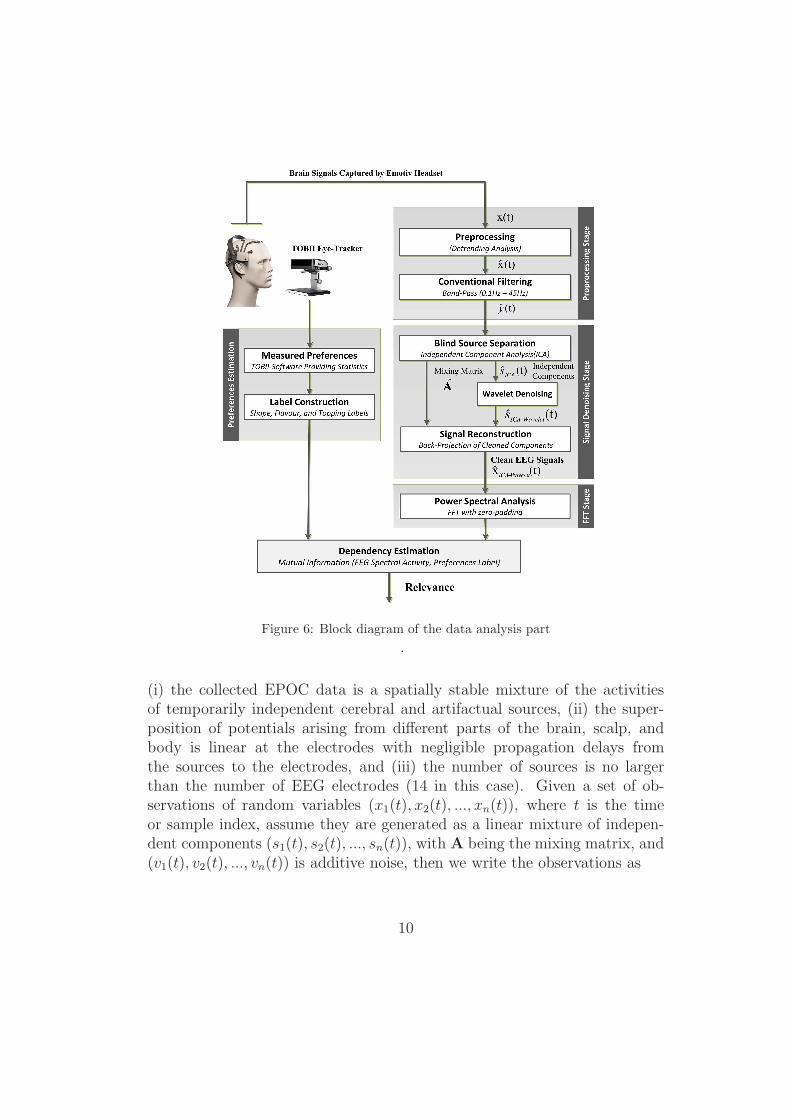
Figure 6: Block diagram of the data analysis part
.
(i) the collected EPOC data is a spatially stable mixture of the activitiesof temporarily independent cerebral and artifactual sources, (ii) the super-position of potentials arising from different parts of the brain, scalp, andbody is linear at the electrodes with negligible propagation delays fromthe sources to the electrodes, and (iii) the number of sources is no largerthan the number of EEG electrodes (14 in this case). Given a set of ob-servations of random variables (x1(t), x2(t), ..., xn(t)), where t is the timeor sample index, assume they are generated as a linear mixture of indepen-dent components (s1(t), s2(t), ..., sn(t)), with A being the mixing matrix, and(v1(t), v2(t), ..., vn(t)) is additive noise, then we write the observations as
10
x1(t)x2(t)...
xn(t)
= A
s1(t)s2(t)...
sn(t)
+
v1(t)v2(t)...
vn(t)
(1)
or simply as
x(t) = As(t) + v(t) (2)
Independent component analysis consists of estimating both the matrixA and the si(t), when we only observe the xi(t). After the application of ICA,the resulting sICA(t) (ICA’s version of s(t)) are usually manually inspectedto identify the independent components corresponding to artifacts, wheresuch components are replaced by zeros to construct a new ICA data [30, 31,33, 34, 35]. In our approach, we denoise each of the acquired componentsby applying the DWT rather than replacing the whole component with zero.For a signal si(t) composed of m samples, DWT is applied with a scale factorof 2j and is given as
wjk = 2−j/2
m−1∑
t=0
si(t)ψ(t
2j− k) (3)
where the scale factor j is related to the frequency, the parameter k isrelated to the time at which a frequency component occurs, wj
k is the waveletcoefficient of si(t) at scale index j and time index k, and ψ(n) is an orthogo-nal basis. We used the fifth-order Daubechies compactly supported waveletwith 5 decomposition levels, as it proved to yield good practical results.We then implemented a hard-thresholding step on the wavelet coefficients inwhich only those coefficients with values less than a specific threshold T weremaintained, with all other coefficients replaced by zeros. The value of T wasselected empirically as the median of the signal plus 3 times its standard de-viation. We then used the inverse wavelet transform to acquire the denoisedversion of the ICA components sICA−wavelet(t). After the wavelet denoisingstep, we obtained the clean EEG signals by multiplying the denoised ICAcomponents by the mixing matrix A as
xICA−wavelet(t) = AsICA−wavelet(t) (4)
11
A key advantage of the above approach is that no manual intervention isrequired to select the noisy components to remove from ICA before projectingback because the purpose of the wavelet denoising is to remove the associatednoise from the components automatically before projecting back to the data.
3.2. EEG-Power Spectrum Analysis
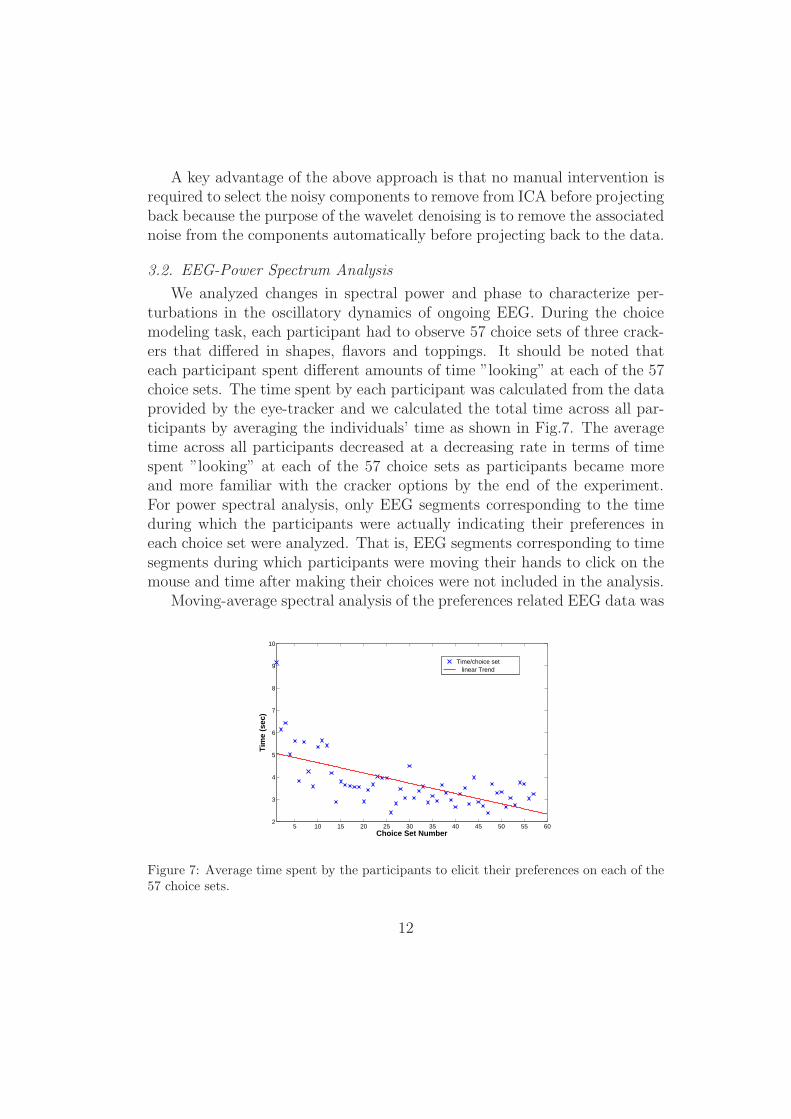
We analyzed changes in spectral power and phase to characterize per-turbations in the oscillatory dynamics of ongoing EEG. During the choicemodeling task, each participant had to observe 57 choice sets of three crack-ers that differed in shapes, flavors and toppings. It should be noted thateach participant spent different amounts of time ”looking” at each of the 57choice sets. The time spent by each participant was calculated from the dataprovided by the eye-tracker and we calculated the total time across all par-ticipants by averaging the individuals’ time as shown in Fig.7. The averagetime across all participants decreased at a decreasing rate in terms of timespent ”looking” at each of the 57 choice sets as participants became moreand more familiar with the cracker options by the end of the experiment.For power spectral analysis, only EEG segments corresponding to the timeduring which the participants were actually indicating their preferences ineach choice set were analyzed. That is, EEG segments corresponding to timesegments during which participants were moving their hands to click on themouse and time after making their choices were not included in the analysis.
Moving-average spectral analysis of the preferences related EEG data was
5 10 15 20 25 30 35 40 45 50 55 602
3
4
5
6
7
8
9
10
Choice Set Number
Tim
e (s
ec)
Time/choice set linear Trend
Figure 7: Average time spent by the participants to elicit their preferences on each of the57 choice sets.
12
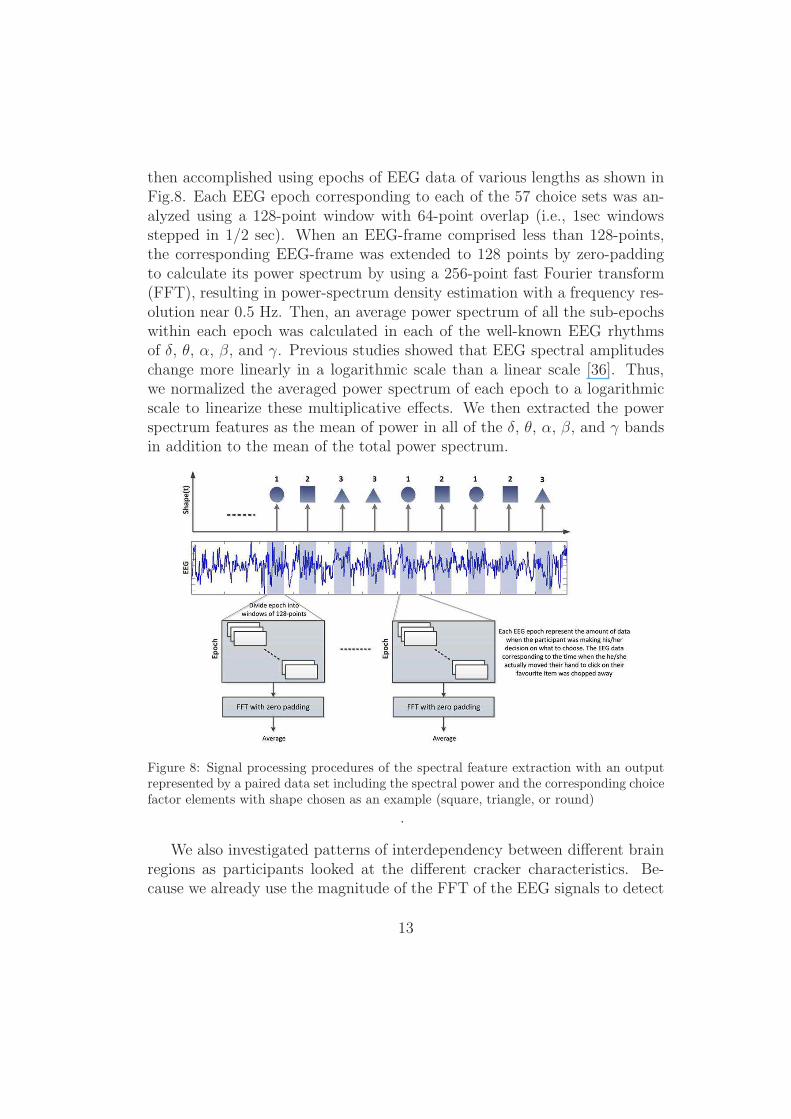
then accomplished using epochs of EEG data of various lengths as shown inFig.8. Each EEG epoch corresponding to each of the 57 choice sets was an-alyzed using a 128-point window with 64-point overlap (i.e., 1sec windowsstepped in 1/2 sec). When an EEG-frame comprised less than 128-points,the corresponding EEG-frame was extended to 128 points by zero-paddingto calculate its power spectrum by using a 256-point fast Fourier transform(FFT), resulting in power-spectrum density estimation with a frequency res-olution near 0.5 Hz. Then, an average power spectrum of all the sub-epochswithin each epoch was calculated in each of the well-known EEG rhythmsof δ, θ, α, β, and γ. Previous studies showed that EEG spectral amplitudeschange more linearly in a logarithmic scale than a linear scale [36]. Thus,we normalized the averaged power spectrum of each epoch to a logarithmicscale to linearize these multiplicative effects. We then extracted the powerspectrum features as the mean of power in all of the δ, θ, α, β, and γ bandsin addition to the mean of the total power spectrum.
Figure 8: Signal processing procedures of the spectral feature extraction with an outputrepresented by a paired data set including the spectral power and the corresponding choicefactor elements with shape chosen as an example (square, triangle, or round)
.
We also investigated patterns of interdependency between different brainregions as participants looked at the different cracker characteristics. Be-cause we already use the magnitude of the FFT of the EEG signals to detect
13
the interdependence between the change in power and preferences, we alsoemploy the phase of the FFT to directly quantity frequency-specific syn-chronization (i.e., transient phase-locking) between two EEG signals. Directevidence supporting phase synchronization during emotional response to pos-itive and negative film stimuli already exists [21]. However, we were unableto find additional studies that evaluated EEG phase synchrony while partic-ipants actually indicated like/dislike decisions for a product. We used thephase locking value (PLV) as a measure of synchrony, which is defined attime t as the average value [21, 37]
PLV =1
N
∣∣∣∣∣
N∑
n=1
exp(jφ(t, n))
∣∣∣∣∣ (5)
where φ(t, n) is the phase difference φ1(t, n)−φ2(t, n) of the EEG signalsfrom two brain regions, representing the inter-trial variability of this phase.Our approach to detecting synchrony in a precise frequency range betweentwo recording sites (i.e., the PLV value) is to calculate this quantity for eachof the δ, θ, α, β, and γ bands to detect what brain regions and which EEGbands are mostly getting phase synchronization, while the above approachdetects interdependences between the power in each of these bands at eachchannel with preferences for the shapes, flavors and toppings of the crackers.
3.3. Mutual Information Analysis
In probability theory and information theory, the mutual information be-tween two random variables is the amount by which the knowledge providedby one variable decreases the uncertainty about the other variable [38]. Itcan also be defined as a quantity that measures the mutual dependence ofthe two random variables [39]. Shannon’s information theory [40] providesa suitable way to quantify the above concepts. In our case, a number offeatures (or variables) describing the change in the EEG power spectrum ofδ, θ, α, β, and γ were extracted from each of the available 14 EEG sensorsfrom the EPOC headset. We try to discover the most relevant brain regionsassociated with the choice task by estimating the mutual dependence be-tween the extracted features from each sensors and the corresponding classlabel of preferences as indicated by each user (in terms of shape, flavor, andtopping). In this case, if we can identify the sensor from which the extractedfeatures highly depend on preferences for cracker characteristics variables(coded cracker characteristics associated with the most and least preferred
14

choices) we also can identify which brain region for which the EEG signalwas most relevant to the choice task.
If we define the probabilities for the different classes (classes refer to thedifferent options within each choice factor, for example square (1), triangle(2), and round (3) for shape) as P (c); c = 1, ...Nc, then the initial uncertaintyin the output class is measured by the entropy :
H(C) = −Nc∑
c=1
P (c)logP (c) (6)
the average uncertainty after knowing the feature vector f , where f mightbe any of the δ, θ, α, β, and γ features, (with Nf components) is the condi-tional entropy:
H(C|F ) = −
Nf∑
f=1
P (f)
(Nc∑
c=1
P (c|f)logP (c|f)
)(7)
where P (c|f) is the conditional probability for class c given the inputvector f . In general, the conditional entropy will be less than or equal tothe initial entropy (being equal if and only if one has independence betweenfeatures and output cracker characteristics coded values). The definition ofmutual information between variables c and f , denoted as I(C;F ) is theamount of reduction in the uncertainty about the class c as provided by thefeature vector f [41]:
I(C;F ) = H(C)−H(C|F ) (8)
which also can be simplified to
I(C;F ) = I(F ;C) =∑
c,f
P (c, f)logP (c, f)
P (c)P (f)(9)
where P(c,f) is the joint probability distribution function of C and F , andP (c) and P (f) are the marginal probability distribution functions of C andF respectively. We used the ratio of I(C;F )/H(F ), with H(F ) being theentropy of the feature f itself, to denote the normalized mutual informationbetween the extracted feature and the class.
15
4. Experiment Results
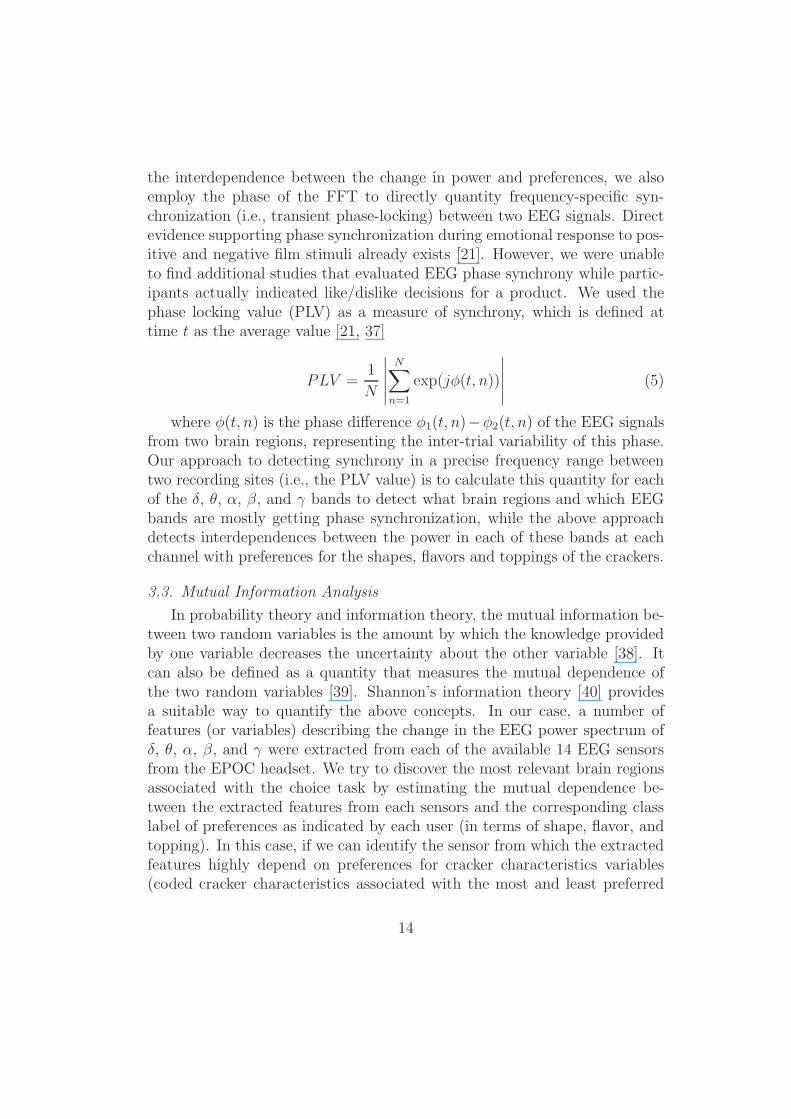
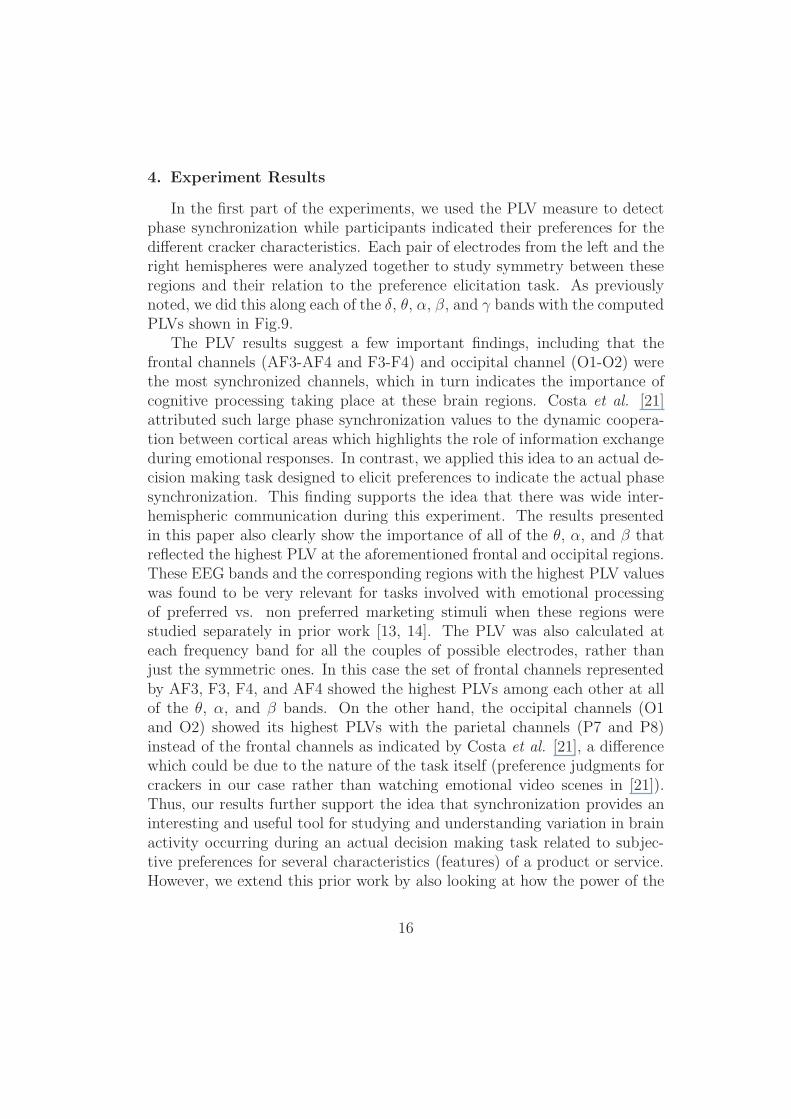
In the first part of the experiments, we used the PLV measure to detectphase synchronization while participants indicated their preferences for thedifferent cracker characteristics. Each pair of electrodes from the left and theright hemispheres were analyzed together to study symmetry between theseregions and their relation to the preference elicitation task. As previouslynoted, we did this along each of the δ, θ, α, β, and γ bands with the computedPLVs shown in Fig.9.
The PLV results suggest a few important findings, including that thefrontal channels (AF3-AF4 and F3-F4) and occipital channel (O1-O2) werethe most synchronized channels, which in turn indicates the importance ofcognitive processing taking place at these brain regions. Costa et al. [21]attributed such large phase synchronization values to the dynamic coopera-tion between cortical areas which highlights the role of information exchangeduring emotional responses. In contrast, we applied this idea to an actual de-cision making task designed to elicit preferences to indicate the actual phasesynchronization. This finding supports the idea that there was wide inter-hemispheric communication during this experiment. The results presentedin this paper also clearly show the importance of all of the θ, α, and β thatreflected the highest PLV at the aforementioned frontal and occipital regions.These EEG bands and the corresponding regions with the highest PLV valueswas found to be very relevant for tasks involved with emotional processingof preferred vs. non preferred marketing stimuli when these regions werestudied separately in prior work [13, 14]. The PLV was also calculated ateach frequency band for all the couples of possible electrodes, rather thanjust the symmetric ones. In this case the set of frontal channels representedby AF3, F3, F4, and AF4 showed the highest PLVs among each other at allof the θ, α, and β bands. On the other hand, the occipital channels (O1and O2) showed its highest PLVs with the parietal channels (P7 and P8)instead of the frontal channels as indicated by Costa et al. [21], a differencewhich could be due to the nature of the task itself (preference judgments forcrackers in our case rather than watching emotional video scenes in [21]).Thus, our results further support the idea that synchronization provides aninteresting and useful tool for studying and understanding variation in brainactivity occurring during an actual decision making task related to subjec-tive preferences for several characteristics (features) of a product or service.However, we extend this prior work by also looking at how the power of the
16
AF3−AF4 F7−F8 F3−F4 FC5−FC6 T7−T8 P7−P8 O1−O20
0.1
0.2
0.3
0.4
0.5
0.6
0.7
0.8
0.9
Pha
se L
ocki
ng V
alue
Delta(δ)Theta(θ)Alpha( α)Beta(β)Gamma(γ)
Figure 9: Phase locking values between all of the δ, θ, α, β, and γ bands at each symmetricpair of electrodes.
.
EEG signals change with preferences.In the second part of the experiments, we assessed individual preferences
for each cracker characteristic (shapes, flavors and toppings). Recall thatthe eye tracker provides information about what was selected as the mostand least preferred cracker in each choice set. This information allows us todecompose the chosen option into preference values for each characteristiclevel (three levels each of shape, flavor and toppings). For example, we de-composed the chosen shape into three binary vectors, one to indicate thata square shape was chosen (indicated by 1’s) versus all other cases wheresquare was not selected (indicated by 0’s), and similarly for rectangle androunded shapes. This produces three vector representations of shape prefer-ences typically known as dummy codes. We used the same coding logic torepresent flavors and toppings for a total of 9 vectors of preferences.
It is worth noting for this experiment that each of the extracted EEGfeatures provided one summary measure for each of the 57 choice sets withthe suggested mutual information measure further summarizing the resultsalong these 57 choice sets for each person. Ideally, we would like the EEGinformation to be provided for each of the three crackers in each choice set,but the data sampling is insufficient to get reliable measures from this exper-iment. Thus, the proper way to interpret our results for the cracker featurelevels is that these represent deviations from the choice sets measures as-
17
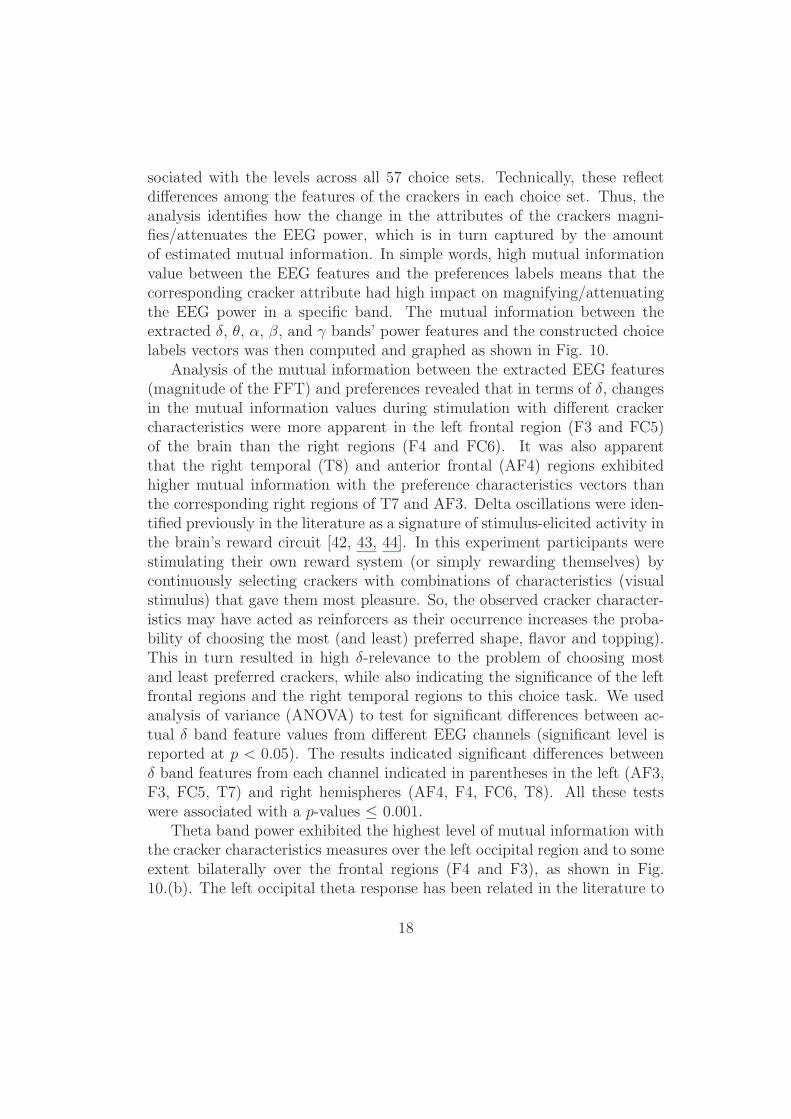
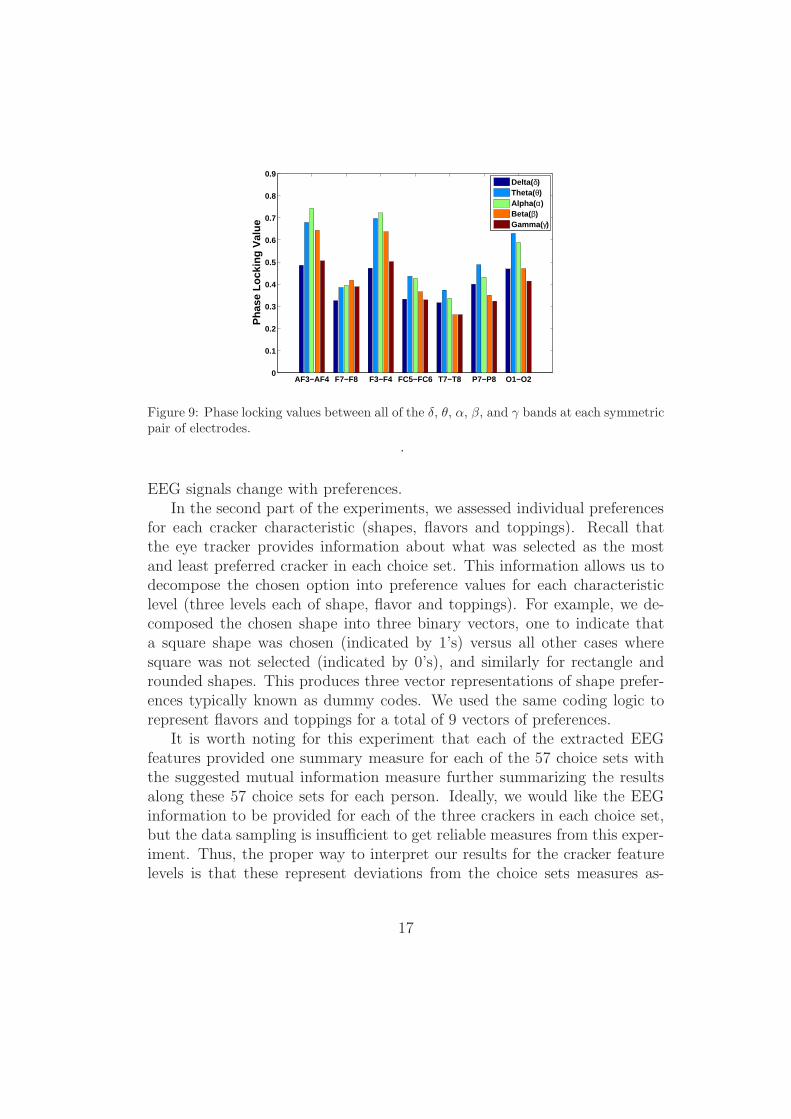
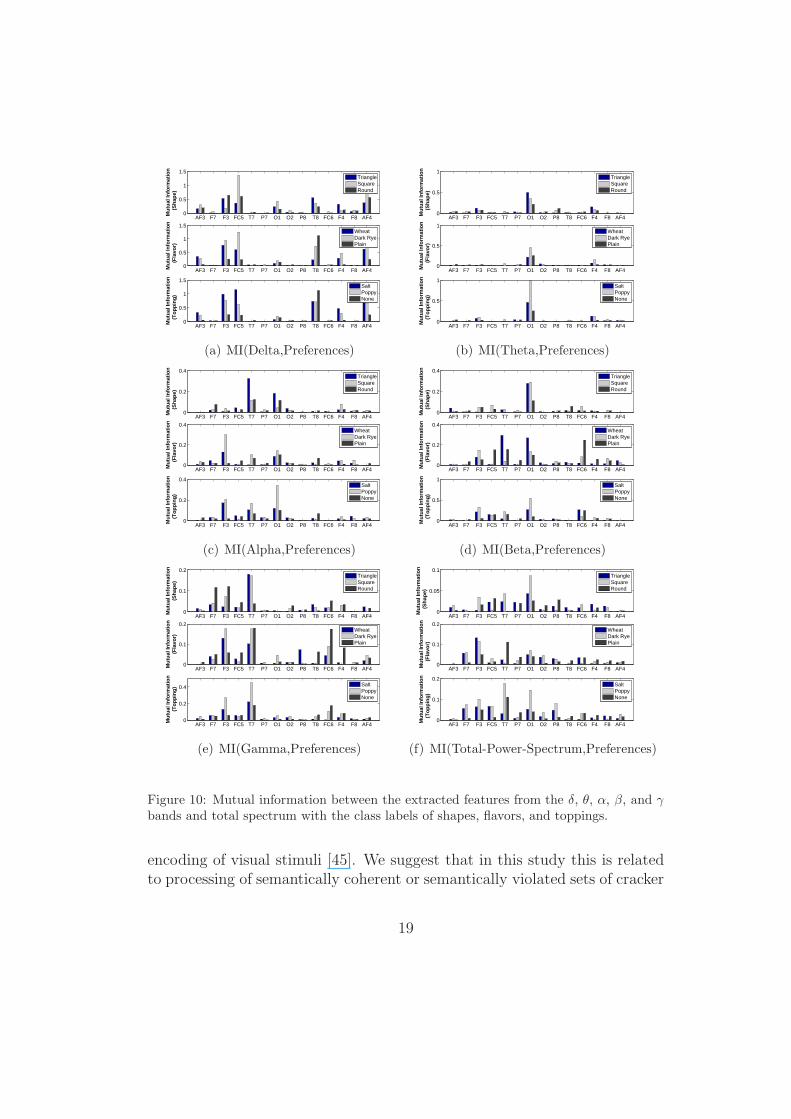
sociated with the levels across all 57 choice sets. Technically, these reflectdifferences among the features of the crackers in each choice set. Thus, theanalysis identifies how the change in the attributes of the crackers magni-fies/attenuates the EEG power, which is in turn captured by the amountof estimated mutual information. In simple words, high mutual informationvalue between the EEG features and the preferences labels means that thecorresponding cracker attribute had high impact on magnifying/attenuatingthe EEG power in a specific band. The mutual information between theextracted δ, θ, α, β, and γ bands’ power features and the constructed choicelabels vectors was then computed and graphed as shown in Fig. 10.
Analysis of the mutual information between the extracted EEG features(magnitude of the FFT) and preferences revealed that in terms of δ, changesin the mutual information values during stimulation with different crackercharacteristics were more apparent in the left frontal region (F3 and FC5)of the brain than the right regions (F4 and FC6). It was also apparentthat the right temporal (T8) and anterior frontal (AF4) regions exhibitedhigher mutual information with the preference characteristics vectors thanthe corresponding right regions of T7 and AF3. Delta oscillations were iden-tified previously in the literature as a signature of stimulus-elicited activity inthe brain’s reward circuit [42, 43, 44]. In this experiment participants werestimulating their own reward system (or simply rewarding themselves) bycontinuously selecting crackers with combinations of characteristics (visualstimulus) that gave them most pleasure. So, the observed cracker character-istics may have acted as reinforcers as their occurrence increases the proba-bility of choosing the most (and least) preferred shape, flavor and topping).This in turn resulted in high δ-relevance to the problem of choosing mostand least preferred crackers, while also indicating the significance of the leftfrontal regions and the right temporal regions to this choice task. We usedanalysis of variance (ANOVA) to test for significant differences between ac-tual δ band feature values from different EEG channels (significant level isreported at p < 0.05). The results indicated significant differences betweenδ band features from each channel indicated in parentheses in the left (AF3,F3, FC5, T7) and right hemispheres (AF4, F4, FC6, T8). All these testswere associated with a p-values ≤ 0.001.
Theta band power exhibited the highest level of mutual information withthe cracker characteristics measures over the left occipital region and to someextent bilaterally over the frontal regions (F4 and F3), as shown in Fig.10.(b). The left occipital theta response has been related in the literature to
18
AF3 F7 F3 FC5 T7 P7 O1 O2 P8 T8 FC6 F4 F8 AF40
0.5
1
1.5M
utua
l Inf
orm
atio
n(S
hape
)
AF3 F7 F3 FC5 T7 P7 O1 O2 P8 T8 FC6 F4 F8 AF40
0.5
1
1.5
Mut
ual I
nfor
mat
ion
(Fla
vor)
AF3 F7 F3 FC5 T7 P7 O1 O2 P8 T8 FC6 F4 F8 AF40
0.5
1
1.5
Mut
ual I
nfor
mat
ion
(Top
ping
)
TriangleSquareRound
WheatDark RyePlain
SaltPoppyNone
(a) MI(Delta,Preferences)
AF3 F7 F3 FC5 T7 P7 O1 O2 P8 T8 FC6 F4 F8 AF40
0.5
1
Mut
ual I
nfor
mat
ion
(Sha
pe)
AF3 F7 F3 FC5 T7 P7 O1 O2 P8 T8 FC6 F4 F8 AF40
0.5
1
Mut
ual I
nfor
mat
ion
(Fla
vor)
AF3 F7 F3 FC5 T7 P7 O1 O2 P8 T8 FC6 F4 F8 AF40
0.5
1
Mut
ual I
nfor
mat
ion
(Top
ping
)
TriangleSquareRound
WheatDark RyePlain
SaltPoppyNone
(b) MI(Theta,Preferences)
AF3 F7 F3 FC5 T7 P7 O1 O2 P8 T8 FC6 F4 F8 AF40
0.2
0.4
Mut
ual I
nfor
mat
ion
(Sha
pe)
AF3 F7 F3 FC5 T7 P7 O1 O2 P8 T8 FC6 F4 F8 AF40
0.2
0.4
Mut
ual I
nfor
mat
ion
(Fla
vor)
AF3 F7 F3 FC5 T7 P7 O1 O2 P8 T8 FC6 F4 F8 AF40
0.2
0.4
Mut
ual I
nfor
mat
ion
(Top
ping
)
TriangleSquareRound
WheatDark RyePlain
SaltPoppyNone
(c) MI(Alpha,Preferences)
AF3 F7 F3 FC5 T7 P7 O1 O2 P8 T8 FC6 F4 F8 AF40
0.2
0.4
Mut
ual I
nfor
mat
ion
(Sha
pe)
AF3 F7 F3 FC5 T7 P7 O1 O2 P8 T8 FC6 F4 F8 AF40
0.2
0.4M
utua
l Inf
orm
atio
n(F
lavo
r)
AF3 F7 F3 FC5 T7 P7 O1 O2 P8 T8 FC6 F4 F8 AF40
0.5
1
Mut
ual I
nfor
mat
ion
(Top
ping
)
TriangleSquareRound
WheatDark RyePlain
SaltPoppyNone
(d) MI(Beta,Preferences)
AF3 F7 F3 FC5 T7 P7 O1 O2 P8 T8 FC6 F4 F8 AF40
0.1
0.2
Mut
ual I
nfor
mat
ion
(Sha
pe)
AF3 F7 F3 FC5 T7 P7 O1 O2 P8 T8 FC6 F4 F8 AF40
0.1
0.2
Mut
ual I
nfor
mat
ion
(Fla
vor)
AF3 F7 F3 FC5 T7 P7 O1 O2 P8 T8 FC6 F4 F8 AF40
0.2
0.4
Mut
ual I
nfor
mat
ion
(Top
ping
)
TriangleSquareRound
WheatDark RyePlain
SaltPoppyNone
(e) MI(Gamma,Preferences)
AF3 F7 F3 FC5 T7 P7 O1 O2 P8 T8 FC6 F4 F8 AF40
0.05
0.1
Mut
ual I
nfor
mat
ion
(Sha
pe)
AF3 F7 F3 FC5 T7 P7 O1 O2 P8 T8 FC6 F4 F8 AF40
0.1
0.2
Mut
ual I
nfor
mat
ion
(Fla
vor)
AF3 F7 F3 FC5 T7 P7 O1 O2 P8 T8 FC6 F4 F8 AF40
0.1
0.2
Mut
ual I
nfor
mat
ion
(Top
ping
)
TriangleSquareRound
WheatDark RyePlain
SaltPoppyNone
(f) MI(Total-Power-Spectrum,Preferences)
Figure 10: Mutual information between the extracted features from the δ, θ, α, β, and γ
bands and total spectrum with the class labels of shapes, flavors, and toppings.
encoding of visual stimuli [45]. We suggest that in this study this is relatedto processing of semantically coherent or semantically violated sets of cracker
19
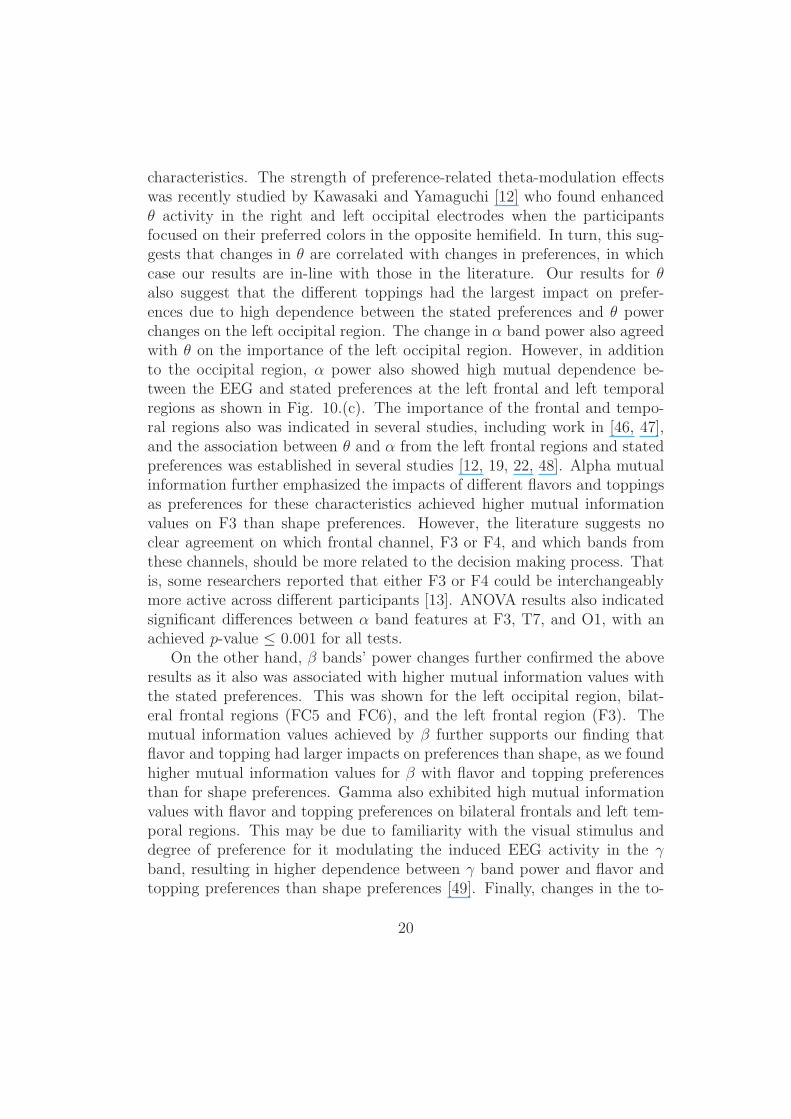
characteristics. The strength of preference-related theta-modulation effectswas recently studied by Kawasaki and Yamaguchi [12] who found enhancedθ activity in the right and left occipital electrodes when the participantsfocused on their preferred colors in the opposite hemifield. In turn, this sug-gests that changes in θ are correlated with changes in preferences, in whichcase our results are in-line with those in the literature. Our results for θalso suggest that the different toppings had the largest impact on prefer-ences due to high dependence between the stated preferences and θ powerchanges on the left occipital region. The change in α band power also agreedwith θ on the importance of the left occipital region. However, in additionto the occipital region, α power also showed high mutual dependence be-tween the EEG and stated preferences at the left frontal and left temporalregions as shown in Fig. 10.(c). The importance of the frontal and tempo-ral regions also was indicated in several studies, including work in [46, 47],and the association between θ and α from the left frontal regions and statedpreferences was established in several studies [12, 19, 22, 48]. Alpha mutualinformation further emphasized the impacts of different flavors and toppingsas preferences for these characteristics achieved higher mutual informationvalues on F3 than shape preferences. However, the literature suggests noclear agreement on which frontal channel, F3 or F4, and which bands fromthese channels, should be more related to the decision making process. Thatis, some researchers reported that either F3 or F4 could be interchangeablymore active across different participants [13]. ANOVA results also indicatedsignificant differences between α band features at F3, T7, and O1, with anachieved p-value ≤ 0.001 for all tests.
On the other hand, β bands’ power changes further confirmed the aboveresults as it also was associated with higher mutual information values withthe stated preferences. This was shown for the left occipital region, bilat-eral frontal regions (FC5 and FC6), and the left frontal region (F3). Themutual information values achieved by β further supports our finding thatflavor and topping had larger impacts on preferences than shape, as we foundhigher mutual information values for β with flavor and topping preferencesthan for shape preferences. Gamma also exhibited high mutual informationvalues with flavor and topping preferences on bilateral frontals and left tem-poral regions. This may be due to familiarity with the visual stimulus anddegree of preference for it modulating the induced EEG activity in the γband, resulting in higher dependence between γ band power and flavor andtopping preferences than shape preferences [49]. Finally, changes in the to-
20
tal power spectrum also suggested the importance of the frontal, temporal,and occipital regions, while also suggesting more importance for flavor andtopping preferences than shapes. ANOVA test results further confirmed thesignificant differences across the different channels on β as well as on γ powerfeatures, with an achieved p-value ≤ 0.001 for all tests.
In the final part of this experiment, it should be noted that a key lim-itation of this research was a wide variation in the amounts of EEG dataavailable for each person in each choice set. This in turn resulted in havinginsufficient EEG observations in some choice sets to reliably estimate the ef-fects of the attribute levels on the EEG measures. Future work should try todeal with this issue, and one way to do that would be to present the crackers(or more generally, stimuli with varying features) individually one-at-a-timeto insure that there is no confound. A second possibility is to present theitems in each choice set one-at-a-time, and then observe the choices in eachset collectively.
5. Conclusion
We used a commercially available wireless EEG headset to investigate thebrain activities taking place during decision-making. A series of 57 choicesets, each set described by three choice objects, was shown to participantswith them asked to select (by mouse clicking) their most and least favoritechoice options for a party that they would host. The frequencies of theirchoices were recorded by eye tracker software from a Tobii X60 eye-trackersystem. The eye tracker system was used in this case solely to map thetransition between the choice sets and the actual choice of object. Whenstudying the EEG activities related to the choices made by participants sev-eral important points emerged. The first is that there was a clear phasesynchronization between symmetric frontal and occipital channels with highphase locking values for θ, α. and β. On the other hand, the phase lockingvalue across non-symmetric channels showed higher values among all of theAF3, F3, F4, AF4 while occipital channels were highly synchronized withthe parietal channels. Secondly, in terms of the change in the EEG powerspectrum and the relevance of this change to the stated preferences, the leftfrontal channel (F3), left temporal (T7), and left occipital (O1) were themost important as they showed high mutual information values with thestated preferences. Our analysis also showed that higher mutual informationvalues were achieved by almost all EEG bands power with the flavor and
21
topping labels in comparison to that of the shape. This in turn suggests thatthese attributes of the crackers initiated more cognitive processing in a waywhich caused the power of the different EEG bands to correlate well with thechange in the factors making each of the flavor and topping attributes, i.e.,wheat, dark rye, plain for flavor and salt, poppy, no topping for topping.
Acknowledgment
The authors would like to thank Dr. Tiago Ribeiro from Indera EstudosEconomicos http://www.indera.pt/english.htm and Dr Mili Mormannfrom University of Miami for their invaluable comments on this manuscript.
References
[1] N. Lee, A. J. Broderick, and L. Chamberlain, ”What is neuromarketing?A discussion and agenda for future research”, International Journal ofPsychophysiology, vol. 63, no. 2, pp. 199-204, 2007.
[2] C. R. Madan, ”Neuromarketing: the next step in market research?”,Eureka, vol. 1, no. 1, pp. 34-42, 2010.
[3] H. Plassmann, T. Z. Ramsoy, and M. Milosavljevic, “Branding the brain:A critical review and outlook”, Journal of Consumer Psychology, vol.22, no. 1, pp. 18-36, 2012.
[4] D. Pirouz, ”The Neuroscience of Consumer Decision-Making”, The PaulMerage School of Business, University of California Irvine, MPRA Paperno. 2181, posted 07. November 2007.
[5] C. F. Camerer, G. Loewenstein, and D. Prelec, ”Neuroeconomics: WhyEconomics Needs Brains”, Scandinavian Journal of Economics, vol. 106,no. 3, pp. 555-579, 2004.
[6] D. Ariely and G. S. Berns, “Neuromarketing: the hope and hype ofneuroimaging in business”, Nature Reviews Neuroscience, vol. 11, pp.284-292, 2010.
[7] G. A. Calvert and M. J. Brammer, ”Predicting Consumer Behavior”,IEEE Pulse Magazine, vol. 3, no. 3, pp. 38-41, 2012.
22
[8] L. Astolfi, F. D. Vico Fallani, F. Cincotti, D. Mattia, L. Bianchi, M. G.Marciani, S. Salinari, I. Gaudiano, G. Scarano, R. Soranzo, and F. Ba-biloni, ”Brain activity during the memorization of visual scenes from TVcommercials: An application of high resolution EEG and steady statesomatosensory evoked potentials technologies”, Journal of Physiology -
Paris, vol. 103, no. 6, pp. 333-341, 2009.
[9] R. Ohme, D. Reykowska, D. Wiener, and A. Choromanska, ”Analy-sis of Neurophysiological Reactions to Advertising Stimuli by Means ofEEG and Galvanic Skin Response Measures”’, Journal of Neuroscience,Psychology, and Economics, vol. 2, no. 1, pp. 21-31, 2009.
[10] N. Bourdaud, R. Chavarriaga, R. Galan, and J. Millan, “Characterizingthe EEG correlates of exploratory behavior”, IEEE Transactions on
Neural Systems and Rehabilitation Engineering, vol. 27, no. 6, pp. 549-556, 2008.
[11] R. Ohme, D. Reykowska, D. Wiener, and A. Choromanska, ”Appli-cation of frontal EEG asymmetry to advertising research”, Journal ofEconomic Psychology, vol. 31, no. 5, pp. 785-793, 2010.
[12] M. Kawasaki and Y. Yamaguchi, ”Effects of subjective preference ofcolors on attention-related occipital theta oscillations”, NeuroImage, vol.59, no. 1, pp. 808-814, 2012.
[13] G. M. M. Aurup, “User Preference Extraction from Bio-Signals: An Ex-perimental Study”, Master Thesis, Department of Mechanical and In-dustrial Engineering, Concordia University, Montreal, Quebec, Canada,2011.
[14] P. F. Custdio, “Use of EEG as a Neuroscientific Approach to Advertis-ing Research”, Master Thesis, Instituto Superior Tcnico, UniversidadeTecnica De Lisboa, 2010.
[15] R. N. Khushabaa, L. Greenacreb, S. Kodagodaa, J. Louviereb, S.Burkeb, G. Dissanayake, “Choice modeling and the brain: A study onthe Electroencephalogram (EEG) of preferences”, Expert Systems with
Applications, vol. 39, no. 16, pp. 1237812388, 2012.
23
[16] M. M. Mostafa, “Brain processing of vocal sounds in advertising: Afunctional magnetic resonance imaging (fMRI) study”, Expert Systems
with Applications, vol. 39, no. 15, pp. 1211412122, 2012.
[17] P. H. Kenning and H. Plassmann, ”How Neuroscience Can Inform Con-sumer Research”, IEEE Transactions on Neural Systems and Rehabili-
tation Engineering, vol. 16, no. 6, pp. 532-538, 2008.
[18] L. Astolfi, F. D. V. Fallani, F. Cincotti, D. Mattia, L. Bianchi, M.G. Marciani, S. Salinari, A. Colosimo, A. Tocci, R. Soranzo, and F.Babiloni, “Neural basis for brain responses to TV commercials: A high-resolution EEG study”, IEEE Transactions on Neural Systems and Re-
habilitation Engineering, vol. 27, no. 6, pp. 522-531, 2008.
[19] P. F. Custdio, “Use of EEG as a Neuroscientific Approach to Advertis-ing Research”, Master Thesis, Instituto Superior Tcnico, UniversidadeTecnica De Lisboa, 2010.
[20] G. Vecchiato, W. Kong, A. G. Maglione, and D. Wei, ”Understandingthe Impact of TV Commercials”, IEEE Pulse Magazine, vol. 3, no. 3,pp. 42-47, 2012.
[21] T. Costa, E. Rognoni, and D. Galati, “EEG phase synchronization dur-ing emotional response to positive and negative film stimuli”, Neuro-science Letters, vol. 406, pp. 159-164, 2006.
[22] D. Nie, X. W. Wang, L. C. Shi, and B. L. Lu, “EEG-based EmotionRecognition during Watching Movies”, In Proceedings of the 5th Inter-national IEEE EMBS Conference on Neural Engineering Cancun, Mex-ico, pp. 667-670, 2011.
[23] A. T. Campbell, T. Choudhury, S. Hu, H. Lu, M. K. Mukerjee, M.Rabbi, and R. D. S. Raizada, “Neurophone: Brain-mobile phone inter-face using a wireless eeg headset”. In Proceedings of The Second ACMSIGCOMM Workshop on Networking, Systems, and Applications onMobile Handhelds (MobiHeld10). ACM New York, NY, USA, 2010.
[24] P. Bobrov, A. Frolov, C. Cantor, I. Fedulova, M. Bakhnyan, and A.Zhavoronkov, “Brain-Computer Interface Based on Generation of VisualImages”, PLoS ONE, vol. 6, no. 6, e20674, pp. 1-12, 2011.
24
[25] E. W. Anderson, K. C. Potter, L. E. Matzen, J. F. Shepherd, G. A.Preston, and C. T. Silva, “A User Study of Visualization EffectivenessUsing EEG and Cognitive Load”, Computer Graphics Forum, vol. 30,no. 3, pp. 791-800, 2011.
[26] A. Stopczynski and J. E. Larsen and C. Stahlhut and M. K. Petersenand L. K. Hansen, “A smartphone interface for a wireless EEG headsetwith real-time 3D reconstruction”, Affective Computing and Intelligent
Interaction: Lecture Notes in Computer Science, vol. 6975/2011, pp.317-318, DOI: 10.1007/978-3-642-24571-8-40, 2011.
[27] P. Comon, “Independent component analysisA new concept, Signal Pro-cessing, vol. 36, pp. 287-314, 1994.
[28] A. Hyvarinen, J. Karhunen, and E. Oja, “Independent Component Anal-ysis”, John Wiley and Sons Inc., 2001.
[29] S. Mallat, “A wavelet tour of signal processing, third edition”, AcademicPress, 2009.
[30] M. T. Akhtar, W. Mitsuhashi, and C. J. James, “Employing spatiallyconstrained ICA and wavelet denoising for automatic removal of artifactsfrom multichannel EEG data”, Signal Processing, vol. 92, no. 2, pp. 401-416, 2012.
[31] N. P. Castellanos and V. A. Makarov, “Recovering EEG brain sig-nals: Artifact suppression with wavelet enhanced independent compo-nent analysis”, Journal of Neuroscience Methods, vol. 158, pp. 300-312,2006.
[32] M. P. S. Chawla, “PCA and ICA processing methods for removal ofartifacts and noise in electrocardiograms: A survey and comparison”,Applied Soft Computing, vol. 11, no. 2, pp. 2216-2226, 2011.
[33] M. Aminghafari, N. Cheze, and J. M. Poggi, “Multivariate denoising us-ing wavelets and principal component analysis”, Computational Statis-
tics and Data Analysis, vol. 50, no. 9, pp. 2381-2398, 2006.
[34] X. Ren, Z. Yan, Z. Wang, and X. Hu, “Noise reduction based on ICAdecomposition and wavelet transform for the extraction of motor unit
25
action potentials”, Journal of Neuroscience Methods, vol. 158, no. 2, pp.313-322, 2006.
[35] R. R. Vazqueza, H. Velez-Pereza, R. Ranta, V. L. Dorr, D. Maquin, andL. Maillard, “Blind source separation, wavelet denoising and discrimi-nant analysis for EEG artefacts and noise cancelling”, Biomedical Signal
Processing and Control, vol. 7, no. 4, pp. 389-400, 2012.
[36] C. T. Lin, L. W. Ko, I. F. Chung, T. Y. Huang, Y. C. Chen, T. P. Jung,and S. F. Liang, “Adaptive EEG-Based Alertness Estimation Systemby Using ICA-Based Fuzzy Neural Networks”, IEEE Transactions on
Circuits and Systems-I: Regular Papers, vol. 53, no. 11, pp. 2469-2476,2006.
[37] J. P. Lachaux, E. Rodriguez, J. Martinerie, and F. J. Varela, “MeasuringPhase Synchrony in Brain Signals”, Human Brain Mapping, vol. 8, pp.194208, 1999.
[38] G. J Klir, “Uncertainty and Information: Foundations of Generalizedinformation Theory”, John Wiley and SOns Inc., New Jersey, USA,2006.
[39] T. M. Cover and J. A. Thomas, “Elements of information theory (seconded.)”, John-Wiley and Sons Inc., 2006.
[40] C. E. Shannon and W. Weaver, “The Mathematical Theory of Commu-nication”, Urbana, IL: University of Illinois Press, 1949.
[41] R. Battiti, “Using Mutual Information for Selecting Features in Super-vised Neural Net Learning”, IEEE Transactions on Neural Networks,vol. 5, no. 4, pp. 537-550, 1994.
[42] G. Stefanics, B Hangya4, I. Herndi, I. Winkler, P. Lakatos, and I. Ulbert,“Phase Entrainment of Human Delta Oscillations Can Mediate the Ef-fects of Expectation on Reaction Speed”, The Journal of Neuroscience,vol. 30, no. 41, pp. 13578-13585, 2010.
[43] G. G. Knyazev, “Motivation, emotion, and their inhibitory control mir-rored in brain oscillations”, Neuroscience and Biobehavioral Reviews,vol. 31, pp. 377395, 2007.
26
[44] J. Wacker, D. G. Dillon, and D. A. Pizzagalli, “The role of the nucleusaccumbens and rostral anterior cingulate cortex in anhedonia: Integra-tion of resting EEG, fmri, and volumetric techniques”. NeuroImage, vol.46, pp. 327337, 2009.
[45] L. A. Hald, M. C. M. Bastiaansen, and P. Hagoort, “EEG theta andgamma responses to semantic violations in online sentence processing”,Brain and Language, vol. 96, pp. 90105, 2006.
[46] G. F. Potts and D. M. Tucker, “Frontal evaluation and posterior rep-resentation in target detection”, Cognitive Brain Research, vol. 11, pp.147156. 2001.
[47] B. C. Min, S. H. Jin, I. H. Kang, D. H. Lee, J. K. Kang, S. T. Lee,and K.Sakamoto, “Analysis of mutual information content for EEG re-sponses to odor stimulation for subjects classified by occupation”, Chem-
ical Senses, vol. 28, no. 9, pp. 741-749, 2003.
[48] E. Yokomatsu, S. I. Ito, Y. Mitsukura, C. Jianting, and M. Fukumi, “Adesign of the preference acquisition detection system”, In Proceedings ofthe annual conference of the society of instrument and control engineers(SICE), pp. 28042807, September 1720, Japan.
[49] E. Z. Golumbic, T. Golan, D. Anaki, and S. Bentin, “Human face pref-erence in gamma-frequency EEG activity”, Neuroimage, vol. 39, pp.19801987, 2008.
27
Related Documents


