CONSUMER BUYING BEHAVIOUR OF DURABLE PRODUCTS IN PUDUCHERRY REGION (With a Special Reference to Lawspet, Puducherry). Dr. R. Karuppusamy 1 and K. Veerappan 2 1 Associate Professor of Commerce & Research supervisor, Department of Commerce, Tagore Government Arts & Science college, Puducherry, India, [email protected] 2 Ph.D. Research Scholar in Commerce, PG and Research Department of Commerce, Kanchi Mamunivar Centre for PG Studies, Puducherry, India, Email Id: [email protected] Abstract The study of consumer buying behaviour is an attempt to Understand why, when, where, how, how much and how often and how long consumer will use to dispose of and offering. The consumer durable industry consists of durable products for domestic use such as Televisions, Refrigerators, Washing machines and Air Conditioners. The main objective of the study is to find the social demographic profile of the consumers intends to purchase durable products. To study the brand preference of durable products, it covered the lawspet area, Puducherry. A questionnaire was administered to obtain information for the consumers. The data collected for this study were from 150 respondents. Convenience sampling technique was followed from collecting response from the respondents. Percentage, and weighted average ranking techniques was used for the analysis of data for this study. Based on the findings, few important suggestions were offered for the benefit of marketers and consumers. Key words: Consumer Durable Products, Demographic Variables, Brand Preference 1. Introduction Consumer buying behavior is the study of how individual customers groups or organization, select, buy, use, and dispose ideas, products, and services to satisfy their needs and wants. Consumer durables involve the type of products purchased by the consumers that is manufactured for long-term use. As opposed to many products that are intended for consume in short time, consumer durables are intended to endure regular usage for several years or longer before their replacement is required. Just about every customer contains at least a few items that may be considered to be of consumer durable nature. The consumer buying preferences are rapidly changing the durable market. Product which was once considered luxury items have become availability because of the changing lifestyle, and rising income levels, with growth in disposable incomes, the demand for high-end Science, Technology and Development Volume VIII Issue XII DECEMBER 2019 ISSN : 0950-0707 Page No : 752

Welcome message from author
This document is posted to help you gain knowledge. Please leave a comment to let me know what you think about it! Share it to your friends and learn new things together.
Transcript

CONSUMER BUYING BEHAVIOUR OF DURABLE PRODUCTS IN
PUDUCHERRY REGION (With a Special Reference to Lawspet, Puducherry).
Dr. R. Karuppusamy1 and K. Veerappan2
1 Associate Professor of Commerce & Research supervisor, Department of Commerce, Tagore
Government Arts & Science college, Puducherry, India, [email protected]
2 Ph.D. Research Scholar in Commerce, PG and Research Department of Commerce, Kanchi
Mamunivar Centre for PG Studies, Puducherry, India, Email Id: [email protected]
Abstract
The study of consumer buying behaviour is an attempt to Understand why, when, where,
how, how much and how often and how long consumer will use to dispose of and offering. The
consumer durable industry consists of durable products for domestic use such as Televisions,
Refrigerators, Washing machines and Air Conditioners. The main objective of the study is to
find the social demographic profile of the consumers intends to purchase durable products. To
study the brand preference of durable products, it covered the lawspet area, Puducherry. A
questionnaire was administered to obtain information for the consumers. The data collected for
this study were from 150 respondents. Convenience sampling technique was followed from
collecting response from the respondents. Percentage, and weighted average ranking techniques
was used for the analysis of data for this study. Based on the findings, few important suggestions
were offered for the benefit of marketers and consumers.
Key words: Consumer Durable Products, Demographic Variables, Brand Preference
1. Introduction
Consumer buying behavior is the study of how individual customers groups or
organization, select, buy, use, and dispose ideas, products, and services to satisfy their needs and
wants. Consumer durables involve the type of products purchased by the consumers that is
manufactured for long-term use. As opposed to many products that are intended for consume in
short time, consumer durables are intended to endure regular usage for several years or longer
before their replacement is required. Just about every customer contains at least a few items that
may be considered to be of consumer durable nature.
The consumer buying preferences are rapidly changing the durable market. Product
which was once considered luxury items have become availability because of the changing
lifestyle, and rising income levels, with growth in disposable incomes, the demand for high-end
Science, Technology and Development
Volume VIII Issue XII DECEMBER 2019
ISSN : 0950-0707
Page No : 752

products such as televisions, refrigerators, washing machines and air conditioners have increase
considerably. It is also facilitated by the easy availability of finance and prevalence of Nuclear
families.
2. Size of Consumer Durable Market
Rise in disposable income, easy access to credit and electrification are likely to accelerate
the demand in this sector. The sector has a huge untapped market for appliances like air
conditioners, washing machine and refrigerators. Air conditioners have a penetration of 4
percent in India, compared to global average of 30 percent. 100 percent FDI allowed in
electronic hardware manufacturing sector under the automatic route. National electronics policy
will also boost investment in the sector. The consumer durables sector in India has attracted
significant investments over the years.
3. Review of literature
Renugadevi, et al.1 (2016) Published a research paper on, “A Study on customer response
towards the selected consumer durables of MNC’s In Coimbatore city.” The main objective of
the study is to identify the demographic factors and factors influencing consumer’s brand
preference which influences the level of satisfaction of the respondents. They use simple
percentage and statistical tools like, average score analysis, ranking analysis were applied to
realize the objective of the study. The study reveals that in spite of a number of well established
Indian companies like Godrej, Videocon, Onida, BPL, etc., and people have gone for MNC’s
products for their quality, brand image, technology updating, etc.
Saravanakumar and Nithyadevi2 (2016) in their article, “A study on Consumer Behaviour of
Women in Durable Goods- with Special Reference to Pollachi Taluk”. Studied the
socioeconomic profile of the selected woman consumers and to examine the problem faced by
the women while purchasing. The sample of 50 were selected as respondents consumers in
pollachi taluck and the data were collected. Convenient sampling method was adopted in this
study. Simple percentage which is applied to find the behavior of women consumer and other
factors of the study. The study concludes that it is quite crucial to improve center product with
fee addition to enhance client satisfaction more in the similar fee range.
Subhadeep Chakrabotry3 (2016) in their study, “Brand Preference of Consumers towards
selected Consumer Durables A case study of Tinsukia Town, framed the objectives as to identify
the factors affecting brand preference of consumer durables in the study area. The consumer
Science, Technology and Development
Volume VIII Issue XII DECEMBER 2019
ISSN : 0950-0707
Page No : 753

durables selected for the study are color television, ceiling fan, pressure cooker, refrigerator,
electric iron, and electric mixer keeping in view that those products are mostly used by the
consumer as durable products. The sample size of the study 371 households and the quota
sampling technique was used. Tools used for the Simple Percentage analysis and Chi Square
were used for the analysis of data. The marketers to find out the factors influencing the brand
preference of consumers for consumer durables and also to know the satisfaction level of
customers of consumer durables. The study concluded that the study was very important for
marketing view pointed consumer buying behaviour and consumers can avail quality in the
market.
Seema Johar4 (2015) in their study entitled, “To study the Consumer Decision Making Behavior
for Purchase of Durable Goods”. The study was undertaken in Loni town (Ghaziabad) in which
Females play a significant role in the domestic and socio-economic life in the society a total of
125 respondents residing in the Loni town formed as sample size for which convenience
sampling method was adopted to pick the sample respondents. Simple percentage analysis was
applied for analysis. Overall, it is argued study of consumer behavior is rapidly evolving as
research recognize and implement new techniques and perspective to understand the nature of
purchase and consumption behavior of female. The result of this studied was emphasized and
further supported the importance of perception of female consumers as an important element of
female purchase decision.
Purushothaman and Krishnamurthy5 (2015) in their study entitled, “A Study on consumer
buying behaviour (with special reference to home appliances in Vellore district). The main
objective of the study is to find out the most influencing source of information for the purchase
of home appliances. Simple random sampling method was applied to collect data from 250
sample respondents. The respondents are particularly Selected those who use microwave oven,
washing machine and refrigerators. Study is used only simple percentage technique. The result
of this study showed that scientific advancements and technological improvements make the
consumers keep abreast of the latest information about the availability of home appliances in the
market.
4. Research Gap
The review of earlier studies focus on the particular concept of durable products like consumer
response, behavior of women consumers towards durable goods, brand preferences etc. But the
Science, Technology and Development
Volume VIII Issue XII DECEMBER 2019
ISSN : 0950-0707
Page No : 754
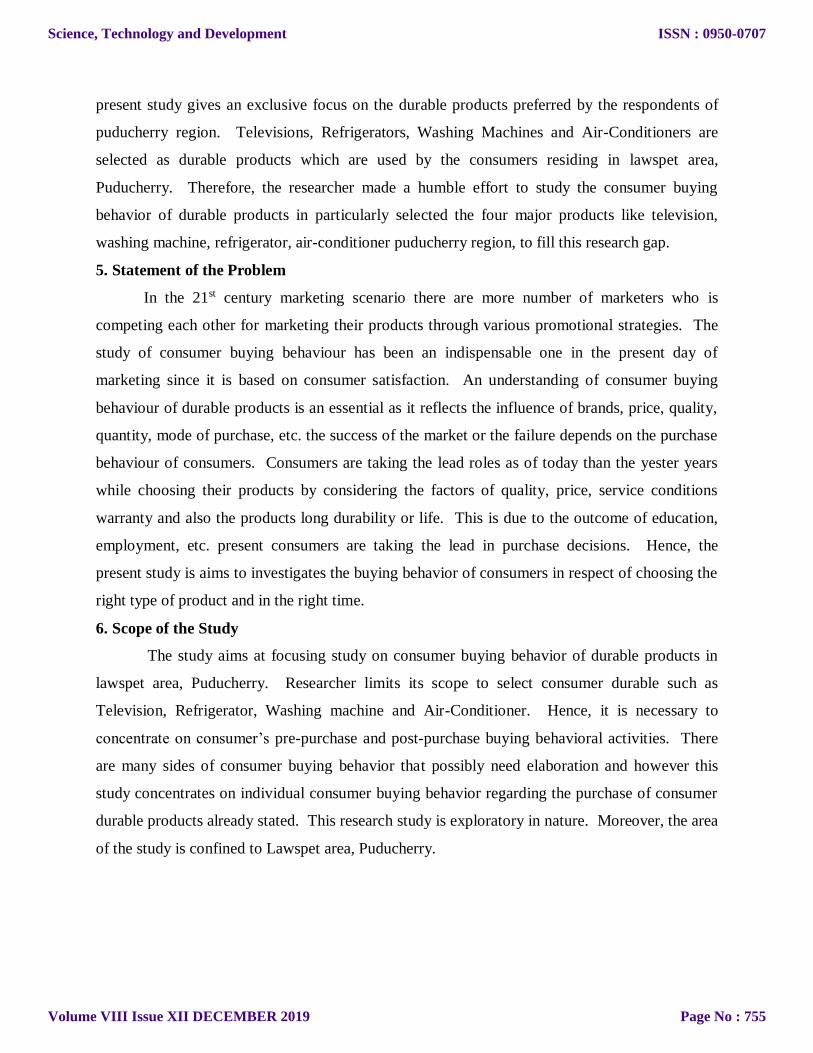
present study gives an exclusive focus on the durable products preferred by the respondents of
puducherry region. Televisions, Refrigerators, Washing Machines and Air-Conditioners are
selected as durable products which are used by the consumers residing in lawspet area,
Puducherry. Therefore, the researcher made a humble effort to study the consumer buying
behavior of durable products in particularly selected the four major products like television,
washing machine, refrigerator, air-conditioner puducherry region, to fill this research gap.
5. Statement of the Problem
In the 21st century marketing scenario there are more number of marketers who is
competing each other for marketing their products through various promotional strategies. The
study of consumer buying behaviour has been an indispensable one in the present day of
marketing since it is based on consumer satisfaction. An understanding of consumer buying
behaviour of durable products is an essential as it reflects the influence of brands, price, quality,
quantity, mode of purchase, etc. the success of the market or the failure depends on the purchase
behaviour of consumers. Consumers are taking the lead roles as of today than the yester years
while choosing their products by considering the factors of quality, price, service conditions
warranty and also the products long durability or life. This is due to the outcome of education,
employment, etc. present consumers are taking the lead in purchase decisions. Hence, the
present study is aims to investigates the buying behavior of consumers in respect of choosing the
right type of product and in the right time.
6. Scope of the Study
The study aims at focusing study on consumer buying behavior of durable products in
lawspet area, Puducherry. Researcher limits its scope to select consumer durable such as
Television, Refrigerator, Washing machine and Air-Conditioner. Hence, it is necessary to
concentrate on consumer’s pre-purchase and post-purchase buying behavioral activities. There
are many sides of consumer buying behavior that possibly need elaboration and however this
study concentrates on individual consumer buying behavior regarding the purchase of consumer
durable products already stated. This research study is exploratory in nature. Moreover, the area
of the study is confined to Lawspet area, Puducherry.
Science, Technology and Development
Volume VIII Issue XII DECEMBER 2019
ISSN : 0950-0707
Page No : 755

7. Objectives of the Study
1. To study the socio-demographic profile of the consumers intend to purchase durable
products.
2. To study the brand preference made by the consumers of this region in respect of durable
products such as Television, Washing machine, Refrigerator and Air conditioner.
8. Methodology
8. 1. Sampling
This research study is of descriptive nature and has used the quantitative research method
and a convenience sampling method was adopted to collect data from the respondents residing
from the Lawspet area.
8. 2. Sample Size
A total of 150 respondents were selected for this study and questionnaires were
distributed to the respondents without considering whether the respondents are using durable
products or not. 30 questionnaires were found either incomplete or unable to collect. Therefore,
those questionnaires were rejected. Hence the sample size for the study is limits to 120
respondents.
8. 3. Source of Data
The data collected from primary and secondary sources. Primary data is collected by
using well structure questionnaire. The questionnaire was framed in such way that, to study the
profile of the respondents, study the brand preference of the consumer and buying behaviour. In
order to have adequate representation of respondents of all age between 18 years and above. The
researcher approached a select respondents and collected data in a sequential order. Secondary
data has been collected from previous dissertations, research papers, marketing journals,
consumer behavior journals, magazines, newspapers, text books and most prominent websites.
8. 4. Statistical Tools user for the Study
Simple Percentage analysis
Weighted Average Ranking Analysis.
Chi-square test
Science, Technology and Development
Volume VIII Issue XII DECEMBER 2019
ISSN : 0950-0707
Page No : 756
9. Limitations of the Study
The range of consumer durable products available in the market is very large, but the
present study covers the product’s viz, Television, Refrigerator, Washing Machine and Air-
Conditioner only. The universe being large, the study is restricted to respondents residing in
Lawpet Area, Puducherry.
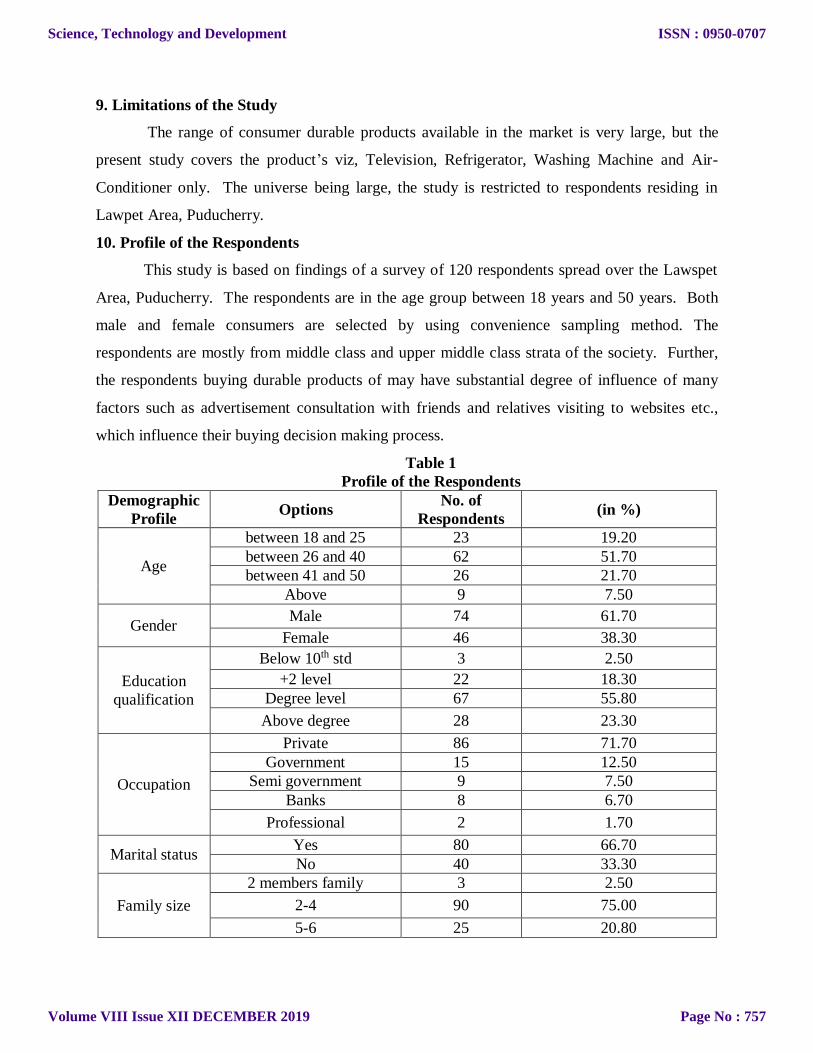
10. Profile of the Respondents
This study is based on findings of a survey of 120 respondents spread over the Lawspet
Area, Puducherry. The respondents are in the age group between 18 years and 50 years. Both
male and female consumers are selected by using convenience sampling method. The
respondents are mostly from middle class and upper middle class strata of the society. Further,
the respondents buying durable products of may have substantial degree of influence of many
factors such as advertisement consultation with friends and relatives visiting to websites etc.,
which influence their buying decision making process.
Table 1
Profile of the Respondents
Demographic
Profile Options
No. of
Respondents (in %)
Age
between 18 and 25 23 19.20
between 26 and 40 62 51.70
between 41 and 50 26 21.70
Above 9 7.50
Gender Male 74 61.70
Female 46 38.30
Education
qualification
Below 10th std 3 2.50
+2 level 22 18.30
Degree level 67 55.80
Above degree 28 23.30
Occupation
Private 86 71.70
Government 15 12.50
Semi government 9 7.50
Banks 8 6.70
Professional 2 1.70
Marital status Yes 80 66.70
No 40 33.30
Family size
2 members family 3 2.50
2-4 90 75.00
5-6 25 20.80
Science, Technology and Development
Volume VIII Issue XII DECEMBER 2019
ISSN : 0950-0707
Page No : 757
Above 6 members 2 1.70
Type of family Nuclear family 99 82.50
Join family 21 17.50
Individual
Income
Below 10000 10 8.30
Between 10001 and 20000 32 26.70
Between 20001 and 30000 39 32.50
Between 30001 and 40000 27 22.50
Above 40000 12 10.00
From the above table, it is obvious to witness that majority 51.70 percent of the
respondents belongs to the age group between 26 and 40 years and 61.70 percent of the
respondents were male. Majority 55.80 percent of the respondents were degree graduate and
71.70 percent of the respondents were working in private organizations. Majority 66.70 percent
of the respondents were married and 75% of the respondents have a family size of 2-4 members.
Huge majority of respondents live as nuclear family. The family income relys between Rs.
20000 and Rs. 30000 which amounts around 33 percent. Only 10 percent of the respondents
earn above Rs. 40000.
Table 2
Do you have Television
Respondents (in %)
YES 100 100
NO - -
Table 2 shows that 100% of the respondents do have television sets in their homes.
Table 3
Television Brands
Television Brands
Brands Name Respondents (in %)
Samsung 19 15.80
LG 20 16.70
Sony 30 25.00
Toshiba 19 15.80
Panasonic 11 9.20
Mi 10 8.30
Vu 6 5.00
Others 5 4.20
Science, Technology and Development
Volume VIII Issue XII DECEMBER 2019
ISSN : 0950-0707
Page No : 758
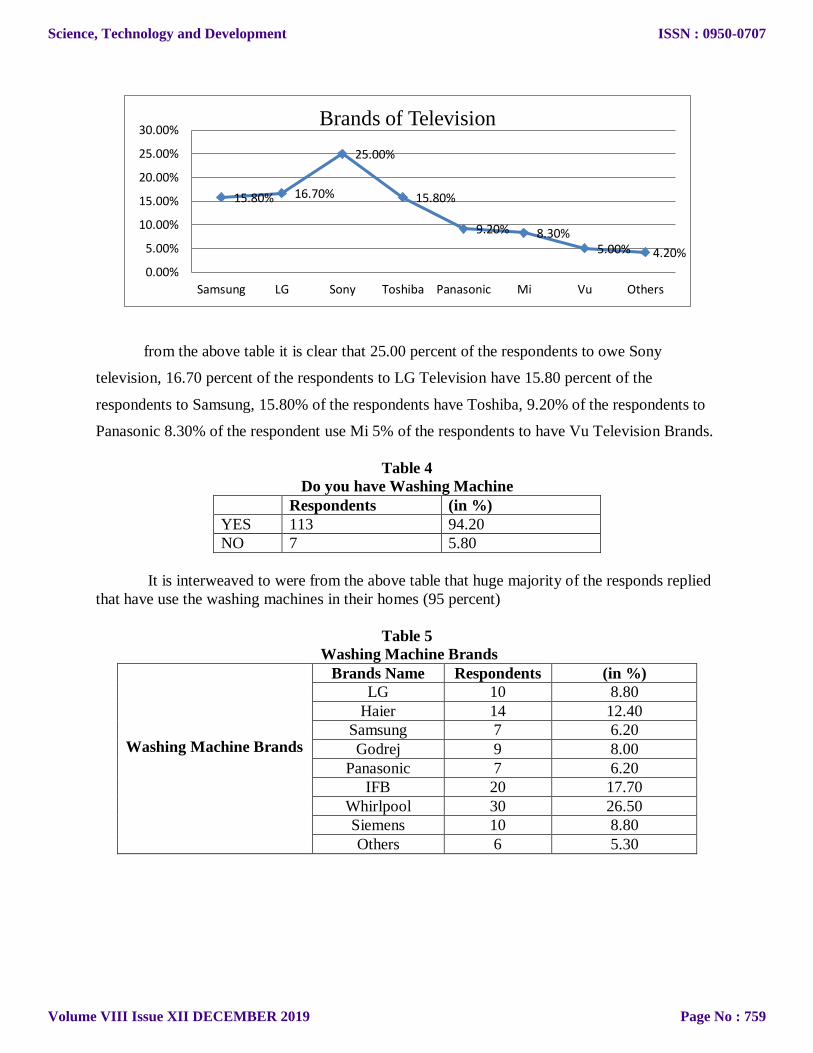
from the above table it is clear that 25.00 percent of the respondents to owe Sony
television, 16.70 percent of the respondents to LG Television have 15.80 percent of the
respondents to Samsung, 15.80% of the respondents have Toshiba, 9.20% of the respondents to
Panasonic 8.30% of the respondent use Mi 5% of the respondents to have Vu Television Brands.
Table 4
Do you have Washing Machine
Respondents (in %)
YES 113 94.20
NO 7 5.80
It is interweaved to were from the above table that huge majority of the responds replied
that have use the washing machines in their homes (95 percent)
Table 5
Washing Machine Brands
Washing Machine Brands
Brands Name Respondents (in %)
LG 10 8.80
Haier 14 12.40
Samsung 7 6.20
Godrej 9 8.00
Panasonic 7 6.20
IFB 20 17.70
Whirlpool 30 26.50
Siemens 10 8.80
Others 6 5.30
15.80% 16.70%
25.00%
15.80%
9.20% 8.30%5.00% 4.20%
0.00%
5.00%
10.00%
15.00%
20.00%
25.00%
30.00%
Samsung LG Sony Toshiba Panasonic Mi Vu Others
Brands of Television
Science, Technology and Development
Volume VIII Issue XII DECEMBER 2019
ISSN : 0950-0707
Page No : 759

from the table 5, it is observed that, Whirlpool and IFB washing machines are most
famous brands and around 45 percent of the respondents used those brands followed by Haier
Siemens and LG controble around 20 percent of the market. Near of the washing machines Viz
Samsung, Godrej and Panasonic etc. forms very merge percentage.
Table 6
Do you have Refrigerator
Table 6, shows that good majority (96.70 percent) of the respondents have refrigerator in
their residence. Only 3.30 percent of the respondents do not have refrigerators.
Table 7
Refrigerator Brands
Refrigerator
Brands
Brands Name Respondents (in %)
Bosch 14 12.10
Godrej 10 8.60
Samsung 18 15.50
LG 30 25.90
Haier 8 6.90
Panasonic 8 6.90
Videocon 9 7.80
Whirlpool 15 12.90
Others 4 3.40
8.80%
12.40%
6.20%8.00%
6.20%
17.70%
26.50%
8.80%
5.30%
0.00%
5.00%
10.00%
15.00%
20.00%
25.00%
30.00%
LG Haier Samsung Godrej Panasonic IFB Whirlpool Siemens Others
Brands of Washing Machine
Respondents (in %)
YES 116 96.70
NO 4 3.30
Science, Technology and Development
Volume VIII Issue XII DECEMBER 2019
ISSN : 0950-0707
Page No : 760

The above table 7 shows that, LG brand is the one which is used by the majority among
the respondents 25.90 percent followed by Samsung, whirlpool and Bosch. Near of the products
Viz, Godrej, Videocon, Haier, Panasonic are very negligible in percentage.
Table 8
Do you have Air-Conditioner
Respondents (in %)
YES 107 89.20
NO 13 10.80
Table 8, It shows that 89.20 percent of the respondents have Air-Conditioner in this
homes. It is important to note that, Pondicherry is one of the hotter cities in India during
summer, hence the people are formed to install for A/C machines in their homes for the better
management of summer season. 10.80 percent of the respondents do not have Air-Conditioner.
Table 9
Air-Conditioner Brands
Air-Conditioner
Brands
Brands Name Respondents (in %)
Voltas 20 18.70
Samsung 7 6.50
Hitachi 12 11.20
Daikin 15 14.00
Blue Star 9 8.40
LG 12 11.20
O General 8 7.50
Carrier 10 9.30
Ken Star 7 6.50
Others 3 2.80
12.10%8.60%
15.50%
25.90%
6.90% 6.90% 7.80%
12.90%
3.40%0.00%
5.00%
10.00%
15.00%
20.00%
25.00%
30.00%
Brands Refrigerator
Science, Technology and Development
Volume VIII Issue XII DECEMBER 2019
ISSN : 0950-0707
Page No : 761

The above table 9 shows that consumers prefer different brands air conditioning
machines according to their whines and farcies out of the total respondents around 20 percent of
then use voltas Air-conditioner machines followed by Daikin, Hitachi and LG etc., around 15
percent of the total respondents do not use Air-conditioner machines
Table 10
Ranking on product preferences
Factors Ranked by Respondents
S.No Variables 1 2 3 4 5 6 7 8 9 10 Wgt* Wgt%** Rank
1 Price 40 20 12 10 8 8 7 5 6 4 427 8.71 5
2 Quality 70 10 15 5 5 6 4 2 2 1 290 5.91 1
3 Brand 35 25 15 5 18 12 4 2 2 2 394 8.04 4
4 Colour &
Esthetics
15 10 9 8 9 7 10 10 20 22 651 13.29 7
5 Shape/Size 25 10 5 10 9 10 9 8 10 24 662 13.51 8
6 Design 28 28 10 15 10 9 8 5 4 3 440 8.98 6
7 After sales
service / post
purchase
service
20 13 8 10 7 10 8 9 15 20 668 13.63 9
8 Guarantee /
Warranty
offered
61 10 12 9 8 6 4 5 3 2 344 7.02 3
9 Technical
Features
56 15 15 10 8 6 4 2 1 1 310 6.32 2
10 Offers and
Discounts
15
10
10 9 8 12 8 10 15 23 714 14.57 10
Total 4900 100%
18.70%
6.50%
11.20%14.00%
8.40%11.20%
7.50%9.30%
6.50%
2.80%0.00%
5.00%
10.00%
15.00%
20.00%Brands of Air-Conditioner
Science, Technology and Development
Volume VIII Issue XII DECEMBER 2019
ISSN : 0950-0707
Page No : 762
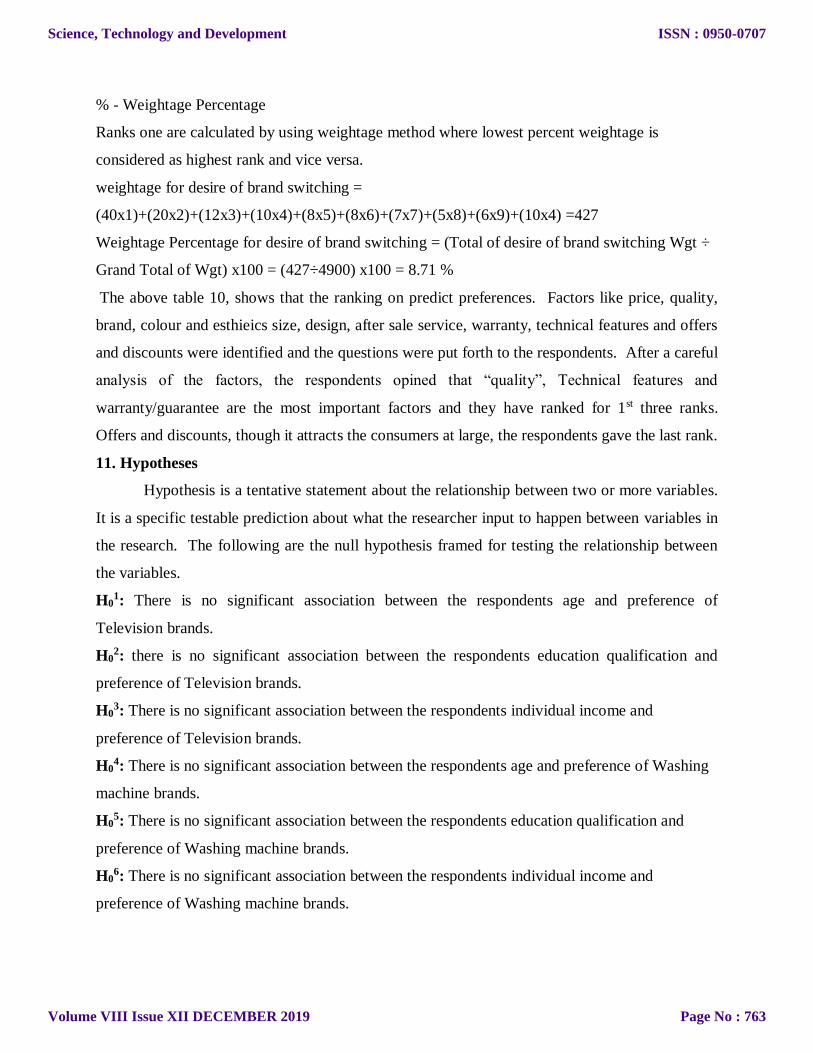
% - Weightage Percentage
Ranks one are calculated by using weightage method where lowest percent weightage is
considered as highest rank and vice versa.
weightage for desire of brand switching =
(40x1)+(20x2)+(12x3)+(10x4)+(8x5)+(8x6)+(7x7)+(5x8)+(6x9)+(10x4) =427
Weightage Percentage for desire of brand switching = (Total of desire of brand switching Wgt ÷
Grand Total of Wgt) x100 = (427÷4900) x100 = 8.71 %
The above table 10, shows that the ranking on predict preferences. Factors like price, quality,
brand, colour and esthieics size, design, after sale service, warranty, technical features and offers
and discounts were identified and the questions were put forth to the respondents. After a careful
analysis of the factors, the respondents opined that “quality”, Technical features and
warranty/guarantee are the most important factors and they have ranked for 1st three ranks.
Offers and discounts, though it attracts the consumers at large, the respondents gave the last rank.
11. Hypotheses
Hypothesis is a tentative statement about the relationship between two or more variables.
It is a specific testable prediction about what the researcher input to happen between variables in
the research. The following are the null hypothesis framed for testing the relationship between
the variables.
H01: There is no significant association between the respondents age and preference of
Television brands.
H02: there is no significant association between the respondents education qualification and
preference of Television brands.
H03: There is no significant association between the respondents individual income and
preference of Television brands.
H04: There is no significant association between the respondents age and preference of Washing
machine brands.
H05: There is no significant association between the respondents education qualification and
preference of Washing machine brands.
H06: There is no significant association between the respondents individual income and
preference of Washing machine brands.
Science, Technology and Development
Volume VIII Issue XII DECEMBER 2019
ISSN : 0950-0707
Page No : 763

H07: There is no significant association between the respondents age and preference of
Refrigerator brands.
H08: There is no significant association between the respondents education qualification and
preference of Refrigerator brands.
H09: There is no significant association between the respondents individual income and
preference of Refrigerator brands.
H010: There is no significant association between the respondents age and preference of Air-
conditioner brands.
H011: There is no significant association between the respondents education qualification and
preference of Air-conditioner brands.
H012: There is no significant association between the respondents individual income and
preference of Air-conditioner brands.
H013: There is no significant association between the respondents age and avail financial option.
H014: There is no significant association between the respondents education qualification and
avail financial option.
H015: There is no significant association between the respondents individual income and avail
financial option.
Table 11
Chi-square test value
Sl
No
Variables p value df Chi-
square
value
Null
Hypothesis
1 Age and Television brands 0.001** 18 48.139 Rejected
2 Education qualification and Television
brands
0.019* 18 24.852 Rejected
3 Individual Income and Television brands 0.083 24 34.082 Accepted
4 Age and Washing machine brands 0.001** 24 57.018 Rejected
5 Education qualification and Washing
machine brands .414 24 24.852 Accepted
6 Individual income and Washing machine 0.001** 32 76.027 Rejected
7 Age and Refrigerator brands 0.316 24 26.751 Accepted
8 Education qualification and Refrigerator
brands 0.001** 24 66.770 Rejected
9 Individual Income and Refrigerator brands 0.060 32 45.310 Accepted
10 Age and Air-conditioner brands 0.001** 27 81.726 Rejected
11 Education qualification and Air-conditioner
brands 0.177 27 33.619 Accepted
Science, Technology and Development
Volume VIII Issue XII DECEMBER 2019
ISSN : 0950-0707
Page No : 764

12 Individual Income and air-conditioner
brands 0.008** 36 59.708 Rejected
13 Age and avail financial options 0.001** 12 20.035 Rejected
14 Education qualification and Avail financial
options 0.066 12 20.035 Accepted
15 Individual Income and Avail financial
options 0.006** 16 33.607 Rejected
Note: ** 1% Highly significant level and *5% significant level
The above table obviously shows the association between the age, education qualification
and individual income of respondents and preference for Television, Washing machine,
Refrigerator Air-conditioner brands and avail finance options. From the table, there are ten
hypotheses testing is observed that the Pearson chi-square is 0.001(<0.05) has been achieved.
From this, since the calculated value is less than the critical value ate 5% level of significance,
the null hypothesis is rejected. It means that there is no significant association between the
respondents’ age, education qualification, individual income and preference of Television,
Washing machine, Refrigerator Air-conditioner brands and avail financial options.
12. Findings of the study
Majority of the respondents (51.70 percent) are belonging to the age group between 26
and 40 years.
Majority of the respondents (61.70 percent) are male.
Majority of the respondents (55.80 percent) have degree level qualification.
71.70% percent of the respondents working in a private organizations
Majority respondents family size contain two to fore members (75 percent)
Huge majority of the respondents 82.50 percent live as nuclear family.
32.50 percent of the respondents’ monthly income is between Rs. 21000 and Rs. 30000.
It was found that all the respondents have television in their home.
Maximum respondents (27.50 percent) use Sony television brand.
95 percent of respondents use washing machine in their homes. Out of which whirlpool
and IFB are the most popular brands among the respondents.
96.70 percent respondent use refrigerators.
LG, Samsung and Bosch refrigerators are the most preferred brands among the
respondents. In case of refrigerators the see more was quality and less price.
Only 89.20 percent of respondents use air-conditioners in their residence.
Science, Technology and Development
Volume VIII Issue XII DECEMBER 2019
ISSN : 0950-0707
Page No : 765
Voltas air-conditioner is the most popular amongst all brands.
As for as brand preference is concerned the factors were identified and it was put forth
with the sample respondents for ranking of factors. The result shows that “quality”,
Technical features and warranty and guarantee occupied the first three ranks. After sale
service and offers and discounts occupy the least two ranks.
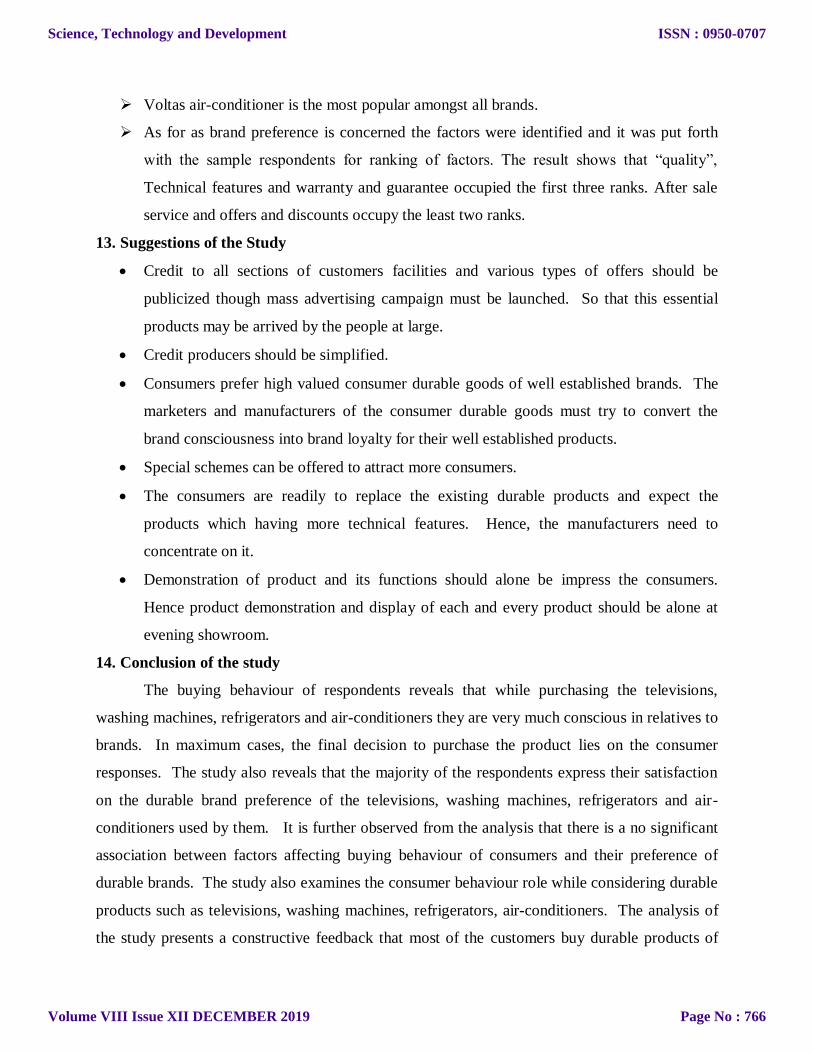
13. Suggestions of the Study
Credit to all sections of customers facilities and various types of offers should be
publicized though mass advertising campaign must be launched. So that this essential
products may be arrived by the people at large.
Credit producers should be simplified.
Consumers prefer high valued consumer durable goods of well established brands. The
marketers and manufacturers of the consumer durable goods must try to convert the
brand consciousness into brand loyalty for their well established products.
Special schemes can be offered to attract more consumers.
The consumers are readily to replace the existing durable products and expect the
products which having more technical features. Hence, the manufacturers need to
concentrate on it.
Demonstration of product and its functions should alone be impress the consumers.
Hence product demonstration and display of each and every product should be alone at
evening showroom.
14. Conclusion of the study
The buying behaviour of respondents reveals that while purchasing the televisions,
washing machines, refrigerators and air-conditioners they are very much conscious in relatives to
brands. In maximum cases, the final decision to purchase the product lies on the consumer
responses. The study also reveals that the majority of the respondents express their satisfaction
on the durable brand preference of the televisions, washing machines, refrigerators and air-
conditioners used by them. It is further observed from the analysis that there is a no significant
association between factors affecting buying behaviour of consumers and their preference of
durable brands. The study also examines the consumer behaviour role while considering durable
products such as televisions, washing machines, refrigerators, air-conditioners. The analysis of
the study presents a constructive feedback that most of the customers buy durable products of
Science, Technology and Development
Volume VIII Issue XII DECEMBER 2019
ISSN : 0950-0707
Page No : 766

popular brands from the market. Further, this analysis bring out fact that offers and discounts are
not that much indulge the consumers to buy the durable commodities.
REFRENCE
1. Renugadevi.M, Ramya.M, Ramya.S, Sangeetha.R, 2016 “A Study on customer response
towards the selected Consumer Durables of Mnc’s In Coimbatore City” International
Journal of Multidisciplinary Research and Development, Vol.3, Issue 5, pp.126-130.
2. Saravanakumar.S, and Nithyadevi.M, 2016 “A Study on Consumer Behaviour of Women
in Durable Goods” International Journal of Multidisciplinary Research and Modern
Education, Vol. II, Issue I, pp.108-111.
3. Subhadeep Chakraborty, 2016 “Brand Preference of Consumers towards Selected
Consumer Durables: A case Study of Tinsukia Town” International Journal on Customer
Relations, Vol. 4, Issue 2, pp. 11-18.
4. Seema Johar, 2015 “To Study the Consumer Decision Making Behaviour to Purchase of
Durable Goods” International Journal of Applied and Pure Science and Agriculture, Vol.
01, Issue 12, pp. 85-92.
5. Purushothaman.G, Krishnamurthy.K, 2015 “A study on consumer Buying Behaviour
(with special reference to Home Appliances in Vellore District, Journal of sales and
Marketing Management, Vol. 1, Issue 1, pp. 19-24.
6. R.S.N. Pillai bagavathi 2013 Marketing management by Nirja publisher & printers
pvt.Ltd, ISBN: 81-219-3244-0
7. Leon G. Schiffman and Leslie Lazar Kanuk 2004 Consumer behavior Published by
Pearson education (Singapore) Pte. Ltd., ISBN: 81-297-0197-9.
8. lhttp://www.ukessays.com/essays/marketing/analysis-of-impulse-buying-marketing-
essay.php#ixzz35NiXcG4K
9. https://www.indianretailer.com/news/Nielsen-survey-on-consumer-buying-behaviour-4260/
10. https://www.ibef.org/industry/information-technology-india.aspx
Science, Technology and Development
Volume VIII Issue XII DECEMBER 2019
ISSN : 0950-0707
Page No : 767
Related Documents


![Buying behaviour[1]](https://static.cupdf.com/doc/110x72/54b9b57a4a7959a4738b46d7/buying-behaviour1.jpg)