Consumer Bankruptcy and Financial Health * Will Dobbie Paul Goldsmith-Pinkham Princeton University and NBER Harvard University Crystal Yang Harvard Law School January 2015 Abstract This paper estimates the effect of Chapter 13 bankruptcy protection on post-filing financial outcomes using a new dataset linking bankruptcy filings to credit bureau records. Our empirical strategy uses the leniency of randomly-assigned judges as an instrument for Chapter 13 protec- tion. Over the first five post-filing years, we find that Chapter 13 protection decreases an index measuring adverse financial events such as civil judgments and repossessions by 0.316 standard deviations, increases the probability of being a homeowner by 13.2 percentage points, and in- creases credit scores by 14.9 points. Chapter 13 protection has little impact on open unsecured debt, but decreases the amount of debt in collections by $1,315. We find evidence that both debt forgiveness and protection from debt collectors are important drivers of our results. * We thank Tal Gross, Matthew Notowidigdo, and Jialan Wang for providing the bankruptcy data used in this analysis. We also thank Lanier Benkard, Raj Chetty, Roland Fryer, Edward Glaeser, Guido Imbens, Lawrence Katz, and numerous seminar participants for helpful comments and suggestions. Jessica Wagner provided outstanding research assistance. Correspondence can be addressed to the authors by e-mail: [email protected] [Dobbie], [email protected] [Goldsmith-Pinkham], or [email protected] [Yang]. All remaining errors are our own.

Welcome message from author
This document is posted to help you gain knowledge. Please leave a comment to let me know what you think about it! Share it to your friends and learn new things together.
Transcript

Consumer Bankruptcy and Financial Health∗
Will Dobbie Paul Goldsmith-PinkhamPrinceton University and NBER Harvard University
Crystal YangHarvard Law School
January 2015
Abstract
This paper estimates the effect of Chapter 13 bankruptcy protection on post-filing financialoutcomes using a new dataset linking bankruptcy filings to credit bureau records. Our empiricalstrategy uses the leniency of randomly-assigned judges as an instrument for Chapter 13 protec-tion. Over the first five post-filing years, we find that Chapter 13 protection decreases an indexmeasuring adverse financial events such as civil judgments and repossessions by 0.316 standarddeviations, increases the probability of being a homeowner by 13.2 percentage points, and in-creases credit scores by 14.9 points. Chapter 13 protection has little impact on open unsecureddebt, but decreases the amount of debt in collections by $1,315. We find evidence that bothdebt forgiveness and protection from debt collectors are important drivers of our results.
∗We thank Tal Gross, Matthew Notowidigdo, and Jialan Wang for providing the bankruptcy data used in thisanalysis. We also thank Lanier Benkard, Raj Chetty, Roland Fryer, Edward Glaeser, Guido Imbens, Lawrence Katz,and numerous seminar participants for helpful comments and suggestions. Jessica Wagner provided outstandingresearch assistance. Correspondence can be addressed to the authors by e-mail: [email protected] [Dobbie],[email protected] [Goldsmith-Pinkham], or [email protected] [Yang]. All remaining errors are our own.

America is a nation of debtors. The amount of debt held by the average American consumer
increased from $31,840 to $45,500 between 2003 and 2013, with more than 14 percent of consumers
having at least one debt in collections by 2013 (Federal Reserve Bank of New York 2014). The-
oretical work has long suggested that excessive debt and financial distress can distort repayment,
consumption, and labor supply decisions (e.g. Myers 1977, Krugman 1988). For example, borrow-
ers with excessive debt have an incentive to avoid repayment through strategies with significant
deadweight costs, such as leaving the formal banking system to avoid seizure of assets or leaving the
formal labor market to avoid wage garnishment. Consistent with this literature, recent empirical
work shows that debt overhang reduces labor supply (Dobbie and Song forthcoming) and increases
mortgage default rates (Melzer 2012).1 Perhaps the most important program meant to alleviate the
adverse consequences of financial distress is the consumer bankruptcy system, the legal process to
resolve unpaid debts in the United States.
The consumer bankruptcy system allows debtors to choose between Chapter 7 bankruptcy,
which provides debt relief and protection from wage garnishment in exchange for a debtor’s non-
exempt assets, and Chapter 13 bankruptcy, which adds the protection of most assets in exchange
for a partial repayment of debt. Each year, more than one million Americans file for bankruptcy
protection, with nearly one in ten American households having filed for bankruptcy at some point
in their lifetimes (Stavins 2000). In terms of financial distress, bankruptcy filers are nearly two and
half times as likely to have a delinquent debt before filing compared to the typical credit user, twice
as likely to have a debt in collections, and three times as likely to have a lien or repossession. Even
after filing, bankruptcy filers are much more likely to experience financial distress than otherwise
similar individuals.2
Despite over one percent of American households filing for bankruptcy each year, little is
known about whether bankruptcy protection reduces or exacerbates financial distress. In theory,
bankruptcy protection benefits debtors directly by improving their balance sheets and preventing
the seizure of important assets such as a home or car. These direct benefits may in turn indirectly
benefit debtors by increasing their credit score or access to credit. Yet, in practice, there is lit-
tle empirical evidence that bankruptcy protection provides any economically significant benefits to
debtors. Cross-sectional comparisons suggest that bankruptcy filers work about the same number
of hours and accumulate less wealth than non-filers (Han and Li 2007, 2011), and within-individual
comparisons show that filers have less access to credit after receiving bankruptcy protection (Cohen-
Cole, Duygan-Bump and Montoriol-Garriga 2013, Jagtiani and Li 2014). However, much of this
1There is also evidence that financial distress imposes negative externalities on nearby individuals. For example,home foreclosures can reduce nearby home values (e.g. Campbell, Giglio, and Pathak 2011, Mian, Sufi, and Trebbi2011) and consumer debt overhang can depress regional consumption and employment (e.g. Guerrieri and Lorenzoni2011, Hall 2011, Midrigan and Philippon 2011, Eggertsson and Krugman 2012, Farhi and Werning 2013, Mian, Rao,and Sufi 2013, Mian and Sufi forthcoming).
2See Table 1 for details and additional summary statistics.
1

prior work has been hampered by the lack of a plausible comparison group. Bankruptcy filers likely
had worse outcomes even before filing, biasing cross-sectional estimates, and the most commonly
reported causes of filing, such as job loss, also impact later outcomes, biasing within-individual
estimates.3
This paper uses a new dataset linking bankruptcy filings to credit bureau records to estimate the
impact of Chapter 13 bankruptcy protection on post-filing financial outcomes. We estimate the ex-
post causal effect of Chapter 13 protection by comparing the outcomes of filers randomly assigned
to bankruptcy judges with different propensities to grant bankruptcy protection. The identified
parameter measures the treatment effect for filers whose bankruptcy decision is altered by the judge
assignment due to disagreement on whether or not they should receive bankruptcy protection (i.e.
the marginal recipients of bankruptcy protection). The estimates hold fixed any independent effects
of bankruptcy filing, such as having a bankruptcy flag on a credit report (Han, Keys, and Li 2013),
and any ex-ante impacts of bankruptcy, such as over-borrowing, moral hazard in the workplace
(White 2011), entrepreneurial risk-taking (Fan and White 2003, Armour and Cumming 2008), or
the crowding out of formal insurance (Mahoney 2014). Using the same identification strategy,
Dobbie and Song (forthcoming) find that Chapter 13 protection increases earnings and decreases
mortality risk.4
There are three main contributions of this paper relative to Dobbie and Song (forthcoming).
First, we estimate the effect of Chapter 13 protection on a broad range of financial outcomes that
shed new light on the well-being of debtors. We employ a new dataset constructed for the purposes
of this study that links over 175,000 bankruptcy filings to credit bureau records. These data allow
us to examine the effects of consumer bankruptcy on post-filing adverse financial events, unsecured
debt, secured asset holdings, credit access, and credit score. Moreover, because we observe detailed
information on distressed borrowers both before and after bankruptcy, we are able to provide new
evidence on the long-term consequences of excessive debt and the extent to which bankruptcy
protection mitigates these adverse consequences. Second, we describe the characteristics of filers
who are on the margin of receiving Chapter 13 bankruptcy protection. We find that young filers
are more likely to be on the margin of bankruptcy receipt, but that there are no differences by
baseline credit score or homeownership status. These results provide new evidence on the types
3The most commonly reported causes of bankruptcy are unexpected income or expense shocks. Sullivan, Warren,and Westbrook (2000) find that 67.5 percent of bankruptcy filers report job loss as a factor in filing for bankruptcy,22.1 percent report family issues such as divorce, and 19.3 percent report medical expenses, with subsequent worksuggesting a somewhat larger role for medical expenses (Domowitz and Sartain 1999, Warren, Sullivan, and Jacoby2000, Himmelstein et al. 2009). Using data from the PSID, Fay, Hurst, and White (2002) find that households arealso more likely to file for bankruptcy protection when there are larger financial benefits to doing so.
4Kling (2006) uses a similar empirical strategy to estimate the ex-post impact of sentence length on earnings, andsubsequent papers have used similar methodologies to estimate the ex-post effects of foster care (Doyle 2007, 2008),juvenile incarceration (Aizer and Doyle forthcoming), corporate bankruptcy (Chang and Schoar 2008), temporary-help employment (Autor and Houseman 2010), and Disability Insurance (Maestas, Mullen, and Strand 2013, Frenchand Song 2014).
2
of cases for which the instrumental variables estimates are most likely to apply, and the types of
filers who are most likely to be affected by changes in bankruptcy laws. Finally, we estimate a
variety of non-experimental specifications that allows us to reconcile our estimates with a literature
finding negative impacts of bankruptcy protection on post-filing finances (e.g. Han and Li 2007,
2011, Cohen-Cole, Duygan-Bump and Montoriol-Garriga 2013, Jagtiani and Li 2014).
In our empirical analysis, we find that Chapter 13 protection is largely successful in alleviating
the most direct adverse consequences of excessive debt. Over the first five post-filing years, Chapter
13 protection decreases an index measuring adverse financial events such as civil judgment and
repossession by 0.316 standard deviations, and significantly decreases seven of the eight individual
measures of financial strain that compose the index. Chapter 13 protection has little impact on the
amount of open unsecured debt, but the amount of debt in collections decreases by $1,315, a 31.2
percent change from the dismissed filer mean of $4,217. These results suggest that the marginal
recipient of Chapter 13 protection reduces his or her unsecured debt through the bankruptcy system,
while the marginal non-recipient is unable to prevent his or her unsecured debts from being sold to
a third-party debt collector. Chapter 13 protection also increases the probability that the marginal
recipient retains his or her home by 13.2 percentage points, a 36.4 percent increase from the dismissed
filer mean of 36.3 percent, but there are no discernible effects on the probability of having a car.
Chapter 13 protection also has important impacts on credit access proxies and credit score, two
financial outcomes not directly affected by bankruptcy protection. Over the first five post-filing
years, Chapter 13 protection decreases revolving credit utilization by 16.1 percentage points, a 34.5
percent change from the dismissed filer mean, and decreases the number of non-mortgage inquiries
by 0.293, a 18.5 percent change from the dismissed filer mean. Chapter 13 protection increases the
marginal recipient’s credit score by 14.9 points over the first five post-filing years, a 2.6 percent
increase from the dismissed filer mean.
We find evidence that protection from debt collectors and debt forgiveness are both important
mechanisms that help explain our results. To test the importance of protection from debt collectors,
we compare treatment effects in states that do and do not allow wage garnishment. We find large
and statistically significant effects of Chapter 13 protection in states that allow wage garnishment,
but small and imprecisely estimated effects in the four states that prohibit wage garnishment where
creditors have fewer options to collect unpaid debts from dismissed filers. These results are consistent
with there being significant costs of not being protected from debt collectors that may help explain
the deterioration of outcomes among dismissed filers. To test the importance of debt forgiveness, we
compare treatment effects in states with higher and lower Chapter 7 homestead exemption levels.
Since Chapter 13 requires that creditors are repaid at least as much as they would have received
in Chapter 7, homeowners that file for Chapter 13 in high exemption states are required to repay
creditors less than filers in low exemption states. We find that the effects of Chapter 13 protection
3
are larger for homeowners in states with high Chapter 7 exemption levels compared to homeowners
in low Chapter 7 exemption states. The results for non-homeowners are similar in high and low
exemption states. These results suggest that the benefits of Chapter 13 protection are increasing
in the amount of debt that is forgiven.
The results reported in this paper stand in sharp contrast to the prior literature showing few
benefits of filing for bankruptcy protection using non-experimental methods (e.g. Han and Li 2007,
2011, Cohen-Cole, Duygan-Bump and Montoriol-Garriga 2013, Jagtiani and Li 2014). Descriptive
results show that the outcomes of both dismissed and granted bankruptcy filers deteriorate one to
two years before filing. Outcomes for both groups remain depressed after filing, though much more
so for dismissed filers. These descriptive trends suggest that non-experimental estimates are likely
to be biased downwards due to selection into bankruptcy filing. Consistent with this scenario, we
find that OLS estimates using a non-filer comparison group and within-individual estimates suggest
negative effects of bankruptcy protection in our data. Conversely, OLS estimates using a dismissed
filer comparison group are broadly consistent with our judge IV estimates, suggesting that selection
into filing accounts for most of the bias in non-experimental specifications.
The remainder of the paper is structured as follows. Section I provides a brief overview of
the consumer bankruptcy system in the United States. Section II describes our data and provides
summary statistics. Section III describes our empirical strategy. Section IV estimates the impact
of Chapter 13 bankruptcy protection on post-filing financial outcomes. Section V reconciles our
estimates with the prior literature, and Section VI concludes. A data appendix provides additional
information on the outcomes used in our analysis.
I. Chapter 13 Bankruptcy Protection
A. Overview
Under Chapter 13 bankruptcy, filers propose a three- to five-year plan to partially repay their unse-
cured debt in exchange for a discharge of the remaining unsecured debt, a hold on debt collection,
and the retention of most assets.5 Chapter 13 requires filers to use all of their disposable income,
defined as their predicted income less predicted expenses, to repay creditors. Creditors must receive
at least as much as they would have received if the filer’s assets were liquidated under Chapter 7, a
requirement known as the “best interest of creditors” test. Chapter 13 filers are also required to fully
repay priority claims, such as child support and alimony, unless the claimant agrees to a reduced
payment. If a filer wants to keep any collateral securing a claim, he or she must keep up to date on
all current payments and include any arrears in the repayment plan. The filer can also choose to
give up the collateral and discharge the remaining debt. Thus, Chapter 13 allows filers to avoid a5During our sample period, Chapter 13 filers were able to choose the length of their repayment plan. In our data,
granted filers took an average of 3.7 years to complete their plan.
4

costly home foreclosure and the repossession of a car by including any arrears in the repayment plan,
with the original debt contract reinstated on the completion of the Chapter 13 repayment plan. In
a sample of Delaware cases, 71 percent of filers included mortgage arrears in their repayment plans,
41 percent included car loans, and 38 percent included priority debt (White and Zhu 2010). Survey
evidence suggests that approximately seventy percent of filers choose Chapter 13 in order to avoid
foreclosure (Porter 2011).
Chapter 13 cases begin with the debtor filing the proposed repayment plan, a bankruptcy peti-
tion, a statement of financial affairs, a copy of his or her most recent tax return, executory contracts
and unexpired leases, and schedules of current income, expenditures, and assets and liabilities. The
bankruptcy trustee then holds a meeting with the debtor and any interested creditors in order to
resolve problems with the proposed repayment plan.6 After this meeting, the bankruptcy judge
decides whether the repayment plan is feasible and meets the standards for confirmation set forth
in the Bankruptcy Code. If the judge confirms the repayment plan, the debtor makes biweekly or
monthly payments to the trustee until the plan is complete. The judge may later dismiss or con-
vert the case to Chapter 7 if the filer fails to make any payments, any post-filing domestic support
obligations, or any post-filing taxes. If a Chapter 13 filing is dismissed, debtors may refile for either
Chapter 7 or Chapter 13 after 180 days. In practice, about 20 percent of dismissed Chapter 13
filers choose to refile under Chapter 7, while almost none refile under Chapter 13. Our judge IV
estimates measure the effect of Chapter 13 protection relative to this counterfactual.
Debtors also have the option of filing under Chapter 7, which discharges unsecured debts and
stops collection efforts in exchange for any non-exempt assets. Chapter 7 bankruptcy does not allow
debtors to retain non-exempt assets or collateral securing delinquent debt. Our analysis focuses on
the effects of Chapter 13 protection due to limited variation in the treatment of Chapter 7 cases.
See Dobbie and Song (forthcoming) for additional details and a discussion of the differences between
Chapter 7 and Chapter 13.
B. Bankruptcy Judges
Bankruptcy judges are federal judges appointed to 14-year terms by the Court of Appeals in their
judicial district. There are a total of 94 federal bankruptcy courts in the United States, including
at least one bankruptcy court in each state, the District of Columbia, and Puerto Rico. Each
bankruptcy court hears all cases originating from counties in its jurisdiction, and are often further
divided into offices that hear all cases originating from a subset of counties in the court’s jurisdiction.
Bankruptcy judges often hear cases across multiple offices within their court, but only hear cases
6There is typically one Chapter 13 bankruptcy trustee who works with all judges in an office. If an office has aparticularly high Chapter 13 caseload, judges may have their own Chapter 13 trustee. As a result, it is not possible toisolate the independent impact of trustees on the probability of receiving bankruptcy protection using our empiricalmethodology.
5
filed in their bankruptcy court. These cases are typically assigned to judges using a random number
generator or a blind rotation system within each office.7
The assigned bankruptcy judge decides all matters connected to a case, including whether the
repayment plan is feasible and meets the standards for confirmation set forth in the Bankruptcy
Code. Common reasons for dismissal include the debtor being able to repay his or her debts without
bankruptcy protection, the repayment plan repaying creditors too little, or the repayment plan being
infeasible given the debtor’s predicted income and expenses (Hynes 2004). In Section III, we discuss
how we use systematic differences in the probability that a judge dismisses a filing to estimate the
causal impact of bankruptcy protection. The variation in judge behavior that we measure is likely
to be driven by differences in how judges interpret the above criteria.
Our empirical strategy also assumes that judges only impact future outcomes through the prob-
ability of receiving bankruptcy protection. This exclusion restriction would be violated if judges
affect debtor outcomes in other ways, such as by providing financial counseling. The assumption that
judges only systematically affect debtor outcomes through bankruptcy is fundamentally untestable,
and our estimates should be interpreted with this potential caveat in mind. However, we argue that
the exclusion assumption is not unreasonable in our setting. Despite the central role of bankruptcy
judges, debtors typically have only limited interaction with the assigned judge. Chapter 13 filers
appear before the bankruptcy judge at the plan confirmation hearing, but all other administrative
aspects of the bankruptcy process are conducted by the bankruptcy trustee and not the judge. Thus,
it seems unlikely that judges would significantly impact debtors other than through the probability
of receiving Chapter 13 protection.
C. Potential Benefits of Chapter 13 Protection
There are at least three reasons that debtors may directly benefit from Chapter 13 bankruptcy
protection. First, filing for and obtaining bankruptcy protection puts a hold on current and future
debt collection efforts.8 Bankruptcy protection may therefore decrease the incentive to avoid re-
payment through strategies with significant deadweight costs, such as leaving the formal banking
system to avoid seizure of assets or leaving the formal labor market to avoid wage garnishment.9
7The median court in our sample is divided into three offices, with little systematic pattern to the number ofoffices in each court. There is considerable variation in the number of bankruptcy judges in each bankruptcy courtand office, with courts serving more populous regions tending to have more judges. Of the 205 offices we observe inour data, 110 have only one Chapter 13 judge, 52 have two Chapter 13 judges, 25 have three Chapter 13 judges, and18 have four or more Chapter 13 judges. See Dobbie and Song (forthcoming) for additional details.
8Dismissed filers receive a temporary stay on collections activity that lasts until the filing is dismissed. Estimateson debt collections activity are therefore likely to be biased downwards, at least in the short run.
9Creditors have a number of options to collect unpaid debts if a debtor has not filed for bankruptcy protectionor after a case is dismissed, including wage garnishment, collection letters or phone calls, in-person visits at home orwork, and seizing of assets through a court order. Debtors can make these collection efforts more difficult by ignoringcollection letters and calls, changing their telephone number, or moving without leaving a forwarding address. Debtorscan also leave the formal banking system to hide their assets from seizure, change jobs to force creditors to reinstate
6

Second, Chapter 13 protection discharges any unsecured debts not repaid under the proposed plan,
significantly improving a debtor’s balance sheet. Third, Chapter 13 bankruptcy allows debtors to
restructure secured debts such as a car or mortgage loan. Creditors are allowed to seize assets
securing a delinquent loan if a debtor has not filed for bankruptcy protection or after a case has
been dismissed, suggesting that Chapter 13 may allow debtors to retain important assets and avoid
a potentially costly repossession or foreclosure.
There are also several potential indirect benefits of bankruptcy protection. Most importantly,
bankruptcy protection may benefit debtors by increasing their access to credit through an improved
balance sheet and fewer adverse collection events reported on a credit record. This may allow
debtors to avoid more costly forms of credit, such as pawn or payday loans. Bankruptcy protection
may also prevent any sharp drops in consumption that have important long-term consequences,
such as becoming sick due to the lack of medical care. Finally, bankruptcy protection may increase
economic stability by allowing debtors to avoid foreclosure or eviction.
There are also many reasons to believe that Chapter 13 protection will have little impact on
debtors. First, it is possible that the bankruptcy process may exacerbate financial distress by forcing
filers to devote all of their disposable income to the repayment plan. It is also possible that debtors
are able to avoid most debt collection efforts at a relatively low cost or that collections strategies do
not significantly affect most debtors. Finally, bankruptcy protection will have little impact if filers’
financial distress stems from broader economic conditions, or immutable individual characteristics
such as low human capital.
II. Data
A. Data Sources and Sample Construction
Our empirical analysis uses data from individual bankruptcy filings merged to credit bureau records
from TransUnion. The bankruptcy records come from the 72 (out of 94) federal bankruptcy courts
that allow full electronic access to their dockets. These data include approximately 75 percent of
all filings during our sample period. Each record includes information on the filer’s name, address,
bankruptcy chapter, filing date, court, office, outcome, and the name of the judge and trustee
assigned to the case.
Following Dobbie and Song (forthcoming), we make four restrictions to the bankruptcy data.
First, we drop filings from 110 offices that only have a single Chapter 13 bankruptcy judge and
filings from counties that assign all cases to a single judge, as in both scenarios there is no variation
in judge leniency that allows us to estimate the impact of Chapter 13 protection. Second, we drop
office-by-year bins where a retiring judge’s cases were reassigned with no documentation as to the
a garnishment order, or work less so that their earnings are not subject to garnishment. See Hynes, Dawsey, andAusubel (2013) for additional discussion of the debt collection process.
7

original judge. Third, we restrict the sample to debtors who filed for Chapter 13 bankruptcy for
the first time between June 2002 and December 2005, ensuring that we obtain at least five years
of post-filing outcomes and at least one year of pre-filing baseline outcomes for all debtors. This
restriction also ensures that filings occurred before the 2005 Bankruptcy Reform Act came into
effect. Finally, we drop office-by-year-by-judge bins with fewer than ten cases where we are unlikely
to be able to accurately measure judge leniency. These sample restrictions leave us with 253,863
filings.
We matched these 253,863 filings to credit bureau records from TransUnion using name and
address at the time of filing. We were able to successfully match 68.9 percent of our estimation
sample to the TransUnion data. Our match rate is similar to Finkelstein et al. (2012), who matched
68.5 percent of Oregon Medicaid applicants to TransUnion data using name, address, and date of
birth. The probability of being matched to the credit report data is not significantly related to
judge leniency (see Panel F of Table 1).
The TransUnion data are available from June 2002 to June 2010. We observe each individual
in the credit bureau data annually in June. The TransUnion data are derived from public records,
collections agencies, and trade lines data from lending institutions. The data also include geographic
location at the ZIP code-level and age. No other demographic information is available at the
individual level. See Avery et al. (2003) and Finkelstein et al. (2012) for additional details on the
TransUnion data.
Our estimation sample includes the 253,863 filings matched to at least one post-filing year of
credit bureau data. This sample consists of 175,076 filers from 39 offices and 29 bankruptcy courts.
The sample includes 348 office-by-year-by-judge observations – the level of variation that drives our
empirical design. The number of cases in each office-by-year-by-judge bin ranges from 31 to 2,040,
with a median of 799. Appendix Table 1 provides additional details on each of the offices in our
estimation sample.
B. Measures of Financial Outcomes
We use the linked dataset to estimate the impact of Chapter 13 bankruptcy protection on financial
strain, unsecured debt, asset holdings, credit access, and credit score. This section briefly describes
how we construct the measures used in our main analysis. The data appendix provides additional
details on all of the measures used in our analysis.
Financial strain is measured using indicators for delinquency, creditor charge-offs, collections,
bankruptcy, foreclosure, civil judgments, liens, and repossessions within the last 12 months. Delin-
quency occurs when at least one trade is reported 30 or more days past due, and is our most common
measure of financial strain. Credit charge-offs typically occur after 180 days of non-payment on an
account, implying that this measure therefore captures a more severe form of non-payment than
8

delinquency. Collections indicate that at least one account has been transferred to a third-party
collections agency or is in the process of collection at some point in the last 12 months. Our collec-
tions measure does not include debts sent to collection agencies that do not report to credit bureaus,
and therefore represents a lower bound on total collections activity. Bankruptcy indicates a new
filing in the last 12 months. Foreclosures indicate any foreclosure related action during the last 12
months, including a foreclosure being initiated, a foreclosure being discontinued, and a foreclosure
being redeemed. The foreclosure measure used in this paper is therefore more inclusive than the
foreclosure measure used in Dobbie and Song (forthcoming), which only included foreclosure sales
and transfers. Civil judgments include all wage garnishment orders, liens against property, and
levies on checkings or savings accounts in the last 12 months. Civil judgments are often difficult
and costly to obtain, meaning that this measure is likely proxying for particularly large unpaid bills.
Liens indicate at least one public records claim on a lien in the past 12 months. Public record liens
include federal and state tax liens, hospital liens, and judicial liens. Repossession indicates that a
creditor has attempted to take back a secured asset, such as a car or boat, in the last 12 months.
Each financial strain measure is the average of five indicator variables for having experienced
the listed event from the filing year to the fifth post-filing year, with two exceptions. We measure
both charge-offs and new bankruptcies from the first full post-filing year to fifth year after filing to
exclude the mechanical effect of the original Chapter 13 filing on these outcomes in the year of filing.
Appendix Table 2 reports results using the number of adverse events in the first five post-filing years
and the cumulative probability of an event occurring at least once in the first five post-filing years
for each of the eight adverse financial events in our data.
We also report results using a financial strain index, a summary index of these eight adverse
events designed to broadly capture financial distress associated with collections activity. Following
Fryer and Katz (2013), for each post-filing year, we first standardize each component in the financial
strain index using the mean and standard deviation of the component for the dismissed filer group
in the baseline year. Next, we sum the eight components in each year, restandardizing using the
mean and standard deviation of the index for the dismissed filer group in the baseline period. To
exclude the mechanical effect of filing on charge-offs and new bankruptcies in the year of filing, the
financial strain index in the year of filing is composed of the other six measures of adverse financial
events. Finally, we average these annual index measures over the first five post-filing years. Because
each of the financial strain components represent adverse events that negatively impact access to
credit, a higher index represents worse outcomes throughout.
Unsecured debt and collections activity are measured using the current balance of open revolving
loans, and the amount of debt currently in collections. Revolving loans includes all current bank
cards, retail cards, and check credit accounts. Collections debt include all loans that have been
transferred to a collection agency or that are in the process of collection. Following the above
9

discussion, our measure of collections debt is likely a lower bound. Our unsecured debt data do
not include information on some non-bank and non-retail forms of unsecured credit, such as pawn
and payday loans. The data also do not include information on the cost of revolving debt. We are
therefore unable to estimate the impact of Chapter 13 on these outcomes.
Retention of secured assets is measured using indicators for having an open mortgage loan within
the past 12 months and having an open auto loan within the past six months, and the current balance
of all open mortgages and open auto loans. All of the debt balance measures are captured in June
of each year. Having an active mortgage or auto loan proxies for ownership of these assets, but is
an underestimate of actual ownership as some filers have likely fully paid off their mortgage or auto
loans.
We measure credit access using the total utilization on revolving accounts, and the number of
non-mortgage inquiries in the last six months. TransUnion does not provide credit line information
for each category of non-mortgage debt, so we proxy for credit supply using revolving trades, the
largest category of non-mortgage credit among all credit users and our estimation sample. Revolving
trades include any bank card accounts, retail accounts, and check credit accounts. Results are
qualitatively similar using bank card trades, a subset of revolving trades. Utilization is defined as
the current balance divided by the credit limit, where TransUnion measures the credit limit using
either the reported credit limit, or the highest amount ever owed on an account if the credit limit is
unreported. Avery et al. (2003) discuss this imputation procedure, concluding that the credit limit
variable is likely a lower bound. Accordingly, utilization measures likely reflect an upper bound
for accounts where the credit limit is imputed. Importantly, estimates using utilization may be
biased if Chapter 13 protection impacts the highest amount ever owed on an account, as credit
limits will appear higher for these individuals. Our utilization estimates should be interpreted with
this potential measurement bias in mind. Our second measure of credit access is the number of
non-mortgage inquiries. Inquiries are made to ensure that an applicant for credit, apartment rental,
insurance, or employment meets minimum standards, and is considered a proxy for excess credit
demand.
Credit score is measured using an ordinal credit score variable calculated by TransUnion to
capture credit risk. The TransUnion credit score variable is used by creditors to determine the price
and eligibility for credit, and is similar to the FICO score commonly referenced in the consumer
finance literature. Our credit score variable should therefore be interpreted as a summary measure
of a debtor’s financial risk. We report estimates using the scale provided by TransUnion.
10

C. Descriptive Statistics
Table 1 presents summary statistics for our data. Column 1 reports summary statistics for a
random sample of the population of credit users in the TransUnion database.10 Column 2 reports
summary statistics for individuals in this random sample that file for bankruptcy protection during
our sample period. The TransUnion data does not report chapter of filing, so these individuals
include a mix of Chapter 7, Chapter 11, Chapter 12, and Chapter 13 filers. Because very different
types of individuals file under various bankruptcy chapters, bankruptcy filers in the national sample
are likely to differ in substantial ways from Chapter 13 filers.11 Columns 3 and 4 report summary
statistics for Chapter 13 filers in our estimation sample assigned to judges with below and above
median judge leniency as defined in Section III.
Bankruptcy filers are younger and more likely to own a home than the typical credit user in the
United States. The typical bankruptcy filer in the national sample is 43.7 years old, compared to
48.5 years old for all credit users. Fifty-two percent of bankruptcy filers own a home. In comparison,
47.0 percent of all credit users own a home. In our estimation sample, 65.5 percent of Chapter 13
filers are homeowners and the average age is 44.8 years old.
Perhaps not surprisingly, bankruptcy filers are far more likely to suffer an adverse financial event
than the typical credit user even before filing. In the national sample, 41.3 percent of bankruptcy
filers have at least one delinquency before filing, 29.6 percent have at least one debt in collections,
18.8 percent have at least one creditor charge-off, 3.4 percent have at least one civil judgment, 1.0
percent have experienced a foreclosure, 1.1 percent have at least one property lien, and 1.2 percent
have at least one repossession. Chapter 13 filers in our estimation sample are even more likely to
have suffered an adverse financial event before filing compared to the typical credit user, with 67.7
percent having had a delinquency in the past 12 months, 46.3 percent having a debt in collections,
30.9 percent having a charge-off, 6.3 percent having a judgment, 5.1 percent having a foreclosure,
2.1 percent having a lien, and 2.1 percent having a repossession. In comparison, only 14.8 percent of
all credit users have a delinquency in the past 12 months, 13.7 percent have a debt in collections, 6.5
percent have a charge-off, 0.9 percent have a judgment, 0.3 percent have a foreclosure, 0.4 percent
have a lien, and 0.3 percent have a repossession.
Bankruptcy filers also have significantly higher unsecured debt and collections activity compared
to the typical credit user. Bankruptcy filers in the national sample have $13,083 in revolving debt
and $1,432 of debt in collections. Chapter 13 filers in our estimation sample have $10,460 in revolving
10See Dobbie and Goldsmith-Pinkham (2014) for additional details on the credit user sample. The data containapproximately two percent of all credit users in the United States during this time period.
11The TransUnion data do not provide information on the date of bankruptcy filing or the chapter of bankruptcy,but each calendar year pull provides information on the number of bankruptcy filings in the last 12 months. Fromthis bankruptcy filing flag, we define bankruptcy filers as those individuals who filed for bankruptcy for the firsttime in the last 12 months based on credit report data between 2003 and 2006. Individuals whose bankruptcy flag isturned on in multiple years between 2003 and 2006 are excluded.
11

debt and $2,460 of debt in collections. In comparison, the typical credit user has $6,011 in revolving
debt and $601 of debt in collections.
Bankruptcy filers are more likely to have an open mortgage than the typical credit user. In the
national sample, 43.4 percent of bankruptcy filers have at least one open mortgage, compared to
36.7 percent for all credit users. In our estimation sample, 57.9 percent of Chapter 13 filers have at
least one open mortgage. Note that active mortgage rates are generally lower than homeownership
rates in both the national sample and estimation sample, suggesting that approximately seven to
ten percent of homeowners have already paid off their mortgages.
While bankruptcy filers in the national sample are more likely to have a mortgage, they have
mortgage balances that are $2,612 lower than the typical credit user, while Chapter 13 filers in
our estimation sample have mortgage balances that are $12,615 more than the typical credit user.
Home mortgage balances are likely higher among Chapter 13 filers than bankruptcy filers in the
national sample because national bankruptcy filers comprise those who file under Chapter 7 as well
as Chapter 13, and Chapter 7 filers are less likely to be homeowners.
Bankruptcy filers are also 17.1 percent more likely to have an open auto loan compared to the
typical credit user, with Chapter 13 filers in our estimation sample 19.1 percent more likely to have
an active auto loan than the typical credit user. Accordingly, bankruptcy filers in the national
sample have auto balances that are $3,412 more than the typical credit user. Chapter 13 filers in
our estimation sample have auto balances $3,892 more than the typical credit user.
Bankruptcy filers in the national sample have higher utilization on revolving accounts and more
credit inquiries than the typical credit user, suggesting that bankruptcy filers have excess credit
demand conditional on credit supply. Specifically, bankruptcy filers in the national sample have
utilization rates that are 35.9 percentage points higher than the average credit user, and also have
1.0 more non-mortgage inquiries in the last six months than the typical credit user. In our estimation
sample, Chapter 13 filers have 45.4 percentage points higher utilization on revolving accounts than
the typical credit user, and 1.5 more non-mortgage inquiries.
Bankruptcy filers also have lower credit scores than the typical credit user in the United States.
Average pre-filing credit scores are 630.0 for bankruptcy filers in the national sample. In comparison,
average credit scores are 739.5 for all credit users. In our estimation sample, the average credit score
is 580.7.
III. Research Design
Consider a model that relates post-filing outcomes such as credit score to the receipt of Chapter 13
bankruptcy protection:
yit = α+ βXi + γBankruptcyi + εit (1)
12

where i denotes individuals, t is the year of observation, γ is the causal impact of bankruptcy
protection, Xi includes controls such as age and lagged outcomes, and εit is noise. Our key empirical
problem is that OLS estimates of equation (1) may be biased if bankruptcy protection is correlated
with the unobservable determinants of later outcomes, explored further in Section V.
We estimate the impact of Chapter 13 protection on debtors using judge leniency as an instru-
ment for bankruptcy protection. Our empirical strategy exploits the fact that judges are randomly
assigned to filings, and that those bankruptcy judges have differing tendencies to grant Chapter 13
protection. In this specification, we interpret any difference in post-filing outcomes as the causal
effect of the change in the probability of receiving bankruptcy protection operating through judge
assignment. The second stage estimating equation is:
yit = α+ αot + βXi + γBankruptcyi + εit (2)
where αot are office-by-filing-month fixed effects and Xi includes baseline age bins, homeownership,
financial strain, revolving, mortgage, auto, and collections debt, indicators for open mortgage and
open auto loans, revolving utilization, non-mortgage inquiries, and credit score. Xi also includes
indicators for missing age and baseline characteristics.
The corresponding first stage estimating equation associated with equation (2) is:
Bankruptcyit = α+ αot + βXi + δσj + εit (3)
where σj is the systematic component of judge behavior and δ represents the impact of judge
behavior on the probability of receiving bankruptcy protection. We cluster standard errors at the
office level in both the first and second stage regressions to account for any serial correlation across
filers at the level of randomization. Results are qualitatively similar if we cluster at the office-by-
judge or office-by-filing-month level.
Following the previous literature (e.g. Kling 2006, Chang and Schoar 2008, Doyle 2007, 2008,
Autor and Houseman 2010, French and Song 2014, Aizer and Doyle forthcoming, Maestas, Mullen,
and Strand 2013, and Dobbie and Song forthcoming), we define judge leniency Zioj as the leave-
one-out fraction of filings granted by judge j in office o minus the leave-one-out fraction granted in
office o:
Zioj =1
noj − 1
(noj∑k=1
(Bk)−Bi
)− 1
no − 1
(no∑k=1
(Bk)−Bi
)(4)
where i again denotes individuals, o denotes offices, j is the assigned judge, Bi is an indicator for
receiving bankruptcy protection, noj is the number of cases seen by a judge in office o, and no is the
number of cases seen by an office. We calculate judge leniency using all filings in the full sample of
filings, including those not matched to TransUnion credit records. Section IVG tests the robustness
13

of our results using a number of alternative measures of judge leniency.
Using our measure of judge leniency Zioj as an instrument for the receipt of Chapter 13
bankruptcy protection, two-stage least squares estimates from equation (2) measure the local aver-
age treatment effect of Chapter 13 protection for filers whose bankruptcy outcomes are altered by
judge assignment. Three conditions must hold to interpret these estimates as the average causal
impact of bankruptcy protection: (1) judge assignment is associated with bankruptcy protection,
(2) judge assignment only impacts debtor outcomes through the probability of receiving bankruptcy
protection, and (3) the impact of judge assignment on the probability of receiving bankruptcy pro-
tection is monotonic across filers.
Appendix Figure 1 tests the first assumption by plotting average discharge against our leave-one-
out measure of judge leniency. The estimation sample includes first-time filers between 2002 and
2005 in the 39 offices in the 29 courts that randomly assign Chapter 13 filings to judges. Appendix
Figure 1 is constructed by calculating the mean residuals from a regression of an indicator for
receiving Chapter 13 protection on office-by-filing-month fixed effects. For ease of interpretation,
we add the mean discharge rate to the mean residual in each judge-by-year bin. The plotted line
and corresponding coefficient show the best linear fit estimated on the underlying individual-level
data, controlling for office-by-filing-month fixed effects and with standard errors clustered at the
office level. Table 2 presents analogous individual-level estimates with and without controls.
Appendix Figure 1 and Table 2 indicate that judge leniency is highly predictive of the probability
of receiving bankruptcy protection. With no controls, a one percentage point increase in Zioj
increases the probability that a debtor receives bankruptcy protection by 0.889 percentage points.
Controlling for all baseline characteristics in column 6, our measure of judge leniency remains highly
predictive of the probability of receiving bankruptcy protection, with a one percentage point increase
in Zioj increasing the probability that a debtor receives bankruptcy protection by 0.811 percentage
points. Thus, a one standard deviation (2.5 percentage point) increase in judge leniency increases
the likelihood of receiving bankruptcy protection by about 2.0 percentage points, corresponding to
a 4.5 percent change from the mean discharge rate of 44.6 percent.
Consistent with the first stage results in Dobbie and Song (forthcoming), the probability of
receiving Chapter 13 protection does not increase one-for-one with our measure of judge leniency,
likely because of measurement error that attenuates the effect toward zero. For instance, the ac-
curacy of our leave-one-out measure will be reduced if judge leniency drifts over the course of the
year or fluctuates with case characteristics. Nevertheless, our first stage results confirm that our
measure of judge leniency is highly predictive of case outcomes.
The coefficients on our baseline controls are of independent interest for understanding the types
of individuals more or less likely to receive Chapter 13 protection. The probability of receiving
bankruptcy protection is increasing in filer age. Homeowners are also more likely to receive Chapter
14

13 protection than non-homeowners. The probability of receiving Chapter 13 protection is decreas-
ing in most measures of financial strain and the amount of debt in collections. The probability of
receiving bankruptcy protection is also decreasing in mortgage and auto debt, although individuals
with open mortgage and auto loans are more likely to receive Chapter 13 protection. Conversely,
filers with higher unsecured debt are more likely to receive bankruptcy protection, as are filers with
more revolving accounts. Finally, the probability of receiving Chapter 13 is decreasing with the
number of credit inquiries in the last six months, and increasing with credit score.
Following Doyle (2008), we also present first stage results for different subsamples to shed light
on the characteristics of filers who are on the margin of Chapter 13 protection. In the case of a
binary instrument, the relative likelihood that a complier has a given characteristic is equal to the
first-stage coefficient for that group divided by the first-stage coefficient for the full sample. Similar
logic applies to the case of a continuous instrument. Given that filers likely differ in how much they
benefit from Chapter 13 protection, these results provide new evidence on the types of cases for
which the instrumental variables estimates are most likely to apply, that is, those filers for whom
judges most disagree on whether to grant bankruptcy protection. These results also provide insight
into the likely impacts of debt-relief policy interventions that target different types of debtors.
Appendix Table 3 shows the first-stage estimates for subgroups of interest. We also present the
ratio of the subgroup first-stage coefficient to the overall first-stage coefficient from column 6 of
Table 2. The results indicate that some groups are more likely to be on the margin of bankruptcy
receipt. The most striking first-stage result is for filers 25 to 39 years old at the time of filing, who
have a first stage coefficient that is 16.5 percent higher than the overall first stage, although the
ratio is not significantly different from one due to variability in the data. Conversely, filers who are
60 and up have a first-stage coefficient that is only 52.3 percent of the overall first stage, significantly
different from one. First-stage results are not substantially different between filers with below and
above median baseline credit scores, and by baseline homeownership status. These results suggest
that young filers are most likely to be on the margin of bankruptcy receipt, indicating greater
judicial disagreement over these types of filers.
Our second identifying assumption is that judge assignment only impacts debtor outcomes
through the probability of receiving bankruptcy protection. This assumption would be violated
if judge leniency is correlated with unobservable determinants of future outcomes. We partially
test this assumption by assessing whether observable filer characteristics differ based on whether
filers are assigned to a judge with either a high or low propensity to grant Chapter 13 protection.
Following Aizer and Doyle (forthcoming), columns 3 and 4 of Table 1 present summary statistics
separately for filers assigned to judges with above and below median leniency. Column 5 reports
results from a series of OLS regressions of each observable filer characteristic on an indicator for
being assigned to a judge with above median leniency and office-by-filing-month fixed effects with
15
standard errors clustered by office. Consistent with our identifying assumptions, there is only one
statistically significant difference in the 26 variables we consider.
Our third identifying assumption is that there is a monotonic impact of judge assignment on the
probability of receiving bankruptcy protection. The monotonicity assumption implies that being
assigned to a more (less) lenient judge does not decrease (increase) the likelihood of receiving Chapter
13 protection. Following Dobbie and Song (forthcoming), we partially test the validity of the
monotonicity assumption by examining how judges treat filings from observably different filers. Any
significant differences in the way that judges treat these filings would suggest that the monotonicity
assumption is violated. Appendix Figure 2 plots judge leniency measures calculated separately by
age at filing, baseline credit score, baseline home ownership, and baseline financial strain. Each
plot reports the coefficient and standard error from an OLS regression relating each measure of
judge leniency. Consistent with our monotonicity assumption, we find that judge tendencies are
very similar across observably different filers. None of the results suggest that the monotonicity
assumption is invalid in this setting.
IV. Results
We begin by exploring the impact of Chapter 13 protection on financial strain associated with debt
collection, the amount of unsecured debt, and retention of assets. We then estimate the indirect
effects of Chapter 13 protection on credit access and credit score. We conclude by examining the
most likely mechanisms driving our results and testing the robustness of our empirical design.
A. Financial Strain
Panel A of Table 3 reports two-stage least squares estimates for our financial strain index and each
individual component of the index. As discussed above, each individual component of the financial
strain index is the average of five indicator variables for having experienced the listed event from
the filing year to the fifth post-filing year. For all of our financial strain measures, our estimates
should be interpreted as the average change in the probability of experiencing an event each year.
The financial strain index combines all eight adverse financial events, as described previously. Our
estimation sample consists of Chapter 13 bankruptcy filers originating from offices that randomly
assign filers to judges between 2002 and 2005 that are linked to the credit report data in the year
of filing. Column 1 reports the mean post-filing average probability for each event for dismissed
filers. Column 2 presents two-stage least squares estimates using our leave-one-out measure of judge
leniency controlling only for office-by-filing-month fixed effects. Column 3 adds controls for baseline
age bins, homeownership, financial strain, revolving, mortgage, auto, and collections debt, indicators
for open mortgage and open auto loans, revolving utilization, non-mortgage inquiries, and credit
16

score. Details on these measures can be found in the data appendix. We report standard errors
clustered at the office level throughout.
We find that Chapter 13 significantly improves financial well-being by reducing the likelihood
of adverse financial events and creditor actions. Over the first five post-filing years, Chapter 13
protection decreases the marginal recipient’s level of financial strain by 0.316 to 0.369 standard
deviations. Turning to each individual component, we find that Chapter 13 protection decreases
the marginal recipient’s probability of having a debt in collections by 14.9 to 20.1 percentage points,
a 25.5 to 34.4 percent decrease from the dismissed filer mean of 58.4 percent. Credit charge-offs
decrease by 6.5 to 6.7 percentage points, a 30.0 to 31.0 percent decrease from the dismissed filer
mean of 21.6 percent. Subsequent bankruptcy filings (of all chapters) decrease by 6.4 percentage
points, a 58.7 percent decrease from the dismissed filer mean of 10.9 percent. Foreclosures decrease
by 1.6 to 3.0 percentage points, a 22.9 to 42.8 percent decrease from the dismissed filer mean of
7.0 percent. Creditor judgments decrease by 3.1 to 3.9 percentage points, a 46.9 to 59.0 percent
decrease from the dismissed filer mean of 6.6 percent. Liens decrease by 3.4 percentage points, a
100.0 percent decrease from the dismissed filer mean of 3.4 percent. Repossessions decrease by 1.5
percentage points, a 78.9 percent decrease from the dismissed filer mean of 1.9 percent. Conversely,
there is no impact of Chapter 13 protection on delinquency, defined as the probability of any trade
being at least thirty days past due.12
Table 4 presents two-stage least squares results from our preferred specification separately by
age, baseline credit score, and baseline homeownership. Chapter 13 reduces financial strain by
0.416 standard deviations for homeowners compared to just 0.165 standard deviations for non-
homeowners, though the difference is not statistically significant. There are no economically or
statistically significant differences by age or baseline credit score.
Consistent with Dobbie and Song (forthcoming), we find that our results are driven by a dete-
rioration of outcomes among dismissed filers rather than gains among granted filers (see Appendix
Figure 3). Taking repossession as a illustrative example, we see that both dismissed and granted
filers are more likely to experience a repossession than non-filers even before filing. In the four years
before filing, repossession rates average 0.7 percent and 1.4 percent among granted and dismissed
filers, respectively. Repossession rates increase to 1.1 percent for granted filers and 1.6 for dismissed
filers in the year before filing, before peaking at 2.4 and 3.4 percent, respectively, in the year of filing.
Repossession rates for dismissed filers remain elevated at approximately 1.4 percent throughout our
sample period, while the rates for granted filers fall to about 0.5 percent, comparable to non-filers.
These results are consistent with bankruptcy protection mitigating the long-term consequences of
financial shocks that might otherwise harm debtors, but not conferring benefits in the absence of a12Panel A of Appendix Table 4 presents additional financial strain results. We find that Chapter 13 protection
decreases both the number of paid and unpaid collections, but has no impact on the number of medical collections.The decrease in judgments is due to a decrease in unpaid judgments.
17

financial shock.
We conclude this section by comparing the magnitude of our two-stage least squares estimates to
the deterioration of outcomes for dismissed filers. This calculation provides a back-of-the-envelope
approximation of the extent to which Chapter 13 protection mitigates the adverse consequences of
financial distress. Specifically, we calculate the change in outcomes for dismissed filers by subtracting
the average post-filing outcomes for the first five post-filing years from the pre-filing outcomes in
the third to fourth years pre-filing. This calculation implies that Chapter 13 protection mitigates
approximately 91.1 percent of the deterioration in the financial strain index. For our other financial
strain measures, Chapter 13 protection mitigates approximately 28.6 percent of the deterioration in
the probability of having a foreclosure and approximately 100 percent of the potential deterioration
in the probability of having collections debt, a charge-off, a new bankruptcy, a judgment, a lien,
and a repossession.
B. Unsecured Debt and Collections
Panel B of Table 3 reports two-stage least squares estimates on open unsecured debt and collections
debt. Each dependent variable is the average amount of debt reported in each category. We report
results using the year of filing to the fifth post-filing year.
There is little impact of Chapter 13 protection on open unsecured debt. Point estimates are
small and not statistically different from zero. However, the marginal recipient of Chapter 13 has
$1,315 to $1,842 less debt in collections, a 31.2 to 43.6 percent decrease from the dismissed filer
mean of $4,217. The impact of Chapter 13 on collections debt is higher for filers with high baseline
credit scores, but does not vary by age or homeownership.13
Comparison of means shows that open unsecured debt falls for both granted and dismissed filers
post-bankruptcy. Collections debt increases for both groups before filing, but falls to pre-filing
levels for granted filers only in the post-filing years. Taken together with our above results, these
trends suggest that the marginal recipient of Chapter 13 protection reduces his or her unsecured
debt through the bankruptcy system, while the marginal non-recipient is unable to prevent his or
her unsecured debts from being sold to a third-party debt collector. Using these trend results, we
estimate that Chapter 13 protection mitigates approximately 63.7 percent of the potential increase
in collections debt.
C. Secured Assets
Panel C of Table 3 reports two-stage least squares estimates for the probability of having an open
mortgage, the average amount of mortgage debt, the probability of having an open auto loan, and
13Panel B of Appendix Table 4 presents results for student debt, a form of unsecured debt that is not dischargedunder Chapter 13 protection. We find no impact of Chapter 13 on active or deferred student debt.
18

the amount of auto debt. We report results using the year of filing to the fifth post-filing year.
We find that Chapter 13 protection significantly increases the probability of having a mortgage
by 11.0 to 13.2 percentage points, a 30.3 to 36.4 percent increase from the dismissed filer mean of 36.3
percent. Chapter 13 protection also increases the marginal recipient’s mortgage debt by $12,196 to
$14,267, a 45.4 to 53.2 percent increase from the dismissed filer mean of $26,833. Unsurprisingly, the
impact of Chapter 13 on both homeownership and mortgage debt is higher for baseline homeowners.
Effects are also larger for filers who are 60 or older at the time of filing.
The increase in mortgage debt may be the result of dismissed filers decreasing their mortgage
debt by downsizing or becoming renters, or by granted filers increasing their mortgage debt by
buying a new home. Panel C of Appendix Table 4 sheds light on this issue by estimating the impact
of Chapter 13 protection on the probability of living in the same residence, the probability of moving
to a rental, and the probability of moving to a home. Each dependent variable is measured in the
fifth post-filing year, with identical results for earlier years. Chapter 13 protection increases the
probability of staying in the same residence by 25.0 to 27.0 percentage points and decreases the
probability of moving to a rental by 25.0 to 26.7 percentage points. These results are consistent
with Chapter 13 decreasing the probability that filers sell or lose their homes.
Comparison of means provides additional evidence on this issue. The probability of having
a mortgage increases in the years before filing for both granted and dismissed filers, peaking the
year before filing at 59.8 percent and 56.2 percent, respectively. For granted filers, the probability
of having a mortgage falls modestly after filing to around 45 percent. For dismissed filers, the
probability of having a mortgage falls all the way to 21.8 percent by the fifth year after filing. These
trend results suggest that Chapter 13 protection alleviates more than 100 percent of the potential
fall in homeownership rates.
We also explore the impact of Chapter 13 protection on whether a debtor has an open auto
loan and average auto debt. Because at least some car owners do not have an open car loan, our
measures of car ownership are lower bounds. Chapter 13 protection does not have a statistically
significant effect on the probability of having a car loan or on auto debt. In Appendix Figure 3, we
find that the probability of having a car loan falls in the year of filing for both granted and dismissed
filers, suggesting that most debtors give up their cars. These results suggest that the retention of a
home may be a more important priority for Chapter 13 filers. This interpretation is consistent with
survey results showing that over seventy percent of dismissed filers choose to file under Chapter 13
bankruptcy to avoid foreclosure (Porter 2011).
D. Credit Access
Panel D of Table 3 reports two-stage least squares estimates for the total utilization on revolving
accounts, and the number of non-mortgage inquiries. Each dependent variable is a five-year average
19

from the year of filing to the fifth post-filing year.
We find that Chapter 13 protection decreases revolving credit utilization, as measured by the
balance to credit limit ratio. These revolving trades include bank credit cards, retail credit cards
and check credit accounts. Revolving accounts are the most common type of credit accounts,
representing 63 percent of all credit accounts, and about 71 percent of all open accounts (Avery et
al. 2003). Utilization decreases by 15.1 to 16.1 percentage points, a 32.3 to 34.5 percent decrease
from the dismissed filer mean of 46.7 percent. Chapter 13 protection also decreases the number of
non-mortgage inquiries in the past six months by 0.293 to 0.410, a 18.5 to 25.9 percent decrease from
the dismissed filer mean of 1.584. The impact of Chapter 13 on credit utilization is larger among
younger filers, and the impact on non-mortgage inquiries is larger among baseline homeowners.
Overall, these results suggest that Chapter 13 protection increases credit access.
However, a comparison of means shows that utilization rates and non-mortgage inquiries fall (i.e.
improves) for both granted and dismissed filers after filing, with larger falls for granted filers. For
dismissed filers, average revolving utilization decreases by 19.3 percent and average non-mortgage
inquiries decrease by 0.8 from the pre- to post-filing periods. These results are consistent with the
pre-filing levels of credit usage being unsustainable for all filers. This suggests that our two-stage
least squares estimates may be more correctly interpreted as Chapter 13 protection decreasing unmet
credit demand, rather than increasing credit supply. Following our earlier back-of-the-envelope
calculations, our estimates suggest that Chapter 13 protection further augments the fall in utilization
by an additional 78.2 percent, and further augments the fall in the number of inquiries by an
additional 36.5 percent.
E. Credit Score
Panel E of Table 3 reports two-stage least squares estimates for credit score, an aggregate measure
of financial health or credit risk. The dependent variable is the mean credit score from the year of
filing to the fifth post-filing year.
There is a large and precisely estimated impact of Chapter 13 bankruptcy protection on post-
filing credit score. The two-stage least squares results with no controls suggest that Chapter 13
protection increases the marginal recipient’s post-filing credit score by 28.5 points, a 5.0 percent
increase from the dismissed filer mean of 565.4 points. With controls, the estimated impact is 14.9
points, a 2.6 percent increase from the dismissed filer mean. The smaller point estimate when
baseline controls are included is likely due to baseline credit scores being modestly different for
filers assigned to more and less lenient judges in our matched sample. Estimates are larger for
homeowners and filers with higher baseline credit scores.
Consistent with our earlier results, a comparison of means shows that credit scores for both
granted and dismissed bankruptcy filers deteriorate several years before filing. In the years prior to
20
filing for bankruptcy, Chapter 13 filers experience a 40 to 50 point decline in credit score. Credit
scores increase slightly for both dismissed and granted filers after filing, with granted filers experi-
encing a quicker score increase. Following our above calculations, we find that Chapter 13 protection
mitigates about 50.8 percent of the potential deterioration in credit scores.
F. Mechanisms
In this section, we explore two potential mechanisms that might explain our findings: (1) protection
from debt collectors and (2) debt forgiveness.14
We test the importance of the Chapter 13 provision that puts a hold on debt collection efforts
using across-state variation in state garnishment laws. In the four states that do not allow wage
garnishment – Florida, Pennsylvania, South Carolina, and Texas – creditors have fewer options to
collect unpaid debts from dismissed filers. Treatment effects in states that allow wage garnishment
include the effect of the hold on debt collection, debt forgiveness, and asset retention. Treatment
effects in states that do not allow wage garnishment only include the effect of debt forgiveness and
asset retention. If the two sets of estimates are different, this implies that the hold on debt collection
is empirically important.15 Table 5 presents two-stage least squares results for filers in states that do
and do not allow wage garnishment. Consistent with our hypothesis, we find large and statistically
significant effects of Chapter 13 protection in states that allow wage garnishment, and small and
imprecisely estimated effects in the four states that prohibit wage garnishment. However, only one
of the eight differences are statistically significant due to the imprecision of the point estimates in
states that do not allow wage garnishment.
Next, we test the importance of debt forgiveness using across-state variation in Chapter 7 home-
stead exemption levels. Recall that the Chapter 13 repayment plan must pay unsecured creditors
at least as much as they would receive under Chapter 7. Moreover, the amount that unsecured
creditors receive under Chapter 7 depends on state home exemption levels. If debt forgiveness is
empirically important, the effect of Chapter 13 protection should therefore be larger in states that
have high exemptions where filers are able to discharge a larger fraction of their debt. Table 6
14The retention of assets is a third potential mechanism that we are unable to fully test. One partial test ofthis hypothesis is to compare treatment effects for baseline homeowners to baseline renters. In Table 4, we findpositive benefits of Chapter 13 protection for both homeowners and non-homeowners, but results are somewhatlarger for homeowners. These results suggest that retention of important assets, such as a home, is a modest butimportant mechanism explaining our results. An alternative test of this mechanism is to compare treatment effectsfor homeowners and non-homeowners in states with and without judicial foreclosure. In states without judicialforeclosure, creditors can initiate foreclosure proceedings more easily. It is plausible that Chapter 13 protection mayhave a larger impact for homeowners in these states if the retention of the home is an important driver of our results.Appendix Table 5 presents these results. Consistent with the results discussed above, the point estimates suggestthat the retention of assets is a somewhat important driver of our results. However, the imprecision of the estimatesmakes definitive conclusions difficult.
15It is plausible that the decision to file for Chapter 13 is influenced by state wage garnishment laws. If theeffects of Chapter 13 protection are different for these filers, our estimates will also incorporate this heterogeneity oftreatment effects. The same logic applies to our Chapter 7 exemption results in Table 6.
21
presents two-stage least squares results for baseline homeowners and renters in states with above
and below median home exemption levels. The results are broadly consistent with the idea that
benefits of Chapter 13 protection are larger when more debt is forgiven. The effect of Chapter 13
protection on financial strain is 0.175 standard deviations larger for homeowners in high exemption
states compared to homeowners in low exemption states (p-value=0.116), and the effect on mort-
gage balance is $27,709 larger (p-value=0.008). The point estimates for all other outcomes are also
larger for homeowners in high exemption states, although none of the differences are statistically
significant. For renters, we find that the effect of Chapter 13 protection on auto balance is larger
in high exemption states, likely because states with high home exemptions also have high auto
exemptions.
G. Additional Robustness Tests
Appendix Table 6 explores the robustness of our main results to alternative measures of judge
leniency. Column 1 replicates our preferred estimates from Table 3 using the leave-one-out measure
of judge leniency as an instrument for Chapter 13 protection. Column 2 uses a leave-month-out
version of judge leniency as an instrument for Chapter 13 protection that purges any remaining
correlation between a filer’s outcomes and our instrument introduced by the estimation of the
office-by-filing-month fixed effects in our first and second stage regressions. Column 3 uses a leave-
one-out measure of judge leniency calculated using decisions after only 90 days to proxy for the
initial judicial decision to confirm or dismiss a filing.16 Column 4 uses a randomly selected subset
of 25 percent of filers to calculate a leave-month-out measure of judge leniency that is used as an
instrument in the mutually exclusive subset of filers. We also test the robustness of our results
using judge fixed effects directly rather than our reduced form measure of judge leniency. Columns
5 through 7 present results that use judge fixed effects as instruments for bankruptcy protection
estimated using two-stage least squares, LIML, and jackknife IV, respectively. Results across all
specifications are nearly identical to our preferred specifications. None of the estimates suggest that
our preferred estimates are invalid.
Appendix Table 7 examines the persistence of our findings using outcomes for an unbalanced
panel of filers in the sixth through eighth post-filing years. In the sixth through eighth post-filing
years, Chapter 13 protection reduces the marginal recipient’s financial strain by 0.127 standard
deviations, reduces the amount of debt in collections by $1,931, increases the probability of being a
homeowner by 26.0 percentage points, and increases credit score by 28.8 points. While there is no
16We calculate judge leniency using decisions after 90 days because the bulk of dismissals occur within 90 days offiling. Under the Bankruptcy Code, the Chapter 13 trustee must hold a meeting of creditors between 21 and 50 daysafter the debtor files for bankruptcy. A judge is required to hold a confirmation hearing for the proposed repaymentplan no later than 45 days after the meeting of the creditors. Our results are qualitatively similar using decisionsafter 60 and 120 days post-filing.
22

change in the probability of having an open auto loan in the first five post-filing years (see Table 3),
Chapter 13 protection increases the probability of having an auto loan by 12.6 percentage points
by the sixth to eighth post-filing years, suggesting that dismissed filers are more likely to lose their
cars several years after filing.
V. Reconciling Estimates with Prior Literature
Our results from Section IV show that Chapter 13 protection has an economically and statistically
significant impact on the marginal recipient’s financial health. These results stand in sharp contrast
to the prior literature showing few benefits of filing for bankruptcy protection using non-experimental
methods (e.g. Han and Li 2007, 2011, Cohen-Cole, Duygan-Bump and Montoriol-Garriga 2013,
Jagtiani and Li 2014). In this section, we explore the extent to which these contrasting results can
be explained by bias in the non-experimental specifications used in this literature.17
We begin by revisiting the descriptive results comparing the means of granted and dismissed
filers before and after filing. Outcomes for both dismissed and granted filers are worse than non-
filers even before filing. Moreover, the outcomes of both dismissed and granted bankruptcy filers
deteriorate one to two years before filing, and remain depressed after filing. For example, consider
our credit score results discussed above. Four years before filing, credit scores for both granted and
dismissed filers are over 100 points lower than non-filers. In the years prior to filing for bankruptcy,
both groups of filers experience a 40 to 50 point decline in credit score. Credit scores increase
slightly for both dismissed and granted filers after filing, with granted filers experiencing a quicker
score increase.
These descriptive results suggest that non-experimental estimates are likely to be biased down-
wards for at least two reasons. First, there are important differences between filers and non-filers
that may not be fully accounted for by the controls that are typically available in survey data.
Second, there is significant selection into filing even conditional on pre-filing characteristics. Our
descriptive data suggests that bankruptcy filings are often the result of adverse shocks that have
independent effects on outcomes even after filing. In this scenario, both OLS estimates with a non-
filing comparison group and within-individual estimates will be downward biased. The magnitude
of the bias is likely to be decreasing in the number of available baseline controls that can account
17There are at least two other reasons why our estimates would deviate from the prior literature. First, theprior literature has largely relied on either small samples of survey responses (e.g. Han and Li 2007, 2011), oradministrative credit bureau data over a limited time span (e.g. Cohen-Cole, Duygan-Bump and Montoriol-Garriga2013). Our analysis uses administrative credit data linked to bankruptcy filings that cover at least five post-filingyears for all filers. It is possible that the benefits of bankruptcy protection are only detectable with the larger samplesize and a longer time horizon afforded by our data. Consistent with this explanation, we find that our results aremore modest one year after filing compared to subsequent post-filing years. Second, many analyses have consideredthe effects of filing for Chapter 7 and Chapter 13 bankruptcy together (e.g. Han and Li 2011, Cohen-Cole, Duygan-Bump and Montoriol-Garriga 2013). Dobbie and Song (forthcoming) find that the effects of Chapter 7 protection onlabor supply and mortality are smaller than the effects of Chapter 13.
23

for pre-filing differences, and the number of available baseline observations before the pre-filing
deterioration of outcomes.18
Table 7 presents formal OLS and within-individual estimates that test these predictions. Columns
1 and 2 of Table 7 present OLS results comparing discharged Chapter 13 filers to non-filers living
in the same zip code. We exclude dismissed Chapter 13 filers from this comparison to focus on the
effects of receiving Chapter 13 protection.19 Column 1 only controls for zip code-by-filing year fixed
effects. Column 2 adds our standard set of baseline controls to account for observable differences
between discharged filers and non-filers. Standard errors are clustered at the zip code level. We
find that discharged Chapter 13 filers have lower credit scores and higher financial strain compared
to non-filers. We also find that Chapter 13 filers have lower revolving, mortgage, and auto balances
compared to non-filers. Collections balances, revolving utilization, and non-mortgage inquiries are
higher among Chapter 13 recipients in our specification without controls, but lower when we include
our baseline controls. These results are broadly consistent with those reported in Han and Li (2011),
who use data from the Survey of Consumer Finances to show that bankruptcy filers have less wealth
compared to non-filers.
Column 3 presents within-individual estimates comparing the pre- and post-filing outcomes of
discharged Chapter 13 filers. We use three years of baseline data to estimate the individual fixed
effects, and cluster standard errors at the individual level. We find that these within-individual
estimates yield incorrectly signed point estimates for financial strain, mortgage balance, and credit
scores. As discussed above, this finding is likely due to adverse shocks that independently affect post-
filing outcomes. These results are also consistent with Cohen-Cole, Duygan-Bump, and Montoriol-
Garriga (2013), who find that filers have less access to credit after filing using credit bureau data.20
Columns 4 through 6 present results comparing dismissed and discharged Chapter 13 filers. This
approach is in the spirit of Bound’s (1989) analysis of accepted and rejected Disability Insurance
applicants, and more recent work estimating the effects of job loss on subsequent outcomes (Ja-
cobson, Lalonde, and Sullivan 1993, von Wachter, Song, and Manchester 2009, Sullivan and von
Wachter 2009). With the exception of Dobbie and Song (forthcoming), the previous bankruptcy
literature has not used dismissed filers as a comparison group. Following our earlier results with
a non-filer comparison group, column 4 presents results with zip code-by-filing year fixed effects,
18The pre-filing fall in outcomes is similar to the drop in earnings among participants in job training programs.See Ashenfelter (1978), Ashenfelter and Card (1985), and Heckman and Hotz (1989) for additional discussion.
19To remain consistent with the panel format of our judge sample, we create pseudo filing events for non-filersin the national sample. We randomly assign all credit users in the national sample one of four pseudo filing yearsbetween 2003 and 2006. We then exclude individuals who filed for bankruptcy in any of the years prior to this pseudofiling date. Remaining individuals comprise the non-filer comparison group.
20Specifications that use only one year of pre-filing data to estimate the individual fixed effects yield point estimatesthat are correctly signed for most outcomes. This surprising result is due to the individual fixed effects being measuredin a year where outcomes are most depressed. As a result, mean reversion in the outcomes of granted filers generatesupwards bias.
24
column 5 adds our standard set of baseline controls, and column 6 adds individual fixed effects. We
cluster standard errors at the office level for columns 4 and 5, and at the individual level for column
6. In contrast to the non-experimental estimates discussed above, the non-experimental estimates
with a dismissed filer comparison group are broadly consistent with our judge IV estimates. We
find that Chapter 13 filers granted bankruptcy protection have lower financial strain than dismissed
filers, and have less collections debt, higher mortgage balances, more credit access, and higher credit
scores.
In sum, the results from Table 7 are consistent with both OLS estimates using a non-filer compar-
ison group and within-individual estimates being biased against finding any benefits of bankruptcy
protection. Using these non-experimental approaches, we find qualitatively similar results to the
prior literature (Han and Li 2007, 2011, Cohen-Cole, Duygan-Bump, and Montoriol-Garriga 2013).
In contrast, estimates using a dismissed filer comparison group are broadly consistent with our judge
IV estimates, suggesting that selection into filing accounts for most of the bias in non-experimental
specifications.
VI. Conclusion
In this paper, we exploit the random assignment of bankruptcy filers to judges to estimate the impact
of Chapter 13 bankruptcy protection on post-filing financial outcomes. We find that Chapter 13
protection reduces financial strain, increases the probability of being a homeowner, and reduces the
amount of debt in collection. Chapter 13 protection also increases credit scores and credit access
proxies. The effects of Chapter 13 protection are largest in states with more creditor-friendly laws
and states with higher Chapter 7 exemption levels, suggesting that protection from debt collectors
and debt forgiveness are key drivers of our results.
Evaluations of the consumer bankruptcy system weigh the trade-off between the ex-post con-
sumption smoothing benefits provided by bankruptcy protection with the ex-ante increased borrow-
ing costs that result from the higher risk of default. This trade-off is at the heart of an important
literature measuring the effect of consumer bankruptcy on welfare using quantitative models of the
credit market (e.g. Athreya 2002, Li and Sarte 2006, Livshits, MacGee, and Tertilt 2007, Chat-
terjee and Gordon 2012). An important limitation of this literature has been the lack of empirical
evidence on the magnitude of the benefits provided by bankruptcy protection for the marginal re-
cipient. The results from our analysis suggest that the ex-post benefits of consumer bankruptcy
are significantly larger than suggested by non-experimental estimates. Our work also provides new
evidence on the mechanisms through which excessive debt and financial distress distort borrower
behavior. In particular, our results suggest that both excessive debt and the debt collection process
have significant long-term consequences, and that bankruptcy protection can ameliorate many of
25

these adverse consequences.
Estimating the independent impact of a bankruptcy flag and incorporating our findings on
Chapter 13 protection in a general equilibrium model of the credit market that includes ex-ante
impacts of bankruptcy remain important areas for future research.
26

References
[1] Aizer, Anna, and Joseph Doyle, Jr. Forthcoming. “Juvenile Incarceration, Human Capital, andFuture Crime: Evidence from Randomly-Assigned Judges.” Quarterly Journal of Economics
[2] Armour, John, and Douglas Cumming. 2008. “Bankruptcy Law and Entrepreneurship.” Amer-ican Law and Economics Review, 10(2): 303-350.
[3] Ashenfelter, Orley. 1978. “Estimating the Effect of Training programs on Earnings.” The Reviewof Economics and Statistics, 60(1): 47-57.
[4] Ashenfelter, Orley and David Card. 1985. “Using the Longitudinal Structure of Earnings toEstimate the Effect of Training Programs on Earnings.” The Review of Economics andStatistics, 67(4): 648-660.
[5] Athreya, Kartik. 2002. “Welfare Implications of the Bankruptcy Reform Act of 1999.” Journalof Monetary Economics, 49(8): 1567-1595.
[6] Autor, David, and Susan Houseman. 2010. “Do Temporary-Help Jobs Improve Labor Mar-ket Outcomes for Low-Skilled Workers? Evidence from “Work First.” American EconomicJournal: Applied Economics, 2(3): 96-128.
[7] Avery, Robert, Paul Calem, and Glenn Canner. 2003. “An Overview of Consumer Data andCredit Reporting.” Federal Reserve Bulletin, 89 (February): 47-78.
[8] Bound, John. 1989. “The Health and Earnings of Rejected Disability Insurance Applicants.”The American Economic Review, 79(3): 482-503.
[9] Campbell, John Y., Stefano Giglio, and Parag Pathak. 2011. “Forced Sales and House Prices.”American Economic Review, 101(5): 2108-2131.
[10] Chang, Tom, and Antoinette Schoar. 2008. “Judge Specific Differences in Chapter 11 and FirmOutcomes.” Unpublished Working Paper.
[11] Chatterjee, Satyajit, and Grey Gordon. 2012. “Dealing with Consumer Default: Bankruptcy vsGarnishment.” Journal of Monetary Economics, 59(15): S1-S16.
[12] Cohen-Cole, Ethan, Burcu Duygan-Bump, and Judit Montoriol-Garriga. 2013. “Who GetsCredit After Bankruptcy and Why? An Information Channel.” Journal of Banking andFinance, 37(12): 5101-5117.
[13] Domowitz, Ian, and Robert Sartain. 1999. “Determinants of the Consumer Bankruptcy Deci-sion.” The Journal of Finance, 54(1): 403-420.
[14] Dobbie, Will, and Paul Goldsmith-Pinkham. 2014. “Debt Protections and the Great Recession.”Unpublished Working Paper.
[15] Dobbie, Will, and Jae Song. Forthcoming. “Debt Relief and Debtor Outcomes: Measuring theEffects of Consumer Bankruptcy Protection.” American Economic Review.
[16] Doyle, Joseph. 2007. “Child Protection and Child Outcomes: Measuring the Effects of FosterCare.” American Economic Review, 97(5): 1583-1610.
[17] Doyle, Joseph. 2008. “Child Protection and Adult Crime: Using Investigator Assignment toEstimate Causal Effects of Foster Care.” Journal of Political Economy, 116(4): 746-770.
[18] Eggertson, Gauti B., and Paul Krugman. 2012. “Debt, Deleveraging, and the Liquidity Trap:A Fisher-Minsky-Koo Approach.” The Quarterly Journal of Economics, 127(3): 1469-1513.
[19] Fan, Wei, and Michelle White. 2003. “Personal Bankruptcy and the Level of EntrepreneurialActivity.” Journal of Law and Economics, 46(2): 543-567.
27

[20] Farhi, Emmanuel, and Ivan Werning. 2013. “A Theory of Macroprudential Policies in the Pres-ence of Nominal Rigidities.” NBER Working Paper No. 19313.
[21] Fay, Scott, Erik Hurst, and Michelle White. 2002. “The Household Bankruptcy Decision.”American Economic Review, 92(3): 706-718.
[22] Federal Reserve Bank of New York. 2014. Quarterly Report on Household Debt and Credit.
[23] Finkelstein, Amy, Sarah Taubman, Bill Wright, Mira Bernstein, Jonathan Gruber, Joseph P.Newhouse, Heidi Allen, Katherine Baicker, and Oregon Health Study Group. 2012. “TheOregon Health Insurance Experiment: Evidence from the First Year.” The Quarterly Jour-nal of Economics, 127(3): 1057-1106.
[24] French, Eric, and Jae Song. 2014. “The Effect of Disability Insurance Receipt on Labor Supply.”American Economic Journal: Economic Policy, 6(2): 291-337.
[25] Fryer, Roland, and L Katz. 2013. “Achieving Escape Velocity: Neighborhood and School In-terventions to Reduce Persistent Inequality.” American Economic Review (Papers and Pro-ceedings), 103(3): 232-237.
[26] Guerrieri, Veronica, and Guido Lorenzoni. 2011. “Credit Crises, Precautionary Savings, andthe Liquidity Trap.” NBER Working Paper No. 17583.
[27] Han, Song, and Wenli Li. 2007. “Fresh Start or Head Start? The Effect of Filing for PersonalBankruptcy on Labor Supply.” Journal of Financial Services Research, 31(2): 123-152.
[28] Han, Song, and Wenli Li. 2011. “Household Borrowing after Personal Bankruptcy.” Journal ofMoney, Credit and Banking, 43(2-3): 491-517.
[29] Han, Song, Benjamin J. Keys, and Geng Li. 2013. “Unsecured Credit Supply over the CreditCycle: Evidence from Credit Card Mailings.” Unpublished Working Paper.
[30] Heckman, James, and V. Joseph Hotz. 1989. “Choosing Among Alternative NonexperimentalMethods for Estimating the Impact of Social Programs: The Case of Manpower Training.”Journal of the American Statistical Association, 84(408): 862-874.
[31] Himmelstein, David, Deborah Thorne, Elizabeth Warren, and Steffie Woolhandler. 2009. “Med-ical Bankruptcy in the United States, 2007: Results of a National Study.” American Journalof Medicine, 122 (8): 741-746.
[32] Hynes, Richard. 2004. “Why (Consumer) Bankruptcy?” Alabama Law Review, 56(1): 121-179.
[33] Hynes, Richard M., Amanda E. Dawsey, and Lawrence M. Ausubel. 2013. “Non-JudicialDebt Collection and the Consumer’s Choice Among Repayment, Bankruptcy and Infor-mal Bankruptcy.” American Bankruptcy Law Journal, 87(1): 1-26.
[34] Jacobson, Louis, Robert LaLonde and Daniel Sullivan. 1993. “Earnings Losses of DisplacedWorkers.” American Economic Review, 83(4): 685-709.
[35] Jagtiani, Julapa and Wenli Li. Forthcoming. “Credit Access After Consumer Bankruptcy Filing:New Evidence.” American Bankruptcy Law Journal.
[36] Kling, Jeffrey. 2006. “Incarceration Length, Employment, and Earnings.” American EconomicReview, 96(3): 863-876.
[37] Krugman, Paul. 1988. “Financing vs. Forgiving a Debt Overhang.” NBER Working Paper No.2486.
[38] Li, Wenli and Pierre-Daniel Sarte. 2006. “U.S. Consumer Bankruptcy Choice: The Importanceof General Equilibrium Effects.” Journal of Monetary Economics, 53(3): 613-631.
28

[39] Livshits, Igor, James MacGee, and Michele Tertilt. 2007. “Consumer Bankruptcy: A FreshStart.” American Economic Review, 97(1): 402-418.
[40] Maestas, Nicole, Kathleen Mullen, and Alexander Strand. 2013. “Does Disability InsuranceReceipt Discourage Work? Using Examiner Assignment to Estimate Causal Effects of SSDIReceipt.” American Economic Review, 103(5): 1797-1829.
[41] Mahoney, Neale. Forthcoming. “Bankruptcy as Implicit Health Insurance.” American EconomicReview.
[42] Melzer, Brian. 2012. “Mortgage Debt Overhang: Reduced Investment by Homeowners withNegative Equity.” Unpublished Working Paper.
[43] Mian, Atif, Amir Sufi, and Francesco Trebbi. 2013. “The Political Economy of the SubprimeMortgage Credit Expansion.” Quarterly Journal of Political Science, 8(4): 373-408.
[44] Mian, Atif, Kamalesh Rao, and Amir Sufi. 2013. “Household Balance Sheets, Consumption,and the Economic Slump.” The Quarterly Journal of Economics, 128(4): 1687-1726.
[45] Mian, Atif, and Amir Sufi. Forthcoming. “What Explains the 2007-2009 Drop in Employment?”Econometrica.
[46] Midrigan, Virgiliu, and Thomas Philippon. 2011. “Household Leverage and the Recession.”NBER Working Paper No. 16965.
[47] Myers, Stewart. 1977. “Determinants of Corporate Borrowing.” Journal of Financial Economics,5(1977): 147-175.
[48] Norberg, Scott, and Nadia Compo. 2007. “Report on an Empirical Study of District Variations,and the Roles of Judges, Trustees and Debtor’s Attorneys in Chapter 13 Bankruptcy Cases.”The American Bankruptcy Law Journal, 81(4): 431-493.
[49] Porter, Katherine. 2011. “The Pretend Solution: An Empirical Study of Bankruptcy Outcomes.”Texas Law Review, 90(103): 104-162.
[50] Sullivan, Daniel, and Till von Wachter. 2009. “Job Displacement and Mortality: An AnalysisUsing Administrative Data.” Quarterly Journal of Economics, 124(3): 1265-1306.
[51] Sullivan, Teresa, Elizabeth Warren, and Jay Westbrook. 2000. The Fragile Middle Class: Amer-icans in Debt. New Haven, CT: Yale University Press.
[52] von Wachter, Till, Jae Song, and Joyce Manchester. 2009. “Long-Term Earnings Losses due toMass-Layoffs During the 1982 Recession: An Analysis Using Longitudinal AdministrativeData from 1974 to 2004." Unpublished Working Paper.
[53] Warren, Elizabeth, Teresa Sullivan, and Melissa Jacoby. 2000. “Medical Problems andBankruptcy Filings.” Norton Bankruptcy Law Advisor, May 2000.
[54] White, Michelle, and Ning Zhu. 2010. “Saving Your Home in Chapter 13 Bankruptcy.” Journalof Legal Studies, 39(1): 33-61.
[55] White, Michelle. 2011. “Corporate and Personal Bankruptcy Law.” Annual Review of Law andSocial Science, 7: 139-164.
[56] Zywicki, Todd J. 2005. “An Economic Analysis of the Consumer Bankruptcy Crisis.” North-western University Law Review, 99(4): 1463-1541.
29
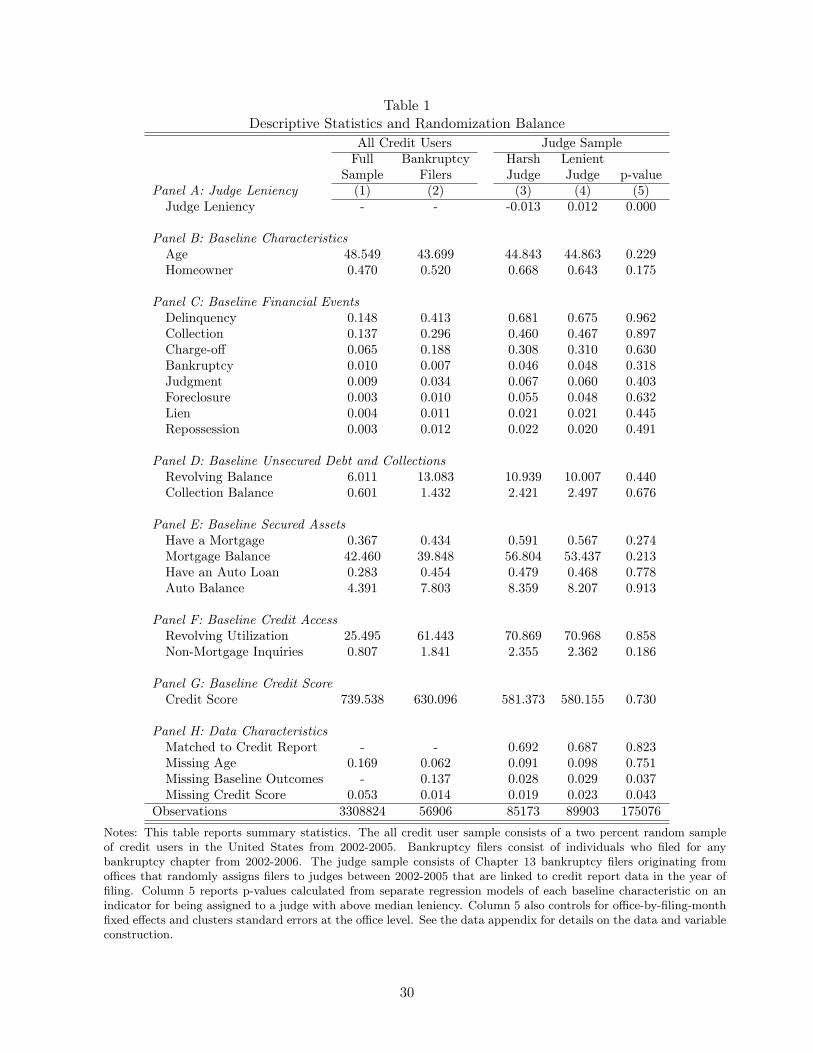
Table 1Descriptive Statistics and Randomization Balance
All Credit Users Judge SampleFull Bankruptcy Harsh Lenient
Sample Filers Judge Judge p-valuePanel A: Judge Leniency (1) (2) (3) (4) (5)
Judge Leniency - - -0.013 0.012 0.000
Panel B: Baseline CharacteristicsAge 48.549 43.699 44.843 44.863 0.229Homeowner 0.470 0.520 0.668 0.643 0.175
Panel C: Baseline Financial EventsDelinquency 0.148 0.413 0.681 0.675 0.962Collection 0.137 0.296 0.460 0.467 0.897Charge-off 0.065 0.188 0.308 0.310 0.630Bankruptcy 0.010 0.007 0.046 0.048 0.318Judgment 0.009 0.034 0.067 0.060 0.403Foreclosure 0.003 0.010 0.055 0.048 0.632Lien 0.004 0.011 0.021 0.021 0.445Repossession 0.003 0.012 0.022 0.020 0.491
Panel D: Baseline Unsecured Debt and CollectionsRevolving Balance 6.011 13.083 10.939 10.007 0.440Collection Balance 0.601 1.432 2.421 2.497 0.676
Panel E: Baseline Secured AssetsHave a Mortgage 0.367 0.434 0.591 0.567 0.274Mortgage Balance 42.460 39.848 56.804 53.437 0.213Have an Auto Loan 0.283 0.454 0.479 0.468 0.778Auto Balance 4.391 7.803 8.359 8.207 0.913
Panel F: Baseline Credit AccessRevolving Utilization 25.495 61.443 70.869 70.968 0.858Non-Mortgage Inquiries 0.807 1.841 2.355 2.362 0.186
Panel G: Baseline Credit ScoreCredit Score 739.538 630.096 581.373 580.155 0.730
Panel H: Data CharacteristicsMatched to Credit Report - - 0.692 0.687 0.823Missing Age 0.169 0.062 0.091 0.098 0.751Missing Baseline Outcomes - 0.137 0.028 0.029 0.037Missing Credit Score 0.053 0.014 0.019 0.023 0.043
Observations 3308824 56906 85173 89903 175076
Notes: This table reports summary statistics. The all credit user sample consists of a two percent random sampleof credit users in the United States from 2002-2005. Bankruptcy filers consist of individuals who filed for anybankruptcy chapter from 2002-2006. The judge sample consists of Chapter 13 bankruptcy filers originating fromoffices that randomly assigns filers to judges between 2002-2005 that are linked to credit report data in the year offiling. Column 5 reports p-values calculated from separate regression models of each baseline characteristic on anindicator for being assigned to a judge with above median leniency. Column 5 also controls for office-by-filing-monthfixed effects and clusters standard errors at the office level. See the data appendix for details on the data and variableconstruction.
30

Table 2Judge Leniency and Chapter 13 Protection
(1) (2) (3) (4) (5) (6)Judge Leniency 0.88872∗∗∗ 0.83789∗∗∗ 0.84220∗∗∗ 0.85585∗∗∗ 0.85780∗∗∗ 0.81092∗∗∗
(0.04873) (0.05299) (0.04777) (0.05243) (0.04588) (0.05186)Age at Filing 0.00305∗∗∗ 0.00235∗∗∗ 0.00424∗∗∗ 0.00310∗∗∗ 0.00072∗∗∗
(0.00016) (0.00018) (0.00017) (0.00017) (0.00018)Homeowner 0.03749∗∗∗−0.01142 0.02574∗∗∗ 0.00205 −0.00827
(0.01047) (0.01305) (0.00512) (0.01222) (0.00536)Delinquency −0.06518∗∗∗ 0.03066∗∗∗
(0.00908) (0.00402)Collection −0.12082∗∗∗ −0.04848∗∗∗
(0.00765) (0.00428)Charge-off 0.00413 0.00117
(0.00320) (0.00267)Bankruptcy −0.13191∗∗∗ −0.08388∗∗∗
(0.01038) (0.00809)Judgment −0.07933∗∗∗ −0.04120∗∗∗
(0.01277) (0.01031)Foreclosure −0.17495∗∗∗ −0.12185∗∗∗
(0.01508) (0.01319)Lien −0.10001∗∗∗ −0.06406∗∗∗
(0.00847) (0.00842)Repossession −0.02670∗∗∗ 0.00054
(0.00855) (0.00804)Revolving Balance 0.00575∗∗∗ 0.00487∗∗∗
(0.00025) (0.00021)Collection Balance −0.00617∗∗∗ −0.00206∗∗∗
(0.00051) (0.00038)Have a Mortgage 0.00883 0.04324∗∗∗
(0.01359) (0.00972)Mortgage Balance −0.00028∗∗∗ −0.00039∗∗∗
(0.00007) (0.00005)Have an Auto Loan 0.10670∗∗∗ 0.06466∗∗∗
(0.00488) (0.00463)Auto Balance −0.00065∗∗∗ −0.00068∗∗∗
(0.00024) (0.00022)Revolving Utilization −0.00004 0.00009∗∗∗
(0.00003) (0.00002)Non-Mortgage Inquiries −0.01126∗∗∗−0.00861∗∗∗
(0.00081) (0.00069)Credit Score 0.00075∗∗∗ 0.00142∗∗∗
(0.00008) (0.00005)Observations 175076 175076 175076 175076 175076 175076
Notes: This table reports first stage results. The sample consists of Chapter 13 bankruptcy filers originating fromoffices that randomly assigns filers to judges between 2002-2005 that are linked to credit report data in the year offiling. Judge leniency is the leave-one-out mean rate of granting Chapter 13 bankruptcy protection for the assignedjudge minus the leave-one-out mean rate of granting bankruptcy protection for the office. All characteristics aremeasured one year prior to the bankruptcy filing. All regressions control for office-by-filing-month fixed effects andcluster standard errors at the office level. See the data appendix for details on the data and variable construction.*** = significant at 1 percent level, ** = significant at 5 percent level, * = significant at 10 percent level.
31

Table 3Chapter 13 Protection and Financial Well-Being
DismissedMean 2SLS Results
Panel A: Adverse Financial Events (1) (2) (3)Financial Strain Index -0.068 −0.369∗∗∗ −0.316∗∗∗
(0.575) (0.070) (0.071)Delinquency 0.596 0.019 0.013
(0.292) (0.017) (0.018)Collection 0.584 −0.201∗∗∗ −0.149∗∗
(0.305) (0.053) (0.061)Charge-off† 0.216 −0.065∗∗∗ −0.067∗∗∗
(0.227) (0.017) (0.020)New Bankruptcy† 0.109 −0.064∗∗∗ −0.065∗∗∗
(0.167) (0.023) (0.025)Foreclosure 0.070 −0.030∗∗∗ −0.016∗
(0.139) (0.009) (0.008)Judgment 0.066 −0.039∗∗ −0.031∗
(0.128) (0.016) (0.016)Lien 0.034 −0.034∗∗∗ −0.034∗∗
(0.099) (0.012) (0.013)Repossession 0.019 −0.015∗∗∗ −0.016∗∗
(0.064) (0.006) (0.006)
Panel B: Unsecured Debt and CollectionsRevolving Balance 2.563 0.199 −0.920
(6.065) (0.720) (0.745)Collection Balance 4.217 −1.842∗∗∗ −1.315∗∗∗
(5.898) (0.449) (0.432)
Panel C: Secured AssetsHave a Mortgage 0.363 0.110∗∗ 0.132∗∗∗
(0.369) (0.045) (0.021)Mortgage Balance 26.833 12.196∗∗∗ 14.267∗∗∗
(41.359) (4.132) (4.955)Have an Auto Loan 0.178 0.046∗ 0.020
(0.263) (0.028) (0.032)Auto Balance 4.067 −0.500 −0.904
(5.797) (0.500) (0.581)
Panel D: Credit AccessRevolving Utilization 46.729 −15.132∗∗∗ −16.148∗∗∗
(46.437) (3.884) (3.282)Non-Mortgage Inquiries 1.584 −0.410∗∗∗ −0.293∗∗
(1.487) (0.121) (0.118)
Panel E: Credit ScoreCredit Score 565.433 28.511∗∗∗ 14.981∗∗∗
(44.543) (4.234) (3.270)Controls – No YesObservations 97006 175076 175076
32

Notes: This table reports two-stage least squares results of the impact of Chapter 13 bankruptcy protection onpost-filing outcomes. The sample consists of Chapter 13 bankruptcy filers originating from offices that randomlyassigns filers to judges between 2002-2005 that are linked to credit report data in the year of filing. All outcomesare annual averages for the year of filing to fifth year post-filing, with the exceptions of outcomes with a † whereoutcomes are averaged over the first full year after filing to the fifth year post-filing to remove the mechanical effectof the bankruptcy filing. Column 1 reports the post-filing mean and standard deviation for dismissed filers. Columns2-3 instrument for Chapter 13 protection using the leave-one-out mean rate of granting Chapter 13 bankruptcyprotection for the assigned judge minus the leave-one-out mean rate of granting bankruptcy protection for the office.All regressions control for office-by-filing-month fixed effects and cluster standard errors at the office level. Column 3adds controls for baseline age bins, homeownership, credit score, financial strain index, revolving balance, collectionbalance, mortgage balance, auto balance, indicators for mortgage and auto loans, revolving utilization, and non-mortgage inquiries as controls. The financial strain index contains the non-cumulative probabilities of the followingeight components: delinquency, collection, charge-off, bankruptcy, foreclosure, judgment, lien and repossession. Foreach year post-filing, each component is standardized using the mean and standard deviation for the dismissed filergroup in the baseline year. We sum across the eight components to create an index, restandardizing using the meanand standard deviation of the dismissed filer group in the baseline period. The index is then averaged over the fiveyears post-filing. See the data appendix for details on the data and variable construction. *** = significant at 1percent level, ** = significant at 5 percent level, * = significant at 10 percent level.
33

Tab
le4
Cha
pter
13Results
byFile
rCha
racteristics
Age
atFiling
BaselineCreditScore
BaselineHom
eowner
25to
3940
to59
60an
dup
High
Low
Yes
No
(1)
(2)
(3)
(4)
(5)
(6)
(7)
Finan
cial
Strain
−0.402∗∗∗
−0.302∗∗∗
−0.388
−0.327∗∗∗
−0.344∗∗∗
−0.416∗∗∗
−0.165∗
(0.085)
(0.070)
(0.405)
(0.065)
(0.071)
(0.047)
(0.091)
[0.040]
[−0.041]
[−0.248]
[−0.132]
[0.012]
[0.010]
[−0.184]
Revolving
Balan
ce0.059
−1.304
1.168
−1.249
−0.011
−0.817
−0.586
(0.700)
(1.130)
(1.985)
(0.996)
(0.774)
(0.747)
(0.918)
[2.171]
[2.961]
[4.282]
[3.161]
[2.226]
[3.061]
[1.676]
CollectionBalan
ce−1.719∗∗
−1.269∗∗∗
−1.528
−2.210∗∗∗
−0.384
−1.531∗∗
−1.011∗∗
(0.747)
(0.410)
(1.589)
(0.433)
(1.089)
(0.641)
(0.474)
[4.737]
[4.160]
[2.950]
[3.354]
[4.737]
[3.935]
[4.661]
MortgageBalan
ce11.449
18.233∗∗∗
26.818∗∗∗
15.583∗∗∗
14.912∗
20.372∗∗
4.530
(7.240)
(4.750)
(10.474)
(4.614)
(8.725)
(9.536)
(6.037)
[25.937]
[31.594]
[28.102]
[29.721]
[26.420]
[39.126]
[6.404]
AutoBalan
ce−1.570∗∗
−0.743
1.846
−0.698
−0.908∗
−0.889
−0.923
(0.780)
(0.790)
(1.729)
(0.837)
(0.478)
(0.592)
(1.023)
[4.797]
[4.188]
[3.129]
[4.508]
[3.920]
[4.224]
[3.810]
Revolving
Utilization
−21.246∗∗∗
−13.434∗∗∗
−7.594
−15.683∗∗∗
−14.441∗∗
−16.708∗∗∗
−14.152∗∗
(6.534)
(3.011)
(9.937)
(5.045)
(5.652)
(2.577)
(6.707)
[49.679]
[48.149]
[45.564]
[41.543]
[52.114]
[46.686]
[47.368]
Non
-MortgageInqu
iries
−0.280
−0.340∗∗∗
0.256
−0.440∗
−0.193
−0.440∗∗
−0.069
(0.210)
(0.078)
(0.621)
(0.227)
(0.389)
(0.189)
(0.156)
[1.843]
[1.552]
[1.221]
[1.422]
[1.714]
[1.595]
[1.548]
CreditScore
22.280∗∗∗
9.952∗∗
32.090∗∗∗
18.579∗∗∗
10.864
18.369∗∗∗
7.573
(5.913)
(4.211)
(11.259)
(5.718)
(7.662)
(2.576)
(7.158)
[556.870]
[569.943]
[596.253]
[585.202]
[553.228]
[570.837]
[556.678]
Con
trols
Yes
Yes
Yes
Yes
Yes
Yes
Yes
Observation
s54442
81206
19100
84154
82241
111432
58627
Notes:Thistablerepo
rtsfirst
stagean
dtw
o-stageleastsqua
resresultsby
baselin
echaracteristics.
The
sampleconsists
ofCha
pter
13ba
nkruptcy
filersoriginatingfrom
officesthat
rand
omly
assign
sfilersto
judg
esbe
tween2002-2005that
arelin
kedto
cred
itrepo
rtda
tain
theyear
offiling.
The
post-filin
gmeanfordism
issedfilersis
repo
rted
inbrackets
foreach
subg
roup
.WeinstrumentforCha
pter
13protection
usingtheleave-on
e-ou
tmean
rate
ofgran
ting
Cha
pter
13ba
nkruptcy
protection
fortheassign
edjudg
eminus
theleave-on
e-ou
tmeanrate
ofgran
ting
bank
ruptcy
protection
forthe
office.Su
bgroup
instruments
areconstructedusingthematched
estimationsample.
Allregression
scontrolforba
selin
eagebins,ho
meowne
rship,
cred
itscore,
finan
cial
strain
inde
x,revolvingba
lance,
colle
ctionba
lance,
mortgageba
lance,
auto
balance,
indicators
formortgagean
dau
toloan
s,revo
lving
utilization
,no
n-mortgageinqu
iries,
office-by-filing-mon
thfix
edeff
ects,an
dclusterstan
dard
errors
attheoffi
celevel.
Seetheda
taap
pend
ixforde
tails
ontheda
taan
dvariab
leconstruction
.***=
sign
ificant
at1pe
rcentlevel,**
=sign
ificant
at5pe
rcentlevel,*=
sign
ificant
at10
percentlevel.
34

Table 5Chapter 13 Results by State Wage Garnishment Laws
Garnishment AllowedYes No p-value(1) (2) (3)
Financial Strain −0.319∗∗∗ −0.132 0.449(0.070) (0.242)
[−0.058] [−0.167]Revolving Balance −1.061 6.606 0.132
(0.654) (5.119)[2.477] [3.407]
Collection Balance −1.285∗∗∗ −2.888 0.407(0.441) (1.913)[4.190] [4.482]
Mortgage Balance 13.985∗∗∗ 29.399 0.606(5.190) (29.864)[26.517] [29.940]
Auto Balance −1.017∗ 5.158 0.245(0.532) (5.366)[4.051] [4.223]
Revolving Utilization −16.619∗∗∗ 9.060 0.349(3.477) (27.639)[46.375] [50.211]
Non-Mortgage Inquiries −0.319∗∗∗ 1.086 0.084(0.120) (0.818)[1.584] [1.584]
Credit Score 15.243∗∗∗ 2.614 0.643(3.180) (27.332)
[564.281] [576.741]Controls Yes Yes –Observations 154611 20465 –
Notes: This table reports two-stage least squares results of the impact of Chapter 13 bankruptcy protection for statesthat do and do not allow wage garnishment. The sample consists of Chapter 13 bankruptcy filers originating fromoffices that randomly assigns filers to judges between 2002-2005 that are linked to credit report data in the year offiling. The post-filing mean for dismissed filers is reported in brackets for each subgroup. We instrument for Chapter13 protection using the leave-one-out mean rate of granting Chapter 13 bankruptcy protection for the assignedjudge minus the leave-one-out mean rate of granting bankruptcy protection for the office. Subgroup instrumentsare constructed using the matched estimation sample. All regressions control for baseline age bins, homeownership,credit score, financial strain index, revolving balance, collection balance, mortgage balance, auto balance, indicatorsfor mortgage and auto loans, revolving utilization, non-mortgage inquiries, office-by-filing-month fixed effects, andcluster standard errors at the office level. See the data appendix for details on the data and variable construction.*** = significant at 1 percent level, ** = significant at 5 percent level, * = significant at 10 percent level.
35

Table 6Chapter 13 Results by State Homestead Exemption Laws
Homeowners RentersHigh Low High Low
Home Ex. Home Ex. p-value Home Ex. Home Ex. p-value(1) (2) (3) (4) (5) (6)
Financial Strain −0.454∗∗∗ −0.279∗∗ 0.116 −0.180∗∗ −0.159 0.912(0.025) (0.114) (0.090) (0.182)[0.032] [−0.022] [−0.141] [−0.214]
Revolving Balance −1.149∗∗ 0.452 0.373 −0.880 −0.101 0.592(0.538) (1.782) (1.066) (1.105)[3.333] [2.677] [2.010] [1.435]
Collection Balance −1.670∗∗∗ −0.930 0.692 −1.019∗ −1.135 0.897(0.602) (1.898) (0.616) (0.793)[4.089] [3.718] [4.699] [4.634]
Mortgage Balance 26.390∗∗∗ −1.319 0.008 5.566 7.000 0.853(7.832) (7.902) (6.412) (5.018)[42.984] [33.692] [8.444] [4.934]
Auto Balance −0.916 −0.594 0.755 −1.548∗∗ 0.697 0.046(0.708) (0.797) (0.736) (0.993)[4.327] [4.080] [4.449] [3.350]
Revolving Utilization −17.234∗∗∗ −16.214∗ 0.910 −9.741∗ −26.188∗∗∗ 0.100(1.712) (9.174) (5.558) (9.145)[46.774] [46.561] [47.841] [47.027]
Non-Mortgage Inquiries −0.501∗∗ −0.194 0.435 −0.169 0.142 0.215(0.244) (0.328) (0.108) (0.267)[1.637] [1.537] [1.596] [1.514]
Credit Score 18.776∗∗∗ 16.311∗∗∗ 0.676 9.496∗ 2.743 0.650(2.658) (5.572) (5.056) (15.766)
[572.428] [568.595] [561.523] [553.179]Controls Yes Yes – Yes Yes –Observations 61334 50098 – 25900 32727 –
Notes: This table reports two-stage least squares results of the impact of Chapter 13 bankruptcy protection forstates with above median and below median homestead exemption amounts, separately by homeownership status.The sample consists of Chapter 13 bankruptcy filers originating from offices that randomly assigns filers to judgesbetween 2002-2005 that are linked to credit report data in the year of filing. The post-filing mean for dismissed filersis reported in brackets for each subgroup. We instrument for Chapter 13 protection using the leave-one-out mean rateof granting Chapter 13 bankruptcy protection for the assigned judge minus the leave-one-out mean rate of grantingbankruptcy protection for the office. Subgroup instruments are constructed using the matched estimation sample.All regressions control for baseline age bins, homeownership, credit score, financial strain index, revolving balance,collection balance, mortgage balance, auto balance, indicators for mortgage and auto loans, revolving utilization,non-mortgage inquiries, office-by-filing-month fixed effects, and cluster standard errors at the office level. See thedata appendix for details on the data and variable construction. *** = significant at 1 percent level, ** = significantat 5 percent level, * = significant at 10 percent level.
36

Tab
le7
Non
-Exp
erim
entalE
stim
ates
withDifferentCom
parisonGroup
sAllCreditUsers
Ind.
FE
DismissedFilers
(1)
(2)
(3)
(4)
(5)
(6)
Finan
cial
Strain
0.505∗∗∗
0.101∗∗∗
0.039∗∗∗
−0.407∗∗∗
−0.337∗∗∗
−0.098∗∗∗
(0.004)
(0.003)
(0.004)
(0.023)
(0.014)
(0.006)
Revolving
Balan
ce−3.094∗∗∗
−10.178∗∗∗
−11.555∗∗∗
1.085∗∗∗
−0.771∗∗∗
−7.508∗∗∗
(0.053)
(0.100)
(0.099)
(0.122)
(0.075)
(0.112)
CollectionBalan
ce0.934∗∗∗
−0.907∗∗∗
0.010
−2.229∗∗∗
−1.576∗∗∗
−1.336∗∗∗
(0.021)
(0.018)
(0.023)
(0.092)
(0.049)
(0.037)
MortgageBalan
ce−8.011∗∗∗
−34.320∗∗∗
−17.744∗∗∗
10.549∗∗∗
7.584∗∗∗
7.410∗∗∗
(0.374)
(0.377)
(0.293)
(0.810)
(0.893)
(0.404)
AutoBalan
ce−0.651∗∗∗
−3.914∗∗∗
−5.530∗∗∗
−0.078
−0.362∗∗∗
−1.829∗∗∗
(0.031)
(0.033)
(0.054)
(0.089)
(0.065)
(0.070)
Revolving
Utiliz
ation
6.813∗∗∗
−21.376∗∗∗
−35.834∗∗∗
−11.388∗∗∗
−8.758∗∗∗
−10.166∗∗∗
(0.167)
(0.169)
(0.285)
(0.790)
(0.630)
(0.448)
Non
-MortgageInqu
iries
0.336∗∗∗
−0.332∗∗∗
−1.096∗∗∗
−0.484∗∗∗
−0.322∗∗∗
−0.042∗∗∗
(0.007)
(0.006)
(0.010)
(0.028)
(0.022)
(0.015)
CreditScore
−118.878∗∗∗
−21.275∗∗∗
−2.973∗∗∗
44.848∗∗∗
24.414∗∗∗
12.743∗∗∗
(0.866)
(0.342)
(0.308)
(1.606)
(0.668)
(0.392)
BaselineCon
trols
No
Yes
No
No
Yes
No
Individu
alFixed
Effe
cts
No
No
Yes
No
No
Yes
Observation
s1721287
1721287
253014
175076
175076
563636
Notes:Thistablerepo
rtsno
n-expe
rimentalestimates
oftheim
pact
ofCha
pter
13ba
nkruptcy
protection
onpo
st-filin
gou
tcom
es.
Colum
ns1-2repo
rtOLSestimates
compa
ring
discha
rged
filersin
ourestimationsampleto
alln
on-filers
inthefullsampleof
allc
redit
users.
Colum
n3repo
rtswithin-individu
alestimates
compa
ring
thepre-
andpo
st-filin
gou
tcom
esof
discha
rged
filersusingthreeyears
ofba
selin
eda
ta.Colum
ns4-5repo
rtOLSestimates
compa
ring
discha
rged
filersto
dism
issedfilersin
ourestimationsample.
Colum
n7
repo
rtswithin-individu
alestimates
compa
ring
discha
rged
filersto
dism
issedfilersin
ourestimationsampleusingthreeyearsof
baselin
eda
ta.Se
ethetext
forad
dition
alde
tails
oneach
specification
,and
theda
taap
pend
ixforde
tails
ontheda
taan
dvariab
leconstruction
.***=
sign
ificant
at1pe
rcentlevel,**
=sign
ificant
at5pe
rcentlevel,*=
sign
ificant
at10
percentlevel.
37

Appendix Table 1Bankruptcy Offices in Chapter 13 IV Sample
Court Office Years Judges Discharge σZNorthern District of Alabama Birmingham 2002-2005 3 0.349 0.036Southern District of Alabama Mobile 2002-2005 2 0.464 0.006Southern District of California San Diego 2002-2005 4 0.472 0.011Southern District of Florida Fort Lauderdale 2002-2005 2 0.448 0.006Southern District of Florida Miami 2002-2005 2 0.537 0.007Northern District of Georgia Atlanta 2004-2005 8 0.322 0.035Northern District of Georgia Rome 2004-2005 2 0.414 0.015District of Idaho Boise 2002-2005 2 0.548 0.006Southern District of Indiana Indianapolis 2002-2005 3 0.529 0.006Eastern District of Kentucky Lexington 2002-2005 2 0.556 0.034District of Massachusetts Boston 2002-2003 3 0.334 0.036Eastern District of Michigan Detroit 2003-2005 3 0.299 0.001Western District of Michigan Grand Rapids 2002-2005 3 0.507 0.010District of Minnesota Minneapolis 2002-2005 2 0.530 0.001District of Minnesota St. Paul 2002-2005 2 0.543 0.044Eastern District of Missouri St. Louis 2003-2005 2 0.422 0.019Western District of Missouri Kansas City 2002-2005 4 0.505 0.011Middle District of North Carolina Durham 2005 2 0.568 0.017District of New Mexico Albuquerque 2002-2005 2 0.419 0.022District of Nevada Las Vegas 2002-2005 3 0.389 0.011Southern District of Ohio Cincinnati 2002-2005 3 0.570 0.025Southern District of Ohio Columbus 2002 3 0.600 0.057Southern District of Ohio Dayton 2002-2005 3 0.609 0.022Northern District of Oklahoma Tulsa 2002-2005 2 0.480 0.011District of Oregon Eugene 2002-2005 2 0.600 0.016District of Oregon Portland 2002-2005 3 0.551 0.114District of South Carolina Columbia 2003-2005 2 0.758 0.021Eastern District of Tennessee Chattanooga 2002-2005 2 0.443 0.009Middle District of Tennessee Columbia 2002-2005 3 0.469 0.010Middle District of Tennessee Cookeville 2002-2005 3 0.476 0.014Middle District of Tennessee Nashville 2002-2005 3 0.493 0.015Western District of Tennessee Memphis 2002-2005 3 0.270 0.003Western District of Texas San Antonio 2002-2005 2 0.443 0.002District of Utah Salt Lake City 2003-2005 3 0.348 0.007Eastern District of Virginia Alexandria 2002-2005 2 0.567 0.001Eastern District of Virginia Newport News 2002-2005 2 0.569 0.038Eastern District of Virginia Norfolk 2002-2005 2 0.597 0.001Western District of Washington Tacoma 2002-2005 2 0.574 0.004Eastern District of Wisconsin Milwaukee 2003-2005 3 0.472 0.010
Notes: This table presents descriptive statistics for the 39 offices in the 29 bankruptcy courts that randomly assignfilings to judges in our instrumental variables sample. σZ is the standard deviation of leave-one-out measure of judgeleniency described in the text.
38

Appendix Table 2Results for Alternative Financial Strain Measures
DismissedMean 2SLS Results
Panel A: Ever Experienced (1) (2) (3)Delinquency 0.942 0.002 −0.007
(0.233) (0.027) (0.026)Collection 0.920 −0.147∗∗ −0.098
(0.271) (0.061) (0.066)Charge-off† 0.581 −0.112∗ −0.120∗
(0.493) (0.060) (0.065)New Bankruptcy† 0.351 −0.271∗∗∗ −0.278∗∗∗
(0.477) (0.056) (0.060)Foreclosure 0.248 −0.111∗∗∗ −0.062∗∗
(0.432) (0.031) (0.025)Judgment 0.252 −0.154∗∗∗ −0.127∗∗
(0.434) (0.056) (0.058)Lien 0.128 −0.116∗∗∗ −0.111∗∗∗
(0.334) (0.026) (0.028)Repossession 0.084 −0.071∗∗∗ −0.074∗∗
(0.278) (0.027) (0.029)
Panel B: Number of ExperiencesDelinquencies 6.774 1.247∗ 0.719
(5.434) (0.650) (0.688)Collections 6.847 −2.992∗∗∗ −2.235∗∗∗
(6.722) (0.624) (0.750)Charge-offs† 1.220 −0.364∗∗∗ −0.395∗∗∗
(1.562) (0.110) (0.130)New Bankruptcies† 0.479 −0.336∗∗∗ −0.339∗∗∗
(0.772) (0.103) (0.110)Foreclosures 0.369 −0.158∗∗∗ −0.077∗
(0.767) (0.047) (0.045)Judgments 0.384 −0.304∗∗∗ −0.262∗∗∗
(0.836) (0.090) (0.093)Liens 0.237 −0.283∗∗∗ −0.275∗∗
(1.069) (0.102) (0.111)Repossessions 0.094 −0.076∗∗ −0.078∗∗
(0.329) (0.034) (0.036)Controls – No YesObservations 97006 175076 175076
Notes: This table reports two-stage least squares results of the impact of Chapter 13 bankruptcy protection foralternative versions of the financial strain variables. All outcomes are annual averages for the year of filing to fifthyear post-filing, with the exceptions of outcomes with a † where outcomes are averaged over the first full year afterfiling to the fifth year post-filing to remove the mechanical effect of the bankruptcy filing. Panel A reports results forindicator variables equal to one if the listed event occurred at least once in the first five post-filing years. Panel Breports results for the number of times the listed event occurred in the first five post-filing years. See Table 3 notesfor additional details. *** = significant at 1 percent level, ** = significant at 5 percent level, * = significant at 10percent level.
39

App
endixTab
le3
First
Stag
eResults
byFile
rCha
racteristics
Age
atFiling
BaselineCreditScore
BaselineHom
eowne
r25
to39
40to
5960
andup
High
Low
Yes
No
(1)
(2)
(3)
(4)
(5)
(6)
(7)
Discharge
0.945∗∗∗
0.854∗∗∗
0.424∗∗∗
0.796∗∗∗
0.815∗∗∗
0.814∗∗∗
0.785∗∗∗
(0.097)
(0.059)
(0.149)
(0.045)
(0.069)
(0.070)
(0.064)
Relativeto
OverallFirst
Stage
1.165
1.053
0.523
0.982
1.005
1.004
0.968
Con
trols
Yes
Yes
Yes
Yes
Yes
Yes
Yes
Observation
s54442
81206
19100
84154
82241
111432
58627
Notes:Thistablerepo
rtsfirst
stagean
dtw
o-stageleastsqua
resresultsby
baselin
echaracteristics.
The
sampleconsists
ofCha
pter
13ba
nkruptcy
filersoriginatingfrom
officesthat
rand
omly
assign
sfilersto
judg
esbe
tween2002-2005that
arelin
kedto
cred
itrepo
rtda
tain
theyear
offiling.
The
post-filin
gmeanfordism
issedfilersis
repo
rted
inbrackets
foreach
subg
roup
.WeinstrumentforCha
pter
13protection
usingtheleave-on
e-ou
tmean
rate
ofgran
ting
Cha
pter
13ba
nkruptcy
protection
fortheassign
edjudg
eminus
theleave-on
e-ou
tmeanrate
ofgran
ting
bank
ruptcy
protection
forthe
office.Su
bgroup
instruments
areconstructedusingthematched
estimationsample.
Allregression
scontrolfor
ageat
filingan
dba
selin
eho
meowne
rship,
cred
itscore,
finan
cial
strain
inde
x,installm
entba
lance,
revolvingba
lance,
colle
ctionba
lance,
mortgageba
lance,
andno
n-mortgagecred
itaccess
inde
x,offi
ce-by-filing-mon
thfix
edeff
ects,a
ndclusterstan
dard
errors
attheoffi
celevel.Se
etheda
taap
pend
ixforde
tails
ontheda
taan
dvariab
leconstruction
.***=
sign
ificant
at1pe
rcentlevel,**
=sign
ificant
at5pe
rcentlevel,*=
sign
ificant
at10
percentlevel.
40

Appendix Table 4Results for Additional Outcomes
DismissedMean 2SLS Results
Panel A: Adverse Financial Events (1) (2) (3)Number of Paid Collections 0.744 −0.336∗∗∗ −0.224∗∗∗
(1.266) (0.057) (0.051)Number of Unpaid Collections 4.251 −1.899∗∗∗ −1.296∗∗
(4.374) (0.475) (0.528)Number of Medical Collections 0.513 −0.077 −0.004
(0.942) (0.090) (0.101)Number of Paid Judgments 0.087 −0.051∗∗ −0.032
(0.338) (0.023) (0.025)Number of Unpaid Judgments 0.560 −0.339∗∗∗ −0.238∗∗
(0.977) (0.107) (0.102)
Panel B: Student DebtAny Active Student Debt 0.167 0.003 0.026
(0.343) (0.057) (0.050)Any Deferred Student Debt 0.038 −0.015 −0.010
(0.154) (0.027) (0.026)
Panel C: Home TransitionsLiving in Same Residence 0.496 0.270∗∗∗ 0.250∗∗∗
(0.500) (0.049) (0.054)Moved to Rental 0.429 −0.267∗∗∗ −0.250∗∗∗
(0.495) (0.065) (0.059)Move to Home 0.075 −0.003 −0.001
(0.263) (0.040) (0.040)
Panel D: Revolving TradesNumber of Open Revolving Trades 0.766 0.576∗∗∗ 0.321∗∗
(1.312) (0.144) (0.130)Credit Limit Revolving Trades 6.083 3.362∗∗∗ −0.599
(12.691) (1.256) (0.801)Controls – No YesObservations 97006 175076 175076
Notes: This table reports two-stage least squares results of the impact of Chapter 13 bankruptcy protection on addi-tional outcomes available in the credit bureau data. The sample consists of Chapter 13 bankruptcy filers originatingfrom offices that randomly assigns filers to judges between 2002-2005 that are linked to credit report data in the yearof filing. All outcomes are measured over the first five post-filing years. Column 1 reports the post-filing mean andstandard deviation for dismissed filers. Columns 2-3 instrument for Chapter 13 protection using the leave-one-outmean rate of granting Chapter 13 bankruptcy protection for the assigned judge minus the leave-one-out mean rateof granting bankruptcy protection for the office. All regressions control for office-by-filing-month fixed effects andcluster standard errors at the office level. Column 3 adds controls for baseline age bins, homeownership, credit score,financial strain index, revolving balance, collection balance, mortgage balance, auto balance, indicators for mortgageand auto loans, revolving utilization, and non-mortgage inquiries as controls. *** = significant at 1 percent level, **= significant at 5 percent level, * = significant at 10 percent level.
41
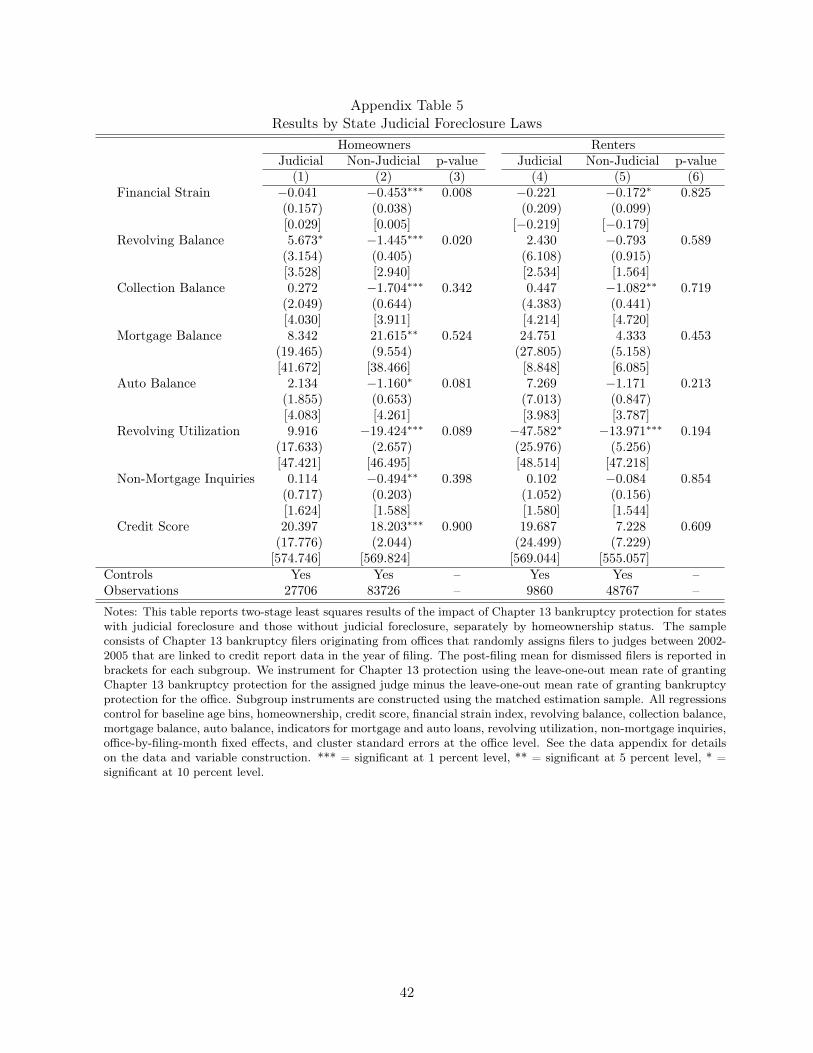
Appendix Table 5Results by State Judicial Foreclosure Laws
Homeowners RentersJudicial Non-Judicial p-value Judicial Non-Judicial p-value
(1) (2) (3) (4) (5) (6)Financial Strain −0.041 −0.453∗∗∗ 0.008 −0.221 −0.172∗ 0.825
(0.157) (0.038) (0.209) (0.099)[0.029] [0.005] [−0.219] [−0.179]
Revolving Balance 5.673∗ −1.445∗∗∗ 0.020 2.430 −0.793 0.589(3.154) (0.405) (6.108) (0.915)[3.528] [2.940] [2.534] [1.564]
Collection Balance 0.272 −1.704∗∗∗ 0.342 0.447 −1.082∗∗ 0.719(2.049) (0.644) (4.383) (0.441)[4.030] [3.911] [4.214] [4.720]
Mortgage Balance 8.342 21.615∗∗ 0.524 24.751 4.333 0.453(19.465) (9.554) (27.805) (5.158)[41.672] [38.466] [8.848] [6.085]
Auto Balance 2.134 −1.160∗ 0.081 7.269 −1.171 0.213(1.855) (0.653) (7.013) (0.847)[4.083] [4.261] [3.983] [3.787]
Revolving Utilization 9.916 −19.424∗∗∗ 0.089 −47.582∗ −13.971∗∗∗ 0.194(17.633) (2.657) (25.976) (5.256)[47.421] [46.495] [48.514] [47.218]
Non-Mortgage Inquiries 0.114 −0.494∗∗ 0.398 0.102 −0.084 0.854(0.717) (0.203) (1.052) (0.156)[1.624] [1.588] [1.580] [1.544]
Credit Score 20.397 18.203∗∗∗ 0.900 19.687 7.228 0.609(17.776) (2.044) (24.499) (7.229)[574.746] [569.824] [569.044] [555.057]
Controls Yes Yes – Yes Yes –Observations 27706 83726 – 9860 48767 –
Notes: This table reports two-stage least squares results of the impact of Chapter 13 bankruptcy protection for stateswith judicial foreclosure and those without judicial foreclosure, separately by homeownership status. The sampleconsists of Chapter 13 bankruptcy filers originating from offices that randomly assigns filers to judges between 2002-2005 that are linked to credit report data in the year of filing. The post-filing mean for dismissed filers is reported inbrackets for each subgroup. We instrument for Chapter 13 protection using the leave-one-out mean rate of grantingChapter 13 bankruptcy protection for the assigned judge minus the leave-one-out mean rate of granting bankruptcyprotection for the office. Subgroup instruments are constructed using the matched estimation sample. All regressionscontrol for baseline age bins, homeownership, credit score, financial strain index, revolving balance, collection balance,mortgage balance, auto balance, indicators for mortgage and auto loans, revolving utilization, non-mortgage inquiries,office-by-filing-month fixed effects, and cluster standard errors at the office level. See the data appendix for detailson the data and variable construction. *** = significant at 1 percent level, ** = significant at 5 percent level, * =significant at 10 percent level.
42
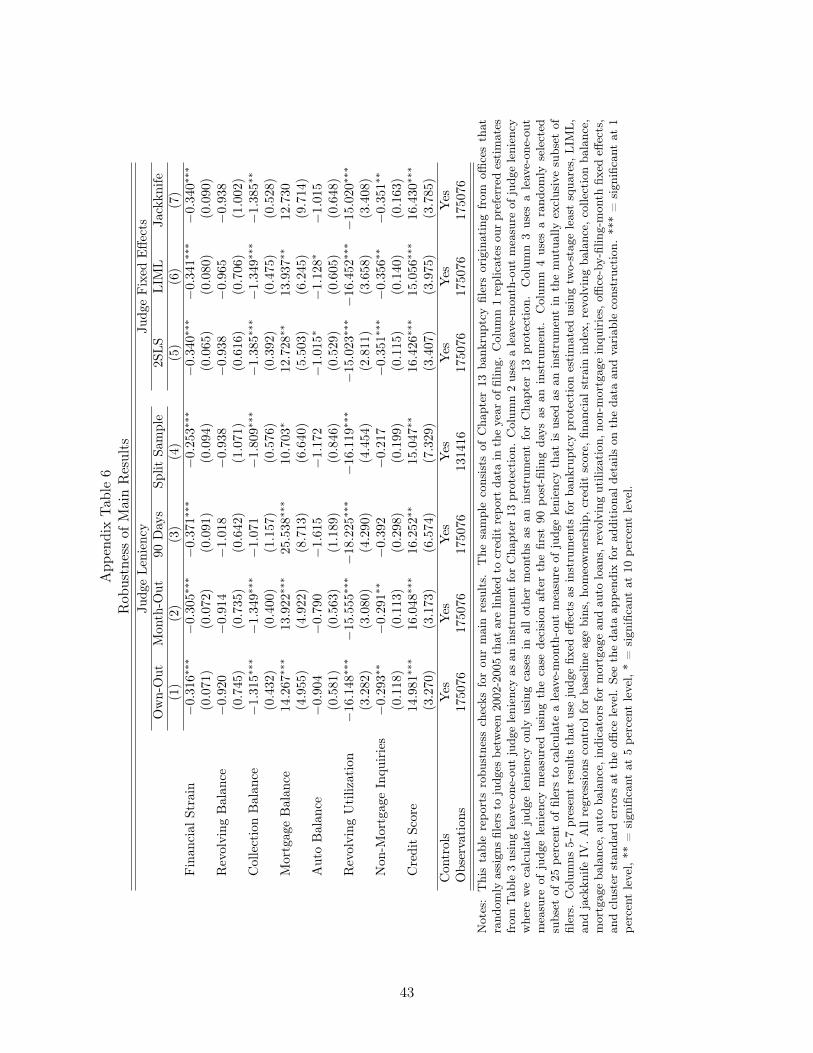
App
endixTab
le6
Rob
ustnessof
MainResults
Judg
eLe
niency
Judg
eFixed
Effe
cts
Own-Out
Mon
th-O
ut90
Days
Split
Sample
2SLS
LIML
Jackkn
ife(1)
(2)
(3)
(4)
(5)
(6)
(7)
Finan
cial
Strain
−0.316∗∗∗
−0.305∗∗∗
−0.371∗∗∗
−0.253∗∗∗
−0.340∗∗∗
−0.341∗∗∗
−0.340∗∗∗
(0.071)
(0.072)
(0.091)
(0.094)
(0.065)
(0.080)
(0.090)
Revolving
Balan
ce−0.920
−0.914
−1.018
−0.938
−0.938
−0.965
−0.938
(0.745)
(0.735)
(0.642)
(1.071)
(0.616)
(0.706)
(1.002)
CollectionBalan
ce−1.315∗∗∗
−1.349∗∗∗
−1.071
−1.809∗∗∗
−1.385∗∗∗
−1.349∗∗∗
−1.385∗∗
(0.432)
(0.400)
(1.157)
(0.576)
(0.392)
(0.475)
(0.528)
MortgageBalan
ce14.267∗∗∗
13.922∗∗∗
25.538∗∗∗
10.703∗
12.728∗∗
13.937∗∗
12.730
(4.955)
(4.922)
(8.713)
(6.640)
(5.503)
(6.245)
(9.714)
AutoBalan
ce−0.904
−0.790
−1.615
−1.172
−1.015∗
−1.128∗
−1.015
(0.581)
(0.563)
(1.189)
(0.846)
(0.529)
(0.605)
(0.648)
Revolving
Utilization
−16.148∗∗∗
−15.555∗∗∗
−18.225∗∗∗
−16.119∗∗∗
−15.023∗∗∗
−16.452∗∗∗
−15.020∗∗∗
(3.282)
(3.080)
(4.290)
(4.454)
(2.811)
(3.658)
(3.408)
Non
-MortgageInqu
iries
−0.293∗∗
−0.291∗∗
−0.392
−0.217
−0.351∗∗∗
−0.356∗∗
−0.351∗∗
(0.118)
(0.113)
(0.298)
(0.199)
(0.115)
(0.140)
(0.163)
CreditScore
14.981∗∗∗
16.048∗∗∗
16.252∗∗
15.047∗∗
16.426∗∗∗
15.056∗∗∗
16.430∗∗∗
(3.270)
(3.173)
(6.574)
(7.329)
(3.407)
(3.975)
(3.785)
Con
trols
Yes
Yes
Yes
Yes
Yes
Yes
Yes
Observation
s175076
175076
175076
131416
175076
175076
175076
Notes:Thistablerepo
rtsrobu
stne
sschecks
forou
rmainresults.
The
sampleconsists
ofCha
pter
13ba
nkruptcy
filersoriginatingfrom
officesthat
rand
omly
assign
sfilersto
judg
esbe
tween2002-2005that
arelin
kedto
cred
itrepo
rtda
tain
theyear
offiling.
Colum
n1replicates
ourpreferredestimates
from
Tab
le3usingleave-on
e-ou
tjudg
elenien
cyas
aninstrumentforCha
pter
13protection
.Colum
n2uses
aleave-mon
th-out
measure
ofjudg
elenien
cywhe
rewecalculatejudg
elenien
cyon
lyusingcasesin
allothe
rmon
thsas
aninstrumentforCha
pter
13protection
.Colum
n3uses
aleave-on
e-ou
tmeasure
ofjudg
elenien
cymeasuredusingthecase
decision
afterthefirst
90po
st-filin
gda
ysas
aninstrument.
Colum
n4uses
arand
omly
selected
subset
of25
percentof
filersto
calculatealeave-mon
th-out
measure
ofjudg
elenien
cythat
isused
asan
instrumentin
themutua
llyexclusivesubset
offilers.
Colum
ns5-7presentresultsthat
usejudg
efix
edeff
ects
asinstruments
forba
nkruptcy
protection
estimated
usingtw
o-stageleastsqua
res,
LIM
L,
andjackkn
ifeIV
.Allregression
scontrolforba
selin
eagebins,ho
meowne
rship,
cred
itscore,
finan
cial
strain
inde
x,revolvingba
lance,
colle
ctionba
lance,
mortgageba
lance,
auto
balance,
indicators
formortgagean
dau
toloan
s,revo
lvingutilization
,non
-mortgageinqu
iries,offi
ce-by-filing-mon
thfix
edeff
ects,
andclusterstan
dard
errors
attheoffi
celevel.Se
etheda
taap
pend
ixforad
dition
alde
tails
ontheda
taan
dvariab
leconstruction
.***=
sign
ificant
at1
percentlevel,**
=sign
ificant
at5pe
rcentlevel,*=
sign
ificant
at10
percentlevel.
43

Appendix Table 7Results in the Sixth to Eighth Post-Filing Years
DismissedMean 2SLS Results(1) (2) (3)
Financial Strain Index -0.416 −0.216∗∗∗ −0.127∗∗
(0.777) (0.055) (0.054)Revolving Balance 1.014 0.697∗ 0.094
(3.878) (0.360) (0.348)Collection Balance 4.666 −2.534∗∗∗ −1.931∗∗∗
(7.376) (0.563) (0.599)Have a Mortgage 0.184 0.259∗∗∗ 0.260∗∗∗
(0.371) (0.032) (0.028)Mortgage Balance 15.861 34.967∗∗∗ 36.780∗∗∗
(48.046) (11.495) (13.654)Have an Auto Loan 0.190 0.127∗∗∗ 0.126∗∗∗
(0.367) (0.041) (0.045)Auto Balance 3.518 0.641 0.486
(6.972) (0.655) (0.700)Revolving Utilization 34.362 −8.942 −8.601
(53.460) (8.636) (9.178)Non-Mortgage Inquiries 0.974 −0.107 −0.037
(1.375) (0.184) (0.196)Credit Score 576.720 45.603∗∗∗ 28.792∗∗∗
(57.229) (7.761) (6.609)Controls – No YesObservations 83792 151655 151655
Notes: This table reports two-stage least squares results of the impact of Chapter 13 bankruptcy protection on post-filing outcomes in the sixth through eighth post-filing years. The sample consists of Chapter 13 bankruptcy filersoriginating from offices that randomly assigns filers to judges between 2002-2005 that are linked to credit report datain the year of filing and at least one observation in the sixth through eighth post-filing years. Column 1 reports thepost-filing mean and standard deviation for dismissed filers. Columns 2-3 instrument for Chapter 13 protection usingthe leave-one-out mean rate of granting Chapter 13 bankruptcy protection for the assigned judge minus the leave-one-out mean rate of granting bankruptcy protection for the office. All regressions control for office-by-filing-month fixedeffects and cluster standard errors at the office level. Column 3 adds controls for baseline age bins, homeownership,credit score, financial strain index, revolving balance, collection balance, mortgage balance, auto balance, indicatorsfor mortgage and auto loans, revolving utilization, and non-mortgage inquiries as controls. See the data appendixfor details on the data and variable construction. *** = significant at 1 percent level, ** = significant at 5 percentlevel, * = significant at 10 percent level.
44

Appendix Figure 1Judge Leniency and Bankruptcy Protection
b = 0.889 (0.049)
.35
.4.4
5.5
.55
Dis
char
ge
-.1 -.05 0 .05 .1Judge Leniency
Notes: This figure plots Chapter 13 discharge vs. our leave-one-out measure of judge leniency. The sample consistsof all first-time Chapter 13 filers from 2002-2005 linked to credit report data, for whom we observe credit data inthe year of filing. Judge leniency is the leave-one-out mean rate of granting Chapter 13 bankruptcy protection forthe assigned judge minus the leave-one-out mean rate of granting bankruptcy protection for the office. To constructthe binned scatter plot, we first regress an indicator for discharge on office-by-filing-month fixed effects and calculateresiduals. We then take the mean residual in each judge-by-year bin, adding the mean discharge rate to each residualto aid in the interpretation of the plot. The solid line shows the best linear fit estimated on the underlying micro dataestimated using OLS. The coefficients show the estimated slope of the best-fit line including office-by-filing-monthfixed effects, with standard errors clustered at the office level reported in parentheses.
45

Appendix Figure 2Judge Leniency by Filer Characteristics
b = 0.702 (0.203)
-.1-.0
50
.05
.1O
ver 4
0 at
Filin
g
-.1 -.05 0 .05 .1Under 40 at Filing
b = 1.154 (0.159)
-.1-.0
50
.05
.1H
igh
Cre
dit S
core
-.1 -.05 0 .05 .1Low Credit Score
b = 0.808 (0.152)
-.1-.0
50
.05
.1H
omeo
wne
r
-.1 -.05 0 .05 .1Not Homeowner
b = 0.777 (0.054)
-.1-.0
50
.05
.1H
igh
Fina
ncia
l Stra
in
-.1 -.05 0 .05 .1Low Financial Strain
Notes: These figures show the correlation between judge leniency for different groups of filers. Age is determined atthe time of filing, and credit score and homeownership are determined in the full year prior to filing. The sampleconsists of all first-time filers between June 2002 and 2005 in the 39 offices that randomly assign filings to judges.Judge leniency is defined as the leave-one-out mean rate of granting bankruptcy protection for the assigned judgeminus the leave-one-out mean rate of granting bankruptcy protection for the office. We take the average leniencyfor each group over all available years of data. Subgroup instruments are constructed using the matched estimationsample. The solid line shows the best linear fit estimated using OLS relating each judge leniency measure.
46

Appendix Figure 3Trends by Filing Status
Delinquency Collections
.2.4
.6.8
1D
elin
quen
cy
-4 -3 -2 -1 0 1 2 3 4Year Relative to Bankruptcy Filing
Non-Filer DismissedDischarged
.1.2
.3.4
.5.6
Col
lect
ion
-4 -3 -2 -1 0 1 2 3 4Year Relative to Bankruptcy Filing
Non-Filer DismissedDischarged
Charge-off Bankruptcy
0.2
.4.6
Cha
rge-
off
-4 -3 -2 -1 0 1 2 3 4Year Relative to Bankruptcy Filing
Non-Filer DismissedDischarged
0.2
.4.6
.81
Bank
rupt
cy
-4 -3 -2 -1 0 1 2 3 4Year Relative to Bankruptcy Filing
Non-Filer DismissedDischarged
Foreclosure Judgment
0.0
5.1
.15
Fore
clos
ure
-4 -3 -2 -1 0 1 2 3 4Year Relative to Bankruptcy Filing
Non-Filer DismissedDischarged
0.0
2.0
4.0
6.0
8.1
Judg
men
t
-4 -3 -2 -1 0 1 2 3 4Year Relative to Bankruptcy Filing
Non-Filer DismissedDischarged
Notes: These figures show the coefficients on year relative to filing dummies interacted with filer status: non-filer,dismissed filer, and discharged filer. Raw data figures include no controls.
47
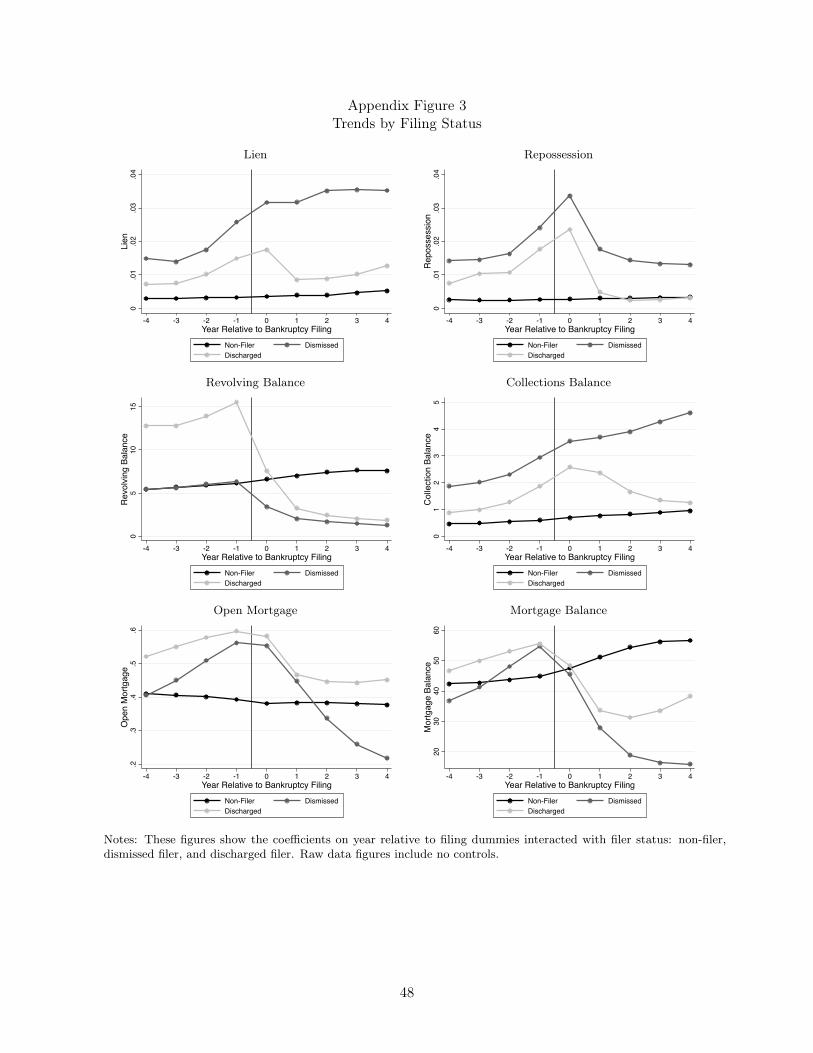
Appendix Figure 3Trends by Filing Status
Lien Repossession
0.0
1.0
2.0
3.0
4Li
en
-4 -3 -2 -1 0 1 2 3 4Year Relative to Bankruptcy Filing
Non-Filer DismissedDischarged
0.0
1.0
2.0
3.0
4R
epos
sess
ion
-4 -3 -2 -1 0 1 2 3 4Year Relative to Bankruptcy Filing
Non-Filer DismissedDischarged
Revolving Balance Collections Balance
05
1015
Rev
olvi
ng B
alan
ce
-4 -3 -2 -1 0 1 2 3 4Year Relative to Bankruptcy Filing
Non-Filer DismissedDischarged
01
23
45
Col
lect
ion
Bala
nce
-4 -3 -2 -1 0 1 2 3 4Year Relative to Bankruptcy Filing
Non-Filer DismissedDischarged
Open Mortgage Mortgage Balance
.2.3
.4.5
.6O
pen
Mor
tgag
e
-4 -3 -2 -1 0 1 2 3 4Year Relative to Bankruptcy Filing
Non-Filer DismissedDischarged
2030
4050
60M
ortg
age
Bala
nce
-4 -3 -2 -1 0 1 2 3 4Year Relative to Bankruptcy Filing
Non-Filer DismissedDischarged
Notes: These figures show the coefficients on year relative to filing dummies interacted with filer status: non-filer,dismissed filer, and discharged filer. Raw data figures include no controls.
48
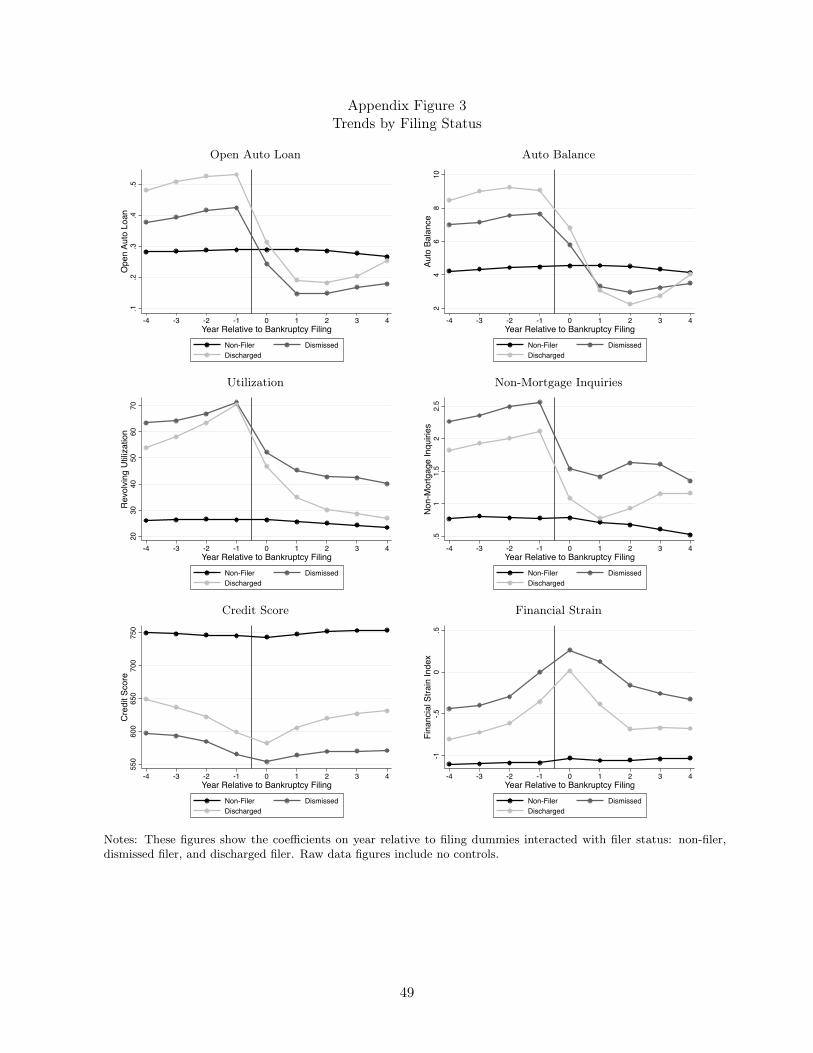
Appendix Figure 3Trends by Filing Status
Open Auto Loan Auto Balance
.1.2
.3.4
.5O
pen
Auto
Loa
n
-4 -3 -2 -1 0 1 2 3 4Year Relative to Bankruptcy Filing
Non-Filer DismissedDischarged
24
68
10Au
to B
alan
ce
-4 -3 -2 -1 0 1 2 3 4Year Relative to Bankruptcy Filing
Non-Filer DismissedDischarged
Utilization Non-Mortgage Inquiries
2030
4050
6070
Rev
olvi
ng U
tiliz
atio
n
-4 -3 -2 -1 0 1 2 3 4Year Relative to Bankruptcy Filing
Non-Filer DismissedDischarged
.51
1.5
22.
5N
on-M
ortg
age
Inqu
iries
-4 -3 -2 -1 0 1 2 3 4Year Relative to Bankruptcy Filing
Non-Filer DismissedDischarged
Credit Score Financial Strain
550
600
650
700
750
Cre
dit S
core
-4 -3 -2 -1 0 1 2 3 4Year Relative to Bankruptcy Filing
Non-Filer DismissedDischarged
-1-.5
0.5
Fina
ncia
l Stra
in In
dex
-4 -3 -2 -1 0 1 2 3 4Year Relative to Bankruptcy Filing
Non-Filer DismissedDischarged
Notes: These figures show the coefficients on year relative to filing dummies interacted with filer status: non-filer,dismissed filer, and discharged filer. Raw data figures include no controls.
49

VII. Data Dictionary
A. Judge Leniency
Judge Leniency - We calculate judge leniency as the leave-one-out mean rate of grantingChapter 13 bankruptcy protection for the assigned judge minus the leave-one-out mean rateof granting bankruptcy protection for the office.
B. Characteristics
Homeowner - Homeownership is based on a home flag calculated by TransUnion. The homeflag is set to “Y” if there is any home equity or mortgage trade on file. This measure may over-estimate actual homeownership because it does not require a non-zero balance on home equityor mortgage trades. Alternatively, this measure may underestimate actual homeownership ifTransUnion does not observe the original mortgage or equity trade.
C. Adverse Financial Events
Delinquency - We measure post-filing delinquencies based on the number of trades currently30+ days past due within the past 12 months, provided by TransUnion. Delinquency prob-abilities are non-cumulative, measured as the probability of at least one delinquency in theprior 12 months, averaged over the first five post-filing years.
Collection - We measure post-filing collections based on the number of collection trades inthe past 12 months, calculated by TransUnion. Collection account records consist of creditaccounts and records of unpaid bills that have been transferred to a collection agency or in theprocess of collection. Generally, accounts sent to collection are listed on a debtor’s credit reportfor seven years. Collection trades are trades either with KOB (Kind of Business) = Collection,MOP (Manner of Payment) = 9B (Collection), or remark/dispute flags such as “Collectionaccount cancelled by creditor,” “Placed for collection,” and “Collection account.” Collectionprobabilities are non-cumulative, measured as the probability of at least one collection in theprior 12 months, averaged over the first five post-filing years.
Charge-off - We measure post-filing charge-offs based on the number of charge-offs within thepast 12 months, calculated by TransUnion. A charge-off occurs when a creditor declares a debtunlikely to be paid. An account is usually charged off after 180 days of non-payment, but thecreditor can continue to attempt to collect on the debt. The charge-off record generally appearson a credit report for up to seven years. Charge-off information is obtained from trades withremark/dispute codes such as “Bad Debt: Collection Suit,” “Claim/PMT Against Guarantor,”“Early Termination w/Deficiency,” “Skip out of Account,” or MOP = 09 (Charged off to baddebt), or MOP = 9P (Paying or paid account with MOP 09). Charge-off probabilities arenon-cumulative, and can be thought of as the probability of at least one charge-off in the prior12 months, averaged over the second to fifth post-filing years.
Bankruptcy - We measure post-filing bankruptcies based on the number of bankruptcies withinthe past 12 months, calculated by TransUnion. Bankruptcies can occur under Chapter 7,Chapter 11, Chapter 12, or Chapter 13. Bankruptcy probabilities are non-cumulative, mea-sured as the probability of at least one bankruptcy in the prior 12 months, averaged over thesecond to fifth post-filing years.
50

Foreclosure - We measure post-filing foreclosures based on the number of foreclosures withinthe past 12 months, calculated by TransUnion. A foreclosure is a process in which a bankor mortgage company takes possession of a mortgaged property because the mortgagor hasfailed to keep up with mortgage payments. Foreclosure information is obtained from publicrecords, and trades with remark/dispute codes that signal foreclosure. In the TransUnion data,foreclosure is defined more expansively than an actual sale or deed transfer. Foreclosure rangesfrom an actual sale or transfer of the home, to merely a notice that foreclosure was commenced.For instance, the foreclosure flag is turned on for any of the following reasons: foreclosureinitiated, foreclosure started, foreclosure discontinued, and foreclosure redeemed. Post-filingforeclosure probabilities are non-cumulative, and can be thought of as the probability of atleast one foreclosure in the prior 12 months, averaged over the first five post-filing years.
Judgment - We measure post-filing judgments based on the number of civil judgment suitswithin the past 12 months, calculated by TransUnion. Judgment probabilities are non-cumulative, measured as the probability of at least one judgment in the prior 12 months,averaged over the first five post-filing years.
Lien - We measure post-filing liens based on the number of lien public records within the past12 months, calculated by TransUnion. A lien is an official claim against property or funds forpayment of a debt owed. Public record liens include federal and state tax liens, hospital liens,and judicial liens. Lien probabilities are non-cumulative, measured as the probability of atleast one lien in the prior 12 months, averaged over the first five post-filing years.
Repossession - We measure post-filing repossessions based on the number of repossessionswithin the past 12 months, calculated by TransUnion. A repossession occurs when a lendertakes back an asset, such as an automobile. Repossessions can be voluntary or involuntary.Late payments leading up to repossession are damaging to a debtor’s credit score, and themark of a repossession appears on credit reports. In the TransUnion data, repossession in-formation is obtained from trades with remark/dispute codes such as “Paid Respossession,”“Reposession,” “Repossession, redeemed,” “Paid by dealer,” “Paid from collateral,” or MOP(Manner of Payment) = 08 (Repossession). As with foreclosure, TransUnion defines reposses-sions expansively, including redeemed repossessions where the debtor makes full payment onthe loan and takes back the asset. Post-filing repossession probabilities are non-cumulative,and can be thought of as the probability of at least one repossession in the prior 12 months,averaged over the first five post-filing years.
Financial Strain Index - The index contains the non-cumulative probabilities of the followingeight components: delinquency, collection, charge-off, bankruptcy, foreclosure, judgment, lienand repossession, as defined above. Following Fryer and Katz (2013), for each post-filing year,each component is standardized using the mean and standard deviation for the dismissed filergroup in the baseline year. We sum across the eight components to create a yearly index,restandardizing using the mean and standard deviation of the dismissed filer group in thebaseline year. The index in the year of filing includes six components, excluding charge-offsand bankruptcies. We then average the yearly index across the first five post-filing years.Because each of the financial strains represent adverse events that negatively impact accessto credit, a higher index represents worse outcomes.
51

D. Unsecured Debt and Collections Activity
Revolving Balance - Total balance of revolving trades with current balance greater than zeroverified within 6 months calculated by TransUnion. Revolving trades include bank card ac-counts, retail accounts, and check credit accounts. Retail trade accounts include clothing,department stores, grocery, home furnishings, jewelry, computer, camera, and sporting goodsstores. According to Avery et al. (2003), revolving trade balances (dollar-weighted) represent11 percent of all open account balances.
Collection Balance - Aggregate current balance of all collections on file calculated by Tran-sUnion. There are two important shortcomings of the collections data. First, there is incom-plete coverage of unpaid bills, with larger entities, such as hospitals and utility companies,more likely to send debts to collection agencies. Second, collection records will not includedebts that parties collect themselves and debts sent to collection agencies that do not reportto credit bureaus.
E. Retaining Secured Assets
Have a Mortgage - We measure the probability of having an open mortgage based on thenumber of open mortgage trades verified in the past 12 months calculated by TransUnion.Mortgage trades are loans such as conventional real estate mortgages, FHA loans, real estateloans, second mortgages, and VA loans.
Mortgage Balance - Total balance of all mortgage trades verified in the past 12 months calcu-lated by TransUnion. According to Avery et al. (2003), mortgage balances (dollar-weighted)represent 67 percent of all open account balances.
Have an Auto Loan - We measure the probability of having an open auto loan based on thenumber of open auto loans verified in the past six months calculated by TransUnion. Autoloans typically involve fixed monthly payments that fully amortize the total amount borrowedover the term of the loan, often secured (Avery et al. 2003).
Auto Balance - Total balance of open auto trades verified in the past 12 months calculatedby TransUnion.
F. Credit Access
Revolving Utilization - Total outstanding revolving trade balance divided by revolving tradecredit limit verified in the past 12 months calculated by TransUnion, expressed in percentages.Because total credit limit is likely understates actual credit limits (Avery et al. 2003), thecredit utilization rate likely overstates actual credit utilization.
Non-Mortgage Inquiries - Number of non-mortgage inquiries within the past 6 months calcu-lated by TransUnion. Inquiries are made to ensure that an applicant for credit, apartmentrental, insurance, or employment meets minimum standards. When a creditor or lender checksa debtor’s credit in connection with an application, a “hard inquiry” is tagged on a credit re-port. A hard inquiry remains on a credit report for up to two years and may lower a debtor’scredit score. When a creditor reviews the credit report of an existing customer, or when adebtor checks his own credit, a “soft inquiry” typically shows up on your credit report. Softinquiries generally do not lower credit scores or appear to businesses checking a debtor’s credit.
52

G. Credit Score
Credit score - This measure is an ordinal credit score calculated by TransUnion to measurecredit risk. This measure is similar to the FICO score commonly referenced in the consumerfinance literature.
H. Data Characteristics
Matched to Credit Report - Indicator for whether the 253,863 bankruptcy filings sent to Tran-sUnion were matched to credit report data from the baseline filing year.
Missing Age - Indicator for whether age at filing is missing.
Missing Baseline Outcomes - Indicator for whether baseline credit report outcomes are missing.
I. Housing Transitions
Living in Same Residence - This measure is calculated based on the number of months atthe current address calculated by TransUnion. We define a consumer as being in the sameresidence five years after filing if the difference between the number of months at the currentaddress in year 5 and year 0 is at least 48 months.
Moved to Rental - We define this measure as individuals who have zero mortgage trades inyear 5, coupled with a move between years 0 and 5 (such that they are no longer in the sameresidence by year 5).
Moved to Home - We define this measure as individuals who have non-zero mortgage tradesin year 5, coupled with a move between years 0 and 5 (such that they are no longer in thesame residence by year 5).
53
Related Documents