Physicochemical and nutritional profile of commonly consumed edible oils in Addis Ababa; and their health implications. By: Kifle Habte January 14-16, 2016 National Food and Nutrition Research Dissemination Conference Desalegn hotel

Welcome message from author
This document is posted to help you gain knowledge. Please leave a comment to let me know what you think about it! Share it to your friends and learn new things together.
Transcript

Physicochemical and nutritional profile of commonly
consumed edible oils in Addis Ababa; and their health
implications.
By: Kifle HabteJanuary 14-16, 2016
National Food and Nutrition Research Dissemination Conference
Desalegn hotel

Outline
• Introduction
• Objectives of the study
• Study method
• Result and discussion
• Conclusion and recommendations

Introduction
Oils are naturally occurring esters of long straight-chain carboxylic
acids.
Industrial processing especially catalytic hydrogenation of
vegetable oils increases saturated fatty acids (SFA) composition.
SFA rich diets have been found to increase the level of cholesterol
in our body (Gurr and Harwood, 1991).
Diets high in animal fats and low in USF fats have been associated
with an increased risk of (CHD) and (CVD) in animal and human
studies.

Introduction cont’d…..
• However, effects of such case on clinical CHD events are
surprisingly poorly established in researches.
• Consumption of polyunsaturated fatty acids (PUFA) lowers the
total cholesterol to HDL-c (TC:HDL-c) ratio, perhaps the best
single lipid predictor of CHD risk.
• PUFA consumption also thought to improve insulin resistance
and reduce systemic inflammation.
• These effects on risk factors suggest that PUFA may be an
ideal replacement for SFA in the population (Mozaffarian, et
al, 2010).

Introduction cont’d…
• Several studies have shown that palm oil has a
hypercholesterolemic effect, because it is composed of a 50%
palmitic acid (C16:0), 40% oleic acid (C18:1), and 10%
linoleic acid (C18:2) (Fattore et al, 2014).
• These high source of SFAs in the human diet thought to have
great effect particularly when compared to polyunsaturated
fatty acids (PUFAs) (Bautista, et al, 2001).

Objectives of the study
To analyze physicochemical and nutritional profile of edible
oils commonly consumed in Addis Ababa and based on the
finding to make recommendations for :-
• Policy makers,
• Inspection and regulatory bodies and
• Oil processing factories/industries
For any measure need or necessary improvement.

Methodology
Sixteen (16) different types of edible oils are collected from main
shops and supermarkets, which are found in Addis Ababa in 2015.
In this study almost all types (varieties) of edible oils available in
Addis Ababa were included.
After sample collection, the analysis of physicochemical and
nutritional were done according to AOAC standard method of fat and

Method cont….
• In addition, using these result, an
approximately a four month animal trial is on
the way to conduct at EPHI, for quantitative
description of cardiovascular & hepatic risks
they may pose, if any.
Result and discussion
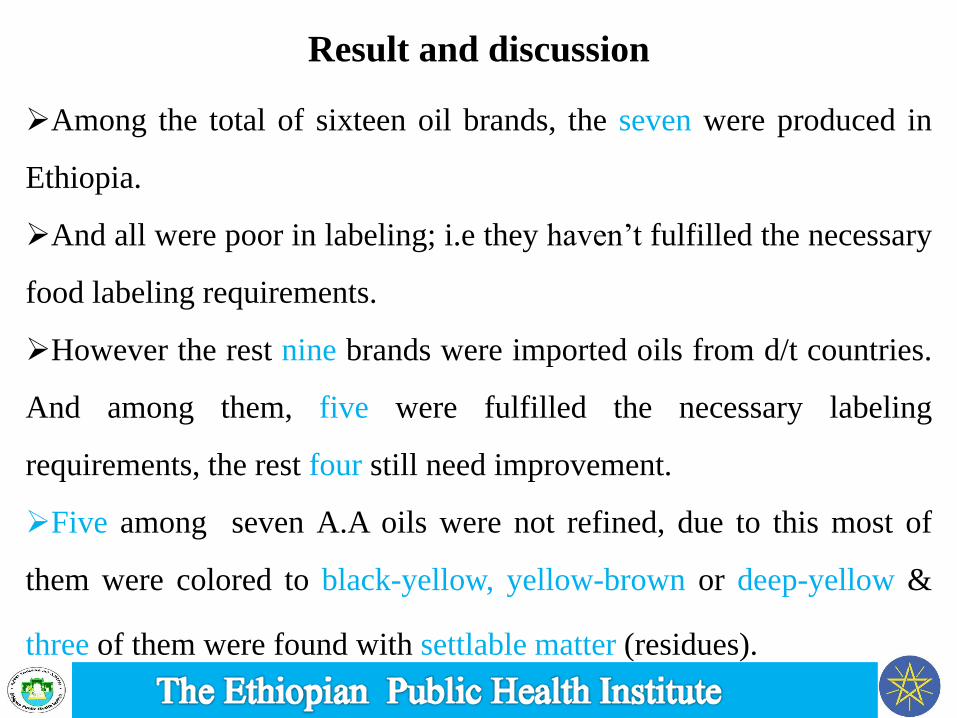
Among the total of sixteen oil brands, the seven were produced in
Ethiopia.
And all were poor in labeling; i.e they haven’t fulfilled the necessary
food labeling requirements.
However the rest nine brands were imported oils from d/t countries.
And among them, five were fulfilled the necessary labeling
requirements, the rest four still need improvement.
Five among seven A.A oils were not refined, due to this most of
them were colored to black-yellow, yellow-brown or deep-yellow &
three of them were found with settlable matter (residues).

Liquid
oils
Mean ± Sd 4.08 ± 2.13 1.25 ± 1.22 120.56 ± 18.77 1.4753 ± 0.00 0.92 ± 0.01
Median 3.61 0.655 123.77 1.476 0.9205
Solid
oils
Mean ± Sd 1.88 ± 1.42 0.53 ± 0.19 56.10 ± 5.44 1.4672 ± 0.00 0.91 ± 0.00
Median 1.29 0.45 56.41 1.467 0.91
Types of oil Peroxide
value (meq
O2/kg)
Acid value
(mgKOH/g)
Iodine value
(gI2/100g)
Ref. index at 40
°C
Sp. grav. at
20 °C
Table 1. Variation of liquid and solid oils in their Physicochemical parameters
Result cont’d....

0
1
2
3
4
5
6
7
8
9
Having
settlable
solid
Poor
labeling
Have deep
Color
Good
labeling
Oils with
high acid
value
Num
ber
of
oil
sam
ple
s (f
)Locally produced oils
Imported oils
Fig. 1 Some physicochemical parameters of imported & locally produced oils
Result cont’d....
As you can see from above figure, six of the seven locally produced oils were
higher in AV than the standard.
Types
of oil
Choleste
rol Fat
Vit
A Vit E SFAs MUFA PUFAs
Tra
FAs
Cis
FAs
ω3
FA
ω6
FA
ω9
FA EPA DHA
Liquid
oils
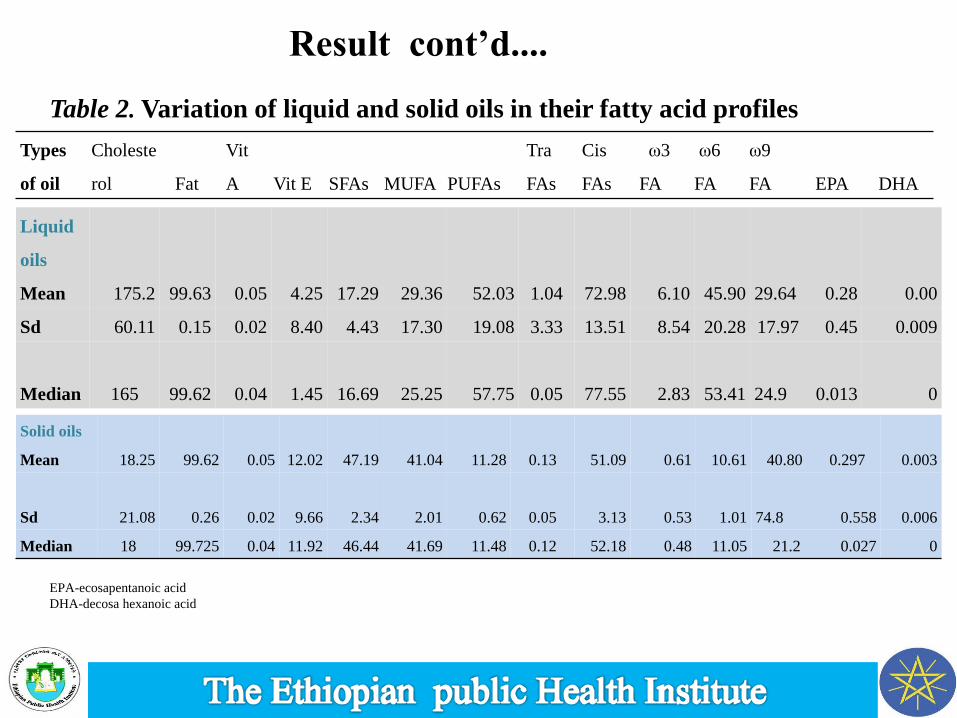
Mean 175.2 99.63 0.05 4.25 17.29 29.36 52.03 1.04 72.98 6.10 45.90 29.64 0.28 0.00
Sd 60.11 0.15 0.02 8.40 4.43 17.30 19.08 3.33 13.51 8.54 20.28 17.97 0.45 0.009
Median 165 99.62 0.04 1.45 16.69 25.25 57.75 0.05 77.55 2.83 53.41 24.9 0.013 0
Solid oils
Mean 18.25 99.62 0.05 12.02 47.19 41.04 11.28 0.13 51.09 0.61 10.61 40.80 0.297 0.003
Sd 21.08 0.26 0.02 9.66 2.34 2.01 0.62 0.05 3.13 0.53 1.01 74.8 0.558 0.006
Median 18 99.725 0.04 11.92 46.44 41.69 11.48 0.12 52.18 0.48 11.05 21.2 0.027 0
Table 2. Variation of liquid and solid oils in their fatty acid profiles
Result cont’d....
EPA-ecosapentanoic acid
DHA-decosa hexanoic acid

Result cont’d…..
• According to the chemical and nutritional analysis of the edible
oils:-
Being hydrogenated or solid was significantly associated
(p<0.0001) with the presence of high Trans and low Cis FAs,
and it was significantly associated (p<0.001) in the presence of
low peroxide value, iodine value, cholesterol level, PUFAs, omega
3 & omega 6 level and presence of sig. high SFA & MUFAs.
The acid values of locally produced (unrefined form) vegetable oils
were higher than the imported ones (refined form).
Why locally produced oils only??
Even though higher hydrolysis due to moisture, high T°, presence of
lipases enzyme & contaminating microorganisms can contribute for
the presence of higher acidity; but the most common one is being
not refined lead to remain higher in acidity than refined oils (Rajko
et al., 2010).

Result cont’d….
0
20
40
60
80
100
120
140
160
180175
17.3
29.4
52
0.045
73
6
46
29
con
stu
ten
tof
the
pro
du
ct
Analysed parameters
liquid, non hydrogenated
oils
Solid, hydrogenated oils
Fig. 2 Some chemical and nutritional mean value of liquid & solid oils

Result cont’d…..
• Estimates based on changes in plasma concentrations of LDL and HDL
indicate around a 4% reduction in CHD incidence based on
epidemiological associations;
• When TFA intake is lowered by 2% (5 g/day), the estimates indicate a
>20% reduction in CHD incidence (Katan, 2006; Moss, 2006).
• Thus many still feel that foods that contain more than 4 g/100 g SFAs
and TFAs together should not be claimed to be healthy food.
• According to Ethiopian national food consumption survey in 2013,
Addis Ababa had an edible oil consumption of 27.8 g/day.
• And when we referring to daily recommended intake of SFA per day is
2.8 g (7%) of the total energy (2000 calorie).
• The content of solid or hydrogenated analyzed palm oil showed that a
mean saturated fatty acid of 47.2g/100g of palm oil.
• And this is equivalent to consumption of 13.12 g/day of SFAs, which is
4.7 times higher than recommended by American heart association.
Conclusion and Recommendation
Locally produced edible oils might have high:-
PUFAs, ω3, ω6, Vit A contents and low SFAs & TFAs level. However they
need to pass through all necessary refining processes in the factory. For instance
PH adjustment (neutralizing) step; (high acidity is major cause of stomach
discomfort & burning feels).
Bleaching, refining and deodorizing need to remove impurities and hazardous
substances; so that to make safe for consumption.
Almost all edible oils manufactured in Ethiopia don’t fulfill basic labeling
requirements, so it seems there a need of work out from inspection bodies.
Compare to the liquid vegetable oils, palm oils have high trans, saturated,
mono unsaturated and omega 9 fatty acids with low omega 3, omega 6 and cis
fatty acids.
Due to this substituting liquid oils (high PUFAs) in the place of solid is
recommended for their many health benefits.
There should be a way of follow-up mechanism for edible oil
Manufacturers/processors to conform with the country’s edible oil standard.

Acknowledgement
The Ethiopian public health institute The Federal minister of health

Related Documents