CONSTRUCTION ACTIVITY IN EUROPE L’ACTIVITÉ DE LA CONSTRUCTION EN EUROPE DIE BAUTÄTIGKEIT IN EUROPA EDITION 2016 EUROPEAN CONSTRUCTION INDUSTRY FEDERATION

Welcome message from author
This document is posted to help you gain knowledge. Please leave a comment to let me know what you think about it! Share it to your friends and learn new things together.
Transcript

CONSTRUCTION ACTIVITY IN EUROPEL’ACTIVITÉ DE LA CONSTRUCTION EN EUROPEDIE BAUTÄTIGKEIT IN EUROPA
EDITION 2016
EUROPEAN CONSTRUCTIONINDUSTRY FEDERATION
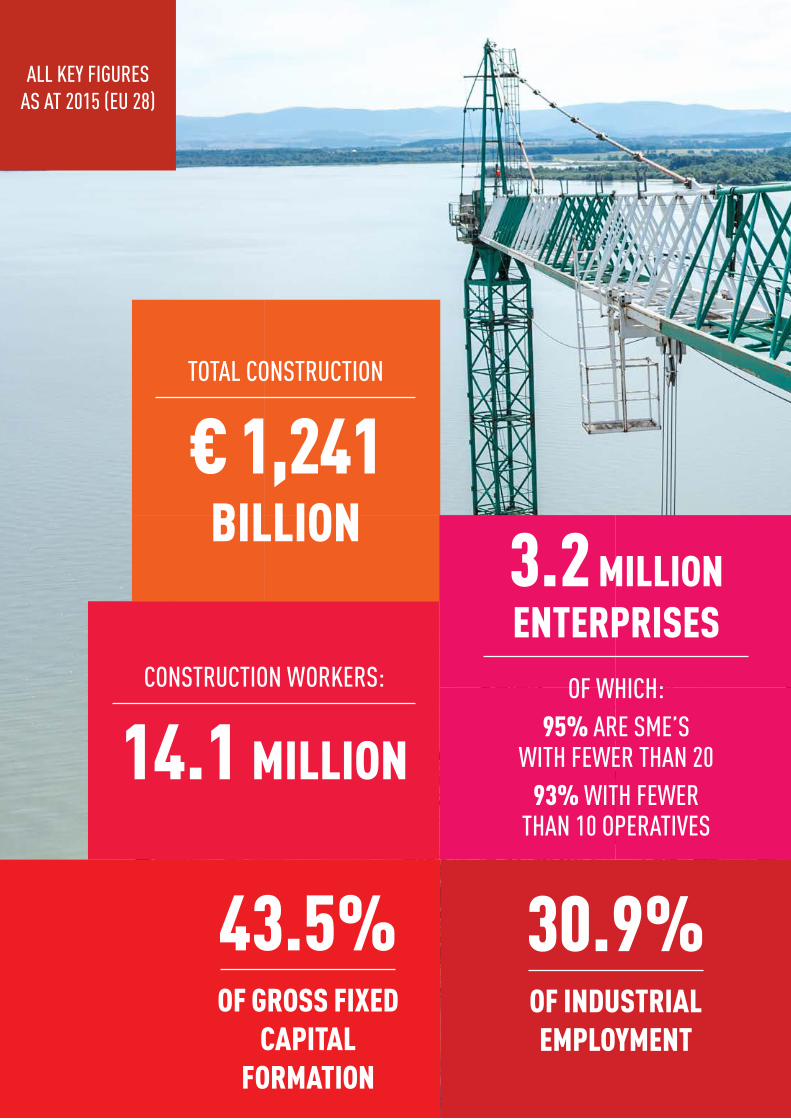
TOTAL CONSTRUCTION
€ 1,241BILLION
CONSTRUCTION WORKERS:
14.1 MILLION
3.2 MILLIONENTERPRISES
OF WHICH:95% ARE SME’S
WITH FEWER THAN 2093% WITH FEWER
THAN 10 OPERATIVES
30.9%OF INDUSTRIAL EMPLOYMENT
43.5%OF GROSS FIXED
CAPITAL FORMATION
ALL KEY FIGURES AS AT 2015 (EU 28)
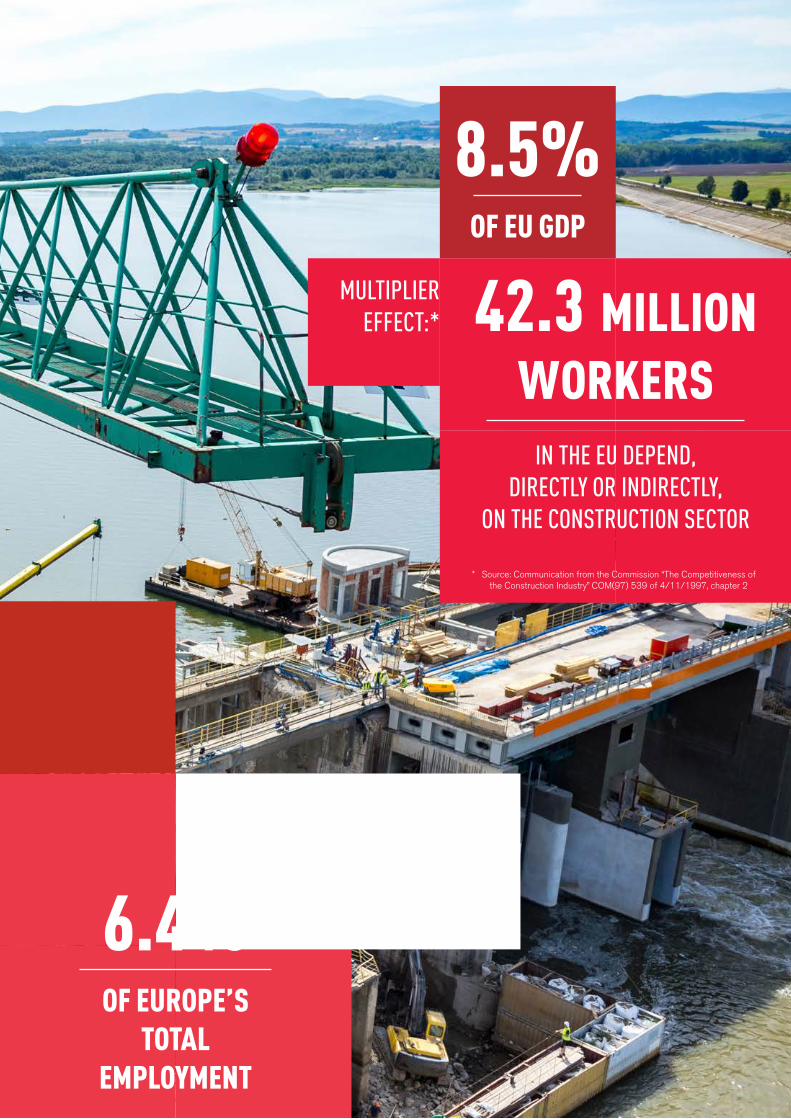
42.3 MILLIONWORKERS
IN THE EU DEPEND,
DIRECTLY OR INDIRECTLY, ON THE CONSTRUCTION SECTOR
6.4%OF EUROPE’S
TOTAL EMPLOYMENT
8.5%OF EU GDP
* Source: Communication from the Commission “The Competitiveness of the Construction Industry” COM(97) 539 of 4/11/1997, chapter 2
MULTIPLIER EFFECT:*
Created in 1905Legal personality under French law
26 countries (23 EU, Switzerland, Norway and Turkey)
29 National member federations representing firms:• of all sizes• of all building and civil engeneering specialties• practising all kind of working methods (whenever operationg as general contractors or as sub-contractors)
Associate members:EFFC European Federation of Foundation ContractorsEQAR European Quality Association for Recycling e.V.
Cooperation Agreement:
NFB National Federation of Builders (UK)
FIEC
Partnerships
Sectoral Social Dialogue
Social Partner in the European Sectoral Social Dialogue of the Construction Industry together with FETBB-EFBWW-EFBH (European Federation of Building and Woodworkers)http://ec.europa.eu/social/main.jsp?catId=480
EICCooperation with EIC (European International Contractors) for activities beyond Europe’s borderswww.eic-federation.eu
CICAThe European founding member of CICA (Confederation of International Contractors’ Associations)www.cica.net
ECFParticipant in the ECF (European Construction Forum)www.ecf.be
EHFMember of EHF (European Housing Forum)www.europeanhousingforum.eu
CENPartner Organisation of CEN (European Committee for Standardisation)www.cen.eu
ECCREDIMember of ECCREDI (European Council for Construction Research, Development and Innovation)www.eccredi.org
EENAssociate Member of the Enterprise Europe Network of the European Commissionhttp://een.ec.europa.eu/
WorldSkill EuropeAssociate Member of WorldSkills Europewww.euroskills.org
Campaigns & Portals
Renovate Europe Partner in the Renovate Europe Campaign www.renovate-europe.eu
Healthy Workplaces (OSHA)
Partner in the OSHA (European Agency for Health and Safety at Work) Campaign on “Healthy Worpkplaces for All Ages”www.healthy-workplaces.eu
BUILD UPPartner of BuiLD uP (The european Portal for energy efficiency in Buildings) www.buildup.eu
Projects
ProductInfoXPartner of Product InfoX www.productxchange.com/en/International/Partners/ProductinfoX/projectdescription/
Posting of workersFIEC-EFBWW website on “Posting of workers”www.posting-workers.eu
Construction for youth
FIEC-EFBWW website on “Construction for youth”www.construction-for-youth.eu
CO
NS
TRU
CTI
ON
AC
TIV
ITY
IN E
UR
OP
E -
ED
ITIO
N 2
016
04
CONTENTS
EU
AT
BE
BG
CY
CZ
DE
DK
EE
ES
FI
FR
GR
HU
IE
IT
LT
NL
PL
PT
RO
SE
SI
UK
CH
NO
TR
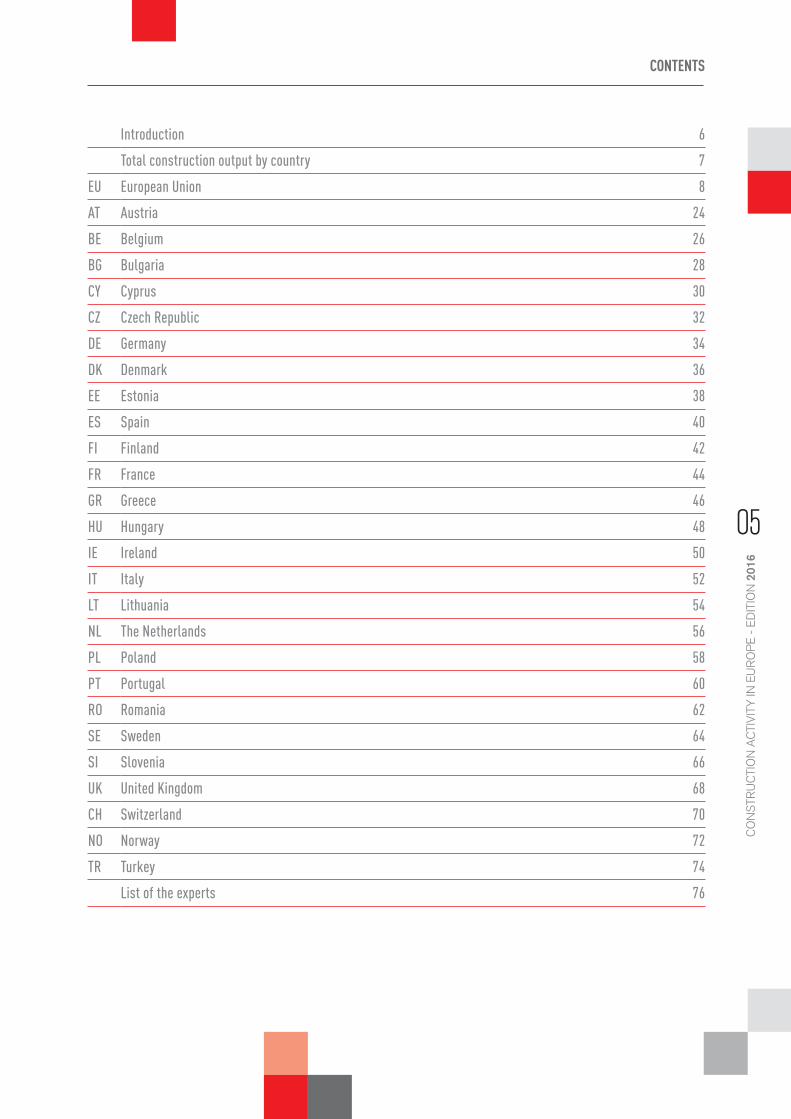
Introduction 6
Total construction output by country 7
European Union 8
Austria 24
Belgium 26
Bulgaria 28
Cyprus 30
Czech Republic 32
Germany 34
Denmark 36
Estonia 38
Spain 40
Finland 42
France 44
Greece 46
Hungary 48
Ireland 50
Italy 52
Lithuania 54
The Netherlands 56
Poland 58
Portugal 60
Romania 62
Sweden 64
Slovenia 66
United Kingdom 68
Switzerland 70
Norway 72
Turkey 74
List of the experts 76
CO
NS
TRU
CTI
ON
AC
TIV
ITY
IN E
UR
OP
E -
ED
ITIO
N 2
016
05

INTRODUCTION
It is a great pleasure for me to present this new edition (no. 59) of the annual FIEC Statistical Report.
The report provides an overview of recent developments and perspectives in the con-struction industry in the various EU Member States, as well as a series of indicators with figures both for each country and for the EU as a whole. The map shown opposite gives an overall view of the performance of construc-tion activity in the various European countries in 2015.
As regards the EU economy, 2015 was the first year since the beginning of the crisis in which all Member States reported an increase in their GDP, but substantial growth differenc-es persist between countries, reflecting both their structural features and their different cyclical positions. This was mainly supported by several positive factors such as the low oil prices, the Euro exchange rate and the very low interest rate and mortgage rates, which have stimulated exports and private consumption.
There are however some economic and polit-ical challenges for the EU, such as the devel-opment and the handling of the asylum-seek-ers issue and the outcome of the referendum in the United Kingdom, which are hindering a stronger recovery in the current year.
Within this framework as regards construc-tion activity the recovery observed in 2014 (+1.7%) continued and strengthened in 2015 (+2.4%). However, the above economic and political uncertainties within the EU and at international level will have an impact on the forecast for 2016 with construction activity expected to continue its recovery (+2.1%), but at a slower pace.
Despite the overall decline in the general gov-ernment deficit, several Member States still have to cope with the necessary budgetary consolidation measures which have been put in place and which continue to lead to some-times significant cuts in public investment.
FIEC never stopped reminding political deci-sion makers of the importance of investment, in particular the public one, as there cannot be any growth without investment and infrastructure. Significant support could still come from the Investment Plan for Europe (also known as the “Juncker Plan”), which is expected to mobilise investments of at least €315 billion over three years. It is therefore crucial to continue to mobilise our forces at all levels (EU, national, regional, local) , in or-der to ensure that projects which can benefit not only larger companies, but also SMEs, can be launched.
I would like to thank all the people in FIEC and from our Member Federations who have contributed to this report and I sincerely hope that its content will be useful and interesting for all readers.
Jean-Louis Marchand Chairman of the Economic and Legal Commission
C’est avec grand plaisir que je vous présente cette nouvelle édition (N° 59) du Rapport Statistique annuel de la FIEC.
Il dresse l’inventaire des récentes avancées et perspectives pour le secteur de la construction dans les différents États membres en Europe et fournit divers indicateurs chiffrés, tant pour chaque membre que pour l’Union Européenne dans son ensemble. Par ailleurs, la carte qui l’accompagne donne un aperçu global des performances de l’activité de construction dans les différents pays européens en 2015.
En ce qui concerne l’économie européenne, 2015 est la première année depuis le début de la crise au cours de laquelle l’intégralité des États membres a enregistré une augmentation du PIB. Néanmoins, il subsiste d’importants écarts de croissance entre les pays, qui témoignent de leurs caractéristiques structurelles et de leurs différents cycles. Différents facteurs positifs y ont contribué, comme la diminution du prix de l’essence, le cours de l’euro, ainsi que des taux d’intérêt et hypothé-caires très bas, qui ont stimulé les exportations et la consommation des ménages.
L’Union Européenne reste toutefois confrontée à certains défis, tant économiques que poli-tiques, telles que la gestion des demandeurs d’asile ou l’issue du referendum au Royaume-Uni, qui empêchent un redressement plus marqué au cours de l’actuel exercice.
Ainsi, en ce qui concerne l’activité de construc-tion, la reprise observée en 2014 (+1,7 %) a perduré et s’est même renforcée en 2015 (+2,4 %). Cependant, les incertitudes écono-miques et politiques susmentionnées au sein de l’UE et au niveau international auront une incidence sur les prévisions de 2016. En effet, l’activité de construction devrait poursuivre sa reprise (+2,1 %), mais à un rythme plus lent.
Malgré la diminution globale du déficit public, plusieurs États membres doivent encore faire face aux mesures de consolidation budgétaire requises qui ont été mises en place et qui sont à l’origine de coupes sombres dans l’investis-sement public.
La FIEC n’a eu de cesse de rappeler aux déci-deurs politiques l’importance de l’investissement, et plus particulièrement de l’investissement public, étant donné que l’investissement et l’in-frastructure sont des conditions essentielles à la croissance. Le Plan pour l’Europe (également appelé le « Plan Juncker ») pourrait encore jouer un rôle majeur, vu qu’il devrait mobiliser des investissements d’au moins 315 milliards d’euros au cours des trois prochaines années. Par conséquent, il est essentiel d’unir nos forces à tous les niveaux (européen, national, régional, local) pour veiller à mettre en place des projets qui seront à la fois bénéfiques aux plus grandes entreprises, et aux PME.
Je souhaiterais remercier toutes les personnes de la FIEC et de nos fédérations membres qui ont participé à ce rapport, et j’espère sincè-rement que tous ses lecteurs trouveront son contenu utile et intéressant.
Jean-Louis Marchand Président de la Commission économique et juridique
Gerne präsentiere ich Ihnen die aktuelle Aus-gabe (Nr. 59) des jährlichen Statistikberichts der FIEC.
Der Bericht enthält einen Überblick über die jüngsten Entwicklungen und Perspektiven der Bauwirtschaft in den einzelnen EU-Mitgliedstaaten sowie eine Reihe von Indikatoren mit Zahlen auf Länder- und EU-Ebene. Die Karte auf der gegen-überliegenden Seite bietet eine Gesamtübersicht zur Performance der Bauwirtschaft in den einzelnen europäischen Ländern im Jahr 2015.
Im Hinblick auf die EU-Konjunktur war 2015 das erste Jahr seit Beginn der Krise, in dem alle Mitgliedstaaten einen Anstieg ihres BIP vermelde-ten. Allerdings bestehen weiterhin starke Wachs-tumsunterschiede zwischen den Ländern, was ihre strukturellen Merkmale sowie die unterschiedlichen Konjunkturlagen in den einzelnen Staaten widerspie-gelt. Dies wurde vorwiegend durch mehrere positive Faktoren gestützt – z. B. die niedrigen Ölpreise, den Euro-Wechselkurs und die sehr niedrigen Zinsen und Hypothekenzinsen –, durch die Exporte und der private Konsum angekurbelt wurden.
Es gibt jedoch einige wirtschaftliche und politische Herausforderungen für die EU wie beispielsweise die weitere Entwicklung und Bewältigung der Migra-tions-Problematik und der Ausgang des bevorste-henden Referendums im Vereinigten Königreich, die eine stärkere Erholung im laufenden Jahr bremsen.
Vor diesem Hintergrund setzte sich in der Bauwirt-schaft die Erholung aus dem Jahr 2014 (+1,7 %) im Jahr 2015 verstärkt fort (+2,4 %). Die bereits erwähnten wirtschaftlichen und politischen Unwäg-barkeiten innerhalb der EU und auf internationaler Ebene wirken sich jedoch auf die Prognose für 2016 aus. Die Bautätigkeit bleibt demnach weiterhin im Aufschwung (+2,1 %), jedoch in langsamerem Tempo.
Trotz der insgesamt sinkenden Staatsdefizite haben mehrere Mitgliedstaaten noch immer mit den ergriffenen notwendigen Maßnahmen zur Haushaltskonsolidierung zu kämpfen, die weiterhin teils signifikante Einschnitte bei den öffentlichen Investitionen zur Folge haben.
Die FIEC weist die politischen Entscheidungsträger stets auf die Bedeutung von Investitionen hin, insbe-sondere Investitionen der öffentlichen Hand, ohne die es keine Infrastrukturen und kein Wachstum geben kann. Eine erkennbare Unterstützung dessen könnte sich aus der Investitionsoffensive für Europa (auch bekannt als „Juncker-Plan“) ergeben. Es wird erwartet, dass diese über drei Jahre hinweg min-destens 315 Mrd. Euro an Investitionen „freisetzen“ wird. Daher ist es wichtig, dass wir auch zukünftig auf allen Ebenen (EU, national, regional, lokal) unsere Kräfte mobilisieren, um sicherzustellen, dass Projekte aufgelegt werden können, die nicht nur den größeren, sondern auch kleinen und mittleren Unternehmen zugutekommen.
Ich möchte mich bei allen Mitarbeitern in der FIEC und aus unseren Mitgliedsverbänden bedanken, die zu diesem Bericht beigetragen haben und hoffe aufrichtig, dass die Inhalte für alle Leser aufschluss-reich und nützlich sein werden.
Jean-Louis Marchand Vorsitzender Wirtschafts- und Rechtsausschuss
CO
NS
TRU
CTI
ON
AC
TIV
ITY
IN E
UR
OP
E -
ED
ITIO
N 2
016
06

TOTAL CONSTRUCTION OUTPUT BY COUNTRY
NB:The text and data contained within the European report have been drawn up on the basis of the national reports supplied by the FIEC Member Federations.
EU2.4%
AT0.2%
BE1.3%
NL7.2%
LUNA
IE8.3%
BG-0.7%
RO10.0%
CH-2.8%
CYNA
TRNA
CZ-5.5%
PL5.9%
DE0.2%
DK1.7%
NO2.3%
SE10.0%
EE-7.5%
LT-5.2%
ES5.6%
UK8.5%
PT3.0%
FI-1.0%
FR-3.3%
HRNA
GR-15.1%
IT-1.3%
MTNA
SKNA
SI-7.3%
HUNA
NB:Le texte et les données du chapitre Union Européenne ont été élaborés sur la base des rapports nationaux envoyés par les fédérations membres de la FIEC.
NB:Der Text und die Zahlen des Kapitels „Europäische Union“ beruhen auf den von den FIEC-Mitgliedsverbänden zur Verfügung gestellten nationalen Berichten.
Variation of production in real terms on previous year (2015/2014)
Variation du volume de la production sur l’année précédente (2015/2014)
Reale Veränderungsrate im Vergleich zum Vorjahr (2015/2014)
Co-operation Agreement
CO
NS
TRU
CTI
ON
AC
TIV
ITY
IN E
UR
OP
E -
ED
ITIO
N 2
016
07
EUROPEAN UNION
1. General economic overview
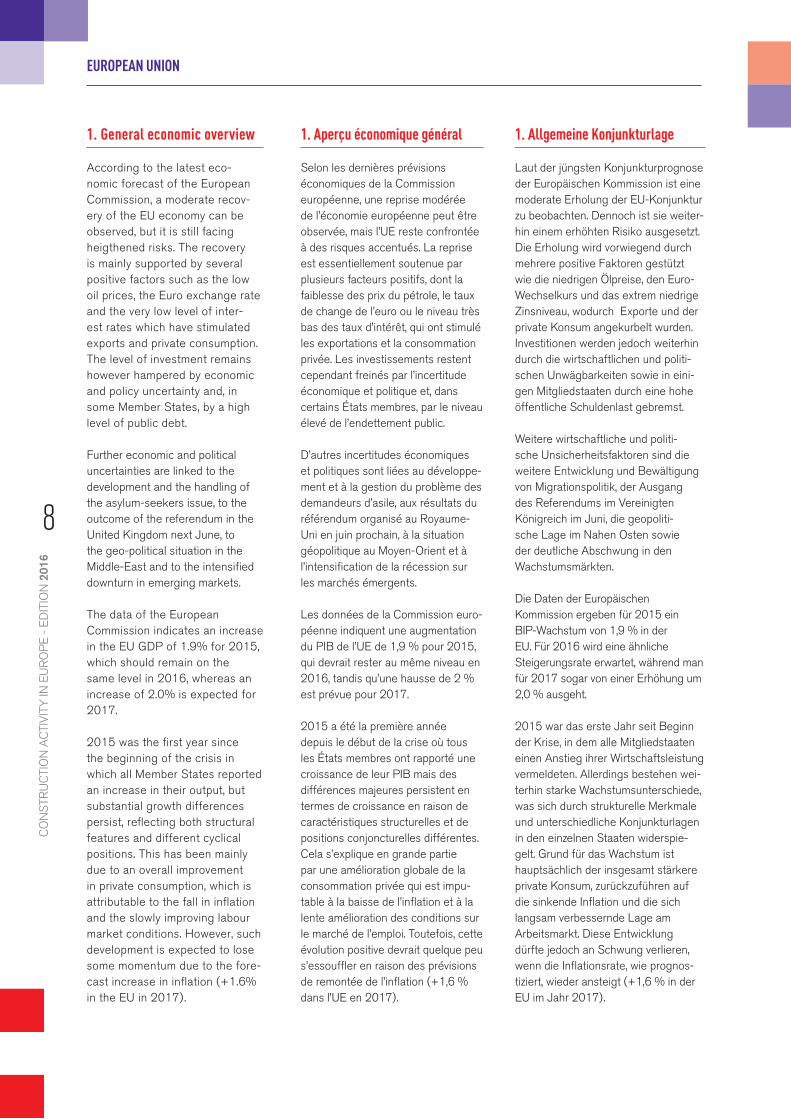
According to the latest eco-nomic forecast of the European Commission, a moderate recov-ery of the EU economy can be observed, but it is still facing heigthened risks. The recovery is mainly supported by several positive factors such as the low oil prices, the Euro exchange rate and the very low level of inter-est rates which have stimulated exports and private consumption. The level of investment remains however hampered by economic and policy uncertainty and, in some Member States, by a high level of public debt.
Further economic and political uncertainties are linked to the development and the handling of the asylum-seekers issue, to the outcome of the referendum in the United Kingdom next June, to the geo-political situation in the Middle-East and to the intensified downturn in emerging markets.
The data of the European Commission indicates an increase in the EU GDP of 1.9% for 2015, which should remain on the same level in 2016, whereas an increase of 2.0% is expected for 2017.
2015 was the first year since the beginning of the crisis in which all Member States reported an increase in their output, but substantial growth differences persist, reflecting both structural features and different cyclical positions. This has been mainly due to an overall improvement in private consumption, which is attributable to the fall in inflation and the slowly improving labour market conditions. However, such development is expected to lose some momentum due to the fore-cast increase in inflation (+1.6% in the EU in 2017).
1. Aperçu économique général
Selon les dernières prévisions économiques de la Commission européenne, une reprise modérée de l’économie européenne peut être observée, mais l’UE reste confrontée à des risques accentués. La reprise est essentiellement soutenue par plusieurs facteurs positifs, dont la faiblesse des prix du pétrole, le taux de change de l’euro ou le niveau très bas des taux d’intérêt, qui ont stimulé les exportations et la consommation privée. Les investissements restent cependant freinés par l’incertitude économique et politique et, dans certains États membres, par le niveau élevé de l’endettement public.
D’autres incertitudes économiques et politiques sont liées au développe-ment et à la gestion du problème des demandeurs d’asile, aux résultats du référendum organisé au Royaume-Uni en juin prochain, à la situation géopolitique au Moyen-Orient et à l’intensification de la récession sur les marchés émergents.
Les données de la Commission euro-péenne indiquent une augmentation du PIB de l’UE de 1,9 % pour 2015, qui devrait rester au même niveau en 2016, tandis qu’une hausse de 2 % est prévue pour 2017.
2015 a été la première année depuis le début de la crise où tous les États membres ont rapporté une croissance de leur PIB mais des différences majeures persistent en termes de croissance en raison de caractéristiques structurelles et de positions conjoncturelles différentes. Cela s’explique en grande partie par une amélioration globale de la consommation privée qui est impu-table à la baisse de l’inflation et à la lente amélioration des conditions sur le marché de l’emploi. Toutefois, cette évolution positive devrait quelque peu s’essouffler en raison des prévisions de remontée de l’inflation (+1,6 % dans l’UE en 2017).
1. Allgemeine Konjunkturlage
Laut der jüngsten Konjunkturprognose der Europäischen Kommission ist eine moderate Erholung der EU-Konjunktur zu beobachten. Dennoch ist sie weiter-hin einem erhöhten Risiko ausgesetzt. Die Erholung wird vorwiegend durch mehrere positive Faktoren gestützt wie die niedrigen Ölpreise, den Euro-Wechselkurs und das extrem niedrige Zinsniveau, wodurch Exporte und der private Konsum angekurbelt wurden. Investitionen werden jedoch weiterhin durch die wirtschaftlichen und politi-schen Unwägbarkeiten sowie in eini-gen Mitgliedstaaten durch eine hohe öffentliche Schuldenlast gebremst.
Weitere wirtschaftliche und politi-sche Unsicherheitsfaktoren sind die weitere Entwicklung und Bewältigung von Migrationspolitik, der Ausgang des Referendums im Vereinigten Königreich im Juni, die geopoliti-sche Lage im Nahen Osten sowie der deutliche Abschwung in den Wachstumsmärkten.
Die Daten der Europäischen Kommission ergeben für 2015 ein BIP-Wachstum von 1,9 % in der EU. Für 2016 wird eine ähnliche Steigerungsrate erwartet, während man für 2017 sogar von einer Erhöhung um 2,0 % ausgeht.
2015 war das erste Jahr seit Beginn der Krise, in dem alle Mitgliedstaaten einen Anstieg ihrer Wirtschaftsleistung vermeldeten. Allerdings bestehen wei-terhin starke Wachstumsunterschiede, was sich durch strukturelle Merkmale und unterschiedliche Konjunkturlagen in den einzelnen Staaten widerspie-gelt. Grund für das Wachstum ist hauptsächlich der insgesamt stärkere private Konsum, zurückzuführen auf die sinkende Inflation und die sich langsam verbessernde Lage am Arbeitsmarkt. Diese Entwicklung dürfte jedoch an Schwung verlieren, wenn die Inflationsrate, wie prognos-tiziert, wieder ansteigt (+1,6 % in der EU im Jahr 2017).
8
CO
NS
TRU
CTI
ON
AC
TIV
ITY
IN E
UR
OP
E -
ED
ITIO
N 2
016

EUROPEAN UNION
Sectors 2007 2008 2009 2010 2011 2012 2013 2014 2015a 2016b
1. Building 3.6 -0.9 -9.7 -0.5 2.6 -3.2 -1.6 2.4 2.1 2.3
1.1. Housebuilding 2.2 -3.7 -10.6 2.4 2.8 -2.4 -1.0 4.6 2.8 3.0
1.1.1. New -3.0 -10.5 -17.1 3.7 6.5 -4.9 -0.9 6.1 3.5 4.0
1.1.2. R&M 5.3 2.3 -3.3 1.6 1.7 0.4 -0.3 3.7 2.6 2.2
1.2. Non residential ** 5.6 2.4 -9.2 -5.7 1.6 -4.3 -2.3 1.1 -0.5 1.4
1.2.1. Private 6.3 2.4 -12.3 1.7 2.1 -3.0 -1.8 1.5 0.3 1.6
1.2.2. Public 2.8 2.8 1.4 -1.8 -0.7 -8.7 -3.5 3.5 -2.4 1.0
2. Civil Engineering 2.4 2.4 0.3 1.3 0.4 -5.8 -1.6 -0.8 6.2 1.8
(1 + 2) Total Construction * 3.5 -0.5 -8.1 -0.5 2.1 -3.6 -1.6 1.7 2.4 2.1
* without : CY, CZ, EE, HR, HU, IE, LU, LV, MT, PL, SK** incl. R&M
80
82
84
86
88
90
92
94
96
98
100
102
104
‘07
‘08
‘09
‘10
‘11
‘12
‘13
‘14
2015
a
2016
b
Housebuilding - Logement - Wohnungsgebau Non residential - Non résidentiel - Nichwohnbau Civil Engineering - Génie Civil - Tiefbau Total Construction - Bauwesen
2007 = 100
VARIATION OF PRODUCTION IN REAL TERMS ON PREVIOUS YEAR (%)
VARIATION DU VOLUME DE LA PRODUCTION SUR L’ANNÉE PRÉCÉDENTE (%)
REALE VERÄNDERUNGSRATE IM VERGLEICH ZUM VORJAHR (%)
INVESTMENT IN CONSTRUCTION INVESTISSEMENT DANS LA CONSTRUCTION INVESTITIONEN IN BAUWESEN
€ 14.605BILLION € 1.241 BILLION
GDP 2015 TOTAL CONSTRUCTIONOUTPUT 2015
9
CO
NS
TRU
CTI
ON
AC
TIV
ITY
IN E
UR
OP
E -
ED
ITIO
N 2
016
EUROPEAN UNION
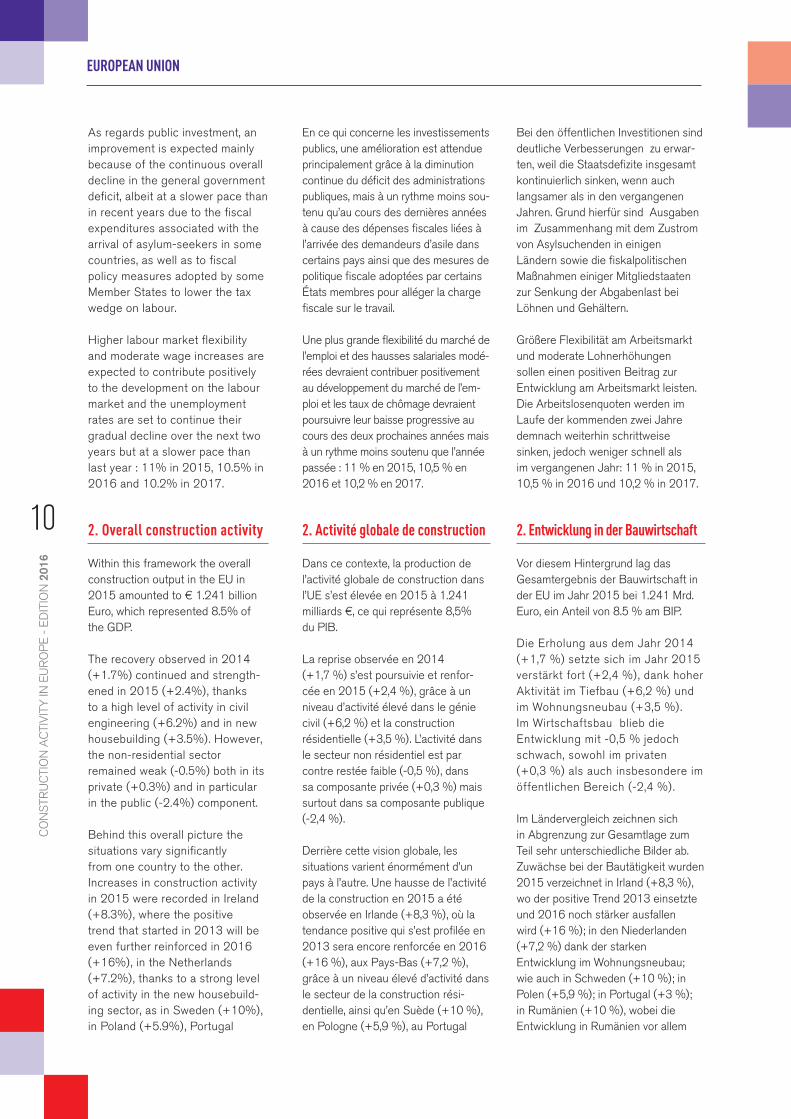
As regards public investment, an improvement is expected mainly because of the continuous overall decline in the general government deficit, albeit at a slower pace than in recent years due to the fiscal expenditures associated with the arrival of asylum-seekers in some countries, as well as to fiscal policy measures adopted by some Member States to lower the tax wedge on labour.
Higher labour market flexibility and moderate wage increases are expected to contribute positively to the development on the labour market and the unemployment rates are set to continue their gradual decline over the next two years but at a slower pace than last year : 11% in 2015, 10.5% in 2016 and 10.2% in 2017.
2. Overall construction activity
Within this framework the overall construction output in the EU in 2015 amounted to € 1.241 billion Euro, which represented 8.5% of the GDP.
The recovery observed in 2014 (+1.7%) continued and strength-ened in 2015 (+2.4%), thanks to a high level of activity in civil engineering (+6.2%) and in new housebuilding (+3.5%). However, the non-residential sector remained weak (-0.5%) both in its private (+0.3%) and in particular in the public (-2.4%) component.
Behind this overall picture the situations vary significantly from one country to the other. Increases in construction activity in 2015 were recorded in Ireland (+8.3%), where the positive trend that started in 2013 will be even further reinforced in 2016 (+16%), in the Netherlands (+7.2%), thanks to a strong level of activity in the new housebuild-ing sector, as in Sweden (+10%), in Poland (+5.9%), Portugal
En ce qui concerne les investissements publics, une amélioration est attendue principalement grâce à la diminution continue du déficit des administrations publiques, mais à un rythme moins sou-tenu qu’au cours des dernières années à cause des dépenses fiscales liées à l’arrivée des demandeurs d’asile dans certains pays ainsi que des mesures de politique fiscale adoptées par certains États membres pour alléger la charge fiscale sur le travail.
Une plus grande flexibilité du marché de l’emploi et des hausses salariales modé-rées devraient contribuer positivement au développement du marché de l’em-ploi et les taux de chômage devraient poursuivre leur baisse progressive au cours des deux prochaines années mais à un rythme moins soutenu que l’année passée : 11 % en 2015, 10,5 % en 2016 et 10,2 % en 2017.
2. Activité globale de construction
Dans ce contexte, la production de l’activité globale de construction dans l’UE s’est élevée en 2015 à 1.241 milliards €, ce qui représente 8,5% du PIB.
La reprise observée en 2014 (+1,7 %) s’est poursuivie et renfor-cée en 2015 (+2,4 %), grâce à un niveau d’activité élevé dans le génie civil (+6,2 %) et la construction résidentielle (+3,5 %). L’activité dans le secteur non résidentiel est par contre restée faible (-0,5 %), dans sa composante privée (+0,3 %) mais surtout dans sa composante publique (-2,4 %).
Derrière cette vision globale, les situations varient énormément d’un pays à l’autre. Une hausse de l’activité de la construction en 2015 a été observée en Irlande (+8,3 %), où la tendance positive qui s’est profilée en 2013 sera encore renforcée en 2016 (+16 %), aux Pays-Bas (+7,2 %), grâce à un niveau élevé d’activité dans le secteur de la construction rési-dentielle, ainsi qu’en Suède (+10 %), en Pologne (+5,9 %), au Portugal
Bei den öffentlichen Investitionen sind deutliche Verbesserungen zu erwar-ten, weil die Staatsdefizite insgesamt kontinuierlich sinken, wenn auch langsamer als in den vergangenen Jahren. Grund hierfür sind Ausgaben im Zusammenhang mit dem Zustrom von Asylsuchenden in einigen Ländern sowie die fiskalpolitischen Maßnahmen einiger Mitgliedstaaten zur Senkung der Abgabenlast bei Löhnen und Gehältern.
Größere Flexibilität am Arbeitsmarkt und moderate Lohnerhöhungen sollen einen positiven Beitrag zur Entwicklung am Arbeitsmarkt leisten. Die Arbeitslosenquoten werden im Laufe der kommenden zwei Jahre demnach weiterhin schrittweise sinken, jedoch weniger schnell als im vergangenen Jahr: 11 % in 2015, 10,5 % in 2016 und 10,2 % in 2017.
2. Entwicklung in der Bauwirtschaft
Vor diesem Hintergrund lag das Gesamtergebnis der Bauwirtschaft in der EU im Jahr 2015 bei 1.241 Mrd. Euro, ein Anteil von 8.5 % am BIP.
Die Erholung aus dem Jahr 2014 (+1,7 %) setzte sich im Jahr 2015 verstärkt fort (+2,4 %) , dank hoher Aktivität im Tiefbau (+6,2 %) und im Wohnungsneubau (+3,5 %) . Im Wirtschaftsbau blieb die Entwicklung mit -0,5 % jedoch schwach, sowohl im privaten (+0,3 %) als auch insbesondere im öffentlichen Bereich (-2,4 %) .
Im Ländervergleich zeichnen sich in Abgrenzung zur Gesamtlage zum Teil sehr unterschiedliche Bilder ab. Zuwächse bei der Bautätigkeit wurden 2015 verzeichnet in Irland (+8,3 %), wo der positive Trend 2013 einsetzte und 2016 noch stärker ausfallen wird (+16 %); in den Niederlanden (+7,2 %) dank der starken Entwicklung im Wohnungsneubau; wie auch in Schweden (+10 %); in Polen (+5,9 %); in Portugal (+3 %); in Rumänien (+10 %), wobei die Entwicklung in Rumänien vor allem
10
CO
NS
TRU
CTI
ON
AC
TIV
ITY
IN E
UR
OP
E -
ED
ITIO
N 2
016

EUROPEAN UNION
NB: The absolute value figures concerning the total volume of construction are given for guidance only and are provisional. The reason for this is that in the various countries these figures are not necessarily calculated on the same basis.
Country 2014(1) Constr. (2) Total economy (1)/(2)
United Kingdom 124.8 2,008 6.2%Germany 120.7 2,623 4.6%France 108.3 1,910 5.7%Italy 71.4 1,449 4.9%Spain 51.4 948 5.4%Poland 27.1 365 7.4%Netherlands 26.9 597 4.5%Sweden 23.0 381 6.0%Belgium 20.3 358 5.7%Austria 18.7 293 6.4%Finland 11.0 177 6.2%Romania 10.7 133 8.1%Denmark 10.3 225 4.6%Czech Republic 7.8 140 5.6%Portugal 6.8 152 4.5%Slovakia 5.7 69 8.3%Ireland 5.0 171 2.9%Greece 4.6 157 2.9%Hungary 3.8 88 4.3%Luxembourg 2.5 44 5.7%Lithuania 2.5 33 7.6%Croatia 1.8 36 5.0%Bulgaria 1.6 37 4.3%Latvia 1.4 21 6.7%Estonia 1.1 17 6.3%Slovenia 1.8 32 5.6%Cyprus 0.4 16 2.5%Malta 0.3 7 4.2%EU28 672 12,487 5.4%Switzerland 27.3 512 5.3%Norway 19.4 338 5.7%Turkey
Country 2015a(1) Constr. (2) GDP (1)/(2)
Germany 297 3,026 9.8%United Kingdom 163 2,577 6.3%France 160 2,160 7.4%Italy 129 1,636 7.9%Spain 101 1,081 9.3%Sweden 63 435 14.5%Netherlands 57 678 8.4%Poland 51 445 11.5%Belgium 42 410 10.2%Austria 33 338 9.8%Finland 29 206 14.1%Denmark 23 267 8.6%Czech Republic 17 162 10.5%Ireland 13 199 6.5%Portugal 11 179 6.1%Romania 9 155 5.8%Greece 8 176 4.5%Bulgaria 7 44 15.9%Hungary 7 109 6.4%Slovakia 6 78 7.7%Luxembourg 4 53 7.5%Lithuania 2 37 5.4%Croatia 2 44 4.5%Latvia 2 25 8.0%Estonia 2 20 10.0%Slovenia 2 39 5.1%Cyprus 1 17 2.9%Malta 1 9 5.6%EU28 1,241 14,605 8.5%Switzerland 58 582 10.0%Turkey 58 646 9.0%Norway 57 410 13.9%
GROSS VALUE ADDED - CONSTRUCTION / TOTAL ECONOMY
VALEUR AJOUTEE BRUTE - CONSTRUCTION / TOTAL ECONOMIE
BRUTTOWERTSCHÖPFUNG - BAUGEWERBE / GESAMTWIRTSCHAFT
CONSTRUCTION INVESTMENT/GDP INVESTISSEMENT CONSTRUCTION/PIB BAUINVESTITIONEN/BIP
Current prices in Bln. € %
Current prices in Bln. €
11
CO
NS
TRU
CTI
ON
AC
TIV
ITY
IN E
UR
OP
E -
ED
ITIO
N 2
016

EUROPEAN UNION
(+3%), Romania (+10%), the latter mainly supported by the civil engineering sector, and in Spain (+5.6%), the first increase since the beginning of the crisis in 2008. In the United Kingdom the sector also performed particularly well (+8.5%) driven by a remark-able increase in civil engineering (+34%).
In Austria (+0.2%) and Germany (+0.2%) the overall level of activ-ity remained more or less stable compared to the previous year, whilst several other countries recorded a negative trend. It is the case of Bulgaria (-0.7%), Estonia (-7.5%) and Greece (-15.1%), due to a decrease in civil engineering; Finland (-1%) and Italy (-1.3%), due to a drop in new housebuilding; France (-3.3%), due to a lack of public investment in particular in the non-residential sector; Lithuania (-5.2%) and Slovenia (-6.5%) where both new housebuilding and civil engineering declined.
The economic and political uncertainties within the EU and at the international level mentioned above are having an impact on the forecast for 2016 with a level of construction activity expected to continue its recovery (+2.1%), but at a slower pace. All the sub-sec-tors should show an increase, but with a strong slowdown for civil engineering (+1.8%) compared to 2015 (+6.2%). The main driver should remain the new house-building sector (+4.0) thanks to the low level of interest rates and of mortgage rates, as well as improvements expected on the labour market and rising real disposable income. However, the high levels of household debts in some Member States will continue to prevent a stronger increase in construction invest-ment in 2016.
(+3 %), en Roumanie (+10 %), où l’activité est principalement soutenue par le secteur du génie civil, et en Espagne (+5,6 %), qui connaît la première hausse depuis le début de la crise en 2008. Au Royaume-Uni, le secteur a aussi enregistré des résultats positifs (+8,5 %) soutenus par une remarquable progression du génie civil (+34 %).
En Autriche (+0,2 %) et en Allemagne (+0,2 %), le niveau d’activité global est resté plus ou moins stable par rapport à l’année précédente, tandis que plusieurs autres pays ont enregistré une évolution négative. C’est le cas de la Bulgarie (-0,7 %), de l’Estonie (-7,5 %) et de la Grèce (-15,1 %), en raison d’une baisse d’activité dans le génie civil ; de la Finlande (-1 %) et de l’Italie (-1,3 %), suite à un recul dans la construction résidentielle ; de la France (-3,3 %), à cause d’un manque d’inves-tissements publics, dans le secteur non résidentiel en particulier ; de la Lituanie (-5,2 %) et de la Slovénie (-6,5 %) où la construction résidentielle et le génie civil ont tous deux connu une baisse.
Les incertitudes économiques et politiques au sein de l’UE et à l’échelle internationale mentionnées plus haut ont eu un impact sur les prévisions pour 2016 qui indiquent que l’activité de la construction devrait poursuivre sa reprise (+2,1 %), mais à un rythme plus lent. Tous les sous-secteurs devraient enregistrer une progression, mais avec un fort ralentissement pour le génie civil (+1,8 %) par rapport à 2015 (+6,2 %). Le principal moteur de croissance devrait rester le secteur de la construction résidentielle (+4%) grâce au faible niveau des taux d’in-térêt et des taux hypothécaires ainsi qu’aux améliorations attendues sur le marché de l’emploi et à l’augmentation du revenu réel disponible. Toutefois, les niveaux d’endettement élevés des ménages dans certains États membres continueront à empêcher une augmen-tation plus forte des investissements en construction en 2016.
durch den Tiefbau getragen wurde; sowie in Spanien (+5,6 %), wo erstes Wachstum seit Beginn der Krise im Jahr 2008 verzeichnet wurde. Auch im Vereinigten Königreich entwickelte sich die Branche besonders gut (+8,5 %). Zurückzuführen war dies vor allem auf bemerkenswerte Zuwächse im Tiefbau (+34 %).
In Österreich (+0,2 %) und Deutschland (+0,2 %) stagnierte die Bautätigkeit insgesamt im Vergleich zum Vorjahr weitgehend, während mehrere andere Länder negative Entwicklungen verzeichne-ten. Dies war der Fall in Bulgarien (-0,7 %), Estland (-7,5 %) und Griechenland (-15,1 %), aufgrund eines Rückgangs im Tiefbau; in Finnland (-1 %) und Italien (-1,3 %), aufgrund von Rückgängen im Wohnungsneubau; in Frankreich (-3,3 %), aufgrund fehlender öffent-licher Investitionen vor allem im Wirtschaftsbau; in Litauen (-5,2 %) und Slowenien (-6,5 %), wo sich sowohl der Wohnungsneubau als auch der Tiefbau negativ entwickelten.
Die bereits erwähnten wirt-schaftlichen und politischen Unwägbarkeiten innerhalb der EU und auf internationaler Ebene wirken sich auf die Prognose für 2016 aus. Die Bautätigkeit bleibt demnach weiterhin im Aufschwung (+2,1 %), jedoch in langsame-rem Tempo. Alle Sektoren der Branche dürften zulegen, aller-dings mit einem stark gebremsten Wachstum im Tiefbau (+1,8 %) im Vergleich zu 2015 (+6,2 %). Der Wohnungsneubau (+4,0 %) dürfte weiterhin Hauptimpulsgeber sein, dank des niedrigen Zinsniveaus und niedriger Hypothekenzinsen sowie der erwarteten Verbesserungen am Arbeitsmarkt und des steigenden verfügbaren Realeinkommens. Die hohe Verschuldung der öffentlichen Haushalte in einigen Mitgliedstaaten wird jedoch 2016 einer stärkeren Ausweitung der Bauinvestitionen weiterhin im Wege stehen.
12
CO
NS
TRU
CTI
ON
AC
TIV
ITY
IN E
UR
OP
E -
ED
ITIO
N 2
016
EUROPEAN UNION
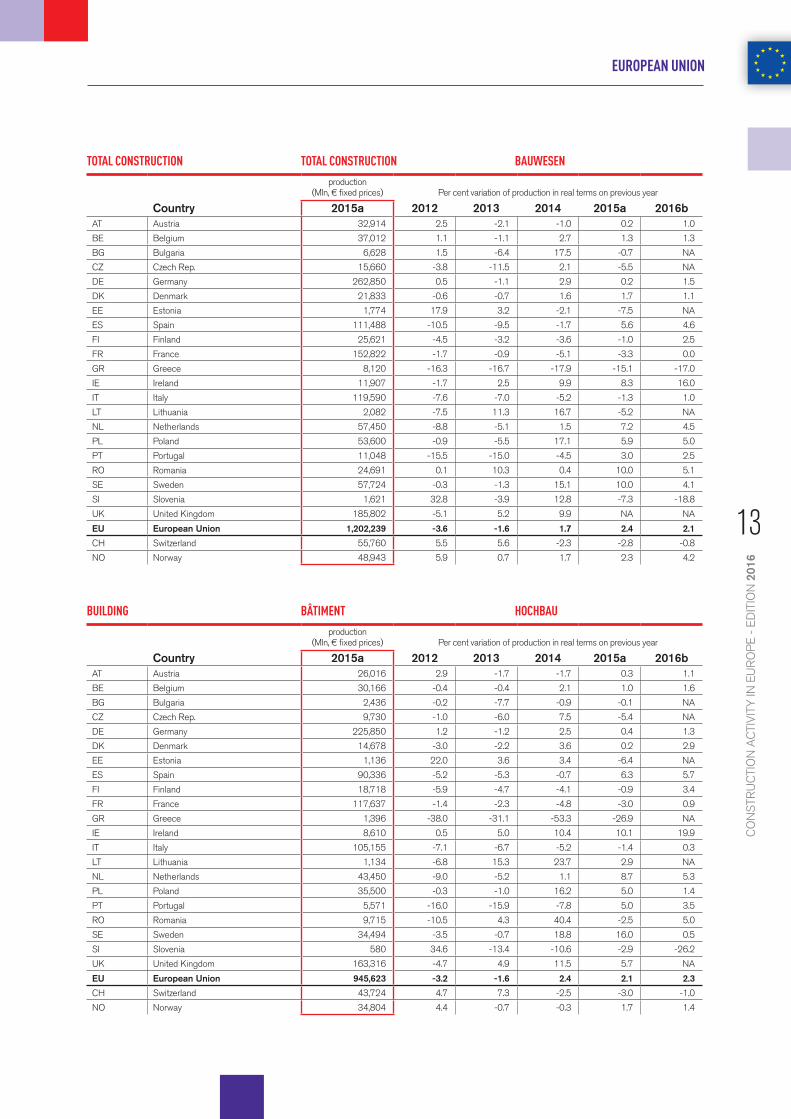
production (Mln, € fixed prices) Per cent variation of production in real terms on previous year
Country 2015a 2012 2013 2014 2015a 2016bAT Austria 32,914 2.5 -2.1 -1.0 0.2 1.0
BE Belgium 37,012 1.1 -1.1 2.7 1.3 1.3
BG Bulgaria 6,628 1.5 -6.4 17.5 -0.7 NA
CZ Czech Rep. 15,660 -3.8 -11.5 2.1 -5.5 NA
DE Germany 262,850 0.5 -1.1 2.9 0.2 1.5
DK Denmark 21,833 -0.6 -0.7 1.6 1.7 1.1
EE Estonia 1,774 17.9 3.2 -2.1 -7.5 NA
ES Spain 111,488 -10.5 -9.5 -1.7 5.6 4.6
FI Finland 25,621 -4.5 -3.2 -3.6 -1.0 2.5
FR France 152,822 -1.7 -0.9 -5.1 -3.3 0.0
GR Greece 8,120 -16.3 -16.7 -17.9 -15.1 -17.0
IE Ireland 11,907 -1.7 2.5 9.9 8.3 16.0
IT Italy 119,590 -7.6 -7.0 -5.2 -1.3 1.0
LT Lithuania 2,082 -7.5 11.3 16.7 -5.2 NA
NL Netherlands 57,450 -8.8 -5.1 1.5 7.2 4.5
PL Poland 53,600 -0.9 -5.5 17.1 5.9 5.0
PT Portugal 11,048 -15.5 -15.0 -4.5 3.0 2.5
RO Romania 24,691 0.1 10.3 0.4 10.0 5.1
SE Sweden 57,724 -0.3 -1.3 15.1 10.0 4.1
SI Slovenia 1,621 32.8 -3.9 12.8 -7.3 -18.8
UK United Kingdom 185,802 -5.1 5.2 9.9 NA NA
EU European Union 1,202,239 -3.6 -1.6 1.7 2.4 2.1
CH Switzerland 55,760 5.5 5.6 -2.3 -2.8 -0.8
NO Norway 48,943 5.9 0.7 1.7 2.3 4.2
production (Mln, € fixed prices) Per cent variation of production in real terms on previous year
Country 2015a 2012 2013 2014 2015a 2016bAT Austria 26,016 2.9 -1.7 -1.7 0.3 1.1
BE Belgium 30,166 -0.4 -0.4 2.1 1.0 1.6
BG Bulgaria 2,436 -0.2 -7.7 -0.9 -0.1 NA
CZ Czech Rep. 9,730 -1.0 -6.0 7.5 -5.4 NA
DE Germany 225,850 1.2 -1.2 2.5 0.4 1.3
DK Denmark 14,678 -3.0 -2.2 3.6 0.2 2.9
EE Estonia 1,136 22.0 3.6 3.4 -6.4 NA
ES Spain 90,336 -5.2 -5.3 -0.7 6.3 5.7
FI Finland 18,718 -5.9 -4.7 -4.1 -0.9 3.4
FR France 117,637 -1.4 -2.3 -4.8 -3.0 0.9
GR Greece 1,396 -38.0 -31.1 -53.3 -26.9 NA
IE Ireland 8,610 0.5 5.0 10.4 10.1 19.9
IT Italy 105,155 -7.1 -6.7 -5.2 -1.4 0.3
LT Lithuania 1,134 -6.8 15.3 23.7 2.9 NA
NL Netherlands 43,450 -9.0 -5.2 1.1 8.7 5.3
PL Poland 35,500 -0.3 -1.0 16.2 5.0 1.4
PT Portugal 5,571 -16.0 -15.9 -7.8 5.0 3.5
RO Romania 9,715 -10.5 4.3 40.4 -2.5 5.0
SE Sweden 34,494 -3.5 -0.7 18.8 16.0 0.5
SI Slovenia 580 34.6 -13.4 -10.6 -2.9 -26.2
UK United Kingdom 163,316 -4.7 4.9 11.5 5.7 NA
EU European Union 945,623 -3.2 -1.6 2.4 2.1 2.3
CH Switzerland 43,724 4.7 7.3 -2.5 -3.0 -1.0
NO Norway 34,804 4.4 -0.7 -0.3 1.7 1.4
TOTAL CONSTRUCTION TOTAL CONSTRUCTION BAUWESEN
BUILDING BÂTIMENT HOCHBAU
13
CO
NS
TRU
CTI
ON
AC
TIV
ITY
IN E
UR
OP
E -
ED
ITIO
N 2
016
EUROPEAN UNION
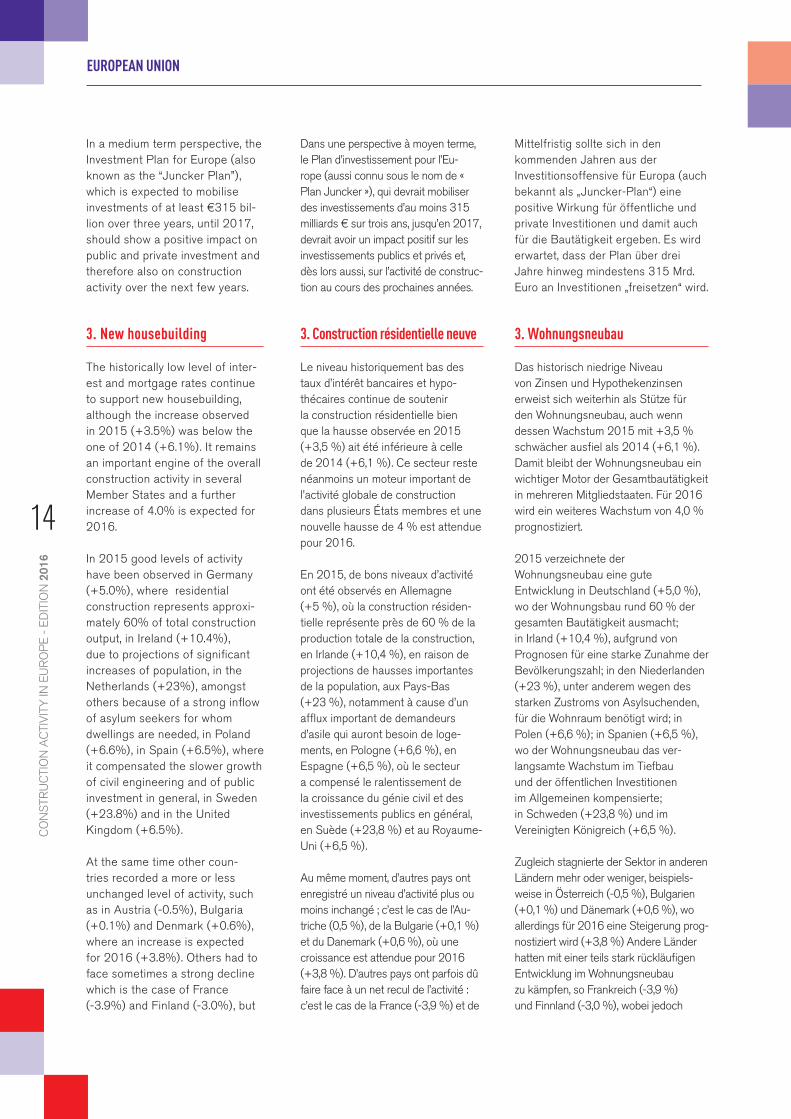
In a medium term perspective, the Investment Plan for Europe (also known as the “Juncker Plan”), which is expected to mobilise investments of at least €315 bil-lion over three years, until 2017, should show a positive impact on public and private investment and therefore also on construction activity over the next few years.
3. New housebuilding
The historically low level of inter-est and mortgage rates continue to support new housebuilding, although the increase observed in 2015 (+3.5%) was below the one of 2014 (+6.1%). It remains an important engine of the overall construction activity in several Member States and a further increase of 4.0% is expected for 2016.
In 2015 good levels of activity have been observed in Germany (+5.0%), where residential construction represents approxi-mately 60% of total construction output, in Ireland (+10.4%), due to projections of significant increases of population, in the Netherlands (+23%), amongst others because of a strong inflow of asylum seekers for whom dwellings are needed, in Poland (+6.6%), in Spain (+6.5%), where it compensated the slower growth of civil engineering and of public investment in general, in Sweden (+23.8%) and in the United Kingdom (+6.5%).
At the same time other coun-tries recorded a more or less unchanged level of activity, such as in Austria (-0.5%), Bulgaria (+0.1%) and Denmark (+0.6%), where an increase is expected for 2016 (+3.8%). Others had to face sometimes a strong decline which is the case of France (-3.9%) and Finland (-3.0%), but
Dans une perspective à moyen terme, le Plan d’investissement pour l’Eu-rope (aussi connu sous le nom de « Plan Juncker »), qui devrait mobiliser des investissements d’au moins 315 milliards € sur trois ans, jusqu’en 2017, devrait avoir un impact positif sur les investissements publics et privés et, dès lors aussi, sur l’activité de construc-tion au cours des prochaines années.
3. Construction résidentielle neuve
Le niveau historiquement bas des taux d’intérêt bancaires et hypo-thécaires continue de soutenir la construction résidentielle bien que la hausse observée en 2015 (+3,5 %) ait été inférieure à celle de 2014 (+6,1 %). Ce secteur reste néanmoins un moteur important de l’activité globale de construction dans plusieurs États membres et une nouvelle hausse de 4 % est attendue pour 2016.
En 2015, de bons niveaux d’activité ont été observés en Allemagne (+5 %), où la construction résiden-tielle représente près de 60 % de la production totale de la construction, en Irlande (+10,4 %), en raison de projections de hausses importantes de la population, aux Pays-Bas (+23 %), notamment à cause d’un afflux important de demandeurs d’asile qui auront besoin de loge-ments, en Pologne (+6,6 %), en Espagne (+6,5 %), où le secteur a compensé le ralentissement de la croissance du génie civil et des investissements publics en général, en Suède (+23,8 %) et au Royaume-Uni (+6,5 %).
Au même moment, d’autres pays ont enregistré un niveau d’activité plus ou moins inchangé ; c’est le cas de l’Au-triche (0,5 %), de la Bulgarie (+0,1 %) et du Danemark (+0,6 %), où une croissance est attendue pour 2016 (+3,8 %). D’autres pays ont parfois dû faire face à un net recul de l’activité : c’est le cas de la France (-3,9 %) et de
Mittelfristig sollte sich in den kommenden Jahren aus der Investitionsoffensive für Europa (auch bekannt als „Juncker-Plan“) eine positive Wirkung für öffentliche und private Investitionen und damit auch für die Bautätigkeit ergeben. Es wird erwartet, dass der Plan über drei Jahre hinweg mindestens 315 Mrd. Euro an Investitionen „freisetzen“ wird.
3. Wohnungsneubau
Das historisch niedrige Niveau von Zinsen und Hypothekenzinsen erweist sich weiterhin als Stütze für den Wohnungsneubau, auch wenn dessen Wachstum 2015 mit +3,5 % schwächer ausfiel als 2014 (+6,1 %). Damit bleibt der Wohnungsneubau ein wichtiger Motor der Gesamtbautätigkeit in mehreren Mitgliedstaaten. Für 2016 wird ein weiteres Wachstum von 4,0 % prognostiziert.
2015 verzeichnete der Wohnungsneubau eine gute Entwicklung in Deutschland (+5,0 %), wo der Wohnungsbau rund 60 % der gesamten Bautätigkeit ausmacht; in Irland (+10,4 %), aufgrund von Prognosen für eine starke Zunahme der Bevölkerungszahl; in den Niederlanden (+23 %), unter anderem wegen des starken Zustroms von Asylsuchenden, für die Wohnraum benötigt wird; in Polen (+6,6 %); in Spanien (+6,5 %), wo der Wohnungsneubau das ver-langsamte Wachstum im Tiefbau und der öffentlichen Investitionen im Allgemeinen kompensierte; in Schweden (+23,8 %) und im Vereinigten Königreich (+6,5 %).
Zugleich stagnierte der Sektor in anderen Ländern mehr oder weniger, beispiels-weise in Österreich (-0,5 %), Bulgarien (+0,1 %) und Dänemark (+0,6 %), wo allerdings für 2016 eine Steigerung prog-nostiziert wird (+3,8 %) Andere Länder hatten mit einer teils stark rückläufigen Entwicklung im Wohnungsneubau zu kämpfen, so Frankreich (-3,9 %) und Finnland (-3,0 %), wobei jedoch
14
CO
NS
TRU
CTI
ON
AC
TIV
ITY
IN E
UR
OP
E -
ED
ITIO
N 2
016

EUROPEAN UNION
production (Mln, € fixed prices) Per cent variation of production in real terms on previous year
Country 2015a 2012 2013 2014 2015a 2016bAT Austria 15,404 3.9 -1.5 -1.4 -0.2 1.0
BE Belgium 16,936 -3.7 -1.7 6.7 3.0 -1.6
BG Bulgaria 830 -16.5 -4.3 -0.4 1.5 NA
CZ Czech Rep. 2,500 1.0 -13.2 7.2 -15.5 NA
DE Germany 157,750 3.4 -0.7 3.3 1.5 2.0
DK Denmark 8,961 -5.1 -2.9 3.7 0.6 3.1
EE Estonia NA 17.7 11.5 24.1 NA NA
ES Spain 56,255 -6.2 -5.6 -1.1 7.6 6.7
FI Finland 10,864 -3.6 -3.3 -5.6 1.8 4.4
FR France 71,565 -2.0 -2.4 -5.9 -1.8 3.0
GR Greece NA NA NA NA NA NA
IE Ireland 5,612 -8.7 -0.9 12.7 10.4 19.9
IT Italy 63,110 -4.4 -3.7 -4.1 -1.4 -0.1
LT Lithuania 354 17.3 13.2 50.2 36.5 NA
NL Netherlands 23,250 -11.6 -7.3 0.6 15.2 6.5
PL Poland 11,600 16.3 0.0 3.7 4.5 4.3
PT Portugal 2,611 -20.0 -18.0 -10.0 5.0 4.0
RO Romania 4,733 -2.5 -13.2 63.4 -2.5 5.0
SE Sweden 17,981 -11.8 0.9 19.8 16.7 7.6
SI Slovenia 160 37.8 -9.7 -10.4 -10.7 -28.4
UK United Kingdom 65,368 -1.7 7.4 20.2 3.6 NA
EU European Union 535,845 -2.4 -1.0 4.6 2.8 3.0
CH Switzerland 26,298 3.7 6.6 -1.9 -4.0 -1.0
NO Norway 15,972 6.5 2.8 -4.4 1.8 2.7
production (Mln, € fixed prices) Per cent variation of production in real terms on previous year
Country 2015a 2012 2013 2014 2015a 2016bAT Austria 10,628 4.5 -1.7 -1.5 -0.5 1.0
BE Belgium 7,192 -3.3 -1.6 11.9 3.0 -7.5
BG Bulgaria 672 -18.7 -5.9 -2.5 0.1 NA
CZ Czech Rep. 1,890 48.9 -12.5 -18.0 -6.0 NA
DE Germany 50,000 5.1 4.9 8.4 5.0 5.0
DK Denmark 1,930 -19.1 -11.1 -2.2 0.6 3.8
EE Estonia NA 19.1 4.5 63.3 NA NA
ES Spain 33,970 -7.5 -7.0 -1.5 6.5 6.5
FI Finland 4,454 -9.6 -9.6 -11.6 -3.0 5.0
FR France 31,135 -3.4 -3.5 -11.5 -3.9 5.5
GR Greece NA NA NA NA NA NA
IE Ireland 2,430 -6.1 2.3 28.0 13.3 37.7
IT Italy 19,837 -11.1 -13.4 -13.9 -6.0 -3.5
LT Lithuania 161 -1.3 41.2 47.7 -16.7 NA
NL Netherlands 10,500 -16.8 -12.3 -4.5 23.2 13.3
PL Poland 8,100 17.2 -1.3 2.7 6.6 4.9
PT Portugal 1,671 -23.4 -23.3 -19.9 3.4 2.4
RO Romania 2,905 -5.2 -24.7 75.5 -2.5 5.0
SE Sweden 9,566 -21.1 10.4 33.7 23.8 12.8
SI Slovenia 80 9.8 -19.8 -12.5 -10.7 -30.0
UK United Kingdom 35,954 -4.9 10.8 32.1 6.5 NA
EU European Union 233,077 -4.9 -0.9 6.1 3.5 4.0
CH Switzerland 19,250 3.9 6.3 -1.8 -3.1 -1.5
NO Norway 10,613 7.2 4.1 -7.8 1.2 3.3
HOUSEBUILDING LOGEMENT WOHNUNGSBAU
NEW HOUSEBUILDING LOGEMENT NEUF WOHNUNGSNEUBAU
15
CO
NS
TRU
CTI
ON
AC
TIV
ITY
IN E
UR
OP
E -
ED
ITIO
N 2
016
EUROPEAN UNION
in both countries the perspectives for 2016 are good (+5.5% in France and +5.0%), as well as in Italy (-6.0%), where the num-ber of construction permits has been steadily declining over the last decade, Lithuania (-16.7%), Romania (-2.5%) and Slovenia (-9.9%), amongst others because of the absence of long-term state housebuilding policy.
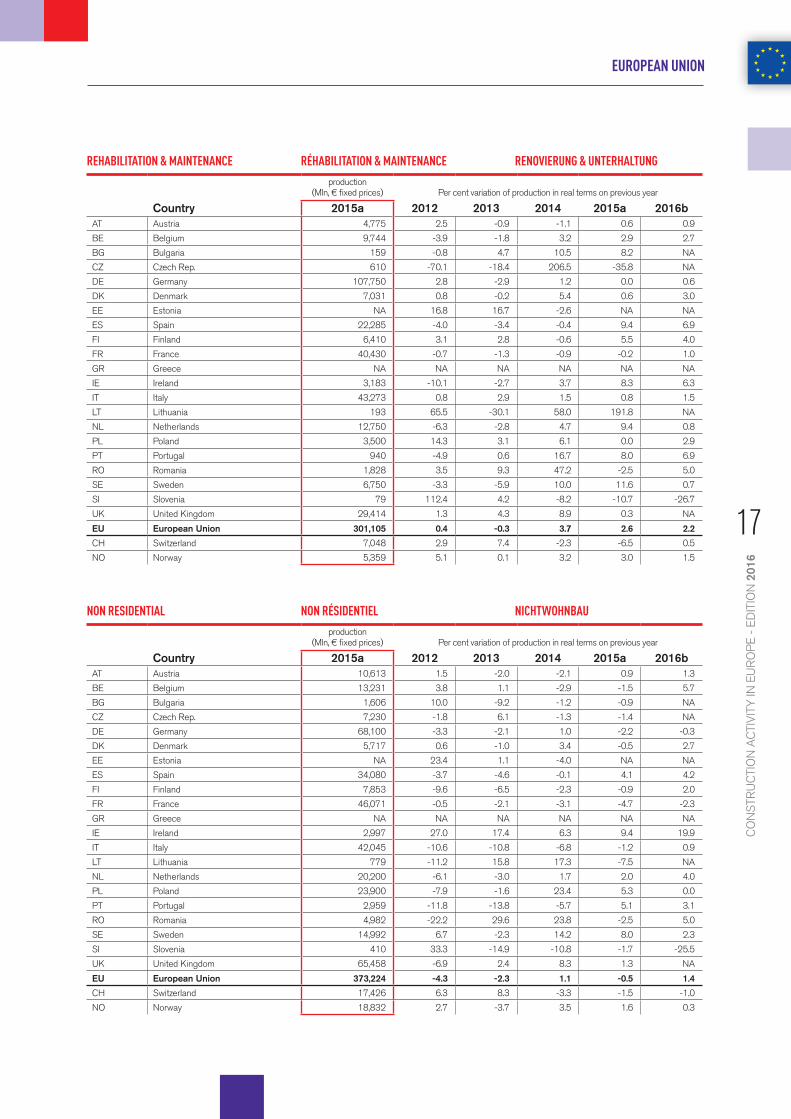
4. Rehabilitation and maintenance
Rehabilitation and maintenance activity maintained at a relatively stable development before and throughout the crisis, thereby playing an important cushioning effect for the entire construction sector. This trend is expected to continue in the near future. In 2015, R&M activities grew by 2.6%, reflecting growth in this segment in the majority of EU countries. A further increase of 2.2% is expected in 2016.
In 2015 this segment has developed positively in Belgium (+3.0%), Bulgaria (+8.2%), thanks to significant investments in energy efficiency works, Finland (+5.5%), thanks to public incentives, Germany (+5.0), Ireland (+8.3%), Netherlands (+9.4%), where it has been strongly supported by the low VAT rate for housing renovation which however will now expire and significantly slow down the activity in this segment in 2016 (+0.8), Portugal (+8.0%), Spain (+9.4%), supported by improving household income and confidence levels, and in Sweden (+11.6%), where the less favourable tax deduction scheme for renovation works that entered into force at the beginning of 2016 will slow down the growth (+0.7%).
In contrast, in 2015 R&M activi-ties declined in France and more sharply in Romania and Slovenia
la Finlande (-3 %), mais dans ces deux pays, les perspectives pour 2016 sont bonnes (+5,5 % en France et +5 %), ainsi que de l’Italie (-6 %), où le nombre de permis de bâtir n’a cessé de dimi-nuer au cours de la dernière décennie, la Lituanie (-16,7 %), la Roumanie (-2,5 %) et la Slovénie (-9,9 %), notam-ment à cause de l’absence de politique à long terme en matière de construc-tion résidentielle.
4. Réhabilitation et maintenance
L’activité de réhabilitation et de main-tenance a enregistré une évolution relativement stable avant et pendant la crise, jouant ainsi un rôle d’amortisseur important pour tout le secteur de la construction. Cette tendance devrait se poursuivre dans un avenir proche. En 2015, les activités de R&M ont augmenté de 2,6 %, ce qui reflète une progression de ce segment dans la majorité des pays de l’UE. Une aug-mentation supplémentaire de 2,2 % est prévue en 2016.
En 2015, ce segment a connu une évolution positive en Belgique (+3 %), en Bulgarie (+8,2 %), grâce à des investissements importants dans des travaux en matière d’efficacité énergé-tique, en Finlande (+5,5 %), grâce aux aides publiques, en Allemagne (+5), en Irlande (+8,3 %), aux Pays-Bas (+9,4 %), où l’activité a été fortement soutenue par le faible taux de TVA pour les rénovations de logements, lequel arrive toutefois à expiration et risque de ralentir considérablement l’activité dans ce segment en 2016 (+0,8 %), au Portugal (+8 %), en Espagne (+9,4 %), où l’activité est soutenue pour une amélioration des revenus des ménages et des niveaux de confiance, et en Suède (+11,6 %), où le système de déduction fiscale moins favorable pour les travaux de rénovation qui est entré en vigueur début 2016 devrait ralentir la croissance (+0,7 %).
Par contre, en 2015, les activités de R&M ont connu une baisse en France et une chute encore plus marquée en
die Aussichten für 2016 in beiden Ländern gut sind (+5,5 % in Frankreich und +5,0 % in Finnland); außerdem Italien (-6,0 %), wo die Zahl erteilter Baugenehmigungen im Laufe der vergangenen zehn Jahre kontinuier-lich gesunken ist; Litauen (-16,7 %), Rumänien (-2,5 %) und Slowenien (-9,9 %), unter anderem wegen einer fehlenden langfristig ausgerichteten staatlichen Wohnungsbaupolitik.
4. Modernisierung und Instandhaltung
Das Segment Modernisierung und Instandhaltung entwickelte sich vor und während der Krise relativ stabil und hatte damit eine erhebliche stützende Wirkung für die Bauwirtschaft insgesamt. Diese Entwicklung soll sich in naher Zukunft entsprechend fortsetzen. Im Jahr 2015 ist der Anteil des Modernisierungs- und Instandhaltungssegments um 2,6 % gestiegen, was ein Wachstum dieses Sektors in den meisten EU-Staaten widerspiegelt. Für 2016 wird ein zusätzli-ches Plus von 2,2 % erwartet.
2015 entwickelte sich das Segment positiv in Belgien (+3,0 %); Bulgarien (+8,2 %), dank umfassender Investitionen in Baumaßnahmen zur Förderung der Energieeffizienz; Finnland (+5,5 %), dank öffentli-cher Anreize; Deutschland (+5,0 %); Irland (+8,3 %); den Niederlanden (+9,4 %), wo der niedrige MwSt.-Satz für Renovierungsmaßnahmen im Bereich Wohnraum eine beflügelnde Wirkung zeigte (+0,8 %) (dieser läuft nun allerdings aus und dürfte das Wachstum in diesem Segment 2016 erheblich bremsen); Portugal (+8,0 %); Spanien (+9,4 %), getragen von stei-genden Einkommen und wachsendem Vertrauen der privaten Haushalte; und in Schweden (+11,6 %), wo allerdings die Anfang 2016 in Kraft getretene weniger günstige Steuerabzugsregelung für Renovierungsarbeiten das Wachstum künftig bremsen dürfte (+0,7 %).
Hingegen verzeichnete das Segment im Jahr 2015 Rückgänge in Frankreich sowie – in wesentlich schärferem
16
CO
NS
TRU
CTI
ON
AC
TIV
ITY
IN E
UR
OP
E -
ED
ITIO
N 2
016
EUROPEAN UNION
production (Mln, € fixed prices) Per cent variation of production in real terms on previous year
Country 2015a 2012 2013 2014 2015a 2016bAT Austria 4,775 2.5 -0.9 -1.1 0.6 0.9
BE Belgium 9,744 -3.9 -1.8 3.2 2.9 2.7
BG Bulgaria 159 -0.8 4.7 10.5 8.2 NA
CZ Czech Rep. 610 -70.1 -18.4 206.5 -35.8 NA
DE Germany 107,750 2.8 -2.9 1.2 0.0 0.6
DK Denmark 7,031 0.8 -0.2 5.4 0.6 3.0
EE Estonia NA 16.8 16.7 -2.6 NA NA
ES Spain 22,285 -4.0 -3.4 -0.4 9.4 6.9
FI Finland 6,410 3.1 2.8 -0.6 5.5 4.0
FR France 40,430 -0.7 -1.3 -0.9 -0.2 1.0
GR Greece NA NA NA NA NA NA
IE Ireland 3,183 -10.1 -2.7 3.7 8.3 6.3
IT Italy 43,273 0.8 2.9 1.5 0.8 1.5
LT Lithuania 193 65.5 -30.1 58.0 191.8 NA
NL Netherlands 12,750 -6.3 -2.8 4.7 9.4 0.8
PL Poland 3,500 14.3 3.1 6.1 0.0 2.9
PT Portugal 940 -4.9 0.6 16.7 8.0 6.9
RO Romania 1,828 3.5 9.3 47.2 -2.5 5.0
SE Sweden 6,750 -3.3 -5.9 10.0 11.6 0.7
SI Slovenia 79 112.4 4.2 -8.2 -10.7 -26.7
UK United Kingdom 29,414 1.3 4.3 8.9 0.3 NA
EU European Union 301,105 0.4 -0.3 3.7 2.6 2.2
CH Switzerland 7,048 2.9 7.4 -2.3 -6.5 0.5
NO Norway 5,359 5.1 0.1 3.2 3.0 1.5
production (Mln, € fixed prices) Per cent variation of production in real terms on previous year
Country 2015a 2012 2013 2014 2015a 2016bAT Austria 10,613 1.5 -2.0 -2.1 0.9 1.3
BE Belgium 13,231 3.8 1.1 -2.9 -1.5 5.7
BG Bulgaria 1,606 10.0 -9.2 -1.2 -0.9 NA
CZ Czech Rep. 7,230 -1.8 6.1 -1.3 -1.4 NA
DE Germany 68,100 -3.3 -2.1 1.0 -2.2 -0.3
DK Denmark 5,717 0.6 -1.0 3.4 -0.5 2.7
EE Estonia NA 23.4 1.1 -4.0 NA NA
ES Spain 34,080 -3.7 -4.6 -0.1 4.1 4.2
FI Finland 7,853 -9.6 -6.5 -2.3 -0.9 2.0
FR France 46,071 -0.5 -2.1 -3.1 -4.7 -2.3
GR Greece NA NA NA NA NA NA
IE Ireland 2,997 27.0 17.4 6.3 9.4 19.9
IT Italy 42,045 -10.6 -10.8 -6.8 -1.2 0.9
LT Lithuania 779 -11.2 15.8 17.3 -7.5 NA
NL Netherlands 20,200 -6.1 -3.0 1.7 2.0 4.0
PL Poland 23,900 -7.9 -1.6 23.4 5.3 0.0
PT Portugal 2,959 -11.8 -13.8 -5.7 5.1 3.1
RO Romania 4,982 -22.2 29.6 23.8 -2.5 5.0
SE Sweden 14,992 6.7 -2.3 14.2 8.0 2.3
SI Slovenia 410 33.3 -14.9 -10.8 -1.7 -25.5
UK United Kingdom 65,458 -6.9 2.4 8.3 1.3 NA
EU European Union 373,224 -4.3 -2.3 1.1 -0.5 1.4
CH Switzerland 17,426 6.3 8.3 -3.3 -1.5 -1.0
NO Norway 18,832 2.7 -3.7 3.5 1.6 0.3
REHABILITATION & MAINTENANCE RÉHABILITATION & MAINTENANCE RENOVIERUNG & UNTERHALTUNG
NON RESIDENTIAL NON RÉSIDENTIEL NICHTWOHNBAU
17
CO
NS
TRU
CTI
ON
AC
TIV
ITY
IN E
UR
OP
E -
ED
ITIO
N 2
016

EUROPEAN UNION
(respectively -0.2%, -2.5% and -9.9%). In France such devel-opment occurred despite a new tax credit for energy renovation and an attractive VAT reduced rate (5.5%) for renovation works, but can be explained by the low energy prices.
5. Non-residential buildings
Contrary to all the other sub-sec-tors, the non-residential sector was the only one to show a nega-tive trend in 2015 (-0.5%), mainly because of the decrease of its public component (-2.4%), due to the low level of public investment in several Member States. The overall situation is expected to improve slightly in 2016 (+1.4%) despite the fact that investors remain hesitant with regards to external risks (oil price decline, economic development in China and in other emerging econo-mies, ongoing turbulence in the Euro-zone).
The situation is however quite contrasted amongst the various EU countries.
In 2015 the sector performed well in Ireland (+9.4%), Portugal (+5.1%), Spain (+4.1%) and in Sweden (+8.0%), pulled by the pri-vate component, which in the case of Sweden reached a double-digit growth of 10.9%, mainly thanks to increasing investment in the industrial sector.
In several other Member States a sometimes significant decline was recorded in the public segment. It is the case of France (-6.5%), Germany (-2.7%), Lithuania (-20.3%) and the United Kingdom (-4.3%),
Roumanie et en Slovénie (respecti-vement -0,2 %, -2,5 % et -9,9 %). En France, cette évolution s’est produite malgré un nouveau crédit d’impôt pour la rénovation énergétique et un taux de TVA réduit attractif (5,5 %) pour les travaux de rénovation, mais elle peut s’expliquer par la faiblesse des prix de l’énergie.
5. Construction non-résidentielle
Contrairement à tous les autres sous-secteurs, la construction non résidentielle a été le seul segment à enregistrer une tendance négative en 2015 (-0,5 %), surtout à cause de la baisse de sa composante publique (-2,4 %) qui est due au faible niveau d’investissements publics dans plusieurs États membres. La situation globale devrait s’améliorer légèrement en 2016 (+1,4 %) malgré le fait que les investisseurs restent circonspects face aux risques externes (baisse des prix du pétrole, développement éco-nomique en Chine et dans d’autres économies divergentes, turbulences actuelles dans la zone euro).
La situation est toutefois relative-ment contrastée parmi les différents pays de l’UE.
En 2015, le secteur a réalisé de bons résultats en Irlande (+9,4 %), au Portugal (+5,1 %), en Espagne (+4,1 %) et en Suède (+8 %), où il a été entraîné par la composante privée qui, dans le cas de la Suède, a atteint une croissance à deux chiffres de 10,9 %, surtout grâce à la progression des inves-tissements dans le secteur industriel.
Dans plusieurs autres États membres, une baisse parfois impor-tante a été enregistrée dans le seg-ment public. C’est le cas de la France (-6,5 %), de l’Allemagne (-2,7 %), de la Lituanie (-20,3 %) et du Royaume-Uni (-4,3 %).
Ausmaß – Rumänien und Slowenien (jeweils -0,2 %, -2,5 % und -9,9 %). Die Entwicklung in Frankreich ergab sich trotz neuer steuerlicher Anreize für Energieeffizienzmaßnahmen und eines attraktiven reduzierten MwSt.-Satzes (5,5 %) für Renovierungsarbeiten, was sich auch durch niedrige Energiepreise erklären lässt.
5. Nichtwohnungsbau
Im Gegensatz zu allen anderen Sektoren entwickelte sich der Wirtschaftsbau 2015 insge-samt negativ (-0,5 %), vor allem wegen der negativen Entwicklung im öffentlichen Bereich (-2,4 %) aufgrund des niedrigen Niveaus öffentlicher Investitionen in mehre-ren Mitgliedstaaten. Die Gesamtlage soll sich laut Prognose 2016 leicht verbessern (+1,4 %), auch wenn Investoren wegen externer Risiken (Ölpreisverfall, Konjunkturentwickung in China und anderen aufstreben-den Volkswirtschaften, andauernde Turbulenzen in der Eurozone) zurück-haltend bleiben.
Allerdings präsentiert sich die Lage in den einzelnen EU-Staaten sehr unterschiedlich.
2015 lief es für den Sektor gut in Irland (+9,4 %), Portugal (+5,1 %), Spanien (+4,1 %) und Schweden (+8,0 %), beflügelt durch den pri-vaten Bereich, in dem im Falle von Schweden zweistellige Zuwächse zu verzeichnen waren (+10,9 %), vor allem dank zunehmender Investitionen in der Industrie.
In mehreren anderen Mitgliedstaaten verzeichnete das öffentliche Segment ein teils erhebliches Minus. Dies gilt für Frankreich (-6,5 %), Deutschland (-2,7 %), Litauen (-20,3 %) und das Vereinigte Königreich (-4,3 %).
18
CO
NS
TRU
CTI
ON
AC
TIV
ITY
IN E
UR
OP
E -
ED
ITIO
N 2
016

EUROPEAN UNION
production (Mln, € fixed prices) Per cent variation of production in real terms on previous year
Country 2015a 2012 2013 2014 2015a 2016bAT Austria NA NA NA NA NA NA
BE Belgium 8,622 3.8 1.1 -2.9 -1.5 5.7
BG Bulgaria 1,595 10.0 -9.2 -1.7 -0.9 NA
CZ Czech Rep. 4,080 17.0 -28.1 3.8 13.6 NA
DE Germany 57,150 -0.8 -2.4 1.7 -2.2 -0.4
DK Denmark 2,552 -12.9 -3.0 0.1 -5.6 0.8
EE Estonia NA NA NA NA NA NA
ES Spain 27,483 -0.4 0.1 0.9 4.9 7.3
FI Finland 4,995 -10.9 -14.6 -3.0 -1.5 2.5
FR France 24,345 -0.8 -2.0 -2.6 -3.0 -1.6
GR Greece NA NA NA NA NA NA
IE Ireland 1,561 82.1 28.7 4.8 10.7 26.9
IT Italy 33,567 -10.6 -11.2 -7.3 -1.2 -0.4
LT Lithuania 599 0.2 13.0 20.7 -2.8 NA
NL Netherlands NA NA NA NA NA NA
PL Poland NA NA NA NA NA NA
PT Portugal 1,849 -13.0 -13.0 -2.0 7.0 4.0
RO Romania 3,841 -21.1 29.5 2.6 -2.5 5.0
SE Sweden 10,238 7.8 -2.6 13.5 10.9 2.5
SI Slovenia NA NA NA NA NA NA
UK United Kingdom 47,896 -3.3 4.1 10.3 3.6 NA
EU European Union 230,372 -3.0 -1.8 1.5 0.3 1.6
CH Switzerland 10,770 5.9 12.3 -3.3 -1.5 -1.0
NO Norway 12,022 3.0 -5.1 3.1 -2.5 -0.7
production (Mln, € fixed prices) Per cent variation of production in real terms on previous year
Country 2015a 2012 2013 2014 2015a 2016bAT Austria NA NA NA NA NA NA
BE Belgium 4,609 3.8 1.1 -2.9 -1.5 5.7
BG Bulgaria 11 0.0 -25.0 266.7 0.0 NA
CZ Czech Rep. 3,150 -27.5 81.3 -5.8 -15.8 NA
DE Germany 10,950 -14.0 -0.9 -2.9 -2.7 0.5
DK Denmark 3,165 18.6 0.9 6.6 4.1 4.1
EE Estonia NA NA NA NA NA NA
ES Spain 6,598 -12.5 -19.1 -3.6 0.8 -8.8
FI Finland 2,858 -6.1 4.7 3.0 3.5 1.0
FR France 21,727 -0.2 -2.3 -3.7 -6.5 -3.1
GR Greece NA NA NA NA NA NA
IE Ireland 1,436 -0.3 7.1 7.9 8.1 12.3
IT Italy 8,478 -10.6 -9.3 -5.1 -1.3 6.0
LT Lithuania 180 -32.1 23.6 8.9 -20.3 NA
NL Netherlands NA NA NA NA NA NA
PL Poland NA NA NA NA NA NA
PT Portugal 1,110 -10.0 -15.0 -11.0 2.0 1.5
RO Romania 1,141 -34.7 31.2 309.1 -2.5 5.0
SE Sweden 4,754 4.6 -1.6 15.5 2.2 2.0
SI Slovenia NA NA NA NA NA NA
UK United Kingdom 17,562 -14.1 -1.2 3.6 -4.3 NA
EU European Union 87,729 -8.7 -3.5 3.5 -2.4 1.0
CH Switzerland 6,655 6.8 2.5 -3.3 -1.5 -1.0
NO Norway 6,810 1.9 -0.6 4.2 9.7 2.0
NON RESIDENTIAL PRIVATE NON RÉSIDENTIEL PRIVÉ NICHTWOHNBAU PRIVAT
NON RESIDENTIAL PUBLIC NON RÉSIDENTIEL PUBLIC NICHTWOHNBAU ÖFFENTLICH
19
CO
NS
TRU
CTI
ON
AC
TIV
ITY
IN E
UR
OP
E -
ED
ITIO
N 2
016

EUROPEAN UNION
Denmark and Finland, where the private segment declined by 5.6% and 1.5% respectively, and the public one increased respec-tively by 4.1% and 3.5%, are two exceptions to the main trends.
6. Civil engineering
Contrary to what was fore-casted in our previous report, civil engineering activity in 2015 increased with a surprisingly high growth rate of 6.2%, which can be explained in large part by the boom recorded in the United Kingdom (+34%) and Romania (+20%), for the latter thanks to a higher volume of financial resources allocated to invest-ments and a greater volume of European funds allocated to sec-torial programmes, in particular in roads and railway infrastructure.
Civil engineering activity also increased in several other countries, but to a lesser extent, such as in Belgium (+3%), where changes in the invest-ment cycle of local authorities is probably approaching a peak ahead of the forthcoming local elections in 2018, in Denmark (+5.1%), mainly thanks to large projects, especially in trans-port infrastructure, in Ireland (+4%), where the “Capital Plan” provides significant funding for investment in education facili-ties, as well as in health infra-structure, in energy efficiency and renewable energy pro-grammes and in flood mitigation initiatives, in the Netherlands (+2.8%), despite the lowered contribution of the central government and the transfer of several tasks (healthcare, labour market) to municipalities, in Spain (+3%), where the elec-toral cycle and the loosening of the fiscal consolidation process
Le Danemark et la Finlande, où le segment privé a baissé respective-ment de 5,6 % et 1,5 % et le seg-ment public a augmenté de 4,1 % et 3,5 %, sont deux exceptions aux principales tendances observées.
6. Génie civil
Contrairement aux prévisions annon-cées dans notre précédent rapport, l’activité du génie civil en 2015 a connu un taux de croissance étonnam-ment élevé de 6,2 %, ce qui peut en grande partie s’expliquer par l’expan-sion enregistrée au Royaume-Uni (+34 %) et en Roumanie (+20 %). Dans ce dernier cas, la progression est imputable à l’allocation de ressources financières accrues aux investisse-ments et à un volume plus important de fonds européens alloués aux programmes sectoriels, en particulier dans les infrastructures routières et ferroviaires.
L’activité du génie civil a aussi aug-menté dans plusieurs autres pays, mais dans une moindre mesure, comme en Belgique (+3 %), où des changements dans le cycle d’in-vestissement des autorités locales atteignent probablement leur apogée en vue des prochaines élections régionales en 2018, au Danemark (+5,1 %), surtout grâce à de gros projets, principalement dans les infrastructures de transport, en Irlande (+4 %), où le « Capital Plan » propose un financement conséquent pour des investissements dans des établisse-ments d’enseignement ainsi que dans des infrastructures de santé, dans des programmes d’efficacité énergétique et d’énergie renouvelable ainsi que des initiatives pour la prévention des inondations, aux Pays-Bas (+2,8 %), malgré la baisse de la contribution du gouvernement central et le transfert de plusieurs compétences (soins de santé, marché de l’emploi) aux municipalités, en Espagne (+3 %), où le cycle électoral et l’assouplissement du processus de consolidation fiscale
Dänemark und Finnland bilden eine Ausnahme zum allgemeinen Trend. Hier erzielte der öffentliche Bereich Zuwächse von 4,1 % bzw. 3,5 %, wohingegen im privaten Bereich ein Rückgang von 5,6 % bzw. 1,5 % zu Buche schlug.
6. Tiefbau
Gegenläufig zur unserer Prognose im letzten Bericht wuchs die Tiefbautätigkeit im Jahr 2015 mit einer Wachstumsrate von +6,2 % überraschend stark. Zurückzuführen ist dies in weiten Teilen auf den Boom im Vereinigten Königreich (+34 %) und in Rumänien (+20 %), in letzterem Fall dank vermehr-ter finanzieller Ressourcen für Investitionen und eines beträchtli-chen Volumens von EU-Mitteln für Tiefbaumaßnahmen, insbesondere auf dem Gebiet der Straßen- und Eisenbahninfrastruktur.
Auch in einigen anderen Ländern wuchs die Tiefbautätigkeit, aller-dings in geringerem Umfang, zum Beispiel in Belgien (+3 %), wo Veränderungen im Investitionszyklus der lokalen Behörden im Vorfeld der Kommunalwahlen im Jahr 2018 einen baldigen Höhepunkt nahelegen; in Dänemark (+5,1 %), vor allem dank großer Projekte insbesondere für die Verkehrsinfrastruktur; in Irland (+ 4 %), wo der „Capital Plan“ umfassende, vorwiegend staat-liche, Mittel für Investitionen in Bildungseinrichtungen, Programme für mehr Energieeffizienz bzw. zu erneuerbaren Energien und Hochwasserschutzmaßnahmen vorsieht; in den Niederlanden (+2,8 %), trotz des reduzierten Beitrags der Zentralregierung und der Verlagerung mehrerer Aufgabenbereiche (Gesundheit, Arbeitsmarkt) an die Städte und Gemeinden; in Spanien (+3 %), wo sich der Finanzierungsrahmen aufgrund der Wahlen und der Lockerung des finanzpolitischen
20
CO
NS
TRU
CTI
ON
AC
TIV
ITY
IN E
UR
OP
E -
ED
ITIO
N 2
016

EUROPEAN UNION
production (Mln, € fixed prices) Per cent variation of production in real terms on previous year
Country 2015a 2012 2013 2014 2015a 2016bAT Austria 6,897 1.0 -3.9 1.5 0.0 0.6
BE Belgium 6,846 8.0 -4.4 5.4 3.0 0.0
BG Bulgaria 4,192 2.8 -5.4 31.6 -1.1 NA
CZ Czech Rep. 5,930 -7.2 -18.3 -5.7 -5.7 NA
DE Germany 37,000 -3.5 -0.3 5.2 -1.2 2.7
DK Denmark 7,155 4.9 2.2 -2.4 5.1 -2.7
EE Estonia 638 12.2 2.6 -10.2 -9.4 NA
ES Spain 21,153 -24.0 -23.0 -5.5 3.0 0.0
FI Finland 6,903 -0.2 1.4 -2.2 -1.0 0.0
FR France 35,185 -2.6 3.8 -6.0 -4.5 -3.0
GR Greece 6,724 12.8 -5.9 1.3 -12.1 NA
IE Ireland 3,297 -6.3 -3.0 8.9 4.0 5.8
IT Italy 14,435 -10.6 -9.3 -5.1 -1.3 6.0
LT Lithuania 949 -8.1 8.0 10.4 -13.4 NA
NL Netherlands 14,000 -8.1 -4.7 2.4 2.8 2.1
PL Poland 18,100 -1.8 -13.5 19.1 7.7 12.2
PT Portugal 5,478 -15.0 -14.0 -1.0 1.0 1.5
RO Romania 14,976 8.1 11.6 -18.2 20.0 5.2
SE Sweden 8,213 11.7 -3.3 8.5 0.7 -0.6
SI Slovenia 1,048 31.0 5.1 30.4 -9.0 -15.2
UK United Kingdom 22,486 -7.9 7.2 -2.4 34.0 NA
EU European Union 241,606 -5.8 -1.6 -0.8 6.2 1.8
CH Switzerland 12,037 8.5 0.0 -1.7 -2.0 0.0
NO Norway 14,139 10.3 4.5 7.0 3.7 11.3
Thousand units Variation on previous year
Country 2015a (x1000) 2013 (%) 2014 (%) 2015a (%) 2016b (%)AT Austria 264 -0.4 0.3 -0.5 1.3BE Belgium 274 -1.0 -1.6 -0.7 -1.6BG Bulgaria 183 -3.8 -0.6 2.8 3.8CY Cyprus 25 -26.7 -14.8 -0.9 NACZ Czech Rep. 415 -9.2 -2.3 9.8 1.2DE Germany 2,431 0.7 0.6 -0.5 0.8DK Denmark 175 -0.5 1.5 4.8 1.3EE Estonia 42 1.4 -1.1 NA NAES Spain 1,074 -11.4 -3.5 8.1 4.5FI Finland 186 -1.3 -2.1 -0.2 2.2FR France 1,763 -1.1 -1.9 -2.3 -1.0GR Greece 145 -19.2 -6.6 -4.3 NAHR Croatia 93 -6.4 -3.3 NA NAHU Hungary 272 0.9 5.2 NA NAIE Ireland 127 0.4 12.6 8.5 NAIT Italy 1,488 -8.6 -4.4 0.3 NALT Lithuania 105 10.9 0.0 6.0 NALU Luxembourg 40 NA NA NA NALV Latvia 64 NA NA NA NAMT Malta 9 NA NA NA NANL Netherlands 452 -5.7 -3.5 -2.4 4.0PL Poland 1,140 -5.5 -0.9 0.5 0.9PT Portugal 276 -19.3 -4.4 0.1 0.9RO Romania 417 3.0 4.0 7.2 3.2SE Sweden 308 -0.5 0.0 -0.9 1.2SI Slovenia 54 -9.7 -0.4 0.6 -9.1SK Slovakia 223 NA NA NA NAUK United Kingdom 2,110 -0.5 2.9 0.5 NAEU28 European Union 14,155 -3.9 -0.8 0.9 NACH Switzerland 327 1.1 0.5 -0.3 -1.0NO Norway 206 1.5 1.5 3.0 2.0TR TR - Turkey 1,914 4.3 7.3 0.1 1.9
CIVIL ENGINEERING GÉNIE CIVIL TIEFBAU
TOTAL EMPLOYMENT IN CONSTRUCTION* EMPLOI TOTAL DANS LA CONSTRUCTION* GESAMTBESCHÄFTIGUNG IM BAUWESEN*
* NACE Section F
21
CO
NS
TRU
CTI
ON
AC
TIV
ITY
IN E
UR
OP
E -
ED
ITIO
N 2
016

EUROPEAN UNION
brought an improvement in the financial framework but which should nevertheless show a stagnation or a slight fall in 2016, and in Poland (+7.7%), where a special focus is given to investments co-financed by the EU.
At the same time the sector declined or stagnated in several countries, mainly because of cuts in public investment. It is the case of Estonia (-9.4%), France (-4.5%), which has been deeply affected by successive expected factors (municipal post-elections and departmental elections) and extraordinary measures (a signif-icant drop in State grants to local governments), Finland (-1%), where the lack of long-term planning is the greatest source of uncertainty, Greece (-12.1%), where the sector is expected to decline further due to cuts in public spending and delays in EU funding of new infrastructure projects, Italy (-1.3%), where an increase of 6% is expected in 2016 thanks to some measures contained in the Italian 2016 Budget Law which should remove several economic and financial obstacles that prevented the carrying out of public works in Italy over the last years, Lithuania (-13.4%) and Slovenia (-8.2%), where a further reduction of already extremely low investment activity in national road network reconstruction is expected.
The unexpected positive develop-ments of 2015 will not continue in 2016 and a smaller overall increase of 1.8% is forecasted.
ont amélioré le contexte financier mais où l’activité devrait quand même enregistrer une stagnation ou une légère baisse en 2016, et en Pologne (+7,7 %), où une attention spécifique est accordée aux investissements cofinancés par l’UE.
En même temps, le secteur a connu un déclin ou une stagnation dans plu-sieurs pays, surtout à cause de coupes dans les investissements publics. C’est le cas de l’Estonie (-9,4 %), de la France (-4,5 %), qui a été profondé-ment touchée par plusieurs facteurs successifs attendus (post-élections municipales et élections départemen-tales) et des mesures extraordinaires (une baisse importante des subven-tions de l’État aux gouvernements locaux), de la Finlande (-1 %), où le manque de planification à long terme constitue la plus grande source d’incertitude, de la Grèce (-12,1 %), où le secteur devrait poursuivre son déclin à cause de coupes dans les dépenses publiques et des retards dans le finan-cement européen de nouveaux projets d’infrastructure, de l’Italie (-1,3 %), où une croissance de 6 % est attendue en 2016 grâce à certaines mesures adoptées dans la loi italienne sur le budget 2016 qui devrait supprimer plusieurs obstacles économiques et financiers qui empêchaient la réalisa-tion de travaux publics dans le pays au cours de ces dernières années, de la Lituanie (-13,4 %) et de la Slovénie (-8,2 %), où il faut s’attendre à une nouvelle baisse du niveau déjà très bas des investissements dans la recons-truction du réseau routier national.
Les développements positifs inatten-dus de 2015 ne se poursuivront pas en 2016, et une croissance globale plus faible de 1,8 % est prévue.
Konsolidierungsprozesses verbessert hat, wo jedoch für 2016 dennoch eine stagnierende oder leicht rückläufige Entwicklung zu erwarten ist; und in Polen (+ 7,7 %), wo ein besonderer Schwerpunkt auf von der EU kofinanzierten Investitionen liegt.
Zugleich stagnierte der Sektor in meh-reren Ländern oder verzeichnete ein Minus, vorwiegend wegen Einschnitten bei öffentlichen Investitionen. Dies war der Fall in Estland (-9,4 %); Frankreich (-4,5 %), aufgrund von starken Beeinträchtigungen durch aufeinan-der folgende absehbare Ereignisse (Nachwahlen auf kommunaler Ebene und Wahlen auf Departement-Ebene) und außergewöhnliche Maßnahmen (erhebliche Einschnitte bei Regierungsmitteln auf kommuna-ler Ebene ); Finnland (-1 %), wo der Mangel an langfristiger Planung den größten Unsicherheitsfaktor darstellt; Griechenland (-12,1 %), wo der Tiefbau den Erwartungen zufolge weitere Rückgänge verzeichnen wird aufgrund von Einschnitten bei den öffentlichen Ausgaben und Verzögerungen bei der Bereitstellung von EU-Mitteln für neue Infrastrukturprojekte; Italien (-1,3 %), wo 2016 ein Wachstum von 6 % erwartet wird dank bestimmter Maßnahmen aus dem italienischen Haushaltsgesetz für 2016, die dafür sorgen sollen, dass die seit Jahren bestehenden wirtschaftli-chen und finanziellen Hürden für die Ausführung öffentlicher Arbeiten in Italien fallen; Litauen (-13,4 %) und Slowenien (-8,2 %), wo eine wei-tere Reduzierung der bereits extrem niedrigen Investitionstätigkeit für die Sanierung des nationalen Straßennetzes erwartet wird.
Die unerwartet positiven Entwicklungen im Jahr 2015 werden sich 2016 nicht fortsetzen, sodass insgesamt ein geringeres Gesamtwachstum von 1,8 % prognos-tiziert wird.
22
CO
NS
TRU
CTI
ON
AC
TIV
ITY
IN E
UR
OP
E -
ED
ITIO
N 2
016
EUROPEAN UNION
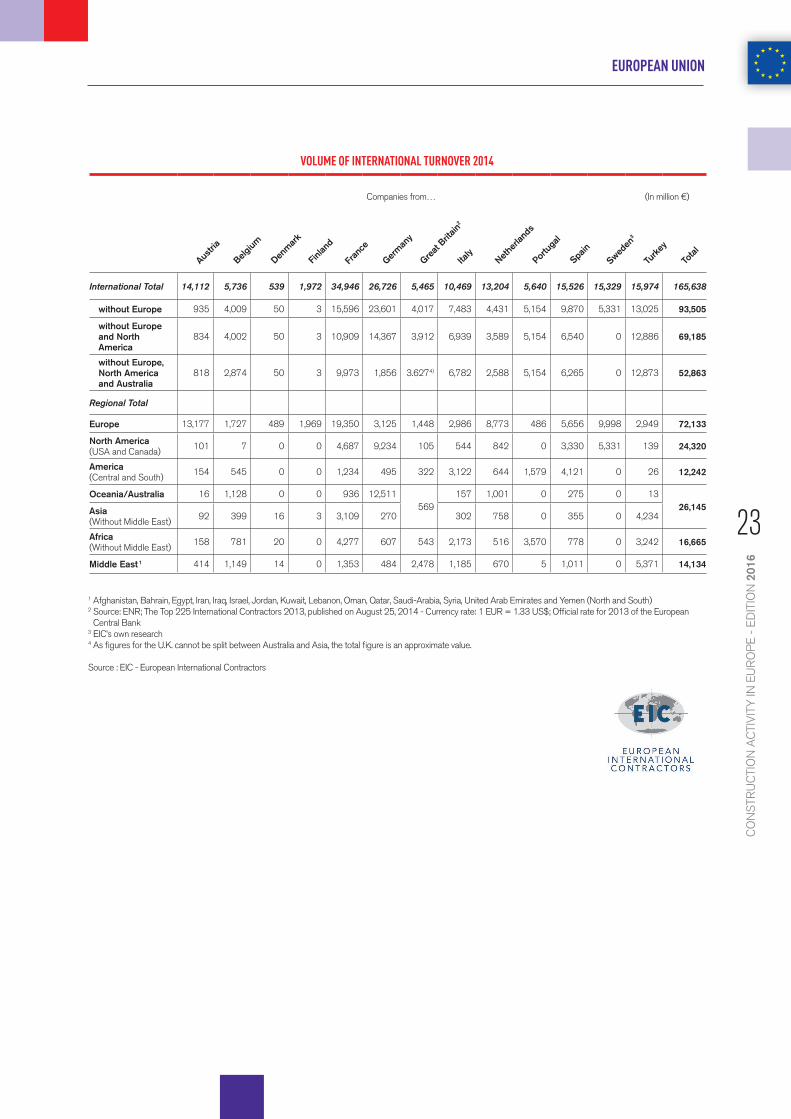
Companies from… (In million €)
International Total 14,112 5,736 539 1,972 34,946 26,726 5,465 10,469 13,204 5,640 15,526 15,329 15,974 165,638
without Europe 935 4,009 50 3 15,596 23,601 4,017 7,483 4,431 5,154 9,870 5,331 13,025 93,505
without Europe and North America
834 4,002 50 3 10,909 14,367 3,912 6,939 3,589 5,154 6,540 0 12,886 69,185
without Europe, North America and Australia
818 2,874 50 3 9,973 1,856 3.6274) 6,782 2,588 5,154 6,265 0 12,873 52,863
Regional Total
Europe 13,177 1,727 489 1,969 19,350 3,125 1,448 2,986 8,773 486 5,656 9,998 2,949 72,133
North America (USA and Canada)
101 7 0 0 4,687 9,234 105 544 842 0 3,330 5,331 139 24,320
America (Central and South)
154 545 0 0 1,234 495 322 3,122 644 1,579 4,121 0 26 12,242
Oceania/Australia 16 1,128 0 0 936 12,511 569
157 1,001 0 275 0 13 26,145 Asia
(Without Middle East)92 399 16 3 3,109 270 302 758 0 355 0 4,234
Africa (Without Middle East)
158 781 20 0 4,277 607 543 2,173 516 3,570 778 0 3,242 16,665
Middle East 1 414 1,149 14 0 1,353 484 2,478 1,185 670 5 1,011 0 5,371 14,134
VOLUME OF INTERNATIONAL TURNOVER 2014
1 Afghanistan, Bahrain, Egypt, Iran, Iraq, Israel, Jordan, Kuwait, Lebanon, Oman, Qatar, Saudi-Arabia, Syria, United Arab Emirates and Yemen (North and South)2 Source: ENR; The Top 225 International Contractors 2013, published on August 25, 2014 - Currency rate: 1 EUR = 1.33 US$; Official rate for 2013 of the European
Central Bank3 EIC’s own research4 As figures for the U.K. cannot be split between Australia and Asia, the total figure is an approximate value.
Source : EIC - European International Contractors
Austri
a
Belgium
Denm
ark
Finlan
d
Fran
ce
Germ
any
Great
Britain
2
Italy
Nethe
rland
s
Portu
gal
Spain
Sweden
3
Turk
ey
Total
23
CO
NS
TRU
CTI
ON
AC
TIV
ITY
IN E
UR
OP
E -
ED
ITIO
N 2
016
1. Overall construction activity
The Austrian economy is picking up pace, but only very slowly. According to the September forecast of the Austrian Institute of Economic Research (WIFO), Austrian GDP (real) will grow by 0.7% in 2015 and 1.4% in 2016. In particular, foreign trade remains weaker than expected and is unable to serve as a catalyst for the recovery of the Austrian economy.The consequences of the weak recovery are most visible in the labour market. Despite a steadily increasing employment rate - it has been growing for 5 consecutive years - the unem-ployment rates are increasing as well.The overall weak economic performance has had a direct impact on the Austrian construction industry. Following the remarkably strong decline (-2.1%) in real construction investment in 2013, 2014 also resulted in a decline (-1.0%). The construction sector, despite good weather conditions in H1 2014, slipped into a negative result for the annual total, emphasising the cur-rent weakness. Even if the negative trend, according to the forecast, slowed down in the year 2015 (+ 0.2%), the currently available data do not envisage prospects for an early recovery.Total construction will be close to stagnation in 2015. In the forecasting period an average growth of slightly above 1% is expected, which rather stems from building construction than from civil engineering.
2. Housebuilding
The residential construction market is improving marginally from year to year, nevertheless 2015 will be the third year in a row with a decline in housing output, even if it is close to stag-nation. In the coming years a small growth is expected, which will mainly stem from new con-struction of flats and multi-storey buildings. In 2017 and 2018 the market will be bouyed by the recently announced stimulus package for housing, which should fulfil future housing needs especially in urban areas, above all in Vienna. Total housing construction is therefore ex-pected to grow slightly above 1% from 2016 onwards.
3. Non-residential construction
New non-residential construction performed less well than expected in 2014. Starting from a lower volume combined with an improving economic framework, non-residential construction is expected to recover again in 2015. Major office projects which will be completed in 2015, helping this market segment. In the public sector projects in the area of health care are also contributing to growth in 2015 while in the coming years growth will mainly result from further investments in the area of industrial buildings.Total non-residential construction is expected to grow by close to 1% in 2015 with an increas-ing trend to 2.2% towards 2018.
4. Civil engineering
The civil engineering outlook is divided into two different areas. The market for transport infra-structure is very favourable. Investments are mainly occuring in highway and rail infrastructure where they will increase until 2017. Also the telecommunications market will show positive development towards 2018. On the other hand, the energy and water works markets are under pressure. Investments in power plants, above all in thermal facilities are not economically viable because of the low energy prices. Water works are declining due to the high connection rate to the public drinking water supply and sewage systems. The current activity is focused on renovation and modernisation works mainly in the waste water sector. But this subsector can-not compensate for the low levels and declining need in terms of new construction. Total civil engineering is therefore expected to grow slightly in 2016 by 0.6% and to more or less stagnate in 2017 and 2018.
AUSTRIA
24
CO
NS
TRU
CTI
ON
AC
TIV
ITY
IN E
UR
OP
E -
ED
ITIO
N 2
016

INVESTMENT IN CONSTRUCTION
Housebuilding Non residential Civil Engineering Total Construction
2007 = 100
‘07
‘08
‘09
‘10
‘11
‘12
‘13
‘14
2015
a
2016
b
PER CENT VARIATION OF PRODUCTION IN REAL TERMS OF PREVIOUS YEAR
production Mln. €
fixed prices variation of production on previous year (%)
Sectors 2015a 2012 2013 2014 2015a 2016b
1. Building 26,016 2.9 -1.7 -1.7 0.3 1.1
1.1. Housebuilding 15,404 3.9 -1.5 -1.4 -0.2 1.0
1.1.1. New 10,628 4.5 -1.7 -1.5 -0.5 1.0
1.1.2. R&M 4,775 2.5 -0.9 -1.1 0.6 0.9
1.2. Non residential 10,613 1.5 -2.0 -2.1 0.9 1.3
1.2.1. Private NA NA NA NA NA NA
1.2.2. Public NA NA NA NA NA NA
2. Civil Engineering 6,897 1.0 -3.9 1.5 0.0 0.6
(1 + 2) Total Construction 32,914 2.5 -2.1 -1.0 0.2 1.0
a: estimate - b: forecast
NUMBER OF BUILDING PERMITS IN RESIDENTIAL CONSTRUCTION
2012 2013 2014 2015a 2016b
single dwelling 15,800 16,400 17,100 17,100 17,400
collective dwelling 24,900 29,500 30,800 32,300 31,600
other types of dwelling NA NA NA NA NA
Total 40,700 45,900 47,900 49,400 49,000
(Collective dwellings and other types of buildings: in number of flats)
120
110
100
90
80
70
60
AUSTRIA
60
70
80
90
100
110
120
€ 338
BILLION 8,566,000
GDP 2015
POPULATION 2015
25
CO
NS
TRU
CTI
ON
AC
TIV
ITY
IN E
UR
OP
E -
ED
ITIO
N 2
016
1. Overall construction activity
The first estimates of the Institute of National Accounts indicate that the construction industry (+1.9%) outperformed the average of the Belgian economy (+1.4%) in 2015. “However, construction” salaried employment subject to Belgian social security recorded a further decline (-2%). It must also be noted that, in parallel, the number of declarations of foreign posted workers for construction assignments in Belgium increased by 25%. Under these conditions, the business confidence of entrepreneurs remained pessimistic throughout the year, even though the gap between optimists and pessimists decreased since the summer of 2015.
Experts are predicting weak economic growth in 2016 (+1.2%) that would, however, be able to decrease unemployment. In this context, the construction industry as a whole should continue to experience positive developments in 2016. The intensity of this increase appears to be highly dependent on the (positive or negative) development of civil engineering in 2016 and the evolution of new constructions that will be authorised, which are currently in a very volatile state. Employment, however, is expected to continue to decrease (-2 to 3%) if nothing changes in the factors causing the accelerated decline in the employment rate of the Belgian construction industry.
2. Housebuilding
The activities connected with the construction of new homes slightly increased in 2015 (by around 3%) in line with the latest works on the large number of homes authorised in 2014, following various epiphenomena.
In the absence of such epiphenomena, the number of authorised homes over the whole year greatly declined (by around 10%). The actual level of demand observed in late 2015 appears unclear. Significantly higher than the level of the first three quarters, it may only reflect the high volatility of statistics on building permits, and it is therefore necessary to expect a significant decline in the activities connected to the construction of new homes in 2016 (by around 7.5%). In the most favourable hypothesis that it is a sign of recovery of demand, the decline in production should be less marked. Given construction deadlines, a recovery of demand does not seem likely to contribute to avoiding a decline in the production of new homes in 2016.
3. Non-residential buildings
The construction of new non-residential buildings decreased in 2015 (by around 3%). This is due to the fact that the volume of works for authorised buildings and buildings yet to be built was lower in early 2015 than it was in early 2014.
The total volume of new buildings authorised in the course of 2015 increased significantly (by around 10%). This shows a growth potential for activities connected to the construction of new non-residential buildings in 2016, especially given that the volume of works linked to the “Scholen voor morgen” (Schools for tomorrow) project is also projected to be higher than in 2015. It is therefore estimated that new non-residential constructions could increase by around 8% in 2016.
4. Civil engineering
The “ex post” statistics on the evolution of civil engineering in 2015 are, for the 2nd year running, quite different from the “ex ante” estimates (perspectives on the resources of the public authorities and how they will be used). Various converging pieces of information seem to suggest that, across all forms of activity, civil engineering avoided the expected decline and possibly even increased by a few percent.
In this context, establishing development prospects for 2016 seems a particularly uncertain exercise. On one hand, it could be stated that the share of civil engineering in public investments reached a level above its trend level: this means that adjusting the figures to trends, according to standard practice in such cases, would result in a decrease for civil engineering in 2016. On the other hand, it can be noted that, firstly, the investment budget for rail was not reduced in 2016 (contrary to 2015) and, secondly, that changes in the investment cycle of local authorities is approaching a peak ahead of the forthcoming local elections (2018): this means that there are favourable prospects for civil engineering in the absence of the above-mentioned adjustment.
BELGIUM
26
CO
NS
TRU
CTI
ON
AC
TIV
ITY
IN E
UR
OP
E -
ED
ITIO
N 2
016

INVESTMENT IN CONSTRUCTION
Housebuilding Non residential Civil Engineering Total Construction
2007 = 100
‘07
‘08
‘09
‘10
‘11
‘12
‘13
‘14
2015
a
2016
b
€ 410
BILLION 11,235,000
GDP 2015
POPULATION 2015
PER CENT VARIATION OF PRODUCTION IN REAL TERMS OF PREVIOUS YEAR
production Mln. €
fixed prices variation of production on previous year (%)
Sectors 2015a 2012 2013 2014 2015a 2016b
1. Building 30,166 -0.4 -0.4 2.1 1.0 1.6
1.1. Housebuilding 16,936 -3.7 -1.7 6.7 3.0 -1.6
1.1.1. New 7,192 -3.3 -1.6 11.9 3.0 -7.5
1.1.2. R&M 9,744 -3.9 -1.8 3.2 2.9 2.7
1.2. Non residential 13,231 3.8 1.1 -2.9 -1.5 5.7
1.2.1. Private 8,622 3.8 1.1 -2.9 -1.5 5.7
1.2.2. Public 4,609 3.8 1.1 -2.9 -1.5 5.7
2. Civil Engineering 6,846 8.0 -4.4 5.4 3.0 0.0
(1 + 2) Total Construction 37,012 1.1 -1.1 2.7 1.3 1.3
a: estimate - b: forecast
NUMBER OF BUILDING PERMITS IN RESIDENTIAL CONSTRUCTION
2012 2013 2014 2015a 2016b
single dwelling 21,623 20,692 21,591 19,000 19,655
collective dwelling 24,806 27,917 31,720 28,500 29,374
other types of dwelling 319 357 616 888 916
Total 46,748 48,966 53,927 48,388 49,945
(Collective dwellings and other types of buildings: in number of flats)
BELGIUM
140
130
120
110
100
9090
100
110
120
130
140
27
CO
NS
TRU
CTI
ON
AC
TIV
ITY
IN E
UR
OP
E -
ED
ITIO
N 2
016

BULGARIA
1. Overall construction activity
The construction industry in 2015 was characterised by favourable dynamics and a change in the growing negative trend established over the years. Statistical data for some indicators show positive signs and indicate the expected pace of recovery and growth of the construction sector. In recent years, the construction sector in Bulgaria accumulated losses and according to preliminary statistics, 2015 proved to be a turning point, marking a positive trend for the first time. The illustrated growth is mainly based on completed EU projects in the area of road and water supply and sewage infrastructure. The construction industry in 2015, according to preliminary data, made up 4.7% of the total gross value added for the economy. In 2015, foreign direct investment in the construction sector showed a significant drop of 57.9% compared with 2014. Small-scale projects still remain in the focus of investors. For more than 4 years, investment activity in the construction industry had overall negative values in real terms. This trend continued in 2015. The expectations are that in 2016, the construction segment will see an increase in construction volume levels on an ongoing basis. Public procurement notices in the construction sector in 2015 amounted to 2.8 of a value of €2 billion. The trend is towards a registered decline in the number of procurement notices by 13.2% and a decrease in value by 14%. An indicative fact for the construction sector is the continuing trend towards significant decline in the costs for acquisition of fixed assets - by 61% in 2015 compared to 2014. Employment in the construction sector accounted for 5.3% of the total employment in the economy of the country, maintaining the same trend as in the previous year and an increase of 2.5%. The trend shows an ageing workforce in the construction sector, and an outflow of the younger generation from the building profession. The unemployed in the construction sector in 2015 accounted for 11.4% of the total number of unemployed in the country (13.9% in 2014).
2. Housebuilding
The forecast analysis of preliminary data for 2015 shows that the share of housing construction in the total revenue in the sector accounted for only 12.6%, which is a significant drop of 32.4% compared to the pre-crisis period. Price falls of homes were registered, but buyers remain cautious. In general, the downward trend in housing construction persists, with signs for a slight increase in 2016. Construction starts of residential buildings in 2015 increased by 11.8% against the previous year and the proportion of dwellings indicate a significant increase of 47.3%. Completed residential buildings that were put into operation in 2015 show a decrease of 5.5% and a decrease in the proportion of dwellings of 18.6%. The Figures show an increase in construction in H2 2015, which gives hope for a positive forecast and grounds for dynamic changes in housing construction in 2016. Completed buildings were mostly made of reinforced concrete and represented 69.9% of the total number of residential buildings put into operation, while the share of brick buildings was 26.3%,
which represents an upward trend. One of the key priorities for the segment is improving energy efficiency in accordance with the “Europe 2020” strategy, under various co-funding schemes. In 2015, in housing construction in Bulgaria projects were launched, aimed mainly at renovation and rehabilitation, optimisation, modernisation and energy efficiency of the existing building stock.
3. Non-residential buildings
According to estimated data, non-residential buildings construction will form 24.3% of the revenue in the construction sector. Summarising the data for 2015 on non-residential building construction, the trend observed is towards a minor increase, of 0.8% compared to 2014. The non-residential sector expects to register positive growth rates during 2016, where the leading segment is industrial construction, and an increase of construction in the healthcare, education and agriculture sectors. Industrial construction and construction related to agricultural businesses held an important position in non-residential building construction in 2015 and this trend will persist in the future. The situation in the segment can be seen from the data on the permits issued in 2015. With regard to administrative buildings, a decline of 16% against the previous year reported and a minor decrease in urban areas of 1.2%. Regarding construction permits issued for other buildings, the data for 2015 indicates an increase of 1.4% and an increase in urban areas of 29.7%. Construction starts of administrative buildings in 2015 remained stagnant with negative values of 4.3% compared to 2014. Most of the investors expect a favourable period in the market, which will unleash the potential of this segment. For the next year, the growth rate for office buildings will be around 2% according to the estimations. In 2015, there was some improvement in the real estate market trend, but the results achieved in the pre-crisis period could hardly be repeated.
4. Civil engineering
Civil engineering infrastructure output was €4.2 billion, which was a positive increase of 17.1% against the previous year. The growth came mainly from the completion of EU-funded projects in the area of road and water infrastructure. For several years the construction industry has redirected its focus and moved towards construction of infrastructure projects. The place of this segment was of particular importance for the development of the construction sector and of the economy as a whole. Based on estimated data, civil engineering infrastructure accounted for 50.2% of total production output and was growing. Engineering construction depends entirely on the state budget and local structures as well as on funds granted by the EU. However, the positive trend in civil engineering is estimated to have stopped by the end of 2015. The reason is the transition period of the EU to 2014-2020, and the reduction of EU funds allocated for civil engineering infrastructure. Forecasts for increasing energy plant construction in the coming years remain volatile due to the uncertain future of nuclear energy projects. This segment is unlikely to fulfil its potential.
28
CO
NS
TRU
CTI
ON
AC
TIV
ITY
IN E
UR
OP
E -
ED
ITIO
N 2
016
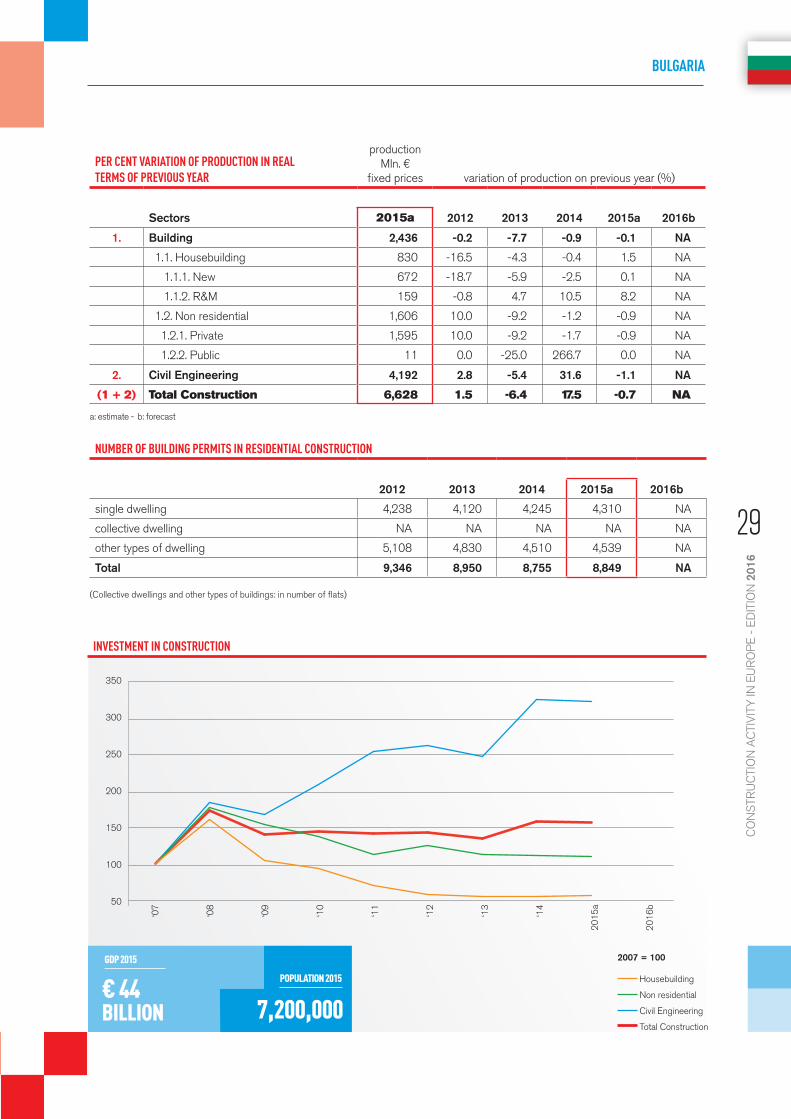
INVESTMENT IN CONSTRUCTION
Housebuilding Non residential Civil Engineering Total Construction
2007 = 100
‘07
‘08
‘09
‘10
‘11
‘12
‘13
‘14
2015
a
2016
b
€ 44
BILLION 7,200,000
GDP 2015
POPULATION 2015
PER CENT VARIATION OF PRODUCTION IN REAL TERMS OF PREVIOUS YEAR
production Mln. €
fixed prices variation of production on previous year (%)
Sectors 2015a 2012 2013 2014 2015a 2016b
1. Building 2,436 -0.2 -7.7 -0.9 -0.1 NA
1.1. Housebuilding 830 -16.5 -4.3 -0.4 1.5 NA
1.1.1. New 672 -18.7 -5.9 -2.5 0.1 NA
1.1.2. R&M 159 -0.8 4.7 10.5 8.2 NA
1.2. Non residential 1,606 10.0 -9.2 -1.2 -0.9 NA
1.2.1. Private 1,595 10.0 -9.2 -1.7 -0.9 NA
1.2.2. Public 11 0.0 -25.0 266.7 0.0 NA
2. Civil Engineering 4,192 2.8 -5.4 31.6 -1.1 NA
(1 + 2) Total Construction 6,628 1.5 -6.4 17.5 -0.7 NA
a: estimate - b: forecast
NUMBER OF BUILDING PERMITS IN RESIDENTIAL CONSTRUCTION
2012 2013 2014 2015a 2016b
single dwelling 4,238 4,120 4,245 4,310 NA
collective dwelling NA NA NA NA NA
other types of dwelling 5,108 4,830 4,510 4,539 NA
Total 9,346 8,950 8,755 8,849 NA
(Collective dwellings and other types of buildings: in number of flats)
BULGARIA
350
300
250
200
150
100
50
0
50
100
150
200
250
300
350
29
CO
NS
TRU
CTI
ON
AC
TIV
ITY
IN E
UR
OP
E -
ED
ITIO
N 2
016

1. Overall construction activity
According to the national statistical service (CYSTAT) the GDP growth rate in real terms during Q3 2015 was positive and estimated at +2.3% compared with the corresponding quarter of 2014. Based on seasonally and working day adjusted data, GDP growth rate in real terms is estimated to be +2.2%. Positive growth rates were recorded by the following sectors: Manufacturing, Construction, Retail and Wholesale Trade, Hotels and Restaurants, Transport, Professional, Scientific and Technical Activities, Administrative and Support Service Activities as well as Financial Service Activities. Negative growth rates were recorded by the following sectors: Recreational, Cultural and Sporting Activities, Activities of Households as Employers and Other Community, Social and Personal Service Activities. During the period January – September 2015, 3,693 building permits were issued compared to 3,714 in the corresponding period of the previous year .The total value of these permits increased by 19.1% and the total area by 14.8%. The number of dwelling units recorded an increase of 15.1%. The output prices index in construction for Q2 2015 reached 100.6 units, recording a decrease of 0.1% over Q1 2015. Compared to the same quarter of the previous year, the index recorded an increase of 3.5%. By type of segments, a decrease of 0.9% was observed for buildings and an increase of 12.8% for civil engineering projects in Q2 2015, compared to the corresponding quarter of 2014. The Consumer Price Index decreased by 2.2% in the period January-October 2015 compared to the corresponding period of 2014. The price of petroleum products decreased on average by 13.5%, local products by 4.0%, imported products by 0.6% and services by 0.1%. In Q2 2015, the number of employed people amounted to 364,585 and the number of unemployed people to 62,643. The employment rate for people aged 20-64 was 68.7% (males 72.7% and females 65.1%) recording an increase from the previous quarter (67.2%) and from the corresponding quarter of 2014 (67.8%). The unemployment rate amounted to 14.7% of the labour force (males 14.9% and females 14.4%) recording a decrease from the previous quarter (17.7%) and the corresponding quarter of 2014 (15.4%). Also the unemployment rate for young people aged 15-24 amounted to 31.7% of the labour force of the same age group recording a decrease from the previous quarter (37.1%) and from the corresponding quarter of 2014 (37.2%).
2. Housebuilding
2,483 building permits for residential buildings were issued during the period January – September 2015, providing for the construction of 2,397 dwelling units. The number of these dwelling units represents an increase of 13.14% compared to 2,082 in the same period of 2014. These building permits comprise 1,978 single houses corresponding to 1,193 dwelling units and 502 buildings with two or more housing units corresponding to 1,204 dwelling units.The number of building permits authorised by the municipal authorities and the district administration offices during September 2015 stood at 407, as in September 2014.
The total value of these permits reached €78.5 million, an increase of 0.76% compared to 77.9 million in September 2014 and the total area 69,400 m². These building permits provided for the construction of 314 dwelling units.
3. Non-residential buildings
During the period January – September 2015, 738 building permits were issued for non-residential buildings, a decrease of 2.5% compared to 757 in the same period of 2014. The total area of these buildings reached 142,668 m² and the total value €184.8 million. These included building permits providing for the construction of 155 hotels and similar buildings (compared to 151 in the same period of 2014), 55 office buildings (compared to 41 in the same period of 2014), 99 industrial buildings and warehouses (compared to 92 in the same period of 2014), 102 public entertainment buildings and buildings used for recreational, educational or medical purposes (compared to 124 in the same period of 2014), 58 wholesale and retail trade buildings (compared to 84 in the same period of 2014) and 251 other non-residential buildings (compared to 265 in the same period of 2014).
4. Civil engineering
The number of building permits issued for civil engineering projects during the period January – September 2015 stood at 144.The total area of these projects represented 9,114 m² recording a decrease of 11.7% compared to 10,180 m² in the same period of the previous year. Their total value reached €57.4 billion, recording an increase of 5.7% compared to €54 billion in the same period of the previous year. In the same period, 57 building permits were issued providing for the execution of road construction projects in addition to the above civil engineering projects, the same figure for the corresponding period of 2014. The total value of these projects (2015) however, reached €4.5 billion recording an increase of 22.6% compared to €3.5 billion in the same period of the previous year. 171 building permits were issued for big projects (each with an area greater than 900 m²) recording an increase of 18.7% compared to 139 in the same period (January – September) of the previous year. The total area of these projects represented 299,212 m² recording an increase of 28.6% compared to 203,540 m² in the same period (January – September) of 2014. Their total value reached €382 billion, recording an increase of 10.9% compared to €203 billion in the same period of the previous year. In the same period (January – September 2015) 3,522 building permits were issued for small projects (including 1,480 dwelling units) recording a decrease of 1.5%. The total area of these projects represented 359,215 m², recording a decrease of 3% compared to 370,216 m² in the same period (January – September) of the previous year .Their total value amounted to €381.8 billion recording a decrease of 4.9% compared to €401 billion in the same period (January – September) of the previous year. The number of permits providing for the division of plots during the period January – September 2015 fell to 228, recording a decrease of 20.6% compared to 275 in the same period of 2014.
CYPRUS
30
CO
NS
TRU
CTI
ON
AC
TIV
ITY
IN E
UR
OP
E -
ED
ITIO
N 2
016

€ 17
BILLION 865,000
GDP 2015
POPULATION 2015
NUMBER OF BUILDING PERMITS IN RESIDENTIAL CONSTRUCTION
2012 2013 2014 2015a 2016b
single dwelling 2,761 2,019 1,599 NA NA
collective dwelling 2,806 1,941 1,184 NA NA
other types of dwelling 312 181 72 NA NA
Total 5,879 4,141 2,855 NA NA
(Collective dwellings and other types of buildings: in number of flats). Note: 2014, data Jan.-Oct. only
CYPRUS
DE
© fo
ttoo
- Fot
olia
.com
31
CO
NS
TRU
CTI
ON
AC
TIV
ITY
IN E
UR
OP
E -
ED
ITIO
N 2
016
1. Overall construction activity
The Czech economy in 2008 fell sharply and was alternately rising and falling, in particular following the political situation and the economic situation in the Euro-region. 2014 represented a turning point for the Czech construction industry. After 5 years there was a growth in production volume. This is partly due to the low comparative levels of previous years - the volume of construction in the 2008-2013 period of time had fallen by 25%. Growth in the last year and this year is a sign of recovery in construction activity in the Czech Republic and in all types of construction. Demand for construction work grew in both the private and public sector. Last year the Czech economy finally recorded a rise in GDP (+2%). Six consecutive quarters of recession (2.3% in total) stopped in Q2 2015. Last year GDP started to recover, mainly thanks to export and import. Domestic demand started to grow also. Estimates for current GDP development are more optimistic in this area and predict a positive trend in all components of GDP. According to current developments, the expected economic growth for this year is more positive (3.8%). Within the period 2016-2018 we expect a moderate growth of around 2.5% each year. The position of the Czech currency-CZK against the EUR is still quite weak due to intervention policy. The Czech National Bank started this concept in 2013 to stimulate export and kick start the Czech economy. Thus the Czech crown was weakened quite significantly and the average exchange rate CZK/EUR reached 25.9 in 2013 and then 27.5 last year. The volatility of the exchange rate stabilised and this helped in the area of investment planning. This intervention should last until the end of 2016. The construction industry in 2014 employed 365,000 people (of which 212,000 were employees), which is 7.3% of all employed persons and approximately 7% of the working population. The number of workers in the construction industry between 2008 and 2014 decreased by 11% and ̀ in 2015. The average wage in construction was about 11% lower than the national average and in comparison with the previous year increased by 1.7%. In 2014, the price index of construction - after years of recession - swung into positive figures and the price of construction works continued to grow in 2015.
2. Housebuilding
Growing confidence in the stability of the economy together with record low mortgage loan rates were the main positive factors for the development of housing construction. Demand for new housing is still considerable. Prices of apartments are already rising. The new construction situation is more optimistic in the case of dwellings in residential buildings. The decline in the construction of houses also stopped and the forecast shows a rising trend. The average interest rate of mortgages in 2015 reached a record low, while in May and June it came down to 2%. Low interest rates are a positive factor for the further development of housing construction, and demand for mortgages reached record levels. The average mortgage amount is increasing, but with the recovery of the real estate market the prices offered for new flats are gradually rising too. A positive factor is the growth in household incomes since
2013. For 2015, the household income growth is expected to exceed just 2%. However, there has also been a growth in house prices, coupled with a recovery in the real estate market. Property prices initially rose mainly in Prague, but now they have grown in almost the entire country. In the Czech Republic there are about 1.5 million houses, from which only 25% have been renovated. From 200,000 residential buildings about 40% have been renovated. The proportion of renovation and modernisation of housing construction has not grown since 2011. With regard to the revival of new construction, the R&M share will not grow and will represent approximately one third of total residential construction. R&M in housing is being positively influenced by the government’s programme, which supports reconstruction in order to improve the energy performance of buildings and the use of renewable energy sources.
3. Non-residential buildings
Non-residential construction in 2015 was still falling. Investors considered each investment carefully. A positive development in non-residential construction is in projects, financed from private sources. Private investors are starting to wake up and are beginning to explore larger-scale projects mainly in the field of storage space. This slight improvement is being driven mainly by technology companies who are interested in modern and cheap spaces. Conversely, non-residential construction, financed from public funds, showed worse results than expected.
4. Civil engineering
Civil engineering construction suffered particularly from the suspension and revision of the amount of highway construction projects, but also by a significant reduction in the preparation of new projects. 2014 was - after three years of almost 10% decline -favourable for civil engineering construction and finally recorded a growth. We managed to activate funding for civil engineering works, with the support of EU funds and open the possibility to exhaust and exploit the EU funds available for the respective period. The year 2015 was, in this respect, even more distinct and growth of more than 15%is expected. Good results were achieved with the construction of flood prevention measures. The construction of sewerage systems and wastewater treatment plants is ongoing, especially in the villages along the rivers and water areas. In 2014, the share of civil engineering construction was 28.9% of the total volume of construction. In 2015 this figure, due to a strong growth in volume, rose to 31.1% and in the coming years will gradually decrease. Road construction is recovering from cuts. The share of engineering construction renovation is reaching around 30%, predicted for the long term. After the recovery of new investments and construction the R&M share will decline. The current government considers building investments to be the main support for the stimulation of the economy and it is intensively concentrating its attention on problems related to funding sources, both from our own and EU funds. The data concerning 2015 will be published by the Czech Statistical Office in May 2016.
CZECH REPUBLIC
32
CO
NS
TRU
CTI
ON
AC
TIV
ITY
IN E
UR
OP
E -
ED
ITIO
N 2
016

INVESTMENT IN CONSTRUCTION
Housebuilding Non residential Civil Engineering Total Construction
2007 = 100
‘07
‘08
‘09
‘10
‘11
‘12
‘13
‘14
2015
a
2016
b
€ 162
BILLION 10,546,000
GDP 2015
POPULATION 2015
PER CENT VARIATION OF PRODUCTION IN REAL TERMS OF PREVIOUS YEAR
production Mln. €
fixed prices variation of production on previous year (%)
Sectors 2015a 2012 2013 2014 2015a 2016b
1. Building 9,730 -1.0 -6.0 7.5 -5.4 NA
1.1. Housebuilding 2,500 1.0 -13.2 7.2 -15.5 NA
1.1.1. New 1,890 48.9 -12.5 -18.0 -6.0 NA
1.1.2. R&M 610 -70.1 -18.4 206.5 -35.8 NA
1.2. Non residential 7,230 -1.8 6.1 -1.3 -1.4 NA
1.2.1. Private 4,080 17.0 -28.1 3.8 13.6 NA
1.2.2. Public 3,150 -27.5 81.3 -5.8 -15.8 NA
2. Civil Engineering 5,930 -7.2 -18.3 -5.7 -5.7 NA
(1 + 2) Total Construction 15,660 -3.8 -11.5 2.1 -5.5 NA
a: estimate - b: forecast
NUMBER OF BUILDING PERMITS IN RESIDENTIAL CONSTRUCTION
2012 2013 2014 2015a 2016b
single dwelling 22,900 18,300 15,800 16,600 17,200
collective dwelling 11,100 11,200 12,300 12,500 13,000
other types of dwelling NA NA NA NA NA
Total 34,000 29,500 28,100 29,100 30,200
(Collective dwellings and other types of buildings: in number of flats)
130
120
110
100
90
80
70
60
50
CZECH REPUBLIC
50
60
70
80
90
100
110
120
130
33
CO
NS
TRU
CTI
ON
AC
TIV
ITY
IN E
UR
OP
E -
ED
ITIO
N 2
016
1. Overall construction activity
Preliminary figures for 2015 show a minimal growth of total construction output in real terms of 0.2%, reaching a volume of €297 billion. The growth was only based on the development of residential construction where the surplus was 1.5%. Non-residential building (- 2.2%) and civil engineering (-1.2%) experienced a decline. Parallel to the minimal surplus in production, employment in construction (2,431 million) fell by 0.5%, due to the improvement in productivity. Expectations for total construction output in 2016 are better than last year. The economic research institutes predict a real growth rate for GDP of 1.8%. Construction federations expect total construction output to grow at nearly the same rate by 1.5% in real terms. The volume at current prices is expected to go beyond the level of €300 billion for the first time. The share of GDP, attributed to construction activity, will be stable at about 10%. New orders for the construction industry in 2015 had a value of more than €58 billion (+4%), the highest volume since 2000. The value of building permits (excluding civil engineering) was €67.6 billion (+6%).
2. Housebuilding
The sector clearly dominates German construction activity with an actual share of 60% of total construction output, with two thirds of the investment going into the existing housing stock and one third into new residential construction. The latter will be once again the driving sector, as it has been since 2010. Historically low mortgage rates, a labour force that continues to grow, combined with rising disposable income of private households and the sharply rising demand in urban areas for rented flats support the development. Demand is being boosted by the high number of refugees coming to Germany (estimated 1.1 million people in 2015). In 2016 the subsectors are going to show different developments. Only a slight growth is expected for single family houses, while high and still rising prices for developed properties will slow things down. On the other hand, flats in multi-family houses will push the market once again. Demand in urban areas is still high and will further be strengthened by the high number of refugees. Efforts will concentrate on reducing the costs of investment into residential buildings to allow for lower rents. Demand for new flats or houses in Germany is expected to be in a range of 350,000 to 400,000 due to the high number of refugees. With 260,000 completions in 2015 and about 290,000 this year, the demand will clearly not be met. Therefore the government has reacted to improve the framework for the market.Government payments to the Federal States for social housing programmes will be doubled to €1 billion from 2016 on. Another rise to €2 billion per year is under discussion. Parallel to that, depreciation allowances will be raised to 35% of the investment sum within the first three years for
the construction of new rental flats in areas with a high demand and limited construction costs. The measures will be effective at least until 2018 so prospects for the medium term future are positive. Parallel to that, efforts to upgrade the existing housing stock to meet demands for energy efficiency will grow slowly but steadily. Legal guidelines have once again been tightened at the beginning of 2016.
3. Non-residential buildings
The share of non-residential buildings in terms of total construction output was about 26% in 2015, the sub-sector itself largely dominated by private investors. Although the predictions for a real GDP growth in Germany of 1.8% in 2016 are still positive, private investors will remain hesitant with regards to external risks (oil price decline, economic development in China, ongoing turbulence in the Euro-zone). Building permits (estimated construction costs) for private investors only stagnated in 2015. New orders for the construction industry in this sub-sector showed a decline of about 2.5% last year. Investment was directed at new machinery and equipment rather than new industrial buildings. On the other hand, investment by German companies in other countries to explore markets remained at a high level.Permits for public investors rose by 6% in 2015, following a decline of 20% in 2014. The outlook for 2016 is positive. Orders in 2015 were up by 8%. Large sums will be spent on a local level to convert all kinds of buildings to refugee shelters. The effects of those plans have been seen since autumn 2015. Rising investment can also be expected for all kinds of educational buildings for the refugees.
4. Civil engineering
In 2015, the sector accounted for 14% of total construction output in Germany, compared to more than 20% in most other European countries. After a decline in real terms of 1.2% last year, an essential growth of nearly 3% is expected for 2016. Federal government announced an initiative last year. The investment into highways, waterways and the railway system will be expanded by €1.5 billion or 14% in 2016. The combined budget for these infrastructure works has a volume of more than €12 billion, which is nearly one third of all civil engineering production. The government plans to raise its spending to more than €13 billion up until 2018.
GERMANY
34
CO
NS
TRU
CTI
ON
AC
TIV
ITY
IN E
UR
OP
E -
ED
ITIO
N 2
016

INVESTMENT IN CONSTRUCTION
Housebuilding Non residential Civil Engineering Total Construction
2007 = 100
‘07
‘08
‘09
‘10
‘11
‘12
‘13
‘14
2015
a
2016
b
€ 3,026
BILLION 83,500,000
GDP 2015
POPULATION 2015
PER CENT VARIATION OF PRODUCTION IN REAL TERMS OF PREVIOUS YEAR
production Mln. €
fixed prices variation of production on previous year (%)
Sectors 2015a 2012 2013 2014 2015a 2016b
1. Building 225,850 1.2 -1.2 2.5 0.4 1.3
1.1. Housebuilding 157,750 3.4 -0.7 3.3 1.5 2.0
1.1.1. New 50,000 5.1 4.9 8.4 5.0 5.0
1.1.2. R&M 107,750 2.8 -2.9 1.2 0.0 0.6
1.2. Non residential 68,100 -3.3 -2.1 1.0 -2.2 -0.3
1.2.1. Private 57,150 -0.8 -2.4 1.7 -2.2 -0.4
1.2.2. Public 10,950 -14.0 -0.9 -2.9 -2.7 0.5
2. Civil Engineering 37,000 -3.5 -0.3 5.2 -1.2 2.7
(1 + 2) Total Construction 262,850 0.5 -1.1 2.9 0.2 1.5
a: estimate - b: forecast
NUMBER OF BUILDING PERMITS IN RESIDENTIAL CONSTRUCTION
2012 2013 2014 2015a 2016b
single dwelling 106,697 110,284 107,337 114,000 110,000
collective dwelling 105,939 126,990 138,687 145,500 160,000
other types of dwelling 28,454 35,159 39,055 42,500 44,000
Total 241,090 272,433 285,079 302,000 314,000
(Collective dwellings and other types of buildings: in number of flats)
120
115
110
105
100
95
90
GERMANY
90
95
100
105
110
115
120
35
CO
NS
TRU
CTI
ON
AC
TIV
ITY
IN E
UR
OP
E -
ED
ITIO
N 2
016
1. Overall construction activity
The Danish economy has experienced positive growth over the past 2 years. The upturn has been moderate, but it has been strong enough to create a clear improvement in the labour market with private sector employment rising without leading to labour-market bottlenecks. The improvement in the labour market and improving real wages - due to very low inflation, have in combination with rising housing prices and very low interest rates, strengthened the economic position of households and created a sound foundation for domestic demand. At the same time Danish exports are being supported by the weak euro and krone exchange rate.The objective of the current monetary policy is to keep the krone stable against the euro. Fiscal policy has been planned in order to support the Danish economy as much as possible in the wake of the economic crisis. Actual budget deficits are expected to comply with the 3% of GDP limit of the Stability and Growth Pact. Having been 1.2% in 2015, GDP growth is expected to be well over 1% in 2016. Low interest rates have led to many households converting their mortgages, shifting from mortgages with frequent interest rate adjustments to fixed-rate mortgages, thereby protecting themselves against future increases in interest rates. This has contributed to reducing the sensitivity to fluctuations in interest rates for both individual families and the Danish economy as a whole. Inflation is low due to the low level of oil prices and also idle resources remaining in the Danish economy. Low inflation is contributing to strengthening the purchasing power of consumers and is supporting private consumption. However, contrary to the period of overheating in the 2000´s there is currently no expectation of a strong increase in debt-financed consumer spending. For the past 2 years employment in the construction industry has been rising. In 2015 the average total employment was 7.7% higher than in 2013. New construction of dwellings and civil works increased. Rehabilitation and maintenance works were stimulated by political measures, i.e. rehabilitation works of dwellings with public grants and a special tax rule, i.e. deduction in tax for some of the labour costs associated with the repair of housing. The Danish Construction Association expects that employment will rise again in 2016 by well over 1%. The companies in construction reporting constraints on production due to a labour shortage has risen since the middle of 2014 after years of low activity and virtually no labour shortage, but the extent of the shortage is far lower than during the 2000´s. Wages were higher in 2015 than in 2014, but are still fairly moderate when seen with a historical perspective. 2. Housebuilding
The large drop in interest rates at the beginning of 2015 led to strong house-price increases in the major urban areas and the increase in long-term interest rates in H2 has not prevented further increases in housing prices. Prices of owner-occupied apartments are rising much more than prices of single-family houses. The development in the housing market is positive with increasing prices and turnover in large parts of the country. This
reflects an improvement in the economic situation of many families as a result of rising employment, income growth and low interest rates. The outlook for mortgage rates to remain low implies that they will not act as a brake on the growth in the housing market. For the forecast horizon further increases in housing prices are expected, albeit at a more muted pace than in 2015. Investment in housing is expected to pick up, especially driven by new construction, which has become more attractive as a result of increasing housing prices. Residential construction is rising. Total dwelling starts rose from 11,500 in 2013 to 14.000 in 2014 and 14,500 in 2015. This year we expect a rise to about 15,000 dwellings.The activity of renovation and maintenance works has been rising as a result of extraordinary events, especially political stimulus measures for major renovation works for dwellings, with public grants. However, in 2016 this activity will fall.A special tax rule for deduction in tax for labour costs associated with special repair works of private dwellings has been changed so the activity will now have a more minor effect than before 2016. The progress in the labour market and rising housing equity is increasing the confidence of many property owners and consequently also their propensity to demand more renovation and maintenance works. We expect that the total employment in renovation and maintenance works will rise by about 3% in 2016 compared with only 1% in 2015.
3. Non-residential buildings
Business investments in non-residential buildings have been reduced to a very low level due to the economic crisis and the fact that years ago during the economic upturn Denmark had large investments in new construction, so now there is a large stock of empty commercial buildings. In 2016, we expect that both the level of starts of new buildings (buildings for distributive and pro¬fes¬sional traders and for administration as well as for factories and workshops) and the level of renovation works of existing buildings will be at about the same level as in 2015. Concerning starts of agricultural construction we expect the same low level this year as last year. An increasing part of the activity of new non-residential construction is investment in buildings for institutional and educational use, especially new universities and new hospitals.
4. Civil engineering
In 2015, activity t civil engineering activity rose due to many large projects, especially in traffic infrastructure. However, this year we expect a minor decrease in the activity of civil works. The Danish Parliament has agreed on a number of initiatives as part of a green transport policy. The political agreement states that most of the traffic growth must be absorbed by public transport. There are a large number of projects and infrastructure investments. For instance there are large investments in a new Metro Line in Copenhagen, investments in a new line in the TEN priority corridor between Copenhagen and Ringsted and investments in the European Rail Traffic Management System.
DENMARK
36
CO
NS
TRU
CTI
ON
AC
TIV
ITY
IN E
UR
OP
E -
ED
ITIO
N 2
016

INVESTMENT IN CONSTRUCTION
Housebuilding Non residential Civil Engineering Total Construction
2007 = 100
‘07
‘08
‘09
‘10
‘11
‘12
‘13
‘14
2015
a
2016
b
€ 267
BILLION 5,674,000
GDP 2015
POPULATION 2015
PER CENT VARIATION OF PRODUCTION IN REAL TERMS OF PREVIOUS YEAR
production Mln. €
fixed prices variation of production on previous year (%)
Sectors 2015a 2012 2013 2014 2015a 2016b
1. Building 14,678 -3.0 -2.2 3.6 0.2 2.9
1.1. Housebuilding 8,961 -5.1 -2.9 3.7 0.6 3.1
1.1.1. New 1,930 -19.1 -11.1 -2.2 0.6 3.8
1.1.2. R&M 7,031 0.8 -0.2 5.4 0.6 3.0
1.2. Non residential 5,717 0.6 -1.0 3.4 -0.5 2.7
1.2.1. Private 2,552 -12.9 -3.0 0.1 -5.6 0.8
1.2.2. Public 3,165 18.6 0.9 6.6 4.1 4.1
2. Civil Engineering 7,155 4.9 2.2 -2.4 5.1 -2.7
(1 + 2) Total Construction 21,833 -0.6 -0.7 1.6 1.7 1.1
a: estimate - b: forecast
NUMBER OF BUILDING PERMITS IN RESIDENTIAL CONSTRUCTION
2012 2013 2014 2015a 2016b
Detached one-family houses 3,673 3,780 3,977 4,667 NA
Other one-family houses (rowhouses) 1,948 1,726 2,480 2,817 NA
Flats in multi-family houses etc. 6,676 5,933 8,633 9,617 NA
Total 12,297 11,439 15,090 17,101 NA
DENMARK
60
70
80
90
100
110
120120
110
100
90
80
70
60
37
CO
NS
TRU
CTI
ON
AC
TIV
ITY
IN E
UR
OP
E -
ED
ITIO
N 2
016

ESTONIA
PL
© P
hoto
grap
hee.
eu -
Foto
lia.c
om
38
CO
NS
TRU
CTI
ON
AC
TIV
ITY
IN E
UR
OP
E -
ED
ITIO
N 2
016
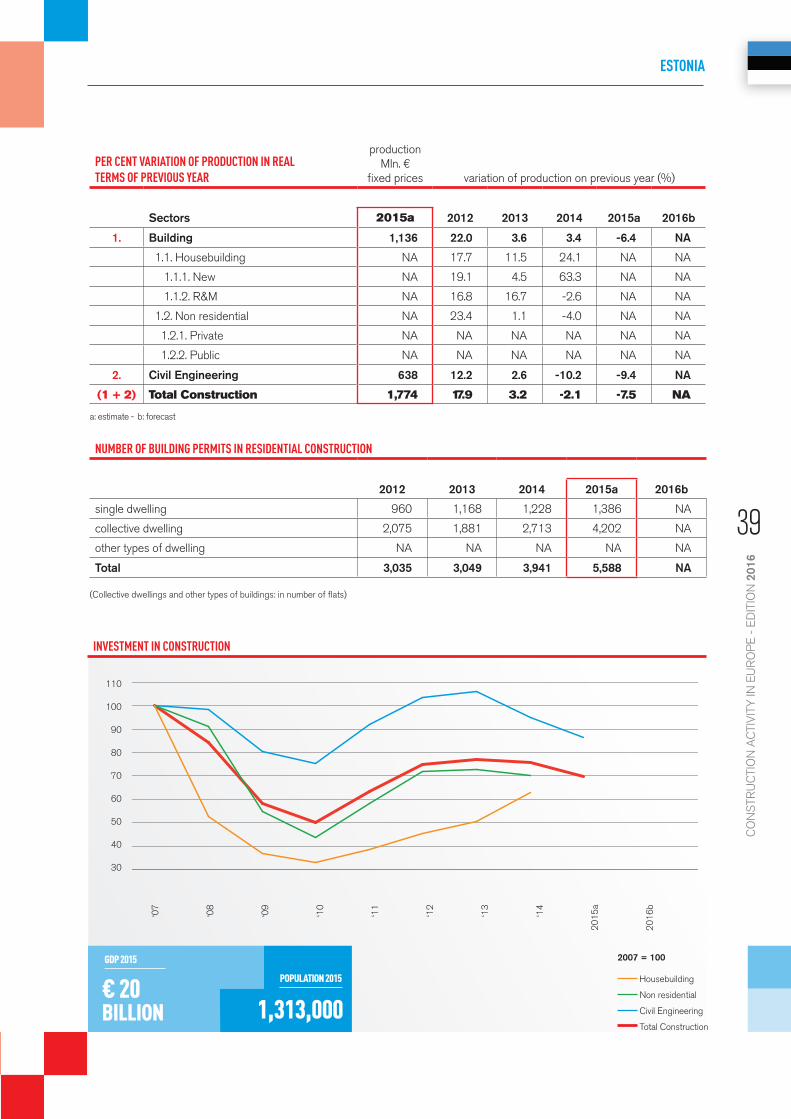
INVESTMENT IN CONSTRUCTION
Housebuilding Non residential Civil Engineering Total Construction
2007 = 100
‘07
‘08
‘09
‘10
‘11
‘12
‘13
‘14
2015
a
2016
b
€ 20
BILLION 1,313,000
GDP 2015
POPULATION 2015
PER CENT VARIATION OF PRODUCTION IN REAL TERMS OF PREVIOUS YEAR
production Mln. €
fixed prices variation of production on previous year (%)
Sectors 2015a 2012 2013 2014 2015a 2016b
1. Building 1,136 22.0 3.6 3.4 -6.4 NA
1.1. Housebuilding NA 17.7 11.5 24.1 NA NA
1.1.1. New NA 19.1 4.5 63.3 NA NA
1.1.2. R&M NA 16.8 16.7 -2.6 NA NA
1.2. Non residential NA 23.4 1.1 -4.0 NA NA
1.2.1. Private NA NA NA NA NA NA
1.2.2. Public NA NA NA NA NA NA
2. Civil Engineering 638 12.2 2.6 -10.2 -9.4 NA
(1 + 2) Total Construction 1,774 17.9 3.2 -2.1 -7.5 NA
a: estimate - b: forecast
NUMBER OF BUILDING PERMITS IN RESIDENTIAL CONSTRUCTION
2012 2013 2014 2015a 2016b
single dwelling 960 1,168 1,228 1,386 NA
collective dwelling 2,075 1,881 2,713 4,202 NA
other types of dwelling NA NA NA NA NA
Total 3,035 3,049 3,941 5,588 NA
(Collective dwellings and other types of buildings: in number of flats)
ESTONIA
110
100
90
80
70
60
50
40
3030
40
50
60
70
80
90
100
110
39
CO
NS
TRU
CTI
ON
AC
TIV
ITY
IN E
UR
OP
E -
ED
ITIO
N 2
016
1. Overall construction activity
The Spanish economy consolidated its recovery as 2015 progressed, reaching an average growth of 3.2%. This growth rate was supported by the falling oil prices, the gradual improvement in European demand and the monetary policy of the European Central Bank, which in turn facilitated a favourable framework for the Euro exchange rate, interest rates and liquidity. Also, structural reforms undertaken in Spain have had a positive effect, and household consumption and business investment have contributed to that growth as well. Among the most remarkable features, it is worth mentioning the gradual recovery of the real estate market, the continuation of the improvement in the labour market and the private deleveraging. Additionally, it is also worth noting the improvement of investment in construction although the starting point was at a very low level. The number of jobs created throughout last year was 525,000 people, an increase higher than 3% in relation to 2014. However, accumulated job destruction is still more than 2.66 million people, and 1 million of those were in the construction sector. The crisis in the Spanish economy throughout recent years has led to a rise in the unemployment rate, from the 8% recorded in 2007 to 27% in early 2013, easing to 20.9% at the end of 2015.The consensus amongst analysts anticipates a moderate growth rate for 2016, although they warn about the persistence of a substantial vulnerability due to the high levels of debt, the difficulties of reducing the public deficit, and in addition there is concern about the political stability in the country.The factors supporting the above projection are improved consumption and investment levels, sustained by a continuing increase in exports (aided by the recovery of competitiveness). In the case of public investment, a similar volume with respect to the previous year is expected. Meanwhile, private investment spending, in a scenario in which financial conditions are still favourable, is expected to rise more intensely. Taking into account SEOPAN estimates, the construction sector reached a production volume of €101.4 billion in 2015, a growth rate higher than 5.5% in comparison with 2014. In terms of added value, a significant loss of weight is confirmed, from its peak of 10.4% of GDP in 2006, and in spite of 0.2% recovered last year, to currently 5.2% of GDP, in line with the European average.Within the recent evolution in the construction industry trend, it is worth highlighting the progressive improvement in housing demand, the continued strength of export activity and the significant recovery of employment. The increase in activity in 2015 stems from the rise in residential building and, to a lesser extent, to the activity in non-residential building. With regard to the recovery in civil engineering, it is attributable to the dynamic in a context of regional elections. Forecasts for 2016 anticipate that the growth in construction
investment will be moderate, underpinned by further progress in the housing segment and slower growth in other buildings, but hampered by the stagnation in civil engineering works.
2. Housebuilding
In 2006 the number of dwelling starts reached its peak; throughout 2007 a change in the demand cycle was confirmed, which became more pronounced in later years, declining to 34,000 in 2013 and 2014. During last year a slight recovery was noticed, with the number increasing up to 45,000. Despite the timid increase in 2015, residential investment accumulates closed with a 50% decrease, which has led to a reduction in its contribution to GDP of almost 7.6% and sets it at 4.5%, lower than the European average. With regard to the real estate market, it improved throughout 2015 and a rise in prices in regions with a more dynamic demand and less stock was perceived.Activity in 2015 grew by 7% in 2015. Forecasts for 2016 show a similar rise. The demand is expected to slowly progress although it is still far from the potential level. With respect to the rehabilitation and maintenance segment, the weakness of previous years is encouraging families to increase their spending, supported by improving household income and confidence levels, which are expected to continue in the current year.
3. Non-residential buildings
An improved business activity casts a more positive outlook. In contrast, public activity will register a drop again.
4. Civil engineering
The civil engineering segment experienced a 3% increase in 2014, the first positive result after 5 years of intense adjustment. This growth was based on the electoral cycle, the loosening of the fiscal consolidation process and an improvement in the financial framework. Nevertheless forecasts for 2016 show stagnation or a slight fall in activity.
SPAIN
40
CO
NS
TRU
CTI
ON
AC
TIV
ITY
IN E
UR
OP
E -
ED
ITIO
N 2
016

INVESTMENT IN CONSTRUCTION
Housebuilding Non residential Civil Engineering Total Construction
2007 = 100
‘07
‘08
‘09
‘10
‘11
‘12
‘13
‘14
2015
a
2016
b
€ 1,081BILLION 46,423,000
GDP 2015
POPULATION 2015
PER CENT VARIATION OF PRODUCTION IN REAL TERMS OF PREVIOUS YEAR
production Mln. €
fixed prices variation of production on previous year (%)
Sectors 2015a 2012 2013 2014 2015a 2016b
1. Building 90,336 -5.2 -5.3 -0.7 6.3 5.7
1.1. Housebuilding 56,255 -6.2 -5.6 -1.1 7.6 6.7
1.1.1. New 33,970 -7.5 -7.0 -1.5 6.5 6.5
1.1.2. R&M 22,285 -4.0 -3.4 -0.4 9.4 6.9
1.2. Non residential 34,080 -3.7 -4.6 -0.1 4.1 4.2
1.2.1. Private 27,483 -0.4 0.1 0.9 4.9 7.3
1.2.2. Public 6,598 -12.5 -19.1 -3.6 0.8 -8.8
2. Civil Engineering 21,153 -24.0 -23.0 -5.5 3.0 0.0
(1 + 2) Total Construction 111,488 -10.5 -9.5 -1.7 5.6 4.6
a: estimate - b: forecast
NUMBER OF BUILDING PERMITS IN RESIDENTIAL CONSTRUCTION
2012 2013 2014 2015a 2016b
single dwelling 18,223 14,231 13,352 13,619 14,709
collective dwelling 39,263 16,982 20,291 20,088 21,896
other types of dwelling 57 23 0 6 10
Total 57,543 31,236 33,643 33,713 36,615
(Collective dwellings and other types of buildings: in number of flats)
110
100
90
80
70
60
50
40
SPAIN
40
50
60
70
80
90
100
110
41
CO
NS
TRU
CTI
ON
AC
TIV
ITY
IN E
UR
OP
E -
ED
ITIO
N 2
016
1. Overall construction activity
In 2015, total construction volume is expected to decrease for the fourth consecutive year by 1%. New residential construction volume will continue to decline. New non-res-idential construction is also ex-pected to decrease for the year 2015. Investments in civil engineering are expected to decrease mod-estly. As in previous years, the poor economic environment in general has meant that building renova-tion is the only sector that will have a steady growth among all construction sectors.In 2016 total construction output will finally grow by 2.5%. New residential construction is expected to increase by 5 per cent. Also the volume of new non-residential construc-tion will grow. The growth rate of housebuilding renovations is expected to slow down modestly, increasing by 4%. The volume of civil engineering will stay at the previous year’s level in 2016.Employment in construction averaged 168,500 people at the end of 2015 according to The Labour Force Survey. Em-ployment recovered as construction volumes started to pick up at the end of 2015. In 2015 the average unemployment rate in the construction sector was 10.2% which is lower than in the previous year (10.5%). The employment outlook in the sector for 2016 is improving. We expect the average employment in 2016 to be 171,000 people.
2. Housebuilding
Residential start-ups are expected to amount to 28,500 in 2015. The level of starts is increasing by the active demand by housing funds. Low interest rates are making housing investments attractive. But the market is starting to have a focus as the demand is heavily projected towards small apartments, especially near public transportation. Consum-er demand was still weak as the unemployment rate rose during the year.In February, we estimated that there will be 29,000 housing starts in 2016. Consumer demand is ex-pected to increase a little bit despite high unemployment during 2016. Therefore, start-ups are ex-pected to increase modestly in 2016.During 2015, banks in Finland offered interest only options for old mortgage loans. Quite a lot of households took this option and therefore the stock of loans started to increase. Also new mortgage loans in 2015 started to increase from previous years. This is a promising sign for the housing market for 2016 even though the economic outlook is still uncertain. The households’ debt ratio was 122% in 2014.The prices of old dwellings have continued to slow down. During 2015 the price movement was nega-tive in every residential type. Large apartments are harder to sell in uncertain times. There are some signs that the housing chain is starting to move. Transaction volumes, especially in single family apartments, have increased. The price gap is also widening between the Helsinki region and other parts of Finland. Urbanisation will continue in the coming years. It is at a low level in Finland compared to other countries.
Residential repair, maintenance and improvement work is increasing steadily. In 2015 the sector was still active as the government stimulated the renovation of residential buildings in 2014. We expect that the growth rate of repair and main-tenance will slightly decelerate in 2016.
3. Non-residential buildings
New non-residential construction decreased in 2015. Non-residential construction is still suffering from the uncer-tain economic outlook which adversely affected investment decisions in previous years.The construction of commercial and office buildings is ex-pected to grow in 2016. The brighter outlook is due to some large mall investments especially in the Helsinki region. Hotel investments are also picking up. While the digitalisation reforms affect especially the commercial sector, there is still a de-mand for high quality commercial and office buildings in attractive locations. The population change in the biggest cities is ensuring that demand will increase.The brighter outlook in the non-residential sector at the end of 2015 was in the construction of public buildings. In many towns hospitals are under construction as well as schools, which are being both newly constructed and renovated. The construction of industrial buildings is also starting to increase partly due to single investments by the forestry industry. Also investments in the energy sector and information sector, namely data centres, are supporting the construction of warehouse buildings.The outlook for non-residential construction overall in 2016 is bright. We expect the volume of non-residential construc-tion to increase by 2% in the next year. However, if invest-ment does not pick up widely during 2016, the growth in this sector could be temporary.
4. Civil engineering
The civil engineering sector declined in 2015. Even though there are ongoing big infrastructure pro-jects,public finance set constraints for the whole civil engineering sector. The outlook for civil en¬gi¬neer¬ing for 2016 is not bright either. New investments are very low as the government’s austerity pro-gramme is cutting availablefinance. The government agreed a three year finance package for the maintenance of roads. This is helping the sector but only partly. The lack of long-term planning is the greatest source of uncertainty in the civil engineering sector. We expect that the level of civil engineer-ing works will stay at the previous year’s level in 2016.
FINLAND
42
CO
NS
TRU
CTI
ON
AC
TIV
ITY
IN E
UR
OP
E -
ED
ITIO
N 2
016

INVESTMENT IN CONSTRUCTION
Housebuilding Non residential Civil Engineering Total Construction
2007 = 100
‘07
‘08
‘09
‘10
‘11
‘12
‘13
‘14
2015
a
2016
b
€ 206
BILLION 5,487,000
GDP 2015
POPULATION 2015
PER CENT VARIATION OF PRODUCTION IN REAL TERMS OF PREVIOUS YEAR
production Mln. €
fixed prices variation of production on previous year (%)
Sectors 2015a 2012 2013 2014 2015a 2016b
1. Building 18,718 -5.9 -4.7 -4.1 -0.9 3.4
1.1. Housebuilding 10,864 -3.6 -3.3 -5.6 1.8 4.4
1.1.1. New 4,454 -9.6 -9.6 -11.6 -3.0 5.0
1.1.2. R&M 6,410 3.1 2.8 -0.6 5.5 4.0
1.2. Non residential 7,853 -9.6 -6.5 -2.3 -0.9 2.0
1.2.1. Private 4,995 -10.9 -14.6 -3.0 -1.5 2.5
1.2.2. Public 2,858 -6.1 4.7 3.0 3.5 1.0
2. Civil Engineering 6,903 -0.2 1.4 -2.2 -1.0 0.0
(1 + 2) Total Construction 25,621 -4.5 -3.2 -3.6 -1.0 2.5
a: estimate - b: forecast
NUMBER OF BUILDING PERMITS IN RESIDENTIAL CONSTRUCTION
2012 2013 2014 2015a 2016b
single dwelling 10,200 7,900 7,000 6,200 6,200
collective dwelling 21,600 18,700 22,000 23,000 23,000
other types of dwelling 1,100 200 400 300 300
Total 32,900 26,800 29,400 29,500 29,500
(Collective dwellings and other types of buildings: in number of flats)
110
100
90
80
70
FINLAND
70
80
90
100
110
43
CO
NS
TRU
CTI
ON
AC
TIV
ITY
IN E
UR
OP
E -
ED
ITIO
N 2
016

1. Overall construction activity
In France in 2015, the construction industry faced a sharp decline in activity by 3.3% in volume terms. Thus, it appears to be the seventh year of a drop in activity since the beginning of the Great Recession in 2007-2008, with the exception of the rebound in 2011. In 2016, the construction industry’s activity should stabilise. Thus, the lowest level should have been reached in 2015, corresponding to a global loss of activity by 21.6% in volume terms since 2007. However, growth for the construction industry is expected only in 2017.
Concerning employment, almost 45,000 jobs were lost in 2015, but the drop was slower in the second half of the year due to the recovery of temporary jobs. In 2016, another 8,000 jobs will be destroyed, with opposite trends between salaried jobs (-17,000) and temporary jobs (+9,000).
2. Housebuilding
Housebuilding activity continued to decline in 2015 (-3.9% in volume terms), but the fall was lower than 2014 (-11.5% in volume terms). The number of housing starts, at the same level as 2014, remained disappointing.
Considering the usual time to complete building constructions and a sharp increase in housing starts (+10%), production should rise by 5.5% in volume terms in 2016. Concerning housing starts, almost 380,000 units should be started, related to the increase in permits (+13.6%). However, this level remains 18,000 units below the average observed since 2000.
This upturn could be explained by various positive factors:- a sharp recovery in new housing sales in 2015;- the strengthening of the Zero rate loan (PTZ) which
should allow 35,000 additional households to buy a new house;
- credit conditions still advantageous with interest rates remaining at a very low level;
- finally, the improvement of consumer confidence, which will reach the level observed before the crisis.
Concerning housing renovation and maintenance, this market faced sluggish activity in 2015. It fell slightly by 0.2% in volume terms after falling by -0.9% in 2014. Despite the new tax credit for energy renovation (CITE), the beneficial effects of which are obvious, and an attractive VAT reduced rate (5.5%), growth in “green” construction works’ was weaker than expected, mainly because of low energy prices.In 2016, a rise of 1% in volume terms is expected for the whole of housebuilding. Three factors could have a positive impact:- The extension of both CITE and 5.5% VAT reduced rate
for energy renovation to similar conditions as in 2015. Renovation works should increase marginally, but no
more, considering the low energy prices;- The significant rise of housing transactions in 2015
(+10%), which usually lead to additional work during the two years following the purchase;
- And the extension throughout the French territory of the Zero-rate loan (PTZ) to the purchase of existing housing with significant renovation work required.
3. Non-residential buildings
The new non-residential buildings market fell by 11.3% in 2015, following a decrease of 6.3% in 2014. All market segments were part of this reduction which was higher for the public sector (-16.8%) than the private sector (-6.8%). Building starts, excluding agricultural buildings, declined by 7.3% and reached a new lowest level with 16.9 million m² of floor area.
In 2016, the global output of non-residential buildings construction (including agricultural buildings) should decline again by 5.3% in volume, at the same time as a new fall in construction starts, excluding agricultural buildings. Indeed, the expected rise of permits, which reflects the evolution of the macroeconomic situation, including business investment, should positively impact construction starts in H2, at best. More specifically, the activity should remain bearish for all market segments, excluding agricultural buildings.
As for new construction, the renovation and maintenance of non-residential buildings should further decrease (-0.5% in volume terms).
4. Civil engineering
After a 7% decline in 2014, public works output growth momentum is now at its weakest since 1985. Civil engineering turnover fell by 8% (in nominal terms) to €36.4 billion. The sector has been deeply affected by successive expected factors (municipal post-elections and departmental elections) and extraordinary measures (a €11 billion drop in State grants to local governments from 2015 to 2017, an administrative and territorial reform …), which triggered a significant decline in public investment.
In 2016, risks to the outlook willcontinue towards the downside. Consequently, civil engineering turnover is projected to slow down, decreasing by 3% (in nominal terms) to €35.3 billion.In 2014, overseas public works turnover amounted to €26.6 billion - a record 8% increase (in nominal terms) year-on-year. French public works exports to the rest of Europe rose by 13%. The value of overseas contracts to South America and to the Middle East surged by 22 % and 55% respectively. French companies are increasingly targeting new markets, especially emerging markets.
FRANCE
44
CO
NS
TRU
CTI
ON
AC
TIV
ITY
IN E
UR
OP
E -
ED
ITIO
N 2
016

INVESTMENT IN CONSTRUCTION
Housebuilding Non residential Civil Engineering Total Construction
2007 = 100
‘07
‘08
‘09
‘10
‘11
‘12
‘13
‘14
2015
a
2016
b
€ 2,160
BILLION 66,319,000
GDP 2015
POPULATION 2015
PER CENT VARIATION OF PRODUCTION IN REAL TERMS OF PREVIOUS YEAR
production Mln. €
fixed prices variation of production on previous year (%)
Sectors 2015a 2012 2013 2014 2015a 2016b
1. Building 117,637 -1.4 -2.3 -4.8 -3.0 0.9
1.1. Housebuilding 71,565 -2.0 -2.4 -5.9 -1.8 3.0
1.1.1. New 31,135 -3.4 -3.5 -11.5 -3.9 5.5
1.1.2. R&M 40,430 -0.7 -1.3 -0.9 -0.2 1.0
1.2. Non residential 46,071 -0.5 -2.1 -3.1 -4.7 -2.3
1.2.1. Private 24,345 -0.8 -2.0 -2.6 -3.0 -1.6
1.2.2. Public 21,727 -0.2 -2.3 -3.7 -6.5 -3.1
2. Civil Engineering 35,185 -2.6 3.8 -6.0 -4.5 -3.0
(1 + 2) Total Construction 152,822 -1.7 -0.9 -5.1 -3.3 0.0
a: estimate - b: forecast
NUMBER OF BUILDING PERMITS IN RESIDENTIAL CONSTRUCTION
2012 2013 2014 2015a 2016b
single dwelling 230,131 200,285 170,855 177,387 204,407
collective dwelling 249,169 219,615 202,345 201,630 226,086
other types of dwelling NA NA NA NA NA
Total 479,300 419,900 373,200 379,017 430,493
(Collective dwellings and other types of buildings: in number of flats)
105
100
95
90
85
80
75
70
FRANCE
70
75
80
85
90
95
100
105
45
CO
NS
TRU
CTI
ON
AC
TIV
ITY
IN E
UR
OP
E -
ED
ITIO
N 2
016

1. Overall construction activity
Greece’s economy slipped back into recession in the latter part of 2015 after growing in Q1 to Q3 2014 and H1 2015. The country has been in recession for 7 consecutive years. Its annual GDP decreased by a further 0.87% in 2015, mak-ing a total decrease of 27% since the 2008 peak. 2015 was a year characterised by 2 general elections, “Grexit” fears, tense bailout negotiations, capital controls and recapitalis-ing of the banking system. While the economy fared better than initially expected, 2016 is off to a bumpy start and growth is projected to gain some momentum in H2 2016 as confidence is expected to strengthen and as structural reforms are anticipated to take place and boost exports and investment. For 2016 a mild annual recession of -0.7% is expected, the eighth year of recession in a row. In order for the country to stabilise its economy and reach the antici-pated growth of about 2.7% in 2017, it is crucial that the triple crisis the country faces, - financial, political and migrant crises - are dealt with decisively. This includes meeting the fiscal targets in order to contain debt, further relief of the huge public debt by international creditors, strengthening tax administration, reducing non-performing loans and lifting capital controls that would ease financial constraints and subsequently open a path for growth. Product market reforms would improve competitiveness and create jobs and public administration reforms would reduce the regulatory burden. Inflation remains low due to the very depressed state of the economy. Unemployment is expected to decline, but only gradually.
The never-ending financial crisis nightmare has dramatically shrunk all sectors of the economy, including the construction sector, where the construction of buildings industry has prac-tically been wiped out.Investments in order to initiate growth in the economy are needed more than ever and aligned with this need is the effort of the government to “inflate” the economy by pushing the utilisation of existing fund lines into new projects. In this context, several new significant civil engineering projects have been planned and their inception is expected to assist the initiation of economic growth.
In 2015 the relevant cost of construction materials dropped by 3.2%, while the cost of labour fell significantly (-9.6%).The production index for overall construction decreased by a further -15% in 2015, or -76% from its peak at 2007. The situation in the building sector is dramatic, where decreases of 27% from last year and 95% from the 2007 peak have practically eradicated the whole sector. In civil engineering projects the decrease –was 12% from last year and 22% from the 2007 peak.The general unemployment rate seems to have stabilised at a very high level of 24.9%, giving a sign of a slight recovery from 26.5% last year. The unemployment rate in young peo-ple (up to 24 years old) is at the extremely high level of 54%.
2. Housebuilding
The present situation in the housebuilding sector is charac-terised by housing oversupply, crisis-driven lack of demand in the market, plunging housing prices, capital controls and a corresponding lack of access to mortgages. All these factors are being reflected in housebuilding statistics, and the inevi-table halt of any new housebuilding projects. The production index of buildings decreased by 27% compared to 2014 and 95% from 2007. The number of permits decreased by 1% compared to 2014 and by 77% compared to 2009.
3. Non-residential buildings
The non-residential buildings sector is closely influenced by the overall economic activity and consequently has followed the same path. Despite the fact that there are no formal national statistics available this year for the sector, it is expected to be analogous to the significant drop seen in the housebuilding sector.
4. Civil engineering
This sector, consisting mainly of public investment and joint EU projects, showed a significant drop in figures. The sec-tor’s index decreased by -12% compared to 2014, or -22% compared to the 2007 peak. This reflects the liquidity prob-lem of the state, the overall economic problems mentioned earlier and the consecutive public spending cuts, due to the austerity measures. These figures are very low compared to earlier years and more investment in civil engineering projects is required, in order to build sustainable growth.For 2016, the sector’s figures are expected to decline fur-ther due to cuts in public spending and delays in EU funding of new infrastructure projects.
GREECE
46
CO
NS
TRU
CTI
ON
AC
TIV
ITY
IN E
UR
OP
E -
ED
ITIO
N 2
016

INVESTMENT IN CONSTRUCTION
2007 = 100
‘07
‘08
‘09
‘10
‘11
‘12
‘13
‘14
2015
a
2016
b
Building Civil Engineering Total Construction
€ 176
BILLION 10,858,000
GDP 2015
POPULATION 2015
PER CENT VARIATION OF PRODUCTION IN REAL TERMS OF PREVIOUS YEAR
production Mln. €
fixed prices variation of production on previous year (%)
Sectors 2015a 2012 2013 2014 2015a 2016b
1. Building 1,396 -38.0 -31.1 -53.3 -26.9 NA
1.1. Housebuilding NA NA NA NA NA NA
1.1.1. New NA NA NA NA NA NA
1.1.2. R&M NA NA NA NA NA NA
1.2. Non residential NA NA NA NA NA NA
1.2.1. Private NA NA NA NA NA NA
1.2.2. Public NA NA NA NA NA NA
2. Civil Engineering 6,724 12.8 -5.9 1.3 -12.1 NA
(1 + 2) Total Construction 8,120 -16.3 -16.7 -17.9 -15.1 -17.0
a: estimate - b: forecast
NUMBER OF BUILDING PERMITS IN RESIDENTIAL CONSTRUCTION
2012 2013 2014 2015a 2016b
single dwelling NA NA NA NA NA
collective dwelling NA NA NA NA NA
other types of dwelling NA NA NA NA NA
Total 22,627 16,384 13,383 13,257 NA
(Collective dwellings and other types of buildings: in number of flats)
140
120
100
80
60
40
20
0
GREECE
0
20
40
60
80
100
120
140
47
CO
NS
TRU
CTI
ON
AC
TIV
ITY
IN E
UR
OP
E -
ED
ITIO
N 2
016

1. Overall construction activity
The output of the economy grew by 2.9% in 2015 and the value of gross domestic product amounted to Forint 33,711 billion at current prices. The 2.9% growth of the gross domestic product in 2015 was due primarily to the engineering industry and the service sector, in particular commerce and tourism.
On the production side the gross value of the industry increased by 6.3%, the construction industry by 2.9%, the service sector by 2.8 % but agriculture decreased by 12.9% in 2015.
Household consumption increased by 2.6% and community consumption increased by 0.6%. As a result, final consumption was up 2.3%. Gross fixed capital formation and gross capital formation improved by 1.9% and 0.5%, respectively. Domestic consumption increased by 1.9%. The growth of exports was 8.4% and imports, 7.8 %.
In 2015 the annual average number of employees was 4,260,000, i.e. 159,000 higher than in 2014. The rate of employment of people aged 15-64 was 63.9% on average in 2015, i.e. 2.1% higher compared to the previous year.
In 2015 construction of both buildings and other structures showed an increase of 4.3% and 1% respectively, and construction companies concluded new contracts, the volume of which was 7.3% lower than a year earlier. The whole construction industry implemented construction-assembly works of HUF 2,172 Billion (approximately € 6.9 Billion) at current prices, the volume of which was 3% higher than in 2014.
In 2015, prices in the construction industry were 2.5% higher on average than in the previous year.
At the end of December 2015 there were 89,093 construction organisations registered in the sector, including private entrepreneurs, which is 3,296 less than in late 2014. The number of existing undertakings included in the above figure is around 82,000. The number of construction undertakings registered by the Hungarian Chamber of Commerce and Industry was 58,000 at the end of 2015.
According to the population employment data of KSH [Central Statistical Office of Hungary], the current number of employees is 276,700, representing 6.5% of the total number of employees in the whole national economy. The 2015 acceleration was primarily the result of public works – dominated by road and railway construction, other infrastructure, sporting facilities and health care projects – implemented from EU funds. The earnings of companies engaged in this subsector considerably increased. The market for companies engaged in private works stagnated.
Home renovation and building is at a historically low level and housing companies had lost 80% of their market by the beginning of 2015, compared to 2006.
The volume of orders at the end of 2015 and the number of new contracts were 48% less than they were one year earlier. The estimated output of the Hungarian Construction Industry will be approximately HUF 1,800 in 2016 (approx. € 5.8 Billion).
2. Housebuilding
In 2015, 7,612 new homes were built in the country, i.e. 8.9% less than the previous year. Although this decline is compared to a very low base level. In order to sustain the value of the national property assets 30-40 thousand new dwellings need to be constructed annually.
The proportion of dwellings built by private investors increased and that of homes built by real estate investors decreased in 2015.
Since the 2008 downturn in home-building, from year to year less and less new homes have been constructed. In 2015 the number of newly built homes was only 1/5 of that in 2008. The number of building permits for residential construction was 12,515 in 2015, which is 29.9% higher than a year earlier.
The proportion of new family homes within the newly built residential buildings showed a decrease from 57% to 56% and multi-storey condominium buildings decreased from 39% to 35%. The proportion of homes in residential parks increased from 1% to 7%.
The average floor space of the dwellings that were completed in 2015 was 101m² and this value is practically the same that it was a year earlier.
HUNGARY
48
CO
NS
TRU
CTI
ON
AC
TIV
ITY
IN E
UR
OP
E -
ED
ITIO
N 2
016

€ 109
BILLION 9,855,000
GDP 2015
POPULATION 2015
NUMBER OF BUILDING PERMITS IN RESIDENTIAL CONSTRUCTION
2012 2013 2014 2015a 2016b
single dwelling 5,019 3,654 4,133 5,153 NA
collective dwelling NA NA NA NA NA
other types of dwelling NA NA NA NA NA
Total 10,600 7,536 9,633 12,515 NA
(Collective dwellings and other types of buildings: in number of flats)
HUNGARY
FR ©
Aur
emar
- Fo
tolia
.com
49
CO
NS
TRU
CTI
ON
AC
TIV
ITY
IN E
UR
OP
E -
ED
ITIO
N 2
016

1. Overall construction activity
The value of output in building and construction is estimated to have increased by 14% in current prices in the year to December 2015. Construction output is estimated to have reached a value of €12.5 billion or 7.5% of Gross National Product (GNP) in 2015. According to DKM Economic Consultants (2012), if compared to the size of the construction industry in other countries and long term trends in terms of Irish construction output as a percentage of GNP, an economy the size of Ireland should be capable of sustaining a construction industry equivalent to around 12% of GNP (10% of GDP) over the medium-term, without the negative repercussions associated with periods of rapid growth. This would result in an industry of around €15 billion and the corresponding employment level is likely to be closer to 170,000.Regrettably, the construction sector has been one of the largest contributors to growth in unemployment. The total number of people unemployed in Ireland as of December 2015 was 321,000 compared to 156,000 people in December 2007. However, direct construction employment rose to almost 127,000 in the Q4 2015. This figure was up from 102,600 in Q4 2012.
2. Housebuilding
A total of 12,666 housing units were completed in 2015. While residential construction activity appears to be slowly picking up in the principal urban centres, demand continues to far outstrip supply, which in turn is putting upward pressure on prices and rents. Figures from the Central Statistics Office indicate that Ireland’s population will continue to grow from 2016 to 2031. Growth is forecasted at between 320,000 and 630,000. In particular, the greater Dublin area will see the largest proportionate growth, with projections of population increases of between 249,000 and 402,000, indicating a rate of growth of 20,000 per annum. The national Housing Agency published a report in April 2014 predicting that the requirement for new housing in urban settlements nationally ranged from 9,526 units in 2014 to 20,853 units in 2018. Within the Dublin region, the figures showed an immediate supply requirement of 5,663 units in 2014, which will rise to an annual requirement of 8,970 units in 2018. However, just 2,891 units were completed in Dublin in 2015 representing a drop of -11.5% year on year. 3. Non-residential buildings
With an expected output of €3.5 billion over the two year period 2015-2016 a strong recovery is anticipated in the coming years. This sector includes the areas of industrial, commercial, tourism and agricultural building investment, with industrial and commercial building projects expected to account for up to 90% of the investment, with 60% and 30% respectively. Activity is forecast to pick up considerably in
2016, with €2.1 billion of investment expected. In relation to the office market, evidence of non-NAMA (National Asset Management Agency) schemes under construction or at planning stage indicate construction of approximately 132,000 m² of office space in Dublin across the period 2015-2017/18. There is also an increased level of demand for Greenfield sites in the industrial and manufacturing sectors, and the IDA (Ireland’s inward investment promotion agency) intends to upgrade its regional business parks as well as building new advanced technology units with a fund of €150 million.Significant opportunities for the construction sector are also being generated by the Foreign Direct Investment (FDI) sector, with the expansion of existing FDI companies and the relocation of new companies to the Irish market expected to have an impact on the sector in 2016 following an increased level of investment seen in 2015.
4. Civil engineering
Public sector spending allocations are indicated in the Government’s Capital Spending Plan (Building for Recovery 2016-2021). The Building for Recovery 2016-2021 plan allocated a total spend of €27 billion. Of this, there will be a €9.6 billion capital envelope for transport provided over seven years. This will include €6 billion for investment in the national, regional and local road network and €3.6 billion in Public Transport. The Capital Plan provides €3.8 billion in direct Exchequer funding for investment in primary, secondary and third level education facilities, combining the upgrade and extension of existing educational infrastructure and the provision of new buildings.The Capital Plan includes just over €3 billion for investment in health infrastructure. Almost €3 billion will be provided to support the Social Housing Strategy 2020, which aims to increase the supply of social housing by up to 35,000 units and contribute significantly to meeting the housing needs of households on the housing list.The Capital Plan is allocating €444 million for investment in energy efficiency and renewable energy programmes from 2016 to 2021. This will provide additional funding for investment in domestic energy efficiency improvements.To address flooding, €430 million is being provided under the Plan for flood mitigation initiatives to protect threatened localities from river and coastal flood risk.Irish Water plans to invest €4 billion over the period 2016-2021. There will also be investment of around €2 billion by the other commercial State companies, primarily in airports, ports, public transport, forestry and biomass.The Ireland Strategic Investment Fund has a value of around €20 billion and aims to invest €7.5 billion over the period of the Capital Plan. In addition, the Fund will be seeking to attract private sector partners, through co-investment, in order to realise a potential total investment of some €15 billion in the economy over this period. Potential areas for investment by the ISIF include energy, transport, water, housing, SME investment, and food and agriculture.
IRELAND
50
CO
NS
TRU
CTI
ON
AC
TIV
ITY
IN E
UR
OP
E -
ED
ITIO
N 2
016

INVESTMENT IN CONSTRUCTION
Housebuilding Non residential Civil Engineering Total Construction
2010 = 100
‘10
‘11
‘12
‘13
‘14
2015
a
2016
b
€ 199
BILLION 4,635,000
GDP 2015
POPULATION 2015
PER CENT VARIATION OF PRODUCTION IN REAL TERMS OF PREVIOUS YEAR
production Mln. €
fixed prices variation of production on previous year (%)
Sectors 2015a 2012 2013 2014 2015a 2016b
1. Building 8,610 0.5 5.0 10.4 10.1 19.9
1.1. Housebuilding 5,612 -8.7 -0.9 12.7 10.4 19.9
1.1.1. New 2,430 -6.1 2.3 28.0 13.3 37.7
1.1.2. R&M 3,183 -10.1 -2.7 3.7 8.3 6.3
1.2. Non residential 2,997 27.0 17.4 6.3 9.4 19.9
1.2.1. Private 1,561 82.1 28.7 4.8 10.7 26.9
1.2.2. Public 1,436 -0.3 7.1 7.9 8.1 12.3
2. Civil Engineering 3,297 -6.3 -3.0 8.9 4.0 5.8
(1 + 2) Total Construction 11,907 -1.7 2.5 9.9 8.3 16.0
a: estimate - b: forecast
NUMBER OF BUILDING PERMITS IN RESIDENTIAL CONSTRUCTION
2012 2013 2014 2015a 2016b
single dwelling 5,389 6,002 6,626 NA NA
collective dwelling 861 1,197 785 NA NA
other types of dwelling NA NA NA NA NA
Total 6,250 7,198 7,411 NA NA
(Collective dwellings and other types of buildings: in number of flats)
IRELAND
160
140
120
100
80
6060
80
100
120
140
160
51
CO
NS
TRU
CTI
ON
AC
TIV
ITY
IN E
UR
OP
E -
ED
ITIO
N 2
016

1. Overall construction activity
The downward trend in the Italian construction activity slowed down in 2015, with the estimate by the National Association of Italian Constructors (ANCE) indicating a decrease in sector investment of 1.3% in real terms from last year, following the more significant drops in previous years (-7% in 2013, and -5.2% in 2014).The year 2015 represented the 8th consecutive year of crisis and the sector has experienced an overall investment loss of 34.8% from 2008. Over the last 8 years (2008-2015), housebuilding declined by 61.1%, non-residential building by 35%, and civil engineering by 48.7%. Only housing redevelopment increased by 19.4% over the same period, also due to the stimulus effect produced by the tax relief for the redevelopment, requalification and energy efficiency works on the housing stock.However, amid the negative production context, the positive signals that already emerged in 2014 in the number of housing transactions, housing mortgages issued to households, and calls for tender in civil engineering, have been reconfirmed.The number of housing transactions in the first three quarters of 2015 increased by 5.3% from the same period of the previous year, following a +3.6% in 2014. One of the main driving forces behind the housing market’s recovery is certainly the renewed viability of housing mortgages to households that continued to increase, in the first three quarters of 2015, registering a +64.5% from the same period of the previous year.By contrast, a solution has not been devised yet to the credit crunch problem for construction companies: in the first 3 quarters of 2015, the mortgages issued in Italy to private companies for financing housebuilding investments dropped by 4.3% compared to the same period of 2014 (the drop in 2014 was -18.3% compared to 2013).Mortgages issued to private companies for non-residential building investment have, instead, increased both in 2014 (+6.7% from 2013) and in the first 3 quarters of 2015 (+94% compared to first 3 quarters of 2014). This early positive signal comes after seven consecutive years of downward trend, with the overall drop in new mortgages for non-residential building between 2007 and 2014 amounting to 71.7%.Calls for tender in civil engineering increased both in number (+13.9%) and in value (+10.8%) over the first 10 months of 2015 from the previous year, confirming the positive trend started in 2014.The year 2016 may represent the turning point for the recovery of the construction sector. ANCE’s outlook for 2016 is positive and it envisions a 1% increase of construction investment in real terms, which will interrupt the ongoing negative trend started in 2008. The trend reversal will be triggered by a further growth in the redevelopment of the existing stock for housing purposes, by a change of direction in civil engineering after a decade of downturns, and by the slowing down in the fall of new house construction and non-residential building’s production levels.
2. Housebuilding
For the year 2015, ANCE estimates a 1.4% real term decline in housebuilding, as a combined result of the decrease of investment in new constructions (-6%) and the increase in the redevelopment for housing purposes (+0.8%). The fall in new house construction is affected by the downward trend in construction permits, which have been steadily declining over the last decade. According to the National Institute of Statistics (ISTAT), the number of house construction permits, both for new constructions and extensions, issued in the first half of 2015 declined by 10.7% compared to H1 2014. The estimate for 2015 is 54,000 new house construction permits, which represents an overall decline of 82.3% from 2005.New contracts are expected to continue their decline in 2016, even if at a slower rate, due to a further fall in the development of new housing units (-3.5% in real terms), only modestly compensated by the increase in the redevelopment of the existing stock for housing purposes (+1.5%). Overall, the 2016 investment in housebuilding is expected to reach roughly the same level as 2015.
3. Non-residential buildings
In 2015, the production levels of private investments in non-residential buildings continued their negative trend, registering a 1.2% decline in real terms from 2014.According to ANCE’s survey of associated companies, despite the protracted fall in production levels, the business sentiment is less negative than what emerged in previous surveys and, after years of severe downturn, the number of mortgages issued to private companies for non-residential building investment is reported to have increased starting from the fourth quarter of 2014.The volume of private investments in non-residential building is expected to register a 0.4% decrease in 2016.
4. Civil engineering
According to ANCE’s estimates for 2015, civil engineering investment decreased by 1.3% in real terms: a minor negative variation if compared to those from previous years (-9.3% in 2013; -5.1% in 2014).Moreover, ANCE’s forecast for 2016 suggests a 6% increase in real terms, also taking into account that some measures contained in the Italian 2016 Budget Law (‘Disposizioni per la formazione del bilancio annuale e pluriennale dello Stato - Legge di Stabilità 2016’) are expected to act on those economic and financial obstacles that prevented the carrying out of public works in Italy, over the last years. The envisioned measures will, in fact, remove the internal Stability and Growth Pact and, thanks to the so-called European “investment clause”, will boost the 2016 expenditure for programmes already approved, as well as the amount of allocated resources (+4.5% in real terms compared to 2015).
ITALY
52
CO
NS
TRU
CTI
ON
AC
TIV
ITY
IN E
UR
OP
E -
ED
ITIO
N 2
016

INVESTMENT IN CONSTRUCTION
Housebuilding Non residential Civil Engineering Total Construction
2007 = 100
‘07
‘08
‘09
‘10
‘11
‘12
‘13
‘14
2015
a
2016
b
€ 1,636
BILLION 60,796,000
GDP 2015
POPULATION 2015
PER CENT VARIATION OF PRODUCTION IN REAL TERMS OF PREVIOUS YEAR
production Mln. €
fixed prices variation of production on previous year (%)
Sectors 2015a 2012 2013 2014 2015a 2016b
1. Building 105,155 -7.1 -6.7 -5.2 -1.4 0.3
1.1. Housebuilding 63,110 -4.4 -3.7 -4.1 -1.4 -0.1
1.1.1. New 19,837 -11.1 -13.4 -13.9 -6.0 -3.5
1.1.2. R&M 43,273 0.8 2.9 1.5 0.8 1.5
1.2. Non residential 42,045 -10.6 -10.8 -6.8 -1.2 0.9
1.2.1. Private 33,567 -10.6 -11.2 -7.3 -1.2 -0.4
1.2.2. Public 8,478 -10.6 -9.3 -5.1 -1.3 6.0
2. Civil Engineering 14,435 -10.6 -9.3 -5.1 -1.3 6.0
(1 + 2) Total Construction 119,590 -7.6 -7.0 -5.2 -1.3 1.0
a: estimate - b: forecast
NUMBER OF BUILDING PERMITS IN RESIDENTIAL CONSTRUCTION
2012 2013 2014 2015a 2016b
single dwelling 14,123 12,025 NA NA NA
collective dwelling 10,471 12,130 NA NA NA
other types of dwelling NA NA NA NA NA
Total 24,594 24,155 NA NA NA
(Collective dwellings and other types of buildings: in number of flats)
100
90
80
70
60
50
ITALY
50
60
70
80
90
100
53
CO
NS
TRU
CTI
ON
AC
TIV
ITY
IN E
UR
OP
E -
ED
ITIO
N 2
016

LITHUANIA
IT ©
Ric
card
o A
rata
- fo
tolia
.com
54
CO
NS
TRU
CTI
ON
AC
TIV
ITY
IN E
UR
OP
E -
ED
ITIO
N 2
016

INVESTMENT IN CONSTRUCTION
Housebuilding Non residential Civil Engineering Total Construction
2007 = 100
‘07
‘08
‘09
‘10
‘11
‘12
‘13
‘14
2015
a
2016
b
€ 37
BILLION 2,890,000
GDP 2015
POPULATION 2015
PER CENT VARIATION OF PRODUCTION IN REAL TERMS OF PREVIOUS YEAR
production Mln. €
fixed prices variation of production on previous year (%)
Sectors 2015a 2012 2013 2014 2015a 2016b
1. Building 1,134 -6.8 15.3 23.7 2.9 NA
1.1. Housebuilding 354 17.3 13.2 50.2 36.5 NA
1.1.1. New 161 -1.3 41.2 47.7 -16.7 NA
1.1.2. R&M 193 65.5 -30.1 58.0 191.8 NA
1.2. Non residential 779 -11.2 15.8 17.3 -7.5 NA
1.2.1. Private 599 0.2 13.0 20.7 -2.8 NA
1.2.2. Public 180 -32.1 23.6 8.9 -20.3 NA
2. Civil Engineering 949 -8.1 8.0 10.4 -13.4 NA
(1 + 2) Total Construction 2,082 -7.5 11.3 16.7 -5.2 NA
a: estimate - b: forecast
NUMBER OF BUILDING PERMITS IN RESIDENTIAL CONSTRUCTION
2012 2013 2014 2015a 2016b
single dwelling 5,277 6,447 5,846 6,074 NA
collective dwelling 91 114 85 116 NA
other types of dwelling 10 10 14 2 NA
Total 5,378 6,571 5,945 6,192 NA
(Collective dwellings and other types of buildings: in number of flats)
LITHUANIA
120
100
80
60
40
2020
40
60
80
100
120
55
CO
NS
TRU
CTI
ON
AC
TIV
ITY
IN E
UR
OP
E -
ED
ITIO
N 2
016

1. Overall construction activity
The Dutch economy is developing steadily with 1.8% growth this year and 2% next year. The economy grew by 0.9% in 2015. The decrease in natural gas production will dampen this year’s growth by 0.2%. Both in 2016 and 2017, all spending categories are contributing to economic growth. Consumption is growing because of an increase in real disposable incomes, a higher employment level, and the delayed impact of a €5 billion package of measures to reduce the financial burden. The stable economic growth is coupled with a limited decrease in unemployment, down to 6.5% this year and 6.3% in 2017. Inflation is not expected to break the 1% barrier until after 2017. The government deficit is projected to drop to 1.7% of GDP this year and 1.2% next year.
After many years of malaise the construction industry started to recover in 2014. Last year construction output grew very strongly (7%) partially due to the tax incentives for housing renovation and maintenance. An increase of some 4.5% is expected in 2016. This expansion is significantly stronger than in other branches of the economy. Although optimism is growing and is fuelling the residential market, the non-residential market and the infrastructure market are not benefiting in an equal way, making the current recovery still rather one-sided. Moreover, profitability will take much longer to recover.
2. Housebuilding
Recovery of the housing market, which began in 2014, is projected to continue. According to the projections, the pace of house price increases will accelerate slightly. The increase in the number of transactions of existing privately owned houses, after having peaked over the last years, will continue at a more moderate level. The resurgence of the housing market has induced a strong recovery in new building permits. The total number of building permits increased from 28,000 in 2013 to 55,000 last year. In 2016, a further increase of some 10,000 permits is forecast. Starting this year building completions will also begin to recover. However, these numbers are still much lower than the levels needed to satisfy demand. For 7 years now, the number of dwellings added to the housing stock has been lower than the number of new households. The current strong inflow of asylum seekers in the Netherlands means that the necessary number of dwellings in the coming years will be much higher than was thought earlier. A conservative estimate, with a gradually decreasing inflow in the coming years, suggests a need of 50,000 extra dwellings in the coming 5 years.
After a loss of half its volume in 2009-2014 new residential output will expand by 13-20% yearly in 2015-2017. Renovation and maintenance has strongly benefited from the low VAT rate for housing renovation. Due to the expiry of this measure, renovation and maintenance output will increase only at a modest rate this year.
3. Non-residential buildings
Non-residential construction has lost some 21% of its output in the crisis. The improvement in the economic situation and favourable export opportunities ensured a steady recovery from 2014 on, but due to high vacancy rates for some types of buildings, the continuing effect of consolidation measures and the negative effects of the transformation of the health care system, this growth will be very modest.
New non-residential output stabilised in 2015, but for this year an increase of some 4% is expected. The construction of industrial buildings, storage buildings, commercial buildings (commerce, hospitality, catering industry and buildings for transport and communication) will show positive growth rates. On the other hand, investments in office buildings, buildings for education, health care and for the agricultural sector are expected to decrease.
The output in renovation and maintenance has fallen strongly in recent years. In the years to come output will be driven by the necessity to catch up on the postponed maintenance work, by rebuilding of existing logistical facilities to make them suitable for e-commerce and by the expanding reconstruction of office buildings into other uses. As a result, the outlook for the renovation and maintenance sector is quite favourable. In both 2015 and 2016 output will increase by some 3.5%.
4. Civil engineering
The civil engineering market has been hit by the economic crisis and austerity measures in the past years. The central government has prioritised expenditures and has lowered its contribution to the ‘Gemeentefonds’ accompanied by the transfer of tasks (care, labour market) to municipalities. At the same time this is leading to prioritisation of local expenditure and the conservation of infra deficits. Nevertheless, civil engineering output increased some 2.75% last year. In 2016 civil engineering output will rise by 2%. As in the recent past this growth will be mainly accounted for by new construction. An important factor is the sharp rise in the housing market that calls for new investment in building sites and utility networks.
THE NETHERLANDS
56
CO
NS
TRU
CTI
ON
AC
TIV
ITY
IN E
UR
OP
E -
ED
ITIO
N 2
016

INVESTMENT IN CONSTRUCTION
Housebuilding Non residential Civil Engineering Total Construction
2007 = 100
‘07
‘08
‘09
‘10
‘11
‘12
‘13
‘14
2015
a
2016
b
€ 678
BILLION 16,937,000
GDP 2015
POPULATION 2015
PER CENT VARIATION OF PRODUCTION IN REAL TERMS OF PREVIOUS YEAR
production Mln. €
fixed prices variation of production on previous year (%)
Sectors 2015a 2012 2013 2014 2015a 2016b
1. Building 43,450 -9.0 -5.2 1.1 8.7 5.3
1.1. Housebuilding 23,250 -11.6 -7.3 0.6 15.2 6.5
1.1.1. New 10,500 -16.8 -12.3 -4.5 23.2 13.3
1.1.2. R&M 12,750 -6.3 -2.8 4.7 9.4 0.8
1.2. Non residential 20,200 -6.1 -3.0 1.7 2.0 4.0
1.2.1. Private NA NA NA NA NA NA
1.2.2. Public NA NA NA NA NA NA
2. Civil Engineering 14,000 -8.1 -4.7 2.4 2.8 2.1
(1 + 2) Total Construction 57,450 -8.8 -5.1 1.5 7.2 4.5
a: estimate - b: forecast
NUMBER OF BUILDING PERMITS IN RESIDENTIAL CONSTRUCTION
2012 2013 2014 2015a 2016b
single dwelling NA NA NA NA NA
collective dwelling NA NA NA NA NA
other types of dwelling NA NA NA NA NA
Total 38,752 28,131 40,170 55,000 65,000
(Collective dwellings and other types of buildings: in number of flats)
THE NETHERLANDS
60
70
80
90
100
110130
120
110
100
90
80
70
60
57
CO
NS
TRU
CTI
ON
AC
TIV
ITY
IN E
UR
OP
E -
ED
ITIO
N 2
016

1. Overall construction activity
After a slowdown in GDP in 2013 (+ 1%), the economy returned to a growth path with rates of 3 % in the years 2014 and 2015 and a further growth of 4% is predicted for this year. In the construction sector the small setback, a response to the completion of projects for the European Football Championships in 2012, especially in civil engineering, has been overcome.
Construction investment, which grew by more than 20% in 2014 and 2015, will exceed the increase in overall economic development with an expected rise of 5% in real terms in 2016. The volume of total construction output is expected to reach 53.5 billion Euros. The share of GDP, attributed to construction activity, will be around 11.5%, compared to the peak of 12.9% in 2008.
Due to the slowdown in output, construction prices fell by more than 4% from 2012 to 2014. Following a mere stagnation last year, 2016 will see a rise in output prices by more than 1% this year.
2. Housebuilding
Last year the number of permits for houses and flats was 7% higher than 2014, the total figure rising to 167,000 units. The growth was not as high as in 2014 but still remarkable. The development is supported by historically low mortgage rates. Long term rates have significantly fallen from 6% in 2011 to 2.7% last year. Additionally the labour market showed positive signs. Within three years 400,000 new jobs were created and unemployment fell by nearly the same figure.
Expectations for the disposable income of private households in 2016 are positive and thus helpful for residential construction. As in other European countries investors are seeking fields of activity where yields are higher than in the capital market. Together with a small rise in construction prices the demand for new flats and houses allows for a satisfactory return on investment.
The government programme “Home for the Young”, initiated in 2014, is aimed at younger people up to 35 years old and delivers subsidies to buy the first home. Since the start more than 23,000 loan agreements have been concluded in this programme with a total value of more than one billion Euro.
2016 investment into the existing housing stock (+3%) will stay behind the development in new residential construction (+5%). With a share of less than one third of total residential investment its influence on residential construction is much smaller than in Western Europe (more than 60%).
3. Non-residential buildings
Investment in this sector by private investors is closely linked to the overall economic development. Real GDP expanded by 3.3% last year, a further growth of nearly 4% is expected for 2016. Factors such as a high capacity utilisation, high availability of loans combined with low interest rates and the ability of a lot of companies to finance investment with their own funds will drive the sector in 2016.
Additionally foreign investors are still highly interested in the polish market focusing on industry. They regard Poland as a hub for Eastern Europe still benefitting from large payments from the EU structural funds to attract investment. Therefore industrial buildings are likely to grow at a higher pace than the rest of the sector. After two years with higher production the growth rate for new office buildings will slow down, the same goes for storage buildings. Nevertheless the private market will show a substantial surplus.
Contrary to this, public investors are likely to show some resistance in financing new public buildings. Last year the value of new orders was about 10.5 lower than in 2014, to a large extent due to the limited financial scope of action on the local sphere. The use of money from EU funds in the new financing period 2014-2020 is taking more time than expected.
4. Civil engineering
The new Polish government, elected in 2015, has announced that infrastructure is high on their agenda. The Minister for Infrastructure and Development is eager to raise the competitiveness of the rail system and will undertake a revision of the existing programs in all kinds of transport infrastructure. Special focus will be given to investments co-financed by the EU.
The modernisation of transport infrastructure is necessary to fulfil the needs of international investors in Polish industry. Although some progress has been achieved in the past years there is still a lot to do. Among the 13 MOE-states of the EU, the quality of Polish infrastructure was only rated as number 11 last year.
The new government is therefore concentrating its efforts on this sector. 2016 investment into transport infrastructure is likely to grow by nearly 15%, with about 20% in road construction. Especially in railways the investment will primarily go into the upgrading and modernisation of existing lines.
POLAND
58
CO
NS
TRU
CTI
ON
AC
TIV
ITY
IN E
UR
OP
E -
ED
ITIO
N 2
016

Housebuilding Non residential Civil Engineering Total Construction
2010 = 100
INVESTMENT IN CONSTRUCTION
‘10
‘11
‘12
‘13
‘14
2015
a
2016
b
€ 445
BILLION 38,482,000
GDP 2015
POPULATION 2015
PER CENT VARIATION OF PRODUCTION IN REAL TERMS OF PREVIOUS YEAR
production Mln. €
fixed prices variation of production on previous year (%)
Sectors 2015a 2012 2013 2014 2015a 2016b
1. Building 35,500 -0.3 -1.0 16.2 5.0 1.4
1.1. Housebuilding 11,600 16.3 0.0 3.7 4.5 4.3
1.1.1. New 8,100 17.2 -1.3 2.7 6.6 4.9
1.1.2. R&M 3,500 14.3 3.1 6.1 0.0 2.9
1.2. Non residential 23,900 -7.9 -1.6 23.4 5.3 0.0
1.2.1. Private NA NA NA NA NA NA
1.2.2. Public NA NA NA NA NA NA
2. Civil Engineering 18,100 -1.8 -13.5 19.1 7.7 12.2
(1 + 2) Total Construction 53,600 -0.9 -5.5 17.1 5.9 5.0
a: estimate - b: forecast
NUMBER OF BUILDING PERMITS IN RESIDENTIAL CONSTRUCTION
2012 2013 2014 2015a 2016b
single dwelling 81,999 71,740 79,000 84,000 82,000
collective dwelling 74,453 59,753 77,000 83,000 85,000
other types of dwelling NA NA NA NA NA
Total 156,452 131,493 156,000 167,000 167,000
(Collective dwellings and other types of buildings: in number of flats)
POLAND
90
100
110
120
130
140140
130
120
110
100
90
59
CO
NS
TRU
CTI
ON
AC
TIV
ITY
IN E
UR
OP
E -
ED
ITIO
N 2
016
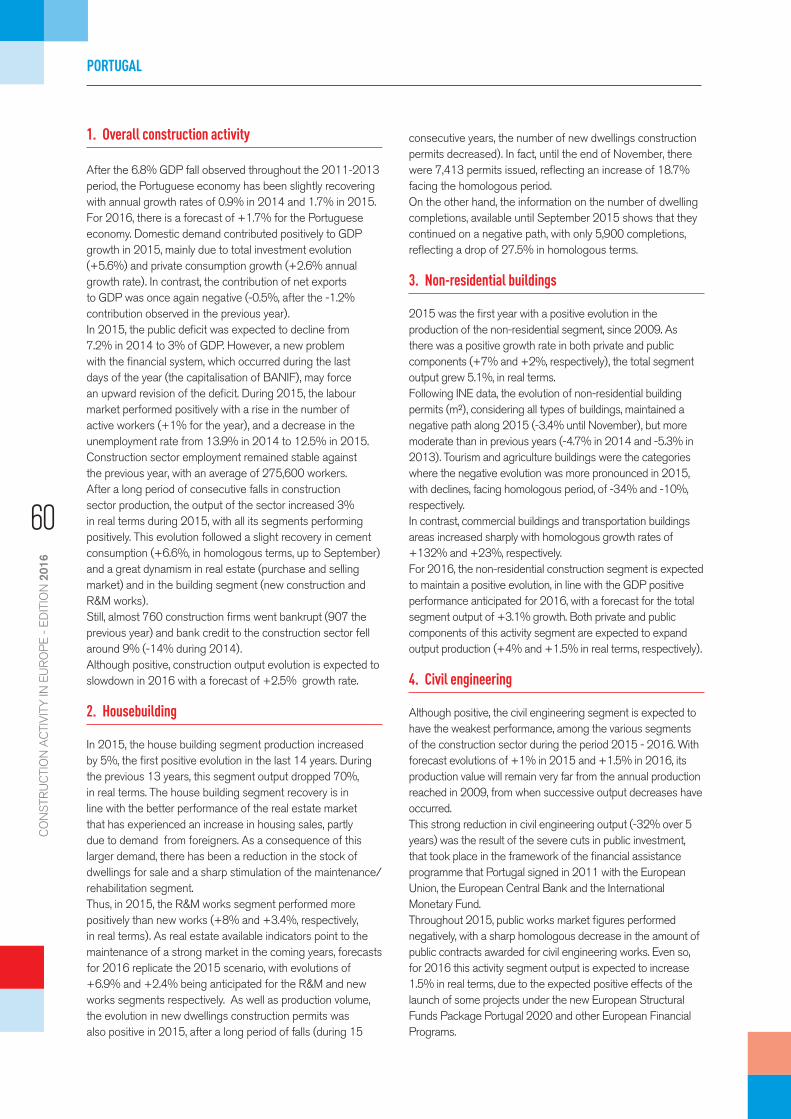
1. Overall construction activity
After the 6.8% GDP fall observed throughout the 2011-2013 period, the Portuguese economy has been slightly recovering with annual growth rates of 0.9% in 2014 and 1.7% in 2015. For 2016, there is a forecast of +1.7% for the Portuguese economy. Domestic demand contributed positively to GDP growth in 2015, mainly due to total investment evolution (+5.6%) and private consumption growth (+2.6% annual growth rate). In contrast, the contribution of net exports to GDP was once again negative (-0.5%, after the -1.2% contribution observed in the previous year).In 2015, the public deficit was expected to decline from 7.2% in 2014 to 3% of GDP. However, a new problem with the financial system, which occurred during the last days of the year (the capitalisation of BANIF), may force an upward revision of the deficit. During 2015, the labour market performed positively with a rise in the number of active workers (+1% for the year), and a decrease in the unemployment rate from 13.9% in 2014 to 12.5% in 2015. Construction sector employment remained stable against the previous year, with an average of 275,600 workers. After a long period of consecutive falls in construction sector production, the output of the sector increased 3% in real terms during 2015, with all its segments performing positively. This evolution followed a slight recovery in cement consumption (+6.6%, in homologous terms, up to September) and a great dynamism in real estate (purchase and selling market) and in the building segment (new construction and R&M works).Still, almost 760 construction firms went bankrupt (907 the previous year) and bank credit to the construction sector fell around 9% (-14% during 2014). Although positive, construction output evolution is expected to slowdown in 2016 with a forecast of +2.5% growth rate.
2. Housebuilding
In 2015, the house building segment production increased by 5%, the first positive evolution in the last 14 years. During the previous 13 years, this segment output dropped 70%, in real terms. The house building segment recovery is in line with the better performance of the real estate market that has experienced an increase in housing sales, partly due to demand from foreigners. As a consequence of this larger demand, there has been a reduction in the stock of dwellings for sale and a sharp stimulation of the maintenance/rehabilitation segment.Thus, in 2015, the R&M works segment performed more positively than new works (+8% and +3.4%, respectively, in real terms). As real estate available indicators point to the maintenance of a strong market in the coming years, forecasts for 2016 replicate the 2015 scenario, with evolutions of +6.9% and +2.4% being anticipated for the R&M and new works segments respectively. As well as production volume, the evolution in new dwellings construction permits was also positive in 2015, after a long period of falls (during 15
consecutive years, the number of new dwellings construction permits decreased). In fact, until the end of November, there were 7,413 permits issued, reflecting an increase of 18.7% facing the homologous period. On the other hand, the information on the number of dwelling completions, available until September 2015 shows that they continued on a negative path, with only 5,900 completions, reflecting a drop of 27.5% in homologous terms.
3. Non-residential buildings
2015 was the first year with a positive evolution in the production of the non-residential segment, since 2009. As there was a positive growth rate in both private and public components (+7% and +2%, respectively), the total segment output grew 5.1%, in real terms.Following INE data, the evolution of non-residential building permits (m²), considering all types of buildings, maintained a negative path along 2015 (-3.4% until November), but more moderate than in previous years (-4.7% in 2014 and -5.3% in 2013). Tourism and agriculture buildings were the categories where the negative evolution was more pronounced in 2015, with declines, facing homologous period, of -34% and -10%, respectively. In contrast, commercial buildings and transportation buildings areas increased sharply with homologous growth rates of +132% and +23%, respectively. For 2016, the non-residential construction segment is expected to maintain a positive evolution, in line with the GDP positive performance anticipated for 2016, with a forecast for the total segment output of +3.1% growth. Both private and public components of this activity segment are expected to expand output production (+4% and +1.5% in real terms, respectively).
4. Civil engineering
Although positive, the civil engineering segment is expected to have the weakest performance, among the various segments of the construction sector during the period 2015 - 2016. With forecast evolutions of +1% in 2015 and +1.5% in 2016, its production value will remain very far from the annual production reached in 2009, from when successive output decreases have occurred. This strong reduction in civil engineering output (-32% over 5 years) was the result of the severe cuts in public investment, that took place in the framework of the financial assistance programme that Portugal signed in 2011 with the European Union, the European Central Bank and the International Monetary Fund.Throughout 2015, public works market figures performed negatively, with a sharp homologous decrease in the amount of public contracts awarded for civil engineering works. Even so, for 2016 this activity segment output is expected to increase 1.5% in real terms, due to the expected positive effects of the launch of some projects under the new European Structural Funds Package Portugal 2020 and other European Financial Programs.
PORTUGAL
60
CO
NS
TRU
CTI
ON
AC
TIV
ITY
IN E
UR
OP
E -
ED
ITIO
N 2
016

INVESTMENT IN CONSTRUCTION
Housebuilding Non residential Civil Engineering Total Construction
2007 = 100
‘07
‘08
‘09
‘10
‘11
‘12
‘13
‘14
2015
a
2016
b
€ 179
BILLION 10,328,000
GDP 2015
POPULATION 2015
PER CENT VARIATION OF PRODUCTION IN REAL TERMS OF PREVIOUS YEAR
production Mln. €
fixed prices variation of production on previous year (%)
Sectors 2015a 2012 2013 2014 2015a 2016b
1. Building 5,571 -16.0 -15.9 -7.8 5.0 3.5
1.1. Housebuilding 2,611 -20.0 -18.0 -10.0 5.0 4.0
1.1.1. New 1,671 -23.4 -23.3 -19.9 3.4 2.4
1.1.2. R&M 940 -4.9 0.6 16.7 8.0 6.9
1.2. Non residential 2,959 -11.8 -13.8 -5.7 5.1 3.1
1.2.1. Private 1,849 -13.0 -13.0 -2.0 7.0 4.0
1.2.2. Public 1,110 -10.0 -15.0 -11.0 2.0 1.5
2. Civil Engineering 5,478 -15.0 -14.0 -1.0 1.0 1.5
(1 + 2) Total Construction 11,048 -15.5 -15.0 -4.5 3.0 2.5
a: estimate - b: forecast
NUMBER OF BUILDING PERMITS IN RESIDENTIAL CONSTRUCTION
2012 2013 2014 2015a 2016b
single dwelling 8,478 5,646 5,242 6,205 6,957
collective dwelling 2,764 1,675 1,543 1,801 1,850
other types of dwelling NA NA NA NA NA
Total 11,251 7,321 6,785 8,006 8,807
(Collective dwellings and other types of buildings: in number of flats)
120
100
80
60
40
20
PORTUGAL
20
40
60
80
100
120
61
CO
NS
TRU
CTI
ON
AC
TIV
ITY
IN E
UR
OP
E -
ED
ITIO
N 2
016
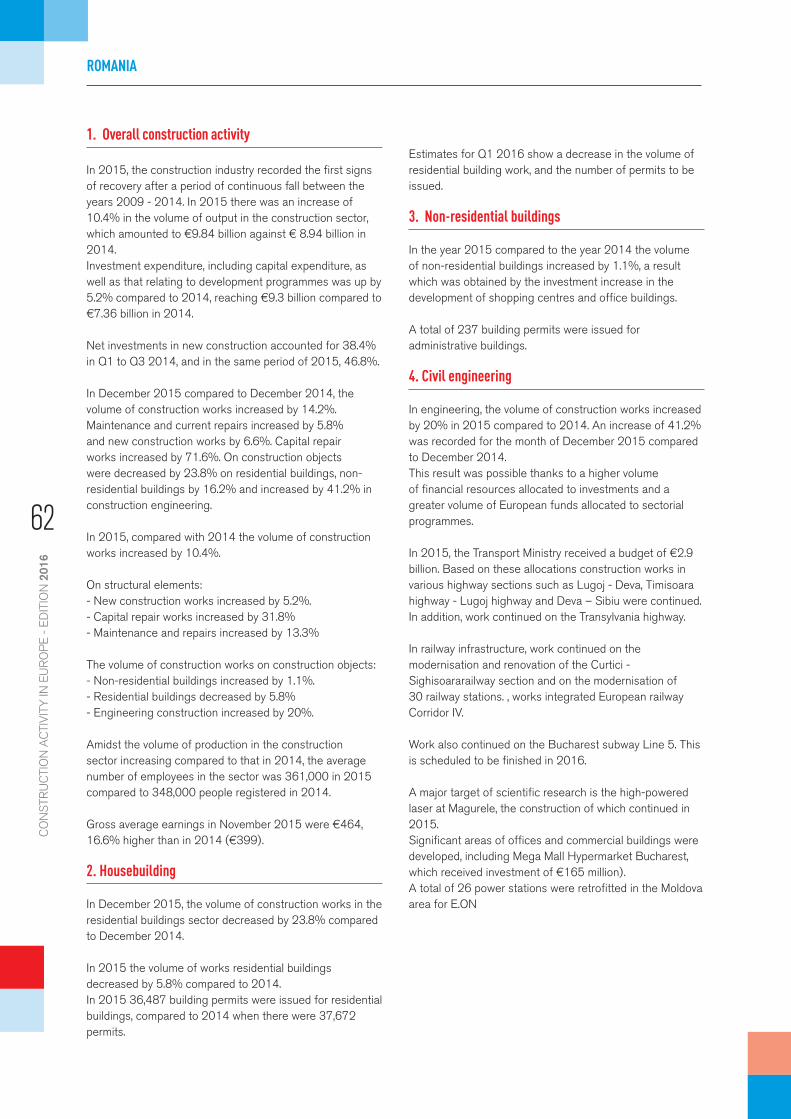
1. Overall construction activity
In 2015, the construction industry recorded the first signs of recovery after a period of continuous fall between the years 2009 - 2014. In 2015 there was an increase of 10.4% in the volume of output in the construction sector, which amounted to €9.84 billion against € 8.94 billion in 2014.Investment expenditure, including capital expenditure, as well as that relating to development programmes was up by 5.2% compared to 2014, reaching €9.3 billion compared to €7.36 billion in 2014.
Net investments in new construction accounted for 38.4% in Q1 to Q3 2014, and in the same period of 2015, 46.8%.
In December 2015 compared to December 2014, the volume of construction works increased by 14.2%. Maintenance and current repairs increased by 5.8% and new construction works by 6.6%. Capital repair works increased by 71.6%. On construction objects were decreased by 23.8% on residential buildings, non-residential buildings by 16.2% and increased by 41.2% in construction engineering.
In 2015, compared with 2014 the volume of construction works increased by 10.4%.
On structural elements:- New construction works increased by 5.2%.- Capital repair works increased by 31.8%- Maintenance and repairs increased by 13.3%
The volume of construction works on construction objects:- Non-residential buildings increased by 1.1%.- Residential buildings decreased by 5.8%- Engineering construction increased by 20%.
Amidst the volume of production in the construction sector increasing compared to that in 2014, the average number of employees in the sector was 361,000 in 2015 compared to 348,000 people registered in 2014.
Gross average earnings in November 2015 were €464, 16.6% higher than in 2014 (€399).
2. Housebuilding
In December 2015, the volume of construction works in the residential buildings sector decreased by 23.8% compared to December 2014.
In 2015 the volume of works residential buildings decreased by 5.8% compared to 2014.In 2015 36,487 building permits were issued for residential buildings, compared to 2014 when there were 37,672 permits.
Estimates for Q1 2016 show a decrease in the volume of residential building work, and the number of permits to be issued.
3. Non-residential buildings
In the year 2015 compared to the year 2014 the volume of non-residential buildings increased by 1.1%, a result which was obtained by the investment increase in the development of shopping centres and office buildings.
A total of 237 building permits were issued for administrative buildings.
4. Civil engineering
In engineering, the volume of construction works increased by 20% in 2015 compared to 2014. An increase of 41.2% was recorded for the month of December 2015 compared to December 2014.This result was possible thanks to a higher volume of financial resources allocated to investments and a greater volume of European funds allocated to sectorial programmes.
In 2015, the Transport Ministry received a budget of €2.9 billion. Based on these allocations construction works in various highway sections such as Lugoj - Deva, Timisoara highway - Lugoj highway and Deva – Sibiu were continued. In addition, work continued on the Transylvania highway.
In railway infrastructure, work continued on the modernisation and renovation of the Curtici - Sighisoararailway section and on the modernisation of 30 railway stations. , works integrated European railway Corridor IV.
Work also continued on the Bucharest subway Line 5. This is scheduled to be finished in 2016.
A major target of scientific research is the high-powered laser at Magurele, the construction of which continued in 2015.Significant areas of offices and commercial buildings were developed, including Mega Mall Hypermarket Bucharest, which received investment of €165 million).A total of 26 power stations were retrofitted in the Moldova area for E.ON
ROMANIA
62
CO
NS
TRU
CTI
ON
AC
TIV
ITY
IN E
UR
OP
E -
ED
ITIO
N 2
016

INVESTMENT IN CONSTRUCTION
Housebuilding Non residential Civil Engineering Total Construction
2007 = 100
‘07
‘08
‘09
‘10
‘11
‘12
‘13
‘14
2015
a
2016
b
€ 155
BILLION 19,830,000
GDP 2015
POPULATION 2015
PER CENT VARIATION OF PRODUCTION IN REAL TERMS OF PREVIOUS YEAR
production Mln. €
fixed prices variation of production on previous year (%)
Sectors 2015a 2012 2013 2014 2015a 2016b
1. Building 9,715 -10.5 4.3 40.4 -2.5 5.0
1.1. Housebuilding 4,733 -2.5 -13.2 63.4 -2.5 5.0
1.1.1. New 2,905 -5.2 -24.7 75.5 -2.5 5.0
1.1.2. R&M 1,828 3.5 9.3 47.2 -2.5 5.0
1.2. Non residential 4,982 -22.2 29.6 23.8 -2.5 5.0
1.2.1. Private 3,841 -21.1 29.5 2.6 -2.5 5.0
1.2.2. Public 1,141 -34.7 31.2 309.1 -2.5 5.0
2. Civil Engineering 14,976 8.1 11.6 -18.2 20.0 5.2
(1 + 2) Total Construction 24,691 0.1 10.3 0.4 10.0 5.1
a: estimate - b: forecast
NUMBER OF BUILDING PERMITS IN RESIDENTIAL CONSTRUCTION
2012 2013 2014 2015a 2016b
single dwelling NA NA NA NA NA
collective dwelling NA NA NA NA NA
other types of dwelling NA NA NA NA NA
Total 39,440 37,863 37,672 36,487 35,500
(Collective dwellings and other types of buildings: in number of flats)
190
180
170
160
150
140
130
120
110
100
90
80
70
ROMANIA
70
80
90
100
110
120
130
140
150
160
170
180
190
63
CO
NS
TRU
CTI
ON
AC
TIV
ITY
IN E
UR
OP
E -
ED
ITIO
N 2
016

1. Overall construction activity
The outlook for the Swedish economy improved during the autumn of 2015 and growth in 2016 is therefore expected to be quite strong. Foreign trade is picking up, thanks to the recovery in Europe, which accounts for nearly 70% of the Swedish export market. There is a broad upturn in the Swedish economy and all parts of the supply chain have contributed to the sharp increase in GDP. A gloomier outlook for the global economy will however affect the Swedish economy during next year. Weaker disposable income growth and negative net exports will slow down GDP growth from 3.3% this year to 2.5% in 2017.
The slowdown in GDP growth will dampen the total construction investment growth during the forecast period. Last year, construction investment rose significantly, where rising investment in residential construction was the main driving force. This year residential investments will still be the main engine while the civil engineering sector will decrease. All in all, total construction investment will increase by 4% in 2016. With regard to employment, 2015 was a weak year, construction employment fell by approximatively 1%. Employment growth will continue to be quite weak (but nevertheless positive) in terms of the strong growth rates of total construction during 2014 and 2015.
2. Housebuilding
Investment in residential construction began to rise in H2 2013. Investment in both single and multi-family dwellings has contributed to the turnaround. The recovery will continue throughout the forecast period, thanks to the housing construction boom in 2014 and 2015.
For newly constructed buildings the forecast is 48,600 dwelling starts in 2015 and 46,000 this year. Expressed in investment terms this means that new construction rose by 24% last year and will continue to increase by 13% this year.
Investment in repair and maintenance by 12% during 2015 after a quite strong 2014. This year households will reduce their demand for repair and maintenance work due to a less favourable tax deduction on ROT work (since January the deduction is 30% - not 50% as before). Thus the private and public property owners’ renovation of rental housing will provide a positive contribution to the development in 2016. All in all, total investment in housebuilding increased by 17% last year, and will continue to increase by 8% in 2016.
3. Non-residential buildings
The market-oriented construction of non-residential buildings continued going up in 2015 after a strong 2014. It was mainly the commercial and real estate sector together with increasing investment in the industrial sector that drove the increase. This year, the economic outlook will keep fuelling private non-residential investment. It is primarily the commercial and real estate construction sector that will contribute to the positive growth rate.
Local Authorities and Regions expect a very strained economy in the county council and municipal sector in both 2015 and 2016. On the other hand the large numbers of asylum seekers in Sweden is putting enormous pressure on the municipalities to construct a lot more public buildings. There are also several large public sector projects (hospitals) under construction and that is why we believe that public investments will have a positive growth even though finances are very strained. Overall, total investment in non-residential buildings increased by 8% in 2015, and will continue to increase by 2% in 2016.
4. Civil engineering
Investment in civil engineering slowed down during 2015. It was mainly the private investment in the sectors of postal, transport- and telecommunications that drove the slowdown. The negative growth in the private civil engineering sector will continue this year through reduced investment in the energy and telecommunication sectors. Public civil engineering investment increased in 2015. This was because of a sharp increase in railway investments (investments in roads and streets fell during 2015). Public sector investment will continue to increase this year when public spending on infrastructure increases (both on roads and on railways). Total civil engineering investment rose by only 1% last year and this year the sector will decrease by the same number, i.e. -1%, due to the drop in the private sector.
SWEDEN
64
CO
NS
TRU
CTI
ON
AC
TIV
ITY
IN E
UR
OP
E -
ED
ITIO
N 2
016

INVESTMENT IN CONSTRUCTION
Housebuilding Non residential Civil Engineering Total Construction
2007 = 100
‘07
‘08
‘09
‘10
‘11
‘12
‘13
‘14
2015
a
2016
b
€ 435
BILLION 9,851,000
GDP 2015
POPULATION 2015
PER CENT VARIATION OF PRODUCTION IN REAL TERMS OF PREVIOUS YEAR
production Mln. €
fixed prices variation of production on previous year (%)
Sectors 2015a 2012 2013 2014 2015a 2016b
1. Building 34,494 -3.5 -0.7 18.8 16.0 0.5
1.1. Housebuilding 17,981 -11.8 0.9 19.8 16.7 7.6
1.1.1. New 9,566 -21.1 10.4 33.7 23.8 12.8
1.1.2. R&M 6,750 -3.3 -5.9 10.0 11.6 0.7
1.2. Non residential 14,992 6.7 -2.3 14.2 8.0 2.3
1.2.1. Private 10,238 7.8 -2.6 13.5 10.9 2.5
1.2.2. Public 4,754 4.6 -1.6 15.5 2.2 2.0
2. Civil Engineering 8,213 11.7 -3.3 8.5 0.7 -0.6
(1 + 2) Total Construction* 57,724 -0.3 -1.3 15.1 10.0 4.1
a: estimate - b: forecast. * Total construction is multiplied by 1.4 in order to include R&M.
NUMBER OF BUILDING PERMITS IN RESIDENTIAL CONSTRUCTION
2012 2013 2014 2015a 2016b
single dwelling 6,628 7,132 9,717 11,870 11,500
collective dwelling 17,295 23,374 27,048 39,052 40,000
other types of dwelling 2,112 3,542 5,232 6,520 7,000
Total 26,035 34,048 41,997 57,442 58,500
(Collective dwellings and other types of buildings: in number of flats)
120
110
100
90
80
70
SWEDEN
60
70
80
90
100
110
120
65
CO
NS
TRU
CTI
ON
AC
TIV
ITY
IN E
UR
OP
E -
ED
ITIO
N 2
016
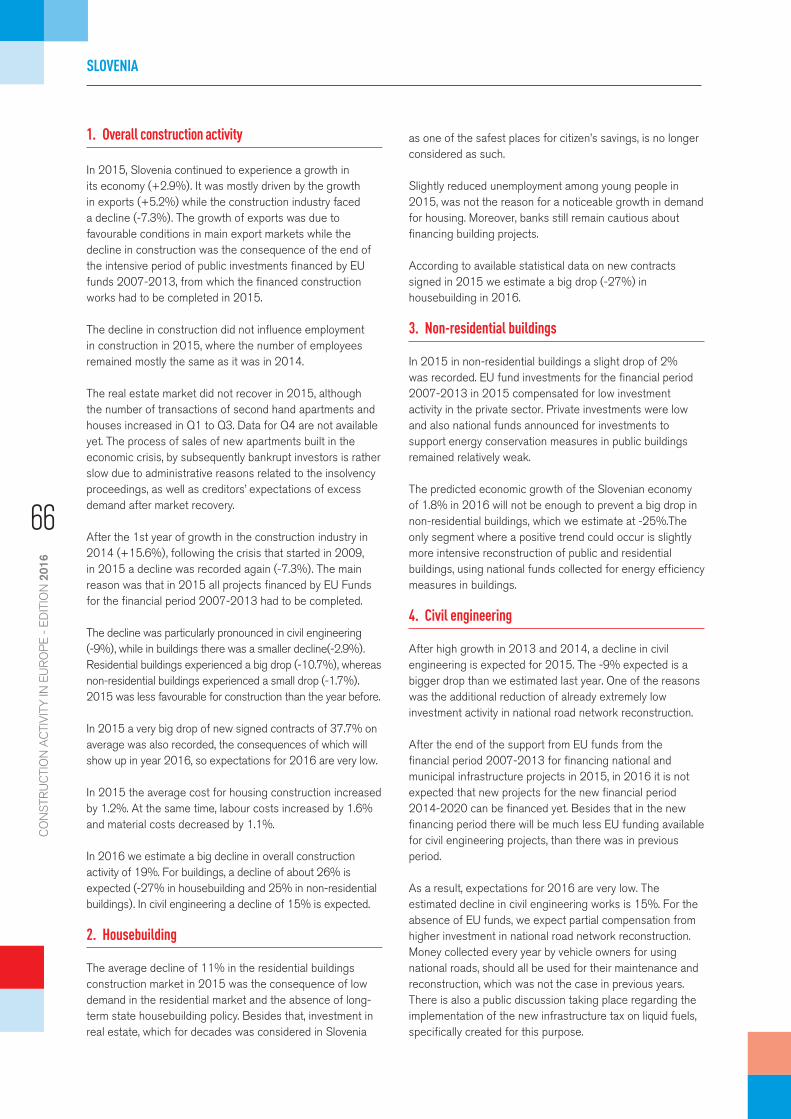
1. Overall construction activity
In 2015, Slovenia continued to experience a growth in its economy (+2.9%). It was mostly driven by the growth in exports (+5.2%) while the construction industry faced a decline (-7.3%). The growth of exports was due to favourable conditions in main export markets while the decline in construction was the consequence of the end of the intensive period of public investments financed by EU funds 2007-2013, from which the financed construction works had to be completed in 2015.
The decline in construction did not influence employment in construction in 2015, where the number of employees remained mostly the same as it was in 2014.
The real estate market did not recover in 2015, although the number of transactions of second hand apartments and houses increased in Q1 to Q3. Data for Q4 are not available yet. The process of sales of new apartments built in the economic crisis, by subsequently bankrupt investors is rather slow due to administrative reasons related to the insolvency proceedings, as well as creditors’ expectations of excess demand after market recovery.
After the 1st year of growth in the construction industry in 2014 (+15.6%), following the crisis that started in 2009, in 2015 a decline was recorded again (-7.3%). The main reason was that in 2015 all projects financed by EU Funds for the financial period 2007-2013 had to be completed.
The decline was particularly pronounced in civil engineering (-9%), while in buildings there was a smaller decline(-2.9%). Residential buildings experienced a big drop (-10.7%), whereas non-residential buildings experienced a small drop (-1.7%). 2015 was less favourable for construction than the year before.
In 2015 a very big drop of new signed contracts of 37.7% on average was also recorded, the consequences of which will show up in year 2016, so expectations for 2016 are very low.
In 2015 the average cost for housing construction increased by 1.2%. At the same time, labour costs increased by 1.6% and material costs decreased by 1.1%.
In 2016 we estimate a big decline in overall construction activity of 19%. For buildings, a decline of about 26% is expected (-27% in housebuilding and 25% in non-residential buildings). In civil engineering a decline of 15% is expected.
2. Housebuilding
The average decline of 11% in the residential buildings construction market in 2015 was the consequence of low demand in the residential market and the absence of long-term state housebuilding policy. Besides that, investment in real estate, which for decades was considered in Slovenia
as one of the safest places for citizen’s savings, is no longer considered as such.
Slightly reduced unemployment among young people in 2015, was not the reason for a noticeable growth in demand for housing. Moreover, banks still remain cautious about financing building projects.
According to available statistical data on new contracts signed in 2015 we estimate a big drop (-27%) in housebuilding in 2016.
3. Non-residential buildings
In 2015 in non-residential buildings a slight drop of 2% was recorded. EU fund investments for the financial period 2007-2013 in 2015 compensated for low investment activity in the private sector. Private investments were low and also national funds announced for investments to support energy conservation measures in public buildings remained relatively weak.
The predicted economic growth of the Slovenian economy of 1.8% in 2016 will not be enough to prevent a big drop in non-residential buildings, which we estimate at -25%.The only segment where a positive trend could occur is slightly more intensive reconstruction of public and residential buildings, using national funds collected for energy efficiency measures in buildings.
4. Civil engineering
After high growth in 2013 and 2014, a decline in civil engineering is expected for 2015. The -9% expected is a bigger drop than we estimated last year. One of the reasons was the additional reduction of already extremely low investment activity in national road network reconstruction.
After the end of the support from EU funds from the financial period 2007-2013 for financing national and municipal infrastructure projects in 2015, in 2016 it is not expected that new projects for the new financial period 2014-2020 can be financed yet. Besides that in the new financing period there will be much less EU funding available for civil engineering projects, than there was in previous period.
As a result, expectations for 2016 are very low. The estimated decline in civil engineering works is 15%. For the absence of EU funds, we expect partial compensation from higher investment in national road network reconstruction. Money collected every year by vehicle owners for using national roads, should all be used for their maintenance and reconstruction, which was not the case in previous years. There is also a public discussion taking place regarding the implementation of the new infrastructure tax on liquid fuels, specifically created for this purpose.
SLOVENIA
66
CO
NS
TRU
CTI
ON
AC
TIV
ITY
IN E
UR
OP
E -
ED
ITIO
N 2
016

INVESTMENT IN CONSTRUCTION
Housebuilding Non residential Civil Engineering Total Construction
2007 = 100
‘07
‘08
‘09
‘10
‘11
‘12
‘13
‘14
2015
a
2016
b
€ 39
BILLION 2,063,000
GDP 2015
POPULATION 2015
PER CENT VARIATION OF PRODUCTION IN REAL TERMS OF PREVIOUS YEAR
production Mln. €
fixed prices variation of production on previous year (%)
Sectors 2015a 2012 2013 2014 2015a 2016b
1. Building 580 34.6 -13.4 -10.6 -2.9 -26.2
1.1. Housebuilding 160 37.8 -9.7 -10.4 -10.7 -28.4
1.1.1. New 80 9.8 -19.8 -12.5 -10.7 -30.0
1.1.2. R&M 79 112.4 4.2 -8.2 -10.7 -26.7
1.2. Non residential 410 33.3 -14.9 -10.8 -1.7 -25.5
1.2.1. Private NA NA NA NA NA NA
1.2.2. Public NA NA NA NA NA NA
2. Civil Engineering 1,048 31.0 5.1 30.4 -9.0 -15.2
(1 + 2) Total Construction 1,621 32.8 -3.9 12.8 -7.3 -18.8
a: estimate - b: forecast
NUMBER OF BUILDING PERMITS IN RESIDENTIAL CONSTRUCTION
2012 2013 2014 2015a 2016b
single dwelling 2,206 2,398 2,215 2,356 2,427
collective dwelling 833 632 344 259 246
other types of dwelling 12 20 19 18 18
Total 3,051 3,050 2,578 2,633 2,691
(Collective dwellings and other types of buildings: in number of flats)
140
120
100
80
60
40
20
SLOVENIA
20
40
60
80
100
120
140
67
CO
NS
TRU
CTI
ON
AC
TIV
ITY
IN E
UR
OP
E -
ED
ITIO
N 2
016

1. Overall construction activity
The United Kingdom continued in its track record of economic growth during 2015, albeit at a slower pace. The UK economy grew by 2.2% in 2015, compared to 2.5% registered in 2014. Unemployment continued to fall to record lows from 5.8% in 2014 to 5.1% in 2015.
The Conservative Party, led by Prime Minister David Cameron, secured an overall majority in the House of Commons at the 2015 General Election. This allowed Cameron to form a majority Conservative government and push ahead with the UK’s renegotiation of its EU membership. An agreement was reached at the European Council of February 2016. The deal reached at that summit will be put before a referendum of the British people on 23 June 2016, where it will be decided whether the UK will remain a member of the EU.
There were 2.11 million workers employed in construction as of Q3 2015. Although this means that 10,000 more people joined the construction industry in 2014-2015, it made up 6.2% of total UK jobs in 2015 as opposed to 6.3% in 2014. On the other hand, construction amounted to 6.5% of the UK economy in 2014, up from 6.1 in 2013.
2. Housebuilding
The UK continues to be affected by an acute housing shortage. The housing demand is far greater than the current supply, thereby pushing property prices to record highs.
It has been repeatedly estimated that the UK needs to build at least 245,000 new homes each year to bridge the gap and satisfy the current demand rate, but recent statistics from the Department for Communities and Local Government showed that just 152,450 new dwellings were completed in 2015. The great part of these home completions came from the private sector, which delivered 118,070 new homes.
In terms of economic output, new housing brought a total of €35.95 billion in 2015. The largest share (83.5%) of this output continued to come from the private sector with €30.05 billion.
3. Non-residential buildings
UK construction output for non-residential building amounted to €65.45 billion in 2015, compared to €64.58 billion in 2014. Overall, €47.89 billion came from the private sector and €17.56 billion came from the public sector.
4. Civil engineering
Infrastructure output across 2015 increased to €22.48 billion from €16.78 billion in 2016. There are certain factors that must be taken into account when assessing these figures.
The planning of the high-speed railway link between London and the North has generated much interest both on the side of local contractors and large construction firms. It is likely that infrastructure and civil engineering output will increase greatly over the next five years. At the same time, the prolonged decision-making process over airport expansion in London and the south-east constitutes a relatively significant block to further infrastructure capacity growth. A decision is expected after July 2016
UNITED KINGDOM
68
CO
NS
TRU
CTI
ON
AC
TIV
ITY
IN E
UR
OP
E -
ED
ITIO
N 2
016

INVESTMENT IN CONSTRUCTION
Housebuilding Non residential Civil Engineering Total Construction
2007 = 100
‘07
‘08
‘09
‘10
‘11
‘12
‘13
‘14
2015
a
2016
b
€ 2,577
BILLION 64,597,000
GDP 2015
POPULATION 2015
PER CENT VARIATION OF PRODUCTION IN REAL TERMS OF PREVIOUS YEAR
production Mln. €
fixed prices variation of production on previous year (%)
Sectors 2015a 2012 2013 2014 2015a 2016b
1. Building 163,316 -4.7 4.9 11.5 5.7 NA
1.1. Housebuilding 65,368 -1.7 7.4 20.2 3.6 NA
1.1.1. New 35,954 -4.9 10.8 32.1 6.5 NA
1.1.2. R&M 29,414 1.3 4.3 8.9 0.3 NA
1.2. Non residential 65,458 -6.9 2.4 8.3 1.3 NA
1.2.1. Private 47,896 -3.3 4.1 10.3 3.6 NA
1.2.2. Public 17,562 -14.1 -1.2 3.6 -4.3 NA
2. Civil Engineering 22,486 -7.9 7.2 -2.4 34.0 NA
(1 + 2) Total Construction 185,802 -5.1 5.2 9.9 8.5 NA
a: estimate - b: forecast
NUMBER OF BUILDING STARTS IN RESIDENTIAL CONSTRUCTION
2012 2013 2014 2015a 2016b
single dwelling 76,000 NA NA NA NA
collective dwelling 39,000 NA NA NA NA
other types of dwelling NA NA NA NA NA
Total 115,000 149,662 163,932 NA NA
(Collective dwellings and other types of buildings: in number of flats)
240
220
200
180
160
140
120
100
80
60
UNITED KINGDOM
60
80
100
120
140
160
180
200
220
240
69
CO
NS
TRU
CTI
ON
AC
TIV
ITY
IN E
UR
OP
E -
ED
ITIO
N 2
016
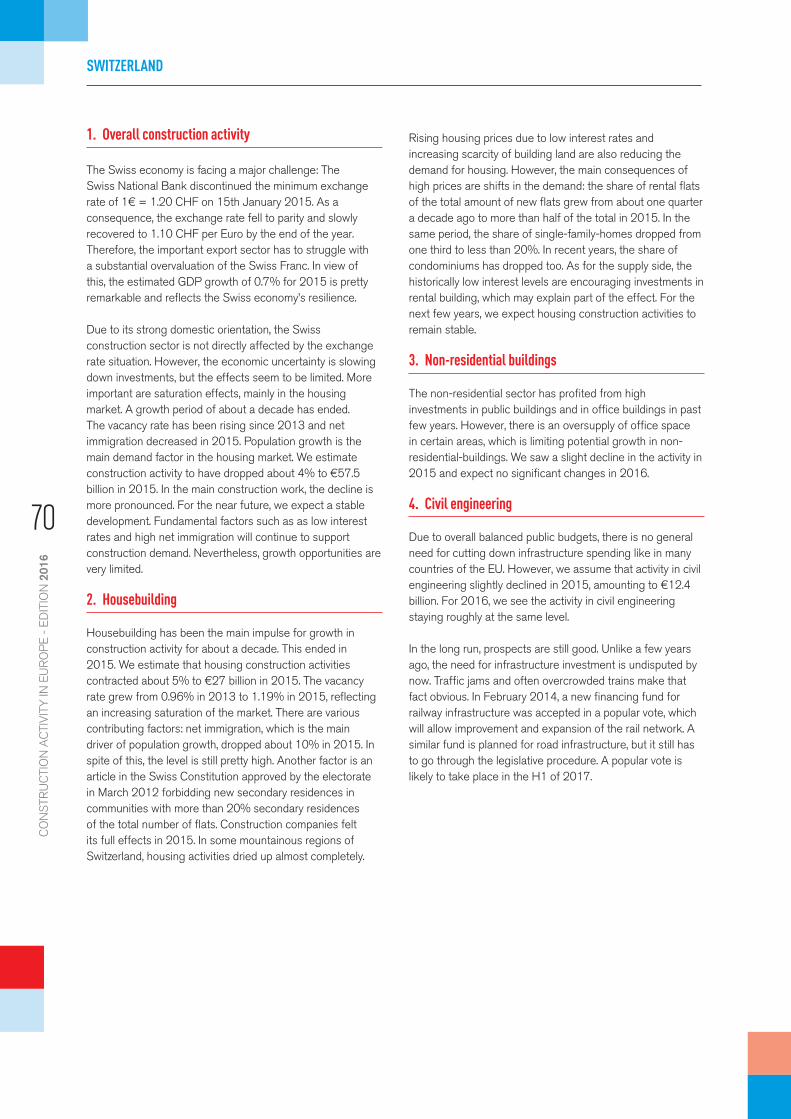
1. Overall construction activity
The Swiss economy is facing a major challenge: The Swiss National Bank discontinued the minimum exchange rate of 1€ = 1.20 CHF on 15th January 2015. As a consequence, the exchange rate fell to parity and slowly recovered to 1.10 CHF per Euro by the end of the year. Therefore, the important export sector has to struggle with a substantial overvaluation of the Swiss Franc. In view of this, the estimated GDP growth of 0.7% for 2015 is pretty remarkable and reflects the Swiss economy’s resilience.
Due to its strong domestic orientation, the Swiss construction sector is not directly affected by the exchange rate situation. However, the economic uncertainty is slowing down investments, but the effects seem to be limited. More important are saturation effects, mainly in the housing market. A growth period of about a decade has ended. The vacancy rate has been rising since 2013 and net immigration decreased in 2015. Population growth is the main demand factor in the housing market. We estimate construction activity to have dropped about 4% to €57.5 billion in 2015. In the main construction work, the decline is more pronounced. For the near future, we expect a stable development. Fundamental factors such as as low interest rates and high net immigration will continue to support construction demand. Nevertheless, growth opportunities are very limited.
2. Housebuilding
Housebuilding has been the main impulse for growth in construction activity for about a decade. This ended in 2015. We estimate that housing construction activities contracted about 5% to €27 billion in 2015. The vacancy rate grew from 0.96% in 2013 to 1.19% in 2015, reflecting an increasing saturation of the market. There are various contributing factors: net immigration, which is the main driver of population growth, dropped about 10% in 2015. In spite of this, the level is still pretty high. Another factor is an article in the Swiss Constitution approved by the electorate in March 2012 forbidding new secondary residences in communities with more than 20% secondary residences of the total number of flats. Construction companies felt its full effects in 2015. In some mountainous regions of Switzerland, housing activities dried up almost completely.
Rising housing prices due to low interest rates and increasing scarcity of building land are also reducing the demand for housing. However, the main consequences of high prices are shifts in the demand: the share of rental flats of the total amount of new flats grew from about one quarter a decade ago to more than half of the total in 2015. In the same period, the share of single-family-homes dropped from one third to less than 20%. In recent years, the share of condominiums has dropped too. As for the supply side, the historically low interest levels are encouraging investments in rental building, which may explain part of the effect. For the next few years, we expect housing construction activities to remain stable.
3. Non-residential buildings
The non-residential sector has profited from high investments in public buildings and in office buildings in past few years. However, there is an oversupply of office space in certain areas, which is limiting potential growth in non-residential-buildings. We saw a slight decline in the activity in 2015 and expect no significant changes in 2016.
4. Civil engineering
Due to overall balanced public budgets, there is no general need for cutting down infrastructure spending like in many countries of the EU. However, we assume that activity in civil engineering slightly declined in 2015, amounting to €12.4 billion. For 2016, we see the activity in civil engineering staying roughly at the same level.
In the long run, prospects are still good. Unlike a few years ago, the need for infrastructure investment is undisputed by now. Traffic jams and often overcrowded trains make that fact obvious. In February 2014, a new financing fund for railway infrastructure was accepted in a popular vote, which will allow improvement and expansion of the rail network. A similar fund is planned for road infrastructure, but it still has to go through the legislative procedure. A popular vote is likely to take place in the H1 of 2017.
SWITZERLAND
70
CO
NS
TRU
CTI
ON
AC
TIV
ITY
IN E
UR
OP
E -
ED
ITIO
N 2
016

INVESTMENT IN CONSTRUCTION
Housebuilding Non residential Civil Engineering Total Construction
2007 = 100
‘07
‘08
‘09
‘10
‘11
‘12
‘13
‘14
2015
a
2016
b
€ 582
BILLION 8,340,000
GDP 2015
POPULATION 2015
PER CENT VARIATION OF PRODUCTION IN REAL TERMS OF PREVIOUS YEAR
production Mln. €
fixed prices variation of production on previous year (%)
Sectors 2015a 2012 2013 2014 2015a 2016b
1. Building 43,724 4.7 7.3 -2.5 -3.0 -1.0
1.1. Housebuilding 26,298 3.7 6.6 -1.9 -4.0 -1.0
1.1.1. New 19,250 3.9 6.3 -1.8 -3.1 -1.5
1.1.2. R&M 7,048 2.9 7.4 -2.3 -6.5 0.5
1.2. Non residential 17,426 6.3 8.3 -3.3 -1.5 -1.0
1.2.1. Private 10,770 5.9 12.3 -3.3 -1.5 -1.0
1.2.2. Public 6,655 6.8 2.5 -3.3 -1.5 -1.0
2. Civil Engineering 12,037 8.5 0.0 -1.7 -2.0 0.0
(1 + 2) Total Construction 55,760 5.5 5.6 -2.3 -2.8 -0.8
a: estimate - b: forecast
NUMBER OF BUILDING PERMITS IN RESIDENTIAL CONSTRUCTION
2012 2013 2014 2015a 2016b
single dwelling 10,500 9,500 7,500 7,100 6,800
collective dwelling 43,800 46,500 47,000 45,600 46,000
other types of dwelling NA NA NA NA NA
Total 54,300 56,000 54,500 52,700 52,800
(Collective dwellings and other types of buildings: in number of flats)
130
120
110
100
90
SWITZERLAND
90
100
110
120
130
71
CO
NS
TRU
CTI
ON
AC
TIV
ITY
IN E
UR
OP
E -
ED
ITIO
N 2
016

1. Overall construction activity
Total construction activity amounted to €54 billion in current market prices in 2014, which gives a yearly volume growth of 1.7%. All growth rates in the following text concerning Norway are measured in constant prices, and hence depict the volume growth. Our estimate for 2015 is €56.6 billion in current prices, and the forecast for 2016 shows €59 billion. The average exchange rate between NOK and EUR in 2010; 1€=8.0NOK, has been used. We estimate that total construction output grew moderately by 2.3% in 2015.
The drop in demand for new non-residential buildings from the private business sector seems to have been neutralised by increased demand for new dwellings and R&M works on existing dwellings from the household sector, as well as increased demand from the public sector. Thus, the overall building activity is in fact expected to grow weakly by 1.4% in 2016. Thanks to a civil engineering boom, we expect the total construction output to grow by 4.2% in 2016. The Government is on a mission to improve Norway’s substandard road- and railway infrastructure, and the production of new energy plants and power lines is increasing strongly.
Slower economic growth caused by the sharp drop in petroleum investments is the explanation behind reduced demand for new buildings from the business sector, but so far, it seems that the problems in the oil and gas sector will only moderately affect demand for construction works from the public and household sector.
Estimated total employment in construction was 206,000 people in 2015, which is a 3% increase from 2014. In 2016, we expect 2% growth in total construction employment.
2. Housebuilding
The housing demand has been strong in recent years, but several bottlenecks on the supply side have limited housing construction. Norway holds a (not-so-glamorous) top position among OECD-countries in terms of the number of days to process a building permit application. With around 220 days on average, we are clearly in the lead as the slowest country, ahead of Poland in second place with 180 days. As a result of this, housing starts have been limited to 27,800 units on average each year in the period 2010-2015. Despite prospects of weaker contributions from economic and demographic demand drivers, strong growth in house prices in 2015 indicates that the fundamentals of demand for new housing are present. We believe that there is demand enough to start at least 30,500 dwellings in 2016. We forecast that 9,150 of these will be single dwellings, 19,825 will be collective dwellings and the rest will be in the category “other”.
Considering the housing market in monetary terms, investments in new residential construction (dwellings, garages and holiday houses) is estimated at €12.4 billion (current market prices) in 2015. This represents an annual growth of only 1.2%. The forecast for 2016 is however somewhat brighter, we expect 3.3% growth in investments in new residential construction.
The R&M market for residential buildings is estimated at €6.2 billion in 2015 (current market prices), which gives an annual growth of 3%. In 2016, we expect that a weaker growth in both consumption and in households’ disposable income will lead to a weaker growth in R&M residential of around 1.5%.
3. Non-residential buildings
Slower economic growth with subsequent higher unemployment will result in reduced demand for new offices, commercial buildings and other non-residential buildings for the private sector. Demand from the public sector is more or less unaffected by the economic slowdown, and planned projects should in general be carried out.
We estimate that the investments in new private non-residential buildings declined by 10.5% (measured in constant prices) in 2015, and we forecast a further decline of 5% in 2016. On the other hand, investments in new public non-residential buildings increased by 18.5% in 2015, and we expect a further small growth of 1.6% in 2016.
Development in the R&M non-residential market is more stable, and we estimate growth of around 3.7% in 2015 and forecast a further 2.2% growth in 2016. The R&M market has been more affected by repair works after damages related to natural disasters in recent years. Additionally, political measures aimed at improving energy efficiency in existing buildings are stimulating demand and thus contributing to growth in the R&M-markets.
Construction output (investments and R&M) in non-residential buildings is estimated at €21.6 billion in 2015 (measured in current market prices), which represents a low annual growth of 1.6%.
4. Civil engineering
This market has been growing at impressive rates for the last 10 years. Growth seems to have been somewhat weaker in 2015, but still solid - about 4% for new investments and maintenance as a total. Total civil engineering activity is estimated at €16.4 billion in current market prices in 2015. It seems that the real boom will come in 2016, when we expect 15% growth in investments and 2.7% growth in maintenance. Road works, energy works and investments in water works and sewage systems, in harbours and airfields, will be the main drivers and will counteract the negative effects of declining railway investments.
NORWAY
72
CO
NS
TRU
CTI
ON
AC
TIV
ITY
IN E
UR
OP
E -
ED
ITIO
N 2
016

INVESTMENT IN CONSTRUCTION
Housebuilding Non residential Civil Engineering Total Construction
2007 = 100
‘07
‘08
‘09
‘10
‘11
‘12
‘13
‘14
2015
a
2016
b
€ 410
BILLION 5,166 ,000
GDP 2015
POPULATION 2015
PER CENT VARIATION OF PRODUCTION IN REAL TERMS OF PREVIOUS YEAR
production Mln. €
fixed prices variation of production on previous year (%)
Sectors 2015a 2012 2013 2014 2015a 2016b
1. Building 34,804 4.4 -0.7 -0.3 1.7 1.4
1.1. Housebuilding 15,972 6.5 2.8 -4.4 1.8 2.7
1.1.1. New 10,613 7.2 4.1 -7.8 1.2 3.3
1.1.2. R&M 5,359 5.1 0.1 3.2 3.0 1.5
1.2. Non residential 18,832 2.7 -3.7 3.5 1.6 0.3
1.2.1. Private 12,022 3.0 -5.1 3.1 -2.5 -0.7
1.2.2. Public 6,810 1.9 -0.6 4.2 9.7 2.0
2. Civil Engineering 14,139 10.3 4.5 7.0 3.7 11.3
(1 + 2) Total Construction 48,943 5.9 0.7 1.7 2.3 4.2
a: estimate - b: forecast
NUMBER OF BUILDING PERMITS IN RESIDENTIAL CONSTRUCTION
2012 2013 2014 2015a 2016b
single dwelling 8,772 8,704 8,369 9,150 9,300
collective dwelling 20,454 21,113 19,235 19,825 20,150
other types of dwelling 1,648 1,612 1,793 1,525 1,550
Total 30,874 31,429 29,397 30,500 31,000
(Collective dwellings and other types of buildings: in number of flats)
200
180
160
140
120
100
80
60
NORWAY
60
80
100
120
140
160
180
200
73
CO
NS
TRU
CTI
ON
AC
TIV
ITY
IN E
UR
OP
E -
ED
ITIO
N 2
016
1. Overall construction activity
The construction sector has been at the forefront of Turkey’s economic development over the last decade. The industry accounts for almost 5% on average of total GDP, and employs nearly 2 million people. When the sector’s direct and indirect impact on related industries, such as building materials, construction machinery, engineering and architecture, are taken into account, the share of the sector in the overall economy reaches 30%.
Despite recent economic slowdown in the country, the construction sector looks to continue its moderate growth in the coming years due to the government’s programme of urban renewal and a string of large-scale infrastructure projects, in line with the corresponding high rates of population growth and urbanisation.
In correlation with the GDP growth trend, the Turkish construction sector output has fluctuated over the recent years. According to the Turkish Statistical Institute (TurkStat) data, construction growth shrank from 2.2% in 2014 to 1.7% in 2015. Thus, the growth of the construction sector was relatively low in comparison to the growth of the overall economy, which accounted for 4% in 2015.
To date,Turkish contractors have completed almost 8,800 projects in 5 continents and 108 countries with a total business volume of USD 326 billion. Almost 90% of the works are undertaken in North Africa, Eurasia and the Middle East.
2. Housebuilding
Due to the growing population in recent years, urbanisation, increased levels of income and improved standards of living, demand for real estate is constantly increasing in the country. Thus, the residential market registered a peak in 2015 with an increase of housing sales of 10.6% in comparison with the previous year.
Moreover, residential property sales to foreigners increased by 20.4% in 2015. According to data released by TurkStat, half of the 22,830 properties sold to foreigners in Turkey, were sold to Iraqis, Saudis, Kuwaitis, Russians and British.
On the other hand, two general elections in 2015 and the period of uncertainty in the Turkish economy afterwards, resulted in a decrease in the supply of housing.
TurkStat figures show that 866,800 building permits for housing units were issued in 2015, a 15.5% decrease in comparison with 2014.
Moreover, in 2015 the number of housing units with occupancy certificates decreased by 6% compared to 2014.
As for the renovation of unsafe housing in earthquake-prone regions, the Urban Transformation Programme introduced by the government in 2012 slowed down in 2015, whereas large scale qualified housing projects were replaced by demolition and reconstruction of single buildings.
3. Non-residential buildings
Office building construction growth has also been increasing in recent years.
The Istanbul Finance Centre Project is underway on the Anatolian side of Istanbul. According to projections, the Centre will create a financial district in Istanbul which will provide employment for 30,000 people. Once completed, the financial district will be larger than its counterparts in New York and London.
On the other hand, the retail and wholesale construction market decreased by almost 30% from 4,476 building permits issued in 2014 to 3,142 building permits in 2015. Moreover, 5,710 occupancy certificates were issued in 2015, showing a 26% decrease in comparison with 2014.
Hotel construction experienced negative growth in 2015 as well. Ukraine-related economic sanctions against Russia, escalating security concerns in the region, and the turmoil in Syria caused big falls in hotel reservations by foreign visitors and led to the sharp decrease in the number of building permits and occupancy certificates for hotel buildings issued in 2015 by 41% and 55% respectively.
4. Civil engineering
There is an increasing involvement of the private sector in civil engineering projects in Turkey.
During the last few years, the private sector has undertaken some major infrastructure projects in energy, transport, health and communication fields under the PPP model. By the end of 2015, the total volume of investment in these projects, that had already been put out to tender amounted to USD 36 billion. The civil engineering production index in construction for 2014 reached 107.9 units (base year 2010 = 100), recording a decrease of nearly 11% over 2013, whereas 2015 figures increased by almost 8% compared to 2014.
The Third Istanbul Airport, the Third Bosphorus Bridge, several health centres and energy production projects are considered to be the largest ongoing projects. Large-scale infrastructure investments are projected to continue in 2016 as well, with port, high-speed railway, subway and highway projects.
TURKEY
74
CO
NS
TRU
CTI
ON
AC
TIV
ITY
IN E
UR
OP
E -
ED
ITIO
N 2
016

INVESTMENT IN CONSTRUCTION
2010 = 100
Housebuilding Civil Engineering Total Construction
‘07
‘08
‘09
‘10
‘11
‘12
‘13
‘14
2015
a
2016
b
€ 646
BILLION 78,741,000
GDP 2015
POPULATION 2015
NUMBER OF BUILDING PERMITS IN RESIDENTIAL CONSTRUCTION
2012 2013 2014 2015a 2016b
single dwelling 19,507 23,219 24,822 21,471 21,000
collective dwelling 747,919 812,919 1,001,416 845,343 825,000
other types of dwelling 4,452 3,492 4,446 3,701 3,500
Total 771,878 839,630 1,030,684 870,515 849,500
(Collective dwellings and other types of buildings: in number of flats)
140
130
120
110
100
90
80
70
TURKEY
70
80
90
100
110
120
130
140
DE
© M
arco
281
1 - f
otol
ia.c
om
75
CO
NS
TRU
CTI
ON
AC
TIV
ITY
IN E
UR
OP
E -
ED
ITIO
N 2
016

AT
Bundesinnung Bau – BI BauSchaumburgergasse 20/8AT – 1040 Wien
T (+43.1) 718.37.37.0F (+43.1) [email protected]://www.bau.or.at
Fachverband der Bauindustrie – FVBISchaumburgergasse 20/8AT – 1040 Wien
T (+43.1) 718.37.37.0F (+43.1) [email protected]://www.bau.or.at
Expert: Mr Peter Scherer
BE
Confédération Construction34-42 rue du LombardBE – 1000 Bruxelles
T (+32.2) 545.56.00F (+32.2) [email protected]://www.confederationconstruction.be
Expert: Mr Jean-Pierre Liebaert
BG
Bulgarian Construction Chamber – BCC6 Mihail Tenev Str.BG – 1784 Sofia
T (+359.2) 806.29.11 / 806.29.62F (+359.2) [email protected]://www.ksb.bg
Expert: Mrs Tatyana Bachvarova
CH
SBV SSESSIC
Schweizerischer Baumeisterverband Société Suisse des Entrepreneurs Società Svizzera degli Impresari-CostruttoriSocietad Svizra dals Impressaris-Constructurs
Schweizerischer Baumeisterverband – SBVSociété Suisse des Entrepreneurs – SSEWeinbergstraße 49 – Postfach 198CH – 8042 Zürich
T (+41.44) 258.81.11F (+41.44) [email protected]://www.baumeister.ch
Expert: Mr Silvan Müggler
CY
Federation of the Building ContractorsAssociations of Cyprus – OSEOK3A, Androcleous Str.CY – 1060 Nicosia
T (+357.22) 75.36.06F (+357.22) [email protected]://www.oseok.org.cy
Expert: Mrs Lefki Pantelidou Kosta
CZ
Association of Building Entrepreneursof the Czech Republic – SPS(-12/2014)
Expert: Mr George Skala
DE
Hauptverband der DeutschenBauindustrie e.V. – HDBKurfürstenstraße 129DE – 10785 Berlin
T (+49.30) 212.86.0F (+49.30) 212.86.240 [email protected]://www.bauindustrie.de
Expert: Mr Heinrich Weitz
Zentralverband des DeutschenBaugewerbes – ZDBKronenstraße 55-58DE – 10117 Berlin
T (+49.30) 20.31.40F (+49.30) [email protected]://www.zdb.de
Expert: Mr Andreas Geyer
DK
Dansk ByggeriNørre Voldgade 106Postboks 2125DK – 1358 Kobenhavn K
T (+45) 72 16 00 00F (+45) 72 16 00 [email protected]://www.danskbyggeri.dk
Expert: Mr Finn Bo Frandsen
EE
Estonian Association of ConstructionEntrepreneurs (EACE)Pärnu mnt 141EE – 11314 Tallinn
T (+372) 687 04 35F (+372) 687 04 [email protected]://www.eeel.ee
ES
Confederación Nacional de la Construcción – CNCC/ Diego de León 50ES – 28006 Madrid
T (+34.91) 562.45.85 / 561.97.15F (+34.91) [email protected]://www.cnc.es
Expert: Mr José-María Duelo
FI
Confederation of Finnish ConstructionIndustries – RTUnioninkatu 14 – PO Box 381FI – 00131 Helsinki 13
T (+358.9) 129.91F (+358.9) 628 [email protected]://www.rakennusteollisuus.fi/
Expert: Mr Sami Pakarinen
FR
Fédération Française du Bâtiment – FFB33 avenue KléberFR – 75784 Paris Cedex 16
T (33-1) 40.69.51.00F (33-1) [email protected]://www.ffbatiment.fr
Expert: Mr Loïc Chapeaux
Fédération Nationale des Travaux Publics –FNTP3 rue de BerriFR – 75008 Paris
T (33-1) 44.13.31.44F (33-1) [email protected]://www.fntp.fr
Expert: Mr Jean-Philippe Dupeyron
LIST OF THE EXPERTS
76
CO
NS
TRU
CTI
ON
AC
TIV
ITY
IN E
UR
OP
E -
ED
ITIO
N 2
016
LIST OF THE EXPERTS
GR
Association Panhellénique des IngénieursDiplômés Entrepreneurs de Travaux Publics –PEDMEDE23 rue AsklipiouGR – 106 80 Athènes
T (+30) 2.10 361.49.78F (+30) 2.10 [email protected]://www.pedmede.gr
Experts: Ms Eleni PapagianniMr Alkiviadis PapadopoulosMr Efstratios Zissimopoulos
HR
HUP – UPGRadnička cesta 52HR – 10 000 Zagreb
T (+385 1) 4897.580F (+385 1) [email protected]://www.hup.hr
Experts: Mr Zdenek Karakas Ms Tatjana Gracic
HU
National Federation of HungarianContractors – ÉVOSZDöbrentei tér 1.HU – 1013 Budapest
T (+36.1) 201.03.33F (+36.1) [email protected]://www.evosz.hu
Expert: Mr Zoltán Pete
IE
Construction Industry Federation –CIF Construction HouseCanal RoadIE – Dublin 6
T (+353.1) 40.66.000F (+353.1) [email protected]://www.cif.ie
Expert: Ms Jeanette Mair
IT
Associazione Nazionale Costruttori Edili – ANCEVia Guattani 16-18IT – 00161 Roma
T (+39.06) 84.56.71F (+39.06) 84 56 75 [email protected]://www.ance.it
Expert: Mrs Anna Bimbo
LT
Lithuanian Builders Association – LSALukiškių st. 5-501, 502LT – 01108 Vilnius
T (+370) 52 12 59 01F (+370) 52 12 59 [email protected]://www.statybininkai.lt
LU
Groupement des Entrepreneurs du Bâtiment etdes Travaux Publics – GEBTP7 rue Alcide de GasperiLU – 1615 Luxembourg
T (+352) 43.53.66F (+352) [email protected]://www.fedil.lu
Expert: Mr Pol Faber
NL
Bouwend NederlandPostbus 340NL – 2700 AH Zoetermeer
T (+31-79) 325 22 52F (+31-79) 325 22 [email protected]://www.bouwendnederland.nl
Expert: Mr Wim Schreurs
NO
Entreprenørforeningen – Bygg og AnleggEBAP.O. Box 5485 MajorstuaNO – 0305 Oslo
T (+47) 23 08 75 00F (+47) 23 08 75 [email protected]://www.eba.no
Experts: Mrs Siw LinderudMrs Torild Engh
PL
Korporacja Przedsiebiorcow BudowlanychKPB UNI-BUD(-12/2014)
PT
Portuguese Federation of construction andpublic works’ industry – FEPICOPPraça de Alvalade, n.º 6, 7º FtePT – 1700 – 036 Lisboa
T (+351.21) 311 02 00F (+351.21) 355 48 [email protected]://www.fepicop.pt
Experts: Mr António Manzoni de SequeiraMr Paulo Lobo
RO
The Romanian Association of BuildingContractors – ARACO17 Papiu Ilarian Streetcod 031691, Sector 3RO – Bucharest
T (+40.21) 316.78.96F (+40.21) [email protected]://www.araco.org
Expert: Mrs Cristina Driga
SE
Sveriges Byggindustrier – BIStorgatan 19BOX 5054SE – 102 42 Stockholm
T (+46.8) 698 58 00F (+46.8) 698 59 [email protected]://www.bygg.org/
Expert: Mr Fredrik Isaksson
SI
Chamber of Construction and BuildingMaterials Industry of Slovenia - CCBMISDimiceva 13SI – 1504 Ljubljana
T (+386 1) 58 98 242F (+386 1) 58 98 [email protected]://www.gzs.si
Expert: Mr Jože Renar
77
CO
NS
TRU
CTI
ON
AC
TIV
ITY
IN E
UR
OP
E -
ED
ITIO
N 2
016

LIST OF THE EXPERTS
SK
Zvaz stavebnych podnikatelovSlovenska ZSPSSabinovska 14SK – 821 02 Bratislava
T (+421.2) 43 633 263F (+421.2) 43 426 336E [email protected]://www.zsps.sk
TR
Turkish Contractors Association – TCABirlik Mahallesi, Dogukent Bulvari, 447. Sokak No. 4TR – 06610 Cankaya-Ankara
T (+90.312) 439.17.12/13F (+90.312) 440.02.53E [email protected]://www.tmb.org.tr
Expert: Ms Cigdem Cinar
UK
National Federation of Builders
National Federations of Builders — NFBSpectrum House, Suite AF29,Beehive Ring Road, Gatwick, UK -West Sussex, RH6 0LG
T (+44) 8450 578160 / 1293 586540F (+44) 8450 578161 / 1293 [email protected]://www.builders.org.uk
Expert: Mr Giorgio Buttironi
Associate Members:
EFFC
European Federation of Foundation ContractorsForum Court83 Copers Cope RoadBeckenhamGB – Kent BR3 1NR
T (+44.208) 663.09.48F (+44.208) [email protected]://www.effc.org
EQAR
European Quality Association for Recycling e.V.Kronenstraße 55-58DE – 10117 Berlin
T +49.30) 203.14.575F (+49.30) [email protected]://www.eqar.info
Member of:
CICA
Confederation of International Contractors’ Associations 3 rue de BerriFR – 75008 Paris
T (+33) 1 58 56 44 20F (+33) 1 58 56 44 [email protected]:// www.cica.net
In Close Cooperation with:
EIC
European International Contractors Kurfürstenstrasse 129DE – 10785 Berlin
T (+49) 30 212 86 244F (+49) 30 212 86 285E-mail: [email protected]://www.eicontractors.de
Cooperation Agreement:
NFB
National Federation of Builders
National Federations of BuildersSpectrum House, Suite AF29,Beehive Ring Road, Gatwick, UK -West Sussex, RH6 0LG
T (+44) 8450 578160 / 1293 586540F (+44) 8450 578161 / 1293 [email protected]://www.builders.org.uk
78
CO
NS
TRU
CTI
ON
AC
TIV
ITY
IN E
UR
OP
E -
ED
ITIO
N 2
016

Coordination / Coordination / KoordinationChristine Le Forestier - FIEC
Domenico Campogrande - FIEC
Design inextremis.be
Traduction / Translation / Übersetzung DSDB, Bruxelles

EUROPEAN CONSTRUCTIONINDUSTRY FEDERATION
Avenue Louise 225BE-1050 BrusselsT +32(0)2 514.55.35T +32(0)2 [email protected]
CONSTRUCTION IS THE SOLUTION INDUSTRY
EMPLOYMENT
COMPETITIVENESS
ENVIRONMENT
IT-NETWORKS
WATER NETWORKS
ENERGY NETWORKS
SOCI
AL IN
FRAS
TRUC
TURE
ENERGY EFFICIENCYTRANSPORT INFRASTRUCTUREGROWTH
CLIM
ATE C
HANG
E INFRASTRUCTUREINNOVATION
RESOURCE EFFICIENCYRE
CYCL
ING
ENERGY PRODUCTIONSK
ILLS
TRAI
NING
/EDU
CATI
ON
STANDARDISATION
JOBS
YOUTH EMPLOYMENT
Pho
to: P
akhn
yush
chyy
- F
otol
ia.c
om
BIM
Related Documents