Construct validity of the Nutrition and Activity Knowledge Scale in a French sample of adolescents with mild to moderate intellectual disability Christophe Maı ¨ano a, *, Je ´ ro ˆme Be ´ garie b , Alexandre J.S. Morin c , Jean-Marie Garbarino d , Gre ´ gory Ninot b a UMR 6233 ‘‘Institute of Movement Sciences, Etienne-Jules Marey’’, CNRS-University of Aix-Marseille II, 163 Avenue de Luminy, CP 910, 13288 Marseille, France b University of Montpellier I, EA 4206 ‘‘Addictive, Performance and Health Behaviors’’, Montpellier, France c University of Sherbrooke, Department of Psychology, Sherbrooke, Que ´bec, Canada d University of Nice Sophia-Antipolis, Laboratory ‘‘Human motricity, Education, Health’’, Nice, France 1. Introduction International research among adults with Intellectual Disability (ID) showed that they tend to present higher rates of obesity, ranging from 13% to 58%, compared to the rates observed in non-ID individuals, ranging from 3.6% to 28% (for reviews see Melville, Hamilton, Hankey, Miller, & Boyle, 2007; Rimmer & Yamaki, 2006). These results have also been more recently confirmed in various samples of adolescents with ID. Indeed, scholars from several countries (i.e. Australia, China, France, Ireland, Japan, Taiwan, and United States of America) reported an overall prevalence of obesity in youth with ID ranging from 7% to 21.9% (Bandini, Curtin, Hamad, Tybor, & Must, 2005; Be ´ garie, Maı ¨ano, Ninot, & Aze ´ ma, 2009; De, Small, & Research in Developmental Disabilities 31 (2010) 232–242 ARTICLE INFO Article history: Received 6 September 2009 Accepted 16 September 2009 Keywords: Knowledge Cross-validation Health Nutrition Physical activity Gender Age School placement Intellectual disability level ABSTRACT The purpose of this study was to test the reliability (i.e. internal consistency and test– retest reliability) and construct validity (i.e. content validity, factor validity, measurement invariance, and latent mean invariance) of the Nutrition and Activity Knowledge Scale (NAKS) in a sample of French adolescents with mild to moderate Intellectual Disability (ID). A total sample of 260 adolescents (144 boys and 116 girls), aged between 12 and 18 years old, with mild to moderate ID was involved in two studies. In the first study, analysis of items’ content reveals that many words from the original version were not understood or induced confusion. These items were reworded and simplified while retaining their original meaning. In the second study, results provided support for: (i) the factor validity and reliability of a 15-item French version of the NAKS; (ii) the measurement invariance of the resulting NAKS across genders and ID levels; (iii) the partial measurement invariance of the resulting NAKS across age groups and type of school placement. In addition, the latent means of the 15-item French version of the NAKS proved to be invariant across gender, age categories, and ID levels, but to vary across type of school placement (with adolescents schooled in self-contained classes from regular schools presenting higher levels of NAK than adolescents placed in specialized establishments). The present results thus provide preliminary evidence regarding the construct validity of a 15-item French version of the NAKS in a sample of adolescents with ID. ß 2009 Elsevier Ltd. All rights reserved. * Corresponding author. Tel.: +33 491 759 653; fax: +33 491 170 415. E-mail address: [email protected] (C. Maı ¨ano). Contents lists available at ScienceDirect Research in Developmental Disabilities 0891-4222/$ – see front matter ß 2009 Elsevier Ltd. All rights reserved. doi:10.1016/j.ridd.2009.09.012

Welcome message from author
This document is posted to help you gain knowledge. Please leave a comment to let me know what you think about it! Share it to your friends and learn new things together.
Transcript
Construct validity of the Nutrition and Activity Knowledge Scale in aFrench sample of adolescents with mild to moderate intellectualdisability
Christophe Maıano a,*, Jerome Begarie b, Alexandre J.S. Morin c,Jean-Marie Garbarino d, Gregory Ninot b
a UMR 6233 ‘‘Institute of Movement Sciences, Etienne-Jules Marey’’, CNRS-University of Aix-Marseille II, 163 Avenue de Luminy, CP 910, 13288 Marseille, Franceb University of Montpellier I, EA 4206 ‘‘Addictive, Performance and Health Behaviors’’, Montpellier, Francec University of Sherbrooke, Department of Psychology, Sherbrooke, Quebec, Canadad University of Nice Sophia-Antipolis, Laboratory ‘‘Human motricity, Education, Health’’, Nice, France
1. Introduction
International research among adults with Intellectual Disability (ID) showed that they tend to present higher rates ofobesity, ranging from 13% to 58%, compared to the rates observed in non-ID individuals, ranging from 3.6% to 28% (forreviews see Melville, Hamilton, Hankey, Miller, & Boyle, 2007; Rimmer & Yamaki, 2006). These results have also been morerecently confirmed in various samples of adolescents with ID. Indeed, scholars from several countries (i.e. Australia, China,France, Ireland, Japan, Taiwan, and United States of America) reported an overall prevalence of obesity in youth with IDranging from 7% to 21.9% (Bandini, Curtin, Hamad, Tybor, & Must, 2005; Begarie, Maıano, Ninot, & Azema, 2009; De, Small, &
Research in Developmental Disabilities 31 (2010) 232–242
A R T I C L E I N F O
Article history:
Received 6 September 2009
Accepted 16 September 2009
Keywords:
Knowledge
Cross-validation
Health
Nutrition
Physical activity
Gender
Age
School placement
Intellectual disability level
A B S T R A C T
The purpose of this study was to test the reliability (i.e. internal consistency and test–
retest reliability) and construct validity (i.e. content validity, factor validity, measurement
invariance, and latent mean invariance) of the Nutrition and Activity Knowledge Scale
(NAKS) in a sample of French adolescents with mild to moderate Intellectual Disability
(ID). A total sample of 260 adolescents (144 boys and 116 girls), aged between 12 and 18
years old, with mild to moderate ID was involved in two studies. In the first study, analysis
of items’ content reveals that many words from the original version were not understood
or induced confusion. These items were reworded and simplified while retaining their
original meaning. In the second study, results provided support for: (i) the factor validity
and reliability of a 15-item French version of the NAKS; (ii) the measurement invariance of
the resulting NAKS across genders and ID levels; (iii) the partial measurement invariance
of the resulting NAKS across age groups and type of school placement. In addition, the
latent means of the 15-item French version of the NAKS proved to be invariant across
gender, age categories, and ID levels, but to vary across type of school placement (with
adolescents schooled in self-contained classes from regular schools presenting higher
levels of NAK than adolescents placed in specialized establishments). The present results
thus provide preliminary evidence regarding the construct validity of a 15-item French
version of the NAKS in a sample of adolescents with ID.
� 2009 Elsevier Ltd. All rights reserved.
* Corresponding author. Tel.: +33 491 759 653; fax: +33 491 170 415.
E-mail address: [email protected] (C. Maıano).
Contents lists available at ScienceDirect
Research in Developmental Disabilities
0891-4222/$ – see front matter � 2009 Elsevier Ltd. All rights reserved.
doi:10.1016/j.ridd.2009.09.012
Baun, 2008; Frey & Chow, 2006; Lin, Yen, Li, & Wu, 2005; Marshall, McConkey, & Moore, 2003; Takeuchi, 1994). These ratesagain tended to be higher than those observed in the general population (i.e. 6% for non-ID and 15% for ID).
Among the potential determinants that may be especially important in the etiology of obesity in adults or adolescentswith ID is lack of knowledge about healthy lifestyle behaviors (Melville et al., 2007; Rimmer, Rowland, & Yamaki, 2007).According to these authors, individuals with ID may have limited knowledge or understanding of the potential consequencesof the health risks associated with sometimes excessive and often inadequate nutritional choices and lower levels of physicalactivities. Nevertheless, very few studies have been published regarding the nutritional and exercise-related level ofknowledge of persons with ID in relation to their weight status. Indeed, to our knowledge, only two studies were performedon this topic during the last 10 years. The first of those was performed by Golden and Hatcher (1997) among a sample of 57adults (32 females, 25 males; Mage = 39.9, SDage = 10.8) with mild to moderate ID living in community-based residences. Inthis study the authors developed and adapted a questionnaire from a series of nutrition-related achievement tests developedby the National Dairy Council (1979). The 75 questions they used, which is a lot for individuals with ID, measured fivedifferent content areas of nutritional knowledge: (i) nutritional/physiological aspects of food; (ii) nutrients and food groups;(iii) fat, sugar and caloric content of food; (iv) weight and weight loss; and (v) exercise. Nevertheless, although they reportedacceptable reliability coefficients for the total scale score (a = .93), they did not test the factor structure of their instrument;which might be explained by the very low participants to item ratio. Results from this study reported that: (i) the overallscore of nutritional knowledge of this sample was acceptable (i.e. 65% of correct answers); (ii) the intellectual quotient (IQ)significantly and negatively predicted nutritional knowledge; (iii) the body mass index significantly and positively predictednutritional knowledge. The second study was performed by Jobling and Cuskelly (2006) among a sample of 38 adolescents(17 girls, 21 boys; Mage = 15.5, SDage = 2.29) with Down syndrome. A semi-structured interview, measuring health knowledgeand behaviors, was specifically developed by the researchers on the basis of various instruments (e.g. Social andPrevocational Information Battery, National Heart Foundation primary school health education materials). The 59 itemsfrom this interview focused on hygiene, substance use, exercise and healthy eating. In contrast to the results from Goldenand Hatcher (1997), this study revealed that knowledge about substance use, exercise, and healthy food was poor in thisyounger population.
One reason for the paucity of research in this area is the absence of available standardized and psychometrically soundassessment tools for quantifying nutritional and exercise-related knowledge among individuals (i.e. adolescents and adults)with ID. This led Illingworth, Moore and McGillivray (2003), on the basis of Golden and Hatcher’s (1997) questionnaire, todevelop and validate the Nutrition and Activity Knowledge Scale (NAKS). This instrument was ‘‘designed to assess the level of
knowledge that people with an intellectual disability have about nutrition: Nutrients and foods groups; fat, sugar and caloric
content of foods; weight and weight loss and the impact and benefits of activity and exercise on health’’ (p. 160). The factor validityand reliability of the NAKS was tested in a sample of 73 Australian adults with ID (35 females, Mage = 33.06, SDage = 8.51; 38males, Mage = 31.35, SDage = 9.82) recruited from four private facilities offering them training (i.e. employment and educationin literacy, etc.) and from one facility providing 24 h residential care. Information from the facilities records on theindividuals included in this sample revealed that 16% were having a severe ID, 73% a moderate ID and 11% a mild ID.Moreover, 10% of the respondents lived independently, 50% lived with their parents and 40 were in community residentialunits or assisted care hostels.
The original scale of this instrument comprised 35 items answered on a multiple-choice format, assessing two knowledgedimensions: (i) the Nutritional Value of Food (NVF) subscale, comprising 21 items (e.g. knowledge about foodcharacteristics), and (ii) the Weight and Weight Control (WWC) subscale, comprising 14 items (e.g. knowledge about thebenefits of exercises using sedentary and active prompts). Only one question is proposed per page and each of the multiple-choice answers are illustrated using colored ‘‘Clip art’’. Three fourth of the questions comprise four alternative illustrativeanswers presenting nutritional or physical activities alternatives. The picture comprising the correct answer is located indifferent positions on each of the pages to avoid a learning effect. Moreover, the same type of material was also covered inseveral questions to ‘‘reduce possible confounding of understanding the question (general intelligence) and recognition/familiarity
with the options offered’’ (p. 160). When the response is correct one point is assigned to the participant, and in case of incorrectresponses or failure to answer the question no point are deducted. Scores from the two subscales of the NAKS (i.e. NVF andWWC) are obtained by summing their respective questions and range from 0 to 21 and from 0 to 14, respectively. An overallscore can be calculated and range from 0 to 35. During the administration of the instrument, the interviewer poses therelevant questions and the participants are asked to point the picture that represented their answer.
The Principal Component Analysis (PCA) performed within the aforementioned sample provided support for a truncatedtwo factor 18-item version of the NAKS. In fact, 17 items from the original version were deleted because they failed tocontribute to the factor solution. The first factor (WWC) comprises 10 items (scores ranges from 0 to 10) and the secondfactor (NVF) comprises 8 items (scores ranges from 0 to 8). Subsequent analyses showed that both factors were significantlycorrelated (r = .33) and presented acceptable internal consistency (WWC: a = .86; NVF: a = .75) and test–retest (WWC:r = .67; NVF: r = .39) coefficients. Finally, the response bias and level of acquiescence of the participants were also tested bythe authors. On this topic, the results showed that the respondents did not tend to select the same quadrant/position inresponse to the various questions, or to systematically pick the answer (food or activity) that they liked or enjoyed the most.
A literature review conducted within several databases (i.e. Current contents, Medline, Psychology and BehavioralScience Collection, and PsycINFO) revealed that this study has yet to be replicated. This is worrying since it is a known factthat a single study is insufficient to reach clear conclusions regarding the psychometric properties of an instrument. The
C. Maıano et al. / Research in Developmental Disabilities 31 (2010) 232–242 233
methodological limitations inherent in Illingworth et al. (2003) study reinforce this conclusion and the need for additionalcross-validation efforts.
First, this study examined the dimensionality of the NAKS through PCA. Despite the relative accuracy of exploratorymethods, Confirmatory Factor Analyses (CFA) appears to represent a more rigorous and complete approach to theverification of the construct validity of psychometric tools (e.g. Byrne, 2005). The advantage of CFAs is that they allow for apriori specification of a factor structure consistent with a model-based hypothesis-testing framework, as opposed to the posthoc labeling of extracted factors that is the norm in exploratory analyses. Since CFA gives the researcher the ability to verifythe adequacy of the hypothetical factor structure (or of alternative hypothetical structures) against observations, to directlymodel measurement errors, it is considered as the gold-standard method for the evaluation of the construct validity ofpsychometric inventories (e.g. Byrne, 2005).
Second, the psychometric analyses of the NAKS have been confined to English-speaking samples of adults with ID.Whether the original factor structure of the NAKS can be generalized to other cultures and non-English-speaking countries isthus an open question. The analysis of the factor structure of the NAKS in another country, such as France, would ensure thatthe NAK construct is not biased by colloquialisms and idiosyncrasies of the language in which it was originally developed.Moreover, an accurate French version of the NAKS would help researchers interested in cross-cultural health issues toexpand their studies to French-speaking samples. This would be particularly useful in bilingual countries, such as Canada,where target populations often comprise both French and English speaking participants. Studies based in Europe will alsobenefit from such a version since participants from at least five European countries (France, Belgium, Luxembourg, Monacoand Switzerland) tend to understand French better than English.
Third, Illingworth et al.’s (2003) study relied exclusively on a small sample of adults with ID. This clearly limits thegeneralizability of these results and the appropriateness of this instrument to younger samples. Indeed, it is currentlyunknown whether the factor structure of the NAKS is appropriate for adolescents with ID. To ensure that this instrumentcould be used among adolescents with ID, its factor validity and reliability in such populations must first be demonstrated.This observation is dramatically given the fact that the aforementioned epidemiologic research in adolescents with IDdemonstrated that this population is at greater risk for obesity and that they should be targeted for health promotion andeducation programs on nutrition and exercise knowledge. Thus, before targeting youths with ID who present a higher risk ofobesity based on an insufficient level of knowledge regarding healthy nutritional and behavioral habits, one needs to be ableto rely on instruments that are appropriate for this population. Consequently, the appropriateness and the verification of thefactor validity of the NAKS in sample of adolescents with ID should be a research priority.
Fourth, Illingworth et al. (2003) did not test the measurement invariance and the latent mean invariance of the NAKSacross the specific subgroups composing their sample: gender, age categories, type of placement (i.e. integrated orsegregated) and ID level (i.e. mild or moderate). This clearly questions its factor validity among these various subgroups andthus limits the NAKS generalizability. Indeed, to ensure that this test could be used among these different subgroups ofindividuals with ID and that comparison between these subgroups is valid, it should be shown to measure the sameconstructs in each of these different subgroups. In addition, measurement invariance represents a prerequisite to theverification of subgroups-based mean-level differences (e.g. Vandenberg & Lance, 2000).
Considering this, the main objective of the present series of studies was to test the construct validity of the NAKS in a largesample of adolescents with ID (i.e. content validity, factor validity and reliability, measurement invariance, latent meaninvariance). Given the absence of a validated French version of the NAKS and the fact that this instrument was originallydesigned for adults with ID, the purpose of the first study was to develop a preliminary French version of the NAKS and toverify the content clarity of the resulting items in a sample of adolescents with ID. Indeed, in the general population, thesuitability of adult versions of questionnaires within younger populations tend to be questioned, because they often relied onitems in which the vocabulary is not clearly understood by children and adolescents (Harter, 1999). Thus, theappropriateness of the content of the adult NAKS items in younger populations with ID remains unknown. The second studysought to: (i) examine the factor validity and reliability (i.e. internal consistency and temporal stability) of the NAKS in alarge sample of adolescents with ID; and (ii) to assess the measurement and latent mean invariance of the NAKS acrossgender, age, school placement and ID level.
2. Materials and methods
2.1. Participants and procedures
2.1.1. Study 1
Participants were 20 adolescents (10 boys, Mage = 14.56 years, SDage = 2.13; 10 girls, Mage = 14.60 years, SDage = 2.12), agedbetween 12 and 18 years (Mage = 14.58 years, SDage = 2.06) and identified as having mild to moderate ID level by theDepartmental Commission for the Right of Self-sufficiency of People with Disabilities (DCRSPD). All of these adolescents hadan Intellectual Quotient (IQ) within the range of 70–35, were limited in their adaptive behavioral skills (Luckasson et al.,1992), attended full time one of two specialized school for ID adolescents. All participants have given written informedconsent (none of the adolescents declined to participate or dropped out of the study), and the study protocol was approvedby the local Ethical Committee. Items from the preliminary French version of the NAKS were read aloud by the interviewerand the adolescents were then asked whether they understood the sentence, the format of delivery and the response
C. Maıano et al. / Research in Developmental Disabilities 31 (2010) 232–242234
alternatives. The suitability of the format and the content were then more directly probed with open-ended questions suchas: What is energy? What is a healthy heart? What is a food group? and What is a long walk?
2.1.2. Study 2
Participants were 240 adolescents (134 boys, Mage = 15.10 years, SDage = 1.88; 106 girls, Mage = 15.08 years, SDage = 2.01),aged between 12 and 18 years (Mage = 15.09 years, SDage = 1.94) and identified as having mild to moderate ID level by theDCRSPD (IQ between 70 and 35 and limited adaptive behavioral skills). This overall sample comprised 125 adolescents withmild ID (IQ between 50 and 70) and 115 with moderate ID (IQ between 35 and 49). On the basis of the adolescents’ currenteducational placement, two separate groups were also identified: (i) adolescents schooled full time in a regular school butwithin a self-contained class with other adolescents with ID (n = 102); and (ii) adolescents enrolled full time in a specializedschool with other adolescents with ID (n = 138). This sample was drawn from 7 schools and 13 specialized establishmentsthat agreed to participate in the study. All participants gave written informed consent and none declined to participate ordropped out of the study.
The French version of the NAKS developed in study 1 was administered to all participants in quiet classroom conditions inclasses of up to 12 adolescents. As in study 1, items were read aloud by the interviewer and the adolescents were then askedto circle the answer directly on the questionnaire. In case of inability to circle the response, the participant was asked to pointto the interviewer the picture that represented his/her answer. Additionally, 18 adolescents (Mage = 13.39 years,SDage = 1.61), comprising 9 boys (Mage = 13.33 years, SDage = 1.58) and 9 girls (Mage = 13.63 years, SDage = 1.77) were re-testedafter two-weeks.
2.1.3. Measures
The original version of the NAKS was translated into French following the standardized back-translation techniqueswidely described in the literature (Brislin, 1986; McKay et al., 1996; Van de Vrijver & Hambleton, 1996). Translation fromEnglish into French was done separately by two bilingual researchers and a bilingual translator. Thereafter, translationdiscrepancies between the three translated forms were discussed in order to develop an initial French version. A secondbilingual translator whose native language was English, and who had not seen the original English version of the NAKS,translated this French version back into English. The back-translated version was then compared with the original Englishversion and inconsistencies, errors, and biases were highlighted. The translation process was repeated until the back-translated versions were equivalent to the original English version. The final version exhibited no discrepancies with theoriginal version when back-translated. As an additional check, the final version was independently reviewed by thetranslators to confirm that each item had kept its original meaning (Brislin, 1986).
2.2. Data analysis
In the second study, analyses were conducted in several stages. In the first stage, two first-order CFA model were used totest the factor structure of the NAKS developed in study 1. The first model hypothesized that: (i) the answers to the NAKScould be explained by one factor, (ii) each items would have a non-zero loading on the single factor, (iii) measurement errorterms would be uncorrelated. The second CFA model hypothesized that: (i) the answers to the NAKS could be explained bytwo factors; (ii) each item would have a non-zero loading on the NAKS factor it was designed to measure, and zero loadingson the other factors; (iii) the two factors would be correlated; (iv) measurement error terms would be uncorrelated. Thismodel was also compared to a one factor model with similar specifications. These CFAs were performed using Full-Information ML (FIML) estimation with AMOS 4.0 (Arbuckle & Wothke, 1999). FIML was selected because there were missingresponses to items on the questionnaires (on the various items, the level of missingness varied from 1% to 2%).1 The CFAmodel with the best fitting solution was retained. In case of inadequate fit of all of the estimated models, the best model wasused as a starting point and modified on the basis of an examination of items’ (i) intercorrelations, (ii) factor loadings, (iii)square multiple correlations, (iv) standard errors, (v) t values, and (vi) modification indices. The CFA was then rerun todetermine whether the modification resulted in an improved fit. This process was continued until a reasonable model wasgenerated as indicated by the absolute and incremental fit indices. Finally, the temporal stability of the resulting instrumentwas estimated with a test–retest reliability correlation for scale scores uncorrected for measurement errors on the data fromthe 18 adolescents who were re-tested after two-weeks.
In the four following stages, the French version of the NAKS was used to test the invariance of the two-factor CFA modelacross age category (Stage 2), gender (Stage 3), types of school placement (Stage 4) and levels of ID (Stage 5). Regarding thereduced number of participants in several of the ages categories, this variable was dichotomized into 12–14 (n = 108) and15–18 (n = 132) years old. The models were first estimated separately in the various subsamples and then measurement
1 It should be noted that all of these models (CFA and measurement invariance tests) were replicated using Mplus 5.22 (Muthen & Muthen, 2009). In this
replication, all items were considered as categorical indicators (Millsap & Tein, 2004), and the models were estimated under the theta parameterisation and
using the robust weighted least square estimator (WLSMV), which use a diagonal weight matrix with standard errors and a mean- and variance-adjusted
chi-square test statistic that use a full-weight matrix (Flora & Curran, 2004; Muthen, du Toit, & Spisic, 1997). Since the results from both forms of analyses
converged on the same results and to maximise the simplicity of the present manuscript, the results from the AMOS models were reported.
C. Maıano et al. / Research in Developmental Disabilities 31 (2010) 232–242 235
invariance tests were directly conducted across age categories, gender groups, types of school placement and levels of ID inthe sequential order recommended by Meredith (1993). In these analyses, each model was compared to the preceding onethat served as a reference model (Vandenberg & Lance, 2000).
Assessment of fit for the CFA models was based on multiple indicators (Byrne, 2005; Hu & Bentler, 1999; Vandenberg &Lance, 2000): the Chi-square statistic (x2), the comparative fit index (CFI), the Tucker-Lewis Index (TLI), the root mean squareerror of approximation (RMSEA), and the 90% confidence interval of the RMSEA. Values greater than .90 for CFI and TLI areconsidered to be indicative of adequate model fit (Byrne, 2005; Hu & Bentler, 1999; Vandenberg & Lance, 2000), althoughvalues approaching .95 are preferable. Values smaller than .08 or .06 for the RMSEA support respectively acceptable and goodmodel fit (Hu & Bentler, 1999; Vandenberg & Lance, 2000). Concerning the RMSEA 90% CI, values less than .05 for the lowerbound (left side) and less than .08 for the upper bounds (right side) or containing 0 for the lower bound and less .05 for theupper bounds (right side) indicate respectively acceptable and good model fit (MacCallum, Browne, & Sugawara, 1996). Thefactor loadings, square multiple correlations, standard errors and t values were inspected for appropriate sign and/ormagnitude. Critical values for the tests of multi-group invariance in CFAs models were evaluated by the examination ofseveral criterions: x2 difference tests and changes in CFI and RMSEA (Chen, 2007; Cheung & Rensvold, 2002; Vandenberg &Lance, 2000). A CFI difference of .01 or less and a RMSEA difference of .015 or less between a reference model and thefollowing model indicate that the measurement invariance hypothesis should not be rejected. Vandenberg and Lance (2000)also indicate that CFI differences of .02 or more would be needed to clearly reject the measurement invariance hypothesis.Finally, the reliability was computed from the model’s standardized parameters, using the formula provided by McDonald(1999): v = (Sli)2/([Sli]2 + Sdii) where li are the factor loading and dii the error variances.
3. Results
3.1. Study 1: format and content evaluation of the preliminary version of the French NAKS
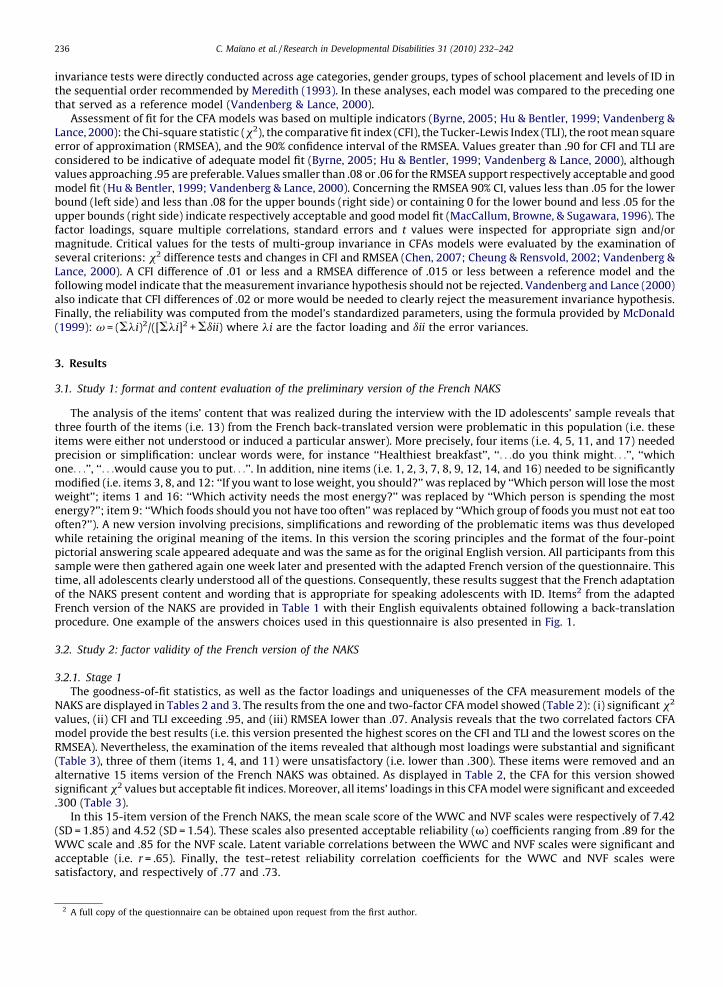
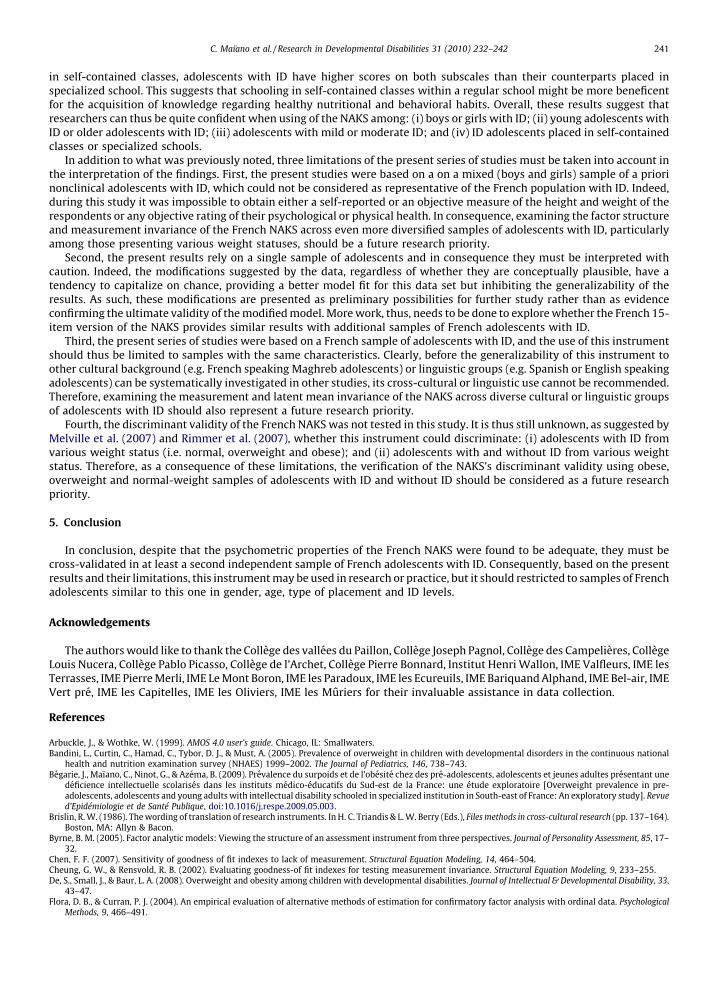
The analysis of the items’ content that was realized during the interview with the ID adolescents’ sample reveals thatthree fourth of the items (i.e. 13) from the French back-translated version were problematic in this population (i.e. theseitems were either not understood or induced a particular answer). More precisely, four items (i.e. 4, 5, 11, and 17) neededprecision or simplification: unclear words were, for instance ‘‘Healthiest breakfast’’, ‘‘. . .do you think might. . .’’, ‘‘whichone. . .’’, ‘‘. . .would cause you to put. . .’’. In addition, nine items (i.e. 1, 2, 3, 7, 8, 9, 12, 14, and 16) needed to be significantlymodified (i.e. items 3, 8, and 12: ‘‘If you want to lose weight, you should?’’ was replaced by ‘‘Which person will lose the mostweight’’; items 1 and 16: ‘‘Which activity needs the most energy?’’ was replaced by ‘‘Which person is spending the mostenergy?’’; item 9: ‘‘Which foods should you not have too often’’ was replaced by ‘‘Which group of foods you must not eat toooften?’’). A new version involving precisions, simplifications and rewording of the problematic items was thus developedwhile retaining the original meaning of the items. In this version the scoring principles and the format of the four-pointpictorial answering scale appeared adequate and was the same as for the original English version. All participants from thissample were then gathered again one week later and presented with the adapted French version of the questionnaire. Thistime, all adolescents clearly understood all of the questions. Consequently, these results suggest that the French adaptationof the NAKS present content and wording that is appropriate for speaking adolescents with ID. Items2 from the adaptedFrench version of the NAKS are provided in Table 1 with their English equivalents obtained following a back-translationprocedure. One example of the answers choices used in this questionnaire is also presented in Fig. 1.
3.2. Study 2: factor validity of the French version of the NAKS
3.2.1. Stage 1
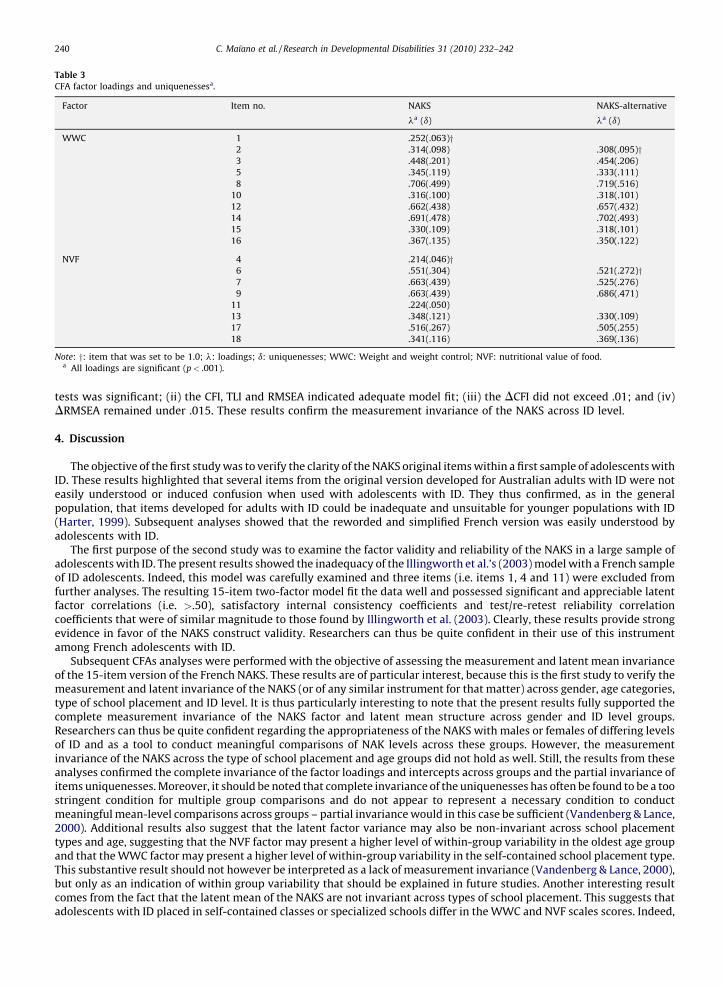
The goodness-of-fit statistics, as well as the factor loadings and uniquenesses of the CFA measurement models of theNAKS are displayed in Tables 2 and 3. The results from the one and two-factor CFA model showed (Table 2): (i) significant x2
values, (ii) CFI and TLI exceeding .95, and (iii) RMSEA lower than .07. Analysis reveals that the two correlated factors CFAmodel provide the best results (i.e. this version presented the highest scores on the CFI and TLI and the lowest scores on theRMSEA). Nevertheless, the examination of the items revealed that although most loadings were substantial and significant(Table 3), three of them (items 1, 4, and 11) were unsatisfactory (i.e. lower than .300). These items were removed and analternative 15 items version of the French NAKS was obtained. As displayed in Table 2, the CFA for this version showedsignificant x2 values but acceptable fit indices. Moreover, all items’ loadings in this CFA model were significant and exceeded.300 (Table 3).
In this 15-item version of the French NAKS, the mean scale score of the WWC and NVF scales were respectively of 7.42(SD = 1.85) and 4.52 (SD = 1.54). These scales also presented acceptable reliability (v) coefficients ranging from .89 for theWWC scale and .85 for the NVF scale. Latent variable correlations between the WWC and NVF scales were significant andacceptable (i.e. r = .65). Finally, the test–retest reliability correlation coefficients for the WWC and NVF scales weresatisfactory, and respectively of .77 and .73.
2 A full copy of the questionnaire can be obtained upon request from the first author.
C. Maıano et al. / Research in Developmental Disabilities 31 (2010) 232–242236
3.2.2. Stage 2
The results from the measurement invariance tests are reported in Table 2. The initial analyses performed separatelywithin both age groups revealed acceptable fit indices in both groups, with an exception for the RMSEA fit that exceed .08 inthe 12–14 years old group (see Table 2). The three first steps of invariance testing (i.e. hypothesis A through C) resulted insignificant bootstrap x2, acceptable goodness-of-fit-indices (i.e. CFI and TLI> .95; RMSEA< .06), non-significant Dx2, andDCFIs and DRMSEAs that did not exceed .01 and .015, respectively. In fact, the DRMSEA and DTLI even showed animprovement of the fit indices given the fact that these indexes incorporate a penalty for parsimony so that it is possible for amore parsimonious model (a model with added constraints) to have a better fit value than a less parsimonious model (i.e. thegain in parsimony is greater than the loss in fit) (Marsh, 2007). The fourth level of measurement invariance (i.e. hypothesis D:equality constraints on items’ uniquenesses) provided significant bootstrap x2, acceptable goodness-of-fit-indices (i.e. CFIand TLI> .95; RMSEA< .05), and DCFI and DRMSEA that did not exceed .015, although all of the indices showed a slightdecrease. However, this model resulted in a significant Dx2. Modification indices for this model were inspected andsuggested that the age-group equality constraint should be relaxed for the uniqueness of the items no. 9 and 11 (see Table 1for description of the items). The fifth model (i.e. hypothesis D0) freely estimated this parameter across age groups whilekeeping the other constraints and provided evidence of partial strict measurement invariance (i.e. non-significant Dx2;DCFI< .01; DRMSEA< .015). The sixth model (i.e. hypothesis E) did not support the invariance of latent factors variancesacross age groups (i.e. significant Dx2). Modification indices for this model were inspected and suggested that the age-groupequality constraint should be relaxed for the NVF factor. The seventh model (i.e. hypothesis E0) freely estimated thisparameter across age groups while keeping the other factor variance constraints and provided evidence of partial factor-invariance (i.e. non-significant Dx2; DCFI< .01; DRMSEA< .015). Finally, the eighth model (i.e. hypothesis F) supports thelatent factor mean invariance across groups (i.e. non-significant Dx2; DCFI< .01; DRMSEA< .015).
3.2.3. Stage 3
The analyses performed separately in both gender groups revealed acceptable fit indices in both groups (Table 2). Theresults from the various steps of the tests of gender-related measurement invariance showed that: (i) all of the x2
were significant; (ii) none of the x2 difference tests was significant; (ii) the CFI, TLI and RMSEA indicated adequate model fit;
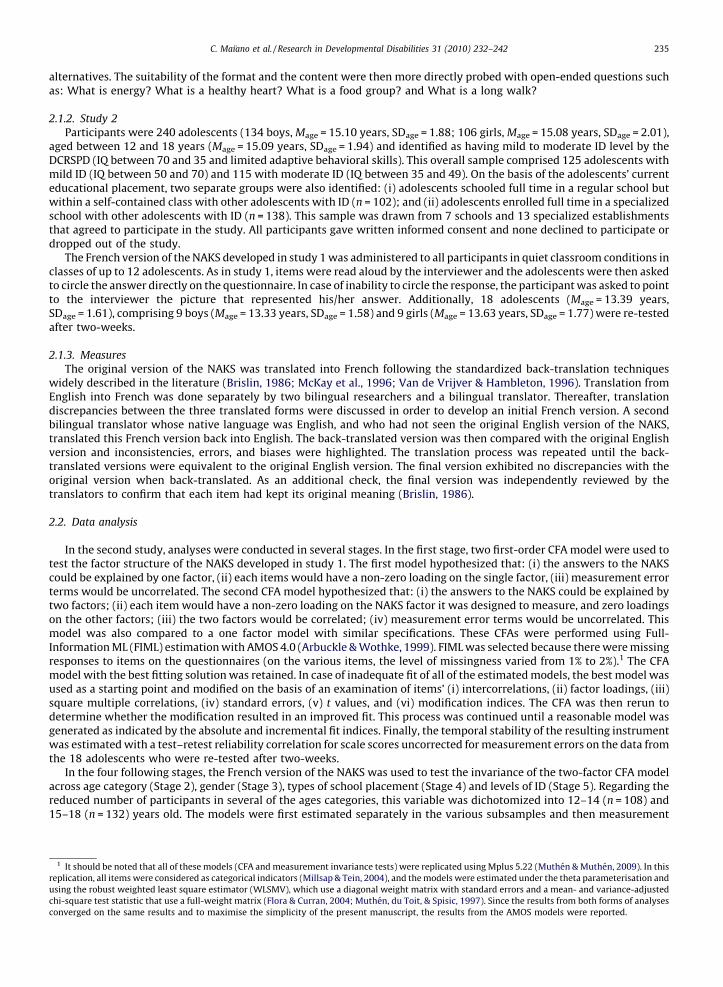
Table 1
Items of the Nutrition and Activity Knowledge Scale.
1. Quelle est la personne qui depense le plus d’energie? WWCDWhich person is spending the most energy?
2. Quel hamburger cet homme a-t-il l’habitude de manger? WWCyWhat burger does this man usually eats?
3. Quelle est la personne qui va perdre du poids? WWCzyWhich person will lose weight?
4. Quel est le meilleur petit dejeuner pour etre en bonne sante? NVF
Which is the best breakfast to be in good health?
5. Quelle est la personne qui va perdre le plus de poids? WWC yWhich person will lose the most weight?
6. Cette femme va faire une longue marche avec son chien. Quel petit dejeuner doit-elle manger? NVF�yThis woman is going on a long walk with her dog. What breakfast should she eat?
7. Quel est le meilleur groupe d’aliments que tu dois manger pour garder ton cœur en bonne sante? NVFyWhich group of foods should you eat to keep your heart healthy?
8. Quelle est la personne qui va perdre du poids? WWCzyWhich person is going to lose weight?
9. Quel groupe d’aliments tu ne dois pas manger trop souvent? NVFyWhich group of foods must you avoid eating too often?
10. Quel est l’homme qui va prendre le plus de poids? WWC�yWhich man will put on the most weight?
11. Quel est l’aliment qui a le plus de proteines? NVF
Which food has the most protein?
12. Quelle est la personne qui va perdre du poids? WWCzyWhich person is going to lose weight?
13. Quel est l’aliment le plus gras? NVF�yWhich food has the most fat?
14. Quelle est la personne qui va perdre le plus de poids? WWC yWhich person is going to lose the most weight?
15. Quel est le groupe d’aliments qui a le plus de sucre? WWC�yWhich group of foods has the most sugar?
16. Quelle est la personne qui depense le plus d’energie? WWCDyWhich person is spending the most energy?
17. Quel est le groupe d’aliments qui fait le plus grossir? NVFyWhich group of foods is the most fattening?
18. Cet homme va faire une longue marche. Quel petit dejeuner doit-il manger? NVF�yThis man is going for a long walk. Which breakfast should he eat?
Note—WWC: weight and weight control; NVF: nutritional value of food;�: items that were not modified; D/z/ : the formulation of these items are similar,
nevertheless they comprise different set of response choice; and y: items that were retained in the final version.
C. Maıano et al. / Research in Developmental Disabilities 31 (2010) 232–242 237
(iii) the DCFIs did not exceed .01; and (iv) the DRMSEAs did not exceed .015 and even improved. These results confirm thegender-based measurement invariance of the NAKS.
3.2.4. Stage 4
The analyses performed separately within both school placement groups revealed acceptable fit in both groups, with anexception for the RMSEA fit indices that exceed .08 in the self-contained classes group (Table 2). The three first steps ofinvariance testing (i.e. hypotheses A–C) resulted in significant bootstrap x2, acceptable goodness-of-fit-indices (i.e. CFI andTLI> .95; RMSEA< .05), non-significant Dx2, and DCFIs and DRMSEAs that did not exceed .01 and .015, respectively. Thefourth level of measurement invariance (i.e. hypothesis D) added the equality constraints on items’ uniquenesses (strictmeasurement invariance). These results did not support the measurement invariance of the items’ uniquenesses acrossschool placement groups (i.e. significant Dx2 and DCFI> .01). Modification indices for this model were inspected andsuggested that the school placement-group equality constraint should be relaxed for the uniqueness of the items no. 3, 4, 5, 6,7, 10, 13, 14 and 18 (see Table 1 for a description of the items). The fifth model (i.e. hypothesis D0) freely estimated theseparameters across school placement groups while keeping the other constraints and provided evidence of partial strictmeasurement invariance (i.e. non-significant Dx2; DCFI< .01; DRMSEA< .015). The sixth model (i.e. hypothesis E) did notsupport the invariance of the latent factors variances across school placement groups (i.e. significant Dx2). Modificationindices for this model were inspected and suggested that the school placement groups equality constraint should be relaxedfor the WWC factor. The seventh model (i.e. hypothesis E0) freely estimated this parameter across school placement groupswhile keeping the other factor variance constraints and provided evidence of partial factor-invariance (i.e. non-significantDx2; DCFI< .01; DRMSEA< .015). Finally, the eighth model (i.e. hypothesis F) did not respectively support the latent factormean invariance of the various school placement groups (i.e. significant Dx2). Post hoc probing of this difference revealedthat adolescents with ID schooled in self-contained classes did indeed present significantly higher scores in WWC (latentmean = .05, t = 2.54, p = .001, d = 0.33) and NVF (latent mean = .11, t = 2.95, p = .001, d = 0.39) scales than those schooled in aspecialized school (latent means fixed at zero as reference).
3.2.5. Stage 5
The initial analyses performed separately within both ID level groups revealed acceptable fit. The results from the varioussteps of the ID level measurement invariance tests showed that: (i) all of the x2 were significant but none of the x2 difference
Fig. 1. Example of the third questions.
C. Maıano et al. / Research in Developmental Disabilities 31 (2010) 232–242238
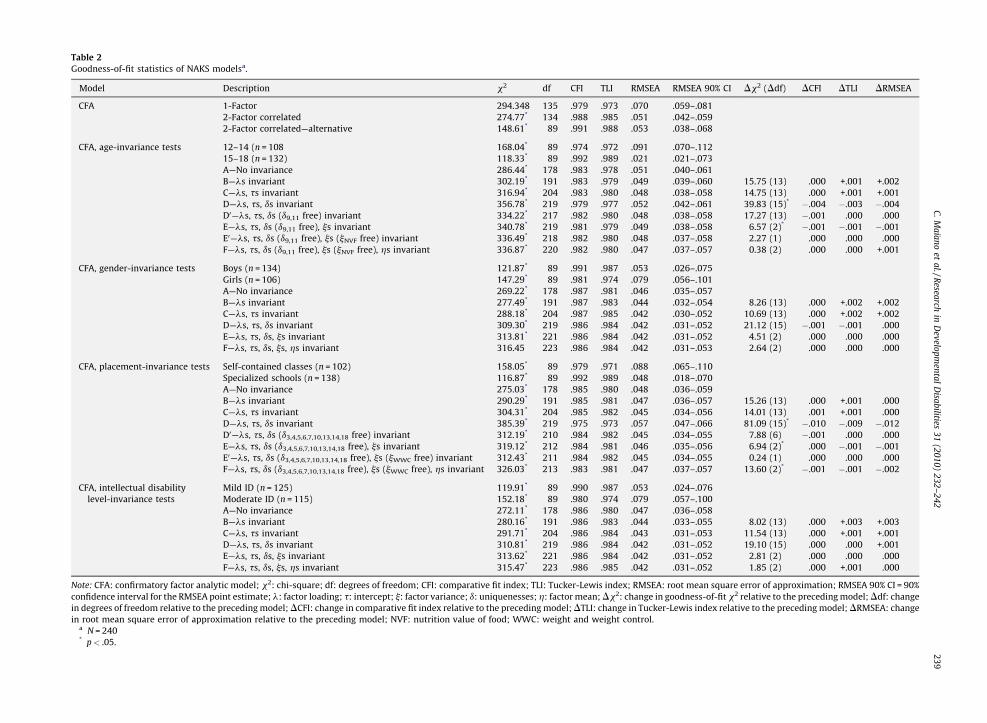
Table 2
Goodness-of-fit statistics of NAKS modelsa.
Model Description x2 df CFI TLI RMSEA RMSEA 90% CI Dx2 (Ddf) DCFI DTLI DRMSEA
CFA 1-Factor 294.348 135 .979 .973 .070 .059–.081
2-Factor correlated 274.77* 134 .988 .985 .051 .042–.059
2-Factor correlated—alternative 148.61* 89 .991 .988 .053 .038–.068
CFA, age-invariance tests 12–14 (n = 108 168.04* 89 .974 .972 .091 .070–.112
15–18 (n = 132) 118.33* 89 .992 .989 .021 .021–.073
A—No invariance 286.44* 178 .983 .978 .051 .040–.061
B—ls invariant 302.19* 191 .983 .979 .049 .039–.060 15.75 (13) .000 +.001 +.002
C—ls, ts invariant 316.94* 204 .983 .980 .048 .038–.058 14.75 (13) .000 +.001 +.001
D—ls, ts, ds invariant 356.78* 219 .979 .977 .052 .042–.061 39.83 (15)* �.004 �.003 �.004
D0—ls, ts, ds (d9,11 free) invariant 334.22* 217 .982 .980 .048 .038–.058 17.27 (13) �.001 .000 .000
E—ls, ts, ds (d9,11 free), js invariant 340.78* 219 .981 .979 .049 .038–.058 6.57 (2)* �.001 �.001 �.001
E0—ls, ts, ds (d9,11 free), js (jNVF free) invariant 336.49* 218 .982 .980 .048 .037–.058 2.27 (1) .000 .000 .000
F—ls, ts, ds (d9,11 free), js (jNVF free), hs invariant 336.87* 220 .982 .980 .047 .037–.057 0.38 (2) .000 .000 +.001
CFA, gender-invariance tests Boys (n = 134) 121.87* 89 .991 .987 .053 .026–.075
Girls (n = 106) 147.29* 89 .981 .974 .079 .056–.101
A—No invariance 269.22* 178 .987 .981 .046 .035–.057
B—ls invariant 277.49* 191 .987 .983 .044 .032–.054 8.26 (13) .000 +.002 +.002
C—ls, ts invariant 288.18* 204 .987 .985 .042 .030–.052 10.69 (13) .000 +.002 +.002
D—ls, ts, ds invariant 309.30* 219 .986 .984 .042 .031–.052 21.12 (15) �.001 �.001 .000
E—ls, ts, ds, js invariant 313.81* 221 .986 .984 .042 .031–.052 4.51 (2) .000 .000 .000
F—ls, ts, ds, js, hs invariant 316.45 223 .986 .984 .042 .031–.053 2.64 (2) .000 .000 .000
CFA, placement-invariance tests Self-contained classes (n = 102) 158.05* 89 .979 .971 .088 .065–.110
Specialized schools (n = 138) 116.87* 89 .992 .989 .048 .018–.070
A—No invariance 275.03* 178 .985 .980 .048 .036–.059
B—ls invariant 290.29* 191 .985 .981 .047 .036–.057 15.26 (13) .000 +.001 .000
C—ls, ts invariant 304.31* 204 .985 .982 .045 .034–.056 14.01 (13) .001 +.001 .000
D—ls, ts, ds invariant 385.39* 219 .975 .973 .057 .047–.066 81.09 (15)* �.010 �.009 �.012
D0—ls, ts, ds (d3,4,5,6,7,10,13,14,18 free) invariant 312.19* 210 .984 .982 .045 .034–.055 7.88 (6) �.001 .000 .000
E—ls, ts, ds (d3,4,5,6,7,10,13,14,18 free), js invariant 319.12* 212 .984 .981 .046 .035–.056 6.94 (2)* .000 �.001 �.001
E0—ls, ts, ds (d3,4,5,6,7,10,13,14,18 free), js (jWWC free) invariant 312.43* 211 .984 .982 .045 .034–.055 0.24 (1) .000 .000 .000
F—ls, ts, ds (d3,4,5,6,7,10,13,14,18 free), js (jWWC free), hs invariant 326.03* 213 .983 .981 .047 .037–.057 13.60 (2)* �.001 �.001 �.002
CFA, intellectual disability
level-invariance tests
Mild ID (n = 125) 119.91* 89 .990 .987 .053 .024–.076
Moderate ID (n = 115) 152.18* 89 .980 .974 .079 .057–.100
A—No invariance 272.11* 178 .986 .980 .047 .036–.058
B—ls invariant 280.16* 191 .986 .983 .044 .033–.055 8.02 (13) .000 +.003 +.003
C—ls, ts invariant 291.71* 204 .986 .984 .043 .031–.053 11.54 (13) .000 +.001 +.001
D—ls, ts, ds invariant 310.81* 219 .986 .984 .042 .031–.052 19.10 (15) .000 .000 +.001
E—ls, ts, ds, js invariant 313.62* 221 .986 .984 .042 .031–.052 2.81 (2) .000 .000 .000
F—ls, ts, ds, js, hs invariant 315.47* 223 .986 .985 .042 .031–.052 1.85 (2) .000 +.001 .000
Note: CFA: confirmatory factor analytic model; x2: chi-square; df: degrees of freedom; CFI: comparative fit index; TLI: Tucker-Lewis index; RMSEA: root mean square error of approximation; RMSEA 90% CI = 90%
confidence interval for the RMSEA point estimate; l: factor loading; t: intercept; j: factor variance; d: uniquenesses; h: factor mean; Dx2: change in goodness-of-fit x2 relative to the preceding model; Ddf: change
in degrees of freedom relative to the preceding model; DCFI: change in comparative fit index relative to the preceding model; DTLI: change in Tucker-Lewis index relative to the preceding model; DRMSEA: change
in root mean square error of approximation relative to the preceding model; NVF: nutrition value of food; WWC: weight and weight control.a N = 240* p< .05.
C.
Ma
ıan
oet
al./R
esearch
inD
evelo
pm
enta
lD
isab
ilities3
1(2
01
0)
23
2–
24
22
39
tests was significant; (ii) the CFI, TLI and RMSEA indicated adequate model fit; (iii) the DCFI did not exceed .01; and (iv)DRMSEA remained under .015. These results confirm the measurement invariance of the NAKS across ID level.
4. Discussion
The objective of the first study was to verify the clarity of the NAKS original items within a first sample of adolescents withID. These results highlighted that several items from the original version developed for Australian adults with ID were noteasily understood or induced confusion when used with adolescents with ID. They thus confirmed, as in the generalpopulation, that items developed for adults with ID could be inadequate and unsuitable for younger populations with ID(Harter, 1999). Subsequent analyses showed that the reworded and simplified French version was easily understood byadolescents with ID.
The first purpose of the second study was to examine the factor validity and reliability of the NAKS in a large sample ofadolescents with ID. The present results showed the inadequacy of the Illingworth et al.’s (2003) model with a French sampleof ID adolescents. Indeed, this model was carefully examined and three items (i.e. items 1, 4 and 11) were excluded fromfurther analyses. The resulting 15-item two-factor model fit the data well and possessed significant and appreciable latentfactor correlations (i.e. >.50), satisfactory internal consistency coefficients and test/re-retest reliability correlationcoefficients that were of similar magnitude to those found by Illingworth et al. (2003). Clearly, these results provide strongevidence in favor of the NAKS construct validity. Researchers can thus be quite confident in their use of this instrumentamong French adolescents with ID.
Subsequent CFAs analyses were performed with the objective of assessing the measurement and latent mean invarianceof the 15-item version of the French NAKS. These results are of particular interest, because this is the first study to verify themeasurement and latent invariance of the NAKS (or of any similar instrument for that matter) across gender, age categories,type of school placement and ID level. It is thus particularly interesting to note that the present results fully supported thecomplete measurement invariance of the NAKS factor and latent mean structure across gender and ID level groups.Researchers can thus be quite confident regarding the appropriateness of the NAKS with males or females of differing levelsof ID and as a tool to conduct meaningful comparisons of NAK levels across these groups. However, the measurementinvariance of the NAKS across the type of school placement and age groups did not hold as well. Still, the results from theseanalyses confirmed the complete invariance of the factor loadings and intercepts across groups and the partial invariance ofitems uniquenesses. Moreover, it should be noted that complete invariance of the uniquenesses has often be found to be a toostringent condition for multiple group comparisons and do not appear to represent a necessary condition to conductmeaningful mean-level comparisons across groups – partial invariance would in this case be sufficient (Vandenberg & Lance,2000). Additional results also suggest that the latent factor variance may also be non-invariant across school placementtypes and age, suggesting that the NVF factor may present a higher level of within-group variability in the oldest age groupand that the WWC factor may present a higher level of within-group variability in the self-contained school placement type.This substantive result should not however be interpreted as a lack of measurement invariance (Vandenberg & Lance, 2000),but only as an indication of within group variability that should be explained in future studies. Another interesting resultcomes from the fact that the latent mean of the NAKS are not invariant across types of school placement. This suggests thatadolescents with ID placed in self-contained classes or specialized schools differ in the WWC and NVF scales scores. Indeed,
Table 3
CFA factor loadings and uniquenessesa.
Factor Item no. NAKS NAKS-alternative
la (d) la (d)
WWC 1 .252(.063)y2 .314(.098) .308(.095)y3 .448(.201) .454(.206)
5 .345(.119) .333(.111)
8 .706(.499) .719(.516)
10 .316(.100) .318(.101)
12 .662(.438) .657(.432)
14 .691(.478) .702(.493)
15 .330(.109) .318(.101)
16 .367(.135) .350(.122)
NVF 4 .214(.046)y6 .551(.304) .521(.272)y7 .663(.439) .525(.276)
9 .663(.439) .686(.471)
11 .224(.050)
13 .348(.121) .330(.109)
17 .516(.267) .505(.255)
18 .341(.116) .369(.136)
Note: y: item that was set to be 1.0; l: loadings; d: uniquenesses; WWC: Weight and weight control; NVF: nutritional value of food.a All loadings are significant (p< .001).
C. Maıano et al. / Research in Developmental Disabilities 31 (2010) 232–242240
in self-contained classes, adolescents with ID have higher scores on both subscales than their counterparts placed inspecialized school. This suggests that schooling in self-contained classes within a regular school might be more beneficentfor the acquisition of knowledge regarding healthy nutritional and behavioral habits. Overall, these results suggest thatresearchers can thus be quite confident when using of the NAKS among: (i) boys or girls with ID; (ii) young adolescents withID or older adolescents with ID; (iii) adolescents with mild or moderate ID; and (iv) ID adolescents placed in self-containedclasses or specialized schools.
In addition to what was previously noted, three limitations of the present series of studies must be taken into account inthe interpretation of the findings. First, the present studies were based on a on a mixed (boys and girls) sample of a priorinonclinical adolescents with ID, which could not be considered as representative of the French population with ID. Indeed,during this study it was impossible to obtain either a self-reported or an objective measure of the height and weight of therespondents or any objective rating of their psychological or physical health. In consequence, examining the factor structureand measurement invariance of the French NAKS across even more diversified samples of adolescents with ID, particularlyamong those presenting various weight statuses, should be a future research priority.
Second, the present results rely on a single sample of adolescents and in consequence they must be interpreted withcaution. Indeed, the modifications suggested by the data, regardless of whether they are conceptually plausible, have atendency to capitalize on chance, providing a better model fit for this data set but inhibiting the generalizability of theresults. As such, these modifications are presented as preliminary possibilities for further study rather than as evidenceconfirming the ultimate validity of the modified model. More work, thus, needs to be done to explore whether the French 15-item version of the NAKS provides similar results with additional samples of French adolescents with ID.
Third, the present series of studies were based on a French sample of adolescents with ID, and the use of this instrumentshould thus be limited to samples with the same characteristics. Clearly, before the generalizability of this instrument toother cultural background (e.g. French speaking Maghreb adolescents) or linguistic groups (e.g. Spanish or English speakingadolescents) can be systematically investigated in other studies, its cross-cultural or linguistic use cannot be recommended.Therefore, examining the measurement and latent mean invariance of the NAKS across diverse cultural or linguistic groupsof adolescents with ID should also represent a future research priority.
Fourth, the discriminant validity of the French NAKS was not tested in this study. It is thus still unknown, as suggested byMelville et al. (2007) and Rimmer et al. (2007), whether this instrument could discriminate: (i) adolescents with ID fromvarious weight status (i.e. normal, overweight and obese); and (ii) adolescents with and without ID from various weightstatus. Therefore, as a consequence of these limitations, the verification of the NAKS’s discriminant validity using obese,overweight and normal-weight samples of adolescents with ID and without ID should be considered as a future researchpriority.
5. Conclusion
In conclusion, despite that the psychometric properties of the French NAKS were found to be adequate, they must becross-validated in at least a second independent sample of French adolescents with ID. Consequently, based on the presentresults and their limitations, this instrument may be used in research or practice, but it should restricted to samples of Frenchadolescents similar to this one in gender, age, type of placement and ID levels.
Acknowledgements
The authors would like to thank the College des vallees du Paillon, College Joseph Pagnol, College des Campelieres, CollegeLouis Nucera, College Pablo Picasso, College de l’Archet, College Pierre Bonnard, Institut Henri Wallon, IME Valfleurs, IME lesTerrasses, IME Pierre Merli, IME Le Mont Boron, IME les Paradoux, IME les Ecureuils, IME Bariquand Alphand, IME Bel-air, IMEVert pre, IME les Capitelles, IME les Oliviers, IME les Muriers for their invaluable assistance in data collection.
References
Arbuckle, J., & Wothke, W. (1999). AMOS 4.0 user’s guide. Chicago, IL: Smallwaters.Bandini, L., Curtin, C., Hamad, C., Tybor, D. J., & Must, A. (2005). Prevalence of overweight in children with developmental disorders in the continuous national
health and nutrition examination survey (NHAES) 1999–2002. The Journal of Pediatrics, 146, 738–743.Begarie, J., Maıano, C., Ninot, G., & Azema, B. (2009). Prevalence du surpoids et de l’obesite chez des pre-adolescents, adolescents et jeunes adultes presentant une
deficience intellectuelle scolarises dans les instituts medico-educatifs du Sud-est de la France: une etude exploratoire [Overweight prevalence in pre-adolescents, adolescents and young adults with intellectual disability schooled in specialized institution in South-east of France: An exploratory study]. Revued’Epidemiologie et de Sante Publique, doi:10.1016/j.respe.2009.05.003.
Brislin, R. W. (1986). The wording of translation of research instruments. In H. C. Triandis & L. W. Berry (Eds.), Files methods in cross-cultural research (pp. 137–164).Boston, MA: Allyn & Bacon.
Byrne, B. M. (2005). Factor analytic models: Viewing the structure of an assessment instrument from three perspectives. Journal of Personality Assessment, 85, 17–32.
Chen, F. F. (2007). Sensitivity of goodness of fit indexes to lack of measurement. Structural Equation Modeling, 14, 464–504.Cheung, G. W., & Rensvold, R. B. (2002). Evaluating goodness-of fit indexes for testing measurement invariance. Structural Equation Modeling, 9, 233–255.De, S., Small, J., & Baur, L. A. (2008). Overweight and obesity among children with developmental disabilities. Journal of Intellectual & Developmental Disability, 33,
43–47.Flora, D. B., & Curran, P. J. (2004). An empirical evaluation of alternative methods of estimation for confirmatory factor analysis with ordinal data. Psychological
Methods, 9, 466–491.
C. Maıano et al. / Research in Developmental Disabilities 31 (2010) 232–242 241
Frey, G. C., & Chow, B. (2006). Relationship between BMI, physical fitness, and motor skills in youth with mild intellectual disabilities. International Journal of EatingDisorders, 30, 861–867.
Golden, E., & Hatcher, J. (1997). Nutrition knowledge and obesity of adults in community residences. Mental Retardation, 35, 177–184.Harter, S. (1999). The construction of the self: A developmental perspective. New York, NY: Guilford.Hu, L.-T., & Bentler, P. M. (1999). Cutoff criteria for fit indexes in covariance structure analysis: Conventional criteria versus new alternatives. Structural Equation
Modeling, 6, 1–55.Illingworth, K., Moore, K. A., & McGillivray, J. (2003). The development of the nutrition and Activity Knowledge Scale for use with people with an intellectual
disability. Journal of Applied Research in Intellectual Disabilities, 16, 159–166.Jobling, A., & Cuskelly, M. (2006). Young people with Down syndrome: A preliminary investigation of health knowledge and associated behaviours. Journal of
Intellectual & Developmental Disability, 31, 210–218.Lin, J. D., Yen, C. F., Li, C. W., & Wu, J. L. (2005). Patterns of obesity among children and adolescents with intellectual disabilities in Taıwan. Journal of Applied
Research on Intellectual Disabilities, 18, 123–129.Luckasson, R., Coulter, D. L., Polloway, E. A., Reiss, S., Schalock, R. L., Snell, M. E., et al. (1992). Mental retardation: Definition, classification and systems of support.
Washington, DC: American Association of Mental Retardation.MacCallum, R. C., Browne, M. W., & Sugawara, H. M. (1996). Power analysis and determination of sample size for covariance structure modeling. Psychological
Methods, 1, 130–149.Marsh, H. W. (2007). Application of confirmatory factor analysis and structural equation modeling in sport/exercise psychology. In G. Tenenbaum & R. C. Eklund
(Eds.), Handbook of on sport psychology (3rd ed., pp. 774–798). New York, NY: Wiley.Marshall, D., McConkey, R., & Moore, G. (2003). Obesity in people with intellectual disabilities: The impact of nurse-led health screenings and health promotion
activities. Journal of Advanced Nursing, 41, 147–153.McDonald, R. P. (1999). Test theory: A unified treatment. Mahwah, NJ: Lawrence Erlbaum Associates Inc.McKay, R. B., Breslow, M. J., Sangster, R. L., Gabbard, S. M., Reynolds, R. W., Nakamoto, J. M., et al. (1996). Translating survey questionnaires: Lessons learned. New
Directions for Evaluation, 70, 93–105.Melville, C. A., Hamilton, S., Hankey, C. R., Miller, S., & Boyle, S. (2007). The prevalence and determinants of obesity in adults with intellectual disabilities. Obesity
Reviews, 8, 223–230.Meredith, W. (1993). Measurement invariance, factor analysis and factorial invariance. Psychometrika, 58, 525–543.Millsap, R. E., & Tein, J.-Y. (2004). Assessing factorial invariance in ordered-categorical measures. Multivariate Behavioral Research, 39, 479–515.Muthen, B. O., du Toit, S. H. C., & Spisic, D. (1997). Robust inference using weighted least squares and quadratic estimating equations in latent variable modeling with
categorical and continuous outcomes. Unpublished manuscript.Muthen, L. K., & Muthen, B. O. (2009). Mplus user’s guide [version 5.22; computer software]. Los Angeles, CA: Muthen & Muthen.National Dairy Council. (1979). Nutrition Achievement Tests (Tests 1–4). Rosemont, IL: Author.Rimmer, J. H., & Yamaki, K. (2006). Obesity and intellectual disability. Mental Retardation and Developmental Disabilities Research Reviews, 12, 22–27.Rimmer, J. H., Rowland, J. L., & Yamaki, K. (2007). Obesity and secondary conditions in adolescents with disabilities: Addressing the needs of an underserved
population. Journal of Adolescent Health, 41, 224–229.Takeuchi, E. (1994). Incidence of obesity among school children with mental retardation in Japan. American Journal on Mental Retardation, 99, 283–288.Van de Vrijver, F. J. R., & Hambleton, R. K. (1996). Translating tests: Some practical guidelines. European Psychologist, 1, 89–99.Vandenberg, R. J., & Lance, C. E. (2000). A review and synthesis of the measurement invariance literature: Suggestions, practices, and recommendations for
organizational research. Organizational Research Methods, 3, 4–70.
C. Maıano et al. / Research in Developmental Disabilities 31 (2010) 232–242242
Related Documents