DOCUMENT RESUME ED 090 246 TM 003 456 AUTHOR Kayser, Brian D. TITLE The Use of Factor Analysis to Salvage Poor Guttman Scales: Can it Really Work. INSTITUTION Wisconsin Univ., Madison. Center of Applied Sociology. SPONS AGENCY Economic Development Administration (DOC), Washington, D.C. Office of Economic Research.; National Inst. of Mental Health (DHEW), Eethesda, Md. REPORT. NO RID-73-3 PUB DATE [73] NOTE 20p. EDRS PRICE MF-$0.75 HC-$1.50 PLUS POSTAGE DESCRIPTORS Attitude Tests; Comparative Statistics; *Factor Analysis; Factor Structure; Internal Scaling; *Multidimensional Scaling; Sociology; *Statistical Analysis IDENTIFIERS *Guttman Scale ABSTRACT The Guttman model of scale analysis has found continued use in sociological analysis: despite criticisms placed against it. An empirical example is provided of the use of factor analysis with Guttman scaling even taking into account the criticisms of both very restricted item number of dichotomcus responses. Data came from a questionnaire using three theoretical law scales. Attitudes, values, and aspirations regarding the legal institution were solicited from high school students. Students indicated on the questionnaire if they strongly agreed, agreed, were undecided, disagreed, or strongly disagreed with each item. The responses were coded such that the higher the score, the more favorable the attitude toward the legal institution. Factor analysis of all items using principal axis with varimax rotation was used. Scale analysis revealed that the scales were not Guttman. Although the scale and item reproducibilities were high, the scale scalabilities were not significantly greater than 0.60. Delineation of the structure of the scale is given as a justification for use of factor analysis with Guttman scales. It appears that the use of factor analysis with Guttman scales is not a desirable technique of scaling. A better approach would be the single use of factor analysis in order tc help construct single factor sales of greater length. (Author/Rt)

Welcome message from author
This document is posted to help you gain knowledge. Please leave a comment to let me know what you think about it! Share it to your friends and learn new things together.
Transcript

DOCUMENT RESUME
ED 090 246 TM 003 456
AUTHOR Kayser, Brian D.TITLE The Use of Factor Analysis to Salvage Poor Guttman
Scales: Can it Really Work.INSTITUTION Wisconsin Univ., Madison. Center of Applied
Sociology.SPONS AGENCY Economic Development Administration (DOC),
Washington, D.C. Office of Economic Research.;National Inst. of Mental Health (DHEW), Eethesda,Md.
REPORT. NO RID-73-3PUB DATE [73]NOTE 20p.
EDRS PRICE MF-$0.75 HC-$1.50 PLUS POSTAGEDESCRIPTORS Attitude Tests; Comparative Statistics; *Factor
Analysis; Factor Structure; Internal Scaling;*Multidimensional Scaling; Sociology; *StatisticalAnalysis
IDENTIFIERS *Guttman Scale
ABSTRACTThe Guttman model of scale analysis has found
continued use in sociological analysis: despite criticisms placedagainst it. An empirical example is provided of the use of factoranalysis with Guttman scaling even taking into account the criticismsof both very restricted item number of dichotomcus responses. Datacame from a questionnaire using three theoretical law scales.Attitudes, values, and aspirations regarding the legal institutionwere solicited from high school students. Students indicated on thequestionnaire if they strongly agreed, agreed, were undecided,disagreed, or strongly disagreed with each item. The responses werecoded such that the higher the score, the more favorable the attitudetoward the legal institution. Factor analysis of all items usingprincipal axis with varimax rotation was used. Scale analysisrevealed that the scales were not Guttman. Although the scale anditem reproducibilities were high, the scale scalabilities were notsignificantly greater than 0.60. Delineation of the structure of thescale is given as a justification for use of factor analysis withGuttman scales. It appears that the use of factor analysis withGuttman scales is not a desirable technique of scaling. A betterapproach would be the single use of factor analysis in order tc helpconstruct single factor sales of greater length. (Author/Rt)

CE\TER OF APPLIED SOCIO
University of Wisconsin Madison
Cooperative Extension ProgramsUniversity of WisconsinExtension
000 900
999999123456222 341

U S DEPARTMENT OF HEALTH,EOUCATION I WELFARENATIONAL INSTITUTE OF
EDUCATIONTHIS DOCUMENT HAS BEEN REPRO
DUCED EXACTLY AS RECEIVED FROM
THE PERSON OR ORGANIZATION ORIGINIATING IT POINTS OF VIEW OR OPINIONS
STATED 00 NOT NECESSARILY REPRE
SENT OFFICIAL NATIONAL INSTITUTE OFEDUCATION POSITION OR POLICY
7RE USE OF FACTOR ANALYSIS
TO SALVAGE POOR GUTTMAN SCALES:
CAN IT REALLY WORK*
Brian D. KayserDepartment of SociologyThe University of Akron
Akron, Ohio
Working Paper RID 73.3
105-7-11-0,ilECE/VEll
uCT 23 1973nrnssU1Z C.
Research supported by the College of Agriculture and rife Sciences;University of Wisconsin, Madison; Illinois Agricultural ExperimentStation, Champaign-Urbana; The Graduate Research Board, The Univer-sity of Illinois at Champaign-Urbana; The National Institute ofMental Health, PHS Research Grant MR-19689; and the Office ofEconomic Research, Economic Development Administration, GrantOER-417-G-72-7 (99-7-13248).

The Use of Factor Analysis to Salvage Poor
Guttman Scales: Can it Really Work?
The Guttman model of scale analysis has found continued use in
sociological analysis despite criticisms placed against it. Proctor
(1970) questioned the acceptability of past methods of testing associated
with it. Scaling by this technique has been called highly impractical
and illogical (Nunnally, 1968) as well as being fadish and ritualistic
(Labovitz, 1972). Perhaps in an attempt to handle such criticisms it
has been suggested that the factor analytic model be used in cooperation
with Guttman scaling, particularly if the items do not meet the require-
ments of reproducibility and scalability.
Schuessler (1966) noted that Guttman scaling and. factor analysis
are not necessarily incompatible models of sca]iig, and advocated use of
the scale model when the factor model failed. Gullahorn and Gullahorn
(1968) advocated use.of both models when using survey data. Using date
on attitudes toward interaction abroad and profestional outcomes, they
found. one Guttman scale could be attributed to a common factor while
another scale loaded on two factors. They noted that the two approaches
are not incompatible: the scale model's value lies in its reproducibility
criterion where the score indicates the pattern of item responses. The
factor model permits reproduction of the correlations among items, rather
than the pattern, but does allow information regarding the importance of
any item in defining a factor. For their data the use of only one of the
two methods would have resulted in the loss of structural information
regarding the relations among the variables.

-2-
While combining factor an/31311dg with Guttman srAlipa mpv in Rome
cases provide a means of saving the scales, the are limitations with
this approach. Guttman scales are rarely long enough to provide adequali
tests of separate factors if they are found. Given a typical four or
five Guttman scale, the reliability of the measurement of two or more
factors would be restricted on the basis of the small number of items to
measure each factor (particularly if a composite method of scaling were
used). In addition, if dichotomous responses were used in the factor
analysis at least thirty items are typically needed to provide good
results (Nunnally, 1968). Guttman scales which have low inter-item
correlations, despite the presence of high item-total correlations, are
unlikely to produce, therefore, any clearly delineated factor structure.
Given the Guttman scaling requirements of reproducibilities and
scalabilities being high are not met, the scale items would based on the
limitations noted above, be of optimal use only if there were only one
factor delineated. In this case rotation would be unnecessary, and,
therefore, the discovery of any clusters of highly interrelated sets
of items would not be possible beyond those suggested by different
signs on any bipolar factor. iIu short, the use of factor analysis to
salvage Guttman scales is limited to thode cases where the items are
scalable as one factor only. The suggestion that factor analysis can
delineate elaborate factor structure for Guttman scales is, therefore,
exaggerated.
The purpose of this paper is to provide an empirical example of the
use of factor analysis with Guttman scaling even taking into account the
criticisms of both very restricted item number of dichotomous responses.

-3-
The stability of the results was investigated by use of a panel of
subjects who responded to theoretical Guttman scale items for three waves.
DATA AND THE VARYABLES
The data for this paper come from al ongoing study of the industrial-
tion of a rural community in northern Illinois. As part of this study,
each year from 1966 to present (1973), high school students in both a
control area and the area under industrialization were given a questionnaire
asking information about their attitudes, values, and aspirations. For
this study, reports of their attitudes toward the legal institution were
used for all students with complete information on the 1967, 1968, and
1969 waves (R=244). Attitudes toward the legal institution were selected
because of their important theoretical interest, because of the avail-
ability of comparison data using similar subjects in the past (Clark
and Wenninger, 1964), and because the measurement of legal attitudes
is often based on older, presumably Guttman scales (Rundquist and
Sletto, 1936).
The attitude toward the legal institution was measured by 11 items
taken from Clark and Wenninger (1964). These items were:
1. On the whole, policemen are honest.
2. On the whole, judges are honest.
3. A person should obey the laws no matter how much one has to go
out of the way to do it.
4. In the courts a poor man has the same chances as a rich man.
5. Laws are made just for the good of a few.
6. A person should tell the truth in court, no matter what.
7. It is O.K. for a person to break the law if he doesn't get caught.

-4-
8. It is O.K. for a person to lie in court in order to protect a
friend who is on tr..11.
9. Almost anything can be fixed up in the courts if you have
enough money.
10. People who break the law are nearly always caught and punished.
11. Just because a person gets himself in a corner is no reason
to break the law.
On the questionnaire the students were given the opportunity to indicate
if they (1) strongly agreed, (2) agreed, (3) were undecided, (4) disagreed,
or (5) strongly disagreed with each item. The responses were coded such
that the higher the score, the greater the favorability of the attitude
toward the legal institution.
The theoretical law scales were the Rundquist-Sletto law scale
(Rundquist and Sletto, 1936) which consisted of the first seven items,
the Law scale taken from Clark and Wenninger (1964) which consisted of
items 3, 5, 7, 10, and 11, and the Court scale also taken from Clark and
Wenninger (1964) which consisted of items 1, 2, 4, 6, 8, and 9. These
scales were developed and have been used as Guttman scales.
To insure comparability of results based on the Guttman scaling
analysis, coding similar to that used by Clark and Wenninger (1964)
was used. For all items but two (items 10 and 11) a positive response
was coded if "strongly agree" was checked. For items 10 and 11 a positive
response was coded if "agree" or "strongly agree" was indicated.

-5 -
RESULTS
GUTTMAN SCALE ANALYSIS
In Ta*,,le 1 the item marginals and item errors are given for the
Rundquist-Sletto scale for the three waves of Aservationl. Over the
three years the rank order of the items remained relatively stable.'
With the exception of the first two items relating to the honesty of
policemen and judges, the level of positive responses rose each year.
That is, the level of anti-legal attitudes increased over the three
years of the study. The item errors were somewhat less stable. The
coefficients of reproducibilities for the scale were .90, .90, and
.92 over the three years. However, the coefficients of scalability
were not greatly over .60, which ine.cates that the quality of the scale
was somewhat low. Over the three years the percent of pure scale
types were 44 percent for 1967, 54 percent for 1968, and 57 percent for
1969. Over all three years there were more errors over items than for
individuals. The marginal reproducibilities for the three years were
.70, .68, and .79 respectively.
(Insert Table 1)
For the Court scale the item marginals and errors are given in
Table 2. Again, as with the Rundquist-Sletto scale, the rank order of
the items remained very stable.2
The marginals varied from 37.9 percent
to 85.5 percent positive responses. Most of the items increased in level
of positive response over the three years. The item errors were somewhat
-6-
less stable. The scale reproducibilities were all .90 in value, but
the scalabilities were .68, .73, and .67. Over all three years there
were more errors over items than for individuals. The minimum marginal
reproducibilities were .68, .63, and .69 respectively. The percent of
pure scale types were 52% for 1967, 53% for 1968, and 55% for 1969.
(Insert Table 2)
In Table 3 the item marginals and errors are given for the Law
scale. As with the other scales the rank order of items remained
relatvely stable over the three years.3 The item errors were also
relatively stable. The scale reproducibilities were .93 for 1967,
.93 for 1968, and .94 for 1969. However, the coefficient of scalabilities
were .72, .76, and .69 for the same years. For all the years there were
more maximum errors for items than for individuals. The minimum marginal
reproducibilities were .74, .72, and .82 respectively. The percent of
pure scale types were 66% for 1967, 69% for 1968, and 75% for 1969.
Over the years there was a trend upward in the level of positive
responses to the items on the scale.
(Insert Table 3)
The general rank order of items was similar for this study and that
of Clark and Wenninger (1964).4 The reproducibilities for the scales
for both studies were nearly identical in value. For the Clark and

-7-
Wenninger (1964) study the item reproducibilities averaged .87. For
this study no item reproducibility was less than .80 in value. Although
the scale reproducibilities were high, apparently they are an artifact
of item errors. For all the scales there were items with marginals
greater than 80% positive responses. This inflated the true scalability
of the attitude items. In general, the scalabilities of the scales
were relatively low (no coefficient of scalability was over .76).5
The scales should not, therefore, be treated RS Guttman scales, but as
quasi-scales.
FACTOR ANALYSIS
Using the original 1 to 5 coding, the items were all used in the
factor analysis. Not using dichotomous coding, and using all the items
rather than only those in each theoretical scale, was done in order to
take into account the criticisms presented earlier about using factor
analysis of Guttman scales.
Factor analysis using principal axis with varimax rotation was used.
Communalities were estimated using the SMC with iteration. Since the
standard error of a factor loading was found to be .09, the value of .30
was chosen as indicating a significant (at the .001 level) loading.
These loadings were used to indicate the factors associated with the
Legal attitudes. Since at least 10 subjects per item were used, the
result', of the factor analyses should reliably indicate the actual
patterns present in the data.
In Table 4 the results of the factor analysis for the 1967 wave are
given. The items all loaded significantly on the first unrotated factor.

-8-
This means that the items were clustering together, and this can be
taken as indicating their common scalability (Rummel, 1970). This factor
accounted for the largest percentage of the common variance (61.2%).
The second bipolar factor, indicates additional variance (24.3%) being
explained by two clusters of items. One cluster (items 1, 2, 4, 9,
and 10) seems to be related to the honesty of both the law and legal
officers, while the second cluster (items 3, 5, 6, 7, 8, and 11) seems
to be related to one's personal responsibility to obey the law.
(Insert Table 4)
By 1968, as seen in Table 5, the amount of variance explained by
the second unrotated bipolar factor dropped to only 1.7%. The items
on this factor, nonetheless, still loaded in a similar pattern to that
observed for the responses a year earlier for the same students. The
first general factor again accounted for over 60% of the common variance.
Since the second factor did not account for much additional variance,
rotation was not carried out.
(Insert Table 5)
The factor analysis results for the 1969 wave were similar to
earlier results. As seen in Table 5, the first general unrotated factor
accounted for 69% of the common variance, while the second bipolar

-9-
again only explained an additional 1.7% of the variance. The pattern
of loadings on this factor were, once again, similar to those found
for the preceding two waves. As with the preceding year's data rotation
was not necessary, since the second factor accounted for little additional
variance beyond that explained by the first.
SUMMARY AND CONCLUSION
For all three legal scales the scale analysis revealed that the
scales were not Guttman. Although the scale reproducibilities and item
reproducibilities were high, the scale scalabilities were not significantly
greater than .60. This low scalability appeared to be the result of
extremity in the items, and not extremity in individuals.
The general level of favorable attitudes toward legal institutions
was lower than in the study by Clark and Wenninger (1964). Over the
three years there appeared to be a trend toward decreased favorableness
toward legal institutions.
Factor analysis of the legal attitude items revealed that the items
wcte scalable, and suggested (in the sense of sets of different signs)
the presence of two possible clusters of items relating to the honesty
of the law and legal officials and to the necessity for obedience
of the law. However, this clustering did not delineate much variance
left unexplained by the general factor. Thus, with a 1.00 eigenvalue
selected as a criterion for rotation, delineation of independent clusters
of items associated with the legal attitudes was not possible for two
of the three waves. That is, discovery of independently highly correlated

-10-
sets of items was not permitted. This failure provides support for
the criticism of factor analysis of Guttman items presented earlier.
A clear.pattern of factors among the items was not delineated. This
result is of mixed blessing. While the scale items are not Guttman,
at least they do have a widely interrelated network of association
which explains a large majority of the common variance. That is, the
items can form a single factor scale. However, because there appeared,
in general, only one factor of significance, the delineation of independent
clusters of items was not possible. n short, while delineation of the
structure of the scale is given as a for use of factor
analysis with Guttman scales, delineation if successful indicates the
need to develop better tests of the factors foundi[Only with delineation
of variance rather than clusters of items (in essence no rotation being
necessary) will the non-Guttman items be adequate to provide a measure
of the general factor.1
Based on the above considerations it appears that use of factor
analysis with Guttman scales is not a desirable technique of scaling.
A better approach would be the single use of factor analysis in order
to help construct single factor scales of greater length.

REFERENCES
Clark, J. P., and E. P. Wenninger.1964 "The Attitude of Juveniles Toward the Legal Institution."
Journal of Criminal Law, Police Science 55 (December):482-489.
Gullahorn, J. E., and J. T. Gullahorn.1968 "The Utility of Applying Both Guttman and Factor Analysis
to Survey Data." Sociometry 31 (June): 213-218.
Labovitz, S.1972 "Statistical Usage in Sociology, Sacred Cows and Ritual."
Sociological Methods and Research 1 (November): 13-37.
Nunnally, J. C.1968 Psychometric Theory. New York: McGraw-Hill.
Rummel, R. J.1970 Applied Factor Analysis. Evanston: Northwestern Univ. Press.
Rundquist, E. A. and R. F. Sletto.1936 Personality in the Depression, Child Welfare Monograph
Series No. 12. Minneapolis: University of Minnesota.
Schuessler, K.1966 "A Note of Scale Analysis and Factor Analysis." Sociometry
29 (December): 461-467.

Table 1. Guttman Scale Item Marginals and Item Errors forthe Rundquist-Sletto Scale for the Three Waves of Observation
Item
1967
Error
1968 1969
Marginal ErrorMarginal Marginal Error
1 85.5 7.5 79.0 8.2 85.5 8.3
2 84.2 7.1 80.2 5.8 85.1 6.2
3 77.2 12.4 78.2 12.8 90.1 6.2
4 65.6 14.5 73.7 13.6 83.5 6.2
5 66.o 16.2 57.6 11.9 70.2 13.2
6 44.4 8.3 54.7 6.2 694 9.5
7 43.7 6.6 53.1 9.9 66.1 6.2
Reproducibility .90 .90 .92
Scalability .65 .69 .63

Table 2. Guttman Scale Item Marginals and Item Errorsfor the Court Scale for the Three Waves of Observation
Item Marginal
1967
Error
12§11
Marginal Error
1969
ErrorMarginal
1 85.5 5.0 79.0 5.3 85.5 8.3
2 84.2 2.5 80.2 5.8 85.1 6.6
3 44.4 8.7 54.7 13.6 69.4 14.9
4 51.9 14.5 51.4 11.5 64.o 14.5
5 31.0 19.1 46.9 14.4 52.9 3.7
6 39.0 12.9 37.9 7.8 55.8 13.2
Reproducibility .90 .90 .90
Scalability .68 .73 .67
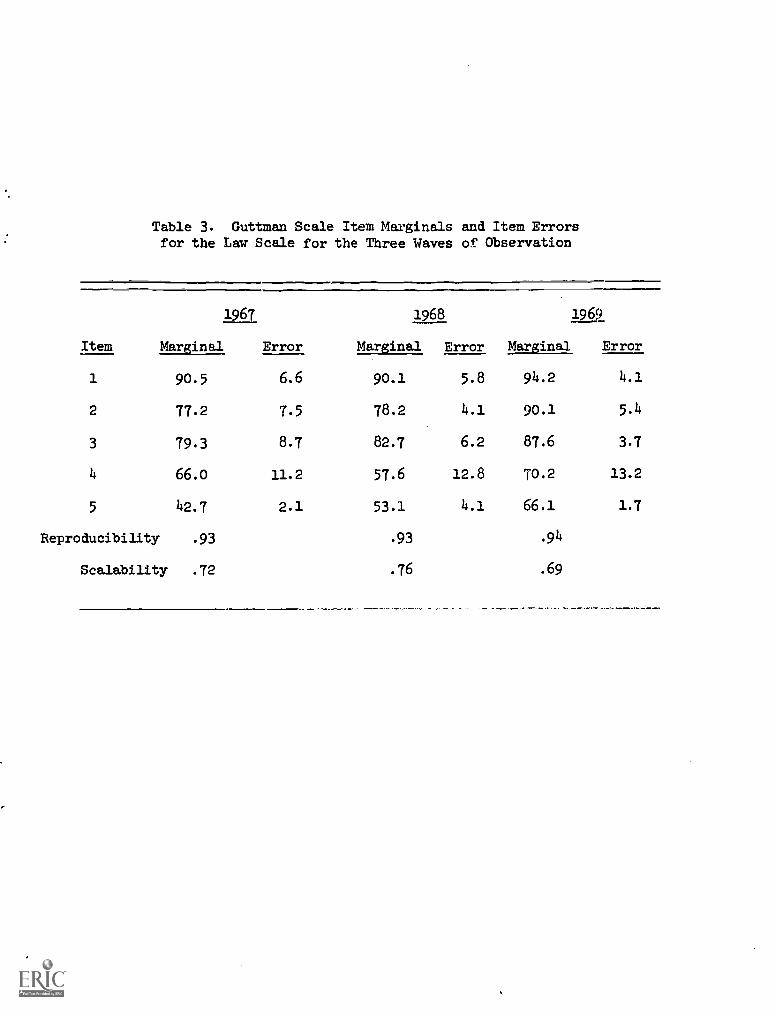
Table 3. Guttman Scale Item Marginals and Item Errorsfor the Law Scale for the Three Waves of Observation
Item Marginal
1967
Error
1968
Error
1969
Marginal ErrorMarginal
1 90.5 6.6 90.1 5.8 94 2 4.1
2 77.2 7.5 78.2 4.1 90.1 5.4
3 79.3 8.7 82.7 6.2 87.6 3.7
4 66.o 11.2 57.6 12.8 70.2 13.2
5 42.7 2.1 53.1 4.1 66.1 1.7
Reproducibility .93 .93 .94
Scalability .72 .76 .69

Table 4. Principal Axis and VarimaxFactor Matrices for the 1967 Wavea
Unrotated Matrix Rotated Matrix
Items 1
Factors
2 1
Factors
2
1 -371 -455 -020 587
2 -634 -348 249 679
3 -46o 196 475 155
4 -372 -286 092 46o
5 -584 005 443 38o
6 -52o 267 567 141
7 -609 262 631 2C3
8 -484 329 581 071
9 -511 -253 218 527
10 -227 -252 005 339
11 -312. 422 512 -113
Eigenvalues 2.516 1.001 1.86 1.66
% Vc 61.2% 24.3% 52.9% 47.1%
aDecimals omitted

Table 5 Principal Axis Factor Matricesfor the 1968 and 1969 Waves of Observationa
1968
Factors
1969
Factors
Item 1 2 1 2
1 -650 354 -535 352
2 -635 451 -537 406
3 -536 -088 -551 -185
4 -530 260 -503 223
5 -593 -023 -597 130
6 -604 -253 -524 -323
7 -621 -392 -641 -304
8 -595 -312 -568 -290
9 -477 190 -550 259
10 -336 114 -471 o44
11 -508 -277 -471 -271
Eigenvalues 3.45 .85 3.24 .81
% CommonVarianceExplained 69.0% 1.7% 69.2% 1.7%
aDecimals omitted

1The marginals for the items were somewhat higher than those found by
Clark and Wenninger (;.964). There the marginals were (using the same
order of items): 79.5, 73.0, 69.5, 67.5, 50.5, 48.5, and 43.5 percent
positive responses.
2The item marginals for the items found by Clark and Wenninger (1964)
were as follows: 72.5%, 69.5%, 66.0%, 51.5%, and 42.5%.
3The order of items was essentially as that found in Clark and Wenninger
(1964). There the marginals were: 79.5, 73.0, 48.5, 42.5, 35.0, and
29.5 percent.
4In the Clark and Wenninger (1964) study the juveniles in the rural farm
area (N=274) held more favorable attitudes toward legal institutions than
did youth in the urban areas. Also they found that older youth in the
rural farm areas were more likely to hold negative attitudes than the
younger youth. For these data the percent of youth holding favorable
attitudes toward legal institutions (0-3 on the Rundquist-Sletto scale)
were (omitting those with undecided responses) 42.7% in 1967, 41.3% in
1968, and 28.7% in 1969. This contrasts with a 58% level of favorable
response (no undecided responses) found by Clark and Wenninger in 1961.
Therefore, the data from this study are somewhat lower in the level of
favorable attitudes toward legal institutions than those rural youth
investigated in 1961. In addition, over the high school years as the
youth age, the level of favorable response toward legal institutions
drops (quite dramatically from 1968 to 1969).
Using the cross-section of the total high school population for 1967 -
and 1968 the level of favorable response was 43.6% and 43.3% respectively.
The undecided responses were not used. The N's varied frold340 to 400.

-2-
When the "undecided" responses were not used in the analysis, the
coefficients of reproducibility for the scales were not affected.
The scalabilities tended to decrease slightly. When the total
cross-sectional high school populations for 1967 and 1968 were
used, the reliabilities were similar to those obtained above, and
the stabilities remained solidly in the .60 range.
Related Documents