Constraint-Based Model of Shewanella oneidensis MR-1 Metabolism: A Tool for Data Analysis and Hypothesis Generation Grigoriy E. Pinchuk 1 * . , Eric A. Hill 1 , Oleg V. Geydebrekht 1 , Jessica De Ingeniis 2 , Xiaolin Zhang 3 , Andrei Osterman 2 , James H. Scott 4 , Samantha B. Reed 1 , Margaret F. Romine 1 , Allan E. Konopka 1 , Alexander S. Beliaev 1 , Jim K. Fredrickson 1 , Jennifer L. Reed 3 * . 1 Biological Sciences Division, Pacific Northwest National Laboratory, Richland, Washington, United States of America, 2 Burnham Institute for Medical Research, La Jolla, California, United States of America, 3 Department of Chemical and Biological Engineering, University of Wisconsin-Madison, Madison, Wisconsin, United States of America, 4 Department of Earth Sciences, Dartmouth College, Hanover, New Hampshire, United States of America Abstract Shewanellae are gram-negative facultatively anaerobic metal-reducing bacteria commonly found in chemically (i.e., redox) stratified environments. Occupying such niches requires the ability to rapidly acclimate to changes in electron donor/ acceptor type and availability; hence, the ability to compete and thrive in such environments must ultimately be reflected in the organization and utilization of electron transfer networks, as well as central and peripheral carbon metabolism. To understand how Shewanella oneidensis MR-1 utilizes its resources, the metabolic network was reconstructed. The resulting network consists of 774 reactions, 783 genes, and 634 unique metabolites and contains biosynthesis pathways for all cell constituents. Using constraint-based modeling, we investigated aerobic growth of S. oneidensis MR-1 on numerous carbon sources. To achieve this, we (i) used experimental data to formulate a biomass equation and estimate cellular ATP requirements, (ii) developed an approach to identify cycles (such as futile cycles and circulations), (iii) classified how reaction usage affects cellular growth, (iv) predicted cellular biomass yields on different carbon sources and compared model predictions to experimental measurements, and (v) used experimental results to refine metabolic fluxes for growth on lactate. The results revealed that aerobic lactate-grown cells of S. oneidensis MR-1 used less efficient enzymes to couple electron transport to proton motive force generation, and possibly operated at least one futile cycle involving malic enzymes. Several examples are provided whereby model predictions were validated by experimental data, in particular the role of serine hydroxymethyltransferase and glycine cleavage system in the metabolism of one-carbon units, and growth on different sources of carbon and energy. This work illustrates how integration of computational and experimental efforts facilitates the understanding of microbial metabolism at a systems level. Citation: Pinchuk GE, Hill EA, Geydebrekht OV, De Ingeniis J, Zhang X, et al. (2010) Constraint-Based Model of Shewanella oneidensis MR-1 Metabolism: A Tool for Data Analysis and Hypothesis Generation. PLoS Comput Biol 6(6): e1000822. doi:10.1371/journal.pcbi.1000822 Editor: Daniel A. Beard, Medical College of Wisconsin, United States of America Received October 1, 2009; Accepted May 19, 2010; Published June 24, 2010 Copyright: ß 2010 Pinchuk et al. This is an open-access article distributed under the terms of the Creative Commons Attribution License, which permits unrestricted use, distribution, and reproduction in any medium, provided the original author and source are credited. Funding: This research was supported by the U.S. Department of Energy (DOE) Office of Biological and Environmental Research under the Genomics:GTL Program via the Shewanella Federation consortium and the Microbial Genome Program (MGP). The Pacific Northwest National Laboratory is operated for the DOE by Battelle Memorial Institute under Contract DE-AC05-76RLO 1830. The funders had no role in study design, data collection and analysis, decision to publish, or preparation of the manuscript. Competing Interests: The authors have declared that no competing interests exist. * E-mail: [email protected] (JLR); [email protected] (GEP) . These authors contributed equally to this work. Introduction Shewanella are common organoheterotrophic organisms in both marine and fresh water environments, particularly in those receiving high inputs of organic matter and where redox conditions fluctuate in space and time. Shewanella oneidensis MR-1 is a dissimilatory manganese-reducing bacterium isolated from Lake Oneida in upstate New York [1] and is among the best studied members of this genus. It grows well on three-carbon substrates such as lactate and pyruvate, but can also use a range of other compounds as sole carbon and energy sources, including protein and DNA [2,3] and N-acetylglucosamine [4]. Shewanella is particularly well-adapted to redox interface environments [5] where electron donor (carbon substrate) is abundant but electron acceptors can be limiting and variable over short distances. Many members of this genus can utilize a wide range of electron acceptors, including O 2 , fumarate, nitrate, nitrite, sulfite, tetra- thionate, thiosulfate, TMAO, DMSO, Fe(III), and Mn(VI). Given its propensity to transfer electrons to extracellular substrates, Shewanella has been of interest for use in microbial fuel cells [6–8]. Because of its ability to reduce metals and radionuclides it has also been used as a model organism for investigating redox transformations of environmental contaminants such as uranium [9] and technetium [10]. Shewanella are obligately respiring bacteria; however, S. oneidensis MR-1 has recently been shown to survive by fermenting pyruvate [11]. These bacteria use a limited range of substrates for growth by anaerobic respiration (lactate, pyruvate, and DNA [1,2,12]), PLoS Computational Biology | www.ploscompbiol.org 1 June 2010 | Volume 6 | Issue 6 | e1000822

Welcome message from author
This document is posted to help you gain knowledge. Please leave a comment to let me know what you think about it! Share it to your friends and learn new things together.
Transcript
Constraint-Based Model of Shewanella oneidensis MR-1Metabolism: A Tool for Data Analysis and HypothesisGenerationGrigoriy E. Pinchuk1*., Eric A. Hill1, Oleg V. Geydebrekht1, Jessica De Ingeniis2, Xiaolin Zhang3, Andrei
Osterman2, James H. Scott4, Samantha B. Reed1, Margaret F. Romine1, Allan E. Konopka1, Alexander S.
Beliaev1, Jim K. Fredrickson1, Jennifer L. Reed3*.
1 Biological Sciences Division, Pacific Northwest National Laboratory, Richland, Washington, United States of America, 2 Burnham Institute for Medical Research, La Jolla,
California, United States of America, 3 Department of Chemical and Biological Engineering, University of Wisconsin-Madison, Madison, Wisconsin, United States of
America, 4 Department of Earth Sciences, Dartmouth College, Hanover, New Hampshire, United States of America
Abstract
Shewanellae are gram-negative facultatively anaerobic metal-reducing bacteria commonly found in chemically (i.e., redox)stratified environments. Occupying such niches requires the ability to rapidly acclimate to changes in electron donor/acceptor type and availability; hence, the ability to compete and thrive in such environments must ultimately be reflected inthe organization and utilization of electron transfer networks, as well as central and peripheral carbon metabolism. Tounderstand how Shewanella oneidensis MR-1 utilizes its resources, the metabolic network was reconstructed. The resultingnetwork consists of 774 reactions, 783 genes, and 634 unique metabolites and contains biosynthesis pathways for all cellconstituents. Using constraint-based modeling, we investigated aerobic growth of S. oneidensis MR-1 on numerous carbonsources. To achieve this, we (i) used experimental data to formulate a biomass equation and estimate cellular ATPrequirements, (ii) developed an approach to identify cycles (such as futile cycles and circulations), (iii) classified how reactionusage affects cellular growth, (iv) predicted cellular biomass yields on different carbon sources and compared modelpredictions to experimental measurements, and (v) used experimental results to refine metabolic fluxes for growth onlactate. The results revealed that aerobic lactate-grown cells of S. oneidensis MR-1 used less efficient enzymes to coupleelectron transport to proton motive force generation, and possibly operated at least one futile cycle involving malicenzymes. Several examples are provided whereby model predictions were validated by experimental data, in particular therole of serine hydroxymethyltransferase and glycine cleavage system in the metabolism of one-carbon units, and growth ondifferent sources of carbon and energy. This work illustrates how integration of computational and experimental effortsfacilitates the understanding of microbial metabolism at a systems level.
Citation: Pinchuk GE, Hill EA, Geydebrekht OV, De Ingeniis J, Zhang X, et al. (2010) Constraint-Based Model of Shewanella oneidensis MR-1 Metabolism: A Tool forData Analysis and Hypothesis Generation. PLoS Comput Biol 6(6): e1000822. doi:10.1371/journal.pcbi.1000822
Editor: Daniel A. Beard, Medical College of Wisconsin, United States of America
Received October 1, 2009; Accepted May 19, 2010; Published June 24, 2010
Copyright: � 2010 Pinchuk et al. This is an open-access article distributed under the terms of the Creative Commons Attribution License, which permitsunrestricted use, distribution, and reproduction in any medium, provided the original author and source are credited.
Funding: This research was supported by the U.S. Department of Energy (DOE) Office of Biological and Environmental Research under the Genomics:GTLProgram via the Shewanella Federation consortium and the Microbial Genome Program (MGP). The Pacific Northwest National Laboratory is operated for the DOEby Battelle Memorial Institute under Contract DE-AC05-76RLO 1830. The funders had no role in study design, data collection and analysis, decision to publish, orpreparation of the manuscript.
Competing Interests: The authors have declared that no competing interests exist.
* E-mail: [email protected] (JLR); [email protected] (GEP)
. These authors contributed equally to this work.
Introduction
Shewanella are common organoheterotrophic organisms in both
marine and fresh water environments, particularly in those
receiving high inputs of organic matter and where redox
conditions fluctuate in space and time. Shewanella oneidensis MR-1
is a dissimilatory manganese-reducing bacterium isolated from
Lake Oneida in upstate New York [1] and is among the best
studied members of this genus. It grows well on three-carbon
substrates such as lactate and pyruvate, but can also use a range of
other compounds as sole carbon and energy sources, including
protein and DNA [2,3] and N-acetylglucosamine [4]. Shewanella is
particularly well-adapted to redox interface environments [5]
where electron donor (carbon substrate) is abundant but electron
acceptors can be limiting and variable over short distances. Many
members of this genus can utilize a wide range of electron
acceptors, including O2, fumarate, nitrate, nitrite, sulfite, tetra-
thionate, thiosulfate, TMAO, DMSO, Fe(III), and Mn(VI). Given
its propensity to transfer electrons to extracellular substrates,
Shewanella has been of interest for use in microbial fuel cells [6–8].
Because of its ability to reduce metals and radionuclides it has also
been used as a model organism for investigating redox
transformations of environmental contaminants such as uranium
[9] and technetium [10].
Shewanella are obligately respiring bacteria; however, S. oneidensis
MR-1 has recently been shown to survive by fermenting pyruvate
[11]. These bacteria use a limited range of substrates for growth by
anaerobic respiration (lactate, pyruvate, and DNA [1,2,12]),
PLoS Computational Biology | www.ploscompbiol.org 1 June 2010 | Volume 6 | Issue 6 | e1000822
whereas aerobic growth is supported by a larger range of carbon
containing compounds. Of particular interest is the inability of
Shewanella, unlike Geobacter [13] and Anaeromxyobacter [14], to grow
by coupling acetate oxidation to reduction of electron acceptors
other than O2 [12]. Moreover, growth of Shewanella on lactate
under anaerobic conditions is accompanied by acetate accumu-
lation [12]. Elucidation of the mechanisms underlying these and
other metabolic traits is important to gain a deeper understanding
of the roles of Shewanella in catalyzing important environmental
processes, as well as to assess and improve their potential for
biotechnological applications. Genome-scale metabolic models
allow for a systematic assessment of the metabolic capabilities of an
organism. These models can be used to analyze and predict the
metabolic behavior of microorganisms under different environ-
mental conditions and in response to genetic alterations [15]. As
such, these models have been used in metabolic engineering for
designing industrial production strains in silico [16–18].
In this work, we developed a metabolic reconstruction for S.
oneidensis MR-1 and analyzed a genome-scale constraint-based
model of MR-1 metabolism to interrogate the organism’s
metabolic behavior and capabilities under aerobic conditions
and to estimate the growth- and non-growth rate dependent ATP
requirements. We made detailed biomass composition measure-
ments for macromolecules (DNA, RNA, lipids, protein, and
carbohydrates) and amino acids. These measurements were used
to construct a biomass production reaction that was included in
the metabolic model iSO783. The resulting model was used to
identify futile cycles, predict biomass yields on alternative carbon
and energy sources, and refine intracellular flux distributions for
lactate-limited growth by integrating experimental data. We also
illustrate how models can be used to improve understanding of
microbial metabolism by incorporating experimental data to refine
metabolic pathways reconstructed from a genome annotation as
well as to predict how cells will behave in response to genetic or
environmental perturbations.
Results
S. oneidensis MR-1 Biomass Composition and MetabolicReconstruction
The biomass composition was measured experimentally for S.
oneidensis MR-1 grown in a lactate-limited chemostat under aerobic
conditions with a dilution rate (D) = 0.095 h21 and contained
52.8% protein, 17.5% lipids, 7.7% carbohydrates, 9% RNA, and
5% DNA on a g/g AFDW (ash-free dry weight) basis. The
remaining biomass constituents (peptidoglycan-2.5%, lipopolysac-
charides-3.4%, and soluble intracellular pools-3.1%) were as-
sumed to have similar abundances as in E. coli [19]. The
comparison of AFDW values to the sum of all cellular components
measured in complete liquid culture revealed that the difference
between them never exceeded 3%, which is in the error range for
the methods used. This observation indicates that S. oneidensis MR-
1 did not excrete a significant amount of polymers under these
growth conditions and that our approximations for un-measured
biomass components were reasonable. The nucleotide composi-
tion of RNA and DNA were estimated based on the GC content of
MR-1, and the amino acid composition of the proteins and the
cellular lipid composition were based on experimental measure-
ments. Together this information was used to formulate a biomass
equation for the network (see Table S1 for complete biomass
details), which was used as an objective function to predict
intracellular flux distributions and growth rates. Intracellular
fluxes are expected to be more sensitive to changes in biomass
composition (due to incorrect estimates of unmeasured biomass
components or resulting from different growth conditions) than
calculated biomass yields and energy requirements [20,21].
The S. oneidensis MR-1 metabolic network was reconstructed
using an automated procedure followed by manual curation (see
Materials and Methods for details). Manual curation was carried
out to verify the reactions included in the automodel were correct
and to generate organism-specific biosynthesis pathways (such as
phospholipids, lipopolysaccharides, and quinones). The result is a
final reconstruction that includes 774 reactions, 783 genes, and
634 unique metabolites (see Tables S2 and S3 for network details)
and contains biosynthesis pathways for all amino acids, nucleo-
tides, lipids, and for a number of cofactors (NAD, NADP, FAD,
CoA, acyl carrier protein, folate, quinones, pyridoxal 5-phosphate,
and hemes). Particular attention was given to electron transport
where the primary literature (see Table S2 for references) and S.
oneidensis MR-1 annotated genome were used to manually
reconstruct the pathways leading to the reduction of various
electron acceptors
An important issue in the reconstruction of metabolism is the
correct accounting of ATP production during substrate oxidation.
Reconstructing the electron transport pathways can be challenging
since energy conservation during respiration varies as a function of
organism and growth condition [22,23]. Three terminal oxidases,
which use O2 as the electron acceptor, were included in the
metabolic network: two cytochrome c oxidases (Cco, SO2361–
2364; Cox, SO4606–4607, SO4609) and one cytochrome d
ubiquinol oxidase (Cyd, SO3285–3286). The use of either Cco or
Cox, in combination with ubiquinol-cytochrome c reductase (Pet,
SO0608–0610), results in the translocation of 6H+/2e2 across the
cytoplasmic membrane as electrons move from ubiquinol to O2
[24]. However, the use of Cyd only results in the translocation of
2H+/2e2 as electrons are transferred from ubiquinol to O2.
Previous proton translocation measurements for S. oneidensis MR-1
with oxygen as the electron acceptor found that a maximum of
2.8H+/2e2 are translocated when cells are grown aerobically [25].
This measurement implies that the flux through Cyd is four times
Author Summary
The role of members of the genus Shewanella in globalcarbon and nutrient cycles is implicated based on theirwide distribution and their ability to link organic matteroxidation to reduction of many organic and inorganicelectron acceptors both natural and artificial. Thesebacteria are also important in bioremediation efforts andother developing fields, including energy generatingbiocatalysis and the production of useful carbon contain-ing compounds. In this study we applied a suite ofsystems-biology tools, including computational and high-throughput experimental approaches, to develop apredictive understanding of S. oneidensis MR-1 metabo-lism. We built a metabolic model and used it to analyzeexperimental data and to predict cellular phenotypes.Predicted cellular biomass yields on different carbonsources under aerobiosis were compared to experimentalmeasurements, and experimental results were used torefine metabolic fluxes for growth on lactate. Computa-tional and experimental analysis of S. oneidensis MR-1metabolism revealed some of the reasons for a significantdifference between experimental and predicted aerobicgrowth efficiency on lactate. The developed modelprovides a platform for a systematic assessment ofShewanella metabolism, which may be used for redesign-ing metabolic networks for chemical production.
Modeling S. oneidensis Metabolism
PLoS Computational Biology | www.ploscompbiol.org 2 June 2010 | Volume 6 | Issue 6 | e1000822
higher than the combined flux through Pet-Cco and Pet-Cox;
therefore, all aerobic simulations reported in the results sections
below were performed using this flux ratio constraint (see
discussion for how the assumed H+/e2 affects results).
Estimation of ATP RequirementsTo estimate S. oneidensis MR-1 ATP requirements, the lactate
consumption rate was measured at different dilution rates in a
chemostat. Analysis of cultural liquid revealed no detectable
amounts of organic acids and that residual lactate concentrations
were below 0.1 mM (the detection limit of the quantification
method used); therefore all the lactate added to the medium
(18mM) was consumed by the bacteria. Using the lactate
consumption rate as a model constraint, we calculated the
maximal amount of ATP that could be hydrolyzed while still
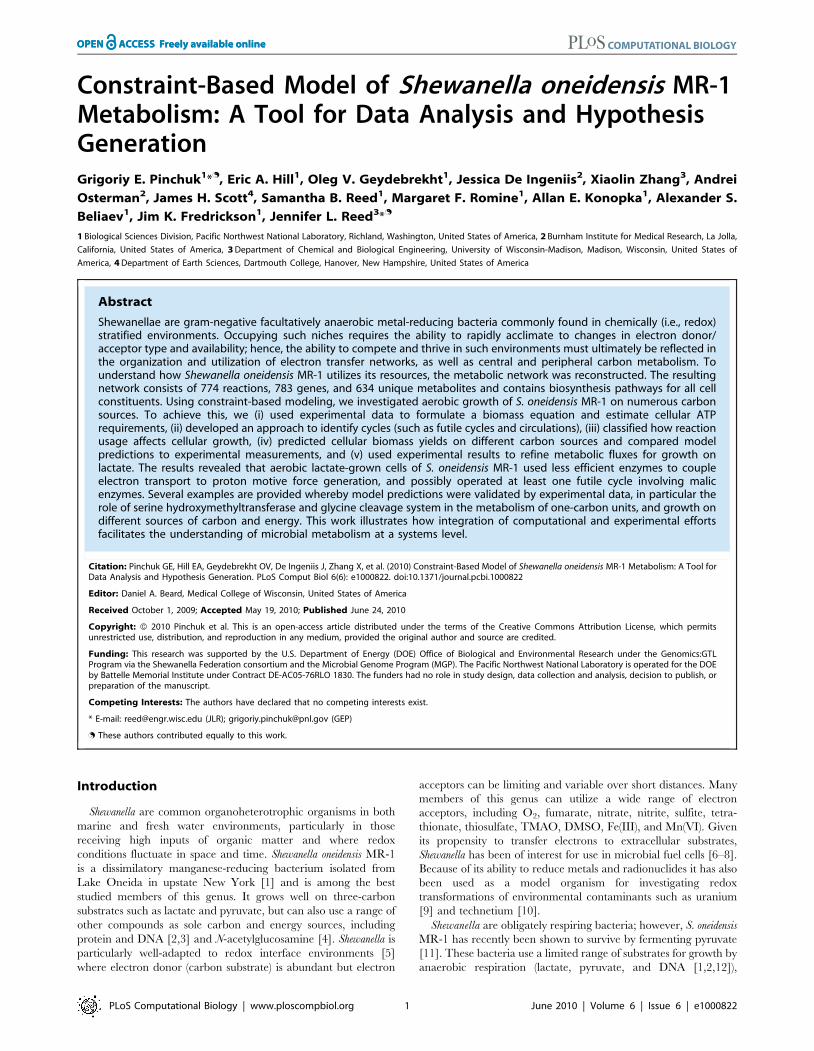
maintaining the measured growth rate. A linear relationship was
found between dilution rates (D) and maximum ATP hydrolysis
(Figure 1A), where the slope represents the growth rate-dependent
ATP requirements (GAR), and the intercept the non-growth rate
dependent ATP requirement (NGAR) [26]. The maximal rate of
ATP hydrolysis then represents GAR multiplied by the cellular
growth rate plus NGAR. In our model GAR accounts for the
energy expenditure on unknown processes that may include
protein and mRNA turnover or repair, proton leakage, and
maintenance of membrane integrity, but does not account for
ATP spent on polymerization reactions, as this is directly
accounted for in the macromolecular synthesis reactions included
in the metabolic network.
From the experimental growth and lactate consumption rates,
the model estimated NGAR to be 1.03 mmol ATP/(g AFDWNh),
and GAR to be 220.22 mmol ATP/g AFDW, when the transfer of
electrons from ubiquinol to O2 has a proton translocation
efficiency of 2.8H+/2e2. This GAR is significantly higher than
values reported for other microorganisms (Figure 1B) [26–32].
Using the estimated ATP requirements as parameters in the
model, we calculated the maximum growth rate as a function of
lactate consumption rate and compared it to experimental
measurements (Figure 1C), which included additional growth
rates not used in the estimation of the ATP requirements.
Interestingly, at growth rates above 0.085 h21, S. oneidensis MR-1
was able to grow more efficiently than predicted by the model
(experimental biomass yield was higher than predicted yield), while
at growth rates less than or equal to 0.085 h21, the model-
estimated biomass yields were in good agreement with experi-
mental values. This may imply that at lower dilution rates the cells
could be using metabolic pathways that reduce energetic
efficiency.
Futile Cycles & Suboptimal PathwaysFutile cycling occurs when opposing reactions catalyzed by
different enzymes take place simultaneously, resulting in a
dissipation of energy. Given the high apparent GAR value for S.
oneidensis MR-1 compared to other evaluated bacteria (Figure 1B),
we hypothesized that energy-dissipating futile cycles may operate
in S. oneidensis MR-1 under aerobic conditions. Since the bacteria
are not exposed to high O2 concentrations in their environment
they may not be adapted to O2 rich environments, but rather to
growth in suboxic and anoxic environments enriched with other
electron acceptors besides O2 [5]. To assess this issue, we
developed a new optimization-based approach to identify ATP-
dependent futile cycles in the network (see Materials and
Methods). The approach can also be used to identify cycles with
no net transformations (e.g. circulations [26]) or cycles where the
net reaction is a transhydrogenase activity. The smallest one
hundred and thirty futile cycles (i.e. those containing the fewest
number of reactions, which are likely to be more biologically
realistic) in the iSO783 metabolic network were found computa-
Figure 1. ATP requirements for maintenance and growth. PanelA shows the model estimated maximum ATP hydrolysis rates needed tomatch experimentally measured lactate consumption rates and cellulargrowth rates at four different dilution rates (D = 0.025. 0.04, 0.055,0.085 h21). The slope and intercept represent the growth- and non-growth rate dependent ATP requirements, GAR and NGAR, respectively.Panel B shows ATP requirements for various microbes that have beenreported in the literature [26–32]. The reported GAR values for othermicrobes were adjusted to remove ATP used for protein polymerization(4 ATP/peptide bond) since ATP used for protein synthesis is accountedfor separately in the S. oneidensis MR-1 model and is not part of the MR-1 GAR value. Panel C compares model estimates of maximum growthrates (solid line) at different lactate consumption rates (using ATPrequirements as reported in panel A) with experimental data. Additionaldata points were included that were not used in the estimation of theATP requirements.doi:10.1371/journal.pcbi.1000822.g001
Modeling S. oneidensis Metabolism
PLoS Computational Biology | www.ploscompbiol.org 3 June 2010 | Volume 6 | Issue 6 | e1000822
tionally (listed in Table S4), each containing between 2 and 11
reactions.
A number of the reactions participating in these futile cycles are
necessary for the maximum production of biomass, and it is the
flux through their reaction partners that dissipates ATP and
reduces biomass production (Figure 2A). To identify which portion
of a futile cycle was needed for optimal biomass production and
which portion caused futile cycling, flux variability analysis (FVA)
[33] was used to determine fluxes through reactions during
optimal and suboptimal biomass production and ATP dissipation
(see Materials and Methods). These FVA results allowed us to
classify all reactions in the metabolic network as being:
(i) optimal— meaning a non-zero flux through the reaction
can lead to maximum biomass production
(ii) suboptimal and futile— a non-zero flux through the
reaction reduces biomass production and the reaction is
part of a futile cycle
(iii) suboptimal and non-futile— a non-zero flux through the
reaction reduces biomass production but the reaction is not
part of a futile cycle; for example, a less energetically
efficient alternative pathway
(iv) blocked— no flux through the reaction is possible at steady
state
While the enumerated futile cycles themselves are independent
of growth condition, the classification of the fluxes by FVA
depends on the growth condition used in the simulation. For
lactate-limited aerobic growth, the distribution of reactions
(Figure 2B) and their associated genes (Figure 2C) in the iSO783
network into the different categories was determined. These
reaction distributions are similar to those found for E. coli during
optimal growth in aerobic minimal media [34].
Once reactions and genes are classified, various types of datasets
(e.g., gene expression, proteomic, metabolomic) can be used to
identify what suboptimal reactions are potentially used that might
explain the high GAR values. We evaluated available gene
expression data for lactate aerobic and O2-limited growth
obtained from the M3D database [35] and focused our analysis
on the 181 genes that were associated with suboptimal reactions
(either futile or non-futile) and not optimal reactions. Thirty-nine
of these 181 genes had both: (i) higher expression under aerobic
conditions than the average expression of 387 genes associated
with optimal reactions; and (ii) higher change in expression
between aerobic and O2-limited conditions, as compared to the
average change in expression for genes associated with optimal
reactions (i.e., 39 red dots fall within upper right quadrant of
Figure 2D).
Based on this gene expression analysis, it appears that some
futile cycles may be operational during aerobic growth on lactate.
These include pyruvate kinase and phosphoenolypyruvate syn-
thase and fatty acid synthesis and degradation. Phosphoenolpyr-
uvate carboxylase was also picked up in our analysis of the
expression data, and it participates in futile cycles with malic
enzymes. Experimental assessment revealed that when either of
the two malic enzymes (SO3855 or SO4118) was deleted, the cells
showed a ,25% increase in biomass yield (indicated by higher
final ODs) over the wild-type strain in lactate aerobic batch
cultures (Figure S1A), indicating that futile cycles involving malic
enzyme may reduce biomass yield and thereby contribute to the
apparent high GAR value.
Additionally, under aerobic conditions some less energetically
efficient enzymes are expressed at higher levels than their more
energetically efficient counterparts. This includes two NADH
dehydrogenases, Ndh (SO3517) and Nqr (SO1103–1108). These
both show higher expression and higher relative changes in
expression (aerobic versus O2-limited conditions) than the nuo
genes, which encode for the more energetically efficient proton-
translocating NADH dehydrogenase. Likewise, the ABC-sulfate
transporter (SO3599–3602) shows higher expression than the
proton symport sulfate transporters SulP (SO2286 or SO3553), the
latter being more energetically efficient.
Comparing Model Predictions to Qualitative GrowthPhenotypes
Although S. oneidensis MR-1 has been considered to be rather
limited in terms of the compounds it can use as carbon and energy
sources [36], its genome analysis implies that this bacterium has
pathways for utilization of different amino acids, nucleosides, fatty
acids, and C1–C3 compounds [37]. To further investigate S.
oneidensis MR-1’s metabolic capabilities, we used flux balance
analysis (FBA) to identify metabolites that could be used as sole
carbon sources under aerobic conditions, and then experimentally
tested some of those predictions. Thirty-three compounds were
predicted to be able to support S. oneidensis MR-1 aerobic growth,
indicating that all the necessary transporters and catabolic
enzymes are present in the genome. About half of these were
reported previously or were found in this study to be able to
support growth of S. oneidensis MR-1 experimentally (see Table S5
for details).
Some of the predicted carbon sources are amino acids, and
while there have been reports of S. oneidensis MR-1 growing on
mixtures of amino acids [38], there have been no studies
investigating which individual amino acids support growth as sole
carbon and energy sources. We subsequently screened eight
individual amino acids and found that glutamate, glutamine,
threonine, and serine were able to support S. oneidensis MR-1
growth, while alanine, aspartate, asparagine, and glycine could not
(Table S5). This indicates that for the latter four amino acids,
regulatory or kinetic limitations likely prevent their use as sole
carbon and energy sources, because these bacteria appear to have
the enzymes and transporters needed to degrade them.
The inability of S. oneidensis MR-1 to grow on glycine was
investigated further. The model predicted that MR-1 could
metabolize glycine by first using the glycine cleavage system to
convert glycine into 5,10-methylenetetrahydrofolate (mlthf), CO2
and NH4, and then combining mlthf with another glycine
molecule to produce serine (by serine hydroxymethyltransferase,
glyA) which can then be deaminated into pyruvate. Further
experiments revealed that (i) addition of glycine restored aerobic
growth on lactate of S. oneidensis MR-1 glyA deletion mutant (see
Figure S2 and S3), which is unable to synthesize glycine from
serine, and (ii) utilization of glycine as the sole source of nitrogen
was mainly dependent on glycine cleavage system (see Text S1 and
Figure S4) indicating that glycine can be taken up and
metabolized. Based on these results, we concluded that S. oneidensis
MR-1 is unable to use glycine as a sole carbon source, possibly due
to transport limitations and/or insufficient activity of serine
hydroxymethyltransferase (in the glycine to serine direction) due
to kinetic or transcriptional regulatory limitations.
During our evaluation of S. oneidensis MR-1’s capability to use
carbon sources, we found four cases where the model did not
correctly predict the use of carbon sources that had been shown to
support growth experimentally, including threonine, adenosine,
deoxyadenosine, and inosine. We found that adding a secretion
reaction for hypoxanthine to the metabolic model would allow the
model to predict growth on adenosine, deoxyadenosine, and
Modeling S. oneidensis Metabolism
PLoS Computational Biology | www.ploscompbiol.org 4 June 2010 | Volume 6 | Issue 6 | e1000822
inosine, while the addition of a threonine transport reaction
enabled the model to accurately predict growth on threonine.
Comparison between Predicted and ExperimentalBiomass Yields
We also used FBA to evaluate the quantitative accuracy of
growth phenotype predictions. Biomass yields (g AFDW/mmol
carbon source) were calculated by constraining the consumption
rate for carbon sources and identifying flux distributions that
maximize growth rate using FBA. As with all previous simulations,
the ratio of fluxes between the cytochrome oxidases was
constrained so that 2.8H+ are translocated for each pair of
electrons that move from ubiquinol to O2. Figure 3A shows the
calculated maximal biomass yields for thirty of the thirty-three
model predicted carbon sources identified above and the
corresponding O2 requirements (mmol O2/mmol carbon source)
needed to achieve the maximal biomass yield (see Table S5 for
complete details; the three fatty acids fall outside the region shown
in Figure 3A). The O2 requirements were normalized to mmol
carbon source to be consistent with the predicted biomass yields
(mgAFDW/mmol carbon source) and to reflect the amount of O2
needed to convert a fixed amount of substrate into biomass.
Substrates such as putrescine, ornithine, propionate, and acetate
have the highest ratios of O2 requirement to biomass yields, while
the nucleosides (cytidine, uridine, deoxyuridine and deoxycytidine)
have the lowest ratios.
To further evaluate the sensitivity of the biomass yields to O2
consumption rates, we fixed the substrate consumption rate for
three different C3 compounds and constrained the O2 consump-
tion rate to different values. The corresponding calculated biomass
yields were significantly affected by the O2 consumption rate
(Figure 3B). If O2 consumption rates are too high, no biomass can
be produced, as all carbon is oxidized to CO2, and no biomass can
be produced without O2 (in agreement with the inability of MR-1
to grow fermentatively). In addition to the O2 consumption rate,
the calculated biomass yields can also be sensitive to biomass
composition measurements used to formulate the biomass
reaction. To evaluate the effects of biomass composition on
calculated biomass yields, the protein, DNA, RNA, and glycogen
abundances were independently altered 630% from their
measured values, with corresponding reductions or elevations in
the levels of other biomass components. The calculated biomass
yields were most sensitive to changes in protein levels, but even a
30% decrease in protein abundance only led to a 2.5% increase in
predicted biomass yield. Overall, the calculated biomass yields
were more sensitive to changes in O2 consumption rates than to
biomass composition.
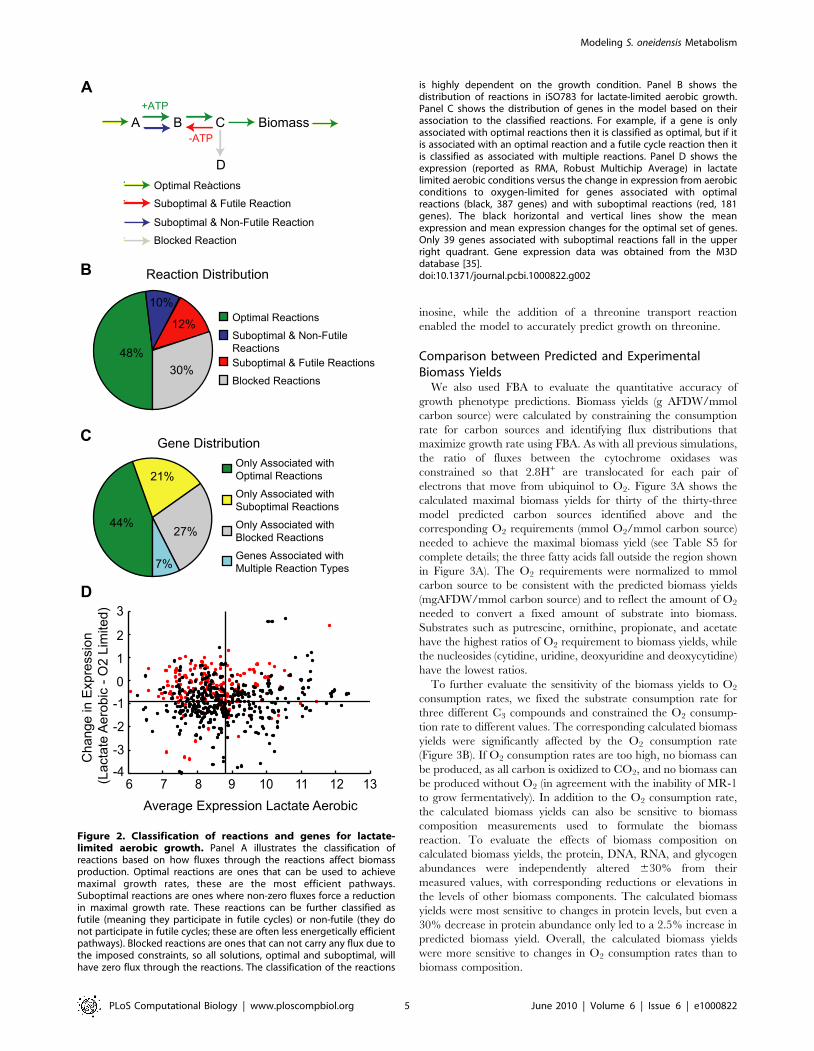
Figure 2. Classification of reactions and genes for lactate-limited aerobic growth. Panel A illustrates the classification ofreactions based on how fluxes through the reactions affect biomassproduction. Optimal reactions are ones that can be used to achievemaximal growth rates, these are the most efficient pathways.Suboptimal reactions are ones where non-zero fluxes force a reductionin maximal growth rate. These reactions can be further classified asfutile (meaning they participate in futile cycles) or non-futile (they donot participate in futile cycles; these are often less energetically efficientpathways). Blocked reactions are ones that can not carry any flux due tothe imposed constraints, so all solutions, optimal and suboptimal, willhave zero flux through the reactions. The classification of the reactions
is highly dependent on the growth condition. Panel B shows thedistribution of reactions in iSO783 for lactate-limited aerobic growth.Panel C shows the distribution of genes in the model based on theirassociation to the classified reactions. For example, if a gene is onlyassociated with optimal reactions then it is classified as optimal, but if itis associated with an optimal reaction and a futile cycle reaction then itis classified as associated with multiple reactions. Panel D shows theexpression (reported as RMA, Robust Multichip Average) in lactatelimited aerobic conditions versus the change in expression from aerobicconditions to oxygen-limited for genes associated with optimalreactions (black, 387 genes) and with suboptimal reactions (red, 181genes). The black horizontal and vertical lines show the meanexpression and mean expression changes for the optimal set of genes.Only 39 genes associated with suboptimal reactions fall in the upperright quadrant. Gene expression data was obtained from the M3Ddatabase [35].doi:10.1371/journal.pcbi.1000822.g002
Modeling S. oneidensis Metabolism
PLoS Computational Biology | www.ploscompbiol.org 5 June 2010 | Volume 6 | Issue 6 | e1000822
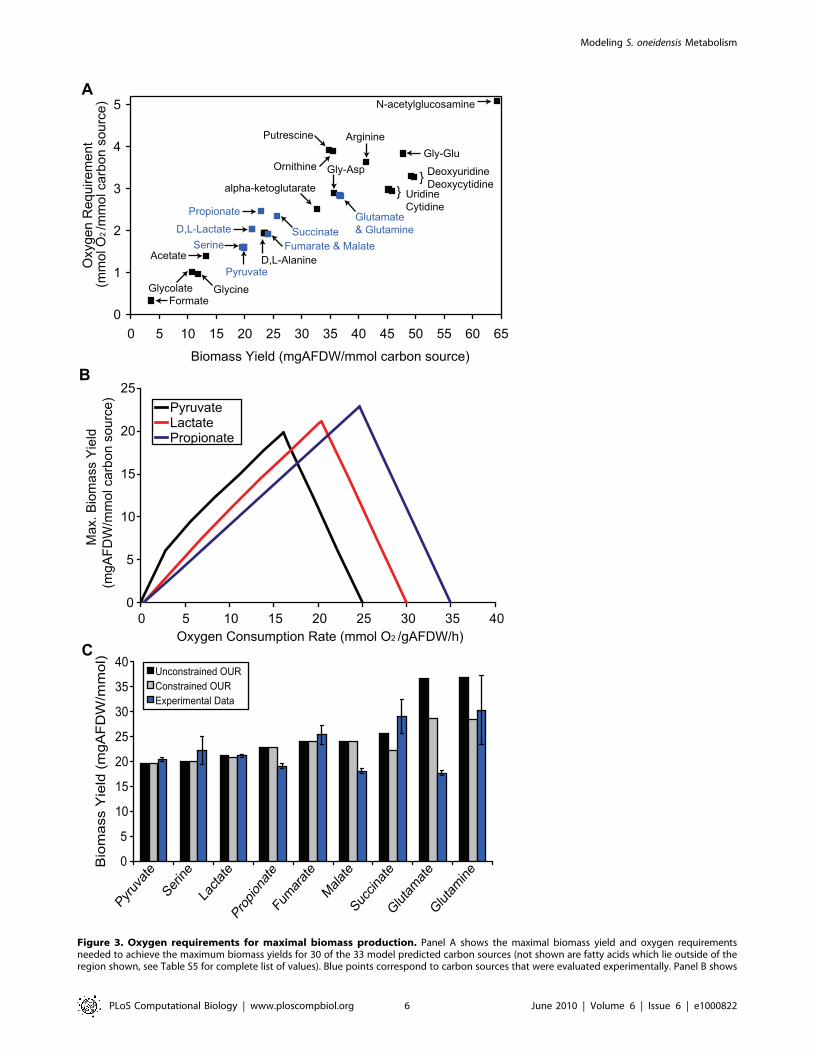
Figure 3. Oxygen requirements for maximal biomass production. Panel A shows the maximal biomass yield and oxygen requirementsneeded to achieve the maximum biomass yields for 30 of the 33 model predicted carbon sources (not shown are fatty acids which lie outside of theregion shown, see Table S5 for complete list of values). Blue points correspond to carbon sources that were evaluated experimentally. Panel B shows
Modeling S. oneidensis Metabolism
PLoS Computational Biology | www.ploscompbiol.org 6 June 2010 | Volume 6 | Issue 6 | e1000822
Given this result, we compared our model predicted biomass
yields, both with and without O2 consumption rate constraints, to
experimental measurements. For most of the carbon sources, the
experimentally measured biomass yields were within 15% of the
model calculated values when restrictions were placed on O2
consumption rates (Figure 3C). The exceptions were growth on
glutamate, succinate, propionate, and malate. Interestingly,
succinate, propionate, and glutamate had three of the four highest
predicted O2 requirements of the substrates experimentally tested
(Figure 3A) indicating that the calculated biomass yields will be
more sensitive to the maximum O2 consumption rate used in the
simulation. The low experimental biomass yields may indicate
there were oxygen limitations in the microplate experiments or
that S. oneidensis MR-1 has not evolved to efficiently use these
carbon sources. Performing additional experimental measure-
ments of substrate and O2 consumption rates will likely improve
model predictions of biomass yields for these three substrates.
Flux Analysis of Lactate-Limited Aerobic GrowthFBA was used to predict which metabolic pathways are likely
operational during lactate-limited aerobic growth in a chemostat.
Simulations were done for lactate-limited aerobic growth corre-
sponding to a growth rate (m) of 0.085 h21 and assuming 2.8H+
translocated per electron pair transferred from ubiquinol to O2.
Using the previously determined values for growth- and non-
growth rate dependent ATP requirements (Figure 1A), the
minimum lactate consumption rate consistent with
m= 0.085 h21 was 4.08 mmol/g AFDW/h, which was in good
agreement with our experimental measurement of 4.06 mmol/g
AFDW/h. Multiple flux distributions could be identified with the
same growth and lactate consumption rates, indicating that the
FBA solution is not unique. Therefore, FVA was used to
determine for each reaction the range of flux values that can still
result in the maximum biomass yield.
As described earlier, optimal reactions are those that can be
used to achieve the maximum biomass yield. Optimal reactions
can further be classified as either optional or required depending
on whether the reaction has to be used to achieve the maximum
biomass yield. In some cases a zero flux through an optimal
reaction can still result in an optimal solution (classified as optional
reaction), while other optimal reactions are required to carry flux
to achieve optimal biomass yield (classified as required reaction).
For example, S. oneidensis MR-1 has two isocitrate dehydrogenases
that use either NAD+ or NADP+ as electron acceptors. The model
predicts that the NADP+-dependent enzyme is required for
optimal biomass yield, while flux through the NAD+-dependent
isocitrate dehydrogenase is optional. The periplasmic fumarate
reductase is another example of an optional reaction, however, it is
known to be inactive aerobically [25].
We have subsequently measured the specific activities for a
variety of enzymes to compare against our model predictions
(Table 1; see Text S2 for methods description). NAD+-dependent
isocitrate dehydrogenase, malate synthase, and pyruvate formate
lyase activities were not detected; therefore, solutions that carry
flux through these reactions and the fumarate reductase reaction
were subsequently excluded from the model. The additional
constraints on these four fluxes caused a small increase (,0.7%) in
the lactate consumption rate that was needed to maintain the
growth rate at 0.085 h21 (and thus a small decrease in biomass
yield); however, the re-calculated flux values were better resolved
and had less individual variability (Figure 4). This illustrates how
iterations of computation and experimentation can be used to
better identify the pathways and enzymes that are important in
particular growth conditions.
The model also predicts that during lactate-limited aerobic
growth tetrahydrofolate (thf) molecules carrying one-carbon units
(5,10-methylenetetrahydrofolate, mlthf; 5,10-methenyltetrahydro-
folate, methf; and 10-formyltetrahydrofolate, 10fthf) are produced
during conversion of serine to glycine (by serine hydroxymethyl-
transferase - glyA, SO3471) and possibly from formate, but not
from the degradation of glycine into CO2 and NH4+ (by the
glycine cleavage system—gcvTHP and lpdA; SO0779–0781 and
SO0426) (Figure 4). These one-carbon units are used to synthesize
a number of biomass components, including CoA, dTTP, ATP,
GTP, and formyl-methionine (fMet). Even though the S. oneidensis
MR-1 genome encodes for two potential ways to generate mlthf
under aerobic conditions, the model calculations suggest that the
glycine cleavage system is not essential. Experiments confirmed
this prediction, as a mutant defective in the glycine cleavage
system had a similar growth phenotype on lactate as did the wild-
type (Text S1).
As noted earlier, the model predicts that for maximal biomass
yields one-carbon units are mainly made by serine hydroxy-
methyltransferase (glyA), and its corresponding reaction
(ser+thf«gly+mlthf) operates in the forward direction (Figure 4),
indicating that glycine is made from serine, instead of threonine
being degraded into glycine and then converted into serine (see
Figure S5). Experimental assessment of a DglyA mutant found that
glyA is essential for aerobic growth on lactate (Figure S2 and Figure
S6) indicating that serine hydroxymethyltransferase is used in the
production of either serine or glycine and one-carbon units. S.
oneidensis MR-1 has two alternate metabolic routes to produce
glycine from threonine in the absence of glyA (Figure 4 and Figure
S5); as a result, the model only predicts a lethal phenotype for a
DglyA mutant if these alternate routes are removed from the
network. Given that the DglyA mutant was experimentally unable
to grow on lactate under aerobic conditions, it is likely that these
alternative enzymes for glycine production were not expressed or
active. The model predicts that in order to restore growth of the
DglyA mutant one of these threonine to glycine routes would need
to be available or alternatively glycine would need to be added to
the medium. In fact, experiments demonstrated that the addition
of either threonine or glycine to M1 medium with lactate restored
growth of DglyA strain, whereas serine addition did not (see Text
S1 and Figure S3). These experimental observations are both in
agreement with in silico assessments, assuming that threonine
addition increases the expression of the enzymes that convert
threonine to glycine. Taken together, these results confirm the
model prediction that reversible serine hydroxymethyltransferase
operates in the serine to glycine direction in S. oneidensis MR-1 cells
in vivo. This agrees with recent findings based on 13C labeling
experiments in carbon-limited aerobic chemostats [39].
how the maximum biomass yield is affected as the O2 consumption rate is increased and decreased from its optimal value. All three carbon sourceshave the same number of carbon atoms, but pyruvate requires the least amount of oxygen and under oxygen limitations will have higher biomassyields than the other two carbon sources. All simulations were done assuming a carbon source consumption rate of 10 mmol ATP/(g AFDWNh). PanelC compares calculated biomass yields with experimental biomass yields as estimated from batch growth in a microplate reader. The modelpredictions were made assuming a carbon source consumption rate of 10 mmol ATP/(g AFDWNh) with either an unconstrained OUR or a maximumOUR of 20 mmol ATP/(g AFDWNh), based on maximal estimates for E. coli [47].doi:10.1371/journal.pcbi.1000822.g003
Modeling S. oneidensis Metabolism
PLoS Computational Biology | www.ploscompbiol.org 7 June 2010 | Volume 6 | Issue 6 | e1000822
Discussion
In this work, we presented the development of a metabolic model
for the facultative dissimilatory metal-reducing bacterium S. oneidensis
MR-1, an organism with applications in bioremediation, energy-
generating biocatalysis, and chemical production. The model served
as a framework to provide context for experimental data, to
quantitatively evaluate experimental observations, and to generate
hypotheses about metabolic network utilization and physiological
capabilities. Here, we were able to use a combination of modeling
and experimentation to identify pathways that are used under lactate-
limited aerobic conditions, and those that are not used. These unused
pathways include threonine degradation (to produce glycine), the
glyoxylate shunt, and, unexpectedly, the more energetically efficient
components of the aerobic respiratory chain.
Based on our analysis of lactate-limited growth at different
dilution rates, S. oneidensis MR-1 appeared to have an unusually
high growth rate dependent ATP requirement (GAR). Our model
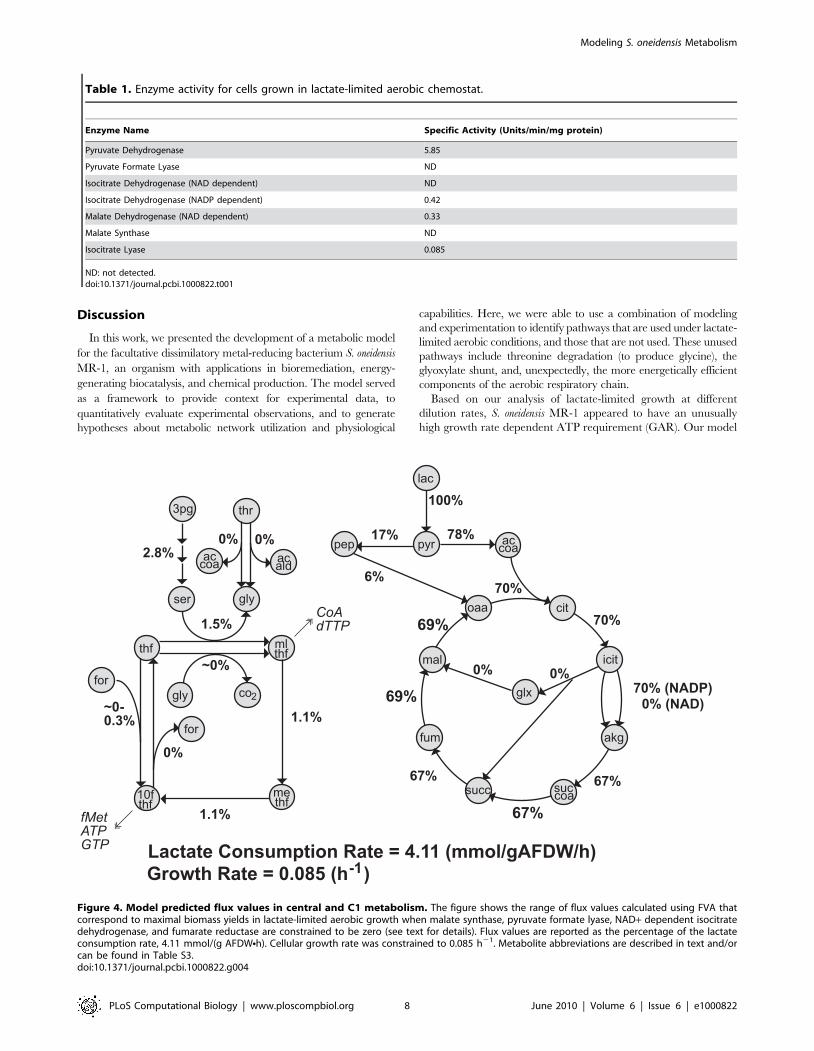
Figure 4. Model predicted flux values in central and C1 metabolism. The figure shows the range of flux values calculated using FVA thatcorrespond to maximal biomass yields in lactate-limited aerobic growth when malate synthase, pyruvate formate lyase, NAD+ dependent isocitratedehydrogenase, and fumarate reductase are constrained to be zero (see text for details). Flux values are reported as the percentage of the lactateconsumption rate, 4.11 mmol/(g AFDWNh). Cellular growth rate was constrained to 0.085 h21. Metabolite abbreviations are described in text and/orcan be found in Table S3.doi:10.1371/journal.pcbi.1000822.g004
Table 1. Enzyme activity for cells grown in lactate-limited aerobic chemostat.
Enzyme Name Specific Activity (Units/min/mg protein)
Pyruvate Dehydrogenase 5.85
Pyruvate Formate Lyase ND
Isocitrate Dehydrogenase (NAD dependent) ND
Isocitrate Dehydrogenase (NADP dependent) 0.42
Malate Dehydrogenase (NAD dependent) 0.33
Malate Synthase ND
Isocitrate Lyase 0.085
ND: not detected.doi:10.1371/journal.pcbi.1000822.t001
Modeling S. oneidensis Metabolism
PLoS Computational Biology | www.ploscompbiol.org 8 June 2010 | Volume 6 | Issue 6 | e1000822
directly accounts for the energy requirements needed to generate
biomass components including macromolecule polymerization.
The remaining GAR in our model may be attributed to
membrane processes (proton leakage), protein and mRNA
turnover, and other unknown costs [40]. The GAR for S. oneidensis
MR-1 (220 mmol/gAFDW) is 2.5 times higher than that reported
for Bacillus subtilis (88 mmol/gDW, when protein polymerization
costs are removed, the highest reported value for GAR). There are
a number of possible explanations for the observed high GAR,
including flux through futile cycles and use of less energetically
efficient enzymes, such as components in the aerobic electron
transport chain. Accounting for these inefficiencies in the model
would reduce the calculated GAR and NGAR values (see details
below).
Futile cycles have been shown to be active in other bacteria
[41,42], and it is possible that they are active in S. oneidensis MR-1
under the experimental conditions we tested. Futile cycles have
been suggested to be beneficial for increasing network robustness
and sensitivity, generating heat, reducing build-up of toxic
intermediates, and providing competitive advantages in energy
rich environments [43,44]. Here, we used optimization to not only
calculate solutions corresponding to maximum biomass yields, but
also to investigate suboptimal solutions. We developed a new
optimization-based approach to identify cycles, such as futile
cycles, that does not require the calculation of extreme pathways
[45]. This makes them easier to enumerate because it does not
require implementation of the model into another software format.
Next, by analyzing fluxes through individual metabolic reactions,
the reactions were classified into different groups based on how
non-zero fluxes affect cellular growth rates. By comparing the
associated genes with high-throughput data (such as gene
expression or proteomic data), hypotheses can be made about
which pathways may cause suboptimal growth phenotypes. As a
result, we were able to identify potential futile cycles, involving
pyruvate kinase and malic enzymes, that may be active based on
analysis of existing gene expression data. Subsequent removal of
either malic enzyme led to ,25% improvement in biomass
production. However, further calculations revealed that the level
of futile cycling has to be three times the lactate consumption rate
to reduce the GAR value to ,80 (a value similar to that reported
for B. subtilis). Therefore, it seems unlikely that futile cycling is the
only explanation for the high apparent GAR value.
Like many other bacteria, S. oneidensis MR-1 has a branched
electron transport chain. The S. oneidensis MR-1 genome contains
annotated genes for (i) three cytochrome oxidases, which results in
either translocation of 2 H+/2e2 (Cyd, SO3285–3286) or 6 H+/
2e2 (Cco, SO2361–2364; or Cox, SO4606–4607, SO4609) as
electrons move from ubiquinol to O2, (ii) two NADH dehydro-
genases translocating either 0 H+/2e2 (Ndh, SO3517) or 4 H+/
2e2 (Nuo, SO1009–SO1021), and (iii) three NADH dehydroge-
nases that translocate 2 Na+/2e2 (Nqr1, SO1103–1108; Nqr2,
SO0902–0907; and Rnf, SO2508–2513). As a result, the transfer
of a pair of electrons from NADH to O2 can result in the
translocation of 2 to 10 H+ across the cytoplasmic membrane,
depending on what enzymes are used. In all aerobic simulations,
we constrained the flux ratios between the cytochrome oxidases
such that they result in the translocation of 2.8 H+/2e2 based on
experimental data [25]. However, no constraint was placed on the
ratio between the NADH dehydrogenase fluxes because no data
were available regarding their relative usage. To produce the
maximum amount of biomass the model predicts that Nuo
(encoding the proton-pumping NADH dehydrogenase) would be
used and not Ndh, Nqr1, Nqr2, and Rnf. However, if Nuo is
inactive so that there is no flux through its associated reactions, the
estimated GAR drops from 220 to 119. Interestingly, S. oneidensis
MR-1, Shewanella benthica KT99, and S. woodyi are the only strains
among 20 sequenced Shewanella strains analyzed that have nuo
orthologs and it would be expected that these three strains would
grow more efficiently than those strains missing nuo orthologs.
However, the presence of nuo orthologs in S. oneidensis MR-1 did
not confer any growth advantage over two Shewanella strains that
do not contain nuo orthologs, S. putrefaciens CN32 and Shewanella sp.
strain W3-18-1. These latter two strains (CN32 and W3-18-1) both
had higher growth rates and biomass production (as indicated by
optical density measurements) than S. oneidensis MR-1 when grown
on lactate in aerobic cultures [2]. These results support the
suggestion that the Nuo proton-pumping NADH dehydrogenase
may not account for a significant fraction of NADH oxidation in S.
oneidensis MR-1 cells under the growth conditions tested.
Additionally, data published by other researchers showed that
aerobic growth of E. coli mutants with disabled Nuo-type NADH
dehydrogenase on minimal medium supplemented with mannitol
or glycerol was undistinguishable from wild-type cultures [46],
implying that use of this Nuo NADH dehydrogenase type may be
condition-dependent for bacteria other than Shewanella.
Further computational analysis revealed that if all three of the
most efficient H+ pumping enzymes are not active (Nuo, Cco, and
Cox), then at most, 2H+/2e2 can be translocated via the electron
transport chain and the GAR drops to 81. In this calculation the
constraint fixing 2.8H+ per electron pair transferred from
ubiquinol to O2 was not included in the simulation. Similarly,
the NGAR in this case also dropped from 1.03 to 0.47, the latter
value being closer to NGAR value reported for Geobacter [30]. By
not utilizing Cco and Cox, only 2H+/2e2 can be translocated
across the membrane via cytochrome oxidase activity, which
disagrees with previous experimental measurements [25]. How-
ever, these experimental results depend on the growth conditions
of the cells prior to measurements being made [25], and these
growth conditions may not be consistent with those used in our
experiments. Therefore, we hypothesize that MR-1 does not use
the most energetically efficient components of its electron
transport chain under the conditions tested in this study, and that
this is likely the main reason for the high estimated GAR value.
This was supported by the subsequent phenotyping of a single Cox
(DSO4606) deletion mutant and a double Cox and Cco (DSO4606/
DSO2361) deletion mutant, both of which exhibited growth rates
in batch culture that did not differ significantly from the wild-type
strain, and in fact grew to higher optical densities than wild-type
cultures (Figure S1B). We should also note that while changes in
the proton translocation efficiency of the electron transport chain
will affect the calculated GAR and NGAR values, this should not
significantly affect other calculations such as biomass yields, flux
distributions and reaction classification (e.g. optimal and subop-
timal reactions.) This is because the effect of the lower proton
translocation efficiency will be canceled out by a lower GAR and
NGAR value. When fewer protons are translocated across the
membrane, less ATP is produced by ATP synthase, but less ATP is
subsequently needed for GAR and NGAR, keeping the net ATP
production the same.
Our findings that (i) the energetically efficient cytochrome
oxidases are not utilized and that (2) futile cycles involving malic
enzymes likely operate during aerobic growth on lactate indicates
that S. oneidensis MR-1 does not achieve maximal biomass
production under the highly aerobic conditions tested in this
study. Given that the organism is found in anoxic and suboxic
environments it is possible that it is not accustomed to the carbon
and oxygen rich environments we tested here, and that adaptive
evolution of this organism under the conditions used here may
Modeling S. oneidensis Metabolism
PLoS Computational Biology | www.ploscompbiol.org 9 June 2010 | Volume 6 | Issue 6 | e1000822
lead to improved biomass yields and metabolic efficiency, as has
been observed for E. coli [47]. The classification of optimal and
suboptimal reactions done here is based primarily on energetic
efficiency, and does not account for the kinetic properties of
enzymes or the relative costs of enzyme production [48]. The
utilization of less energetically efficient enzymes that are more
kinetically efficient may provide a competitive advantage in terms
of flux per unit enzyme when substrate concentrations are low. For
example, in E. coli the cytochrome bd oxidase has a higher affinity
for oxygen making it more beneficial to use under low oxygen
concentrations even though it is less energetically efficient [22].
Trade-offs between growth yields and rates have been theorized
and demonstrated [49,50], where increased rates are accompanied
by decreased yields. Thus, S. oneidensis MR-1 may have evolved in
its natural environment to achieve high rates rather than yields.
The integration of experimental and modeling results is
extremely valuable to advance model development and biological
discovery. In cases where there is agreement between data and
model predictions, the models can be used to help explain
observed cellular behavior (e.g., what metabolic pathways are
being used under a given condition), analyze experimental data, or
engineer metabolism for specific applications. For example, the
model predicted that the TCA cycle is important for aerobic
growth on lactate by S. oneidensis MR-1, a finding that was also
confirmed experimentally. Model predictions of TCA cycle fluxes
in cells grown in a lactate-limited aerobic chemostat (with a growth
rate of 0.085 h21) showed that a significant fraction (,70%) of
lactate may be oxidized by TCA cycle (Figure 4). In agreement
with the model calculations, cell-free extracts of S. oneidensis MR-1
grown in lactate-limited aerobic chemostat (D = 0.095 h21)
displayed a high specific activity of pyruvate dehydrogenase
(Table 1). Additionally, disruption of the TCA by deletion of the
E1 subunit of pyruvate dehydrogenase or E2 subunit of alpha-
ketoglutarate dehydrogenase (KGDH) totally impaired the ability
of MR-1 to grow aerobically on any tested single substrate in batch
cultures (see Figure S7 and Text S1). Interesting, the KGDH
mutant was unable to grow aerobically even in rich medium,
which is in contrast to E. coli KGDH mutants which retain their
ability to grow aerobically in rich (LB) [51] and glycerol minimal
media [52].
As more cycles of model prediction and experimental testing are
carried out, both the model and our knowledge of S. oneidensis MR-
1 metabolism will improve. Integrated models of metabolism and
regulation for this organism (as has been done with E. coli [53] and
Saccharomyces cerevisiae [54]) will undoubtedly lead to improved
model predictions. Such predictions can be used to design strains
with desired phenotypes, to provide a better understanding of
which enzymes or pathways are important for survival and growth
in a particular environment, and can be used for understanding of
organism ecology. The developed model can also be used as a
template for developing models of other Shewanella, particularly
those that have been sequenced, as well as other organisms that
have orthologs to genes included in the S. oneidensis MR-1 model.
For example, many of the genes that were computationally
determined to be essential for growth in S. oneidensis MR-1 are
highly conserved in other Shewanella species, indicating a conserved
set of core metabolic processes and capabilities across these
bacteria.
Materials and Methods
Bacterial Strains and Growth MediaThe strains of S. oneidensis MR-1 used in this study are listed in
Table S6. Wild-type and mutant strains were routinely cultured at
30uC in tryptic soy broth (TSB; pH 7.4) [55] or in modified M1
medium (pH 7.0) of the following composition: piperazine-N,N9-
bis(2-ethanesulfonic acid (30 mM and 3 mM for batch and
chemostat cultivation, respectively), 28 mM NH4Cl, 4.35 mM
NaH2PO4NH2O, 30 mM NaCl, 3 mM MgCl2N6H2O, 1.34 mM
KCl, 6.8 mM CaCl2, 1 mM Na2SeO4, and 10 ml each of 106Wolfe’s vitamin solution and 106 mineral solution [56]. The
modified M1 medium used for controlled chemostat cultivation
was additionally supplemented with 18mM lactate and 10 mM
ferric nitrilotriacetic acid [Fe(III)-NTA]. S. oneidensis MR-1 growth
was tested using 18 organic compounds, containing from 1 to 5
carbon atoms (alanine, asparagine, aspartate, glutamate, gluta-
mine, glycine, serine, threonine, formate, acetate, ethanol,
pyruvate, lactate, propionate, succinate, fumarate, malate, and
a-ketoglutarate) at concentration 40 mM unless stated otherwise.
To grow S. oneidensis MR-1 under anaerobic conditions, NaCl was
excluded from M1 medium, and sodium fumarate was added as
an electron acceptor to final concentration 35 mM. Anaerobiosis
was achieved by extensively purging medium with pure N2.
Genetic ManipulationsIn-frame deletion mutagenesis in S. oneidensis MR-1 was
performed using a previously described method [57,58]. The
sucrose selection step for obtaining SO1931 and SO4606/SO2361
deletion mutants was performed under anaerobic conditions at
25uC using plates containing modified M1 medium supplemented
with 20 mM D, L-lactate, 30 mM sodium fumarate, 10% LB, and
1.5% agar. Table S7 contains list of primers used in this study.
Chemostat and Batch CultivationA 15-liter New Brunswick Bioflow 3000 reactor (New Brunswick
Scientific, Edison, NJ) operated at a 7-liter working volume
(modified M1 medium supplemented with 18 mM D,L-lactate) at
30uC was used to grow chemostat cultures of S. oneidensis MR-1 in
modified M1 media supplemented with 18mM lactate. The gas
flow rate and agitation were kept at 3.5 liters/min and 350 rpm,
respectively, and the dissolved oxygen tension (DOT) was
maintained at 20% or 1% of air saturation by automatically
changing the ratio of N2 and air in the gas mix. The pH was
maintained at 7.0 by addition of 2 M HCl, and composition of
incoming and off-gas was constantly monitored by an in-line mass
spectrometry based gas analyzer MGA iSCAN (Hamilton
Sundstrand, Pomona CA).
Culture growth was constantly monitored by measuring and
recording optical density using a custom-made system. For this
purpose, a fluorescent lamp was placed near the bioreactor wall,
and a photodiode (Silicon Solar Cell, Model 276-124, Radio-
Shack) was secured on the opposite side of the wall to quantify
transmitted light. Photodiode voltages were recorded by a Keithley
Model 2700 multimeter (Keithley Instruments, Inc., Cleveland,
OH) using the ExceLinx data logging software (Microsoft Corp.).
Additionally, 5- to 10-ml samples were periodically taken from the
reactors for OD600 measurements using SpectronicH model 20
GENESISTM VIS spectrophotometer (Spectronic Instruments,
Rochester NY, USA), and/or further analyses when necessary.
Reactors were inoculated with 1mL/L of overnight culture
grown in TSB and maintained in batch mode until late-
logarithmic stage. Continuous cultures were started by pumping
medium of the same composition at desired dilution rate (D).
Samples for further analysis were taken after at least five volume
changes at steady-state conditions. Steady-state achievement was
inferred from stability of the following parameters: OD600 (no
more than 3% variation between measurements), acid addition
rate, O2 concentration in incoming gas, and O2 and CO2
Modeling S. oneidensis Metabolism
PLoS Computational Biology | www.ploscompbiol.org 10 June 2010 | Volume 6 | Issue 6 | e1000822
concentrations in the off-gas. Samples for the following measure-
ments were taken from reactors: (i) ash-free dry organic weight
(AFDW), (ii) biomass composition, (iii) organic acids composition.
Sampling procedure took no more than 4 minutes.
Batch experiments were performed at 30uC in an Infinite M200
(Tecan, Mannedorf, Switzerland) or Bioscreen-C (Growth Curves
USA, Piscataway, NJ) microplate reader, or crimp-sealed serum
bottles placed on a rotary shaker (Innova 4900, New Brunswick
Scientific, Edison, NJ) at 30uC and 150 rpm. Growth was
monitored by measuring the cultures’ optical density at 600 nm
(OD600). Cells were grown with three or more replicates in 96- or
100-well plates at 30uC. M1 minimal media supplemented with
40 mM carbon source was used in growth phenotyping experi-
ments. Absorbance readings were taken every 15 minutes at
600 nm. A standard curve was used to convert absorbance
readings in a microplate reader to a standard spectrophotometer
with a 1-cm pathlength. Alternately, cultures were grown in
shaken (150 rpm) 70 mL crimp-sealed serum bottles containing
10 mL of medium. If necessary, the OD measurements were
converted to biomass concentration (gAFDW/L) by multiplying
by 0.69 using previously established correlations between OD600
and cell concentration (g AFDW/L). All batch experiments were
repeated at least 3 times, and the standard deviation of triplicate
cultures never exceeded 6%, unless indicated otherwise by error
bars. Under conditions used to grow cells in M1 medium
supplemented with 18–20 mM lactate all substrate was consumed
when cultures entered stationary phase.
Analytical MethodsTo measure biomass ash-free dry weight (AFDW), a known
volume of cultural liquid was centrifuged (11,0006g, 4uC),
supernatant discarded, pellet thoroughly resuspended in deionized
water, transferred into a pre-weighed aluminum dish and, using
Sartorius MA100 Mositure Analyzer (Sartorius Goettingen,
Germany), dried at 105uC to a constant weight (DW1). The dried
biomass was then combusted at 600uC for 12 h and weighed again
(DW2). The biomass concentration (gAFDW/L) was calculated as
follows: (DW1–DW2)/volume.
For the purpose of this work, biomass was considered to include
the cell pellet following centrifugation and extracellular polymers
present in the supernatant. Bacteria can produce substantial
amounts of extracellular polymers (protein and carbohydrates) as
well as membrane vesicles containing the above as well as
membrane lipids. For the initial stages of metabolic modeling, the
location of cell constituents is not critical but it is important to
capture all biomass components in order for the model to be
accurate. Therefore, biomass composition included analyses of
culture liquid (CL) without preliminary fractionation. In all cases,
a method of standard additions was used to quantify polymers in
known CL volume [59]. Total protein, reducing carbohydrates,
RNA, and DNA were assayed using previously described methods
[60,61]. The total mass of lipids was extracted from a known
volume of freeze-dried CL and analyzed by Global Lipidomics,
LLC (Text S2). Amino acid composition of biomass protein was
analyzed using reversed-phase high-performance liquid chroma-
tography (Text S2). Organic acids in cultural liquid were filtered
through 0.22-mm-pore-size Millex-GP membrane filter (Millipore)
and quantified by HPLC as described previously [2].
Metabolic Network Reconstruction iSO783The S. oneidensis MR-1 metabolic network was reconstructed in
SimPheny (Genomatica, San Diego, CA) initially using an
automated model building process [62] by comparing its genome
sequence to those of previously modeled organisms. Each gene in
Shewanella was the subject of a reciprocal BLAST search against
genes from other microorganisms with well-curated metabolic
reconstructions. Metabolic reactions and gene to protein to
reaction (GPR) associations from other models were included in
the draft Shewanella reconstruction if a good reciprocal best hit
could be found in S. oneidensis MR-1.
This draft reconstruction was manually reviewed to exclude and
include additional genes and reactions. GPR associations in the
draft reconstruction were reviewed to confirm that the gene’s
annotated functions were consistent with the associated reactions.
Genes not included in the draft reconstruction were also evaluated
and included in the reconstruction if their products were predicted
to carry out metabolic functions. A large fraction of the anaerobic
electron transport chain reactions were added to the draft
reconstruction at this stage because these reactions do not occur
in other reconstructed organisms. Additional reactions were added
as necessary to produce known biomass constituents or utilize
known growth substrates.
The final reconstruction includes organism-specific reactions
associated with macromolecular synthesis, which were incorrect in
the draft reconstruction because they differ from other recon-
structed organisms. The structure of lipopolysaccharide had been
previously determined for MR-1 [63], and this was used to
generate reactions for the biosynthesis of this biomass component.
The measured fatty acid content on phospholipids (measured in
this study and in a previous publication [3]) was also used to
generate MR-1 specific phospholipid biosynthesis reactions.
Measured amino acid levels were used to create a protein
biosynthesis reaction. The monomeric compositions of RNA and
DNA were estimated based on the GC content for MR-1 and used
in the RNA and DNA biosynthesis reactions.
A biomass reaction was generated from measured biomass
compositions (protein, RNA, DNA, phospholipids, and carbohy-
drate) for MR-1. Cells grown in a lactate limited chemostat
(D = 0.095 h21) were used for biomass composition analysis. The
measured biomass composition was then used to generate a
biomass reaction, which is included in the metabolic model. This
biomass reaction specifies the amount of biomass components
(mmol) needed to synthesize 1 g AFDW of cells. Lipopolysaccha-
ride and peptidoglycan abundances (g/g AFDW) were estimated
based on values reported for E. coli [19]. In addition, soluble pools
for acetyl-CoA, succinyl-CoA, putrescine, spermidine, UDP-
glucose, 5-methyltetrahydrafolate, CoA, FAD, NAD(P),
NAD(P)H, and AMP were included based on measurements for
E. coli [40].
To estimate growth- and non-growth rate dependent ATP
requirements (mmol ATP/(g AFDWNh)), a series of S. oneidensis
MR-1 chemostat cultures were grown at different dilution rates
and the lactate consumption rates (mmol/(g AFDWNh)) were
measured. The growth and non-growth rate dependent ATP
requirements were calculated by the metabolic model using this
data as described previously [26]. Briefly, for each dilution rate the
cell growth and lactate consumption rates were constrained to
their measured values and maximum rate of ATP hydrolysis is
calculated using the metabolic model. A linear curve fit between
the maximum ATP hydrolysis rate and dilution rate was then used
to calculate the energy requirements, where the slope is the growth
rate dependent ATP requirement and the intercept is the non-
growth rate dependent ATP requirement (or ATP maintenance
requirement).
Constraint-Based AnalysisA constraint-based model was developed based on the
metabolic reconstruction for MR-1. These models include three
Modeling S. oneidensis Metabolism
PLoS Computational Biology | www.ploscompbiol.org 11 June 2010 | Volume 6 | Issue 6 | e1000822
types of constraints, the first is a steady-state mass balance
constraint, where the production rate minus the consumption rate
for each metabolite must equal zero. These steady-state mass
balance constraints can be represented as:
S.v~0 ð1Þ
where S is a matrix of stoichiometric coefficients for the reaction
network (rows correspond to metabolites and columns to reactions)
and v is a vector of fluxes corresponding to the variables in the
model. The other two types of constraints place restrictions on the
values individual fluxes (vj ) can take:
ajƒvjƒbj ð2Þ
Thermodynamic constraints can be imposed on irreversible
reactions by setting the corresponding values for aj to zero.
Additionally, enzyme capacity constraints can be imposed by
specifying aj and bj appropriately.
In most cases the linear system of equations is underdetermined
so there are multiple flux distributions that satisfy the imposed the
constraints. FBA uses optimization to identify flux distributions
that maximize or minimize a given objective function [15]. For
example, FBA can be used to find a flux distribution with
maximizes flux through the biomass reaction. FVA determines the
range of values each flux can take that are consistent with a given
set of constraints [33]. Here, each flux is maximized and
minimized individually. FVA can be used to find the range of
flux values that are possible across alternative optimal solutions (by
adding a constraint that the FBA objective function has to be equal
to the maximum value determined by FBA) or across suboptimal
solutions (by not including any constraint on the value for the FBA
objective function). All optimization simulations were done using
GAMS (GAMS Development Corporations, Washington DC).
Enumeration of CyclesWe developed an optimization-based approach to calculate
cycles (such as futile cycles, transhydrogenase cycles, and
circulations) in constraint-based models of metabolism. All
exchange fluxes are constrained to be zero so that no metabolites
can enter or exit the system. To find futile cycles an artificial ATP
synthesis (ATPS) reaction is added (ADP+Pi+H+RATP+H2O)
and its flux is constrained to be positive; this ensures that a futile
cycle must take on non-zero fluxes to hydrolyze the ATP that is
produced by ATPS. FVA using these constraints can be used to
identify all reactions that can participate in futile cycles. To find
individual futile cycles, a mixed-integer linear programming
problem was formulated (Eq. 3–8) to minimize the number of
reactions included in the cycle (Eq. 3), where yj is a decision
variable that indicates whether a flux is zero (yj~0) or non-zero
(yj~1) and n is the total number of reactions in the network. If the
flux through the reaction is non-zero the corresponding value of
the decision variable, yj, must be one (Eq. 5). The fluxes and
decision variables must satisfy the mass balance (Eq. 4),
thermodynamic, enzyme capacity constraints (Eq. 5), and positive
ATPS flux constraint (Eq. 6, where e is a positive number— we
used a value of 20 in the futile cycle calculations). To find
additional cycles, integer-cut constraints can be added (Eq. 7)
which ensure that the same solution is not revisited and that a new
solution is not a combination of previous solutions [64], where ykj
indicates whether reaction j was used in the previous iteration k.
The problem can be solved repeatedly until it becomes infeasible,
indicating that there are no more cycles.
MinimizeXn
j~1
yj ð3Þ
S.v~0 ð4Þ
yj:ajƒvjƒyj
:bj ð5Þ
vATPSwe ð6Þ
Xn
j~1
yj:yk
j ƒ{1zXn
j~1
ykj for all k previous iterations ð7Þ
yj[ 0,1f g ð8Þ
Other types of cycles can be found using the same approach where
Eq. 6 is changed to force selection of other cycles of interest (see
Text S3 for more details). For example, transhydrogenase cycles
can be found where the net effect of the cycle is NADH+NADPRNAD+NADPH, by adding an artificial reaction that
undoes this reaction (NAD+NADPHRNADH+NADP) and
constraining the corresponding flux to be positive. Such
transhydrogenase cycles can be thermodynamically infeasible (if
the intracellular ratios of [NAD]/[NADH].[NADP]/[NADPH])
and would need to be eliminated from the network reconstruction.
Cycles which result in no net change in metabolite levels (i.e.
circulations [26]) can also be identified by replacing Eq. 6 with a
constraint that the sum of the absolute flux values must be positive.
More details for calculating all these types of cycles are presented
in Text S3. Only twelve circulations and one transhydrogenase
cycle (in the thermodynamically feasible direction: NAD+NADPHRNADH+NADP) were present in the S. oneidensis MR-
1 network reconstruction.
Supporting Information
Table S1 Biomass composition used to generate the biomass
equation.
Found at: doi:10.1371/journal.pcbi.1000822.s001 (0.02 MB XLS)
Table S2 Reactions and GPR associations in iSO783.
Found at: doi:10.1371/journal.pcbi.1000822.s002 (0.28 MB XLS)
Table S3 Metabolites and their abbreviations used in iSO783.
Found at: doi:10.1371/journal.pcbi.1000822.s003 (0.15 MB XLS)
Table S4 Reactions used in the smallest 130 futile cycles.
Found at: doi:10.1371/journal.pcbi.1000822.s004 (0.02 MB XLS)
Table S5 The 33 model predicted carbon sources.
Found at: doi:10.1371/journal.pcbi.1000822.s005 (0.02 MB XLS)
Table S6 Bacterial strains and plasmids used for this study.
Found at: doi:10.1371/journal.pcbi.1000822.s006 (0.04 MB DOC)
Table S7 Primers used in this study.
Found at: doi:10.1371/journal.pcbi.1000822.s007 (0.06 MB
DOC)
Modeling S. oneidensis Metabolism
PLoS Computational Biology | www.ploscompbiol.org 12 June 2010 | Volume 6 | Issue 6 | e1000822
Text S1 Summary of additional experimental results.
Found at: doi:10.1371/journal.pcbi.1000822.s008 (0.06 MB
DOC)
Text S2 Supplemental experimental methods.
Found at: doi:10.1371/journal.pcbi.1000822.s009 (0.05 MB
DOC)
Text S3 Methods for cycle calculations.
Found at: doi:10.1371/journal.pcbi.1000822.s010 (0.13 MB
DOC)
Figure S1 Growth dynamics of S. oneidensis MR-1 wild-type
(filled circles), and selected deletion mutants. Panel A: DSO3855
(open triangle) and DSO4118 (open diamond). Panel B: DSO4606
(open circle) and (filled triangle) double mutant DSO4606/SO2363.
Cells were cultivated in 100-well plates in Bioscreen C; each well
(550 ml total volume) received 100 ml of M1 medium supplement-
ed with 20 mM D,L-lactate.
Found at: doi:10.1371/journal.pcbi.1000822.s011 (0.10 MB PDF)
Figure S2 Growth of S. oneidensis MR-1 DSO3471 mutants on
lactate (45 mM) in M1 medium and organic acids concentration
dynamics. Cells were added in the beginning to make final optical
density 0.08 at 600 nm. Crimp-sealed serum bottles were used for
cultivation.
Found at: doi:10.1371/journal.pcbi.1000822.s012 (0.03 MB PDF)
Figure S3 Influence of glycine (A) and threonine (B) additions on
maximal accumulation of S. oneidensis MR-1 DSO3471 biomass on
lactate (45 mM) in M1 medium. Biomass accumulation was
expressed as optical density at 600 mn. Crimpsealed serum bottles
were used for cultivation.
Found at: doi:10.1371/journal.pcbi.1000822.s013 (0.12 MB PDF)
Figure S4 Growth dynamics of S. oneidensis MR-1 wild-type and
selected deletion mutants. Wild-type (filled circle) and DSO0781
(open circle) deletion mutant were grown on lactate (18 mM) or
acetate (45 mM) in M1 medium supplemented with NH4Cl or
glycine (10 mM) as the sole source of nitrogen. Crimp-sealed
serum bottles were used for cultivation, starting OD600 values were
0.01 (A and B) and 0.003 (C).
Found at: doi:10.1371/journal.pcbi.1000822.s014 (0.08 MB PDF)
Figure S5 Metabolic network for interconversion of C1-
compounds and biosynthesis/degradation of relevant amino acids
in S. oneidensis MR-1. The network was constructed based on
genome annotation.
Found at: doi:10.1371/journal.pcbi.1000822.s015 (0.10 MB PDF)
Figure S6 Growth of S. oneidensis MR-1 wild-type (A) and
DSO3471 mutant (B) in M1 medium supplemented with different
compounds as sole sources of carbon and energy. Crimp-sealed
serum bottles were used for cultivation, and starting OD600 value
was 0.015 for all experiments.
Found at: doi:10.1371/journal.pcbi.1000822.s016 (0.13 MB PDF)
Figure S7 Aerobic growth of S. oneidensis DSO0424 cells in M1
medium supplemented with 18 mM D,L-lactate. 70 ml serum
bottles containing 15 ml of medium were used. Periodically 0.7–
0.8 ml samples were withdrawn to measure OD600 and organic
acids in 0.22 mm filtrates of culture.
Found at: doi:10.1371/journal.pcbi.1000822.s017 (0.07 MB PDF)
Acknowledgments
The authors wish to acknowledge Christophe Schilling, Iman Famili, and
Sharon Wiback from Genomatica for their help in the initial development
of the metabolic model, and our colleagues from Global Lipidomics, LLC
for lipids analysis. We also thank Sergey Stolyar for insightful discussions of
this manuscript, Johannes Scholten and David Kennedy for their valuable
help with chemostat runs and HPLC analysis, and Julie Wiley and Donna
Austin-Workman for their help in manuscript preparation.
Author Contributions
Conceived and designed the experiments: GEP ASB JKF JLR. Performed
the experiments: GEP EAH OVG JDI XZ JHS SBR JLR. Analyzed the
data: GEP EAH OVG JDI XZ AO SBR MFR AEK ASB JKF JLR.
Contributed reagents/materials/analysis tools: AO MFR AEK. Wrote the
paper: GEP AEK ASB JKF JLR.
References
1. Myers CR, Nealson KH (1988) Bacterial Manganese Reduction and Growth
with Manganese Oxide as the Sole Electron Acceptor. Science 240: 1319–1321.
2. Pinchuk GE, Ammons C, Culley DE, Li SM, McLean JS, et al. (2008)
Utilization of DNA as a sole source of phosphorus, carbon, and energy by
Shewanella spp.: ecological and physiological implications for dissimilatory
metal reduction. Appl Environ Microbiol 74: 1198–1208.
3. Venkateswaran K, Moser DP, Dollhopf ME, Lies DP, Saffarini DA, et al. (1999)
Polyphasic taxonomy of the genus Shewanella and description of Shewanella
oneidensis sp. nov. Int J Syst Bacteriol 49 Pt 2: 705–724.
4. Yang C, Rodionov DA, Li X, Laikova ON, Gelfand MS, et al. (2006)
Comparative genomics and experimental characterization of N-acetylglucosa-
mine utilization pathway of Shewanella oneidensis. J Biol Chem 281:
29872–29885.
5. Nealson K, Scott J (2006) Ecophysiology of the Genus Shewanella. In: Dworkin M,
ed. The Prokaryotes. New York: Springer-NY, LLC. pp 1133–1151.
6. Bretschger O, Obraztsova A, Sturm CA, Chang IS, Gorby YA, et al. (2007)
Current production and metal oxide reduction by Shewanella oneidensis MR-1
wild type and mutants. Appl Environ Microbiol 73: 7003–7012.
7. Kim HJ, Hyun MS, Chang IS, Kim BH (1999) A microbial fuel cell type lactate
biosensor using a metal-reducing bacterium, Shewanella putrefaciens. Journal of
Microbiology and Biotechnology 9: 365–367.
8. Ringeisen BR, Henderson E, Wu PK, Pietron J, Ray R, et al. (2006) High power
density from a miniature microbial fuel cell using Shewanella oneidensis DSP10.
Environ Sci Technol 40: 2629–2634.
9. Marshall MJ, Beliaev AS, Dohnalkova AC, Kennedy DW, Shi L, et al. (2006) c-
Type cytochrome-dependent formation of U(IV) nanoparticles by Shewanella
oneidensis. PLoS Biol 4: e268.
10. Marshall MJ, Plymale AE, Kennedy DW, Shi L, Wang Z, et al. (2008)
Hydrogenase- and outer membrane c-type cytochrome-facilitated reduction of
technetium(VII) by Shewanella oneidensis MR-1. Environ Microbiol 10:
125–136.
11. Meshulam-Simon G, Behrens S, Choo AD, Spormann AM (2007) Hydrogen
metabolism in Shewanella oneidensis MR-1. Applied and EnvironmentalMicrobiology 73: 1153–1165.
12. Lovley DR, Phillips EJ, Lonergan DJ (1989) Hydrogen and Formate Oxidation
Coupled to Dissimilatory Reduction of Iron or Manganese by Alteromonasputrefaciens. Appl Environ Microbiol 55: 700–706.
13. Esteve-Nunez A, Rothermich M, Sharma M, Lovley D (2005) Growth of
Geobacter sulfurreducens under nutrient-limiting conditions in continuousculture. Environ Microbiol 7: 641–648.
14. He Q, Sanford RA (2003) Characterization of Fe(III) reduction by chlororespir-
ing Anaeromxyobacter dehalogenans. Applied and Environmental Microbiology
69: 2712–2718.15. Price ND, Reed JL, Palsson BO (2004) Genome-scale models of microbial cells:
evaluating the consequences of constraints. Nat Rev Microbiol 2: 886–897.
16. Fong SS, Burgard AP, Herring CD, Knight EM, Blattner FR, et al. (2005) In
silico design and adaptive evolution of Escherichia coli for production of lacticacid. Biotechnol Bioeng 91: 643–648.
17. Alper H, Jin YS, Moxley JF, Stephanopoulos G (2005) Identifying gene targets
for the metabolic engineering of lycopene biosynthesis in Escherichia coli. MetabEng 7: 155–164.
18. Park JH, Lee KH, Kim TY, Lee SY (2007) Metabolic engineering of Escherichia
coli for the production of L-valine based on transcriptome analysis and in silicogene knockout simulation. Proc Natl Acad Sci U S A 104: 7797–7802.
19. Neidhardt FC, Umbarger EH (1996) Chemical Composition of Escherichia coli.
In: Neidhardt FC, ed. Escherichia coli and Salmonella: Cellular and MolecularBiology. 2nd ed. Washington DC: ASM Press. pp 13–16.
20. Feist AM, Henry CS, Reed JL, Krummenacker M, Joyce AR, et al. (2007) A
genome-scale metabolic reconstruction for Escherichia coli K-12 MG1655 thataccounts for 1260 ORFs and thermodynamic information. Mol Syst Biol 3: 121.
21. Pramanik J, Keasling JD (1998) Effect of Escherichia coli biomass composition
on central metabolic fluxes predicted by a stoichiometric model. Biotechnol
Bioeng 60: 230–238.
Modeling S. oneidensis Metabolism
PLoS Computational Biology | www.ploscompbiol.org 13 June 2010 | Volume 6 | Issue 6 | e1000822
22. Gennis RB, Stewart V (1996) Respiration. In: Neidhardt FC, ed. Escherichia coli
and Salmonella: Cellular and Molecular Biology. 2nd ed. Washington DC: ASMPress. pp 217–261.
23. Nicholls DG, Ferguson SJ (2002) Bioenergetics 3. London: Academic Press. pp
xviii, 297 p., [213] p. of plates p.
24. Toledo-Cuevas M, Barquera B, Gennis RB, Wikstrom M, Garcia-Horsman JA
(1998) The cbb3-type cytochrome c oxidase from Rhodobacter sphaeroides, aproton-pumping heme-copper oxidase. Biochim Biophys Acta 1365: 421–434.
25. Myers CR, Nealson KH (1990) Respiration-linked proton translocation coupled
to anaerobic reduction of manganese(IV) and iron(III) in Shewanellaputrefaciens MR-1. J Bacteriol 172: 6232–6238.
26. Teusink B, Wiersma A, Molenaar D, Francke C, de Vos WM, et al. (2006)Analysis of growth of Lactobacillus plantarum WCFS1 on a complex medium
using a genome-scale metabolic model. J Biol Chem 281: 40041–40048.
27. Oh YK, Palsson BO, Park SM, Schilling CH, Mahadevan R (2007) Genome-scale reconstruction of metabolic network in Bacillus subtilis based on high-
throughput phenotyping and gene essentiality data. J Biol Chem 282:28791–28799.
28. Oliveira AP, Nielsen J, Forster J (2005) Modeling Lactococcus lactis using agenome-scale flux model. BMC Microbiol 5: 39.
29. Reed JL, Vo TD, Schilling CH, Palsson BO (2003) An expanded genome-scale
model of Escherichia coli K-12 (iJR904 GSM/GPR). Genome Biol 4: R54.
30. Mahadevan R, Bond DR, Butler JE, Esteve-Nunez A, Coppi MV, et al. (2006)
Characterization of metabolism in the Fe(III)-reducing organism Geobactersulfurreducens by constraint-based modeling. Appl Environ Microbiol 72:
1558–1568.
31. Borodina I, Krabben P, Nielsen J (2005) Genome-scale analysis of Streptomycescoelicolor A3(2) metabolism. Genome Res 15: 820–829.
32. Jamshidi N, Palsson BO (2007) Investigating the metabolic capabilities ofMycobacterium tuberculosis H37Rv using the in silico strain iNJ661 and
proposing alternative drug targets. BMC Syst Biol 1: 26.
33. Mahadevan R, Schilling CH (2003) The effects of alternate optimal solutions inconstraint-based genome-scale metabolic models. Metab Eng 5: 264–276.
34. Burgard AP, Nikolaev EV, Schilling CH, Maranas CD (2004) Flux couplinganalysis of genome-scale metabolic network reconstructions. Genome Res 14:
301–312.
35. Faith JJ, Driscoll ME, Fusaro VA, Cosgrove EJ, Hayete B, et al. (2008) ManyMicrobe Microarrays Database: uniformly normalized Affymetrix compendia
with structured experimental metadata. Nucleic Acids Res 36: D866–870.
36. Scott JH, Nealson KH (1994) A biochemical study of the intermediary carbon
metabolism of Shewanella putrefaciens. J Bacteriol 176: 3408–3411.
37. Serres MH, Riley M (2006) Genomic analysis of carbon source metabolism ofShewanella oneidensis MR-1: Predictions versus experiments. J Bacteriol 188:
4601–4609.
38. Driscoll ME, Romine MF, Juhn FS, Serres MH, McCue LA, et al. (2007)
Identification of diverse carbon utilization pathways in Shewanella oneidensisMR-1 via expression profiling. Genome Inform 18: 287–298.
39. Tang YJ, Hwang JS, Wemmer DE, Keasling JD (2007) Shewanella oneidensis
MR-1 fluxome under various oxygen conditions. Appl Environ Microbiol 73:718–729.
40. Pramanik J, Keasling JD (1997) Stoichiometric model of Escherichia colimetabolism: Incorporation of growth-rate dependent biomass composition and
mechanistic energy requirements. Biotechnol Bioeng 56: 398–421.
41. Sauer U, Lasko DR, Fiaux J, Hochuli M, Glaser R, et al. (1999) Metabolic fluxratio analysis of genetic and environmental modulations of Escherichia coli
central carbon metabolism. J Bacteriol 181: 6679–6688.
42. Klapa MI, Aon JC, Stephanopoulos G (2003) Systematic quantification of
complex metabolic flux networks using stable isotopes and mass spectrometry.
Eur J Biochem 270: 3525–3542.
43. Russell JB, Cook GM (1995) Energetics of bacterial growth: balance of anabolic
and catabolic reactions. Microbiol Rev 59: 48–62.44. Qian H, Beard DA (2006) Metabolic futile cycles and their functions: a systems
analysis of energy and control. Syst Biol (Stevenage) 153: 192–200.
45. Schilling CH, Letscher D, Palsson BO (2000) Theory for the systemic definitionof metabolic pathways and their use in interpreting metabolic function from a
pathway-oriented perspective. J Theor Biol 203: 229–248.46. Zambrano MM, Kolter R (1993) Escherichia coli mutants lacking NADH
dehydrogenase I have a competitive disadvantage in stationary phase. J Bacteriol
175: 5642–5647.47. Ibarra RU, Edwards JS, Palsson BO (2002) Escherichia coli K-12 undergoes
adaptive evolution to achieve in silico predicted optimal growth. Nature 420:186–189.
48. Carlson RP (2007) Metabolic systems cost-benefit analysis for interpretingnetwork structure and regulation. Bioinformatics 23: 1258–1264.
49. Novak M, Pfeiffer T, Lenski RE, Sauer U, Bonhoeffer S (2006) Experimental
tests for an evolutionary trade-off between growth rate and yield in E. coli. AmNat 168: 242–251.
50. Pfeiffer T, Schuster S, Bonhoeffer S (2001) Cooperation and competition in theevolution of ATP-producing pathways. Science 292: 504–507.
51. Baba T, Ara T, Hasegawa M, Takai Y, Okumura Y, et al. (2006) Construction
of Escherichia coli K-12 in-frame, single-gene knockout mutants: the Keiocollection. Mol Syst Biol 2: 2006 0008.
52. Joyce AR, Reed JL, White A, Edwards R, Osterman A, et al. (2006)Experimental and computational assessment of conditionally essential genes in
Escherichia coli. J Bacteriol 188: 8259–8271.53. Covert MW, Knight EM, Reed JL, Herrgard MJ, Palsson BO (2004) Integrating
high-throughput and computational data elucidates bacterial networks. Nature
429: 92–96.54. Herrgard MJ, Lee BS, Portnoy V, Palsson BO (2006) Integrated analysis of
regulatory and metabolic networks reveals novel regulatory mechanisms inSaccharomyces cerevisiae. Genome Res 16: 627–635.
55. Sambrook J, Russell DW (2001) Molecular cloning : a laboratory manual. Cold
Spring HarborN.Y.: Cold Spring Harbor Laboratory Press.56. Kieft TL, Fredrickson JK, Onstott TC, Gorby YA, Kostandarithes HM, et al.
(1999) Dissimilatory reduction of Fe(III) and other electron acceptors by aThermus isolate. Appl Environ Microbiol 65: 1214–1221.
57. Pinchuk GE, Rodionov DA, Yang C, Li X, Osterman AL, et al. (2009) Genomicreconstruction of Shewanella oneidensis MR-1 metabolism reveals a previously
uncharacterized machinery for lactate utilization. Proc Natl Acad Sci U S A 106:
2874–2879.58. Wan XF, Verberkmoes NC, McCue LA, Stanek D, Connelly H, et al. (2004)
Transcriptomic and proteomic characterization of the Fur modulon in themetal-reducing bacterium Shewanella oneidensis. J Bacteriol 186: 8385–8400.
59. Shugar GJ, Ballinger JT (1996) Chemical technicians’ ready reference
handbook. New York: McGraw-Hill. pp xxxi, 972.60. Lowry OH, Rosebrough NJ, Farr AL, Randall RJ (1951) Protein measurement
with the Folin phenol reagent. J Biol Chem 193: 265–275.61. Daniels L, Hanson R, Philipps J In: Gerhardt P, ed. Methods for General and
Molecular Bacteriology. WashingtonDC: American Society for Microbiology.pp 512–554.
62. Sun J, Sayyar B, Butler JE, Pharkya P, Fahland TR, et al. (2009) Genome-scale
constraint-based modeling of Geobacter metallireducens. BMC Syst Biol 3: 15.63. Vinogradov E, Korenevsky A, Beveridge TJ (2003) The structure of the rough-
type lipopolysaccharide from Shewanella oneidensis MR-1, containing 8-amino-8-deoxy-Kdo and an open-chain form of 2-acetamido-2-deoxy-D-galactose.
Carbohydr Res 338: 1991–1997.
64. Burgard AP, Vaidyaraman S, Maranas CD (2001) Minimal reaction sets forEscherichia coli metabolism under different growth requirements and uptake
environments. Biotechnol Prog 17: 791–797.
Modeling S. oneidensis Metabolism
PLoS Computational Biology | www.ploscompbiol.org 14 June 2010 | Volume 6 | Issue 6 | e1000822
Related Documents


![Synthesis of nanoparticles by green chemistry …...(Rhodococcus sp.) [59]Bacterium Actinobacter spp[60] was reported. γ-proteobacterium Shewanella oneidensis can reduce tetrachloroaurate](https://static.cupdf.com/doc/110x72/5fa40df8360e89563d43f2bd/synthesis-of-nanoparticles-by-green-chemistry-rhodococcus-sp-59bacterium.jpg)


