Hindawi Publishing Corporation BioMed Research International Volume 2013, Article ID 268249, 10 pages http://dx.doi.org/10.1155/2013/268249 Research Article Constitutive Optimized Production of Streptokinase in Saccharomyces cerevisiae Utilizing Glyceraldehyde 3-Phosphate Dehydrogenase Promoter of Pichia pastoris Ravi N. Vellanki, 1,2 Ravichandra Potumarthi, 3 Kiran K. Doddapaneni, 1 Naveen Anubrolu, 1 and Lakshmi N. Mangamoori 1 1 Centre for Biotechnology, Institute of Science and Technology, Jawaharlal Nehru Technological University, Kukatpally, Hyderabad, Andhra Pradesh 500085, India 2 Ontario Cancer Institute, Princess Margaret Cancer Centre, 610 University Avenue, Toronto, ON, Canada M5G 2M9 3 Department of Chemical Engineering, Monash University, Clayton, VIC 3800, Australia Correspondence should be addressed to Lakshmi N. Mangamoori; [email protected] Received 25 April 2013; Revised 27 June 2013; Accepted 10 July 2013 Academic Editor: Gotthard Kunze Copyright © 2013 Ravi N. Vellanki et al. is is an open access article distributed under the Creative Commons Attribution License, which permits unrestricted use, distribution, and reproduction in any medium, provided the original work is properly cited. A novel expression vector constructed from genes of Pichia pastoris was applied for heterologous gene expression in Saccharomyces cerevisiae. Recombinant streptokinase (SK) was synthesized by cloning the region encoding mature SK under the control of glyceraldehyde 3-phosphate dehydrogenase (GAP) promoter of Pichia pastoris in Saccharomyces cerevisiae. SK was intracellularly expressed constitutively, as evidenced by lyticase-nitroanilide and caseinolytic assays. e functional activity was confirmed by plasminogen activation assay and in vitro clot lysis assay. Stability and absence of toxicity to the host with the recombinant expression vector as evidenced by southern analysis and growth profile indicate the application of this expression system for large-scale production of SK. Two-stage statistical approach, Plackett-Burman (PB) design and response surface methodology (RSM) was used for SK production medium optimization. In the first stage, carbon and organic nitrogen sources were qualitatively screened by PB design and in the second stage there was quantitative optimization of four process variables, yeast extract, dextrose, pH, and temperature, by RSM. PB design resulted in dextrose and peptone as best carbon and nitrogen sources for SK production. RSM method, proved as an efficient technique for optimizing process conditions which resulted in 110% increase in SK production, 2352 IU/mL, than for unoptimized conditions. 1. Introduction Streptokinase (SK) is a nonenzymatic thrombolytic protein secreted by Lancefield group C strains of beta hemolytic streptococci and is important in their virulence [1, 2]. A growing thrombotic mass may lead to partial or complete thrombotic arterial occlusion and end-organ ischemia or infarction. SK activates the fibrinolytic system indirectly by forming a 1 : 1 stoichiometric complex with plasminogen or plasmin. When fibrin thrombi develop, plasminogen adsorbs to the clot and SK penetrates the clot, activating plasminogen to plasmin, a proteolytic enzyme which dissolves the clot from within. SK has been used successfully in the treatment of pulmonary embolism, myocardial infarction, arterial/deep vein thrombosis, and clotted arteriovenous fistulae [1, 3]. Fibrinolytic molecules (enzymes/nonenzymes) were ex- tracted, purified to homogeneity from a variety of microbial sources, and tested for their efficacy and toxi- genicity [1, 4– 6]. e Streptococcus equisimilis H46A strain expressing SK is pathogenic and also secretes other potent antigenic toxins. e skc gene encoding SK (47 kDa) is produced in a heterolo- gous host that is generally regarded as safe (GRAS) organism. A variety of bacterial and yeast hosts were successfully exploited for the production of active SK [7, 8]. S. cerevisiae, due to its extensive data on gene manipulation tools, is the traditional host for the production of heterologous proteins.

Welcome message from author
This document is posted to help you gain knowledge. Please leave a comment to let me know what you think about it! Share it to your friends and learn new things together.
Transcript
Hindawi Publishing CorporationBioMed Research InternationalVolume 2013 Article ID 268249 10 pageshttpdxdoiorg1011552013268249
Research ArticleConstitutive Optimized Production of Streptokinase inSaccharomyces cerevisiae Utilizing Glyceraldehyde 3-PhosphateDehydrogenase Promoter of Pichia pastoris
Ravi N Vellanki12 Ravichandra Potumarthi3 Kiran K Doddapaneni1
Naveen Anubrolu1 and Lakshmi N Mangamoori1
1 Centre for Biotechnology Institute of Science and Technology Jawaharlal Nehru Technological University KukatpallyHyderabad Andhra Pradesh 500085 India
2Ontario Cancer Institute Princess Margaret Cancer Centre 610 University Avenue Toronto ON Canada M5G 2M93Department of Chemical Engineering Monash University Clayton VIC 3800 Australia
Correspondence should be addressed to Lakshmi N Mangamoori mangamoorigmailcom
Received 25 April 2013 Revised 27 June 2013 Accepted 10 July 2013
Academic Editor Gotthard Kunze
Copyright copy 2013 Ravi N Vellanki et alThis is an open access article distributed under theCreativeCommonsAttribution Licensewhich permits unrestricted use distribution and reproduction in any medium provided the original work is properly cited
A novel expression vector constructed from genes of Pichia pastoriswas applied for heterologous gene expression in Saccharomycescerevisiae Recombinant streptokinase (SK) was synthesized by cloning the region encoding mature SK under the control ofglyceraldehyde 3-phosphate dehydrogenase (GAP) promoter of Pichia pastoris in Saccharomyces cerevisiae SK was intracellularlyexpressed constitutively as evidenced by lyticase-nitroanilide and caseinolytic assays The functional activity was confirmed byplasminogen activation assay and in vitro clot lysis assay Stability and absence of toxicity to the hostwith the recombinant expressionvector as evidenced by southern analysis and growth profile indicate the application of this expression system for large-scaleproduction of SK Two-stage statistical approach Plackett-Burman (PB) design and response surface methodology (RSM) wasused for SK production medium optimization In the first stage carbon and organic nitrogen sources were qualitatively screenedby PB design and in the second stage there was quantitative optimization of four process variables yeast extract dextrose pHand temperature by RSM PB design resulted in dextrose and peptone as best carbon and nitrogen sources for SK productionRSMmethod proved as an efficient technique for optimizing process conditions which resulted in 110 increase in SK production2352 IUmL than for unoptimized conditions
1 Introduction
Streptokinase (SK) is a nonenzymatic thrombolytic proteinsecreted by Lancefield group C strains of beta hemolyticstreptococci and is important in their virulence [1 2] Agrowing thrombotic mass may lead to partial or completethrombotic arterial occlusion and end-organ ischemia orinfarction SK activates the fibrinolytic system indirectly byforming a 1 1 stoichiometric complex with plasminogen orplasminWhen fibrin thrombi develop plasminogen adsorbsto the clot and SK penetrates the clot activating plasminogento plasmin a proteolytic enzyme which dissolves the clotfrom within SK has been used successfully in the treatment
of pulmonary embolism myocardial infarction arterialdeepvein thrombosis and clotted arteriovenous fistulae [1 3]
Fibrinolytic molecules (enzymesnonenzymes) were ex-tracted purified to homogeneity from a variety of microbialsources and tested for their efficacy and toxi- genicity [1 4ndash6] The Streptococcus equisimilis H46A strain expressing SKis pathogenic and also secretes other potent antigenic toxinsThe skc gene encoding SK (47 kDa) is produced in a heterolo-gous host that is generally regarded as safe (GRAS) organismA variety of bacterial and yeast hosts were successfullyexploited for the production of active SK [7 8] S cerevisiaedue to its extensive data on gene manipulation tools is thetraditional host for the production of heterologous proteins
2 BioMed Research International
The advent of alcohol oxidase (AOX) expression system ofP pastoris led to successful protein industrialization Thedisadvantages associated with AOX expression system arechiefly that themethanol utilization led to the development ofalternate promoter systems GAP FLD and ICL1 for proteinexpression Of the above promoters GAP-(glyceraldehyde 3phosphate dehydrogenase-) based promoter system has beenextensively applied for constitutive continuous bioprocess [79ndash12] SK was expressed as intracellularsecretory moleculein P pastoris and Schizosaccharomyces pombe [7 13ndash15]
Microtiter analyses have been used to determine proteincontents enzyme activities ligand binding and are increas-ingly popular with the use of colorimetry fluorescence forefficiency and throughput They have also been used todetermine growth and lysis by spheroplast lysis assay [16ndash18]We describe here the adaptation of this assay in conjunctionwith a chromogenic substrate for qualitative detection of SKlevels in yeast clones [19]
SK production was maximized by screening carbonand nitrogen sources using two-evel Plackett-Burman (PB)design [20] Conventionally optimization of the processvariables involves changing one variable at a timewhile othersare held constant Practically this method is laborious totest every possible combination of test variables as it resultsin large number of experiments [21 22] Besides it doesnot consider the effect of interactions of various parametersAlternatively response surface methodology (RSM) can beused to evaluate and understand interaction among processvariables [23] RSM was successfully applied into bioprocessparameter optimization [24ndash28]
We have previously reported the production of hepatitisB surface antigen (HBsAg) in S cerevisiae utilizing GAPpromoter of P pastoris [12] The same vector backbone wasused for SK expression In the current investigation wehave explored the following (1) intracellular expression ofSK in S cerevisiae utilizing GAP promoter of P pastoris(2) optimization of nutrients for SK production using theabove expression system by response surface methodology(RSM) and comparison between normal and baffled flasksand (3) qualitative SK detection by Lyticase-nitroanilide assay(LNA) We report the successful constitutive intracellularexpression of SK in S cerevisiae detection by LNA followedby increased production using baffled-flask design after RSMSignificantly peptone and dextrose have shown the maximalSK production We have obtained a level of expressionconsiderable to that achieved in other yeast systems
2 Materials and Methods
21 Materials Media for bacterial and yeast growth Todd-Hewitt broth himedia (Mumbai India) and yeast extractpeptone dextrose (YPD) from USB (Cleveland OH) wereused Restriction enzymes T4 DNA ligases were pur-chased from New England Biolabs (Beverly MA) PCR wasperformed with Eppendorf mastercycler using Pfu DNApolymerase (Stratagene CA USA) Plasmid transformationand retainment were done in Escherichia coli DH5120572 fromGibco BRL (Gaithersburg MD) Saccharomyces cerevisiae
INVSC1 (MATa his3D1 leu2 trp1-289 and ura3-52) from In-vitrogen (Carlsband CA USA) is used in expression stud-ies Human plasminogen thrombin and fibrinogen werepurchased from Calbiochem (La Jolla CA)Sigma (StLouisMO) Nitroanilide substrate S-2251 is purchased from Fluka(BuchsSwitzerland)
22 Growth Media and Conditions All E coli DH5 120572 basedexperiments were performed in low-salt luria broth (1tryptone and 05 yeast extract 05 NaCl pH 75) mediumwith Zeocin (25 120583gmL) Transformants of S cerevisiae wereselected on YPD (1 yeast extract 2 peptone and 2 dex-trose) mediumwith Zeocin (200120583gmL) at 30∘C For proteinexpression S cerevisiae were cultured in YPD medium at30∘C
23 Construction of Recombinant Streptokinase ExpressionVector SK coding region was amplified by PCR usingP1-CAGCAGGAATTCATTGCTG GACCTGAGTGG andP2-TCCCCTCGAGTTATTTGTCGTTAGGGTTATC prim-ers from pGAPZA-SK vector [7] in a gene Eppendorf mas-tercycler PCR system and ligated to pB2ZB2 vector [12]downstream of GAP promoter at EcoRI and XhoI sitesIn-frame cloning of skc gene between GAP promoter andAOX TT terminator in the expression plasmid was analyzedby restriction digestion and DNA sequencing as describedpreviously [7] The resulting recombinant plasmid pB2ZB2-SK (Figure 1) was maintained in E coli DH5 120572 with Zeocinas a selection pressure pB2ZB2-SK was used as an integrativeexpression vector to transform S cerevisiae
24 Transformation and Screening of S cerevisiae withpB2ZB2-SK S cerevisiae were transformed with NarI-linearized pB2ZB2-SK vector (7431 bp) by lithium acetatemethod and selected as detailed earlier [12] The transfor-mants were screened for PGAP-skc-AOXTT cassette by colonyPCR [7]
241 Lyticase Nitroanilide Assay (LNA Assay) A part of thetransformant colony was inoculated in a 96-well conical-bottomed microtest plate (Thermo Scientific Microtiterplates) with each well containing 300 120583L of YPD-ZeocinmediumTheplatewas properly sealed and incubated at 30∘C100 rpm for 16 h to obtain exponential-phase cells Doublingtime of log phase for Saccharomyces in YPD medium is sim90min The density of cells in liquid culture was determinedat A600
(Thermo Multiskan Spectrum spectrophotometer)A fresh 96-well conical-bottomed plate was inoculated with03OD cells with each well containing 300 120583L of YPDmedium and incubated at 30∘C 100 rpm for 24 h Afterincubation cell density was determined and the plates werecentrifuged for 5min at 430 g (Eppendorf microcentrifuge5430 R) The supernatant was discarded from each wellusing a vacuum pump The cells were washed in PBS andcentrifuged for 2min at 430 g The culture was diluted inZ buffer (60mM Na
2HPO4 40mM NaH
2PO4 10mM KCl
1mM MgSO4 and 50mM 120573-ME pH 70) to obtain 06OD
50120583L of lyticase (10 120583g) was added to the cell suspension and
BioMed Research International 3
incubated for 30min at 22∘Cwith no shakingThis is followedby addition and incubation of 100 120583L of 001 Triton X-100solution for 15min at 22∘C After incubation plates werecentrifuged for 5ndash10min at 430 g If cell lysis is incompletefreeze thawing at minus80∘C was done
A 20120583L of cell-lysis supernatant was transferred to flat-bottom 96-well microtitration plates (Thermo Scientific)and proceeded with S-2251 assay Control samples wereprepared by adding 20120583L 01MTris-HCl buffer pH 74 30 120583Lsubstrate S-2251 (06mM) and 100 120583L plasminogen solution(01 CUmL) In the test samples the reaction was performedafter the addition of 20120583L SK 30 120583L S-2251 and 100 120583Lplasminogen solutions The plate was immediately placed inthe plate reader previously heated at 37∘C The absorbanceof the wells was measured at 405 nm every 30 s for 30minPlates were shaken for 5 s before reading the absorbanceusing aThermoMultiskan Spectrum spectrophotometer andanalyzing with SkanIt software A calibration curve was con-structed from five measurements with reference standards(50ndash2500 IUmL) Each SK dilution was assayed a minimumof three times One unit of SK is defined as the amount ofenzyme activity that converts 1120583mol of substrate per min perLiter
25 Time CourseExpression Experiments S cerevisiae clonewith maximum SK expression (Scerv-SK) screened by LNAassay was cultured in a 10mL YPD medium at 30∘C for24 hrs 180 rpm 10OD of 24 hr culture was inoculated in a25mL YPDmedium in a 150mL normalbaffled flask [29] Atime course study was performed at 30∘C 180 rpm for 120 hrsto evaluate the growth and expression profile S cerevisiaeharboring only the parent plasmid and untransformed strainswere used as controls Cell lysates of Scerv-SK clone wereprepared as discussed previously [12] and soluble SK wasscreenedusing chromogenic assay and clot lysis assayThe celllysate was analyzed for expression of rSK or stored at minus70∘C
26 Southern Analysis Genomic DNA was isolated fromS cerevisiae culture as per the standard procedure [30]Quantified genomic DNA (10 120583g) was restricted with SapIand AgeI and electrophoresed on 08 agarose gel Resolvedfragments were transferred to Hybond nylon membraneprobed with 163 Kbp PGAP-skc-AOXTT cassette fragmentand radiolabeled by nick translation kit (GIBCO-BRL) with[120572-32P] dCTP A PGAP-skc-AOXTT cassette fragment wasgenerated by digestion of pB2ZB2-SK vector with SapI andAgeI DNA from untransformed host was also included inthe analysis After hybridization and washing PGAP-skc-AOXTT insertion to yeast genomic DNA was visualized byautoradiography
27 Activity Assay Methods Plasminogen activation assayfibrin plate lysis assay and in vitro clot lysis assay wereperformed as described previously [19 31ndash35] Purified nativeSK (Streptase) was used as a standard
28 Carbon and Organic Nitrogen Sources Screening byPlackett-Burman Design The aim of the present study was to
screen significant carbon and organic nitrogen sources withrespect to their main effects on SK production by PB designbut it is not intended to study interaction effects between var-ious medium constituents Different carbon sources namelydextrose galactose fructose maltose sucrose lactose andglycerol and nitrogen sources namely yeast extract tryp-tone peptone casamino acids beef extract corn steep liquorand polypeptone were screened by PB design Seven carbonand nitrogen sources were selected with each variable at twolevels high concentrations (+1 2) and low concentrations(minus1 1) respectively and tested for SK production
Experiments were carried in 250mL Erlenmeyer flaskswith 100mL of production medium Different carbon andnitrogen sources were screened at 1 yeast extract 2peptone pH 70 200 rpm and 2 dextrose pH 70 200 rpmfor SK production respectively Supplementary Tables S1 andS2 available online at httpdxdoiorg1011552013268249shows design matrix (eight experiments) generated by PBto screen carbon and nitrogen sources Number of positivesigns and negative signs per trial are (119896 + 1)2 and (119896 minus1)2 respectively Here 119896 represents the number of variablesthat is 7 for both carbon and nitrogen sources Columns ofdesign matrix (supplementary Tables S1 and S2) should haveequal number of positive and negative signs meaning thateach row represents a trial run and each column representsan independent variable The effect of each variable wasdetermined by the following equation
119864 (119909119894) =
2 (sum119872119894
+
+119872119894
minus
)
119873
(1)
where 119864(119909119894) is the concentration effect of the tested variable
119872119894
+ and 119872119894
minus are from the trials where the variable (119909119894)
measured at high and low concentrations respectively 119873 isthe number of trials STATISTICA 60 (Stat Soft Inc TulsaOK) software was used for regression and graphical analysisof the data obtained
29 Experimental Design and Optimization of SK Produc-tion Medium by RSM [21ndash23] Optimum SK productionmedium composition was achieved by estimating the levelsof parameters using RSM RSM is an empirical techniqueused for the evaluation of relationships between a cluster ofcontrolled experimental factors and measured responses Acentral composite design (CCD) was used for RSM studiesCCD has the total number of combinations 2119896 + 2 lowast 119896 + 119899
0
where 119896 is the number of independent variables and 1198990is the
number of repetitions of the experiments at the center pointFour important SK production medium components wereselected by the best results of conventional (one at a time)approach Further these four parameters were evaluated fortheir interactive behaviors by using a statistical approachThe levels of four variables namely yeast extract 26 (119909
1)
dextrose 27 (1199092) pH 71 (119909
3) and temperature 30∘C (119909
4)
were coded at five levels minus2 minus1 0 1 and 2 by using (2)For statistical calculations the variables119883
119894were coded as
119909119894according to the following transformation
4 BioMed Research International
The range and levels of the variables in coded units forRSM studies are given in supplementary Table S3 Consider
119909119894=
119883119894minus 1198830
Δ119883
(2)
where 119909119894is the dimensionless coded value of the variable 119883
119894
1198830is the value of the119883
119894at the center point andΔ119883 is the step
changeThe behavior of the systemwas explained by the following
quadratic model (3)
119884 = 1205730+sum120573
119894lowast 119909119894+sum120573
119894119894lowast 1199092
119894
+sum120573119894119895lowast 119909119894119895 (3)
where 119884 is the predicted response 1205730is the intercept term
120573119894is the linear effect 120573
119894119894is the multiple effect and 120573
119894119895is the
interaction effect The full quadratic equation for four factorsis given by model (4)
119884 = 1205730+ 12057311199091+ 12057321199092+ 12057341199093+ 12057341199094
+ 120573111199091lowast 1199091+ 120573121199091lowast 1199092+ 120573131199091lowast 1199093
+ 120573141199091lowast 1199094+ 120573221199092lowast 1199092+ 120573231199092lowast 1199093
+ 120573241199092lowast 1199094+ 120573331199093lowast 1199093+ 120573341199093lowast 1199094
+ 120573441199094lowast 1199094
(4)
In the present study a 24 full factorial central compositedesign with eight points and six replicates at central pointwas used to fit the second-order polynomial equation Thisapproach has resulted in 30 experiments Regression andgraphical analysis of data were carried out by STATISTICA60 (Stat Soft Inc Tulsa OK) Selection of optimum com-bination of four test variables for the better SK productionwas performed according to the CCD experimental plan(supplementary Table S4) Analysis of variance (ANOVA)was used for regression equations to obtain optimal levelsof SK production as a function of the initial values of yeastextract dextrose pH and temperature
3 Results and Discussion
Streptokinase was expressed intracellularly with no post-translational proteolysis in P pastoris by AOX1 [13] andGAP [7] promoters Constitutive intracellular expressioncontinuous bioprocess in YPDmedium for SK were achievedwith P pastoris [7] Expression of SK in S cerevisiae either byintracellular or secretory mode was not reported previouslyThe present study demonstrates the constitutive expressionof rSK intracellularly in S cerevisiae by employing the GAPpromoter of P pastoris This is the first report of a GAP pro-moter operable dominant selective optimized constitutiveintracellular expression of recombinant SK in S cerevisiae
31 Construction of Recombinant Expression Vectors ThepB2ZB2 plasmid contains the PGAP-skc-AOXTT cassettewild-type histidinol dehydrogenase (HIS4) gene for lin-earized integration into host genome and Zeocin cassette bi-functional in both S cerevisiae and E coli for the selection
SapIEcoRINarI
HIS4
BspEI
skc gene
Amp (frag) ZeocinpEM7
Agel
pUC ori cyc1 TT
3998400 AOX TT
pTEF1
NotISacII6X His
C-myc epitope
pGAP
pB2ZB2-SK7431bp
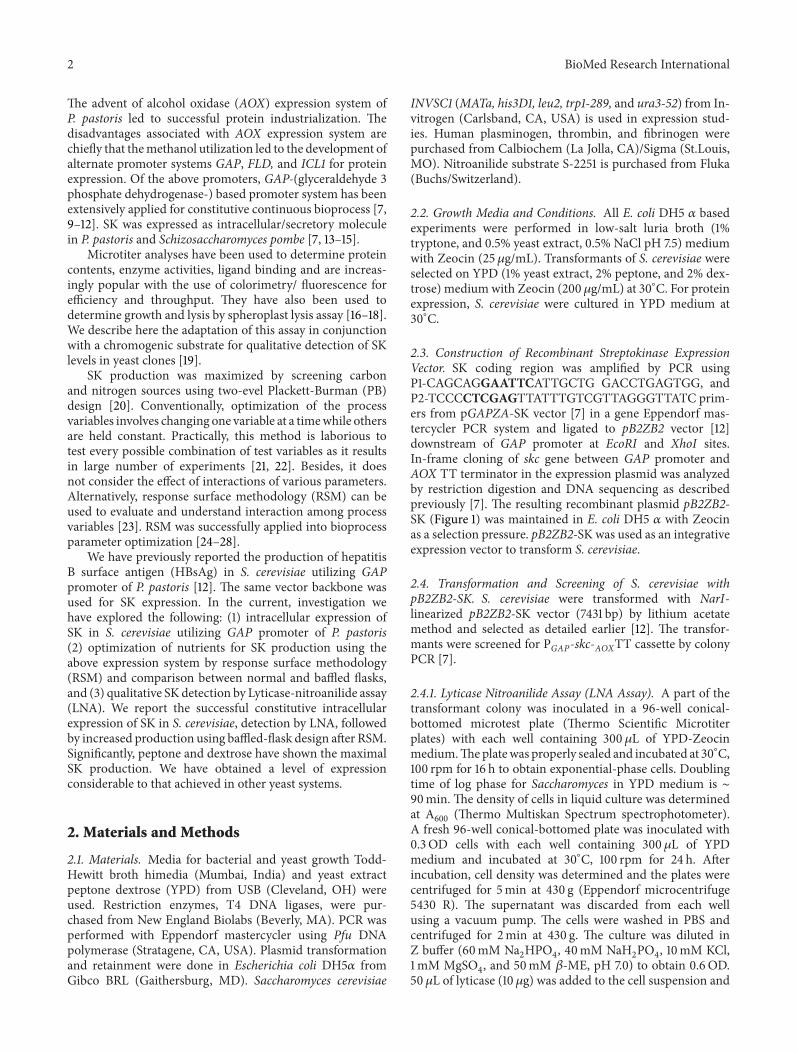
Figure 1 Plasmidmap of expression vector pB2ZB2-SK constructedto express streptokinase in S cerevisiae 125 Kbp skc gene is operablycloned downstream to GAP promoter generating a recombinantpB2ZB2-SK expression vector Appropriate restriction endonucleasesites are designated
of transformantsThe skc gene was cloned into the pB2ZB2vector generating recombinant expression vector pB2ZB2-SK (Figure 1) The cloning of skc gene downstream of GAPpromoter was confirmed by PCR and nucleotide sequencingGenetic markers like HIS4 and ARG4 of S cerevisiae wereused in episomal and integrative vectors in P pastoris [36]SUC2marker of S cerevisiae was used as dominant selectionin P pastoris [36] Constitutive promoters like PGK1 (Phos-pho Glycerate Kinase) and TDH3 (Triose Phosphate Dehy-drogenase 3) of S cerevisiae have been used for heterologousprotein expression [36 37]
HIS4 locus encoding histidinol dehydrogenase in Ppastoris and S cerevisiae shares more than 50 homology atDNA level NarI restriction site in HIS4 locus was chosen tolinearize the recombinant pB2ZB2-SK vector as the sequencehomology around this site is more than 85 Efficientintegration to S cerevisiae HIS4 locus by homologous recom-binationwithP pastorisHIS4 locuswas successfully achievedIntegration of skc gene expression cassette was confirmed byPCR with promoter- and terminator-specific primers and bysouthern hybridization indicating that the expression of SK isin fact mediated by GAP promoter
32 Generation of Constitutive Saccharomyces-SK ClonesNarI linearized pB2ZB2-SK recombinant vector was used totransform S cerevisiae Saccharomyces transformants inte-grated with the constitutive SK expression cassette wereselected on YPD agar plates containing Zeocin for 3-4 daysat 30∘C (Figure 2(a)) The presence of 15 Kbp PGAP-skc-AOXTT insert in Saccharomyces transformants was confirmedby colony PCR (Figure 2(b)) 85 transformants selected withZeocin were analyzed for SK expression by LNA assay 84transformants had SK expression and the clone (Scerv-SK)with 1050 IUmL is chosen for further experiments Southern
BioMed Research International 5
1 2
(a)
15Kbp
1 2 3 4 5
(b)
Figure 2 Screening of S cerevisiae transformants (a) S cerevisiae transformed with pB2ZB2-SK expression vector were selected on YPD-Zeocin (200 120583gmL) medium Transformants with pB2ZB2-SK vector (Lane 1) untransformed S cerevisiae (Lane 2) (b) Colony PCR (P3and P4 primers) of Saccharomyces transformants selected on YPD Zeocin medium Untransformed S cerevisiae (Lane 1) transformants with15 Kbp skc expression cassette fragments (Lanes 2 3 4 and 5) and 025ndash120 Kbp DNA ladder (Lane 6)
hybridization analysis of the Scerv-SK probed with PGAP-skc-AOXTT DNA fragment generated a 163 Kbp product(Figure 4)
33 Growth and Expression Profile A comparative growthexpression analysis was performed between normal andbaffled-flask cultures Quantification of SK activity by plas-minogen activation assay using cell lysates indicated anexpression level of 1050 IUmL in a normal flask and1300 IUmL for a baffled flask (Figure 3(a)) All the mediaoptimization experiments were conducted with baffle-flaskdesign
Stability and integration of skc gene in the Saccharomycesclone expressing SK were analyzed by southern blot analysis163 Kbp band is consistently seen from 24 to 120 hrs indicat-ing stability of the continuously cultured clone (Figure 4)
The toxicity of continuous expression of SK on the hostcells harboring the plasmids pB2ZB2-SK and pB2ZB2 andparent untransformed cells was investigated by comparingthe growth rate No significant difference in growth rate ofS cerv-SK clone compared with the controls was observed(Figure 3(b)) The above data indicates a correlation betweenthe time of onset of expression of SK with an increase in thegrowth rate suggesting that the expression of SK is not toxicto the host Qualitative and quantitative analyses of rSK in celllysis supernatant were performed by caseinolytic assay andplasminogen activation assay (S-2251 substrate) at differenttime intervals of growth The results indicate that expressionof rSK is observed from day 1 and is maintained till the endof the experiment
34 Carbon and Nitrogen Sources Screening by Plackett-Burman Design Plackett-Burman statistical design was usedto test various carbon (dextrose sucrose fructose maltosegalactose lactose and glycerol) and nitrogen sourcesrsquo (yeastextract tryptone peptone casamino acids beef extract cornsteep liquor and polypeptone) effect on SK production
Pareto charts (Figures 6 and 7) were used to showthe effect of various carbon and nitrogen sources on SKproduction It is evident from Figure 6 that dextrose has asignificant effect on SK production The SK production ina normal flask was 1050 IUmL and 1300 IUmL in a baffled
flask resulting in that dextrose is the most significant carbonsource for SK production in a baffled flask On the other handglycerol had least effect on SK production with yields 310 and440 IUmL in normal and baffled flasks respectively Furtherthe influence of different nitrogen sources on SK productionhas been shown in Figure 7 Yeast extract wasmost influentialwith 1410 and 1100 IUmL of SK production in baffled andnormal flasks respectively From Figures 6 and 7 it is clearlyevident that the shape of the flask has a significant effecton the amount of SK produced in confirmative lines withthe work done by Villatte et al [29] Results indicate thatPB design is a powerful technique to identify carbon andnitrogen sources for better SK production Further CCD andRSM were used to identify the exact optimal values of theindividual parameter
35 Optimization of SK Production Medium Conditions byDesign of Experiments and RSM Experiments 16 15 14 and 2(supplementary Table S4) resulted in amaximumproductionof SK with 2350 2150 2100 and 2100 IUmL respectivelyamong all combinations Four critical independent variablesyeast extract dextrose pH and temperature were chosen tooptimize the production of SK by S cerevisiae Experimentswere performed according to the CCD experimental designgiven in supplementary Table S5 in order to search for theoptimum combination of components of the medium
From supplementary Table S5 (model summary) coeffi-cient of determination (1198772) 0816 indicates fitness of modelwhich means that the statistical model can explain 816 ofvariability in the response for SK production The 1198772 valueshould always be between 0 and 1 and the closer the 1198772value to 1 the stronger the model to predict the responseThe adjusted 1198772 value is another one (supplementary TableS5) which corrects the 1198772 value for the sample size and forthe number of terms in the model Here the adjusted 1198772value is 0645 indicating better fitness of the model used foroptimization by RSM [38 39] The value of adjusted 1198772 issmaller than 1198772 if the model has many terms and the samplesize is small The values of adjusted 1198772 0645 1198772 0816and the coefficient of variation CV = 1113 indicate thatthe model can predict precise values from the experimentscarried out for SK production
6 BioMed Research International
0
200
400
600
800
1000
1200
0
5
10
15
20
25
30
35
40
45
24 48 72 96 120Time (hrs)
ODrSK activity
OD600
SK ac
tivity
(IU
mL)
(a)
0
10
20
30
40
50
Culture time (hrs)
Scerevisiae INVSc1Scerevisiae pB2ZB2Scerevisiae pB2ZB2-SK
OD600
24 48 72 96 120
(b)
Figure 3 (a) Plasminogen activation assay of rSK Growth profile and outline of SK expression of S cerevisiae clone Cells were grown inYPDmedium for 5 days Aliquots of cells were examined at different time intervals for growth and SK activity in the cell lysis supernatant bychromogenic assay using S-2251 substrate (b) Expression of rSK has no toxic effect on the growth rate of the S cerevisiae host S cerevisiaeINVSc1 cells were transformed with parent plasmids and recombinant expression vector pB2ZB2-SK Cells were cultured in YPD brothand aliquots were withdrawn at indicated time points up to 120 hrs OD600 recorded and plotted The above data is a mean of three to sixindependent experiments
163Kbp
1 2 3 4 5
Figure 4 Southern blot analyses of S cerevisiae-SK clone Genomic635 DNA of the clone was restricted with SapIAgeI enzymes blot-ted and hybridized with 12057232P-labelled 163 Kbp PGAP-skc-AOXTTcassette fragment S cerevisiae clone genomic DNA extracted at24 (Lane 2) 72 (Lane 3) 96 (Lane 4) and 120 hrs (Lane 5) anduntransformed S cerevisiae genomic DNA (Lane 1) 163 Kbp PGAP-skc-AOXTT cassette fragment is specified
1 2 3
Figure 5 Fibrin agarose indicator gel Untransformed S cerevisiaecell lysate (Lane 1) commercial SK (lane 2) and rSK expressed in Scerevisiae SK clone (Lane 3)
Multiple regression analysis was carried out on CCDexperimental data and a second-order full polynomial equa-tion was fitted Equation (5) gives the empirical relationshipbetween SK production (119884) and four test variables in codedunits
SK (IUmL)0 140012001000800600400200
1
2
3
4
5
6
7
Carb
on so
urce
s
1050 13001000 1100
690 850
680
620500
420 530
310 440
600
Figure 6 Pareto chart for the estimation of influence of differentcarbon sources on SK production (IUmL) by P pastoris (1)dextrose (2) galactose (3) maltose (4) sucrose (5) lactose (6)fructose and (7) glycerol
119884 = 1945 + 89792 lowast 1199091+ 87708 lowast 119909
2+ 53958 lowast 119909
3
minus 35208 lowast 1199094minus 9740 lowast 119909
11199091minus 69063 lowast 119909
11199092
+ 62813 lowast 11990911199093minus 47188 lowast 119909
11199094minus 47240 lowast 119909
21199092
+ 65938 lowast 11990921199093+ 43438 lowast 119909
21199094minus 15990 lowast 119909
31199093
+ 150313 lowast 11990931199094minus 59740 lowast 119909
41199094
(5)
where 119884 is SK production in IUmL 119884 is the response of(5) and 119909
1 1199092 1199093 and 119909
4are the coded values of the test
BioMed Research International 7
SK (IUmL)0 140012001000800600400200
1
2
3
4
5
6
7
Nitr
ogen
sour
ces
1100 1410
13801150
1080 1375
800 1000
740 980
610 800
640536
Figure 7 Pareto chart for the estimation of the influence of differentnitrogen sources on SK production (IUmL) by P pastoris (1)peptone (2) yeast extract (3) polypeptone (4) beef extract (5)tryptone (6) casamino acids and (7) corn steep liquor
variables yeast extract 26 (1199091) dextrose 27 (119909
2) pH
71 (1199093) temperature 30∘C (119909
4)
Results of analysis of variance (ANOVA) carried outon a second-order response surface model are given insupplementary Tables S5 and S6 Studentrsquos 119905-test and 119901 valueswere used to estimate each coefficient (supplementary TablesS5 and S6 Studentrsquos 119905 test and 119901 values were used to estimateeach coTables S5 and S6) Larger 119905-value and smaller 119901 valueare more significant to determine coefficients which meansthat linear effects of yeast extract (119901 lt 0006) and dextrose(119901 lt 0007) and interactive effect of pH and temperature(119901 lt 00001) are significant in SK production
Contour plots are the graphical representation of themodel generated and were drawn to illustrate effects of inde-pendent variables and combined effects of each independentvariable upon response variable Contour plots Figures 8(a)ndash8(f) help in predicting the SK production for different levelsof production medium conditions Infinite combinations oftwo test variables while others held at 0 level are indicatedin contour plots
Figures 8(a)ndash8(c) show the trend of SK production inIUmL with the variation in yeast extract with respect todextrose pH and temperature and the maximum predictedSK production of 2000 2400 and 2000 IUmL respectivelywas observed Figures 8(d) and 8(e) show the trend ofSK production in IUmL with the variation in dextrosewith respect to pH and temperature while a maximum SKproduction was predicted as of 2300 and 1900 respectivelySimilarly Figure 8(f) shows that a maximum of 2300 IUmLSK production was predicted with the variation in pH andtemperature
Regression equation was solved by a numerical method[39 40] and the optimal values of the four test variablesin coded units are 119909
1= minus072 119909
2= 0491 119909
3= 72
and 1199094= minus0681 The predicted value of 119884 (SK produ-
ction IUmL) at these values of 119909rsquos was 246113 IUmLThe real values of the four test variables were obtained by
substituting the respective coded values in (2) and foundto be yeast extract (119909
1) 3215 dextrose (119909
2) 2952 pH
742 (1199093) and temperature 3245 (119909
4) Further optimized SK
productionmedium conditions were validated in 250mL EMflask containing 100mL of productionmedium Experimentswere conducted in triplicates to check the reproducibility ofSK production using optimized conditions The SK produc-tion of 235207 IUmL (average of three experiments) wasobtained at optimal conditions This shows an increase ofalmost 110 than before optimizing experimental conditionsThe experimental value of the SK production was almostequal if we consider 95 of the confidence limits for theprediction of119884 value at optimized conditions with the shake-flask results
36 Streptokinase Expressed in S cerevisiae Is FunctionallyActive Various qualitative and quantitative assays have beendeveloped for the detection of SK activity casein plateassay [32] fibrin plate assay [33] chromogenic assay [19]in vitro clot lysis assay [31] and a combination of theseassays [34] were being proposed to accurately determinethe SK activity Lyticase produced by Arthrobacter luteusconsists of 120573-1 3-glucanase that attacks the 120573-1 3-glucans ina random endolytic approach releasing oligosaccharides in apH-dependent mode [17]
Lyticase-assisted yeast estrogen screening assay was per-formed to evaluate the environmental toxicity of certainchemicals [18] There are many methods available for mea-suring the activity of plasminogen activators changes in clotphysical structure or retainment of trapped bubbles fibrinopacity measurement by lysis zones on plates and changesin OD in microtiter plate formats The common endpoint inthese methods is the time to half lysis Alternative methodsuse radiochemical detection or utilize modified fibrinogenswith chromogenic detection Methods using chromogenicsubstrates have been developed where fibrin is removedbefore OD measurement or involving fibrin (ogen) chemi-cally immobilized to microtiter plates or in the presence ofopaque fibrin [34]
The mechanism of quantification of SK is the conversionof inactive plasminogen to active plasmin form Plasminacts on the chromogenic plasmin substrate D-Val-Leu-Lys-119901-nitroanilide and liberates 119901-nitroaniline upon cleavage [19]Cell lysis supernatant containing SK obtained by lyticasetreatment was analyzed for plasminogen activation capabilityby S-2251 chromogenic assay Spectrophotometric calibrationof cell density at OD
600was determined by direct counting in
a hemocytometer or by serial titration on YPD Zeocin agarplates for viable colonies
The biologically active nature of rSK expressed in Scerevisiae was further analyzed by a fibrin agarose indicatorclearing assay after resolving the crude protein by SDS-PAGE(Figure 5) SK resolved in PAGE activates the plasminogenin non-enzymatic mode in the agar gel to plasmin Plasmindissolves the fibrin clot formed in the agar gel evident byclear bands indicating the fibrinolytic activity 47 kDa formof constitutively expressing SK is functional In vitro clot lysis
8 BioMed Research International
260024002200200018001600140012001000
215 1
050minus05
minus1
minus15minus2
SK (I
Um
L)
Dextrose (wv)
2151050minus05
minus1minus15
minus2 Yeast extract (w
v)
2000
1800
1600
1400
1200
(a)
2600240022002000180016001400
215
105
0minus05
minus1minus15
minus2
SK (I
Um
L)
2151050minus05
minus1minus15
minus2Yeast e
xtract (wv)
pH
gt2200
lt2200
lt2000
lt1800
lt1600
(b)
2400220020001800160014001200
215
105
0minus05
minus1minus15
minus2
SK (I
Um
L)
2151050
minus05minus1
minus15minus2 Yeast e
xtract (wv)
Temperature ( ∘C)
gt2000
lt2000
lt1800
lt1600
lt1400
(c)
2400220020001800160014001200
SK (I
Um
L)
pH
Dextrose (wv)
215
105
0minus05
minus1minus15
minus2
2151050
minus05minus1
minus15minus2
gt2200
lt2200
lt2000
lt1800
lt1600
lt1400
(d)
260024002200200018001600140012001000
SK (I
Um
L)
Dextrose (wv)
215
105
0minus05
minus1minus15
minus2
2151050
minus05minus1
minus15minus2
Temperature ( ∘C)
gt1800
lt1700
lt1500
lt1300
lt1100
(e)
260024002200200018001600140012001000
800600
SK (I
Um
L)
215
105
0minus05
minus1minus15
minus2
2151050
minus05minus1
minus15minus2
Temperature ( ∘C)pH
gt2200
lt2100
lt1900
lt1700
lt1500
lt1300
lt1100
lt900
(f)
Figure 8 ((a)ndash(f)) 3D surface and contour plots of SK production by Pichia pastoris (IUmL) the effect of two variables while the other twoare held at 0 level
BioMed Research International 9
Table 1 Stability of intracellularly expressed SK in S cerevisiae celllysates
Storage temperaturea Functional activityb inCell lysis supernatant
minus20∘C 1000∘C 944∘C 8625∘C 937∘C mdash42∘C mdashaCell lysis supernatant of Saccharomyces clone expressing SK was stored atabove temperatures for duration of 96 hrsbFunctional activity was assayed by in vitro clot lysis method and is a meanof three assays
assay [34] was also used to confirm the biologically activenature of the rSK
37 Stability of SK Stability studies using cell lysate of Scerevisiae expressing rSK at minus20∘C 4∘C 25∘C 37∘C and 42∘Cindicated the presence of plasminogen activation efficiency atminus20∘C 0∘C and 4∘C (Table 1) Similar results were obtainedfrom rSK expressed in P pastoris and with SK purified fromE coli that was used as control
The level of SK activity achieved by constitutive intracel-lular expression in S cerevisiae is 2352 IUmL compared tothat of Schizosaccharomyces pombe (2450 IUmL) [9] and Ppastoris (3200 IUmL and 2089 IUmL) [7 14]The optimiza-tion of nutrients at shake flask level is to be extrapolated tobioreactor level to obtain large-scale production of rSK Con-tinuous constitutive bioreactor culture is being investigatedto achieve rSK expression at industrial scale
4 Conclusion
In conclusion we have accomplished constitutively express-ing rSK intracellularly in S cerevisiae using P pastorisexpression backboneThe expressed SKprotein (2352 IUmL)on fibrin-plate zymography and chromogenic assay exhib-ited plasminogen activation property Continuous cultivationbioreactor and purification strategies are being devised toobtain a protein of homogeneity
Abbreviations
SK StreptokinaseGAP Glyceraldehyde 3-phosphate dehydrogenaseAOX Alcohol oxidaseHRP Horse radish peroxidaseHIS4 Histidinol dehydrogenaseRSM Response surface methodology
Conflict of Interests
All the authors of this paper disclose that there is no conflictof interest between companiesorganizations and for thematerial used and discussed in the present work
Acknowledgments
This study was supported by a funding under the TechnologyEducation Quality Improvement Program (TEQIP) by theWorld Bank to the Centre for Biotechnology JawaharlalNehru Technological University (JNTU) Hyderabad IndiaRavi N Vellanki acknowledges the Council of Scientific andIndustrial Research (CSIR) Government of India for theSenior Research Fellowship (SRF)
References
[1] A Banerjee Y Chisti and U C Banerjee ldquoStreptokinasemdashaclinically useful thrombolytic agentrdquo Biotechnology Advancesvol 22 no 4 pp 287ndash307 2004
[2] H Sun Y Xu I Sitkiewicz et al ldquoInhibitor of streptokinasegene expression improves survival after group A streptococcusinfection in micerdquo Proceedings of the National Academy ofSciences of the United States of America vol 109 no 9 pp 3469ndash3474 2012
[3] D Xavier P Pais P Devereaux et al ldquoTreatment and outcomesof acute coronary syndromes in India (CREATE) a prospectiveanalysis of registry datardquoTheLancet vol 371 no 9622 pp 1435ndash1442 2008
[4] K Balaraman and G Prabakaran ldquoProduction and purificationof a fibrinolytic enzyme (thrombinase) from Bacillus sphaeri-cusrdquo Indian Journal of Medical Research vol 126 no 5 pp 459ndash464 2007
[5] R R Chitte S V Deshmukh and P P Kanekar ldquoProduc-tion purification and biochemical characterization of a fib-rinolytic enzyme from thermophilic Streptomyces sp MCMB-379rdquo Applied Biochemistry and Biotechnology vol 165 no 5-6pp 1406ndash1413 2011
[6] M Ueda T Kubo K Miyatake and T Nakamura ldquoPurificationand characterization of fibrinolytic alkaline protease fromFusarium sp BLBrdquoAppliedMicrobiology and Biotechnology vol74 no 2 pp 331ndash338 2007
[7] R N Vellanki R Potumarthi and L N Mangamoori ldquoCon-stitutive expression and optimization of nutrients for streptok-inase production by Pichia pastoris using statistical methodsrdquoApplied Biochemistry and Biotechnology vol 158 no 1 pp 25ndash40 2009
[8] E Pimienta J C Ayala C Rodrıguez et al ldquoRecombinantproduction of Streptococcus equisimilis streptokinase by Strepto-myces lividansrdquoMicrobial Cell Factories vol 6 article 20 2007
[9] F S HartnerFS C Ruth D Langenegger et al ldquoPromoterlibrary designed for fine-tuned gene expression in Pichia pas-torisrdquo Nucleic Acids Research vol 36 no 12 article e76 2008
[10] O Cos R Ramon J L Montesinos and F Valero ldquoOperationalstrategies monitoring and control of heterologous proteinproduction in the methylotrophic yeast Pichia pastoris underdifferent promoters a reviewrdquo Microbial Cell Factories vol 5article 17 2006
[11] A L Zhang J X Luo T Y Zhang et al ldquoRecent advances ontheGAP promoter derived expression systemofPichia pastorisrdquoMolecular Biology Reports vol 36 no 6 pp 1611ndash1619 2009
[12] R N Vellanki N Komaravelli R Tatineni and L N Mang-amoori ldquoExpression of hepatitis B surface antigen in Saccha-romyces cerevisiae utilizing glyceraldeyhyde-3-phosphate dehy-drogenase promoter of Pichia pastorisrdquo Biotechnology Lettersvol 29 no 2 pp 313ndash318 2007
10 BioMed Research International
[13] M J Hagenson K A Holden K A Parker et al ldquoExpressionof streptokinase in Pichia pastoris yeastrdquo Enzyme and MicrobialTechnology vol 11 no 10 pp 650ndash656 1989
[14] J Pratap G Rajamohan and K L Dikshit ldquoCharacteristicsof glycosylated streptokinase secreted from Pichia pastorisenhanced resistance of SK to proteolysis by glycosylationrdquoApplied Microbiology and Biotechnology vol 53 no 4 pp 469ndash475 2000
[15] R Kumar and J Singh ldquoExpression and secretion of a prokary-otic protein streptokinase without glycosylation and degrada-tion in Schizosaccharomyces pomberdquo Yeast vol 21 no 16 pp1343ndash1358 2004
[16] R Ovalle M Spencer M Thiwanont and P N Lipke ldquoThespheroplast lysis assay for yeast in microtiter plate formatrdquoApplied and Environmental Microbiology vol 65 no 8 pp3325ndash3327 1999
[17] J H Scott and R Schekman ldquoLyticase endoglucanase andprotease activities that act together in yeast cell lysisrdquo Journalof Bacteriology vol 142 no 2 pp 414ndash423 1980
[18] T Schultis and J W Metzger ldquoDetermination of estrogenicactivity by LYES-assay (yeast estrogen screen-assay assisted byenzymatic digestion with lyticase)rdquo Chemosphere vol 57 no 11pp 1649ndash1655 2004
[19] E S Kulisek S E Holm and K H Johnston ldquoA chromogenicassay for the detection of plasmin generated by plasmino-gen activator immobilized on nitrocellulose using a para-nitroanilide synthetic peptide substraterdquo Analytical Biochem-istry vol 177 no 1 pp 78ndash84 1989
[20] R L Plackett and J P Burman ldquoThe design of optimummultifactorial experimentsrdquo Biometrika vol 33 no 4 pp 305ndash325 1946
[21] S Akhnazarova and V Vafarov Experiment Optimizationin Chemistry and Chemical Engineering Mir PublicationsMoscow Russia 1982
[22] RHMyers andDCMontgomery ldquoResponse surfacemethod-ologyrdquo in Process and Product Optimization Using DesignedExperiments Wiley-Interscience New York NY USA 1995
[23] A I Khuri and J A Cornell Response Surfaces Design andAnalysis Marcel Dekker New York NY USA 1987
[24] S Sharma A Malik and S Satya ldquoApplication of response sur-face methodology (RSM) for optimization of nutrient supple-mentation for Cr (VI) removal by Aspergillus lentulus AML05rdquoJournal of Hazardous Materials vol 164 no 2-3 pp 1198ndash12042009
[25] C Gasparetti P Buzzini M R Cramarossa B Turchetti UM Pagnoni and L Forti ldquoApplication of the response surfacemethodology (RSM) for optimizing the production of volatileorganic compounds (VOCs) by Trichosporon moniliiformerdquoEnzyme and Microbial Technology vol 39 no 6 pp 1341ndash13462006
[26] R Potumarthi L Jacques W Harry and M Danquah ldquoSur-face immobilization of Rhizopus oryzae (ATCC 96382) forenhanced production lipase enzyme by multiple responsesoptimizationrdquoAsia-Pacific Journal of Chemical Engineering vol7 no 3 supplement pp S285ndashS295 2012
[27] R Potumarthi G Mugeraya and A Jetty ldquoBiological treatmentof toxic petroleum spent caustic in fluidized bed bioreactorusing immobilized cells of Thiobacillus RAI01rdquo Applied Bio-chemistry and Biotechnology vol 151 no 2-3 pp 532ndash546 2008
[28] R Potumarthi C Subhakar A Pavani and A Jetty ldquoEvalu-ation of various parameters of calcium-alginate immobiliza-tion method for enhanced alkaline protease production by
Bacillus licheniformis NCIM-2042 using statistical methodsrdquoBioresource Technology vol 99 no 6 pp 1776ndash1786 2008
[29] F Villatte A S Hussein T T Bachmann and R D SchmidldquoExpression level of heterologous proteins in Pichia pastoris isinfluenced by flask designrdquo Applied Microbiology and Biotech-nology vol 55 no 4 pp 463ndash465 2001
[30] C S Hoffman and FWinston ldquoA ten-minute DNA preparationfrom yeast efficiently releases automomous plasmids for trans-formation of Escherichia colirdquoGene vol 57 no 2-3 pp 267ndash2721987
[31] L T Couto J L Donato and G de Nucci ldquoAnalysis of fivestreptokinase formulations using the euglobulin lysis test andthe plasminogen activation assayrdquo Brazilian Journal of Medicaland Biological Research vol 37 no 12 pp 1889ndash1894 2004
[32] A Granelli-Piperno and E Reich ldquoA study of proteases andprotease-inhibitor complexes in biological fluidsrdquo Journal ofExperimental Medicine vol 148 no 1 pp 223ndash234 1978
[33] H Malke and J J Ferretti ldquoStreptokinase cloning expressionand excretion by Escherichia colirdquo Proceedings of the NationalAcademy of Sciences of the United States of America vol 81 no11 pp 3557ndash3561 1984
[34] C Longstaff and C MWhitton ldquoA proposed reference methodfor plasminogen activators that enables calculation of enzymeactivities in SI unitsrdquo Journal of Thrombosis and Haemostasisvol 2 no 8 pp 1416ndash1421 2004
[35] US Pharmacopeial Convention Inc United States Pharma-copeia 27National Formulary 22 US Pharmacopeial Conven-tion Inc Rockville Md USA 2004
[36] T TWang J Y Choi and BH Lee ldquoTransformation systems ofnon-Saccharomyces yeastsrdquo Critical Reviews in Biotechnologyvol 21 no 3 pp 177ndash218 2001
[37] V Nacken T Achstetter and E Degryse ldquoProbing the limitsof expression levels by varying promoter strength and plasmidcopy number in Saccharomyces cerevisiaerdquo Gene vol 175 no 1-2 pp 253ndash260 1996
[38] G E P Box W G Hunter and J S Hunter Statistics forExperimenters John Wiley amp Sons New York NY USA 1978
[39] W G Cochran and G M Cox Eds Experimental Design JohnWiley amp Sons New York NY USA 1957
[40] D Montgomery Design and Analysis of Experiments JohnWiley amp Sons New York NY USA 2001
2 BioMed Research International
The advent of alcohol oxidase (AOX) expression system ofP pastoris led to successful protein industrialization Thedisadvantages associated with AOX expression system arechiefly that themethanol utilization led to the development ofalternate promoter systems GAP FLD and ICL1 for proteinexpression Of the above promoters GAP-(glyceraldehyde 3phosphate dehydrogenase-) based promoter system has beenextensively applied for constitutive continuous bioprocess [79ndash12] SK was expressed as intracellularsecretory moleculein P pastoris and Schizosaccharomyces pombe [7 13ndash15]
Microtiter analyses have been used to determine proteincontents enzyme activities ligand binding and are increas-ingly popular with the use of colorimetry fluorescence forefficiency and throughput They have also been used todetermine growth and lysis by spheroplast lysis assay [16ndash18]We describe here the adaptation of this assay in conjunctionwith a chromogenic substrate for qualitative detection of SKlevels in yeast clones [19]
SK production was maximized by screening carbonand nitrogen sources using two-evel Plackett-Burman (PB)design [20] Conventionally optimization of the processvariables involves changing one variable at a timewhile othersare held constant Practically this method is laborious totest every possible combination of test variables as it resultsin large number of experiments [21 22] Besides it doesnot consider the effect of interactions of various parametersAlternatively response surface methodology (RSM) can beused to evaluate and understand interaction among processvariables [23] RSM was successfully applied into bioprocessparameter optimization [24ndash28]
We have previously reported the production of hepatitisB surface antigen (HBsAg) in S cerevisiae utilizing GAPpromoter of P pastoris [12] The same vector backbone wasused for SK expression In the current investigation wehave explored the following (1) intracellular expression ofSK in S cerevisiae utilizing GAP promoter of P pastoris(2) optimization of nutrients for SK production using theabove expression system by response surface methodology(RSM) and comparison between normal and baffled flasksand (3) qualitative SK detection by Lyticase-nitroanilide assay(LNA) We report the successful constitutive intracellularexpression of SK in S cerevisiae detection by LNA followedby increased production using baffled-flask design after RSMSignificantly peptone and dextrose have shown the maximalSK production We have obtained a level of expressionconsiderable to that achieved in other yeast systems
2 Materials and Methods
21 Materials Media for bacterial and yeast growth Todd-Hewitt broth himedia (Mumbai India) and yeast extractpeptone dextrose (YPD) from USB (Cleveland OH) wereused Restriction enzymes T4 DNA ligases were pur-chased from New England Biolabs (Beverly MA) PCR wasperformed with Eppendorf mastercycler using Pfu DNApolymerase (Stratagene CA USA) Plasmid transformationand retainment were done in Escherichia coli DH5120572 fromGibco BRL (Gaithersburg MD) Saccharomyces cerevisiae
INVSC1 (MATa his3D1 leu2 trp1-289 and ura3-52) from In-vitrogen (Carlsband CA USA) is used in expression stud-ies Human plasminogen thrombin and fibrinogen werepurchased from Calbiochem (La Jolla CA)Sigma (StLouisMO) Nitroanilide substrate S-2251 is purchased from Fluka(BuchsSwitzerland)
22 Growth Media and Conditions All E coli DH5 120572 basedexperiments were performed in low-salt luria broth (1tryptone and 05 yeast extract 05 NaCl pH 75) mediumwith Zeocin (25 120583gmL) Transformants of S cerevisiae wereselected on YPD (1 yeast extract 2 peptone and 2 dex-trose) mediumwith Zeocin (200120583gmL) at 30∘C For proteinexpression S cerevisiae were cultured in YPD medium at30∘C
23 Construction of Recombinant Streptokinase ExpressionVector SK coding region was amplified by PCR usingP1-CAGCAGGAATTCATTGCTG GACCTGAGTGG andP2-TCCCCTCGAGTTATTTGTCGTTAGGGTTATC prim-ers from pGAPZA-SK vector [7] in a gene Eppendorf mas-tercycler PCR system and ligated to pB2ZB2 vector [12]downstream of GAP promoter at EcoRI and XhoI sitesIn-frame cloning of skc gene between GAP promoter andAOX TT terminator in the expression plasmid was analyzedby restriction digestion and DNA sequencing as describedpreviously [7] The resulting recombinant plasmid pB2ZB2-SK (Figure 1) was maintained in E coli DH5 120572 with Zeocinas a selection pressure pB2ZB2-SK was used as an integrativeexpression vector to transform S cerevisiae
24 Transformation and Screening of S cerevisiae withpB2ZB2-SK S cerevisiae were transformed with NarI-linearized pB2ZB2-SK vector (7431 bp) by lithium acetatemethod and selected as detailed earlier [12] The transfor-mants were screened for PGAP-skc-AOXTT cassette by colonyPCR [7]
241 Lyticase Nitroanilide Assay (LNA Assay) A part of thetransformant colony was inoculated in a 96-well conical-bottomed microtest plate (Thermo Scientific Microtiterplates) with each well containing 300 120583L of YPD-ZeocinmediumTheplatewas properly sealed and incubated at 30∘C100 rpm for 16 h to obtain exponential-phase cells Doublingtime of log phase for Saccharomyces in YPD medium is sim90min The density of cells in liquid culture was determinedat A600
(Thermo Multiskan Spectrum spectrophotometer)A fresh 96-well conical-bottomed plate was inoculated with03OD cells with each well containing 300 120583L of YPDmedium and incubated at 30∘C 100 rpm for 24 h Afterincubation cell density was determined and the plates werecentrifuged for 5min at 430 g (Eppendorf microcentrifuge5430 R) The supernatant was discarded from each wellusing a vacuum pump The cells were washed in PBS andcentrifuged for 2min at 430 g The culture was diluted inZ buffer (60mM Na
2HPO4 40mM NaH
2PO4 10mM KCl
1mM MgSO4 and 50mM 120573-ME pH 70) to obtain 06OD
50120583L of lyticase (10 120583g) was added to the cell suspension and
BioMed Research International 3
incubated for 30min at 22∘Cwith no shakingThis is followedby addition and incubation of 100 120583L of 001 Triton X-100solution for 15min at 22∘C After incubation plates werecentrifuged for 5ndash10min at 430 g If cell lysis is incompletefreeze thawing at minus80∘C was done
A 20120583L of cell-lysis supernatant was transferred to flat-bottom 96-well microtitration plates (Thermo Scientific)and proceeded with S-2251 assay Control samples wereprepared by adding 20120583L 01MTris-HCl buffer pH 74 30 120583Lsubstrate S-2251 (06mM) and 100 120583L plasminogen solution(01 CUmL) In the test samples the reaction was performedafter the addition of 20120583L SK 30 120583L S-2251 and 100 120583Lplasminogen solutions The plate was immediately placed inthe plate reader previously heated at 37∘C The absorbanceof the wells was measured at 405 nm every 30 s for 30minPlates were shaken for 5 s before reading the absorbanceusing aThermoMultiskan Spectrum spectrophotometer andanalyzing with SkanIt software A calibration curve was con-structed from five measurements with reference standards(50ndash2500 IUmL) Each SK dilution was assayed a minimumof three times One unit of SK is defined as the amount ofenzyme activity that converts 1120583mol of substrate per min perLiter
25 Time CourseExpression Experiments S cerevisiae clonewith maximum SK expression (Scerv-SK) screened by LNAassay was cultured in a 10mL YPD medium at 30∘C for24 hrs 180 rpm 10OD of 24 hr culture was inoculated in a25mL YPDmedium in a 150mL normalbaffled flask [29] Atime course study was performed at 30∘C 180 rpm for 120 hrsto evaluate the growth and expression profile S cerevisiaeharboring only the parent plasmid and untransformed strainswere used as controls Cell lysates of Scerv-SK clone wereprepared as discussed previously [12] and soluble SK wasscreenedusing chromogenic assay and clot lysis assayThe celllysate was analyzed for expression of rSK or stored at minus70∘C
26 Southern Analysis Genomic DNA was isolated fromS cerevisiae culture as per the standard procedure [30]Quantified genomic DNA (10 120583g) was restricted with SapIand AgeI and electrophoresed on 08 agarose gel Resolvedfragments were transferred to Hybond nylon membraneprobed with 163 Kbp PGAP-skc-AOXTT cassette fragmentand radiolabeled by nick translation kit (GIBCO-BRL) with[120572-32P] dCTP A PGAP-skc-AOXTT cassette fragment wasgenerated by digestion of pB2ZB2-SK vector with SapI andAgeI DNA from untransformed host was also included inthe analysis After hybridization and washing PGAP-skc-AOXTT insertion to yeast genomic DNA was visualized byautoradiography
27 Activity Assay Methods Plasminogen activation assayfibrin plate lysis assay and in vitro clot lysis assay wereperformed as described previously [19 31ndash35] Purified nativeSK (Streptase) was used as a standard
28 Carbon and Organic Nitrogen Sources Screening byPlackett-Burman Design The aim of the present study was to
screen significant carbon and organic nitrogen sources withrespect to their main effects on SK production by PB designbut it is not intended to study interaction effects between var-ious medium constituents Different carbon sources namelydextrose galactose fructose maltose sucrose lactose andglycerol and nitrogen sources namely yeast extract tryp-tone peptone casamino acids beef extract corn steep liquorand polypeptone were screened by PB design Seven carbonand nitrogen sources were selected with each variable at twolevels high concentrations (+1 2) and low concentrations(minus1 1) respectively and tested for SK production
Experiments were carried in 250mL Erlenmeyer flaskswith 100mL of production medium Different carbon andnitrogen sources were screened at 1 yeast extract 2peptone pH 70 200 rpm and 2 dextrose pH 70 200 rpmfor SK production respectively Supplementary Tables S1 andS2 available online at httpdxdoiorg1011552013268249shows design matrix (eight experiments) generated by PBto screen carbon and nitrogen sources Number of positivesigns and negative signs per trial are (119896 + 1)2 and (119896 minus1)2 respectively Here 119896 represents the number of variablesthat is 7 for both carbon and nitrogen sources Columns ofdesign matrix (supplementary Tables S1 and S2) should haveequal number of positive and negative signs meaning thateach row represents a trial run and each column representsan independent variable The effect of each variable wasdetermined by the following equation
119864 (119909119894) =
2 (sum119872119894
+
+119872119894
minus
)
119873
(1)
where 119864(119909119894) is the concentration effect of the tested variable
119872119894
+ and 119872119894
minus are from the trials where the variable (119909119894)
measured at high and low concentrations respectively 119873 isthe number of trials STATISTICA 60 (Stat Soft Inc TulsaOK) software was used for regression and graphical analysisof the data obtained
29 Experimental Design and Optimization of SK Produc-tion Medium by RSM [21ndash23] Optimum SK productionmedium composition was achieved by estimating the levelsof parameters using RSM RSM is an empirical techniqueused for the evaluation of relationships between a cluster ofcontrolled experimental factors and measured responses Acentral composite design (CCD) was used for RSM studiesCCD has the total number of combinations 2119896 + 2 lowast 119896 + 119899
0
where 119896 is the number of independent variables and 1198990is the
number of repetitions of the experiments at the center pointFour important SK production medium components wereselected by the best results of conventional (one at a time)approach Further these four parameters were evaluated fortheir interactive behaviors by using a statistical approachThe levels of four variables namely yeast extract 26 (119909
1)
dextrose 27 (1199092) pH 71 (119909
3) and temperature 30∘C (119909
4)
were coded at five levels minus2 minus1 0 1 and 2 by using (2)For statistical calculations the variables119883
119894were coded as
119909119894according to the following transformation
4 BioMed Research International
The range and levels of the variables in coded units forRSM studies are given in supplementary Table S3 Consider
119909119894=
119883119894minus 1198830
Δ119883
(2)
where 119909119894is the dimensionless coded value of the variable 119883
119894
1198830is the value of the119883
119894at the center point andΔ119883 is the step
changeThe behavior of the systemwas explained by the following
quadratic model (3)
119884 = 1205730+sum120573
119894lowast 119909119894+sum120573
119894119894lowast 1199092
119894
+sum120573119894119895lowast 119909119894119895 (3)
where 119884 is the predicted response 1205730is the intercept term
120573119894is the linear effect 120573
119894119894is the multiple effect and 120573
119894119895is the
interaction effect The full quadratic equation for four factorsis given by model (4)
119884 = 1205730+ 12057311199091+ 12057321199092+ 12057341199093+ 12057341199094
+ 120573111199091lowast 1199091+ 120573121199091lowast 1199092+ 120573131199091lowast 1199093
+ 120573141199091lowast 1199094+ 120573221199092lowast 1199092+ 120573231199092lowast 1199093
+ 120573241199092lowast 1199094+ 120573331199093lowast 1199093+ 120573341199093lowast 1199094
+ 120573441199094lowast 1199094
(4)
In the present study a 24 full factorial central compositedesign with eight points and six replicates at central pointwas used to fit the second-order polynomial equation Thisapproach has resulted in 30 experiments Regression andgraphical analysis of data were carried out by STATISTICA60 (Stat Soft Inc Tulsa OK) Selection of optimum com-bination of four test variables for the better SK productionwas performed according to the CCD experimental plan(supplementary Table S4) Analysis of variance (ANOVA)was used for regression equations to obtain optimal levelsof SK production as a function of the initial values of yeastextract dextrose pH and temperature
3 Results and Discussion
Streptokinase was expressed intracellularly with no post-translational proteolysis in P pastoris by AOX1 [13] andGAP [7] promoters Constitutive intracellular expressioncontinuous bioprocess in YPDmedium for SK were achievedwith P pastoris [7] Expression of SK in S cerevisiae either byintracellular or secretory mode was not reported previouslyThe present study demonstrates the constitutive expressionof rSK intracellularly in S cerevisiae by employing the GAPpromoter of P pastoris This is the first report of a GAP pro-moter operable dominant selective optimized constitutiveintracellular expression of recombinant SK in S cerevisiae
31 Construction of Recombinant Expression Vectors ThepB2ZB2 plasmid contains the PGAP-skc-AOXTT cassettewild-type histidinol dehydrogenase (HIS4) gene for lin-earized integration into host genome and Zeocin cassette bi-functional in both S cerevisiae and E coli for the selection
SapIEcoRINarI
HIS4
BspEI
skc gene
Amp (frag) ZeocinpEM7
Agel
pUC ori cyc1 TT
3998400 AOX TT
pTEF1
NotISacII6X His
C-myc epitope
pGAP
pB2ZB2-SK7431bp
Figure 1 Plasmidmap of expression vector pB2ZB2-SK constructedto express streptokinase in S cerevisiae 125 Kbp skc gene is operablycloned downstream to GAP promoter generating a recombinantpB2ZB2-SK expression vector Appropriate restriction endonucleasesites are designated
of transformantsThe skc gene was cloned into the pB2ZB2vector generating recombinant expression vector pB2ZB2-SK (Figure 1) The cloning of skc gene downstream of GAPpromoter was confirmed by PCR and nucleotide sequencingGenetic markers like HIS4 and ARG4 of S cerevisiae wereused in episomal and integrative vectors in P pastoris [36]SUC2marker of S cerevisiae was used as dominant selectionin P pastoris [36] Constitutive promoters like PGK1 (Phos-pho Glycerate Kinase) and TDH3 (Triose Phosphate Dehy-drogenase 3) of S cerevisiae have been used for heterologousprotein expression [36 37]
HIS4 locus encoding histidinol dehydrogenase in Ppastoris and S cerevisiae shares more than 50 homology atDNA level NarI restriction site in HIS4 locus was chosen tolinearize the recombinant pB2ZB2-SK vector as the sequencehomology around this site is more than 85 Efficientintegration to S cerevisiae HIS4 locus by homologous recom-binationwithP pastorisHIS4 locuswas successfully achievedIntegration of skc gene expression cassette was confirmed byPCR with promoter- and terminator-specific primers and bysouthern hybridization indicating that the expression of SK isin fact mediated by GAP promoter
32 Generation of Constitutive Saccharomyces-SK ClonesNarI linearized pB2ZB2-SK recombinant vector was used totransform S cerevisiae Saccharomyces transformants inte-grated with the constitutive SK expression cassette wereselected on YPD agar plates containing Zeocin for 3-4 daysat 30∘C (Figure 2(a)) The presence of 15 Kbp PGAP-skc-AOXTT insert in Saccharomyces transformants was confirmedby colony PCR (Figure 2(b)) 85 transformants selected withZeocin were analyzed for SK expression by LNA assay 84transformants had SK expression and the clone (Scerv-SK)with 1050 IUmL is chosen for further experiments Southern
BioMed Research International 5
1 2
(a)
15Kbp
1 2 3 4 5
(b)
Figure 2 Screening of S cerevisiae transformants (a) S cerevisiae transformed with pB2ZB2-SK expression vector were selected on YPD-Zeocin (200 120583gmL) medium Transformants with pB2ZB2-SK vector (Lane 1) untransformed S cerevisiae (Lane 2) (b) Colony PCR (P3and P4 primers) of Saccharomyces transformants selected on YPD Zeocin medium Untransformed S cerevisiae (Lane 1) transformants with15 Kbp skc expression cassette fragments (Lanes 2 3 4 and 5) and 025ndash120 Kbp DNA ladder (Lane 6)
hybridization analysis of the Scerv-SK probed with PGAP-skc-AOXTT DNA fragment generated a 163 Kbp product(Figure 4)
33 Growth and Expression Profile A comparative growthexpression analysis was performed between normal andbaffled-flask cultures Quantification of SK activity by plas-minogen activation assay using cell lysates indicated anexpression level of 1050 IUmL in a normal flask and1300 IUmL for a baffled flask (Figure 3(a)) All the mediaoptimization experiments were conducted with baffle-flaskdesign
Stability and integration of skc gene in the Saccharomycesclone expressing SK were analyzed by southern blot analysis163 Kbp band is consistently seen from 24 to 120 hrs indicat-ing stability of the continuously cultured clone (Figure 4)
The toxicity of continuous expression of SK on the hostcells harboring the plasmids pB2ZB2-SK and pB2ZB2 andparent untransformed cells was investigated by comparingthe growth rate No significant difference in growth rate ofS cerv-SK clone compared with the controls was observed(Figure 3(b)) The above data indicates a correlation betweenthe time of onset of expression of SK with an increase in thegrowth rate suggesting that the expression of SK is not toxicto the host Qualitative and quantitative analyses of rSK in celllysis supernatant were performed by caseinolytic assay andplasminogen activation assay (S-2251 substrate) at differenttime intervals of growth The results indicate that expressionof rSK is observed from day 1 and is maintained till the endof the experiment
34 Carbon and Nitrogen Sources Screening by Plackett-Burman Design Plackett-Burman statistical design was usedto test various carbon (dextrose sucrose fructose maltosegalactose lactose and glycerol) and nitrogen sourcesrsquo (yeastextract tryptone peptone casamino acids beef extract cornsteep liquor and polypeptone) effect on SK production
Pareto charts (Figures 6 and 7) were used to showthe effect of various carbon and nitrogen sources on SKproduction It is evident from Figure 6 that dextrose has asignificant effect on SK production The SK production ina normal flask was 1050 IUmL and 1300 IUmL in a baffled
flask resulting in that dextrose is the most significant carbonsource for SK production in a baffled flask On the other handglycerol had least effect on SK production with yields 310 and440 IUmL in normal and baffled flasks respectively Furtherthe influence of different nitrogen sources on SK productionhas been shown in Figure 7 Yeast extract wasmost influentialwith 1410 and 1100 IUmL of SK production in baffled andnormal flasks respectively From Figures 6 and 7 it is clearlyevident that the shape of the flask has a significant effecton the amount of SK produced in confirmative lines withthe work done by Villatte et al [29] Results indicate thatPB design is a powerful technique to identify carbon andnitrogen sources for better SK production Further CCD andRSM were used to identify the exact optimal values of theindividual parameter
35 Optimization of SK Production Medium Conditions byDesign of Experiments and RSM Experiments 16 15 14 and 2(supplementary Table S4) resulted in amaximumproductionof SK with 2350 2150 2100 and 2100 IUmL respectivelyamong all combinations Four critical independent variablesyeast extract dextrose pH and temperature were chosen tooptimize the production of SK by S cerevisiae Experimentswere performed according to the CCD experimental designgiven in supplementary Table S5 in order to search for theoptimum combination of components of the medium
From supplementary Table S5 (model summary) coeffi-cient of determination (1198772) 0816 indicates fitness of modelwhich means that the statistical model can explain 816 ofvariability in the response for SK production The 1198772 valueshould always be between 0 and 1 and the closer the 1198772value to 1 the stronger the model to predict the responseThe adjusted 1198772 value is another one (supplementary TableS5) which corrects the 1198772 value for the sample size and forthe number of terms in the model Here the adjusted 1198772value is 0645 indicating better fitness of the model used foroptimization by RSM [38 39] The value of adjusted 1198772 issmaller than 1198772 if the model has many terms and the samplesize is small The values of adjusted 1198772 0645 1198772 0816and the coefficient of variation CV = 1113 indicate thatthe model can predict precise values from the experimentscarried out for SK production
6 BioMed Research International
0
200
400
600
800
1000
1200
0
5
10
15
20
25
30
35
40
45
24 48 72 96 120Time (hrs)
ODrSK activity
OD600
SK ac
tivity
(IU
mL)
(a)
0
10
20
30
40
50
Culture time (hrs)
Scerevisiae INVSc1Scerevisiae pB2ZB2Scerevisiae pB2ZB2-SK
OD600
24 48 72 96 120
(b)
Figure 3 (a) Plasminogen activation assay of rSK Growth profile and outline of SK expression of S cerevisiae clone Cells were grown inYPDmedium for 5 days Aliquots of cells were examined at different time intervals for growth and SK activity in the cell lysis supernatant bychromogenic assay using S-2251 substrate (b) Expression of rSK has no toxic effect on the growth rate of the S cerevisiae host S cerevisiaeINVSc1 cells were transformed with parent plasmids and recombinant expression vector pB2ZB2-SK Cells were cultured in YPD brothand aliquots were withdrawn at indicated time points up to 120 hrs OD600 recorded and plotted The above data is a mean of three to sixindependent experiments
163Kbp
1 2 3 4 5
Figure 4 Southern blot analyses of S cerevisiae-SK clone Genomic635 DNA of the clone was restricted with SapIAgeI enzymes blot-ted and hybridized with 12057232P-labelled 163 Kbp PGAP-skc-AOXTTcassette fragment S cerevisiae clone genomic DNA extracted at24 (Lane 2) 72 (Lane 3) 96 (Lane 4) and 120 hrs (Lane 5) anduntransformed S cerevisiae genomic DNA (Lane 1) 163 Kbp PGAP-skc-AOXTT cassette fragment is specified
1 2 3
Figure 5 Fibrin agarose indicator gel Untransformed S cerevisiaecell lysate (Lane 1) commercial SK (lane 2) and rSK expressed in Scerevisiae SK clone (Lane 3)
Multiple regression analysis was carried out on CCDexperimental data and a second-order full polynomial equa-tion was fitted Equation (5) gives the empirical relationshipbetween SK production (119884) and four test variables in codedunits
SK (IUmL)0 140012001000800600400200
1
2
3
4
5
6
7
Carb
on so
urce
s
1050 13001000 1100
690 850
680
620500
420 530
310 440
600
Figure 6 Pareto chart for the estimation of influence of differentcarbon sources on SK production (IUmL) by P pastoris (1)dextrose (2) galactose (3) maltose (4) sucrose (5) lactose (6)fructose and (7) glycerol
119884 = 1945 + 89792 lowast 1199091+ 87708 lowast 119909
2+ 53958 lowast 119909
3
minus 35208 lowast 1199094minus 9740 lowast 119909
11199091minus 69063 lowast 119909
11199092
+ 62813 lowast 11990911199093minus 47188 lowast 119909
11199094minus 47240 lowast 119909
21199092
+ 65938 lowast 11990921199093+ 43438 lowast 119909
21199094minus 15990 lowast 119909
31199093
+ 150313 lowast 11990931199094minus 59740 lowast 119909
41199094
(5)
where 119884 is SK production in IUmL 119884 is the response of(5) and 119909
1 1199092 1199093 and 119909
4are the coded values of the test
BioMed Research International 7
SK (IUmL)0 140012001000800600400200
1
2
3
4
5
6
7
Nitr
ogen
sour
ces
1100 1410
13801150
1080 1375
800 1000
740 980
610 800
640536
Figure 7 Pareto chart for the estimation of the influence of differentnitrogen sources on SK production (IUmL) by P pastoris (1)peptone (2) yeast extract (3) polypeptone (4) beef extract (5)tryptone (6) casamino acids and (7) corn steep liquor
variables yeast extract 26 (1199091) dextrose 27 (119909
2) pH
71 (1199093) temperature 30∘C (119909
4)
Results of analysis of variance (ANOVA) carried outon a second-order response surface model are given insupplementary Tables S5 and S6 Studentrsquos 119905-test and 119901 valueswere used to estimate each coefficient (supplementary TablesS5 and S6 Studentrsquos 119905 test and 119901 values were used to estimateeach coTables S5 and S6) Larger 119905-value and smaller 119901 valueare more significant to determine coefficients which meansthat linear effects of yeast extract (119901 lt 0006) and dextrose(119901 lt 0007) and interactive effect of pH and temperature(119901 lt 00001) are significant in SK production
Contour plots are the graphical representation of themodel generated and were drawn to illustrate effects of inde-pendent variables and combined effects of each independentvariable upon response variable Contour plots Figures 8(a)ndash8(f) help in predicting the SK production for different levelsof production medium conditions Infinite combinations oftwo test variables while others held at 0 level are indicatedin contour plots
Figures 8(a)ndash8(c) show the trend of SK production inIUmL with the variation in yeast extract with respect todextrose pH and temperature and the maximum predictedSK production of 2000 2400 and 2000 IUmL respectivelywas observed Figures 8(d) and 8(e) show the trend ofSK production in IUmL with the variation in dextrosewith respect to pH and temperature while a maximum SKproduction was predicted as of 2300 and 1900 respectivelySimilarly Figure 8(f) shows that a maximum of 2300 IUmLSK production was predicted with the variation in pH andtemperature
Regression equation was solved by a numerical method[39 40] and the optimal values of the four test variablesin coded units are 119909
1= minus072 119909
2= 0491 119909
3= 72
and 1199094= minus0681 The predicted value of 119884 (SK produ-
ction IUmL) at these values of 119909rsquos was 246113 IUmLThe real values of the four test variables were obtained by
substituting the respective coded values in (2) and foundto be yeast extract (119909
1) 3215 dextrose (119909
2) 2952 pH
742 (1199093) and temperature 3245 (119909
4) Further optimized SK
productionmedium conditions were validated in 250mL EMflask containing 100mL of productionmedium Experimentswere conducted in triplicates to check the reproducibility ofSK production using optimized conditions The SK produc-tion of 235207 IUmL (average of three experiments) wasobtained at optimal conditions This shows an increase ofalmost 110 than before optimizing experimental conditionsThe experimental value of the SK production was almostequal if we consider 95 of the confidence limits for theprediction of119884 value at optimized conditions with the shake-flask results
36 Streptokinase Expressed in S cerevisiae Is FunctionallyActive Various qualitative and quantitative assays have beendeveloped for the detection of SK activity casein plateassay [32] fibrin plate assay [33] chromogenic assay [19]in vitro clot lysis assay [31] and a combination of theseassays [34] were being proposed to accurately determinethe SK activity Lyticase produced by Arthrobacter luteusconsists of 120573-1 3-glucanase that attacks the 120573-1 3-glucans ina random endolytic approach releasing oligosaccharides in apH-dependent mode [17]
Lyticase-assisted yeast estrogen screening assay was per-formed to evaluate the environmental toxicity of certainchemicals [18] There are many methods available for mea-suring the activity of plasminogen activators changes in clotphysical structure or retainment of trapped bubbles fibrinopacity measurement by lysis zones on plates and changesin OD in microtiter plate formats The common endpoint inthese methods is the time to half lysis Alternative methodsuse radiochemical detection or utilize modified fibrinogenswith chromogenic detection Methods using chromogenicsubstrates have been developed where fibrin is removedbefore OD measurement or involving fibrin (ogen) chemi-cally immobilized to microtiter plates or in the presence ofopaque fibrin [34]
The mechanism of quantification of SK is the conversionof inactive plasminogen to active plasmin form Plasminacts on the chromogenic plasmin substrate D-Val-Leu-Lys-119901-nitroanilide and liberates 119901-nitroaniline upon cleavage [19]Cell lysis supernatant containing SK obtained by lyticasetreatment was analyzed for plasminogen activation capabilityby S-2251 chromogenic assay Spectrophotometric calibrationof cell density at OD
600was determined by direct counting in
a hemocytometer or by serial titration on YPD Zeocin agarplates for viable colonies
The biologically active nature of rSK expressed in Scerevisiae was further analyzed by a fibrin agarose indicatorclearing assay after resolving the crude protein by SDS-PAGE(Figure 5) SK resolved in PAGE activates the plasminogenin non-enzymatic mode in the agar gel to plasmin Plasmindissolves the fibrin clot formed in the agar gel evident byclear bands indicating the fibrinolytic activity 47 kDa formof constitutively expressing SK is functional In vitro clot lysis
8 BioMed Research International
260024002200200018001600140012001000
215 1
050minus05
minus1
minus15minus2
SK (I
Um
L)
Dextrose (wv)
2151050minus05
minus1minus15
minus2 Yeast extract (w
v)
2000
1800
1600
1400
1200
(a)
2600240022002000180016001400
215
105
0minus05
minus1minus15
minus2
SK (I
Um
L)
2151050minus05
minus1minus15
minus2Yeast e
xtract (wv)
pH
gt2200
lt2200
lt2000
lt1800
lt1600
(b)
2400220020001800160014001200
215
105
0minus05
minus1minus15
minus2
SK (I
Um
L)
2151050
minus05minus1
minus15minus2 Yeast e
xtract (wv)
Temperature ( ∘C)
gt2000
lt2000
lt1800
lt1600
lt1400
(c)
2400220020001800160014001200
SK (I
Um
L)
pH
Dextrose (wv)
215
105
0minus05
minus1minus15
minus2
2151050
minus05minus1
minus15minus2
gt2200
lt2200
lt2000
lt1800
lt1600
lt1400
(d)
260024002200200018001600140012001000
SK (I
Um
L)
Dextrose (wv)
215
105
0minus05
minus1minus15
minus2
2151050
minus05minus1
minus15minus2
Temperature ( ∘C)
gt1800
lt1700
lt1500
lt1300
lt1100
(e)
260024002200200018001600140012001000
800600
SK (I
Um
L)
215
105
0minus05
minus1minus15
minus2
2151050
minus05minus1
minus15minus2
Temperature ( ∘C)pH
gt2200
lt2100
lt1900
lt1700
lt1500
lt1300
lt1100
lt900
(f)
Figure 8 ((a)ndash(f)) 3D surface and contour plots of SK production by Pichia pastoris (IUmL) the effect of two variables while the other twoare held at 0 level
BioMed Research International 9
Table 1 Stability of intracellularly expressed SK in S cerevisiae celllysates
Storage temperaturea Functional activityb inCell lysis supernatant
minus20∘C 1000∘C 944∘C 8625∘C 937∘C mdash42∘C mdashaCell lysis supernatant of Saccharomyces clone expressing SK was stored atabove temperatures for duration of 96 hrsbFunctional activity was assayed by in vitro clot lysis method and is a meanof three assays
assay [34] was also used to confirm the biologically activenature of the rSK
37 Stability of SK Stability studies using cell lysate of Scerevisiae expressing rSK at minus20∘C 4∘C 25∘C 37∘C and 42∘Cindicated the presence of plasminogen activation efficiency atminus20∘C 0∘C and 4∘C (Table 1) Similar results were obtainedfrom rSK expressed in P pastoris and with SK purified fromE coli that was used as control
The level of SK activity achieved by constitutive intracel-lular expression in S cerevisiae is 2352 IUmL compared tothat of Schizosaccharomyces pombe (2450 IUmL) [9] and Ppastoris (3200 IUmL and 2089 IUmL) [7 14]The optimiza-tion of nutrients at shake flask level is to be extrapolated tobioreactor level to obtain large-scale production of rSK Con-tinuous constitutive bioreactor culture is being investigatedto achieve rSK expression at industrial scale
4 Conclusion
In conclusion we have accomplished constitutively express-ing rSK intracellularly in S cerevisiae using P pastorisexpression backboneThe expressed SKprotein (2352 IUmL)on fibrin-plate zymography and chromogenic assay exhib-ited plasminogen activation property Continuous cultivationbioreactor and purification strategies are being devised toobtain a protein of homogeneity
Abbreviations
SK StreptokinaseGAP Glyceraldehyde 3-phosphate dehydrogenaseAOX Alcohol oxidaseHRP Horse radish peroxidaseHIS4 Histidinol dehydrogenaseRSM Response surface methodology
Conflict of Interests
All the authors of this paper disclose that there is no conflictof interest between companiesorganizations and for thematerial used and discussed in the present work
Acknowledgments
This study was supported by a funding under the TechnologyEducation Quality Improvement Program (TEQIP) by theWorld Bank to the Centre for Biotechnology JawaharlalNehru Technological University (JNTU) Hyderabad IndiaRavi N Vellanki acknowledges the Council of Scientific andIndustrial Research (CSIR) Government of India for theSenior Research Fellowship (SRF)
References
[1] A Banerjee Y Chisti and U C Banerjee ldquoStreptokinasemdashaclinically useful thrombolytic agentrdquo Biotechnology Advancesvol 22 no 4 pp 287ndash307 2004
[2] H Sun Y Xu I Sitkiewicz et al ldquoInhibitor of streptokinasegene expression improves survival after group A streptococcusinfection in micerdquo Proceedings of the National Academy ofSciences of the United States of America vol 109 no 9 pp 3469ndash3474 2012
[3] D Xavier P Pais P Devereaux et al ldquoTreatment and outcomesof acute coronary syndromes in India (CREATE) a prospectiveanalysis of registry datardquoTheLancet vol 371 no 9622 pp 1435ndash1442 2008
[4] K Balaraman and G Prabakaran ldquoProduction and purificationof a fibrinolytic enzyme (thrombinase) from Bacillus sphaeri-cusrdquo Indian Journal of Medical Research vol 126 no 5 pp 459ndash464 2007
[5] R R Chitte S V Deshmukh and P P Kanekar ldquoProduc-tion purification and biochemical characterization of a fib-rinolytic enzyme from thermophilic Streptomyces sp MCMB-379rdquo Applied Biochemistry and Biotechnology vol 165 no 5-6pp 1406ndash1413 2011
[6] M Ueda T Kubo K Miyatake and T Nakamura ldquoPurificationand characterization of fibrinolytic alkaline protease fromFusarium sp BLBrdquoAppliedMicrobiology and Biotechnology vol74 no 2 pp 331ndash338 2007
[7] R N Vellanki R Potumarthi and L N Mangamoori ldquoCon-stitutive expression and optimization of nutrients for streptok-inase production by Pichia pastoris using statistical methodsrdquoApplied Biochemistry and Biotechnology vol 158 no 1 pp 25ndash40 2009
[8] E Pimienta J C Ayala C Rodrıguez et al ldquoRecombinantproduction of Streptococcus equisimilis streptokinase by Strepto-myces lividansrdquoMicrobial Cell Factories vol 6 article 20 2007
[9] F S HartnerFS C Ruth D Langenegger et al ldquoPromoterlibrary designed for fine-tuned gene expression in Pichia pas-torisrdquo Nucleic Acids Research vol 36 no 12 article e76 2008
[10] O Cos R Ramon J L Montesinos and F Valero ldquoOperationalstrategies monitoring and control of heterologous proteinproduction in the methylotrophic yeast Pichia pastoris underdifferent promoters a reviewrdquo Microbial Cell Factories vol 5article 17 2006
[11] A L Zhang J X Luo T Y Zhang et al ldquoRecent advances ontheGAP promoter derived expression systemofPichia pastorisrdquoMolecular Biology Reports vol 36 no 6 pp 1611ndash1619 2009
[12] R N Vellanki N Komaravelli R Tatineni and L N Mang-amoori ldquoExpression of hepatitis B surface antigen in Saccha-romyces cerevisiae utilizing glyceraldeyhyde-3-phosphate dehy-drogenase promoter of Pichia pastorisrdquo Biotechnology Lettersvol 29 no 2 pp 313ndash318 2007
10 BioMed Research International
[13] M J Hagenson K A Holden K A Parker et al ldquoExpressionof streptokinase in Pichia pastoris yeastrdquo Enzyme and MicrobialTechnology vol 11 no 10 pp 650ndash656 1989
[14] J Pratap G Rajamohan and K L Dikshit ldquoCharacteristicsof glycosylated streptokinase secreted from Pichia pastorisenhanced resistance of SK to proteolysis by glycosylationrdquoApplied Microbiology and Biotechnology vol 53 no 4 pp 469ndash475 2000
[15] R Kumar and J Singh ldquoExpression and secretion of a prokary-otic protein streptokinase without glycosylation and degrada-tion in Schizosaccharomyces pomberdquo Yeast vol 21 no 16 pp1343ndash1358 2004
[16] R Ovalle M Spencer M Thiwanont and P N Lipke ldquoThespheroplast lysis assay for yeast in microtiter plate formatrdquoApplied and Environmental Microbiology vol 65 no 8 pp3325ndash3327 1999
[17] J H Scott and R Schekman ldquoLyticase endoglucanase andprotease activities that act together in yeast cell lysisrdquo Journalof Bacteriology vol 142 no 2 pp 414ndash423 1980
[18] T Schultis and J W Metzger ldquoDetermination of estrogenicactivity by LYES-assay (yeast estrogen screen-assay assisted byenzymatic digestion with lyticase)rdquo Chemosphere vol 57 no 11pp 1649ndash1655 2004
[19] E S Kulisek S E Holm and K H Johnston ldquoA chromogenicassay for the detection of plasmin generated by plasmino-gen activator immobilized on nitrocellulose using a para-nitroanilide synthetic peptide substraterdquo Analytical Biochem-istry vol 177 no 1 pp 78ndash84 1989
[20] R L Plackett and J P Burman ldquoThe design of optimummultifactorial experimentsrdquo Biometrika vol 33 no 4 pp 305ndash325 1946
[21] S Akhnazarova and V Vafarov Experiment Optimizationin Chemistry and Chemical Engineering Mir PublicationsMoscow Russia 1982
[22] RHMyers andDCMontgomery ldquoResponse surfacemethod-ologyrdquo in Process and Product Optimization Using DesignedExperiments Wiley-Interscience New York NY USA 1995
[23] A I Khuri and J A Cornell Response Surfaces Design andAnalysis Marcel Dekker New York NY USA 1987
[24] S Sharma A Malik and S Satya ldquoApplication of response sur-face methodology (RSM) for optimization of nutrient supple-mentation for Cr (VI) removal by Aspergillus lentulus AML05rdquoJournal of Hazardous Materials vol 164 no 2-3 pp 1198ndash12042009
[25] C Gasparetti P Buzzini M R Cramarossa B Turchetti UM Pagnoni and L Forti ldquoApplication of the response surfacemethodology (RSM) for optimizing the production of volatileorganic compounds (VOCs) by Trichosporon moniliiformerdquoEnzyme and Microbial Technology vol 39 no 6 pp 1341ndash13462006
[26] R Potumarthi L Jacques W Harry and M Danquah ldquoSur-face immobilization of Rhizopus oryzae (ATCC 96382) forenhanced production lipase enzyme by multiple responsesoptimizationrdquoAsia-Pacific Journal of Chemical Engineering vol7 no 3 supplement pp S285ndashS295 2012
[27] R Potumarthi G Mugeraya and A Jetty ldquoBiological treatmentof toxic petroleum spent caustic in fluidized bed bioreactorusing immobilized cells of Thiobacillus RAI01rdquo Applied Bio-chemistry and Biotechnology vol 151 no 2-3 pp 532ndash546 2008
[28] R Potumarthi C Subhakar A Pavani and A Jetty ldquoEvalu-ation of various parameters of calcium-alginate immobiliza-tion method for enhanced alkaline protease production by
Bacillus licheniformis NCIM-2042 using statistical methodsrdquoBioresource Technology vol 99 no 6 pp 1776ndash1786 2008
[29] F Villatte A S Hussein T T Bachmann and R D SchmidldquoExpression level of heterologous proteins in Pichia pastoris isinfluenced by flask designrdquo Applied Microbiology and Biotech-nology vol 55 no 4 pp 463ndash465 2001
[30] C S Hoffman and FWinston ldquoA ten-minute DNA preparationfrom yeast efficiently releases automomous plasmids for trans-formation of Escherichia colirdquoGene vol 57 no 2-3 pp 267ndash2721987
[31] L T Couto J L Donato and G de Nucci ldquoAnalysis of fivestreptokinase formulations using the euglobulin lysis test andthe plasminogen activation assayrdquo Brazilian Journal of Medicaland Biological Research vol 37 no 12 pp 1889ndash1894 2004
[32] A Granelli-Piperno and E Reich ldquoA study of proteases andprotease-inhibitor complexes in biological fluidsrdquo Journal ofExperimental Medicine vol 148 no 1 pp 223ndash234 1978
[33] H Malke and J J Ferretti ldquoStreptokinase cloning expressionand excretion by Escherichia colirdquo Proceedings of the NationalAcademy of Sciences of the United States of America vol 81 no11 pp 3557ndash3561 1984
[34] C Longstaff and C MWhitton ldquoA proposed reference methodfor plasminogen activators that enables calculation of enzymeactivities in SI unitsrdquo Journal of Thrombosis and Haemostasisvol 2 no 8 pp 1416ndash1421 2004
[35] US Pharmacopeial Convention Inc United States Pharma-copeia 27National Formulary 22 US Pharmacopeial Conven-tion Inc Rockville Md USA 2004
[36] T TWang J Y Choi and BH Lee ldquoTransformation systems ofnon-Saccharomyces yeastsrdquo Critical Reviews in Biotechnologyvol 21 no 3 pp 177ndash218 2001
[37] V Nacken T Achstetter and E Degryse ldquoProbing the limitsof expression levels by varying promoter strength and plasmidcopy number in Saccharomyces cerevisiaerdquo Gene vol 175 no 1-2 pp 253ndash260 1996
[38] G E P Box W G Hunter and J S Hunter Statistics forExperimenters John Wiley amp Sons New York NY USA 1978
[39] W G Cochran and G M Cox Eds Experimental Design JohnWiley amp Sons New York NY USA 1957
[40] D Montgomery Design and Analysis of Experiments JohnWiley amp Sons New York NY USA 2001
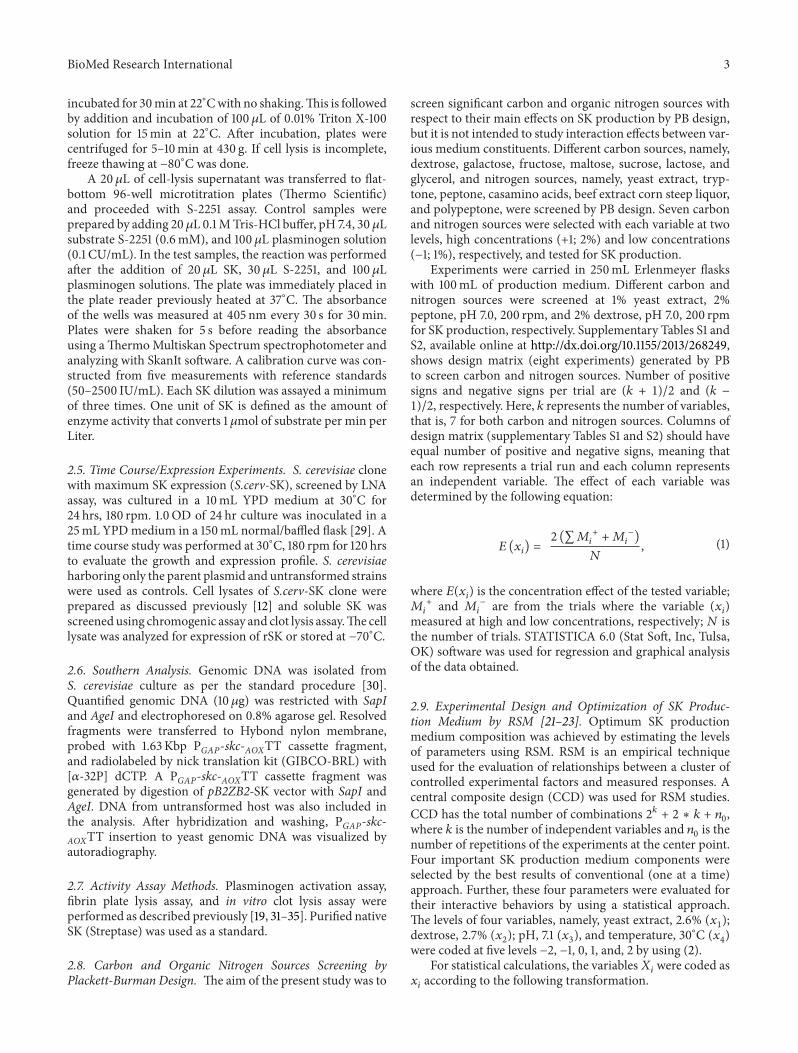
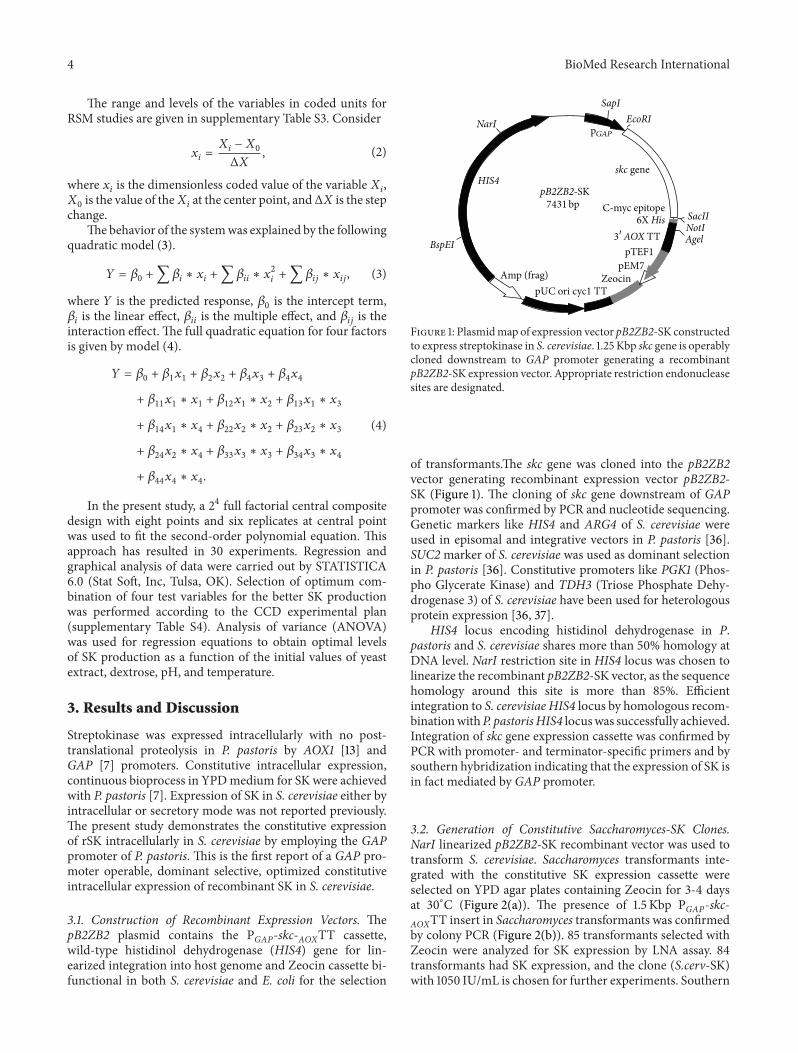
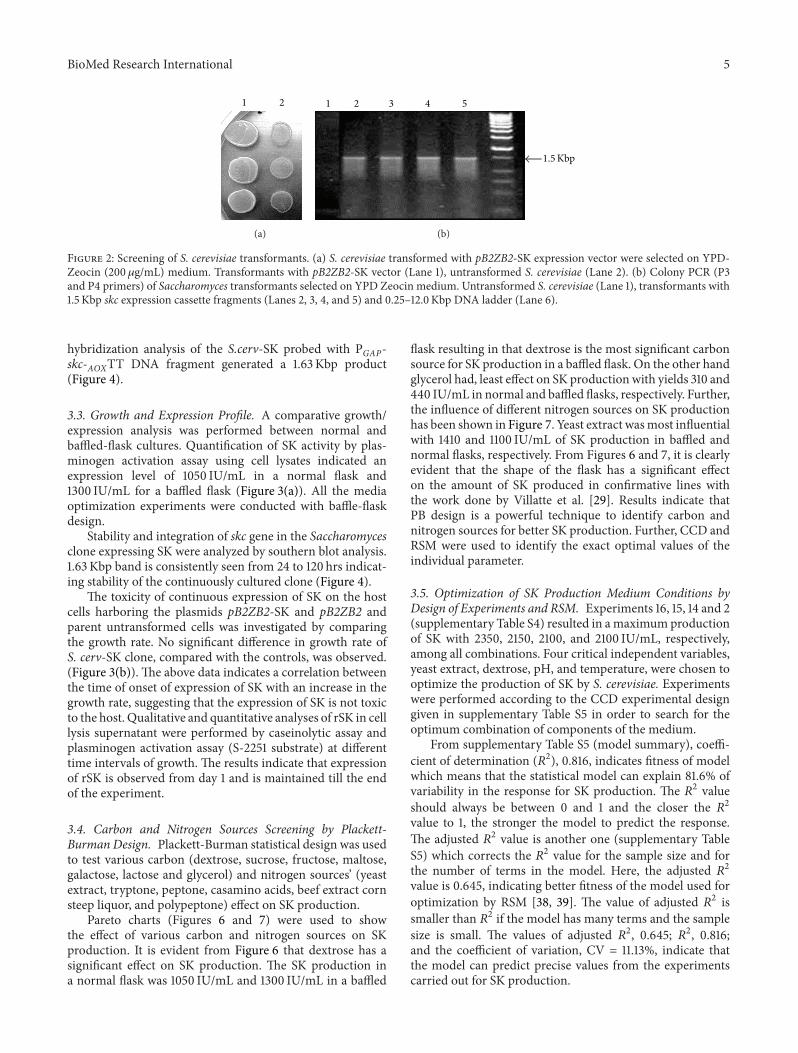
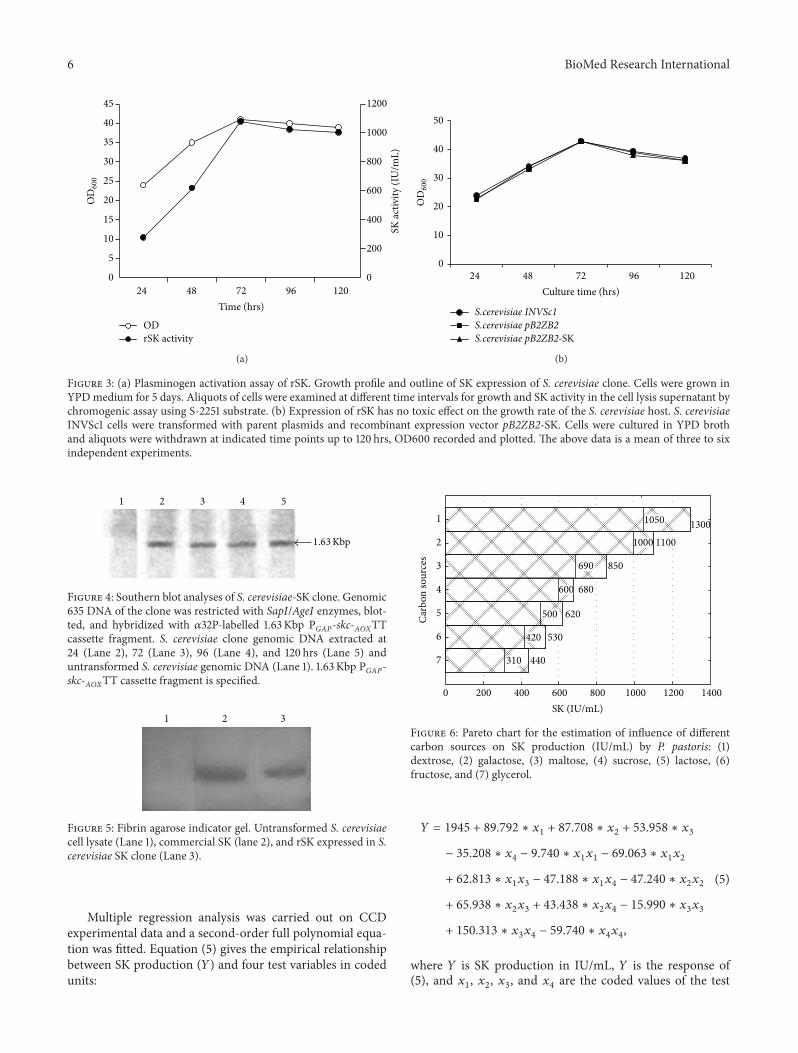
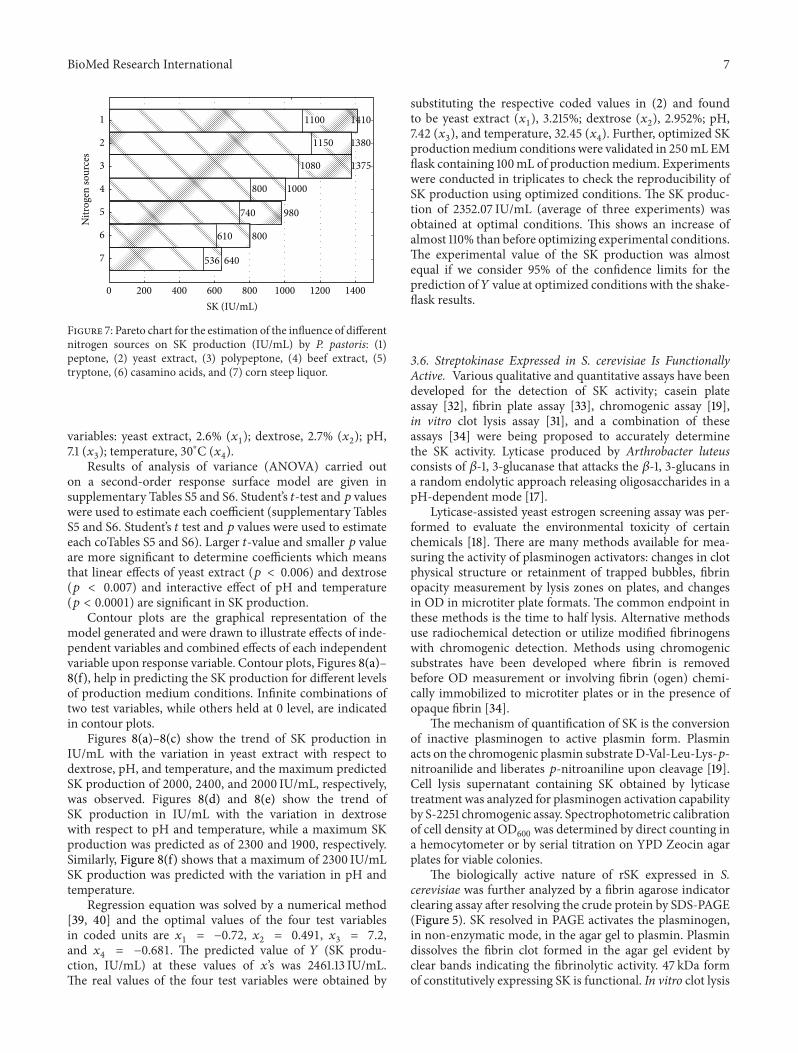
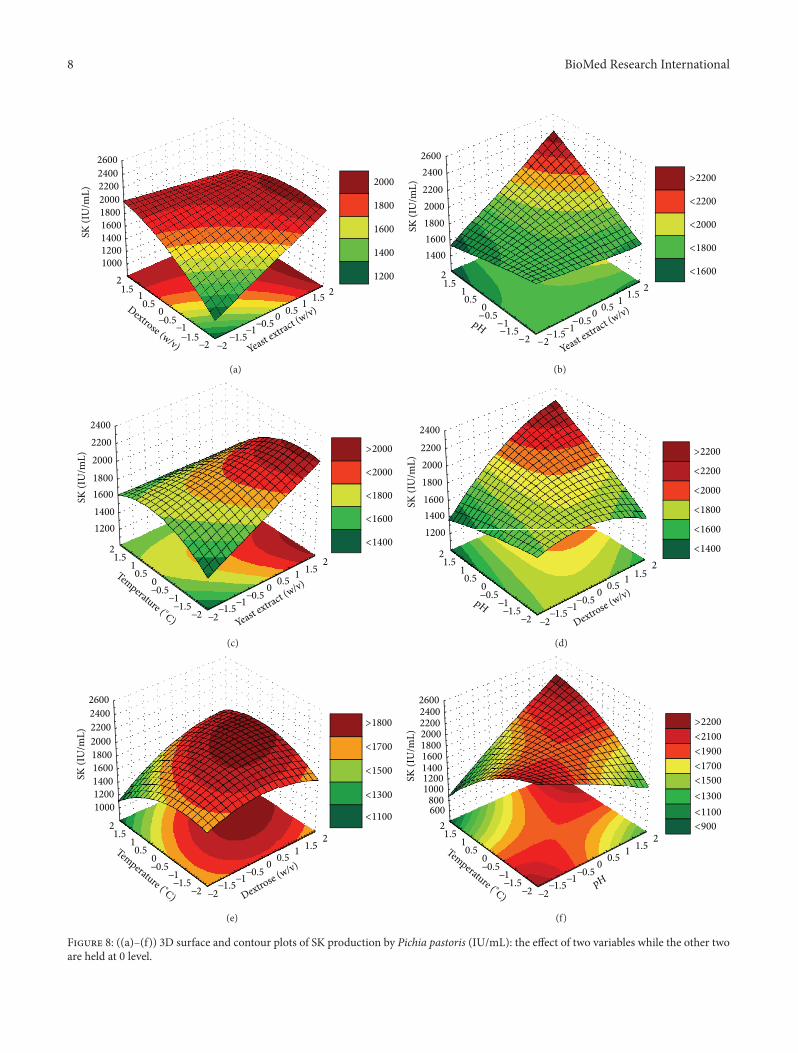
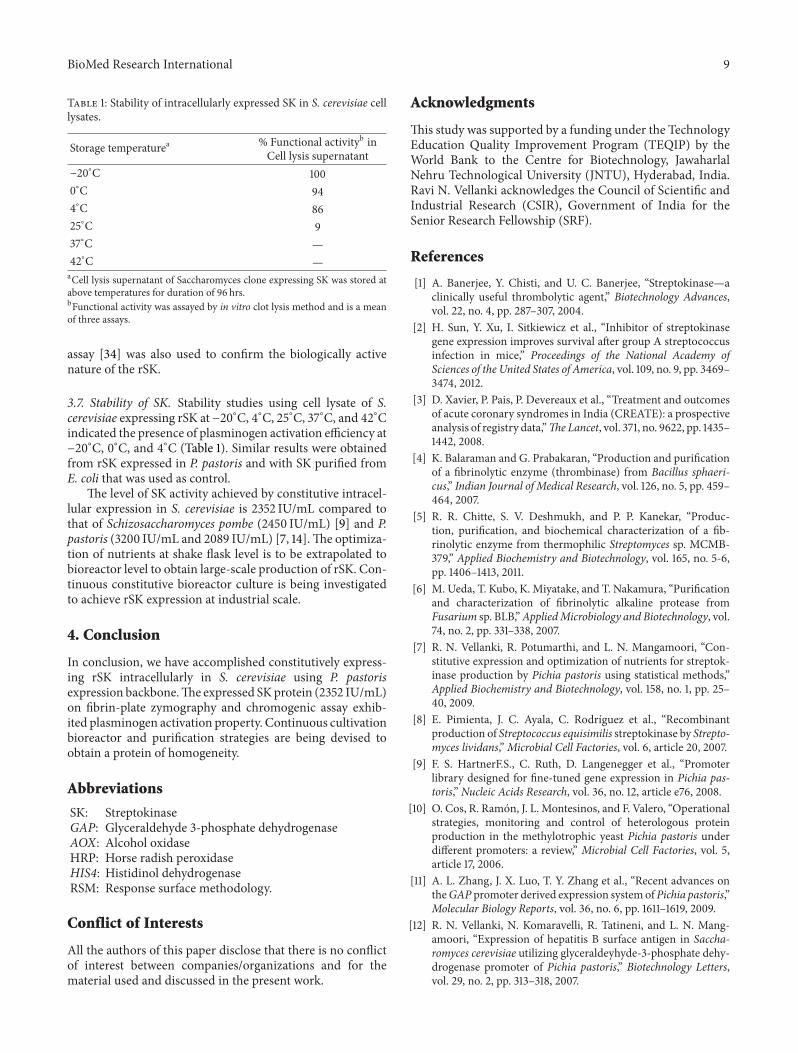
Related Documents