Constituents of the stems of Macrococculus pomiferus and their inhibitory activities against cyclooxygenases-1 and -2 Bao-Ning Su a,1 , William P. Jones a,1 , Muriel Cuendet a , Leonardus B.S. Kardono b , Rachman Ismail c , Soedarsono Riswan c , Harry H.S. Fong a , Norman R. Farnsworth a , John M. Pezzuto a,2 , A. Douglas Kinghorn a, * ,1 a Program for Collaborative Research in the Pharmaceutical Sciences and Department of Medicinal Chemistry and Pharmacognosy, College of Pharmacy, University of Illinois at Chicago, Chicago, IL 60612, USA b Research Center for Chemistry, Indonesian Institute of Science, Serpong 15310, Tangerang, Indonesia, and Herbarium Bogoriense, Indonesia c Research Center for Biology, Indonesian Institute of Science, 16122 Bogor, Indonesia Received 31 March 2004; received in revised form 29 June 2004 Available online 23 September 2004 Dedicated to Prof. Dr. Kurt Hostettmann on the occasion of his 60th birthday Abstract As part of our program directed towards the discovery of new cancer chemopreventive agents from plants, the EtOAc-soluble extract of the stems of M. pomiferus was found to inhibit the enzyme cyclooxygenase-2 (COX-2). Bioassay-directed fractionation of this extract led to the isolation of two dibenzylbutyrolactone lignans, (8R,8 0 R)-3 0 -O-demethyl-5-hydroxymatairesinol (1) and (8R,8 0 R)-3 0 -O-demethyl-5-methoxymatairesinol (2), as well as seven known compounds, ()-5 0 -methoxyyatein (3), blumenol A, ()-deoxypodophyllotoxin (anthricin), ()-deoxypodorhizone, 2,6-dimethoxyhydroquinone, 4-hydroxybenzaldehyde, and b-sito- sterol glucoside. The structures of compounds 1 and 2 were determined using spectroscopic data (1D and 2D NMR, and HREIMS), and the 8R and 8 0 R absolute stereochemistry was established for both 1 and 2 on the basis of their CD spectra. All isolates obtained in the present study were evaluated for their inhibitory effects with both COX-1 and -2. Of these, only 5 0 -methoxyyatein (3) showed weak activity against COX-2, while all other compounds isolated were inactive. The COX-2 inhibitory activity of the EtOAc extract was also traced to the presence of several common fatty acids by LC–MS. Ó 2004 Elsevier Ltd. All rights reserved. Keywords: Macrococculus pomiferus; Menispermaceae; (8R,8 0 R)-3 0 -O-Demethyl-5-hydroxymatairesinol; (8R,8 0 R)-3 0 -O-Demethyl-5-methoxyma- tairesinol; Cyclooxygenases-1 and -2; LC–MS analysis 1. Introduction An increase in prostaglandin (PG) synthesis may influence tumor growth in both humans and experimen- tal animals (Karmali, 1980), and numerous studies have illustrated the effect of PG synthesis on carcinogen metabolism, tumor cell proliferation, and metastatic potential (Marnett, 1992; Levy, 1997). As a result, inhi- bition of PG synthesis has been investigated as a means of preventing tumor development (Levy, 1997). PGs 0031-9422/$ - see front matter Ó 2004 Elsevier Ltd. All rights reserved. doi:10.1016/j.phytochem.2004.08.007 * Corresponding author. Tel.: +1 614 247 8094; fax: +1 614 247 8081. E-mail address: [email protected] (A. Douglas Kinghorn). 1 Present address: College of Pharmacy, The Ohio State University, Columbus, OH 43210, USA. 2 Present address: Heine Pharmacy Building, Purdue University, West Lafayette, IN 47907, USA. www.elsevier.com/locate/phytochem Phytochemistry 65 (2004) 2861–2866 PHYTOCHEMISTRY

Welcome message from author
This document is posted to help you gain knowledge. Please leave a comment to let me know what you think about it! Share it to your friends and learn new things together.
Transcript
www.elsevier.com/locate/phytochem
Phytochemistry 65 (2004) 2861–2866
PHYTOCHEMISTRY
Constituents of the stems of Macrococculus pomiferus andtheir inhibitory activities against cyclooxygenases-1 and -2
Bao-Ning Su a,1, William P. Jones a,1, Muriel Cuendet a, Leonardus B.S. Kardono b,Rachman Ismail c, Soedarsono Riswan c, Harry H.S. Fong a, Norman R. Farnsworth a,
John M. Pezzuto a,2, A. Douglas Kinghorn a,*,1
a Program for Collaborative Research in the Pharmaceutical Sciences and Department of Medicinal Chemistry and Pharmacognosy, College
of Pharmacy, University of Illinois at Chicago, Chicago, IL 60612, USAb Research Center for Chemistry, Indonesian Institute of Science, Serpong 15310, Tangerang, Indonesia, and Herbarium Bogoriense, Indonesia
c Research Center for Biology, Indonesian Institute of Science, 16122 Bogor, Indonesia
Received 31 March 2004; received in revised form 29 June 2004
Available online 23 September 2004
Dedicated to Prof. Dr. Kurt Hostettmann on the occasion of his 60th birthday
Abstract
As part of our program directed towards the discovery of new cancer chemopreventive agents from plants, the EtOAc-soluble
extract of the stems of M. pomiferus was found to inhibit the enzyme cyclooxygenase-2 (COX-2). Bioassay-directed fractionation of
this extract led to the isolation of two dibenzylbutyrolactone lignans, (8R,8 0R)-3 0-O-demethyl-5-hydroxymatairesinol (1) and
(8R,8 0R)-3 0-O-demethyl-5-methoxymatairesinol (2), as well as seven known compounds, (�)-5 0-methoxyyatein (3), blumenol A,
(�)-deoxypodophyllotoxin (anthricin), (�)-deoxypodorhizone, 2,6-dimethoxyhydroquinone, 4-hydroxybenzaldehyde, and b-sito-sterol glucoside. The structures of compounds 1 and 2 were determined using spectroscopic data (1D and 2D NMR, and HREIMS),
and the 8R and 8 0R absolute stereochemistry was established for both 1 and 2 on the basis of their CD spectra. All isolates obtained
in the present study were evaluated for their inhibitory effects with both COX-1 and -2. Of these, only 5 0-methoxyyatein (3) showed
weak activity against COX-2, while all other compounds isolated were inactive. The COX-2 inhibitory activity of the EtOAc extract
was also traced to the presence of several common fatty acids by LC–MS.
� 2004 Elsevier Ltd. All rights reserved.
Keywords: Macrococculus pomiferus; Menispermaceae; (8R,8 0R)-3 0-O-Demethyl-5-hydroxymatairesinol; (8R,80R)-3 0-O-Demethyl-5-methoxyma-
tairesinol; Cyclooxygenases-1 and -2; LC–MS analysis
0031-9422/$ - see front matter � 2004 Elsevier Ltd. All rights reserved.
doi:10.1016/j.phytochem.2004.08.007
* Corresponding author. Tel.: +1 614 247 8094; fax: +1 614 247
8081.
E-mail address: [email protected] (A. Douglas Kinghorn).1 Present address: College of Pharmacy, The Ohio State University,
Columbus, OH 43210, USA.2 Present address: Heine Pharmacy Building, Purdue University,
West Lafayette, IN 47907, USA.
1. Introduction
An increase in prostaglandin (PG) synthesis may
influence tumor growth in both humans and experimen-tal animals (Karmali, 1980), and numerous studies have
illustrated the effect of PG synthesis on carcinogen
metabolism, tumor cell proliferation, and metastatic
potential (Marnett, 1992; Levy, 1997). As a result, inhi-
bition of PG synthesis has been investigated as a means
of preventing tumor development (Levy, 1997). PGs
2862 B.-N. Su et al. / Phytochemistry 65 (2004) 2861–2866
produced by cyclooxygenases-1 and -2 (COX-1 and
COX-2) are represented by a large series of compounds
which enhance mainly cancer development and progres-
sion, acting as carcinogens or tumor promoters, with
profound effects on carcinogenesis (Lupulescu, 1996).
As part of our program directed towards the discoveryof new cancer chemopreventive agents from plants, the
EtOAc-soluble extract of the stems of Macrococculus
pomiferus Becc. (Menispermaceae) was found to inhibit
the enzyme cyclooxygenase-2 (COX-2). Bioassay-di-
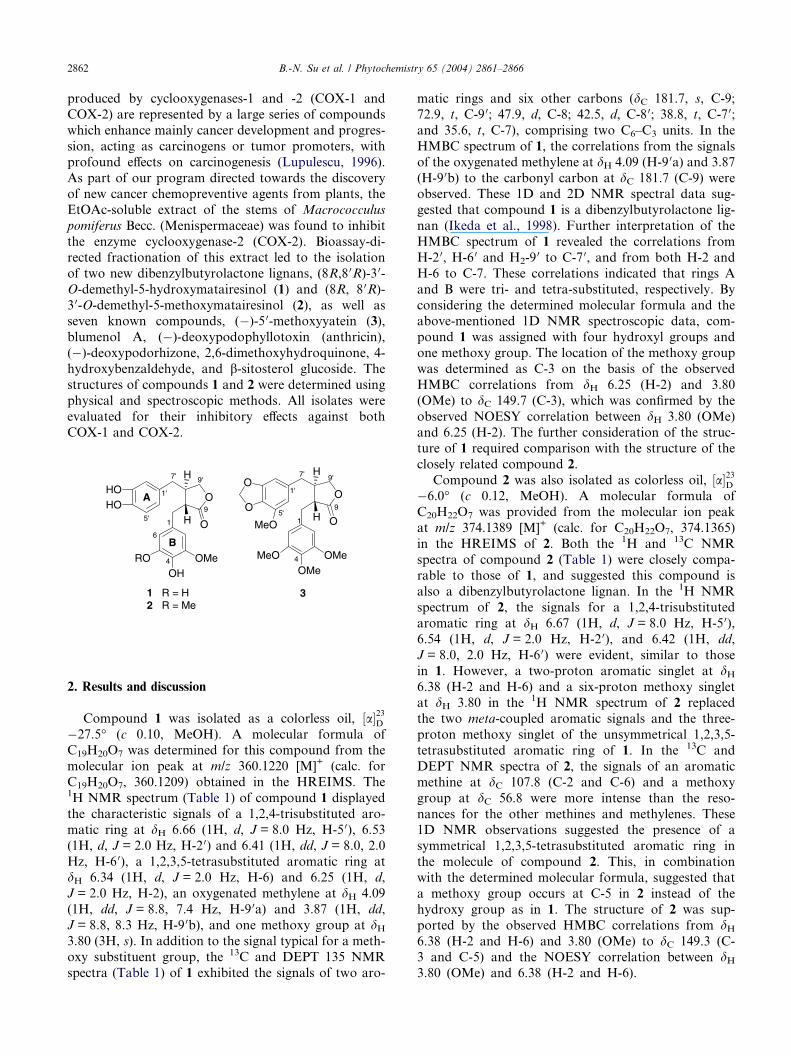
rected fractionation of this extract led to the isolation
of two new dibenzylbutyrolactone lignans, (8R,8 0R)-3 0-
O-demethyl-5-hydroxymatairesinol (1) and (8R, 8 0R)-
3 0-O-demethyl-5-methoxymatairesinol (2), as well asseven known compounds, (�)-5 0-methoxyyatein (3),
blumenol A, (�)-deoxypodophyllotoxin (anthricin),
(�)-deoxypodorhizone, 2,6-dimethoxyhydroquinone, 4-
hydroxybenzaldehyde, and b-sitosterol glucoside. The
structures of compounds 1 and 2 were determined using
physical and spectroscopic methods. All isolates were
evaluated for their inhibitory effects against both
COX-1 and COX-2.
O
O
OHOMeRO
HOHO
H
H1
4
9
1'
5'
7' 9'
O
O
OMeOMeMeO
3
MeO
H
H1
4
9
1'
5'
7' 9'
1 R = H2 R = Me
O
OA
B6
2. Results and discussion
Compound 1 was isolated as a colorless oil, ½a�23D�27.5� (c 0.10, MeOH). A molecular formula ofC19H20O7 was determined for this compound from the
molecular ion peak at m/z 360.1220 [M]+ (calc. for
C19H20O7, 360.1209) obtained in the HREIMS. The1H NMR spectrum (Table 1) of compound 1 displayed
the characteristic signals of a 1,2,4-trisubstituted aro-
matic ring at dH 6.66 (1H, d, J = 8.0 Hz, H-5 0), 6.53
(1H, d, J = 2.0 Hz, H-2 0) and 6.41 (1H, dd, J = 8.0, 2.0
Hz, H-6 0), a 1,2,3,5-tetrasubstituted aromatic ring atdH 6.34 (1H, d, J = 2.0 Hz, H-6) and 6.25 (1H, d,
J = 2.0 Hz, H-2), an oxygenated methylene at dH 4.09
(1H, dd, J = 8.8, 7.4 Hz, H-9 0a) and 3.87 (1H, dd,
J = 8.8, 8.3 Hz, H-9 0b), and one methoxy group at dH3.80 (3H, s). In addition to the signal typical for a meth-
oxy substituent group, the 13C and DEPT 135 NMR
spectra (Table 1) of 1 exhibited the signals of two aro-
matic rings and six other carbons (dC 181.7, s, C-9;
72.9, t, C-9 0; 47.9, d, C-8; 42.5, d, C-8 0; 38.8, t, C-7 0;
and 35.6, t, C-7), comprising two C6–C3 units. In the
HMBC spectrum of 1, the correlations from the signals
of the oxygenated methylene at dH 4.09 (H-9 0a) and 3.87
(H-9 0b) to the carbonyl carbon at dC 181.7 (C-9) wereobserved. These 1D and 2D NMR spectral data sug-
gested that compound 1 is a dibenzylbutyrolactone lig-
nan (Ikeda et al., 1998). Further interpretation of the
HMBC spectrum of 1 revealed the correlations from
H-2 0, H-6 0 and H2-90 to C-7 0, and from both H-2 and
H-6 to C-7. These correlations indicated that rings A
and B were tri- and tetra-substituted, respectively. By
considering the determined molecular formula and theabove-mentioned 1D NMR spectroscopic data, com-
pound 1 was assigned with four hydroxyl groups and
one methoxy group. The location of the methoxy group
was determined as C-3 on the basis of the observed
HMBC correlations from dH 6.25 (H-2) and 3.80
(OMe) to dC 149.7 (C-3), which was confirmed by the
observed NOESY correlation between dH 3.80 (OMe)
and 6.25 (H-2). The further consideration of the struc-ture of 1 required comparison with the structure of the
closely related compound 2.
Compound 2 was also isolated as colorless oil, ½a�23D�6.0� (c 0.12, MeOH). A molecular formula of
C20H22O7 was provided from the molecular ion peak
at m/z 374.1389 [M]+ (calc. for C20H22O7, 374.1365)
in the HREIMS of 2. Both the 1H and 13C NMR
spectra of compound 2 (Table 1) were closely compa-rable to those of 1, and suggested this compound is
also a dibenzylbutyrolactone lignan. In the 1H NMR
spectrum of 2, the signals for a 1,2,4-trisubstituted
aromatic ring at dH 6.67 (1H, d, J = 8.0 Hz, H-5 0),
6.54 (1H, d, J = 2.0 Hz, H-2 0), and 6.42 (1H, dd,
J = 8.0, 2.0 Hz, H-6 0) were evident, similar to those
in 1. However, a two-proton aromatic singlet at dH6.38 (H-2 and H-6) and a six-proton methoxy singletat dH 3.80 in the 1H NMR spectrum of 2 replaced
the two meta-coupled aromatic signals and the three-
proton methoxy singlet of the unsymmetrical 1,2,3,5-
tetrasubstituted aromatic ring of 1. In the 13C and
DEPT NMR spectra of 2, the signals of an aromatic
methine at dC 107.8 (C-2 and C-6) and a methoxy
group at dC 56.8 were more intense than the reso-
nances for the other methines and methylenes. These1D NMR observations suggested the presence of a
symmetrical 1,2,3,5-tetrasubstituted aromatic ring in
the molecule of compound 2. This, in combination
with the determined molecular formula, suggested that
a methoxy group occurs at C-5 in 2 instead of the
hydroxy group as in 1. The structure of 2 was sup-
ported by the observed HMBC correlations from dH6.38 (H-2 and H-6) and 3.80 (OMe) to dC 149.3 (C-3 and C-5) and the NOESY correlation between dH3.80 (OMe) and 6.38 (H-2 and H-6).
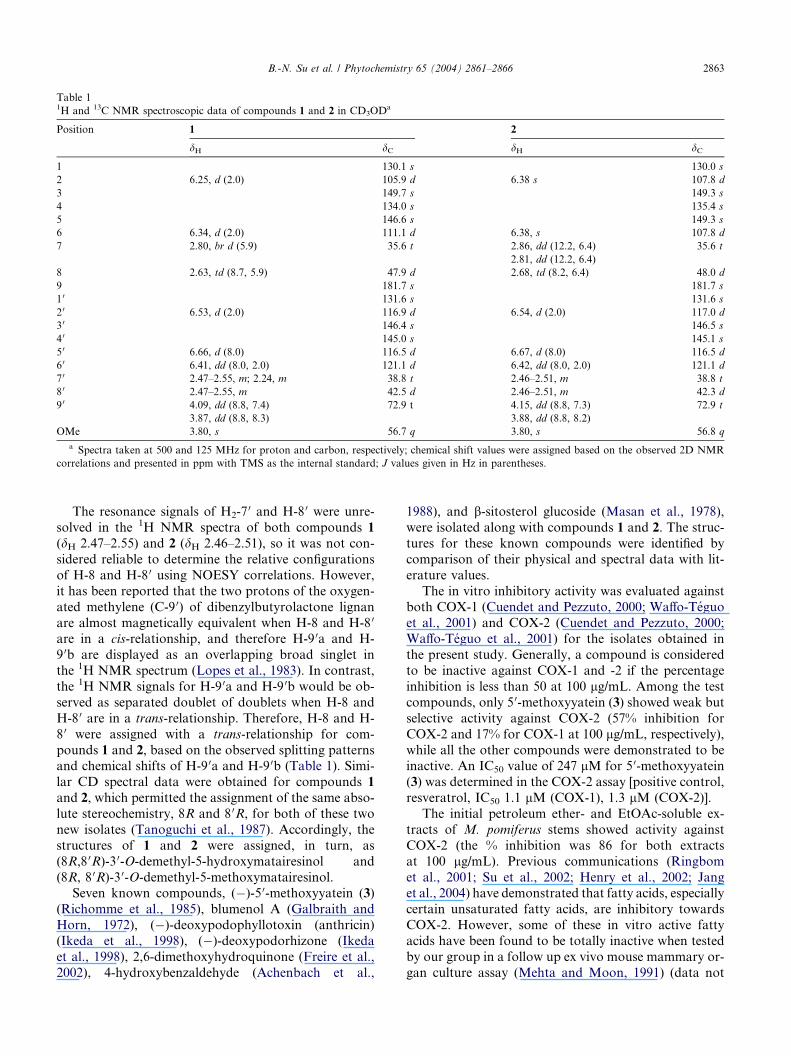
Table 11H and 13C NMR spectroscopic data of compounds 1 and 2 in CD3ODa
Position 1 2
dH dC dH dC
1 130.1 s 130.0 s
2 6.25, d (2.0) 105.9 d 6.38 s 107.8 d
3 149.7 s 149.3 s
4 134.0 s 135.4 s
5 146.6 s 149.3 s
6 6.34, d (2.0) 111.1 d 6.38, s 107.8 d
7 2.80, br d (5.9) 35.6 t 2.86, dd (12.2, 6.4) 35.6 t
2.81, dd (12.2, 6.4)
8 2.63, td (8.7, 5.9) 47.9 d 2.68, td (8.2, 6.4) 48.0 d
9 181.7 s 181.7 s
1 0 131.6 s 131.6 s
2 0 6.53, d (2.0) 116.9 d 6.54, d (2.0) 117.0 d
3 0 146.4 s 146.5 s
4 0 145.0 s 145.1 s
5 0 6.66, d (8.0) 116.5 d 6.67, d (8.0) 116.5 d
6 0 6.41, dd (8.0, 2.0) 121.1 d 6.42, dd (8.0, 2.0) 121.1 d
7 0 2.47–2.55, m; 2.24, m 38.8 t 2.46–2.51, m 38.8 t
8 0 2.47–2.55, m 42.5 d 2.46–2.51, m 42.3 d
9 0 4.09, dd (8.8, 7.4) 72.9 t 4.15, dd (8.8, 7.3) 72.9 t
3.87, dd (8.8, 8.3) 3.88, dd (8.8, 8.2)
OMe 3.80, s 56.7 q 3.80, s 56.8 q
a Spectra taken at 500 and 125 MHz for proton and carbon, respectively; chemical shift values were assigned based on the observed 2D NMR
correlations and presented in ppm with TMS as the internal standard; J values given in Hz in parentheses.
B.-N. Su et al. / Phytochemistry 65 (2004) 2861–2866 2863
The resonance signals of H2-70 and H-8 0 were unre-
solved in the 1H NMR spectra of both compounds 1
(dH 2.47–2.55) and 2 (dH 2.46–2.51), so it was not con-
sidered reliable to determine the relative configurations
of H-8 and H-8 0 using NOESY correlations. However,
it has been reported that the two protons of the oxygen-
ated methylene (C-9 0) of dibenzylbutyrolactone lignan
are almost magnetically equivalent when H-8 and H-8 0
are in a cis-relationship, and therefore H-9 0a and H-
9 0b are displayed as an overlapping broad singlet in
the 1H NMR spectrum (Lopes et al., 1983). In contrast,
the 1H NMR signals for H-9 0a and H-9 0b would be ob-
served as separated doublet of doublets when H-8 and
H-8 0 are in a trans-relationship. Therefore, H-8 and H-
8 0 were assigned with a trans-relationship for com-
pounds 1 and 2, based on the observed splitting patternsand chemical shifts of H-9 0a and H-9 0b (Table 1). Simi-
lar CD spectral data were obtained for compounds 1
and 2, which permitted the assignment of the same abso-
lute stereochemistry, 8R and 8 0R, for both of these two
new isolates (Tanoguchi et al., 1987). Accordingly, the
structures of 1 and 2 were assigned, in turn, as
(8R,8 0R)-3 0-O-demethyl-5-hydroxymatairesinol and
(8R, 8 0R)-3 0-O-demethyl-5-methoxymatairesinol.Seven known compounds, (�)-5 0-methoxyyatein (3)
(Richomme et al., 1985), blumenol A (Galbraith and
Horn, 1972), (�)-deoxypodophyllotoxin (anthricin)
(Ikeda et al., 1998), (�)-deoxypodorhizone (Ikeda
et al., 1998), 2,6-dimethoxyhydroquinone (Freire et al.,
2002), 4-hydroxybenzaldehyde (Achenbach et al.,
1988), and b-sitosterol glucoside (Masan et al., 1978),
were isolated along with compounds 1 and 2. The struc-
tures for these known compounds were identified by
comparison of their physical and spectral data with lit-
erature values.
The in vitro inhibitory activity was evaluated against
both COX-1 (Cuendet and Pezzuto, 2000; Waffo-Teguo
et al., 2001) and COX-2 (Cuendet and Pezzuto, 2000;Waffo-Teguo et al., 2001) for the isolates obtained in
the present study. Generally, a compound is considered
to be inactive against COX-1 and -2 if the percentage
inhibition is less than 50 at 100 lg/mL. Among the test
compounds, only 5 0-methoxyyatein (3) showed weak but
selective activity against COX-2 (57% inhibition for
COX-2 and 17% for COX-1 at 100 lg/mL, respectively),
while all the other compounds were demonstrated to beinactive. An IC50 value of 247 lM for 5 0-methoxyyatein
(3) was determined in the COX-2 assay [positive control,
resveratrol, IC50 1.1 lM (COX-1), 1.3 lM (COX-2)].
The initial petroleum ether- and EtOAc-soluble ex-
tracts of M. pomiferus stems showed activity against
COX-2 (the % inhibition was 86 for both extracts
at 100 lg/mL). Previous communications (Ringbom
et al., 2001; Su et al., 2002; Henry et al., 2002; Janget al., 2004) have demonstrated that fatty acids, especially
certain unsaturated fatty acids, are inhibitory towards
COX-2. However, some of these in vitro active fatty
acids have been found to be totally inactive when tested
by our group in a follow up ex vivo mouse mammary or-
gan culture assay (Mehta and Moon, 1991) (data not
2864 B.-N. Su et al. / Phytochemistry 65 (2004) 2861–2866
shown). During the isolation and identification of cancer
chemopreventive compounds directed using COX-1
and/or -2 assays over the past few years, we have found
a number of plant petroleum ether-soluble extracts to be
COX-1 and COX-2 inhibitory active. However, the ma-
jor active compounds then obtained by further purifica-tion are often fatty acids (Su et al., 2002; Jang et al.,
2004). Identification of individual components in active
fractions, a process often termed ‘‘dereplication’’, typi-
cally employs LC–MS, because of the efficiency of
HPLC separations, and the wide range of compound
polarities that can be ionized using atmospheric pressure
ionization interfaces (Wolfender et al., 1992; Cordell
and Shin, 1999). Thus, for routine dereplication in ourlaboratory, plant extracts have been analyzed using
LC–MS conditions that allow detection of a variety of
active plant metabolites (Constant and Beecher, 1995;
Cordell and Shin, 1999). Although GC–MS is the most
often used method for identification of free fatty acids,
negative-ion electrospray LC–MS has also been used
as a convenient alternative for analysis of fatty acids
in mixtures (Carrier and Parent, 2001). In the presentstudy, linoleic acid, oleic acid, and stearic acid were
demonstrated as the main fatty acid components of
the petroleum ether-soluble extract of M. pomiferus
based on the NMR and LC–MS data (Section 3). There-
fore, only the EtOAc-soluble extract was chosen for fur-
ther purification in this study. The percentage
inhibitions in the COX-2 assay of the six fractions
(F001–F006) obtained from the silica gel column chro-matography of this extract were 84, 65, 53, 4, 0, and 1,
respectively. The most active fraction was the most
non-polar fraction, F001, and the main constituents of
this fraction were also indicated to be fatty acids,
namely, linoleic acid, linolenic acid, oleic acid and stea-
ric acid based on the observed 1D NMR and LC–MS
data. Therefore, the pure compounds obtained in this
study were isolated from fractions F002 and F003.Accordingly, to avoid unnecessary time-consuming
activity-guided fractionation, it is recommended that
fatty acids are removed from plant extracts by defatting
with a suitable solvent prior to their evaluation in the
COX-1 and COX-2 bioassays, and these non-polar ex-
tracts are then subjected to LC–MS dereplication.
3. Experimental
3.1. General
Melting points were determined on a Fisher–Johns
melting point apparatus and are uncorrected. Optical
rotations were measured with a Perkin–Elmer 241 auto-
matic polarimeter. UV spectra were obtained with aBeckman DU-7 spectrometer. IR spectra were run on
an ATI Mattson Genesis Series FT-IR spectrophotome-
ter. CD measurements were performed using a JASCO-
710 CD spectropolarimeter. NMR spectral data were
recorded at room temperature on a Bruker Avance
DPX-300 or DRX-500 MHz spectrometer with tetra-
methylsilane (TMS) as an internal standard. Standard
pulse sequences were employed for the measurement of2D NMR spectra (1H–1H COSY, HMQS, HMBC, and
NOESY). HREIMS and EIMS were performed on a
Finnigan/MAT 90/95 sector-field mass spectrometer.
LC–MS analyses were carried out using an Agilent (Palo
Alto, CA) G1946A LCMSD quadrupole mass spec-
trometer equipped with an 1100 HPLC and an XTerra
MS C18 column (5 lm, 150 · 2.1 mm, Waters, Milford,
MA, USA) fitted with a Sentry C18 guard column (5 lm,10 · 2.1 mm, Waters). The reference compounds, elaidic
acid, linoleic acid, linolenic acid, oleic acid, petroselinic
acid, and stearic acid were purchased from Sigma–Ald-
rich (Milwaukee, WI, USA). Column chromatography
was carried out with Si gel G (Merck, 70–230 or 230–
400 mesh). Analytical thin-layer chromatography
(TLC) was performed on 250 lm thickness Merck Si
gel 60 F254 aluminum plates, while preparative thin-layer chromatography was performed on precoated
500 or 1000 lm thick Merck Si gel 60 F254 glass plates.
3.2. Plant material
The stems (400 g) of M. pomiferus were collected in
Indonesia, in October 2000, and identified by S.R. A
voucher specimen (Accession No. ISNG-3) has beendeposited at the Herbarium Bogoriense, Indonesia Insti-
tute of Science, Bogor, Indonesia.
3.3. Cyclooxygenases-1 and -2 inhibitory assays
Inhibition assays against both cylooxygenase-1 and -
2 were performed by the methods described previously
(Cuendet and Pezzuto, 2000; Waffo-Teguo et al., 2001).
3.4. Extraction and isolation
The dried and milled stems (400 g) were extracted by
maceration with MeOH three times (3 · 4 L) at room
temperature, for two days each. After filtration and
evaporation of the solvent under reduced pressure, the
combined crude methanolic extract was suspended inH2O (500 mL) to yield an aqueous MeOH solution
(�95%), which was then partitioned in turn with petro-
leum ether (3 · 500 mL) and EtOAc (3 · 500 mL), to af-
ford dried petroleum ether-(3.81 g), EtOAc-(2.67 g), and
H2O-soluble (ca. 12 g) extracts. The percentage inhibi-
tion of these three extracts against COX-2 at 10 lg/mL were 86, 86, and 69, respectively.
The EtOAc-soluble extract was chromatographedover a Si gel column (5.0 · 45 cm, 350 g 70–230 mesh
Si gel), and eluted with gradient mixtures of CHCl3–
B.-N. Su et al. / Phytochemistry 65 (2004) 2861–2866 2865
MeOH (from 50:1 to 4:1), to afford six fractions (F001–
F006). The percentage inhibitions at 10 lg/mL of these
fractions against COX-2 assay were 84, 65, 53, 4, 0,
and 1, respectively. The fatty acids, linoleic acid, lino-
lenic acid, oleic acid, and stearic acid were demonstrated
to be the major compounds of the first fraction (F001)by NMR and LC–MS data (see below).
Fraction F002, eluted with CHCl3–MeOH (40:1), was
subjected to Sephadex LH-20 column chromatography
(2.8 · 55 cm) and eluted with MeOH, to give four sub-
fractions (F00201–F00204). The subfraction F00202,
was chromatographed over a Si gel column (2.8 · 30
cm) and eluted with CHCl3–MeOH (40:1), to give a mix-
ture of lignans (identified by 1H and 13C NMR spectralmeasurements), 2,6-dimethoxyhydroquinone (8 mg),
and 4-hydroxybenzaldehyde (7 mg), in order of polarity.
The lignanmixture was then purified by preparative TLC
(Merck 60 A Si gel, 20 · 20 cm, 500 lm), developed with
n-hexane-EtOAc twice, in the ratios of 3:1 and 2:1,
respectively, to afford (�)-deoxypodorhizone (Rf =
0.68; 9.0 mg), (�)-deoxypodophyllotoxin (anthricin)
(Rf = 0.65; 4.4 mg), and (�)-5 0-methoxyyatein (3,Rf = 0.57; 0.5 mg). Fraction F003, eluted with CHCl3–
MeOH (30:1), was chromatographed over a Si gel
column (3.8 · 45 cm) and eluted with petroleum ether–
acetone mixtures of increasing polarity (from 3:1 to
1:1), to give three subfractions (F00301–F00303). Blume-
nol A (5.0 mg) was obtained by purifying F00302 using
preparative TLC (Merck 60 A Si gel, 20 · 20 cm, 500
lm), developed with n-hexane-EtOAc (1:1; Rf = 0.47).Subfraction F00303 was finally purified by preparative
TLC (Merck 60 A Si gel, 20 · 20 cm, 1000 lm), devel-
oped with CHCl3–MeOH (12:1), to afford compounds
1 (Rf = 0.52; 1.3 mg) and 2 (Rf = 0.47; 1.2 mg). The yel-
lowish amorphous powder, b-sitosterol glucoside (58
mg), was obtained from a CHCl3–MeOH (�5:1) solution
of F005, eluted with CHCl3–MeOH (10:1).
3.5. (�)-3 0-O-Demethyl-5-hydroxymatairesinol (1)
½a�23D �27.5� (c 0.10, MeOH). UV (MeOH) kmax (log e)209 (3.86), 281 (3.42) nm; IR tmax (film) cm�1 2928,
1768, 1592, 1488, 1240, 1126; CD (MeOH, c 67 mM) knm (De) 237 (�3.03), 276 (�0.65); EIMS m/z (rel. int.):
360 [M]+ (71), 237 (10), 210 (8), 153 (100), 123 (33), 77
(9); HREIMS m/z : 360.1220 (calc. for C19H20O7,360.1209); for the 1H and 13C NMR data see Table 1.
3.6. (�)-3 0-O-Demethyl-5-methoxymatairesinol (2)
½a�23D �6.0� (c 0.12, MeOH); UV (MeOH) kmax (log e)205 (3.82), 281 (3.43) nm; IR tmax (film) cm�1 2912,
1756, 1614, 1512, 1452, 1107; CD (MeOH, c 54 mM) knm (De) 238 (�3.12), 275 (�0.45); EIMS m/z (rel. int.):374 [M]+ (74), 248 (6), 224 (7), 167 (100), 137 (5), 123
(21), 69 (8), 44 (11); HREIMS m/z : 374.1389 (calc. for
C20H22O7, 374.1365); for the 1H and 13C NMR data
see Table 1.
3.7. NMR data and LC–MS analysis of the petroleum
ether extract and a non-polar fraction eluted from the
EtOAc extract of M. pomiferus
That the major constituents of the petroleum ether
extract (D001) and the first fraction (F001) from the col-
umn chromatography of the EtOAc extract are fatty
acids was determined by their 1H and 13C NMR data
(Gunstone et al., 1977; Su and Takaishi, 1999; Su
et al., 2002). The major 1H NMR data in CDCl3 (300
MHz, TMS): d 11.66 (broad singlet, –COOH), 5.28–5.37 (m, olefinic protons), 2.75 (t, J = 5.9 Hz, double
allylic methylene protons), 2.34 (t, J = 7.5 Hz, a-methyl-
ene protons), 2.02–2.06 (m, allylic methylene protons),
1.60–1.65 (m, b-methylene protons), 1.26–1.32 (strong
singlet, other methylene protons), 0.86–0.89 (m, terminal
methyl protons); The major 13C NMR data in CDCl3(75 MHz, TMS): d 180.7 (s; –COOH), 128.0–130.2 (d;
olefinic carbons), 22.8–34.2 (t; other methylenes), 14.1(q; terminal methyls).
In order to determine the compositions of the fatty acid
mixtures, D001 and F001 were analyzed by LC–MS. The
mobile phase for the LC–MS analyses consisted of 0.1%
aqueous formic acid (eluent A) and 0.1% formic acid in
acetonitrile (eluent B). During the LC–MS analysis, the
flow rate was 200 lL/min. After each chromatographic
run, the columnwas equilibrated for 10min at the startingconditions. Negative-ionization ESIMS was operated
with a nitrogen nebulizer pressure of 20 psi, a nitrogen
drying gas temperature of 275 �C at a rate of 4.5 L/min,
a capillary voltage of�2500 V, and a fragmentor voltage
of 60 V. For the initial LC–MS analysis, a mobile phase
system of solvent B in A was used as follows: 0–3 min,
5% B; 3–8 min, linear gradient from 5 to 50% B; 8–20
min, linear gradient from 50 to 95% B; 20–30 min, 95%B. Negative ion mass spectra were recorded scanning
fromm/z 250 to 750. For subsequent LC–MS comparison
of D001 and F001 with fatty acid standards, a 20 min lin-
ear gradient from 80% solvent B to 95% solvent B, fol-
lowed by 5 min at 95% solvent B, was employed, with
solvent A as a counter-solvent. After a 3-min delay, neg-
ative ion mass spectra were recorded for 22 min scanning
fromm/z 200 to 450. Following each analysis, the columnwas flushed with 100% acetonitrile for 5 min at a flow rate
of 250 lL/min.
The initial LC–MS analyses indicated F001 to be a
relatively simple mixture, comprised mainly of four
non-polar compounds forming negative ions at m/z
277, 279, 281, and 283. Coupled with the above-men-
tioned NMR observations, this suggested that the major
constituents in this sample were a series of 18-carbonfatty acids with masses of 278, 280, 282, and 284, respec-
tively. To test this supposition, reference samples of
2866 B.-N. Su et al. / Phytochemistry 65 (2004) 2861–2866
several fatty acids with these molecular weights (elaidic
acid, M = 282; linoleic acid, M = 280; linolenic acid,
M = 278; oleic acid, M = 282; petroselinic acid,
M = 282; and stearic acid, M = 284) were analyzed by
LC–MS using a variation on the method reported by
Carrier and Parent (2001). The fatty acid constituentsin F001 were found to be identical with linoleic, lino-
lenic, oleic, and stearic acids. Based on peak area, the
relative proportions of the fatty acids in F001 were
determined. The main constituents were linoleic and
oleic acids in equal proportions, with linolenic and stea-
ric acids being present at about a 10-fold lower
concentration.
Acknowledgements
This work was supported by Program ProjectP01CA48112, funded by the National Cancer Institute,
NIH, Bethesda, MD. We are grateful to the Research
Resources Center, UIC, for the provision of certain
spectroscopic equipment used in this investigation.
References
Achenbach, H., Stoecker, M., Constenla, M.A., 1988. Constituents of
tropical medicinal plants. Part 31. Flavonoid and other constitu-
ents of Bauhinia manca. Phytochemistry 27, 1835–1841.
Carrier, A., Parent, J., 2001. Liquid chromatography–mass spectrom-
etry determination of free fatty acids in phospholipid-based
formulations. J. Liq. Chromatogr. Rel. Technol. 24, 97–107.
Constant, H.L., Beecher, C.W.W., 1995. A method for the dereplica-
tion of natural product extracts using electrospray HPLC/MS. Nat.
Prod. Lett. 6, 193–196.
Cordell, G.A., Shin, Y.G., 1999. Finding the needle in the haystack.
The dereplication of natural product extracts. Pure Appl. Chem.
71, 1089–1094.
Cuendet, M., Pezzuto, J.M., 2000. The role of cyclooxygenase and
lipoxygenase in cancer chemoprevention. Drug Metab. Drug
Interact. 17, 109–157.
Gunstone, F.D., Pollard, M.R., Scrimgeour, C.M., Vedanayagam,
H.S., 1977. Fatty acids. Part 50. 13C Nuclear magnetic resonance
studies of olefinic fatty acids and esters. Chem. Phys. Lipids 18,
115–129.
Freire, C.S.R., Silvestre, A.J.D., Pascoal Neto, C., Cavaleiro, J.A.S.,
2002. Lipophilic extractives of the inner and outer barks of
Eucalyptus globulus. Holzforschung 56, 372–379.
Galbraith, M.N., Horn, D.H.S., 1972. Structures of natural products
blumenols A, B, and C. J. Chem. Soc., Chem. Commun., 113–114.
Henry, G.E., Momin, R.A., Nair, M.G., Dewitt, D.L., 2002. Antioxi-
dant and cyclooxygenase activities of fatty acids found in food. J.
Agric. Food Chem. 50, 2231–2234.
Ikeda, R., Nagao, T., Okabe, H., Nakano, Y., Matsunaga, H.,
Katano, M., Mori, M., 1998. Antiproliferative constituents in
Umbelliferae plants. III. Constituents in the root and the ground
part of Anthriscus sylvestris Hoffm. Chem. Pharm. Bull. 46, 871–
874.
Jang, D.S., Cuendet, M., Fong, H.H.S., Pezzuto, J.M., Kinghorn,
A.D., 2004. Constituents of Asparagus officinalis evaluated for
inhibitory activity against cyclooxygenase-2. J. Agric. Food Chem.
52, 2218–2222.
Karmali, R.A., 1980. Review: prostaglandins and cancer. Prostaglan-
dins Med. 5, 11–28.
Levy, G.N., 1997. Prostaglandin H synthases, nonsteroidal anti-
inflammatory drugs, and colon cancer. FASEB J. 11, 234–247.
Lopes, L.M.X., Yoshida, M., Gottlieb, O.R., 1983. Dibenzylbutyro-
lactone lignans from Virola sebifera. Phytochemistry 22, 1516–
1518.
Lupulescu, A., 1996. Leukotrienes essent. Fatty Acids 54, 83–94.
Marnett, L.J., 1992. Aspirin and the potential role of prostaglandins in
colon cancer. Cancer Res. 52, 5575–5589.
Masan, C., Woitke, H.D., Hiller, K., Franke, P., 1978. Components of
several herbs. Part 31. Isolation of b-sitosterol-O-DD-glucoside from
Astrantia major L. Pharmazie 33, 382.
Mehta, R.G., Moon, R.C., 1991. Characterization of effective chem-
opreventive agents in mammary gland in vitro using an initiation-
promotion protocol. Anticancer Res. 11, 593–596.
Richomme, P., Bruneton, J., Cave, A., 1985. Study of Hernandiaceae.
VII. 50-Methoxyyatein and 5 0-methoxypodorhizol. New lignans
isolated from Hernandia cordigera Viell. Heterocycles 23, 309–312.
Ringbom, T., Huss, U., Stenholm, A., Flock, S., Skattebøl, L., Perera,
P., Bohlin, L., 2001. COX-2 Inhibitory effects of naturally
occurring and modified fatty acids. J. Nat. Prod. 64, 745–749.
Su, B.-N., Cuendet, M., Farnsworth, N.R., Fong, H.H.S., Pezzuto,
J.M., Kinghorn, A.D., 2002. Activity-guided fractionation of the
seeds of Ziziphus jujuba using a cyclooxygenase-2 inhibitory assay.
Planta Med. 68, 1125–1128.
Su, B.-N., Takaishi, Y., 1999. Morinins H–K, four novel phenylpro-
panol ester lipid metabolites from Morina chinensis. J. Nat. Prod.
62, 1325–1327.
Tanoguchi, M., Arimoto, M., Saika, H., Yamaguchi, H., 1987. Studies
on the constituents of the seeds of Hernandia ovigera L. VI.
Isolation and structural determination of three lignans. Chem.
Pharm. Bull. 35, 4162–4168.
Waffo-Teguo, P., Lee, D., Cuendet, M., Merillon, J.-M., Pezzuto,
J.M., Kinghorn, A.D., 2001. Two new stilbene dimer glucosides
from grape (Vitis vinifera) cell cultures. J. Nat. Prod. 64, 136–138.
Wolfender, J.-L., Maillard, M., Marston, A., Hostettmann, K., 1992.
Mass spectrometry of underivatized naturally occurring glycosides.
Phytochem. Anal. 3, 193–214.
Related Documents