FORM 10-Q CONSTELLATION ENERGY GROUP INC - CEG Exhibit: Filed: May 10, 2007 (period: March 31, 2007) Quarterly report which provides a continuing view of a company's financial position

Welcome message from author
This document is posted to help you gain knowledge. Please leave a comment to let me know what you think about it! Share it to your friends and learn new things together.
Transcript

FORM 10-QCONSTELLATION ENERGY GROUP INC - CEGExhibit: �
Filed: May 10, 2007 (period: March 31, 2007)
Quarterly report which provides a continuing view of a company's financial position
Table of Contents
PART I
Item 3 Quantitative and Qualitative Disclosures About Market Risk 41 Item 1 Financial Statements Item 2. Management s Discussion Item 3. Quantitative and Qualitative Disclosures About Market Risk Item 4. Controls and Procedures PART II.
OTHER INFORMATION Item 1. Legal Proceedings Item 1A. Risk Factors Item 2. Unregistered Sales of Equity Securities and Use of Proceeds Item 5. Other Information Item 6. Exhibits SIGNATURE
EX-12.(A) (EX-12.(A))
EX-12.(B) (EX-12.(B))
EX-31.(A) (EX-31.(A))
EX-31.(B) (EX-31.(B))
EX-31.(C) (EX-31.(C))
EX-31.(D) (EX-31.(D))
EX-32.(A) (EX-32.(A))
EX-32.(B) (EX-32.(B))
EX-32.(C) (EX-32.(C))
EX-32.(D) (EX-32.(D))

UNITED STATESSECURITIES AND EXCHANGE COMMISSION
Washington, D.C. 20549
FORM 10-Q
QUARTERLY REPORT PURSUANT TO SECTION 13 OR 15(d) OFTHE SECURITIES EXCHANGE ACT OF 1934
For The Quarterly Period Ended March 31, 2007
Commission
IRS Employer
File Number
Exact name of registrant as specified in its charter
Identification No.1-12869
CONSTELLATION ENERGY GROUP, INC.
52-1964611
1-1910
BALTIMORE GAS AND ELECTRIC COMPANY
52-0280210
MARYLAND
(State of Incorporation of both registrants)
750 E. PRATT STREET, BALTIMORE, MARYLAND 21202
(Address of principal executive offices) (Zip Code)
410-783-2800
(Registrants’ telephone number, including area code)
NOT APPLICABLE
(Former name, former address and former fiscal year, if changed since last report)
Indicate by check mark whether the registrants (1) have filed all reports required to be filed by Section 13 or 15(d) of the SecuritiesExchange Act of 1934 during the preceding 12 months, and (2) have been subject to such filing requirements for the past 90 days. Yes ⌧ No o
Indicate by check mark whether Constellation Energy Group, Inc. is a large accelerated filer, an accelerated filer, or a non-acceleratedfiler. See definition of “accelerated filer” and “large accelerated filer” in Rule 12b-2 of the Exchange Act.(Check one):
Large accelerated filer ⌧ Accelerated filer o Non-accelerated filer oIndicate by check mark whether Baltimore Gas and Electric Company is a large accelerated filer, an accelerated filer, or a
non-accelerated filer. See definition of “accelerated filer” and “large accelerated filer” in Rule 12b-2 of the Exchange Act.(Check one):
Large accelerated filer o Accelerated filer o Non-accelerated filer ⌧Indicate by check mark whether Constellation Energy Group, Inc. is a shell company (as defined in Rule 12b-2 of the Exchange
Act) Yes o No ⌧Indicate by check mark whether Baltimore Gas and Electric Company is a shell company (as defined in Rule 12b-2 of the Exchange
Act) Yes o No ⌧Common Stock, without par value 180,305,042 shares outstanding of
Constellation Energy Group, Inc. on April 30, 2007.Baltimore Gas and Electric Company meets the conditions set forth in General Instruction H(1)(a) and (b) of Form 10-Q and is therefore
filing this form in the reduced disclosure format.
Source: CONSTELLATION ENERGY, 10-Q, May 10, 2007

TABLE OF CONTENTS
Page
Part I—Financial Information
Item 1—Financial Statements
Constellation Energy Group, Inc. and Subsidiaries
Consolidated Statements of Income
3
Consolidated Statements of Comprehensive Income
3
Consolidated Balance Sheets
4
Consolidated Statements of Cash Flows
6
Baltimore Gas and Electric Company and Subsidiaries
Consolidated Statements of Income
7
Consolidated Balance Sheets
8
Consolidated Statements of Cash Flows
10
Notes to Consolidated Financial Statements
11
Item 2—Management’s Discussion and Analysis of Financial Condition and Results of Operations
Introduction and Overview
22
Business Environment
22
Events of 2007
23
Results of Operations
24
Financial Condition
35
Capital Resources
37
Item 3—Quantitative and Qualitative Disclosures About Market Risk
41
Item 4—Controls and Procedures
41
Part II—Other Information
Item 1—Legal Proceedings
42
Item 1A—Risk Factors
42
Item 2—Unregistered Sales of Equity Securities and Use of Proceeds
42
Item 5—Other Information
42
Item 6—Exhibits
44
Signature
45
2
Source: CONSTELLATION ENERGY, 10-Q, May 10, 2007

PART 1—FINANCIAL INFORMATIONItem 1—Financial Statements
CONSOLIDATED STATEMENTS OF INCOME (UNAUDITED)
Constellation Energy Group, Inc. and Subsidiaries
Three Months EndedMarch 31,
2007
2006
(In millions, except per share amounts)
Revenues
Nonregulated revenues
$ 4,138.2 $ 3,936.9
Regulated electric revenues
514.8
504.0
Regulated gas revenues
402.5
418.3
Total revenues
5,055.5
4,859.2
Expenses
Fuel and purchased energy expenses
3,961.1
3,923.1
Operating expenses
568.7
507.7
Workforce reduction costs
—
2.2
Merger-related costs
—
1.9
Depreciation, depletion, and amortization
132.4
130.2
Accretion of asset retirement obligations
17.7
16.5
Taxes other than income taxes
73.2
73.6
Total expenses
4,753.1
4,655.2
Income from Operations
302.4
204.0
Other Income
42.4
14.8
Fixed Charges
Interest expense
80.3
77.0
Interest capitalized and allowance for borrowed funds used during construction
(3.8) (2.7)BGE preference stock dividends
3.3
3.3
Total fixed charges
79.8
77.6
Income from Continuing Operations Before Income Taxes
265.0
141.2
Income Tax Expense
67.7
39.6
Income from Continuing Operations
197.3
101.6
(Loss) income from discontinued operations, net of income taxes of $0.8 and $7.1, respectively
(1.6) 12.3
Net Income
$ 195.7 $ 113.9
Earnings Applicable to Common Stock
$ 195.7 $ 113.9
Average Shares of Common Stock Outstanding—Basic
180.6
178.6
Average Shares of Common Stock Outstanding—Diluted
182.8
180.4
Earnings Per Common Share from Continuing Operations—Basic
$ 1.09 $ 0.57
(Loss) income from discontinued operations
(0.01) 0.07
Earnings Per Common Share—Basic
$ 1.08 $ 0.64
Earnings Per Common Share from Continuing Operations—Diluted
$ 1.08 $ 0.56
(Loss) income from discontinued operations
(0.01) 0.07
Earnings Per Common Share—Diluted
$ 1.07 $ 0.63
Dividends Declared Per Common Share
$ 0.435 $ 0.3775
CONSOLIDATED STATEMENTS OF COMPREHENSIVE INCOME (UNAUDITED)
Constellation Energy Group, Inc. and Subsidiaries
Three Months EndedMarch 31,
2007
2006
(In millions)
Net Income
$ 195.7 $ 113.9
Other comprehensive income (loss) (OCI)
Hedging instruments:
Reclassification of net loss on hedging instruments from OCI to net income, net of taxes
399.4
81.0
Net unrealized gain (loss) on hedging instruments, net of taxes
310.3
(755.0)Available-for-sale securities:
Reclassification of net gain on sales of securities from OCI to net income, net of taxes
(0.9) (0.3)Net unrealized gain on securities, net of taxes
(19.5) 11.8
Defined benefit obligations:
Amortization of net actuarial loss, prior service cost, and transition obligation included in net periodic benefit cost, netof taxes
6.3
—
Net unrealized gain on foreign currency, net of taxes
0.3
—
Comprehensive Income (Loss)
$ 891.6 $ (548.6)
5
See Notes to Consolidated Financial Statements.Certain prior-period amounts have been reclassified to conform with the current period’s presentation.
3
Source: CONSTELLATION ENERGY, 10-Q, May 10, 2007

CONSOLIDATED BALANCE SHEETS
Constellation Energy Group, Inc. and Subsidiaries
March 31,2007*
December 31,2006
(In millions)
Assets
Current Assets
Cash and cash equivalents
$ 1,936.6
$ 2,289.1
Accounts receivable (net of allowance for uncollectibles of$51.7 and $48.9, respectively)
3,187.4
3,248.3
Fuel stocks
369.7
599.5
Materials and supplies
204.4
200.2
Mark-to-market energy assets
1,189.3
1,294.8
Risk management assets
233.6
261.7
Unamortized energy contract assets
34.1
35.2
Deferred income taxes
172.0
674.3
Other
485.4
497.0
Total current assets
7,812.5
9,100.1
Investments and Other Assets
Nuclear decommissioning trust funds
1,257.7
1,240.1
Investments in qualifying facilities and power projects
297.3
308.6
Regulatory assets (net)
560.3
389.0
Goodwill
157.6
157.6
Mark-to-market energy assets
702.3
623.4
Risk management assets
323.8
325.7
Unamortized energy contract assets
118.2
123.6
Other
291.3
311.4
Total investments and other assets
3,708.5
3,479.4
Property, Plant and Equipment
Nonregulated property, plant and equipment
7,945.7
7,587.6
Regulated property, plant and equipment
5,816.9
5,752.9
Nuclear fuel (net of amortization)
337.6
339.9
Accumulated depreciation
(4,545.1)
(4,458.3)
Net property, plant and equipment
9,555.1
9,222.1
Total Assets
$ 21,076.1
$ 21,801.6
* UnauditedSee Notes to Consolidated Financial Statements.
4
Source: CONSTELLATION ENERGY, 10-Q, May 10, 2007

CONSOLIDATED BALANCE SHEETS
Constellation Energy Group, Inc. and Subsidiaries
March 31,2007*
December 31,2006
(In millions)
Liabilities and Equity
Current Liabilities
Current portion of long-term debt
$ 878.8
$ 878.8
Accounts payable and accrued liabilities
2,089.5
2,137.2
Customer deposits and collateral
365.3
347.2
Mark-to-market energy liabilities
1,082.9
1,071.7
Risk management liabilities
484.4
1,340.0
Unamortized energy contract liabilities
336.2
378.3
Accrued expenses and other
703.8
969.5
Total current liabilities
5,940.9
7,122.7
Deferred Credits and Other Liabilities
Deferred income taxes
1,377.4
1,435.8
Asset retirement obligations
992.5
974.8
Mark-to-market energy liabilities
466.9
392.4
Risk management liabilities
667.8
707.3
Unamortized energy contract liabilities
866.1
958.0
Defined benefit obligations
813.6
928.3
Deferred investment tax credits
55.5
57.2
Other
127.2
109.0
Total deferred credits and other liabilities
5,367.0
5,562.8
Long-term Debt
Long-term debt of Constellation Energy
3,051.6
3,042.9
Long-term debt of nonregulated businesses
352.3
347.4
First refunding mortgage bonds of BGE
123.1
244.5
Other long-term debt of BGE
1,214.5
1,214.5
6.20% deferrable interest subordinated debentures due October 15, 2043 to BGEwholly owned BGE Capital Trust II relating to trust preferred securities
257.7
257.7
Unamortized discount and premium
(5.6)
(5.9)
Current portion of long-term debt
(878.8)
(878.8)
Total long-term debt
4,114.8
4,222.3
Minority Interests
90.1
94.5
BGE Preference Stock Not Subject to Mandatory Redemption
190.0
190.0
Common Shareholders’ Equity
Common stock
2,707.0
2,738.6
Retained earnings
3,574.0
3,474.3
Accumulated other comprehensive loss
(907.7)
(1,603.6)
Total common shareholders’ equity
5,373.3
4,609.3
Commitments, Guarantees, and Contingencies (see Notes)
Total Liabilities and Equity
$ 21,076.1
$ 21,801.6
* UnauditedSee Notes to Consolidated Financial Statements.
5
Source: CONSTELLATION ENERGY, 10-Q, May 10, 2007

CONSOLIDATED STATEMENTS OF CASH FLOWS (UNAUDITED)
Constellation Energy Group, Inc. and Subsidiaries
Three Months Ended March 31,
2007
2006
(In millions)
Cash Flows From Operating Activities
Net income
$ 195.7 $ 113.9
Adjustments to reconcile to net cash provided by (used in) operating activities
Gain on sale of discontinued operations
—
(0.9)Depreciation, depletion, and amortization
126.4
144.7
Accretion of asset retirement obligations
17.7
16.5
Deferred income taxes
23.2
(48.3)Investment tax credit adjustments
(1.7) (1.7)
Deferred fuel costs
(173.5) 7.1
Defined benefit obligation expense
34.2
33.8
Defined benefit obligation payments
(138.2) (65.1)Equity in earnings of affiliates less than dividends received
15.8
5.0
Proceeds from derivative power sales contracts classified as financing activities underSFAS No. 149
1.5
(19.6)
Changes in
Accounts receivable
234.6
(76.1)Mark-to-market energy assets and liabilities
89.6
(191.0)
Risk management assets and liabilities
28.7
16.7
Materials, supplies, and fuel stocks
155.8
(73.8)Other current assets
(7.4) (64.0)
Accounts payable and accrued liabilities
(62.6) (23.3)Other current liabilities
(196.8) (269.6)
Other
6.0
6.5
Net cash provided by (used in) operating activities
349.0
(489.2)Cash Flows From Investing Activities
Investments in property, plant and equipment
(272.7) (184.4)Acquisitions, net of cash acquired
(212.0) (100.8)
Investments in nuclear decommissioning trust fund securities
(140.0) (73.5)Proceeds from nuclear decommissioning trust fund securities
131.2
69.1
Other
0.8
4.0
Net cash used in investing activities
(492.7) (285.6)Cash Flows From Financing Activities
Net issuance of short-term borrowings
—
424.3
Proceeds from issuance of
Common stock
22.1
18.8
Long-term debt
10.0
—
Repayment of long-term debt
(126.5) (17.6)Common stock dividends paid
(68.5) (59.8)
Reacquisition of common stock
(77.6) —
Proceeds from contract and portfolio acquisitions
27.0
—
Proceeds from derivative power sales contracts classified as financing activities under SFASNo. 149
(1.5) 19.6
Other
6.2
1.3
Net cash (used in) provided by financing activities
(208.8) 386.6
Net Decrease in Cash and Cash Equivalents
(352.5) (388.2)Cash and Cash Equivalents at Beginning of Period
2,289.1
813.0
Cash and Cash Equivalents at End of Period
$ 1,936.6 $ 424.8
See Notes to Consolidated Financial Statements.Certain prior-period amounts have been reclassified to conform with the current period’s presentation.
6
Source: CONSTELLATION ENERGY, 10-Q, May 10, 2007
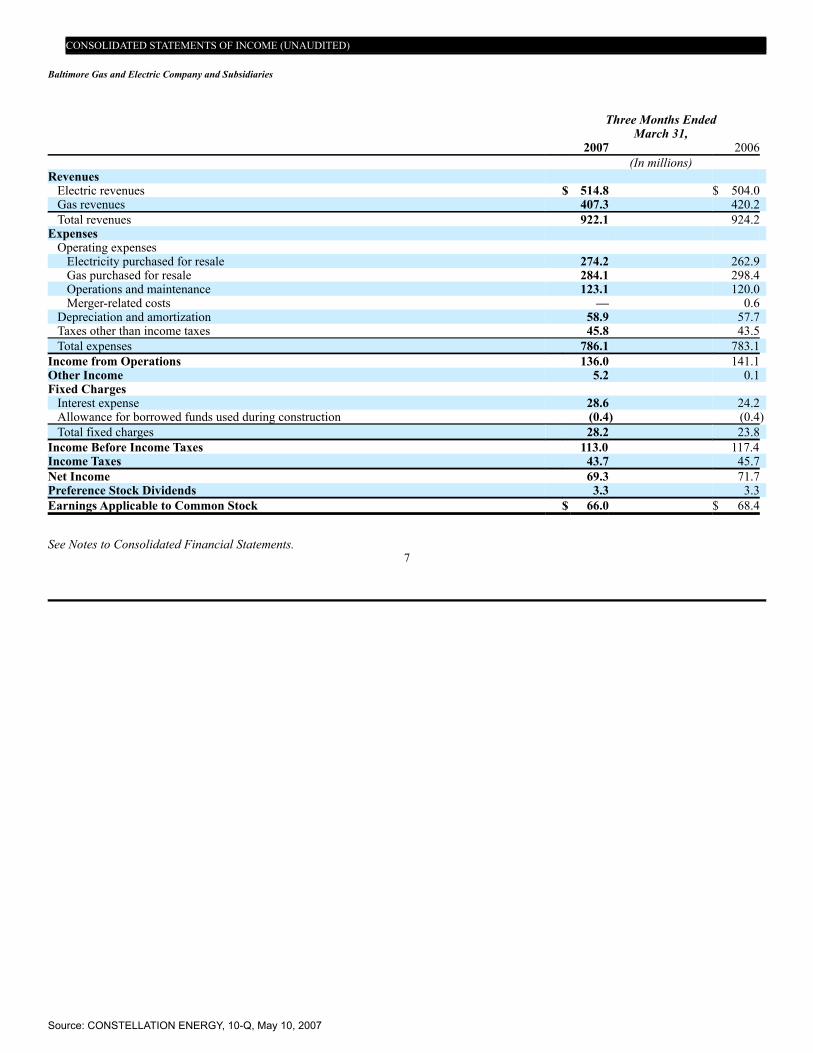
CONSOLIDATED STATEMENTS OF INCOME (UNAUDITED)
Baltimore Gas and Electric Company and Subsidiaries
Three Months EndedMarch 31,
2007
2006
(In millions)
Revenues
Electric revenues
$ 514.8 $ 504.0
Gas revenues
407.3
420.2
Total revenues
922.1
924.2
Expenses
Operating expenses
Electricity purchased for resale
274.2
262.9
Gas purchased for resale
284.1
298.4
Operations and maintenance
123.1
120.0
Merger-related costs
—
0.6
Depreciation and amortization
58.9
57.7
Taxes other than income taxes
45.8
43.5
Total expenses
786.1
783.1
Income from Operations
136.0
141.1
Other Income
5.2
0.1
Fixed Charges
Interest expense
28.6
24.2
Allowance for borrowed funds used during construction
(0.4) (0.4)Total fixed charges
28.2
23.8
Income Before Income Taxes
113.0
117.4
Income Taxes
43.7
45.7
Net Income
69.3
71.7
Preference Stock Dividends
3.3
3.3
Earnings Applicable to Common Stock
$ 66.0 $ 68.4
See Notes to Consolidated Financial Statements.7
Source: CONSTELLATION ENERGY, 10-Q, May 10, 2007
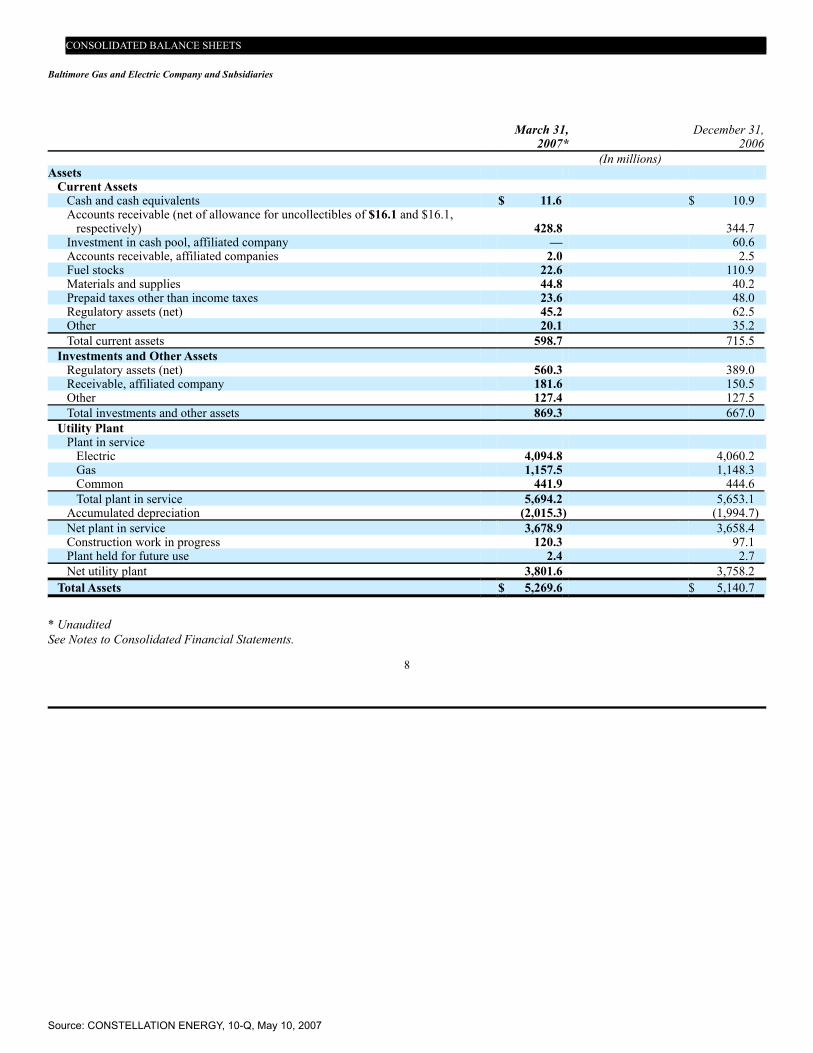
CONSOLIDATED BALANCE SHEETS
Baltimore Gas and Electric Company and Subsidiaries
March 31,2007*
December 31,2006
(In millions)
Assets
Current Assets
Cash and cash equivalents
$ 11.6
$ 10.9
Accounts receivable (net of allowance for uncollectibles of $16.1 and $16.1,respectively)
428.8
344.7
Investment in cash pool, affiliated company
—
60.6
Accounts receivable, affiliated companies
2.0
2.5
Fuel stocks
22.6
110.9
Materials and supplies
44.8
40.2
Prepaid taxes other than income taxes
23.6
48.0
Regulatory assets (net)
45.2
62.5
Other
20.1
35.2
Total current assets
598.7
715.5
Investments and Other Assets
Regulatory assets (net)
560.3
389.0
Receivable, affiliated company
181.6
150.5
Other
127.4
127.5
Total investments and other assets
869.3
667.0
Utility Plant
Plant in service
Electric
4,094.8
4,060.2
Gas
1,157.5
1,148.3
Common
441.9
444.6
Total plant in service
5,694.2
5,653.1
Accumulated depreciation
(2,015.3)
(1,994.7)
Net plant in service
3,678.9
3,658.4
Construction work in progress
120.3
97.1
Plant held for future use
2.4
2.7
Net utility plant
3,801.6
3,758.2
Total Assets
$ 5,269.6
$ 5,140.7
* UnauditedSee Notes to Consolidated Financial Statements.
8
Source: CONSTELLATION ENERGY, 10-Q, May 10, 2007
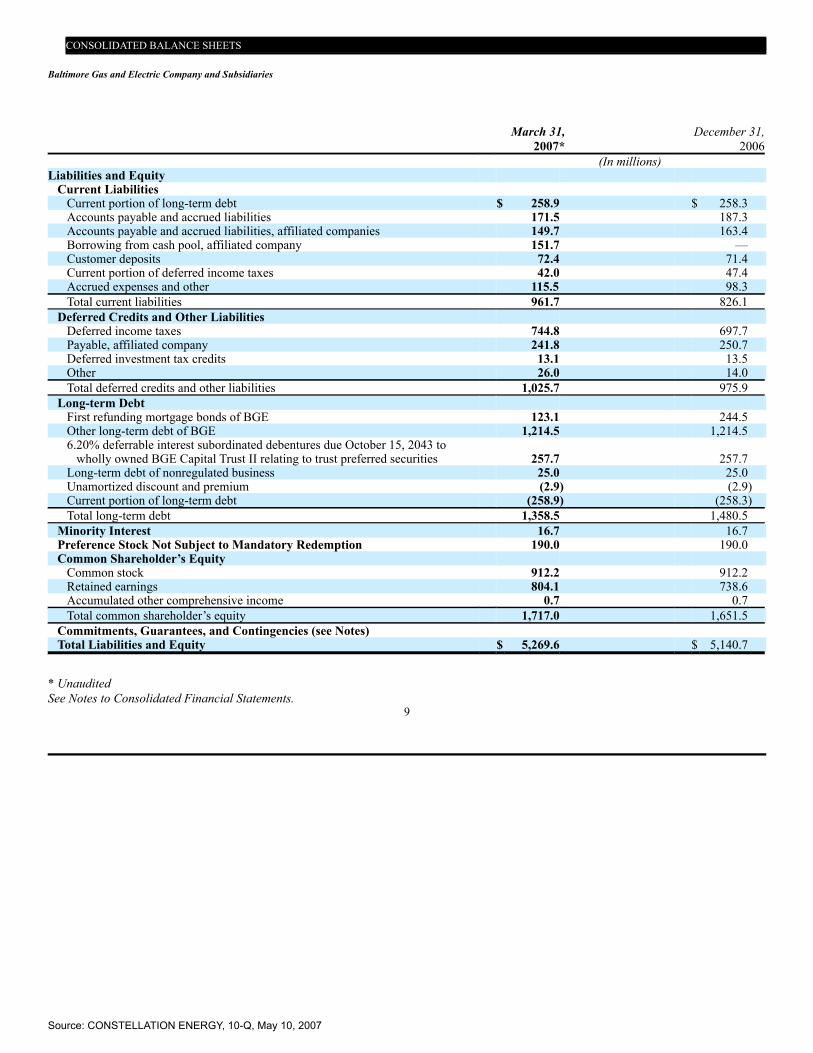
CONSOLIDATED BALANCE SHEETS
Baltimore Gas and Electric Company and Subsidiaries
March 31,2007*
December 31,2006
(In millions)
Liabilities and Equity
Current Liabilities
Current portion of long-term debt
$ 258.9
$ 258.3
Accounts payable and accrued liabilities
171.5
187.3
Accounts payable and accrued liabilities, affiliated companies
149.7
163.4
Borrowing from cash pool, affiliated company
151.7
—
Customer deposits
72.4
71.4
Current portion of deferred income taxes
42.0
47.4
Accrued expenses and other
115.5
98.3
Total current liabilities
961.7
826.1
Deferred Credits and Other Liabilities
Deferred income taxes
744.8
697.7
Payable, affiliated company
241.8
250.7
Deferred investment tax credits
13.1
13.5
Other
26.0
14.0
Total deferred credits and other liabilities
1,025.7
975.9
Long-term Debt
First refunding mortgage bonds of BGE
123.1
244.5
Other long-term debt of BGE
1,214.5
1,214.5
6.20% deferrable interest subordinated debentures due October 15, 2043 towholly owned BGE Capital Trust II relating to trust preferred securities
257.7
257.7
Long-term debt of nonregulated business
25.0
25.0
Unamortized discount and premium
(2.9)
(2.9)
Current portion of long-term debt
(258.9)
(258.3)
Total long-term debt
1,358.5
1,480.5
Minority Interest
16.7
16.7
Preference Stock Not Subject to Mandatory Redemption
190.0
190.0
Common Shareholder’s Equity
Common stock
912.2
912.2
Retained earnings
804.1
738.6
Accumulated other comprehensive income
0.7
0.7
Total common shareholder’s equity
1,717.0
1,651.5
Commitments, Guarantees, and Contingencies (see Notes)
Total Liabilities and Equity
$ 5,269.6
$ 5,140.7
* UnauditedSee Notes to Consolidated Financial Statements.
9
Source: CONSTELLATION ENERGY, 10-Q, May 10, 2007

CONSOLIDATED STATEMENTS OF CASH FLOWS (UNAUDITED)
Baltimore Gas and Electric Company and Subsidiaries
Three Months Ended March 31,
2007
2006
(In millions)
Cash Flows From Operating Activities
Net income
$ 69.3 $ 71.7
Adjustments to reconcile to net cash (used in) provided by operating activities
Depreciation and amortization
62.0
61.1
Deferred income taxes
58.0
(10.1)Investment tax credit adjustments
(0.4) (0.4)
Deferred fuel costs
(173.5) 7.1
Defined benefit plan expenses
10.1
10.9
Allowance for equity funds used during construction
(0.7) (0.8)Changes in
Accounts receivable
(84.1) 27.2
Accounts receivable, affiliated companies
0.5
1.2
Materials, supplies, and fuel stocks
83.7
56.8
Other current assets
39.6
22.0
Accounts payable and accrued liabilities
(15.8) (45.5)Accounts payable and accrued liabilities, affiliated companies
(13.7) (4.6)
Other current liabilities
1.3
51.3
Long-term receivables and payables, affiliated companies
(50.0) (36.4)Other
12.2
11.9
Net cash (used in) provided by operating activities
(1.5) 223.4
Cash Flows From Investing Activities
Utility construction expenditures (excluding equity portion of allowance for funds used duringconstruction)
(85.4) (74.6)
Change in cash pool at parent
212.3
(94.9)Sales of investments and other assets
—
0.5
Other
—
7.9
Net cash provided by (used in) investing activities
126.9
(161.1)Cash Flows From Financing Activities
Repayment of long-term debt
(121.4) —
Distribution to parent
—
(59.8)Preference stock dividends paid
(3.3) (3.3)
Net cash used in financing activities
(124.7) (63.1)Net Increase (Decrease) in Cash and Cash Equivalents
0.7
(0.8)
Cash and Cash Equivalents at Beginning of Period
10.9
15.1
Cash and Cash Equivalents at End of Period
$ 11.6 $ 14.3
See Notes to Consolidated Financial Statements.Certain prior-period amounts have been reclassified to conform with the current period’s presentation.
10
Source: CONSTELLATION ENERGY, 10-Q, May 10, 2007

NOTES TO CONSOLIDATED FINANCIAL STATEMENTS
Various factors can have a significant impact on our results for interim periods. This means that the results for this quarter are not necessarilyindicative of future quarters or full year results given the seasonality of our business.
Our interim financial statements on the previous pages reflect all adjustments that management believes are necessary for the fairstatement of the results of operations for the interim periods presented. These adjustments are of a normal recurring nature.
Basis of PresentationThis Quarterly Report on Form 10-Q is a combined report of Constellation Energy Group, Inc. (Constellation Energy) and Baltimore Gas andElectric Company (BGE). References in this report to “we” and “our” are to Constellation Energy and its subsidiaries, collectively.References in this report to the “regulated business(es)” are to BGE.
Variable Interest EntitiesWe have a significant interest in the following variable interest entities (VIE) for which we are not the primary beneficiary:
VIE
Nature ofInvolvement
Date ofInvolvement
Power projects
Equity investment and guarantees
Prior to 2003Power contract monetization entities
Power sale agreements, loans, andguarantees
March 2005
Oil and gas fields
Equity investment
May 2006Retail power supply
Power sale agreement
September 2006
We discuss the nature of our involvement with the power contract monetization VIEs in detail in Note 4 of our 2006 AnnualReport on Form 10-K.
The following is summary information available as of March 31, 2007 about the VIEs in which we have a significant interest, butare not the primary beneficiary:
PowerContract
MonetizationVIEs
All OtherVIEs
Total
(In millions)
Total assets
$ 744.7
$ 354.9
$ 1,099.6
Total liabilities
591.1
148.4
739.5
Our ownership interest
—
52.2
52.2
Other ownership interests
153.6
154.3
307.9
Our maximum exposure to loss
64.5
88.3
152.8
The maximum exposure to loss represents the loss that we would incur in the unlikely event that our interests in all of theseentities were to become worthless and we were required to fund the full amount of all guarantees associated with these entities.
Our maximum exposure to loss as of March 31, 2007 consists of the following:♦ outstanding receivables, loans and letters of credit totaling $88.0 million,♦ the carrying amount of our investment totaling $52.1 million, and♦ debt and performance guarantees totaling $12.7 million.We assess the risk of a loss equal to our maximum exposure to be remote.
Discontinued OperationsIn the fourth quarter of 2006, we completed the sale of six natural gas-fired plants. During the first quarter of 2007, we recognized anafter-tax loss of $1.6 million as a component of “(Loss) income from discontinued operations” due to post-closing working capitaladjustments. We discuss the details of the sale in Note 2 of our 2006 Annual Report on Form 10-K.
Workforce Reduction CostsWe incurred costs related to workforce reduction efforts initiated in 2006. We discuss these costs in more detail in Note 2 of our 2006 AnnualReport on Form 10-K.
11
Source: CONSTELLATION ENERGY, 10-Q, May 10, 2007

The following table summarizes the status of the involuntary severance liability for Nine Mile Point and Calvert Cliffs atMarch 31, 2007:
(In millions)
Initial severance liability balance
$ 19.6
Amounts recorded as defined benefit obligations
(7.3)
Net cash severance liability
12.3
Cash severance payments
(5.8)
Other
—
Severance liability balance at March 31, 2007
$ 6.5
Earnings Per ShareBasic earnings per common share (EPS) is computed by dividing earnings applicable to common stock by the weighted-average number ofcommon shares outstanding for the period. Diluted EPS reflects the potential dilution of common stock equivalent shares that could occur ifsecurities or other contracts to issue common stock were exercised or converted into common stock.
Our dilutive common stock equivalent shares consist of stock options and other stock-based compensation awards. The followingtable presents stock options that were not dilutive and were excluded from the computation of diluted EPS in each period, as well asthe dilutive common stock equivalent shares:
Quarter EndedMarch 31,
2007
2006
(In millions)
Non-dilutive stock options
—
2.0
Dilutive common stock equivalent shares
2.2
1.8
Accretion of Asset Retirement ObligationsWe discuss our asset retirement obligations in more detail in Note 1 of our 2006 Annual Report on Form 10-K. The change in our “Assetretirement obligations” liability during 2007 was as follows:
(In millions)
Liability at January 1, 2007
$ 974.8
Accretion expense
17.7
Liabilities incurred
—
Liabilities settled
—
Revisions to cash flows
—
Other
—
Liability at March 31, 2007
$ 992.5
In 2007, we are performing site specific studies for all three of our nuclear facilities. We expect to complete the studies and reflectthe results in the third quarter of 2007.
AcquisitionsWorking Interests in Gas Producing FieldsIn the first quarter of 2007, we acquired working interests of 41% and 55% in two gas and oil producing properties in Oklahoma for$212.0 million in cash, subject to closing adjustments. We purchased leases, producing wells, inventory, and related equipment. We haveincluded the results of operations from these properties in our merchant energy business segment since the date of acquisition.
Our preliminary purchase price is allocated to the net assets acquired as follows:
At March 23, 2007
(In millions)
Property, Plant and Equipment
Inventory
$ 0.2
Unproved property
7.3
Proved property
204.5
Net Assets Acquired
$ 212.0
The purchase price is subject to closing adjustments, which could impact our purchase price allocation.We believe that the pro-forma impact of the acquisition of these working interests would not have been material to our results of
operations for the three months ended March 31, 2007 and 2006.
Coalbed Methane Properties
Source: CONSTELLATION ENERGY, 10-Q, May 10, 2007

In April 2007, Constellation Energy Partners LLC (CEP) acquired 100% ownership of certain coalbed methane properties for an aggregatepurchase price of approximately $115 million. The properties are located in the Cherokee Basin in Kansas and Oklahoma.
In connection with the financing of this acquisition, CEP also sold in a private placement 2,207,684 common units at $26.12 perunit and sold 90,376 newly-created Class E units at a price of $25.84 per unit to third-party investors for gross cash proceeds ofapproximately $60 million. In the second quarter of 2007, we expect to record a pre-tax gain of $10-$15 million related to thisadditional equity issuance by CEP. The remaining purchase price was funded from funds available under an existing revolving creditfacility of CEP.
In anticipation of closing this acquisition and the related equity issuance, at March 31, 2007 we evaluated the probability offorecasted sales of natural gas from CEP’s properties that previously had been hedged by our merchant energy business. As a result ofthe anticipated
12
Source: CONSTELLATION ENERGY, 10-Q, May 10, 2007

deconsolidation of CEP resulting from this equity issuance, which we discuss below, we determined that the hedged forecasted saleswere probable of not occurring. Therefore, we reclassified $21.8 million pre-tax in previously deferred cash-flow hedge losses from“Accumulated other comprehensive loss” to earnings during the first quarter of 2007.
As a result of the equity issuance by CEP, our ownership percentage in CEP fell below 50 percent. Therefore, during the secondquarter of 2007, we deconsolidated CEP and began accounting for our investment under Accounting Principles Board Opinion (APB)No. 18, The Equity Method of Accounting for Investments in Common Stock. We discuss the equity method of accounting in moredetail in Note 1 of our 2006 Annual Report on Form 10-K.
Information by Operating SegmentOur reportable operating segments are—Merchant Energy, Regulated Electric, and Regulated Gas:
♦ Our merchant energy business is nonregulated and includes:— full requirements load-serving sales of energy and capacity to utilities, cooperatives, and commercial, industrial, and
governmental customers,— structured transactions and risk management services for various customers (including hedging of output from generating
facilities and fuel costs),— deployment of risk capital through portfolio management and trading activities,— gas retail energy products and services to commercial, industrial, and governmental customers,— fossil, nuclear, and interests in hydroelectric generating facilities and qualifying facilities, fuel processing facilities, and power
projects in the United States,— upstream (exploration and production) and downstream (transportation and storage) natural gas operations,— coal sourcing and logistics services for the variable or fixed supply needs of global customers, and— generation operations and maintenance and new nuclear development consulting services.
♦ Our regulated electric business purchases, transmits, distributes, and sells electricity in Central Maryland.♦ Our regulated gas business purchases, transports, and sells natural gas in Central Maryland.Our remaining nonregulated businesses:♦ design, construct, and operate heating, cooling, and cogeneration facilities for commercial, industrial, and governmental customers
throughout North America, and♦ provide home improvements, service electric and gas appliances, service heating, air conditioning, plumbing, electrical, and indoor air
quality systems, and provide natural gas marketing to residential customers in Central Maryland.In addition, we own several investments that we do not consider to be core operations. These include financial investments and
real estate projects.Our Merchant Energy, Regulated Electric, and Regulated Gas reportable segments are strategic businesses based principally upon
regulations, products, and services that require different technology and marketing strategies. We evaluate the performance of thesesegments based on net income. We account for intersegment revenues using market prices. A summary of information by operatingsegment is shown in the table on the next page.
13
Source: CONSTELLATION ENERGY, 10-Q, May 10, 2007

Reportable Segments
MerchantEnergy
Business
RegulatedElectricBusiness
RegulatedGas
Business
OtherNonregulated
Businesses
Eliminations
Consolidated
(In millions)
Quarter ended March 31,
2007
Unaffiliated revenues
$ 4,063.5 $ 514.8
$ 402.5
$ 74.7
$ —
$ 5,055.5
Intersegment revenues
322.9
—
4.8
—
(327.7)
—
Total revenues
4,386.4
514.8
407.3
74.7
(327.7)
5,055.5
Loss from discontinued operations
(1.6)
—
—
—
—
(1.6)
Net income
120.0
32.2
33.7
9.8
—
195.7
2006
Unaffiliated revenues
$ 3,876.1 $ 504.0
$ 418.3
$ 60.8
$ —
$ 4,859.2
Intersegment revenues
207.2
—
1.9
0.1
(209.2)
—
Total revenues
4,083.3
504.0
420.2
60.9
(209.2)
4,859.2
Income from discontinued operations
11.4
—
—
0.9
—
12.3
Net income
43.6
33.6
35.0
1.7
—
113.9
Certain prior year amounts have been reclassified to conform with the current year’s presentation. The reclassifications primarily relate tooperations that have been classified as discontinued operations in the current year.
Pension and Postretirement Benefits
We show the components of net periodic pension benefit cost in the following table:
Quarter EndedMarch 31,
2007
2006
(In millions)
Components of net periodic pension benefit cost
Service cost
$ 12.5 $ 11.7
Interest cost
24.4
20.5
Expected return on plan assets
(26.6) (22.3)Recognized net actuarial loss
8.0
8.6
Amortization of prior service cost
1.3
1.3
Amount capitalized as construction cost
(3.0) (2.9)Net periodic pension benefit cost1
$ 16.6
$ 16.9
1 BGE’s portion of our net periodic pension benefit cost, excluding amounts capitalized, was $5.2 million in 2007 and $5.6 million in 2006.
We show the components of net periodic postretirement benefit cost in the following table:
Quarter EndedMarch 31,
2007
2006
(In millions)
Components of net periodic postretirement benefit cost
Service cost
$ 1.7 $ 2.1
Interest cost
6.2
6.2
Amortization of transition obligation
0.5
0.5
Recognized net actuarial loss
1.4
2.0
Amortization of prior service cost
(0.8) (0.9)Amount capitalized as construction cost
(2.1) (2.0)
Net periodic postretirement benefit cost 1
$ 6.9 $ 7.9
1 BGE’s portion of our net periodic postretirement benefit cost, excluding amounts capitalized, was $4.0 million in 2007 and $4.3 million in 2006.
Our non-qualified pension plans and our postretirement benefit programs are not funded; however, we have trust assets securingcertain executive pension benefits. We estimate that we will incur approximately $4 million in pension benefit payments for ournon-qualified pension plans and approximately $29 million for retiree health and life insurance benefit payments during 2007. Wecontributed $125.0 million to our qualified pension plans in March 2007.
14
Source: CONSTELLATION ENERGY, 10-Q, May 10, 2007
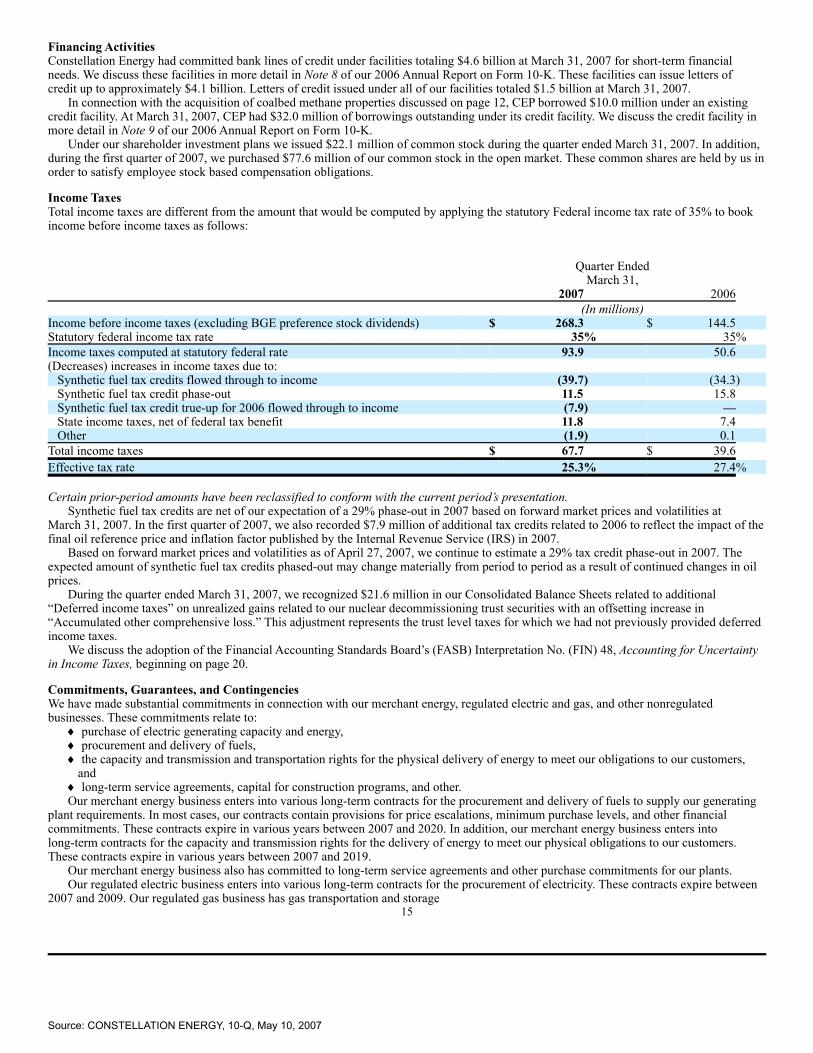
Financing ActivitiesConstellation Energy had committed bank lines of credit under facilities totaling $4.6 billion at March 31, 2007 for short-term financialneeds. We discuss these facilities in more detail in Note 8 of our 2006 Annual Report on Form 10-K. These facilities can issue letters ofcredit up to approximately $4.1 billion. Letters of credit issued under all of our facilities totaled $1.5 billion at March 31, 2007.
In connection with the acquisition of coalbed methane properties discussed on page 12, CEP borrowed $10.0 million under an existingcredit facility. At March 31, 2007, CEP had $32.0 million of borrowings outstanding under its credit facility. We discuss the credit facility inmore detail in Note 9 of our 2006 Annual Report on Form 10-K.
Under our shareholder investment plans we issued $22.1 million of common stock during the quarter ended March 31, 2007. In addition,during the first quarter of 2007, we purchased $77.6 million of our common stock in the open market. These common shares are held by us inorder to satisfy employee stock based compensation obligations.
Income TaxesTotal income taxes are different from the amount that would be computed by applying the statutory Federal income tax rate of 35% to bookincome before income taxes as follows:
Quarter EndedMarch 31,
2007
2006
(In millions)
Income before income taxes (excluding BGE preference stock dividends)
$ 268.3 $ 144.5
Statutory federal income tax rate
35% 35%Income taxes computed at statutory federal rate
93.9
50.6
(Decreases) increases in income taxes due to:
Synthetic fuel tax credits flowed through to income
(39.7) (34.3)Synthetic fuel tax credit phase-out
11.5
15.8
Synthetic fuel tax credit true-up for 2006 flowed through to income
(7.9) —
State income taxes, net of federal tax benefit
11.8
7.4
Other
(1.9) 0.1
Total income taxes
$ 67.7 $ 39.6
Effective tax rate
25.3% 27.4%
Certain prior-period amounts have been reclassified to conform with the current period’s presentation.Synthetic fuel tax credits are net of our expectation of a 29% phase-out in 2007 based on forward market prices and volatilities at
March 31, 2007. In the first quarter of 2007, we also recorded $7.9 million of additional tax credits related to 2006 to reflect the impact of thefinal oil reference price and inflation factor published by the Internal Revenue Service (IRS) in 2007.
Based on forward market prices and volatilities as of April 27, 2007, we continue to estimate a 29% tax credit phase-out in 2007. Theexpected amount of synthetic fuel tax credits phased-out may change materially from period to period as a result of continued changes in oilprices.
During the quarter ended March 31, 2007, we recognized $21.6 million in our Consolidated Balance Sheets related to additional“Deferred income taxes” on unrealized gains related to our nuclear decommissioning trust securities with an offsetting increase in“Accumulated other comprehensive loss.” This adjustment represents the trust level taxes for which we had not previously provided deferredincome taxes.
We discuss the adoption of the Financial Accounting Standards Board’s (FASB) Interpretation No. (FIN) 48, Accounting for Uncertaintyin Income Taxes, beginning on page 20.
Commitments, Guarantees, and ContingenciesWe have made substantial commitments in connection with our merchant energy, regulated electric and gas, and other nonregulatedbusinesses. These commitments relate to:
♦ purchase of electric generating capacity and energy,♦ procurement and delivery of fuels,♦ the capacity and transmission and transportation rights for the physical delivery of energy to meet our obligations to our customers,
and♦ long-term service agreements, capital for construction programs, and other.Our merchant energy business enters into various long-term contracts for the procurement and delivery of fuels to supply our generating
plant requirements. In most cases, our contracts contain provisions for price escalations, minimum purchase levels, and other financialcommitments. These contracts expire in various years between 2007 and 2020. In addition, our merchant energy business enters intolong-term contracts for the capacity and transmission rights for the delivery of energy to meet our physical obligations to our customers.These contracts expire in various years between 2007 and 2019.
Our merchant energy business also has committed to long-term service agreements and other purchase commitments for our plants.Our regulated electric business enters into various long-term contracts for the procurement of electricity. These contracts expire between
2007 and 2009. Our regulated gas business has gas transportation and storage15
Source: CONSTELLATION ENERGY, 10-Q, May 10, 2007

contracts that expire between 2007 and 2028. As discussed in Note 1 of our 2006 Annual Report on Form 10-K, the costs under thesecontracts are fully recoverable by our regulated businesses.
Our other nonregulated businesses have committed to gas purchases, as well as to contribute additional capital for construction programsand joint ventures in which they have an interest.
We have also committed to long-term service agreements and other obligations related to our information technology systems.At March 31, 2007, the total amount of commitments was $8,840.4 million. These commitments are primarily related to our merchant
energy business.
Long-Term Power Sales ContractsWe enter into long-term power sales contracts in connection with our load-serving activities. We also enter into long-term power salescontracts associated with certain of our power plants. Our load-serving power sales contracts extend for terms through 2019 and provide forthe sale of energy to electricity distribution utilities and certain retail customers. Our power sales contracts associated with power plants weown extend for terms into 2014 and provide for the sale of all or a portion of the actual output of certain of our power plants. All long-termcontracts were executed at pricing that approximated market rates, including profit margin, at the time of execution.
GuaranteesOur guarantees do not represent incremental Constellation Energy obligations; rather they primarily represent parental guarantees ofsubsidiary obligations. The following table summarizes the maximum exposure based on the stated limit of our outstanding guarantees atMarch 31, 2007:
At March 31, 2007
Stated Limit
(In millions)
Competitive supply guarantees
$ 10,678.1
Nuclear guarantees
773.6
BGE guarantees
263.3
Other non-regulated guarantees
74.2
Power project guarantees
19.2
Total guarantees
$ 11,808.4
At March 31, 2007, Constellation Energy had a total of $11,808.4 million in guarantees outstanding related to loans, credit facilities, andcontractual performance of certain of its subsidiaries as described below.
♦ Constellation Energy guaranteed $10,678.1 million on behalf of our subsidiaries for competitive supply activities. These guaranteesare put into place in order to allow our subsidiaries the flexibility needed to conduct business with counterparties without having to postother forms of collateral. While the face amount of these guarantees is $10,678.1 million, our calculated fair value of obligations forcommercial transactions covered by these guarantees was $2,983.4 million at March 31, 2007. If the parent company was required tofund these subsidiary obligations, the total amount based on March 31, 2007 market prices would be $2,983.4 million. For thoseguarantees related to our mark-to-market energy or risk management liabilities, the fair value of the obligation is recorded in ourConsolidated Balance Sheets.
♦ Constellation Energy guaranteed $773.6 million primarily on behalf of our nuclear generating facilities for nuclear insurance and creditsupport to ensure these plants have funds to meet expenses and obligations to safely operate and maintain the plants.
♦ BGE guaranteed the Trust Preferred Securities of $250.0 million of BGE Trust II,♦ BGE guaranteed two-thirds of certain debt of Safe Harbor Water Power Corporation, an unconsolidated investment. At March 31,
2007, Safe Harbor Water Power Corporation had outstanding debt of $20.0 million. The maximum amount of BGE’s guarantee is$13.3 million.
♦ Constellation Energy guaranteed $62.4 million on behalf of our other nonregulated businesses primarily for loans and performancebonds of which $25.0 million was recorded in our Consolidated Balance Sheets at March 31, 2007.
♦ Our other nonregulated business guaranteed $11.8 million primarily for performance bonds.♦ Our merchant energy business guaranteed $19.2 million for loans and other performance guarantees related to certain power projects in
which we have an investment.We believe it is unlikely that we would be required to perform or incur any losses associated with guarantees of our subsidiaries’
obligations.
ContingenciesRevenue Sufficiency Guarantee CostsDuring 2006, the Federal Energy Regulatory Commission (FERC) issued orders finding that the Midwest Independent System Operator(MISO) violated its tariff by incorrectly allocating revenue sufficiency guarantee (RSG) charges among market participants. As a result ofFERC orders, MISO proposed a revised methodology for the allocation of RSG charges in its December 2006
16
Source: CONSTELLATION ENERGY, 10-Q, May 10, 2007

compliance filing with the FERC with a proposed effective date of April 1, 2007.In March 2007, FERC rejected the RSG allocation methodology proposed by MISO in its December 2006 compliance filing and ordered
MISO to reallocate RSG costs based on its existing tariff back to the date of FERC’s original order (April 2006). Based on this FERC order,we recorded an immaterial liability in our Consolidated Balance Sheets based on our estimate of the amount of re-allocated RSGs we believeis probable. Our liability is subject to change based upon MISO’s calculation of the actual RSG adjustment. In addition, the order may beappealed, and we cannot predict the ultimate timing or outcome of any appeal.
Environmental MattersSolid and Hazardous WasteThe Environmental Protection Agency (EPA) and several state agencies have notified us that we are considered a potentially responsibleparty with respect to the clean-up of certain environmentally contaminated sites. We cannot estimate the final clean-up costs for all of thesesites, but the current estimated costs for, and current status of, each site is described in more detail below.
68th Street DumpIn 1999, the EPA proposed to add the 68th Street Dump in Baltimore, Maryland to the Superfund National Priorities List, which is its list ofsites targeted for clean-up and enforcement, and sent a general notice letter to BGE and 19 other parties identifying them as potentially liableparties at the site. In March 2004, we and other potentially responsible parties formed the 68th Street Coalition and entered into consent ordernegotiations with the EPA to investigate clean-up options for the site under the Superfund Alternative Sites Program. In May 2006, asettlement among the EPA and 19 of the potentially responsible parties, including BGE, with respect to investigation of the site becameeffective. The settlement requires the potentially responsible parties, over the course of several years, to identify contamination at the site andrecommend clean-up options. BGE is fully indemnified by a wholly-owned affiliate of Constellation Energy for costs related to thissettlement, as well as any clean-up costs. The clean-up costs will not be known until the investigation is closer to completion. However, thosecosts could have a material effect on our financial results.
Spring GardensIn December 1996, BGE signed a consent order with the Maryland Department of the Environment that requires it to implement remedialaction plans for contamination at and around the Spring Gardens site, located in Baltimore, Maryland. The Spring Gardens site was once usedto manufacture gas from coal and oil. Based on remedial action plans and cost modeling performed in late 2006, BGE estimates its probableclean-up costs will total $43 million. BGE has recorded these costs as a liability in its Consolidated Balance Sheets and has deferred thesecosts, net of accumulated amortization and amounts it recovered from insurance companies, as a regulatory asset. Based on the results ofstudies at this site, it is reasonably possible that additional costs could exceed the amount BGE has recognized by approximately $3 million.Through March 31, 2007, BGE has spent approximately $40 million for remediation at this site.
BGE also has investigated other small sites where gas was manufactured in the past. We do not expect the clean-up costs of theremaining smaller sites to have a material effect on our financial results.
Air QualityIn late July 2005, we received two Notices of Violation (NOVs) from the Placer County Air Pollution Control District, Placer CountyCalifornia (District) alleging that the Rio Bravo Rocklin facility located in Lincoln, California had violated certain District air emissionregulations. We have a combined 50% ownership interest in the partnership which owns the Rio Bravo Rocklin facility. The NOVs allege atotal of 38 violations between January 2003 and March 2005 of either the facility’s air permit or federal, state, and county air emissionstandards related to nitrogen oxide, carbon monoxide, and particulate emissions, as well as violations of certain monitoring and reportingrequirements during that time period. The maximum civil penalties for the alleged violations range from $10,000 to $40,000 per violation.Management of the Rio Bravo Rocklin facility is currently discussing the allegations in the NOVs with District representatives. It is notpossible to determine the actual liability, if any, of the partnership that owns the Rio Bravo Rocklin facility.
LitigationIn the normal course of business, we are involved in various legal proceedings. We discuss the significant matters below.City of Tacoma v. AEP, et al.,—The City of Tacoma, on June 7, 2004, in the U.S. District Court, Western District of Washington, filed acomplaint against over 60 companies, including Constellation Energy Commodities Group, Inc. (CCG). The complaint alleges that thedefendants engaged in manipulation of electricity markets resulting in prices for power in the western power markets that were substantiallyabove what market prices would have been in the absence of the alleged unlawful contracts, combinations and conspiracy in violation ofSection 1 of the Sherman Act. The complaint further alleges that the total amount of damages is unknown, but is estimated to exceed$175 million. On February 11, 2005, the Court granted the defendants’ motion to dismiss the action based on the Court’s lack of jurisdictionover the claims in
17
Source: CONSTELLATION ENERGY, 10-Q, May 10, 2007

question. The plaintiff appealed the dismissal of the action to the Ninth Circuit Court of Appeals, but subsequently agreed to a dismissal withprejudice, which the Ninth Circuit Court ordered on March 20, 2007.
Challenges to the Illinois AuctionIn March 2007, the Illinois Attorney General filed a complaint at FERC against the wholesale suppliers, including our wholesale marketing,risk management and trading operation, that were successful bidders in the recent Illinois auction. The complaint alleges that the ratesresulting from the auction are not “just and reasonable” and requests that FERC commence a proceeding to determine if the rates are just andreasonable and to investigate evidence of price manipulation.
In addition, two class action complaints have been filed in Illinois state court against these wholesale suppliers alleging that they engagedin deceptive practices, including colluding in setting prices and actual price fixing. The complaints seek unspecified damages in an amount tobe proven at trial.
We believe we have meritorious defenses to these claims challenging the Illinois auction and our conduct in the auction and intend todefend against them vigorously. However, we cannot predict the timing, or outcome, of these proceedings, or their possible effect on ourfinancial results.
MercurySince September 2002, BGE, Constellation Energy, and several other defendants have been involved in numerous actions filed in the CircuitCourt for Baltimore City, Maryland alleging mercury poisoning from several sources, including coal plants formerly owned by BGE. Theplants are now owned by a subsidiary of Constellation Energy. In addition to BGE and Constellation Energy, approximately 11 otherdefendants, consisting of pharmaceutical companies, manufacturers of vaccines, and manufacturers of Thimerosal have been sued.Approximately 70 cases, involving claims related to approximately 132 children, have been filed to date, with each claimant seeking$20 million in compensatory damages, plus punitive damages, from us.
In rulings applicable to all but six of the cases, involving claims related to approximately 50 children, the Circuit Court for BaltimoreCity dismissed with prejudice all claims against BGE and Constellation Energy. Plaintiffs may attempt to pursue appeals of the rulings infavor of BGE and Constellation Energy once the cases are finally concluded as to all defendants. We believe that we have meritoriousdefenses and intend to defend the remaining actions vigorously. However, we cannot predict the timing, or outcome, of these cases, or theirpossible effect on our, or BGE’s, financial results.
AsbestosSince 1993, BGE and certain Constellation Energy subsidiaries have been involved in several actions concerning asbestos. The actions arebased upon the theory of “premises liability,” alleging that BGE and Constellation Energy knew of and exposed individuals to an asbestoshazard. BGE and Constellation Energy, and numerous other parties are defendants in these cases.
Approximately 535 individuals who were never employees of BGE or Constellation Energy have pending claims each seeking severalmillion dollars in compensatory and punitive damages. Cross-claims and third-party claims brought by other defendants may also be filedagainst BGE and Constellation Energy in these actions. To date, most asbestos claims against us have been dismissed or resolved without anypayment and a small minority have been resolved for amounts that were not material to our financial results. The remaining claims arecurrently pending in state courts in Maryland and Pennsylvania.
BGE and Constellation Energy do not know the specific facts necessary to estimate their potential liability for these claims. The specificfacts we do not know include:
♦ the identity of the facilities at which the plaintiffs allegedly worked as contractors,♦ the names of the plaintiffs’ employers,♦ the dates on which and the places where the exposure allegedly occurred, and♦ the facts and circumstances relating to the alleged exposure.Until the relevant facts are determined, we are unable to estimate what our, or BGE’s, liability might be. Although insurance and hold
harmless agreements from contractors who employed the plaintiffs may cover a portion of any awards in the actions, the potential effect onour, or BGE’s, financial results could be material.
InsuranceWe discuss our nuclear and non-nuclear insurance programs in Note 12 of our 2006 Annual Report on Form 10-K.
18
Source: CONSTELLATION ENERGY, 10-Q, May 10, 2007
SFAS No. 133 Hedging ActivitiesWe are exposed to market risk, including changes in interest rates and the impact of market fluctuations in the price and transportation costsof electricity, natural gas, and other commodities. We discuss our market risk in more detail in our 2006 Annual Report on Form 10-K.
Commodity PricesOur merchant energy business uses a variety of derivative and non-derivative instruments to manage the commodity price risk of ourcompetitive supply activities and our electric generation facilities, including power sales, fuel and energy purchases, gas purchased for resale,emission credits, weather risk, and the market risk of outages. In order to manage these risks, we may enter into fixed-price derivative ornon-derivative contracts to hedge the variability in future cash flows from forecasted sales of energy and purchases of fuel and energy. Theobjectives for entering into such hedges include:
♦ fixing the price for a portion of anticipated future electricity sales at a level that provides an acceptable return on our electricgeneration operations,
♦ fixing the price of a portion of anticipated fuel purchases for the operation of our power plants,♦ fixing the price for a portion of anticipated energy purchases to supply our load-serving customers, and♦ fixing the price for a portion of anticipated sales of natural gas to customers.The portion of forecasted transactions hedged may vary based upon management’s assessment of market, weather, operational, and other
factors.Our merchant energy business designated certain fixed-price forward contracts as cash-flow hedges of forecasted sales of energy and
forecasted purchases of fuel and energy for the years 2007 through 2015 under Statement of Financial Accounting Standard (SFAS) No. 133,Accounting for Derivative Instruments and Hedging Activities, as amended. Our merchant energy business had net unrealized pre-tax losseson these cash-flow hedges recorded in “Accumulated other comprehensive loss” of $1,084.1 million at March 31, 2007 and $2,227.1 millionat December 31, 2006.
We expect to reclassify $409.4 million of net pre-tax losses on cash-flow hedges from “Accumulated other comprehensive loss” intoearnings during the next twelve months based on market prices at March 31, 2007. However, the actual amount reclassified into earningscould vary from the amounts recorded at March 31, 2007, due to future changes in market prices. Additionally, for cash-flow hedges settledby physical delivery of the underlying commodity, “Reclassification of net losses on hedging instruments from OCI to net income” representsthe fair value of those derivatives, which is realized through gross settlement at the contract price. We recognized into earnings a $16.5million pre-tax loss for the quarter ended March 31, 2007 and a $5.2 million pre-tax loss for the quarter ended March 31, 2006 related tocash-flow hedge ineffectiveness.
In addition, during the quarter ended March 31, 2007, we de-designated contracts previously designated as cash-flow hedges for whichthe forecasted transactions originally hedged are probable of not occurring and as a result we recognized a pre-tax loss of $21.6 million. Wediscuss the transaction that accounts for substantially all of this amount in more detail in the Acquisitions section on page 12. During thequarter ended March 31, 2006, we de-designated contracts previously designated as cash-flow hedges and as a result we recognized a pre-taxloss of $10.5 million.
Our merchant energy business also enters into natural gas storage contracts under which the gas in storage qualifies for fair value hedgeaccounting treatment under SFAS No. 133. We recognized a $2.2 million pre-tax loss for the quarter ended March 31, 2007 and a $1.0million pre-tax net loss for the quarter ended March 31, 2006 due to hedge ineffectiveness. In addition, we recognized a $1.3 million pre-taxgain for the quarter ended March 31, 2007 related to the change in value for the portion of our fair value hedges excluded fromineffectiveness testing.
We record changes in fair value of these hedges related to our retail competitive supply operations as a component of “Fuel andpurchased energy expenses” in our Consolidated Statements of Income. We record changes in fair value of these hedges related to ourwholesale competitive supply operations as a component of “Nonregulated revenues” in our Consolidated Statements of Income.
Interest RatesWe use interest rate swaps to manage our interest rate exposures associated with new debt issuances, to manage our exposure to fluctuationsin interest rates on variable rate debt, and to optimize the mix of fixed and floating-rate debt. The swaps used to manage our exposure prior tothe issuance of new debt are designated as cash-flow hedges under SFAS No. 133, with the effective portion of gains and losses, net ofassociated deferred income tax effects, recorded in “Accumulated other comprehensive loss” in anticipation of planned financingtransactions. We reclassify gains and losses on the hedges from “Accumulated other comprehensive loss” into “Interest expense” in ourConsolidated Statements of Income during the periods in which the interest payments being hedged occur.
The swaps used to optimize the mix of fixed and floating-rate debt are designated as fair value hedges under SFAS No. 133. We recordany gains or losses on swaps that qualify for fair value hedge accounting treatment, as well as changes in the fair value of the debt beinghedged, in “Interest expense,” and we record any changes in fair value of the swaps and the debt in “Risk management assets and
19
Source: CONSTELLATION ENERGY, 10-Q, May 10, 2007

liabilities” and “Long-term debt” in our Consolidated Balance Sheets. In addition, we record the difference between interest on hedgedfixed-rate debt and floating-rate swaps in “Interest expense” in the periods that the swaps settle.
“Accumulated other comprehensive loss” includes net unrealized pre-tax gains on interest rate cash-flow hedges terminated upon debtissuance totaling $11.8 million at March 31, 2007 and $12.5 million at December 31, 2006. We expect to reclassify $0.1 million of pre-taxnet losses on these cash-flow hedges from “Accumulated other comprehensive loss” into “Interest expense” during the next twelve months.We had no hedge ineffectiveness on these swaps.
In order to optimize the mix of fixed and floating-rate debt, we entered into interest rate swaps qualifying as fair value hedges relating to$450.0 million of our fixed-rate debt maturing in 2012 and 2015, and converted this notional amount of debt to floating-rate. The fair value ofthese hedges was an unrealized gain of $1.6 million at March 31, 2007 and was recorded as an increase in our “Risk management assets” and“Long-term debt.” The fair value of these hedges was an unrealized loss of $7.1 million at December 31, 2006 and was recorded as anincrease in our “Risk management liabilities” and a decrease in our “Long-term debt.” We had no hedge ineffectiveness on these interest rateswaps.
Accounting Standards IssuedSFAS No. 159In February 2007, the FASB issued SFAS No. 159, The Fair Value Option for Financial Assets and Financial Liabilities—including anamendment of FASB Statement No. 115. SFAS No. 159 provides the option to report at fair value certain financial instruments that are notcurrently required or permitted to be measured at fair value. This option would be applied on an instrument by instrument basis. If elected,unrealized gains and losses on the affected financial instruments would be recognized in earnings at each subsequent reporting date. SFASNo. 159 is effective beginning January 1, 2008. We are currently assessing the provisions of SFAS No. 159; however, while the applicationof the fair value accounting would be optional, the impact of fair value accounting, if elected, could be material to our, or BGE’s, financialresults.
FSP FIN 39-1In April 2007, the FASB issued Staff Position (FSP) FIN 39-1, Amendment of FASB Interpretation No. 39. FSP FIN 39-1 permits an entity toreport all derivatives recorded at fair value with any associated fair value cash collateral, which are with the same counterparty under amaster netting arrangement, together in the balance sheet. Our wholesale competitive supply operation reports derivative amounts undermaster netting arrangements net in accordance with FIN 39, Offsetting of Amounts Related to Certain Contracts; however, we report fairvalue cash collateral separate from our derivative amounts. Under the provisions of this FSP, we must either report net all derivativesrecorded at fair value with the associated fair value cash collateral or report all derivative amounts gross. The effects of FSP FIN 39-1 mustbe applied by adjusting all financial statements presented beginning January 1, 2008. We are currently evaluating the impact of this FSP;however, this FSP could have a material impact on our financial results.
Accounting Standards AdoptedFIN 48In July 2006, the FASB issued FIN 48. FIN 48 provides guidance for the recognition and measurement of an entity’s uncertain tax positions.These are defined as positions taken in a previously filed tax return or positions expected to be taken in future tax returns and which result in,among other things, a permanent reduction of income taxes payable, a deferral of income taxes otherwise currently payable to future years, ora change in the expected ability to realize deferred tax assets. Under FIN 48, we are required to recognize the financial statement effects oftax positions if they meet a “more-likely-than-not” threshold. In evaluating items relative to this threshold, we must assess whether each taxposition will be sustained based solely on its technical merits assuming examination by a taxing authority.
For those uncertain tax positions that we have recognized in our financial statements, we establish liabilities to reflect the portion of thosepositions we cannot conclude are “more likely than not” to be realized upon ultimate settlement. These are referred to as liabilities forunrecognized tax benefits under FIN 48. We recognize interest and penalties related to unrecognized tax benefits in “Income tax expense” inour Consolidated Statements of Income.
20
Source: CONSTELLATION ENERGY, 10-Q, May 10, 2007

The adoption of FIN 48 on January 1, 2007, resulted in our recording a $7.3 million incremental liability for unrecognized tax benefitsand a corresponding reduction in “Retained earnings” in our Consolidated Balance Sheets as a cumulative effect of change in accountingprinciple. We also reclassified $49.4 million from existing tax liabilities (primarily deferred income taxes) to the new FIN 48 liability forunrecognized tax benefits. Our resulting total $56.7 million FIN 48 liability for unrecognized tax benefits includes $12.1 million of accruedinterest and penalties.
Additionally, FIN 48 requires disclosure of total unrecognized tax benefits, regardless of whether or not these amounts are reflected inour balance sheet. We have $59.4 million of unrecognized tax benefits related to outstanding federal and state refund claims for which no taxbenefit was previously provided in our financial statements because the claims do not meet the “more-likely-than-not” threshold. Included inthis amount is $48.3 million of refund claims that have been disallowed by the applicable tax authorities for which we assess the probabilityof tax benefit recognition to be remote.
The following table summarizes our total unrecognized tax benefits at January 1, 2007. There have been no significant changes to ourunrecognized tax benefits during the quarter ended March 31, 2007.
(In millions)
Total liabilities reflected in our balance sheet for unrecognized tax benefits of $56.7 million less $12.1million of interest and penalties
$ 44.6
Other unrecognized tax benefits not reflected in our balance sheet
59.4
Total unrecognized tax benefits
$ 104.0
If the total amount of unrecognized tax benefits of $104.0 million were ultimately realized, our income tax expense would decrease byapproximately $65 million; however, this includes the $48.3 million of disallowed refund claims discussed above.
We file income tax returns in the United States and foreign jurisdictions. With few exceptions, we are no longer subject to U.S. federal,state and local, or non-U.S. income tax examinations by tax authorities for years before 2002. The IRS commenced an examination of ourU.S. income tax returns for 2002, 2003, and 2004 in the third quarter of 2005. We anticipate that these examinations will be completed by theend of 2007.
Recently, the IRS has proposed certain adjustments to our 2002-2004 deductions for repairs and casualty losses. We do not anticipate theadjustments, if any, would result in a material impact on our financial results. However, we anticipate that it is reasonably possible that anadditional payment in the range of $20 to $25 million will be made by March 31, 2008, which will reduce our liabilities for unrecognized taxbenefits.
The adoption of FIN 48 did not have a material impact on BGE’s financial results.
Related Party Transactions—BGEIncome StatementBGE is obligated to provide market-based standard offer service to all of its electric customers for varying periods. Bidding to supply BGE’smarket-based standard offer service to electric customers will occur from time to time through a competitive bidding process approved by theMaryland PSC.
Our wholesale marketing, risk management, and trading operation will supply a substantial portion of BGE’s market-based standard offerservice obligation to residential electric customers through May 31, 2007, as well as a portion of BGE’s market-based standard offer serviceobligations for electric customers from June 1, 2007 through May 31, 2009.
The cost of BGE’s purchased energy from nonregulated subsidiaries of Constellation Energy to meet its standard offer service obligationwas $302.7 million for the quarter ended March 31, 2007 compared to $187.6 million for the same period in 2006.
In addition, Constellation Energy charges BGE for the costs of certain corporate functions. Certain costs are directly assigned to BGE.We allocate other corporate function costs based on a total percentage of expected use by BGE. We believe this method of allocation isreasonable and approximates the cost BGE would have incurred as an unaffiliated entity. These costs were approximately $34.3 million forthe quarter ended March 31, 2007 compared to $31.6 million for the quarter ended March 31, 2006.
Balance SheetBGE participates in a cash pool under a Master Demand Note agreement with Constellation Energy. Under this arrangement, participatingsubsidiaries may invest in or borrow from the pool at market interest rates. Constellation Energy administers the pool and invests excess cashin short-term investments or issues commercial paper to manage consolidated cash requirements. Under this arrangement, BGE had borrowed$151.7 million at March 31, 2007 and had invested $60.6 million at December 31, 2006.
BGE’s Consolidated Balance Sheets include intercompany amounts related to corporate functions performed at the Constellation Energyholding company, BGE’s purchases to meet its standard offer service obligation, BGE’s charges to Constellation Energy and its nonregulatedaffiliates for certain services it provides them, and the participation of BGE’s employees in the Constellation Energy defined benefit plans.
We believe our allocation methods are reasonable and approximate the costs that would be charged to unaffiliated entities.21
Source: CONSTELLATION ENERGY, 10-Q, May 10, 2007
Item 2. Management’s Discussion
Management’s Discussion and Analysis of Financial Condition and Results of Operations
Introduction and OverviewConstellation Energy Group, Inc. (Constellation Energy) is an energy company that conducts its business through various subsidiariesincluding a merchant energy business and Baltimore Gas and Electric Company (BGE). We describe our operating segments in the Notes toConsolidated Financial Statements on page 13.
This Quarterly Report on Form 10-Q is a combined report of Constellation Energy and BGE. References in this report to “we” and “our”are to Constellation Energy and its subsidiaries, collectively. References in this report to the “regulated business(es)” are to BGE. We discussour business in more detail in Item 1—Business section of our 2006 Annual Report on Form 10-K and we discuss the risks affecting ourbusiness in Item 1A. Risk Factors section on page 42.
Our 2006 Annual Report on Form 10-K includes a detailed discussion of various items impacting our business, our results of operations,and our financial condition. These include:
♦ Introduction and Overview section which provides a description of our business segments,♦ Strategy section,♦ Business Environment section, including how regulation, weather, and other factors affect our business, and♦ Critical Accounting Policies section.Critical accounting policies are the accounting policies that are most important to the portrayal of our financial condition and results of
operations and require management’s most difficult, subjective, or complex judgment. Our critical accounting policies include derivativeaccounting, evaluation of assets for impairment and other than temporary decline in value, and asset retirement obligations.
In this discussion and analysis, we explain the general financial condition and the results of operations for Constellation Energy and BGEincluding:
♦ factors which affect our businesses,♦ our earnings and costs in the periods presented,♦ changes in earnings and costs between periods,♦ sources of earnings,♦ impact of these factors on our overall financial condition,♦ expected future expenditures for capital projects, and♦ expected sources of cash for further capital expenditures.As you read this discussion and analysis, refer to our Consolidated Statements of Income on page 3, which present the results of our
operations for the quarters ended March 31, 2007 and 2006. We analyze and explain the differences between periods in the specific line itemsof the Consolidated Statements of Income.
We have organized our discussion and analysis as follows:♦ We describe changes to our business environment during the year.♦ We highlight significant events that occurred in 2007 that are important to understanding our results of operations and financial
condition.♦ We then review our results of operations beginning with an overview of our total company results, followed by a more detailed review
of those results by operating segment.♦ We review our financial condition, addressing our sources and uses of cash, capital resources, commitments, and liquidity.♦ We conclude with a discussion of our exposure to various market risks.
Business EnvironmentWith the evolving regulatory environment surrounding customer choice, increasing competition, and the growth of our merchant energybusiness, various factors affect our financial results. We discuss these various factors in the Forward Looking Statements section on page 42and in Item 1A. Risk Factors section on page 42. We discuss our market risks in the Market Risk section beginning on page 39.
In this section, we discuss in more detail events which have impacted our business during 2007.
Regulation by the Maryland PSCIn April 2007, Senate Bill 400 was enacted, which makes certain modifications to Senate Bill 1. We discuss Senate Bill 1 in more detail inItem 1. Business—Electric Regulatory Matters and Competition section of our 2006 Annual Report on Form 10-K. Under Senate Bill 400,the Maryland Public Service Commission (Maryland PSC) is required to initiate several studies including studies relating to stranded costs,the costs and benefits of various options for regulation, and the structure of the electric power sector. The Maryland PSC is required to submitan interim report by December 1, 2007 and a final report by December 1, 2008. We cannot at this time predict the outcome of these studies ortheir actual effect on our, or BGE’s, financial results, but it could be material.
Environmental MattersAir QualityNational Ambient Air Quality Standards (NAAQS)In March 2007, the Environmental Protection Agency (EPA) filed a petition to seek a rehearing on a December 2006 decision of the UnitedStates Court of
22
Source: CONSTELLATION ENERGY, 10-Q, May 10, 2007

Appeals for the District of Columbia Circuit in which the Court ruled that the EPA must impose fees on emissions sources that failed toachieve applicable ozone standards retroactive to November 2005. At this time, we cannot predict whether the Court will grant a rehearing,the outcome of a rehearing or whether the fees will be retroactively assessed. Any fees that are ultimately assessed could have a materialimpact on our financial results.
New Source ReviewIn April 2007, the U.S. Supreme Court issued a decision regarding the standard to be used to measure emissions when the EPA’s new sourcereview requirements are triggered but did not address when those requirements are triggered. We do not believe the Court’s decision willhave a material impact on our financial results.
Global Climate ChangeIn April 2007, the U.S. Supreme Court ruled that the EPA has authority to regulate carbon dioxide (CO 2) emissions from automobiles.Although the decision did not address CO2 emissions from stationary sources such as power generation facilities, federal legislation orregulation addressing CO2 emissions from other sources may now be more likely. We cannot predict the nature or timing of anyCO2 legislation or regulation, but any compliance costs we incur could have a material impact on our financial results.
Also in April 2007, Maryland became a full participant in the Northeast Regional Greenhouse Gas Initiative (RGGI). We discuss RGGIin more detail in Item 1—Business section of our 2006 Annual Report on Form 10-K.
Capital ExpendituresAs discussed in our 2006 Annual Report on Form 10-K, we expect to incur additional environmental capital expenditures to comply with airquality laws and regulations. Based on updated information from vendors, we expect our estimated environmental capital requirements to beapproximately $265 million in 2007, $490 million in 2008, $325 million in 2009 and $30 million from 2010-2011.
Our estimates may change further as we implement our compliance plan. As discussed in our 2006 Annual Report on Form 10-K, ourestimates of capital expenditures continue to be subject to significant uncertainties.
Accounting Standards Issued and AdoptedWe discuss recently issued and adopted accounting standards in the Accounting Standards Issued and Accounting Standards Adopted sectionsof the Notes to Consolidated Financial Statements beginning on page 20.
Events of 2007AcquisitionsWorking Interests in Gas Producing FieldsIn March 2007, we acquired working interests in gas and oil producing fields. We discuss this acquisition in more detail in the Notes toConsolidated Financial Statements on page 12.
Coalbed Methane PropertiesIn April 2007, Constellation Energy Partners LLC (CEP) acquired certain coalbed methane properties for an aggregate purchase price ofapproximately $115 million. In connection with the financing of this acquisition, CEP issued equity resulting in cash proceeds ofapproximately $60 million. We discuss this acquisition and related issuance of equity in more detail in the Notes to Consolidated FinancialStatements beginning on page 12.
Contract and Portfolio AcquisitionsIn the first quarter of 2007, our wholesale marketing, risk management and trading operation reached an agreement for the purchase of aportfolio of power-related contracts in the southeast region of the United States. Upon closing of the transaction, we will assume severallong-term full-requirements fixed-price power supply agreements. The peak demand under these agreements is more than 3,000 megawatts,and these agreements terminate at various dates through 2015.
We will also enter into several long-term tolling agreements that terminate at various dates through 2015. In addition to the power supplyand tolling agreements, we will also receive various power and natural gas hedges.
The transaction is expected to close during the second quarter of 2007. We expect to receive approximately $350 million in cash atclosing as consideration for assuming all of these contracts, which were executed by the counterparty at prices that differ from current marketprices.
Cornerstone EnergyIn March 2007, our retail competitive supply operation signed an agreement to acquire 100% ownership of Cornerstone Energy, Inc.(Cornerstone Energy) for approximately $100 million. Cornerstone Energy provides natural gas supply and related services to more than8,500 commercial, industrial, and institutional customers primarily in the Central United States and is expected to add 100 billion cubic feetof natural gas to our annual volumes served.
The transaction is expected to close later in 2007, subject to standard closing conditions.
23
Source: CONSTELLATION ENERGY, 10-Q, May 10, 2007

Synthetic Fuel Tax CreditsAs discussed in our 2006 Annual Report on Form 10-K, the Internal Revenue Code provides for a phase-out of synthetic fuel tax credits ifaverage annual wellhead oil prices increase above certain levels. For 2007, we estimate the tax credit reduction would begin if the referenceprice exceeds approximately $56 per barrel and would be fully phased out if the reference price exceeds approximately $70 per barrel.
Based on forward market prices and volatilities and current production levels as of March 31, 2007, we estimate a 29% tax creditphase-out in 2007. We discuss the impact of synthetic fuel tax credits on our total income tax expense and effective tax rate in the Notes toConsolidated Financial Statements on page 15.
Based on forward market prices and volatilities and current production levels as of April 27, 2007, we continue to estimate a 29% taxcredit phase-out in 2007. However, the ultimate amount of tax credits phased-out for 2007, if any, is subject to change based on the actualreference price and production levels for the entire year.
Results of Operations for the Quarter Ended March 31, 2007 Compared with the Same Period of 2006
In this section, we discuss our earnings and the factors affecting them. We begin with a general overview, then separately discuss earnings forour operating segments. Changes in other income, fixed charges, and income taxes are discussed, as necessary, in the aggregate for allsegments in the Consolidated Nonoperating Income and Expenses section on page 35.
OverviewResults
Quarter EndedMarch 31,
2007
2006
(In millions, after-tax)
Merchant energy
$ 121.6
$ 32.2
Regulated electric
32.2
33.6
Regulated gas
33.7
35.0
Other nonregulated
9.8
0.8
Income from continuing operations
197.3
101.6
(Loss) income from discontinued operations
(1.6)
12.3
Net Income
$ 195.7
$ 113.9
Other Items Included in Operations:
Non-qualifying hedges
$ (9.2)
$ (9.7)
Merger-related costs
—
(1.5)
Workforce reduction costs
—
(1.3)
Total Other Items
$ (9.2)
$ (12.5)
Certain prior-period amounts have been reclassified to conform with the current period’s presentation.
Quarter Ended March 31, 2007Our total net income for the quarter ended March 31, 2007 increased $81.8 million, or $0.44 per share, compared to the same period of 2006mostly because of the following:
♦ We had higher earnings of approximately $93 million after-tax at our merchant energy business due to higher gross margin from theMid-Atlantic Region. We discuss this increase in gross margin in more detail in the Mid-Atlantic Region section beginning on page 27.
♦ We had higher earnings of approximately $17 million after-tax from other income mostly due to an increase in interest incomeresulting from a higher cash balance.
♦ We had higher earnings of $15.7 million after-tax at our retail competitive supply operation primarily due to an increase in grossmargin, partially offset by higher operating expenses mostly due to the growth of this operation. We discuss our retail gross margin inmore detail in the Competitive Supply section on page 27.
♦ We had higher earnings of $14.9 million after-tax from our facilities that produce synthetic fuel, which included the recognition of$7.9 million after-tax related to the true-up of 2006 tax credits and phase-out for the final 2006 IRS inflation adjustment factor. Wediscuss the impact of synthetic fuel tax credits from these facilities in more detail in the Notes to Consolidated Financial Statements onpage 15.
These increases were partially offset by the following:♦ We had lower earnings of approximately $43 million after-tax due to lower gross margin and increased operating expenses at our
wholesale competitive supply operation. We discuss our mark-to-market and wholesale accrual results in more detail in the CompetitiveSupply section beginning on page 27.
♦ We had lower earnings from discontinued operations of $13.9 million after-tax.In the following sections, we discuss our net income by business segment in greater detail.
Merchant Energy BusinessBackgroundOur merchant energy business is a competitive provider of energy solutions for various customers. We discuss the impact of deregulation onour merchant energy business in Item 1. Business—Competition section of our 2006 Annual Report on Form 10-K.
Our merchant energy business focuses on delivery of physical, customer-oriented products to producers and24
Source: CONSTELLATION ENERGY, 10-Q, May 10, 2007

Source: CONSTELLATION ENERGY, 10-Q, May 10, 2007

consumers, manages the risk and optimizes the value of our owned generation assets, and uses our portfolio management and tradingcapabilities both to manage risk and to deploy risk capital to generate additional returns. We continue to identify and pursue opportunitieswhich can generate additional returns through portfolio management and trading activities within our business. These opportunities haveincreased due to the significant growth in scale of our competitive supply operations.
We record merchant energy revenues and expenses in our financial results in different periods depending upon which portion of ourbusiness they affect. We discuss our revenue recognition policies in the Critical Accounting Policies section and Note 1 of our 2006 AnnualReport on Form 10-K. We summarize our revenue and expense recognition policies as follows:
♦ We record revenues as they are earned and fuel and purchased energy costs as they are incurred for contracts and activities subject toaccrual accounting, including certain load-serving activities.
♦ Prior to the settlement of the forecasted transaction being hedged, we record changes in the fair value of contracts designated ascash-flow hedges in other comprehensive income to the extent that the hedges are effective. We record the effective portion of thechanges in fair value of hedges in earnings in the period the settlement of the hedged transaction occurs. We record the ineffectiveportion of the changes in fair value of hedges, if any, in earnings in the period in which the change occurs.
♦ We record changes in the fair value of contracts that are subject to mark-to-market accounting in revenues or fuel and purchasedenergy expenses in the period in which the change occurs.
Mark-to-market accounting requires us to make estimates and assumptions using judgment in determining the fair value of certaincontracts and in recording revenues from those contracts. We discuss the effects of mark-to-market accounting on our results in theCompetitive Supply—Mark-to-Market section beginning on page 27.
Our wholesale marketing, risk management, and trading operation actively transacts in energy and energy-related commodities in order tomanage our portfolio of energy purchases and sales to customers through structured transactions. As part of these activities, we trade energyand energy-related commodities and deploy risk capital in the management of our portfolio in order to earn additional returns. Theseactivities are managed through daily value at risk and stop loss limits and liquidity guidelines, and may have a material impact on ourfinancial results. We discuss the impact of our trading activities and value at risk in more detail in the Competitive Supply—Mark-to-Marketsection beginning on page 27 and the Market Risk section on page 39.Results
Quarter EndedMarch 31,
2007
2006
(In millions)
Revenues $ 4,386.4
$ 4,083.3
Fuel and purchased energy expenses
(3,708.8) (3,548.0)Operating expenses
(420.2) (362.3)
Workforce reduction costs
—
(2.2)Merger-related costs
—
(1.3)
Depreciation, depletion, and amortization
(62.9) (64.1)Accretion of asset retirement obligations
(17.7) (16.5)
Taxes other than income taxes
(26.8) (29.5)Income from Operations
$ 150.0
$ 59.4
Income from continuing operations (after-tax) $ 121.6
$ 32.2
(Loss) income from discontinued operations (after-tax)
(1.6) 11.4
Net Income $ 120.0
$ 43.6
Other Items Included in Operations (after-tax):
Non-qualifying hedges $ (9.2) $ (9.7)
Merger-related costs
—
(1.0)Workforce reduction costs
—
(1.3)
Total Other Items $ (9.2) $ (12.0)
Certain prior-period amounts have been reclassified to conform with the current period’s presentation. Above amounts include intercompanytransactions eliminated in our Consolidated Financial Statements. The Information by Operating Segment section within the Notes toConsolidated Financial Statements on page 14 provides a reconciliation of operating results by segment to our Consolidated FinancialStatements.
Revenues and Fuel and Purchased Energy ExpensesOur merchant energy business manages the revenues we realize from the sale of energy to our customers and our costs of procuring fuel andenergy. As previously discussed, our merchant energy business uses either accrual or mark-to-market accounting to record our revenues andexpenses. Mark-to-market results reflect the net impact of amounts recorded in either revenues or fuel and purchased energy expenses torecognize the changes in fair value of derivative contracts subject to mark-to-market accounting during the reporting period.
The difference between revenues and fuel and purchased energy expenses, including all direct expenses, is the gross margin of ourmerchant energy business, and this measure is a useful tool for assessing the profitability of our merchant energy business. Accordingly, webelieve it is appropriate to discuss the operating results of our merchant energy business by analyzing the changes in gross margin betweenperiods. In managing our portfolio, we may terminate, restructure, or acquire contracts. Such transactions are within the normal course ofmanaging our portfolio and may materially impact the timing of our
25
Source: CONSTELLATION ENERGY, 10-Q, May 10, 2007
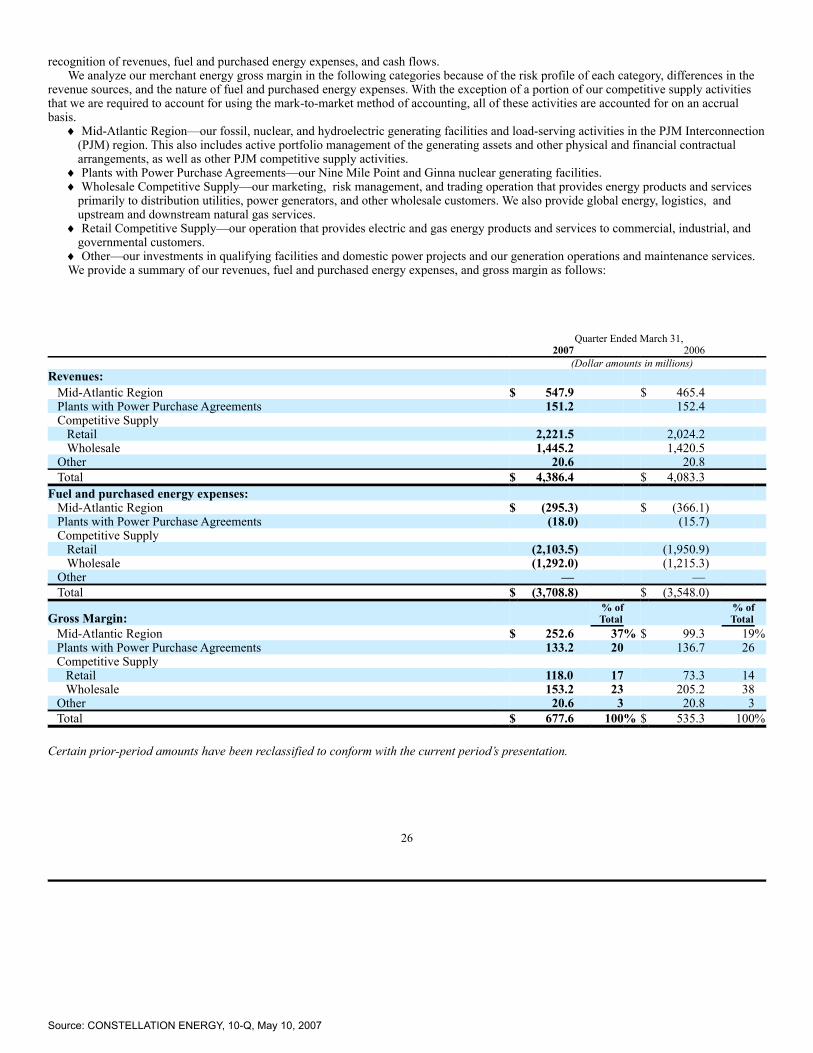
recognition of revenues, fuel and purchased energy expenses, and cash flows.We analyze our merchant energy gross margin in the following categories because of the risk profile of each category, differences in the
revenue sources, and the nature of fuel and purchased energy expenses. With the exception of a portion of our competitive supply activitiesthat we are required to account for using the mark-to-market method of accounting, all of these activities are accounted for on an accrualbasis.
♦ Mid-Atlantic Region—our fossil, nuclear, and hydroelectric generating facilities and load-serving activities in the PJM Interconnection(PJM) region. This also includes active portfolio management of the generating assets and other physical and financial contractualarrangements, as well as other PJM competitive supply activities.
♦ Plants with Power Purchase Agreements—our Nine Mile Point and Ginna nuclear generating facilities.♦ Wholesale Competitive Supply—our marketing, risk management, and trading operation that provides energy products and services
primarily to distribution utilities, power generators, and other wholesale customers. We also provide global energy, logistics, andupstream and downstream natural gas services.
♦ Retail Competitive Supply—our operation that provides electric and gas energy products and services to commercial, industrial, andgovernmental customers.
♦ Other—our investments in qualifying facilities and domestic power projects and our generation operations and maintenance services.We provide a summary of our revenues, fuel and purchased energy expenses, and gross margin as follows:
Quarter Ended March 31,
2007
2006
(Dollar amounts in millions)
Revenues:
Mid-Atlantic Region
$ 547.9
$ 465.4
Plants with Power Purchase Agreements
151.2
152.4
Competitive Supply
Retail
2,221.5
2,024.2
Wholesale
1,445.2
1,420.5
Other
20.6
20.8
Total
$ 4,386.4
$ 4,083.3
Fuel and purchased energy expenses:
Mid-Atlantic Region
$ (295.3)
$ (366.1)
Plants with Power Purchase Agreements
(18.0)
(15.7)
Competitive Supply
Retail
(2,103.5)
(1,950.9)
Wholesale
(1,292.0)
(1,215.3)
Other
—
—
Total
$ (3,708.8)
$ (3,548.0)
Gross Margin:
% ofTotal
% ofTotal
Mid-Atlantic Region
$ 252.6
37% $ 99.3
19%Plants with Power Purchase Agreements
133.2
20
136.7
26
Competitive Supply
Retail
118.0
17
73.3
14
Wholesale
153.2
23
205.2
38
Other
20.6
3
20.8
3
Total
$ 677.6
100% $ 535.3
100%
Certain prior-period amounts have been reclassified to conform with the current period’s presentation.
26
Source: CONSTELLATION ENERGY, 10-Q, May 10, 2007

Mid-Atlantic Region
Quarter EndedMarch 31,
2007
2006
(In millions)
Revenues
$ 547.9 $ 465.4
Fuel and purchased energy expenses
(295.3) (366.1)Gross margin
$ 252.6
$ 99.3
The increase in gross margin during the quarter ended March 31, 2007 compared to the same period of 2006 is primarily due toapproximately $174 million in higher margins on new and existing contracts, which included the effect of the expiration of below-markethedges. This increase in gross margin included higher revenues from BGE of approximately $115 million.
As discussed in our 2006 Annual Report on Form 10-K, our wholesale marketing, risk management, and trading operation servedfixed-price standard offer service obligations to BGE from July 1, 2000 until July 1, 2006. The increase from higher margins on new andexisting contracts was partially offset by the absence of competitive transition charge (CTC) revenue of $21 million. In June 2006, allcustomers completed their CTC obligation.
Plants with Power Purchase Agreements
Quarter EndedMarch 31,
2007
2006
(In millions)
Revenues
$ 151.2 $ 152.4
Fuel and purchased energy expenses
(18.0) (15.7)Gross margin
$ 133.2
$ 136.7
Gross margin from our Plants with Power Purchase Agreements was about the same during the quarter ended March 31, 2007 compared tothe same period of 2006.
Competitive SupplyWe analyze our retail accrual, wholesale accrual and mark-to-market competitive supply activities separately below.
Retail
Quarter EndedMarch 31,
2007
2006
(In millions)
Accrual revenues
$ 2,222.8 $ 2,016.8
Fuel and purchased energy expenses
(2,100.4) (1,934.0)Retail accrual activities
122.4
82.8
Mark-to-market activities
(4.4) (9.5)Gross margin
$ 118.0
$ 73.3
The increase in accrual gross margin from our retail competitive supply activities during the quarter endedMarch 31, 2007 compared to the same period of 2006 is primarily due to:
♦ approximately $30 million from the positive impact of higher contract rates per megawatt hour and lower costs to serve load, and♦ approximately $5 million from serving 2 million more megawatt hours and 10 billion cubic feet more of natural gas.
Wholesale
Quarter EndedMarch 31,
2007
2006
(In millions)
Accrual revenues
$ 1,488.0 $ 1,323.2
Fuel and purchased energy expenses
(1,292.0) (1,215.3)Wholesale accrual activities
196.0
107.9
Mark-to-market activities
(42.8) 97.3
Gross margin
$ 153.2 $ 205.2
Our wholesale marketing, risk management, and trading operation had higher accrual gross margin during the quarter ended March 31, 2007compared to the same period of 2006 primarily due to approximately $122 million from new contracts executed during 2007, higher realizedgross margin associated with existing contracts, and the favorable impact of higher energy prices.
These increases in gross margin were partially offset by the recognition of approximately $34 million in losses for amounts reclassifiedfrom “Accumulated other comprehensive loss” to earnings related to:
♦ as discussed in more detail in the Notes to Consolidated Financial Statements beginning on page 12, as a result of the anticipated CEPequity issuance and subsequent deconsolidation, we determined that the hedged forecasted sales were probable of not occurring, which
Source: CONSTELLATION ENERGY, 10-Q, May 10, 2007

resulted in the reclassification of losses from “Accumulated other comprehensive loss” into earnings.♦ as discussed in more detail on the next page, we amended certain nonderivative contracts such that the new contracts are accounted for
as mark-to-market. This resulted in the recognition of losses from cash-flow hedges previously deferred in “Accumulated othercomprehensive loss” due to the forecasted transaction affecting earnings.
Mark-to-MarketMark-to-market results include net gains and losses from origination, trading, and risk management activities for which we use themark-to-market method of accounting. We discuss these activities and the mark-to-market method of accounting in more detail in the CriticalAccounting Policies section of our 2006 Annual Report on Form 10-K.
27
Source: CONSTELLATION ENERGY, 10-Q, May 10, 2007
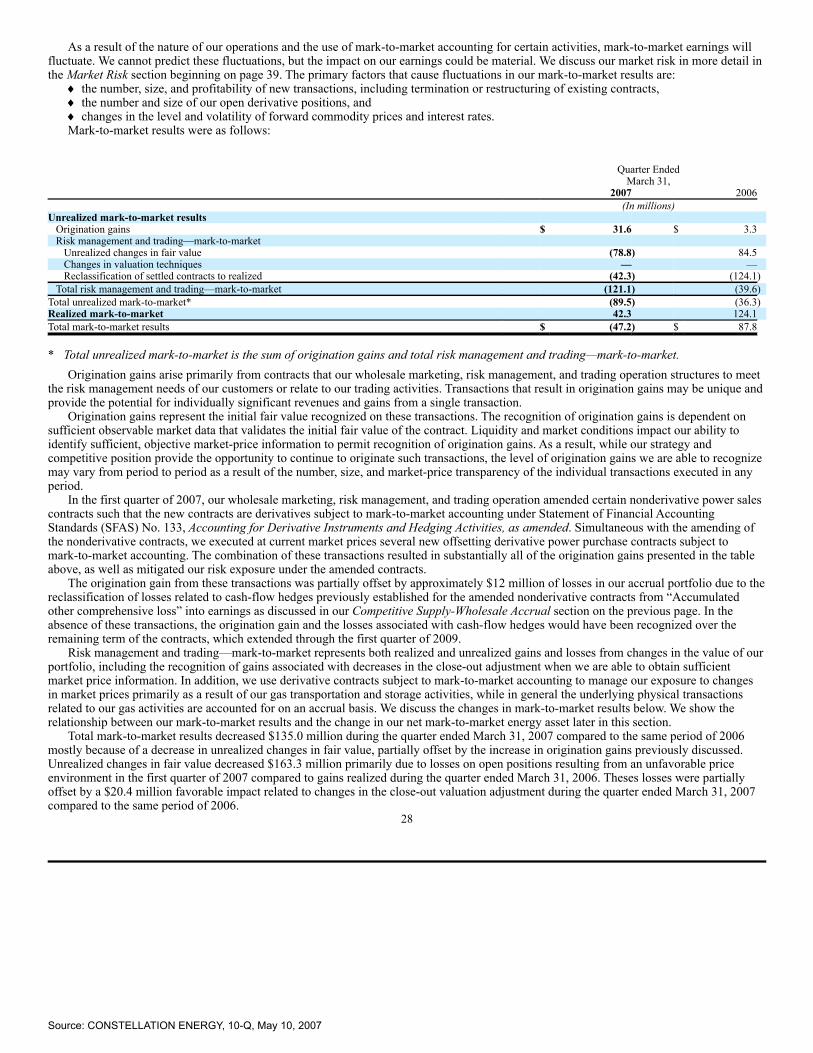
As a result of the nature of our operations and the use of mark-to-market accounting for certain activities, mark-to-market earnings willfluctuate. We cannot predict these fluctuations, but the impact on our earnings could be material. We discuss our market risk in more detail inthe Market Risk section beginning on page 39. The primary factors that cause fluctuations in our mark-to-market results are:
♦ the number, size, and profitability of new transactions, including termination or restructuring of existing contracts,♦ the number and size of our open derivative positions, and♦ changes in the level and volatility of forward commodity prices and interest rates.Mark-to-market results were as follows:
Quarter EndedMarch 31,
2007
2006
(In millions)
Unrealized mark-to-market results
Origination gains
$ 31.6 $ 3.3
Risk management and trading—mark-to-market
Unrealized changes in fair value
(78.8) 84.5
Changes in valuation techniques
—
—
Reclassification of settled contracts to realized
(42.3) (124.1)Total risk management and trading—mark-to-market
(121.1) (39.6)
Total unrealized mark-to-market*
(89.5) (36.3)Realized mark-to-market
42.3
124.1
Total mark-to-market results
$ (47.2) $ 87.8
* Total unrealized mark-to-market is the sum of origination gains and total risk management and trading—mark-to-market.Origination gains arise primarily from contracts that our wholesale marketing, risk management, and trading operation structures to meet
the risk management needs of our customers or relate to our trading activities. Transactions that result in origination gains may be unique andprovide the potential for individually significant revenues and gains from a single transaction.
Origination gains represent the initial fair value recognized on these transactions. The recognition of origination gains is dependent onsufficient observable market data that validates the initial fair value of the contract. Liquidity and market conditions impact our ability toidentify sufficient, objective market-price information to permit recognition of origination gains. As a result, while our strategy andcompetitive position provide the opportunity to continue to originate such transactions, the level of origination gains we are able to recognizemay vary from period to period as a result of the number, size, and market-price transparency of the individual transactions executed in anyperiod.
In the first quarter of 2007, our wholesale marketing, risk management, and trading operation amended certain nonderivative power salescontracts such that the new contracts are derivatives subject to mark-to-market accounting under Statement of Financial AccountingStandards (SFAS) No. 133, Accounting for Derivative Instruments and Hedging Activities, as amended. Simultaneous with the amending ofthe nonderivative contracts, we executed at current market prices several new offsetting derivative power purchase contracts subject tomark-to-market accounting. The combination of these transactions resulted in substantially all of the origination gains presented in the tableabove, as well as mitigated our risk exposure under the amended contracts.
The origination gain from these transactions was partially offset by approximately $12 million of losses in our accrual portfolio due to thereclassification of losses related to cash-flow hedges previously established for the amended nonderivative contracts from “Accumulatedother comprehensive loss” into earnings as discussed in our Competitive Supply-Wholesale Accrual section on the previous page. In theabsence of these transactions, the origination gain and the losses associated with cash-flow hedges would have been recognized over theremaining term of the contracts, which extended through the first quarter of 2009.
Risk management and trading—mark-to-market represents both realized and unrealized gains and losses from changes in the value of ourportfolio, including the recognition of gains associated with decreases in the close-out adjustment when we are able to obtain sufficientmarket price information. In addition, we use derivative contracts subject to mark-to-market accounting to manage our exposure to changesin market prices primarily as a result of our gas transportation and storage activities, while in general the underlying physical transactionsrelated to our gas activities are accounted for on an accrual basis. We discuss the changes in mark-to-market results below. We show therelationship between our mark-to-market results and the change in our net mark-to-market energy asset later in this section.
Total mark-to-market results decreased $135.0 million during the quarter ended March 31, 2007 compared to the same period of 2006mostly because of a decrease in unrealized changes in fair value, partially offset by the increase in origination gains previously discussed.Unrealized changes in fair value decreased $163.3 million primarily due to losses on open positions resulting from an unfavorable priceenvironment in the first quarter of 2007 compared to gains realized during the quarter ended March 31, 2006. Theses losses were partiallyoffset by a $20.4 million favorable impact related to changes in the close-out valuation adjustment during the quarter ended March 31, 2007compared to the same period of 2006.
28
Source: CONSTELLATION ENERGY, 10-Q, May 10, 2007
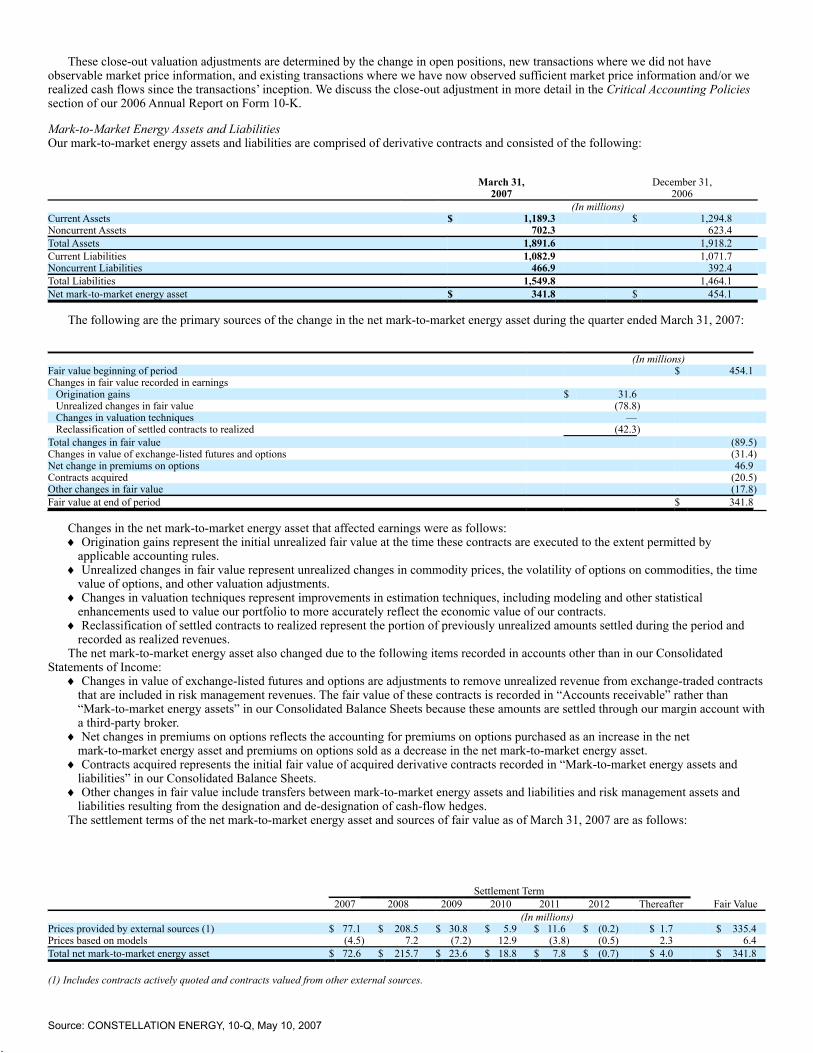
These close-out valuation adjustments are determined by the change in open positions, new transactions where we did not haveobservable market price information, and existing transactions where we have now observed sufficient market price information and/or werealized cash flows since the transactions’ inception. We discuss the close-out adjustment in more detail in the Critical Accounting Policiessection of our 2006 Annual Report on Form 10-K.
Mark-to-Market Energy Assets and LiabilitiesOur mark-to-market energy assets and liabilities are comprised of derivative contracts and consisted of the following:
March 31,2007
December 31,2006
(In millions)
Current Assets
$ 1,189.3
$ 1,294.8
Noncurrent Assets
702.3
623.4
Total Assets
1,891.6
1,918.2
Current Liabilities
1,082.9
1,071.7
Noncurrent Liabilities
466.9
392.4
Total Liabilities
1,549.8
1,464.1
Net mark-to-market energy asset
$ 341.8
$ 454.1
The following are the primary sources of the change in the net mark-to-market energy asset during the quarter ended March 31, 2007:
(In millions)
Fair value beginning of period
$ 454.1
Changes in fair value recorded in earnings
Origination gains
$ 31.6
Unrealized changes in fair value
(78.8)
Changes in valuation techniques
—
Reclassification of settled contracts to realized
(42.3)
Total changes in fair value
(89.5)Changes in value of exchange-listed futures and options
(31.4)
Net change in premiums on options
46.9
Contracts acquired
(20.5)Other changes in fair value
(17.8)
Fair value at end of period
$ 341.8
Changes in the net mark-to-market energy asset that affected earnings were as follows:♦ Origination gains represent the initial unrealized fair value at the time these contracts are executed to the extent permitted by
applicable accounting rules.♦ Unrealized changes in fair value represent unrealized changes in commodity prices, the volatility of options on commodities, the time
value of options, and other valuation adjustments.♦ Changes in valuation techniques represent improvements in estimation techniques, including modeling and other statistical
enhancements used to value our portfolio to more accurately reflect the economic value of our contracts.♦ Reclassification of settled contracts to realized represent the portion of previously unrealized amounts settled during the period and
recorded as realized revenues.The net mark-to-market energy asset also changed due to the following items recorded in accounts other than in our Consolidated
Statements of Income:♦ Changes in value of exchange-listed futures and options are adjustments to remove unrealized revenue from exchange-traded contracts
that are included in risk management revenues. The fair value of these contracts is recorded in “Accounts receivable” rather than“Mark-to-market energy assets” in our Consolidated Balance Sheets because these amounts are settled through our margin account witha third-party broker.
♦ Net changes in premiums on options reflects the accounting for premiums on options purchased as an increase in the netmark-to-market energy asset and premiums on options sold as a decrease in the net mark-to-market energy asset.
♦ Contracts acquired represents the initial fair value of acquired derivative contracts recorded in “Mark-to-market energy assets andliabilities” in our Consolidated Balance Sheets.
♦ Other changes in fair value include transfers between mark-to-market energy assets and liabilities and risk management assets andliabilities resulting from the designation and de-designation of cash-flow hedges.
The settlement terms of the net mark-to-market energy asset and sources of fair value as of March 31, 2007 are as follows:
Settlement Term
2007
2008
2009
2010
2011
2012
Thereafter
Fair Value
(In millions)
Prices provided by external sources (1)
$ 77.1 $ 208.5
$ 30.8
$ 5.9
$ 11.6
$ (0.2)
$ 1.7
$ 335.4
Prices based on models
(4.5) 7.2
(7.2) 12.9
(3.8) (0.5)
2.3
6.4
Total net mark-to-market energy asset
$ 72.6 $ 215.7
$ 23.6
$ 18.8
$ 7.8
$ (0.7)
$ 4.0
$ 341.8
(1) Includes contracts actively quoted and contracts valued from other external sources.
Source: CONSTELLATION ENERGY, 10-Q, May 10, 2007

29
Source: CONSTELLATION ENERGY, 10-Q, May 10, 2007
We manage our mark-to-market risk on a portfolio basis based upon the delivery period of our contracts and the individual componentsof the risks within each contract. Accordingly, we record and manage the energy purchase and sale obligations under our contracts in separatecomponents based upon the commodity (e.g., electricity or gas), the product (e.g., electricity for delivery during peak or off-peak hours), thedelivery location (e.g., by region), the risk profile (e.g., forward or option), and the delivery period (e.g., by month and year).
Consistent with our risk management practices, we have presented the information in the table on the previous page based upon theability to obtain reliable prices for components of the risks in our contracts from external sources rather than on a contract-by-contract basis.Thus, the portion of long-term contracts that is valued using external price sources is presented under the caption “prices provided by externalsources.” This is consistent with how we manage our risk, and we believe it provides the best indication of the basis for the valuation of ourportfolio. Since we manage our risk on a portfolio basis rather than contract-by-contract, it is not practicable to determine separately theportion of long-term contracts that is included in each valuation category. We describe the commodities, products, and delivery periodsincluded in each valuation category in detail below.
The amounts for which fair value is determined using prices provided by external sources represent the portion of forward, swap, andoption contracts for which price quotations are available through brokers or over-the-counter transactions. The term for which such priceinformation is available varies by commodity, region, and product. The fair values included in this category are the following portions of ourcontracts:
♦ forward and swap purchases and sales of electricity during peak and off-peak hours for delivery terms primarily through 2010, but upto 2012, depending upon the region,
♦ options for the purchase and sale of electricity during peak hours for delivery terms through 2008, depending upon the region,♦ forward purchases and sales of electric capacity for delivery terms primarily through 2007, but up to 2008, depending upon the region,♦ forward and swap purchases and sales of natural gas, coal and oil for delivery terms primarily through 2011, and♦ options for the purchase and sale of natural gas, coal, and oil for delivery terms through 2008.The remainder of the net mark-to-market energy asset is valued using models. The portion of contracts for which such techniques are
used includes standard products for which external prices are not available and customized products that are valued using modelingtechniques to determine expected future market prices, contract quantities, or both.
Modeling techniques include estimating the present value of cash flows based upon underlying contractual terms and incorporate, whereappropriate, option pricing models and statistical and simulation procedures. Inputs to the models include:
♦ observable market prices,♦ estimated market prices in the absence of quoted market prices,♦ the risk-free market discount rate,♦ volatility factors,♦ estimated correlation of energy commodity prices, and♦ expected generation profiles of specific regions.Additionally, we incorporate counterparty-specific credit quality and factors for market price and volatility uncertainty and other risks in
our valuation. The inputs and factors used to determine fair value reflect management's best estimates.The electricity, fuel, and other energy contracts we hold have varying terms to maturity, ranging from contracts for delivery the next hour
to contracts with terms of ten years or more. Because an active, liquid electricity futures market comparable to that for other commodities hasnot developed, the majority of contracts used in the wholesale marketing, risk management, and trading operation are direct contractsbetween market participants and are not exchange-traded or financially settling contracts that can be readily liquidated in their entiretythrough an exchange or other market mechanism. Consequently, we and other market participants generally realize the value of thesecontracts as cash flows become due or payable under the terms of the contracts rather than through selling or liquidating the contractsthemselves.
Consistent with our risk management practices, the amounts shown in the table on the previous page as being valued using prices fromexternal sources include the portion of long-term contracts for which we can obtain reliable prices from external sources. The remainingportions of these long-term contracts are shown in the table as being valued using models. In order to realize the entire value of a long-termcontract in a single transaction, we would need to sell or assign the entire contract. If we were to sell or assign any of our long-term contractsin their entirety, we may not realize the entire value reflected in the table. However, based upon the nature of the wholesale marketing, riskmanagement, and trading operation, we expect to realize the value of these contracts, as well as any contracts we may enter into in the futureto manage our risk, over time as the contracts and related hedges settle in accordance with their terms. Generally, we do not expect to realizethe value of these contracts and related hedges by selling or assigning the contracts themselves in total.
30
Source: CONSTELLATION ENERGY, 10-Q, May 10, 2007
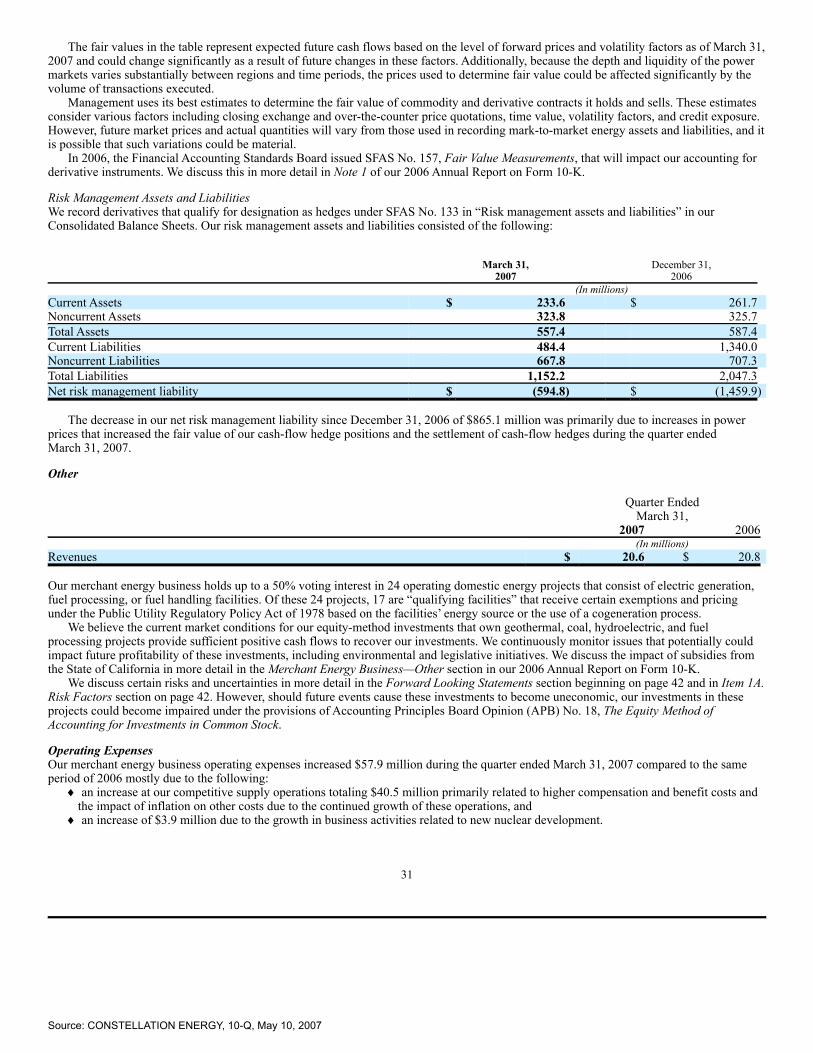
The fair values in the table represent expected future cash flows based on the level of forward prices and volatility factors as of March 31,2007 and could change significantly as a result of future changes in these factors. Additionally, because the depth and liquidity of the powermarkets varies substantially between regions and time periods, the prices used to determine fair value could be affected significantly by thevolume of transactions executed.
Management uses its best estimates to determine the fair value of commodity and derivative contracts it holds and sells. These estimatesconsider various factors including closing exchange and over-the-counter price quotations, time value, volatility factors, and credit exposure.However, future market prices and actual quantities will vary from those used in recording mark-to-market energy assets and liabilities, and itis possible that such variations could be material.
In 2006, the Financial Accounting Standards Board issued SFAS No. 157, Fair Value Measurements, that will impact our accounting forderivative instruments. We discuss this in more detail in Note 1 of our 2006 Annual Report on Form 10-K.
Risk Management Assets and LiabilitiesWe record derivatives that qualify for designation as hedges under SFAS No. 133 in “Risk management assets and liabilities” in ourConsolidated Balance Sheets. Our risk management assets and liabilities consisted of the following:
March 31,2007
December 31,2006
(In millions)
Current Assets
$ 233.6
$ 261.7
Noncurrent Assets
323.8
325.7
Total Assets
557.4
587.4
Current Liabilities
484.4
1,340.0
Noncurrent Liabilities
667.8
707.3
Total Liabilities
1,152.2
2,047.3
Net risk management liability
$ (594.8) $ (1,459.9)
The decrease in our net risk management liability since December 31, 2006 of $865.1 million was primarily due to increases in powerprices that increased the fair value of our cash-flow hedge positions and the settlement of cash-flow hedges during the quarter endedMarch 31, 2007.
Other
Quarter EndedMarch 31,
2007
2006
(In millions)
Revenues
$ 20.6 $ 20.8
Our merchant energy business holds up to a 50% voting interest in 24 operating domestic energy projects that consist of electric generation,fuel processing, or fuel handling facilities. Of these 24 projects, 17 are “qualifying facilities” that receive certain exemptions and pricingunder the Public Utility Regulatory Policy Act of 1978 based on the facilities’ energy source or the use of a cogeneration process.
We believe the current market conditions for our equity-method investments that own geothermal, coal, hydroelectric, and fuelprocessing projects provide sufficient positive cash flows to recover our investments. We continuously monitor issues that potentially couldimpact future profitability of these investments, including environmental and legislative initiatives. We discuss the impact of subsidies fromthe State of California in more detail in the Merchant Energy Business—Other section in our 2006 Annual Report on Form 10-K.
We discuss certain risks and uncertainties in more detail in the Forward Looking Statements section beginning on page 42 and in Item 1A.Risk Factors section on page 42. However, should future events cause these investments to become uneconomic, our investments in theseprojects could become impaired under the provisions of Accounting Principles Board Opinion (APB) No. 18, The Equity Method ofAccounting for Investments in Common Stock.
Operating ExpensesOur merchant energy business operating expenses increased $57.9 million during the quarter ended March 31, 2007 compared to the sameperiod of 2006 mostly due to the following:
♦ an increase at our competitive supply operations totaling $40.5 million primarily related to higher compensation and benefit costs andthe impact of inflation on other costs due to the continued growth of these operations, and
♦ an increase of $3.9 million due to the growth in business activities related to new nuclear development.
31
Source: CONSTELLATION ENERGY, 10-Q, May 10, 2007

Regulated Electric BusinessOur regulated electric business is discussed in detail in Item 1. Business—Electric Business section of our 2006 Annual Report onForm 10-K.
Results
Quarter EndedMarch 31,
2007
2006
(In millions)
Revenues $ 514.8
$ 504.0
Electricity purchased for resale expenses
(274.2) (262.9)Operations and maintenance expenses
(86.3) (84.4)
Merger-related costs
—
(0.4)Depreciation and amortization
(46.9) (45.8)
Taxes other than income taxes
(35.2) (34.0)Income from Operations
$ 72.2
$ 76.5
Net Income $ 32.2
$ 33.6
Other Items Included in Operations (after-tax):
Merger-related costs $ —
$ (0.3)
Above amounts include intercompany transactions eliminated in our Consolidated Financial Statements. The Information by OperatingSegment section within the Notes to Consolidated Financial Statements on page 14 provides a reconciliation of operating results by segmentto our Consolidated Financial Statements.
Electric RevenuesThe changes in electric revenues during the quarter ended March 31, 2007 compared to the same period of 2006 were caused by:
Quarter EndedMarch 31,
2007 vs. 2006
(In millions)
Distribution volumes
$ 2.0
Standard offer service
202.1
Rate stabilization credits
(192.3)
Nuclear decommissioning credits
(5.2)
Total change in electric revenues from electric system sales
6.6
Other
4.2
Total change in electric revenues
$ 10.8
Distribution VolumesDistribution volumes are the amount of electricity that BGE delivers to customers in its service territory.
The percentage changes in our electric distribution volumes, by type of customer, during the quarter ended March 31, 2007 compared tothe same period of 2006 were:
Quarter EndedMarch 31,
2007 vs. 2006
Residential
10.0%
Commercial
3.9
Industrial
(6.5)
During the quarter ended March 31, 2007, we distributed more electricity to residential and commercial customers compared to the sameperiod of 2006 mostly due to colder weather, increased usage per customer, and an increased number of customers. We distributed lesselectricity to industrial customers primarily due to decreased usage per customer, partially offset by an increased number of customers.
Standard Offer ServiceBGE provides standard offer service for customers that do not select an alternative supplier. We discuss the provisions of Maryland’s SenateBill 1 related to residential electric rates in the Item 1. Business—Electric Regulatory Matters and Competition section of our 2006 AnnualReport on Form 10-K.
Standard offer service revenues increased during the quarter ended March 31, 2007 compared to the same period of 2006 mostly due toan increase in the standard offer service rates following the expiration of the residential rate freeze in July 2006, partially offset by lowerstandard offer service volumes mostly due to commercial and industrial customers that switched to an alternate supplier.
Rate Stabilization CreditsAs a result of Senate Bill 1, we are required to defer from July 1, 2006 until May 31, 2007 a portion of the full market rate increase resultingfrom the expiration of the residential rate freeze. Therefore, the increase in standard offer service revenues is mostly offset by rate
Source: CONSTELLATION ENERGY, 10-Q, May 10, 2007

stabilization credits in order to reduce rates for residential customers from market price to the 15% increase required by Senate Bill 1.
Nuclear Decommissioning CreditsAs a result of Senate Bill 1, beginning January 1, 2007, we were required to provide to residential electric customers a credit equal to theamount collected from all BGE ratepayers for the decommissioning of our Calvert Cliffs nuclear power plant.
32
Source: CONSTELLATION ENERGY, 10-Q, May 10, 2007

Electricity Purchased for Resale ExpensesElectricity purchased for resale expenses include the cost of electricity purchased for resale to our standard offer service customers. Thesecosts do not include the cost of electricity purchased by delivery service only customers.
Quarter EndedMarch 31,
2007
2006
(In millions)
Actual costs
$ 466.5 $ 262.9
Deferral under rate stabilization plan
(192.3) —
Electricity purchased for resale expenses
$ 274.2 $ 262.9
Actual CostsBGE’s actual costs for electricity purchased for resale increased $203.6 million during the quarter ended March 31, 2007 compared to thesame period of 2006 primarily due to higher contract prices to purchase electricity for our residential customers following the expiration ofcontracts that were executed in 2000 as part of the implementation of electric deregulation in Maryland, partially offset by lower volumesmostly due to commercial and industrial customers that switched to an alternate supplier.
Deferral under Rate Stabilization PlanWe defer the difference between our actual costs of electricity purchased for resale and what we are allowed to bill customers under SenateBill 1. During the quarter ended March 31, 2007, we deferred $192.3 million in electricity purchased for resale expenses. Since July 1, 2006,we have deferred $514.2 million in electricity purchased for resale expenses. These deferred expenses, plus carrying charges, are included in“Regulatory Assets (net)” in our, and BGE’s, Consolidated Balance Sheets.
Regulated Gas BusinessOur regulated gas business is discussed in detail in Item 1. Business—Gas Business section of our 2006 Annual Report on Form 10-K.
Results
Quarter EndedMarch 31,
2007
2006
(In millions)
Revenues $ 407.3
$ 420.2
Gas purchased for resale expenses
(284.1) (298.4)Operations and maintenance expenses
(36.8) (35.6)
Merger-related costs
—
(0.2)Depreciation and amortization
(12.0) (11.9)
Taxes other than income taxes
(10.6) (9.5)Income from operations
$ 63.8
$ 64.6
Net Income $ 33.7
$ 35.0
Other Items Included in Operations (after-tax):
Merger-related costs $ —
$ (0.2)
Above amounts include intercompany transactions eliminated in our Consolidated Financial Statements. The Information by OperatingSegment section within the Notes to Consolidated Financial Statements on page 14 provides a reconciliation of operating results by segmentto our Consolidated Financial Statements.
Gas RevenuesThe changes in gas revenues during the quarter ended March 31, 2007 compared to the same period of 2006 were caused by:
Quarter EndedMarch 31,
2007 vs. 2006
(In millions)
Distribution volumes
$ 11.2
Revenue decoupling
(12.0)
Gas cost adjustments
14.6
Total change in gas revenues from gas system sales
13.8
Off-system sales
(25.8)
Other
(0.9)
Total change in gas revenues
$ (12.9)
33
Source: CONSTELLATION ENERGY, 10-Q, May 10, 2007

Source: CONSTELLATION ENERGY, 10-Q, May 10, 2007
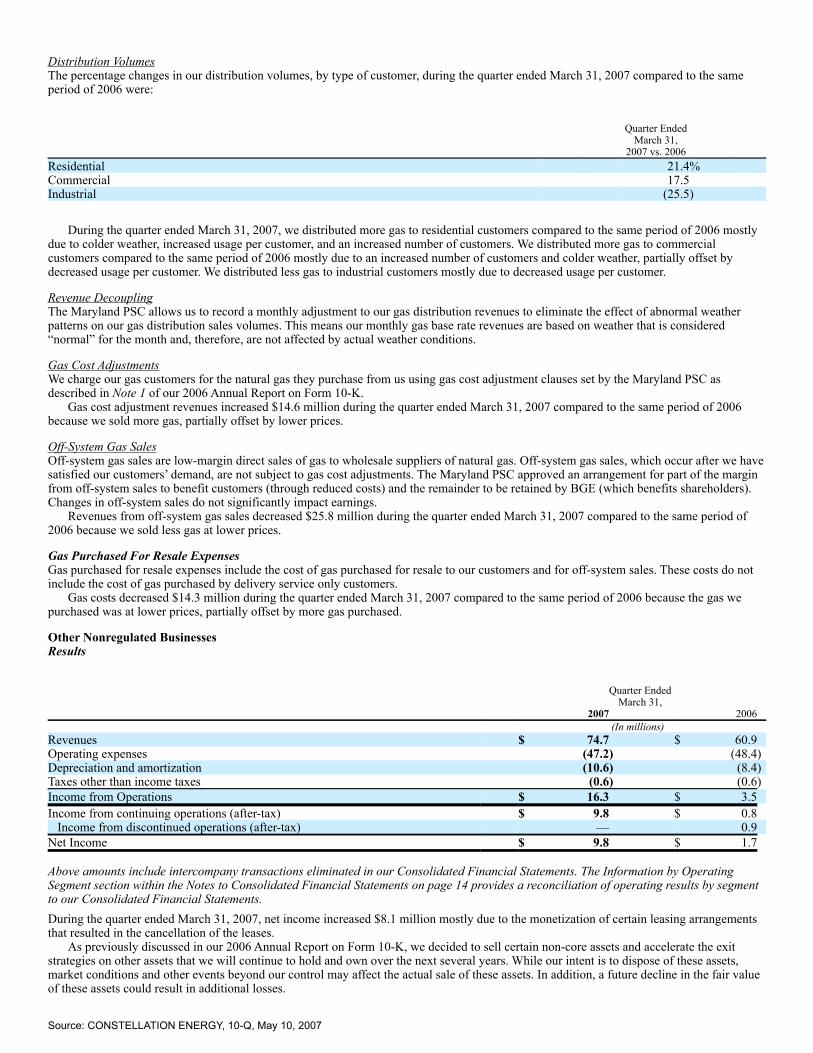
Distribution VolumesThe percentage changes in our distribution volumes, by type of customer, during the quarter ended March 31, 2007 compared to the sameperiod of 2006 were:
Quarter EndedMarch 31,
2007 vs. 2006
Residential
21.4%
Commercial
17.5
Industrial
(25.5)
During the quarter ended March 31, 2007, we distributed more gas to residential customers compared to the same period of 2006 mostlydue to colder weather, increased usage per customer, and an increased number of customers. We distributed more gas to commercialcustomers compared to the same period of 2006 mostly due to an increased number of customers and colder weather, partially offset bydecreased usage per customer. We distributed less gas to industrial customers mostly due to decreased usage per customer.
Revenue DecouplingThe Maryland PSC allows us to record a monthly adjustment to our gas distribution revenues to eliminate the effect of abnormal weatherpatterns on our gas distribution sales volumes. This means our monthly gas base rate revenues are based on weather that is considered“normal” for the month and, therefore, are not affected by actual weather conditions.
Gas Cost AdjustmentsWe charge our gas customers for the natural gas they purchase from us using gas cost adjustment clauses set by the Maryland PSC asdescribed in Note 1 of our 2006 Annual Report on Form 10-K.
Gas cost adjustment revenues increased $14.6 million during the quarter ended March 31, 2007 compared to the same period of 2006because we sold more gas, partially offset by lower prices.
Off-System Gas SalesOff-system gas sales are low-margin direct sales of gas to wholesale suppliers of natural gas. Off-system gas sales, which occur after we havesatisfied our customers’ demand, are not subject to gas cost adjustments. The Maryland PSC approved an arrangement for part of the marginfrom off-system sales to benefit customers (through reduced costs) and the remainder to be retained by BGE (which benefits shareholders).Changes in off-system sales do not significantly impact earnings.
Revenues from off-system gas sales decreased $25.8 million during the quarter ended March 31, 2007 compared to the same period of2006 because we sold less gas at lower prices.
Gas Purchased For Resale ExpensesGas purchased for resale expenses include the cost of gas purchased for resale to our customers and for off-system sales. These costs do notinclude the cost of gas purchased by delivery service only customers.
Gas costs decreased $14.3 million during the quarter ended March 31, 2007 compared to the same period of 2006 because the gas wepurchased was at lower prices, partially offset by more gas purchased.
Other Nonregulated BusinessesResults
Quarter EndedMarch 31,
2007
2006
(In millions)
Revenues
$ 74.7 $ 60.9
Operating expenses
(47.2) (48.4)Depreciation and amortization
(10.6) (8.4)
Taxes other than income taxes
(0.6) (0.6)Income from Operations
$ 16.3
$ 3.5
Income from continuing operations (after-tax)
$ 9.8 $ 0.8
Income from discontinued operations (after-tax)
—
0.9
Net Income
$ 9.8 $ 1.7
Above amounts include intercompany transactions eliminated in our Consolidated Financial Statements. The Information by OperatingSegment section within the Notes to Consolidated Financial Statements on page 14 provides a reconciliation of operating results by segmentto our Consolidated Financial Statements.During the quarter ended March 31, 2007, net income increased $8.1 million mostly due to the monetization of certain leasing arrangementsthat resulted in the cancellation of the leases.
As previously discussed in our 2006 Annual Report on Form 10-K, we decided to sell certain non-core assets and accelerate the exitstrategies on other assets that we will continue to hold and own over the next several years. While our intent is to dispose of these assets,market conditions and other events beyond our control may affect the actual sale of these assets. In addition, a future decline in the fair valueof these assets could result in additional losses.
Source: CONSTELLATION ENERGY, 10-Q, May 10, 2007

34
Source: CONSTELLATION ENERGY, 10-Q, May 10, 2007
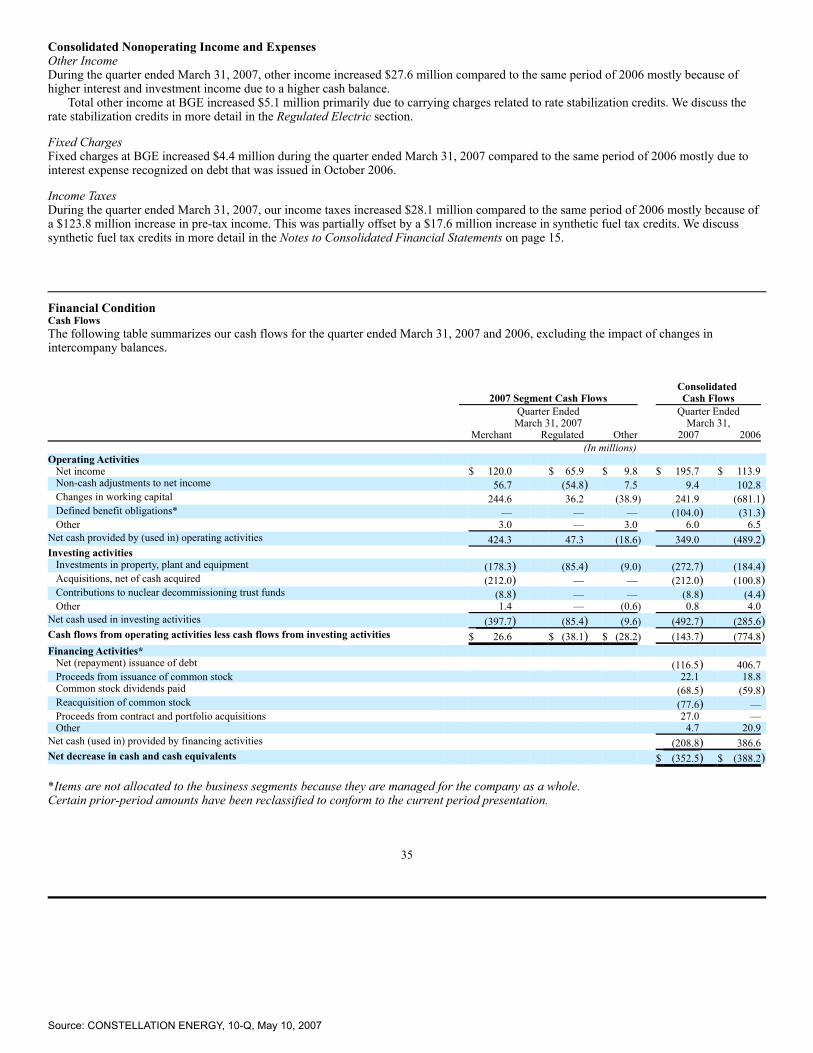
Consolidated Nonoperating Income and ExpensesOther IncomeDuring the quarter ended March 31, 2007, other income increased $27.6 million compared to the same period of 2006 mostly because ofhigher interest and investment income due to a higher cash balance.
Total other income at BGE increased $5.1 million primarily due to carrying charges related to rate stabilization credits. We discuss therate stabilization credits in more detail in the Regulated Electric section.
Fixed ChargesFixed charges at BGE increased $4.4 million during the quarter ended March 31, 2007 compared to the same period of 2006 mostly due tointerest expense recognized on debt that was issued in October 2006.
Income TaxesDuring the quarter ended March 31, 2007, our income taxes increased $28.1 million compared to the same period of 2006 mostly because ofa $123.8 million increase in pre-tax income. This was partially offset by a $17.6 million increase in synthetic fuel tax credits. We discusssynthetic fuel tax credits in more detail in the Notes to Consolidated Financial Statements on page 15.
Financial ConditionCash FlowsThe following table summarizes our cash flows for the quarter ended March 31, 2007 and 2006, excluding the impact of changes inintercompany balances.
2007 Segment Cash Flows
Consolidated Cash Flows
Quarter EndedMarch 31, 2007
Quarter EndedMarch 31,
Merchant
Regulated
Other
2007
2006
(In millions)
Operating Activities
Net income
$ 120.0
$ 65.9 $ 9.8
$ 195.7
$ 113.9
Non-cash adjustments to net income
56.7
(54.8) 7.5
9.4
102.8
Changes in working capital
244.6
36.2
(38.9) 241.9
(681.1)Defined benefit obligations*
—
—
—
(104.0) (31.3)
Other
3.0
—
3.0
6.0
6.5
Net cash provided by (used in) operating activities
424.3
47.3
(18.6) 349.0
(489.2)Investing activities
Investments in property, plant and equipment
(178.3)
(85.4) (9.0) (272.7) (184.4)Acquisitions, net of cash acquired
(212.0)
—
—
(212.0) (100.8)
Contributions to nuclear decommissioning trust funds
(8.8)
—
—
(8.8) (4.4)Other
1.4
—
(0.6) 0.8
4.0
Net cash used in investing activities
(397.7)
(85.4) (9.6) (492.7) (285.6)Cash flows from operating activities less cash flows from investing activities
$ 26.6
$ (38.1) $ (28.2) (143.7) (774.8)
Financing Activities*
Net (repayment) issuance of debt
(116.5) 406.7
Proceeds from issuance of common stock
22.1
18.8
Common stock dividends paid
(68.5) (59.8)Reacquisition of common stock
(77.6) —
Proceeds from contract and portfolio acquisitions
27.0
—
Other
4.7
20.9
Net cash (used in) provided by financing activities
(208.8) 386.6
Net decrease in cash and cash equivalents
$ (352.5) $ (388.2)
*Items are not allocated to the business segments because they are managed for the company as a whole.Certain prior-period amounts have been reclassified to conform to the current period presentation.
35
Source: CONSTELLATION ENERGY, 10-Q, May 10, 2007
Cash Flows from Operating ActivitiesCash provided by operating activities was $349.0 million in 2007 compared to cash used in operating activities of $489.2 million in 2006.This $838.2 million increase was primarily due to favorable changes in working capital.
Changes in working capital had a positive impact of $241.9 million on cash flow from operations in 2007 compared to a negative impactof $681.1 million in 2006. The net increase of $923.0 million was primarily due to cash changes related to our collateral positions, which isimpacted by commodity price volatility and increased risk management and trading activities. During the quarter ended March 31, 2007, wereceived approximately $330 million in cash due to a decrease in collateral requirements, compared to the same period of 2006, when weposted cash collateral of approximately $500 million.
This favorable increase from working capital changes was partially offset by a pension contribution that was $73 million higher in 2007compared to the same period of 2006.
Cash Flows from Investing ActivitiesCash used in investing activities was $492.7 million in 2007 compared to $285.6 million in 2006. The $207.1 million increase in cash used in2007 compared to 2006 was primarily due to the following:
♦ a $111.2 million increase in cash paid for acquisitions related to our March 2007 acquisition of working interests in gas and oilproducing properties as discussed in more detail in the Notes to Consolidated Financial Statements on page 12, and
♦ an $88.3 million increase in cash paid for investments in property, plant and equipment, which includes spending related toenvironmental controls at our generating facilities.
Cash Flows from Financing ActivitiesCash used in financing activities was $208.8 million in 2007 compared to cash provided of $386.6 million in 2006. The decrease of$595.4 million was primarily due to a net decrease in cash related to changes in short-term borrowings and long-term debt of $523.2 million,cash used for reacquisition of common stock of $77.6 million, and a $8.7 million increase in our dividends paid in 2007 compared to 2006.These decreases were partially offset by an increase in proceeds from contract and portfolio acquisitions of $27.0 million.
Contract and Portfolio AcquisitionsAs discussed in the Events of 2007 section on page 23, in the first quarter of 2007, our wholesale marketing, risk management, and tradingoperation reached an agreement for the purchase of a portfolio of power-related contracts in the southeast region of the United States. Asconsideration for assuming all of these contracts, which were executed by the counterparty at prices that differ from current market prices, weexpect to receive approximately $350 million in cash at closing during the second quarter of 2007.
Available Sources of FundingWe continuously monitor our liquidity requirements and believe that our facilities and access to the capital markets provide sufficientliquidity to meet our business requirements. We discuss our available sources of funding in more detail below.
Constellation EnergyConstellation Energy has committed bank lines of credit under credit facilities of $4.6 billion at March 31, 2007 for short-term financialneeds. We discuss these credit facilities in more detail in Note 8 of our 2006 Annual Report on Form 10-K. These facilities can issue lettersof credit up to approximately $4.1 billion. Letters of credit issued under all of our facilities totaled $1.5 billion at March 31, 2007.
In connection with the acquisition of coalbed methane properties discussed in the Notes to Consolidated Financial Statements onpage 12, CEP borrowed $10.0 million under its existing credit facility. At March 31, 2007, CEP had $32.0 million of borrowings outstandingunder its credit facility. We discuss the credit facility in more detail in Note 9 of our 2006 Annual Report on Form 10-K.
BGEBGE currently maintains a $400.0 million five-year revolving credit facility expiring in 2011. BGE can borrow directly from the banks, usethe facilities to allow commercial paper to be issued, or issue letters of credit. As of March 31, 2007, BGE had $0.6 million in letters of creditissued, which results in $399.4 million in unused credit facilities.
36
Source: CONSTELLATION ENERGY, 10-Q, May 10, 2007

Capital ResourcesOur estimated annual amounts for the years 2007 and 2008 are shown in the table below.
We will continue to have cash requirements for:♦ working capital needs,♦ payments of interest, distributions, and dividends,♦ capital expenditures, and♦ the retirement of debt and redemption of preference stock.Capital requirements for 2007 and 2008 include estimates of spending for existing and anticipated projects. We continuously review and
modify those estimates. Actual requirements may vary from the estimates included in the table below because of a number of factorsincluding:
♦ regulation, legislation, and competition,♦ BGE load requirements,♦ environmental protection standards,♦ the type and number of projects selected for construction or acquisition,♦ the effect of market conditions on those projects,♦ the cost and availability of capital,♦ the availability of cash from operations, and♦ business decisions to invest in capital projects.Our estimates are also subject to additional factors. Please see the Forward Looking Statements section beginning on page 42 and
Item 1A. Risk Factors section on page 42. We discuss the potential impact of environmental legislation and regulation in more detail inBusiness Environment section beginning on page 22 and Item 1. Business—Environmental Matters section of our 2006 Annual Report onForm 10-K.
Calendar Year Estimates
2007
2008
(In millions)
Nonregulated Capital Requirements:
Merchant energy
Generation plants
$ 245 $ 280
Nuclear fuel
150
150
Environmental controls
280
490
Portfolio acquisitions/investments
550
290
Technology/other
190
175
Total merchant energy capital requirements
1,415
1,385
Other nonregulated capital requirements
10
10
Total nonregulated capital requirements
1,425
1,395
Regulated Capital Requirements:
Regulated electric
370
380
Regulated gas
60
70
Total regulated capital requirements
430
450
Total capital requirements
$ 1,855 $ 1,845
Capital RequirementsMerchant Energy BusinessOur merchant energy business’ capital requirements consist of its continuing requirements, including expenditures for:
♦ improvements to generating plants,♦ nuclear fuel costs,♦ upstream gas investments,♦ portfolio acquisitions and other investments,♦ costs of complying with the EPA, Maryland, and Pennsylvania regulations and legislation, and♦ enhancements to our information technology infrastructure.
Regulated Electric and GasRegulated electric and gas construction expenditures primarily include new business construction needs and improvements to existingfacilities, including projects to improve reliability.
Funding for Capital RequirementsWe discuss our funding for capital requirements in our 2006 Annual Report on Form 10-K.
37
Source: CONSTELLATION ENERGY, 10-Q, May 10, 2007
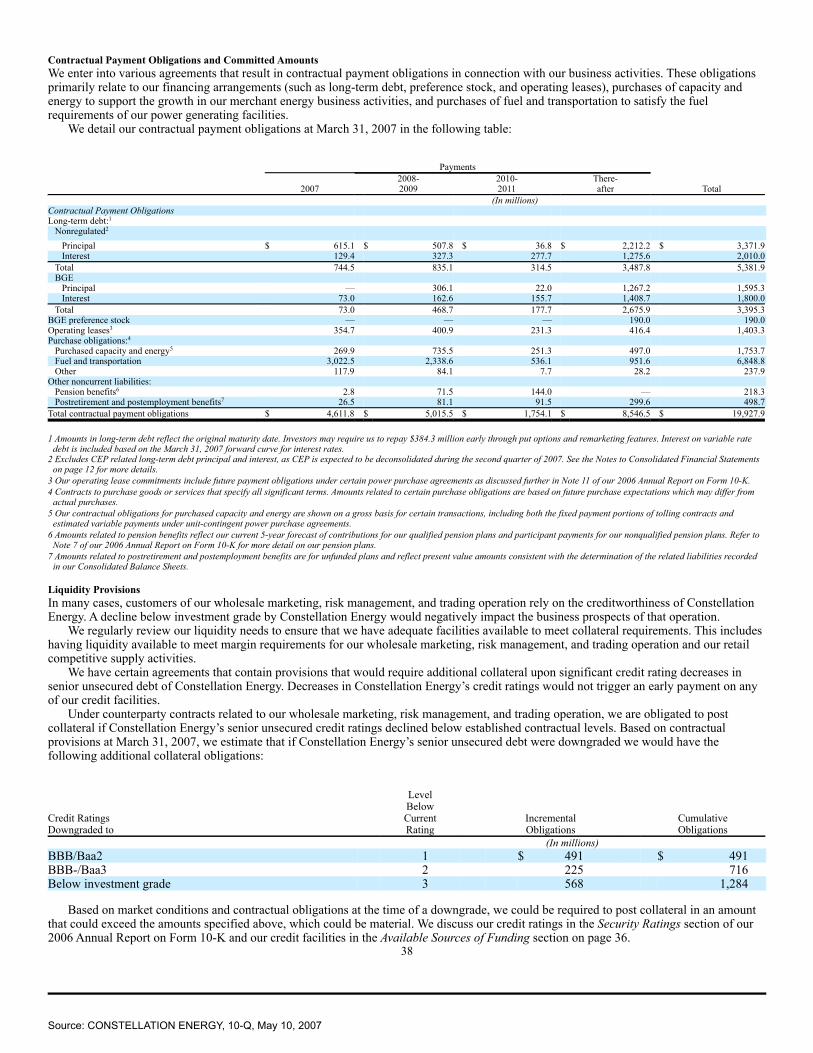
Contractual Payment Obligations and Committed AmountsWe enter into various agreements that result in contractual payment obligations in connection with our business activities. These obligationsprimarily relate to our financing arrangements (such as long-term debt, preference stock, and operating leases), purchases of capacity andenergy to support the growth in our merchant energy business activities, and purchases of fuel and transportation to satisfy the fuelrequirements of our power generating facilities.
We detail our contractual payment obligations at March 31, 2007 in the following table:
Payments
2007
2008-2009
2010-2011
There-after Total
(In millions)
Contractual Payment Obligations
Long-term debt:1
Nonregulated2
Principal $ 615.1 $ 507.8 $ 36.8 $ 2,212.2 $ 3,371.9
Interest 129.4 327.3 277.7 1,275.6 2,010.0
Total 744.5 835.1 314.5 3,487.8 5,381.9
BGE
Principal — 306.1 22.0 1,267.2 1,595.3
Interest 73.0 162.6 155.7 1,408.7 1,800.0
Total 73.0 468.7 177.7 2,675.9 3,395.3
BGE preference stock — — — 190.0 190.0
Operating leases3 354.7 400.9 231.3 416.4 1,403.3
Purchase obligations:4
Purchased capacity and energy5 269.9 735.5 251.3 497.0 1,753.7
Fuel and transportation 3,022.5 2,338.6 536.1 951.6 6,848.8
Other 117.9 84.1 7.7 28.2 237.9
Other noncurrent liabilities:
Pension benefits6 2.8 71.5 144.0 — 218.3
Postretirement and postemployment benefits7 26.5 81.1 91.5 299.6 498.7
Total contractual payment obligations $ 4,611.8 $ 5,015.5 $ 1,754.1 $ 8,546.5 $ 19,927.9
1 Amounts in long-term debt reflect the original maturity date. Investors may require us to repay $384.3 million early through put options and remarketing features. Interest on variable rate
debt is included based on the March 31, 2007 forward curve for interest rates.2 Excludes CEP related long-term debt principal and interest, as CEP is expected to be deconsolidated during the second quarter of 2007. See the Notes to Consolidated Financial Statements
on page 12 for more details.3 Our operating lease commitments include future payment obligations under certain power purchase agreements as discussed further in Note 11 of our 2006 Annual Report on Form 10-K.4 Contracts to purchase goods or services that specify all significant terms. Amounts related to certain purchase obligations are based on future purchase expectations which may differ from
actual purchases.5 Our contractual obligations for purchased capacity and energy are shown on a gross basis for certain transactions, including both the fixed payment portions of tolling contracts and
estimated variable payments under unit-contingent power purchase agreements.6 Amounts related to pension benefits reflect our current 5-year forecast of contributions for our qualified pension plans and participant payments for our nonqualified pension plans. Refer to
Note 7 of our 2006 Annual Report on Form 10-K for more detail on our pension plans.7 Amounts related to postretirement and postemployment benefits are for unfunded plans and reflect present value amounts consistent with the determination of the related liabilities recorded
in our Consolidated Balance Sheets.
Liquidity ProvisionsIn many cases, customers of our wholesale marketing, risk management, and trading operation rely on the creditworthiness of ConstellationEnergy. A decline below investment grade by Constellation Energy would negatively impact the business prospects of that operation.
We regularly review our liquidity needs to ensure that we have adequate facilities available to meet collateral requirements. This includeshaving liquidity available to meet margin requirements for our wholesale marketing, risk management, and trading operation and our retailcompetitive supply activities.
We have certain agreements that contain provisions that would require additional collateral upon significant credit rating decreases insenior unsecured debt of Constellation Energy. Decreases in Constellation Energy’s credit ratings would not trigger an early payment on anyof our credit facilities.
Under counterparty contracts related to our wholesale marketing, risk management, and trading operation, we are obligated to postcollateral if Constellation Energy’s senior unsecured credit ratings declined below established contractual levels. Based on contractualprovisions at March 31, 2007, we estimate that if Constellation Energy’s senior unsecured debt were downgraded we would have thefollowing additional collateral obligations:
Credit RatingsDowngraded to
LevelBelowCurrentRating
IncrementalObligations
CumulativeObligations
(In millions)
BBB/Baa2
1
$ 491
$ 491
BBB-/Baa3
2
225
716
Below investment grade
3
568
1,284
Based on market conditions and contractual obligations at the time of a downgrade, we could be required to post collateral in an amountthat could exceed the amounts specified above, which could be material. We discuss our credit ratings in the Security Ratings section of our2006 Annual Report on Form 10-K and our credit facilities in the Available Sources of Funding section on page 36.
38
Source: CONSTELLATION ENERGY, 10-Q, May 10, 2007

Certain credit facilities of Constellation Energy contain a provision requiring Constellation Energy to maintain a ratio of debt tocapitalization equal to or less than 65%. At March 31, 2007, the debt to capitalization ratios as defined in the credit agreements were nogreater than 47%. The failure by Constellation Energy to comply with these provisions could result in the acceleration of the maturity of thedebt outstanding under these facilities, which is primarily letters of credit issued in support of our competitive supply operations. We detailour letters of credit in the Available Sources of Funding section on page 36.
The credit agreement of BGE contains a provision requiring BGE to maintain a ratio of debt to capitalization equal to or less than 65%.At March 31, 2007, the debt to capitalization ratio for BGE as defined in this credit agreement was 46%. At March 31, 2007, no amount isoutstanding under these facilities.
Off-Balance Sheet ArrangementsWe discuss our off-balance sheet arrangements in our 2006 Annual Report on Form 10-K.
At March 31, 2007, Constellation Energy had a total of $11,808.4 million in guarantees outstanding, of which $10,678.1 million relatedto our competitive supply activities. These amounts do not represent incremental consolidated Constellation Energy obligations; rather, theyprimarily represent parental guarantees of certain subsidiary obligations to third parties. These guarantees are put into place in order to allowour subsidiaries the flexibility needed to conduct business with counterparties without having to post other forms of collateral. While thestated limit of these guarantees is $10,678.1 million, our calculated fair value of obligations for commercial transactions covered by theseguarantees was $2,983.4 million at March 31, 2007. If the parent company was required to fund these subsidiary obligations, the total amountbased on March 31, 2007 market prices would be $2,983.4 million. For those guarantees related to our mark-to-market energy or riskmanagement liabilities, the fair value of the obligation is recorded in our Consolidated Balance Sheets. We believe it is unlikely that wewould be required to perform or incur any losses associated with guarantees of our subsidiaries’ obligations.
We discuss our other guarantees in the Notes to Consolidated Financial Statements on page 16.
Market RiskCommodity RiskWe measure the sensitivity of our wholesale marketing, risk management, and trading mark-to-market energy contracts to potential changesin market prices using value at risk. Value at risk represents the potential pre-tax loss in the fair value of our wholesale marketing, riskmanagement, and trading mark-to-market energy assets and liabilities over one- and ten-day holding periods. We discuss value at risk inmore detail in the Market Risk section of our 2006 Annual Report on Form 10-K. The table below is the value at risk associated with ourwholesale marketing, risk management, and trading operation's mark-to-market energy assets and liabilities, including both trading andnon-trading activities.
We discuss our mark-to-market results in more detail in the Competitive Supply section beginning on page 27.
Quarter EndedMarch 31, 2007
(In millions)
99% Confidence Level, One-DayHolding Period
Average
$ 12.8
High
20.0
95% Confidence Level, One-DayHolding Period
Average
9.8
High
15.2
95% Confidence Level, Ten-DayHolding Period
Average
30.9
High
48.2
The following table details our value at risk for the trading portion of our wholesale marketing, risk management, and trading operation’smark-to-market energy assets and liabilities over a one-day holding period at a 99% confidence level for the first quarter of 2007:
Quarter EndedMarch 31, 2007
(In millions)
Average
$ 9.4
High
13.8
Due to the inherent limitations of statistical measures such as value at risk and the seasonality of changes in market prices, the value atrisk calculation may not reflect the full extent of our commodity price risk exposure. Additionally, actual changes in the value of options maydiffer from the value at risk calculated using a linear approximation inherent in our calculation method. As a result, actual changes in the fairvalue of mark-to-market energy assets and liabilities could differ from the calculated value at risk, and such changes could have a materialimpact on our financial results.
39
Source: CONSTELLATION ENERGY, 10-Q, May 10, 2007
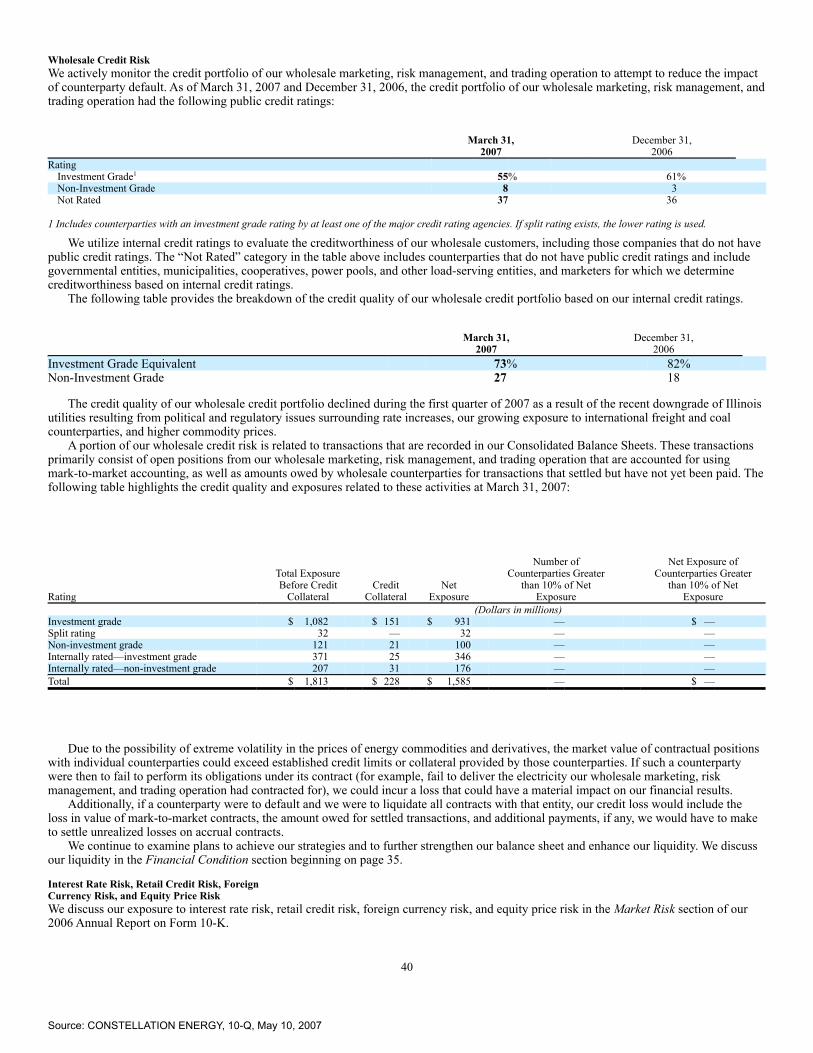
Wholesale Credit RiskWe actively monitor the credit portfolio of our wholesale marketing, risk management, and trading operation to attempt to reduce the impactof counterparty default. As of March 31, 2007 and December 31, 2006, the credit portfolio of our wholesale marketing, risk management, andtrading operation had the following public credit ratings:
March 31,2007
December 31,2006
Rating
Investment Grade1
55%
61%
Non-Investment Grade
8
3
Not Rated
37
36
1 Includes counterparties with an investment grade rating by at least one of the major credit rating agencies. If split rating exists, the lower rating is used.
We utilize internal credit ratings to evaluate the creditworthiness of our wholesale customers, including those companies that do not havepublic credit ratings. The “Not Rated” category in the table above includes counterparties that do not have public credit ratings and includegovernmental entities, municipalities, cooperatives, power pools, and other load-serving entities, and marketers for which we determinecreditworthiness based on internal credit ratings.
The following table provides the breakdown of the credit quality of our wholesale credit portfolio based on our internal credit ratings.
March 31,2007
December 31,2006
Investment Grade Equivalent
73%
82%
Non-Investment Grade
27
18
The credit quality of our wholesale credit portfolio declined during the first quarter of 2007 as a result of the recent downgrade of Illinoisutilities resulting from political and regulatory issues surrounding rate increases, our growing exposure to international freight and coalcounterparties, and higher commodity prices.
A portion of our wholesale credit risk is related to transactions that are recorded in our Consolidated Balance Sheets. These transactionsprimarily consist of open positions from our wholesale marketing, risk management, and trading operation that are accounted for usingmark-to-market accounting, as well as amounts owed by wholesale counterparties for transactions that settled but have not yet been paid. Thefollowing table highlights the credit quality and exposures related to these activities at March 31, 2007:
Rating
Total ExposureBefore Credit
Collateral
CreditCollateral
NetExposure
Number ofCounterparties Greater
than 10% of NetExposure
Net Exposure ofCounterparties Greater
than 10% of NetExposure
(Dollars in millions)
Investment grade
$ 1,082
$ 151
$ 931
—
$ —
Split rating
32
—
32
—
—
Non-investment grade
121
21
100
—
—
Internally rated—investment grade
371
25
346
—
—
Internally rated—non-investment grade
207
31
176
—
—
Total
$ 1,813
$ 228
$ 1,585
—
$ —
Due to the possibility of extreme volatility in the prices of energy commodities and derivatives, the market value of contractual positionswith individual counterparties could exceed established credit limits or collateral provided by those counterparties. If such a counterpartywere then to fail to perform its obligations under its contract (for example, fail to deliver the electricity our wholesale marketing, riskmanagement, and trading operation had contracted for), we could incur a loss that could have a material impact on our financial results.
Additionally, if a counterparty were to default and we were to liquidate all contracts with that entity, our credit loss would include theloss in value of mark-to-market contracts, the amount owed for settled transactions, and additional payments, if any, we would have to maketo settle unrealized losses on accrual contracts.
We continue to examine plans to achieve our strategies and to further strengthen our balance sheet and enhance our liquidity. We discussour liquidity in the Financial Condition section beginning on page 35.
Interest Rate Risk, Retail Credit Risk, ForeignCurrency Risk, and Equity Price RiskWe discuss our exposure to interest rate risk, retail credit risk, foreign currency risk, and equity price risk in the Market Risk section of our2006 Annual Report on Form 10-K.
40
Source: CONSTELLATION ENERGY, 10-Q, May 10, 2007

Source: CONSTELLATION ENERGY, 10-Q, May 10, 2007
Item 3. Quantitative and Qualitative Disclosures About Market Risk
We discuss the following information related to our market risk:♦ SFAS No. 133 hedging activities section in the Notes to Consolidated Financial Statements beginning on page 19,♦ activities of our wholesale marketing, risk management, and trading operation in the Merchant Energy Business section of
Management’s Discussion and Analysis beginning on page 24,♦ evaluation of commodity and credit risk in the Market Risk section of Management’s Discussion and Analysis beginning on page 39,
and♦ changes to our business environment in the Business Environment section of Management’s Discussion and Analysis beginning on
page 22.
Item 4. Controls and Procedures
A control system, no matter how well conceived and operated, can provide only reasonable, not absolute, assurance that the objectives of thecontrol system are met. Because of the inherent limitations in all control systems, no evaluation of controls can provide absolute assurancethat all control issues and instances of fraud, if any, within Constellation Energy or BGE have been detected. These inherent limitationsinclude errors by personnel in executing controls due to faulty judgment or simple mistakes, which could occur in situations such as whenpersonnel performing controls are new to a job function or when inadequate resources are applied to a process. Additionally, controls can becircumvented by the individual acts of some persons or by collusion of two or more people.
The design of any system of controls also is based in part upon certain assumptions about the likelihood of future events, and there can beno absolute assurance that any design will succeed in achieving its stated goals under all potential future conditions; over time, controls maybecome inadequate because of changes in conditions or personnel, or the degree of compliance with the policies or procedures maydeteriorate. Because of the inherent limitations in a cost-effective control system, misstatements due to error or fraud may occur and not bedetected.
Evaluation of Disclosure Controls and ProceduresThe principal executive officers and principal financial officer of both Constellation Energy and BGE have evaluated the effectiveness of thedisclosure controls and procedures (as such term is defined in Rules 13a-15(e) and 15d-15(e) under the Securities Exchange Act of 1934, asamended (the “Exchange Act”)) as of the end of the fiscal quarter covered by this quarterly report (the “Evaluation Date”). Based on suchevaluation, such officers have concluded that, as of the Evaluation Date, Constellation Energy’s and BGE’s disclosure controls andprocedures are effective.
Changes in Internal Control over Financial ReportingDuring the quarter ended March 31, 2007, there has been no change in either Constellation Energy’s or BGE’s internal control over financialreporting (as such term is defined in Rules 13a-15(f) and 15d—15(f) under the Exchange Act) that has materially affected, or is reasonablylikely to materially affect, either Constellation Energy’s or BGE’s internal control over financial reporting.
41
Source: CONSTELLATION ENERGY, 10-Q, May 10, 2007

PART II. OTHER INFORMATION
Item 1. Legal ProceedingsWe discuss our Legal Proceedings in the Notes to Consolidated Financial Statements beginning on page 17.
Item 1A. Risk FactorsThe risk factors included in our 2006 Annual Report on Form 10-K have not materially changed. You should consider carefully the risksdescribed under Item 1A. Risk Factors in our 2006 Annual Report on Form 10-K. The risks and uncertainties described in our 2006 AnnualReport on Form 10-K are not the only ones that may affect us. Additional risks and uncertainties also may adversely affect our business andoperations including those discussed in Item 2. Management’s Discussion and Analysis. If any of the events described actually occur, ourbusiness and financial results could be materially adversely affected.
Item 2. Unregistered Sales of Equity Securities and Use of ProceedsThe following table presents shares surrendered by employees to satisfy tax withholding obligations on vested restricted stock and sharesrepurchased by us in the open market to satisfy employee stock option exercises and restricted stock grants.
Period
Total Numberof SharesPurchased
Average PricePaid for Shares
Total Numberof Shares
Purchased asPart of Publicly
AnnouncedPlans or
Programs
Maximum Numberof Shares thatMay Yet Be
Purchased Underthe Plans and
Programs
January 1 – January 31, 2007
33,344
$ 68.68
—
—
February 1 – February 28, 2007
335,710
75.55
—
—
March 1 – March 31, 2007
756,000
78.55
—
—
Total
1,125,054
$ 77.36
—
—
Item 5. Other Information
Forward Looking StatementsWe make statements in this report that are considered forward looking statements within the meaning of the Securities Exchange Act of 1934.Sometimes these statements will contain words such as “believes,” “anticipates,” “expects,” “intends,” “plans,” and other similar words. Wealso disclose non-historical information that represents management’s expectations, which are based on numerous assumptions. Thesestatements and projections are not guarantees of our future performance and are subject to risks, uncertainties, and other important factorsthat could cause our actual performance or achievements to be materially different from those we project. These risks, uncertainties, andfactors include, but are not limited to:
♦ the timing and extent of changes in commodity prices and volatilities for energy and energy related products including coal, naturalgas, oil, electricity, nuclear fuel, and emission allowances,
♦ the liquidity and competitiveness of wholesale markets for energy commodities,♦ the effect of weather and general economic and business conditions on energy supply, demand, and prices,♦ the ability to attract and retain customers in our competitive supply activities and to adequately forecast their energy usage,♦ the timing and extent of deregulation of, and competition in, the energy markets, and the rules and regulations adopted in those
markets,♦ uncertainties associated with estimating natural gas reserves, developing properties, and extracting natural gas,♦ regulatory or legislative developments that affect deregulation, the price of energy, transmission or distribution rates and revenues,
demand for energy, or increases in costs, including costs related to nuclear power plants, safety, or environmental compliance,♦ the ability of our regulated and nonregulated businesses to comply with complex and/or changing market rules and regulations,♦ the inability of BGE to recover all its costs associated with providing customers service,♦ the conditions of the capital markets, interest rates, foreign exchange rates, availability of credit facilities to support business
requirements, and general economic conditions, as well as Constellation Energy and BGE’s ability to maintain their current creditratings,
42
Source: CONSTELLATION ENERGY, 10-Q, May 10, 2007

♦ the effectiveness of Constellation Energy’s and BGE’s risk management policies and procedures and the ability and willingness of ourcounterparties to satisfy their financial and performance commitments,
♦ operational factors affecting commercial operations of our generating facilities (including nuclear facilities) and BGE’s transmissionand distribution facilities, including catastrophic weather-related damages, unscheduled outages or repairs, unanticipated changes infuel costs or availability, unavailability of coal or gas transportation or electric transmission services, workforce issues, terrorism,liabilities associated with catastrophic events, and other events beyond our control,
♦ the actual outcome of uncertainties associated with assumptions and estimates using judgment when applying critical accountingpolicies and preparing financial statements, including factors that are estimated in determining the fair value of energy contracts, suchas the ability to obtain market prices and, in the absence of verifiable market prices, the appropriateness of models and model inputs(including, but not limited to, estimated contractual load obligations, unit availability, forward commodity prices, interest rates,correlation and volatility factors),
♦ changes in accounting principles or practices,♦ losses on the sale or write down of assets due to impairment events or changes in management intent with regard to either holding or
selling certain assets,♦ the ability to successfully identify and complete acquisitions and sales of businesses and assets, and♦ cost and other effects of legal and administrative proceedings that may not be covered by insurance, including environmental
liabilities.Given these uncertainties, you should not place undue reliance on these forward looking statements. Please see the other sections of this
report and our other periodic reports filed with the Securities and Exchange Commission for more information on these factors. Theseforward looking statements represent our estimates and assumptions only as of the date of this report.
Changes may occur after that date, and neither Constellation Energy nor BGE assume responsibility to update these forward lookingstatements.
43
Source: CONSTELLATION ENERGY, 10-Q, May 10, 2007

Item 6. Exhibits
Exhibit No. 3(a)*
Articles Supplementary to the Charter of Constellation Energy Group, Inc. as of April 10, 2007(Designated as Exhibit 3(a) to the Current Report on Form 8-K dated April 10, 2007, FileNo. 1-12869.)
Exhibit No. 3(b)*
By-laws of Constellation Energy Group, Inc., as amended to April 10, 2007 (Designated asExhibit 3(b) to the Current Report on Form 8-K dated April 10, 2007, File No. 1-12869.)
Exhibit No. 12(a)
Constellation Energy Group, Inc. Computation of Ratio of Earnings to Fixed Charges.Exhibit No. 12(b)
Baltimore Gas and Electric Company Computation of Ratio of Earnings to Fixed Charges andComputation of Ratio of Earnings to Combined Fixed Charges and Preferred and PreferenceDividend Requirements.
Exhibit No. 31(a)
Certification of Chairman of the Board, President, and Chief Executive Officer of ConstellationEnergy Group, Inc. pursuant to 18 U.S.C. Section 1350, as adopted pursuant to Section 302 ofthe Sarbanes-Oxley Act of 2002.
Exhibit No. 31(b)
Certification of Executive Vice President, Chief Financial Officer, and Chief AdministrativeOfficer of Constellation Energy Group, Inc. pursuant to 18 U.S.C. Section 1350, as adoptedpursuant to Section 302 of the Sarbanes-Oxley Act of 2002.
Exhibit No. 31(c)
Certification of President and Chief Executive Officer of Baltimore Gas and Electric Companypursuant to 18 U.S.C. Section 1350, as adopted pursuant to Section 302 of the Sarbanes-OxleyAct of 2002.
Exhibit No. 31(d)
Certification of Senior Vice President and Chief Financial Officer of Baltimore Gas andElectric Company pursuant to 18 U.S.C. Section 1350, as adopted pursuant to Section 302 ofthe Sarbanes-Oxley Act of 2002.
Exhibit No. 32(a)
Certification of Chairman of the Board, President, and Chief Executive Officer of ConstellationEnergy Group, Inc. pursuant to 18 U.S.C. Section 1350, as adopted pursuant to Section 906 ofthe Sarbanes-Oxley Act of 2002.
Exhibit No. 32(b)
Certification of Executive Vice President, Chief Financial Officer, and Chief AdministrativeOfficer of Constellation Energy Group, Inc. pursuant to 18 U.S.C. Section 1350, as adoptedpursuant to Section 906 of the Sarbanes-Oxley Act of 2002.
Exhibit No. 32(c)
Certification of President and Chief Executive Officer of Baltimore Gas and Electric Companypursuant to 18 U.S.C. Section 1350, as adopted pursuant to Section 906 of the Sarbanes-OxleyAct of 2002.
Exhibit No. 32(d)
Certification of Senior Vice President and Chief Financial Officer of Baltimore Gas andElectric Company pursuant to 18 U.S.C. Section 1350, as adopted pursuant to Section 906 ofthe Sarbanes-Oxley Act of 2002.
* Incorporated by reference.44
Source: CONSTELLATION ENERGY, 10-Q, May 10, 2007
SIGNATURE
Pursuant to the requirements of the Securities Exchange Act of 1934, each registrant has duly caused this report to be signed on its behalf bythe undersigned thereunto duly authorized.
CONSTELLATION ENERGY GROUP, INC.
(Registrant)
BALTIMORE GAS AND ELECTRIC COMPANY
(Registrant)Date: May 9, 2007
/s/ E. FOLLIN SMITH
E. Follin Smith,
Executive Vice President of Constellation EnergyGroup, Inc. and Senior Vice President of Baltimore Gas
and Electric Company, and as Principal FinancialOfficer of each Registrant
45
Source: CONSTELLATION ENERGY, 10-Q, May 10, 2007
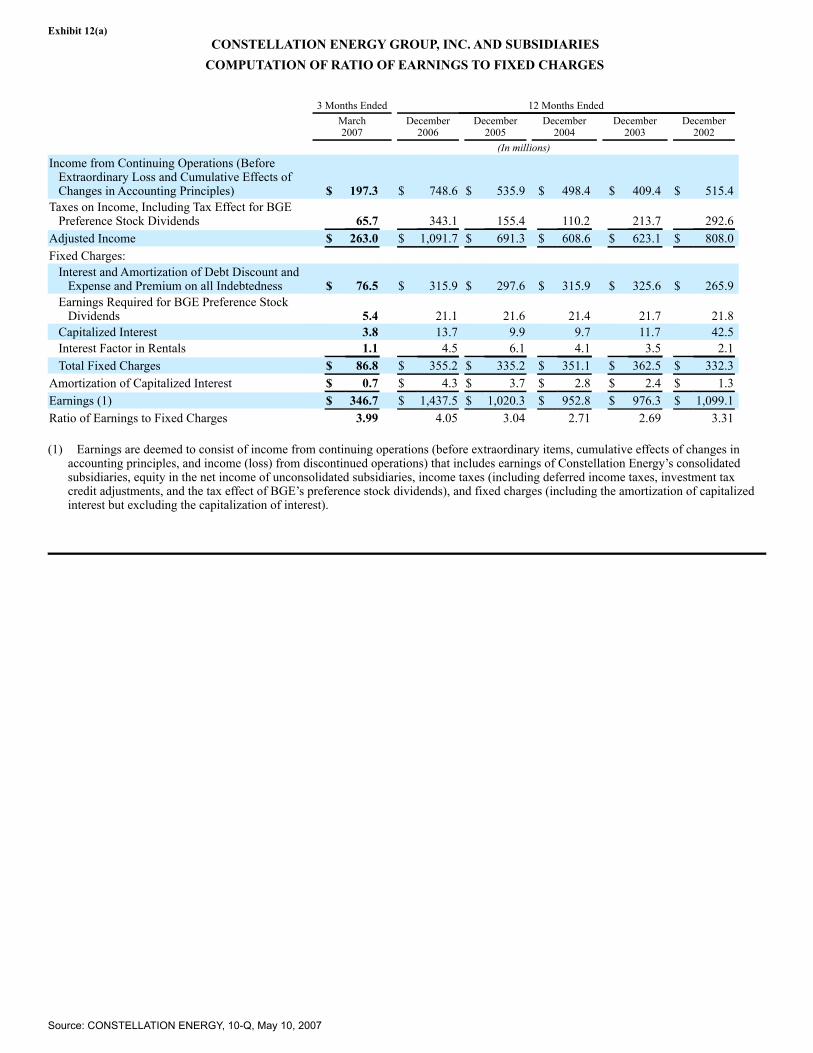
Exhibit 12(a)CONSTELLATION ENERGY GROUP, INC. AND SUBSIDIARIES
COMPUTATION OF RATIO OF EARNINGS TO FIXED CHARGES
3 Months Ended
12 Months Ended
March2007
December2006
December2005
December2004
December2003
December2002
(In millions)
Income from Continuing Operations (BeforeExtraordinary Loss and Cumulative Effects ofChanges in Accounting Principles)
$ 197.3
$ 748.6
$ 535.9
$ 498.4
$ 409.4
$ 515.4
Taxes on Income, Including Tax Effect for BGEPreference Stock Dividends
65.7
343.1
155.4
110.2
213.7
292.6
Adjusted Income
$ 263.0
$ 1,091.7 $ 691.3
$ 608.6
$ 623.1
$ 808.0
Fixed Charges:
Interest and Amortization of Debt Discount andExpense and Premium on all Indebtedness
$ 76.5
$ 315.9
$ 297.6
$ 315.9
$ 325.6
$ 265.9
Earnings Required for BGE Preference StockDividends
5.4
21.1
21.6
21.4
21.7
21.8
Capitalized Interest
3.8
13.7
9.9
9.7
11.7
42.5
Interest Factor in Rentals
1.1
4.5
6.1
4.1
3.5
2.1
Total Fixed Charges
$ 86.8
$ 355.2 $ 335.2
$ 351.1
$ 362.5
$ 332.3
Amortization of Capitalized Interest
$ 0.7
$ 4.3 $ 3.7
$ 2.8
$ 2.4
$ 1.3
Earnings (1)
$ 346.7
$ 1,437.5 $ 1,020.3
$ 952.8
$ 976.3
$ 1,099.1
Ratio of Earnings to Fixed Charges
3.99
4.05
3.04
2.71
2.69
3.31
(1) Earnings are deemed to consist of income from continuing operations (before extraordinary items, cumulative effects of changes inaccounting principles, and income (loss) from discontinued operations) that includes earnings of Constellation Energy’s consolidatedsubsidiaries, equity in the net income of unconsolidated subsidiaries, income taxes (including deferred income taxes, investment taxcredit adjustments, and the tax effect of BGE’s preference stock dividends), and fixed charges (including the amortization of capitalizedinterest but excluding the capitalization of interest).
Source: CONSTELLATION ENERGY, 10-Q, May 10, 2007

Exhibit 12(b)BALTIMORE GAS AND ELECTRIC COMPANY AND SUBSIDIARIES
COMPUTATION OF RATIO OF EARNINGS TO FIXED CHARGES ANDCOMPUTATION OF RATIO OF EARNINGS TO COMBINED FIXED CHARGES AND
PREFERRED AND PREFERENCE DIVIDEND REQUIREMENTS
3 Months Ended
12 Months Ended
March2007
December2006
December2005
December2004
December2003
December2002
(In Millions of Dollars)
Income from Continuing Operations (BeforeExtraordinary Loss)
$ 69.3
$ 170.3
$ 189.0
$ 166.3
$ 163.2
$ 143.1
Taxes on Income
43.7
102.2
119.9
102.5
105.2
93.3
Adjusted Income
$ 113.0
$ 272.5
$ 308.9
$ 268.8
$ 268.4
$ 236.4
Fixed Charges:
Interest and Amortization of Debt Discountand Expense and Premium on allIndebtedness
$ 28.0
$ 104.6
$ 95.6
$ 97.3
$ 112.8
$ 142.1
Interest Factor in Rentals
0.1
0.3
0.3
0.5
0.7
0.5
Total Fixed Charges
$ 28.1
$ 104.9
$ 95.9
$ 97.8
$ 113.5
$ 142.6
Preferred and Preference
Dividend Requirements: (1)
Preferred and Preference Dividends
$ 3.3
$ 13.2
$ 13.2
$ 13.2
$ 13.2
$ 13.2
Income Tax Required
2.1
8.0
8.4
8.1
8.6
8.6
Total Preferred and Preference DividendRequirements
$ 5.4
$ 21.2
$ 21.6
$ 21.3
$ 21.8
$ 21.8
Total Fixed Charges and Preferred andPreference Dividend Requirements
$ 33.5
$ 126.1
$ 117.5
$ 119.1
$ 135.3
$ 164.4
Earnings (2)
$ 141.1
$ 377.4
$ 404.8
$ 366.6
$ 381.9
$ 379.0
Ratio of Earnings to Fixed Charges
5.02
3.60
4.22
3.75
3.36
2.66
Ratio of Earnings to Combined FixedCharges and Preferred and PreferenceDividend Requirements
4.21
2.99
3.45
3.08
2.82
2.31
(1) Preferred and preference dividend requirements consist of an amount equal to the pre-tax earnings that would be required to meetdividend requirements on preferred stock and preference stock.
(2) Earnings are deemed to consist of income from continuing operations (before extraordinary items) that includes earnings ofBGE’s consolidated subsidiaries, income taxes (including deferred income taxes and investment tax credit adjustments), and fixedcharges other than capitalized interest.
Source: CONSTELLATION ENERGY, 10-Q, May 10, 2007

Exhibit 31(a)CONSTELLATION ENERGY GROUP, INC.
CERTIFICATIONI, Mayo A. Shattuck III, certify that:
1. I have reviewed this report on Form 10-Q of Constellation Energy Group, Inc.;2. Based on my knowledge, this report does not contain any untrue statement of a material fact or omit to state a material fact
necessary to make the statements made, in light of the circumstances under which such statements were made, not misleading withrespect to the period covered by this report;
3. Based on my knowledge, the financial statements, and other financial information included in this report, fairly present in allmaterial respects the financial condition, results of operations and cash flows of the registrant as of, and for, the periods presented inthis report;
4. The registrant’s other certifying officer(s) and I are responsible for establishing and maintaining disclosure controls and procedures(as defined in Exchange Act Rules 13a-15(e) and 15d-15(e)) and internal control over financial reporting (as defined in Exchange ActRules 13a-15(f) and 15d-15(f)) for the registrant and have:(a) Designed such disclosure controls and procedures, or caused such disclosure controls and procedures to be designed under our
supervision, to ensure that material information relating to the registrant, including its consolidated subsidiaries, is made knownto us by others within those entities, particularly during the period in which this report is being prepared;
(b) Designed such internal control over financial reporting, or caused such internal control over financial reporting to be designedunder our supervision, to provide reasonable assurance regarding the reliability of financial reporting and the preparation offinancial statements for external purposes in accordance with generally accepted accounting principles;
(c) Evaluated the effectiveness of the registrant’s disclosure controls and procedures and presented in this report our conclusionsabout the effectiveness of the disclosure controls and procedures, as of the end of the period covered by this report based on suchevaluation; and
(d) Disclosed in this report any change in the registrant’s internal control over financial reporting that occurred during theregistrant’s most recent fiscal quarter (the registrant’s fourth quarter in the case of an annual report) that has materially affected,or is reasonably likely to materially affect, the registrant’s internal control over financial reporting; and
5. The registrant’s other certifying officer(s) and I have disclosed, based on our most recent evaluation of internal control overfinancial reporting, to the registrant’s auditors and the audit committee of the registrant’s Board of Directors (or persons performingthe equivalent functions):(a) All significant deficiencies and material weaknesses in the design or operation of internal control over financial reporting which
are reasonably likely to adversely affect the registrant’s ability to record, process, summarize and report financial information;and
(b) Any fraud, whether or not material, that involves management or other employees who have a significant role in the registrant’sinternal control over financial reporting.
Date: May 9, 2007
/s/ MAYO A. SHATTUCK III
Chairman of the Board, President, and Chief Executive Officer
Source: CONSTELLATION ENERGY, 10-Q, May 10, 2007

Exhibit 31(b)CONSTELLATION ENERGY GROUP, INC.
CERTIFICATION
I, E. Follin Smith, certify that:1. I have reviewed this report on Form 10-Q of Constellation Energy Group, Inc.;2. Based on my knowledge, this report does not contain any untrue statement of a material fact or omit to state a material fact
necessary to make the statements made, in light of the circumstances under which such statements were made, not misleading withrespect to the period covered by this report;
3. Based on my knowledge, the financial statements, and other financial information included in this report, fairly present in allmaterial respects the financial condition, results of operations and cash flows of the registrant as of, and for, the periods presented inthis report;
4. The registrant’s other certifying officer(s) and I are responsible for establishing and maintaining disclosure controls and procedures(as defined in Exchange Act Rules 13a-15(e) and 15d-15(e)) and internal control over financial reporting (as defined in Exchange ActRules 13a-15(f) and 15d-15(f)) for the registrant and have:(a) Designed such disclosure controls and procedures, or caused such disclosure controls and procedures to be designed under our
supervision, to ensure that material information relating to the registrant, including its consolidated subsidiaries, is made knownto us by others within those entities, particularly during the period in which this report is being prepared;
(b) Designed such internal control over financial reporting, or caused such internal control over financial reporting to be designedunder our supervision, to provide reasonable assurance regarding the reliability of financial reporting and the preparation offinancial statements for external purposes in accordance with generally accepted accounting principles;
(c) Evaluated the effectiveness of the registrant’s disclosure controls and procedures and presented in this report our conclusionsabout the effectiveness of the disclosure controls and procedures, as of the end of the period covered by this report based on suchevaluation; and
(d) Disclosed in this report any change in the registrant’s internal control over financial reporting that occurred during theregistrant’s most recent fiscal quarter (the registrant’s fourth quarter in the case of an annual report) that has materially affected,or is reasonably likely to materially affect, the registrant’s internal control over financial reporting; and
5. The registrant’s other certifying officer(s) and I have disclosed, based on our most recent evaluation of internal control overfinancial reporting, to the registrant’s auditors and the audit committee of the registrant’s Board of Directors (or persons performingthe equivalent functions):(a) All significant deficiencies and material weaknesses in the design or operation of internal control over financial reporting which
are reasonably likely to adversely affect the registrant’s ability to record, process, summarize and report financial information;and
(b) Any fraud, whether or not material, that involves management or other employees who have a significant role in the registrant’sinternal control over financial reporting.
Date: May 9, 2007
/s/ E. FOLLIN SMITH
Executive Vice President, Chief Financial Officer, andChief Administrative Officer
Source: CONSTELLATION ENERGY, 10-Q, May 10, 2007
Exhibit 31(c)BALTIMORE GAS AND ELECTRIC COMPANY
CERTIFICATIONI, Kenneth W. DeFontes, Jr., certify that:
1. I have reviewed this report on Form 10-Q of Baltimore Gas and Electric Company;2. Based on my knowledge, this report does not contain any untrue statement of a material fact or omit to state a material fact
necessary to make the statements made, in light of the circumstances under which such statements were made, not misleading withrespect to the period covered by this report;
3. Based on my knowledge, the financial statements, and other financial information included in this report, fairly present in allmaterial respects the financial condition, results of operations and cash flows of the registrant as of, and for, the periods presented inthis report;
4. The registrant’s other certifying officer(s) and I are responsible for establishing and maintaining disclosure controls and procedures(as defined in Exchange Act Rules 13a-15(e) and 15d-15(e)) for the registrant and have:(a) Designed such disclosure controls and procedures, or caused such disclosure controls and procedures to be designed under our
supervision, to ensure that material information relating to the registrant, including its consolidated subsidiaries, is made knownto us by others within those entities, particularly during the period in which this report is being prepared;
(b) Evaluated the effectiveness of the registrant’s disclosure controls and procedures and presented in this report our conclusionsabout the effectiveness of the disclosure controls and procedures, as of the end of the period covered by this report based on suchevaluation; and
(c) Disclosed in this report any change in the registrant’s internal control over financial reporting that occurred during theregistrant’s most recent fiscal quarter (the registrant’s fourth quarter in the case of an annual report) that has materially affected,or is reasonably likely to materially affect, the registrant’s internal control over financial reporting; and
5. The registrant’s other certifying officer(s) and I have disclosed, based on our most recent evaluation of internal control overfinancial reporting, to the registrant’s auditors and the audit committee of the registrant’s Board of Directors (or persons performingthe equivalent functions):(a) All significant deficiencies and material weaknesses in the design or operation of internal control over financial reporting which
are reasonably likely to adversely affect the registrant’s ability to record, process, summarize and report financial information;and
(b) Any fraud, whether or not material, that involves management or other employees who have a significant role in the registrant’sinternal control over financial reporting.
Date: May 9, 2007
/s/ KENNETH W. DEfONTES, JR.
President and Chief Executive Officer
Source: CONSTELLATION ENERGY, 10-Q, May 10, 2007
Exhibit 31(d)BALTIMORE GAS AND ELECTRIC COMPANY
CERTIFICATIONI, E. Follin Smith, certify that:
1. I have reviewed this report on Form 10-Q of Baltimore Gas and Electric Company;2. Based on my knowledge, this report does not contain any untrue statement of a material fact or omit to state a material fact
necessary to make the statements made, in light of the circumstances under which such statements were made, not misleading withrespect to the period covered by this report;
3. Based on my knowledge, the financial statements, and other financial information included in this report, fairly present in allmaterial respects the financial condition, results of operations and cash flows of the registrant as of, and for, the periods presented inthis report;
4. The registrant’s other certifying officer(s) and I are responsible for establishing and maintaining disclosure controls and procedures(as defined in Exchange Act Rules 13a-15(e) and 15d-15(e)) for the registrant and have:(a) Designed such disclosure controls and procedures, or caused such disclosure controls and procedures to be designed under our
supervision, to ensure that material information relating to the registrant, including its consolidated subsidiaries, is made knownto us by others within those entities, particularly during the period in which this report is being prepared;
(b) Evaluated the effectiveness of the registrant’s disclosure controls and procedures and presented in this report our conclusionsabout the effectiveness of the disclosure controls and procedures, as of the end of the period covered by this report based on suchevaluation; and
(c) Disclosed in this report any change in the registrant’s internal control over financial reporting that occurred during theregistrant’s most recent fiscal quarter (the registrant’s fourth quarter in the case of an annual report) that has materially affected,or is reasonably likely to materially affect, the registrant’s internal control over financial reporting; and
5. The registrant’s other certifying officer(s) and I have disclosed, based on our most recent evaluation of internal control overfinancial reporting, to the registrant’s auditors and the audit committee of the registrant’s Board of Directors (or persons performingthe equivalent functions):(a) All significant deficiencies and material weaknesses in the design or operation of internal control over financial reporting which
are reasonably likely to adversely affect the registrant’s ability to record, process, summarize and report financial information;and
(b) Any fraud, whether or not material, that involves management or other employees who have a significant role in the registrant’sinternal control over financial reporting.
Date: May 9, 2007
/s/ E. FOLLIN SMITH
Senior Vice President and Chief Financial Officer
Source: CONSTELLATION ENERGY, 10-Q, May 10, 2007

Exhibit 32(a)CERTIFICATION PURSUANT TO
18 U.S.C. SECTION 1350AS ADOPTED PURSUANT TO
SECTION 906 OF THE SARBANES-OXLEY ACT OF 2002I, Mayo A. Shattuck III, Chairman of the Board, President and Chief Executive Officer of Constellation Energy Group, Inc., certify pursuantto 18 U.S.C. Section 1350 adopted pursuant to Section 906 of the Sarbanes-Oxley Act of 2002 that to my knowledge:
(i) The accompanying Quarterly Report on Form 10-Q for the quarter ended March 31, 2007 fully complies with the requirements ofSection 13(a) or Section 15(d) of the Securities Exchange Act of 1934, as amended; and
(ii) The information contained in such report fairly presents, in all material respects, the financial condition and results of operations ofConstellation Energy Group, Inc.
/s/ MAYO A. SHATTUCK Iii
Mayo A. Shattuck IIIChairman of the Board, President andChief Executive Officer
Date: May 9, 2007
Source: CONSTELLATION ENERGY, 10-Q, May 10, 2007

Exhibit 32(b)CERTIFICATION PURSUANT TO
18 U.S.C. SECTION 1350AS ADOPTED PURSUANT TO
SECTION 906 OF THE SARBANES-OXLEY ACT OF 2002I, E. Follin Smith, Executive Vice President, Chief Financial Officer, and Chief Administrative Officer of Constellation Energy Group, Inc.,certify pursuant to 18 U.S.C. Section 1350 adopted pursuant to Section 906 of the Sarbanes-Oxley Act of 2002 that to my knowledge:
(i) The accompanying Quarterly Report on Form 10-Q for the quarter ended March 31, 2007 fully complies with the requirements ofSection 13(a) or Section 15(d) of the Securities Exchange Act of 1934, as amended; and
(ii) The information contained in such report fairly presents, in all material respects, the financial condition and results of operations ofConstellation Energy Group, Inc.
/s/ E. FOLLIN SMITH
E. Follin SmithExecutive Vice President, Chief Financial Officer, andChief Administrative Officer
Date: May 9, 2007
Source: CONSTELLATION ENERGY, 10-Q, May 10, 2007

Exhibit 32(c)CERTIFICATION PURSUANT TO
18 U.S.C. SECTION 1350AS ADOPTED PURSUANT TO
SECTION 906 OF THE SARBANES-OXLEY ACT OF 2002I, Kenneth W. DeFontes, Jr., President and Chief Executive Officer of Baltimore Gas and Electric Company, certify pursuant to 18 U.S.C.Section 1350 adopted pursuant to Section 906 of the Sarbanes-Oxley Act of 2002 that to my knowledge:
(i) The accompanying Quarterly Report on Form 10-Q for the quarter ended March 31, 2007 fully complies with the requirements ofSection 13(a) or Section 15(d) of the Securities Exchange Act of 1934, as amended; and
(ii) The information contained in such report fairly presents, in all material respects, the financial condition and results of operations ofBaltimore Gas and Electric Company.
/s/ KENNETH W. DEFONTES, JR.
Kenneth W. DeFontes, Jr.President and Chief Executive Officer
Date: May 9, 2007
Source: CONSTELLATION ENERGY, 10-Q, May 10, 2007

Exhibit 32(d)CERTIFICATION PURSUANT TO
18 U.S.C. SECTION 1350AS ADOPTED PURSUANT TO
SECTION 906 OF THE SARBANES-OXLEY ACT OF 2002I, E. Follin Smith, Senior Vice President and Chief Financial Officer of Baltimore Gas and Electric Company, certify pursuant to 18 U.S.C.Section 1350 adopted pursuant to Section 906 of the Sarbanes-Oxley Act of 2002 that to my knowledge:
(i) The accompanying Quarterly Report on Form 10-Q for the quarter ended March 31, 2007 fully complies with the requirements ofSection 13(a) or Section 15(d) of the Securities Exchange Act of 1934, as amended; and
(ii) The information contained in such report fairly presents, in all material respects, the financial condition and results of operations ofBaltimore Gas and Electric Company.
/s/ E. FOLLIN SMITH
E. Follin SmithSenior Vice President and Chief Financial Officer
Date: May 9, 2007
_______________________________________________Created by 10KWizard www.10KWizard.com
Source: CONSTELLATION ENERGY, 10-Q, May 10, 2007
Related Documents