Edited by PAWEL SWIANIEWICZ Consolidation or Fragmentation? The Size of Local Governments in Central and Eastern Europe Local Government and Public Service Reform Initiative brought to you by CORE View metadata, citation and similar papers at core.ac.uk provided by Policy Documentation Center

Welcome message from author
This document is posted to help you gain knowledge. Please leave a comment to let me know what you think about it! Share it to your friends and learn new things together.
Transcript
E d i t e d b y
PAWEL SWIANIEWICZ
Consolidationor Fragmentation?
The Size of Local Governmentsin Central and Eastern Europe
Local Governmentand Public ServiceReform Initiative
brought to you by COREView metadata, citation and similar papers at core.ac.uk
provided by Policy Documentation Center
C O N S O L I D A T I O N O R F R A G M E N T A T I O N ?
ii D F I D – L G I L O C A L G O V E R N M E N T P O L I C Y P A R T N E R S H I P P R O G R A M
L O C A L G O V E R N M E N T A N D P U B L I C S E RV I C E R E F O R M I N I T I AT I V E
OP E N S O C I E T Y I N S T I T U T E
A d d r e s sNádor utca 11.
H-1051 Budapest, Hungary
M a i l i n g a d d r e s sP.O. Box 519
H-1357 Budapest, Hungary
Te l e p h o n e (36-1) 327-3104
F a x(36-1) 327-3105
E - m a i [email protected]
We b s i t ehttp://lgi.osi.hu
First published in 2002by Local Government and Public Service Reform Initiative, Open Society Institute Budapest
© OSI/LGI, 2002
ISBN: 963 9419 45 1
The publication of these country reports has been funded by the British Department for InternationalDevelopment and the Local Government and Public Service Reform Initiative of the Open Society Institute in
Budapest within the framework of the Local Government Policy Partnership Programme. The judgementsexpressed herein do not necessarily reflect the views of the above two sponsors.
All rights reserved. No part of this book may be reprinted or reproduced or utilized in any form or byany electronic, mechanical or other means, now known or hereafter invented, including photocopying and
recording, or in any information storage or retrieval system, without permission in writing from the publishers.
Copies of the book can be ordered by e-mail or post from LGI.Printed in Budapest, Hungary, December 2002.
Design & Layout by Createch Ltd.
OPEN SOCIETY INSTITUTE
iii
šš
Contents
Foreword ................................................................ xv
List of Contributors ............................................ xvii
1. Size of Local Governments: InternationalContext and Theoretical Framework .............. 1Pawel Swianiewicz
2. Size of Local Governments, Local Democracyand Local Service Delivery in Hungary ........ 31Éva Fekete, Mihály Lados,Edit Pfeil, Zsolt Szoboszlai
3. Separate Existences Above All Else—Local Self-Governments andService Delivery in Slovakia ........................ 101Jaroslav Kling, V. Niznansky, Jaroslav Pilat
4. Does Larger Mean More Effective?Size and the functioningof Local Governments in Bulgaria .............. 167Stefan Ivanov, Guinka Tchavdarova,Emil Savov, Hristo Stanev
5. Economies and Diseconomies of Scalein Polish Local Governments ...................... 219Pawel Swianiewicz, Mikolaj Herbst
6. Is There a Third Road BetweenSmall yet Ineffective and Big yet LessDemocratic? Comparative Conclusionsand Lessons Learned ................................... 293Pawel Swianiewicz
Index .................................................................. 327

C O N S O L I D A T I O N O R F R A G M E N T A T I O N ?
iv D F I D – L G I L O C A L G O V E R N M E N T P O L I C Y P A R T N E R S H I P P R O G R A M
v
List of Tables and Figures
TABLES
C H A P T E R 1
Table 1.1: Average Size of (Municipal) Local Governmentsin Selected European Countries ........................................... 7
Table 1.2: Opinions on Various Arguments for MergingMunicipalities in the Czech Republic,Poland, Slovakia .................................................................. 23
C H A P T E R 2
Table 2.1: Changing Size of Settlements Between 1990–2000 ......... 36
Table 2.2: Distribution of Capital Expenditure ................................. 42
Table 2.3: The Hungarian NUTS System........................................... 42
Table 2.4: Spatial Units (2000) ........................................................... 44
Table 2.5: The Number of Joint Local Governmental Officesand Their Members Between 1991–2000 ........................ 46
Table 2.6: Regional Differences in Densityof Joint Local Governmental Offices (2000)and Common Councils (1987) .......................................... 47
Table 2.7: LGs’ Responsibilities in Hungary ...................................... 49
Table 2.8: Costs of Administration ...................................................... 53
Table 2.9: Unit Costs of Pre-Schools (Kindergartens), 2000 ............. 54
Table 2.10: Unit Costs of Primary Schools, 2000 ................................ 55
Table 2.11: The Shape of Unit Costs by LG Size Category ................. 56
Table 2.12: Rate of Participation in Local Elections by LGs’ Size ....... 58
Table 2.13: Appearance of Non-Profit OrganizationsAccording to LG Size .......................................................... 59
C O N S O L I D A T I O N O R F R A G M E N T A T I O N ?
vi D F I D – L G I L O C A L G O V E R N M E N T P O L I C Y P A R T N E R S H I P P R O G R A M
Table 2.14: Evaluation of the Role of the Local Mayor and theRepresentative Body in the Life of a Community ............. 61
Table 2.15: Level of Basic Infrastructure, 1990 and 2000 ................... 63
Table 2.16: The Relationship Between Communities,Local Councils and Local Governments ............................. 68
Table 2.17: The Changing Numbers of Joint LG Offices andCommon Councils As Well As Their MemberCommunities in Baranya CountyBetween 1989–2000 .......................................................... 73
Table 2.18: The Situation of Associations in Hungaryas of 31 December 1999 .................................................... 74
Table 2.19: Sector Patterns for Small Regional Projects andTheir Tendencies ................................................................. 80
Table 2.20: Support for LGs in Handling Financial ProblemsCaused Through No Fault of Their Own ......................... 83
Table 2.21: Suggestion for Differentiated Delegationof Competencies (According to the Opinionof Chief Executives in County Capitals) ............................ 90
C H A P T E R 3
Table 3.1: Structure of Local Public Administration in 2000 ........ 107
Table 3.2: Development of the Size Structureof Municipalities in Slovakia ........................................... 114
Table 3.3: Types of Territorial Changes After 1990 ......................... 119
Table 3.4: Public Budgets and GDP ................................................ 122
Table 3.5: The Local Self-Governments’ Shareof State Budget Expenditures .......................................... 122
Table 3.6: Development of Local Budget Revenuesin 1991–2000 ................................................................. 123
Table 3.7: Major Sources of Revenue in Municipalities in 2000 ... 124
Table 3.8: Real Estate Tax Revenues Per Capita .............................. 125
vii
Table 3.9: Transfers Per Capita in 2000 ........................................... 127
Table 3.10: Credit Burdens of Municipalities ................................... 128
Table 3.11: Received Credits Per Capita ............................................ 128
Table 3.12: Structure of Local Budget Expenditures in 2000 .......... 130
Table 3.13: Personnel Expenditures of Local Self-GovernmentsPer Capita ......................................................................... 130
Table 3.14: Debt Related Expenditures for Local Budgets ............... 132
Table 3.15: Debt Related Expenditures Per Capita in 2000 ............ 132
Table 3.16: Expenditures for Services Delivered in 2000 .................. 133
Table 3.17: The Forms Citizens Use to Make LocalSelf-Government Solve Local Problems .......................... 153
Table 3.18: Poles of Power/Influence in Municipalitiesin the Slovak Republic ..................................................... 155
C H A P T E R 4
Table 4.1: Share of Central and Local Government Expendituresin the Consolidated State Budget (CSB) and GDP ....... 173
Table 4.2: Dynamics of the Administrative Reforms ....................... 176
Table 4.3: Characteristic Features of the Regions in Bulgaria ......... 178
Table 4.4: Distribution of Municipalities in BulgariaBased on Population in 2001 ......................................... 179
Table 4.5: Distribution of Municipalities by GroupsBased on Population ........................................................ 182
Table 4.6: Main Demographic Characteristics of Municipalities ... 183
Table 4.7: Territory and Settlement Structure ................................. 183
Table 4.8: Level of Socio-Economic Developmentof the Municipality Groups for 2000 ............................. 184
Table 4.9: Main Socio-Economic Indicatorsby Municipality Groups in 2000 ................................... 185
L I S T O F T A B L E S A N D F I G U R E S
C O N S O L I D A T I O N O R F R A G M E N T A T I O N ?
viii D F I D – L G I L O C A L G O V E R N M E N T P O L I C Y P A R T N E R S H I P P R O G R A M
Table 4.10: Number of Local Services ProvidedBased on the Size of Municipalities ................................ 188
Table 4.11: Share of Intergovernmental Transferswithin the Local Budget Revenues ................................. 189
Table 4.12: Structure of Local Revenues ............................................ 190
Table 4.13: Structure of Municipal Revenuesin Municipality Groups for 2000 ................................... 191
Table 4.14: Municipal Expenditures for Major Health Services ....... 196
Table 4.15: Major Indicators for the Mother Municipalitiesand the Settlements, Which Have Separated fromThem and Formed New Municipalities ......................... 200
Table 4.16: Expenditures for Municipal Administration .................. 201
Table 4.17: Revenues from Municipal Property in 2000 .................. 203
Table 4.18: Local Budgetary Capital Expendituresand Target Subsidies for Capital Investment .................. 204
C H A P T E R 5
Table 5.1: Allocation of Functions Among Tiersof Local and Regional Self-Government in Poland ........ 225
Table 5.2: Changes in the Numberof Municipalities 1990–2000 ......................................... 228
Table 5.3: Area and Population of Regions, Countiesand Municipalities (2000) .............................................. 229
Table 5.4: Number of Villages (Solectwa) and SettlementUnits in Rural Local Governments (2000) .................... 230
Table 5.5: The Number of Councilors per Municipalityas Stated by the Act on Local Government .................... 232
Table 5.6: Number of Councilors per Village (Solectwo)and per One Settlement Unit Within Polish RuralLocal Governments (1999) .............................................. 233
Table 5.7: Democratic Representationin Polish Municipalities (2000) ...................................... 234
ix
Table 5.8: Size and the Measureof Indirect Representation (2000) ................................ 235
Table 5.9: Do You Think Local Government in Your CommunityHas Undertaken Visible, Positive Activities in theFollowing Services [% of Positive Answers, 1992] ....... 243
Table 5.10: Satisfaction With Local Primary SchoolFunctions (2000) ........................................................... 244
Table 5.11: Size of Municipality, Educationand Age Structure of Local Councilors—Pearson’s Correlation Coefficients (2000) ................ 246
Table 5.12: Village Leaders’ Opinions on ContactsWith Municipal Authorities (2001) ............................ 253
Table 5.13: Size of Municipality and Technical Capacityof the Local Administration (1999) .............................. 257
Table 5.13a: Indicators of Capacity to Promote Local EconomicDevelopment and Size of Municipalities (2000) ......... 259
Table 5.13b: Indicators of Capacity to Promote Local EconomicDevelopment and Size of the Municipality—Rural Local Governments Only (2000) ................... 260
Table 5.14: Person’s Correlations Between Size of Municipalityand Various Indicators of Capacityto Promote Economic Growth (2000) ......................... 261
Table 5.15a Current Spending on Administration and the Sizeof Local Government (2000) MunicipalGovernments (Without Cities of County Status) ........ 264
Table 5.15b: Current Spending on Administration and the Sizeof Local Government (2000) County Governments(Without Cities of County Status) ................................. 264
Table 5.16: Current Expenditures Over the Amountof Received Grants in Three Types PolishMunicipalities (2000) ................................................... 265
Table 5.17: Average Kindergartens Attendance Rate of Children,3–5 Years Old, in Polish Municipalities (2000) .......... 267
L I S T O F T A B L E S A N D F I G U R E S
C O N S O L I D A T I O N O R F R A G M E N T A T I O N ?
x D F I D – L G I L O C A L G O V E R N M E N T P O L I C Y P A R T N E R S H I P P R O G R A M
Table 5.18: Kindergartens Attendance Ratein Rural Municipalities (1999) .................................... 268
Table 5.19: Received Subvention and Resources Spenton Education by the Municipalities (2000) ................ 269
Table 5.20: Expenditure on Primary Education andBudget Revenues in Polish Municipalities (2000) ........ 269
Table 5.21: Rural Municipality Size (Population)and Average Per Student Expenditureson Primary Education (2000) ......................................... 270
Table 5.22: Attendance Rate in the Secondary Schoolsof 10 Selected Counties in 2000 .................................... 271
Table 5.23: Cities and Surrounding Counties Financial Supportfor Education (2000) ....................................................... 271
Table 5.24: Number of Inter-Municipal Associations in Poland ...... 272
Table 5.25: Purpose–Oriented Associationsof Gdynia and Slubice ..................................................... 274
Table 5.26: Size and Local Government Functioning—Summary of Polish Findings ....................................... 277
Table 5.27: Variables Used in the Indexof Local Government Performance .................................. 281
Table 5.28: Weighted Values for Different Index Variations .............. 283
C H A P T E R 6
Table 6.1: Decisions on the Change in Number of Municipalities .... 299
Table 6.2: Relationship Between Average Sizeand the Municipalities Expenditures’ Share in GDP .... 303
Table 6.3: Relationship Between Average Size of Municipalitiesand Trend of Changes (During the Last Decade)in Municipalities Expenditures’ Share in GDP ............. 303
Table 6.4: Position of Sub-municipal Governmentsin Bulgaria and Poland .................................................... 316
Table 6.5: Territorial Organization at the Basic Level—Options Available ........................................................ 318
xi
FIGURES
C H A P T E R 1
Figure 1.1: The Present Value of Gains and Sizeof Local Government .......................................................... 12
Figure 1.2: Impact of the Demand for Servicesand Variation of Citizens’ Preferenceson the Optimal Size of Local Government ........................ 13
Figure 1.3: Distribution of Local Governments Accordingto Their Population Size ..................................................... 18
C H A P T E R 2
Figure 2.1: Differences in the Settlement Structure (2000) ................ 36
Figure 2.2: Development Regions (NUTS II) in Hungary ................. 44
Figure 2.3: The Average Share of Investments in Total LocalGovernment Spending ........................................................ 65
Figure 2.4: Demand for “Large” Investment According to LG Size .... 66
Figure 2.5: Which Public Administration Purposes are Importantin the Future? (Opinions Ranked on 10-Grade Scale) ..... 71
Figure 2.6: What Do You Expect From SmallRegional Cooperation? ........................................................ 72
Figure 2.7: Increasing Number of Small RegionalDevelopment Associations .................................................. 77
Figure 2.8: The Division of Small Regional AssociationsAccording to the Number of the LGs and Population ..... 78
Figure 2.9: Spatial Pattern of Small Regional Associations andRelated NUTS IV Regions ................................................. 79
C H A P T E R 3
Figure 3.1: Structure of State Administration in Slovakia ................ 106
Figure 3.2: Structure of Territorial Self-Government in Slovakia ...... 107
L I S T O F T A B L E S A N D F I G U R E S
C O N S O L I D A T I O N O R F R A G M E N T A T I O N ?
xii D F I D – L G I L O C A L G O V E R N M E N T P O L I C Y P A R T N E R S H I P P R O G R A M
Figure 3.3: Development of the Number of Municipalitiesin Slovakia Since 1950................................................... 114
Figure 3.4: Population Distribution Amongst Municipalitiesby Size Category Since 1950......................................... 116
Figure 3.5: Size Structure for Municipalities in Slovakiaas of December 31, 2000 .............................................. 116
Figure 3.6: Territorial Changes of Municipalities After 1990 ........ 119
Figure 3.7: Non-Tax Revenues Per Capita in 2000 ........................ 126
Figure 3.8: Capital Expenditures of Local Budgets Per Capita ...... 131
Figure 3.9: Expenditures for Road Management in 2000.............. 135
Figure 3.10: Expenditures for Waste Management in 2000 ............. 136
Figure 3.11: Municipal Office Administration Expendituresin 2000 .......................................................................... 138
C H A P T E R 4
Figure 4.1: Influence of Inflationon Municipal Budget Revenues .................................... 174
Figure 4.2: Structure of Local Budgets (1991–2000) .................... 175
C H A P T E R 5
Figure 5.1: Regions, Counties and Municipalities.......................... 229
Figure 5.2: Democratic Representationand Population in Polish Municipalities ...................... 235
Figure 5.3: % of Mayors Who Agree that Merging TheirMunicipalities Might be a Good Idea (1997) ............. 238
Figure 5.4: Are You Satisfied With the Result of Local GovernmentFunctioning? Percentage Difference BetweenPositive and Negative Answers (Citizens’ Opinions) ... 241
Figure 5.5: Age Structure of Councilors in Polish Municipalities .. 245
Figure 5.6: Education Structure of Councilorsin Polish Municipalities ................................................ 246
xiii
Figure 5.7: Number of Candidates Per Seatin the Local Council (1994 Election) ........................... 248
Figure 5.8: If There Is a Conflict of Interest, Whose InterestsShould Be Represented, First and Foremost,By the Councilor? (Citizens' OpinionsAccording to CBOS) ...................................................... 249
Figure 5.9: The Most Important Social Conflicts in Local RuralGovernments According to Village Leaders (2001) ..... 251
Figure 5.10: Percent of Local Governments Who Took OverResponsibility for Primary Schools Before 1995 .......... 256
Figure 5.11: Local Democracy, Economic Development,Service Delivery and Size of Local Government ........... 284
Figure 5.12: Index of Performance and Size of Local Government ... 285
C H A P T E R 6
Figure 6.1a: Spending per Capita on Municipal Administrationas % of National Average ............................................... 307
Figure 6.1b: Spending on Administrationas % of Total Operating Expenditures .......................... 308
Figure 6.2: Turn-out in Local Elections (1998) .............................. 311
L I S T O F T A B L E S A N D F I G U R E S

C O N S O L I D A T I O N O R F R A G M E N T A T I O N ?
xiv D F I D – L G I L O C A L G O V E R N M E N T P O L I C Y P A R T N E R S H I P P R O G R A M
xv
Foreword
This book was prepared under the “Local Government Policy Partnership” Program,which is a joint project of two donor organizations. The British Government’sDepartment for International Development (DFID) and the Local Governmentand Public Service Initiative (LGI) of the Open Society Institute, Budapest launchedthis regional program jointly. The “Local Government Policy Partnership” (LGPP)projects intend to contribute to policy development and innovation in these countries(http://lgi.osi.hu/lgpp/).
LGPP hopes to develop expertise and to support professional cooperation amonglocal government specialists throughout Central and Eastern Europe. Parallel to this,experiences from this region should be made available in Central and Eastern Europe,and in Central Asia. The core partner countries are the Czech Republic, Hungary,Poland and Slovakia. However, other countries have been invited to participate in theseregional projects, which would help direct information exchange and comparison ofpolicy efforts.
LGPP publications include policy studies and proposals discussed with governmentofficials and experts in the countries involved. Targeted beneficiaries of LGPP projectsare national government ministries, local government associations, research and traininginstitutions, and individual local authorities throughout the CEE region. LGPPintends to publish three studies each year.
In the first year of LGPP operations, the following three policy areas were selectedfor analysis: (i) education financing and management; (ii) regulation and competitionof local utility services, and (iii) public perception of local governments. The policystudies were widely disseminated throught our region. They supported the policydialogue (e.g. on education in Macedonia) and served as training materials (e.g. forregulatory experts).
Topics for the second year of LGPP (2001/2002) were rather different by nature:a) decentralization and regional development;b) relationship between local government size, local democracy and local services
delivery;c) local government and housing.
This volume touches the most critical issues of decentralization reforms: howdemocratic institutions and procedures, public service efficiency and size of localgovernments are interrelated. Evidence and lessons from countries with fragmentedlocal government structures (Czech Republic, Hungary, Slovakia) are compared

C O N S O L I D A T I O N O R F R A G M E N T A T I O N ?
xvi D F I D – L G I L O C A L G O V E R N M E N T P O L I C Y P A R T N E R S H I P P R O G R A M
with countries having traditionally large local authorities (Bulgaria, Poland). Beyondthese country reports, the comparative chapters in this book specify the conditionsand components of each basic policy option.
Kenneth Davey & Gábor Péteri
September, 2002
xvii
šš
List of Contributors
Éva G. Fekete, PhD in Geography, head of department at North Hungarian Departmentof the Center for Regional Studies in Miskolc, senior lecturer at the Departmentof Regional Economics, University of Miskolc;
Mikolaj Herbst, research assistant at the European Institute for Regional and LocalDevelopment, University of Warsaw, MA in Economics;
Stefan Ivanov, PhD, expert on Local Finance, Director of the Center of RegionalStudies of Club Economika 2000;
Jaroslav Kling, MA in Human Geography, expert on MESA 10 Public Administration,Local and Regional Development;
Mihály Lados, PhD in Economics, deputy director of the West Hungarian ResearchInstitute of the Center for Regional Studies in Gyor;
Viktor Niznansky, urban economist and planner, expert on local government finances,part of 1999–2001 Slovak Government Plenipotentiary for Public Administ-ration Reform, executive director of MESA 10;
Jaroslav Pilat, MA in Law, expert on Decentralization of Public Administration inMESA 10;
Edit Pfeil Somlyodyné, PhD in State and Law Sciences, senior research fellow of theTransdanubian Research Institute of the Center for Regional Studies in Pecs;
Emil Savov, expert on Fiscal Decentralization, municipal finance team co-leader forLGI/USAID, Sofia, Bulgaria;
Hristo Stanev, expert on Administrative and Territorial Division, National TerritorialDevelopment Center, Sofia;
Pawel Swianiewicz, professor at the European Institute for Regional and Local Deve-lopment, University of Warsaw, Ph.D. in Economics and in Geography;
C O N S O L I D A T I O N O R F R A G M E N T A T I O N ?
xviii D F I D – L G I L O C A L G O V E R N M E N T P O L I C Y P A R T N E R S H I P P R O G R A M
Zsolt Szoboszlai, Sociologist, head of department at the Great Plain Research Instituteof the Center for Regional Studies in Szolnok;
Guinka Tchavdarova, PhD, expert on Local Self-Government, Executive Director of theNational Association of Municipalities in the Republic of Bulgaria (NAMRB).
Size of Local Government,Local Democracy and Efficiency
in Delivery of Local Services—International Context and
Theoretical Framework
Pawel Swianiewicz
C H A P T E R 1

C O N S O L I D A T I O N O R F R A G M E N T A T I O N ?
2 D F I D – L G I L O C A L G O V E R N M E N T P O L I C Y P A R T N E R S H I P P R O G R A M
3
S I Z E O F LO C A L G O V E R N M E N T, L O C A L D E M O C R A C Y A N D E F F I C I E N C Y I N D E L I V E R Y O F LO C A L S E R V I C E S
Table of Contents
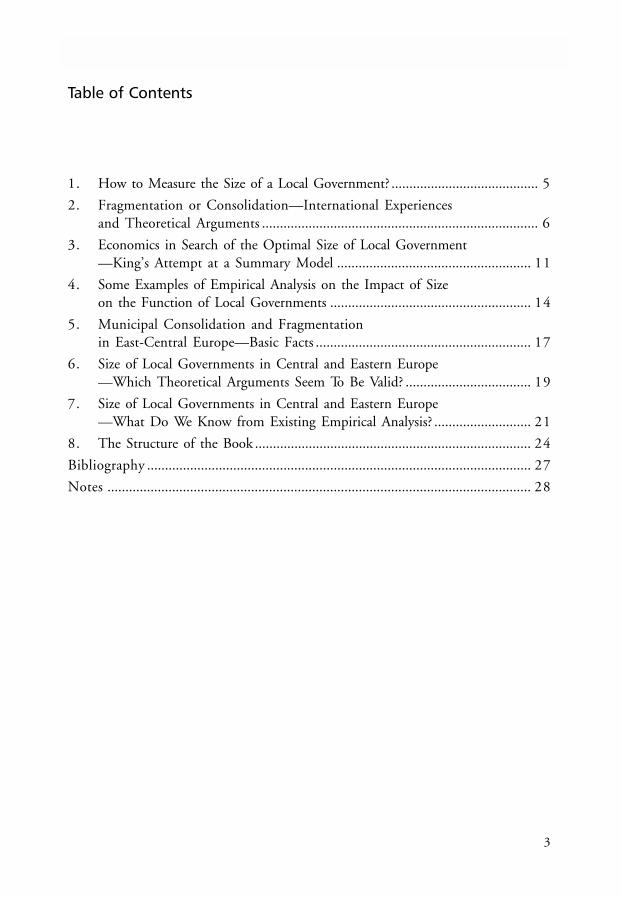
1. How to Measure the Size of a Local Government? ......................................... 5
2. Fragmentation or Consolidation—International Experiencesand Theoretical Arguments ............................................................................. 6
3. Economics in Search of the Optimal Size of Local Government—King’s Attempt at a Summary Model ...................................................... 11
4. Some Examples of Empirical Analysis on the Impact of Sizeon the Function of Local Governments ........................................................ 14
5. Municipal Consolidation and Fragmentationin East-Central Europe—Basic Facts ............................................................ 17
6. Size of Local Governments in Central and Eastern Europe—Which Theoretical Arguments Seem To Be Valid? ................................... 19
7. Size of Local Governments in Central and Eastern Europe—What Do We Know from Existing Empirical Analysis? ........................... 21
8. The Structure of the Book ............................................................................. 24
Bibliography ........................................................................................................... 27
Notes ...................................................................................................................... 28

C O N S O L I D A T I O N O R F R A G M E N T A T I O N ?
4 D F I D – L G I L O C A L G O V E R N M E N T P O L I C Y P A R T N E R S H I P P R O G R A M
5
S I Z E O F LO C A L G O V E R N M E N T, L O C A L D E M O C R A C Y A N D E F F I C I E N C Y I N D E L I V E R Y O F LO C A L S E R V I C E S
Size of Local Government, Local Democracyand Efficiency in Delivery of Local Services—International Context andTheoretical Framework
Pawel Swianiewicz
1. HOW TO MEASURE THE SIZE OF A LOCAL GOVERNMENT?
There are at least two potential measures of the size of a local government: populationnumber and surface area. Both of these have some advantages when applied todifferent public administration themes. Population number seems to be the mostpopular and the most powerful indicator [King 1984]—this relates directly to thoseconsumers of locally provided services. Nevertheless, for some issues, such as networkinfrastructure, the area to be covered is an almost equally important challenge forlocal government. Simplifying matters, we may say that with some services, costsare first and foremost a function of the number of beneficiaries (customers), whilewith others costs are more dependent on the area being covered. In practice, bothfactors have some significance. For example: in order to construct a rational schoolnetwork, local government not only has to take into account the number of students,but also the distance from residential areas to the closest school, the social benefits ofmaintaining small schools in remote rural settlements, the number of teachers to beemployed, etc.
For some local government activities we might agree that the key factor determiningcost efficiency is population density rather than simple measures of size, as mentionedabove. However, in this book, we will concentrate first and foremost on populationsize, only making reference to surface area. There is a strong argument against expressingthe size of a municipality based on population density. Any social research is useful aslong as it results in reasonable policy implications. It is feasible (although sometimesa political challenge) to re-draw a country’s administrative divisions, to increase orto decrease the population or area surface size of local government units. Even so, it ishard to imagine, unless under a dictatorship, that any country’s administrative reformwould have a short-term affect on population density within its existing units.
C O N S O L I D A T I O N O R F R A G M E N T A T I O N ?
6 D F I D – L G I L O C A L G O V E R N M E N T P O L I C Y P A R T N E R S H I P P R O G R A M
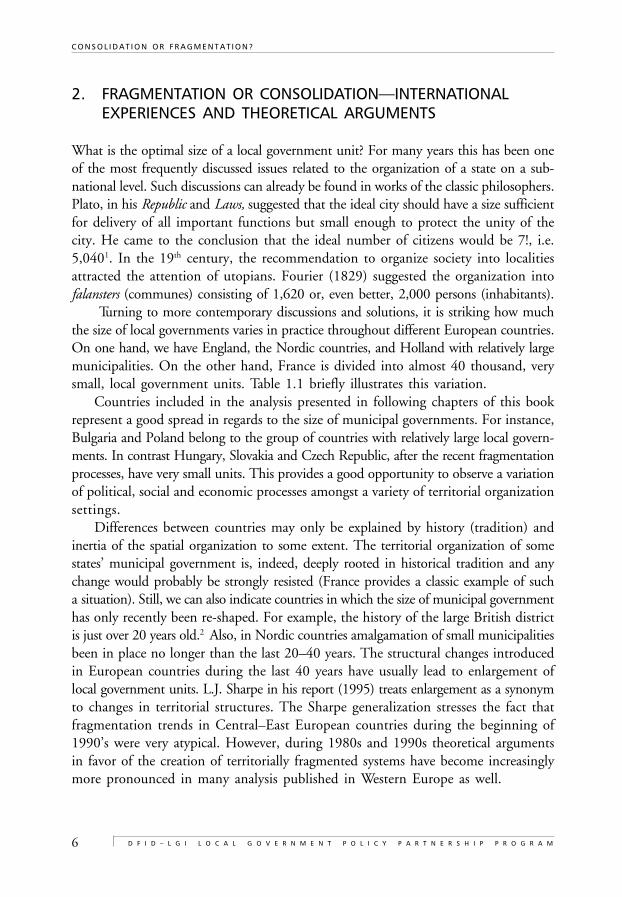
2. FRAGMENTATION OR CONSOLIDATION—INTERNATIONALEXPERIENCES AND THEORETICAL ARGUMENTS
What is the optimal size of a local government unit? For many years this has been oneof the most frequently discussed issues related to the organization of a state on a sub-national level. Such discussions can already be found in works of the classic philosophers.Plato, in his Republic and Laws, suggested that the ideal city should have a size sufficientfor delivery of all important functions but small enough to protect the unity of thecity. He came to the conclusion that the ideal number of citizens would be 7!, i.e.5,0401. In the 19th century, the recommendation to organize society into localitiesattracted the attention of utopians. Fourier (1829) suggested the organization intofalansters (communes) consisting of 1,620 or, even better, 2,000 persons (inhabitants).
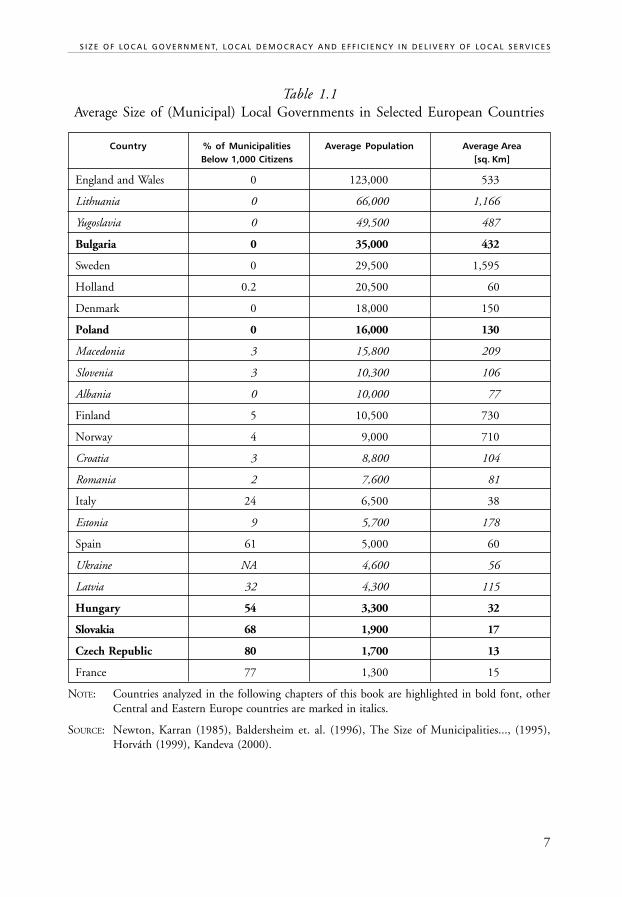
Turning to more contemporary discussions and solutions, it is striking how muchthe size of local governments varies in practice throughout different European countries.On one hand, we have England, the Nordic countries, and Holland with relatively largemunicipalities. On the other hand, France is divided into almost 40 thousand, verysmall, local government units. Table 1.1 briefly illustrates this variation.
Countries included in the analysis presented in following chapters of this bookrepresent a good spread in regards to the size of municipal governments. For instance,Bulgaria and Poland belong to the group of countries with relatively large local govern-ments. In contrast Hungary, Slovakia and Czech Republic, after the recent fragmentationprocesses, have very small units. This provides a good opportunity to observe a variationof political, social and economic processes amongst a variety of territorial organizationsettings.
Differences between countries may only be explained by history (tradition) andinertia of the spatial organization to some extent. The territorial organization of somestates’ municipal government is, indeed, deeply rooted in historical tradition and anychange would probably be strongly resisted (France provides a classic example of sucha situation). Still, we can also indicate countries in which the size of municipal governmenthas only recently been re-shaped. For example, the history of the large British districtis just over 20 years old.2 Also, in Nordic countries amalgamation of small municipalitiesbeen in place no longer than the last 20–40 years. The structural changes introducedin European countries during the last 40 years have usually lead to enlargement oflocal government units. L.J. Sharpe in his report (1995) treats enlargement as a synonymto changes in territorial structures. The Sharpe generalization stresses the fact thatfragmentation trends in Central–East European countries during the beginning of1990’s were very atypical. However, during 1980s and 1990s theoretical argumentsin favor of the creation of territorially fragmented systems have become increasinglymore pronounced in many analysis published in Western Europe as well.
7
S I Z E O F LO C A L G O V E R N M E N T, L O C A L D E M O C R A C Y A N D E F F I C I E N C Y I N D E L I V E R Y O F LO C A L S E R V I C E S
Table 1.1Average Size of (Municipal) Local Governments in Selected European Countries
Country % of Municipalities Average Population Average AreaBelow 1,000 Citizens [sq. Km]
England and Wales 0 123,000 533
Lithuania 0 66,000 1,166
Yugoslavia 0 49,500 487
Bulgaria 0 35,000 432
Sweden 0 29,500 1,595
Holland 0.2 20,500 60
Denmark 0 18,000 150
Poland 0 16,000 130
Macedonia 3 15,800 209
Slovenia 3 10,300 106
Albania 0 10,000 77
Finland 5 10,500 730
Norway 4 9,000 710
Croatia 3 8,800 104
Romania 2 7,600 81
Italy 24 6,500 38
Estonia 9 5,700 178
Spain 61 5,000 60
Ukraine NA 4,600 56
Latvia 32 4,300 115
Hungary 54 3,300 32
Slovakia 68 1,900 17
Czech Republic 80 1,700 13
France 77 1,300 15
NOTE: Countries analyzed in the following chapters of this book are highlighted in bold font, otherCentral and Eastern Europe countries are marked in italics.
SOURCE: Newton, Karran (1985), Baldersheim et. al. (1996), The Size of Municipalities..., (1995),Horváth (1999), Kandeva (2000).
C O N S O L I D A T I O N O R F R A G M E N T A T I O N ?
8 D F I D – L G I L O C A L G O V E R N M E N T P O L I C Y P A R T N E R S H I P P R O G R A M
The issue of the size of local government units has many important practical con-sequences. This goes beyond the typical results usually identified with territorialorganization. For example, Page and Goldsmith (1987) claim that the shape of territorialorganization, to large extent, will determine other characteristics of the local governmentsystem, including the allocation of functions and the nature of the contact betweencentral and local governments.
Before we veer into deeper analysis of Central European countries, it is worthwhileto review the most important arguments for and against small/large local governments.
Keating (1995) claims that the discussion on optimal size of local governmentusually focuses on four dimensions:
• Economic efficiency—which scale may produce the most service at the leastcost;
• Democracy—what structures can best secure citizen control over governmentand proper accountability;
• Distribution—which structures can achieve the most equitable distributionof services and tax burdens;
• Development—which structures are best equipped to promote economicgrowth?
It is the reform theory that provides the most essential arguments for territorialconsolidation. These arguments can be summarized under the following items:
• There is economy of scale in many local services. Marginal cost of service deliveryis lower if the total amount of produced services is larger;
• Small local governments produce costs related to spillovers (a.k.a. “free-riders”,those using services in a municipality but who live and pay taxes elsewhere).Many big cities and their suburbs, which have separate local governments,provide a good example of just such a phenomenon. Citizens living in suburbspay their taxes locally but they still benefit from many services delivered inthe center of the city. The “central municipality” carries the burden of providingthe services used by commuters. To some extent, this means that tax-payersliving in the center subsidize those who live outside city limits. The situationis even more dramatic when the rich inhabit the suburbs and the majorityof those living in the center are relatively poor. Examples of spillover are alsoencountered in Central European countries. In the Czech Republic, many citiescomplain that surrounding municipalities are not willing to co-finance services(such as schools or administrative services), which are delivered in the city[Blazek, 1994]. During the beginning of 1990s, one frequent conflict inPoland was over financing public transportation to the suburbs. This servicewas delivered by a company owned by the “central city” but it was mostlyserving citizens from surrounding local governments [Swianiewicz, 1997].
9
S I Z E O F LO C A L G O V E R N M E N T, L O C A L D E M O C R A C Y A N D E F F I C I E N C Y I N D E L I V E R Y O F LO C A L S E R V I C E S
The spillover effect can never be eliminated (reduction of its negative impactis usually one reason for central grants systems) but it can be reduced if localgovernment system is territorially consolidated. Obviously the extent of problemsrelated to spillovers also depends on how local services are financed. For example,if tax on citizens’ income is one of major local revenues, the situation can bequite different depending upon whether revenues are allocated according toplace of residence (as in Scandinavian countries and Poland) or according toplace of work (as in Bulgaria or the Ukraine). Central cities will no doubt benefitmost from taxes on commercial activity and on commercial properties, whilesuburban municipalities will benefit more from tax on residential properties.
• Large local governments can provide more functions, which may lead to more publicinterest and participation in local politics. Page and Goldsmith (1987) arguethat one of the most important reasons why Northern European countries areresponsible for more functions than local governments in their fragmentedSouthern European counterparts, is the large size of their local governments.This observation was confirmed by Bours (1993) who grouped European localgovernment systems into 4 clusters3: (A) large and responsible for numerousfunctions (Scandinavia, Netherlands, the United Kingdom), (B) average sizeand average scope of functions (Finland, Germany, Belgium), (C) small, withan average scope of functions (France, Spain, Switzerland, Austria), (D) small,with a narrow scope of functions (Italy, Portugal, Greece). This classification’scorrelation between size and scope of functions is very clear. The theory arguesthat a broader list of functions stimulates citizens’ interest and participation aswell as helping to attract “better quality” candidates to local councils [Dahl,Tufte, 1973]. Of course, this is also related to the fact that the power and prestigeassociated with holding office in larger constituencies is greater [Goldsmith, Rose, 2000].
• Territorial consolidation provides more space for interest groups representing a pluralistsociety. In this theory, interest groups as well as more developed party systemsare seen as a positive emanation of pluralist society. In big communities, it iseasier to avoid nepotisms or other forms of political clienteles. It helps citizensinfluence local politics between the election periods. One potential danger isrelated to the presence of dominant pressure groups. Such a danger is smallerin large territorial units. Goldsmith and Rose (2000) also suggest that there isbetter representation of various minority groups in larger local governments,since bigger municipalities are usually more liberal and disadvantaged groupsare less likely to meet with negative prejudices preventing them from enteringthe politics;
• Similarly, in large local governments, there is a greater possibility of a strong civilsociety. In large communities, there is a greater chance that a dense networkof voluntary organizations will develop.
C O N S O L I D A T I O N O R F R A G M E N T A T I O N ?
10 D F I D – L G I L O C A L G O V E R N M E N T P O L I C Y P A R T N E R S H I P P R O G R A M
• Large local governments enable promotion of local economic development. Thisis the case because larger scale enables complex, coherent planning and alsomakes it easier to finance expensive infrastructure investment projects, crucialfor promoting economic development;
• Proponents’ arguments about territorial fragmentation based on “community argu-ments” are very often idealistic and vague. This line of argument tries to dispelsome of the counter-arguments used by proponents of territorial fragmentation.It is argued that most people are more interested in getting good quality, cheapservices rather than participating in the everyday decision-making and formu-lation of local policies. Further, to illustrate how vague the notion of “localcommunity” is, Lyon (1987) enumerates 94 different definitions of this term.
The opposing arguments (in favor of territorial fragmentation) include both theidea of localism [Jones, Stewart, 1983] and that of public choice. Although branchingfrom very different theoretical assumptions, both theories come to very similarconclusions—small is beautiful. The following arguments are those most frequentlyused to support this position:
• Contact between councilors and citizens are much closer and politicians are moreaccountable to their local communities when in small units. According to thisargument, “social trust is based on strong personal ties in small communities.Decline of community and social trust resulting from increasing scale will bereflected in declining political trust” [Denters, 2002]. This high trust issueshould subsequently be reflected in general positive attitudes towards theelected officials in small units;
• In small units citizens can “vote with their feet” [Tiebout, 1956] i.e. choosetheir preferred ratio of local taxes vs. services publicly delivered. Accordingto the classical Tiebout model, people migrate to local governments in whichthe ratio of taxes verses services is closest to their personal preferences.Territorial fragmentation decreases the costs of migration and increases thechances of reducing the gap between implemented public policies and theindividual preferences of citizens;
• Small local communities are more homogenous and it is easier to implementpolicies that meet the preferences of a large proportion of citizenry (to some extent,this is a less radical formulation of the Tiebout argument).
• There is more incentive for citizen participation in small communities because asingle individual’s vote will “weigh more”. Denters (2002) provides an excellentillustration: in Schiemonnikoog, the smallest Dutch municipality, one councilorrepresents 111 citizens. While in Amsterdam, there is one councilor for almost16,250 citizens. The rational of this argument is additionally strengthenedby the more socio-psychological argument that people are more likely to develop
11
S I Z E O F LO C A L G O V E R N M E N T, L O C A L D E M O C R A C Y A N D E F F I C I E N C Y I N D E L I V E R Y O F LO C A L S E R V I C E S
a stronger sense of community and local identification in smaller, morehomogenous settings. This, in turn, will heighten interest in local affairsand stimulate political involvement.
• Small local governments are less bureaucratic. In some functions, economy ofscale is overshadowed by problems related to the co-ordination and managementof large units. Administrative function is a good example of this.
• Argument of economy of scale is irrelevant since it is possible to separate responsibilityfor service from actual delivery. It is true that economy of scale is important inmany services. But many services may be contracted-out to the private sectorand, in such a situation, economy of scale depends on the size of the privatecompany. Possible solutions may be found in American and British privatizationof local services [Savas, 1987; Walsch, 1989] but also in the French model[Lorrain, 1997], in which large public utility companies serve many munici-palities, or in Germany [Reidenbach, 1997], where economy of scale isfrequently achieved by the creation of multi-sector companies providingcomplex services in small towns;
• Fragmentation supports competition between local governments in attractingcapital to those places where it will be most productive;
• Fragmentation supports experimentation and innovation.4 If a given territoryhas many small local governments, it is both easier to experiment with variouspolicies and to learn from neighboring territory’s experiences.
The collection of arguments presented above requires at least one critical comment.As Sharpe (1995) notes, size arguments cannot be considered in the abstract. Quiteoften, what is quoted as an argument for or against small scale local government, infact, is not related to the size itself, rather to the social nature of the community.For example, it is true that most small local governments have less developed pressuregroups and/or weaker media systems. Yet, it is not because they are small, rather,because they are rural. Only some of arguments quoted above can particularly berelated to the size itself.
3. ECONOMICS IN SEARCH OF THE OPTIMAL SIZE OF LOCALGOVERNMENT—KING’S ATTEMPT AT A SUMMARY MODEL
The economic analysis of optimal size for a local government is presented by King(1984). It provides a good summary of most the arguments presented above. Limitedspace available does not allow us to present the details of his model, but it isworthwhile to highlight at least the most important elements. The model startswith analysis of a basic situation in which:
C O N S O L I D A T I O N O R F R A G M E N T A T I O N ?
12 D F I D – L G I L O C A L G O V E R N M E N T P O L I C Y P A R T N E R S H I P P R O G R A M
• all citizens have similar tastes and incomes;• governments do not co-ordinate with each other• citizens are geographically immobile• the authorities that provide a public service, also produce that service• only one service is entrusted to sub-central authorities• the area is geographically homogenous• the population density of the country is broadly uniform.
These assumptions are successively released in the model analysis. The model isbased on cost-benefit analysis methods.
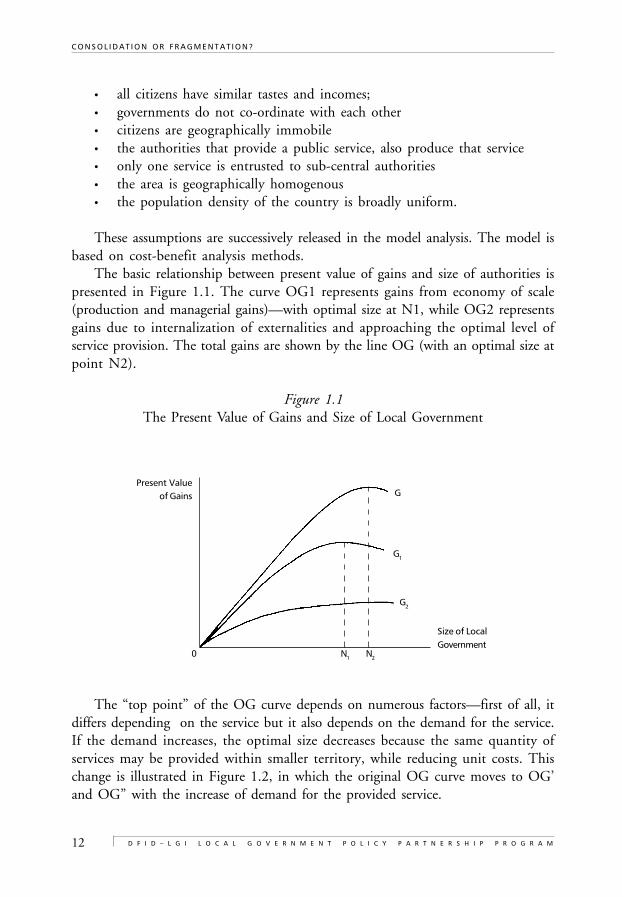
The basic relationship between present value of gains and size of authorities ispresented in Figure 1.1. The curve OG1 represents gains from economy of scale(production and managerial gains)—with optimal size at N1, while OG2 representsgains due to internalization of externalities and approaching the optimal level ofservice provision. The total gains are shown by the line OG (with an optimal size atpoint N2).
Figure 1.1The Present Value of Gains and Size of Local Government
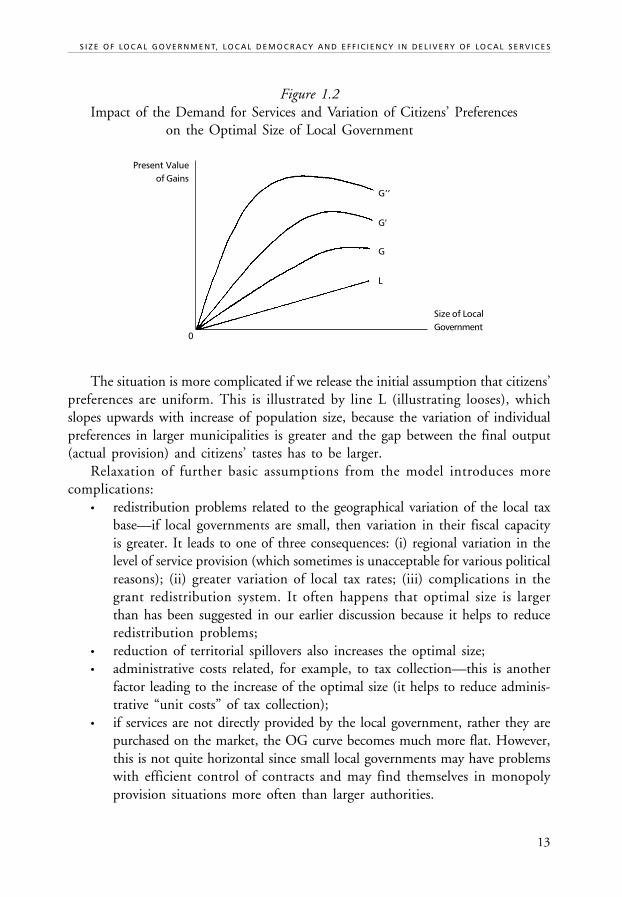
The “top point” of the OG curve depends on numerous factors—first of all, itdiffers depending on the service but it also depends on the demand for the service.If the demand increases, the optimal size decreases because the same quantity ofservices may be provided within smaller territory, while reducing unit costs. Thischange is illustrated in Figure 1.2, in which the original OG curve moves to OG’and OG” with the increase of demand for the provided service.
G1
G2
G
N1 N2
Present Valueof Gains
Size of LocalGovernment
0
13
S I Z E O F LO C A L G O V E R N M E N T, L O C A L D E M O C R A C Y A N D E F F I C I E N C Y I N D E L I V E R Y O F LO C A L S E R V I C E S
Figure 1.2Impact of the Demand for Services and Variation of Citizens’ Preferences
on the Optimal Size of Local Government
The situation is more complicated if we release the initial assumption that citizens’preferences are uniform. This is illustrated by line L (illustrating looses), whichslopes upwards with increase of population size, because the variation of individualpreferences in larger municipalities is greater and the gap between the final output(actual provision) and citizens’ tastes has to be larger.
Relaxation of further basic assumptions from the model introduces morecomplications:
• redistribution problems related to the geographical variation of the local taxbase—if local governments are small, then variation in their fiscal capacityis greater. It leads to one of three consequences: (i) regional variation in thelevel of service provision (which sometimes is unacceptable for various politicalreasons); (ii) greater variation of local tax rates; (iii) complications in thegrant redistribution system. It often happens that optimal size is largerthan has been suggested in our earlier discussion because it helps to reduceredistribution problems;
• reduction of territorial spillovers also increases the optimal size;• administrative costs related, for example, to tax collection—this is another
factor leading to the increase of the optimal size (it helps to reduce adminis-trative “unit costs” of tax collection);
• if services are not directly provided by the local government, rather they arepurchased on the market, the OG curve becomes much more flat. However,this is not quite horizontal since small local governments may have problemswith efficient control of contracts and may find themselves in monopolyprovision situations more often than larger authorities.
Present Valueof Gains
Size of LocalGovernment
0
G’’
G’
G
L
C O N S O L I D A T I O N O R F R A G M E N T A T I O N ?
14 D F I D – L G I L O C A L G O V E R N M E N T P O L I C Y P A R T N E R S H I P P R O G R A M
With some simplification, we may say that the OG curve presents a summaryof theoretical expectations for the impact of size on unit costs of service provision,while L line represents a summary of theoretical expectations for the impact of sizeon democratic processes. The theory also expects that distribution and developmentconsiderations will also push the optimal size in the direction of larger localgovernments.
4. SOME EXAMPLES OF EMPIRICAL ANALYSIS FOR THE IMPACTOF SIZE ON THE FUNCTIONING OF LOCAL GOVERNMENTS
There are many empirical analysis which try to expose the following questions:1) How is size of local governments related to democracy? Is there any relationship
between size and citizens satisfaction as well as between size and ability (andwillingness) to participate in local public issues?
2) How does the size of local governments affect costs of local services’ deliveryand capacity for development?
Ad. 1.In their classic analysis, Verba and Nie (1972) came to a conclusion which supportsreform theory arguments—that is, participation is positively correlated with thesize of local community. Newton (1982) and Nielsen (1981) formulated similarconclusions in their studies in the United Kingdom and Denmark. Yet, anotherclassic book by Dahl and Tufte (1973) leads to opposite conclusions. Very interestinganalysis by Mouritzen (1991) suggests that, in Denmark, trust in local governmentis low in big cities (over 100,000) and the optimal point is probably somewherebetween a population of 15 and 20 thousand.
In their recent comparative analysis of the United Kingdom and Norway,Goldsmith and Rose (2000) found that, in both countries, local elections in largermunicipalities attract more candidates, this may be interpreted as a larger interestin local politics. In Norway, large cities also have a more balanced social structurefor their councils (i.e. representation by a larger proportion of female councilors).On the other hand, there is a strong (and continually increasing) negative correlationbetween local government size and turnout in local elections in Norway. In theUnited Kingdom, such a relationship has not been found. This is probably due tothe large size of local governments in the UK, where a local government with apopulation of 50,000 is considered very small. For the nature of social links there isnot a huge difference between a population of 50,000 and 100,000, but there is asignificant qualitative difference between a community of 2,000 and 20,000.
15
S I Z E O F LO C A L G O V E R N M E N T, L O C A L D E M O C R A C Y A N D E F F I C I E N C Y I N D E L I V E R Y O F LO C A L S E R V I C E S
Rose (2002) provides a comparative analysis of the relationship between size oflocal government and non-electoral participation in local politics in Denmark, theNetherlands and Norway. He comes to the conclusion that size is an importantfactor in explaining citizens local political activity. In small local governments,contacting local politicians, contacting local administration and—to a lesser extent—attending public meetings, are all usually much more frequent than they are in biglocal governments. For other analyzed forms of participation (participation in actiongroups and petitioning) the relationship is not so clear nor so straightforward. Analysisshows a low participation in the smallest municipalities (especially those below1,000–2,000 citizens) as well as some advantages of larger governments.
Denters (2002) provides clear examples (on the basis of analysis carry out in theNetherlands, Denmark, Norway and the United Kingdom) that trust in localpoliticians is significantly, and negatively, related to the size of local government.In spite of theoretical arguments, which present different predictions in this respect,Denters concludes that the civic trust or higher competence perspectives (whichprovide an argument for better “democratic performance” in bigger municipalities)are not supported by empirical findings.
Many interesting examples of this are provided by a recent Council of Europereport [The Size..., 1995]. Analysis completed in Finland and Iceland did not leadto any definite conclusions on the impact of size. In Norway, it was found thatthere was larger voter turn-out during elections in small local governments but, onthe other hand, larger units seem to stimulate participation through protest actionsand general political communication seems to be more intensive. Also, in theNetherlands, size has no clear effect. For example, on one hand, councilors are easieravailable to citizens in smaller municipalities, but, on the other hand, in regards toconsultations on decisions, large municipalities were found to be more active.However, these findings are questioned by Denters, De Jong and Thomassen (1991)who all criticize Dutch amalgamation policy anyway, arguing that it leads to adecrease in citizen satisfaction and participation in local public affairs. This is notalways immediately visible in the data because participation is usually positivelyrelated to the level of education and low-educated citizens are frequently over-represented in small municipalities. Yet, when impact of size by the education levelwas controlled, the correlation became much stronger. Surprisingly, the same Dutchresearch did not find a correlation between the size of local government and the gapbetween policy preferences of citizens and local councilors.
In Sweden, some very interesting research tries to compare the situation beforeand after amalgamation of local governments. It found that, after amalgamation, theintensity of local political life and citizens orientation into local policy issues increasedbut the personal acquaintance between residents with local politicians decreased.
C O N S O L I D A T I O N O R F R A G M E N T A T I O N ?
16 D F I D – L G I L O C A L G O V E R N M E N T P O L I C Y P A R T N E R S H I P P R O G R A M
The Council of Europe report also notes also an interesting observation takenfrom Central Europe. One of problems with local democracy in the Czech Republicis that, in very small villages, it is often difficult to find enough citizens willing tobe members of the municipal bodies prescribed by the law.
Ad. 2.In regards to costs of service delivery and its efficiency, various empirical analyseslead to a variety of conclusions. It is generally accepted that the efficiency functionin relation to the size is U-shaped, with the lowest point representing the effect ofeconomy of scale. But location of this point is very different in various empiricalanalyses. Newton (1992), Sharpe (1995), as well as King (1984) in his theoreticalanalysis, all point out that optimal size may differ for various services. Therefore,optimal size depends on the allocation of functions to local governments.
The Council of Europe survey on the subject [The Size...., 1995] providesnumerous examples of empirical analysis of the impact of size on the efficiency oflocal services’ delivery. Still, there is a basic methodological problem with suchanalysis. It is extremely difficult to measure the output of certain services and thereis certainly no objective method to measure the benefits arising from them. Inpractice, many researchers adopt a simplified method measuring only the cost-side,following a silent assumption that the level of service provision is invariant. However,some analyses are worthy of mention. In the Netherlands, it has been found thatsize of municipalities has considerable implications in regards to administrativecapabilities concerning certain services such as social security, public order andsafety. Yet, it has little importance in regards to others, such as public works. Thesame Council of Europe survey reported results of analysis occurring in manycountries in which the question of the minimum size of municipal government hasbeen asked. In quite a few of the countries (Italy, Norway, Denmark) the conclusionwas that a population 5,000 is the minimal size for an efficient local government.Analysis undertaken in the Netherlands and Sweden led to even larger populationthreshold of about 8,000.
Most research agrees that larger size increases capacity of local administration topromote economic development. However, this finding happens to be in questionas well. For example Denters, De Jong and Thomassen (1991), analyzing 30 Dutchmunicipalities with less than 30,000 citizens, could find no evidence that biggermunicipalities are more successful in achieving their planning objectives. This fact,together with other findings, led them to the conclusion that size of local governmentis far less important for various dimensions of the quality of government than is generallypresumed.
The brief review presented in this section clearly shows that, although most theempirical findings confirm theoretical arguments presented in the previous sections,
17
S I Z E O F LO C A L G O V E R N M E N T, L O C A L D E M O C R A C Y A N D E F F I C I E N C Y I N D E L I V E R Y O F LO C A L S E R V I C E S
there are considerable differences in the theoretical approaches and a considerablevariation of the empirical findings, which lead to far from univocal conclusions.
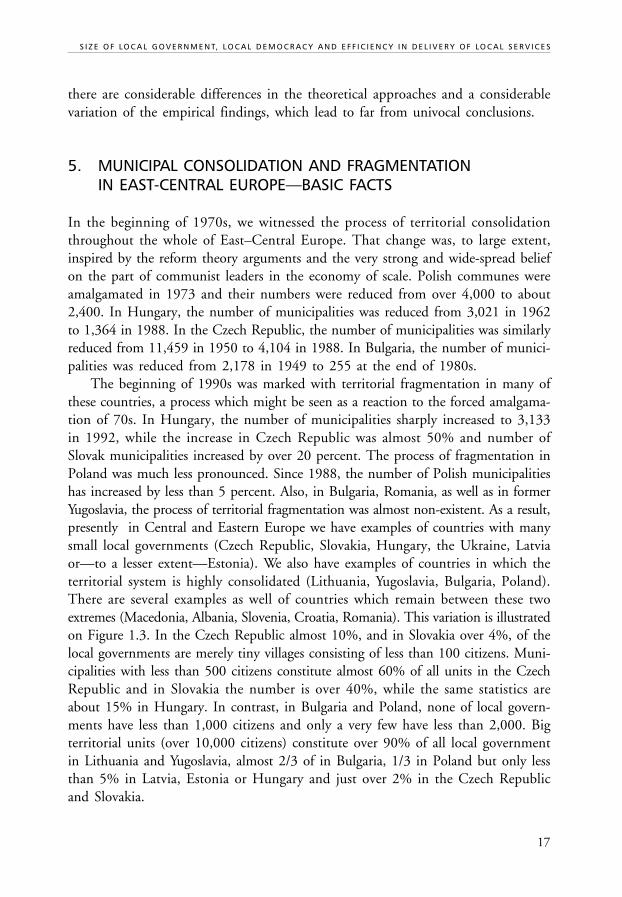
5. MUNICIPAL CONSOLIDATION AND FRAGMENTATIONIN EAST-CENTRAL EUROPE—BASIC FACTS
In the beginning of 1970s, we witnessed the process of territorial consolidationthroughout the whole of East–Central Europe. That change was, to large extent,inspired by the reform theory arguments and the very strong and wide-spread beliefon the part of communist leaders in the economy of scale. Polish communes wereamalgamated in 1973 and their numbers were reduced from over 4,000 to about2,400. In Hungary, the number of municipalities was reduced from 3,021 in 1962to 1,364 in 1988. In the Czech Republic, the number of municipalities was similarlyreduced from 11,459 in 1950 to 4,104 in 1988. In Bulgaria, the number of munici-palities was reduced from 2,178 in 1949 to 255 at the end of 1980s.
The beginning of 1990s was marked with territorial fragmentation in many ofthese countries, a process which might be seen as a reaction to the forced amalgama-tion of 70s. In Hungary, the number of municipalities sharply increased to 3,133in 1992, while the increase in Czech Republic was almost 50% and number ofSlovak municipalities increased by over 20 percent. The process of fragmentation inPoland was much less pronounced. Since 1988, the number of Polish municipalitieshas increased by less than 5 percent. Also, in Bulgaria, Romania, as well as in formerYugoslavia, the process of territorial fragmentation was almost non-existent. As a result,presently in Central and Eastern Europe we have examples of countries with manysmall local governments (Czech Republic, Slovakia, Hungary, the Ukraine, Latviaor—to a lesser extent—Estonia). We also have examples of countries in which theterritorial system is highly consolidated (Lithuania, Yugoslavia, Bulgaria, Poland).There are several examples as well of countries which remain between these twoextremes (Macedonia, Albania, Slovenia, Croatia, Romania). This variation is illustratedon Figure 1.3. In the Czech Republic almost 10%, and in Slovakia over 4%, of thelocal governments are merely tiny villages consisting of less than 100 citizens. Muni-cipalities with less than 500 citizens constitute almost 60% of all units in the CzechRepublic and in Slovakia the number is over 40%, while the same statistics areabout 15% in Hungary. In contrast, in Bulgaria and Poland, none of local govern-ments have less than 1,000 citizens and only a very few have less than 2,000. Bigterritorial units (over 10,000 citizens) constitute over 90% of all local governmentin Lithuania and Yugoslavia, almost 2/3 of in Bulgaria, 1/3 in Poland but only lessthan 5% in Latvia, Estonia or Hungary and just over 2% in the Czech Republicand Slovakia.
C O N S O L I D A T I O N O R F R A G M E N T A T I O N ?
18 D F I D – L G I L O C A L G O V E R N M E N T P O L I C Y P A R T N E R S H I P P R O G R A M
Figure 1.3Distribution of Local Governments According to Their Population Size
Not surprisingly, in the countries with territorially fragmented systems—theCzech Republic, Slovakia and Hungary (and also in some other countries of theregion—such as the Ukraine, where the average size of a municipal governmentunit is just over 4,600 citizens, yet in rural areas the average size of over 10,000 ofits local governments is just over 1,500 citizens) the issue of the size of municipalgovernment has became among the hottest issues discussed both by local politiciansand academics. It has been noted that small local governments (many of them withless than 100 inhabitants) cannot provide important local services and they slow-down the decentralization process [see for example: Szabo, 1991]. It has been alsomentioned that territorial fragmentation increases problems related to spillover[Blazek, 1994]. The problems associated with small local government have frequentlybeen the focus of very numerous analyses [see for example: Horvath, 1995, whofocused his attention on service delivery issues, or Bucek, 1997, who discussed theweakness of small local governments in promoting economic growth due to theirlack of capacity to undertake major infrastructure projects].
Contrary to the Czech Republic, Slovakia or Hungary, the issue of size ofmunicipal government has not been widely discussed in Poland nor have any pointedchanges been introduced. The issue has become important only locally, especially
[%]
0
20
Yugo
slavi
a
40
60
80
100Bu
lgar
ia
Pola
nd
Alb
ania
Rom
ania
Croa
tia
Slov
enia
Mac
edon
ia
Esto
nia
Latv
ia
Hun
gary
Slov
akia
Czec
h Re
p.
Over 10,000
5,000–10,000
1,000–5,000
500–1,000
200–500
Up to 200
19
S I Z E O F LO C A L G O V E R N M E N T, L O C A L D E M O C R A C Y A N D E F F I C I E N C Y I N D E L I V E R Y O F LO C A L S E R V I C E S
in communities consisting of a small town and several surrounding villages. In suchlocal governments, conflicts between urban and rural councilors were quite common.The former were accused of preferring spending on “pavements and flowers in thecity”5 while the latter prefer development of water supply and roads in rural areas.Not surprisingly, the division between town and village was the most frequentreason for the modest increase in number of Polish municipalities during the 1990s.This is despite the other rational arguments proving there was even an increase ofsome service delivery costs after the split [Swianiewicz, 1996].
6. SIZE OF LOCAL GOVERNMENTSIN CENTRAL AND EASTERN EUROPE—WHICH THEORETICAL ARGUMENTS SEEM TO BE VALID?
Do theoretical arguments cited in the first section of this paper seem to be potentiallyvalid in Central and Eastern Europe? We hope that the analysis undertaken in ourLGPP project will help to answer this question. It may be best, however, to start byformulating some initial comments and hypothesis.
It seems to me that most of the arguments used in Western literature are worthyof consideration and we should keep them in mind when we prepare our analysis,although there are some specific remarks that are very important.
There is no doubt that economy of scale may be important to many local servicesprovided in Central and Eastern Europe. One should also consider though that it isthe impact of a weak infrastructure which in some cases makes the benefits of largerscale in rural areas questionable. For example, it is true that larger schools organizedfor children from a few small villages can be not only cheaper but also may providebetter quality education. But for children from villages with very poor or non-existent transportation connections attending the school may raise additional problemswhich can overshadow the potential benefits. During a visit to the Ukraine, I wastold that if snow falls are heavy enough, many villages are almost completely cut-offfor most of the winter.
Similarly, we discuss the use of basic administrative services. Bulgaria definitelyhas the largest local government units among those countries under analysis. But thosetraveling to the municipal centers in mountain areas may find it very difficult. Thevillage of Srbnica, in the Rodopy mountains, is located in the Municipality of Velingrad.The distance between the settlement units is well above 30 kilometers. There is onlyone bus per day (and not every day of the week) providing transportation to Velingradand most citizens do not have their own cars. How can they use administrativeservices in the municipal center? Such a situation puts a very large question markover the policy of territorial consolidation justified by the above mentioned theoretical
C O N S O L I D A T I O N O R F R A G M E N T A T I O N ?
20 D F I D – L G I L O C A L G O V E R N M E N T P O L I C Y P A R T N E R S H I P P R O G R A M
argument. It also requires significant “decentralization within the municipality” toallow the provision of basic administrative services down in individual villages.
But existing data clearly suggests [for Polish evidence see Swianiewicz, 1996,but similar calculations were conducted in other countries as well] that there is aneconomy of scale for administrative services in Central and Eastern Europe. Does itmean that the arguments, for local and public choice within larger organizationalbureaucracies, are totally invalid? Not necessarily. It might very well happen thatbenefits from cheaper administrative services in large local governments are partiallyeaten-up by slower decision making processes and more frequent events of corruption(indirect evidence from Poland suggests that danger of corruption is much larger inbig than in small local governments).
Arguments related to the catchment area and spillover effect remain valid butshould be slightly reformulated. In several Central and Eastern European countries,some of the taxes providing local budget revenues are to be paid in one’s place ofwork not in one’s place of residency (Bulgarian and Ukrainian local shares in PersonalIncome Tax provide good examples). In this case, the list of losers and gainers willchange. Under such a regulation, it is more likely that suburban municipalities willloose and central cities will gain.
Other theoretical arguments, which require additional comment, concern betterorganized pressure groups and more diversified forms of participation in large local govern-ments. Can this argument, based on the experiences of Western democracies with relativelylong traditions of democratic and civic society, be translated into a realistic scenariofor Central and Eastern Europe where civic society is at a much earlier stage offormation? This question certainly requires further reflection. It seems that, in Easternand Central Europe, development of local media (press, TV stations) is very importantfor pluralist politics and this factor may work in favor of larger local governments.
The set of arguments related to closeness and openness of local authorities in smallunits may be even more important in our region than in well-established Westerndemocracies. Lack of well-established democratic traditions and political culturecan make civic control over authorities difficult especially in big, more anonymouscommunities.
It seems that incentive for citizens’ interest in local politics can be also providedby the system of voting. The problem of rural local governments which consist ofseveral settlement units is proper representation of individual villages. In theproportional system (like in Bulgaria) there is no guarantee that a council will notbe dominated by representatives from the largest village (town). In the ward majoritysystem (as in Polish municipalities below 20,000 citizens) more balanced territorialrepresentation may be secured. Reports presented in the following chapters willprovide us with opportunity to check whether this hypothesis is correct.
21
S I Z E O F LO C A L G O V E R N M E N T, L O C A L D E M O C R A C Y A N D E F F I C I E N C Y I N D E L I V E R Y O F LO C A L S E R V I C E S
The Tiebout concept of voting by feet is highly controversial anywhere, but ithas to be treated with special suspicion in countries in which spatial mobility is verylow. For example, in Poland, a low level of incentive to migrate as well as structuralshortage of housing flats, are seen as some of the most important problems in developinga sound policy to cope with unemployment. Still, there is no doubt that the actualability to migrate, because of variation in local taxes, is quite small. We can treat theTiebout theory as an interesting point of reference or as an example of elegant model,but certainly it would be unwise to try to apply it in our countries, word for word.
Last but not least, there is the public choice argument, suggesting that theeconomy of scale effect should be achieved by private producers to which provision of localservices might be contracted. This raises the question: To what extent are the marketsin Central and Eastern Europe developed? Naturally, the situation may differ fromone country to another (as well as from one locality to another within each of thecountries), but one can definitely say that the types of policies, recommended bythe public choice theory, are still more difficult to implement in practice withinCentral and Eastern Europe than in Northern America or Western Europe.
7. SIZE OF LOCAL GOVERNMENTSIN CENTRAL AND EASTERN EUROPE—WHAT DO WE KNOW FROM EXISTING EMPIRICAL ANALYSIS?
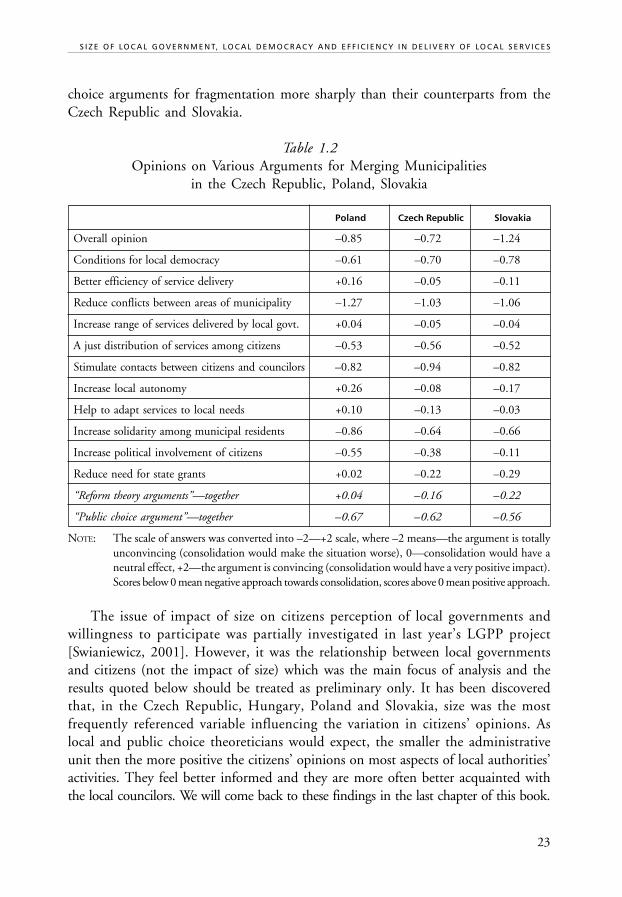
In 1997, mayors from the Czech Republic, Poland, and Slovakia were asked theiropinion on both the general idea of amalgamation and on the impact of possibleamalgamation on different aspects of local communities’ governance6 [for moredetails see Swianiewicz, 2000].
The first observation is that there are many missing values in the answers torelevant questions in the LDI survey—i.e. many mayors do not have very clearopinion on the issue. It might be interpreted in two ways: respondents either havenot thought about the issue or they considered the various arguments (leading todifferent conclusions) and have difficulties deciding. At first glance, the former hypothesisis supported by the fact that, in general, when questioned about amalgamation,Polish mayors have remained undecided much more often (19%) than their Czech(7%) or Slovak (6%) colleagues. It may reflect the fact that, in Poland (opposite totwo other countries), territorial division on municipal level is not a hot issue. Butsurprisingly enough, the situation appears differently when we consider opinions onindividual arguments for and against fragmentation. In this case, the proportion ofundecided Polish mayors is lower than in two other countries. The proportion ofmissing values in Poland varies from 2.5% to 12.9%. In the Czech Republic, missingvalues vary from 4.1% to 13.4%, with three other arguments with missing values
C O N S O L I D A T I O N O R F R A G M E N T A T I O N ?
22 D F I D – L G I L O C A L G O V E R N M E N T P O L I C Y P A R T N E R S H I P P R O G R A M
of more than 10% ratio. In Slovakia, the ratio varies from 7.6% to 17.2%, with five (!)other arguments with missing values of over 10%. This suggests that, while Czechand (especially) Slovak mayors usually have a clear general opinion on the issues ofterritorial consolidation (as we will see later, they are usually against it), their opinionis quite often of a more ideological nature rather than based on analysis of rationalarguments.
In general, public choice and localism arguments for territorial fragmentationare much more convincing to Central European mayors than reform theory argumentsfor consolidation. Yet again, there are important differences between the countriesanalyzed here.
This is well illustrated in Table 1.2. Overall opinion on consolidation is themost negative in Slovakia. According to the mayors there, three of the strongestarguments against amalgamation are: it would increase level of conflicts betweencitizens, it would reduce support for local democracy and it would make contactbetween residents and councilors more difficult. The top-most convincing argumentagainst consolidation is the fear of increased conflicts among citizens. It is also theonly argument stressed more in Poland than in the two other countries. PerhapsPolish municipalities, which are usually much larger than Czech or Slovak, havehad the most frequent negative experiences related to that issue. Indeed, in recognizedcases of division, involving relatively big Polish local governments, the process usuallystarted with conflicts between villages or the town and surrounding villages[Swianiewicz, 1995]. Also, conflicts between geographical areas are among the mostimportant dimensions of political debate in local councils, especially in rural areas,where local politics is usually non-partisan.
On the other hand, arguments for consolidation that are usually the mostconvincing are: better efficiency of service delivery, possible increase of local autonomyand then (gaining slightly less support) that it would help to increase range ofservices delivered locally and it would help to adapt services to local needs. Thescore of the latter argument is surprising, since public choice theory uses this argumentto support territorial fragmentation. However, Poland is the only country in whichany of the arguments for amalgamation proved to be, all in all, convincing for themayors (i.e. the average score, as seen in the Table 1.2, is larger than 0)7 .
Arguments evaluated by mayors during the survey may be divided in two groups:those streaming from reform theory and those referring to arguments of localism orpublic choice. The summary results for the two groups or, rather, their definedarguments, are presented at the bottom of Table 1.2. Public choice arguments (forfragmentation) are seen everywhere as more important. On the other hand, reformtheory arguments for consolidation are considered as largely valid only in Poland.However, support for this is not very high in Poland either. Their average score infavor of reform theory arguments is just over 0. At the same time, they see public
23
S I Z E O F LO C A L G O V E R N M E N T, L O C A L D E M O C R A C Y A N D E F F I C I E N C Y I N D E L I V E R Y O F LO C A L S E R V I C E S
choice arguments for fragmentation more sharply than their counterparts from theCzech Republic and Slovakia.
Table 1.2Opinions on Various Arguments for Merging Municipalities
in the Czech Republic, Poland, Slovakia
Poland Czech Republic Slovakia
Overall opinion –0.85 –0.72 –1.24
Conditions for local democracy –0.61 –0.70 –0.78
Better efficiency of service delivery +0.16 –0.05 –0.11
Reduce conflicts between areas of municipality –1.27 –1.03 –1.06
Increase range of services delivered by local govt. +0.04 –0.05 –0.04
A just distribution of services among citizens –0.53 –0.56 –0.52
Stimulate contacts between citizens and councilors –0.82 –0.94 –0.82
Increase local autonomy +0.26 –0.08 –0.17
Help to adapt services to local needs +0.10 –0.13 –0.03
Increase solidarity among municipal residents –0.86 –0.64 –0.66
Increase political involvement of citizens –0.55 –0.38 –0.11
Reduce need for state grants +0.02 –0.22 –0.29
“Reform theory arguments”—together +0.04 –0.16 –0.22
“Public choice argument”—together –0.67 –0.62 –0.56
NOTE: The scale of answers was converted into –2—+2 scale, where –2 means—the argument is totallyunconvincing (consolidation would make the situation worse), 0—consolidation would have aneutral effect, +2—the argument is convincing (consolidation would have a very positive impact).Scores below 0 mean negative approach towards consolidation, scores above 0 mean positive approach.
The issue of impact of size on citizens perception of local governments andwillingness to participate was partially investigated in last year’s LGPP project[Swianiewicz, 2001]. However, it was the relationship between local governmentsand citizens (not the impact of size) which was the main focus of analysis and theresults quoted below should be treated as preliminary only. It has been discoveredthat, in the Czech Republic, Hungary, Poland and Slovakia, size was the mostfrequently referenced variable influencing the variation in citizens’ opinions. Aslocal and public choice theoreticians would expect, the smaller the administrativeunit then the more positive the citizens’ opinions on most aspects of local authorities’activities. They feel better informed and they are more often better acquainted withthe local councilors. We will come back to these findings in the last chapter of this book.
C O N S O L I D A T I O N O R F R A G M E N T A T I O N ?
24 D F I D – L G I L O C A L G O V E R N M E N T P O L I C Y P A R T N E R S H I P P R O G R A M
It is hard to formulate very definite conclusions on the basis of the data collectedby the “Public perception…” LGPP project, however, it seems that citizens withinsmall administrative units, while enjoying many positive features of their localgovernments, are at least partially aware that far-reaching decentralization of functionson to very small authorities would be unrealistic or would lead to inefficiency ofservice provision. Still, this conclusion would require further investigation with theinclusion of economic—not only sociological—analysis.
8. THE STRUCTURE OF THE BOOK
The reports presented in the following chapters provide empirical analysis on theissues previously discussed in regards to four8 Central and East European countries:Bulgaria, Hungary, Poland and Slovakia. These analysis lead to general conclusionsand practical recommendations which are presented both in national reports and inthe summary chapter at the end of the book. The main focus is on the basic (thelowest) level of local governments, however, wherever it is appropriate, referencesare made to the situation within the upper tiers of government as well.
Each of national studies tries to answer following questions:• What is the impact of the size of basic local government units on their
efficiency and effectiveness? Efficiency considerations include; scale economiesin service delivery, the costs of administration, as well as local economicdevelopment policies. Effectiveness includes; issues of public trust and parti-cipation in local public issues.
• What measures are taken in individual countries to compensate for territorialfragmentation? These measures may include; municipal cooperation, jointoffices and differential assignment of functions. In amalgamated systems—how is representation of village interests secured (especially through the electionsystem)?
These general issues are made operational in a list of more specific researchissues:
• Impact of the size of local governments on the level citizens’ satisfaction withlocal government and preservation of community life. There are arguments,including those formed in the year 2000 following the LGPP “public percep-tion study” [Swianiewicz, 2001], that people in small local governments aremore willing to participate, trust local authorities more and are more satisfiedwith the performance of local administration. However, this is not necessarilytrue for the smallest groups and, anyway, it does not concern all dimensionsof citizens’ satisfaction;
25
S I Z E O F LO C A L G O V E R N M E N T, L O C A L D E M O C R A C Y A N D E F F I C I E N C Y I N D E L I V E R Y O F LO C A L S E R V I C E S
• Catchment area of services delivered by local governments. How often doesit happen that services delivered by one local government serve populationin the surrounding units as well? To what extent is this a problem for smalllocal governments in rural areas? How this situation is dealt with? For example:is the service being delivered when a local government receives specialcompensation from the state budget? Are there mechanisms of horizontalcompensation among local government budgets? Are there examples ofvoluntary and compulsory co-operation of local governments (for examplein form of one-purpose associations)?
• In countries where one local government covers several settlement units—what are examples of “decentralization within local government”? How arethe relationships between individual villages managed? Is there any form ofgovernment in individual villages? If so, what are its powers and modes ofoperation (in functional and financial terms)? What is the level of tension(conflicts) between villages within one local government and what aremethods to manage these tensions? What measures are, or should be taken,to secure sufficient political representation of individual villages in theamalgamated system?
• The impact of size on unit costs in service delivery. Is there any evidence ofthe economy (or diseconomy) of scale in local services? In relation to whichservices has this been noticed?
• Impact of territorial organization on the allocation of functions among tiersof government. In some countries small size is a limit for the further decentra-lization of many important functions. In result, these are delivered by centralgovernment administration—is that the case in some East-Central Europeancountries?
• Impact of territorial organization on local economic development policies.Is there any evidence that territorial fragmentation/consolidation makeseconomic development policies less or more effective?
• what are the most important features of national debates on the issue of sizeof local governments? Are those debates “a hot issue” on the political agendaor are they treated as of secondary importance?
Although there is still much to be done, we hope that this book contributes tofilling some of the gaps in our knowledge and also provides input into importantpolicy discussions going on in several countries of the region.
C O N S O L I D A T I O N O R F R A G M E N T A T I O N ?
26 D F I D – L G I L O C A L G O V E R N M E N T P O L I C Y P A R T N E R S H I P P R O G R A M
BIBLIOGRAPHY
Baldersheim, H., and Stahlberg, K. (1994). Towards the self-regulating municipality:free communes and administrative modernisation in Scandinavia. Aldershot–Brookfield–Singapore–Sydney: Dartmouth.
Baldershiem, H., Illner, M., Offerdal, A., Rose, L., and Swianiewicz, P. (Eds.)(1995). Local Democracy and the Process of Transformation in East-Central Europe.Boulder–San Francisco–Oxford: Westview Press.
Blazek, J. (1994). “Changing Local Finances in the Czech Republic: Half WayOver?” GeoJournal, Vol. 32, No. 3.
Bours, A. (1993). “Management, Teirs, Size and Amalgamations of Local Government”.In Bennett, R.J. (Ed.) Local Government in the New Europe. London–New York:Belhaven Press.
Bucek, J. (1997). “Size Categories of Municipalities and Finances of Local Governmentin Slovakia”. Acta Universitatis Carolinae, Geographica, Supplementum.
CBOS (1994). “Okolicznosci przejmowania szkól przez samorzady lokalne”, BiuletynCBOS, Maj 1994.
Dahl, R., and Tufte, E.R. (1973). Size and Democracy. Stanford University Press.
Denters, B., De Jong, H., and Thomassen, J. (1991). “Reorganizing Local Government:A Normative Analysis of Amalgamations of Dutch Municipalities”. Paper preparedon the occasion of Professor V. Ostrom’s visit to University of Twente.
Denters, B. (2002, forthcoming). “Size and Political Trust: Evidence from Denmark,The Netherlands, Norway and the United Kingdom”. Government & Policy C:Environment and Planning.
Fourier, C. (1829). Le nouveau monde industriel. Paris.
Goldsmith, M., and Rose, L. (2000). “Constituency, Size and Electoral Politics: AComparison of Patterns at Local Elections in Norway and the UK”. Paper presentedat the IPSA World Congress, Quebec, Canada, 1–5 August 2000.
Horváth, T. (1995). “Local Functions and Local Democracy: Size, Democracy andFunctions in East-Central European Systems of Local Government”. Paper preparedfor the European Summer School in Local Government Studies, Odense, 3–15July 1995.
Horváth, T. (Ed.). (1999). Decentralisation: Experiments and Reforms. Budapest:Open Society Institute, Local Government and Public Service Reform Initiative.
˛
27
S I Z E O F LO C A L G O V E R N M E N T, L O C A L D E M O C R A C Y A N D E F F I C I E N C Y I N D E L I V E R Y O F LO C A L S E R V I C E S
Jones, G., and Stewart, J. (1983). The Case for Local Government. London: Allen &Unwin.
Kandeva, E. (Ed.) (2000). Stabilisation of Local Governments. Budapest: Open SocietyInstitute, Local Government and Public Service Reform Initiative.
Keating, M. (1995). “Size, Efficiency and Democracy: Consolidation. Fragmentationand Public Choice”. In Judge, D., Stoker, G., and Wolman, H. (Eds.). Theoriesof Urban Politics. London–Thousand Oaks–New Delhi: Sage.
King, D.S. (1984). Fiscal Tiers: The Economy of Multi-Level Government. London:Allen & Unwin.
Lorrain, D. (1987). “France; Silent Change”. In Lorrain, D., and Stoker, G. (Eds.)The Privatisation of Urban Services in Europe. London, UK: Pinter.
Lyon L., (1987). The Community in Urban Society. Chicago: Dorsey.
Mouritzen, P.E. (1989). “City Size and Citizens’ Satisfaction: Two Competing TheoriesRevisited”. European Journal of Political Research, Vol. 17.
Newton, K., and Karran, T.J. (1985). The Politics of Local Expenditure. London,UK: Macmillan.
Newton, K. (1992). “Is Small Really so Beautiful? Is Big Really so Ugly? Size,Effectiveness and Democracy in Local Government”. Political Studies, Vol. 30.
Nielsen, H.J. (1982). “Size and Evaluation in Government: Danish Attitudes towardsPolitics at Multiple Levels of Government”. European Journal of Political Research,Vol. 9.
Page, E., and Goldsmith, M. (Eds.) (1987). Central and Local Government Relations.London, UK: Sage.
Plato (360 B.C.E.). Laws and Republic.
Reidenbach, M. (1997). “The Privatisation of Urban Services in Germany”. In Lorrain,D., and Stoker, G. (Eds.) The Privatisation of Urban Services in Europe. London,UK: Pinter.
Rose, L. (2002, forthcoming). “Municipal Size and Local Non-Electoral Participation:Findings form Denmark, the Netherlands and Norway”. Environment and Planning.
Savas, E.S. (1987). Privatisation: The Key to Better Government. New Jersey: ChathamHouse.
Sharpe, L.J. (1995). “Local Government: Size, Efficiency and Citizen Participation”.In “The Size of Municipalities, Efficiency and Citizen Participation”. Local andRegional Authorities in Europe, No. 56. Strasbourg: Council of Europe.
C O N S O L I D A T I O N O R F R A G M E N T A T I O N ?
28 D F I D – L G I L O C A L G O V E R N M E N T P O L I C Y P A R T N E R S H I P P R O G R A M
Swianiewicz, P. (1995). “Funkcjonowanie miast-gmin i ich podzial w swietle teoriii praktyki finansów lokalnych”. unpublished material prepared for OMEGA-PHARE Programme and the Government of Poland.
Swianiewicz, P. (1996). Zróz•nicowanie polityk finansowych wladz lokalnych. Warszawa-Gdansk: Instytut Badan nad Gospodarka Rynkowa.
Swianiewicz, P. (1997). “Local Services in Poland in the Wake of Public Provision”.In Lorrain, D., and Stoker, G. (Eds.) The Privatisation of Urban Services in Europe.London: Pinter.
Swianiewicz, P. (2000). “In search of optimal size. Opinions of East-Central Europeanmayors on merging/splitting their municipalities”. Paper presented at the IPSAWorld Congress, Quebec, Canada, 1–5 August 2000.
Swianiewicz, P. (2001). “Between Active Appreciation, Passive Approval and DistrustfulWithdrawal. Citizens’ Perception of Local Government Reforms and LocalDemocracy in Central and Eastern Europe”. In Swianiewicz, P. (Ed.) Public Perceptionof Local Governments. Budapest: OSI.
Szabó, G. (1991). “Localities in Transition: Re-emergency of Self-Government System”.In The Reform of Hungarian Public Administration. Budapest: Hungarian Instituteof Public Administration.
“The Size of Municipalities, Efficiency and Citizen Participation” (1995). Local andRegional Authorities in Europe, No. 56. Strasbourg: Council of Europe.
Tiebout, C. (1956). “A Pure Theory of Local Expenditures”. Journal of PoliticalEconomy, Vol. 64.
Verba, S., and Ne, N.H. (1972). Participation in America. Political Democracy andSocial Equity. New York: Harper & Row.
Walsch, K. (1989). “Competition and Service in Local Government”. In Stewart, J.,and Stoker, G. (Eds.) The Future of Local Government. London, UK: Macmillan.
NOTES
1 The number of our citizens shall be 5,040—this will be a convenient number; andthese shall be owners of the land and protectors of the allotment [Plato 360 B.C.E.Laws, Book V., in translation of B.V. Jowett]. Plato was counting heads of householdsonly. So, taking into account the size of their families, he meant a city of about25–30,000 inhabitants. Interestingly enough, this was a very similar size to identifyas optimal by empirical analysis in the Polish national chapter further on in thisbook.
˛˛

29
S I Z E O F LO C A L G O V E R N M E N T, L O C A L D E M O C R A C Y A N D E F F I C I E N C Y I N D E L I V E R Y O F LO C A L S E R V I C E S
2 It is worth noting that the United Kingdom, very recently (last ten years) engagedin discussion about creating a one-tier local government system, leading to evenlarger units of local government.
3 Bours tried to also include Central and Eastern Europe countries in his classification.However, since his data is out-dated and not very precise, we will skip that sectionof his classification here.
4 However, it is interesting to note that the most well-known programme, whichfocused on stimulation of innovations and experiments in local government, hasbeen introduced in Nordic countries where the territorial system is consolidatedrather than fragmented [Baldersheim, Stahlberg, 1994].
5 Direct quotation taken during an interview with one of village managers. [See:Swianiewicz, 1995].
6 I refer to the Local Democracy and Innovation Project which was financed bythe Norwegian government and co-ordinated by Harald Baldersheim from theUniversity of Bergen. The question I refer to was formulated in the following way:A merging of municipalities can have an impact in several ways. In the event yourmunicipality were to be combined with one or more neighbouring municipalities, doyou think it would lead to an improvement or worsening with respect to following matters:... (individual items assessed by local mayors are presented in the Table 1.2).
7 A score over 0 means the mayors expected a positive impact from consolidation.For details of the scaling system used see the note below Table 1.2.
8 Initially, it was assumed that this book would also include a chapter on theCzech Republic but, eventually, it has not been possible to include the Czechreport. Nevertheless, some examples from the Czech Republic are called uponin the introductory and summary chapters.
Size of Local Governments,Local Democracy andLocal Service Delivery
in Hungary
Éva G. Fekete
Mihály Lados
Edit Pfeil
Zsolt Szoboszlai
C H A P T E R 2

32
C O N S O L I D A T I O N O R F R A G M E N T A T I O N ?
D F I D – L G I L O C A L G O V E R N M E N T P O L I C Y P A R T N E R S H I P P R O G R A M
33
S I Z E O F L O C A L G O V E R N M E N T S , L O C A L D E M O C R A C Y A N D L O C A L S E R V I C E D E L I V E R Y I N H U N G A R Y
Table of Contents
1. Introduction: Background on the Issues Regarding Size ofLocal Governments ........................................................................................ 351.1 Dual and Fragmented Settlement System and Changing
Urban-Rural Relationships ................................................................... 351.2 The Features of Local Governmental Legislation ................................. 37
1.2.1 Strong Local Autonomy in Relation to Local Communities ..... 371.2.2 The Unprecedented Large Scale of Local
Governmental Competencies ..................................................... 381.2.3 The Lack of Spatial Hierarchy and Differentiated Local
Governmental Tasks .................................................................... 381.2.4 Freedom to Form Voluntary LG Associations ............................ 39
1.3 Traditionally High Levels of Redistribution ........................................ 401.4 Regional Divisions ................................................................................ 42
2. The Consequences of a Fragmented Local Governmental System ............... 452.1 The Fragmentation of the Local Public Administration System ......... 452.2 Local Services ......................................................................................... 48
2.2.1 Local Service Delivery ................................................................. 482.2.2 Efficiency of Local Services ......................................................... 51
2.3 Local Democracy, Which is More Powerful in the Case of theSmallest and in the Largest LGs? .......................................................... 572.3.1 Different Intensity of Political Activity ..................................... 572.3.2 Different Intensity of Civic Organizations ................................ 592.3.3 Participation in Local Public Affairs, Trust, Expectations
and Satisfaction With Local Governments Dependingon the Level of Socio-Economic Development .......................... 60
2.3.4 The Diverse Tools of Local Publicity and the VariousLevels of Informality ................................................................... 61
2.4 Changing the Intensity of Local Developmental Activity ................... 63
3. Forms of Integration of Local Governments ................................................. 673.1 Unpleasant Memories of Former Integration Practices and
Contradicting Preconditions Stemming From the Former PublicAdministration System .......................................................................... 673.1.1 Transformation of the Regional Structure of Public
Administration During the 1970s ............................................. 67
34
C O N S O L I D A T I O N O R F R A G M E N T A T I O N ?
D F I D – L G I L O C A L G O V E R N M E N T P O L I C Y P A R T N E R S H I P P R O G R A M
3.1.2 Abolition of Districts and Institutionalization ofSurrounding Urban Areas During the 1980’s .......................... 67
3.2 The Need and Willingness of Local Governments to Cooperate ........ 703.2.1 The Notion of Local Autonomy and Cooperation
with LGS in the Minds of Local Leaders ................................... 703.2.2 The Relationship Between LGs Which Were Formerly in
One Administrative District ...................................................... 703.3 Small Regional Associations and Their Characteristics ....................... 73
3.3.1 Administrative Authority Associations and Associationsof Institutional Control .............................................................. 73
3.3.2 Regional Development Associations .......................................... 743.4 The Ability and Means of the Central Government to Handle
the Diversity in Local Administration .................................................. 82
4. Summary of the Debates and Suggestions Regarding the Size of LocalGovernments and the Conflicts that Emerged from Fragmentation ........... 844.1 Suggestions for Slowing Down Fragmentation and Creating
an Optimal Pattern for LGs in Regards to Their Size ......................... 844.2 Amalgamation, Political Integration and Functional Cooperation ..... 854.3 Voluntary and Forced Formation of Associations ................................ 874.4 One and Multicolor Patterns of Association ........................................ 874.5 Differential Delegation of Competencies and Financing .................... 88
5. Conclusions .................................................................................................... 92
Notes ...................................................................................................................... 96
35
S I Z E O F L O C A L G O V E R N M E N T S , L O C A L D E M O C R A C Y A N D L O C A L S E R V I C E D E L I V E R Y I N H U N G A R Y
Size of Local Governments, Local Democracyand Local Service Delivery in Hungary
Éva G. Fekete, Mihály Lados, Edit Pfeil, Zsolt Szoboszlai
1. INTRODUCTION: BACKGROUND ON THE ISSUESREGARDING SIZE OF LOCAL GOVERNMENTS
1.1 Dual and Fragmented Settlement Systemsand Changing Urban-Rural Relationships
The most important factors that influenced the Hungarian settlement network werethe following: 1) geographical conditions—landscape, hidrography, collision line ofvarious regions, 2) special geopolitical location of the country, being at the cross pointbetween East and West. The features of the Hungarian settlement network are in betweenthe western and eastern type models. There is a special mixture of regions characterized bysmall and large settlements. The settlement structure for the Hungarian Great Plains iscompletely different from western style models for settlements because it consists ofrelatively large settlements, agricultural towns and homesteads. [Tóth J., 1988]
The average size of a settlement (exempting cities) is 1,264 inhabitants. In theGreat Plain region, the average size of a settlement is 2,000 inhabitants. The mostcommon size of a settlement, in counties where small villages dominate the settlementpattern, is between 500–700 inhabitants. Statistically, a total of 17.2% of the popu-lation (1.7 million people) live in villages under 2,000 inhabitants while villages amountto 75.8% of the total number of settlements. (In 1900 the first rate was 26.6% and in1970 it had been 19.3%)
Between 1960 and 1990 a strong concentration process dominated the Hungariansettlement network. The population in the big cities grew dynamically, while the pop-ulation and rate of growth in the smaller settlements decreased rapidly. Signs ofdeconcentration began to appear in 1990, when the population started growing againin the smaller settlements. Further expansion of small settlements can be seen between1990 and 2000. The splitting of many formerly amalgamated settlements has result-ed 64 new—and rather small—villages.
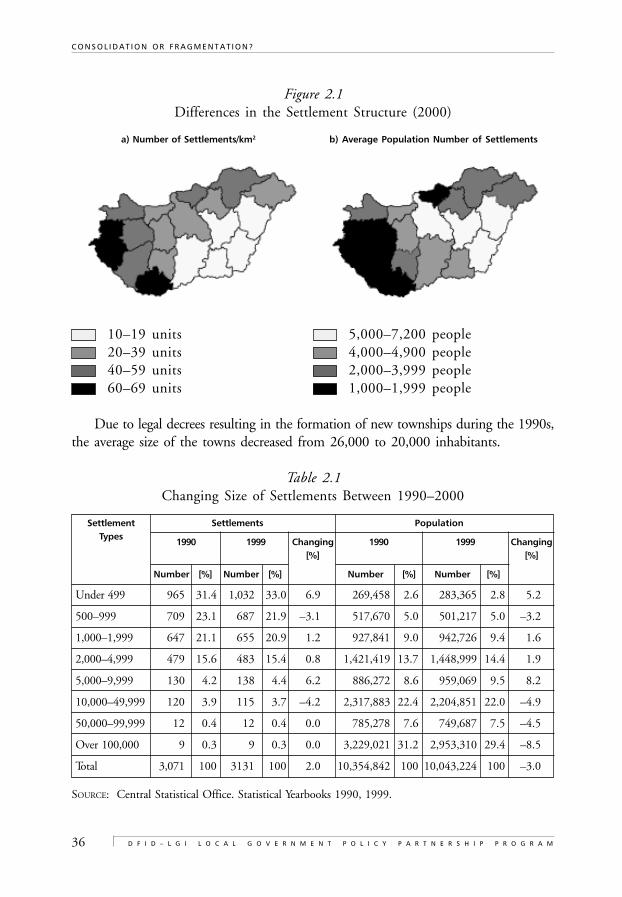
36
C O N S O L I D A T I O N O R F R A G M E N T A T I O N ?
D F I D – L G I L O C A L G O V E R N M E N T P O L I C Y P A R T N E R S H I P P R O G R A M
Figure 2.1Differences in the Settlement Structure (2000)
a) Number of Settlements/km2 b) Average Population Number of Settlements
10–19 units 5,000–7,200 people20–39 units 4,000–4,900 people40–59 units 2,000–3,999 people60–69 units 1,000–1,999 people
Due to legal decrees resulting in the formation of new townships during the 1990s,the average size of the towns decreased from 26,000 to 20,000 inhabitants.
Table 2.1Changing Size of Settlements Between 1990–2000
Settlement Settlements PopulationTypes
1990 1999 Changing 1990 1999 Changing[%] [%]
Number [%] Number [%] Number [%] Number [%]
Under 499 965 31.4 1,032 33.0 6.9 269,458 2.6 283,365 2.8 5.2
500–999 709 23.1 687 21.9 –3.1 517,670 5.0 501,217 5.0 –3.2
1,000–1,999 647 21.1 655 20.9 1.2 927,841 9.0 942,726 9.4 1.6
2,000–4,999 479 15.6 483 15.4 0.8 1,421,419 13.7 1,448,999 14.4 1.9
5,000–9,999 130 4.2 138 4.4 6.2 886,272 8.6 959,069 9.5 8.2
10,000–49,999 120 3.9 115 3.7 –4.2 2,317,883 22.4 2,204,851 22.0 –4.9
50,000–99,999 12 0.4 12 0.4 0.0 785,278 7.6 749,687 7.5 –4.5
Over 100,000 9 0.3 9 0.3 0.0 3,229,021 31.2 2,953,310 29.4 –8.5
Total 3,071 100 3131 100 2.0 10,354,842 100 10,043,224 100 –3.0
SOURCE: Central Statistical Office. Statistical Yearbooks 1990, 1999.
37
S I Z E O F L O C A L G O V E R N M E N T S , L O C A L D E M O C R A C Y A N D L O C A L S E R V I C E D E L I V E R Y I N H U N G A R Y
To date, each settlement with a population above 10,000 has been declared atownship. Among settlements with a population under 10,000, a total of 75 of thesehave also been declared towns.
1.2 The Features of Local Governmental Legislation
The legal framework of formation and operation of local governments has been laiddown in the Constitution,1 in the Act on Local Governments2 and the Act on Associ-ations of Local Governments.3
1.2.1 Strong Local Autonomy in Relation to Local Communities
According to the law, a community of local citizens has the right to self-governance.The state has given up some of its sovereignty and, today, it is not able to intervene indivision of territorial structure suitable to national interests if these interests are inconflict with opinion of the local community in question. Any change in connectionwith this autonomy (merge or split of settlements, establishing new settlements, etc.)can be implemented only by initiation of local community.
Size was not even an issue when the Constitution and Act No. LXV on LocalGovernments was accepted in 1990. These had given the right to every local communityto establish its own local government representative body. (Besides municipal LGs, thegovernments of the capital and the counties are also considered local governments.)According to the legislation, the most important challenge for local self-governing ismanaging local public affairs in an independent and democratic way. The LG—with-in the framework of Act No. LXV—can regulate and govern local public affairsautonomously. The Court supervises operation of the LGs but only in the case ofinfraction of the law does it have the right to interfere with its decisions. The funda-mental rights for local self-governance are:
• the right to autonomy;• the right to democratic use of local power;• the right to legal protection of self-governmental rights.
The formation and operation of their institutions can express the autonomy of LGs. AnLG—within the legal framework—can form its own organizational and operationalstructure, create local governmental symbols, and create local badges of honor.
Because of the political conflicts that emerged from the undemocratic and stronglycentralized soviet style council system, the former council units, once covering more
38
C O N S O L I D A T I O N O R F R A G M E N T A T I O N ?
D F I D – L G I L O C A L G O V E R N M E N T P O L I C Y P A R T N E R S H I P P R O G R A M
settlements, have broken up. The former “supply district” and “urban surroundingzone” categories also have come to an end. Cooperation between new LGs has beenbased absolutely on voluntary associations.
Regulation of the minimal size LGs was missing in the beginning. Today, the increas-ing number of split of settlements and growing fragmentation has demanded someregulations. Legislation in 1994 changed the preconditions for establishing new LGs.To establish a new LG, the minimum number of inhabitants is 300. In addition, it hasto prove its ability to accomplish the obligatory tasks arising from the law.
1.2.2 The Unprecedented Large Scale of Local Governmental Competencies
Local communities self-governments were uniquely allotted a lot of authority fromthe state to manage public tasks. Most of the compulsory tasks are defined in the Acton Local Governments itself and we list some of these in chapter 2.2.1. According tocurrent legislation, the compulsory tasks must be provided by every settlement, irre-spective of its size and capabilities. Besides these tasks, other “sector” regulations canalso determine compulsory tasks for the LGs, and they usually do just that. Thenumber of compulsory tasks for LGs increases continually, but without the continu-ous increase of access to resources needed to accomplish these tasks. Due to theincreasing “sector” tasks, LG offices engage 70% of their capacities to the completionof central obligatory tasks and only in 30% to deal with local affairs. [Ministry ofInterior, 2001]
1.2.3 The Lack of Spatial Hierarchyand Differentiated Local Governmental Tasks
The structure of public administration in Hungary has traditionally had three levelsbranching from the central one. These included the communities, the districts andthe counties. District governments were abolished in 1984. After 1990, every LG,even those situated at different territorial levels, gained the same rights within theHungarian governmental system. Within the former political system, county gov-ernments played a central role in unfair redistribution of development resources.This is why such a strong antipathy evolved against them. This is also why countyand capital governments have no greater authority than that of small villages andthere is no difference in authority between smaller and larger settlements, nor townsand villages. Subordination between LGs is completely missing from the Hungariangovernmental system.
39
S I Z E O F L O C A L G O V E R N M E N T S , L O C A L D E M O C R A C Y A N D L O C A L S E R V I C E D E L I V E R Y I N H U N G A R Y
LG dominance is expressed through its no more than assisting role of county govern-ments on the division of competencies. County governments must carry out all those tasksthat are not obligatory for the LGs. Such tasks are public services that cover a part of, orthe whole, county. The county in this structure is not an integrating unit and its mostimportant character is its on mid-level operation of institutions.
Differentiated delegation of governmental competencies—as prescribed by the Acton Local Governments—means that local authorities may carry out different tasksaccording to local demands and their capabilities. Yet, the legislative body has theright to delegate more tasks and authority to those LGs with a larger number of inhab-itants or more developed capabilities. But the LGs priorities are also expressed: TheLG of a smaller community by itself, or by formulating association with other LGs,can undertake tasks which are delegated as obligatory tasks to larger LGs or countygovernments. (In this case, the LG has the right to receive the same subsidy from thecentral budget.) However, in practice, while the “sector” authorities give an increasingnumber of tasks to the LGs, these tasks are rarely differentiated. They do not differen-tiate between LGs from villages or towns, smaller or larger communities. Furthermore,they do not help county governments become real territorial governments with higherlevels of competency.
Delegation of competencies to district centers is part of the rationalization behind thefirst tier of public administration. The architectural authority and the department ofchild-protection have operated in districts formulated around selected towns since the1st of January 2001. City administration is responsible for these tasks and LG bodieshave no power in this regard. These districts have been designated by the centralgovernment. Tasks delegated to districts can be fulfilled by voluntary LG administra-tive associations only in the case of certain architectural affairs. This possibility waschosen only by a limited number of districts. This is not so suitable for LGs compul-sory and optional tasks, especially in the case of distributing public services in integratedterritorial units, because the state does not have the right to control and intervene withmatters under the LGs authority.
1.2.4 Freedom to Form Voluntary LG Associations
According to 44th paragraph of the Hungarian Constitution, a local representativebody can freely form association with other local representative bodies. The Act onLocal Governments declares that LGs, within the frame of the Act, can form voluntaryassociations with other LGs. The local representative body has the right to decide toform associations. The Act on Local Governments defines the possible legal forms ofassociations. These are the following: administrative authority, institutional directivesand joint representative bodies.4
40
C O N S O L I D A T I O N O R F R A G M E N T A T I O N ?
D F I D – L G I L O C A L G O V E R N M E N T P O L I C Y P A R T N E R S H I P P R O G R A M
Parliament modified the Act on Local Governments and then, in 1997, passedthe Act on Associations and Cooperation of Local Governments. The Act on Associa-tions and Cooperation of Local Governments only accepts those associations based onagreement and precisely defines the content of this agreement. This represents animportant legal guarantee for the unified operation of the associations. It also specifiesthat the agreement must be sent to the Public Administration Office, which has theright to make legal reflection. The Public Administration Office then endorses theestablishment of the association, if it corresponds to the rules of the Act. The associ-ation can begin operation legally only after endorsement. Registration with the courtis not obligatory. The Act makes it possible to form associations with autonomic finan-cial rights and liabilities. (For example; in the case of common investment, distributingservices or operating institutions.) In this case, the association must be registered withthe court as a legal entity. Such an association can establish institutions, can undertakeauthority from LGs, and can even impose taxes (but there is no precedent for thisyet). For the formation of an association as a legal entity, beside the association agree-ment, a statute is also needed because the association would become a central budgetinstitution. The County Public Administration Office and the Public Prosecutor’sOffice supervise the operation of local governmental associations. In regards to finan-cial affairs—in case of the presence of public money—the association would besupervised by the State Audit Office.
1.3 Traditionally High Levels of Redistribution
The aim of the Concept for Spatial Development [OTK, 1971] was to provide a morebalanced spatial structure in Hungary.5 For this purpose, OTK constructed a hierar-chical settlement structure system for defining the central function(s) of each level.The distribution of resources was strongly correlated to the concentration of capitalinvestments in order to achieve this structure. In large and medium size towns, dis-tricts with housing blocks were set up equipped with all required facilities, like publicutilities (roads, waterworks, sewage system, central heating, gas works) and humaninfrastructure (kindergartens, primary and secondary schools, medical services). At thesame time, public administration and public services (education, health care) becamevery centralized. At the village level the number of local councils reduced from around3,100 to 1,500. According to the rational of the OTK, 2,000 villages became a so-called ‘settlements without a role’.
As a result of this policy, 90 percent of state grants for capital investment targetedBudapest and the city network. [Vági, 1982] At the same time, the greater share of thecountry (60 percent of the population) was left to enjoy only 10 percent of the capital
41
S I Z E O F L O C A L G O V E R N M E N T S , L O C A L D E M O C R A C Y A N D L O C A L S E R V I C E D E L I V E R Y I N H U N G A R Y
investment resources. Non-centers had almost no chance to develop. ‘Settlements with-out a role’ applied to two thirds of Hungarian settlements and 20 percent of the country’spopulation. However, they received only 3–4 percent of the available financial supportfor their development [ed. Kusztosné, 1998]. Since the early 1980s, more voices emergedcalling for a more equitable distribution of capital expenditure because of the greatdemographic losses and the growing unbalance in the demographic structure of mostvillages.
In the late 1980s, the proposals for the reform of local finance focused on thefollowing elements [Pitti–Varga, 1995]:
• switch from expenditure oriented to revenue oriented budgetary planning;6
• the revenue system of local councils, including state grants, should be legallydefined based on objective measures adopted by Parliament;
• regulations should be promoted to generation of own revenues;• local councils should get their properties back;• the financial background of local councils should be based on locally generated
revenues and normative distributed state grants;• local councils located in underdeveloped areas and with weak income genera-
tion capacity should get extra state grants (equalization grants) on a normativebasis.
Because of the system change, instead of the reformed council system, the localself-government system was born in 1990. The principles listed above were also builtinto the Local Government Act. Both the distribution of capital investment and stategrants support of LGs capital expenditure became more balanced during the Transi-tion. In smaller villages (below 1,000 inhabitants), the distribution of these indicatorsbetter reflected the distribution of population.
The share of capital expenditure is a little bit lower. At the same time, the share ofstate grants supporting capital expenditure is a little bit higher than their populationproportion. Budapest’s weight changed drastically over this period. The capitalabsorbed less than 10 percent of capital expenditure related state grants, about half ofits population share.
Under the soviet style council system, the decisions on public investment weremade on a central level (CG and ministries). Since 1971, the county level received agreater role in this. Besides the basic priorities of cities and any types of central func-tion, there has been strong competition amongst counties at the central level, andamong local councils at the county level, for development funds. Success has dependedon the ‘bargaining position’ of each council. [Vági, 1982]
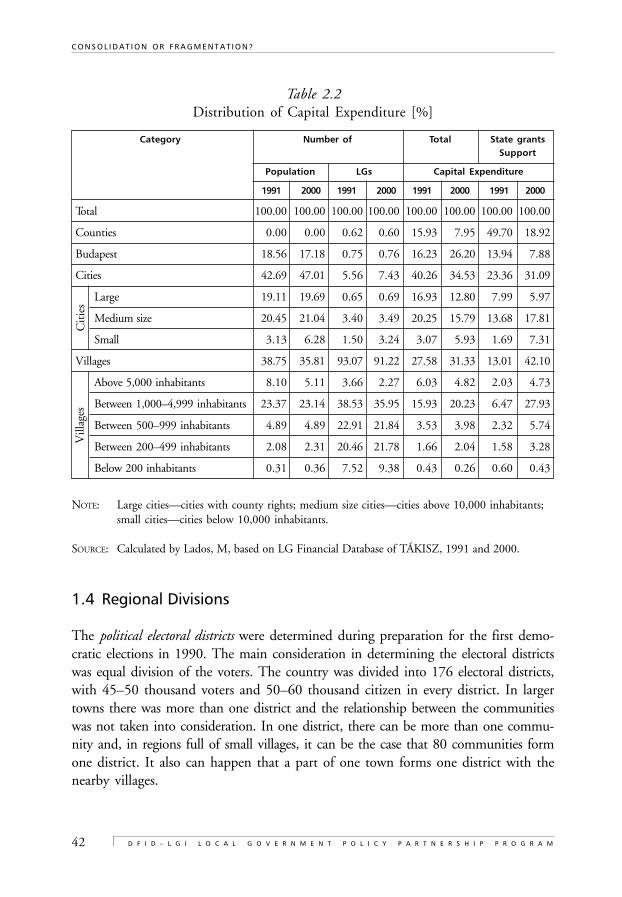
42
C O N S O L I D A T I O N O R F R A G M E N T A T I O N ?
D F I D – L G I L O C A L G O V E R N M E N T P O L I C Y P A R T N E R S H I P P R O G R A M
Table 2.2Distribution of Capital Expenditure [%]
Category Number of Total State grantsSupport
Population LGs Capital Expenditure
1991 2000 1991 2000 1991 2000 1991 2000
Total 100.00 100.00 100.00 100.00 100.00 100.00 100.00 100.00
Counties 0.00 0.00 0.62 0.60 15.93 7.95 49.70 18.92
Budapest 18.56 17.18 0.75 0.76 16.23 26.20 13.94 7.88
Cities 42.69 47.01 5.56 7.43 40.26 34.53 23.36 31.09
Large 19.11 19.69 0.65 0.69 16.93 12.80 7.99 5.97
Medium size 20.45 21.04 3.40 3.49 20.25 15.79 13.68 17.81
Small 3.13 6.28 1.50 3.24 3.07 5.93 1.69 7.31
Villages 38.75 35.81 93.07 91.22 27.58 31.33 13.01 42.10
Above 5,000 inhabitants 8.10 5.11 3.66 2.27 6.03 4.82 2.03 4.73
Between 1,000–4,999 inhabitants 23.37 23.14 38.53 35.95 15.93 20.23 6.47 27.93
Between 500–999 inhabitants 4.89 4.89 22.91 21.84 3.53 3.98 2.32 5.74
Between 200–499 inhabitants 2.08 2.31 20.46 21.78 1.66 2.04 1.58 3.28
Below 200 inhabitants 0.31 0.36 7.52 9.38 0.43 0.26 0.60 0.43
NOTE: Large cities—cities with county rights; medium size cities—cities above 10,000 inhabitants;small cities—cities below 10,000 inhabitants.
SOURCE: Calculated by Lados, M, based on LG Financial Database of TÁKISZ, 1991 and 2000.
1.4 Regional Divisions
The political electoral districts were determined during preparation for the first demo-cratic elections in 1990. The main consideration in determining the electoral districtswas equal division of the voters. The country was divided into 176 electoral districts,with 45–50 thousand voters and 50–60 thousand citizen in every district. In largertowns there was more than one district and the relationship between the communitieswas not taken into consideration. In one district, there can be more than one commu-nity and, in regions full of small villages, it can be the case that 80 communities formone district. It also can happen that a part of one town forms one district with thenearby villages.
Cit
ies
Vill
ages
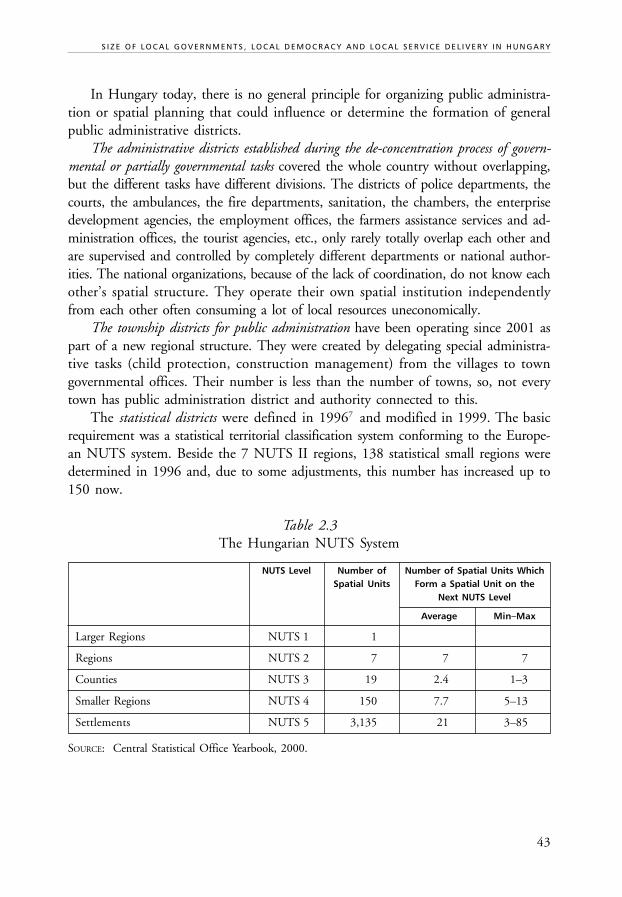
43
S I Z E O F L O C A L G O V E R N M E N T S , L O C A L D E M O C R A C Y A N D L O C A L S E R V I C E D E L I V E R Y I N H U N G A R Y
In Hungary today, there is no general principle for organizing public administra-tion or spatial planning that could influence or determine the formation of generalpublic administrative districts.
The administrative districts established during the de-concentration process of govern-mental or partially governmental tasks covered the whole country without overlapping,but the different tasks have different divisions. The districts of police departments, thecourts, the ambulances, the fire departments, sanitation, the chambers, the enterprisedevelopment agencies, the employment offices, the farmers assistance services and ad-ministration offices, the tourist agencies, etc., only rarely totally overlap each other andare supervised and controlled by completely different departments or national author-ities. The national organizations, because of the lack of coordination, do not know eachother’s spatial structure. They operate their own spatial institution independentlyfrom each other often consuming a lot of local resources uneconomically.
The township districts for public administration have been operating since 2001 aspart of a new regional structure. They were created by delegating special administra-tive tasks (child protection, construction management) from the villages to towngovernmental offices. Their number is less than the number of towns, so, not everytown has public administration district and authority connected to this.
The statistical districts were defined in 19967 and modified in 1999. The basicrequirement was a statistical territorial classification system conforming to the Europe-an NUTS system. Beside the 7 NUTS II regions, 138 statistical small regions weredetermined in 1996 and, due to some adjustments, this number has increased up to150 now.
Table 2.3The Hungarian NUTS System
NUTS Level Number of Number of Spatial Units WhichSpatial Units Form a Spatial Unit on the
Next NUTS Level
Average Min–Max
Larger Regions NUTS 1 1
Regions NUTS 2 7 7 7
Counties NUTS 3 19 2.4 1–3
Smaller Regions NUTS 4 150 7.7 5–13
Settlements NUTS 5 3,135 21 3–85
SOURCE: Central Statistical Office Yearbook, 2000.
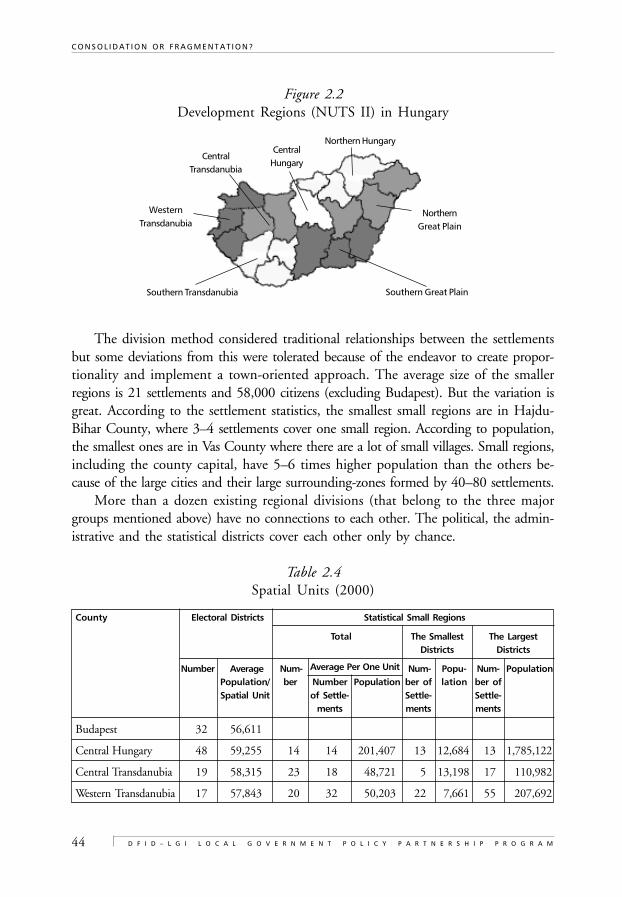
44
C O N S O L I D A T I O N O R F R A G M E N T A T I O N ?
D F I D – L G I L O C A L G O V E R N M E N T P O L I C Y P A R T N E R S H I P P R O G R A M
Figure 2.2Development Regions (NUTS II) in Hungary
The division method considered traditional relationships between the settlementsbut some deviations from this were tolerated because of the endeavor to create propor-tionality and implement a town-oriented approach. The average size of the smallerregions is 21 settlements and 58,000 citizens (excluding Budapest). But the variation isgreat. According to the settlement statistics, the smallest small regions are in Hajdu-Bihar County, where 3–4 settlements cover one small region. According to population,the smallest ones are in Vas County where there are a lot of small villages. Small regions,including the county capital, have 5–6 times higher population than the others be-cause of the large cities and their large surrounding-zones formed by 40–80 settlements.
More than a dozen existing regional divisions (that belong to the three majorgroups mentioned above) have no connections to each other. The political, the admin-istrative and the statistical districts cover each other only by chance.
Table 2.4Spatial Units (2000)
County Electoral Districts Statistical Small Regions
Total The Smallest The LargestDistricts Districts
Number Average Num- Average Per One Unit Num- Popu- Num- PopulationPopulation/ ber Number Population ber of lation ber ofSpatial Unit of Settle- Settle- Settle-
ments ments ments
Budapest 32 56,611
Central Hungary 48 59,255 14 14 201,407 13 12,684 13 1,785,122
Central Transdanubia 19 58,315 23 18 48,721 5 13,198 17 110,982
Western Transdanubia 17 57,843 20 32 50,203 22 7,661 55 207,692
Southern Transdanubia Southern Great Plain
CentralTransdanubia
WesternTransdanubia
CentralHungary
Northern Hungary
NorthernGreat Plain
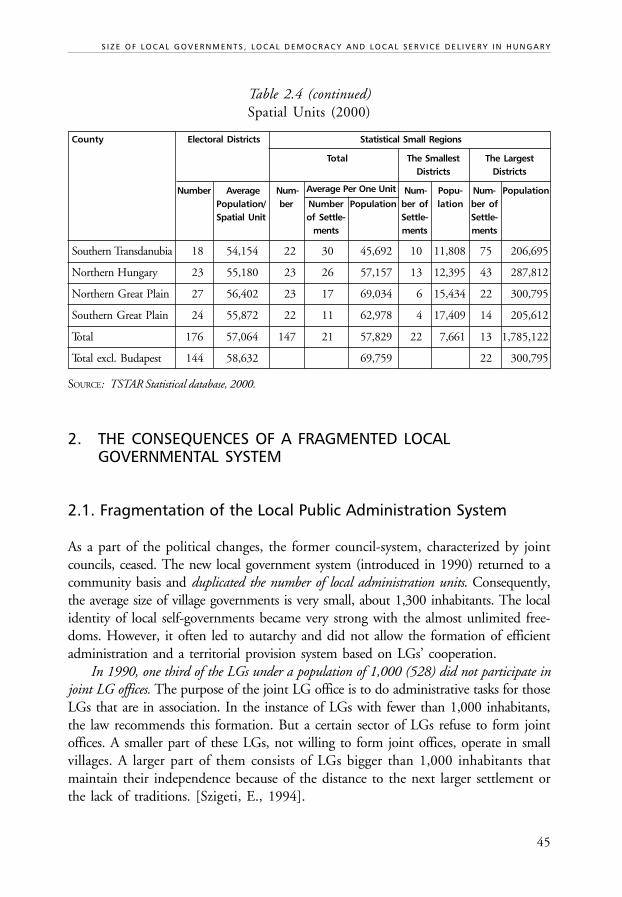
45
S I Z E O F L O C A L G O V E R N M E N T S , L O C A L D E M O C R A C Y A N D L O C A L S E R V I C E D E L I V E R Y I N H U N G A R Y
Table 2.4 (continued)Spatial Units (2000)
County Electoral Districts Statistical Small Regions
Total The Smallest The LargestDistricts Districts
Number Average Num- Average Per One Unit Num- Popu- Num- PopulationPopulation/ ber Number Population ber of lation ber ofSpatial Unit of Settle- Settle- Settle-
ments ments ments
Southern Transdanubia 18 54,154 22 30 45,692 10 11,808 75 206,695
Northern Hungary 23 55,180 23 26 57,157 13 12,395 43 287,812
Northern Great Plain 27 56,402 23 17 69,034 6 15,434 22 300,795
Southern Great Plain 24 55,872 22 11 62,978 4 17,409 14 205,612
Total 176 57,064 147 21 57,829 22 7,661 13 1,785,122
Total excl. Budapest 144 58,632 69,759 22 300,795
SOURCE: TSTAR Statistical database, 2000.
2. THE CONSEQUENCES OF A FRAGMENTED LOCALGOVERNMENTAL SYSTEM
2.1. Fragmentation of the Local Public Administration System
As a part of the political changes, the former council-system, characterized by jointcouncils, ceased. The new local government system (introduced in 1990) returned to acommunity basis and duplicated the number of local administration units. Consequently,the average size of village governments is very small, about 1,300 inhabitants. The localidentity of local self-governments became very strong with the almost unlimited free-doms. However, it often led to autarchy and did not allow the formation of efficientadministration and a territorial provision system based on LGs’ cooperation.
In 1990, one third of the LGs under a population of 1,000 (528) did not participate injoint LG offices. The purpose of the joint LG office is to do administrative tasks for thoseLGs that are in association. In the instance of LGs with fewer than 1,000 inhabitants,the law recommends this formation. But a certain sector of LGs refuse to form jointoffices. A smaller part of these LGs, not willing to form joint offices, operate in smallvillages. A larger part of them consists of LGs bigger than 1,000 inhabitants thatmaintain their independence because of the distance to the next larger settlement orthe lack of traditions. [Szigeti, E., 1994].
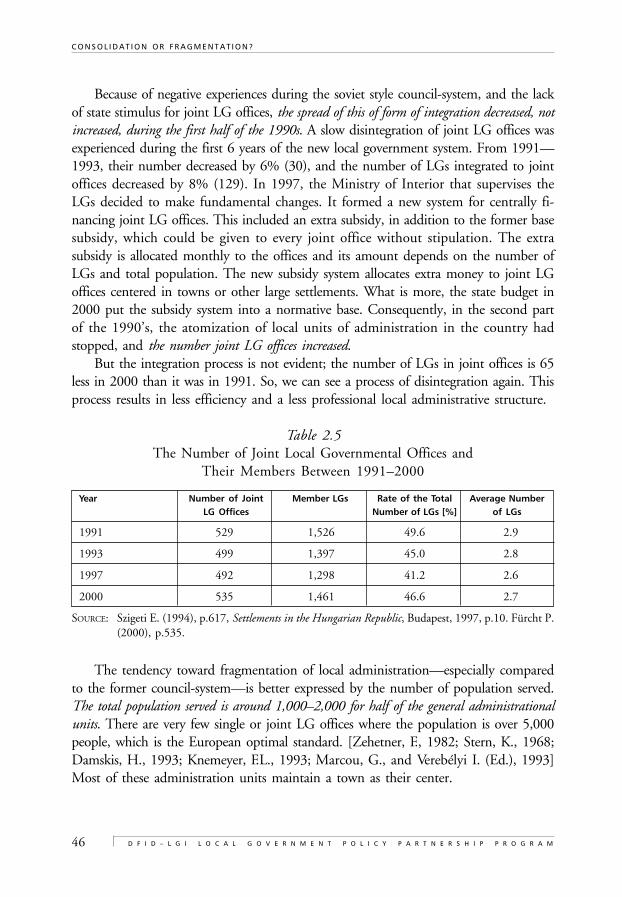
46
C O N S O L I D A T I O N O R F R A G M E N T A T I O N ?
D F I D – L G I L O C A L G O V E R N M E N T P O L I C Y P A R T N E R S H I P P R O G R A M
Because of negative experiences during the soviet style council-system, and the lackof state stimulus for joint LG offices, the spread of this of form of integration decreased, notincreased, during the first half of the 1990s. A slow disintegration of joint LG offices wasexperienced during the first 6 years of the new local government system. From 1991—1993, their number decreased by 6% (30), and the number of LGs integrated to jointoffices decreased by 8% (129). In 1997, the Ministry of Interior that supervises theLGs decided to make fundamental changes. It formed a new system for centrally fi-nancing joint LG offices. This included an extra subsidy, in addition to the former basesubsidy, which could be given to every joint office without stipulation. The extrasubsidy is allocated monthly to the offices and its amount depends on the number ofLGs and total population. The new subsidy system allocates extra money to joint LGoffices centered in towns or other large settlements. What is more, the state budget in2000 put the subsidy system into a normative base. Consequently, in the second partof the 1990’s, the atomization of local units of administration in the country hadstopped, and the number joint LG offices increased.
But the integration process is not evident; the number of LGs in joint offices is 65less in 2000 than it was in 1991. So, we can see a process of disintegration again. Thisprocess results in less efficiency and a less professional local administrative structure.
Table 2.5The Number of Joint Local Governmental Offices and
Their Members Between 1991–2000
Year Number of Joint Member LGs Rate of the Total Average NumberLG Offices Number of LGs [%] of LGs
1991 529 1,526 49.6 2.9
1993 499 1,397 45.0 2.8
1997 492 1,298 41.2 2.6
2000 535 1,461 46.6 2.7
SOURCE: Szigeti E. (1994), p.617, Settlements in the Hungarian Republic, Budapest, 1997, p.10. Fürcht P.(2000), p.535.
The tendency toward fragmentation of local administration—especially comparedto the former council-system—is better expressed by the number of population served.The total population served is around 1,000–2,000 for half of the general administrationalunits. There are very few single or joint LG offices where the population is over 5,000people, which is the European optimal standard. [Zehetner, F., 1982; Stern, K., 1968;Damskis, H., 1993; Knemeyer, F.L., 1993; Marcou, G., and Verebélyi I. (Ed.), 1993]Most of these administration units maintain a town as their center.
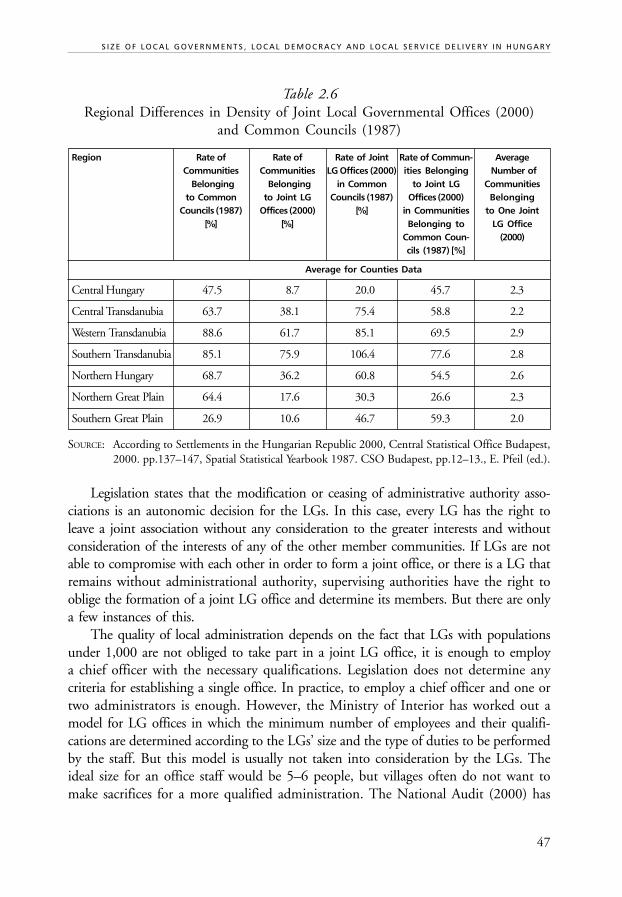
47
S I Z E O F L O C A L G O V E R N M E N T S , L O C A L D E M O C R A C Y A N D L O C A L S E R V I C E D E L I V E R Y I N H U N G A R Y
Table 2.6Regional Differences in Density of Joint Local Governmental Offices (2000)
and Common Councils (1987)
Region Rate of Rate of Rate of Joint Rate of Commun- AverageCommunities Communities LG Offices (2000) ities Belonging Number of Belonging Belonging in Common to Joint LG Communitiesto Common to Joint LG Councils (1987) Offices (2000) Belonging
Councils (1987) Offices (2000) [%] in Communities to One Joint[%] [%] Belonging to LG Office
Common Coun- (2000)cils (1987) [%]
Average for Counties Data
Central Hungary 47.5 8.7 20.0 45.7 2.3
Central Transdanubia 63.7 38.1 75.4 58.8 2.2
Western Transdanubia 88.6 61.7 85.1 69.5 2.9
Southern Transdanubia 85.1 75.9 106.4 77.6 2.8
Northern Hungary 68.7 36.2 60.8 54.5 2.6
Northern Great Plain 64.4 17.6 30.3 26.6 2.3
Southern Great Plain 26.9 10.6 46.7 59.3 2.0
SOURCE: According to Settlements in the Hungarian Republic 2000, Central Statistical Office Budapest,2000. pp.137–147, Spatial Statistical Yearbook 1987. CSO Budapest, pp.12–13., E. Pfeil (ed.).
Legislation states that the modification or ceasing of administrative authority asso-ciations is an autonomic decision for the LGs. In this case, every LG has the right toleave a joint association without any consideration to the greater interests and withoutconsideration of the interests of any of the other member communities. If LGs are notable to compromise with each other in order to form a joint office, or there is a LG thatremains without administrational authority, supervising authorities have the right tooblige the formation of a joint LG office and determine its members. But there are onlya few instances of this.
The quality of local administration depends on the fact that LGs with populationsunder 1,000 are not obliged to take part in a joint LG office, it is enough to employa chief officer with the necessary qualifications. Legislation does not determine anycriteria for establishing a single office. In practice, to employ a chief officer and one ortwo administrators is enough. However, the Ministry of Interior has worked out amodel for LG offices in which the minimum number of employees and their qualifi-cations are determined according to the LGs’ size and the type of duties to be performedby the staff. But this model is usually not taken into consideration by the LGs. Theideal size for an office staff would be 5–6 people, but villages often do not want tomake sacrifices for a more qualified administration. The National Audit (2000) has
48
C O N S O L I D A T I O N O R F R A G M E N T A T I O N ?
D F I D – L G I L O C A L G O V E R N M E N T P O L I C Y P A R T N E R S H I P P R O G R A M
determined that the number of civil servants within LGs is rather low, but the qual-ification levels are improving.
Examination of 400 LGs by the National Audit Office (2000) has confirmed thatjoint LG offices operate efficiently and economically. In 1999, the average cost of LGs’administrational services per capita were 10,500 HUF. In the joint offices, this num-ber was 6,500 HUF. In the case of LGs maintaining their own local offices, it was14,500 HUF. So, the differences are significant. What is more; the greatest differencesare in the case of LGs with 500–1,000 citizens. In these communities, the mainte-nance of common offices was three times cheaper than independent ones.
2.2 Local Services
2.2.1 Local Service Delivery
The provision of services by the Hungarian LGs is based upon the principle of manda-tory and optional tasks defined by the Act on Local Governments. Mandatory tasks areseparated into two categories. The first must be provided by/for every communityregardless of type or size. This includes supply of drinking water, kindergartens andbasic education, basic health and welfare services, public lighting, maintenance of localpublic roads and cemeteries and the protection of ethnic minorities’ rights. The sec-ond is determined by legislation and the financial means necessary for such purposesmust be allocated from the state budget. [Temesi, 2000]
This second type is regulated by the Act on Local Governments, which says LGswith larger populations and greater capabilities may be assigned more mandatory func-tions and powers in comparison to other LGs. The requirements for different sizedLGs’ personal provision is an example of such regulation:8
• above 2,000 inhabitants, it is mandatory to provide daily social care institu-tions for elderly people;
• above 10,000 inhabitants, it is mandatory to provide temporary social careinstitutions for elderly people;
• above 20,000 inhabitants, it is mandatory to provide various daily social careinstitutions for local residents;
• above 30,000 inhabitants, it is mandatory to provide various temporary socialcare institutions for local residents.
Services are obviously only for local residents and other provisions are optional.According to this regulation, only these municipalities receive special grants related tothose services, not others. That is why other municipalities do not install such serviceson a voluntary base.
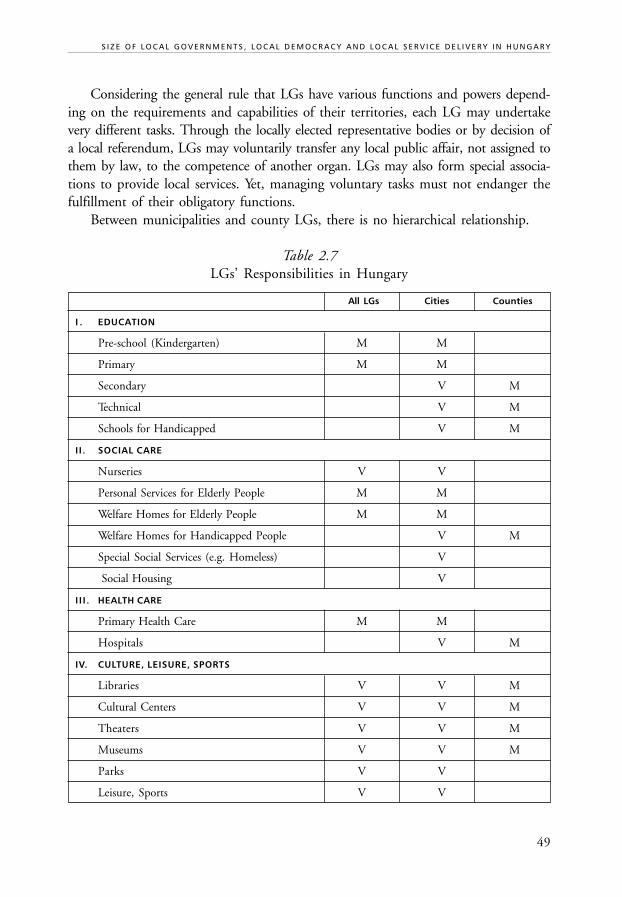
49
S I Z E O F L O C A L G O V E R N M E N T S , L O C A L D E M O C R A C Y A N D L O C A L S E R V I C E D E L I V E R Y I N H U N G A R Y
Considering the general rule that LGs have various functions and powers depend-ing on the requirements and capabilities of their territories, each LG may undertakevery different tasks. Through the locally elected representative bodies or by decision ofa local referendum, LGs may voluntarily transfer any local public affair, not assigned tothem by law, to the competence of another organ. LGs may also form special associa-tions to provide local services. Yet, managing voluntary tasks must not endanger thefulfillment of their obligatory functions.
Between municipalities and county LGs, there is no hierarchical relationship.
Table 2.7LGs’ Responsibilities in Hungary
All LGs Cities Counties
I . EDUCATION
Pre-school (Kindergarten) M M
Primary M M
Secondary V M
Technical V M
Schools for Handicapped V M
I I . SOCIAL CARE
Nurseries V V
Personal Services for Elderly People M M
Welfare Homes for Elderly People M M
Welfare Homes for Handicapped People V M
Special Social Services (e.g. Homeless) V
Social Housing V
I I I . HEALTH CARE
Primary Health Care M M
Hospitals V M
IV. CULTURE, LEISURE, SPORTS
Libraries V V M
Cultural Centers V V M
Theaters V V M
Museums V V M
Parks V V
Leisure, Sports V V
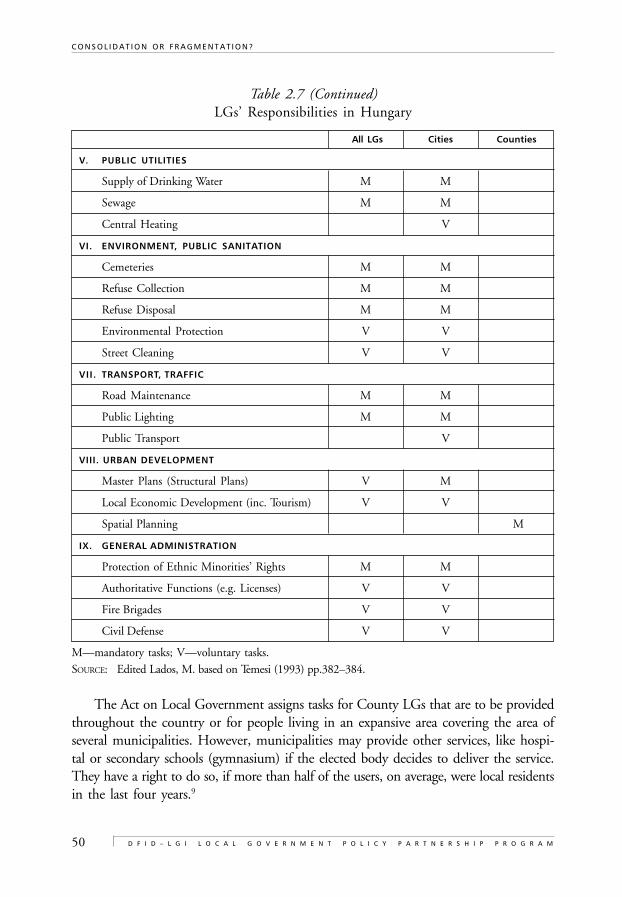
50
C O N S O L I D A T I O N O R F R A G M E N T A T I O N ?
D F I D – L G I L O C A L G O V E R N M E N T P O L I C Y P A R T N E R S H I P P R O G R A M
Table 2.7 (Continued)LGs’ Responsibilities in Hungary
All LGs Cities Counties
V. PUBLIC UTILITIES
Supply of Drinking Water M M
Sewage M M
Central Heating V
VI. ENVIRONMENT, PUBLIC SANITATION
Cemeteries M M
Refuse Collection M M
Refuse Disposal M M
Environmental Protection V V
Street Cleaning V V
VII. TRANSPORT, TRAFFIC
Road Maintenance M M
Public Lighting M M
Public Transport V
VIII. URBAN DEVELOPMENT
Master Plans (Structural Plans) V M
Local Economic Development (inc. Tourism) V V
Spatial Planning M
IX. GENERAL ADMINISTRATION
Protection of Ethnic Minorities’ Rights M M
Authoritative Functions (e.g. Licenses) V V
Fire Brigades V V
Civil Defense V V
M—mandatory tasks; V—voluntary tasks.
SOURCE: Edited Lados, M. based on Temesi (1993) pp.382–384.
The Act on Local Government assigns tasks for County LGs that are to be providedthroughout the country or for people living in an expansive area covering the area ofseveral municipalities. However, municipalities may provide other services, like hospi-tal or secondary schools (gymnasium) if the elected body decides to deliver the service.They have a right to do so, if more than half of the users, on average, were local residentsin the last four years.9
51
S I Z E O F L O C A L G O V E R N M E N T S , L O C A L D E M O C R A C Y A N D L O C A L S E R V I C E D E L I V E R Y I N H U N G A R Y
2.2.2 Efficiency of Local Services
The unit costs of services change according to the size of the LG and/or the provider ofthe service. Services are cost effective when the increase in the effected population orgeographical area of the service does not cause additional costs. Sometimes, however,empirical studies show contradictory results when testing this principle. Average unitcosts have a ‘U-shape’, which means that services are most costly for the biggest andsmallest municipalities. Decreasing (with increasing size) unit costs characterizescapital-intensive services in places where the implementation of the service depends onthe use of technology and the level of specialization. In the case of labor-intensiveservices, higher management and communication costs increase the average unit costs.[Hermann et al., 1998]
According to a study conducted in European countries, public services are eco-nomically efficient for municipalities of around 5,000 inhabitants. However, this sizecannot be the optimal size for LGs because each of public service has different optimalsize based on population. [ACIR, 1974]
Since the first years after the fragmented system was created, in 1990, some profes-sionals have been arguing that this system is very costly and have called for integration.In their view, based on the old principle about the relationship of size and unit costscited above, increase in service units will reduce the unit costs. Several research projectstested the principle in Hungary, but the results varied according to variety of servicesor unit costs measured by the direct beneficiaries of a particular service or total popu-lation within the LG. In several cases, at a minimum service unit size, costs becameconstant (the shape of the unit costs curve goes horizontal) or ‘U-shaped’. [Hermannet al., 1998]
We have to separate local public services into two categories. The first includespublic utilities like electricity, gas works, water works, sewage and sewage plants andother public services like public transport and solid waste collection and disposal.These services are provided by larger (covering the area of more counties) or smaller(smaller regions in each county) regional utility and service companies. This is whypotential amalgamation would not have an immediate effect on the unit costs of theseservices. However, there is a proposal to create larger local government units on thebasis of the area covered by regional public utility companies. [Hermann et al., 1998]Nowadays, related to these services, the question is rather about the break down ofmonopolies than optimization size.
The other group of local public services is human services like education, healthand social care and public administration. We tried to test those local services that are
• mandatory by the Act on Local Government,• represent a higher cost to the total local running expenditure of villages, and• potentially available to most LGs.
52
C O N S O L I D A T I O N O R F R A G M E N T A T I O N ?
D F I D – L G I L O C A L G O V E R N M E N T P O L I C Y P A R T N E R S H I P P R O G R A M
Administration, pre-schools and primary schools represent more than 50 percentof local expenditure in villages. Further evaluation is made on these sectors only.
A) Costs of AdministrationThe costs of administration within LGs’ running expenditure has significantly changedthroughout the 1990s. The average share of these costs has increased from 7.8 to 9.9percent, affecting LGs of all different sizes. There is a very strong correlation betweenthe size of a LG and increase in the share of administration costs within the totalrunning costs, for both the beginning and the end of the last decade. In 2000, all levelsof village administrations absorbed at least one fifth of the total running costs. In thesmallest LGs, this figure was above 40 percent.
On a per capita basis, the position of each level also changed. It is most visible inrelation to Budapest. Its indicator was 94.7 percent of the country average in 1991and 128.3 percent in 2000. Budapest’s shifting position is caused by two factors.Firstly, costs of administration in Budapest increased much faster over this period thanthe country average (Budapest: 807%; country average: 610%). Secondly, Budapestexperienced an intense population flux. In 2000, Budapest had 9.5% fewer inhabit-ants compared to 1991. The country’s total population has decreased only by 2.2%over the same period. The principle of size and costs relation is indicated among thedifferent size of cities for both years. In villages, per capita costs increased by the de-creasing size up to category size 500–999 inhabitants. In the smallest LGs, the indicatorbecame lower than the village average.
The unit costs measured per public employees have a totally different shape. Ac-cording to the different levels (capital–cities–villages), and the different cities’ sizes(including Budapest), unit costs are smaller if the size of the LG is smaller. For villages,the trend is similar. However, the mid-range size groups are becoming rather horizon-tal in shape with unit costs very close to each other. On one hand, the reason behindthese results is the relatively significant proportion of wages within the total adminis-trational costs (45.4%). On the other hand, it is due to the strong hierarchy of wageswithin the LG size categories. In larger LGs, employees get much higher wages for thesame position than those employed in smaller ones. For administrations in Budapestduring 2000, the average personnel costs including wages was 141.3 percent of thenational average. In contrast, the same figure for small cities and villages was 81.1 and82.5 percent.
B) Costs of Pre-schools (Kindergartens)Due to the decreasing number of children and the emerging provisions of the privatesector, the share of kindergartens costs within the total running expenditure has fallenfrom 6.3 to 3.7 percent. This figure is much higher in villages for both years, but the
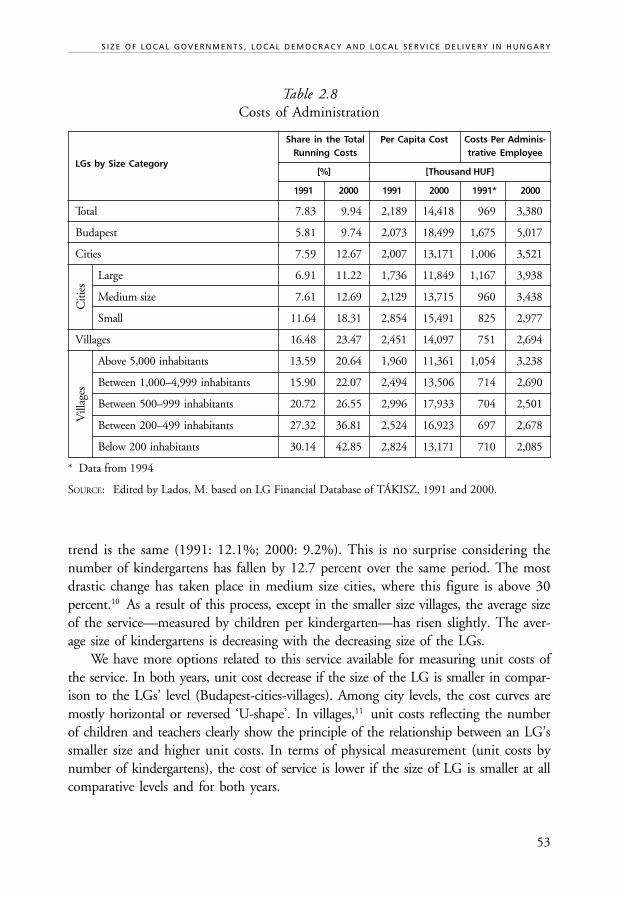
53
S I Z E O F L O C A L G O V E R N M E N T S , L O C A L D E M O C R A C Y A N D L O C A L S E R V I C E D E L I V E R Y I N H U N G A R Y
Table 2.8Costs of Administration
LGs by Size Category
Share in the Total Per Capita Cost Costs Per Adminis-Running Costs trative Employee
[%] [Thousand HUF]
1991 2000 1991 2000 1991* 2000
Total 7.83 9.94 2,189 14,418 969 3,380
Budapest 5.81 9.74 2,073 18,499 1,675 5,017
Cities 7.59 12.67 2,007 13,171 1,006 3,521
Large 6.91 11.22 1,736 11,849 1,167 3,938
Medium size 7.61 12.69 2,129 13,715 960 3,438
Small 11.64 18.31 2,854 15,491 825 2,977
Villages 16.48 23.47 2,451 14,097 751 2,694
Above 5,000 inhabitants 13.59 20.64 1,960 11,361 1,054 3,238
Between 1,000–4,999 inhabitants 15.90 22.07 2,494 13,506 714 2,690
Between 500–999 inhabitants 20.72 26.55 2,996 17,933 704 2,501
Between 200–499 inhabitants 27.32 36.81 2,524 16,923 697 2,678
Below 200 inhabitants 30.14 42.85 2,824 13,171 710 2,085
* Data from 1994
SOURCE: Edited by Lados, M. based on LG Financial Database of TÁKISZ, 1991 and 2000.
trend is the same (1991: 12.1%; 2000: 9.2%). This is no surprise considering thenumber of kindergartens has fallen by 12.7 percent over the same period. The mostdrastic change has taken place in medium size cities, where this figure is above 30percent.10 As a result of this process, except in the smaller size villages, the average sizeof the service—measured by children per kindergarten—has risen slightly. The aver-age size of kindergartens is decreasing with the decreasing size of the LGs.
We have more options related to this service available for measuring unit costs ofthe service. In both years, unit cost decrease if the size of the LG is smaller in compar-ison to the LGs’ level (Budapest-cities-villages). Among city levels, the cost curves aremostly horizontal or reversed ‘U-shape’. In villages,11 unit costs reflecting the numberof children and teachers clearly show the principle of the relationship between an LG’ssmaller size and higher unit costs. In terms of physical measurement (unit costs bynumber of kindergartens), the cost of service is lower if the size of LG is smaller at allcomparative levels and for both years.
Citi
esV
illag
es
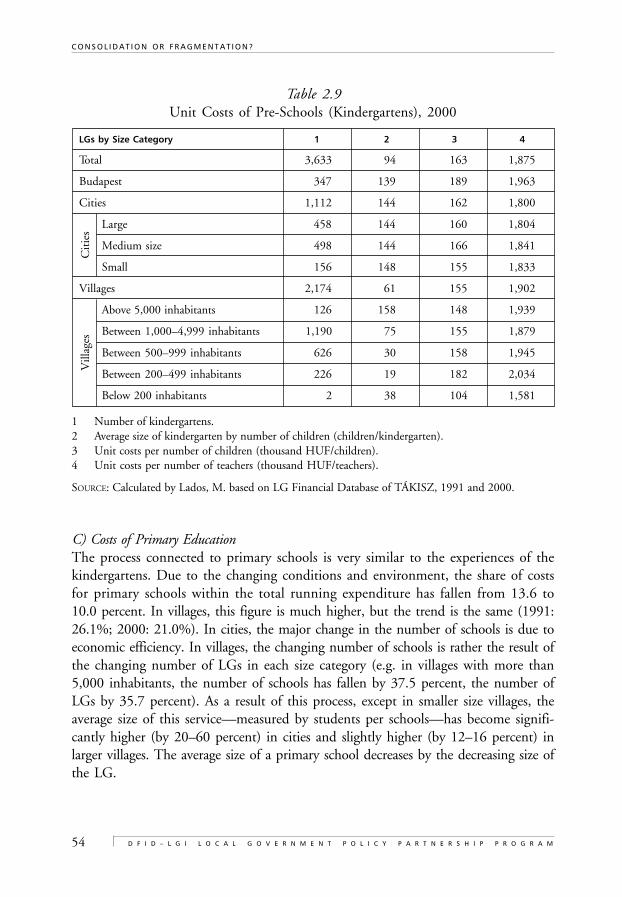
54
C O N S O L I D A T I O N O R F R A G M E N T A T I O N ?
D F I D – L G I L O C A L G O V E R N M E N T P O L I C Y P A R T N E R S H I P P R O G R A M
Table 2.9Unit Costs of Pre-Schools (Kindergartens), 2000
LGs by Size Category 1 2 3 4
Total 3,633 94 163 1,875
Budapest 347 139 189 1,963
Cities 1,112 144 162 1,800
Large 458 144 160 1,804
Medium size 498 144 166 1,841
Small 156 148 155 1,833
Villages 2,174 61 155 1,902
Above 5,000 inhabitants 126 158 148 1,939
Between 1,000–4,999 inhabitants 1,190 75 155 1,879
Between 500–999 inhabitants 626 30 158 1,945
Between 200–499 inhabitants 226 19 182 2,034
Below 200 inhabitants 2 38 104 1,581
1 Number of kindergartens.2 Average size of kindergarten by number of children (children/kindergarten).3 Unit costs per number of children (thousand HUF/children).4 Unit costs per number of teachers (thousand HUF/teachers).
SOURCE: Calculated by Lados, M. based on LG Financial Database of TÁKISZ, 1991 and 2000.
C) Costs of Primary EducationThe process connected to primary schools is very similar to the experiences of thekindergartens. Due to the changing conditions and environment, the share of costsfor primary schools within the total running expenditure has fallen from 13.6 to10.0 percent. In villages, this figure is much higher, but the trend is the same (1991:26.1%; 2000: 21.0%). In cities, the major change in the number of schools is due toeconomic efficiency. In villages, the changing number of schools is rather the result ofthe changing number of LGs in each size category (e.g. in villages with more than5,000 inhabitants, the number of schools has fallen by 37.5 percent, the number ofLGs by 35.7 percent). As a result of this process, except in smaller size villages, theaverage size of this service—measured by students per schools—has become signifi-cantly higher (by 20–60 percent) in cities and slightly higher (by 12–16 percent) inlarger villages. The average size of a primary school decreases by the decreasing size ofthe LG.
Cit
ies
Vill
ages
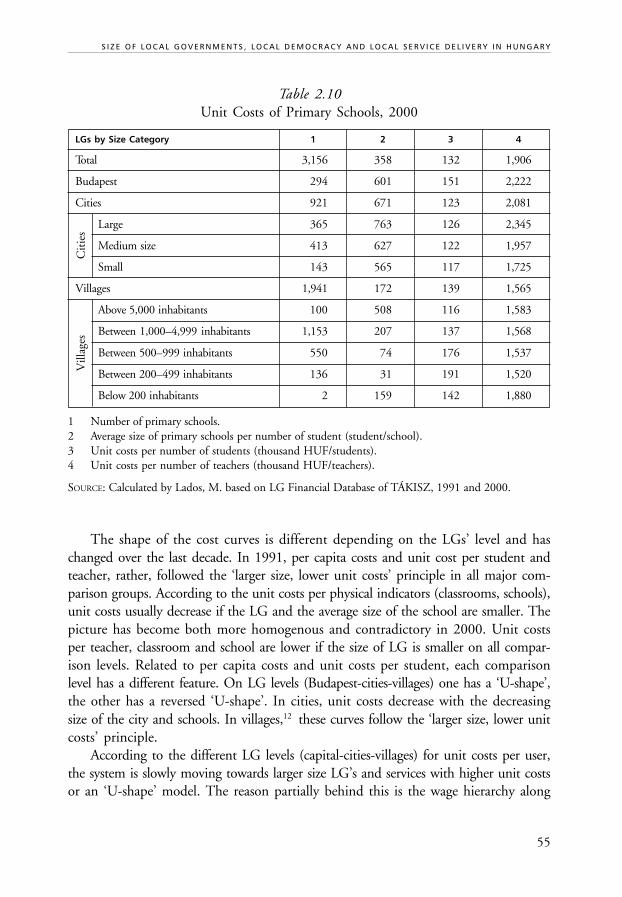
55
S I Z E O F L O C A L G O V E R N M E N T S , L O C A L D E M O C R A C Y A N D L O C A L S E R V I C E D E L I V E R Y I N H U N G A R Y
Table 2.10Unit Costs of Primary Schools, 2000
LGs by Size Category 1 2 3 4
Total 3,156 358 132 1,906
Budapest 294 601 151 2,222
Cities 921 671 123 2,081
Large 365 763 126 2,345
Medium size 413 627 122 1,957
Small 143 565 117 1,725
Villages 1,941 172 139 1,565
Above 5,000 inhabitants 100 508 116 1,583
Between 1,000–4,999 inhabitants 1,153 207 137 1,568
Between 500–999 inhabitants 550 74 176 1,537
Between 200–499 inhabitants 136 31 191 1,520
Below 200 inhabitants 2 159 142 1,880
1 Number of primary schools.2 Average size of primary schools per number of student (student/school).3 Unit costs per number of students (thousand HUF/students).4 Unit costs per number of teachers (thousand HUF/teachers).
SOURCE: Calculated by Lados, M. based on LG Financial Database of TÁKISZ, 1991 and 2000.
The shape of the cost curves is different depending on the LGs’ level and haschanged over the last decade. In 1991, per capita costs and unit cost per student andteacher, rather, followed the ‘larger size, lower unit costs’ principle in all major com-parison groups. According to the unit costs per physical indicators (classrooms, schools),unit costs usually decrease if the LG and the average size of the school are smaller. Thepicture has become both more homogenous and contradictory in 2000. Unit costsper teacher, classroom and school are lower if the size of LG is smaller on all compar-ison levels. Related to per capita costs and unit costs per student, each comparisonlevel has a different feature. On LG levels (Budapest-cities-villages) one has a ‘U-shape’,the other has a reversed ‘U-shape’. In cities, unit costs decrease with the decreasingsize of the city and schools. In villages,12 these curves follow the ‘larger size, lower unitcosts’ principle.
According to the different LG levels (capital-cities-villages) for unit costs per user,the system is slowly moving towards larger size LG’s and services with higher unit costsor an ‘U-shape’ model. The reason partially behind this is the wage hierarchy along
Cit
ies
Vill
ages
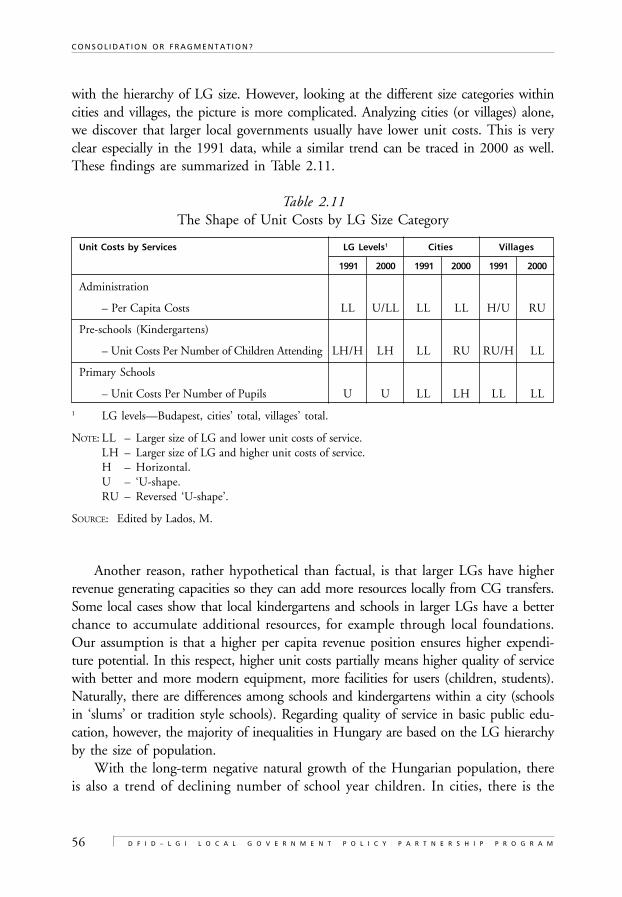
56
C O N S O L I D A T I O N O R F R A G M E N T A T I O N ?
D F I D – L G I L O C A L G O V E R N M E N T P O L I C Y P A R T N E R S H I P P R O G R A M
with the hierarchy of LG size. However, looking at the different size categories withincities and villages, the picture is more complicated. Analyzing cities (or villages) alone,we discover that larger local governments usually have lower unit costs. This is veryclear especially in the 1991 data, while a similar trend can be traced in 2000 as well.These findings are summarized in Table 2.11.
Table 2.11The Shape of Unit Costs by LG Size Category
Unit Costs by Services LG Levels1 Cities Villages
1991 2000 1991 2000 1991 2000
Administration
– Per Capita Costs LL U/LL LL LL H/U RU
Pre-schools (Kindergartens)
– Unit Costs Per Number of Children Attending LH/H LH LL RU RU/H LL
Primary Schools
– Unit Costs Per Number of Pupils U U LL LH LL LL
1 LG levels—Budapest, cities’ total, villages’ total.
NOTE: LL – Larger size of LG and lower unit costs of service.LH – Larger size of LG and higher unit costs of service.H – Horizontal.U – ‘U-shape.RU – Reversed ‘U-shape’.
SOURCE: Edited by Lados, M.
Another reason, rather hypothetical than factual, is that larger LGs have higherrevenue generating capacities so they can add more resources locally from CG transfers.Some local cases show that local kindergartens and schools in larger LGs have a betterchance to accumulate additional resources, for example through local foundations.Our assumption is that a higher per capita revenue position ensures higher expendi-ture potential. In this respect, higher unit costs partially means higher quality of servicewith better and more modern equipment, more facilities for users (children, students).Naturally, there are differences among schools and kindergartens within a city (schoolsin ‘slums’ or tradition style schools). Regarding quality of service in basic public edu-cation, however, the majority of inequalities in Hungary are based on the LG hierarchyby the size of population.
With the long-term negative natural growth of the Hungarian population, thereis also a trend of declining number of school year children. In cities, there is the
57
S I Z E O F L O C A L G O V E R N M E N T S , L O C A L D E M O C R A C Y A N D L O C A L S E R V I C E D E L I V E R Y I N H U N G A R Y
potential to join classrooms or schools together, maintaining the level of service andunit costs. In most larger and medium size cities, this process began in the second halfof the 1990s. In villages, if LGs want to keep a service within the community, theycan manage it by reducing the level of services. Another possibility is partnership andjoint management of the service with another LG. The law on associations ensuresthis potential form of the partnership. In 1999, around 7 percent of children andstudents studied in jointly manage kindergartens and schools. The number of kinder-garten and school associations fluctuated from between 500 and 550 over the secondhalf of 1990. This fluctuation indicates that the introduced financial incentives formaintaining jointly managed institutional associations have not been effective enough.[Halász, 2000]
2.3 Local Democracy, Which is More Powerfulin the Case of the Smallest and in the Largest LGs?
The formation of democratic society in Hungary began many years before the politicaltransition. However, the formation of its final structure and efficient operation is amuch bigger process and is still under way today. According to our interpretation ofsocial and political democracy; social democracy has a wider view and comprises manyparts of political democracy. This is especially true on the local level, since local de-mocracy involves the fundamental parts of political democracy, but cannot be stablewithout the evolution and operation of local social democracy. LGs play a key role inthis process due to their position and authority. They are the leaders of local politicaldemocracy, and—if not in everyday work, but in the long term—have a crucial role inthe formation and evolution of local social democracy.
According to our previous examinations [Szarvak, T. 1997, 2000; Szoboszlai Zs.,1998, 1999, 2000], the viability of local democracy—under the existing legal frame-work—depends mainly on the traditions of the community; its economic-social-culturalcircumstances; the family background of the citizenry; the developmental level of thecivil society and its publicity; the level of attentiveness and honesty and socialization ofthe local governmental representatives. Some connections between the size of LGs andthe function of local democracy can be seen in the following examples.
2.3.1 The Various Intensities of Political Activity
At national, as well as local levels, the institutions of political democracy have been inoperation since 1989. The institutions of political democracy stabilized, thanks to the
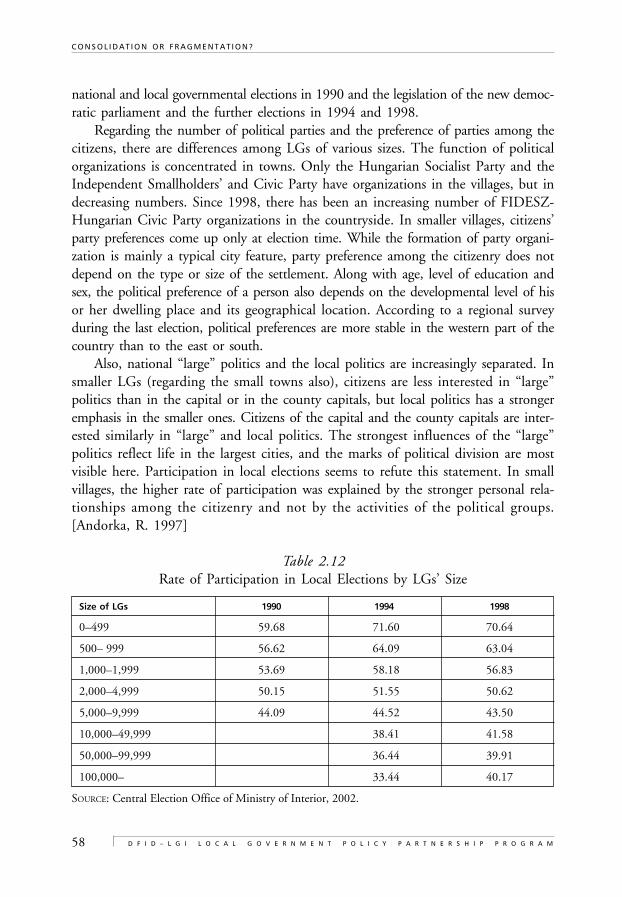
58
C O N S O L I D A T I O N O R F R A G M E N T A T I O N ?
D F I D – L G I L O C A L G O V E R N M E N T P O L I C Y P A R T N E R S H I P P R O G R A M
national and local governmental elections in 1990 and the legislation of the new democ-ratic parliament and the further elections in 1994 and 1998.
Regarding the number of political parties and the preference of parties among thecitizens, there are differences among LGs of various sizes. The function of politicalorganizations is concentrated in towns. Only the Hungarian Socialist Party and theIndependent Smallholders’ and Civic Party have organizations in the villages, but indecreasing numbers. Since 1998, there has been an increasing number of FIDESZ-Hungarian Civic Party organizations in the countryside. In smaller villages, citizens’party preferences come up only at election time. While the formation of party organi-zation is mainly a typical city feature, party preference among the citizenry does notdepend on the type or size of the settlement. Along with age, level of education andsex, the political preference of a person also depends on the developmental level of hisor her dwelling place and its geographical location. According to a regional surveyduring the last election, political preferences are more stable in the western part of thecountry than to the east or south.
Also, national “large” politics and the local politics are increasingly separated. Insmaller LGs (regarding the small towns also), citizens are less interested in “large”politics than in the capital or in the county capitals, but local politics has a strongeremphasis in the smaller ones. Citizens of the capital and the county capitals are inter-ested similarly in “large” and local politics. The strongest influences of the “large”politics reflect life in the largest cities, and the marks of political division are mostvisible here. Participation in local elections seems to refute this statement. In smallvillages, the higher rate of participation was explained by the stronger personal rela-tionships among the citizenry and not by the activities of the political groups.[Andorka, R. 1997]
Table 2.12Rate of Participation in Local Elections by LGs’ Size
Size of LGs 1990 1994 1998
0–499 59.68 71.60 70.64
500– 999 56.62 64.09 63.04
1,000–1,999 53.69 58.18 56.83
2,000–4,999 50.15 51.55 50.62
5,000–9,999 44.09 44.52 43.50
10,000–49,999 38.41 41.58
50,000–99,999 36.44 39.91
100,000– 33.44 40.17
SOURCE: Central Election Office of Ministry of Interior, 2002.
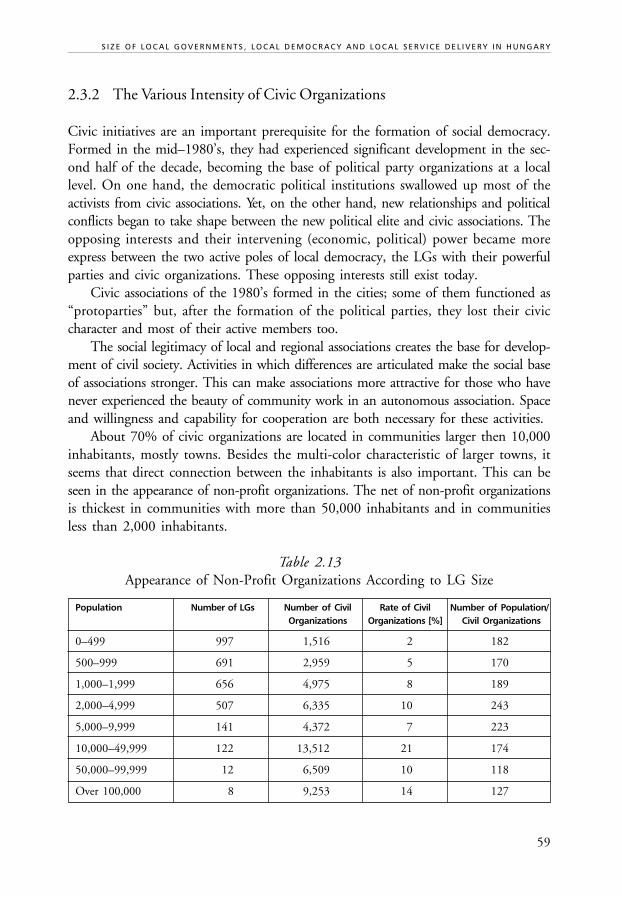
59
S I Z E O F L O C A L G O V E R N M E N T S , L O C A L D E M O C R A C Y A N D L O C A L S E R V I C E D E L I V E R Y I N H U N G A R Y
2.3.2 The Various Intensity of Civic Organizations
Civic initiatives are an important prerequisite for the formation of social democracy.Formed in the mid–1980’s, they had experienced significant development in the sec-ond half of the decade, becoming the base of political party organizations at a locallevel. On one hand, the democratic political institutions swallowed up most of theactivists from civic associations. Yet, on the other hand, new relationships and politicalconflicts began to take shape between the new political elite and civic associations. Theopposing interests and their intervening (economic, political) power became moreexpress between the two active poles of local democracy, the LGs with their powerfulparties and civic organizations. These opposing interests still exist today.
Civic associations of the 1980’s formed in the cities; some of them functioned as“protoparties” but, after the formation of the political parties, they lost their civiccharacter and most of their active members too.
The social legitimacy of local and regional associations creates the base for develop-ment of civil society. Activities in which differences are articulated make the social baseof associations stronger. This can make associations more attractive for those who havenever experienced the beauty of community work in an autonomous association. Spaceand willingness and capability for cooperation are both necessary for these activities.
About 70% of civic organizations are located in communities larger then 10,000inhabitants, mostly towns. Besides the multi-color characteristic of larger towns, itseems that direct connection between the inhabitants is also important. This can beseen in the appearance of non-profit organizations. The net of non-profit organizationsis thickest in communities with more than 50,000 inhabitants and in communitiesless than 2,000 inhabitants.
Table 2.13Appearance of Non-Profit Organizations According to LG Size
Population Number of LGs Number of Civil Rate of Civil Number of Population/Organizations Organizations [%] Civil Organizations
0–499 997 1,516 2 182
500–999 691 2,959 5 170
1,000–1,999 656 4,975 8 189
2,000–4,999 507 6,335 10 243
5,000–9,999 141 4,372 7 223
10,000–49,999 122 13,512 21 174
50,000–99,999 12 6,509 10 118
Over 100,000 8 9,253 14 127
60
C O N S O L I D A T I O N O R F R A G M E N T A T I O N ?
D F I D – L G I L O C A L G O V E R N M E N T P O L I C Y P A R T N E R S H I P P R O G R A M
Table 2.13 (Continued)Appearance of Non-Profit Organizations According to LG Size
Population Number of LGs Number of Civil Rate of Civil Number of Population/Organizations Organizations [%] Civil Organizations
Budapest 1 16,003 24 109
Total 3,135 65,334 100 146
SOURCE: TSTAR database, 1999.
2.3.3 Participation in Local Public Affairs, Trust, Expectations andSatisfaction With Local Governments Depending on the Levelof Socio-Economic Development
We consider Public affairs those local matters and activities of the citizenry or/and theirgroups, that are connected with the provision, development, etc. of the given commu-nity and have an effect on more of the local citizenry. Those activities, not obligatory toeveryday work activities, we must consider participation in public affairs. Our empiricalexperience shows that participation in public affairs is differentiated according to theLG size. Especially in larger towns, and in county capitals as well, participation inpublic affairs and the intensity of its direction are diverse in various sections of town.According to a survey of Szolnok city, the citizens in the city center are less satisfied andmore active, while the citizens of the suburban region are active, satisfied and patient.13
The citizens in the industrial zone are less interested in the public affaires, membershipin civic associations is low, and their opinions rarely surface. The reason for these ten-dencies is that qualified citizens with high status live in specific parts of town.
Trust in local governments, in our opinion, also depends on the development level ofthe settlement, the employment situation, the level of services, and the position of theindividual citizen. Party preference only fall into these two categories: Citizens livingin average or above average conditions and whose basic needs are fulfilled, therefore,they are more satisfied and citizens with higher criterion, young people and men areless satisfied and more critical.
The results of research into 9 Hungarian counties (6 in the East and 3 in the South)have verified this statement. Where the number of inhabitants is less than 10,000, therespect of the mayor is higher (it scored 82 points of 100) than in settlements withmore than 10,000 inhabitants (it scored 72 points). The respect for the governing bodyof the local authority is also higher in the smaller settlements (less than 10,000—71point; more than 10,000 inhabitants—66 point), than in the bigger ones.
According to appreciation of leaders roles, there is a significant difference betweensmall and large LGs. Citizens in smaller villages highly esteem the mayor and yet theydo not consider the other local representatives and the local governmental bodies.
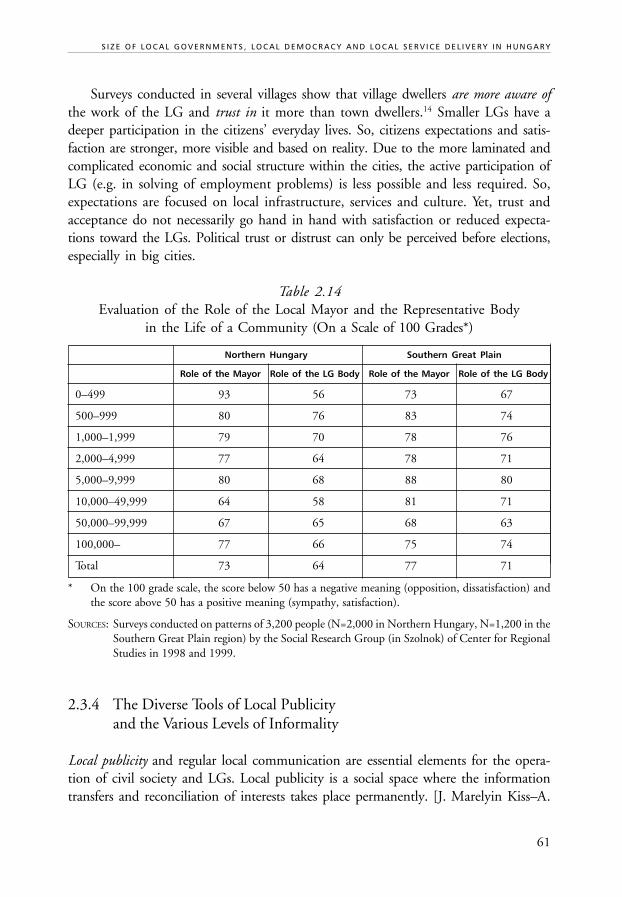
61
S I Z E O F L O C A L G O V E R N M E N T S , L O C A L D E M O C R A C Y A N D L O C A L S E R V I C E D E L I V E R Y I N H U N G A R Y
Surveys conducted in several villages show that village dwellers are more aware ofthe work of the LG and trust in it more than town dwellers.14 Smaller LGs have adeeper participation in the citizens’ everyday lives. So, citizens expectations and satis-faction are stronger, more visible and based on reality. Due to the more laminated andcomplicated economic and social structure within the cities, the active participation ofLG (e.g. in solving of employment problems) is less possible and less required. So,expectations are focused on local infrastructure, services and culture. Yet, trust andacceptance do not necessarily go hand in hand with satisfaction or reduced expecta-tions toward the LGs. Political trust or distrust can only be perceived before elections,especially in big cities.
Table 2.14Evaluation of the Role of the Local Mayor and the Representative Body
in the Life of a Community (On a Scale of 100 Grades*)
Northern Hungary Southern Great Plain
Role of the Mayor Role of the LG Body Role of the Mayor Role of the LG Body
0–499 93 56 73 67
500–999 80 76 83 74
1,000–1,999 79 70 78 76
2,000–4,999 77 64 78 71
5,000–9,999 80 68 88 80
10,000–49,999 64 58 81 71
50,000–99,999 67 65 68 63
100,000– 77 66 75 74
Total 73 64 77 71
* On the 100 grade scale, the score below 50 has a negative meaning (opposition, dissatisfaction) andthe score above 50 has a positive meaning (sympathy, satisfaction).
SOURCES: Surveys conducted on patterns of 3,200 people (N=2,000 in Northern Hungary, N=1,200 in theSouthern Great Plain region) by the Social Research Group (in Szolnok) of Center for RegionalStudies in 1998 and 1999.
2.3.4 The Diverse Tools of Local Publicityand the Various Levels of Informality
Local publicity and regular local communication are essential elements for the opera-tion of civil society and LGs. Local publicity is a social space where the informationtransfers and reconciliation of interests takes place permanently. [J. Marelyin Kiss–A.
62
C O N S O L I D A T I O N O R F R A G M E N T A T I O N ?
D F I D – L G I L O C A L G O V E R N M E N T P O L I C Y P A R T N E R S H I P P R O G R A M
DÉNES, 2000). Publicity is a medium of communication between the citizens, orga-nizations and other players in society. It is important to realize, however, that solvingcommunication problems is not enough to create a social base. It alone is not able tosolve the problem of legitimacy, on the other hand, a developed social backgroundwill, at the same time, produce a high level of publicity as well.
Local newspapers, radio and television are the most important bases of local identityand community development. These instruments are under formation and it seems thattechnical development, the content of publicity, as well as the creation of legal, finan-cial, technical and social backgrounds for its operation, still need more time. All thesame, we have to take into consideration the emerging effects of development on theinformation society during the next decade.
The role of local publicity and local media has received less attention than itdeserved in the last decade. Politicians focused on influencing national mediums.However, we can see a huge development process in local publicity also. Since 1988,hundreds of local newspapers have not only appeared in big cities, but in smallercommunities, too. During the 1990’s, only a small number of local television stationsoperated (especially in the capital and in some county capitals) and we do not knowof any local radio stations of the time. In 2001, according to KÖRMÉDIA statistics,there were 49 circulating TV stations, 156 local cable TV stations and 109 localradio stations.
Local print and electronic media became essential participants in the local andregional news market.
There are some contradictions between LGs’ size and the role of local publicity.The smaller the LG, the less the possibility of operating local publicity as a for-profitbusiness. In this situation, the operation of local media needs a subsidy from the LG.But, if they are financially reliant on local public money, how can independence andobjectivity be ensured? And, if the subsidy of the LG is exhausted, how will operationof the local TV, radio or newspaper continue? These are significant sources of problems.Even in the case of the most correct and fair LGs; these are also serious ethical andpolitical traps. In most places, it seems that the head of the LG forgot about thecommunicational principle, that both giving information and receiving of informationare necessary.
In contrast, there are more possibilities to solve grievances, to handle cases of injus-tice efficiently, as well as to build up and operate informal channels to the civil societyin smaller LGs. The traditional public forums, legally required of LGs by law, do notprovide ample opportunity to articulate and expose community intentions [Horváthand Péteri, 1997, Central Budget Policy, p.21.], however, new structures have not yetformed.
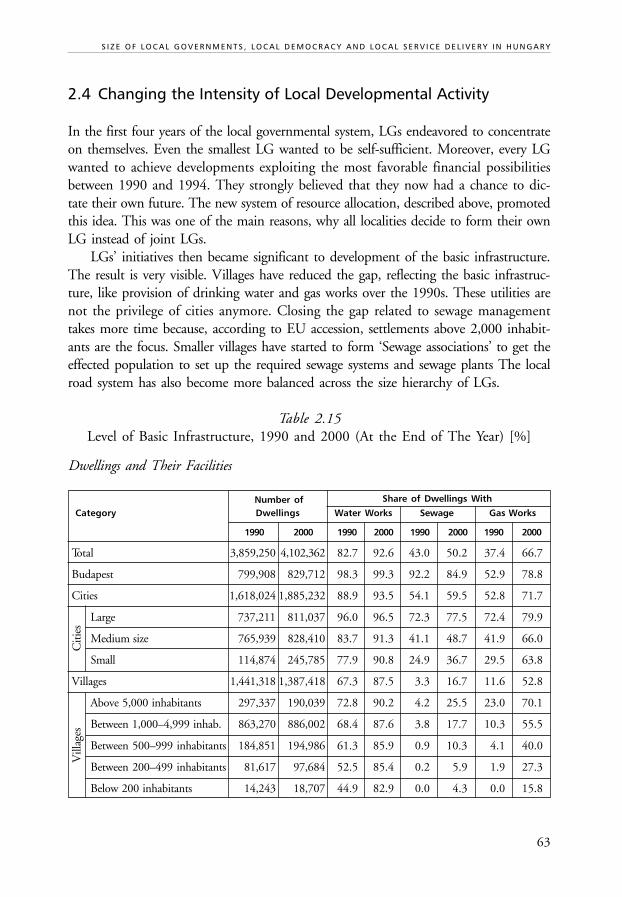
63
S I Z E O F L O C A L G O V E R N M E N T S , L O C A L D E M O C R A C Y A N D L O C A L S E R V I C E D E L I V E R Y I N H U N G A R Y
2.4 Changing the Intensity of Local Developmental Activity
In the first four years of the local governmental system, LGs endeavored to concentrateon themselves. Even the smallest LG wanted to be self-sufficient. Moreover, every LGwanted to achieve developments exploiting the most favorable financial possibilitiesbetween 1990 and 1994. They strongly believed that they now had a chance to dic-tate their own future. The new system of resource allocation, described above, promotedthis idea. This was one of the main reasons, why all localities decide to form their ownLG instead of joint LGs.
LGs’ initiatives then became significant to development of the basic infrastructure.The result is very visible. Villages have reduced the gap, reflecting the basic infrastruc-ture, like provision of drinking water and gas works over the 1990s. These utilities arenot the privilege of cities anymore. Closing the gap related to sewage managementtakes more time because, according to EU accession, settlements above 2,000 inhabit-ants are the focus. Smaller villages have started to form ‘Sewage associations’ to get theeffected population to set up the required sewage systems and sewage plants The localroad system has also become more balanced across the size hierarchy of LGs.
Table 2.15Level of Basic Infrastructure, 1990 and 2000 (At the End of The Year) [%]
Dwellings and Their Facilities
Number of Share of Dwellings With
Category Dwellings Water Works Sewage Gas Works
1990 2000 1990 2000 1990 2000 1990 2000
Total 3,859,250 4,102,362 82.7 92.6 43.0 50.2 37.4 66.7
Budapest 799,908 829,712 98.3 99.3 92.2 84.9 52.9 78.8
Cities 1,618,024 1,885,232 88.9 93.5 54.1 59.5 52.8 71.7
Large 737,211 811,037 96.0 96.5 72.3 77.5 72.4 79.9
Medium size 765,939 828,410 83.7 91.3 41.1 48.7 41.9 66.0
Small 114,874 245,785 77.9 90.8 24.9 36.7 29.5 63.8
Villages 1,441,318 1,387,418 67.3 87.5 3.3 16.7 11.6 52.8
Above 5,000 inhabitants 297,337 190,039 72.8 90.2 4.2 25.5 23.0 70.1
Between 1,000–4,999 inhab. 863,270 886,002 68.4 87.6 3.8 17.7 10.3 55.5
Between 500–999 inhabitants 184,851 194,986 61.3 85.9 0.9 10.3 4.1 40.0
Between 200–499 inhabitants 81,617 97,684 52.5 85.4 0.2 5.9 1.9 27.3
Below 200 inhabitants 14,243 18,707 44.9 82.9 0.0 4.3 0.0 15.8
Citi
esV
illag
es
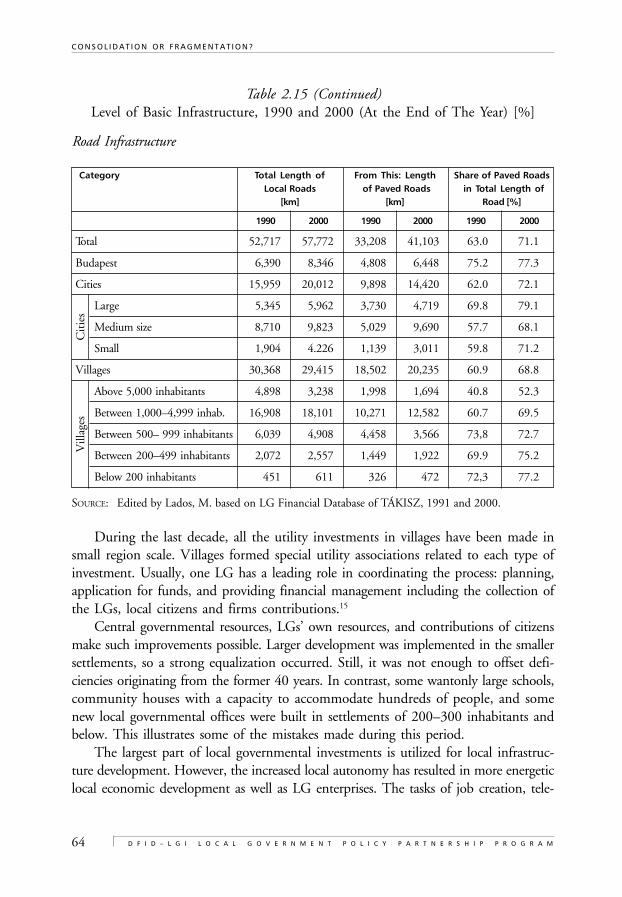
64
C O N S O L I D A T I O N O R F R A G M E N T A T I O N ?
D F I D – L G I L O C A L G O V E R N M E N T P O L I C Y P A R T N E R S H I P P R O G R A M
Table 2.15 (Continued)Level of Basic Infrastructure, 1990 and 2000 (At the End of The Year) [%]
Road Infrastructure
Category Total Length of From This: Length Share of Paved RoadsLocal Roads of Paved Roads in Total Length of
[km] [km] Road [%]
1990 2000 1990 2000 1990 2000
Total 52,717 57,772 33,208 41,103 63.0 71.1
Budapest 6,390 8,346 4,808 6,448 75.2 77.3
Cities 15,959 20,012 9,898 14,420 62.0 72.1
Large 5,345 5,962 3,730 4,719 69.8 79.1
Medium size 8,710 9,823 5,029 9,690 57.7 68.1
Small 1,904 4.226 1,139 3,011 59.8 71.2
Villages 30,368 29,415 18,502 20,235 60.9 68.8
Above 5,000 inhabitants 4,898 3,238 1,998 1,694 40.8 52.3
Between 1,000–4,999 inhab. 16,908 18,101 10,271 12,582 60.7 69.5
Between 500– 999 inhabitants 6,039 4,908 4,458 3,566 73,8 72.7
Between 200–499 inhabitants 2,072 2,557 1,449 1,922 69.9 75.2
Below 200 inhabitants 451 611 326 472 72,3 77.2
SOURCE: Edited by Lados, M. based on LG Financial Database of TÁKISZ, 1991 and 2000.
During the last decade, all the utility investments in villages have been made insmall region scale. Villages formed special utility associations related to each type ofinvestment. Usually, one LG has a leading role in coordinating the process: planning,application for funds, and providing financial management including the collection ofthe LGs, local citizens and firms contributions.15
Central governmental resources, LGs’ own resources, and contributions of citizensmake such improvements possible. Larger development was implemented in the smallersettlements, so a strong equalization occurred. Still, it was not enough to offset defi-ciencies originating from the former 40 years. In contrast, some wantonly large schools,community houses with a capacity to accommodate hundreds of people, and somenew local governmental offices were built in settlements of 200–300 inhabitants andbelow. This illustrates some of the mistakes made during this period.
The largest part of local governmental investments is utilized for local infrastruc-ture development. However, the increased local autonomy has resulted in more energeticlocal economic development as well as LG enterprises. The tasks of job creation, tele-
Cit
ies
Vill
ages
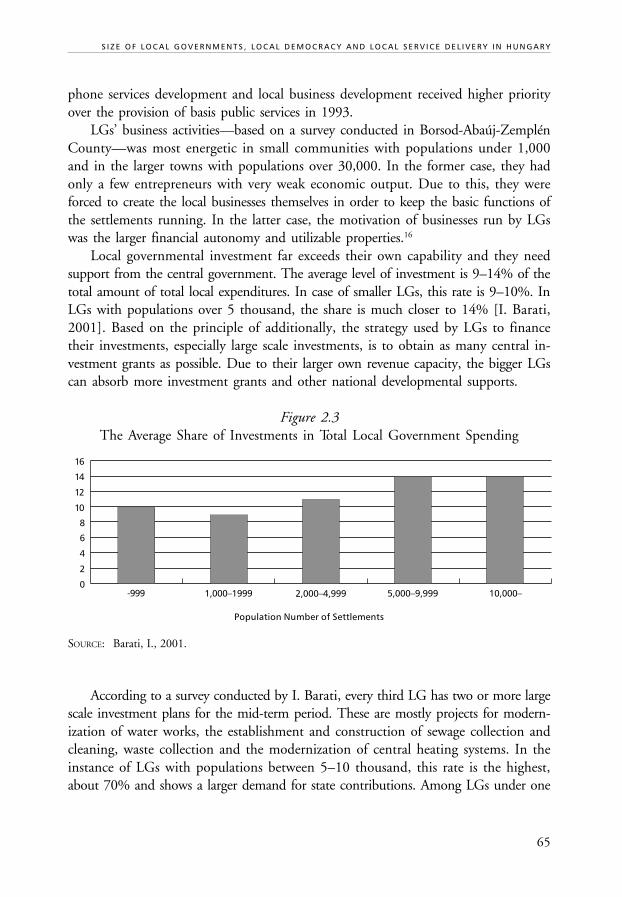
65
S I Z E O F L O C A L G O V E R N M E N T S , L O C A L D E M O C R A C Y A N D L O C A L S E R V I C E D E L I V E R Y I N H U N G A R Y
phone services development and local business development received higher priorityover the provision of basis public services in 1993.
LGs’ business activities—based on a survey conducted in Borsod-Abaúj-ZemplénCounty—was most energetic in small communities with populations under 1,000and in the larger towns with populations over 30,000. In the former case, they hadonly a few entrepreneurs with very weak economic output. Due to this, they wereforced to create the local businesses themselves in order to keep the basic functions ofthe settlements running. In the latter case, the motivation of businesses run by LGswas the larger financial autonomy and utilizable properties.16
Local governmental investment far exceeds their own capability and they needsupport from the central government. The average level of investment is 9–14% of thetotal amount of total local expenditures. In case of smaller LGs, this rate is 9–10%. InLGs with populations over 5 thousand, the share is much closer to 14% [I. Barati,2001]. Based on the principle of additionally, the strategy used by LGs to financetheir investments, especially large scale investments, is to obtain as many central in-vestment grants as possible. Due to their larger own revenue capacity, the bigger LGscan absorb more investment grants and other national developmental supports.
Figure 2.3The Average Share of Investments in Total Local Government Spending
Population Number of Settlements
SOURCE: Barati, I., 2001.
According to a survey conducted by I. Barati, every third LG has two or more largescale investment plans for the mid-term period. These are mostly projects for modern-ization of water works, the establishment and construction of sewage collection andcleaning, waste collection and the modernization of central heating systems. In theinstance of LGs with populations between 5–10 thousand, this rate is the highest,about 70% and shows a larger demand for state contributions. Among LGs under one
16
-999
14
12
10
8
6
4
2
01,000–1999 2,000–4,999 5,000–9,999 10,000–
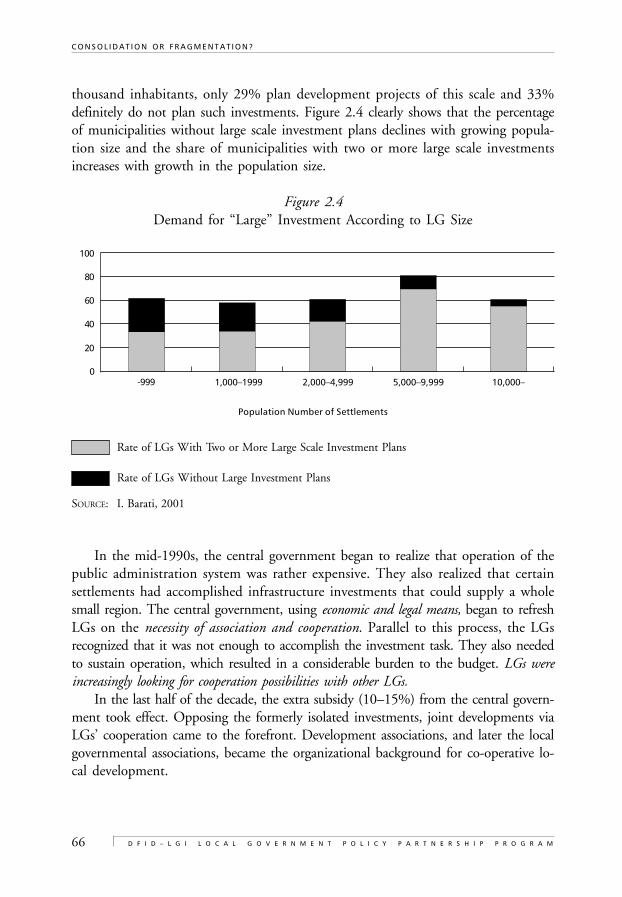
66
C O N S O L I D A T I O N O R F R A G M E N T A T I O N ?
D F I D – L G I L O C A L G O V E R N M E N T P O L I C Y P A R T N E R S H I P P R O G R A M
thousand inhabitants, only 29% plan development projects of this scale and 33%definitely do not plan such investments. Figure 2.4 clearly shows that the percentageof municipalities without large scale investment plans declines with growing popula-tion size and the share of municipalities with two or more large scale investmentsincreases with growth in the population size.
Figure 2.4Demand for “Large” Investment According to LG Size
Population Number of Settlements
Rate of LGs With Two or More Large Scale Investment Plans
Rate of LGs Without Large Investment Plans
SOURCE: I. Barati, 2001
In the mid-1990s, the central government began to realize that operation of thepublic administration system was rather expensive. They also realized that certainsettlements had accomplished infrastructure investments that could supply a wholesmall region. The central government, using economic and legal means, began to refreshLGs on the necessity of association and cooperation. Parallel to this process, the LGsrecognized that it was not enough to accomplish the investment task. They also neededto sustain operation, which resulted in a considerable burden to the budget. LGs wereincreasingly looking for cooperation possibilities with other LGs.
In the last half of the decade, the extra subsidy (10–15%) from the central govern-ment took effect. Opposing the formerly isolated investments, joint developments viaLGs’ cooperation came to the forefront. Development associations, and later the localgovernmental associations, became the organizational background for co-operative lo-cal development.
100
80
60
40
20
0-999 1,000–1999 2,000–4,999 5,000–9,999 10,000–
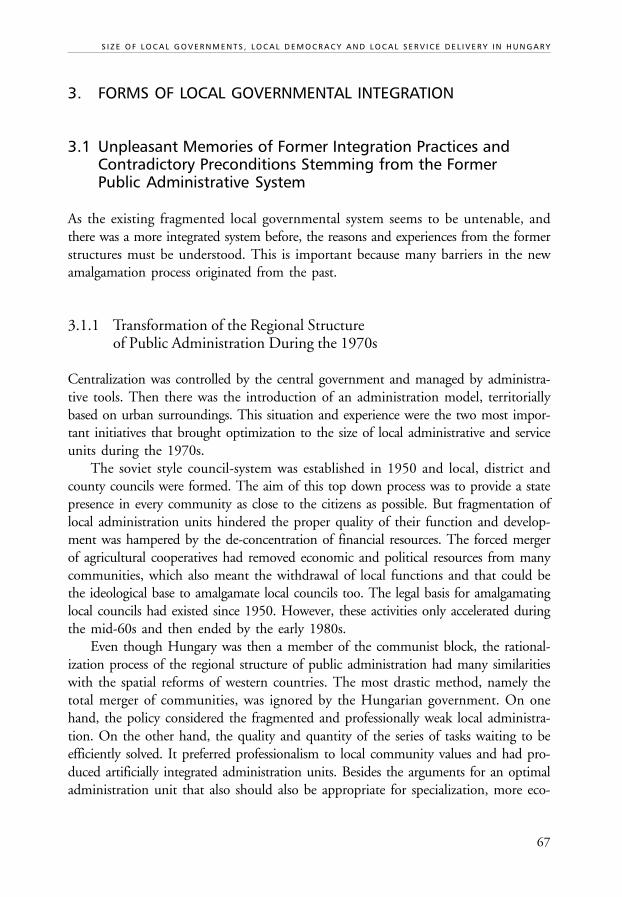
67
S I Z E O F L O C A L G O V E R N M E N T S , L O C A L D E M O C R A C Y A N D L O C A L S E R V I C E D E L I V E R Y I N H U N G A R Y
3. FORMS OF LOCAL GOVERNMENTAL INTEGRATION
3.1 Unpleasant Memories of Former Integration Practices andContradictory Preconditions Stemming from the FormerPublic Administrative System
As the existing fragmented local governmental system seems to be untenable, andthere was a more integrated system before, the reasons and experiences from the formerstructures must be understood. This is important because many barriers in the newamalgamation process originated from the past.
3.1.1 Transformation of the Regional Structureof Public Administration During the 1970s
Centralization was controlled by the central government and managed by administra-tive tools. Then there was the introduction of an administration model, territoriallybased on urban surroundings. This situation and experience were the two most impor-tant initiatives that brought optimization to the size of local administrative and serviceunits during the 1970s.
The soviet style council-system was established in 1950 and local, district andcounty councils were formed. The aim of this top down process was to provide a statepresence in every community as close to the citizens as possible. But fragmentation oflocal administration units hindered the proper quality of their function and develop-ment was hampered by the de-concentration of financial resources. The forced mergerof agricultural cooperatives had removed economic and political resources from manycommunities, which also meant the withdrawal of local functions and that could bethe ideological base to amalgamate local councils too. The legal basis for amalgamatinglocal councils had existed since 1950. However, these activities only accelerated duringthe mid-60s and then ended by the early 1980s.
Even though Hungary was then a member of the communist block, the rational-ization process of the regional structure of public administration had many similaritieswith the spatial reforms of western countries. The most drastic method, namely thetotal merger of communities, was ignored by the Hungarian government. On onehand, the policy considered the fragmented and professionally weak local administra-tion. On the other hand, the quality and quantity of the series of tasks waiting to beefficiently solved. It preferred professionalism to local community values and had pro-duced artificially integrated administration units. Besides the arguments for an optimaladministration unit that also should also be appropriate for specialization, more eco-
68
C O N S O L I D A T I O N O R F R A G M E N T A T I O N ?
D F I D – L G I L O C A L G O V E R N M E N T P O L I C Y P A R T N E R S H I P P R O G R A M
nomic local services and development were considered in case of determining a concen-trated regional structure for public administration.
The common councils formed administrative districts, which did not necessarilymean economic or public service attraction zones. There was always a kind of internalconflict in the institution of common councils. Common councils integrated both thecenter and the satellite communities but the satellite communities retained their legalstatus. In the statistical registers, they appeared as independent communities and theelection laws guaranteed them representation in the common council, proportionateto their population. The law stated that every satellite community had to elect at leastthree representatives to the common council. Council members from the satellitecommunities became members of local leadership and they formed a quasi-partial gov-ernment, according to a 1983 modification of the law. This meant that there was nohierarchy between the center and the other communities. Only one council body, oneexecutive body and one administrative department fulfilled the tasks. As a consequenceof the amalgamation, the settlement network and the network of councils had beenseparated. This was performed in various ways by the counties, according to the fea-tures of the settlement network. In counties with many small communities, the councilswere common ones. While in the Great Plain, there were much fewer common coun-cils and the communities were left alone.
Table 2.16The Relationship Between Communities, Local Councils and
Local Governments
Year Communities Communities With Communities With Number of CouncilsTheir Own Council a Common Council or Local Governments
1950 3,229 2,862 361 3,032
1970 3,244 1,784 1,440 2,294
1980 3,122 811 2,311 1,525
SOURCE: Yearbooks of the Central Statistical Office
The next step was the decentralization of competencies. This prepared for a reduc-tion of public administration to two levels. The target groups of this process were theamalgamated political and administrative units and, further formation of a level be-tween localities and counties.
The council-system only accepted one form of institutional cooperation by thecouncils and this was to carry out state-administrative tasks on a joint basis. By the mid-1980s, an expanded network of administrative associations operated, especially in counties
69
S I Z E O F L O C A L G O V E R N M E N T S , L O C A L D E M O C R A C Y A N D L O C A L S E R V I C E D E L I V E R Y I N H U N G A R Y
full of small villages and they drew out a new level of public administration. In some coun-ties, they covered the whole territory. In the instance of local public services, the law didnot accept these kinds of associative institutions. The council headquarter was respon-sible for local public service distribution for all its own citizens and those from thesatellite community.
A governmental decision founded in 1968 ordered the merge of annual budgetsand development resources from those communities in a common councils in order toaccomplish the council’s investments in the central settlements. In the satellite settle-ments, only the basic institutions and infrastructure were allowed to develop. Thebasic public service institutions (schools, health care, nursery schools, homes for theelderly, culture centers) were concentrated in the council center and were difficult toreach because of bad transportation conditions.
The negative effects of this centralized development policy were further enhancedby the redistribution of development resources designated by county councils.17 Theredistribution of economic resources in the county was not proportional and rational,but based on despotic approach and service of certain clienteles.
3.1.2 Abolision of Districts and Institutionalizationof Surrounding Urban Areas During the 1980’s
The concept of public administration by urban surroundings appeared fairly early in1969. At that time it had become possible to put certain villages under urban guid-ance. In 1971, the third Law on Councils had introduced the notion of “the village inurban surroundings” and determined the criteria for urban surrounding communities.The criteria were as follows: strong geographical, social, economic, employment andtransport connections between the town and the nearby village and specific reasonsfor their coordinated development. The real aim of the institutionalization of urbansurroundings was the gradual change toward a two level administration structure. Theurban surrounding, as a form of public administration, evolved into a type of develop-ment, which nobody had thought of before. After the abolishment of districts in1984, urban surroundings became more administration-oriented. In reality, the rela-tionships between the towns and the villages had become much more complex. Theurban surrounding administration covered three kinds of activities [Kara, P., Kilényi,G., Kökényesi, J. and Verebélyi, I., 1983]:
• the towns provided services for the surrounding villages under an horizontalrelationship,
• the towns, taking part in county administration, controlled the surroundingvillages’ councils,
70
C O N S O L I D A T I O N O R F R A G M E N T A T I O N ?
D F I D – L G I L O C A L G O V E R N M E N T P O L I C Y P A R T N E R S H I P P R O G R A M
• the towns and the larger villages became the second level of authority over thesurrounding villages and it made a hierarchy between the communities with astrong dependency building up between the town and the villages.
The mixture of these functions was accepted, only because it was seen as a transi-tional situation. The urban surrounding administration finished only after the politicalchange in 1990, when the local government was established. The urban surroundingadministration system created 139 administration districts, of which 105 were townssurrounding districts and 34 were larger villages surrounding districts.
3.2 The Need and Willingness of Local Governments to Cooperate
3.2.1 The Notion of Local Autonomyand Co-Operation with LGs in the Minds of Local Leaders
The integration process that took place in the 1970s had its affect. Ongoing conflictswhich have flared between communities belonging to a common council, the centerand the other communities, towns and villages, the local and the county councils, allrooted in the past, can only be destroyed within decades. These conflicts also shapedcitizens attitudes towards cooperation with other communities and inspired them toinsist on the autonomy of the LGs.
Results of a survey conducted in Somogy county in 2000 show LGs attitudes towardcooperation. Mayors and local representatives from various sizes of LGs were ques-tioned. According to their opinions, LGs protect their autonomy but are willing tocooperate, mainly with their neighboring LGs. Insistence on autonomy is fairly strong,especially in case of LGs under 500 inhabitants, but they came out in support offorming associations.
Village governments focused on building relationships with neighboring villages,while towns emphasized small regional connections as their most important mission.In all LG size categories, they expected to develop small regional strategies, commonprojects and fundraising activities through cooperation on a small regional level. Theseinterests are also common and strong for establishment and operation of a commoninformation infrastructure. The towns have less interest in distribution of public ser-vices and implementation of central tasks in cooperation. Consultation between mayorsis also not so necessary for villages. The smallest LGs show less interest in commoninfrastructure development and co-ordination of employment and social care.
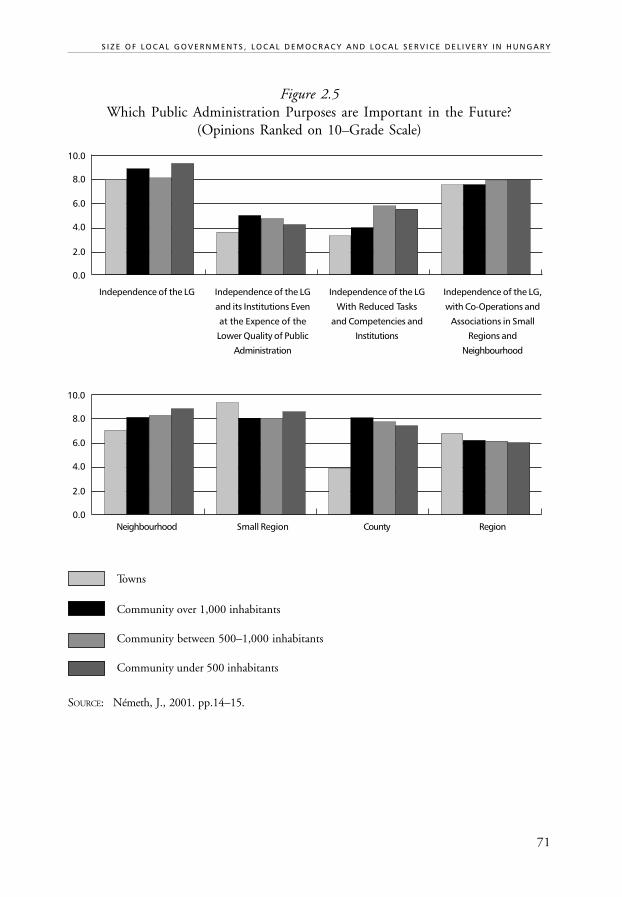
71
S I Z E O F L O C A L G O V E R N M E N T S , L O C A L D E M O C R A C Y A N D L O C A L S E R V I C E D E L I V E R Y I N H U N G A R Y
Figure 2.5Which Public Administration Purposes are Important in the Future?
(Opinions Ranked on 10–Grade Scale)
Independence of the LG Independence of the LG Independence of the LG Independence of the LG,
and its Institutions Even With Reduced Tasks with Co-Operations and
at the Expence of the and Competencies and Associations in Small
Lower Quality of Public Institutions Regions and
Administration Neighbourhood
Neighbourhood Small Region County Region
Towns
Community over 1,000 inhabitants
Community between 500–1,000 inhabitants
Community under 500 inhabitants
SOURCE: Németh, J., 2001. pp.14–15.
10.0
8.0
6.0
4.0
2.0
0.0
0.0
10.0
8.0
6.0
4.0
2.0
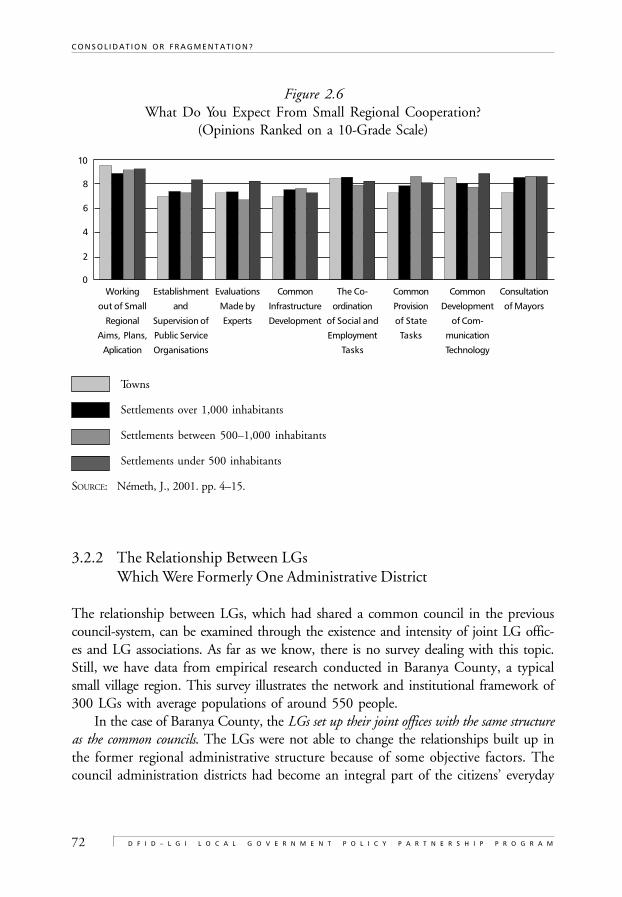
72
C O N S O L I D A T I O N O R F R A G M E N T A T I O N ?
D F I D – L G I L O C A L G O V E R N M E N T P O L I C Y P A R T N E R S H I P P R O G R A M
Figure 2.6What Do You Expect From Small Regional Cooperation?
(Opinions Ranked on a 10-Grade Scale)
Working Establishment Evaluations Common The Co- Common Common Consultation
out of Small and Made by Infrastructure ordination Provision Development of Mayors
Regional Supervision of Experts Development of Social and of State of Com-
Aims, Plans, Public Service Employment Tasks munication
Aplication Organisations Tasks Technology
Towns
Settlements over 1,000 inhabitants
Settlements between 500–1,000 inhabitants
Settlements under 500 inhabitants
SOURCE: Németh, J., 2001. pp. 4–15.
3.2.2 The Relationship Between LGsWhich Were Formerly One Administrative District
The relationship between LGs, which had shared a common council in the previouscouncil-system, can be examined through the existence and intensity of joint LG offic-es and LG associations. As far as we know, there is no survey dealing with this topic.Still, we have data from empirical research conducted in Baranya County, a typicalsmall village region. This survey illustrates the network and institutional framework of300 LGs with average populations of around 550 people.
In the case of Baranya County, the LGs set up their joint offices with the same structureas the common councils. The LGs were not able to change the relationships built up inthe former regional administrative structure because of some objective factors. Thecouncil administration districts had become an integral part of the citizens’ everyday
10
8
6
4
2
0
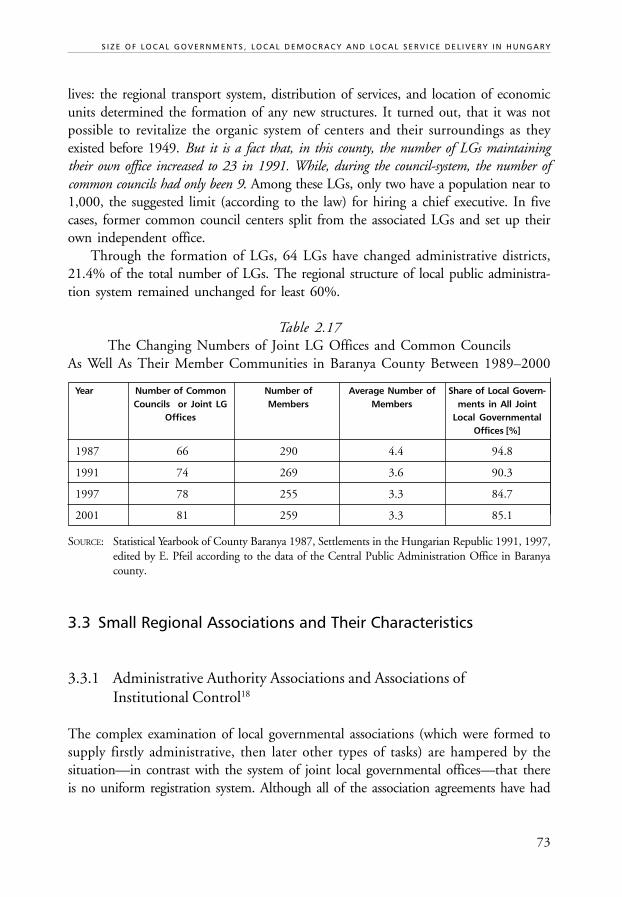
73
S I Z E O F L O C A L G O V E R N M E N T S , L O C A L D E M O C R A C Y A N D L O C A L S E R V I C E D E L I V E R Y I N H U N G A R Y
lives: the regional transport system, distribution of services, and location of economicunits determined the formation of any new structures. It turned out, that it was notpossible to revitalize the organic system of centers and their surroundings as theyexisted before 1949. But it is a fact that, in this county, the number of LGs maintainingtheir own office increased to 23 in 1991. While, during the council-system, the number ofcommon councils had only been 9. Among these LGs, only two have a population near to1,000, the suggested limit (according to the law) for hiring a chief executive. In fivecases, former common council centers split from the associated LGs and set up theirown independent office.
Through the formation of LGs, 64 LGs have changed administrative districts,21.4% of the total number of LGs. The regional structure of local public administra-tion system remained unchanged for least 60%.
Table 2.17The Changing Numbers of Joint LG Offices and Common Councils
As Well As Their Member Communities in Baranya County Between 1989–2000
Year Number of Common Number of Average Number of Share of Local Govern-Councils or Joint LG Members Members ments in All Joint
Offices Local GovernmentalOffices [%]
1987 66 290 4.4 94.8
1991 74 269 3.6 90.3
1997 78 255 3.3 84.7
2001 81 259 3.3 85.1
SOURCE: Statistical Yearbook of County Baranya 1987, Settlements in the Hungarian Republic 1991, 1997,edited by E. Pfeil according to the data of the Central Public Administration Office in Baranyacounty.
3.3 Small Regional Associations and Their Characteristics
3.3.1 Administrative Authority Associations and Associations ofInstitutional Control18
The complex examination of local governmental associations (which were formed tosupply firstly administrative, then later other types of tasks) are hampered by thesituation—in contrast with the system of joint local governmental offices—that thereis no uniform registration system. Although all of the association agreements have had
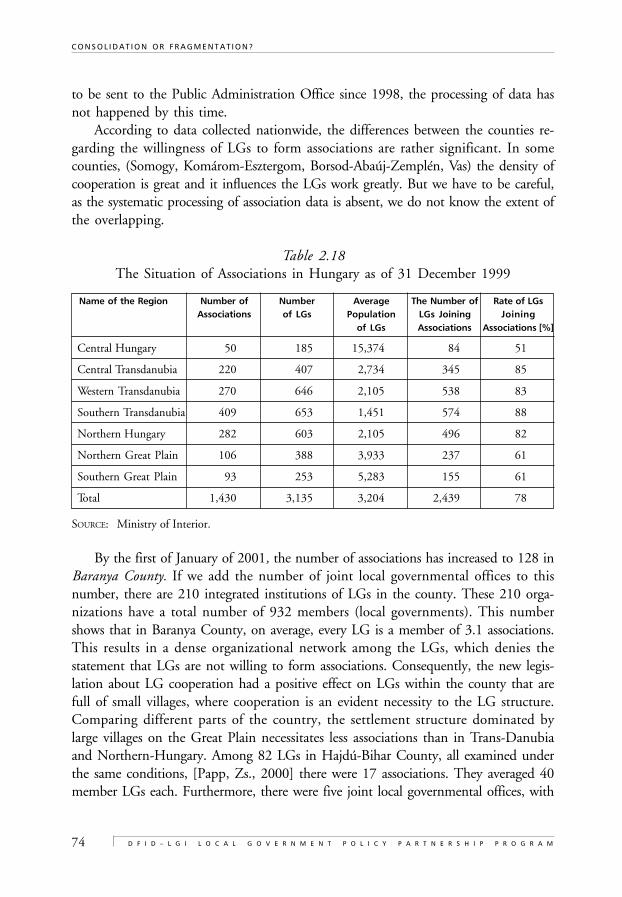
74
C O N S O L I D A T I O N O R F R A G M E N T A T I O N ?
D F I D – L G I L O C A L G O V E R N M E N T P O L I C Y P A R T N E R S H I P P R O G R A M
to be sent to the Public Administration Office since 1998, the processing of data hasnot happened by this time.
According to data collected nationwide, the differences between the counties re-garding the willingness of LGs to form associations are rather significant. In somecounties, (Somogy, Komárom-Esztergom, Borsod-Abaúj-Zemplén, Vas) the density ofcooperation is great and it influences the LGs work greatly. But we have to be careful,as the systematic processing of association data is absent, we do not know the extent ofthe overlapping.
Table 2.18The Situation of Associations in Hungary as of 31 December 1999
Name of the Region Number of Number Average The Number of Rate of LGsAssociations of LGs Population LGs Joining Joining
of LGs Associations Associations [%]
Central Hungary 50 185 15,374 84 51
Central Transdanubia 220 407 2,734 345 85
Western Transdanubia 270 646 2,105 538 83
Southern Transdanubia 409 653 1,451 574 88
Northern Hungary 282 603 2,105 496 82
Northern Great Plain 106 388 3,933 237 61
Southern Great Plain 93 253 5,283 155 61
Total 1,430 3,135 3,204 2,439 78
SOURCE: Ministry of Interior.
By the first of January of 2001, the number of associations has increased to 128 inBaranya County. If we add the number of joint local governmental offices to thisnumber, there are 210 integrated institutions of LGs in the county. These 210 orga-nizations have a total number of 932 members (local governments). This numbershows that in Baranya County, on average, every LG is a member of 3.1 associations.This results in a dense organizational network among the LGs, which denies thestatement that LGs are not willing to form associations. Consequently, the new legis-lation about LG cooperation had a positive effect on LGs within the county that arefull of small villages, where cooperation is an evident necessity to the LG structure.Comparing different parts of the country, the settlement structure dominated bylarge villages on the Great Plain necessitates less associations than in Trans-Danubiaand Northern-Hungary. Among 82 LGs in Hajdú-Bihar County, all examined underthe same conditions, [Papp, Zs., 2000] there were 17 associations. They averaged 40member LGs each. Furthermore, there were five joint local governmental offices, with
75
S I Z E O F L O C A L G O V E R N M E N T S , L O C A L D E M O C R A C Y A N D L O C A L S E R V I C E D E L I V E R Y I N H U N G A R Y
13 member LGs. Comparing the two counties, it turns out that for a county in theGreat Plain region a LG is, on average, a member of 0.66 associations. Can we drawthe conclusion that the variance in the organizational form between two parts of thecountry for supplying local service goods has got a decent explanation? Perhaps thisamount of discrepancy is not evident because the average population of LGs in H-BCounty is only about 2,000?
Another form of LGs association is an ‘association of institutional control’, a com-mon operation of institutions, mainly for primary schools (in 1996 there were 489such associations). There is only few number of waste management, public infrastruc-ture associations (51), even though these can operate in small regional level moreefficiently. Further, there are 283 associations which cannot be ranked into any of thecategories. [Fürcht, 1998]
Multipurpose cooperation amongst the same LGs is very rare. Though it frequentlyhappens that LGs in the same administration district will make a second or a thirdagreement of association for supplying public services or operating institutions togeth-er. Joint local government offices only represent a common office for the LGs. Legally,it is not appropriate for supplying public services to fulfill local governmental tasksbecause it does not have its own representative body. Consequently, the associationsoperate in a regional structure full of overlapping and dispersion. This means that the econ-omy of size required for efficient supply of tasks is out of the question. A great part of theassociations are nourished by compulsion, which means that during communism theinstitutions were established in the center settlement and were the joint property ofthe member communities. So, these institutions can be maintained only jointly. Theformation of larger and multi purpose associations, especially in regions full of smallvillages, would create an arranged situation. For this to happen, the inducement ofcentral support is necessary.
Despite this, the Act on Association and Cooperation of Local Governments andthe introduction of new types of associations have helped the upswing of local govern-mental cooperation in Hungary. At the same time, because of the deficiencies in theregulations, it is not able to handle the problem of diversity. Some of the questions stillpending are:
• There is no way of introducing an obligatory set up for cooperation in Hunga-ry because the new Constitution has not been accepted yet.
• The legislator has not dealt with the question of the institutionalization ofurban surroundings.
• The participation of private persons is not possible in any type of these asso-ciation.
• The responsibility of performing duties can not be passed to any kind of asso-ciation. If the institution is not able to perform its tasks, members LGs havedirect responsibility.
76
C O N S O L I D A T I O N O R F R A G M E N T A T I O N ?
D F I D – L G I L O C A L G O V E R N M E N T P O L I C Y P A R T N E R S H I P P R O G R A M
• Most of the associations cannot be subject to financing from the national bud-get. So, the LGs can require subsidies from the central budget as the memberof an association and not from the association itself.
(A new type of association, introduced by the modification of Act on Local Gov-ernment, has been the only exception since 1997. An association with a legal personalitycan take over competencies from its members and get subsidies from the state.)
3.3.2 Regional Development Associations19
The first village associations were formed in 1989–1990, in the most underdevelopedpart of the country. Four processes influenced the formation of bottom-up associations:
• improvement of the public administration system;• regional policy and its realization;• other sector policies;• organization of civic associations.
Between 1994–1999, the number of small regional associations doubled. Two mea-sures inspired the formation of the new associations. In 1993–94 a PHARE PilotProgram and, in 1996, the Act on Spatial Development both gave an impetus. Theformation of associations was rapid in counties full of small villages but, thanks to theAct, the associations covered more then 90% of the communities in each county.
The first associations were a mixture of local governmental, business and civicmembers. They formed in a real bottom-up process but without any legal registra-tion or with legal status of social organization. After the 1996 Act, only associationswith LG members were considered by the state and many former associations had tochange their legal form and membership. They have become purely local govern-mental organizations.
Among the different possible legal forms for small regional development organizations,local governmental associations dominate—2/3 of organizations belong to this type.In the eastern part of the country, this number is larger as is the rate of small regionaldevelopment associations working as civic associations (the rate is 1/3). Here, the for-mation of small regional associations occurred a bit earlier and was closer to being amovement. Among organizations set up after 1996, the rate of civic associations is only8% and the form of public corporation is much higher.
The size of small regional associations, in regards to the population and number ofLGs is very different. More than 3/4 of associations contain less than 20 LGs. Only inregions full of small villages do associations have a greater number of LGs.
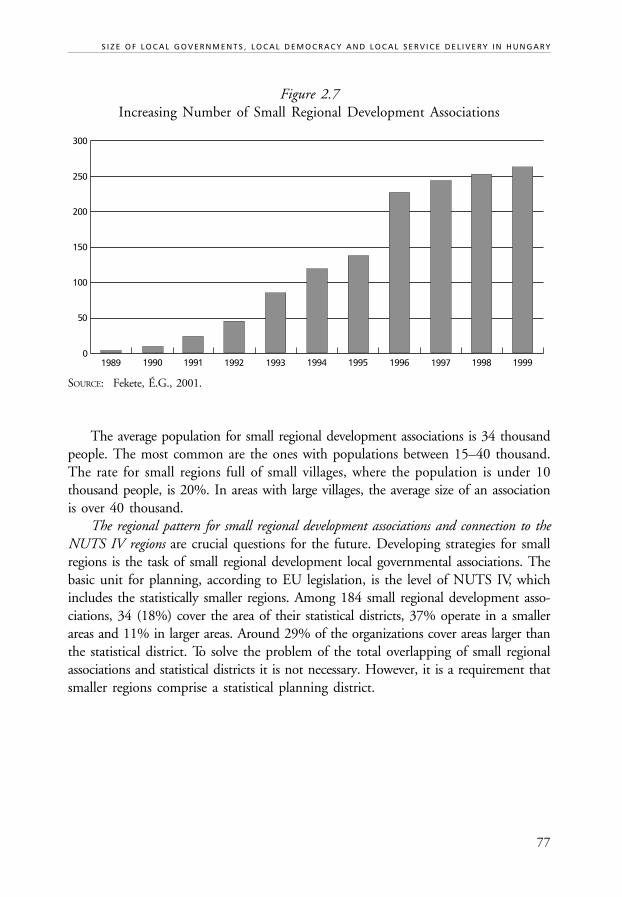
77
S I Z E O F L O C A L G O V E R N M E N T S , L O C A L D E M O C R A C Y A N D L O C A L S E R V I C E D E L I V E R Y I N H U N G A R Y
Figure 2.7Increasing Number of Small Regional Development Associations
SOURCE: Fekete, É.G., 2001.
The average population for small regional development associations is 34 thousandpeople. The most common are the ones with populations between 15–40 thousand.The rate for small regions full of small villages, where the population is under 10thousand people, is 20%. In areas with large villages, the average size of an associationis over 40 thousand.
The regional pattern for small regional development associations and connection to theNUTS IV regions are crucial questions for the future. Developing strategies for smallregions is the task of small regional development local governmental associations. Thebasic unit for planning, according to EU legislation, is the level of NUTS IV, whichincludes the statistically smaller regions. Among 184 small regional development asso-ciations, 34 (18%) cover the area of their statistical districts, 37% operate in a smallerareas and 11% in larger areas. Around 29% of the organizations cover areas larger thanthe statistical district. To solve the problem of the total overlapping of small regionalassociations and statistical districts it is not necessary. However, it is a requirement thatsmaller regions comprise a statistical planning district.
300
1989
250
200
150
100
50
01990 1991 1992 1993 1994 1995 1996 1997 1998 1999
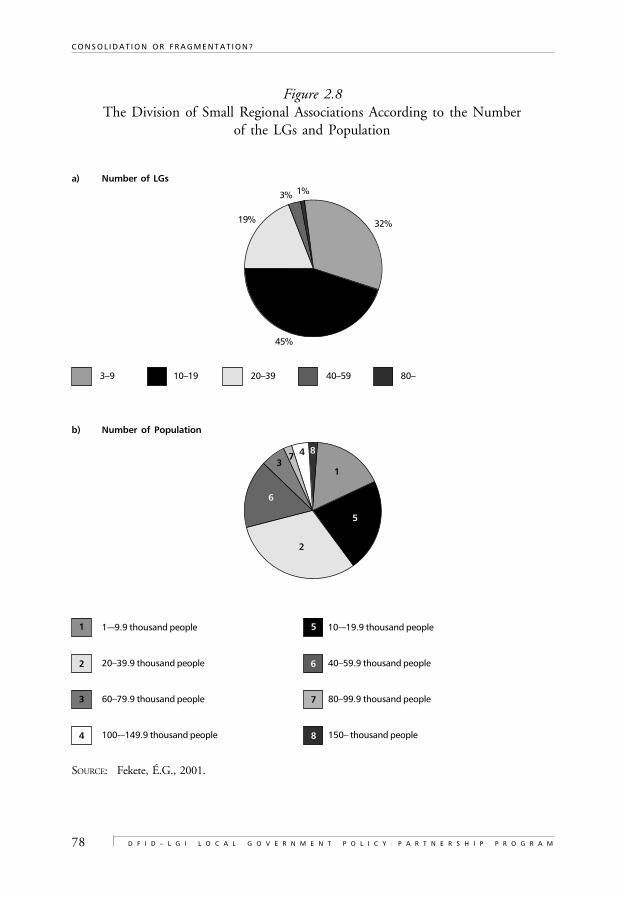
78
C O N S O L I D A T I O N O R F R A G M E N T A T I O N ?
D F I D – L G I L O C A L G O V E R N M E N T P O L I C Y P A R T N E R S H I P P R O G R A M
Figure 2.8The Division of Small Regional Associations According to the Number
of the LGs and Population
a) Number of LGs
3–9 10–19 20–39 40–59 80–
b) Number of Population
1-–9.9 thousand people 10-–19.9 thousand people
20–39.9 thousand people 40–59.9 thousand people
60–79.9 thousand people 80–99.9 thousand people
100-–149.9 thousand people 150– thousand people
SOURCE: Fekete, É.G., 2001.
1
2
3
4
5
6
7
8
45%
19%
3% 1%
32%
1
2
34
5
6
78
79
S I Z E O F L O C A L G O V E R N M E N T S , L O C A L D E M O C R A C Y A N D L O C A L S E R V I C E D E L I V E R Y I N H U N G A R Y
Figure 2.9Spatial Pattern of Small Regional Associations and Related NUTS IV Regions
a) Territory of Small Regional Associations Compared to Territory of Statistical Districts
The same Smaller Larger and smaller Larger Covers more districts
b) Territory of Statistical Districts Compared to Territory of Small Regional Associations
One organization covers the whole area
More organizations cover the whole area
One organization, but crosses the border
More organizations of which a minimum of one cross the border
SOURCE: Fekete, É.G., 2001.
18%
37%
26%
11%
8%
25%
41%
8%
26%
80
C O N S O L I D A T I O N O R F R A G M E N T A T I O N ?
D F I D – L G I L O C A L G O V E R N M E N T P O L I C Y P A R T N E R S H I P P R O G R A M
The rate of small regional associations, which are larger than one statistic districtand belong to two statistical districts, is 68%. This is 18% for those who belong tothree statistical districts. Those organizations belonging to more than four statisticaldistricts are umbrella organizations.
Approaching this from another angle, we can state that in every statistical districtthere is a small regional organization. Of the statistical districts, 25% are completely“all right”, a further 41% contain more than one association, but do not extend pastthe district border. In 34% of statistical districts, the spontaneously organized associ-ations cross the border of the statistical districts.
Between 1996 and 1999, most of the projects fulfilled by smaller regional devel-opment association were the planning and creation of development strategies. Whilean increasing number of associations were established on a territorial basis from theNUTS IV, indirect development activities received priority to direct ones. Infrastruc-ture and tourism development projects greatly stand out among the investment typeprojects while other economic projects have less popularity.
Table 2.19Sector Patterns for Small Regional Projects and Their Tendencies
Number of Finished Number of Projects Future Project/or Ongoing Projects with Prepared Present Project
Feasibility Studies orPlanned in the Future
Forestry 23 70 3.04
Quality Control 54 161 2.98
Food Processing 53 139 2.62
Handcrafts 40 94 2.35
Village Renewal 139 325 2.34
Innovation, R+D 21 48 2.29
Exploitation of Thermal Water 58 97 1.67
Agriculture 240 398 1.66
Environmental Protection 109 151 1.39
Job-Creation 236 265 1.12
Information Technology 195 203 1.04
Other 52 54 1.04
Industrial Park, Business Zones 94 97 1.03
Education, Training 142 145 1.02
Infrastructure 411 400 0.97
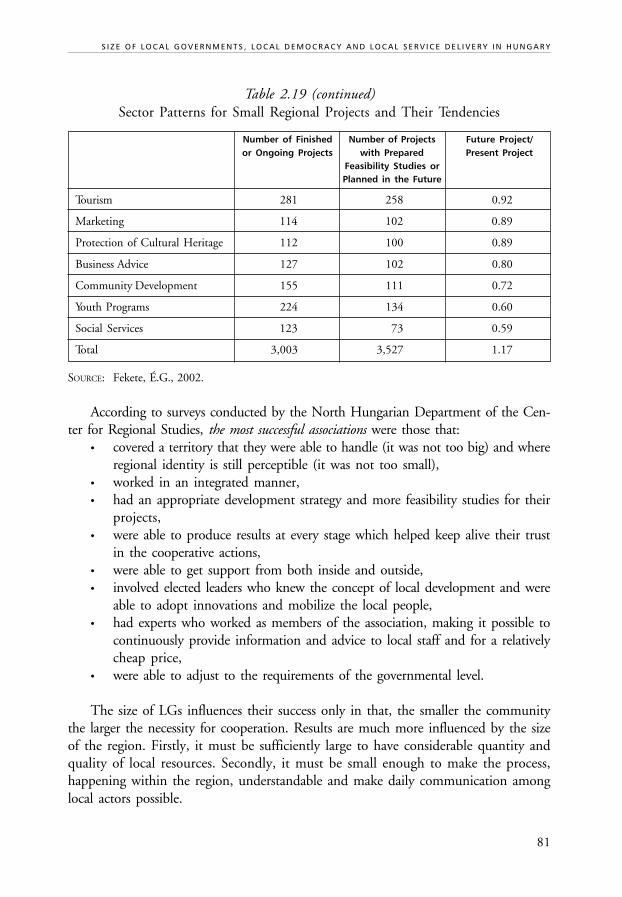
81
S I Z E O F L O C A L G O V E R N M E N T S , L O C A L D E M O C R A C Y A N D L O C A L S E R V I C E D E L I V E R Y I N H U N G A R Y
Table 2.19 (continued)Sector Patterns for Small Regional Projects and Their Tendencies
Number of Finished Number of Projects Future Project/or Ongoing Projects with Prepared Present Project
Feasibility Studies orPlanned in the Future
Tourism 281 258 0.92
Marketing 114 102 0.89
Protection of Cultural Heritage 112 100 0.89
Business Advice 127 102 0.80
Community Development 155 111 0.72
Youth Programs 224 134 0.60
Social Services 123 73 0.59
Total 3,003 3,527 1.17
SOURCE: Fekete, É.G., 2002.
According to surveys conducted by the North Hungarian Department of the Cen-ter for Regional Studies, the most successful associations were those that:
• covered a territory that they were able to handle (it was not too big) and whereregional identity is still perceptible (it was not too small),
• worked in an integrated manner,• had an appropriate development strategy and more feasibility studies for their
projects,• were able to produce results at every stage which helped keep alive their trust
in the cooperative actions,• were able to get support from both inside and outside,• involved elected leaders who knew the concept of local development and were
able to adopt innovations and mobilize the local people,• had experts who worked as members of the association, making it possible to
continuously provide information and advice to local staff and for a relativelycheap price,
• were able to adjust to the requirements of the governmental level.
The size of LGs influences their success only in that, the smaller the communitythe larger the necessity for cooperation. Results are much more influenced by the sizeof the region. Firstly, it must be sufficiently large to have considerable quantity andquality of local resources. Secondly, it must be small enough to make the process,happening within the region, understandable and make daily communication amonglocal actors possible.
82
C O N S O L I D A T I O N O R F R A G M E N T A T I O N ?
D F I D – L G I L O C A L G O V E R N M E N T P O L I C Y P A R T N E R S H I P P R O G R A M
3.4 The Ability and Means of the Central Government to HandleDiversity in Local Administration
The policy of the central government to induce formation of associations is hamperedby two factors. For one, there is no precise information about the intensity and struc-ture of associations, especially in the case of public services. Yet, since 1994 there hasbeen a regulation in the Act on Local Governments that stipulates associations can beendeavored by financial means. Still, a comprehensive governmental subsidy system isimpeded by the idea that legislation for the different sectors must point out thoseactivities that are practical for associations to apply and only after this may these activ-ities be subsidized.
According to this, education and social sectors use more financial subsidies tomotivate cooperation between LGs. In the case of elementary schools and child care,extra financial support is available if they are operated by associations, but they mustonly work in forms determined by the law. Consequently, in last few years, new asso-ciations were formed only in these two sectors. Unfortunately, the preferences of statepolicy are confused. Subsidies for LGs with small populations and without association com-pete with the above mentioned extra subsidies given to associations. For example, in theeducation sector within Baranya County during 2000, LGs received 2.8 times moresupplementary subsidies because of size rather than because of their operating in asso-ciation. There is no professional or efficiency criterion that should be necessary forreceiving financial support.
One of the basic requirements for cooperation and joint running of public institu-tions is accessibility. School buses may increase better commute to joint schools. The CGpromoted buying school buses during the mid-1990s. Utilizing this incentive, mu-nicipalities bought 128 school buses in 1996. This amount provides services for onequarter of the joint school associations and effected 304 LGs. However, the grant wasonly offered for investment. Municipalities have experienced a lot of difficulty in main-taining the service. They needed support for the running expenditure of the schoolbuses too. Instead of extension of support, the CG stopped this kind of incentive.[Halász, 2000]
Delegation of competencies to district centers is a tool for the state, but it canincrease the efficiency only of public administration. The district centers obtain sup-plementary subsidies also. We mention here again the differentiated subsidy system forjoint LG offices.
In Hungary, there is a kind of financial support handling the issue of LGs that,through no fault of their own, get into a critical financial situation. One of the keyselection criteria for applicant LGs is their use of the potential capacity of local publicfacilities (such as kindergartens or schools). The regulation gives different requirementsfor municipalities above and below 3,000 inhabitants. For the former, the rate of use
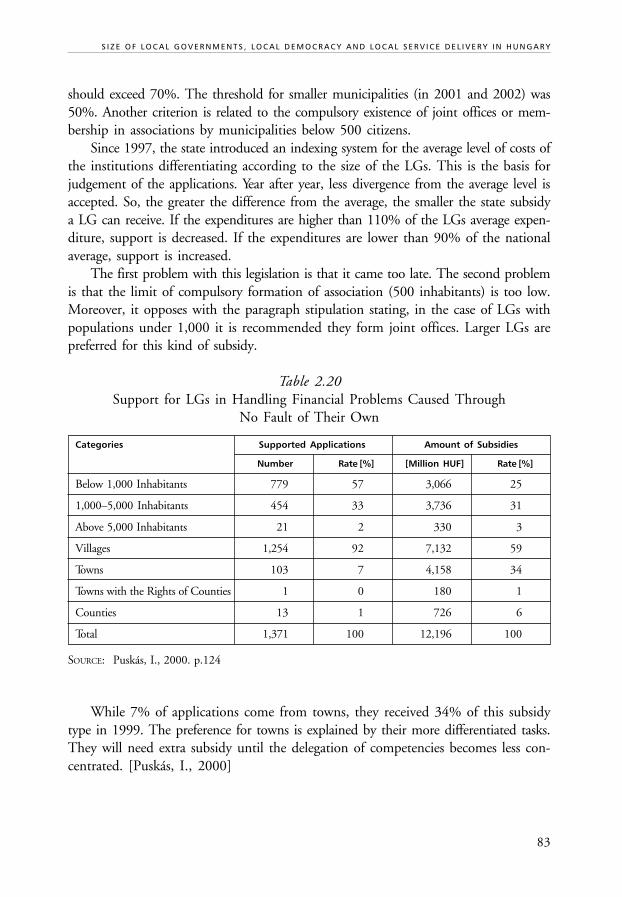
83
S I Z E O F L O C A L G O V E R N M E N T S , L O C A L D E M O C R A C Y A N D L O C A L S E R V I C E D E L I V E R Y I N H U N G A R Y
should exceed 70%. The threshold for smaller municipalities (in 2001 and 2002) was50%. Another criterion is related to the compulsory existence of joint offices or mem-bership in associations by municipalities below 500 citizens.
Since 1997, the state introduced an indexing system for the average level of costs ofthe institutions differentiating according to the size of the LGs. This is the basis forjudgement of the applications. Year after year, less divergence from the average level isaccepted. So, the greater the difference from the average, the smaller the state subsidya LG can receive. If the expenditures are higher than 110% of the LGs average expen-diture, support is decreased. If the expenditures are lower than 90% of the nationalaverage, support is increased.
The first problem with this legislation is that it came too late. The second problemis that the limit of compulsory formation of association (500 inhabitants) is too low.Moreover, it opposes with the paragraph stipulation stating, in the case of LGs withpopulations under 1,000 it is recommended they form joint offices. Larger LGs arepreferred for this kind of subsidy.
Table 2.20Support for LGs in Handling Financial Problems Caused Through
No Fault of Their Own
Categories Supported Applications Amount of Subsidies
Number Rate [%] [Million HUF] Rate [%]
Below 1,000 Inhabitants 779 57 3,066 25
1,000–5,000 Inhabitants 454 33 3,736 31
Above 5,000 Inhabitants 21 2 330 3
Villages 1,254 92 7,132 59
Towns 103 7 4,158 34
Towns with the Rights of Counties 1 0 180 1
Counties 13 1 726 6
Total 1,371 100 12,196 100
SOURCE: Puskás, I., 2000. p.124
While 7% of applications come from towns, they received 34% of this subsidytype in 1999. The preference for towns is explained by their more differentiated tasks.They will need extra subsidy until the delegation of competencies becomes less con-centrated. [Puskás, I., 2000]
84
C O N S O L I D A T I O N O R F R A G M E N T A T I O N ?
D F I D – L G I L O C A L G O V E R N M E N T P O L I C Y P A R T N E R S H I P P R O G R A M
4. SUMMARY OF THE DEBATES AND SUGGESTIONSREGARDING THE SIZE OF LOCAL GOVERNMENTSAND THE CONFLICTS THAT EMERGED FROM FRAGMENTATION
4.1 Suggestions for Slowing Down Fragmentation and Creatingan Optimal Pattern for LGs in Regards to Their Size
Suggestions for the criteria for establishing a new LG are based on the legal philoso-phy stating that, during the second decade of the new local governmental system inHungary, the reference to the forced amalgamation of communities during the com-munist era provides no reason to split up any more LGs. Establishment of a new LGmust meet serious requirements in order to hamper further fragmentation of the localgovernmental system.
A dialogue on the issue, prepared by the Ministry of the Interior (2001), summa-rizes the possible ways to develop LGs. The opinions represented in this paper’s debatedeal with this question. According to the paper: The precise content for the right toestablish LGs must be determined by the Constitution. The rights that entitle everyvoter in every local community are the following:
• the right to directly elect their representative body and mayor;• the right for referendum;• the right to own property, their own budget, state subsidies and local taxes;• the right to decide on and regulate local public affairs.
Despite these, the tasks and authorities of LGs must be differentiated and deter-mined according to their potential.
Nevertheless, it is necessary to decrease the fragmentation of LGs. For instance,small areas where located businesses with huge incomes are not allowed to separatefrom their town and form a new LG. The solution for the LGs with declining popula-tions and weak self- governing potential is to join another LG. There is a belief that theformation of a common representative body should only be induced in areas with afulltime mayor with a population limit of 1,000, this later became 1,500 inhabitants.
The opinions connecting to the official opinion further strengthen the sugges-tions. [Debate About the Local..., 2001] The right to establish an LG is considered asignificant achievement but, again, the opinion is that those under a certain popula-tion size should not be able to establish an independent LG, only a joint representativebody. The paper prepared by the Ministry of the Interior, suggests the minimumlimit should be 1,000 inhabitants but others consider this too high, suggesting theminimum be 500 inhabitants. In order to strengthen local identity, the category ofjoint LGs would be extended to some districts of towns that possess their own identity.
85
S I Z E O F L O C A L G O V E R N M E N T S , L O C A L D E M O C R A C Y A N D L O C A L S E R V I C E D E L I V E R Y I N H U N G A R Y
Others emphasize the necessity of differentiated provision of tasks and authorities ac-cording to the size of LG. For example, it would be possible to differentiate betweenvillages with a population between 500–1,000, over 1,000, small towns and largetowns.
The compulsory formation of joint offices above 1,000 or 1,500 inhabitants wasalso followed by debate. However, more opinions were in favor of it rather than againstit. Besides the minimum population limit, it was necessary to define the maximumnumber of LGs that can join offices. According to experience, the administration of3– 4—according to others, 7—LGs can be performed collectively. [Debate About theLocal..., 2001]
Besides population size, further criteria were drawn up. According to a decision bythe Constitutional Court, the availability of the financial assets necessary to operate anLG cannot be criteria of establishment of a new LG. According to E. Pfeil (2001), thenew LG should prove the possession of its own institutional background for perform-ing basic and obligatory tasks. So, it should be determined that the LG, that wants tosplit, will be able to perform its future obligatory tasks—accomplished commonlybefore—in to proper degree or will perform them in an other way (i.e. involving theeconomic or social sphere). The other criterion, according to the suggestion, is theverification of the existence of a local society through the presence and strength of civicorganizations in the given communities. Finally, there remains the existing criteria forthe method of property sharing and calculating a budget for the new LG.
4.2 Amalgamation, Political Integration and Functional Cooperation
No one in Hungary considers amalgamation of LGs as a political alternative. Onereason for this is that the strained rigidity of the formation of districts is still living inthe memories of the people. In spite of this, the opinion that larger local governmentalunits should be created annually reappears. This is especially in the case of providingphysical public services (like transportation, water supply, waste handling) and repre-senting territorial interests on higher levels. The opinions against it emphasize that thedifferent services have different optimal spatial units and the amount of money saved—as these are the smallest LGs is not significant. [Hermann Z., Horváth, M.T., PéteriG., and Ungvári G., 1998] The strongest barrier for amalgamations, which entailsdisappearance of settlement names, is increasing local identity. This is why, in thepresent reform of the public administration, value is placed on local communitiesstaying in the center of the LGs system and this value must be preserved.
For the formation of a common representative body, this means political integra-tion,20 the situation has also not matured. Only in special cases are LG’s willing to giveup their autonomy. Although legislation made the formation of common representa-
86
C O N S O L I D A T I O N O R F R A G M E N T A T I O N ?
D F I D – L G I L O C A L G O V E R N M E N T P O L I C Y P A R T N E R S H I P P R O G R A M
tive body possible, there are rarely any examples of it. Despite this, the integrationconcepts are formed during the conception of the public administration reform.
The most realistic type of integration is to strengthen LGs functional associations.In Hungary today, there are more than 200 small regional spatial development associ-ations and thousands of other local governmental (administrative) associations operatingat a small regional level. The situation is more confusing if we consider that the role ofsmall regions in the vertical system is unclear and relationships at the community leveland within the regions are not regulated. This confusing situation is the result of apermanent adjustment to small regional organizations according to the actual redistri-bution policy. The most chaotic characteristics of the system: 1. the mixture of functionsand authorities at both the vertical and horizontal level, 2. spatial patterns that do notmatch each other. Consequently, these two problems must be solved in order to strength-en functional integration between LGs.
There is a suggestion to form the state policies that will introduce and expand onthe models of multipurpose associations. These multipurpose associations could guar-antee transmission of a more integrated local development policy and efficient operationof public services, organized over a bigger territorial base and achieving higher qual-ity than currently. The supported model of associations should fulfil criteria such asthe following:
• established by a minimum of 3 and a maximum of 10 LGs;• population size within their territory should be higher than 2,000;• they are engaged in basic education, social care, maintaining local roads, han-
dling waste materials, settlement development and zoning.
Subsidies for distribution of services should based upon a cost-benefit analysisdetermined according to the action plan for development of the public administration.
According to some, local governmental competencies should be reorganized intoseparated organizations (local governmental associations), each with the same au-thority as authorized to the LGs themselves for the given task. Others think that thisis an infringement on governmental autonomy and do not agree with this solution.The law has closed this dispute. Since 1997, the modified Act on Local Governmentsnow provides the opportunity for local governments to delegate competencies totheir associations and the Act on Association of LGs makes it possible to form associ-ations with the inclusion of a legal personality. This legal person may have propertiesand undertake any obligation in order to implement its tasks and provide services toits member communities. Its decision maker body is the associative council. [Fürcht,P., 1998]
87
S I Z E O F L O C A L G O V E R N M E N T S , L O C A L D E M O C R A C Y A N D L O C A L S E R V I C E D E L I V E R Y I N H U N G A R Y
4.3 Voluntary and Forced Formation of Associations
The idea of obligatory formation of associations emerged in regards to joint LG offices.During the former parliamentary cycle (1994–98), a proposal on alterations of theConstitution was prepared. This was ultimately refused by Parliament. This proposalincluded creation of an institution of obligatory joint offices. For their introduction, amodification of the Constitution is necessary. According to the paper, produced by theMinistry of the Interior in 2001, the formation of joint offices would be compulsory,firstly under 1,000 inhabitants, later under 1,500 inhabitants and the possibility toemploy a full time mayor would be connected to the joint offices. Beside this, thecompulsory formation of association was considered possible in case of certain obliga-tory tasks financed by central budget.
There is agreement on the necessity of LG stimulation to form larger suppliedareas but indirect means are preferred. Such indirect stimulation can be as follows:
• normative subsidies according to village population in relation to the town oraccording to the number of inhabitants supplied;
• more significant and complex subsidization of multipurpose associations.
The principles of voluntary versus obligatory formation of associations are not to-tally exclusive. The voluntary principle can be considered the main rule but theobligatory principle, requiring a two-third majority decision, within the legislationcan be applied in a few cases too. [Fürcht, P., 1998]
4.4 One and Multicolor Patterns of Association
There is a debate about the question of whether simplification of local governmentalintegration, by creating one organization responsible for all common tasks, is an achiev-able and correct solution. This type of organization would improve the comprehensiblearrangement for a spatial system of task provisions. Still, it is recognized that differenttasks have different spatial divisions. What is more, these change over time. Moreover,besides LGs, other actors are emerging both in local services and in local develop-ment. Public-private partnerships require small regional institutions, more then publicadministration. It is clear, that local governmental associations, or de-concentratedstate organizations, are not able to undertake tasks organized by small regional devel-opment associations in a bottom-up process and based on wide social participation.Nor can they integrate economic and civic actors in order to mobilize local resourcesfor local development. They are not able to manage integrated local development, inthe first instance, due to their purely local governmental membership and, in the
88
C O N S O L I D A T I O N O R F R A G M E N T A T I O N ?
D F I D – L G I L O C A L G O V E R N M E N T P O L I C Y P A R T N E R S H I P P R O G R A M
second instance, because of the waning interest of the state and its bureaucraticmanner. State governmental, self-governmental integrated associations and develop-ment action groups are also necessary for effective development. A flexible systeminvolving more types of organizations is needed. They might form a multicolorpattern of associations, which means more types of associations with several purposes,more types of LGs and those including, not only LGs, but private persons and busi-nesses as well.
There is an interesting pilot project managed by the local governmental develop-ment association for the town of Siklos and its surrounding communities. Within thisproject, a complex small regional public-service system is under formation. They setup an organizational and operational framework for collective performance of regionaldevelopment, economic development and public administration tasks as well as mak-ing a pioneer attempt to unify administrative and regional development associationsworking in the same small region. [Csefkó F., 2001]
It is an important element lacking in the present legislation that no form ofassociation has been made suitable to receive members of the private sphere, such asrepresentatives of civic organizations or businesses. This critique is made especially inregards to associations with a legal entity being financed by the central budget. Thesituation of local development associations acting outside the Act of Local Govern-ments is rather problematic, since the principle of partnership should be determinantin their operation. It can be useful to consider the admission of social and economicplayers into local governmental associations based on public law, since getting undersocial and state control would become suitable for functions not exploited before.The limited admission of chambers, economic associations and civic organizationsinto certain types of associations should happen while maintaining the dominance ofthe public sphere. In this regard, it is a frequently attempted method in WesternEurope to allow private actors or representatives to possess a maximum two-fifth ofthe votes.
4.5 Differential Delegation of Competencies and Financing
Every function allotted to local governments has a geographical attractive zone, i.e. thezone influenced by the settlement as a “central place” for the area. Presently in Hungary,these zones have been reduced to the level of local communities or counties.
Revision of the issuing of tasks and authority is a general requirement for expertsdealing with this topic. Beyond raising the questions about task sharing between thestate and the LGs [Csefkó, 2000; Kara, 1999], there is a central question on tasksharing amongst LGs: Differentiation of delegation of competencies and financingwould be possible according to the Act on Local Governments, but it is rarely used in
89
S I Z E O F L O C A L G O V E R N M E N T S , L O C A L D E M O C R A C Y A N D L O C A L S E R V I C E D E L I V E R Y I N H U N G A R Y
practice. The concept of differentiation of competency delegation and financing offers,to form a more sophisticated system where different functions have different geograph-ical attractive zones based on size. Bigger units get the power and tools (from the state)to provide services for smaller ones. In this case, LGs in the service centers are respon-sible for the smaller units, too. Of course, we speak only about obligatory tasks. In thecase of optional tasks, the local government should decide to maintain its own instituteor create association with others. (In this instance, inhabitants living in smaller unitsmay miss those services.)
P. Fürcht (2000) suggests differentiating between LGs in towns and villages whentheir competencies and public tasks are delegated. According to him, village govern-ment must provide the public services that are necessary for living there (roads, healthydrinking water, public light, electricity, gas works, and local administration for dailylife, etc.) For other services sector models should be worked out. According to this,there can be three types of task-delegation:
• local provision of tasks, where population and capacity make it possible;• provision of tasks through LG associations (voluntary or, if the Constitution
makes it possible, in the case of certain obligatory public services, compulsoryones);
• through towns, in case the town supplies services for the surrounding commu-nities according to the sector model. (In this case, towns would get financialresources directly from the central budget or the villages would contribute tofunds under a contract that guarantees accountability. Both individual LGsand their association could be the contracting partner of the town.)
By allotting public services to the towns, 65% of the whole population obtainsthe services locally and an additional 35% living in nearby villages. [Fürcht, P., 2000.p.536]
J. Németh (1999) considers the role of the cooperation of neighboring villages(these can be define as micro-regions) very important. Z. Kéki (2000) differentiatesthree types of task and authorities:
1) sham tasks and authorities: These are in the Act of Local Governments, butnever supplied because of lack of demand, financial resources, or other possi-bilities based on the size of the LG. (For example: provision of new flats, publictransport, fire protection, public security, financing scientific public social, artand sport activities);
2) tasks and authorities without means: These are provided, but not by the LGitself, rather by other actors; (for example: nursery schools, primary schoolsand health care)
3) wandering tasks and authorities: These can be transferred to the county gov-ernment; (for example: secondary schools, hospitals)
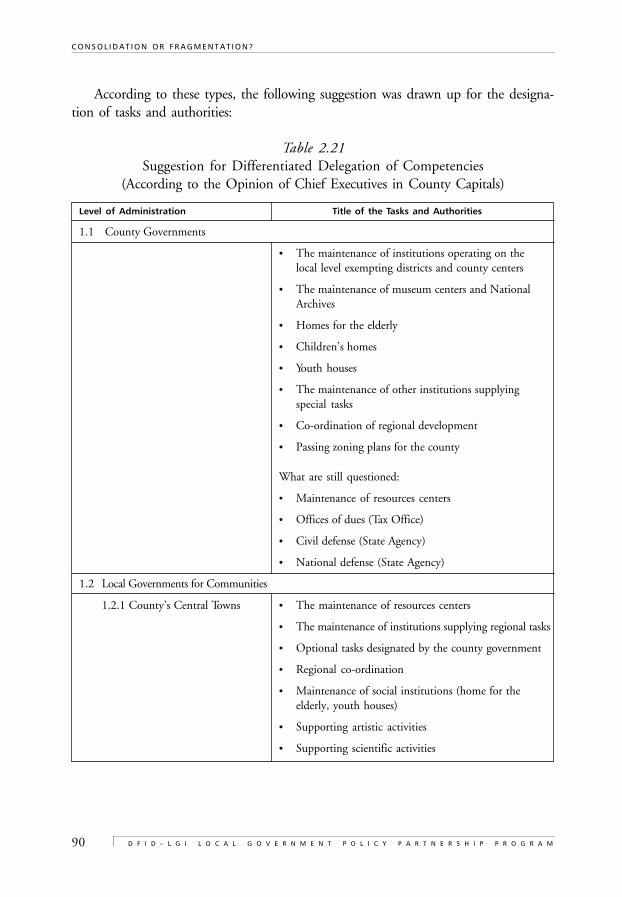
90
C O N S O L I D A T I O N O R F R A G M E N T A T I O N ?
D F I D – L G I L O C A L G O V E R N M E N T P O L I C Y P A R T N E R S H I P P R O G R A M
According to these types, the following suggestion was drawn up for the designa-tion of tasks and authorities:
Table 2.21Suggestion for Differentiated Delegation of Competencies
(According to the Opinion of Chief Executives in County Capitals)
Level of Administration Title of the Tasks and Authorities
1.1 County Governments
• The maintenance of institutions operating on thelocal level exempting districts and county centers
• The maintenance of museum centers and NationalArchives
• Homes for the elderly
• Children’s homes
• Youth houses
• The maintenance of other institutions supplyingspecial tasks
• Co-ordination of regional development
• Passing zoning plans for the county
What are still questioned:
• Maintenance of resources centers
• Offices of dues (Tax Office)
• Civil defense (State Agency)
• National defense (State Agency)
1.2 Local Governments for Communities
1.2.1 County’s Central Towns • The maintenance of resources centers
• The maintenance of institutions supplying regional tasks
• Optional tasks designated by the county government
• Regional co-ordination
• Maintenance of social institutions (home for theelderly, youth houses)
• Supporting artistic activities
• Supporting scientific activities
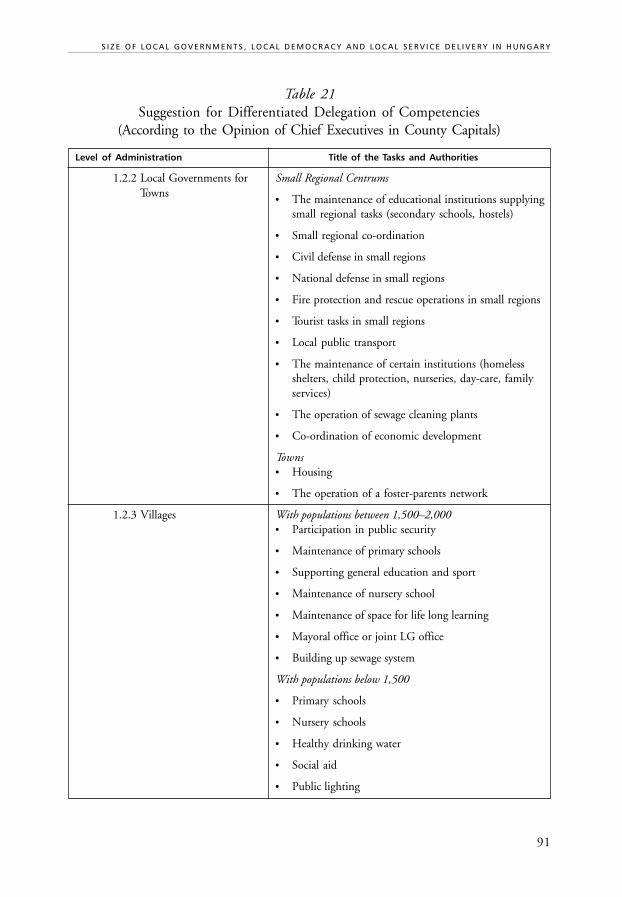
91
S I Z E O F L O C A L G O V E R N M E N T S , L O C A L D E M O C R A C Y A N D L O C A L S E R V I C E D E L I V E R Y I N H U N G A R Y
Table 21Suggestion for Differentiated Delegation of Competencies
(According to the Opinion of Chief Executives in County Capitals)
Level of Administration Title of the Tasks and Authorities
1.2.2 Local Governments for Small Regional Centrums
Towns• The maintenance of educational institutions supplying
small regional tasks (secondary schools, hostels)
• Small regional co-ordination
• Civil defense in small regions
• National defense in small regions
• Fire protection and rescue operations in small regions
• Tourist tasks in small regions
• Local public transport
• The maintenance of certain institutions (homelessshelters, child protection, nurseries, day-care, familyservices)
• The operation of sewage cleaning plants
• Co-ordination of economic development
Towns• Housing
• The operation of a foster-parents network
1.2.3 Villages With populations between 1,500–2,000• Participation in public security
• Maintenance of primary schools
• Supporting general education and sport
• Maintenance of nursery school
• Maintenance of space for life long learning
• Mayoral office or joint LG office
• Building up sewage system
With populations below 1,500
• Primary schools
• Nursery schools
• Healthy drinking water
• Social aid
• Public lighting
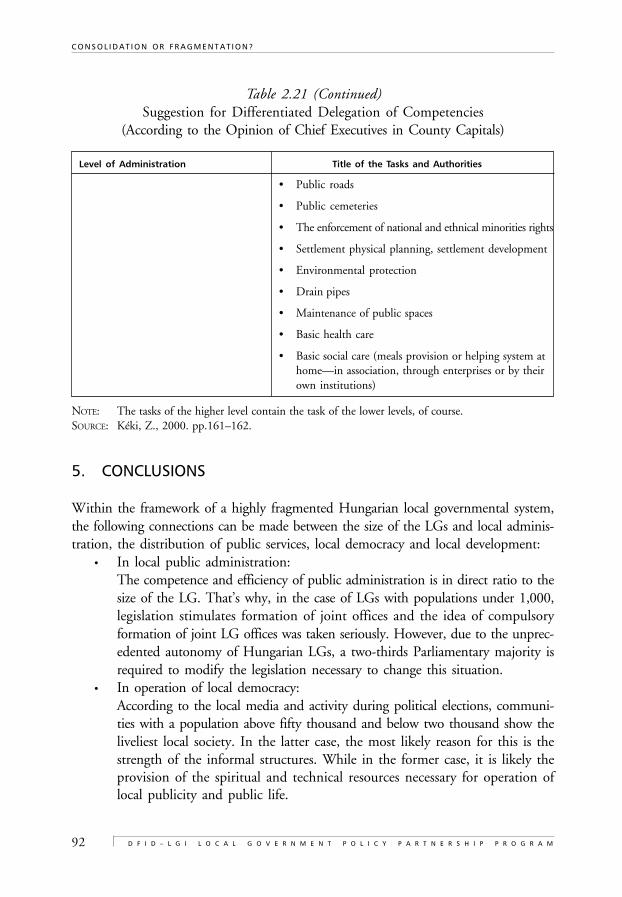
92
C O N S O L I D A T I O N O R F R A G M E N T A T I O N ?
D F I D – L G I L O C A L G O V E R N M E N T P O L I C Y P A R T N E R S H I P P R O G R A M
Table 2.21 (Continued)Suggestion for Differentiated Delegation of Competencies
(According to the Opinion of Chief Executives in County Capitals)
Level of Administration Title of the Tasks and Authorities
• Public roads
• Public cemeteries
• The enforcement of national and ethnical minorities rights
• Settlement physical planning, settlement development
• Environmental protection
• Drain pipes
• Maintenance of public spaces
• Basic health care
• Basic social care (meals provision or helping system athome—in association, through enterprises or by theirown institutions)
NOTE: The tasks of the higher level contain the task of the lower levels, of course.SOURCE: Kéki, Z., 2000. pp.161–162.
5. CONCLUSIONS
Within the framework of a highly fragmented Hungarian local governmental system,the following connections can be made between the size of the LGs and local adminis-tration, the distribution of public services, local democracy and local development:
• In local public administration:The competence and efficiency of public administration is in direct ratio to thesize of the LG. That’s why, in the case of LGs with populations under 1,000,legislation stimulates formation of joint offices and the idea of compulsoryformation of joint LG offices was taken seriously. However, due to the unprec-edented autonomy of Hungarian LGs, a two-thirds Parliamentary majority isrequired to modify the legislation necessary to change this situation.
• In operation of local democracy:According to the local media and activity during political elections, communi-ties with a population above fifty thousand and below two thousand show theliveliest local society. In the latter case, the most likely reason for this is thestrength of the informal structures. While in the former case, it is likely theprovision of the spiritual and technical resources necessary for operation oflocal publicity and public life.
93
S I Z E O F L O C A L G O V E R N M E N T S , L O C A L D E M O C R A C Y A N D L O C A L S E R V I C E D E L I V E R Y I N H U N G A R Y
• In the provision of local public services:The principle of economy of size prevails in the case of public services. Due tothe enormously high rate of wage-cost for services, the efficiency of the servicesdepends on the number of people supplied and it changes in direct ratio to that.
• In local development:The factor influencing local development, rather than the size of the LG, is thelocation and distance from the core of regional development and the level ofregional development. Directly after the political changes, development activ-ity in the smaller LGs was stronger than in larger ones. This can be explainedby the “compensation” of the infrastructure developments which formerly hadnot occurred.
Today, it is widely accepted that the fragmentation of the local development sys-tem has hampered the taking of further steps. Demands for public services remainunsatisfied in certain areas while, in other areas, solutions leading to the waste of re-sources were carried out. But the formation of common LGs, for political reasons,cannot be the solution. Attention has turned toward associations. For these, there arereasons for both the obligatory as well as the voluntary associations. Besides the stimu-lation of associations and, in certain cases, the enforcement of them, the most importantfuture duties are creating more strict legislation for formation of new LGs, the differ-entiated delegation of local governmental competencies and the geographical harmoniza-tion of public administrative spatial units. Suggestions summarized in section IV arerelated to the following propositions for these problems:
1) Give up the strong attachment to locality and settlement boundaries in orderto find an optimal territorial framework for local services, local society and localdevelopment. In many terms, small regions function as a locality.
2) Harmonize the spatial division of top-down districts and bottom-up associa-tions based on regional identity, but it should not mean unification. Territoriesof several organizations and the statistical districts should fit but not necessar-ily be equal to one another.
3) Because of the extremely large size of statistical smaller regions with big cities(especially county capitals), there is a need for typology which should be thebasis for programming and redistribution of financial resources.
4) Create criteria for establishing new LGs connected to population size (morethen the presently required 300 inhabitants) and some additional indicators(capacities, civic organizations ...). However, it should be kept in mind thateven the authors of this proposal do not agree on the extension of these criteriato existing LGs.
5) Compulsory formation of joint offices and provision of a full time mayor onlyto populations above 1,000 or 1,500 inhabitants and as would be necessary.This is included in the national plan for developing public administration.
94
C O N S O L I D A T I O N O R F R A G M E N T A T I O N ?
D F I D – L G I L O C A L G O V E R N M E N T P O L I C Y P A R T N E R S H I P P R O G R A M
6) Strengthen the functional associations of LGs: clear functions and authoritieson both vertical and horizontal levels, spatial patterns that fit to each other.
7) Form a state policy to introduce and extend the models of multipurposeassociations.
8) Create normative subsidies for provision of small regional services. For exam-ple, according to village population in relation to its town or according to thenumber of inhabitants supplied
9) State governmental, integrated self-governmental associations and develop-ment action groups should all be taken into consideration and develop aflexible system for them.
10) Involve the representatives of local, social, and economic spheres in smallregional associations in order to encourage partnership development.
11) Delegate different competencies and functions to different sized communities12) The Local Government Act defines cities with county rights as a type of local
government. Instead of a separate entity for such municipalities, there is aneed to formulate rules for cooperation between bigger cities and their sur-roundings. Legislation should deal with this issue.
13) In some areas, such as regional development, legislation should accept awider concept of cooperation between localities. Beside municipalities, localcitizens, civil organizations and enterprises should be allowed to join rele-vant local associations.
REFERENCES
ACIR (1974). Governmental Functions and Processes: Local and Area Wide. AdvisoryCom-mission on Intergovernmental Relations, A–45. Washington DC.
Gergely, A. (1993). Urbanizált méhkas, avagy a helyi társadalom. Budapest: MTA PolitikaiTudományok Intézete—Akadémiai Kiadó.
Andorka, R. (1997). Bevezetés a szociológiába. Aula Kiadó.
Az Állami Számvevôszék tájékoztatója az önkormányzati feladatellátás szervezeti formáirólés mûködésük célszerûségének ellenôrzésérôl. In Önkormányzati tájékoztató 2000.No. 10, pp.3–34.
Az önkormányzati kötelezô és fakultatív feladatok vizsgálata. (1998). Kutatási Záró-tanulmány. Témavezetô: Csefkó Ferenc Készült a Közigazgatás KorszerûsítésiKormánybiztos megbízásából a MTA Regionális Kutatások Központjában. Pécs.
Barati, I. (2001). “Önkormányzati fejlesztések finanszírozása külsô források bevo-násával”. In Magyar Közigazgatás, LI, No. 9, 2001, pp.531–545.
95
S I Z E O F L O C A L G O V E R N M E N T S , L O C A L D E M O C R A C Y A N D L O C A L S E R V I C E D E L I V E R Y I N H U N G A R Y
Belügyminisztérium Önkormányzati Munkacsoport (2001). “A helyi önkormányzatirendszer fejlesztésének fô irányai” (Munkaközi szakmai anyag). In Magyar Köz-igazgatás, LI, No. 3, March 2001, pp.138–145.
Bódi, F. (1992). “Az önkormányzatok vállalkozásai és vállalkozástámogató politikájaBAZ megyében”. Területi kutatások BAZ megyében 2. MTA RKK ÉMO.
Bozóki, A. (1999). A rendszerváltás forgatókönyve. Issue IV. Magvetô Kiadó, 1–588.pp.
Bôhm, A., Gazsó, F., Stumpf, I., and Szoboszlai, Gy. (2000). Parlamenti választások—1998. MTA Politikai Tudományok Intézete, Századvég Kiadó, 1–714.pp.
Cappellin, R. (1990). Theories of Local Indigenous Development and InternationalCooperation. Paper presented to a European Workshop on International cooperationand development in the European fringe areas. Joensuu, Finland.
Csatári, B. (1999). A falvak térkapcsolatai és fejlesztési lehetôségei 1986–1990. Jász-Nagykun-Szolnok és Bács-Kiskun megyei vizsgálatok, kutatási jelentések. Kecskemét: MTARKK ATI. Manuscript.
Csatári, B. (1989). A Tiszazug kistérségi problémái. Kecskemét: MTA RKK ATI.Manuscript.
Csatári, B. (1999). Az identitás földrajzi térelemei. Pálné Kovács Ilona (Ed.) (1999).Pécs: MTA Stratégiai Kutatások, MTA RKK. Manuscript.
Csefkó F. (2000). “A települések differenciált hatásköri rendje kialakításának elvialapjai (I.)”. In Magyar Közigazgatás, L, No. 2, 2000, pp.66–82.
Csefkó F. (2001). Kistérségfejlesztési–közszolgáltatási stratégiai program. (Vitatézisek).In Magyar Közigazgatás, LI, No. 3, 2001, pp.184–186.
Csepeli, Gy. (1992). Nemzet által homályosan. Századvég Kiadó.
Damskis, H. (1993). Zur Entwicklung der kommunalen Gebietsreform in den neuenBundes-ländern. Berlin: Deutsches Institut für Urbanistik.
Debate About the Local... (Vita a helyi önkormányzati rendszer fejlesztésérôl). InMagyar Közigazgatás, LI, No. 9, 2001, pp.513–530.
Dessewffy, T. (1996). A kedélyes labirintus. Multikulturalizmus és posztkommuniz-mus. In Kritika 12, 1996.
Enyedi, Gy. (1991). A lokalitás szerepe a modern társadalmakban. In Juss 4, 1991.
Enyedi, Gy. (1996). Regionális folyamatok Magyarországon. Ember–Település–Régió.Budapest.
Eros, F. (1996). Azonosság és különbözôség. Scientia Humana, 1996.
Finta, I., Pálné Kovács, I., and Pfeil, E. (2001). Közigazgatási alapok. Budapest:Unió Lap- és Könyvkiadó.
96
C O N S O L I D A T I O N O R F R A G M E N T A T I O N ?
D F I D – L G I L O C A L G O V E R N M E N T P O L I C Y P A R T N E R S H I P P R O G R A M
Fürcht, P. (2000). A településközi együttmûködés egyes kérdései. In Magyar Közigaz-gatás, L, No. 9, 2000, pp.532–537.
Fürcht. P. (1998). Az önkormányzati társulási törvényeirôl. In Magyar Közigazgatás,XLVIII, No. 3, 1998, pp.151–157.
Fekete, É.G. (2001). Együtt!—De hogyan? Innovációk a kistérségi fejlesztésekben. Pécs–Miskolc: MTA RKK.
Fekete, É.G. (2002). A kistérségi fejlesztô szervezetek információs helyzete. (Manuscript).
Halász, G. (2000). “A közigazgatás továbbfejlesztése és a közoktatás: a településekközötti együttmûködés kérdései”. In Helyi önállóság és önkormányzati feladatok.Közigazgatás-fejlesztési füzetek 1. “Helyi önkormányzati know-how program”—Miniszterelnöki Hivatal Közigazgatás- és Területpolitikai Államtitkárság. Budapest,2000, pp.37–51. (Reforming Public Administration and the Public Education:Questions of Partnership among Local Governments).
Hamar, A., and Szoboszlai, Zs. (1998). A Széchenyi lakótelep szociológiai vizsgálata,Szolnok: MTA RKK ATI, pp.1–75.
Hankiss, E. (1983). Közösségek válsága és hiánya, in Társadalmi csapdák—Diagnózisok,Budapest: Magvetô Könyvkiadó.
Haveri, A. (1994). On Adaptive and Strategic Behavior of Local Level Communities.Acta Universitatis Tamperensis, Ser A, Vol. 393, 1994.
Hegedûs, L. (1993). A megye országgyûlési képviselôjelöltjei. Jász-Nagykun-Szolnokmegyei statisztikai tájékoztató, 1998/3, 1993, pp.82–88.
Hermann, Z., Horváth, T., Péteri, G., and Ungvári, G. (1998). “Önkormányzatifeladat-telepítés szempontjai és feltételei”. Fiscal Decentralization Initiative forCentral and Eastern Europe. Strasbourg/Paris/Washington: Fiscal Decentralizationof the Council of Europe/OECD/World Bank, 1998 (Principles for Task Divisionof Local Governments).
Horváth, Gy., and Rechnitzer, J. (2000). Magyarország területi szerkezete és folyamataiaz ezred-fordulón. MTA Regionális Kutatások Központja, 1–616.pp.
Horváth M.T., and Péteri, G. (1997). Indulj el egy úton... Költségvetési politika,önkormányzati politika. Manuscript.
Horváth M.T., and Péteri, G. (1993). “Új változatosság. Politikai keretek és gazdálkodásistratégiák az önkormányzatokban”. Budapest: Helyi demokrácia és újítások Ala-pítvány.
Horváth, M.T., and Péteri, G. (Eds.) (1996). Market–Competion–Contracts,Management and Financial Methods in Municipal Services. Nagykovácsi. LocalGovernment Know-how Programme.
97
S I Z E O F L O C A L G O V E R N M E N T S , L O C A L D E M O C R A C Y A N D L O C A L S E R V I C E D E L I V E R Y I N H U N G A R Y
Horváth M.T., and Vági, G. (1991). Magunk, uraim. Budapest: Gondolat.
Jelentés a területi folyamatok alakulásáról ... (2001). Budapest: Váti Kht.
Kara, P. (1999). “Javaslat az önkormányzati és az államigazgatási feladat- és hatáskörökfelülvizsgálatára”. In Magyar Közigazgatás, XLIX, Nos. 1–2, 1999, pp.2–7.
Kara, P., Kilényi, G., Kökényesi, J., and Verebélyi, I. (1983). A városkörnyéki igazgatásirendszer mûködése. Budapest: ÁSZI.
Kéki Z. (2000). “A települések differenciált hatásköri rendje kialakításának elvi alapjai(II.)”. In Magyar Közigazgatás, L, No. 3, 2000, pp.157–165.
Knemeyer, F-L.:Verwaltungs- und Gebietsreformen in den jungen Bundesländern.Die Verwaltung 3, 1993, pp.273–290.
Krappman, L. (1980). Az identitás szociológiai dimenziói, Huszár Tibor and LédererPál (Eds.). Oktatási Minisztérium.
Kusztosné Nyitrai, E. (Ed.) (1998). A helyi önkormányzatok és pénzügyeik. ConsultingCo., Local Governments and Financing Local Governments. Budapest.
Kusztosné Nyirai, E. (Ed.) (1998). A helyi önkormányzatok és pénzügyeik. ConsultingCo., Local Governments and Financing Local Governments. Budapest.
Lados, M., and Rechnitzer, J. “Jövedelemtermelés változásai a megyékben (1980–1985)”. Tervgazdasági Fórum, 1988, Vol. 3, pp.40–53. (Changes on RegionalDifferences of the GDP in Hungary between 1980 and 1985).
Marcou, G., and Verebélyi I. (Ed.) (1993). New Trends in Local Government inWestern and Eastern Europe. Size, Levels and Functions of Local Government.Brussels: International Institute of Administrative Sciences.
Marelyin Kiss, J., and Dénes, A. (2001). Aréna és otthon. Jelenkutató Intézet, pp.1–76).
Murányi, I., and Szoboszlai, Zs. (1999). A szolnoki közvélemény. Szolnok: MTARKK ATI. Manuscript, pp.1–32).
Murányi, I., and Szoboszlai, Zs. (1999). Egy város három része. Szolnok: MTA RKKATI, pp.1–85.
Murányi, I., and Szoboszlai, Zs. (2001). “Identitás jellemzôk a dél-alföldi régióban”.In Tér és Társadalom, 2000/1. pp.27–50.
Murányi, I., and Szoboszlai, Zs. (1998). Ifjúsági életmód és szokásvizsgálat Jász-Nagykun-Szolnok megyében. Szolnok: MTA RKK ATI. Manuscript.
Murányi, I., and Szoboszlai, Zs. (2000). Résztársadalmak. Szolnok: MTA RKKATI, 1–72.
Murányi, I., and Szoboszlai, Zs. (1999). Sikeres városok, magasan, illetve alacsonyanfejlett települések az Alföldön. Szolnok: MTA RKK ATI, Manuscript. pp.1–65).
98
C O N S O L I D A T I O N O R F R A G M E N T A T I O N ?
D F I D – L G I L O C A L G O V E R N M E N T P O L I C Y P A R T N E R S H I P P R O G R A M
Nánásiné Tóth, É. (1996). Kötôdések a városhoz. Kecskemét: MTA RKK ATI,Manuscript.
Nemes Nagy, J. (1998). “A tér a társadalomkutatásban. Bevezetés a regionális tudo-mányba”. Ember—Település—Régió. Budapest: Hirschler Rezsô SzociálpolitikaiEgyesület.
Németh, J. (2001). “A kistérségi (városkörnyéki) közigazgatás és együttmûködésgyakorlata, jövôje”. In Magyar Közigazgatás, LI, No. 1, 2001, pp.4–17.
Németh, J. (1999). “A térségi (városkörnyéki) együttmûködés és igazgatás fejlesztésénekindokai, leheto´´ségei”. In Magyar Közigazgatás, XLIX, Nos. 1–2, 1999, pp.18–28.
Pál, L. (1984). “Kísérlet a ‘helyi társadalom’ dimenzióinak megragadására”. In Helyitársadalom II. Budapest: MSZMP Társadalomtudományi Intézete.
Pálné Kovács, I. (1999). Regionális politika és közigazgatás. Budapest–Pécs: DialógCampus.
Papp, Zs. (2000). “Társulások Hajdú-Bihar megyében”. In Magyar Közigazgatás,No. 11, 2000, pp.674–677.
Péter, J. (1998). Várospolitikai elképzelések komplex vizsgálata Kunhegyesen. Szolnok:MTA RKK ATI, pp.1–48.
Péter, J., and Szarvák, T. (1999). Kisújszállás: város a négyes fôút mentén. Szolnok:MTA RKK ATI, Manuscript, pp.1–44.
Pfeil, E. (2001). “Önkormányzati finanszírozás és térségi szerepkörök”. In TerületiStatisztika, 2001/1, 20001, pp.3–22.
Pitti, Z., and Varga, S. (1995). Az önkormányzatok vagyonosodási folyamata. Budapest:Közgazdasági és Jogi Könyvkiadó. (The Process of Property Ownership of LocalGovernments).
Stern, K. (1968). Grundfragen zur Verwaltungsreform im Stadtumland. Studien zumöffentlichen Recht und zur Verwaltungslehre. Band 7. Verlag Franz Vahlen, Berlinund Frankfurt am Main.
Strasbourg/Paris/Washington: Fiscal Decentralization of the Council of Europe/OECD/World Bank, 1998 (Principles for Task Division of Local Governments)
Szarvák, T. (1997). Egy település megtartó ereje. Társadalmi-kulturális viszonyokNagykörüben. Szolnok: MTA RKK ATI, Manuscript, pp.1–34.
Szarvák, T. (2000). Fót a várossá válás útján. Szolnok: MTA RKK ATI, Manuscript,pp.1–77).
Szigeti, E. (1994). “A körjegyzôségek területi struktúrája”. In Magyar Közigazgatás,No. 10, 1994, pp.609–619.
99
S I Z E O F L O C A L G O V E R N M E N T S , L O C A L D E M O C R A C Y A N D L O C A L S E R V I C E D E L I V E R Y I N H U N G A R Y
Szoboszlai, Zs. (1998). Szociológiai háttérvizsgálat (Gyomaendrôd). Szolnok: MTARKK ATI, Manuscript, pp.1–15). Szolnoki városrészvizsgálatok: 1998, 1999,2000.
Temesi, I. (2000). “Local Government in Hungary”. In Decentralization: Experimentsand Reforms. Horváth, T.M. (ed.) Local Governments in Central and EasternEurope, 2000. Vol.1, pp.343–384.
Tóth, J. (1988). “Urbanizáció az Alföldön”. Területi és Települési Kutatások 3. Budapest:Akadémiai Kiadó.
Vági, G. (1982). Versengés a fejlesztési forrásokért. Budapest: Közgazdasági és JogiKönyvkiadó. (Competition for the Resources of Capital Investment).
Varga, Cs. (1999). “Régiók az információs társadalomban”. A Falu, 1999, XIV, No. 4,pp.53–62.
Verebélyi, I. (2000). Egy évtized önkormányzati mérlege és a jövô kilátásai. MagyarKözigazgatási Intézet–MTA Politikai Tudományok Intézete–MTA RegionálisKutatások Központja, pp.1–320.
Veres, M. (1979). A községi integráció szervezeti-jogi formái. A községi közös tanácsokés a községegyesítések tapasztalatai. Budapest: ÁSZI.
Weber, M. (1970). Állam, politika, tudomány. Budapest: Közgazdasági és Jogi Könyv-kiadó.
Zehetner, F. (Hrsg.) (1982). Reformen der Kommunen und Regionen in Europa.Kommunale Forschung in Österreich 61. Institut für Kommunalwissenschaftenund Umweltschutz. Wien–München: Verlag für Jugend und Volk. p.15, Germany,p.79 Danemark, p.97 Norvegen.
NOTES
1 Constitution of Hungarian Republic.2 Act on Local Governments.3 Act CXXXV of 1997 on Associations and Co-operation among Local Governments.4 See a detailed explanation in chapter III.5 Regional policy wanted to create a stronger city network, which would be able to
absorb migration from the villages and stop the inadequate growth of Budapest.6 Expenditure oriented budgetary planning: The base for planning is the accepted
level of expenditure. Local councils had own revenues. Central government ensuredthe difference of expenditure and own revenues by state grants.
100
C O N S O L I D A T I O N O R F R A G M E N T A T I O N ?
D F I D – L G I L O C A L G O V E R N M E N T P O L I C Y P A R T N E R S H I P P R O G R A M
Revenue oriented budgetary planning: LGs have own revenues, shared revenues, statetransfers allocated on normative base and transfers from other LGs and/or NGOs.LGs have access to credit too. Each LG’s expenditure cannot exceed its total revenue.
7 “a” point of the 5th paragraph of the Act of XXI on Regional Development.8 Act No. III. in 1993 on Social Provision. (Note: Higher categories include all
mandatory functions of lower categories.)9 Act on Local Government 69. §. Paragraphs 1–2.1 0 In villages with more than 5,000 inhabitants the number of kindergartens has
fallen by 40 percent. The real decline is much lower because a major change in thiscategory has occured from the changed position of 40 villages (one third of villagesin this size category), who received city status during the 1990s.
1 1 Figures from the smallest villages are not relevant for comparison because of the298 villages in this category, only 2 have kindergartens.
1 2 Figures of the smallest villages are not relevant for comparison because of the 298villages in this category, only 2 have primary schools.
1 3 According to surveys conducted by MTA RKK in Szolnok, Kisújszállás, Gyoma-endrôd, Kalocsa, Mátészalka.
1 4 Households and firms directly contribute to utility investments through utilityassociations. The share of their contribution is usually around one third of the totalinvestment budget.
1 5 Bódi Ferenc, 1992: The enterprise supporting policy of the local governments inBorsod Abaúj Zemplén County. Spatial research in County BAZ. MTA RKK ÉMO.
1 6 The counties in the middle of the regional hierarchy were, on one hand, the stretchedarms of the state which transferred the central decisions to the towns and villages. Onthe other hand, they represented the interests of the communities to the State. Thecounty council controlled the local councils in two ways. The county council wasthe second-grade authority in public administration affairs and, what is more, itwas the county council that reallocated the development resources taken from taxes.
1 7 According to the Act CXXXV of 1997 on Associations and Cooperation amongLocal Governments.
1 8 According to the Act XXI of 1996 on Regional Development.1 9 Representatives are elected from separate lists set up by communities, but they
form an common body.
šš
Separate Existences Above AllElse—Local Self-Governments and
Service Delivery in Slovakia
Jaroslav Kling
Viktor Niznansky
Jaroslav Pilát
C H A P T E R 3

102
C O N S O L I D A T I O N O R F R A G M E N T A T I O N ?
D F I D – L G I L O C A L G O V E R N M E N T P O L I C Y P A R T N E R S H I P P R O G R A M
103
S E PA R AT E E X I S T E N C E S A B O V E A L L — LO C A L S E L F – G O V E R N M E N T S A N D S E R V I C E D E L I V E R Y I N S LOVA K I A
Table of Contents
1. Introduction ................................................................................................. 1051.1 Development of Public Management Since 1989 ............................. 1051.2 The Current Form of Public Management in Slovakia ..................... 106
1.2.1 State Administration ................................................................. 1061.2.2 Territorial Self-Government ...................................................... 107
1.3 Division of Competencies Within Public Management ................... 1081.3.1 State Administration ................................................................. 1081.3.2 Territorial Self-Government ...................................................... 108
1.4 Political Mechanisms for Public Management Operation ................ 1091.4.1 State Administration ................................................................. 1091.4.2 Territorial Self-Government ...................................................... 110
1.5 Financial Mechanisms for Public Management Operation ............... 1111.5.1 State Administration ................................................................. 1111.5.2 Territorial Self-Government ...................................................... 111
2. Municipal Government Structure in Slovakia ............................................ 1132.1 Integration of Municipalities Prior to 1990 ...................................... 1172.2 Fragmentation After 1990 .................................................................. 1182.3 Conditions of Settlement Structure Stabilization .............................. 1202.4 Conclusion ........................................................................................... 121
3. Service Delivery ............................................................................................ 1223.1 Economy of Local Self-Governments .................................................. 122
3.1.1 Structure of Local Budgets Revenues ....................................... 1233.1.2 Structure of Local Self-Governments’ Expenditures ............... 129
3.2 Economy of Services Delivered ........................................................... 1333.2.1 Road Management ................................................................... 1343.2.2 Municipal Waste Management ................................................ 1353.2.3 Municipal Office Administration ............................................ 1373.2.4 Economic Development ........................................................... 139
4. Inter-Municipal Cooperation and Services Provision ................................. 1404.1 Legal Settings for Inter-Municipal Cooperation ................................ 1404.2. Areas of Inter-Municipal Cooperation ................................................ 1414.3 Examples of Inter-Municipal Cooperation ........................................ 142
4.3.1 Economic and Social Services ................................................... 1424.3.2 Administrative Services ............................................................. 146
104
C O N S O L I D A T I O N O R F R A G M E N T A T I O N ?
D F I D – L G I L O C A L G O V E R N M E N T P O L I C Y P A R T N E R S H I P P R O G R A M
4.4 Evaluation of Existing Examples of Inter-Municipal Cooperation ... 1474.5 The Willingness of Municipalities to Engage in
Inter-Municipal Cooperation ............................................................. 1494.6 Conclusion ........................................................................................... 150
5. Services Delivered and Local Democracy .................................................... 1515.1 Citizens Participation in Local Self-Government ............................... 1515.2 Public Attitudes Towards Local Self-Government ............................. 1535.3 Satisfaction with Local Self-Government Operation ......................... 155
6. Conclusions and Possible Political Recommendations .............................. 1576.1 Conclusions ......................................................................................... 1576.2. Recommendations ............................................................................... 159
References ............................................................................................................. 162
Notes .................................................................................................................... 165
105
S E PA R AT E E X I S T E N C E S A B O V E A L L — LO C A L S E L F – G O V E R N M E N T S A N D S E R V I C E D E L I V E R Y I N S LOVA K I A
šš
Separate Existences Above All Else—Local Self-Governmentsand Service Delivery in Slovakia
Jaroslav Kling, Viktor Niznansky Jaroslav Pilát
1. INTRODUCTION
1.1 Development of Public Management Since 19891
Prior to 1990, public administration in Slovakia was managed through a three-levelnetwork of the národny vybor (national committees)—miestny (local), okresny (district)and krajsky (regional). These committees represented the state’s power; they were thebodies of state administration as well as of economic management. The lower leveldepended upon both the higher level and the central government. In 1990, these com-mittees were abolished and the reform of public administration in Slovakia had begun.
With the acceptance of Municipal law no. 369/1990, public management in Slo-vakia split into elected local self-governments and state administration. At this time,a dual model of public management was introduced with one, municipal, level ofterritorial self-government.
Until 2001, further developments in public administration reform were purelyrelated to reform of the state administration, with some amendments to Municipallaw. Firstly, in 1990, the kraje level of state administration was canceled and a newlevel, subordinated to okres (district) level, was created called obvod (sub district). Theterritorial units of state administration in Slovakia from 1990 to 1996 included 38districts and 121 sub districts.
Secondly, in 1996, the territorial structure of state administration changed. Thesub districts were revoked and the number of districts increased to 79. An interim tierof local state administration was created. Eight regions (kraj) were then established.Political pressure during creation of new districts resulted in disproportionably largedistricts. During this period, the difference between the largest and the smallest dis-tricts was 150,000 inhabitants (the Nitra district—163,419 inhabitants vs. theMedzilaborce district—12,597 inhabitants in 2001). Although the number of dis-trict offices increased in comparison to the previous division, they did not cover the
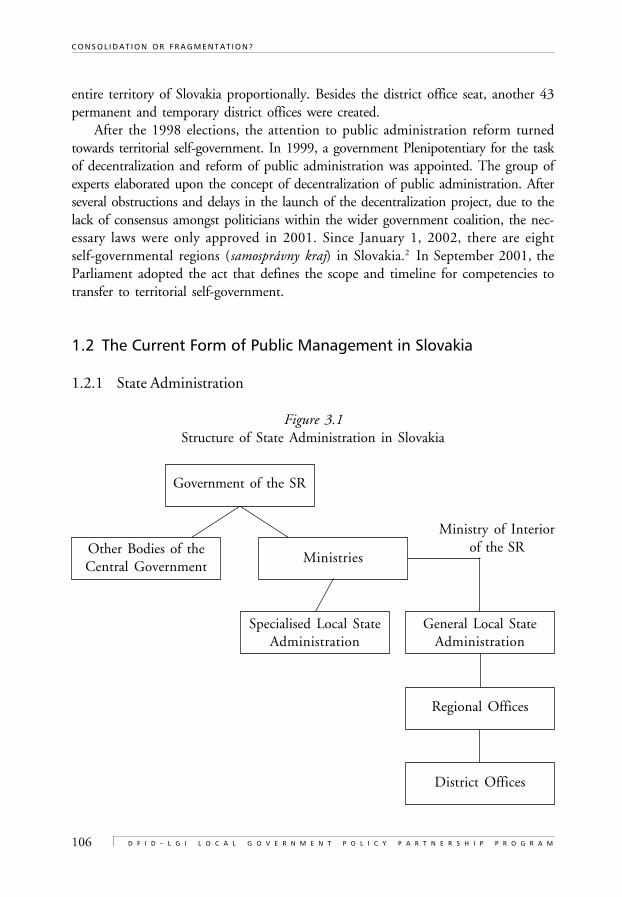
106
C O N S O L I D A T I O N O R F R A G M E N T A T I O N ?
D F I D – L G I L O C A L G O V E R N M E N T P O L I C Y P A R T N E R S H I P P R O G R A M
entire territory of Slovakia proportionally. Besides the district office seat, another 43permanent and temporary district offices were created.
After the 1998 elections, the attention to public administration reform turnedtowards territorial self-government. In 1999, a government Plenipotentiary for the taskof decentralization and reform of public administration was appointed. The group ofexperts elaborated upon the concept of decentralization of public administration. Afterseveral obstructions and delays in the launch of the decentralization project, due to thelack of consensus amongst politicians within the wider government coalition, the nec-essary laws were only approved in 2001. Since January 1, 2002, there are eightself-governmental regions (samosprávny kraj) in Slovakia.2 In September 2001, theParliament adopted the act that defines the scope and timeline for competencies totransfer to territorial self-government.
1.2 The Current Form of Public Management in Slovakia
1.2.1 State Administration
Figure 3.1Structure of State Administration in Slovakia
Government of the SR
Other Bodies of theCentral Government
Ministries
Specialised Local StateAdministration
General Local StateAdministration
Ministry of Interiorof the SR
Regional Offices
District Offices
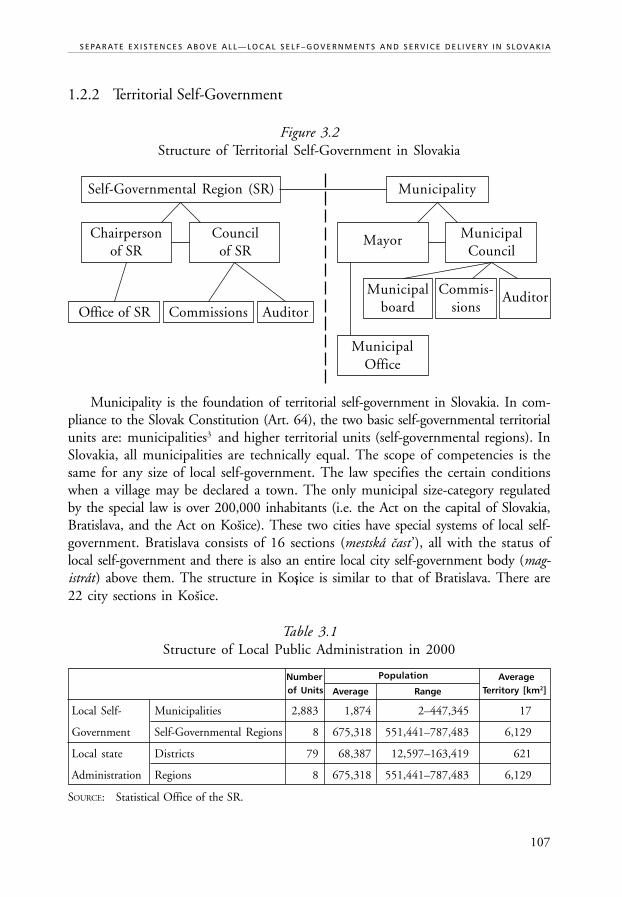
107
S E PA R AT E E X I S T E N C E S A B O V E A L L — LO C A L S E L F – G O V E R N M E N T S A N D S E R V I C E D E L I V E R Y I N S LOVA K I A
Self-Governmental Region (SR)
Chairpersonof SR
Councilof SR
Office of SR Commissions Auditor
Municipality
Mayor MunicipalCouncil
Municipalboard
Commis-sions
Auditor
MunicipalOffice
š
š
š
1.2.2 Territorial Self-Government
Figure 3.2Structure of Territorial Self-Government in Slovakia
Municipality is the foundation of territorial self-government in Slovakia. In com-pliance to the Slovak Constitution (Art. 64), the two basic self-governmental territorialunits are: municipalities3 and higher territorial units (self-governmental regions). InSlovakia, all municipalities are technically equal. The scope of competencies is thesame for any size of local self-government. The law specifies the certain conditionswhen a village may be declared a town. The only municipal size-category regulatedby the special law is over 200,000 inhabitants (i.e. the Act on the capital of Slovakia,Bratislava, and the Act on Kosice). These two cities have special systems of local self-government. Bratislava consists of 16 sections (mestská cast ’), all with the status oflocal self-government and there is also an entire local city self-government body (mag-istrát) above them. The structure in Kos¡ice is similar to that of Bratislava. There are22 city sections in Kosice.
Table 3.1Structure of Local Public Administration in 2000
Number Population Averageof Units Average Range Territory [km2]
Local Self- Municipalities 2,883 1,874 2–447,345 17
Government Self-Governmental Regions 8 675,318 551,441–787,483 6,129
Local state Districts 79 68,387 12,597–163,419 621
Administration Regions 8 675,318 551,441–787,483 6,129
SOURCE: Statistical Office of the SR.
108
C O N S O L I D A T I O N O R F R A G M E N T A T I O N ?
D F I D – L G I L O C A L G O V E R N M E N T P O L I C Y P A R T N E R S H I P P R O G R A M
1.3 Division of Competencies Within Public Management
1.3.1 State Administration
The regional offices and district offices exercise state administration at the regional anddistrict levels. These offices deliver services provided by the state. In Slovakia, stateadministration delivers a vast majority of services in the categories of education, health-care, social welfare, environmental issues, cadastre, registry of enterprises and businesslicenses, etc. These services are administered in the district and regional offices. Indi-vidual branches, responsible for the state administration exercised by these offices, aremethodologically run by the respective ministries. The Ministry of Interior plays acoordinating role in local state administration and other ministries related work.District and regional offices are appealing bodies for the administrative issues of terri-torial self-governments. They can also assist territorial self-governments in delivery oftheir services. The networks for special offices in individual branches of state adminis-tration (tax offices, military offices, fire departments, etc.) are further bodies of localstate administration.
1.3.2 Territorial Self-Government
MunicipalityThe major purpose of a municipality is to take care of the municipal territory’s develop-ment and the needs of the citizenry. A municipality’s territory can consist of one orseveral cadastral territories. The central government can found, cancel, divide or joinmunicipalities. Such an act can be performed only upon agreement by the municipalityand the respective regional office. Along with exercising other self-governmental func-tions, the municipality carries out activities related to proper management of municipalproperty and state property left for the municipality’s use. The range of competency forlocal self-governments is not very wide. Practically, the services that are fully, and exclu-sively, provided by local self-government include; municipal road management,municipal waste management, development of municipal territory (construction ofmunicipal facilities and development of municipal property), territory managementand green areas, local public transportation and public lighting. The services whichmay be, or may in part be, delivered by local self-governments include; water works, gasworks, sewage systems, environmental issues, culture, sport, other leisure time activities,healthcare, social welfare and education. Generally, these services are delivered by thestate administration. Local self-governments also deliver some services delegated to themby the state administration (such as residential registry, building permits, etc. Localself-governments can issue ordinances and have their own municipal police to secure
109
S E PA R AT E E X I S T E N C E S A B O V E A L L — LO C A L S E L F – G O V E R N M E N T S A N D S E R V I C E D E L I V E R Y I N S LOVA K I A
public safety.4 In reality, not every municipality carries out all the services listed due tolack of capacity (the smallest municipality consists of only two people, see section 2).
Municipalities also carry out founding and some economic and managerial func-tions in some areas decentralized in 2001, from the state administration level down tolocal self-government. The areas are as follows: water management, social services, edu-cation, culture, healthcare, regional development and tourism.
Self-Governmental RegionBeginning in 2002, an interim tier of territorial self-government functions in Slovakia.The self-governmental region individually manages its own property and own reve-nues. The territory of the self-governmental region is identical with the territory of theregion (kraj), a state administrative unit. It cooperates with other state bodies, otherself-governmental regions, municipalities and other legal entities. The relationshipbetween the self-governmental region and municipalities is not based on the principleof subordination, but partnership. The self-governmental regions have competenciesprimarily in the area of conceptualizing and planning projects for individual branchesof social life. Firstly, the competence transferred to them concerns regional develop-ment. The self-governmental regions mainly create the conditions for development ofenvironmental protection, education, healthcare, social welfare and culture. They areallowed to issue ordinances on the matters concerning local self-government. The rela-tionship between regional self-government and state administration is based onpartnership, not subordination. Self-governmental regions also carry out founding eco-nomic and managerial functions for some areas decentralized in 2001 (Act no. 416/2001) from the state administration level to the local self-government. The areas are asfollows: road management, transportation, social services, education, culture, health-care, regional development and tourism.
1.4 Political Mechanisms for Public Management Operation
Concerning the political mechanisms within public administration, the two divisions ofpublic administration, state administration and local self-government, must be differ-entiated. Basically, state administration is appointed and local self-government is elected.
1.4.1 State Administration
The operation of all state administration bodies depends upon the results of theparliamentary elections. The elected political parties then appoint leadership for the
110
C O N S O L I D A T I O N O R F R A G M E N T A T I O N ?
D F I D – L G I L O C A L G O V E R N M E N T P O L I C Y P A R T N E R S H I P P R O G R A M
central bodies as well as the leadership of local state administrative bodies. This prin-ciple creates low accountability on the part of state administration bureaucrats, whoare basically only responsible to their nominating political party. In the summer of2001, the Slovak Parliament adopted an Act on state service that specifies the legalparameters for state administrative positions, the qualification requirements and theterms of state administration employment. It hoped to eliminate the present stronginfluence of political affiliation in the process of accepting candidates for state admin-istrative positions.
1.4.2 Territorial Self-Government
Political mechanisms, for the operation of local self-government, stem from the Consti-tution. The determining factor is the principle of election.
MunicipalityThe municipal council and the mayor are the two municipal bodies. The municipalcouncil (obecné zastupitel’stvo) consists of the councilors, elected for four years in directelections by the residents of municipality. Prior to this date, the municipal councilspecifies the number of councilors elected for the next elections. There are a maximumof three councilors in municipalities up to 40 inhabitants. Municipalities over 100,000inhabitants have usually 23 to 41 councilors. In Slovakia, municipal elections are basedupon the majority electoral system. There are multiple mandate election districts,within each municipality, for municipal councilors elections. The number of mandatesfor each particular district depends on its population. The maximum number of coun-cilors elected in one election district is 12. The municipal council is a decision-makingbody seeing to the basic areas of the municipal life.
The mayor (starosta/primátor), elected in direct elections every four years, is a high-est executive body of a municipality. For mayoral elections, each municipality formsone a one-mandate election district. The majority electoral system also applies tomayoral elections. The Municipal law also specifies the terms and conditions forremoving the mayor from office before the end of his/her term.
Political mechanisms at the local self-government level are almost exclusively ruledby the principles of the electoral process. Certainly, the political orientation of theelected representatives is important at this level too. At the municipal level, politicalinfluence is significantly lower than at the national level. The municipal issues beingaddressed very often yield to political interests.
The local self-government is managed by its elected representatives. The optionsfor removal of a mayor are quite clearly stated in the Municipal law. Incidentally, the
111
S E PA R AT E E X I S T E N C E S A B O V E A L L — LO C A L S E L F – G O V E R N M E N T S A N D S E R V I C E D E L I V E R Y I N S LOVA K I A
municipal councilors cannot be removed due to low quality of his/her work prior to theend of their term.
Self-Governmental RegionsThe council of the self-governmental region and the chairperson of the self-govern-mental region are the bodies of the regional self-government.
The council of the self-governmental region (zastupitel’stvo samosprávneho kraja) speci-fies the number of councilors to be elected in the next elections, based on the specificationsof 12,000 to 15,000 inhabitants per one councilor. Elections to this body have thesame rules as municipal elections.
The chairperson of the self-governmental region (predseda samosprvneho kraja) rep-resents it. He/she is its statutory body. Act no. 302/2001 specifies the conditions of his/her removal prior to the end of the term. The election of the chairperson is differentthan election of the mayor. The candidate who receives plus 50% of the votes in thedirect elections becomes the chairperson. If none of the candidates pools this numberof votes, the two most successful candidates advance to the second round. In the secondround, the candidate with majority of votes becomes the chairperson. The regionalself-government body’s terms are four years.
1.5 Financial Mechanisms for Public Management Operation
1.5.1 State Administration
The state budget is the funding source for the state administration’s central bodiesand the regional and district offices. Individual branches within the district and regionaloffices are financed through the budget chapter of the respective regional office. In2001, the government came to the decision to decrease the number of budget chapters.The regional offices chapters will be abandoned. The local state administration wasto be financed through the chapter of respective ministry or the Ministry of Interiorof the SR. Later on, the entire system shall be revised by the Act on the state treasury.
1.5.2 Territorial Self-Government
MunicipalityThe municipality funds its needs primarily through its own revenues, state subsidiesand other sources. Major sources of municipal revenue are:
112
C O N S O L I D A T I O N O R F R A G M E N T A T I O N ?
D F I D – L G I L O C A L G O V E R N M E N T P O L I C Y P A R T N E R S H I P P R O G R A M
a) Share in the state tax revenue: The funds from the state tax revenue (person-al income tax, corporate tax and road tax) are distributed to the municipalitiesin compliance with the given rules. These rules changed during the 1991–2000 period. Revenue from the personal income tax are distributed accordingto the population (of the municipality). Distribution of corporate tax reve-nue reflects the localization of the corporation. Sixty percent of revenues aredistributed proportionally by population and another forty percent accord-ing to the residence of the taxpayer. Municipalities receive 40% of road taxrevenues. These funds are distributed proportionally according to the pop-ulation. The overall portion of state tax monies allotted to the municipalitiesis annually determined by the state budget (except for the share in the roadtax revenues).
b) Revenue from local taxes and local fees: The real estate tax is an exclusivemunicipal tax. It is calculated as a multiple of the rate for individual typesof real estate given by the notice of the Ministry of Finance of the SR. Themaximum multiple is as follows:
1.0 In municipalities up to 1,000 inhabitants1.4 In municipalities from 1,001 to 6,000 inhabitants1.6 In municipalities from 6,001 to 10,000 inhabitants2.0 In municipalities from 10,001 to 25,000 inhabitants2.5 In municipalities over 25,000 inhabitants3.5 In the seats of the district and spa municipalities4.0 In the seats of the region4.5 In BratislavaLocal fees (taxes) include fines/licenses for: dogs; alcohol and tobacco
products sale; gambling and slot machines; cash registers; car entry into thehistorical center of the city; taxes for lodging; advertisement; public en-trance; spa and recreation; non-residential use of an apartment; publicproperty use; air pollution; waste disposal as well as other fees.
c) Revenues of enterprise and property ownership.d) Administrative and other fees and payments.e) Capital assets sale revenues.f) Revenues from provided loans.g) Revenues from rental of buildings and facilities, transfers from contributory
organizations and transfers from the financial funds of the municipality.h) Donations and voluntary fundraising for municipality revenues. Besides these
revenues, municipalities can have also the following revenues.i) Transfers and other subsidies from the state budget: Subsidies to munici-
palities for the provision of self-governmental services belong under thiscategory. Until 1995, all municipalities under 5,000 inhabitants were eli-
113
S E PA R AT E E X I S T E N C E S A B O V E A L L — LO C A L S E L F – G O V E R N M E N T S A N D S E R V I C E D E L I V E R Y I N S LOVA K I A
š
š
š šš
gible for this subsidy. The subsidy was given based upon the quality of soilin the territory, as defined by the Ministry of Agriculture of the SR and thesize of the municipality. Since 1996, the population stipulation dropped to3,000 inhabitants. Further subsidies include: subsidies for local public trans-portation in Bratislava, Kosice, Presov, Zilina and Banská Bystrica; subsidiesfor completion of complex housing construction; subsidies for regional de-velopment; and other specific transfers and subsidies provided by individualchapters of the state budget.
j) Subsidies from state funds: This category consists mainly of transfers fromthe State environmental fund for construction of technical infrastructurefacilities (sewage, wastewater treatment facilities, etc.) Also, Pro Slovakia,the State fund for funding cultural activities, the State water managementfund for supporting the construction of water supply systems and the Statefund for housing development and construction.
k) Received credits and revenue from municipal bonds.
Self-Governmental RegionThe self-governmental regions mostly use the revenues from their share in state taxcollections, surcharges to personal income taxes they create, and funds of horizontalleveling of self-governmental regions. In addition to these sources, self-governmentalregions can use financial sources similar to municipalities. As of the time of this study,exact mechanisms for the finance of self-governmental regions do not exist.
2. MUNICIPAL GOVERNMENT STRUCTURE IN SLOVAKIA
The municipal structure of Slovakia features instability and a large number of smallmunicipalities (fragmentation). In 1950, there were 3,344 municipalities in Slovakiaaveraging 1,029 residents. In 1989, there were only 2,694 municipalities with an averagepopulation of 1,963. After the changes in 1989, the number of municipalities rocket-ed to 2,825 in 1991 (Figure 3.3).
In 2000, Slovakia had 2,883 municipalities. Of this number, 138 had the statuteof city. More than two thirds of the municipalities were under 1,000 inhabitants.Over 42% had less than 500 inhabitants. A total of 123 municipalities (4.3%) hadfewer than 100 inhabitants. Príkra, the smallest municipality (two inhabitants) is lo-cated in the Svidnik district in northeast Slovakia.
Smizany was the village with the highest number of inhabitants (7,367 people).Besides this village, another seven villages exceeded the threshold of 5,000 inhabitants.On the other hand, Modry Kamen was the smallest town, with a population of 1,441people. A total of 22 towns fell into the size category of under 5,000 people.
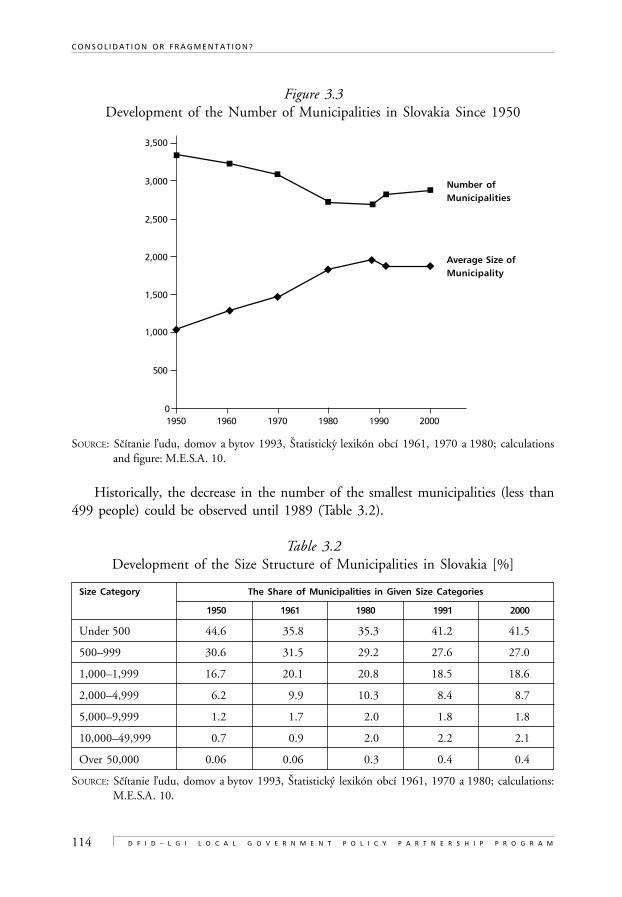
114
C O N S O L I D A T I O N O R F R A G M E N T A T I O N ?
D F I D – L G I L O C A L G O V E R N M E N T P O L I C Y P A R T N E R S H I P P R O G R A M
šš
š š
Figure 3.3Development of the Number of Municipalities in Slovakia Since 1950
SOURCE: Scítanie l’udu, domov a bytov 1993, Statisticky lexikón obcí 1961, 1970 a 1980; calculationsand figure: M.E.S.A. 10.
Historically, the decrease in the number of the smallest municipalities (less than499 people) could be observed until 1989 (Table 3.2).
Table 3.2Development of the Size Structure of Municipalities in Slovakia [%]
Size Category The Share of Municipalities in Given Size Categories
1950 1961 1980 1991 2000
Under 500 44.6 35.8 35.3 41.2 41.5
500–999 30.6 31.5 29.2 27.6 27.0
1,000–1,999 16.7 20.1 20.8 18.5 18.6
2,000–4,999 6.2 9.9 10.3 8.4 8.7
5,000–9,999 1.2 1.7 2.0 1.8 1.8
10,000–49,999 0.7 0.9 2.0 2.2 2.1
Over 50,000 0.06 0.06 0.3 0.4 0.4
SOURCE: Scítanie l’udu, domov a bytov 1993, Statisticky lexikón obcí 1961, 1970 a 1980; calculations:M.E.S.A. 10.
Number ofMunicipalities
Average Size ofMunicipality
3,500
3,000
2,500
2,000
1,500
1,000
500
19500
1960 1970 1980 1990 2000
115
S E PA R AT E E X I S T E N C E S A B O V E A L L — LO C A L S E L F – G O V E R N M E N T S A N D S E R V I C E D E L I V E R Y I N S LOVA K I A
In the first post-1989 Census, conducted in 1991, the number of the smallermunicipalities rose again. The process of integration can explain the rapid growth ofthe towns over 10,000 inhabitants since 1970. This process took place mainly duringthe 1970s and the 1980s in Slovakia. Similar explanations may be used for the contin-ual decline of the smallest municipalities up until 1991. These municipalities wereannexed either to neighboring towns or villages. The joint municipalities then shiftedinto a higher size category.
In 1950, 13.3% of the Slovak population resided in municipalities with less than499 inhabitants (the proportion of this size category on the total number of munici-palities was 44.6%). In 2000, when these municipalities accounted for 41.5% of allmunicipalities in the country, only 6% of population lived there. The populationproportion from municipalities with less than 999 people decreased with a similarlyhigh rate (from 20.3% in 1950 to 10.3% in 2000). All municipalities with less than999 inhabitants represented as much as 68.5% of the total municipalities in the SlovakRepublic in 2000. However, only 16.3% of population actually lived there. To thecontrary, in the case of the largest size categories, the proportion of inhabitants grewmore than twofold, in some cases as much as threefold (cities over 50,000 people). Themunicipalities in the size category 5,000–9,999 inhabitants have maintained relative-ly stable proportions over the last 50 years (Figure 3.4). Based upon development inthe number of municipalities and municipal population, this size category seems to bethe most stable element of the settlement structure of Slovakia.
Regarding the spatial aspect, several remarks can be made as to the settlementstructure of Slovakia. The largest concentration of small municipalities can be found inthe northeastern part of Slovakia. This part of the country is the continuous economicperiphery of Slovakia. This explains also the low population within these municipali-ties. Another area with a large number of small municipalities is situated in theJuhoslovenská kotlina (Southern Slovak Lowlands located in the southern part of Cen-tral Slovakia). The western part of Slovakia is the opposite. Primarily medium-sizedlarge villages and towns are concentrated here. The areas in the Vah River Valley, theOrava River Valley and central part of Slovakia have similar concentrations.
The recent shape of settlement structure in Slovakia is influenced by several factors.Firstly, it is the difficult vertical segmentation of Slovakia’s terrain. Secondly, it is thehistorical patterns of settlement in Slovakia—various settling of the wild terrain (colo-nization). Later on, it was the development of economic activities and their concentrationin select locations. In the second half of the 20th century, there were two contradictingprocesses taking place in two different societal systems in Slovakia. The integration ofmunicipalities, during the period of state socialism was the first process. The disinte-gration caused by the implementation of democratic elements into management andadministration of the state after 1990 was the second process.
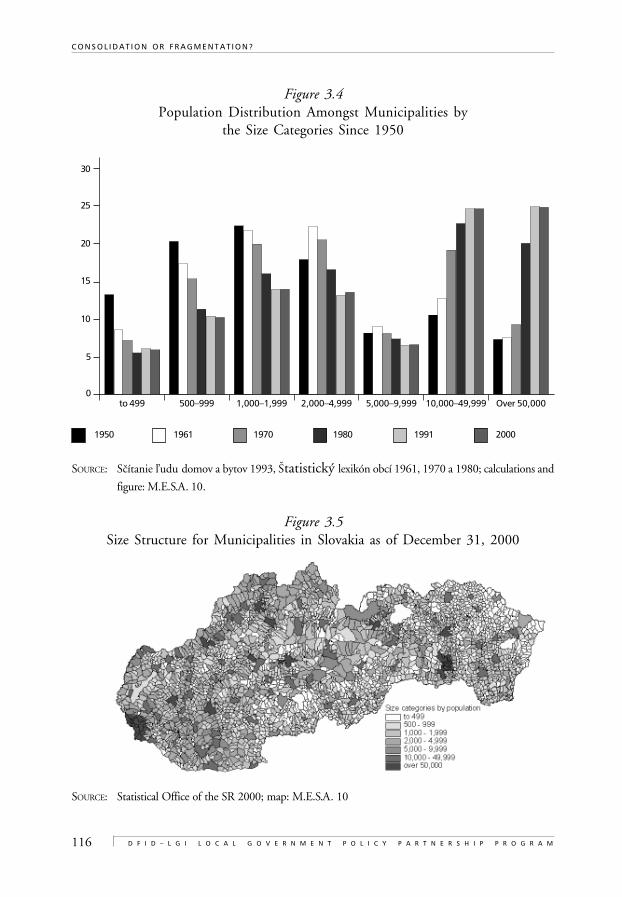
116
C O N S O L I D A T I O N O R F R A G M E N T A T I O N ?
D F I D – L G I L O C A L G O V E R N M E N T P O L I C Y P A R T N E R S H I P P R O G R A M
š š
Figure 3.4Population Distribution Amongst Municipalities by
the Size Categories Since 1950
1950 1961 1970 1980 1991 2000
SOURCE: Scítanie l’udu domov a bytov 1993, Statisticky lexikón obcí 1961, 1970 a 1980; calculations and
figure: M.E.S.A. 10.
Figure 3.5Size Structure for Municipalities in Slovakia as of December 31, 2000
SOURCE: Statistical Office of the SR 2000; map: M.E.S.A. 10
30
25
20
15
10
5
0to 499 500–999 1,000–1,999 2,000–4,999 5,000–9,999 10,000–49,999 Over 50,000
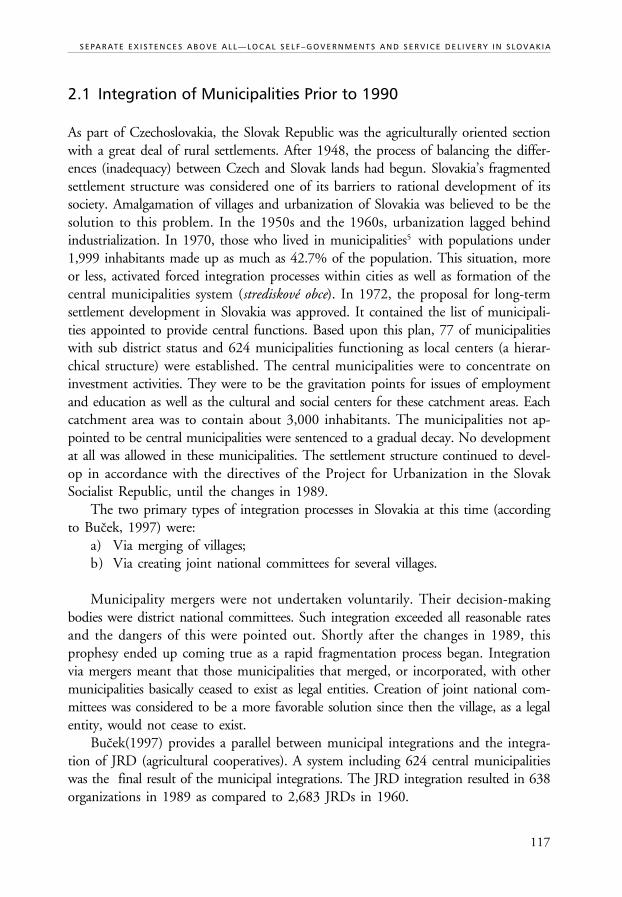
117
S E PA R AT E E X I S T E N C E S A B O V E A L L — LO C A L S E L F – G O V E R N M E N T S A N D S E R V I C E D E L I V E R Y I N S LOVA K I A
š
š
2.1 Integration of Municipalities Prior to 1990
As part of Czechoslovakia, the Slovak Republic was the agriculturally oriented sectionwith a great deal of rural settlements. After 1948, the process of balancing the differ-ences (inadequacy) between Czech and Slovak lands had begun. Slovakia’s fragmentedsettlement structure was considered one of its barriers to rational development of itssociety. Amalgamation of villages and urbanization of Slovakia was believed to be thesolution to this problem. In the 1950s and the 1960s, urbanization lagged behindindustrialization. In 1970, those who lived in municipalities5 with populations under1,999 inhabitants made up as much as 42.7% of the population. This situation, moreor less, activated forced integration processes within cities as well as formation of thecentral municipalities system (strediskové obce). In 1972, the proposal for long-termsettlement development in Slovakia was approved. It contained the list of municipali-ties appointed to provide central functions. Based upon this plan, 77 of municipalitieswith sub district status and 624 municipalities functioning as local centers (a hierar-chical structure) were established. The central municipalities were to concentrate oninvestment activities. They were to be the gravitation points for issues of employmentand education as well as the cultural and social centers for these catchment areas. Eachcatchment area was to contain about 3,000 inhabitants. The municipalities not ap-pointed to be central municipalities were sentenced to a gradual decay. No developmentat all was allowed in these municipalities. The settlement structure continued to devel-op in accordance with the directives of the Project for Urbanization in the SlovakSocialist Republic, until the changes in 1989.
The two primary types of integration processes in Slovakia at this time (accordingto Bucek, 1997) were:
a) Via merging of villages;b) Via creating joint national committees for several villages.
Municipality mergers were not undertaken voluntarily. Their decision-makingbodies were district national committees. Such integration exceeded all reasonable ratesand the dangers of this were pointed out. Shortly after the changes in 1989, thisprophesy ended up coming true as a rapid fragmentation process began. Integrationvia mergers meant that those municipalities that merged, or incorporated, with othermunicipalities basically ceased to exist as legal entities. Creation of joint national com-mittees was considered to be a more favorable solution since then the village, as a legalentity, would not cease to exist.
Bucek(1997) provides a parallel between municipal integrations and the integra-tion of JRD (agricultural cooperatives). A system including 624 central municipalitieswas the final result of the municipal integrations. The JRD integration resulted in 638organizations in 1989 as compared to 2,683 JRDs in 1960.
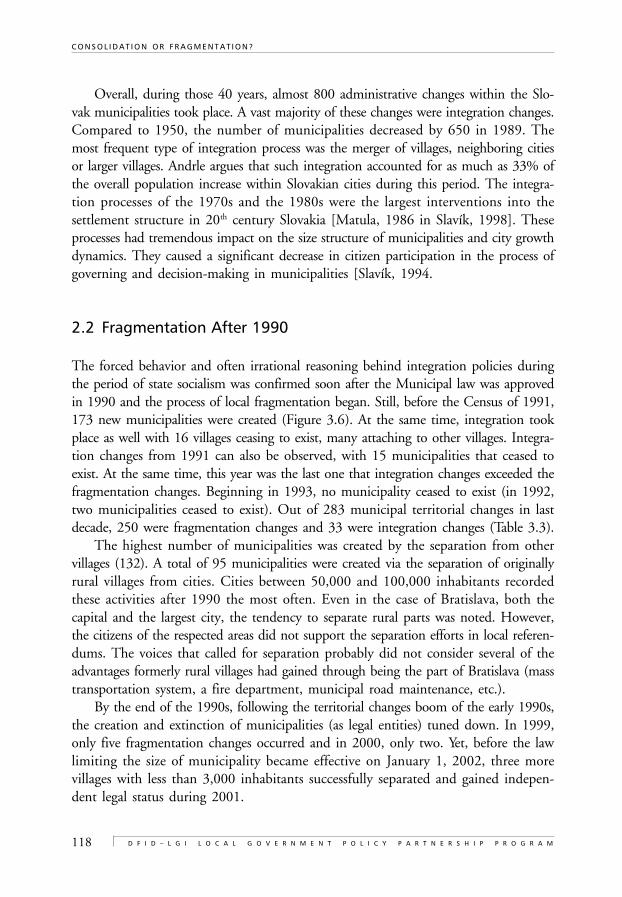
118
C O N S O L I D A T I O N O R F R A G M E N T A T I O N ?
D F I D – L G I L O C A L G O V E R N M E N T P O L I C Y P A R T N E R S H I P P R O G R A M
Overall, during those 40 years, almost 800 administrative changes within the Slo-vak municipalities took place. A vast majority of these changes were integration changes.Compared to 1950, the number of municipalities decreased by 650 in 1989. Themost frequent type of integration process was the merger of villages, neighboring citiesor larger villages. Andrle argues that such integration accounted for as much as 33% ofthe overall population increase within Slovakian cities during this period. The integra-tion processes of the 1970s and the 1980s were the largest interventions into thesettlement structure in 20th century Slovakia [Matula, 1986 in Slavík, 1998]. Theseprocesses had tremendous impact on the size structure of municipalities and city growthdynamics. They caused a significant decrease in citizen participation in the process ofgoverning and decision-making in municipalities [Slavík, 1994.
2.2 Fragmentation After 1990
The forced behavior and often irrational reasoning behind integration policies duringthe period of state socialism was confirmed soon after the Municipal law was approvedin 1990 and the process of local fragmentation began. Still, before the Census of 1991,173 new municipalities were created (Figure 3.6). At the same time, integration tookplace as well with 16 villages ceasing to exist, many attaching to other villages. Integra-tion changes from 1991 can also be observed, with 15 municipalities that ceased toexist. At the same time, this year was the last one that integration changes exceeded thefragmentation changes. Beginning in 1993, no municipality ceased to exist (in 1992,two municipalities ceased to exist). Out of 283 municipal territorial changes in lastdecade, 250 were fragmentation changes and 33 were integration changes (Table 3.3).
The highest number of municipalities was created by the separation from othervillages (132). A total of 95 municipalities were created via the separation of originallyrural villages from cities. Cities between 50,000 and 100,000 inhabitants recordedthese activities after 1990 the most often. Even in the case of Bratislava, both thecapital and the largest city, the tendency to separate rural parts was noted. However,the citizens of the respected areas did not support the separation efforts in local referen-dums. The voices that called for separation probably did not consider several of theadvantages formerly rural villages had gained through being the part of Bratislava (masstransportation system, a fire department, municipal road maintenance, etc.).
By the end of the 1990s, following the territorial changes boom of the early 1990s,the creation and extinction of municipalities (as legal entities) tuned down. In 1999,only five fragmentation changes occurred and in 2000, only two. Yet, before the lawlimiting the size of municipality became effective on January 1, 2002, three morevillages with less than 3,000 inhabitants successfully separated and gained indepen-dent legal status during 2001.
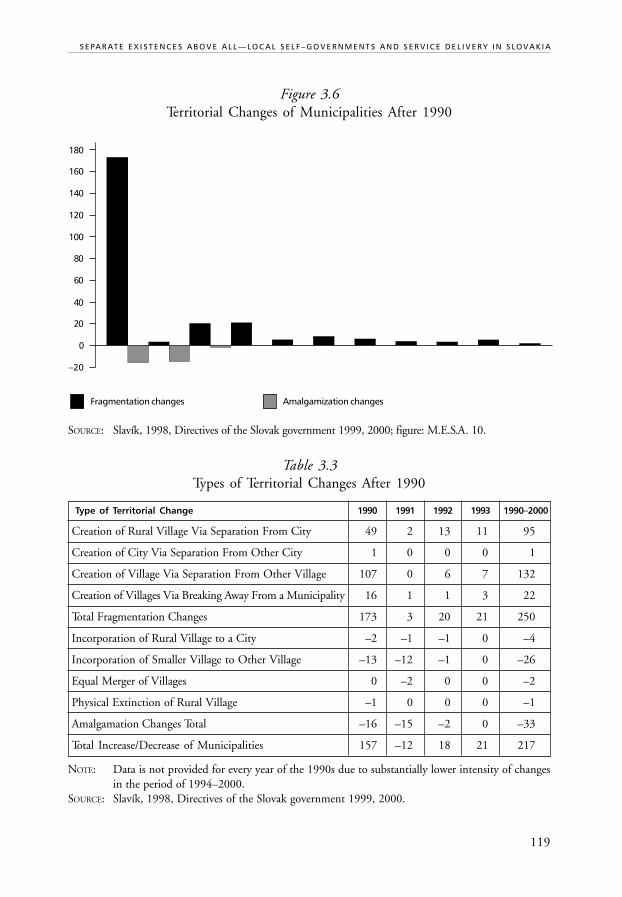
119
S E PA R AT E E X I S T E N C E S A B O V E A L L — LO C A L S E L F – G O V E R N M E N T S A N D S E R V I C E D E L I V E R Y I N S LOVA K I A
Figure 3.6Territorial Changes of Municipalities After 1990
Fragmentation changes Amalgamization changes
SOURCE: Slavík, 1998, Directives of the Slovak government 1999, 2000; figure: M.E.S.A. 10.
Table 3.3Types of Territorial Changes After 1990
Type of Territorial Change 1990 1991 1992 1993 1990–2000
Creation of Rural Village Via Separation From City 49 2 13 11 95
Creation of City Via Separation From Other City 1 0 0 0 1
Creation of Village Via Separation From Other Village 107 0 6 7 132
Creation of Villages Via Breaking Away From a Municipality 16 1 1 3 22
Total Fragmentation Changes 173 3 20 21 250
Incorporation of Rural Village to a City –2 –1 –1 0 –4
Incorporation of Smaller Village to Other Village –13 –12 –1 0 –26
Equal Merger of Villages 0 –2 0 0 –2
Physical Extinction of Rural Village –1 0 0 0 –1
Amalgamation Changes Total –16 –15 –2 0 –33
Total Increase/Decrease of Municipalities 157 –12 18 21 217
NOTE: Data is not provided for every year of the 1990s due to substantially lower intensity of changesin the period of 1994–2000.
SOURCE: Slavík, 1998, Directives of the Slovak government 1999, 2000.
–20
180
160
140
120
100
80
60
40
20
0
120
C O N S O L I D A T I O N O R F R A G M E N T A T I O N ?
D F I D – L G I L O C A L G O V E R N M E N T P O L I C Y P A R T N E R S H I P P R O G R A M
2.3 Conditions of Settlement Structure Stabilization
Municipal law no. 369/1990 did not originally set up any preconditions for munici-palities that intend to separate from other municipalities or municipalities that intendto split into several new municipalities. In accordance to this law, a local referendumand the agreement of all participating municipalities were sufficient to separate or joinmunicipalities. Yet, the Fall 2001 amendment to this law determined some conditionsfor the creation of new municipalities via separation from other municipalities. Effec-tive January 1, 2002, a municipality may break away only if: The territories of the newmunicipalities create a coherent territorial unit; and the new municipalities have atleast 3,000 inhabitants and new municipalities had not created an urbanite unit withthe mother municipality before the change. The municipality cannot be broken upwhen the extricating part has been given an investment that is of importance to theentire municipality (such as a waste water treatment facility). These provisions are thecontribution to stabilization of the settlement structure in Slovakia, since it preventsthe creation of further small municipalities.
The stabilization and optimization of the settlement system through amalgam-ation of municipalities is not acceptable for the representatives of local self-governments[ZMOS, 1999]. The experience of forced amalgamation remains a major barrier to it.The support for the central village in an amalgamated municipality and the contrary,shutdowns of any development in the non-central villages, during state socialism causedvoluntary amalgamation to be unacceptable. Another barrier to amalgamation is thatmunicipalities are not willing to give up any of their control to another municipalityonce they have gained their independence. There is a widely held opinion amongcitizens than if the municipality consists of several parts (villages), the home of themayor will be developed the most. It is also perceived that smaller villages in suchmunicipalities are not decently developed. The later opinion prevails among the citi-zens from the rural parts of the cities. These citizens sense they are being shortchangedin some way. According to their complaints, the city council does not pay appropriateattention to development of rural city sections and it only deals with development ofnon-rural parts.6
Amalgamation, however, is not an exclusive solution for fragmented settlementstructure in Slovakia and is an unfavorable structure for municipalities as administra-tive units. Inter-municipal cooperation, actually one type of it, joint municipal offices,is an alternative solution (see section 4). Creation of joint offices, however, runs into afrom all participating municipalities [PHARE, 1998].
Stabilization of the size structure of municipalities must take place in Slovakia sothat municipalities can provide to their full capabilities. Discussion on the proper sizeof a municipality, as the smallest administrative unit, has existed in Slovakia for 50
121
S E PA R AT E E X I S T E N C E S A B O V E A L L — LO C A L S E L F – G O V E R N M E N T S A N D S E R V I C E D E L I V E R Y I N S LOVA K I A
years, beginning in the period of state socialism. As we have already mentioned, thesystem of central municipalities operated with a catchment area of about 3,000 inhab-itants. This number is often used as a threshold for self-governing municipalities, eventoday. Populations of 5,000 inhabitants are being discussed as a minimum populationfor a municipality as well. This number enables municipalities to create own adminis-trative capacities with various expertise and financial coverage (The Concept ofDecentralization and Modernization of Public Administration, 2001). In Slovak legis-lation, 5,000 inhabitants is the threshold for a village upgrading to a city (Act no. 369/1990).
In 1999, ZMOS7 turned to its regional associations of municipalities for theircomments on the optimum size of local self-governing units. The opinions differed.The most widely accepted limit was 3,000 inhabitants. However, limits such as5,000 and 8,000 appeared as well. The exact limitation for the minimum and max-imum size of municipality was absolutely unacceptable for all the regional associations[ZMOS, 1999].
The issue of self-governmental unit size was also elaborated within work upondecentralization of public administration in Slovakia. Even though the exact size forlocal self-governments was not set up, 169 nodal municipalities were recommended asthe center of a basic administrative unit of territorial self-government, in comparison to2,883 current local self-governments (The Concept of Decentralization and Modern-ization of Public Administration, 2001). These centers would provide administrativeservices for local self-governments. The delivery of economic services would not belimited to their nodal region. The catchment area for these services would be basedupon the economic efficiency of delivery.
2.4 Conclusion
The process of decentralization of public administration in Slovakia decidedly needs tohave the issue of settlement system fragmentation solved. If the current situation per-sists, full provision of decentralized services to local self-governments is impossible. Thenecessity of it is multiplied by the reality that municipalities are to provide, not onlytheir original tasks, but also tasks delegated by the state administration. These delegat-ed tasks are mainly provisions from decisions of individual-legal matters.
The optimal size of municipalities cannot be developed solely on economic princi-pals. The volume of direct costs of public services in individual size categories ofmunicipalities is important, but not crucial. Other assets can balance the higher costs.As we have already mentioned, the amalgamation was not realistic. Perhaps inter-municipal cooperation is the more acceptable and realistic solution (see section 4).
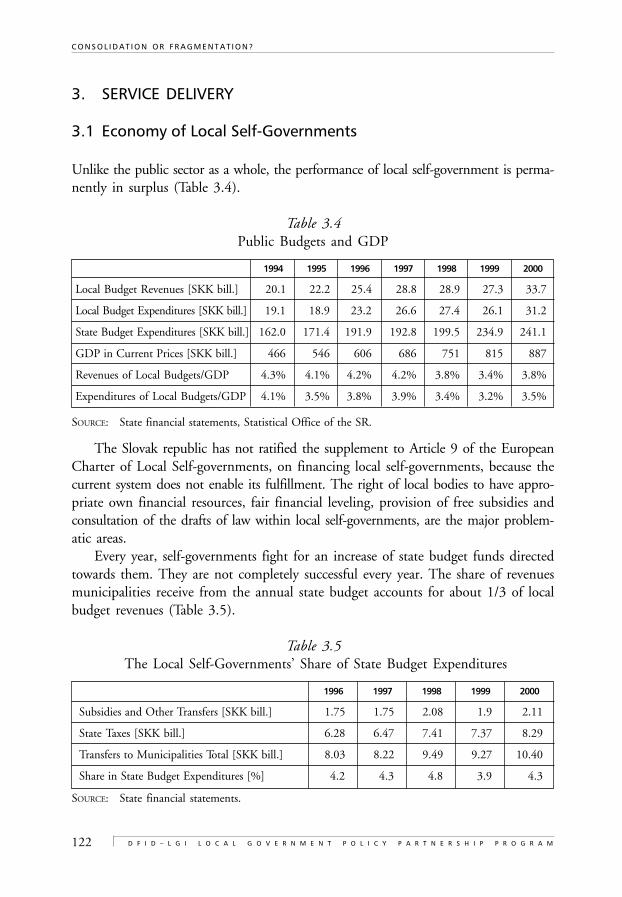
122
C O N S O L I D A T I O N O R F R A G M E N T A T I O N ?
D F I D – L G I L O C A L G O V E R N M E N T P O L I C Y P A R T N E R S H I P P R O G R A M
3. SERVICE DELIVERY
3.1 Economy of Local Self-Governments
Unlike the public sector as a whole, the performance of local self-government is perma-nently in surplus (Table 3.4).
Table 3.4Public Budgets and GDP
1994 1995 1996 1997 1998 1999 2000
Local Budget Revenues [SKK bill.] 20.1 22.2 25.4 28.8 28.9 27.3 33.7
Local Budget Expenditures [SKK bill.] 19.1 18.9 23.2 26.6 27.4 26.1 31.2
State Budget Expenditures [SKK bill.] 162.0 171.4 191.9 192.8 199.5 234.9 241.1
GDP in Current Prices [SKK bill.] 466 546 606 686 751 815 887
Revenues of Local Budgets/GDP 4.3% 4.1% 4.2% 4.2% 3.8% 3.4% 3.8%
Expenditures of Local Budgets/GDP 4.1% 3.5% 3.8% 3.9% 3.4% 3.2% 3.5%
SOURCE: State financial statements, Statistical Office of the SR.
The Slovak republic has not ratified the supplement to Article 9 of the EuropeanCharter of Local Self-governments, on financing local self-governments, because thecurrent system does not enable its fulfillment. The right of local bodies to have appro-priate own financial resources, fair financial leveling, provision of free subsidies andconsultation of the drafts of law within local self-governments, are the major problem-atic areas.
Every year, self-governments fight for an increase of state budget funds directedtowards them. They are not completely successful every year. The share of revenuesmunicipalities receive from the annual state budget accounts for about 1/3 of localbudget revenues (Table 3.5).
Table 3.5 The Local Self-Governments’ Share of State Budget Expenditures
1996 1997 1998 1999 2000
Subsidies and Other Transfers [SKK bill.] 1.75 1.75 2.08 1.9 2.11
State Taxes [SKK bill.] 6.28 6.47 7.41 7.37 8.29
Transfers to Municipalities Total [SKK bill.] 8.03 8.22 9.49 9.27 10.40
Share in State Budget Expenditures [%] 4.2 4.3 4.8 3.9 4.3
SOURCE: State financial statements.
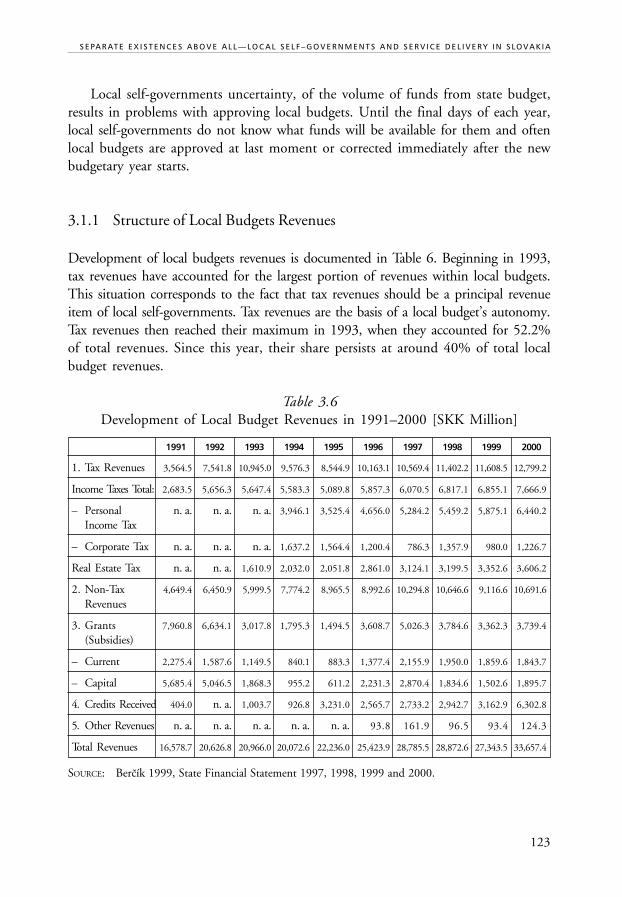
123
S E PA R AT E E X I S T E N C E S A B O V E A L L — LO C A L S E L F – G O V E R N M E N T S A N D S E R V I C E D E L I V E R Y I N S LOVA K I A
š
Local self-governments uncertainty, of the volume of funds from state budget,results in problems with approving local budgets. Until the final days of each year,local self-governments do not know what funds will be available for them and oftenlocal budgets are approved at last moment or corrected immediately after the newbudgetary year starts.
3.1.1 Structure of Local Budgets Revenues
Development of local budgets revenues is documented in Table 6. Beginning in 1993,tax revenues have accounted for the largest portion of revenues within local budgets.This situation corresponds to the fact that tax revenues should be a principal revenueitem of local self-governments. Tax revenues are the basis of a local budget’s autonomy.Tax revenues then reached their maximum in 1993, when they accounted for 52.2%of total revenues. Since this year, their share persists at around 40% of total localbudget revenues.
Table 3.6Development of Local Budget Revenues in 1991–2000 [SKK Million]
1991 1992 1993 1994 1995 1996 1997 1998 1999 2000
1. Tax Revenues 3,564.5 7,541.8 10,945.0 9,576.3 8,544.9 10,163.1 10,569.4 11,402.2 11,608.5 12,799.2
Income Taxes Total: 2,683.5 5,656.3 5,647.4 5,583.3 5,089.8 5,857.3 6,070.5 6,817.1 6,855.1 7,666.9
– Personal n. a. n. a. n. a. 3,946.1 3,525.4 4,656.0 5,284.2 5,459.2 5,875.1 6,440.2
Income Tax
– Corporate Tax n. a. n. a. n. a. 1,637.2 1,564.4 1,200.4 786.3 1,357.9 980.0 1,226.7
Real Estate Tax n. a. n. a. 1,610.9 2,032.0 2,051.8 2,861.0 3,124.1 3,199.5 3,352.6 3,606.2
2. Non-Tax 4,649.4 6,450.9 5,999.5 7,774.2 8,965.5 8,992.6 10,294.8 10,646.6 9,116.6 10,691.6
Revenues
3. Grants 7,960.8 6,634.1 3,017.8 1,795.3 1,494.5 3,608.7 5,026.3 3,784.6 3,362.3 3,739.4
(Subsidies)
– Current 2,275.4 1,587.6 1,149.5 840.1 883.3 1,377.4 2,155.9 1,950.0 1,859.6 1,843.7
– Capital 5,685.4 5,046.5 1,868.3 955.2 611.2 2,231.3 2,870.4 1,834.6 1,502.6 1,895.7
4. Credits Received 404.0 n. a. 1,003.7 926.8 3,231.0 2,565.7 2,733.2 2,942.7 3,162.9 6,302.8
5. Other Revenues n. a. n. a. n. a. n. a. n. a. 93.8 161.9 96.5 93.4 124.3
Total Revenues 16,578.7 20,626.8 20,966.0 20,072.6 22,236.0 25,423.9 28,785.5 28,872.6 27,343.5 33,657.4
SOURCE: Bercík 1999, State Financial Statement 1997, 1998, 1999 and 2000.
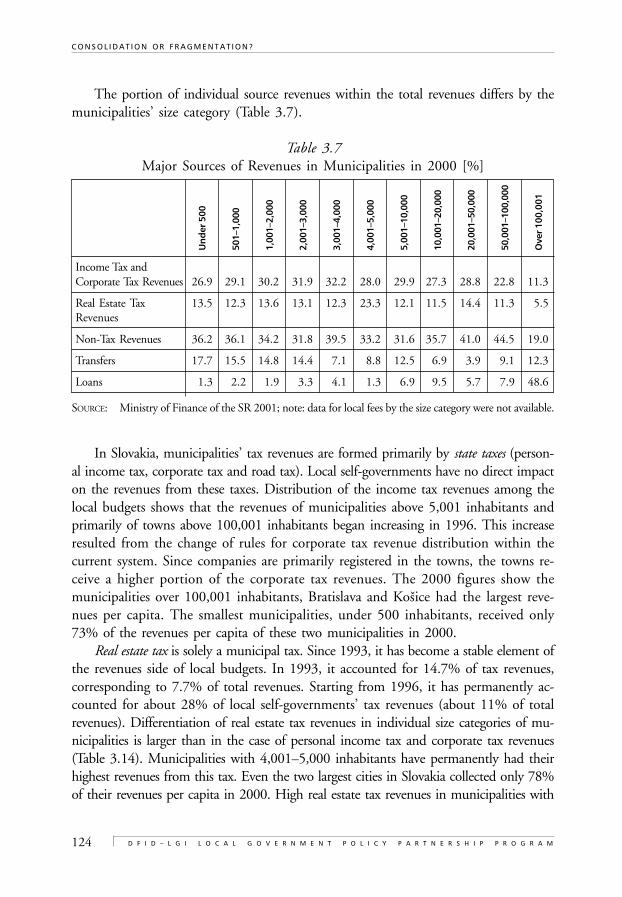
124
C O N S O L I D A T I O N O R F R A G M E N T A T I O N ?
D F I D – L G I L O C A L G O V E R N M E N T P O L I C Y P A R T N E R S H I P P R O G R A M
Un
der
500
501–
1,00
0
1,00
1–2,
000
2,00
1–3,
000
3,00
1–4,
000
4,00
1–5,
000
5,00
1–10
,000
10,0
01–2
0,00
0
20,0
01–5
0,00
0
50,0
01–1
00,0
00
Ove
r 100
,001
š
The portion of individual source revenues within the total revenues differs by themunicipalities’ size category (Table 3.7).
Table 3.7Major Sources of Revenues in Municipalities in 2000 [%]
Income Tax andCorporate Tax Revenues 26.9 29.1 30.2 31.9 32.2 28.0 29.9 27.3 28.8 22.8 11.3
Real Estate Tax 13.5 12.3 13.6 13.1 12.3 23.3 12.1 11.5 14.4 11.3 5.5Revenues
Non-Tax Revenues 36.2 36.1 34.2 31.8 39.5 33.2 31.6 35.7 41.0 44.5 19.0
Transfers 17.7 15.5 14.8 14.4 7.1 8.8 12.5 6.9 3.9 9.1 12.3
Loans 1.3 2.2 1.9 3.3 4.1 1.3 6.9 9.5 5.7 7.9 48.6
SOURCE: Ministry of Finance of the SR 2001; note: data for local fees by the size category were not available.
In Slovakia, municipalities’ tax revenues are formed primarily by state taxes (person-al income tax, corporate tax and road tax). Local self-governments have no direct impacton the revenues from these taxes. Distribution of the income tax revenues among thelocal budgets shows that the revenues of municipalities above 5,001 inhabitants andprimarily of towns above 100,001 inhabitants began increasing in 1996. This increaseresulted from the change of rules for corporate tax revenue distribution within thecurrent system. Since companies are primarily registered in the towns, the towns re-ceive a higher portion of the corporate tax revenues. The 2000 figures show themunicipalities over 100,001 inhabitants, Bratislava and Kosice had the largest reve-nues per capita. The smallest municipalities, under 500 inhabitants, received only73% of the revenues per capita of these two municipalities in 2000.
Real estate tax is solely a municipal tax. Since 1993, it has become a stable element ofthe revenues side of local budgets. In 1993, it accounted for 14.7% of tax revenues,corresponding to 7.7% of total revenues. Starting from 1996, it has permanently ac-counted for about 28% of local self-governments’ tax revenues (about 11% of totalrevenues). Differentiation of real estate tax revenues in individual size categories of mu-nicipalities is larger than in the case of personal income tax and corporate tax revenues(Table 3.14). Municipalities with 4,001–5,000 inhabitants have permanently had theirhighest revenues from this tax. Even the two largest cities in Slovakia collected only 78%of their revenues per capita in 2000. High real estate tax revenues in municipalities with
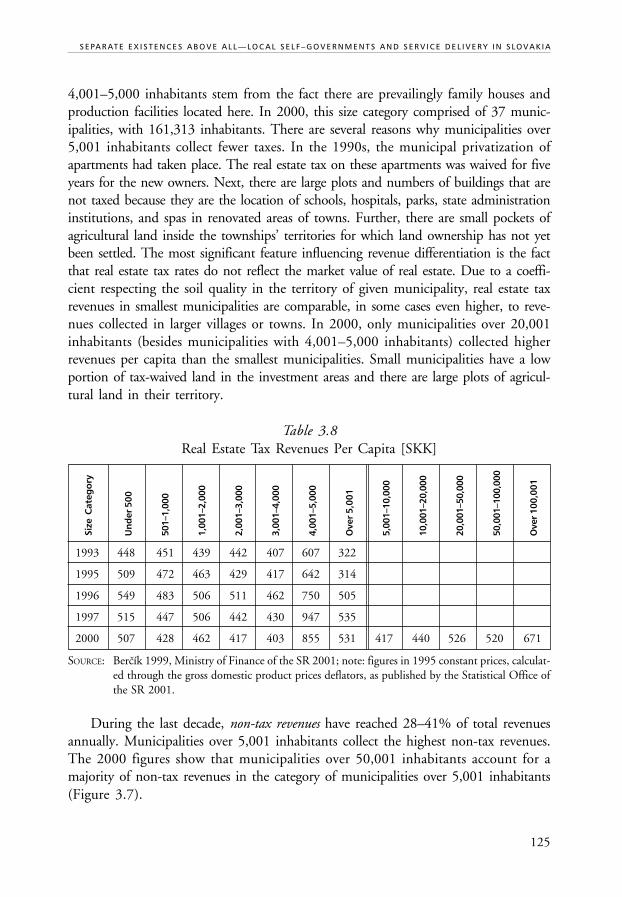
125
S E PA R AT E E X I S T E N C E S A B O V E A L L — LO C A L S E L F – G O V E R N M E N T S A N D S E R V I C E D E L I V E R Y I N S LOVA K I A
Un
der
500
501–
1,00
0
1,00
1–2,
000
2,00
1–3,
000
3,00
1–4,
000
4,00
1–5,
000
Ove
r 5,
001
5,00
1–10
,000
10,0
01–2
0,00
0
20,0
01–5
0,00
0
50,0
01–1
00,0
00
Ove
r 100
,001
š
4,001–5,000 inhabitants stem from the fact there are prevailingly family houses andproduction facilities located here. In 2000, this size category comprised of 37 munic-ipalities, with 161,313 inhabitants. There are several reasons why municipalities over5,001 inhabitants collect fewer taxes. In the 1990s, the municipal privatization ofapartments had taken place. The real estate tax on these apartments was waived for fiveyears for the new owners. Next, there are large plots and numbers of buildings that arenot taxed because they are the location of schools, hospitals, parks, state administrationinstitutions, and spas in renovated areas of towns. Further, there are small pockets ofagricultural land inside the townships’ territories for which land ownership has not yetbeen settled. The most significant feature influencing revenue differentiation is the factthat real estate tax rates do not reflect the market value of real estate. Due to a coeffi-cient respecting the soil quality in the territory of given municipality, real estate taxrevenues in smallest municipalities are comparable, in some cases even higher, to reve-nues collected in larger villages or towns. In 2000, only municipalities over 20,001inhabitants (besides municipalities with 4,001–5,000 inhabitants) collected higherrevenues per capita than the smallest municipalities. Small municipalities have a lowportion of tax-waived land in the investment areas and there are large plots of agricul-tural land in their territory.
Table 3.8Real Estate Tax Revenues Per Capita [SKK]
1993 448 451 439 442 407 607 322
1995 509 472 463 429 417 642 314
1996 549 483 506 511 462 750 505
1997 515 447 506 442 430 947 535
2000 507 428 462 417 403 855 531 417 440 526 520 671
SOURCE: Bercík 1999, Ministry of Finance of the SR 2001; note: figures in 1995 constant prices, calculat-ed through the gross domestic product prices deflators, as published by the Statistical Office ofthe SR 2001.
During the last decade, non-tax revenues have reached 28–41% of total revenuesannually. Municipalities over 5,001 inhabitants collect the highest non-tax revenues.The 2000 figures show that municipalities over 50,001 inhabitants account for amajority of non-tax revenues in the category of municipalities over 5,001 inhabitants(Figure 3.7).
Size
Cat
ego
ry
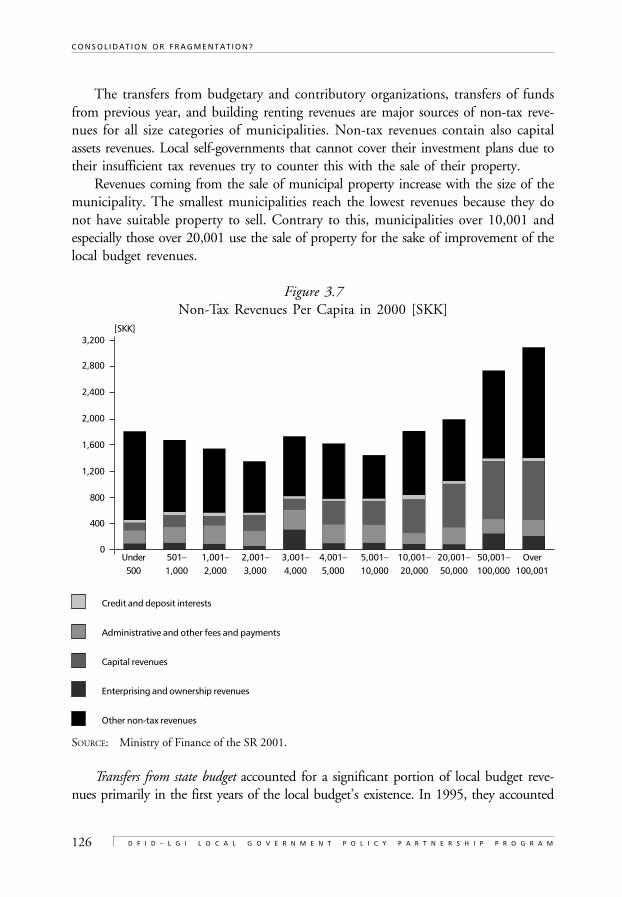
126
C O N S O L I D A T I O N O R F R A G M E N T A T I O N ?
D F I D – L G I L O C A L G O V E R N M E N T P O L I C Y P A R T N E R S H I P P R O G R A M
The transfers from budgetary and contributory organizations, transfers of fundsfrom previous year, and building renting revenues are major sources of non-tax reve-nues for all size categories of municipalities. Non-tax revenues contain also capitalassets revenues. Local self-governments that cannot cover their investment plans due totheir insufficient tax revenues try to counter this with the sale of their property.
Revenues coming from the sale of municipal property increase with the size of themunicipality. The smallest municipalities reach the lowest revenues because they donot have suitable property to sell. Contrary to this, municipalities over 10,001 andespecially those over 20,001 use the sale of property for the sake of improvement of thelocal budget revenues.
Figure 3.7Non-Tax Revenues Per Capita in 2000 [SKK]
Credit and deposit interests
Administrative and other fees and payments
Capital revenues
Enterprising and ownership revenues
Other non-tax revenues
SOURCE: Ministry of Finance of the SR 2001.
Transfers from state budget accounted for a significant portion of local budget reve-nues primarily in the first years of the local budget’s existence. In 1995, they accounted
3,200
2,800
2,400
2,000
1,600
1,200
800
400
0Under 501– 1,001– 2,001– 3,001– 4,001– 5,001– 10,001– 20,001– 50,001– Over500 1,000 2,000 3,000 4,000 5,000 10,000 20,000 50,000 100,000 100,001
[SKK]
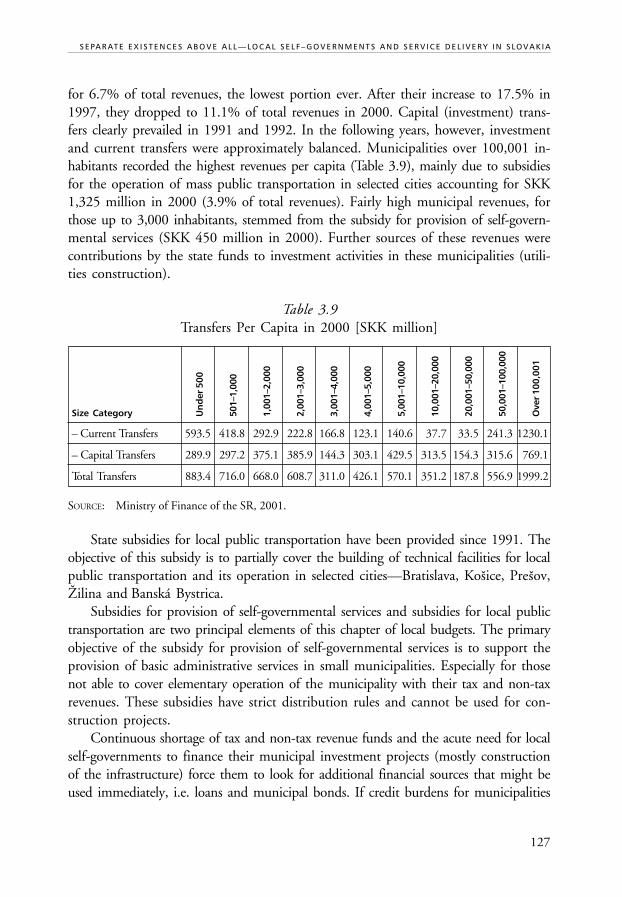
127
S E PA R AT E E X I S T E N C E S A B O V E A L L — LO C A L S E L F – G O V E R N M E N T S A N D S E R V I C E D E L I V E R Y I N S LOVA K I A
Un
der
500
501–
1,00
0
1,00
1–2,
000
2,00
1–3,
000
3,00
1–4,
000
4,00
1–5,
000
5,00
1–10
,000
10,0
01–2
0,00
0
20,0
01–5
0,00
0
50,0
01–1
00,0
00
Ove
r 100
,001
š
š š
for 6.7% of total revenues, the lowest portion ever. After their increase to 17.5% in1997, they dropped to 11.1% of total revenues in 2000. Capital (investment) trans-fers clearly prevailed in 1991 and 1992. In the following years, however, investmentand current transfers were approximately balanced. Municipalities over 100,001 in-habitants recorded the highest revenues per capita (Table 3.9), mainly due to subsidiesfor the operation of mass public transportation in selected cities accounting for SKK1,325 million in 2000 (3.9% of total revenues). Fairly high municipal revenues, forthose up to 3,000 inhabitants, stemmed from the subsidy for provision of self-govern-mental services (SKK 450 million in 2000). Further sources of these revenues werecontributions by the state funds to investment activities in these municipalities (utili-ties construction).
Table 3.9Transfers Per Capita in 2000 [SKK million]
Size Category
– Current Transfers 593.5 418.8 292.9 222.8 166.8 123.1 140.6 37.7 33.5 241.3 1230.1
– Capital Transfers 289.9 297.2 375.1 385.9 144.3 303.1 429.5 313.5 154.3 315.6 769.1
Total Transfers 883.4 716.0 668.0 608.7 311.0 426.1 570.1 351.2 187.8 556.9 1999.2
SOURCE: Ministry of Finance of the SR, 2001.
State subsidies for local public transportation have been provided since 1991. Theobjective of this subsidy is to partially cover the building of technical facilities for localpublic transportation and its operation in selected cities—Bratislava, Kosice, Presov,Zilina and Banská Bystrica.
Subsidies for provision of self-governmental services and subsidies for local publictransportation are two principal elements of this chapter of local budgets. The primaryobjective of the subsidy for provision of self-governmental services is to support theprovision of basic administrative services in small municipalities. Especially for thosenot able to cover elementary operation of the municipality with their tax and non-taxrevenues. These subsidies have strict distribution rules and cannot be used for con-struction projects.
Continuous shortage of tax and non-tax revenue funds and the acute need for localself-governments to finance their municipal investment projects (mostly constructionof the infrastructure) force them to look for additional financial sources that might beused immediately, i.e. loans and municipal bonds. If credit burdens for municipalities
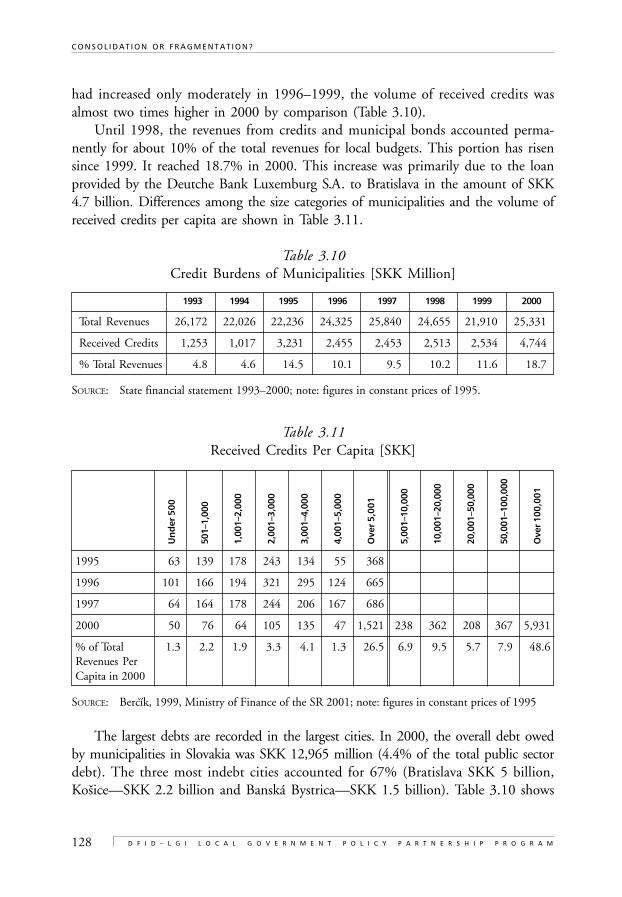
128
C O N S O L I D A T I O N O R F R A G M E N T A T I O N ?
D F I D – L G I L O C A L G O V E R N M E N T P O L I C Y P A R T N E R S H I P P R O G R A M
š
š
had increased only moderately in 1996–1999, the volume of received credits wasalmost two times higher in 2000 by comparison (Table 3.10).
Until 1998, the revenues from credits and municipal bonds accounted perma-nently for about 10% of the total revenues for local budgets. This portion has risensince 1999. It reached 18.7% in 2000. This increase was primarily due to the loanprovided by the Deutche Bank Luxemburg S.A. to Bratislava in the amount of SKK4.7 billion. Differences among the size categories of municipalities and the volume ofreceived credits per capita are shown in Table 3.11.
Table 3.10Credit Burdens of Municipalities [SKK Million]
1993 1994 1995 1996 1997 1998 1999 2000
Total Revenues 26,172 22,026 22,236 24,325 25,840 24,655 21,910 25,331
Received Credits 1,253 1,017 3,231 2,455 2,453 2,513 2,534 4,744
% Total Revenues 4.8 4.6 14.5 10.1 9.5 10.2 11.6 18.7
SOURCE: State financial statement 1993–2000; note: figures in constant prices of 1995.
Table 3.11Received Credits Per Capita [SKK]
1995 63 139 178 243 134 55 368
1996 101 166 194 321 295 124 665
1997 64 164 178 244 206 167 686
2000 50 76 64 105 135 47 1,521 238 362 208 367 5,931
% of Total 1.3 2.2 1.9 3.3 4.1 1.3 26.5 6.9 9.5 5.7 7.9 48.6Revenues PerCapita in 2000
SOURCE: Bercík, 1999, Ministry of Finance of the SR 2001; note: figures in constant prices of 1995
The largest debts are recorded in the largest cities. In 2000, the overall debt owedby municipalities in Slovakia was SKK 12,965 million (4.4% of the total public sectordebt). The three most indebt cities accounted for 67% (Bratislava SKK 5 billion,Kosice—SKK 2.2 billion and Banská Bystrica—SKK 1.5 billion). Table 3.10 shows
Un
der
500
501–
1,00
0
1,00
1–2,
000
2,00
1–3,
000
3,00
1–4,
000
4,00
1–5,
000
Ove
r 5,
001
5,00
1–10
,000
10,0
01–2
0,00
0
20,0
01–5
0,00
0
50,0
01–1
00,0
00
Ove
r 100
,001
129
S E PA R AT E E X I S T E N C E S A B O V E A L L — LO C A L S E L F – G O V E R N M E N T S A N D S E R V I C E D E L I V E R Y I N S LOVA K I A
that small municipalities, up to 500 inhabitants and municipalities with 4,001–5,000inhabitants, engage in loan taking least often. This relates to the capacity of a givenmunicipality to be accepted for a loan as well as from the fact large cities are the seats ofstate administration facilities and other important institutions and naturally appear tobe more “good looking”. Local self-governments do not perform favorable financial(credit) policies that are sure not to jeopardize the municipal finances for the nextelection term. Many local politicians do not think past the time period of their term inoffice. In 2000, credit revenues accounted for over a quarter of total revenues in munic-ipalities over 5,001 inhabitants. The majority of this debt was created by theaforementioned cities. In municipalities over 100,001 inhabitants, credits revenuesaccounted for as much as 48.6% of total revenues of local budgets.
The often unreasonable creation of debt by some municipalities finally resulted inthe legislative action of 2001. The resulting amendment to Act no. 303/1995, onbudgeting rules, specifies that the Slovakian Ministry of Finance must authorize allcredits given to municipalities over SKK 75 million. At the same time, further provi-sions preventing excessive creation of debt will come into effect January 1, 2005. Certainmunicipalities can use returnable funds or credits in order to provide their services.They may do so only if the total debt of municipality at the end of the budgetary yeardoes not exceed 60% of the current real revenues for the previous year. Another condi-tion is that annual repayment installments (including interest) for the debt cannotexceed 25% of the real current revenues for the previous budgetary year. Overall, debtsincurred by local self-governments equaled about SKK 12,965 million in 2000. Thisyear, it was 56.6% of current revenues (SKK 22,909.1 million). Total expendituresrelated to indebtedness were SKK 6,204.9 million in 2000, corresponding to 27.1%of current revenues of municipalities in 2000.
3.1.2 Structure of Local Self-Governments’ Expenditures
Budgetary expenditures may be broken into current (operational) and capital expendi-tures. Provision of loans, property shares, and debt installments are registered separately.The ratio of current expenditures (plus debt related expenditures8), and capital expen-ditures, oscillated from 58.6%: 41.4% to 76.7%: 23.3% during the last ten years.Starting in 1997, the ratio had increased, in favor of operational expenditures, to 76.7%:23.3% in 2000.
In 2000, the overall ratio of current and capital expenditures was more or lessidentical for all municipal size categories (Table 3.12). Municipalities with 2,001 to3,000 inhabitants achieved the lowest ratio. Capital expenditures accounted for 29%of total expenditures. Municipalities over 100,001 inhabitants experienced a differentratio. Capital expenditures were only 19%. We have to point out that this percentage
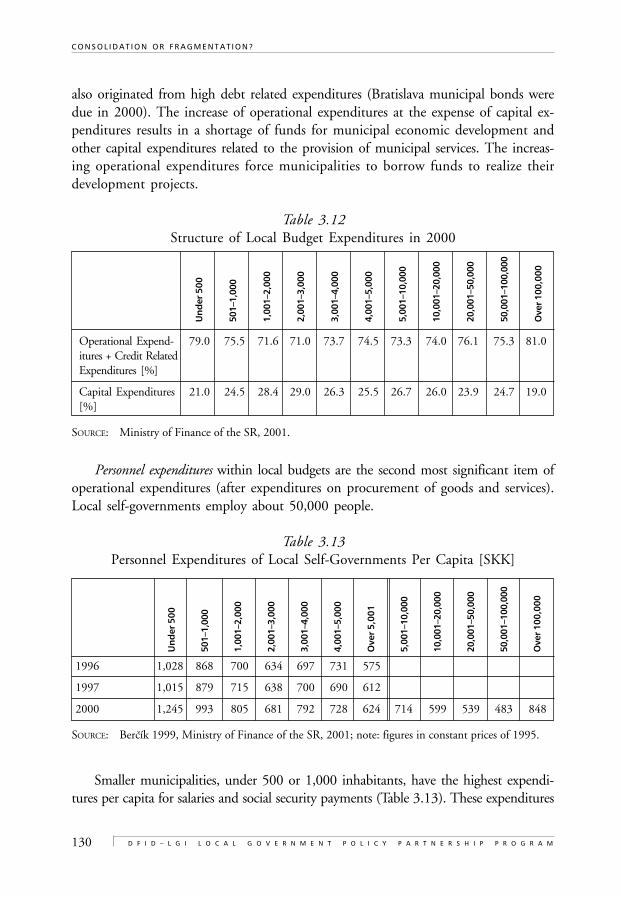
130
C O N S O L I D A T I O N O R F R A G M E N T A T I O N ?
D F I D – L G I L O C A L G O V E R N M E N T P O L I C Y P A R T N E R S H I P P R O G R A M
Un
der
500
501–
1,00
0
1,00
1–2,
000
2,00
1–3,
000
3,00
1–4,
000
4,00
1–5,
000
Ove
r 5,
001
5,00
1–10
,000
10,0
01–2
0,00
0
20,0
01–5
0,00
0
50,0
01–1
00,0
00
Ove
r 100
,000
Un
der
500
501–
1,00
0
1,00
1–2,
000
2,00
1–3,
000
3,00
1–4,
000
4,00
1–5,
000
5,00
1–10
,000
10,0
01–2
0,00
0
20,0
01–5
0,00
0
50,0
01–1
00,0
00
Ove
r 100
,000
š
also originated from high debt related expenditures (Bratislava municipal bonds weredue in 2000). The increase of operational expenditures at the expense of capital ex-penditures results in a shortage of funds for municipal economic development andother capital expenditures related to the provision of municipal services. The increas-ing operational expenditures force municipalities to borrow funds to realize theirdevelopment projects.
Table 3.12Structure of Local Budget Expenditures in 2000
Operational Expend- 79.0 75.5 71.6 71.0 73.7 74.5 73.3 74.0 76.1 75.3 81.0itures + Credit RelatedExpenditures [%]
Capital Expenditures 21.0 24.5 28.4 29.0 26.3 25.5 26.7 26.0 23.9 24.7 19.0[%]
SOURCE: Ministry of Finance of the SR, 2001.
Personnel expenditures within local budgets are the second most significant item ofoperational expenditures (after expenditures on procurement of goods and services).Local self-governments employ about 50,000 people.
Table 3.13Personnel Expenditures of Local Self-Governments Per Capita [SKK]
1996 1,028 868 700 634 697 731 575
1997 1,015 879 715 638 700 690 612
2000 1,245 993 805 681 792 728 624 714 599 539 483 848
SOURCE: Bercík 1999, Ministry of Finance of the SR, 2001; note: figures in constant prices of 1995.
Smaller municipalities, under 500 or 1,000 inhabitants, have the highest expendi-tures per capita for salaries and social security payments (Table 3.13). These expenditures
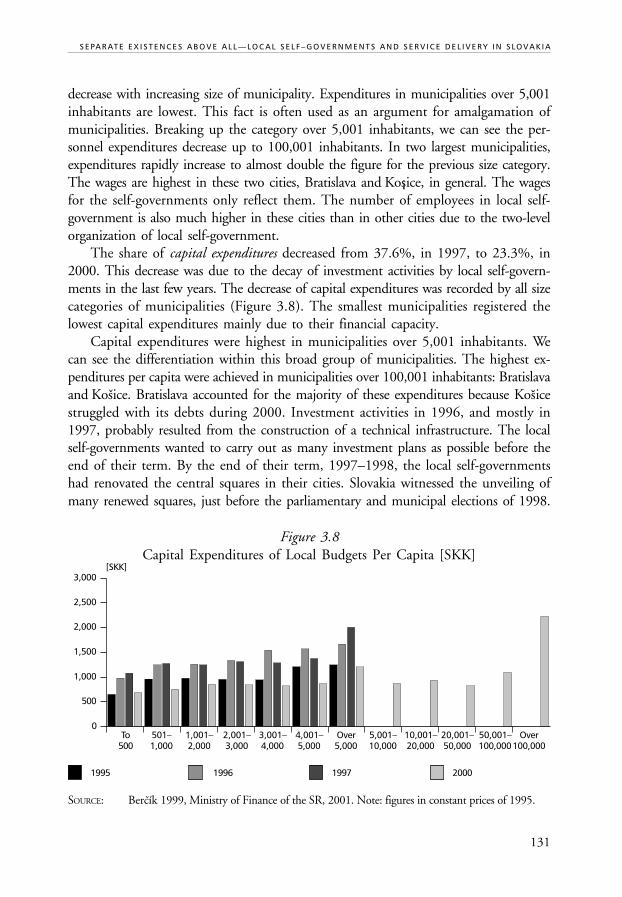
131
S E PA R AT E E X I S T E N C E S A B O V E A L L — LO C A L S E L F – G O V E R N M E N T S A N D S E R V I C E D E L I V E R Y I N S LOVA K I A
šš
2,500
2,000
1,500
1,000
500
0
3,000
To 501– 1,001– 2,001– 3,001– 4,001– Over 5,001– 10,001– 20,001– 50,001– Over500 1,000 2,000 3,000 4,000 5,000 5,000 10,000 20,000 50,000 100,000100,000
š
decrease with increasing size of municipality. Expenditures in municipalities over 5,001inhabitants are lowest. This fact is often used as an argument for amalgamation ofmunicipalities. Breaking up the category over 5,001 inhabitants, we can see the per-sonnel expenditures decrease up to 100,001 inhabitants. In two largest municipalities,expenditures rapidly increase to almost double the figure for the previous size category.The wages are highest in these two cities, Bratislava and Kos¡ice, in general. The wagesfor the self-governments only reflect them. The number of employees in local self-government is also much higher in these cities than in other cities due to the two-levelorganization of local self-government.
The share of capital expenditures decreased from 37.6%, in 1997, to 23.3%, in2000. This decrease was due to the decay of investment activities by local self-govern-ments in the last few years. The decrease of capital expenditures was recorded by all sizecategories of municipalities (Figure 3.8). The smallest municipalities registered thelowest capital expenditures mainly due to their financial capacity.
Capital expenditures were highest in municipalities over 5,001 inhabitants. Wecan see the differentiation within this broad group of municipalities. The highest ex-penditures per capita were achieved in municipalities over 100,001 inhabitants: Bratislavaand Kosice. Bratislava accounted for the majority of these expenditures because Kosicestruggled with its debts during 2000. Investment activities in 1996, and mostly in1997, probably resulted from the construction of a technical infrastructure. The localself-governments wanted to carry out as many investment plans as possible before theend of their term. By the end of their term, 1997–1998, the local self-governmentshad renovated the central squares in their cities. Slovakia witnessed the unveiling ofmany renewed squares, just before the parliamentary and municipal elections of 1998.
Figure 3.8Capital Expenditures of Local Budgets Per Capita [SKK]
1995 1996 1997 2000
SOURCE: Bercík 1999, Ministry of Finance of the SR, 2001. Note: figures in constant prices of 1995.
[SKK]
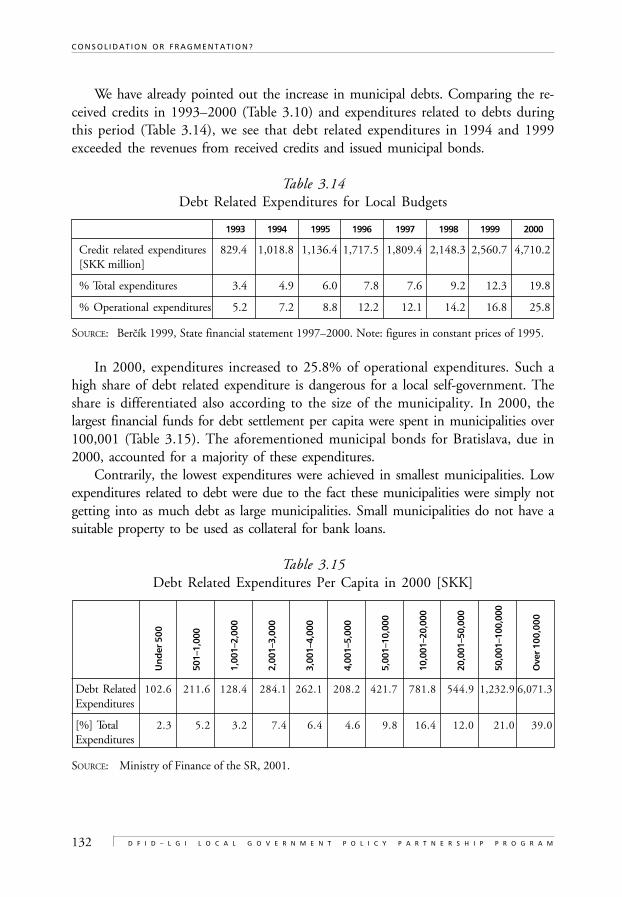
132
C O N S O L I D A T I O N O R F R A G M E N T A T I O N ?
D F I D – L G I L O C A L G O V E R N M E N T P O L I C Y P A R T N E R S H I P P R O G R A M
Un
der
500
501–
1,00
0
1,00
1–2,
000
2,00
1–3,
000
3,00
1–4,
000
4,00
1–5,
000
5,00
1–10
,000
10,0
01–2
0,00
0
20,0
01–5
0,00
0
50,0
01–1
00,0
00
Ove
r 100
,000
š
We have already pointed out the increase in municipal debts. Comparing the re-ceived credits in 1993–2000 (Table 3.10) and expenditures related to debts duringthis period (Table 3.14), we see that debt related expenditures in 1994 and 1999exceeded the revenues from received credits and issued municipal bonds.
Table 3.14Debt Related Expenditures for Local Budgets
1993 1994 1995 1996 1997 1998 1999 2000
Credit related expenditures 829.4 1,018.8 1,136.4 1,717.5 1,809.4 2,148.3 2,560.7 4,710.2[SKK million]
% Total expenditures 3.4 4.9 6.0 7.8 7.6 9.2 12.3 19.8
% Operational expenditures 5.2 7.2 8.8 12.2 12.1 14.2 16.8 25.8
SOURCE: Bercík 1999, State financial statement 1997–2000. Note: figures in constant prices of 1995.
In 2000, expenditures increased to 25.8% of operational expenditures. Such ahigh share of debt related expenditure is dangerous for a local self-government. Theshare is differentiated also according to the size of the municipality. In 2000, thelargest financial funds for debt settlement per capita were spent in municipalities over100,001 (Table 3.15). The aforementioned municipal bonds for Bratislava, due in2000, accounted for a majority of these expenditures.
Contrarily, the lowest expenditures were achieved in smallest municipalities. Lowexpenditures related to debt were due to the fact these municipalities were simply notgetting into as much debt as large municipalities. Small municipalities do not have asuitable property to be used as collateral for bank loans.
Table 3.15Debt Related Expenditures Per Capita in 2000 [SKK]
Debt Related 102.6 211.6 128.4 284.1 262.1 208.2 421.7 781.8 544.9 1,232.9 6,071.3Expenditures
[%] Total 2.3 5.2 3.2 7.4 6.4 4.6 9.8 16.4 12.0 21.0 39.0Expenditures
SOURCE: Ministry of Finance of the SR, 2001.
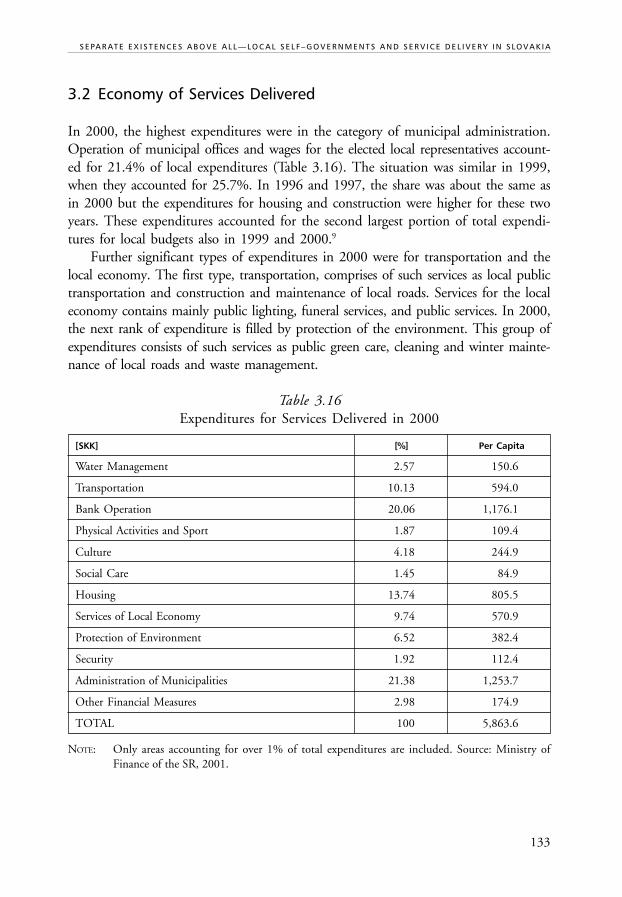
133
S E PA R AT E E X I S T E N C E S A B O V E A L L — LO C A L S E L F – G O V E R N M E N T S A N D S E R V I C E D E L I V E R Y I N S LOVA K I A
3.2 Economy of Services Delivered
In 2000, the highest expenditures were in the category of municipal administration.Operation of municipal offices and wages for the elected local representatives account-ed for 21.4% of local expenditures (Table 3.16). The situation was similar in 1999,when they accounted for 25.7%. In 1996 and 1997, the share was about the same asin 2000 but the expenditures for housing and construction were higher for these twoyears. These expenditures accounted for the second largest portion of total expendi-tures for local budgets also in 1999 and 2000.9
Further significant types of expenditures in 2000 were for transportation and thelocal economy. The first type, transportation, comprises of such services as local publictransportation and construction and maintenance of local roads. Services for the localeconomy contains mainly public lighting, funeral services, and public services. In 2000,the next rank of expenditure is filled by protection of the environment. This group ofexpenditures consists of such services as public green care, cleaning and winter mainte-nance of local roads and waste management.
Table 3.16Expenditures for Services Delivered in 2000
[SKK] [%] Per Capita
Water Management 2.57 150.6
Transportation 10.13 594.0
Bank Operation 20.06 1,176.1
Physical Activities and Sport 1.87 109.4
Culture 4.18 244.9
Social Care 1.45 84.9
Housing 13.74 805.5
Services of Local Economy 9.74 570.9
Protection of Environment 6.52 382.4
Security 1.92 112.4
Administration of Municipalities 21.38 1,253.7
Other Financial Measures 2.98 174.9
TOTAL 100 5,863.6
NOTE: Only areas accounting for over 1% of total expenditures are included. Source: Ministry ofFinance of the SR, 2001.
134
C O N S O L I D A T I O N O R F R A G M E N T A T I O N ?
D F I D – L G I L O C A L G O V E R N M E N T P O L I C Y P A R T N E R S H I P P R O G R A M
š
All the aforementioned services, together with water management services (watersupply and sewage), which accounted for 2.6%, fall under the basic responsibilities oflocal self-governments. Culture, social welfare, physical education, healthcare, school-ing and education accounted for a portion of local budget expenditures proportional tothe scope of competencies given to local self-governments in these areas.10
The following section deals with select examples of services delivery by local self-governments, diverging by size category.
3.2.1 Road Management
The municipality is the owner of the local roads. It is obliged to provide for their main-tenance and function. The municipality carries out construction of local roads as well.In 1997, a total of 24,978.7 km of roadways were under municipal ownership. Besidesthese, municipalities owned 11,347 km of sidewalks, 1,022 city squares, 9,172 park-ing lots, 127 transportation-training playgrounds, 9,080 bridges, 3,490 pedestrianbridges, 1,094 railroad crossings and 258 traffic lights.
Local self-governments provide these services differently, depending on the size ofthe municipality. The cities have their municipal organizations to take care of roadmanagement. Such organization is called the Technické sluzby (technical services) andit often also provides waste management, public green care, management of cemeteries,etc. If the municipality does not have such an organization, it contracts either the statecompany taking care of state roads or another private provider. This is usually the casein small towns and villages.
In 1997, expenditures for road management reached SKK 1,640.9 million (ex-cluding winter maintenance) corresponding to 6.2% of the total expenditures for thelocal budget. It then increased to SKK 1,993.5 million (7.6%) in 1999 and to SKK2,063.9 million (6.6%) in 2000. Differentiation among the different size categories ofmunicipalities can be observed (Figure 3.9).
The largest expenditures per capita were made in municipalities with 4,001 to5,000 inhabitants. These municipalities have fairly large territories and a respectivelength of local roads. Road management expenditures accounted for 11.9% of totalexpenditures in these municipalities (2000). High expenditures in this category werereached also in municipalities over 100,001 inhabitants (the highest per capita expen-ditures). The expenditures for local roads’ winter maintenance played a substantial rolein these municipalities (52%). In 2000, this accounted for more expenditures than forconstruction and maintenance of local roads (42%). In the other size categories, theexpenditures for construction and repairs of local roads prevailed. The highest expendi-tures of this nature were reached in municipalities with 4,001 to 5,000 inhabitantsand over 100,001 inhabitants.
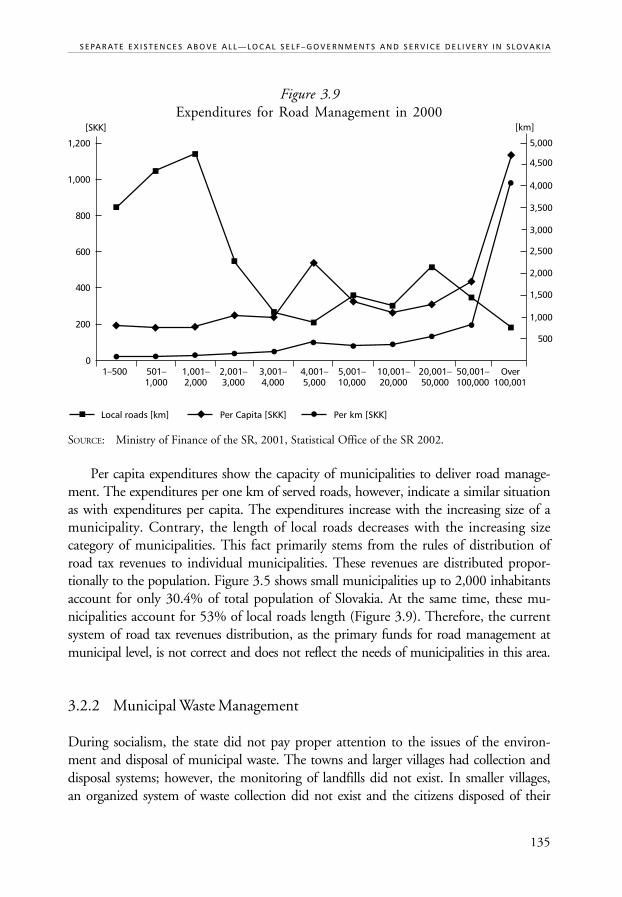
135
S E PA R AT E E X I S T E N C E S A B O V E A L L — LO C A L S E L F – G O V E R N M E N T S A N D S E R V I C E D E L I V E R Y I N S LOVA K I A
Figure 3.9Expenditures for Road Management in 2000
Local roads [km] Per Capita [SKK] Per km [SKK]
SOURCE: Ministry of Finance of the SR, 2001, Statistical Office of the SR 2002.
Per capita expenditures show the capacity of municipalities to deliver road manage-ment. The expenditures per one km of served roads, however, indicate a similar situationas with expenditures per capita. The expenditures increase with the increasing size of amunicipality. Contrary, the length of local roads decreases with the increasing sizecategory of municipalities. This fact primarily stems from the rules of distribution ofroad tax revenues to individual municipalities. These revenues are distributed propor-tionally to the population. Figure 3.5 shows small municipalities up to 2,000 inhabitantsaccount for only 30.4% of total population of Slovakia. At the same time, these mu-nicipalities account for 53% of local roads length (Figure 3.9). Therefore, the currentsystem of road tax revenues distribution, as the primary funds for road management atmunicipal level, is not correct and does not reflect the needs of municipalities in this area.
3.2.2 Municipal Waste Management
During socialism, the state did not pay proper attention to the issues of the environ-ment and disposal of municipal waste. The towns and larger villages had collection anddisposal systems; however, the monitoring of landfills did not exist. In smaller villages,an organized system of waste collection did not exist and the citizens disposed of their
1,200
1,000
800
600
400
200
01–500 501– 1,001– 2,001– 3,001– 4,001– 5,001– 10,001– 20,001– 50,001– Over
1,000 2,000 3,000 4,000 5,000 10,000 20,000 50,000 100,000 100,001
[SKK] [km]
5,000
4,500
4,000
3,500
3,000
2,500
2,000
1,500
1,000
500
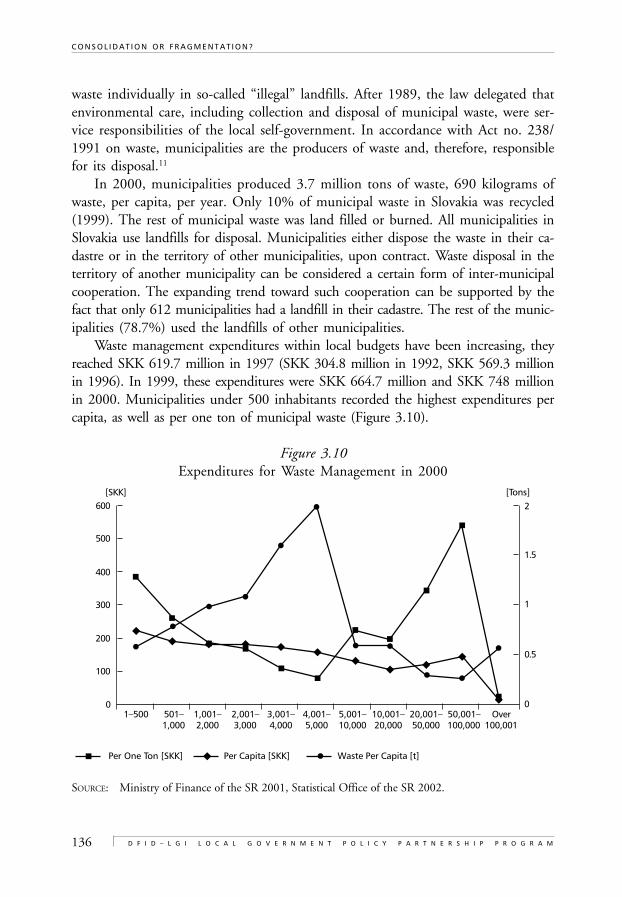
136
C O N S O L I D A T I O N O R F R A G M E N T A T I O N ?
D F I D – L G I L O C A L G O V E R N M E N T P O L I C Y P A R T N E R S H I P P R O G R A M
waste individually in so-called “illegal” landfills. After 1989, the law delegated thatenvironmental care, including collection and disposal of municipal waste, were ser-vice responsibilities of the local self-government. In accordance with Act no. 238/1991 on waste, municipalities are the producers of waste and, therefore, responsiblefor its disposal.11
In 2000, municipalities produced 3.7 million tons of waste, 690 kilograms ofwaste, per capita, per year. Only 10% of municipal waste in Slovakia was recycled(1999). The rest of municipal waste was land filled or burned. All municipalities inSlovakia use landfills for disposal. Municipalities either dispose the waste in their ca-dastre or in the territory of other municipalities, upon contract. Waste disposal in theterritory of another municipality can be considered a certain form of inter-municipalcooperation. The expanding trend toward such cooperation can be supported by thefact that only 612 municipalities had a landfill in their cadastre. The rest of the munic-ipalities (78.7%) used the landfills of other municipalities.
Waste management expenditures within local budgets have been increasing, theyreached SKK 619.7 million in 1997 (SKK 304.8 million in 1992, SKK 569.3 millionin 1996). In 1999, these expenditures were SKK 664.7 million and SKK 748 millionin 2000. Municipalities under 500 inhabitants recorded the highest expenditures percapita, as well as per one ton of municipal waste (Figure 3.10).
Figure 3.10Expenditures for Waste Management in 2000
Per One Ton [SKK] Per Capita [SKK] Waste Per Capita [t]
SOURCE: Ministry of Finance of the SR 2001, Statistical Office of the SR 2002.
600 2
1.5
1
0.5
0
500
400
300
200
100
01–500 501– 1,001– 2,001– 3,001– 4,001– 5,001– 10,001– 20,001– 50,001– Over
1,000 2,000 3,000 4,000 5,000 10,000 20,000 50,000 100,000 100,001
[SKK] [Tons]
137
S E PA R AT E E X I S T E N C E S A B O V E A L L — LO C A L S E L F – G O V E R N M E N T S A N D S E R V I C E D E L I V E R Y I N S LOVA K I A
Even though this size category maintained a low volume of municipal waste pro-duction in comparison to the other size categories, the expenditures are higher than inother categories. The expenditures of local self-governments per capita decreased withincreasing population. The expenditures per one ton feature almost U-shape distribu-tion throughout the size categories. This distribution pattern is interrupted only bythe largest cities (above 100,001 people). Contrary to expenditures distribution perton of waste, the volume of waste per capita reached inverse distribution with a maxi-mum in the 4,001–5,000 inhabitants size category. In the largest municipalities, whichcontract special companies to carry out waste management, the transfers to such com-panies to cover potential losses account for a majority of the total municipal expendituresfor waste management (analyzed here). Further targets of municipal spending in thisarea are the expenditures for construction of monitored landfills and to support pro-gressive methods of separation.
3.2.3 Municipal Office Administration
Municipalities’ administration expenditures are the major item on local budgets’ ex-penditure agenda. These expenditures comprise of the expenditure on elected localself-government representatives and for administration of the municipal offices.
The mayor’s financial allowances are provided by Act no. 253/1994. The mini-mum wage for the mayor is a multiple of the average monthly wage within the economyfor the previous year. The multiple differentiates according to the population of themunicipality. For example, in municipalities up to 500 inhabitants the multiple equals1.35 and in municipalities with 50,001–100,000 inhabitants the multiple equals3.06. The municipal council can grant the mayor bonuses up to 50% of his/her min-imum wage. The municipal councilors receive small financial rewards (as approved bythe council) for every meeting.
In 2000, the expenditures for municipal offices operation totaled SKK 6.4 billion,what accounted for 20.5% of local self-governments’ total expenditures. In 1999, theamount was the same, but it accounted for 24.6% of total expenditures. The expendi-tures were SKK 4.8 billion in 1996 (20.7%) and SKK 5.4 billion in 1997 (20.3%).Personnel expenditures (wages and social security) accounted for a majority of theseexpenditures. As for the size categories of municipalities, the expenditures per capitaare highest in municipalities up to 2,000 inhabitants. In 1999, the expenditures werealso comparably high in the two largest Slovakian cities.
Information on the expenditures of individual size categories of municipalities foradministration of municipal offices is provided in Figure 3.11. Municipalities under500 inhabitants had the highest expenditures in 2000. These expenditures accountedfor almost 50% of the total expenditures for these municipalities. If we consider that
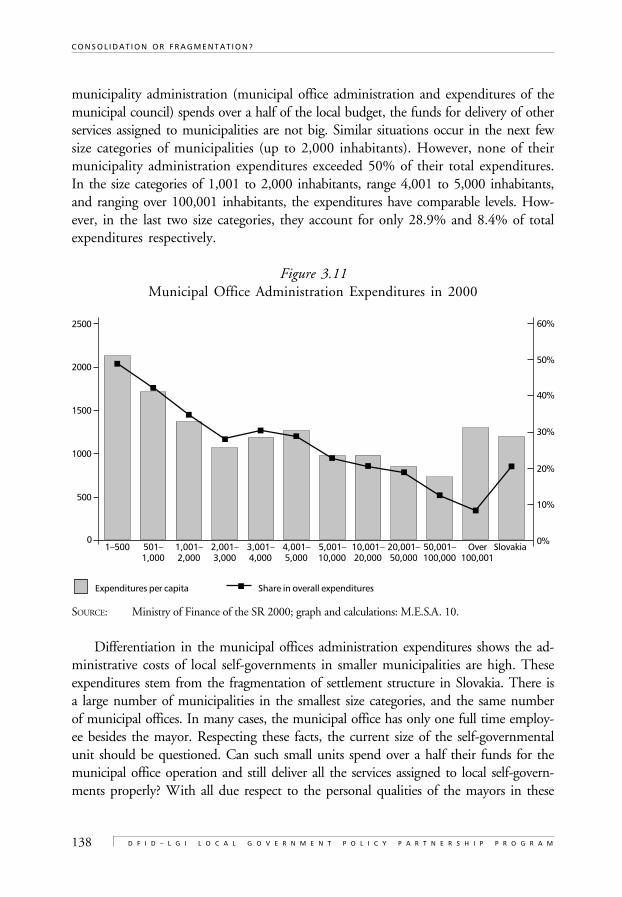
138
C O N S O L I D A T I O N O R F R A G M E N T A T I O N ?
D F I D – L G I L O C A L G O V E R N M E N T P O L I C Y P A R T N E R S H I P P R O G R A M
municipality administration (municipal office administration and expenditures of themunicipal council) spends over a half of the local budget, the funds for delivery of otherservices assigned to municipalities are not big. Similar situations occur in the next fewsize categories of municipalities (up to 2,000 inhabitants). However, none of theirmunicipality administration expenditures exceeded 50% of their total expenditures.In the size categories of 1,001 to 2,000 inhabitants, range 4,001 to 5,000 inhabitants,and ranging over 100,001 inhabitants, the expenditures have comparable levels. How-ever, in the last two size categories, they account for only 28.9% and 8.4% of totalexpenditures respectively.
Figure 3.11Municipal Office Administration Expenditures in 2000
Expenditures per capita Share in overall expenditures
SOURCE: Ministry of Finance of the SR 2000; graph and calculations: M.E.S.A. 10.
Differentiation in the municipal offices administration expenditures shows the ad-ministrative costs of local self-governments in smaller municipalities are high. Theseexpenditures stem from the fragmentation of settlement structure in Slovakia. There isa large number of municipalities in the smallest size categories, and the same numberof municipal offices. In many cases, the municipal office has only one full time employ-ee besides the mayor. Respecting these facts, the current size of the self-governmentalunit should be questioned. Can such small units spend over a half their funds for themunicipal office operation and still deliver all the services assigned to local self-govern-ments properly? With all due respect to the personal qualities of the mayors in these
60%
1–500 501– 1,001– 2,001– 3,001– 4,001– 5,001– 10,001– 20,001– 50,001– Over Slovakia1,000 2,000 3,000 4,000 5,000 10,000 20,000 50,000 100,000 100,001
2500
2000
1500
1000
500
0
50%
40%
30%
20%
10%
0%

139
S E PA R AT E E X I S T E N C E S A B O V E A L L — LO C A L S E L F – G O V E R N M E N T S A N D S E R V I C E D E L I V E R Y I N S LOVA K I A
small municipalities, one person cannot manage delivery of all those services. Concern-ing expertise, as well as the mere physical potential, it is just not possible for one personto do. Establishment of joint municipal offices or defining the minimum size of anadministrative unit of local self-government by the law can be solutions to this problem(see section 6). Both alternatives, however, bring some negatives that are discussed insettlement structure chapter and the inter-municipal cooperation chapter.
3.2.4 Economic Development
Municipal law no. 369/1990 obliges a municipality to administer and appreciate itsproperty and form suitable conditions for living in the municipality. Municipalities inSlovakia are also allowed to carry out entrepreneurial activities. The revenues of suchactivities can be used for development of the municipality.
Local self-governments are allowed to support economic development in their ter-ritory indirectly through creation of appropriate environments for development ofenterprise activity. The only direct support they can provide for potential enterprise isthe provision of waivers or reduction of real estate taxes or other local fees. Municipal-ities use this option quite often and we can see this from the municipal revenues of realestate taxes in municipalities over 5,000 inhabitants. These municipalities have thelargest concentrations of business activities (section 3.1.1). A further tool for directlysupporting economic development is favorable fees for rental of municipal property forthe sake of performing some economic activity in it. Municipalities can enhanceeconomic development through direct participation in a commercial company. Localself-governments often participate by putting its property (building, land) forth tosuch companies.
The municipalities create conditions for economic activities in their territory throughphysical planning activities, investment into building of water works and sewage sys-tems, assisting in building of energy distribution lines. Since 2001, municipalities canuse the creation of industrial parks to attract economic activities to their territory.However, the construction of industrial parks is not funded solely by municipal sourc-es. The state budget can grant a subsidy worth up to 70% of the expenditures forconstruction of an industrial park. The subsidized investments are mainly for construc-tion of the technical infrastructure in areas appointed for industrial parks.
The capacity of individual municipalities to engage in activities towards economicdevelopment differs according to their size. Small municipalities have smaller budgets.We have already shown before that these municipalities spent substantial portions oftheir budget for delivery of basic administrative tasks and for financing the operation ofmunicipal offices. Small municipalities have consequently little funds left for invest-ment into economically enhancing development in their territory. Small municipalities
140
C O N S O L I D A T I O N O R F R A G M E N T A T I O N ?
D F I D – L G I L O C A L G O V E R N M E N T P O L I C Y P A R T N E R S H I P P R O G R A M
do not even have an updated Master Plan, since there are no funds left for it. TheMaster Plans of many small villages have not been elaborated since Socialist days. Largeportions of municipalities use amendments to still existing (yet outdated) Master Plansinstead of elaborating new ones. The development of municipalities is therefore, to alarge extent, not systemic. Large municipalities, and larger villages and towns, havelower expenditures for municipal offices operation and their capacity to gain returnablefunds is much higher than in the case of small municipalities. These municipalities canfocus on almost any kind of plan supporting economic development in their territory.
4. INTER-MUNICIPAL COOPERATION AND SERVICES PROVISION
4.1 Legal Settings for Inter-Municipal Cooperation
In Slovakia, municipalities can associate with other municipalities for the sake of pro-viding services of common interest. The framework contained in the Constitution ofthe Slovak Republic is further elaborated in the Municipal Law.
There are three basic groups of inter-municipal cooperation:1) Provision of administrative tasks—there are several legal forms for executing
administrative competencies of local self-governments through inter-munici-pal cooperation:• Joint municipal offices—Art. 16a of the Municipal law namely allows
creation of joint municipal offices. This provision was added in 1992.The municipalities have not often used this option given by the law. Theyargue the law did not set up details for creation and operation of the jointmunicipal offices.12 According to the law, joint municipal offices are es-tablished upon voluntary principles. Individual municipalities participatefinancially in the operation of the joint office in accordance to their agree-ment. The control of the tasks’ fulfillment and the funds’ use can be carriedout via individual municipal councils or in the joint meeting of all foundersof the joint office;
• Delegation of delivery to the bodies of other municipalities;• Delegation of delivery to other public entities.
2) Provision of social and economic development and services—inter-municipalcooperation that carries out social and economic development, utilities andentrepreneurial activities can be realized, in accordance to the Slovak legisla-tion and practice, via several legal forms such as interest associations, privateenterprise with the municipal share, non-profit organization and cross-bordercooperation.
141
S E PA R AT E E X I S T E N C E S A B O V E A L L — LO C A L S E L F – G O V E R N M E N T S A N D S E R V I C E D E L I V E R Y I N S LOVA K I A
3) Other cooperation—there are other forms of inter-municipal cooperation, whichdo not fit into the previous two groups such as country, regional, and municipalinterest associations, municipal conferences and cooperation of the partnercities and villages.
The legal system in Slovakia enables all entities (except the bodies of state adminis-tration) to carry out any activity the law does not forbid and does not collide with goodmanners. Based upon this specification within Slovak legislation, municipalities will-ing to engage in inter-municipal cooperation have found legal support in laws otherthan the Municipal law. The existing examples of inter-municipal cooperation are thebest proof of such a statement. The following sections provide some examples of inter-municipal cooperation in Slovakia.
4.2 Areas of Inter-Municipal Cooperation
Local self-governments’ limited financial sources and limited personnel capacity, aswell as the scope of services they have to provide within the public administrationin Slovakia, are the main reasons municipalities associate their funds and providesome services together. Basically, there are two main groups of local self-govern-ment competencies: administrative and economic-social. So far, the municipalitieshave used inter-municipal cooperation prevailingly for provision of their economic-social competencies. These competencies expect fairly high investments and a numberof municipalities, mostly small ones, do not have them.
In the section about local self-government financing, we pointed out the increase ofoperational expenditures of local self-governments as an expense of investment expen-ditures. This fact is the main reason for municipalities to engage in inter-municipalcooperation. Further reasons are the fact that provision of economic-social services ismore economically efficient as the joint activity of more municipalities and the lack ofqualified personnel to provide administrative competencies for local self-governments.
Out of the forms of inter-municipal cooperation allowed by Slovak legislation, thefollowing two are the most common:
1) Regional associations of universal character. In Slovakia, an Association of Citiesand Villages in Slovakia (ZMOS) exists. It associates 2,719 cities and villagesin order to articulate the joint interest of local self-governments.13 There are57 regional associations operating within ZMOS. The scope of their activitiesis very universal. They focus on the creation of conditions for the differentforms of above-mentioned municipal relations, formulation of joint commentsand organization of joint steps in issues concerning local self-government. ZMOStransfers information within local self-governments; it negotiates needed laws
142
C O N S O L I D A T I O N O R F R A G M E N T A T I O N ?
D F I D – L G I L O C A L G O V E R N M E N T P O L I C Y P A R T N E R S H I P P R O G R A M
with ministries and deputies of Parliament; it is the commenting body withinthe law-approving process; it organizes the education of the elected representa-tives and employees of local self-governments.The Union of Cities of Slovakia, the interest association for Slovak cities, fol-lows a similar goal. It comprises of 43 member cities and 8 rural municipalities.This association was created due to specific city problems resulting from thestructure of local self-governments. According to the founders, these specifici-ties were not sufficiently articulated via ZMOS.
2) Specific purpose associations of municipalities are being created in order to providegreater competencies in economic and social development. The majority ofsuch cooperation is a one-purpose cooperation of municipalities. Complexresearch into such cooperative activities has not yet been done in Slovakia. EvenZMOS, as an association of local self-governments, does not follow such activ-ities by its member municipalities.
Inter-municipal cooperation in Slovakia is developed mostly in the areas of: munic-ipal waste management; waste water treatment, tourism, protection of the environment,regional education, culture, education, social issues, coordination and planning of de-velopment activities, joint projects of technical infrastructure (gas and water supply),organization of regional advisory and information centers, regional development agen-cies, healthcare and joint enterprise (in cooperation with the private sector).
Act no. 416/2001 covers the transfer of some competencies from the bodies of stateadministration to municipalities and self-governmental regions. It also sets up poten-tial areas of inter-municipal cooperation: social help, local and regional culture,elementary and specialized education and retraining, primary and secondary contacthealthcare, Construction Act implementations, and water management.
4.3 Examples of Inter-Municipal Cooperation
4.3.1 Economic and Social Services
Municipal Waste ManagementInter-municipal cooperation mostly focuses on finding solutions to the issues of mu-nicipal waste management. Perhaps the best-elaborated scheme is offered through theexample of the Komplex association of Sered’. In this association, the city of Sered’ andten surrounding rural municipalities joined together to address the issue of localizationof a landfill and organization of waste management. Similar associations exist amongsurrounding municipalities of Malacky. Six municipalities, including the city of Mal-acky, and four private companies joined to address the waste management issue. The
143
S E PA R AT E E X I S T E N C E S A B O V E A L L — LO C A L S E L F – G O V E R N M E N T S A N D S E R V I C E D E L I V E R Y I N S LOVA K I A
š
š š
š
association of 48 municipalities, and the city of Sobrance, focuses on construction andmanagement of landfills too. There is cooperation between 15 municipalities in theregional association of Podunajsko on a project of municipal waste, including its sepa-ration and use. The landfill issues are the purpose of the regional association ofmunicipalities for the 23 municipalities of the Laborec area. There are several associa-tions of municipalities for the separation of waste in Slovakia, for example, the Associationof municipalities for the waste separation—SPIS—and the Association of Municipali-ties for Waste Separation in Javorina-Bezovec.
Komplex-Lobbe s.r.o., Sered’
In 1992, the interest association Komplex was established in Sered’. Its main objective was thepreparatory works for, and operation of, the landfill in Pusté Sady. The membership compris-es of ten neighboring villages of Sered’ and the city of Sered’. Basic capital for the associationconsists of financial contributions by the founders, subsidies, credits and operational profits.The founders funded the association with financial assets totaling Sk 5.56 million, propor-tional to their population. Pusté Sady did not have to contribute financially since the landfillwas to be built on its territory. New members must be approved by 3/5 of the members andhave to pay a fee in the amount of Sk 40 per capita. At the same time, every member shares theobligations of the association proportional to the volume of contribution made to the associa-tion. The bodies of the association are: general assembly, board of directors and supervisoryboard. Every participating village has a representative in the general assembly (the mayor or anappointed person). The general assembly elects the members of the board of directors andsupervisory board for four year terms. The membership in these two bodies cannot be com-bined. In 1994, Komplex–Lobbe s.r.o. was founded to carry out collection and disposal ofwaste and operation of the landfill in Pusté Sady. The Komplex association contributed to thelandfill in Pusté Sady. Lobbe Slovakia s.r.o., a private company, contributed by financialdeposit. Both parts have a representative in the general assembly of the company that securesthey have to come to an agreement on every issue. The catchment area for the operatinglandfills is about 105,000 people. The contractors of the company are: 29 villages, 3 townsand 215 private enterprises. Three of the contract towns, Sala, Sered’ and Hlohovec, contrib-ute the largest shares to the landfill disposal. The members of the Komplex association payspecial, discounted fees for the municipal waste disposal. The landfill complies with theEuropean ecological standards and it should be in operation for 30–40 years.
Lobbe Slovakia engages in five more similar companies projects (in cooperation with othermunicipalities) dealing with municipal waste, special waste management, and landfilldisposal.
Water Supply and Sewage ManagementBased on the Civil Code, there are seven municipalities associated in order to constructthe sewage collection via Varín—Terchová. Five member municipalities, of the regionalassociation Podunajsko, cooperate in the sewage and water treatment facility issue inHamuliakovo. Since 1997, Trencianske vodárne a kanalizácie (Trencín water supply
144
C O N S O L I D A T I O N O R F R A G M E N T A T I O N ?
D F I D – L G I L O C A L G O V E R N M E N T P O L I C Y P A R T N E R S H I P P R O G R A M
š š
and sewage system company) has operated a joint action by 48 municipalities in theTrencín district. Two municipalities, Studienka and Laksárska Nová Ves, joined theirfunds for the construction of a mutual drinking water reservoir.
TourismDevelopment of tourism is the third area of frequent inter-municipal cooperation.Such activities are primarily connected to development of rural municipalities, ecolo-gy, and protection of the environment. The interest association of nine municipalities,Slovensky raj, is one example of such cooperation. The main mission of the associationis to coordinate tourism development activities and to provide maintenance and repairfor technological facilities located in the national park belonging to the municipalities.The funds for its activities are provided by the contributions of the participating mu-nicipalities, the State environmental fund, and other commercial entities. There areassociations similar to this one, such as the association of municipalities in the Detvian-ska Huta area (joint development of agritourism), the association of ten municipalitiesin the Nitra area, the garden of Europe, the association of municipalities in the Marí-ková valley for rural tourism and agritourism Zomda (five municipalities), Ivamoza(three municipalities by Ivánka pri Dunaji), etc.
Agency for Development of Tourism in the Tatras Region
The Regional Association of the Tatras and by-Tatras Municipalities has been operating since1993, when the Association of Historical Tatras and by-Tatras Municipalities changed itsname. This Association founded several companies as a direct outcome of the inter-municipalcooperation. In 1993, four towns and 11 villages, together with further private companies,established a publishing company called Marmota Press. This publishing company deals withthe publication of periodicals and non-periodicals, promotion materials and promotionalactivities. Even though Marmota Press‘s connection to tourism is more than obvious, theoriginal idea was actually to rescue the publisher of regional weekly. The municipalities’ sharein Marmota Press is 29%.
Marmota Press deals only partially with the tourism issue. More complex cooperation in thearea of tourism is dealt with in the region through the Agency for Development of Tourism inthe Tatras Region, established in 1996. The founders consisted of 18 municipalities, 34private companies and five non-governmental organizations. The Agency registered as a non-profit organization and later on changed its legal status into association of legal and physicalentities.
The bodies of the Agency are: the general assembly, board of directors and supervisory board.Every member has one vote in the general assembly with no relation to the volume of itscontribution. The board of directors consists of nine members. Four members represent publicsector (municipalities), three members represent private sector and two, non-governmentalorganizations. The supervisory board consists of three members. One member represents thepublic sector and two, the private sector. In 1998, the Association had 130 members, whennew members from the Liptov and Orava regions joined the Agency.
145
S E PA R AT E E X I S T E N C E S A B O V E A L L — LO C A L S E L F – G O V E R N M E N T S A N D S E R V I C E D E L I V E R Y I N S LOVA K I A
š
š
š
Originally, the funding was intended to be multi-source funding. Besides regional sources(members’ contributions), they also intended to finance from the existing tourism projectstaking place in the region. Since these projects ended in 1998, members’ contributions becamethe primary financial source. Municipalities contribute Sk 3 per capita. Private companiescontribute proportional to their turnover. The annual member fee for individual privateperson (not as a citizen of municipality or enterprise) is about Sk 300.
The main purpose of the Agency is marketing and promotion of tourism products within theterritory of member municipalities; collection, analysis and provision of information for themembers and contractors; organization of trainings and conferences oriented to exchangeexperiences within the Agency; special consultancies; search for financial sources for the region-al tourism development funds; and strategic planning for sustainable development of tourismwithin the territory of member municipalities.
HealthcareInter-municipal cooperation has also developed in less traditional areas, such as health-care. This is especially the case if healthcare is not the responsibility of the localself-government and is fully provided by the state administration.14 The accumulationof funds in four municipalities by Sárovce, to be able to purchase special medicalequipment for the local doctor, is an example of short-term inter-municipal coopera-tion. The cooperation of seven municipalities on the left bank of the Váh River is anexample of long-term inter-municipal cooperation. These municipalities accumulatedtheir funds to build a dental clinic for their citizens to be located in one of the munic-ipalities, Trencianska Turná. The 23 municipal members of the Laborecky regionalassociation of towns and villages established a foundation to finish one section of thehospital in Medzilaborce. Six municipalities near Gemerská Poloma worked in part-nership with the local doctor in providing healthcare services for the citizens.
Social WelfarePartially, social welfare belongs among the responsibilities of local self-government. Forexample, the Social care center Podhorie, and the Service center of social care in KrásnaVes, created by the regional association of municipalities located in upper BebravaRiver Valley. Another example is the social taxi for the five municipalities of the Pri-dunajsko region by Dunajská Luzná.
Podhorie
The distance to the district seat (Bánovce nad Bebravou) and location in the upper BebravaRiver Valley inspired several citizens in the area to establish the civic association Podhorie.Initiation and support of developmental programs and realization of this, in the territory, werethe main objectives of the association. Its activities developed in the areas of development of
146
C O N S O L I D A T I O N O R F R A G M E N T A T I O N ?
D F I D – L G I L O C A L G O V E R N M E N T P O L I C Y P A R T N E R S H I P P R O G R A M
š
š
š
local self-government, economy, ecology, social welfare, spiritual activities, culture, tourism,education, and publishing activities.
Based upon this civic activity, the local self-governments in this micro-region joined theAssociation of Municipalities for the Podhorie micro-region. The main goal of the associationis the unification of efforts towards development of micro-region, and the strengthening ofdemocratic governance and public administration. The eight participating municipalitiestotal only something above 3,000 inhabitants. Individual municipalities delegated someresponsibilities to Association and rationalized the operation of their administration.
The joint project in the area of social welfare is being realized in Krásna Ves. The former firestation was renovated and a facility for 15 citizens was created. The Center of SocialWelfare, Podhorie, provides care for elderly citizens, including immobile citizens. Thefacility also provides care for citizens who need only part-time assistance, regular health carefrom a specialist, rehabilitation and catering for non-residents. It serves as a spiritual andcultural center for elderly citizens as well. The Agency of Domestic Nursing Services operatesvia the center as well. It provides nursing and rehabilitation, doctor’s examinations andtransportation by ambulance.
The financing of such facilities is a problem for municipalities. There are limited funds inmunicipal budgets and the individual patients’ relatives are not willing to participate finan-cially in social care.
Regional Development—Local EconomyRegional development agencies and information centers are an interesting area of inter-municipal cooperation. The municipalities engage in such cooperation directly orthrough the regional associations. The regional innovation center, Rovinka, is an exam-ple of a development agency. It aims at development of entrepreneurial activities in thePodunajsko region. It comprises of 24 municipalities. The society of the topol’ciansko-duchonsky micro-region municipalities is a similar form of cooperation. Its primarygoal is development and maintenance of tourism, activation of enterprising and overalldevelopment of the micro-region. It comprises of eight rural municipalities and thecity of Topol’cany. Workshops for entrepreneurs is just one of its activities. The associ-ation also built a bike trail and educational trail near the historical mountain railwayand succeeded in getting its member, Podhradie municipality, ownership rights to themedieval castle, Topol’cany. The regional advisory and information center establishedby the Regional association of the Tatry region municipalities in 1992 is another exam-ple of the second type of cooperation in this area.
4.3.2 Administrative Services
Although Slovak legislation enables local self-governments to create joint municipaloffices, this form of inter-municipal cooperation is not common. Primarily, provision
147
S E PA R AT E E X I S T E N C E S A B O V E A L L — LO C A L S E L F – G O V E R N M E N T S A N D S E R V I C E D E L I V E R Y I N S LOVA K I A
of administrative competencies is the main area of such cooperation. Cooperation willprobably develop more after 2002, when local self-governments start getting morecompetencies and small municipalities will no longer be able to carry them out (finan-cial and personnel reasons). Despite the previous statement, it is not uncommon inSlovakia that the municipal offices of larger municipalities carry out payroll agendas orentire financial agendas for their smaller neighboring municipalities. The financial andpayroll offices of the association of municipalities of Humenné, are such an example.The municipal office in Humenné provides these services for 68 municipalities. Indi-vidual municipalities proportionally contribute to the operation of the financial andpayroll office in Humenne.
4.4 Evaluation of Existing Examples of Inter-Municipal Cooperation
Although, after 1989, identity of the municipality, its independence, autonomy andaccountability for management of local affairs (see settlement structure analysis) areconsidered to be the basic spirit of the local community, there are some reasons forinter-municipal cooperation:
• Similar issues can be addressed more economically effective without loosingautonomy;
• Resources necessary, for addressing existing issues sufficiently, exceed the ex-pert and material availabilities of any of the individual municipalities;
• The nature of the provided service—drinking water supply, wastewater treat-ment facility, waste collection and waste disposal, etc.;
• Cultural, social or economic orientation of several municipalities creates theneed for specific articulation of joint manifestations and joint activities;
• Communication and brainstorming support creative ideas, an atmosphere ofsolidarity and cohesion creates a good base for political and social stability inthe given territories.
Examples offered suggest that service area for inter-municipal cooperation differsdepending on the services provided. These service areas are most different in the provi-sion of the economic-social services. Drawing a universal service area is easier in the areaof administrative services. Mainly, regional and historical relations among participat-ing municipalities influence the size of service area for joint municipal offices. Naturallandscape is an important factor as well. Municipalities all located in one valley aremore willing to join. However, they are willing to join, merely for provision of certainadministrative tasks, without loosing their law status.15
In some cases, inter-municipal cooperation is the only viable option for public ser-vice provision at the local level. Otherwise, it can be absent from a particular territory,
148
C O N S O L I D A T I O N O R F R A G M E N T A T I O N ?
D F I D – L G I L O C A L G O V E R N M E N T P O L I C Y P A R T N E R S H I P P R O G R A M
the municipality will have to merge with other municipalities, or a higher level of localself-government will provide the service.
Municipalities engage in inter-municipal cooperation mainly because they are shorton the financial funds and personnel to carry out their tasks, as well as general ineffi-ciency of their execution. Inter-municipal cooperation enables municipalities toaccumulate financial and human resources. However, such accumulation can be insuf-ficient too. Therefore, it is favorable to involve the private sector in cooperation (seeMarmota Press and Komplex Lobbe examples).
Based upon inter-municipal cooperation in waste management, we can determinethat the provision of economic tasks of local self-governments is more favorable throughcreation of a commercial company (Komplex–Lobbe). Participation in such a compa-ny can take various forms. Respecting the fact it provides public services, municipalitiesshould have sufficient control rights included in the contract. Municipalities should beable to direct the activities of the company through their representatives in its bodies.Commercial companies not only allow private enterprises to participate in inter-mu-nicipal cooperation, but also foreign enterprises. The easing financial burden, otherwiseput solely on municipalities, is the advantage to inter-municipal cooperation via com-mercial companies. Commercial companies enable production of new resources, forthe further operation of the inter-municipal cooperation, without burdening munici-pal budgets.
Inter-municipal cooperation in tourism needs greater funds.16 Solution to thisproblem is often to engage more private companies in the tourism business. Then,these companies bear a significant share of financial costs for the operation of inter-municipal cooperation.
The results of existing projects in inter-municipal cooperation suggest that estab-lishing simple and uncomplicated structures for inter-municipal cooperation is thebest. Management, financial, and control (including accountability) relations must behighly transparent and spending on newly created administration and material needscannot be inadequate. The one-task orientation of inter-municipal cooperation shouldbe sustained, because associations for more general orientation (orientation to provi-sion of more tasks) can disrupt the nature of territorial self-government itself.
The provision of services delegated by state administration bodies to the local self-governmental bodies is a significant influencing factor concerning the lack of funds forfulfillment of local self-governments’ original tasks. Local self-governments are oftendelegated to provide state administration tasks and delegations that are not followedby the respective funds, however. In compliance to Slovak legislation, municipalitiescannot refuse to provide any of the tasks delegated to them by the law approved by theNational Council of the Slovak Republic. At the same time, the Constitution of theSlovak Republic and the Municipal law state that a municipality must carry out thetask only if the funds to cover it are delegated by the law too. Therefore, if municipal-
149
S E PA R AT E E X I S T E N C E S A B O V E A L L — LO C A L S E L F – G O V E R N M E N T S A N D S E R V I C E D E L I V E R Y I N S LOVA K I A
šš
ities do finance the tasks of state administration, provided by them from the municipalbudgets, they act in conflict with the rules of the municipal property management,financing of municipalities, and creation and respect for the municipal budget. Theambiguity of the legal provisions, and various interpretations of the respective laws, hasresulted in illegality of some municipal activities. Local self-government contributes toprovision of tasks assigned by state administration under public pressure. Such activi-ties occur mainly in the areas of education, healthcare, public transportation, culture,gas supply construction and energy facility construction. Through such activities,municipalities break their duty to exclusively appreciate the property of municipality[Niznansky, 1998].
4.5 The Willingness of Municipalities to Engagein Inter-Municipal Cooperation
Self-government representatives’ attitudes towards participation in inter-municipalcooperation can be derived only from partial surveys. In Slovakia, general surveys onthis issue do not exist. The Ministry of Interior for the Slovak Republic carried out asurvey on the willingness of municipalities to provide services in the area of educationand social care after decentralization from state administration (Ministry of Interior ofthe SR 2000). In the sample municipalities under 5,000 inhabitants3 , 76% of themunicipalities intended to provide administrative tasks for these services after theirdecentralization, individually through their municipal office. Only 17% of munici-palities intended to use inter-municipal cooperation. The largest support for inter-municipal cooperation was expressed in the smallest municipalities, up to 200 inhab-itants (61%), and in municipalities with 200–499 inhabitants (30%). This fact supportsour argument about fragmentation of settlement structure in Slovakia and the conse-quent inability of smaller municipalities to provide all the services assigned to localself-government. The intentions differ according to the type of facility as well. Only aslight majority of municipalities, up to 200 inhabitants (53%), intended to use inter-municipal cooperation in the area of daycare. As for elementary schools and facilities ofsocial care, a clear majority of smallest municipalities (77–88%) intended to use inter-municipal cooperation. As for elementary schools, support for inter-municipalcooperation prevailed also in municipalities with 500–999 inhabitants.
Mayors in the Podhorie micro region municipalities support our argument aboutthe greater willingness of small municipalities to engage in inter-municipal cooperation[PHARE, 1998]. While the mayors of smaller municipal members of the Associationof municipalities of the Podhorie microregion praised existing inter-municipal cooper-ation, the mayors of larger municipalities were more reserved. Basically, the mayorswho did not have any social case in their municipality did not see any reason to engage
150
C O N S O L I D A T I O N O R F R A G M E N T A T I O N ?
D F I D – L G I L O C A L G O V E R N M E N T P O L I C Y P A R T N E R S H I P P R O G R A M
in inter-municipal cooperation in the area of social services. From this, we can derivethat municipalities engage in inter-municipal cooperation only after they get into prob-lems with public services delivery themselves.
As for legal forms of inter-municipal cooperation for provision of these services, themayors preferred the legal entity upon the agreement of public character (38.1%).Two further forms favored by the mayors were inter-municipal cooperation upon agree-ment for the taking over of competencies and tasks by one of the participatingmunicipalities and creation of a specific association of municipalities for the sake ofjoint provision of tasks.
The way the mayors expected the tasks, decentralized to municipalities and pro-vided through inter-municipal cooperation, to be financed suggests a strong sense ofautonomy amongst local self-governments’ representatives and distrust in other mu-nicipalities. Over a half of the mayors preferred the transfer of state funds to the budgetof the municipality, where the facility is located. Basically, it is the way it works now.Today, the funds are transferred to a particular facility and not to an individual receiverof a given service. Only a quarter of municipalities favored the transfer of funds to eachparticipating municipality and these municipalities would, consequently, contributeproportionally to the joint delivery of service (Ministry of Interior of the SR 2000).
4.6 Conclusion
There are basically two ways for territorial self-government to provide public servicesunder the financial limitations of local self-governments:
a) Through mandatory cooperation.The minimal size and service area for a basic unit of local self-government isdefined by the law. Such cooperation is inevitable, mainly for service provisiondelegated to local self-governments by the state administration.For example, a local self-government carries out the tasks of state administra-tion in the area of Construction Act provisions. Not every municipality has thepersonnel capacities to do so. Therefore, the municipality that would carry outthese tasks for other municipalities must be appointed to the defined criteria.Similar situations also exist in other areas. Designation of service areas can bethe basis for defining the lowest administrative units of local self-government.
b) Through voluntary cooperation.This type of cooperation can mainly be developed with the provision of origi-nal competencies of municipalities (economic-social competencies).Inter-municipal cooperation creates respective service areas for individual ser-vices provided by local self-governments. Historical development of thesettlement structure in Slovakia, popular attitudes and local self-governments’
151
S E PA R AT E E X I S T E N C E S A B O V E A L L — LO C A L S E L F – G O V E R N M E N T S A N D S E R V I C E D E L I V E R Y I N S LOVA K I A
attitudes suggest that the voluntary nature of service provision through inter-municipal cooperation should persist. Recognizing fragmentation of settlementstructure (as one of the main causes of municipalities’ inabilities to carry outtheir tasks), the system of economic motivation of municipalities leading to-wards inter-municipal cooperation must then be thoroughly elaborated. Incompliance with democratic principals, it is more appropriate to let citizensdecide (through their elected representatives—local self-government), whichway of service provision they would prefer. The first way of inter-municipalcooperation makes public services provision in municipality more effective.The second path is an individual provision of public services and citizens mayhave to bear the negative side effects, like local self-governments’ financial shortageand consequent inability to properly address the problems of the municipality.This decision should not be left for bureaucrats in state administration. Thereare several problems connected to their decision-making, mostly reflecting thelevel of their responsibility and the level of their knowledge about the particu-lar local problems.Mayors’ opinions suggest that they are apprehensive about loss of municipalidentity and independence when some forms of inter-municipal cooperationare used [Ministry of Interior of the SR, 2000]. At the same time, the fear ofsmall municipalities lagging in the system of central municipalities can benoted. Another source of fear is belief that the deficit, of financial funds forprovision of economic and administrative tasks, would increase. Municipali-ties, therefore, prefer looser forms of cooperation and put emphasize on thevoluntary principle of cooperation (in the selection of the type of cooperationas well). Based upon their opinions, the joint municipal offices should be cre-ated within micro regions, territories smaller than the former sub districts orrecent districts.
5. SERVICES DELIVERED AND LOCAL DEMOCRACY
5.1 Citizens Participation in Local Self-Government
Creation of local self-government in 1990 restituted citizens’ options for direct partic-ipation in development and management of municipalities. The Municipal Law providesthe following options:
• Municipal elections;• Local referendum;• Participation in public citizen meetings;
152
C O N S O L I D A T I O N O R F R A G M E N T A T I O N ?
D F I D – L G I L O C A L G O V E R N M E N T P O L I C Y P A R T N E R S H I P P R O G R A M
š
šš
• Participation in the municipal council meetings;• Submission of petitions, proposals or complaints to the local self-government;• Questioning the representative of the local self-government.
Through these initiatives, the citizenry can control the local self-government. Localself-government has to inform citizens about the municipal budget proposal as well asthe municipal financial statement. It must allow the public to comment on the chang-es of physical plan of municipality.
Municipal elections are generally considered the most important right citizens haveto participate in local self-government. A public survey undertaken by FOCUS agencyin March 1997 demonstrated that popular engagement in public affairs mainly beginsand ends with their participation in the elections [Niznansky, 1998]. In November1990, 64% of eligible voters participated in the first municipal elections. Turnout inanother municipal election, in November 1994, was only 52.2%. Four years later, in1998, the turnout slightly increased to 53.9%. Contrary to this development of turn-out in municipal elections, the turnout in parliamentary elections permanently exceeds75% (1994–75.6% and 1998–84.2%). Fairly low turnout in the 1998 municipalelections does not correspond to polls that indicated about 75% of eligible populationintended to vote in municipal elections [FOCUS, 2000].18 Intended participation inelections was highest in municipalities up to 1,000 inhabitants (84.4%). This de-creased according to the size of municipality. In two largest cities of Slovakia, Bratislavaand Kosice, only 64% of eligible voters intended to vote in January 2000.
Citizens’ participation in municipal elections is derived from the interest of citizensin solving the problems of their municipality. From 1997 to 2000, only 26.1–28.7%of population in Slovakia attempted to solve the problems of their municipality[FOCUS, 2000]. In 2001, it was only 19% [IVO, 2001]. Similar to the election turn-out, the citizens of smaller municipalities, under 2,000 inhabitants, were engaged themost by trying to solve the problems of their municipality (35.9%). The greatest rateof citizen passivity was recorded among the people living in municipalities between50,000–100,000 inhabitants (only 14.4% attempted to participate in addressing themunicipal problems). Out of those who attempted to address the problems, 60% haveexperience the problem solved. This suggests that municipal problems can be solvedwhen the public questions the local self-government. It also increases the perception ofa meaningful existence for self-government. Even though self-government is fairly suc-cessful in addressing the issues after dialogue with the citizenry, citizens do not engagein solving municipal problems. The main reason for this is that citizens do not knowhow to contribute to addressing municipal problems (26.1%). Another reason is thelack of time the citizens are willing to spend in order to help the municipality (20.1%).The third reason, identified by the survey, is that citizens are not interested in helpingto solve municipal problems (12.6%) [FOCUS, 2000].
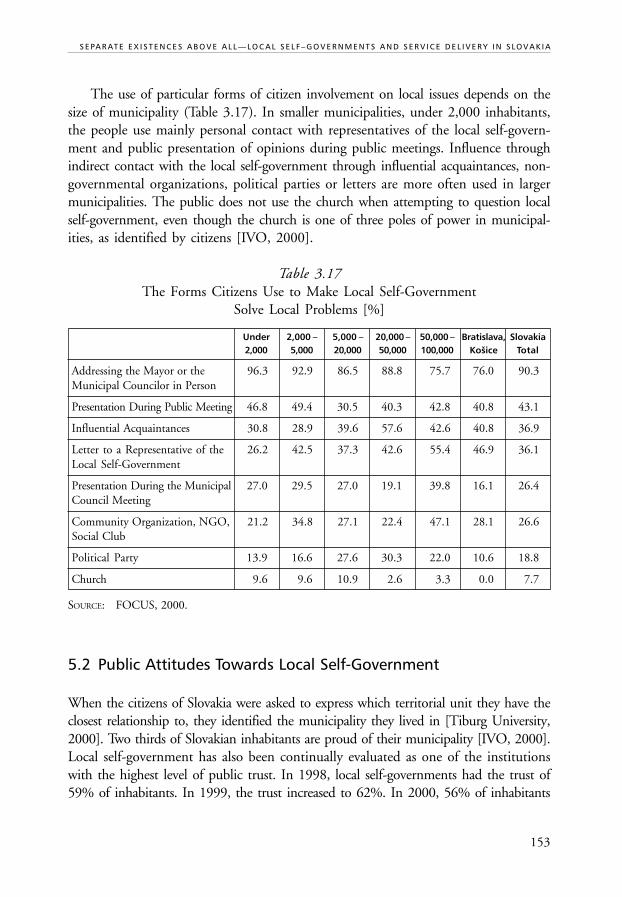
153
S E PA R AT E E X I S T E N C E S A B O V E A L L — LO C A L S E L F – G O V E R N M E N T S A N D S E R V I C E D E L I V E R Y I N S LOVA K I A
The use of particular forms of citizen involvement on local issues depends on thesize of municipality (Table 3.17). In smaller municipalities, under 2,000 inhabitants,the people use mainly personal contact with representatives of the local self-govern-ment and public presentation of opinions during public meetings. Influence throughindirect contact with the local self-government through influential acquaintances, non-governmental organizations, political parties or letters are more often used in largermunicipalities. The public does not use the church when attempting to question localself-government, even though the church is one of three poles of power in municipal-ities, as identified by citizens [IVO, 2000].
Table 3.17The Forms Citizens Use to Make Local Self-Government
Solve Local Problems [%]
Under 2,000 – 5,000 – 20,000 – 50,000 – Bratislava, Slovakia2,000 5,000 20,000 50,000 100,000 Košice Total
Addressing the Mayor or the 96.3 92.9 86.5 88.8 75.7 76.0 90.3Municipal Councilor in Person
Presentation During Public Meeting 46.8 49.4 30.5 40.3 42.8 40.8 43.1
Influential Acquaintances 30.8 28.9 39.6 57.6 42.6 40.8 36.9
Letter to a Representative of the 26.2 42.5 37.3 42.6 55.4 46.9 36.1Local Self-Government
Presentation During the Municipal 27.0 29.5 27.0 19.1 39.8 16.1 26.4Council Meeting
Community Organization, NGO, 21.2 34.8 27.1 22.4 47.1 28.1 26.6Social Club
Political Party 13.9 16.6 27.6 30.3 22.0 10.6 18.8
Church 9.6 9.6 10.9 2.6 3.3 0.0 7.7
SOURCE: FOCUS, 2000.
5.2 Public Attitudes Towards Local Self-Government
When the citizens of Slovakia were asked to express which territorial unit they have theclosest relationship to, they identified the municipality they lived in [Tiburg University,2000]. Two thirds of Slovakian inhabitants are proud of their municipality [IVO, 2000].Local self-government has also been continually evaluated as one of the institutionswith the highest level of public trust. In 1998, local self-governments had the trust of59% of inhabitants. In 1999, the trust increased to 62%. In 2000, 56% of inhabitants
154
C O N S O L I D A T I O N O R F R A G M E N T A T I O N ?
D F I D – L G I L O C A L G O V E R N M E N T P O L I C Y P A R T N E R S H I P P R O G R A M
š
trusted local self-government [UVVM, 1999; FOCUS, 2000]. The highest level oftrust is in the smallest municipalities, under 2,000 inhabitants. As many as 70% oftheir citizens trust in the activities of their local self-governments. The level of trustdecreases with the increasing size of municipalities. The lowest level of trust is amongthe citizens of the two largest cities, Bratislava and Kosice, at only 47.8%. As for dis-trust, the highest level of distrust can be found among the citizens of municipalitiesbetween 20,000–50,000 inhabitants, at 47% [FOCUS, 2000].
The amount of information available to the public about the activities and deci-sions of local self-government is an important factor in the trust/distrust issue. Citizens,who have sufficient information about these, express the highest levels of confidence inthe local self-government (78%). The people with no information equally trust anddistrust in activities of local self-government. The survey shows an interesting situa-tion. Amongst people who are not at all interested in the activities of local self-government,more trust in it than distrust it (45% vs. 38%) [FOCUS, 2000]. Overall, fairly lowlevels of public information about local self-government activities exist. In 1997–2000,only 26–31% of citizens were informed sufficiently. Contrarily, about 42% of peopledid not have information about local self-government activities. About the same portionof people who are sufficiently informed, are not interested in any information about theactivities of local self-government. The previous statement supports the argument aboutlow citizen interest in the municipal life. Again, citizens living in the municipalitiesunder 2,000 inhabitants are the best informed. In contrast, the citizens of municipali-ties with 20,000–50,000 inhabitants had the lowest level of information about localself-government activities. The percentage of uninformed citizens exceeds the percent-age of informed citizens in all municipal size categories. As for sources of information,they rely mainly on neighbors and family (59%), local/regional radio stations and local/regional newspapers (39%). The following methods are used for getting information aswell: announcements in the public places, various materials from municipal offices andpublic meetings with representatives of the local self-government.
Citizens perceive the mayor as the most influential person in the municipality(63%) [IVO, 2000]. On one hand, this finding can support the credentials of localself-government. On the other hand, it can also reflect the existence of the extremeauthority of one person and the passivity of citizens (identified in previous analysis).The primacy of mayor is highlighted by the fact that the second most influentialinstitution in municipalities, are the municipal councils, identified by only half ofthose who identified the mayor (31%). Further groups, according to their influence,are: local entrepreneur/s (26%), local state administration (23%) and church (18%).The perception of importance of local state administration in municipalities is oftenoverestimated. The influence of the political parties is at about the same level as per-ceived by the mayors (14% vs. 10%). The distribution of power, according to individualpoles, differs upon the size of municipality (Table 3.18).
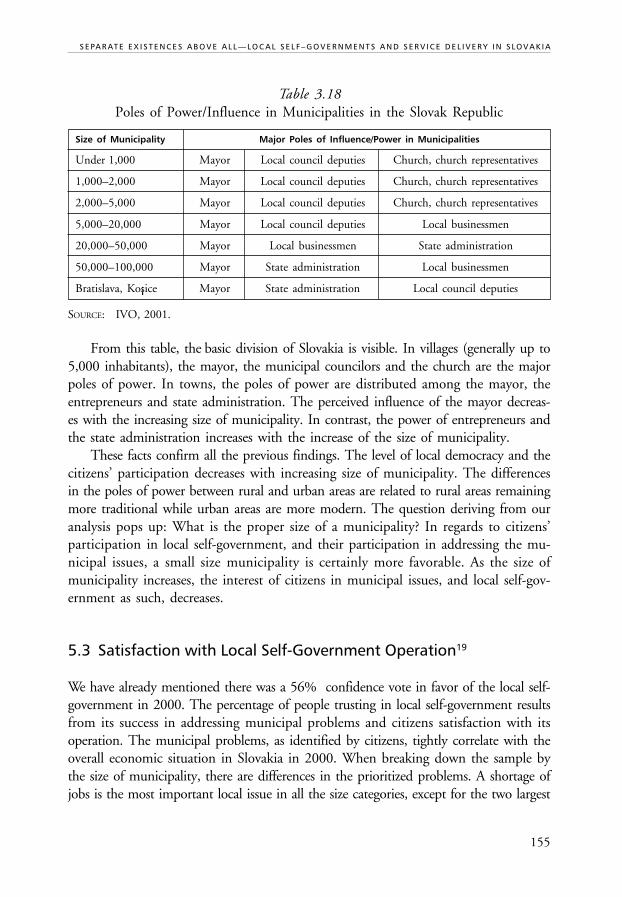
155
S E PA R AT E E X I S T E N C E S A B O V E A L L — LO C A L S E L F – G O V E R N M E N T S A N D S E R V I C E D E L I V E R Y I N S LOVA K I A
Table 3.18Poles of Power/Influence in Municipalities in the Slovak Republic
Size of Municipality Major Poles of Influence/Power in Municipalities
Under 1,000 Mayor Local council deputies Church, church representatives
1,000–2,000 Mayor Local council deputies Church, church representatives
2,000–5,000 Mayor Local council deputies Church, church representatives
5,000–20,000 Mayor Local council deputies Local businessmen
20,000–50,000 Mayor Local businessmen State administration
50,000–100,000 Mayor State administration Local businessmen
Bratislava, Kos¡ice Mayor State administration Local council deputies
SOURCE: IVO, 2001.
From this table, the basic division of Slovakia is visible. In villages (generally up to5,000 inhabitants), the mayor, the municipal councilors and the church are the majorpoles of power. In towns, the poles of power are distributed among the mayor, theentrepreneurs and state administration. The perceived influence of the mayor decreas-es with the increasing size of municipality. In contrast, the power of entrepreneurs andthe state administration increases with the increase of the size of municipality.
These facts confirm all the previous findings. The level of local democracy and thecitizens’ participation decreases with increasing size of municipality. The differencesin the poles of power between rural and urban areas are related to rural areas remainingmore traditional while urban areas are more modern. The question deriving from ouranalysis pops up: What is the proper size of a municipality? In regards to citizens’participation in local self-government, and their participation in addressing the mu-nicipal issues, a small size municipality is certainly more favorable. As the size ofmunicipality increases, the interest of citizens in municipal issues, and local self-gov-ernment as such, decreases.
5.3 Satisfaction with Local Self-Government Operation19
We have already mentioned there was a 56% confidence vote in favor of the local self-government in 2000. The percentage of people trusting in local self-government resultsfrom its success in addressing municipal problems and citizens satisfaction with itsoperation. The municipal problems, as identified by citizens, tightly correlate with theoverall economic situation in Slovakia in 2000. When breaking down the sample bythe size of municipality, there are differences in the prioritized problems. A shortage ofjobs is the most important local issue in all the size categories, except for the two largest
156
C O N S O L I D A T I O N O R F R A G M E N T A T I O N ?
D F I D – L G I L O C A L G O V E R N M E N T P O L I C Y P A R T N E R S H I P P R O G R A M
šcities, Bratislava and Kosice. In these cities, employment ranked fourth in the order ofimportance behind crime, housing, and corruption in local self-government. In someregions, the unemployment rate exceeds 30% and, not surprisingly, employment wasproblem number one. The municipalities, however, have almost no tools for influenc-ing employment in their territory because they do not have power over the necessarycompetencies to boost local economy. In municipalities under 2,000 inhabitants, theorder of problems was as follows: sewage, access to sport and cultural activities, health-care and social welfare, transportation and road management, and education. Out ofthese areas, the local self-government has some competencies, but only in the areas oftechnical infrastructure. Even though municipalities have no competencies for deliveryof healthcare, and broad range of social services, they engage in addressing these prob-lems anyway and participate in addressing the problems with local elementary schoolstoo. Following these issues, crime and corruption in local self-government were identi-fied as the other problems. In municipalities between 2,000 to 5,000 inhabitants, theorder of the issues were very similar. In these municipalities, housing was perceived asmore important problem than sewage, and transportation and road management wasidentified as less important issue than crime and corruption in local self-government.The order of problems in the rest of the size categories was almost identical. Thisanalysis suggests the inhabitants of smaller municipalities see more problems in the areaof infrastructure (technical and social). While citizens living in large municipalities seemore problems rather in the areas related to ethics (crime and corruption).
Satisfaction with the local self-government activities in addressing local issues is aninversed function of the importance of individual problems. Citizens are most satisfiedwith addressing the technical and social infrastructure. Contrarily, they are unsatisfiedwith addressing the issues of job shortage, housing, and crime. When looking at satis-faction in individual municipal size categories, the relationship between satisfactionand importance, outlined above, is preserved. The most important issues are addressedleast successfully and vice versa.
Generally, the main reasons of why municipalities cannot address local problemsare: the lack of funds, lack of competencies, and the lack of quality in the local self-government operation. Citizens of all size categories identified financial shortage beingtheir reason for failure. For the rest of the reasons, we can see the differentiation. Inmunicipalities under 2,000 inhabitants, lack of competencies was identified as a pri-mary reason. Then, it was low quality of local self-governmental operation, insufficientparticipation by citizens, and political differences amongst the representatives of thelocal self-government. In municipalities above 2,000 inhabitants, low quality of localself-governmental operation was the major reason. Lack of competencies was one of theleast influential reasons. Fairly high importance was attributed to the unwillingness ofcitizens to participate in the local issues addressed in municipalities between 2,000 to5,000 inhabitants and 50,000 to 100,000 inhabitants (50% and 52.7% respectively).
157
S E PA R AT E E X I S T E N C E S A B O V E A L L — LO C A L S E L F – G O V E R N M E N T S A N D S E R V I C E D E L I V E R Y I N S LOVA K I A
š
6. CONCLUSIONS AND POSSIBLE POLITICAL RECOMMENDATIONS
6.1 Conclusions
Territorial Self-GovernmentUntil 2002, territorial self-government operated only at a municipal level. The SlovakConstitution treats all municipalities as equal, with no differentiation based upon size.The size of municipalities ranges from population 2 (Príkra) to 447,345 (Bratislava).The scope of services delivered by any given municipality is the same, except for Brat-islava and Kosice. These two cities also provide some services, which in other caseswould be provided by state administration (road network management, firefighters).By 2002, a majority of services was delivered by the state administration. In 2002,regional level of territorial self-government was established and a gradual transfer ofcompetencies to territorial self-government had begun.
Settlement StructureThe settlement structure in Slovakia features high fragmentation (2883 municipali-ties) and a large portion of small municipalities (municipalities up to 1,000 peopleaccount for 69% of all municipalities and 16% of the total population of Slovakia).Such a fragmented structure stems from two major processes taking place in Slovakia inthe second half of the 20th century. During state socialism, integration of municipali-ties reduced their numbers from 3,344 in 1950 to 2,694 in 1989. After 1990, rapidfragmentation started and continued on up to 2001 when the law began regulatingthe minimum size for newly created/separated municipality. Expert discussions onoptimum size of municipality took place in Slovakia throughout the 1990s. Minimumsizes of municipalities between 3,000 and 5,000 inhabitants resulted from these dis-cussions. The experiences in the small villages, during the period of state socialismsystem of central villages, restrained their higher amalgamation.
Economic PerformanceThe financial stance of local budgets is better than the financial situation of the publicsector as a whole. In total, local budgets have been permanently in surplus throughoutthe last decade. Major sources of local budgets’ revenues are shared in state taxes reve-nues, real estate tax, local fees, municipality property ownership and enterprise revenues,transfers from public budgets and loans. State tax revenues are distributed proportion-ally by the population, therefore, the revenues of municipalities do not differ by the size(per capita revenues). Real estate tax revenues account for 5.5% (over 100,001 people)to 23.3% (4,001–5,000 people) of local budget revenues. It peaks in the 4,001–5,000inhabitants size category of municipalities. Non-tax revenues account for more than the
158
C O N S O L I D A T I O N O R F R A G M E N T A T I O N ?
D F I D – L G I L O C A L G O V E R N M E N T P O L I C Y P A R T N E R S H I P P R O G R A M
š
revenues from state taxes. They range from 19% (over 100,001 inhabitants) to 44.5%(50,001–100,000 inhabitants). Smaller municipalities depend on transfers from pub-lic budgets more than larger municipalities. These transfers consist primarily of subsidiesto support provision of self-governmental functions in municipalities fewer than 3,000inhabitants. Contrarily, smaller municipalities do not gain funds from loans to theextent larger municipalities do. Bratislava is the most indebt municipality in Slovakia.
As for expenditures, operational expenditures increase on expense of capital expen-ditures and credits related expenditures. The personnel expenditures are primary itemsof the operational expenditures of local budgets. They account for 25.2% of the oper-ational expenditures and 16.1% of total expenditures. The highest expenditures are inmunicipalities with under 1,000 inhabitants and over 100,001 inhabitants. In thetwo largest cities, Bratislava and Kosice, the expenditures stem from a two-level organi-zation of local self-government in these cities. Capital expenditures per capita decreasewith the increasing size of municipality. Debt related expenditures rise with the size ofmunicipalities, culminating at 39% of total expenditures for municipalities over 100,001inhabitants (2000).
Economy of Services DeliveryAdministration of municipalities, the operation of municipal offices, and costs for theaccounts of the elected local representatives total 21.4% of local expenditures. Expen-ditures for housing and construction account for 13.7% of total expenditures. Furthersignificant categories of expenditures are transportation expenditures (10.7%) and lo-cal economy expenditures (9.7%). In 2000, ranking just after was protection ofenvironment (6.5%). These expenditures consist of such services as public green care,cleaning and winter maintenance of local roads, and waste management. Analysis oflocal budgets expenditures in selected areas shows that smaller municipalities (up to1,000 people) have significantly higher expenditures per service unit than municipal-ities with higher populations. Road transportation is an exemption from this statement.The expenditures of local roads per km increase with increasing size of municipalitymainly due to the system of road tax revenue distribution as a primary source of fundsin this area. The administration of municipal offices clearly shows the lack of econom-ical sustainability, for municipalities with less than 1,000 people, when the operationof municipal offices accounts for as much as 42–49 percent of their total expenditures.Municipal activities towards economic development in their territory are limited toplanning, construction of technical infrastructure, participation in commercial projects,and competencies in the area of real estate tax rates.
Inter-Municipal CooperationLegal settings for inter-municipal cooperation have existed in Slovakia since 1990.Major areas of inter-municipal cooperation are: municipal waste management; waste
159
S E PA R AT E E X I S T E N C E S A B O V E A L L — LO C A L S E L F – G O V E R N M E N T S A N D S E R V I C E D E L I V E R Y I N S LOVA K I A
water treatment, tourism, environmental protection, regional education, culture,education, social issues, coordination and planning of development activities, jointprojects for technical infrastructure (gas and water supply), organization of regionaladvisory and information centers, regional development agencies, healthcare andjoint enterprise (in cooperation with the private sector). The provided examplesconfirm these are reasonable ways to address the problems related to the size vs.capacity issue in delivery of some services. The municipalities are willing to engagein cooperation for delivery of economic and social services, but less willing in the areaof administrative services. Geographical location, tradition of cooperation and size ofmunicipalities are major factors that make municipalities conditioned to engage ininter-municipal cooperation.
Citizens Participation and SatisfactionThe options for citizen’s participation in local self-government are defined in the Mu-nicipal law. The level of popular interest is best reflected in the local election turnout(about 54% in 1998). The public interest in local matters declines with the increasingsize of municipalities. Active participation has a similar trend. Local self-governmentsenjoy quite a high level of public trust in comparison to other public institutes inSlovakia. The mayors are major poles of power and influence in municipalities of allsizes. In cities over 50,001 people, the influence of local council and church decreasesin favor of state administration and the local business community. Local problemsidentified by citizens differ from the problems often publicized by the representativesof local self-governments. The public identified insufficient funds and competencies oflocal self-governments as being the major reasons for municipalities’ failure to addressthe issues.
6.2 Recommendations
Due to the transfer of further competencies to local self-governments, the Slovak Re-public must deal in more precise manner with the relationship between efficient size oflocal self-governmental administrative units and the impact of citizens on the scopeand structure of provided services. It is impossible that all 2,883 municipalities wouldprovide newly transferred tasks individually without respecting their different size andcapacity (Príkra vs. Bratislava).
A document that deals with this issue does exist. It is the Concept of Decentraliza-tion (2001) and it has already been approved by the Government. It addressed theissue of the relationship between the size of administrative unit, the scope of deliveredservices and the influence of citizenry in deciding on the structure and quality of deliv-ered services.
160
C O N S O L I D A T I O N O R F R A G M E N T A T I O N ?
D F I D – L G I L O C A L G O V E R N M E N T P O L I C Y P A R T N E R S H I P P R O G R A M
This document and our analysis of services delivery through inter-municipal coop-eration (section 4) show the type of provided service does influence the decisions on thesize of administrative units. The criteria, for defining an administrative unit’s optimalsize, differ by the type of service. Creating maximum efficiency and reflecting the influ-ence of citizens on the service delivery are generally valid criteria, mainly for delivery ofeconomic and social services. Further criteria must be included when delivering ad-ministrative services (decision making in personal areas), such as accessibility and numberof decisions. Until recently, accessibility was measured through conventional means oftransportation. Development of IT and electronic signature will decrease the impor-tance of distance. At the same time, however, the necessity of knowing the specifics ofa local environment by the public service provider will persist. Particularly, the admin-istrative tasks that require knowledge of the local environment are those most requested(construction permits, social help, cadastral office, enterprises registering, etc.).
Our analyses showed small municipalities operated with financial severity and per-sonnel, as well as a low overall capacity to carry out the necessary tasks. Based upon therecent experiences of local state administration offices operation, the financial and per-sonnel severity of operation of the given services providers (current departments ofdistrict offices) becomes efficient at the size of 40,000 inhabitants. The financial anal-ysis of municipal expenditures shows expenditures per capita decrease with the increasingsize of the municipality (section 3.1.2).
For provision of administrative tasks of local self-governments, the Concept of De-centralization (2001) suggested that 169 municipalities should be administrative centers.In this network, the distance of citizens to the administrative office would not exceed15 km and the size of unit would not be less than 5,000 inhabitants (extreme cases).The average size of the administrative unit for provision of administrative tasks of localself-government would be 32,000 inhabitants. The legal status of every municipalitywould be preserved and, consequently, the impact of citizens on the service deliverythrough elected representatives and through contracts between municipalities includ-ed in administrative unit.
However, the reform of public administration proposed by the Concept of Decen-tralization is not to be carried out after the Parliament’s decision on self-governmentalregions. The solution used today defines inter-municipal cooperation as the exclusivelyvoluntary activity of municipalities. Municipalities can freely decide to provide servicesindividually or in cooperation with other municipalities. However, all mandatory tasksof local self-governments must be delivered, with no exceptions for small municipali-ties with limited capacities.
The current size differentiation of local self-governments and the way it is ad-dressed by law is not optimal for several reasons:
• It will not enable further significant decentralization of competencies to mu-nicipalities, mainly due to their fragmentation and the low capacities of thesmaller ones;
161
S E PA R AT E E X I S T E N C E S A B O V E A L L — LO C A L S E L F – G O V E R N M E N T S A N D S E R V I C E D E L I V E R Y I N S LOVA K I A
• Direct connection between public service provision and the citizen’s influenceon it directly, or through elected representatives, will not exist in several areas;
• Fragmentation of local levels complicates territorial economic development;• Fragmented local levels make administration more expensive (see 3.2.3).
Even though, in recent phases of public administration reform, the voluntary prin-ciple in inter-municipal cooperation rules, and our analysis of the municipalities’ willengage in the inter-municipal cooperation confirmed by this, territorial reform of localself-government at municipal level must be prepared. The reason is basic and it isshown in our analyses. Small municipalities have no sufficient capacity to carry outtheir tasks while they must spend almost half their budgets on operation. Despite thefact that municipalities do not like mandatory cooperation, the increase of efficiency oflocal self-governmental operation is impossible if it is left to free will of the municipal-ities. Certain regulations must be implemented (mainly the small municipalities, witha few hundreds of inhabitants, that greatly value their separate existence above theirfinancial severity).
Territorial reform of local self-government at the municipal level should be phasedout. The settlement structure in Slovakia, and the requested quality of services, re-quire a compromising solution between amalgamation (absolutely mandatory act)and inter-municipal cooperation (voluntary cooperation) as well as differentiationbetween these in individual regions. The compromise for the first phase could bebased on the following:
• Mandatory amalgamation of municipalities under 200 inhabitants (about 382municipalities with 49,000 inhabitants) or their mergers to larger municipal-ities. Their identity would be preserved through their status of local section;they would still have their councilors in the municipal council.
• Voluntary unification of municipalities into administrative units through amal-gamation or inter-municipal cooperation associations to provide administrativetasks so that they create administrative units of more than 5,000 inhabitants.
• State administration bodies would oblige the municipalities that did not jointhe aforementioned associations, whose size is less then 5,000 inhabitants, tojoin it (then voluntary unification from previous item becomes voluntary onlyuntil it is realized by municipalities themselves).
Even though a 5,000 inhabitant threshold is not sufficient for establishing fulladministrative and financial capacity for local self-governments, it was selected as thefirst phase because this size enables creation of local government’s own administrativecapacities with different expertise, as well as their financial coverage. The process ofamalgamation or association would affect about 96% of municipalities. The aforemen-tioned steps would reduced the number of municipalities by 382 (from 2,883 to2,501), reduce the number of administrative units, reduce the number of elect-
162
C O N S O L I D A T I O N O R F R A G M E N T A T I O N ?
D F I D – L G I L O C A L G O V E R N M E N T P O L I C Y P A R T N E R S H I P P R O G R A M
š
š
š
š
š
š
ed bodies while preserving democratic control over public service delivery. We can alsoassume that service delivery quality would improve.
REFERENCES
Bercík, P. (1999). Financovanie miestnych samospráv v Slovenskej republike. Doku-mentácia vyvoja za roky 1991–1997 [Financing of local self-governments in theSlovak Republic. Development in 1991–1997]. Banská Bystrica: Ekonomická fakul-ta Univerzity Mateja Bela.
Bucek, J. (1997). Sídelny systém a interkomunálna spolupráca: sanca pre flexibilnysystém verejnej správy na Slovensku [Settlement structure and inter-municipal co-operation: A chance for a flexible system of public administration in Slovakia] InDelmartino, F., Vermessen, E., Miháliková, S., and Falt’an, L’. (Eds.) (1997). Novépodoby verejnej správy (Slovenská a flámska skúsenost’), Sociologicky ústav SAV,Bratislava, pp.162–177.
Bucek, J. (1997a). Size Categories of Municipalities and Finances of Local Govern-ment in Slovakia. Acta Universitatis Carolinae, Geographica, Supplementum,Prague, pp.297–305.
Bútorová, Z. (1998). Verejná mienka [Public opinion]. In Bútora, M., and Ivantysyn,M. (Eds.) (1998). Slovensko 1997. Súhrnná správa o stave spolocnosti a trendochna rok 1998. pp.197–232. Bratislava: Institute for Public Affairs.
Concept of Decentralization and Modernization of Public Administration in Slovakia,Government of the Slovak Republic 2001.
Directives of the Government of the Slovak Republic 1999 and 2000.
FOCUS (2000): Citizen’s Participation and Local Government in Slovakia. Bratislava
Horváth, T. (Ed.) (2000). Decentralization: Experiments and Reforms. Budapest: OSI/LGI.
Institute for Public Affairs (IVO) (2000). Prieskum názorov ekonomickych elít naaktuálne otázky vyvoja slovenskej ekonomiky [Economic elites survey on actualissues of the Slovak economy development]. Bratislava.
Institute for Public Affairs (IVO) (2001). Prieskum názorov ekonomickych elít naaktuálne otázky vyvoja slovenskej ekonomiky [Economic elites survey on actualissues of the Slovak economy development]. Bratislava.
Institute for Public Affairs (IVO) (2001). Reforma verejnej správy—pohl’ad verejnosti[Reform of public administration—public view]. Bratislava.
163
S E PA R AT E E X I S T E N C E S A B O V E A L L — LO C A L S E L F – G O V E R N M E N T S A N D S E R V I C E D E L I V E R Y I N S LOVA K I A
š
š šš
šš
š
šš
š
š
š
š
Konecny, S. (1997). Decentralizácia v podmienkach Slovenskej republiky [Decentral-ization under the conditions in the Slovak Republic] In Delmartino, F, Vermessen,E., Miháliková, S., and Falt’an, L’. (Eds.) (1997). Nové podoby verejnej správy(Slovenská a flámska skúsenost’). Sociologicky ústav SAV, pp.77–90. Bratislava.
Malíková, L’. (2000). “Public Administration Reform in Slovakia with Special Refer-ence to Local Government”. Sociológia, Vol. 32, No. 3, pp.273–288.
Malíková, L’., and Bucek, J. (1997). “Mayors in Slovakia”. (A Case Study). Sociológia,Vol. 29, No. 6, pp.707–722.
Meseznikov, G. (1999). Domestic Politics. In Meseznikov, G., Ivantysyn, M., andNicholson, T. (Eds.). Slovakia 1998–1999. A Global Report on the State of Soci-ety. Institute for Public Affairs, pp.13–64. Bratislava.
Ministry of Finance in the SR (2000). Odvetvová bilancia príjmov a vydavkov obcík 31.12.1999 [Branch structure of revenues and expenditures of municipalities asof December 12, 1999].
Ministry of Finance in the SR (2001). Odvetvová bilancia príjmov a vydavkov obcík 31.12.2000 [Branch structure of revenues and expenditures of municipalities asof December 12, 2000].
Ministry of Interior (2000). Anketa o potrebách a formách medziobecnej spolupráce[The survey on requirements and forms of inter-municipal cooperation].
Nemec, J., and Bercík, P. (1997). Zlucovanie obcí alebo ich funkcií: efektívnost’a rovnost’ [Integration of municipalities or their tasks: effectiveness and equity] InDelmartino, F, Vermessen, E., Miháliková, S., and Falt’an, L’. (Eds.) (1997). Novépodoby verejnej správy (Slovenská a flámska skúsenost’), Sociologicky ústav SAV,pp.178–189. Bratislava.
Niznansky, V. (1998). Verejná správa [Public administration]. In Bútora, M., and Ivan-tysyn, M. (Eds.) (1998). Slovensko 1997. Súhrnná správa o stave spolocnosti atrendoch na rok 1998. Institute for Public Affairs, pp.171–196. Bratislava.
PHARE (1998). Technical Assistance to Public Administration Reform. Medziobecnáspolupráca [Inter-municipal cooperation]. Bratislava.
Scítanie l’udu, domov a bytov 1991 [Census 1991], Statistical Office of the SR, Brat-islava 1993.
Slavík, V. (1994). Proces integrácie a desintegrácie obcí ako prejav lokálnej politiky[Processes of integration and disintegration of municipalities as a demonstration oflocal politics]. Rozvoj vidieka. Zborník príspevkov z vedeckej konferencie v Nitre7–8. 12. 1994, VSP, pp.67–70. Nitra.
164
C O N S O L I D A T I O N O R F R A G M E N T A T I O N ?
D F I D – L G I L O C A L G O V E R N M E N T P O L I C Y P A R T N E R S H I P P R O G R A M
š
š
š
š
š
š
Slavík, V. (1997). The Settlement Structure of the Slovak Republic during the Processof Transformation. Acta Universitatis Carolinae, Geographica, Supplementum,pp.235–243. Prague.
Slavík, V. (1998). Územné zmeny obcí v Slovenskej republike v etape transformácie(1990–1998) [Territorial changes in municipalities of the Slovak Republic duringthe period of transformation (1990–1998)]. Acta Facultas Rerum NaturaliumUniversitatis Comenianae Geographica, No 41, pp.137–154. Bratislava.
State Financial Statement 1993–2000.
Statistical Office of the SR (2000). Odpady v Slovenskej republike v roku 1999 [Wastein the Slovak Republic in 1999]. Bratislava.
Statistical Office of the SR (2001). The Macroeconomic Indicators of Quarterly Na-tional Accounts and Value Added for the 1st–3rd Quarter, p.27. Bratislava.
Statistical Office of the SR (2002). MIS/MOS [Town Information System/Town andVillage Statistics]. Bratislava—statistical data on municipalities.
Statistical Yearbook for the Slovak Republic, 1996 and 2000, Statistical Office of theSR. Bratislava.
Statisticky lexikón obcí 1961, 1970, 1980 [Statistical lexicon of municipalities], Sta-tistical Office of the SR, Bratislava.
Tiburg University—Sociologicky ústav SAV (2000): European Values Study 1999/2000.
Ústav pre vyskum verejnej mienky (ÚVVM) (1999): Názory [Opinions]. StatisticalOffice of the Slovak republic, Bratislava.
Ústav pre vyskum verejnej mienky (ÚVVM) (2001): Informácie [Information]. Statis-tical Office of the Slovak republic, Bratislava.
Ústava Slovenskej republiky [Constitution of the Slovak Republic].
World Bank (2000): Corruption in Slovakia. Results of Diagnostic Surveys.
Zákon c. 302/2001 o samosprávnych krajoch [Act no. 302/2001 on self-governmen-tal regions]
Zákon c. 303/2001 o vol’bách do orgánov samosprávnych krajov [Act no 303/2001on elections to the bodies of self-governmental regions].
Zákon c. 369/1990 o obecnom zriadení [Municipal Law no. 369/1990].
ZMOS (2000). Zoznam odporúcanych spádovych sídiel pre medziobecnú spoluprácu[The list of recommended nodal centers for inter-municipal cooperation]. Bratislava.
ZMOS (2000a). Kompetencie a úlohy územnej samosprávy [Competencies and tasksof territorial self-governments]. Bratislava.
165
S E PA R AT E E X I S T E N C E S A B O V E A L L — LO C A L S E L F – G O V E R N M E N T S A N D S E R V I C E D E L I V E R Y I N S LOVA K I A
NOTES
1 For a more detailed account of public administration development in Slovakia, seeHorváth 2000.
2 The adopted acts (302/2001 and 303/2001) changed the drafts, approved by theGovernment, for the number of self-governmental regions. Through this decision,the socio-spatial organization of Slovakia was broken. The borders of natural re-gions were not respected. The original proposal considered 12 regions rangingfrom 266,332 to 725,018 inhabitants. Such a division also respected the results ofa public survey, that stated 66% of population in Slovakia identified a naturalregion with the territorial unit with the closest relation. Such an attitude by thepopulation does have an impact on their participation in public affairs.
3 A municipality is called, in Slovak terminology, obec. Every municipality is a localself-government. Municipalities in Slovakia can be towns (mesto) or villages (dedina).Towns and villages can consist of several settlement units. In this study, towns/citiesand villages are used as local self-governments. When the term municipality isused, both types are the subject.
4 A more detailed list of the local self-government competencies can be found inHorvath 1999, Municipal Law no. 369/1990 and Act no. 416/2001.
5 Even though under state socialism there was no local self-government, today’smunicipalities existed as statistical units of settlement structure. Therefore, whenreferring to municipalities in this subsection, we are referring to similar units asrecent municipalities.
6 This is the personal experience of the authors taken from city council meetings,attitudes of representatives of its rural sections, as well as experience drawn duringpublic meetings undertaken during work on the Concept of Decentralization andModernization of Public Administration in 1999–2001.
7 ZMOS—the Association of towns and villages of Slovakia, an association repre-senting the interests of local self-governments.
8 Debt related expenditures comprise of credit interest and principal payment andfees for credit administration.
9 We excluded bank operation expenditures that accounted for 20% of expendituresin 2000. These expenditures included mainly debt related expenditures—the afore-mentioned redemption of municipal bonds for Bratislava.
1 0 Until 2001. The scope of competencies of local self-governments expanded after2002.
166
C O N S O L I D A T I O N O R F R A G M E N T A T I O N ?
D F I D – L G I L O C A L G O V E R N M E N T P O L I C Y P A R T N E R S H I P P R O G R A M
1 1 The New Act on waste no. 223/2001 was approved in 2001. Starting January 1,2002, every individual inhabitant of a municipality became the personal producerof municipal waste, not the municipality as a whole. Municipalities specify the feefor waste management per capita in compliance with local conditions.
1 2 Theses provisions were incorporated by an amendment to Act no. 369/1990, Fall2001.
1 3 The overall number of municipalities in Slovakia was 2,883 in 2001. ZMOS asso-ciates 94.3% of them.
1 4 Act no. 416/2001, concerning the tranfer of some competencies from state admin-istration bodies to municipalities and regional self-governments, changed thissituation. Effective July 1, 2002, more tasks in healthcare and social care will be-come the responsibility of municipalities and regional self-government.
1 5 In 2001, the Open Society Foundation provided support funds for creation ofjoint municipal offices and these conclusions drew upon the submitted projects.
1 6 In 2001, the draft law on creation and financing of the tourism association waselaborated upon.
1 7 Only municipalities which had daycare, elementary school or social welfare facili-ties within its territory have been taken into account.
1 8 In February 1998, 69% of eligible population intended to vote in municipal elec-tions [FOCUS, 2000].
1 9 This section elaborated upon the surveys undertaken by the FOCUS agency in1997–2000.
Does LargerMean More Effective?
Size and the Function ofLocal Governments in Bulgaria
Stefan Ivanov
Guinka Tchavdarova
Emil Savov
Hristo Stanev
C H A P T E R 4

168
C O N S O L I D A T I O N O R F R A G M E N T A T I O N ?
D F I D – L G I L O C A L G O V E R N M E N T P O L I C Y P A R T N E R S H I P P R O G R A M
169
D O E S L A R G E R M E A N M O R E E F F E C T I V E ? S I Z E A N D T H E F U N C T I O N O F L O C A L G O V E R N M E N T S I N B U L G A R I A
Table of Contents
1. Introduction ..................................................................................................... 1711.1 Background Information ..................................................................... 1721.2 Administrative and Territorial Divisions in Bulgaria ......................... 175
1.2.1 Brief History of the Changesin the Territorial Division of Bulgaria .................................... 175
1.2.2 Situation of the Present AdministrativeDivisions in Bulgaria .............................................................. 1771.2.2.1 Nature of Administration by Government Tiers .... 1801.2.2.2 Legislation Regulating Changes
in the Country’s Territorial Organization ............... 1801.2.3 Local Government Disparities ................................................ 182
1.2.3.1Demographic and Settlement Structures .................. 1821.2.3.2Socio-Economic Disparities ....................................... 184
1.2.4 Political Mechanisms and Political Representation .............. 1851.2.5 Allocation of Functions Among Tiers of Administration.
Reforms Affecting Allocation of Functions.Inter-Municipal Disparities in the Scope of Local Services .. 187
1.2.6 Financial Resource Structure .................................................. 189
2. Analysis of the Relationship Between Local Government Size andthe Function of Local Governments and Local Democracy ....................... 1912.1 Local Government Size and Citizens’ Satisfaction.
Citizen Participation ........................................................................... 1912.1.1 Citizen Participation ............................................................... 1912.1.2 Citizen Satisfaction ................................................................. 193
2.2 Catchment Areas ................................................................................. 1942.3 Relationship Between the Municipal Center
and Individual Villages ....................................................................... 1972.4 The Impact of Size on Unit Costs of Service Delivery ....................... 2002.5 Local Economic Development and Investment Policy ...................... 202
2.5.1 Local Economic Development ............................................... 2022.5.2 Investment Policy ................................................................... 203
2.6 Inter-Governmental Relations—Does Number and Size ofLocal Governments Influence the Nature and Efficiency ofNegotiations with Central Institutions? ............................................. 205
170
C O N S O L I D A T I O N O R F R A G M E N T A T I O N ?
D F I D – L G I L O C A L G O V E R N M E N T P O L I C Y P A R T N E R S H I P P R O G R A M
3. Description of the National Debateson the Size of Local Governments ............................................................... 207
4. Conclusions and Policy Recommendations ................................................ 2104.1 Conclusions ......................................................................................... 2104.2 Recommendations ............................................................................... 213
References ............................................................................................................. 214
Notes .................................................................................................................... 216
171
D O E S L A R G E R M E A N M O R E E F F E C T I V E ? S I Z E A N D T H E F U N C T I O N O F L O C A L G O V E R N M E N T S I N B U L G A R I A
Does Larger Mean More Effective?Size and the Functioning ofLocal Governments in Bulgaria
Stefan Ivanov, Guinka Tchavdarova, Emil Savov, Hristo Stanev
1. INTRODUCTION
During the years of transition, the administrative and territorial structure in Bulgariawas characterized by relative stability of the lowest (decentralized) level of local go-vernment—the municipalities. The preserved size of local government here is incontrast with the relative fragmentation occurring in some of the other Central andEast European countries. At the same time, a slight trend towards formation of newmunicipalities, through division of some settlements, has also been monitored inthe recent years.
The fragmentation of municipalities strengthens the link between the populationand the local government and is a manifestation of the democratic process risingforth after the collapse of communism. On the other hand, large size municipalitiesenable the provision of more and higher quality local services while other thingsremain the same. That is why, in the last 20 years, a trend towards aggregation ofmunicipalities is being monitored in West Europe (for example the Scandinaviancountries). Meanwhile, there are also examples of very fragmented structure andconservative attitude towards any administrative changes (France).
Fragmentation or aggregation—two approaches, each of them with advantagesand disadvantages. Which of them is more adequate for the conditions, and for practice,in Bulgaria? How is the link between the population and the local government in themunicipalities of different sizes established? How does this influence the democraticprocess of election, local representation, citizen satisfaction and citizen participationin decision making? Are large municipalities able to conduct more independentlocal policy and to provide more and higher quality services to citizens and businesses?
The goal of this paper is to answer to these questions by analyzing Bulgarianpractice, evaluating the influence of the size of local government on the coverageand quality of the provided local services, and local democracy.
172
C O N S O L I D A T I O N O R F R A G M E N T A T I O N ?
D F I D – L G I L O C A L G O V E R N M E N T P O L I C Y P A R T N E R S H I P P R O G R A M
All municipalities in Bulgaria are placed in one of 5 groups for the purpose of theanalysis:
• Group 1—Sofia (capital city of Bulgaria);• Group 2—the municipalities with a population above 75,000 people;• Group 3—the municipalities with a population between 30,000—75,000
people;• Group 4—the municipalities with a population between 10,000—30,000
people;• Group 5—the municipalities with a population below 10,000 people.
The paper has the following structure:• Main macroeconomic indicators, characterizing the share of the local governments
in the public sector;• Presentation of the administrative and territorial structure of the country and
the main characteristics of the municipalities;• Analysis of the relationship between the size of local governments and their
operation and the manifestation of local democracy;• Presentation of national debates on the size of municipalities;• Conclusions and recommendations for changes in the size of local governments
and their operation.
1.1 Background Information
The share of local budget expenditures within the consolidated state budget andGDP in the ‘90s was characterized by strong changes. Several periods can be identified:
Period One—up to 1992. In this period, reforms in the country began (1991)leading to a strong decline in the share of consolidated state budget in the GDP. Theshare of central institutional expenditure declined, while the share of local budgetexpenditures increased in relative terms;
Period Two, from 1993 to the crisis of 1996–1997. The local finance reformpractically started in the beginning of 1993 with the introduction of the intergovern-mental transfer formula. A rapid decline of the share of local expenditures in GDPand in the consolidated state budget was monitored during the entire period. Thetotal public expenditures were also declining, but their rate of decline was smallerthan that of the local budgets;
Period Three, from 1998 to the Present. This period is characterized by a secondstage of legal changes within local government activities and beginning of largestructural changes in local budgets. In 1998, both the share allocated to local budgetsfrom the consolidated state budget and the GDP increased as a result of the
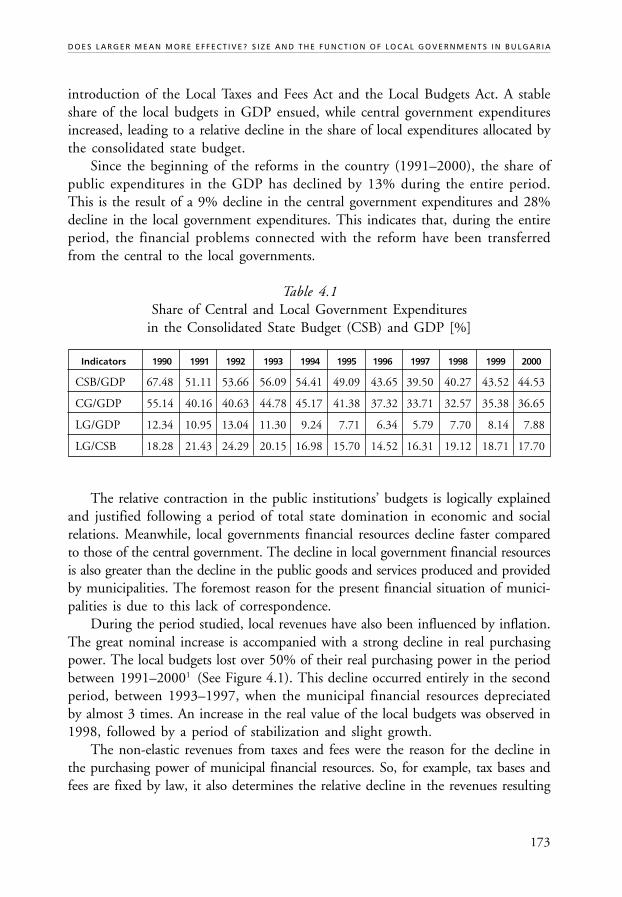
173
D O E S L A R G E R M E A N M O R E E F F E C T I V E ? S I Z E A N D T H E F U N C T I O N O F L O C A L G O V E R N M E N T S I N B U L G A R I A
introduction of the Local Taxes and Fees Act and the Local Budgets Act. A stableshare of the local budgets in GDP ensued, while central government expendituresincreased, leading to a relative decline in the share of local expenditures allocated bythe consolidated state budget.
Since the beginning of the reforms in the country (1991–2000), the share ofpublic expenditures in the GDP has declined by 13% during the entire period.This is the result of a 9% decline in the central government expenditures and 28%decline in the local government expenditures. This indicates that, during the entireperiod, the financial problems connected with the reform have been transferredfrom the central to the local governments.
Table 4.1Share of Central and Local Government Expenditures
in the Consolidated State Budget (CSB) and GDP [%]
Indicators 1990 1991 1992 1993 1994 1995 1996 1997 1998 1999 2000
CSB/GDP 67.48 51.11 53.66 56.09 54.41 49.09 43.65 39.50 40.27 43.52 44.53
CG/GDP 55.14 40.16 40.63 44.78 45.17 41.38 37.32 33.71 32.57 35.38 36.65
LG/GDP 12.34 10.95 13.04 11.30 9.24 7.71 6.34 5.79 7.70 8.14 7.88
LG/CSB 18.28 21.43 24.29 20.15 16.98 15.70 14.52 16.31 19.12 18.71 17.70
The relative contraction in the public institutions’ budgets is logically explainedand justified following a period of total state domination in economic and socialrelations. Meanwhile, local governments financial resources decline faster comparedto those of the central government. The decline in local government financial resourcesis also greater than the decline in the public goods and services produced and providedby municipalities. The foremost reason for the present financial situation of munici-palities is due to this lack of correspondence.
During the period studied, local revenues have also been influenced by inflation.The great nominal increase is accompanied with a strong decline in real purchasingpower. The local budgets lost over 50% of their real purchasing power in the periodbetween 1991–20001 (See Figure 4.1). This decline occurred entirely in the secondperiod, between 1993–1997, when the municipal financial resources depreciatedby almost 3 times. An increase in the real value of the local budgets was observed in1998, followed by a period of stabilization and slight growth.
The non-elastic revenues from taxes and fees were the reason for the decline inthe purchasing power of municipal financial resources. So, for example, tax bases andfees are fixed by law, it also determines the relative decline in the revenues resulting
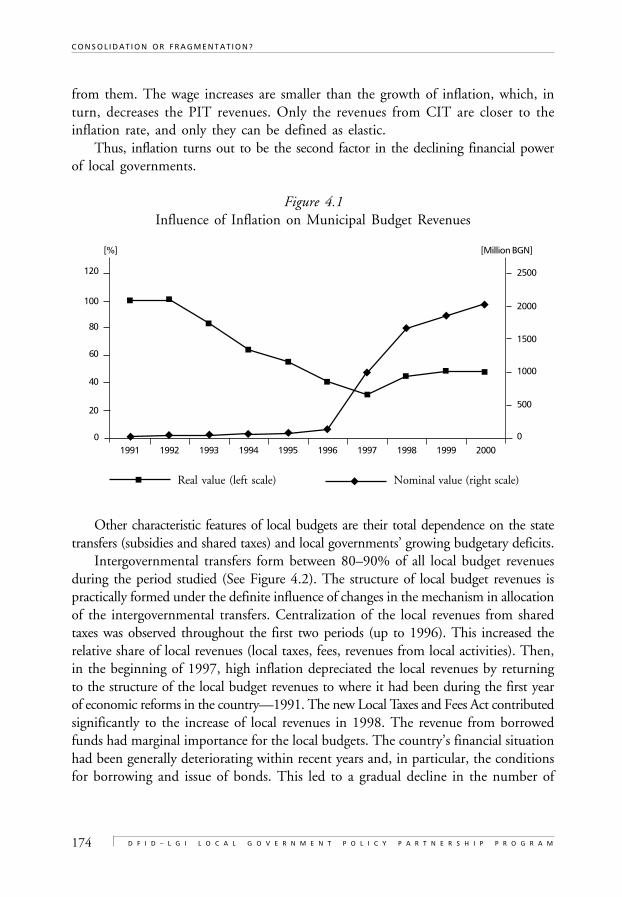
174
C O N S O L I D A T I O N O R F R A G M E N T A T I O N ?
D F I D – L G I L O C A L G O V E R N M E N T P O L I C Y P A R T N E R S H I P P R O G R A M
from them. The wage increases are smaller than the growth of inflation, which, inturn, decreases the PIT revenues. Only the revenues from CIT are closer to theinflation rate, and only they can be defined as elastic.
Thus, inflation turns out to be the second factor in the declining financial powerof local governments.
Figure 4.1Influence of Inflation on Municipal Budget Revenues
Other characteristic features of local budgets are their total dependence on the statetransfers (subsidies and shared taxes) and local governments’ growing budgetary deficits.
Intergovernmental transfers form between 80–90% of all local budget revenuesduring the period studied (See Figure 4.2). The structure of local budget revenues ispractically formed under the definite influence of changes in the mechanism in allocationof the intergovernmental transfers. Centralization of the local revenues from sharedtaxes was observed throughout the first two periods (up to 1996). This increased therelative share of local revenues (local taxes, fees, revenues from local activities). Then,in the beginning of 1997, high inflation depreciated the local revenues by returningto the structure of the local budget revenues to where it had been during the first yearof economic reforms in the country—1991. The new Local Taxes and Fees Act contributedsignificantly to the increase of local revenues in 1998. The revenue from borrowedfunds had marginal importance for the local budgets. The country’s financial situationhad been generally deteriorating within recent years and, in particular, the conditionsfor borrowing and issue of bonds. This led to a gradual decline in the number of
Nominal value (right scale)Real value (left scale)
[%]
0
20
40
60
80
100
120
[Million BGN]
2500
2000
1500
1000
500
0
1991 1992 1993 1994 1995 1996 1997 1998 1999 2000
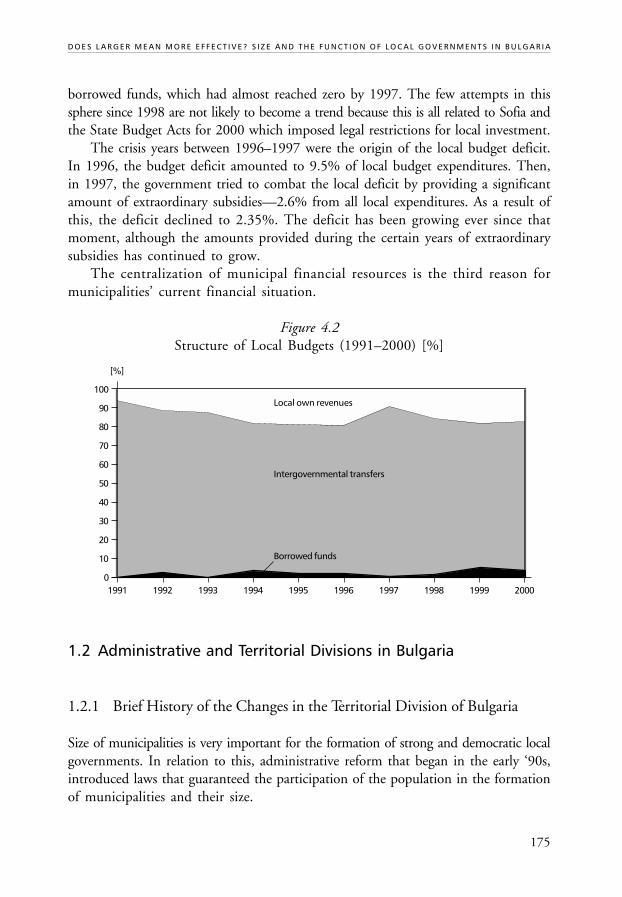
175
D O E S L A R G E R M E A N M O R E E F F E C T I V E ? S I Z E A N D T H E F U N C T I O N O F L O C A L G O V E R N M E N T S I N B U L G A R I A
borrowed funds, which had almost reached zero by 1997. The few attempts in thissphere since 1998 are not likely to become a trend because this is all related to Sofia andthe State Budget Acts for 2000 which imposed legal restrictions for local investment.
The crisis years between 1996–1997 were the origin of the local budget deficit.In 1996, the budget deficit amounted to 9.5% of local budget expenditures. Then,in 1997, the government tried to combat the local deficit by providing a significantamount of extraordinary subsidies—2.6% from all local expenditures. As a result ofthis, the deficit declined to 2.35%. The deficit has been growing ever since thatmoment, although the amounts provided during the certain years of extraordinarysubsidies has continued to grow.
The centralization of municipal financial resources is the third reason formunicipalities’ current financial situation.
Figure 4.2Structure of Local Budgets (1991–2000) [%]
1.2 Administrative and Territorial Divisions in Bulgaria
1.2.1 Brief History of the Changes in the Territorial Division of Bulgaria
Size of municipalities is very important for the formation of strong and democratic localgovernments. In relation to this, administrative reform that began in the early ‘90s,introduced laws that guaranteed the participation of the population in the formationof municipalities and their size.
[%]
100
1991
90
80
70
60
50
40
30
20
10
01993 1994 1995 1996 1997 1998 1999 20001992
Borrowed funds
Intergovernmental transfers
Local own revenues
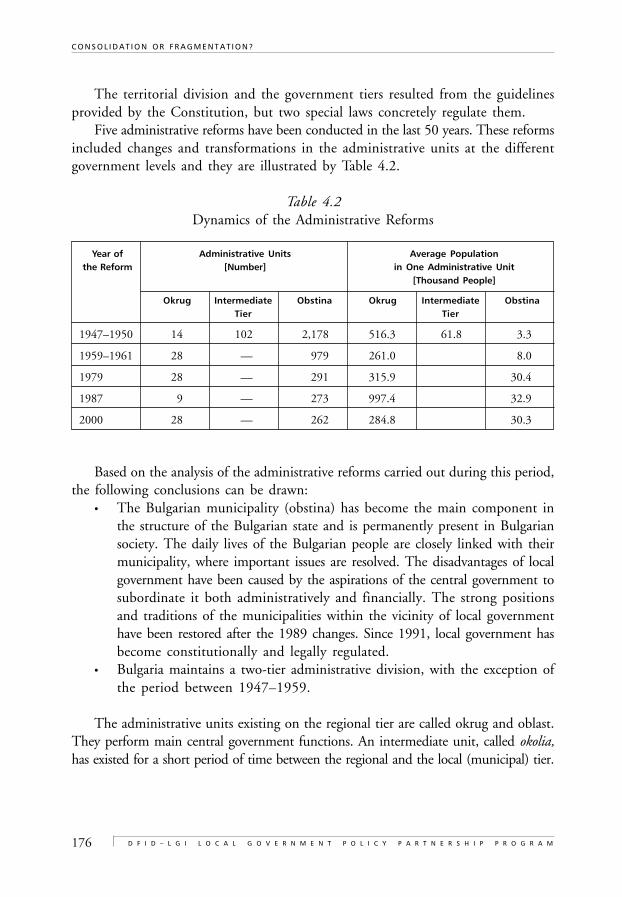
176
C O N S O L I D A T I O N O R F R A G M E N T A T I O N ?
D F I D – L G I L O C A L G O V E R N M E N T P O L I C Y P A R T N E R S H I P P R O G R A M
The territorial division and the government tiers resulted from the guidelinesprovided by the Constitution, but two special laws concretely regulate them.
Five administrative reforms have been conducted in the last 50 years. These reformsincluded changes and transformations in the administrative units at the differentgovernment levels and they are illustrated by Table 4.2.
Table 4.2Dynamics of the Administrative Reforms
Year of Administrative Units Average Populationthe Reform [Number] in One Administrative Unit
[Thousand People]
Okrug Intermediate Obstina Okrug Intermediate ObstinaTier Tier
1947–1950 14 102 2,178 516.3 61.8 3.3
1959–1961 28 — 979 261.0 8.0
1979 28 — 291 315.9 30.4
1987 9 — 273 997.4 32.9
2000 28 — 262 284.8 30.3
Based on the analysis of the administrative reforms carried out during this period,the following conclusions can be drawn:
• The Bulgarian municipality (obstina) has become the main component inthe structure of the Bulgarian state and is permanently present in Bulgariansociety. The daily lives of the Bulgarian people are closely linked with theirmunicipality, where important issues are resolved. The disadvantages of localgovernment have been caused by the aspirations of the central government tosubordinate it both administratively and financially. The strong positionsand traditions of the municipalities within the vicinity of local governmenthave been restored after the 1989 changes. Since 1991, local government hasbecome constitutionally and legally regulated.
• Bulgaria maintains a two-tier administrative division, with the exception ofthe period between 1947–1959.
The administrative units existing on the regional tier are called okrug and oblast.They perform main central government functions. An intermediate unit, called okolia,has existed for a short period of time between the regional and the local (municipal) tier.
177
D O E S L A R G E R M E A N M O R E E F F E C T I V E ? S I Z E A N D T H E F U N C T I O N O F L O C A L G O V E R N M E N T S I N B U L G A R I A
1.2.2 Situation of the Present Administrative Divisions in Bulgaria
According to the present Act on Administrative and Territorial Division of the Republicof Bulgaria, the country has a two-tier administrative structure, including two typesof administrative units—oblast2, and a municipality system.
The region (oblast) is an administrative unit of the central government. It comprisesof one3 or several neighboring municipalities. The regions can be created and liquidatedonly under certain laws. A regional governor, appointed by the Council of Ministers4 ,governs the regions. Presently 28 regions exist. These were established by splittingthe 9 regions that existed before 1999.
The regions are defined by the following parameters:• Population: average population—285,000 people; minimum population—
131,000 people (Vidin Region); maximum population—1,174,000 people(Sofia City Region);
• Territory: average territory—4,000 sq.km.; minimum territory— 1,300 sq.km.(Sofia City Region); maximum territory—7,700 sq.km. (Bourgas Region);
• Number of municipalities: average number—9 municipalities; minimumnumber—1 municipality (Sofia City Region); maximum number—22 muni-cipalities (Sofia Region);
• Number of settlements: average number—191 settlements; minimum number38 (Sofia City Region); maximum number—478 municipalities (KardjaliRegion);
According to the Constitution, the municipality (obstina) is the main (and by nowthe only) tier of local government in the country. A municipality is comprised of oneor more settlements and its territory comprises of the territories of the componentsettlements. The municipality is then named after the administrative center. Themunicipality is a legal entity. It has own independent budget and property that it canuse to serve its interests. The bodies of local government—the municipal council andmayor—are elected directly by the population within the whole municipality. Themunicipalities can still have their own structural units—districts and mayoralties.Districts (raioni) can be established in larger cities, with populations over 100,000people, based on the decision of the municipal council or, within the large citieswith population over 300,000 people themselves, based on the law. Presently, onlythe capital city of Sofia and the second and third largest cities have districts. Thenumber of these districts is as follows: Sofia—24 districts, Plovdiv—6 districts, andVarna—5 districts. The mayoralties (kmetstva) can be established with the permissionof the municipal council and they comprise of one or more neighboring settlements.Presently 1,696 mayoralties exist in Bulgaria. The number of mayoralties variesdepending on the policies of the municipal councils. The mayoralty is a dilutedmunicipal administration (located in a settlement) governed by an elected person.
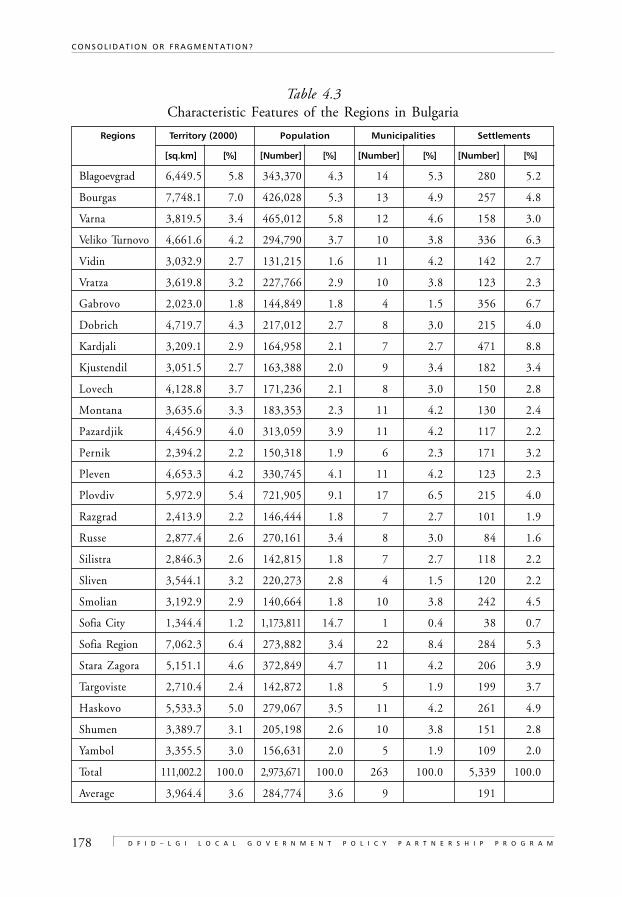
178
C O N S O L I D A T I O N O R F R A G M E N T A T I O N ?
D F I D – L G I L O C A L G O V E R N M E N T P O L I C Y P A R T N E R S H I P P R O G R A M
Table 4.3Characteristic Features of the Regions in Bulgaria
Regions Territory (2000) Population Municipalities Settlements
[sq.km] [%] [Number] [%] [Number] [%] [Number] [%]
Blagoevgrad 6,449.5 5.8 343,370 4.3 14 5.3 280 5.2
Bourgas 7,748.1 7.0 426,028 5.3 13 4.9 257 4.8
Varna 3,819.5 3.4 465,012 5.8 12 4.6 158 3.0
Veliko Turnovo 4,661.6 4.2 294,790 3.7 10 3.8 336 6.3
Vidin 3,032.9 2.7 131,215 1.6 11 4.2 142 2.7
Vratza 3,619.8 3.2 227,766 2.9 10 3.8 123 2.3
Gabrovo 2,023.0 1.8 144,849 1.8 4 1.5 356 6.7
Dobrich 4,719.7 4.3 217,012 2.7 8 3.0 215 4.0
Kardjali 3,209.1 2.9 164,958 2.1 7 2.7 471 8.8
Kjustendil 3,051.5 2.7 163,388 2.0 9 3.4 182 3.4
Lovech 4,128.8 3.7 171,236 2.1 8 3.0 150 2.8
Montana 3,635.6 3.3 183,353 2.3 11 4.2 130 2.4
Pazardjik 4,456.9 4.0 313,059 3.9 11 4.2 117 2.2
Pernik 2,394.2 2.2 150,318 1.9 6 2.3 171 3.2
Pleven 4,653.3 4.2 330,745 4.1 11 4.2 123 2.3
Plovdiv 5,972.9 5.4 721,905 9.1 17 6.5 215 4.0
Razgrad 2,413.9 2.2 146,444 1.8 7 2.7 101 1.9
Russe 2,877.4 2.6 270,161 3.4 8 3.0 84 1.6
Silistra 2,846.3 2.6 142,815 1.8 7 2.7 118 2.2
Sliven 3,544.1 3.2 220,273 2.8 4 1.5 120 2.2
Smolian 3,192.9 2.9 140,664 1.8 10 3.8 242 4.5
Sofia City 1,344.4 1.2 1,173,811 14.7 1 0.4 38 0.7
Sofia Region 7,062.3 6.4 273,882 3.4 22 8.4 284 5.3
Stara Zagora 5,151.1 4.6 372,849 4.7 11 4.2 206 3.9
Targoviste 2,710.4 2.4 142,872 1.8 5 1.9 199 3.7
Haskovo 5,533.3 5.0 279,067 3.5 11 4.2 261 4.9
Shumen 3,389.7 3.1 205,198 2.6 10 3.8 151 2.8
Yambol 3,355.5 3.0 156,631 2.0 5 1.9 109 2.0
Total 111,002.2 100.0 2,973,671 100.0 263 100.0 5,339 100.0
Average 3,964.4 3.6 284,774 3.6 9 191
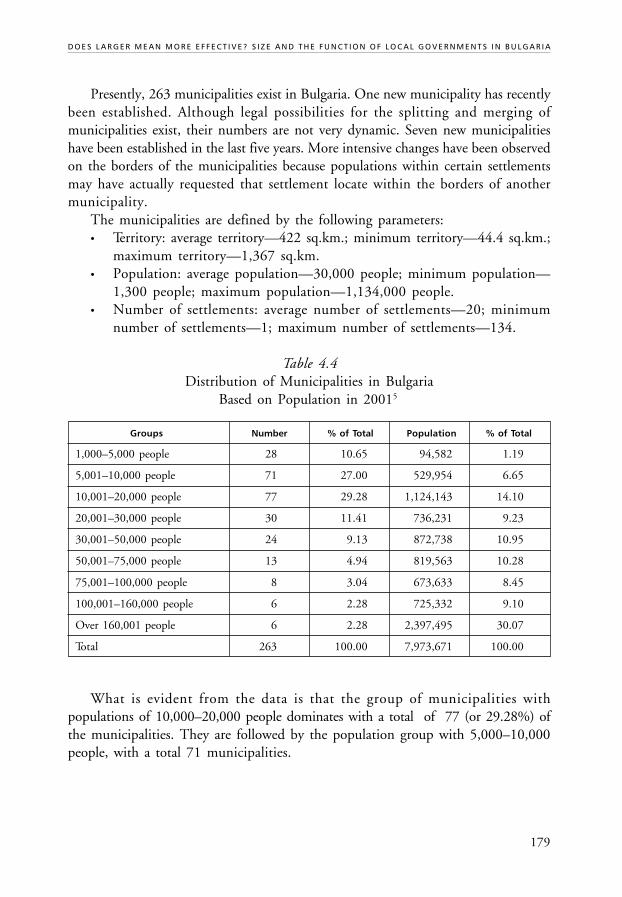
179
D O E S L A R G E R M E A N M O R E E F F E C T I V E ? S I Z E A N D T H E F U N C T I O N O F L O C A L G O V E R N M E N T S I N B U L G A R I A
Presently, 263 municipalities exist in Bulgaria. One new municipality has recentlybeen established. Although legal possibilities for the splitting and merging ofmunicipalities exist, their numbers are not very dynamic. Seven new municipalitieshave been established in the last five years. More intensive changes have been observedon the borders of the municipalities because populations within certain settlementsmay have actually requested that settlement locate within the borders of anothermunicipality.
The municipalities are defined by the following parameters:• Territory: average territory—422 sq.km.; minimum territory—44.4 sq.km.;
maximum territory—1,367 sq.km.• Population: average population—30,000 people; minimum population—
1,300 people; maximum population—1,134,000 people.• Number of settlements: average number of settlements—20; minimum
number of settlements—1; maximum number of settlements—134.
Table 4.4Distribution of Municipalities in Bulgaria
Based on Population in 20015
Groups Number % of Total Population % of Total
1,000–5,000 people 28 10.65 94,582 1.19
5,001–10,000 people 71 27.00 529,954 6.65
10,001–20,000 people 77 29.28 1,124,143 14.10
20,001–30,000 people 30 11.41 736,231 9.23
30,001–50,000 people 24 9.13 872,738 10.95
50,001–75,000 people 13 4.94 819,563 10.28
75,001–100,000 people 8 3.04 673,633 8.45
100,001–160,000 people 6 2.28 725,332 9.10
Over 160,001 people 6 2.28 2,397,495 30.07
Total 263 100.00 7,973,671 100.00
What is evident from the data is that the group of municipalities withpopulations of 10,000–20,000 people dominates with a total of 77 (or 29.28%) ofthe municipalities. They are followed by the population group with 5,000–10,000people, with a total 71 municipalities.
180
C O N S O L I D A T I O N O R F R A G M E N T A T I O N ?
D F I D – L G I L O C A L G O V E R N M E N T P O L I C Y P A R T N E R S H I P P R O G R A M
1.2.2.1 Nature of Administration by Government TiersIt has already been pointed out that the regional administration is part of the centralgovernment administration. The total number of employees in the regional administ-rations is small—about 1,100 people, 80% of whom have university degrees. Womenprevail among the regional administrations at 64% of all employees.
The municipal administrations perform local government functions. The municipalcouncils have the legal powers to determine the structure and the number of employeesin the municipal administration. However, many centrally determined legal requirementsas well as restrictions, also exist. The number of municipal administrators is 18,000people, over 40% have university degrees. The municipal administration is mainlylocalized in the settlement, which is the administrative center of the municipality.This houses 65% of the municipal servants. The rest of the municipal servantswork within the mayoralties and the districts.
1.2.2.2 Legislation Regulating Changes in the Country’s Territorial OrganizationThe Act on Administrative and Territorial Division of the Republic of Bulgaria, adoptedin 1995, determines the way and the conditions for establishing and changingadministrative units. The adoption of this law determined a new meaning for theterm “administrative and territorial structure”. It means; “a continuous process forcreation of administrative and territorial units in the country, for development oflocal government and conducting administrative changes according to the will ofthe population and the state interests”. The law is based on a number of principles,the most important of which are: the principle of territorial neighborhood; compliancebetween the size of the administrative units and their competencies and resources;the subsidiarity principle; the principle of succession and territorial stability of theadministrative structure and democratic choice in decisions that effect particularadministrative and territorial changes.
The law determines the following conditions necessary for creation of a newmunicipality:
• The total combined population of the settlements, to be included in themunicipality, should be over 6,000 people.
• There should exist a settlement that can serve as the center, with establishedsocial and technical infrastructure and ensuring the servicing of the population.
• The maximum distance between the center of the municipality and thesettlements should not exceed 40 km.
• The new municipality may include those neighboring settlements that canneither become a separate municipality nor join another neighboring muni-cipality.
• The new municipality should be able to finance its expenditures with ownsource revenues, which should be equal to at least half of its average own
181
D O E S L A R G E R M E A N M O R E E F F E C T I V E ? S I Z E A N D T H E F U N C T I O N O F L O C A L G O V E R N M E N T S I N B U L G A R I A
source revenues for the municipalities as approved by the state budget actfor that respective year. For example, if the municipalities in the countrysupport 50% of their expenditures with own source revenues on the average,then the newly established municipality should have the ability to cover atleast 25% of its expenditures with own source revenues.
The new municipalities are created through:• Separation of one or several neighboring settlements from an existing municipality
and establishment of a new municipality;• Merging of two or more municipalities within one municipality, or one
municipality annexing another one;• Splitting of one existing municipality into two or more municipalities.
The procedure for the establishment or liquidation of a municipality requiresthe enactment of a local referendum and a positive vote from the population. Adecision by the Council of Ministers and a decree from the President should followthis. In cases of a positive vote from the population, it is possible for the governmentto decide not to establish a new municipality. However, the opposite is impossible:to create/liquidate a municipality following a negative vote from the population.
The establishment of districts (as components of the municipality) is based onsome conditions for the number of population (over 25,000 people). Districts canbe established in cities with populations over 100,000 people. The mayor proposes,and the municipal council approves, the establishment of districts. This procedureis not applied in the case of districts established in the capital city and in cities withpopulations over 300,000 people because their territorial division is subject to speciallaws.
The establishment of a mayoralty (as a component of municipality) requires apopulation over 500 people and capacity for the performance of functions assignedby the municipality. The procedure also includes a referendum. The municipal councilcan only make a decision after a positive vote from the population of the new mayoralty.
The country’s main changes in the administrative and territorial structure canbe performed through mergers, divisions, annexing, separation and liquidation.The legislation oversees when each of these procedures is performed. Referendumsare always required for the municipalities and the mayoralties. No such requirementis needed for the districts.
The legislation also regulates the procedures for changing the center of theadministrative unit, the name of the settlement, creation of a new or liquidation ofan existing settlement, giving “city” status to a village, etc.
The main features of the present legislation concerning administrative andterritorial structure can be summarized as follows:
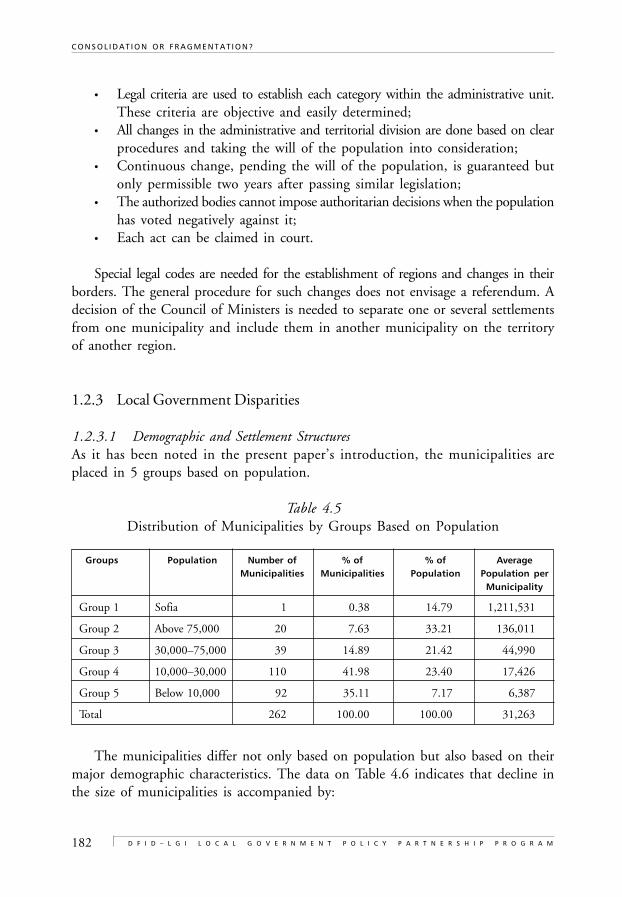
182
C O N S O L I D A T I O N O R F R A G M E N T A T I O N ?
D F I D – L G I L O C A L G O V E R N M E N T P O L I C Y P A R T N E R S H I P P R O G R A M
• Legal criteria are used to establish each category within the administrative unit.These criteria are objective and easily determined;
• All changes in the administrative and territorial division are done based on clearprocedures and taking the will of the population into consideration;
• Continuous change, pending the will of the population, is guaranteed butonly permissible two years after passing similar legislation;
• The authorized bodies cannot impose authoritarian decisions when the populationhas voted negatively against it;
• Each act can be claimed in court.
Special legal codes are needed for the establishment of regions and changes in theirborders. The general procedure for such changes does not envisage a referendum. Adecision of the Council of Ministers is needed to separate one or several settlementsfrom one municipality and include them in another municipality on the territoryof another region.
1.2.3 Local Government Disparities
1.2.3.1 Demographic and Settlement StructuresAs it has been noted in the present paper’s introduction, the municipalities areplaced in 5 groups based on population.
Table 4.5Distribution of Municipalities by Groups Based on Population
Groups Population Number of % of % of AverageMunicipalities Municipalities Population Population per
Municipality
Group 1 Sofia 1 0.38 14.79 1,211,531
Group 2 Above 75,000 20 7.63 33.21 136,011
Group 3 30,000–75,000 39 14.89 21.42 44,990
Group 4 10,000–30,000 110 41.98 23.40 17,426
Group 5 Below 10,000 92 35.11 7.17 6,387
Total 262 100.00 100.00 31,263
The municipalities differ not only based on population but also based on theirmajor demographic characteristics. The data on Table 4.6 indicates that decline inthe size of municipalities is accompanied by:
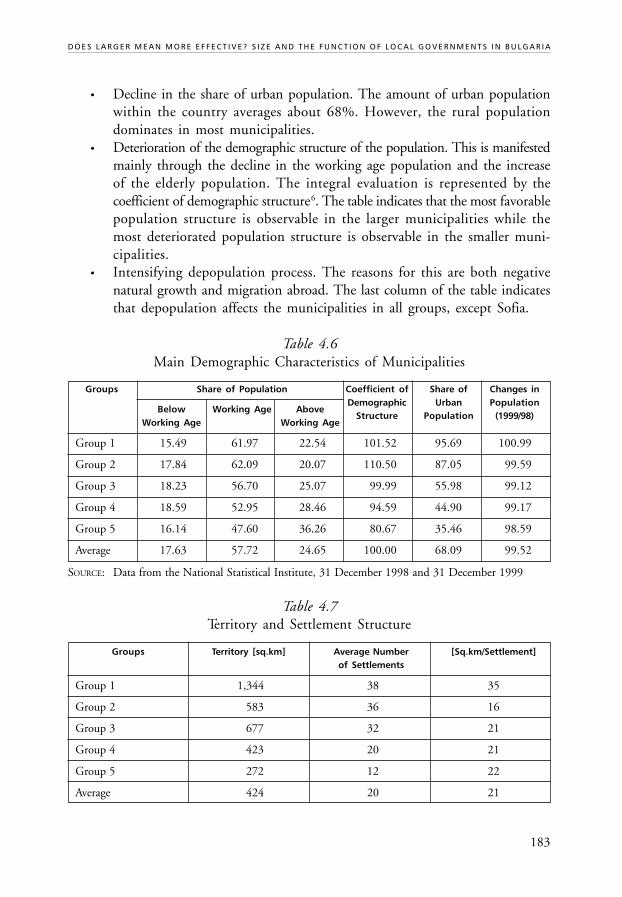
183
D O E S L A R G E R M E A N M O R E E F F E C T I V E ? S I Z E A N D T H E F U N C T I O N O F L O C A L G O V E R N M E N T S I N B U L G A R I A
• Decline in the share of urban population. The amount of urban populationwithin the country averages about 68%. However, the rural populationdominates in most municipalities.
• Deterioration of the demographic structure of the population. This is manifestedmainly through the decline in the working age population and the increaseof the elderly population. The integral evaluation is represented by thecoefficient of demographic structure6. The table indicates that the most favorablepopulation structure is observable in the larger municipalities while themost deteriorated population structure is observable in the smaller muni-cipalities.
• Intensifying depopulation process. The reasons for this are both negativenatural growth and migration abroad. The last column of the table indicatesthat depopulation affects the municipalities in all groups, except Sofia.
Table 4.6Main Demographic Characteristics of Municipalities
Groups Share of Population Coefficient of Share of Changes in
Below Working Age AboveDemographic Urban Population
Working Age Working AgeStructure Population (1999/98)
Group 1 15.49 61.97 22.54 101.52 95.69 100.99
Group 2 17.84 62.09 20.07 110.50 87.05 99.59
Group 3 18.23 56.70 25.07 99.99 55.98 99.12
Group 4 18.59 52.95 28.46 94.59 44.90 99.17
Group 5 16.14 47.60 36.26 80.67 35.46 98.59
Average 17.63 57.72 24.65 100.00 68.09 99.52
SOURCE: Data from the National Statistical Institute, 31 December 1998 and 31 December 1999
Table 4.7Territory and Settlement Structure
Groups Territory [sq.km] Average Number [Sq.km/Settlement]of Settlements
Group 1 1,344 38 35
Group 2 583 36 16
Group 3 677 32 21
Group 4 423 20 21
Group 5 272 12 22
Average 424 20 21
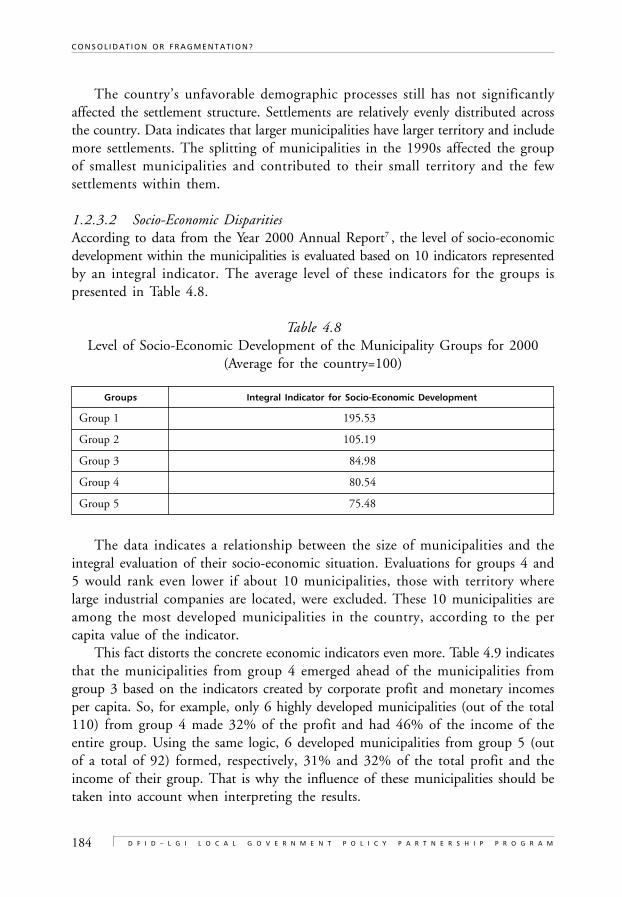
184
C O N S O L I D A T I O N O R F R A G M E N T A T I O N ?
D F I D – L G I L O C A L G O V E R N M E N T P O L I C Y P A R T N E R S H I P P R O G R A M
The country’s unfavorable demographic processes still has not significantlyaffected the settlement structure. Settlements are relatively evenly distributed acrossthe country. Data indicates that larger municipalities have larger territory and includemore settlements. The splitting of municipalities in the 1990s affected the groupof smallest municipalities and contributed to their small territory and the fewsettlements within them.
1.2.3.2 Socio-Economic DisparitiesAccording to data from the Year 2000 Annual Report7 , the level of socio-economicdevelopment within the municipalities is evaluated based on 10 indicators representedby an integral indicator. The average level of these indicators for the groups ispresented in Table 4.8.
Table 4.8Level of Socio-Economic Development of the Municipality Groups for 2000
(Average for the country=100)
Groups Integral Indicator for Socio-Economic Development
Group 1 195.53
Group 2 105.19
Group 3 84.98
Group 4 80.54
Group 5 75.48
The data indicates a relationship between the size of municipalities and theintegral evaluation of their socio-economic situation. Evaluations for groups 4 and5 would rank even lower if about 10 municipalities, those with territory wherelarge industrial companies are located, were excluded. These 10 municipalities areamong the most developed municipalities in the country, according to the percapita value of the indicator.
This fact distorts the concrete economic indicators even more. Table 4.9 indicatesthat the municipalities from group 4 emerged ahead of the municipalities fromgroup 3 based on the indicators created by corporate profit and monetary incomesper capita. So, for example, only 6 highly developed municipalities (out of the total110) from group 4 made 32% of the profit and had 46% of the income of theentire group. Using the same logic, 6 developed municipalities from group 5 (outof a total of 92) formed, respectively, 31% and 32% of the total profit and theincome of their group. That is why the influence of these municipalities should betaken into account when interpreting the results.
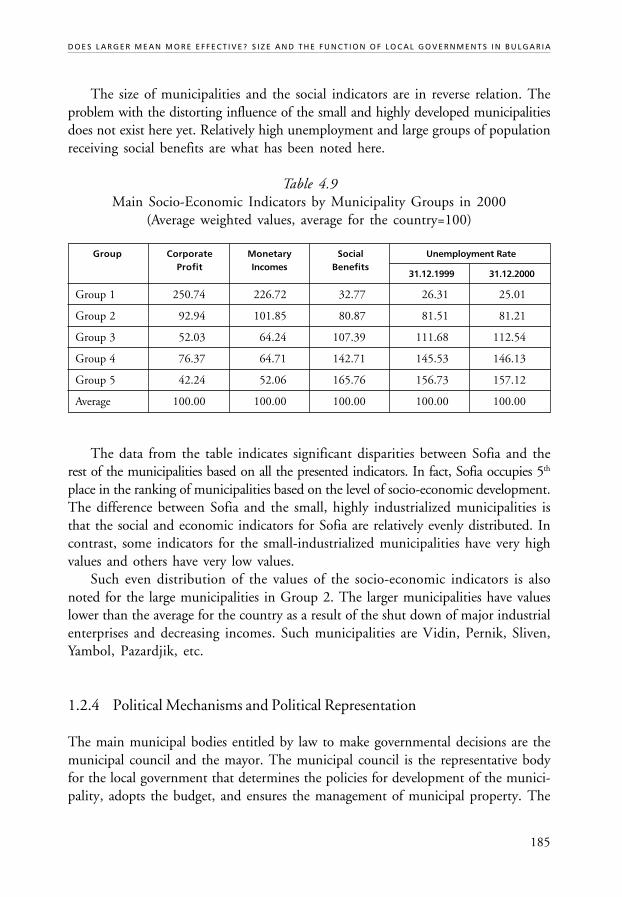
185
D O E S L A R G E R M E A N M O R E E F F E C T I V E ? S I Z E A N D T H E F U N C T I O N O F L O C A L G O V E R N M E N T S I N B U L G A R I A
The size of municipalities and the social indicators are in reverse relation. Theproblem with the distorting influence of the small and highly developed municipalitiesdoes not exist here yet. Relatively high unemployment and large groups of populationreceiving social benefits are what has been noted here.
Table 4.9Main Socio-Economic Indicators by Municipality Groups in 2000
(Average weighted values, average for the country=100)
Group Corporate Monetary Social Unemployment RateProfit Incomes Benefits
31.12.1999 31.12.2000
Group 1 250.74 226.72 32.77 26.31 25.01
Group 2 92.94 101.85 80.87 81.51 81.21
Group 3 52.03 64.24 107.39 111.68 112.54
Group 4 76.37 64.71 142.71 145.53 146.13
Group 5 42.24 52.06 165.76 156.73 157.12
Average 100.00 100.00 100.00 100.00 100.00
The data from the table indicates significant disparities between Sofia and therest of the municipalities based on all the presented indicators. In fact, Sofia occupies 5th
place in the ranking of municipalities based on the level of socio-economic development.The difference between Sofia and the small, highly industrialized municipalities isthat the social and economic indicators for Sofia are relatively evenly distributed. Incontrast, some indicators for the small-industrialized municipalities have very highvalues and others have very low values.
Such even distribution of the values of the socio-economic indicators is alsonoted for the large municipalities in Group 2. The larger municipalities have valueslower than the average for the country as a result of the shut down of major industrialenterprises and decreasing incomes. Such municipalities are Vidin, Pernik, Sliven,Yambol, Pazardjik, etc.
1.2.4 Political Mechanisms and Political Representation
The main municipal bodies entitled by law to make governmental decisions are themunicipal council and the mayor. The municipal council is the representative bodyfor the local government that determines the policies for development of the munici-pality, adopts the budget, and ensures the management of municipal property. The
186
C O N S O L I D A T I O N O R F R A G M E N T A T I O N ?
D F I D – L G I L O C A L G O V E R N M E N T P O L I C Y P A R T N E R S H I P P R O G R A M
mayor performs executive functions. The mayor directly manages the municipaladministration as well as ensures the performance of the municipal budget and thedecisions of the municipal council.
The municipal council comprises of the elected municipal councilors. The LocalGovernment and Local Administration Act determines the number of municipalcouncilors based on the population of the specific municipality. The number of muni-cipal councilors varies from 11 to 61 people. The procedure for electing municipalcouncilors is determined by the Local Elections Act. Municipal councilors are electedon the basis of proportionate representation. The registered political parties, or coalitions,register their candidates on independent lists. These are blocked lists, they cannot bechanged during the vote. Independent candidates not linked with any party may alsoparticipate. A committee, comprising of a certain minimum number of voters that havesigned the nomination petition, submits their nomination. The distribution of thepositions depends on the votes and is based on the d’Hondt method. The mandateof the municipal council is 4 years.
The local elections held at the end of 1999, elected 262 municipal councilswith 5,249 municipal councilors. Men prevailed among the municipal councilorseat takers (79.1%).
The mayor of the municipality and the mayor of mayoralty, for settlements withpopulation over 500 people, are elected directly by the population of the municipalityfor a 4-year mandate. This procedure is outlined in the Local Elections Act. Theelections for mayor take place in two rounds, based on the majority system. The leader-ship of political parties and coalitions propose the candidates for mayors. Independentcandidates can also run for mayor. The candidate who gains the absolute majorityof votes in the first round, becomes mayor. A second round is organized if none ofthe candidates has been elected. The second round takes place a week after the firstround and only the first two candidates may participate. The candidate who gainsthe most votes becomes mayor.
The mayor nominates and the municipal council elects, in a secret election, oneor more deputy mayors for the municipality. The municipal council is based on thenomination of the mayor elect, by the secret vote of the mayors’ representatives.The mayor’s representatives are elected by the municipal council to represent themayor in settlements with populations below 500 people. Legislation says that thepowers of the mayor’s representatives should be determined by the Regulations forthe operation of the municipal council and the municipal administration, adoptedby the municipal council.
In the local elections that took place at the end of 1999, 262 municipal mayorsand 1,696 mayors of mayoralties were elected. Over 40 political parties and coalitionsparticipated in the elections and over 20 of them are represented through the electedmayors and municipal councilors. The independent municipal councilors nominated
187
D O E S L A R G E R M E A N M O R E E F F E C T I V E ? S I Z E A N D T H E F U N C T I O N O F L O C A L G O V E R N M E N T S I N B U L G A R I A
by committees form about 4% of the total number of municipal councilors. Over15% of the elected mayors, were independent candidates.
The election rules in the country are valid for all municipalities, regardless ofsize. The only exceptions to this rule are the numerous mandates within the municipalcouncils, depending on the population size of the municipalities.
Role of the Political PartiesPolitical parties can participate directly or indirectly in the political life of the munici-palities. The direct participation of political parties occurs during the election process,in which the political parties form election lists and perform election campaigns.The indirect participation of political parties in the municipal policy is enacted through:the municipal councilors; groups of municipal councilors united on party principles;the chairperson of the municipal council (who is usually the representative of the partywith most members in the municipal council); the statutory committees in themunicipal council (if the party has a majority in them); the mayor of the municipality(if he/she has been nominated by a certain political party). The participation ofpolitical parties is more active in large and medium size municipalities.
The relationship between the mayor and the local leaders of political parties ismainly connected with the executive activities. Problems may occur when the mayorbelongs to one political party and the majority of municipal councilors come fromanother party. Legal prerequisites exist that state the mayor should resign when 2/3 of the municipal councilors vote against him. The law forbids the mayor, the deputymayors and the mayor’s representatives to participate in the leadership of politicalparties and/or to participate in any commercial activities.
1.2.5 Allocation of Functions Among Tiers of Administration.Reforms Affecting Allocation of Functions.Inter-Municipal Disparities in the Scope of Local Services
The public sector in Bulgaria consists of three government tiers: central, regional andlocal. The regional level comprises of 28 administrative diluted units of the centralgovernment that do not provide public services. Their main responsibilities consist ofmanaging state property in the respective region, coordination of regional units of theline ministries, preparation and execution of the National Plan for Regional Develop-ment, etc. They do not have revenue raising authority, nor their own budget. So,in terms of service provision responsibilities, they cannot be included into the study.
Public services are organized in nine major functions, each of them containing anumber of activities. The central and the local governments provide services in each ofthese functions, as the ratio of their shares in the consolidated public expenditures variesfor the different functions. Local governments spent around 18% of total public expen-
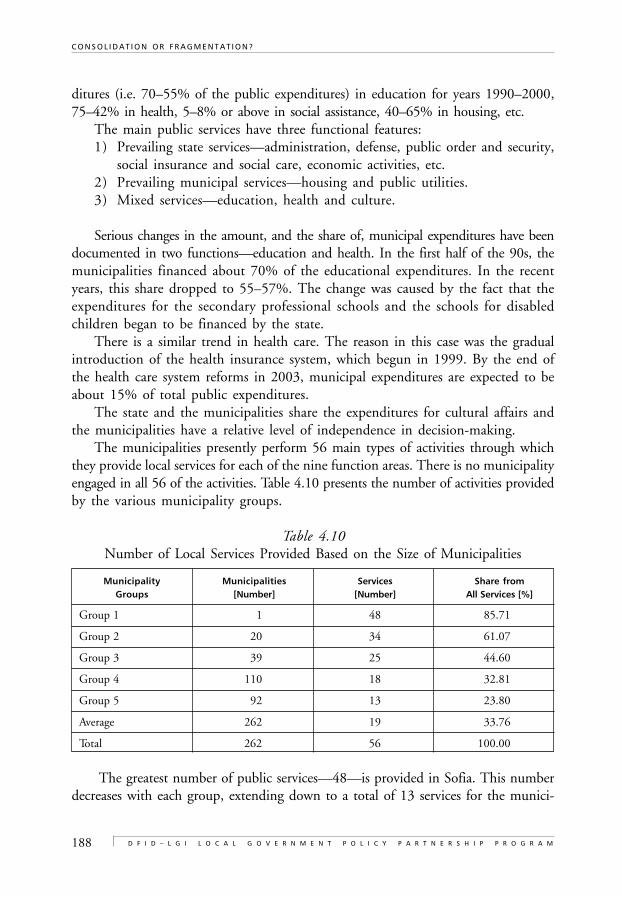
188
C O N S O L I D A T I O N O R F R A G M E N T A T I O N ?
D F I D – L G I L O C A L G O V E R N M E N T P O L I C Y P A R T N E R S H I P P R O G R A M
ditures (i.e. 70–55% of the public expenditures) in education for years 1990–2000,75–42% in health, 5–8% or above in social assistance, 40–65% in housing, etc.
The main public services have three functional features:1) Prevailing state services—administration, defense, public order and security,
social insurance and social care, economic activities, etc.2) Prevailing municipal services—housing and public utilities.3) Mixed services—education, health and culture.
Serious changes in the amount, and the share of, municipal expenditures have beendocumented in two functions—education and health. In the first half of the 90s, themunicipalities financed about 70% of the educational expenditures. In the recentyears, this share dropped to 55–57%. The change was caused by the fact that theexpenditures for the secondary professional schools and the schools for disabledchildren began to be financed by the state.
There is a similar trend in health care. The reason in this case was the gradualintroduction of the health insurance system, which begun in 1999. By the end ofthe health care system reforms in 2003, municipal expenditures are expected to beabout 15% of total public expenditures.
The state and the municipalities share the expenditures for cultural affairs andthe municipalities have a relative level of independence in decision-making.
The municipalities presently perform 56 main types of activities through whichthey provide local services for each of the nine function areas. There is no municipalityengaged in all 56 of the activities. Table 4.10 presents the number of activities providedby the various municipality groups.
Table 4.10Number of Local Services Provided Based on the Size of Municipalities
Municipality Municipalities Services Share fromGroups [Number] [Number] All Services [%]
Group 1 1 48 85.71
Group 2 20 34 61.07
Group 3 39 25 44.60
Group 4 110 18 32.81
Group 5 92 13 23.80
Average 262 19 33.76
Total 262 56 100.00
The greatest number of public services—48—is provided in Sofia. This numberdecreases with each group, extending down to a total of 13 services for the munici-
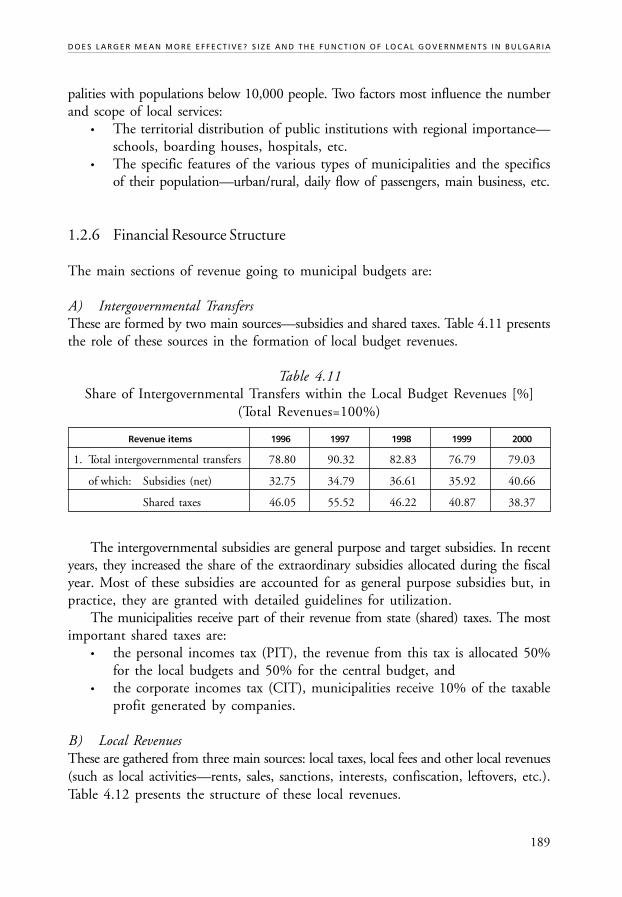
189
D O E S L A R G E R M E A N M O R E E F F E C T I V E ? S I Z E A N D T H E F U N C T I O N O F L O C A L G O V E R N M E N T S I N B U L G A R I A
palities with populations below 10,000 people. Two factors most influence the numberand scope of local services:
• The territorial distribution of public institutions with regional importance—schools, boarding houses, hospitals, etc.
• The specific features of the various types of municipalities and the specificsof their population—urban/rural, daily flow of passengers, main business, etc.
1.2.6 Financial Resource Structure
The main sections of revenue going to municipal budgets are:
A) Intergovernmental TransfersThese are formed by two main sources—subsidies and shared taxes. Table 4.11 presentsthe role of these sources in the formation of local budget revenues.
Table 4.11Share of Intergovernmental Transfers within the Local Budget Revenues [%]
(Total Revenues=100%)
Revenue items 1996 1997 1998 1999 2000
1. Total intergovernmental transfers 78.80 90.32 82.83 76.79 79.03
of which: Subsidies (net) 32.75 34.79 36.61 35.92 40.66
Shared taxes 46.05 55.52 46.22 40.87 38.37
The intergovernmental subsidies are general purpose and target subsidies. In recentyears, they increased the share of the extraordinary subsidies allocated during the fiscalyear. Most of these subsidies are accounted for as general purpose subsidies but, inpractice, they are granted with detailed guidelines for utilization.
The municipalities receive part of their revenue from state (shared) taxes. The mostimportant shared taxes are:
• the personal incomes tax (PIT), the revenue from this tax is allocated 50%for the local budgets and 50% for the central budget, and
• the corporate incomes tax (CIT), municipalities receive 10% of the taxableprofit generated by companies.
B) Local RevenuesThese are gathered from three main sources: local taxes, local fees and other local revenues(such as local activities—rents, sales, sanctions, interests, confiscation, leftovers, etc.).Table 4.12 presents the structure of these local revenues.
190
C O N S O L I D A T I O N O R F R A G M E N T A T I O N ?
D F I D – L G I L O C A L G O V E R N M E N T P O L I C Y P A R T N E R S H I P P R O G R A M
Table 4.12Structure of Local Revenues [%]
1996 1997 1998 1999 2000
Total local revenues 19.27 9.36 15.86 18.19 17.47
Local taxes 5.36 2.03 4.95 4.43 4.40
Local fees 4.85 3.16 6.21 6.13 6.69
Other local revenues 9.07 4.16 4.70 7.63 6.38
Since the 1998 local tax reforms, the share of local tax revenues has been decreasing(the municipalities have no power to determine their share); the share of local fees hasslightly increased (the municipalities have limited powers to determine their share);the share of the rest local own revenues (in which the municipalities have full powerto influence) has increased significantly.
C) Borrowed FundsThese are revenues from the issue of municipal bonds, loans from financial institutions,interest-free loans from the central budget, loans between the municipalities andloans from off-budget funds. Yet, they are not a significant source of revenues to thelocal budgets. In 2000, their share was 3.5%. In practice, 81% from the borrowedfunds are used by Sofia and another 17% by the large municipalities in Group 2.
The distribution of local revenues by municipality groups in 2000, based ontheir size is presented in Table 4.13.
The data indicates:• A U-form curve for distribution of all revenues per capita: with a significant
disparity between the per capita revenues for Sofia and the rest municipalities;medium size municipalities having the lowest per capita revenues; and percapita revenue in the smaller municipalities higher in comparison to thelarger municipalities;
• The levels of shared taxes, local revenues and borrowed funds decline withthe size of municipalities;
• The intergovernmental subsidies increase when the size of municipalitiesdecreases.
The data indicates that the high level of revenues in Sofia is mostly due to sharedtaxes. The small municipalities are ahead of the large municipalities in terms ofrevenues per capita, due to the large amounts of intergovernmental subsidies.
It is normal for small municipalities to receive more intergovernmental subsidiesper capita. They must compensate for the shortage of funds caused by low fiscalpotential and relatively low amounts of municipal property. However, the sky-rocketing
191
D O E S L A R G E R M E A N M O R E E F F E C T I V E ? S I Z E A N D T H E F U N C T I O N O F L O C A L G O V E R N M E N T S I N B U L G A R I A
amount of total budget revenues per capita indicated for the municipalities fromgroup 5, in comparison to the municipalities from groups 2–4, has no logical explanation.The municipalities from group 5, surely, finance fewer services compared to the othermunicipalities. The elevated amount of their necessary revenues could be due to: relativelyhigher municipal administrative expenditures compared to the large municipalities;services in these municipalities that are not so concentrated in the central settlement,used by less consumers, which makes them more expensive (calculated per capita);the unit costs for service production are higher—additional transport costs are needed,they have poor technical equipment, etc.
Table 4.13Structure of Municipal Revenues in Municipality Groups for 2000 [%]
(Average for the Country=100)
Groups Total Revenues Shared Taxes Subsidies Local Own BorrowedRevenues Funds
Group 1 140.18 224.22 18.63 161.45 524.37
Group 2 93.93 95.36 88.60 112.34 48.25
Group 3 86.90 62.04 122.18 76.06 3.98
Group 4 91.58 71.75 127.30 70.40 6.03
Group 5 107.40 50.84 185.01 69.22 0.36
Average 100.00 100.00 100.00 100.00 100.00
2. ANALYSIS OF THE RELATIONSHIP BETWEENLOCAL GOVERNMENT SIZE AND THE FUNCTION OFLOCAL GOVERNMENTS AND LOCAL DEMOCRACY
2.1 Local Government Size and Citizens’ Satisfaction.Citizen Participation
2.1.1 Citizen Participation
Citizens are able to resolve issues relating to the activity of the municipality and thepublic services it provides, but only within the competencies given to the municipa-lities. What is the scope of local competencies? According to one study8 , all municipal
192
C O N S O L I D A T I O N O R F R A G M E N T A T I O N ?
D F I D – L G I L O C A L G O V E R N M E N T P O L I C Y P A R T N E R S H I P P R O G R A M
activity is divided in three groups based on the decision-making power of the localauthorities—limited, shared, and full powers. “The data indicates that the municipa-lities actually manage slightly over 19% of their budget expenditures, as most of them(95%) are for current expenditures. It is alarming that the municipalities have littleinfluence on labor expenditures, although they occupy over 45% of the total budgetaryexpenditures.”
The results from another study9 say “Our conservative methodology has reachedthe conclusion that the fiscal burden of the expenditures for the mandatory services,as assigned by the central government to the municipalities, amounts to approximately60–70% of total municipal expenditures”. The municipal powers of expendituremanagement prevail only in the categories of public utilities, culture and economicactivities.
In the conditions of financial shortage the municipalities are forced to reduceexpenditures, which increases the relative share of the mandatory expenditures comparedto the expenditures, which the municipalities can influence.
The municipalities have even more limited powers to influence revenues. Theyare free to influence the amount of the so-called “other local revenues” and, withincertain legal limits, revenues from fees and loans. This makes about 12–15% of allrevenues going toward the municipal budgets.
It is evident that legislation limits the local possibilities for taxing the population,accumulating financial resources and making decisions on major issues related tothe provision of local services. The municipalities provide a certain set of municipalservices because they are obliged by law to do so and the citizens pay taxes and feesbecause they are also obliged to do so. The population cannot trace the link betweenthe taxes that it pays to the municipality and the quality of services. Nor do the localgovernments assist in resolving existing problems. All this remains an obstacle forthe creation of links between citizens and local governments.
All these statements are supported by the results of a sociological survey10 conductedin three municipalities—a small municipality (Boichinovtzi), a medium size municipality(Berkovitza) and a large municipality (Montana). The citizens there are rather un-interested in the workings of the local governments. They feel they are not, and areactually not, informed of the sources of local revenues and the local activities. Thelack of interest and the unawareness increases with decreasing the size of municipality.So, for example, 30.2% of the population within the large municipality declaredthat they were not interested in the workings of the municipality. For the mediumsize and the small municipalities, these percentages were respectively 40.9% and44.8%. In the large municipality, 4.7% of the interviewed people have attended amunicipal council session. These percentages are, respectively, 2.6% and 0.9% inthe medium size and small municipality.
193
D O E S L A R G E R M E A N M O R E E F F E C T I V E ? S I Z E A N D T H E F U N C T I O N O F L O C A L G O V E R N M E N T S I N B U L G A R I A
Between 60% (large municipality) and 80% (small municipality) of the populationdo not have any view about the question: “What strategy for local services would yousupport if there were a shortage of financial resources?” The majority of the peopleprefer the scope of services to be diminished and that payment should not be increased.
The population is also not aware of the scope of municipal powers. However, itsupports the opinion that the municipalities should have certain powers to set localtaxes and fees, although limited under the law. Populations from larger municipalitiesare more likely to support increasing local powers in comparison to populations inthe small municipalities.
2.1.2 Citizen Satisfaction
Two categories of issues are analyzed:• The work of the municipal administration and the municipal council; and• The quality of local services provided. Four groups of services are reviewed—
technical,11 social, waste collection, and maintenance of infrastructure. Thequality of services provided and the fees paid are compared.
The work of the municipal administration is generally better regarded than thework of the municipal council (the positive evaluations are 21.7% against 3% andthe negative evaluations—10.1% against 21.7%). The share of people who abstainfrom evaluation is great (31.6% against 49.5%). Citizens from small municipalitiesgive relatively better marks for the work of municipal administration and the municipalcouncil. For example, the positive evaluations for the municipal administration inthe direction “big>small” municipality are respectively 13.2%, 23.5%, 29.8%.
It is common within the three municipalities that the people are satisfied withthe quality of the technical and social services provided and they are not satisfiedwith the quality of sanitation.
The quality of technical services is better regarded in the small municipality.The best evaluations are given for the services related to the issue and certification ofdocuments, and poorer evaluations are given to the services related to construction—issue of construction permits and permits for trade. Only these services receive mostlynegative evaluations in the large municipality.
Child-related services—schools, nurseries, kindergartens and camps, receive thehighest evaluations among the social services. Social assistance and health care receivethe poorest evaluations. The citizens of the smaller municipalities give the highestmarks (average evaluations: 4.77—small municipality; 4.22—medium size munici-pality; 4.03—large municipality).
194
C O N S O L I D A T I O N O R F R A G M E N T A T I O N ?
D F I D – L G I L O C A L G O V E R N M E N T P O L I C Y P A R T N E R S H I P P R O G R A M
Evaluations of the situation of sanitation are extremely negative in all three muni-cipalities. There are no significant differences among the municipalities.
The services related to street maintenance, street lighting, water supply and sewageare evaluated in a different way by the certain municipalities. Evaluations of the streetsare negative in the three municipalities. However, the share of the dissatisfied dropsfrom 73% in the large municipality, to slightly over 50% in the smallest municipality.No correlation between the size of the municipality and the quality of service is monitoredfor the other two services. So, for example, the quality of street lighting in Montanareceives mainly positive evaluation. The street lighting in the other two municipalitiesreceives extremely negative evaluations and the citizens say that such services simplydoesn’t exist. The quality of water supply is positively evaluated in the largest and thesmallest municipalities, and negatively in Berkovitza, which possibly encountersdifficulties.
The rates of the fees are generally evaluated as normal, except for the solid wastefee, which is considered high. The attitude towards the rates of the fees becomes morenegative with increasing size of the municipality.
The general conclusion is that the citizens of the small municipalities are moresatisfied with the local services.
2.2 Catchment Areas
Some important municipal services cannot be provided by all municipalities due toa number of historical and economic reasons. Nevertheless, the citizens should haveequal access to them. Health care is a typical example of this. The health establishmentsnetwork consists of various types of hospitals and policlinics. Often times, the citizensdo not have any choice but to visit the regional hospitals because they are the onlyproviders of specific health services. In smaller municipalities (groups 4 and 5), onecan receive ordinary health services (regular check-ups, maternity consultations,etc.). The regional hospitals provide more sophisticated services for a number ofreasons—equipment, qualified doctors, etc.
The municipalities continued to finance the pre-hospital and hospital medicalassistance, despite the progress of the health reforms of 2000. The territorial distributionof the hospital network and its staff also determines the concentration of healthservices. Table 4.14 presents data for three types of health care institutions providinghealth services—regional hospitals, municipal hospitals and social care nurseries,for all municipalities in 2000.
Great disparities exist in the share of health expenditures within total budgetexpenditures—8.4% for the smallest municipalities and 30.5% for the big cities.The disparities in terms of health expenditures per capita are even greater.
195
D O E S L A R G E R M E A N M O R E E F F E C T I V E ? S I Z E A N D T H E F U N C T I O N O F L O C A L G O V E R N M E N T S I N B U L G A R I A
The per capita expenditures for the regional hospitals providing unique servicesamounts to BGN 33 in the big cities. Part of these funds are spent for servicingneighboring municipalities from groups 4 and 5, which actually do not make theseexpenditures for their population.
The situation with the municipal hospitals is similar. The group 3 and 4 munici-palities pay 3–4 times more per capita than the smallest municipalities, and theyalso service their population.
Social care nurseries are concentrated in the large cities and the smaller municipa-lities, again, do not pay anything for the use of their services.
The Local Government and Local Administration Act has envisaged mechanismsfor the horizontal cooperation of municipalities in the provision of certain servicesand correct distribution of the expenditures. In practice, there are no such examplesexcept for some capital improvement projects of regional importance. The mainreason is related to the intergovernmental transfers system, which forms a majorpart of the budget revenues for the small municipalities. The general subsidies fromthe central government, by design, create several disincentives for better use of thefunds—if one or more local governments achieve better results in terms of costsavings the subsidy will be reduced in the next year, by the amount of these savings.We need to add here, that the severe budget problems in the municipal sector, as afactor in general, did not contribute to horizontal cooperation.
There are many examples when specific groups of patients are transferred toneighboring municipalities due to break down of specific medical equipment. Thecompensation to the affected municipalities is directed towards the central budgetto correct relations with the municipalities (subsidy/contribution).
The methodology for setting the annual intergovernmental transfers containsan element, which allocates funds to the municipalities in the form of objectivecriteria, as each of them has definite weight. All of the three types of health institutionsshould bring more funds to the municipalities, in whose territories they are located.The main problem to this approach is the residual approach12 for determining thesubsidies. Another problem is the inability to react to changes in the provision ofthe service during the fiscal year. In the best case scenario, the affected municipalitymay expect to receive part of the funds no earlier than the next fiscal year.
There are some examples of joint actions amongst municipalities for optimizationof the expenditures and increasing service quality. For several years the municipalitiesworked under the guidance of the Ministry of Environment and Waters for thejoint construction and made use of 14 regional solid waste landfills. With thisapproach, the municipalities using one regional modern landfill, received 100% ofthe capital construction costs and shared the operational maintenance costs on thebasis of objective indicators, like amount of waste deposited, number of citizens,etc. This policy stimulates the local governments to reduce capital costs for the
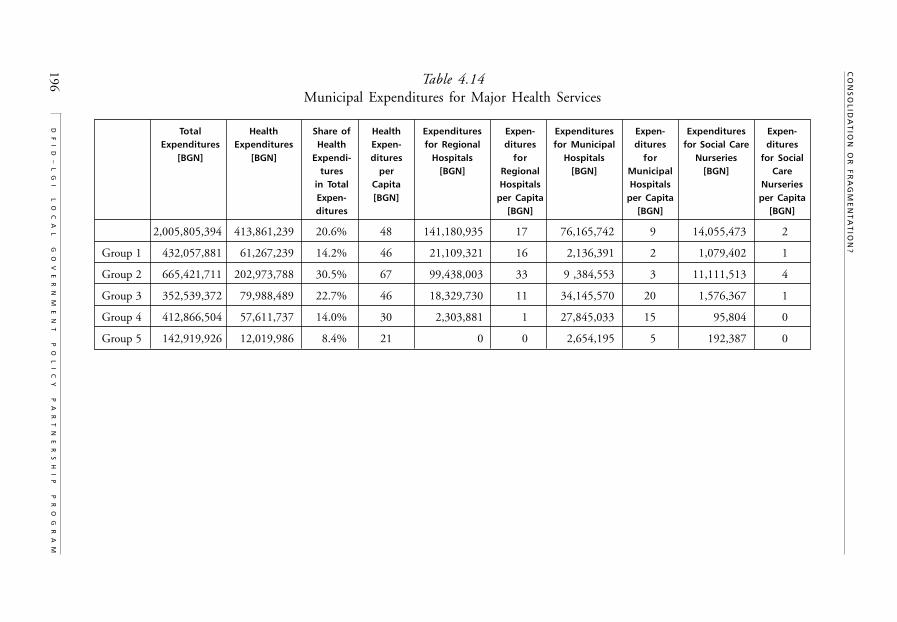
196
CO
NS
OL
IDA
TIO
N O
R F
RA
GM
EN
TA
TIO
N?
DF
ID
–L
GI
L
OC
AL
G
OV
ER
NM
EN
T
PO
LI
CY
P
AR
TN
ER
SH
IP
P
RO
GR
AM
Table 4.14Municipal Expenditures for Major Health Services
Total Health Share of Health Expenditures Expen- Expenditures Expen- Expenditures Expen-Expenditures Expenditures Health Expen- for Regional ditures for Municipal ditures for Social Care ditures
[BGN] [BGN] Expendi- ditures Hospitals for Hospitals for Nurseries for Socialtures per [BGN] Regional [BGN] Municipal [BGN] Care
in Total Capita Hospitals Hospitals NurseriesExpen- [BGN] per Capita per Capita per Capitaditures [BGN] [BGN] [BGN]
2,005,805,394 413,861,239 20.6% 48 141,180,935 17 76,165,742 9 14,055,473 2
Group 1 432,057,881 61,267,239 14.2% 46 21,109,321 16 2,136,391 2 1,079,402 1
Group 2 665,421,711 202,973,788 30.5% 67 99,438,003 33 9 ,384,553 3 11,111,513 4
Group 3 352,539,372 79,988,489 22.7% 46 18,329,730 11 34,145,570 20 1,576,367 1
Group 4 412,866,504 57,611,737 14.0% 30 2,303,881 1 27,845,033 15 95,804 0
Group 5 142,919,926 12,019,986 8.4% 21 0 0 2,654,195 5 192,387 0
197
D O E S L A R G E R M E A N M O R E E F F E C T I V E ? S I Z E A N D T H E F U N C T I O N O F L O C A L G O V E R N M E N T S I N B U L G A R I A
landfills and allocate more resources for improving the services within the city limits.They have a real interest in applying full-cost recovery with the solid waste fee andbeing more accountable to the taxpayers.
2.3 Relationship Between the Municipal Centerand Individual Villages
On average, Bulgarian municipalities comprise of 20 settlements. The inter-municipaldisparities vary from 134 settlements (Gabrovo municipality) to only 1 settlement(10 municipalities).
The municipal councilors are elected on the basis of the proportionate system.There are no electoral districts within the municipality that guarantee the representationof the certain settlements. This means that the representation of the certain settle-ments is not guaranteed by the local legislative assembly. For example, Razgradmunicipality has a population of 71,000 people and 19 settlements—the city of Razgrad,the municipal center, and 18 villages. The municipal council of Razgrad municipalityhas 33 members—30 from the city of Razgrad and 3 from the villages. The populationof the city of Razgrad constitutes 68% from the total population of the municipality,while its councilors total 91% of all municipal councilors. The other 3 councilorsare from three, relatively large, villages within the territory of the municipality.
Mayors of the mayoralties are elected directly in the settlements with populationsover 500 people. The municipal council then elects mayor’s representatives forsmall settlements with populations below 500 people. These people are directlyresponsible for coordination with the municipal center.
The functions that the mayoralties perform, and their financial resources, are notclearly regulated by law. These issues are resolved by the municipal council, whichmeans that different municipalities have different practices. However, observation confirmsthat the country’s municipalities have very centralized structures. The municipalityhas a clearly outlined periphery (usually villages), whose problems are underestimated.If the example with Razgrad municipality is considered again—the municipal councilmakes all decisions concerning investment. The mayoralties have limited financialresources for operating needs. For example, 97% of the total municipal budget(13,131 thousand BGN for 2001) are managed centrally and go to the municipalcenter, while only 3% are allocated to mayoralties. The limited responsibilities andfinancial resources of the mayoralties cause certain pressures.
Some good practices are used for improving the interaction. For example, certainsessions of the municipal council and its committees can be conducted outside themunicipal center. On specific days, the municipal administration may work in settle-ments outside the municipal center, etc. Nevertheless, there are certain problems
198
C O N S O L I D A T I O N O R F R A G M E N T A T I O N ?
D F I D – L G I L O C A L G O V E R N M E N T P O L I C Y P A R T N E R S H I P P R O G R A M
that can only be resolved by changing the Electoral system, i.e. the majority electionof municipal councilors engaged with a certain election districts.
Legislation also envisaged another opportunity for ensuring better service to thepopulation—the opening of municipal administration units, not only in certainsettlements but also, in their neighborhoods. Due to the lack of funds and the extremereduction in the number of municipal administrations, the municipalities do notimplement this opportunity. The reduction of municipal administration staff is aresult of requirements imposed by the central government.
The “municipality-mayoralty” relations were partially subject to two surveys ofmunicipal decision-makers13 (mayors and deputy mayors). The first survey was conductedin September 1997, immediately after the adoption of the two major laws regulatinglocal finance—the Local Budgets Act and the Local Taxes and Fees Act. The secondsurvey was conducted after the enforcement of these two laws in the period of May–June 1998. Both of these surveys covered 25 municipalities. The main results arepresented below.
Most of those interviewed (72%) shared the opinion that the mayoralties shouldnot be separated into independent municipalities and 20% stated that this wasappropriate only in some cases. About 52% of those interviewed stated that theseparation of the mayoralties, into independent municipalities, would contributeto the more successful resolution of local problems, and 28% thought that thiswould increase financial and administrative independence. About 16% of the inter-viewees didn’t see any advantages in separation. The main disadvantages to thiswere lack of staff (84%) and the unnecessary expansion of the local administration(68%). Only 20% of interviewees stated that it was necessary to give more power tothe mayoralties and 68% stated that the mayoralties should be given more poweronly in some particular spheres. About 32% of those interviewed agreed that themayoralties should be provided with more power in the administration of the revenue,and 64% stated that the mayoralties should be given more rights in the administrationof expenditures. Many of the interviewees gave more than one answer, with 24%agreeing that the mayoralties should be given more power for management of themunicipal property located in its territory.
It is obvious that the majority of local authorities have a negative attitude towardsthe subdivision of the municipalities, but at least a relatively big number of themare willing to give greater competencies to the mayoralties in some spheres although.
The second survey indicates that the opinion of the interviewees, towardsseparating the mayoralties in independent municipalities, has not changed and has,in fact, become even more conservative in some aspects. For example, 52% of thoseinterviewed in the second survey didn’t see any advantages in this (16% in the firstsurvey). About 76% of the interviewees stated that this would increase administration,
199
D O E S L A R G E R M E A N M O R E E F F E C T I V E ? S I Z E A N D T H E F U N C T I O N O F L O C A L G O V E R N M E N T S I N B U L G A R I A
and 32% gave a new answer—this would impede the relationship between themunicipalities and the central authorities. The share of those who didn’t wish togive more power to the mayoralties increased from 12% to 28%. The other 72% ofinterviewees admitted the granting of more powers, again emphasizing that thesepower should concern the management of municipal properties.
It is evident that the number of local government representatives, who are notlikely to support the idea of fragmentation of municipalities, is growing. The numberof those, likely to give more competencies to the mayoralties, is also significantlylower. This means that the tense conditions between the municipal center and theperiphery are deteriorating. The process of fragmentation in Bulgarian municipalitiesis limited only by its complicated procedures and the minimal legal requirementsfor settlements separation into separate municipalities.
In the last five years, seven new municipalities have formed via separation of settlements.What do these settlements gain or lose? Table 4.15 presents the main parameters oftheir budget performance for 2000. The following conclusions can be drawn:
• The fragmentation process covers mainly small municipalities;• All mother municipalities have a level of socio-economic development below
average, and unemployment rates above the average, for the country (exceptRhodopi municipality). Newly established municipalities have parameters,lower than those of the mother-municipalities. The only exception is Pri-morsko municipality;
• The mother municipalities have lower revenues per capita than the newlyestablished municipalities. The main reason for this is that the newly establishedmunicipalities receive significantly higher intergovernmental subsidies. Thelatter have lower tax potential and accumulate lower local revenues per capita.The only exception is Primorsko municipality, which is in a relatively betterfinancial situation than the mother municipality.
Thus, the socio-economic conditions, in the newly established municipalitiesand their influence on the revenue raising capacity, are worse compared to the mother-municipalities. However, this is compensated by a number of advantages, the mostimportant of which are:
• Elimination of the dependence on former municipal centers. The newlyestablished municipalities constitute an independent municipal council anddecide independently (within their legislative powers) upon their local problems;
• Increase of financial resources, which are no longer centralized in the formermunicipal center. The newly established municipalities receive relatively higherintergovernmental subsidies;
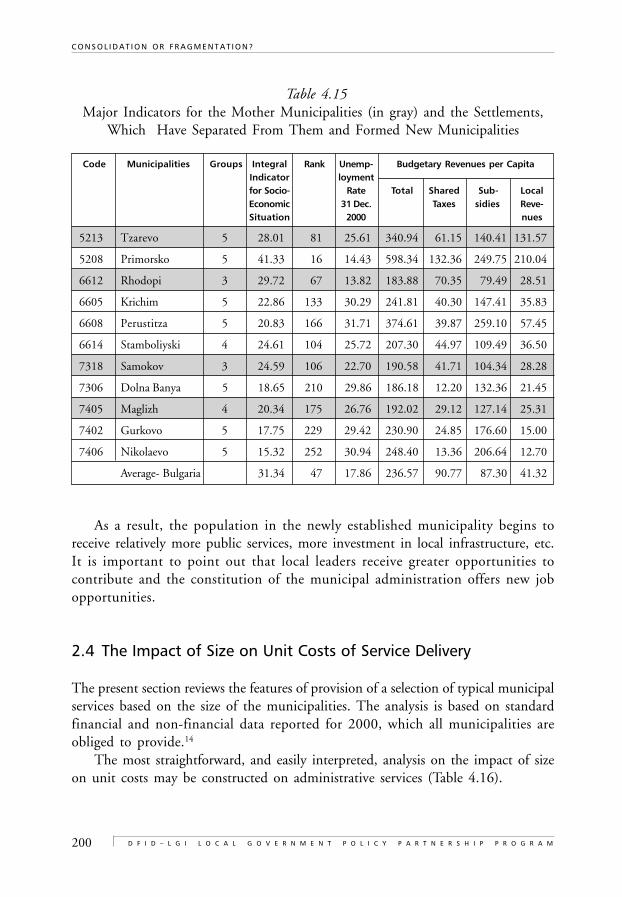
200
C O N S O L I D A T I O N O R F R A G M E N T A T I O N ?
D F I D – L G I L O C A L G O V E R N M E N T P O L I C Y P A R T N E R S H I P P R O G R A M
Table 4.15Major Indicators for the Mother Municipalities (in gray) and the Settlements,
Which Have Separated From Them and Formed New Municipalities
Code Municipalities Groups Integral Rank Unemp- Budgetary Revenues per CapitaIndicator loymentfor Socio- Rate Total Shared Sub- LocalEconomic 31 Dec. Taxes sidies Reve-Situation 2000 nues
5213 Tzarevo 5 28.01 81 25.61 340.94 61.15 140.41 131.57
5208 Primorsko 5 41.33 16 14.43 598.34 132.36 249.75 210.04
6612 Rhodopi 3 29.72 67 13.82 183.88 70.35 79.49 28.51
6605 Krichim 5 22.86 133 30.29 241.81 40.30 147.41 35.83
6608 Perustitza 5 20.83 166 31.71 374.61 39.87 259.10 57.45
6614 Stamboliyski 4 24.61 104 25.72 207.30 44.97 109.49 36.50
7318 Samokov 3 24.59 106 22.70 190.58 41.71 104.34 28.28
7306 Dolna Banya 5 18.65 210 29.86 186.18 12.20 132.36 21.45
7405 Maglizh 4 20.34 175 26.76 192.02 29.12 127.14 25.31
7402 Gurkovo 5 17.75 229 29.42 230.90 24.85 176.60 15.00
7406 Nikolaevo 5 15.32 252 30.94 248.40 13.36 206.64 12.70
Average- Bulgaria 31.34 47 17.86 236.57 90.77 87.30 41.32
As a result, the population in the newly established municipality begins toreceive relatively more public services, more investment in local infrastructure, etc.It is important to point out that local leaders receive greater opportunities tocontribute and the constitution of the municipal administration offers new jobopportunities.
2.4 The Impact of Size on Unit Costs of Service Delivery
The present section reviews the features of provision of a selection of typical municipalservices based on the size of the municipalities. The analysis is based on standardfinancial and non-financial data reported for 2000, which all municipalities areobliged to provide.14
The most straightforward, and easily interpreted, analysis on the impact of sizeon unit costs may be constructed on administrative services (Table 4.16).
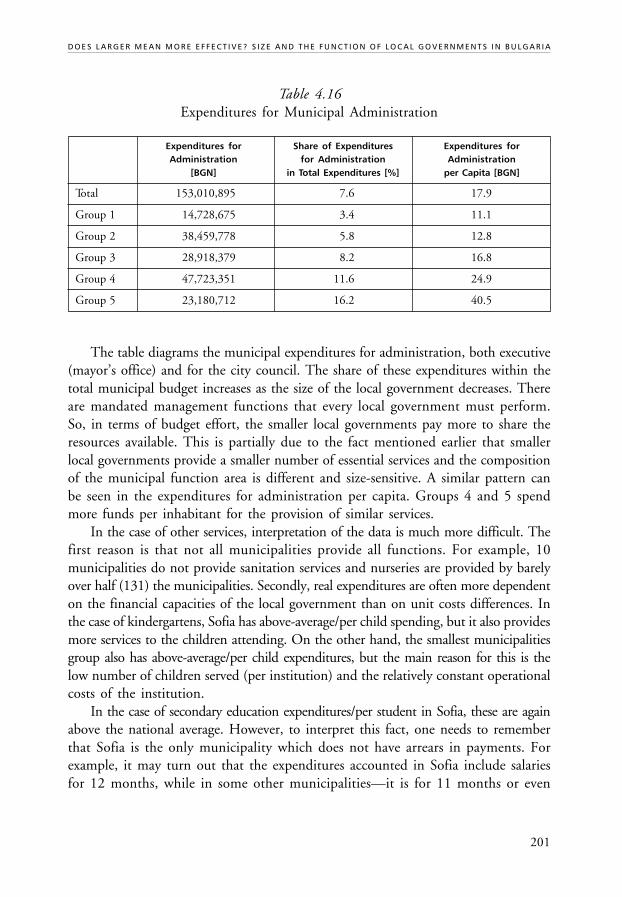
201
D O E S L A R G E R M E A N M O R E E F F E C T I V E ? S I Z E A N D T H E F U N C T I O N O F L O C A L G O V E R N M E N T S I N B U L G A R I A
Table 4.16Expenditures for Municipal Administration
Expenditures for Share of Expenditures Expenditures forAdministration for Administration Administration
[BGN] in Total Expenditures [%] per Capita [BGN]
Total 153,010,895 7.6 17.9
Group 1 14,728,675 3.4 11.1
Group 2 38,459,778 5.8 12.8
Group 3 28,918,379 8.2 16.8
Group 4 47,723,351 11.6 24.9
Group 5 23,180,712 16.2 40.5
The table diagrams the municipal expenditures for administration, both executive(mayor’s office) and for the city council. The share of these expenditures within thetotal municipal budget increases as the size of the local government decreases. Thereare mandated management functions that every local government must perform.So, in terms of budget effort, the smaller local governments pay more to share theresources available. This is partially due to the fact mentioned earlier that smallerlocal governments provide a smaller number of essential services and the compositionof the municipal function area is different and size-sensitive. A similar pattern canbe seen in the expenditures for administration per capita. Groups 4 and 5 spendmore funds per inhabitant for the provision of similar services.
In the case of other services, interpretation of the data is much more difficult. Thefirst reason is that not all municipalities provide all functions. For example, 10municipalities do not provide sanitation services and nurseries are provided by barelyover half (131) the municipalities. Secondly, real expenditures are often more dependenton the financial capacities of the local government than on unit costs differences. Inthe case of kindergartens, Sofia has above-average/per child spending, but it also providesmore services to the children attending. On the other hand, the smallest municipalitiesgroup also has above-average/per child expenditures, but the main reason for this is thelow number of children served (per institution) and the relatively constant operationalcosts of the institution.
In the case of secondary education expenditures/per student in Sofia, these are againabove the national average. However, to interpret this fact, one needs to rememberthat Sofia is the only municipality which does not have arrears in payments. Forexample, it may turn out that the expenditures accounted in Sofia include salariesfor 12 months, while in some other municipalities—it is for 11 months or even
202
C O N S O L I D A T I O N O R F R A G M E N T A T I O N ?
D F I D – L G I L O C A L G O V E R N M E N T P O L I C Y P A R T N E R S H I P P R O G R A M
less. Yet again, expenditures in the smallest municipalities are also above the nationalaverage, but this is due to the greater transport expenses for teachers and is necessaryto ensure normal education process.
The per capita spending in big cities is also higher in the case of waste collection.The city of Sofia spends 5.5 times more funds per capita on waste collection thanthe smallest municipalities and 2.5 times more than the average for the whole country.This difference results from the combination of following factors: higher costs of wastetransportation in big cities, wider scope of services provided (for example snow removal)and the quality of these services.
Available data does not allow precise measurement of the role of individual factorsneither allow us to determine the real relationship between the size and unit cost usingan assumption of the same scope and the quality of services. That is why we need tolimit our firm conclusions in this section to basic administrative services.
2.5 Local Economic Development and Investment Policy
2.5.1 Local Economic Development
The Local Government and Local Administration Act does not contain explicitregulations for the municipal responsibilities regarding the local economic deve-lopment. On the other hand, the municipalities are directly engaged in the provisionof public utility services: water works, sewage, electrification, district heating, telephoneservice, maintenance of streets, squares, parks, gardens, correction of river beds, solidwaste management, public transport, operation of municipal baths, laundries, hotels,garages and cemeteries (Article 11, point 6).
The National Regional Development Plan of Bulgaria was drafted in 2000. Everymunicipality participates in this plan, each with certain priority development areasthat do not always coincide with the services listed above. The main disadvantage ofthe regional plan is that it is not supported with enough resources. Practice indicatesthat the municipality is a natural center and an active participant in initiatives promotingeconomic development, particularly in areas of local importance.
The transformation of property in the last decade created a significant amountof municipal property mainly by separating it from the state property. The newlyacquired property became a major instrument for the municipalities for influencingthe local economic environment. There are three major ways for using the propertyto stimulate economic activity:
• Privatization;
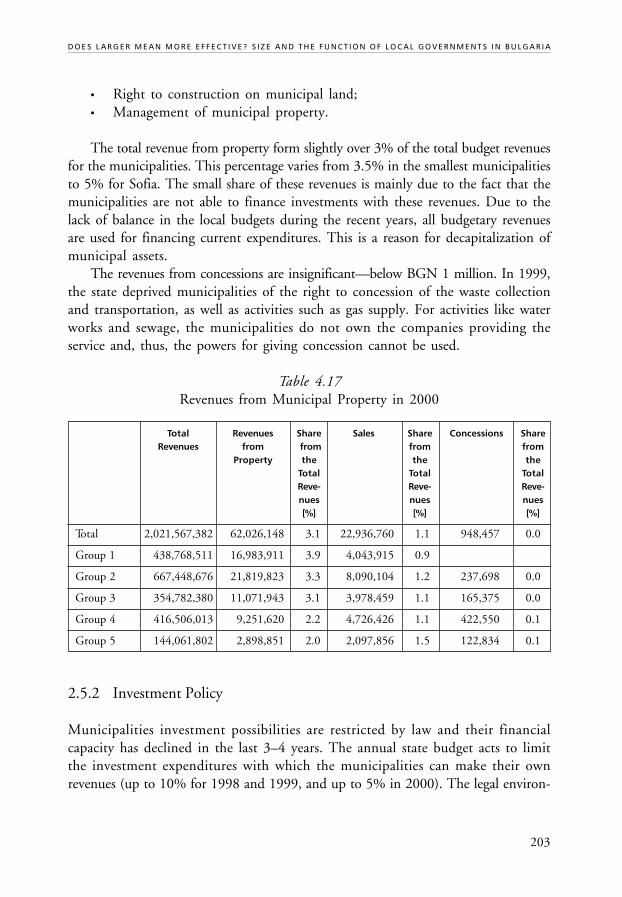
203
D O E S L A R G E R M E A N M O R E E F F E C T I V E ? S I Z E A N D T H E F U N C T I O N O F L O C A L G O V E R N M E N T S I N B U L G A R I A
• Right to construction on municipal land;• Management of municipal property.
The total revenue from property form slightly over 3% of the total budget revenuesfor the municipalities. This percentage varies from 3.5% in the smallest municipalitiesto 5% for Sofia. The small share of these revenues is mainly due to the fact that themunicipalities are not able to finance investments with these revenues. Due to thelack of balance in the local budgets during the recent years, all budgetary revenuesare used for financing current expenditures. This is a reason for decapitalization ofmunicipal assets.
The revenues from concessions are insignificant—below BGN 1 million. In 1999,the state deprived municipalities of the right to concession of the waste collectionand transportation, as well as activities such as gas supply. For activities like waterworks and sewage, the municipalities do not own the companies providing theservice and, thus, the powers for giving concession cannot be used.
Table 4.17Revenues from Municipal Property in 2000
Total Revenues Share Sales Share Concessions ShareRevenues from from from from
Property the the theTotal Total TotalReve- Reve- Reve-nues nues nues[%] [%] [%]
Total 2,021,567,382 62,026,148 3.1 22,936,760 1.1 948,457 0.0
Group 1 438,768,511 16,983,911 3.9 4,043,915 0.9
Group 2 667,448,676 21,819,823 3.3 8,090,104 1.2 237,698 0.0
Group 3 354,782,380 11,071,943 3.1 3,978,459 1.1 165,375 0.0
Group 4 416,506,013 9,251,620 2.2 4,726,426 1.1 422,550 0.1
Group 5 144,061,802 2,898,851 2.0 2,097,856 1.5 122,834 0.1
2.5.2 Investment Policy
Municipalities investment possibilities are restricted by law and their financialcapacity has declined in the last 3–4 years. The annual state budget acts to limitthe investment expenditures with which the municipalities can make their ownrevenues (up to 10% for 1998 and 1999, and up to 5% in 2000). The legal environ-
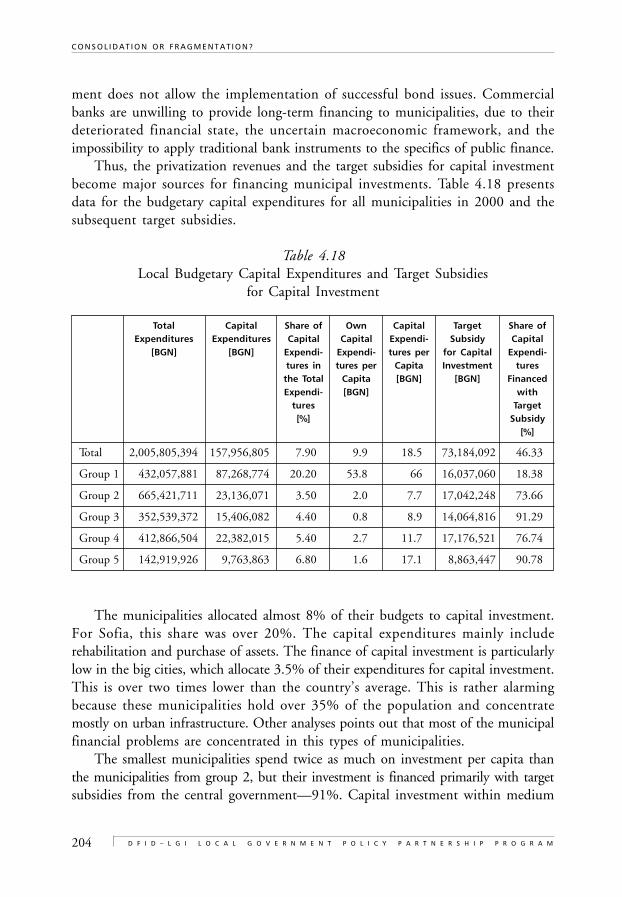
204
C O N S O L I D A T I O N O R F R A G M E N T A T I O N ?
D F I D – L G I L O C A L G O V E R N M E N T P O L I C Y P A R T N E R S H I P P R O G R A M
ment does not allow the implementation of successful bond issues. Commercialbanks are unwilling to provide long-term financing to municipalities, due to theirdeteriorated financial state, the uncertain macroeconomic framework, and theimpossibility to apply traditional bank instruments to the specifics of public finance.
Thus, the privatization revenues and the target subsidies for capital investmentbecome major sources for financing municipal investments. Table 4.18 presentsdata for the budgetary capital expenditures for all municipalities in 2000 and thesubsequent target subsidies.
Table 4.18Local Budgetary Capital Expenditures and Target Subsidies
for Capital Investment
Total Capital Share of Own Capital Target Share ofExpenditures Expenditures Capital Capital Expendi- Subsidy Capital
[BGN] [BGN] Expendi- Expendi- tures per for Capital Expendi-tures in tures per Capita Investment turesthe Total Capita [BGN] [BGN] FinancedExpendi- [BGN] with
tures Target[%] Subsidy
[%]
Total 2,005,805,394 157,956,805 7.90 9.9 18.5 73,184,092 46.33
Group 1 432,057,881 87,268,774 20.20 53.8 66 16,037,060 18.38
Group 2 665,421,711 23,136,071 3.50 2.0 7.7 17,042,248 73.66
Group 3 352,539,372 15,406,082 4.40 0.8 8.9 14,064,816 91.29
Group 4 412,866,504 22,382,015 5.40 2.7 11.7 17,176,521 76.74
Group 5 142,919,926 9,763,863 6.80 1.6 17.1 8,863,447 90.78
The municipalities allocated almost 8% of their budgets to capital investment.For Sofia, this share was over 20%. The capital expenditures mainly includerehabilitation and purchase of assets. The finance of capital investment is particularlylow in the big cities, which allocate 3.5% of their expenditures for capital investment.This is over two times lower than the country’s average. This is rather alarmingbecause these municipalities hold over 35% of the population and concentratemostly on urban infrastructure. Other analyses points out that most of the municipalfinancial problems are concentrated in this types of municipalities.
The smallest municipalities spend twice as much on investment per capita thanthe municipalities from group 2, but their investment is financed primarily with targetsubsidies from the central government—91%. Capital investment within medium
205
D O E S L A R G E R M E A N M O R E E F F E C T I V E ? S I Z E A N D T H E F U N C T I O N O F L O C A L G O V E R N M E N T S I N B U L G A R I A
size municipalities from group 3 is financed in the same way. At least Sofia relies ontarget subsidies from the central budget—slightly over 18%.
The study clearly shows the link between the economic and financial potentialof the municipalities, and their ability to invest. Sofia is the only city which issuedeuro bonds, to use as the main source of investment funds. The potential formunicipalities to have their own investment, without relying on target subsidies,clearly distinguishes two groups of local governments—Sofia and all of the others.Municipalities from groups 2 and 3 take most of the financial burden of the reformsand, as an obvious result, their investment capabilities are close to zero. Most of thelarge and medium size cities mostly rely on privatization proceeds to fund theirinvestment programs. The current financial strain makes the importance of thebudget investment funds insignificant. Small cities only spend on investmentresources that which they receive from the central government.
2.6 Inter-Governmental Relations—Does Number and Sizeof Local Governments Influence the Nature and Efficiency ofNegotiations with Central Institutions?
The municipal structures have a positive influence on the negotiations between thecentral government and the local governments. The Bulgarian municipalities are relativelylarge and have the relevant internal potential for effective development and provisionof public services. On the other hand, there exist institutionally strong organizationswithin the local governments. These are the National Association of Municipalitiesin the Republic of Bulgaria (NAMRB), 10 regional associations of municipalities,professional associations of municipal officials—legal experts, financial experts, chiefarchitects, secretaries, environmental experts, etc.
The legal possibility for administrative and territorial changes did not producesignificant fragmentation of municipalities. The size of local governments favors effectiveinteraction with central government institutions, as well as the performance of the reformsfor particular areas. The intensity of certain problems, mainly related to the financiallink between revenue and expenditure responsibilities, additionally motivates thelocal governments to unite in their efforts to speed up reforms.
On national level, the dialogue between the central government and the local govern-ments is carried out between NAMRB and the relevant executive and legislative bodies.
NAMRB, originally founded by 1/3 of Bulgarian municipalities, now unites allmunicipalities in the country and enables them to have a stronger “voice” in theirnegotiations with the central government.
Regional associations of municipalities are successfully used for considering thespecifics of each municipality, from the views of different parts of the country. These
206
C O N S O L I D A T I O N O R F R A G M E N T A T I O N ?
D F I D – L G I L O C A L G O V E R N M E N T P O L I C Y P A R T N E R S H I P P R O G R A M
associations are established on a geographical principle—municipalities from theDanube region, from the Black Sea region, the Rhodopi mountain region, the StaraPlanina mountain region, etc. The capacity of the municipal employees’ professionalassociations is used in the preparation of important municipal proposals. Theprogram that forms general NAMRB positions, guarantees that this position shouldonly include proposals reached with consensus. Thus, the initial stage of discussionsincludes a variety of ideas, while the final stage of discussions is limited to summaryproposals supported by all municipalities.
The specific interests of the different municipalities by size are ensured throughthe representation mechanisms. All executive and working bodies of NAMRB areformed based on the equal representation of large, medium and small municipalities,and the relevant geographical and political representation. Thus, the Executive Boardof NAMRB (which is elected by the General Assembly) has 28% representativesfrom small municipalities, 33% representatives from medium size municipalitiesand 33% representatives from large municipalities. The mayor of Sofia’s municipalityis also a member of the Executive Board of NAMRB.
Coinciding principles are followed in the drafting of all key proposals.Presently, the specialized committees of NAMRB are the main standing forums
for reaching agreement on different interests. Better mechanisms for consideringthe specifics of the small municipalities are still sought. The relative share ofpopulation living in these municipalities is very small—1% in municipalities withpopulations below 5,000 people, and 7% in municipalities with populations below10,000 people. Nevertheless, these municipalities are 38% of all municipalities inthe country. The main problems with these municipalities, as discussed in thenegotiations, concern their capacity rather than the specifics of their powers.
The eventual fragmentation of municipalities may impede the conduct ofnegotiations in the following directions:
• Finding acceptable solutions for some of the very smallest size municipalities;• Delay in coordination among municipalities for formulation of common
positions;• Use of the municipal fragmentation for political purposes;• Winning or losing influence among the political parties in power;• Threats of new centralization due to the rationalization that the municipalities
have insufficient capacity;
No tendency for increasing the number of municipalities is observed. Themunicipalities started to develop good and motivated positions in their on-goingnegotiations with the central government.
207
D O E S L A R G E R M E A N M O R E E F F E C T I V E ? S I Z E A N D T H E F U N C T I O N O F L O C A L G O V E R N M E N T S I N B U L G A R I A
3. DESCRIPTION OF THE NATIONAL DEBATESON THE SIZE OF LOCAL GOVERNMENTS
In Bulgaria, two public political debates regarding the size of local government havecommenced in the past ten years.
The first political debate began in 1990–1991, when the Constitution and theLocal Government and Local Administration Act were drafted. This debate continued,with several interruptions, until 1995. It includes two significant steps. The firststep was made after the democratic changes by the first National Assembly with theparticipation of some of its statutory committees, many members of parliament, membersof government, experts and academia. The discussions concerned the size of theadministrative and territorial organization of the country—tiers; types of administrativeand territorial units; number; optimal size; mayors’ basis powers, functions andresponsibilities; election of the executive bodies, and other specific parameters. Thedebate aimed to visualize and define a concrete position regarding the developmentof local government. Further to this, several options for territorial organization werereviewed, including three government tiers—oblast, okolia, and municipality.
The discussions of the regions aimed at their fragmentation, which contradictedthe vision for a three-tier organization. That is why political consensus for preservingthe existent 9 regions and their territories was so quickly reached. Thus, no debateon the regions was held. Various division options were discussed for the other twotiers. Despite the compromise, which was reached with difficulty, the passing ofthe Constitution and the Local Government and Local Administration Act did notinclude the concrete establishment of the okolia15 . So, for example, the Constitutionapproved two main administrative and territorial units: oblast (region) and municipality,but it assumed the possibility that “other administrative and territorial self-governmentunits in them can be established within the law.” The Local Government and LocalAdministration Act regulate the structure and the operation of the municipalitiesand the regions. The country’s administrative and territorial division had to be enactedthrough a separate law. No administrative changes have been made in the recentyears because the procedure is very complicated and contains many limitations.
The second step in the public debate for development of the country’s administrativeand territorial organization was made in the period between 1994–95, when theadministrative reforms began. This step aimed at resolving several important issuesrelated to development of the country’s administrative division and the further im-provement of local government regarding:
• Government tiers and major administrative units;• Territorial division of the large cities;• Procedures for establishing, transforming and shutting down administrative
units;
208
C O N S O L I D A T I O N O R F R A G M E N T A T I O N ?
D F I D – L G I L O C A L G O V E R N M E N T P O L I C Y P A R T N E R S H I P P R O G R A M
• Spheres of activity and competency within particular administrative andterritorial units;
As a result of the debate:• Consensus was reached to eliminate the legal possibility of establishing
intermediate tiers between the oblast and the municipality—okolia. Theprimary reason for this was the small size of the country and a willingness topreserve the size of the existing municipalities;
• The adoption of the Act on Administrative and Territorial Division of theRepublic of Bulgaria created a legislative basis for the establishment of ad-ministrative and territorial units, considering it the will of the people. Agreementwas reached for preserving the present status, number, scope and territorialcoverage of the existent territorial structures. The performance of concreteadministrative and territorial changes was based on “equal start” and uniformlegal provisions for the creation of, and changes in, a particular territorialunit; and clear technological procedures for performance of necessary activitiesand democratic rules for participation of the population;
• Explicit conditions for creation of new municipalities were introduced, whichstrengthened the model of strong and stable units. Procedures for relativelylimited changes in the size, coverage, and number of municipalities wascreated. Thus, 8 new municipalities have been created in the last six years.The need for legal and organizational measures led to the introduction ofconcrete principles and criteria in defining the conditions, procedures, andmechanisms for making changes, drafting of alternatives, discussing andevaluating these alternatives and selection of acceptable solutions. Oppositionto concrete legal proposals and working assumptions came from variousdirections. The main opponents were specific central administration units,certain local elected representatives and citizen groups. Restricting the rightof free choice, by raising the requirements for creation of new municipalities,was confronted with the argument that lower limits would assist individualspurely with leadership ambitions or ambitions caused by personal conflictsat the local level. The objections concerned the lower limit, minimum numberof population for establishment of municipality, as well as the possibleexceptions from the general procedure. The objections of the political partieswere not so strong. In fact, the differences mainly had a technical characterand the opposition actually concerned procedural and other issues. Theadopted Act on Administrative and Territorial Division of the Republic ofBulgaria regulates not only the changes in the municipalities, but also thechanges in their component units (mayoralties and districts) and the primaryunit—the settlement.
209
D O E S L A R G E R M E A N M O R E E F F E C T I V E ? S I Z E A N D T H E F U N C T I O N O F L O C A L G O V E R N M E N T S I N B U L G A R I A
• The territorial division of the capital city, Sofia, and the cities of Plovdiv andVarna were based on the special law. Regulations were created according towhich the cities with population above 100,000 people can have internaldivision and that the municipal councils can decide upon this.
• The debate on the regional self-government tier did not take place.
The second debate was held between 1998–99. It was completely dedicated tothe reorganization of the regional tier. Resolution of these issues required the re-evaluation of the existent number of regions and their territories, development ofthe regional governor’s powers, and its interaction with the established dilution ofstate administration units within the territories of the region. On the other hand,proposals for the introduction of self-government elements into the regional tierwere not raised. The Local Government and Local Administration Act provides ageneral framework and concept for the organization and operation of regional tiers.It complies with the constitutional provisions which state that the regional governoris appointed by the Council of Ministers, not elected.
Public debate did not actually take place. The political debates on the numberand size of new regions were conducted by the government with the participationof experts from the Council of Ministers, the National Assembly, and the Presidency.Although several options for changing the number and the size of the regions presentlyexisted, the option was adopted by 28 regions (through fragmentation of the existent9 regions), as it was considered “flexible and responsible ” enough for making futurechanges. The main motives for fragmentation of the regions were related to thehistorical sustainability of the 28 units (long period of existence), larger operationin the interaction with the municipalities (the smaller regions comprise a smallernumber of municipalities). Of course, political arguments also existed particularlyregarding the control of the central government on the local level. Despite theshortcomings of this option like: fragmentation of resources; non-correspondencewith the EU regions; significant increase of the current expenditures; etc., theNational Assembly passed the relevant law in 1999. The strong opposition of somepolitical parties represented within the parliament, many international and Bulgarianexperts, and citizens did not influence this decision. The introduction of regionalself-government tier was postponed for the future. Some attempts were made tolimit the shortcomings of the adopted decision—e.g. the Regional DevelopmentAct provided the possibility for establishment of regional development council.The municipal councils of the component municipalities can appoint a section ofthe members in these councils. Six regions for planning (NUTS II, each includingseveral present oblasti) were established to avoid fragmentation. These regions forplanning can implement large regional projects.
210
C O N S O L I D A T I O N O R F R A G M E N T A T I O N ?
D F I D – L G I L O C A L G O V E R N M E N T P O L I C Y P A R T N E R S H I P P R O G R A M
Despite these attempts, the problems, related to the development and operationof the regions, remain without a permanent solution. The political powers did notreach any consensus regarding overall development, position, size and role of theregions. The issue of size and coverage of Bulgarian regions, and the model for theirestablishment and development as self-governing units, will have further developmentin the future. One reason for this is the new government’s program (the Governmentof Prime Minister Simeon Saxcoburgotski, elected by the National Assembly inJuly 2001) and the parliamentary majority, which have declared their commitmentto enhancing the decentralization processes, as well as their readiness for discussingthe establishment of a regional self-government level.
The following summary conclusions can be made:Firstly: The debate on the size, number, and territorial scope of municipalities
and their component administrative structures has already concluded. Distinct legalregulations for the making administrative and territorial changes, corresponding tothe will of the people, are being successfully implemented;
Secondly : The debate on the enhancement of decentralization and financialindependence for local governments is now on the agenda. The proposals of thelocal governments, the NGOs, and the government programs all point in onedirection. The discussion is more concentrated on creating concrete forms and phasesof the local finance reform.
Thirdly: The creation of second, sub-national, government ties will be discussedin the next two or three years. The issues that should be discussed include; thenumber, the territorial scope, and the competencies of the regional level.
4. CONCLUSIONS AND POLICY RECOMMENDATIONS
4.1 Conclusions
The frequent changes in the regional tier and the relative stability of the municipaltier indicate that the central institutions are the active sector in conducting theadministrative and territorial changes within the country. However, local initiativeshave also manifested in the last five or six years, which have led to the fragmentationof four municipalities.
Significant disparities exist among the municipalities in terms of population. Certainrelations between size, in terms of population, and the major characteristics of themunicipalities are observed. So, for example, when the size of municipalities declines:
• The number of urban population declines, the demographic structure deterio-rates and depopulation processes intensify;
211
D O E S L A R G E R M E A N M O R E E F F E C T I V E ? S I Z E A N D T H E F U N C T I O N O F L O C A L G O V E R N M E N T S I N B U L G A R I A
• The territory of, and the number of, component settlements decline;• The level of socio-economic development declines. Economic activity and
incomes decline, unemployment grows, and social benefits per capita increase;• The quantity of provided public services declines. This is mainly due to the
services which are provided by the larger municipalities that serve the neighboringsmall municipalities;
• The municipal capacity for accumulation of its own revenues declines. Smallermunicipalities become more dependent on intergovernmental subsidies;
• The amount of fees paid by the population, for the local services provided,declines.
Some local characteristics are in reverse relation to the size of local governments.So, for example:
• The satisfaction with the services is greater in the small municipalities;• The per capita expenditures for the mass services—kindergartens and secondary
education—increase when the size of municipalities decrease; the same istrue for basic administrative services;
• The smaller municipalities have more investment expenditure/per capita.This is because targeted intergovernmental subsidies are mostly directedtoward the smallest local governments. With some exceptions, the largemunicipalities’ insufficient funds for covering current needs do not allowthem to allocate significant own funds for investment, and the underdevelopedcredit market does not yet allow the use of borrowed funds for investment.Nevertheless, the capacity to find capital projects with own resources increaseswith the increasing size of the local government.
Municipal councilors are elected on the basis of a proportionate system. Noelection districts exist in municipalities comprising of more than one settlement (theseare 96% of all municipalities). This should guarantee the representation of particularsettlements. This causes tension and center-periphery problems. This is also intensifiedby the centralized system of allocating the powers and the lack of powers in thesettlements. Re-allocation of financial resources is performed within the municipality,which then deprives the peripheral settlements. The present local governments arealso not willing to transfer more functions and financial resources to the mayoralties.
Fragmentation is observed in the small municipalities, where the center city isrelatively equal to the rest of the settlements. This is a result of two factors: the legislativerequirements for the establishment of a new municipality and the specific attitudesamongst populations in the certain settlements.
In the large municipalities, the municipal center is usually a big city whosegravitational impact on the peripheral settlements is relatively big. Most of the
212
C O N S O L I D A T I O N O R F R A G M E N T A T I O N ?
D F I D – L G I L O C A L G O V E R N M E N T P O L I C Y P A R T N E R S H I P P R O G R A M
population has migrated to the municipal center, making the neighboring villagesrelatively small in size. The populations, still within the villages, nevertheless usethe city infrastructure and the services provided in the city. Thus, the villages becometoo dependent on the municipal center. Conversely, the peripheral villages are under-represented in the municipal council, based on their minute population. By addingtheir fragmentation, it is seen that the separation of villages and turning them intoautonomous municipalities is less possible (in terms of local interests) and almostimpossible (in terms of reaching the requirements for minimum number of separatingsettlements).
The conditions in municipalities with relatively smaller disparities in the size ofsettlements are absolutely different. The municipal center does not have the gravi-tational impact that a large city does on the rest settlements. They are all betterrepresented in the municipal council and the centralistic policy meets greateropposition. The separation of settlements and formation of autonomous municipalitiesis a result of this opposition.
Presently, the complicated procedures and the legislative restrictions impedethe stronger fragmentation of municipalities. The centralized system of relationsbetween the central government institutions and the local governments also contributesto preserving the size of municipalities. The decentralization process would increasethe scope of local powers. The advantages of settlements’ separation in autonomousmunicipalities are expected to increase while other things hold equal. This wouldincrease the centrifugal forces, particularly in municipalities, where the settlementsare relatively equal to the municipal center. An eventual mass fragmentation ofthese municipalities would increase the inter-municipal disparities in national terms.
Legislation does not treat the municipalities differently in terms of their sizeand capacity to accumulate revenues and manage expenditures. All municipalities—large and small—have very limited power and influence on their revenues and expend-itures.
The population cannot trace the link between taxes and fees, that which it paysto the municipality, and the quality of the services. The citizens are not informed ofthe workings of the local government. Meanwhile, increased activity by the localpopulation is observed in several places where the local governments have the powerto set fees and manage local activities. The critical attitude towards the sanitation,where the “solid waste fee—cleaning” link is direct and the population realizes it, isvery indicative. It can be conditionally stated that the local governments in the smallmunicipalities are closer to the citizens and consider their preferences more often.
The possibility for municipalities to conduct local economic policies is verylimited. This is mainly done through municipal property, considering the presentlegislation. It is evident that larger municipalities have greater property revenues.
213
D O E S L A R G E R M E A N M O R E E F F E C T I V E ? S I Z E A N D T H E F U N C T I O N O F L O C A L G O V E R N M E N T S I N B U L G A R I A
The relation between the size of local governments and their ability to conductlocal economic policy is very controversial.
Small municipalities have small bureaucracies, which allows faster response timeto the needs of businesses. Meanwhile, the property and territory of these municipalitiesare less attractive. Large municipalities have greater possibilities to provide favorableconditions, they have greater property and yet, sometimes, the complicatedbureaucratic procedures will actually impede and even repel business.
4.2 Recommendations
Bulgarian municipalities are relatively large. This creates relative advantages, onwhich the social consensus for preserving their size is built. One municipality usuallyincludes several settlements, one of which is its center. The internal contradictionsin the municipality are provoked by the electoral system, which leaves some settle-ments un-represented in the local parliament and causes mayoralties to have reducedpowers. Proposals for resolving these problems are:
• Change of the electoral system. Moving from the proportionate systemtowards a majority system for the election of municipal councilors;
• Increasing the village mayors’ powers. Fairer allocation of financial resourcesand transfer of the responsibilities for municipal property management. Thisdoes not require any legislative changes because the municipal council performsthe allocation of powers and responsibilities among the settlements withinone municipality.
There is also something to be done for the better representation of the varioussized municipalities and the protection of their interests within the central institutions.Conditions should be created for considering the interests of the small municipalities.A special committee, under NAMRB, could be created for this purpose or quotas forsmall municipalities in the present committees could be provided. The establishmentof a small municipalities’ association could be another alternative.
The other issue worth considering is a change in the country’s administrativeand territorial division and the possible establishment of a second self-governmenttier on the level of the present administrative regions (28). The delegated state unitsare suitable to be concentrated on the level of the present regions for planning (6).
There are arguments which suggest that the intergovernmental subsidy mechanismfor 2003 will be based on separation of power and the responsibility of municipalitiesfor the provision of public services, financed from the municipal budgets. The amountof intergovernmental subsidies should add to the shared tax revenues and, thus,
214
C O N S O L I D A T I O N O R F R A G M E N T A T I O N ?
D F I D – L G I L O C A L G O V E R N M E N T P O L I C Y P A R T N E R S H I P P R O G R A M
finance the delegated municipal services. The new formula should also includeequalizing subsidies for poor municipalities, formed in reverse relation to their taxcapacity. Such a solution would help fill the shortage of local revenues in the smallestmunicipalities and compensate their higher costs of local services.
Elimination of legislative restrictions for local fee rates would, to large extent,resolve the problem of a catchment area, for those services consumed by the populationof neighboring municipalities. The eventual establishment of a second tier of localself-government will create opportunities for delegating the provision of these servicesby the new tier of government.
The significant disparities in the capacity of local governments suggest differentialtreatment of the municipalities by the reforms aimed at fiscal decentralization andindependence of local governments. The rational approach to this relationship isthe transfer of power and responsibility towards the municipalities in a manner sothat the differential disparities in government and resource capacity are considered.For example, the large municipalities are better prepared to undertake the responsibilitiesfor administration (setting the amount and collection) of local fees and set the localtax rates. Access to greater financial resources, which they have, enables them to servicerelatively bigger investment loans. In this sense, the raising of the legal limit ofinvestment from own source, and borrowed funds, will enable them to use theirfinancial resources effectively. Later on, the small municipalities can also receivesuch powers when their capacity increases.
REFERENCES
Law on the Administrative and Territorial Division of the Republic of Bulgaria.
Law on the Administrative and Territorial Division of Sofia City Municipality andthe Large Cities.
Law on Local Government and Local Administration.
Law on the Administration.
Law on the State Servant.
“Administrativnata reforma—realnost i badeste” (The Administrative Reform—Realityand Future) (Book with laws and comments), Sofia, 1995.
Analysis, evaluation and ranking of Bulgarian municipalities based on the level of socio-economic development in 2000, Annual Report of Club “Economika 2000”, 2001.
Izabella Barati and Ákos Szalai: Fiscal Decentralisation in Hungary, Based on Inter-national Comparison.
215
D O E S L A R G E R M E A N M O R E E F F E C T I V E ? S I Z E A N D T H E F U N C T I O N O F L O C A L G O V E R N M E N T S I N B U L G A R I A
Burden of the expenditures for ensuring the mandatory services assigned by the centralgovernment to the municipalities in Bulgaria, Report of LGI/USAID, 2000.
Chavdarova Guinka: “Administrativnata reforma—realnost i badeste” (The Administ-rative Reform—Reality and Future), article in the “Administrative Reform”Journal, Book 2, Sofia, 1996.
Comparative Analysis of the Municipal Powers and Responsibilities, Report of LGI/USAID,1999.
Enhancing the Capacity of the Local Governments Through Effective and AccountableManagement by Improving the Budget Process, Club Economika 2000.
Ivanov Stefan: “Mestni finansi” (Local Finance), NASRB, Sofia, 2000.
Ivanov Stefan: Socio-Economic Differentiation of Municipalities, in Human Develop-ment Report, UNDP, 1996.
Ivanov Stefan: “Mestni finansi v Francia” (Local Finance in France), in Series AnalyticalReports, Parliamentary Research Department, Sofia, 1996.
Ivanov Stefan, “Mejduobstinski finansovi razlichia” (Intermunicipal Financial In-equalities), Economic Thought, 1997, No.1, Sofia.
Ivanov Stefan (co-author): Municipal Finance Reform Strategy for Bulgaria, FinalReport, Urban Institute, Washington D.C., 1997.
Ivanov Stefan: “Mehanizam za razpredelenie na darjavnite transferi” (IntergovernmentalFiscal Transfers), in Fiscal Decentralization, FLGR, Sofia, 1998.
Ivanov Stefan: Municipal budgets—situation, factors, conflict potential, in EarlyWarning Report, UNDP, Sofia, November 1999.
Ivanov Stefan: “Mejduobstinski finansovi razlichia” (Intermunicipal Financial Disparitiesin Bulgaria (1996–1998), Economic Studies, Volume VIII, No.2, BAS, Sofia,1999.
Ivanov Stefan: “Mestni danaci i taxi v Bulgaria—vazmojnosti za budesto razvitie” (LocalTaxes and Fees in Bulgaria—Possibilities for Future Development), NAMRB,Sofia, 2000.
“The Municipality—the Basis of Local Government”, issue of RAABE.
Stanev Hristo, I. Botev, Sl. Gencheva and S. Kovachev: “Administrativno I teritorialnodelenie na Bulgaria” (The Administrative and Territorial Division of Bulgaria),Sofia, 2002.
216
C O N S O L I D A T I O N O R F R A G M E N T A T I O N ?
D F I D – L G I L O C A L G O V E R N M E N T P O L I C Y P A R T N E R S H I P P R O G R A M
NOTES
1 The CPI published by the National Statistical Institute is used as deflator.2 Further on, it is referred to as region.3 The capital city, Sofia.4 The Government.5 This is the latest data from the national census, March 2001. The other sections
of the paper use data for the number of population from 31 December 1999.6 [(P
below-i/P
below-av)+ (P
in-i/P
in-av)+ (P
above-av/P
above-i)]/3 , where:
Pbelow
-i — % of the population below working age in municipality i;
Pbelow
-av — % of the population below working age average for all municipalities;
Pin-i — % of the population in working age in municipality i;
Pin -av — % of the population in working age average for all municipalities;
Pabove
-i — % of the population above working age in municipality i;
Pabove
-av — % of the population above working age average for all municipalities.7 Analysis, evaluation and ranking of Bulgarian municipalities based on the level
of socio-economic development in 2000, Annual Report of Club “Economika2000”, 2001.
8 Comparative analysis of the municipal powers and responsibilities, Report of LGI/USAID, page 57,1999.
9 Burden of the expenditures for ensuring mandatory services assigned by the centralgovernment to the municipalities in Bulgaria, Report of LGI/USAID, page 6,2000.
1 0 Enhancing the capacity of the local governments, through effective and accountablemanagement, by improving the budget process, Club Economika 2000, 2000-2001
1 1 Services relating to the urban planing, the construction and other economic activities.1 2 The legal budget framework requires the central government to determine the
amount of the general subsidy on the basis of the draft budgets of localgovernments for the coming year in order to substitute for the lack of ownresources. Practice shows that the total volume of the subsidy is being determinedaccording the current possibilities of the central budget and on the basis of generallyunderestimated tax revenues. As result, the municipalities receive portions ofwhat they have requested.
217
D O E S L A R G E R M E A N M O R E E F F E C T I V E ? S I Z E A N D T H E F U N C T I O N O F L O C A L G O V E R N M E N T S I N B U L G A R I A
1 3 Ivanov St., Local budgets in Bulgaria, FLGR, 1998.1 4 We need to note that the data used does not reflect the fact that some expenditure
for 2000 is not paid by local governments and, thus, are not reflected in thefinancial reports. On the other hand, these expenditures refer to the overalloperation of the services monitored in the report. The way the unpaid bills arereported (by function area) does not allow for the necessary activity breakdownand usage in the recent study.
The impact of the unpaid bills on the financial situations of the five groups isdifferent. The unpaid bills in the end of FY 2000 for Sofia represent 0.25% ofthe budget expenditures reported, which means that all of the municipalexpenditures made are included into the financial statements.
For the municipalities from group 2 this ratio is 13%, for group 3–10%, for group4–8% and for group 5–6%.
1 5 Okolia—an intermediate tier between oblast and municipality.
Economies and Diseconomiesof Scale in Polish
Local Governments
Pawel Swianiewicz
Mikolaj Herbst
C H A P T E R 5

220
C O N S O L I D A T I O N O R F R A G M E N T A T I O N ?
D F I D – L G I L O C A L G O V E R N M E N T P O L I C Y P A R T N E R S H I P P R O G R A M
221
E C O N O M I E S A N D D I S E C O N O M I E S O F S C A L E I N P O L I S H L O C A L G O V E R N M E N T S
Table of Contents
1. Introduction—Local Government in Poland ............................................. 223
2. Basic Description of Territorial Organization and Its Changes ................. 2272.1 Descriptive Statistics and Characteristics
of Territorial Organizations ................................................................. 2272.2 Debates on Territorial Organization and the Size
of Local Government Units ................................................................. 2302.3 The Size of Local Government and Democratic Representation ...... 2322.4 Regulations on Division and Amalgamation
of Administrative Units ....................................................................... 2362.5 Regulations on Sub-Municipal Governments ................................... 236
3. Size of Local Government in the Leaders’ Perception ................................ 237
4. Size of Local Government and Local Democracy ...................................... 2404.1 Size, Trust, and Citizens’ Satisfaction ................................................ 2404.2 Size and Representation ...................................................................... 2454.3 Decentralization Within Local Government—the Relationship
Between Municipal Authorities and Villages (or City Districts) ..... 2494.4 Size and Function of Local Democracy
—An Attempt at Conclusions ............................................................ 253
5. Size of Local Government and Allocation of FunctionsBetween Tiers of Government ..................................................................... 255
6. Size of Local Government and Economic Development Policies .............. 258
7. Unit Cost, Catchment Area, Quality of Municipal Servicesand the Size of Administrative Units .......................................................... 2627.1 Basic Administrative Services .............................................................. 2627.2 Primary and Secondary Education ..................................................... 265
7.2.1 Pre-School Education and the Size of Local Government ....... 2677.2.2 The Primary School Network, School Size,
and the Size of the Municipality ............................................. 2687.2.3 The Problem of Free Riding Within Secondary Education ... 270
222
C O N S O L I D A T I O N O R F R A G M E N T A T I O N ?
D F I D – L G I L O C A L G O V E R N M E N T P O L I C Y P A R T N E R S H I P P R O G R A M
7.3 Voluntary Co-Operation Between Local Governments ..................... 2727.3.1 Case Study–Solid Waste Management ..................................... 273
8. Conclusions .................................................................................................. 2758.1 Efficient Function of the Municipality—Attempts
at Building a Composite Index and Relationship With Size ............ 2798.1.1 Defining the Efficiency (Performance) ..................................... 2798.1.2 Matching Variables, Developing the Final Formula
for the Efficiency (Performance) ............................................... 2808.1.3 Verifying the Relationship Between Size and Efficiency ......... 281
8.2 Practical Recommendations ................................................................ 286
References ............................................................................................................. 288
Notes .................................................................................................................... 290
223
E C O N O M I E S A N D D I S E C O N O M I E S O F S C A L E I N P O L I S H L O C A L G O V E R N M E N T S
Economies and Diseconomies of Scalein Polish Local Governments
Pawel Swianiewicz, Mikolaj Herbst1
1. INTRODUCTION—LOCAL GOVERNMENT IN POLAND
Before 1990, the highly centralist doctrine of real-socialism left no space for a local self-government system. Local administration was hierarchically dependent upon the uppertiers of administration and central government branch ministries. Consequently, localdiscretion to act upon any financial issues or forms of service delivery was next to none.The constitutionally dominant position of the communist party limited any reformsaimed at real democratization of the local political process. Nevertheless, the inefficiencyof the centralist system had been commonly observed for many years. The PolishCommunist Party then tried to introduce some forms of decentralization and localgovernment (see Acts of 1983 and 1988). But these limited reforms could not changethe doctrinal base of the centralist state and they were unable to create more democraticor effective local government results.
The turning point was the round-table negotiation (between the “Solidarity”opposition and the ruling communist party) in 1989. Local government reform wasone of topics of discussion. It is worth emphasizing that it was the only topic on whicha final agreement was not reached and a “statement of disagreement” was signed.Nevertheless, the main directions of the future reform had been already drawn by the“Solidarity” opposition.
Local government reform was one of the main priorities for the first post-communistgovernment, formed in September 1989. Reformers from the Solidarity movementassumed that it was not enough to change the government in Warsaw in order tolaunch the transformation towards a democratic country and free-market economy.They were afraid that “old-style” local administration could block the practicalimplementation of actual reforms for the countryside. Quick, but intensive, preparationallowed for the passing of the new Local Government Act in March 1990. This wasfollowed by general local elections in May 1990 and radical decentralization of financialregulations in January 1991. The 1990 reform introduced elected local governmenton the municipal (gmina) level only, while upper tiers of territorial divisions remainedin the control of the state administration. This solution was treated as provisional one.It was argued that the existence of 49 small regions (województwa) introduced by the
224
C O N S O L I D A T I O N O R F R A G M E N T A T I O N ?
D F I D – L G I L O C A L G O V E R N M E N T P O L I C Y P A R T N E R S H I P P R O G R A M
communist administration in the mid-seventies was disfunctional and required modifi-cation. It was assumed that newly elected regional governments should be introducedalong with reforms in territorial division. However, for a number of reasons which willnot be discussed here in depth, the introduction of upper tiers of local governmentshad been postponed for several years, until the end of 1998.
There are some striking similarities between the implementation of the 1990 and1998 reforms. Like in 1990, the 1998 reform were prepared very quickly. The specificdirections of the government proposal were formulated at the beginning of 1998, theelections for county and regional councils were held in October, and new tiers ofgovernment started operation by January 1, 1999. Again, similarly to 1990, manyimportant legal regulations were approved at the last minute (or even later). The Acton Revenues of Territorial Self-Government was voted on after the October 1998 elections.Moreover, the Act was only temporary-limitations of its validity, as specified in theoriginal title of the Act, were between the years 1999 and 2000. The government andthe parliament agreed that substantial revisions would be necessary after a couple yearsof the new system’s operation. Also precise regulations on division of competenciesbetween tiers of government and between local government and state administrationwere discussed by the Parliament, even after the 1998 county and regional elections. Inboth cases (i.e. the municipal and the regional reform), the validity of temporary financialregulations was extended beyond the intended period (i.e. in the case of municipalgovernments—beyond 1991, when the more stable law was voted at the end of1993, in the case of county and regional reform—beyond 2000. Currently, there aremany signs that validity of this temporary solution will be extended for 2002 as well).
As a result of this process, there are currently three tiers of territorial governments:almost 2,500 gminy (municipalities), 308 powiats (counties), plus 65 cities with acounty status (i.e. performing both tasks allocated to municipal and county level ofgovernments) and 16 województwa (regions) which replaced earlier 49 smaller units. Onboth a municipal and a county level, self-government is the only form of public admin-istration. On a regional level, there is a dual structure—on the one hand—electedself-government, and on the other—a governor (wojewoda) nominated by the PrimeMinister with his/her own administrative apparatus. However, functions of regional stateand self-government administrations are clearly separated and there is no hierarchi-cal subordination between them.
The goal of the reform was to clearly separate functions and policy areas betweentiers of government and to eliminate vertical (hierarchical) dependency of the lower tierupon the higher. This has been achieved in regards to the three levels of sub-nationalself-governments. Obviously municipal, county and regional levels co-operate, forexample in economic development policies, but in terms of specific service delivery, theseparation is close to perfect. The situation is much more complicated in regards to therelationship between central and local government level. In some cases (such as education

225
E C O N O M I E S A N D D I S E C O N O M I E S O F S C A L E I N P O L I S H L O C A L G O V E R N M E N T S
or some of social welfare benefits), nation-wide regulations are so strict that localgovernment’s role is reduced to a large extent to the central government agents andimplementation of central policies.
The set of reforms granted a wider range of functions to municipal governmentswhile the list of county’s functions is much shorter. The aggregate county budget isonly a small fraction (about a quarter) of the aggregate municipal budgets. Such adivision of functions is possible because of a relatively large size of municipal units inPoland.2 This issue is discussed in following sections of this chapter.
As it is presented briefly in Table 5.1, the widest scope of services is delivered on amunicipal level, county responsibilities are more limited and the role of regional self-government in direct service delivery is very limited (although there are also someexamples of such roles, higher education and main road maintenance) but they aremostly focused on strategic planning and regional development programs.
Table 5.1Allocation of Functions Among Tiers of Local
and Regional Self-Government in Poland
Municipality County Region
Strategic and Physical Planning • Plans for local • Plans for • Strategicdevelopment county’s regional planning
• Local physical development (including inter-master plans • Building national eco-
• Granting inspection nomic relationsbuilding permits and regional
promotion)• Regional devel-
opment con-tracts with cent-ral government
Roads and Communal Infrastructure • Water supply • County road • Regional workand sewerage network network
• Waste collection • Waterand disposal management
• Street cleaning (flood• Street lighting protection)• Parks and
green areasconservation
• Central heating• Local roads• City public
transportation
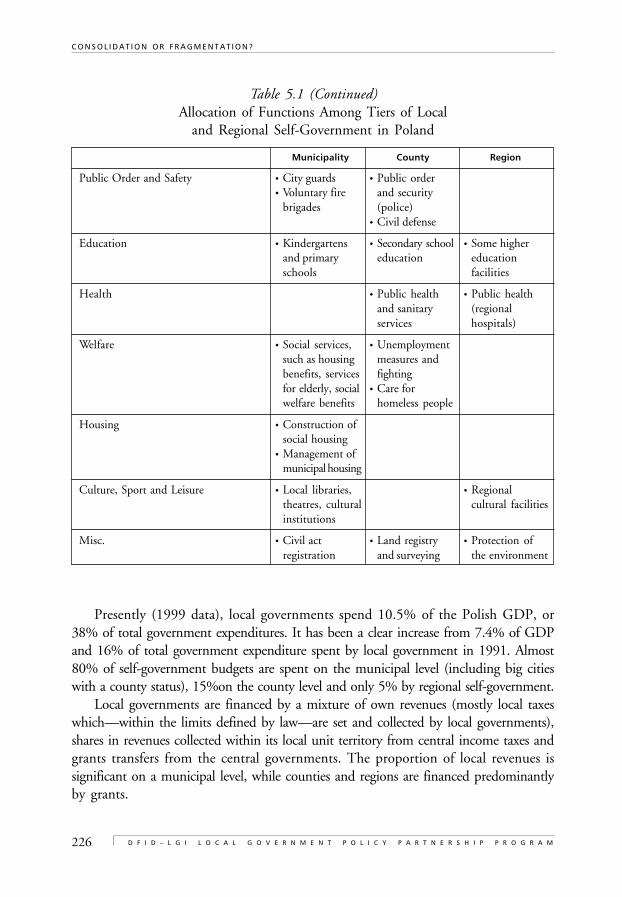
226
C O N S O L I D A T I O N O R F R A G M E N T A T I O N ?
D F I D – L G I L O C A L G O V E R N M E N T P O L I C Y P A R T N E R S H I P P R O G R A M
Table 5.1 (Continued)Allocation of Functions Among Tiers of Local
and Regional Self-Government in Poland
Municipality County Region
Public Order and Safety • City guards • Public order• Voluntary fire and security
brigades (police)• Civil defense
Education • Kindergartens • Secondary school • Some higherand primary education educationschools facilities
Health • Public health • Public healthand sanitary (regionalservices hospitals)
Welfare • Social services, • Unemploymentsuch as housing measures andbenefits, services fightingfor elderly, social • Care forwelfare benefits homeless people
Housing • Construction ofsocial housing
• Management ofmunicipal housing
Culture, Sport and Leisure • Local libraries, • Regionaltheatres, cultural cultural facilitiesinstitutions
Misc. • Civil act • Land registry • Protection ofregistration and surveying the environment
Presently (1999 data), local governments spend 10.5% of the Polish GDP, or38% of total government expenditures. It has been a clear increase from 7.4% of GDPand 16% of total government expenditure spent by local government in 1991. Almost80% of self-government budgets are spent on the municipal level (including big citieswith a county status), 15%on the county level and only 5% by regional self-government.
Local governments are financed by a mixture of own revenues (mostly local taxeswhich—within the limits defined by law—are set and collected by local governments),shares in revenues collected within its local unit territory from central income taxes andgrants transfers from the central governments. The proportion of local revenues issignificant on a municipal level, while counties and regions are financed predominantlyby grants.
227
E C O N O M I E S A N D D I S E C O N O M I E S O F S C A L E I N P O L I S H L O C A L G O V E R N M E N T S
2. BASIC DESCRIPTION OF TERRITORIAL ORGANIZATIONAND ITS CHANGES
2.1 Descriptive Statistics and Characteristicsof Territorial Organizations
Present division into basic territorial units (gmina) was introduced in 1973 as a resultof amalgamation of earlier, smaller units, called gromada. The number of newly createdmunicipalities totaled about 2,400, but later, during the 1970s, there was furthergradual amalgamation and, in 1978, the number of municipal governments (includingboroughs in the largest cities) was 2,348. Later, a very slow fragmentation processbegun and, in 1988, the number of municipalities was 2,399 (again, including boroughsin big cities).
The last decade has not brought a dramatic change to this picture. The 1990reform liquidated division in the big city boroughs (Warsaw was the only exception).Apart from this, the number of municipalities was relatively stable, diverging only withthe occasional rare case of splitting or joining units according to the will of its citizens.The most significant shift in municipal structure reflects the transformation of therural areas into quickly developing mixed rural-urban gminas3. This involves granting(by the Council of Ministers) urban status to the “central village” of rural municipalities.During the last decade, there were 56 villages who received urban status and 30 suchcases in the period between 1994–2000 (most often for new cities 1994–99 and in1996–96). However this kind of transformation, unlike splitting and joining existingunits, doesn’t affect the total number of municipalities, since each liquidated rural unitis replaced by a mixed one.
The most common type of municipal division occurs in mixed urban-rural gminasand results in the establishment of new purely urban and new purely rural municipalities.There are over 500 such (mixed) local governments in Poland, many of them functionquite smoothly. However, in some cases, conflicts between the rural and urbanpopulation (or even more frequently between urban and rural politicians) results instrong pressure to the divide the local government unit. The reasons for such conflictsare discussed in more detail in the following sections. The largest series of such splitstook a place in 1991, when 23 urban-rural municipalities divided into separate urbanand rural units. A few other cases took a place in 1994–1997, but central governmenthas been very reluctant to comply with fragmentation pressures and, since 1998, therehas not been any case of such splits.
The third type of change in municipal territorial organization was related to thedivision of existing rural local government into two or more or to the separation ofdistricts of the city. Also this type of new local governments emergence were the most
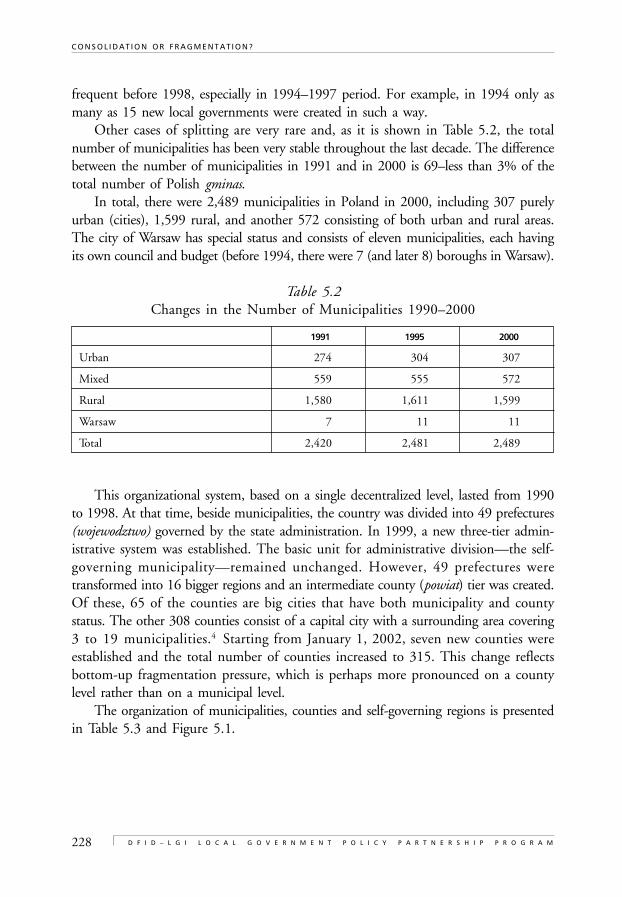
228
C O N S O L I D A T I O N O R F R A G M E N T A T I O N ?
D F I D – L G I L O C A L G O V E R N M E N T P O L I C Y P A R T N E R S H I P P R O G R A M
frequent before 1998, especially in 1994–1997 period. For example, in 1994 only asmany as 15 new local governments were created in such a way.
Other cases of splitting are very rare and, as it is shown in Table 5.2, the totalnumber of municipalities has been very stable throughout the last decade. The differencebetween the number of municipalities in 1991 and in 2000 is 69–less than 3% of thetotal number of Polish gminas.
In total, there were 2,489 municipalities in Poland in 2000, including 307 purelyurban (cities), 1,599 rural, and another 572 consisting of both urban and rural areas.The city of Warsaw has special status and consists of eleven municipalities, each havingits own council and budget (before 1994, there were 7 (and later 8) boroughs in Warsaw).
Table 5.2Changes in the Number of Municipalities 1990–2000
1991 1995 2000
Urban 274 304 307
Mixed 559 555 572
Rural 1,580 1,611 1,599
Warsaw 7 11 11
Total 2,420 2,481 2,489
This organizational system, based on a single decentralized level, lasted from 1990to 1998. At that time, beside municipalities, the country was divided into 49 prefectures(wojewodztwo) governed by the state administration. In 1999, a new three-tier admin-istrative system was established. The basic unit for administrative division—the self-governing municipality—remained unchanged. However, 49 prefectures weretransformed into 16 bigger regions and an intermediate county (powiat) tier was created.Of these, 65 of the counties are big cities that have both municipality and countystatus. The other 308 counties consist of a capital city with a surrounding area covering3 to 19 municipalities.4 Starting from January 1, 2002, seven new counties wereestablished and the total number of counties increased to 315. This change reflectsbottom-up fragmentation pressure, which is perhaps more pronounced on a countylevel rather than on a municipal level.
The organization of municipalities, counties and self-governing regions is presentedin Table 5.3 and Figure 5.1.
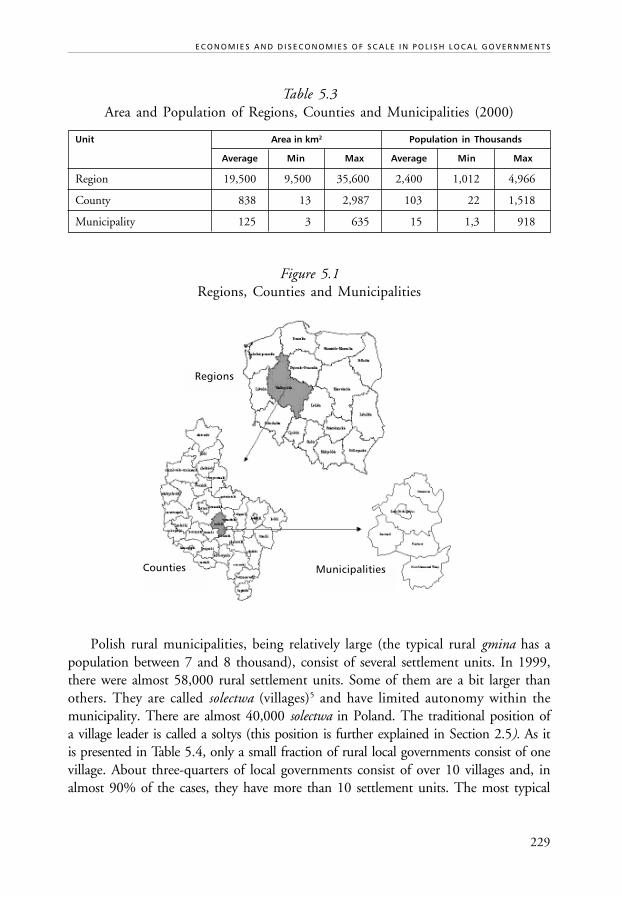
229
E C O N O M I E S A N D D I S E C O N O M I E S O F S C A L E I N P O L I S H L O C A L G O V E R N M E N T S
Table 5.3Area and Population of Regions, Counties and Municipalities (2000)
Unit Area in km2 Population in Thousands
Average Min Max Average Min Max
Region 19,500 9,500 35,600 2,400 1,012 4,966
County 838 13 2,987 103 22 1,518
Municipality 125 3 635 15 1,3 918
Figure 5.1Regions, Counties and Municipalities
Polish rural municipalities, being relatively large (the typical rural gmina has apopulation between 7 and 8 thousand), consist of several settlement units. In 1999,there were almost 58,000 rural settlement units. Some of them are a bit larger thanothers. They are called solectwa (villages)5 and have limited autonomy within themunicipality. There are almost 40,000 solectwa in Poland. The traditional position ofa village leader is called a soltys (this position is further explained in Section 2.5). As itis presented in Table 5.4, only a small fraction of rural local governments consist of onevillage. About three-quarters of local governments consist of over 10 villages and, inalmost 90% of the cases, they have more than 10 settlement units. The most typical
Regions
MunicipalitiesCounties
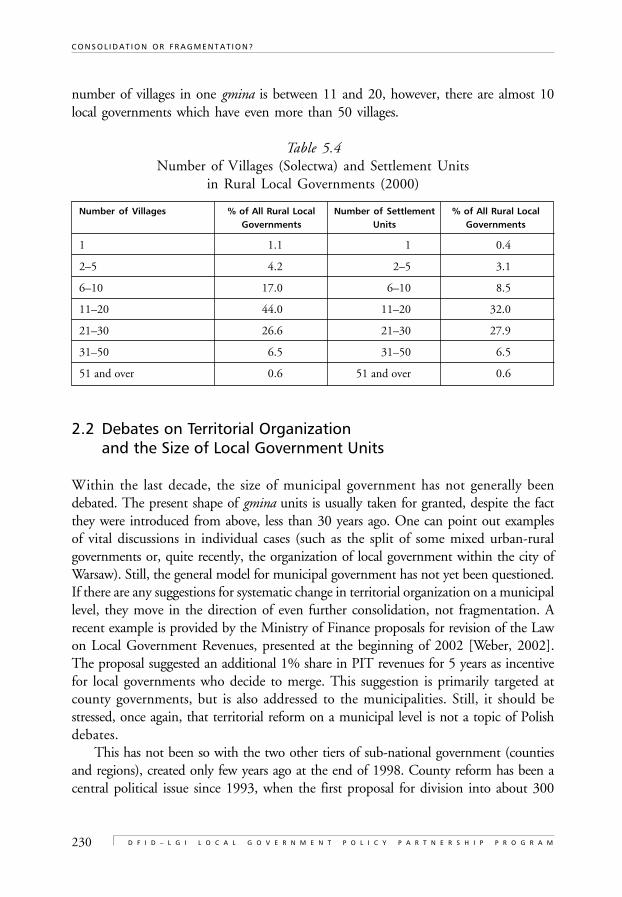
230
C O N S O L I D A T I O N O R F R A G M E N T A T I O N ?
D F I D – L G I L O C A L G O V E R N M E N T P O L I C Y P A R T N E R S H I P P R O G R A M
number of villages in one gmina is between 11 and 20, however, there are almost 10local governments which have even more than 50 villages.
Table 5.4Number of Villages (Solectwa) and Settlement Units
in Rural Local Governments (2000)
Number of Villages % of All Rural Local Number of Settlement % of All Rural LocalGovernments Units Governments
1 1.1 1 0.4
2–5 4.2 2–5 3.1
6–10 17.0 6–10 8.5
11–20 44.0 11–20 32.0
21–30 26.6 21–30 27.9
31–50 6.5 31–50 6.5
51 and over 0.6 51 and over 0.6
2.2 Debates on Territorial Organizationand the Size of Local Government Units
Within the last decade, the size of municipal government has not generally beendebated. The present shape of gmina units is usually taken for granted, despite the factthey were introduced from above, less than 30 years ago. One can point out examplesof vital discussions in individual cases (such as the split of some mixed urban-ruralgovernments or, quite recently, the organization of local government within the city ofWarsaw). Still, the general model for municipal government has not yet been questioned.If there are any suggestions for systematic change in territorial organization on a municipallevel, they move in the direction of even further consolidation, not fragmentation. Arecent example is provided by the Ministry of Finance proposals for revision of the Lawon Local Government Revenues, presented at the beginning of 2002 [Weber, 2002].The proposal suggested an additional 1% share in PIT revenues for 5 years as incentivefor local governments who decide to merge. This suggestion is primarily targeted atcounty governments, but is also addressed to the municipalities. Still, it should bestressed, once again, that territorial reform on a municipal level is not a topic of Polishdebates.
This has not been so with the two other tiers of sub-national government (countiesand regions), created only few years ago at the end of 1998. County reform has been acentral political issue since 1993, when the first proposal for division into about 300
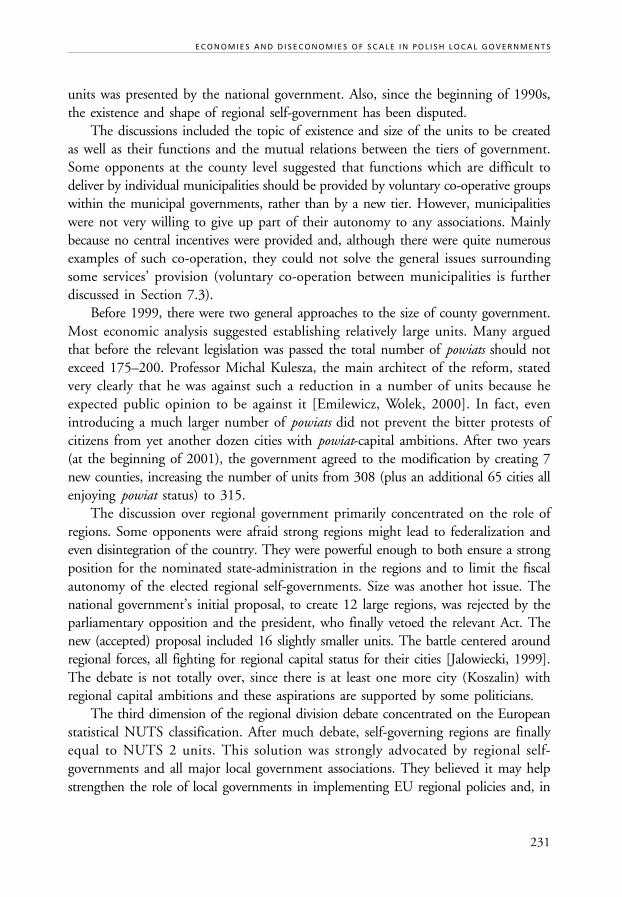
231
E C O N O M I E S A N D D I S E C O N O M I E S O F S C A L E I N P O L I S H L O C A L G O V E R N M E N T S
units was presented by the national government. Also, since the beginning of 1990s,the existence and shape of regional self-government has been disputed.
The discussions included the topic of existence and size of the units to be createdas well as their functions and the mutual relations between the tiers of government.Some opponents at the county level suggested that functions which are difficult todeliver by individual municipalities should be provided by voluntary co-operative groupswithin the municipal governments, rather than by a new tier. However, municipalitieswere not very willing to give up part of their autonomy to any associations. Mainlybecause no central incentives were provided and, although there were quite numerousexamples of such co-operation, they could not solve the general issues surroundingsome services’ provision (voluntary co-operation between municipalities is furtherdiscussed in Section 7.3).
Before 1999, there were two general approaches to the size of county government.Most economic analysis suggested establishing relatively large units. Many arguedthat before the relevant legislation was passed the total number of powiats should notexceed 175–200. Professor Michal Kulesza, the main architect of the reform, statedvery clearly that he was against such a reduction in a number of units because heexpected public opinion to be against it [Emilewicz, Wolek, 2000]. In fact, evenintroducing a much larger number of powiats did not prevent the bitter protests ofcitizens from yet another dozen cities with powiat-capital ambitions. After two years(at the beginning of 2001), the government agreed to the modification by creating 7new counties, increasing the number of units from 308 (plus an additional 65 cities allenjoying powiat status) to 315.
The discussion over regional government primarily concentrated on the role ofregions. Some opponents were afraid strong regions might lead to federalization andeven disintegration of the country. They were powerful enough to both ensure a strongposition for the nominated state-administration in the regions and to limit the fiscalautonomy of the elected regional self-governments. Size was another hot issue. Thenational government’s initial proposal, to create 12 large regions, was rejected by theparliamentary opposition and the president, who finally vetoed the relevant Act. Thenew (accepted) proposal included 16 slightly smaller units. The battle centered aroundregional forces, all fighting for regional capital status for their cities [Jalowiecki, 1999].The debate is not totally over, since there is at least one more city (Koszalin) withregional capital ambitions and these aspirations are supported by some politicians.
The third dimension of the regional division debate concentrated on the Europeanstatistical NUTS classification. After much debate, self-governing regions are finallyequal to NUTS 2 units. This solution was strongly advocated by regional self-governments and all major local government associations. They believed it may helpstrengthen the role of local governments in implementing EU regional policies and, in
232
C O N S O L I D A T I O N O R F R A G M E N T A T I O N ?
D F I D – L G I L O C A L G O V E R N M E N T P O L I C Y P A R T N E R S H I P P R O G R A M
particular, in making detail decisions on the allocation of EU pre-accession and futurestructural funds.
2.3 The Size of Local Government and Democratic Representation
The number of councilors elected in each municipality depends on population sizeand is determined by an Article 17 of the Law on Local Government. The 1990 reformsdecreased the number of councilors (if compared with the old “people’s councils”system) and a recent (April 2001) amendment to the Local Government Law specifiedfurther reductions. This is illustrated in Table 5.5.
The Polish Law on Local Election states, in Article 27, that the division of amunicipality into electoral wards is determined by the wojewoda (government’sadministrative representative in the region). The number of election wards depends onthe settlement structure. As long as they do not exceed the total number of councilorsto be elected, each village (solectwo) constitutes one ward. Urban areas are divided intowards on the basis of sub-municipal administration structure (administration districts,residential areas, etc.)
The Act differentiates between municipalities under 20,000 inhabitants, wherevoters elect 1 to 5 councilors for each election ward, and units with populations exceeding20,000, where the number of councilors for each district varies from 8 to 12 (Art.90).In gminas under 20,000 inhabitants, election results are calculated according the simplemajority rule (voting for individual candidates). In larger units, the councils are electedunder the proportional system, with citizens voting in fact for the list (organization)the candidate represents. (Art. 87,88).
Because the number of villages in a municipality is usually quite large in practice,the number of councilors is lower than the number of villages in almost half the rurallocal governments. This means, some of the villages are not directly represented bytheir own deputy in the council (a more precise distribution of councilor per villageratio is presented in Table 5.6). Obviously, the recent April 2001 amendment thatreduced the number of councilors will increase the number of “unrepresented” villages.After the 2002 local elections, the proportion of rural governments where the numberof councilors is lower than number of villages will increase from the present 40% to59%. Also, the proportion of governments in which the number of councilors is lowerthan number of settlement units will increase from the current 63% to 76%.
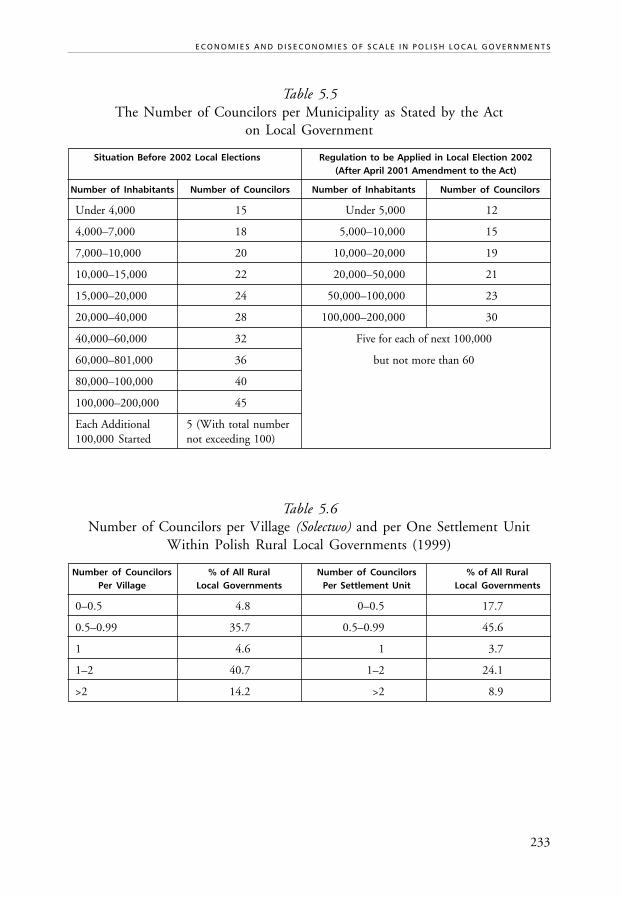
233
E C O N O M I E S A N D D I S E C O N O M I E S O F S C A L E I N P O L I S H L O C A L G O V E R N M E N T S
Table 5.5The Number of Councilors per Municipality as Stated by the Act
on Local Government
Situation Before 2002 Local Elections Regulation to be Applied in Local Election 2002(After April 2001 Amendment to the Act)
Number of Inhabitants Number of Councilors Number of Inhabitants Number of Councilors
Under 4,000 15 Under 5,000 12
4,000–7,000 18 5,000–10,000 15
7,000–10,000 20 10,000–20,000 19
10,000–15,000 22 20,000–50,000 21
15,000–20,000 24 50,000–100,000 23
20,000–40,000 28 100,000–200,000 30
40,000–60,000 32 Five for each of next 100,000
60,000–801,000 36 but not more than 60
80,000–100,000 40
100,000–200,000 45
Each Additional 5 (With total number100,000 Started not exceeding 100)
Table 5.6Number of Councilors per Village (Solectwo) and per One Settlement Unit
Within Polish Rural Local Governments (1999)
Number of Councilors % of All Rural Number of Councilors % of All RuralPer Village Local Governments Per Settlement Unit Local Governments
0–0.5 4.8 0–0.5 17.7
0.5–0.99 35.7 0.5–0.99 45.6
1 4.6 1 3.7
1–2 40.7 1–2 24.1
>2 14.2 >2 8.9
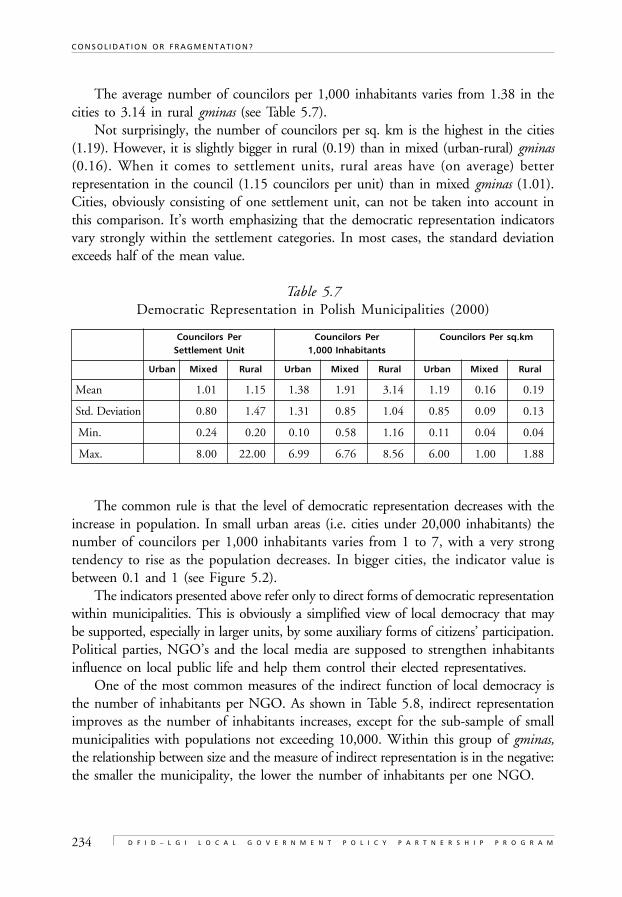
234
C O N S O L I D A T I O N O R F R A G M E N T A T I O N ?
D F I D – L G I L O C A L G O V E R N M E N T P O L I C Y P A R T N E R S H I P P R O G R A M
The average number of councilors per 1,000 inhabitants varies from 1.38 in thecities to 3.14 in rural gminas (see Table 5.7).
Not surprisingly, the number of councilors per sq. km is the highest in the cities(1.19). However, it is slightly bigger in rural (0.19) than in mixed (urban-rural) gminas(0.16). When it comes to settlement units, rural areas have (on average) betterrepresentation in the council (1.15 councilors per unit) than in mixed gminas (1.01).Cities, obviously consisting of one settlement unit, can not be taken into account inthis comparison. It’s worth emphasizing that the democratic representation indicatorsvary strongly within the settlement categories. In most cases, the standard deviationexceeds half of the mean value.
Table 5.7Democratic Representation in Polish Municipalities (2000)
Councilors Per Councilors Per Councilors Per sq.kmSettlement Unit 1,000 Inhabitants
Urban Mixed Rural Urban Mixed Rural Urban Mixed Rural
Mean 1.01 1.15 1.38 1.91 3.14 1.19 0.16 0.19
Std. Deviation 0.80 1.47 1.31 0.85 1.04 0.85 0.09 0.13
Min. 0.24 0.20 0.10 0.58 1.16 0.11 0.04 0.04
Max. 8.00 22.00 6.99 6.76 8.56 6.00 1.00 1.88
The common rule is that the level of democratic representation decreases with theincrease in population. In small urban areas (i.e. cities under 20,000 inhabitants) thenumber of councilors per 1,000 inhabitants varies from 1 to 7, with a very strongtendency to rise as the population decreases. In bigger cities, the indicator value isbetween 0.1 and 1 (see Figure 5.2).
The indicators presented above refer only to direct forms of democratic representationwithin municipalities. This is obviously a simplified view of local democracy that maybe supported, especially in larger units, by some auxiliary forms of citizens’ participation.Political parties, NGO’s and the local media are supposed to strengthen inhabitantsinfluence on local public life and help them control their elected representatives.
One of the most common measures of the indirect function of local democracy isthe number of inhabitants per NGO. As shown in Table 5.8, indirect representationimproves as the number of inhabitants increases, except for the sub-sample of smallmunicipalities with populations not exceeding 10,000. Within this group of gminas,the relationship between size and the measure of indirect representation is in the negative:the smaller the municipality, the lower the number of inhabitants per one NGO.
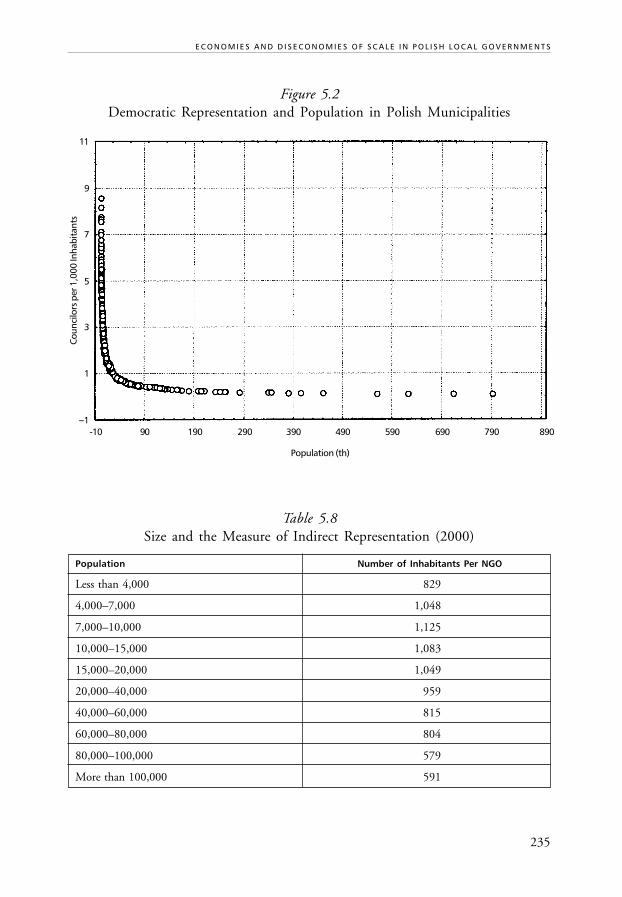
235
E C O N O M I E S A N D D I S E C O N O M I E S O F S C A L E I N P O L I S H L O C A L G O V E R N M E N T S
Figure 5.2Democratic Representation and Population in Polish Municipalities
Table 5.8Size and the Measure of Indirect Representation (2000)
Population Number of Inhabitants Per NGO
Less than 4,000 829
4,000–7,000 1,048
7,000–10,000 1,125
10,000–15,000 1,083
15,000–20,000 1,049
20,000–40,000 959
40,000–60,000 815
60,000–80,000 804
80,000–100,000 579
More than 100,000 591
11
Coun
cilo
rs p
er 1
,000
Inha
bita
nts
9
7
5
3
1
–1-10 90 190 290 390 490 590 690 790 890
Population (th)
236
C O N S O L I D A T I O N O R F R A G M E N T A T I O N ?
D F I D – L G I L O C A L G O V E R N M E N T P O L I C Y P A R T N E R S H I P P R O G R A M
2.4 Regulations on Division and Amalgamation ofAdministrative Units
In the Polish legal system, it is the central government that has right to decide uponthe number and range of local governments on both the municipal and county level.The decision to change the present borders (or even more so, for amalgamation or splitof existing local governments) has to be made after consultations with the effected localcouncils and citizens. However, the results of these consultations are not binding forthe government. The Municipal Government Act states (in Art. 4) that changing thelocal unit borders’ should follow several principles. For instance, the gmina should beas homogenous unit as possible, borders should respect settlement structures and spatialorganization, they should take into account social, economic and cultural ties and theshape of borders should ensure local government capacity to deliver public tasks. Thesesuggestions are of a very general nature and, in fact, they leave a lot of decisions to thediscretion of the central government. The last argument (about capacity to delivertasks) is most frequently referred to when local attempts at fragmentation (division oflocal government units) are being fought.
Quite recently, in August 2001, the Council of Ministries published a resolutionsetting rules for municipalities who are interested in dividing. The municipal councilhas to pass its petition to the regional governor, who (within 30 days) prepares his(her) opinion and passes it, along with a petition, to the Ministry for Interior andPublic Administration. The central government must make their decision within ayear and the decision has to be announced no later than June 30 of the preceding year.Such a rule allows the newly created local governments enough time to prepare nextyear’s budget. The municipal petition has to include:
• estimation of the one-time, and consistent, costs of the split;• the prognosis of local revenues and expenditures for suggested new governments
in the next financial year;• results of social consultations (usually in the form of a local referendum) for
each village involved separately, including turn-out and the number of votersactively supporting and opposing the change.
The basic statistics of such splits has been presented in Section 2.1 and somefurther case studies are presented in Section 4.1.
2.5 Regulations on Sub-Municipal Governments
The Polish municipalities, being relatively large, provide ample opportunities fordecentralization within local government. This concerns both rural communities, where
237
E C O N O M I E S A N D D I S E C O N O M I E S O F S C A L E I N P O L I S H L O C A L G O V E R N M E N T S
decentralization of some decisions to individual villages could have a place, and bigcities, where they might be divided into smaller districts (boroughs). The Act onMunicipal Governments leaves all important decisions on sub-municipal “auxiliaryunits” in the hands of the municipal council (Art. 5). Each municipal council has thepower to decide whether such units should exist and, if so, what its geographical borders,precise competencies, method of election of local representatives, etc. should be.
In rural areas, there is a very old tradition of limited forms of self-government led bypopularly elected village leaders (soltys). The Act on Municipal Government determinedthat the most important decisions about village government are made directly through“village meetings”, which also elects the soltys. In city districts’ citizens elect the districtcouncil (although some issues may be decided in citizen meetings as well). Executivepower in the district belongs to the district board elected by the district council.
Both the village leader and the city district chairman of the board have a right toparticipate in all meetings of the municipal council.
Although village and district councils exist in almost all local governments, municipalcouncils are usually reluctant to transfer any considerable amount of discretionaryauthority to them. Nevertheless, there have been some examples of innovations in thisrespect, both in big cities and in small rural communities. This issue is further discussedin Section 4.6.
3. SIZE OF LOCAL GOVERNMENT IN THE LEADERS’ PERCEPTION
What do Polish mayors think about the size of their municipalities? As it was presentedin the introductory chapter, according to the survey conducted by the LDI project,6
Polish mayors see the advantages of potential amalgamation of their municipalitiesmore often than their colleagues in the Czech Republic or Slovakia. Nevertheless, thereare negative opinions about potential merging that prevail also in Poland. Only 5.5%of Polish mayors said that merging with another municipality would be a very goodidea, another 13.1% said it would be a good idea, while 43% thought it would be badand 39.4% said it was a very bad idea.
But the idea of splitting (and creation of smaller municipalities) is even less popularamong Polish mayors. Only a small margin (0.2%) thought it would be a very goodidea, another 2.5% said it would be a good idea, while over 60% said it would be a verybad idea and 36% called it a rather bad idea. This means a vast majority of Polishmayors think their municipalities are a proper size and there are no convincing argumentsfor enlarging or dividing them.
One might expect that arguments in favor of merging with neighboring localgovernments might be more convincing in small municipalities. Interestingly enough,
238
C O N S O L I D A T I O N O R F R A G M E N T A T I O N ?
D F I D – L G I L O C A L G O V E R N M E N T P O L I C Y P A R T N E R S H I P P R O G R A M
the opposite is true. Mayors in large local governments are more often in favor ofamalgamation. This is illustrated by Figure 5.3. The breakdown is at about populationsize 20,000. About 40% of mayors in larger cities see advantages in such mergers,while only 10–20% of smaller local governments do. It seems that mayors in largerunits normally think about incorporating the smaller surrounding local governments,while those in smaller municipalities are more often afraid of loosing their autonomy asa result of a merger with another unit of a comparable size.
Figure 5.3% of Mayors Who Agree that Merging Their Municipalities
Might be a Good Idea (1997)
Acceptance for potential splits of local government is low among mayors, regardlessof the size of the local government they represent. It is only slightly larger in units withpopulation between 15–20,000. In Poland, most local governments belonging to thegroup consisting of several settlement units. One may expect that local governments inthis group are large enough to generate a variety of conflicts between various parts oflocal governments. Acceptance of splitting is less common in larger local governments,because these are usually single cities, where a split would be unnatural and wouldcause numerous infrastructure service problems.
Mayors’ points of view on most the individual arguments for merging local authoritiesis usually unrelated to size of local government. The only clear exception is the opinion
60
50
40
30
20
10
0Up to4,000
4–5,000 5–7,000 7–10,000 10–15,000 15–20,000 20–30,000 30–50,000 Over50,000
Population Size
239
E C O N O M I E S A N D D I S E C O N O M I E S O F S C A L E I N P O L I S H L O C A L G O V E R N M E N T S
that “merging would help create just distribution of services among citizens”. Thisopinion is more frequently supported by mayors from large local governments. Probably,they see the possibility to reduce spillovers in service delivery as resulting fromincorporating surrounding local governments to the city.
From the same survey, we can see that an increasing number of conflicts betweenareas of municipality is viewed as the strongest argument against further amalgamationof local government. Since Polish local governments are relatively large and heterogeneous,we may ask whether territorial roles play an important role in local political life.Unfortunately, the only data which we have to help us answer this question comesfrom a 1991 survey [Grochowski, 1991]. Local mayors were asked to assess theimportance of several problems with local governments’ functions. In the hierarchy ofperceived problems, conflicts between parts of municipality were not among the mostfrequently mentioned. Problems relating to insufficient financial resources and centralcontrol and standards were indicated much more often. Still, territorial conflicts wereindicated as important by 17% of mayors, significantly more than other local conflictssuch as conflicts between political groups (10%), between councilors and localadministration (11%), and conflicts with occupational groups (6%). This means thatterritorial conflicts did not effect everyday life in Polish municipalities but, at the sametime, they were relatively frequent and important for local political life. Unfortunately,we do not know whether the intensity of these conflicts was related to the size of thelocal governments nor do we know how the situation developed after 1991. One mayspeculate that, with further development of the political system in Poland, conflictsbetween political parties became much more frequent, conflicts between occupationalgroups have become more apparent, even though the role of territorial conflicts mighthave relatively decreased. We do not have hard facts to support this intuition, althoughthis thesis can be indirectly supported by some case studies. For example, Malewska-Szalygin (2001) in her analysis of one rural community in Northern Poland comes tothe conclusion that the most important contemporary local conflicts include the followingdimensions: poor versus rich citizens, teachers versus farmers, as well as members of thecommunist party before 1990 versus those who were never in the party, but she nevermentions territorial conflicts. This intuition is further confirmed by results of the 2001village leaders (soltys) survey, reported in detail in Section 4.3. Yet, some cases of splittingexisting municipalities into smaller units (some aspects of these cases are discussed infollowing sections) suggest territorial conflicts still happen to play a significant role inlocal politics.
240
C O N S O L I D A T I O N O R F R A G M E N T A T I O N ?
D F I D – L G I L O C A L G O V E R N M E N T P O L I C Y P A R T N E R S H I P P R O G R A M
4. SIZE OF LOCAL GOVERNMENT AND LOCAL DEMOCRACY7
4.1 Size, Trust, and Citizens’ Satisfaction
In theoretical debates on the size of local government units, arguments about democracyare among the most frequently brought up. Most often these arguments are raised byadvocates of small local units, although they can be found with proponents’ of theamalgamation thesis as well.
From the earlier study on public perception of local government in Poland[Swianiewicz, 2001], we know that people in small municipalities are more interestedin local governments’ activities. This is confirmed both by citizens’ verbal declarationsas well as—indirectly—by greater voter turn-out in local elections held in small territorialunits. The greater turn-out in small communities (than in big cities) is observed inspite of usually lower education and lower income status of citizens. Size remains themost powerful explanatory variable for turn-outs, even when controlled by other variablessuch as levels of income or education of the local population.
Reform theorists [see for example Mouritzen, 1989] might argue that citizens’willingness to participate in local politics might be more pronounced in bigger localgovernments because large administrative units may be granted more functions. Thisresults in local politics becoming more important in people’s everyday lives. In Poland,cities over 100,000 citizens have been responsible for more services than smaller localgovernment units. The 1998 reforms then granted similar extended functions to somesmaller cities which received a county status. However, empirical data does not providesupport for reform theory suggestions. In 1998, local electoral turnout in cities withpopulations between 40–100,000 and county status was even a little bit lower than inother cities of the similar size (42.1% in cities of county status and 44.3% in remainingcities). One might argue that people were still unaware of the consequences of therecent change in allocation of functions in 1998. But, in cities with populations over100,000, the extended functions had been transferred to the local governments fouryears before (in 1994). Nevertheless, the change in turnout between the 1994 and1998 election was no different there, than in other local governments.
According to public choice arguments, creation of smaller local authorities shouldresult in the increase of local populations’ political activity. However, 1990 and 1994analysis of local electoral turn-out, for over 40 local governments all created in 1991 asa result of a split of larger municipalities, does not support this hypothesis [see Jalowiecki,1995]. In newly created urban local governments, the turnout in 1994 was onlymarginally higher than in average cities of similar size, while, in newly created ruralgovernments, turn-out was even lower than in remaining rural areas.
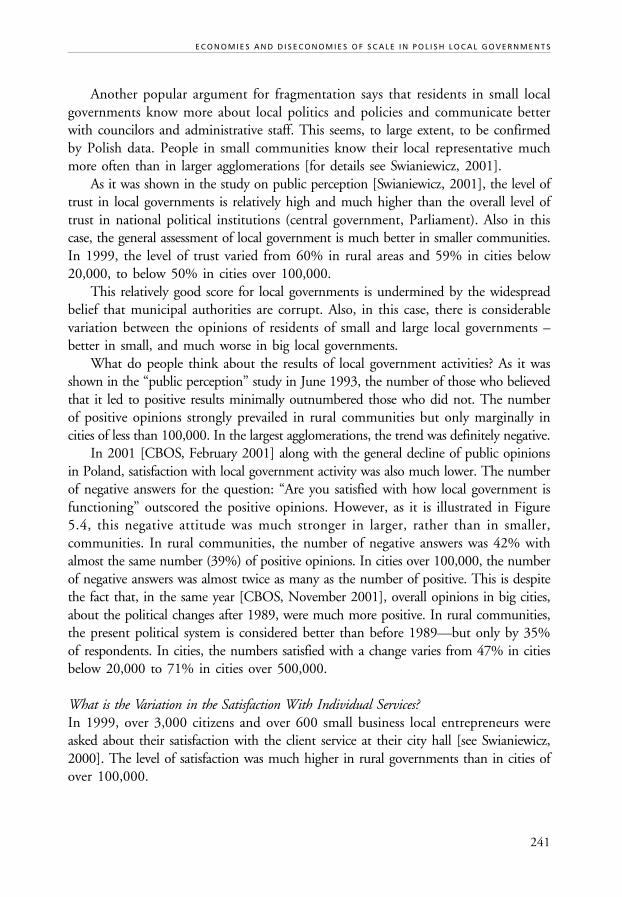
241
E C O N O M I E S A N D D I S E C O N O M I E S O F S C A L E I N P O L I S H L O C A L G O V E R N M E N T S
Another popular argument for fragmentation says that residents in small localgovernments know more about local politics and policies and communicate betterwith councilors and administrative staff. This seems, to large extent, to be confirmedby Polish data. People in small communities know their local representative muchmore often than in larger agglomerations [for details see Swianiewicz, 2001].
As it was shown in the study on public perception [Swianiewicz, 2001], the level oftrust in local governments is relatively high and much higher than the overall level oftrust in national political institutions (central government, Parliament). Also in thiscase, the general assessment of local government is much better in smaller communities.In 1999, the level of trust varied from 60% in rural areas and 59% in cities below20,000, to below 50% in cities over 100,000.
This relatively good score for local governments is undermined by the widespreadbelief that municipal authorities are corrupt. Also, in this case, there is considerablevariation between the opinions of residents of small and large local governments –better in small, and much worse in big local governments.
What do people think about the results of local government activities? As it wasshown in the “public perception” study in June 1993, the number of those who believedthat it led to positive results minimally outnumbered those who did not. The numberof positive opinions strongly prevailed in rural communities but only marginally incities of less than 100,000. In the largest agglomerations, the trend was definitely negative.
In 2001 [CBOS, February 2001] along with the general decline of public opinionsin Poland, satisfaction with local government activity was also much lower. The numberof negative answers for the question: “Are you satisfied with how local government isfunctioning” outscored the positive opinions. However, as it is illustrated in Figure5.4, this negative attitude was much stronger in larger, rather than in smaller,communities. In rural communities, the number of negative answers was 42% withalmost the same number (39%) of positive opinions. In cities over 100,000, the numberof negative answers was almost twice as many as the number of positive. This is despitethe fact that, in the same year [CBOS, November 2001], overall opinions in big cities,about the political changes after 1989, were much more positive. In rural communities,the present political system is considered better than before 1989—but only by 35%of respondents. In cities, the numbers satisfied with a change varies from 47% in citiesbelow 20,000 to 71% in cities over 500,000.
What is the Variation in the Satisfaction With Individual Services?In 1999, over 3,000 citizens and over 600 small business local entrepreneurs wereasked about their satisfaction with the client service at their city hall [see Swianiewicz,2000]. The level of satisfaction was much higher in rural governments than in cities ofover 100,000.
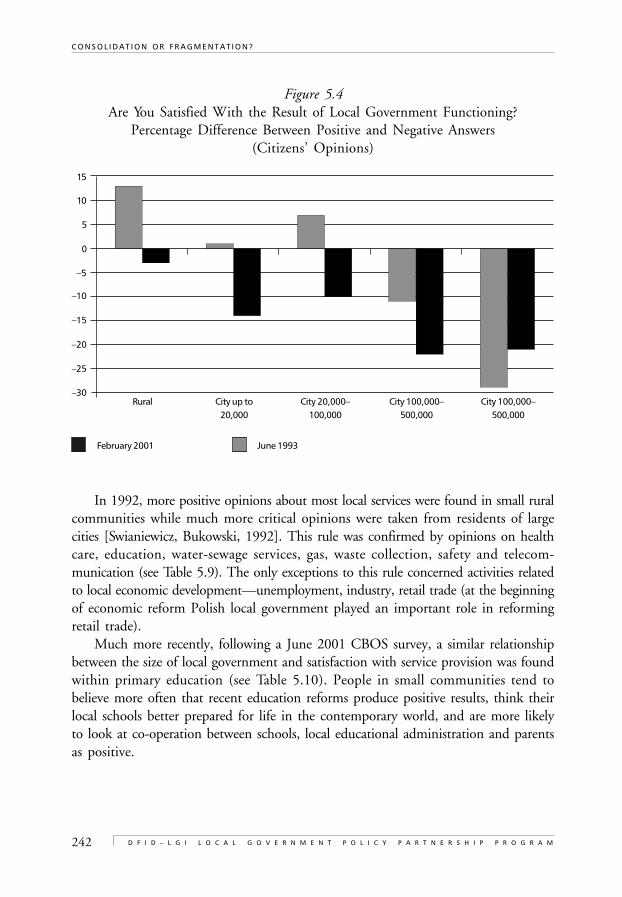
242
C O N S O L I D A T I O N O R F R A G M E N T A T I O N ?
D F I D – L G I L O C A L G O V E R N M E N T P O L I C Y P A R T N E R S H I P P R O G R A M
Figure 5.4Are You Satisfied With the Result of Local Government Functioning?
Percentage Difference Between Positive and Negative Answers(Citizens’ Opinions)
In 1992, more positive opinions about most local services were found in small ruralcommunities while much more critical opinions were taken from residents of largecities [Swianiewicz, Bukowski, 1992]. This rule was confirmed by opinions on healthcare, education, water-sewage services, gas, waste collection, safety and telecom-munication (see Table 5.9). The only exceptions to this rule concerned activities relatedto local economic development—unemployment, industry, retail trade (at the beginningof economic reform Polish local government played an important role in reformingretail trade).
Much more recently, following a June 2001 CBOS survey, a similar relationshipbetween the size of local government and satisfaction with service provision was foundwithin primary education (see Table 5.10). People in small communities tend tobelieve more often that recent education reforms produce positive results, think theirlocal schools better prepared for life in the contemporary world, and are more likelyto look at co-operation between schools, local educational administration and parentsas positive.
15
10
5
0
–5
–10
–15
–20
–25
–30Rural City up to
20,000City 20,000–
100,000City 100,000–
500,000City 100,000–
500,000
February 2001 June 1993
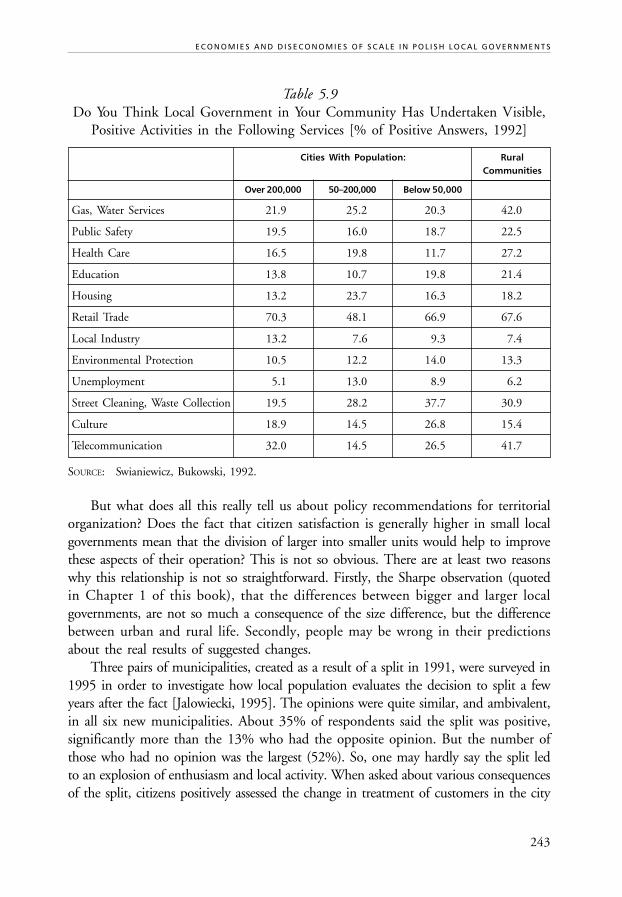
243
E C O N O M I E S A N D D I S E C O N O M I E S O F S C A L E I N P O L I S H L O C A L G O V E R N M E N T S
Table 5.9Do You Think Local Government in Your Community Has Undertaken Visible,
Positive Activities in the Following Services [% of Positive Answers, 1992]
Cities With Population: RuralCommunities
Over 200,000 50–200,000 Below 50,000
Gas, Water Services 21.9 25.2 20.3 42.0
Public Safety 19.5 16.0 18.7 22.5
Health Care 16.5 19.8 11.7 27.2
Education 13.8 10.7 19.8 21.4
Housing 13.2 23.7 16.3 18.2
Retail Trade 70.3 48.1 66.9 67.6
Local Industry 13.2 7.6 9.3 7.4
Environmental Protection 10.5 12.2 14.0 13.3
Unemployment 5.1 13.0 8.9 6.2
Street Cleaning, Waste Collection 19.5 28.2 37.7 30.9
Culture 18.9 14.5 26.8 15.4
Telecommunication 32.0 14.5 26.5 41.7
SOURCE: Swianiewicz, Bukowski, 1992.
But what does all this really tell us about policy recommendations for territorialorganization? Does the fact that citizen satisfaction is generally higher in small localgovernments mean that the division of larger into smaller units would help to improvethese aspects of their operation? This is not so obvious. There are at least two reasonswhy this relationship is not so straightforward. Firstly, the Sharpe observation (quotedin Chapter 1 of this book), that the differences between bigger and larger localgovernments, are not so much a consequence of the size difference, but the differencebetween urban and rural life. Secondly, people may be wrong in their predictionsabout the real results of suggested changes.
Three pairs of municipalities, created as a result of a split in 1991, were surveyed in1995 in order to investigate how local population evaluates the decision to split a fewyears after the fact [Jalowiecki, 1995]. The opinions were quite similar, and ambivalent,in all six new municipalities. About 35% of respondents said the split was positive,significantly more than the 13% who had the opposite opinion. But the number ofthose who had no opinion was the largest (52%). So, one may hardly say the split ledto an explosion of enthusiasm and local activity. When asked about various consequencesof the split, citizens positively assessed the change in treatment of customers in the city
244
C O N S O L I D A T I O N O R F R A G M E N T A T I O N ?
D F I D – L G I L O C A L G O V E R N M E N T P O L I C Y P A R T N E R S H I P P R O G R A M
hall, in education, and cleaning services. At the same time, most the respondents saidthe division of the municipality had a negative impact on economic development.
Table 5.10Satisfaction With Local Primary School Functions (2000)
Schools Work Schools Co- Schools Prepare Schools Prepare Schools PrepareBetter than Operate With Pupils for Pupils to Become Pupils to DealBefore the Parents Family Life Active in Their With Various
Reform Social Environ- Contemporaryment Problems
Yes No Yes No Yes No Yes No Yes No
Rural Community
Cities: 21 35 77 14 46 38 40 42 40 46
Below 20,000 15 43 61 31 42 48 31 58 28 60
20–100,000 20 39 67 23 32 52 30 53 34 54
100–500,000 15 33 68 21 30 59 37 48 30 56
Over 500,000 16 45 52 41 25 63 29 62 26 67
SOURCE: CBOS survey, June 2001.
Citizens surveyed thought that the most important reason for the split was theambition of local politicians. According to average respondents, it was politicians andlocal political parties who really initiated the split. In some cases, citizens of ruralvillages were seen among initiators as well but citizens in the cities played no active rolein the decision on split.
Among the positive consequences of the division, they mentioned fairer allocationof financial resources between the geographical parts of the former municipality. Butthey also agreed the costs of local government administration and of local service deliveryincreased after the split. Surprisingly, only in 4 (out of 6) new municipalities didcitizens think that the split helped to reduce number of conflicts in local communities.
The last observation on splitting local governments, yet it not necessarily resultingin reduced number of conflicts, leads us to the question of political representation.
According to a 1993 CBOS survey, most people believe that local councils representthe interests of ordinary citizens. Again, more positive opinions are found amongrespondents from small local communities [see Swianiewicz, 2001].
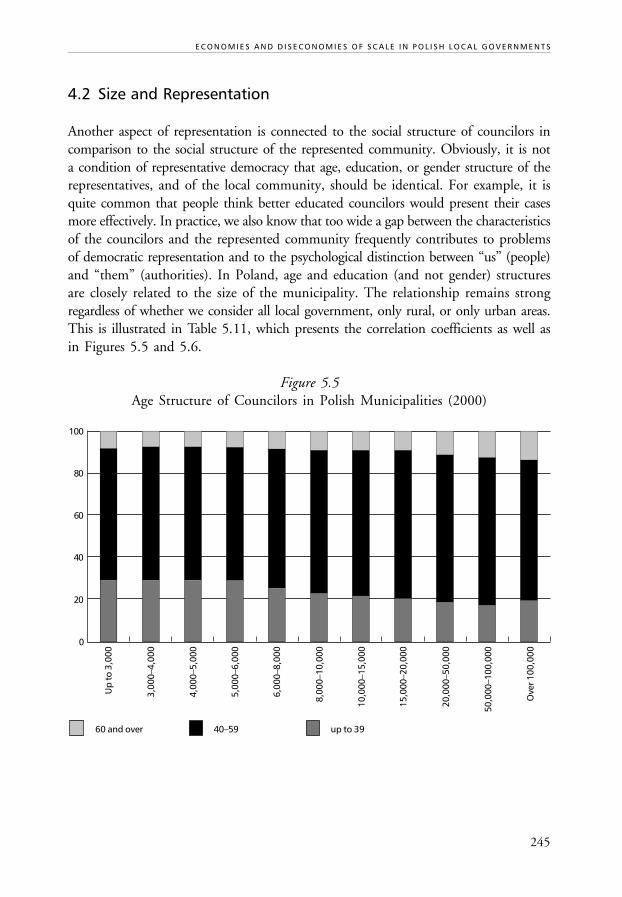
245
E C O N O M I E S A N D D I S E C O N O M I E S O F S C A L E I N P O L I S H L O C A L G O V E R N M E N T S
4.2 Size and Representation
Another aspect of representation is connected to the social structure of councilors incomparison to the social structure of the represented community. Obviously, it is nota condition of representative democracy that age, education, or gender structure of therepresentatives, and of the local community, should be identical. For example, it isquite common that people think better educated councilors would present their casesmore effectively. In practice, we also know that too wide a gap between the characteristicsof the councilors and the represented community frequently contributes to problemsof democratic representation and to the psychological distinction between “us” (people)and “them” (authorities). In Poland, age and education (and not gender) structuresare closely related to the size of the municipality. The relationship remains strongregardless of whether we consider all local government, only rural, or only urban areas.This is illustrated in Table 5.11, which presents the correlation coefficients as well asin Figures 5.5 and 5.6.
Figure 5.5Age Structure of Councilors in Polish Municipalities (2000)
60 and over 40–59
Up
to 3
,000
3,00
0–4,
000
4,00
0–5,
000
5,00
0–6,
000
6,00
0–8,
000
8,00
0–10
,000
10,0
00–1
5,00
0
15,0
00–2
0,00
0
20,0
00–5
0,00
0
50,0
00–1
00,0
00
Ove
r 100
,000
up to 39
100
80
60
40
20
0
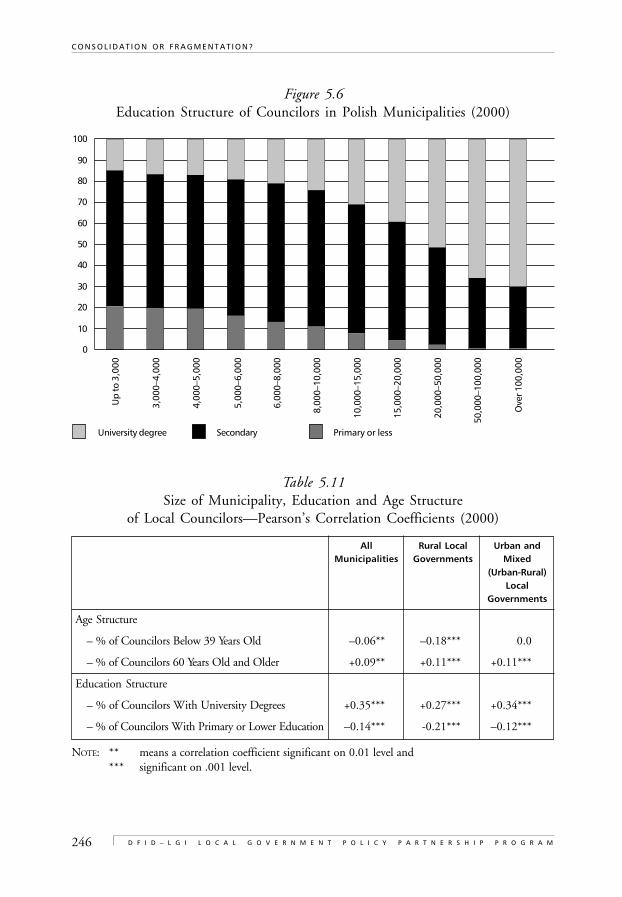
246
C O N S O L I D A T I O N O R F R A G M E N T A T I O N ?
D F I D – L G I L O C A L G O V E R N M E N T P O L I C Y P A R T N E R S H I P P R O G R A M
Figure 5.6Education Structure of Councilors in Polish Municipalities (2000)
Table 5.11Size of Municipality, Education and Age Structure
of Local Councilors—Pearson’s Correlation Coefficients (2000)
All Rural Local Urban andMunicipalities Governments Mixed
(Urban-Rural)Local
Governments
Age Structure
– % of Councilors Below 39 Years Old –0.06** –0.18*** 0.0
– % of Councilors 60 Years Old and Older +0.09** +0.11*** +0.11***
Education Structure
– % of Councilors With University Degrees +0.35*** +0.27*** +0.34***
– % of Councilors With Primary or Lower Education –0.14*** -0.21*** –0.12***
NOTE: ** means a correlation coefficient significant on 0.01 level and*** significant on .001 level.
100
80
60
40
20
0
90
70
50
30
10
Up
to 3
,000
3,00
0–4,
000
4,00
0–5,
000
5,00
0–6,
000
6,00
0–8,
000
8,00
0–10
,000
10,0
00–1
5,00
0
15,0
00–2
0,00
0
20,0
00–5
0,00
0
50,0
00–1
00,0
00
Ove
r 100
,000
University degree Secondary Primary or less
247
E C O N O M I E S A N D D I S E C O N O M I E S O F S C A L E I N P O L I S H L O C A L G O V E R N M E N T S
Councilors in small communities are usually much younger. In tiny rural govern-ments with populations below 4,000, the proportion of councilors who are less than39 years is over 30%. In large rural municipalities (over 10,000), it is usually about20%. In instances of councilors who are 60 years old or over, the average proportion inurban governments varies from about 6% in towns with less than 5,000 population toover 13% in cities over 100,000. A similar variation may be found in rural localgovernments.
The difference between large and small is even more pronounced in the case ofeducational structure. In cities over 20,000, the proportion of councilors with universitydegrees exceeds 50% (in cities over 100,000 it is even over 70%). While, in townsbelow 10,000, this number is below 30%. In rural municipalities, the proportionvaries from slightly less than 14% in municipalities below 3,000 to over 25% in localgovernments with populations over 10,000. In contrast, the proportion of councilorswith primary or lower education varies from over 20%, in rural communities under4,000, to about 7%, in rural communities over 15,000. In cities, it is between almost10% in towns below 5,000 to less than 1% in cities over 50,000.
Obviously, both the age and educational structure of the whole population variessignificantly between small rural and large urban communities. However, the variationin social structure for councilors is much larger than that of the whole population. Forexample, the educational structure for the population in small and large ruralgovernments is almost identical. Yet, the structure of councilors’ education varies rathersignificantly. This means size matters. Younger and less educated people have a muchbetter chance of becoming local representatives in smaller local governments than theydo in larger ones. Consequently, the distance between the social structure of a localpopulation and their representatives is much more narrow in smaller municipalities.
Some authors argue that there are more interest groups in larger municipalitiesthat try to express their opinions and this leads to more pluralist politics. Such a thesishas been formulated by T.N. Clark on the basis of statistical analysis of local politics inAmerican cities [Clark, 1967]. Is this true of Polish local governments? We can try tomeasure pluralism in local politics by an imperfect, but significant, indicator-numberof candidates competing for a given seat in the local council. In 19948 this ratio wassignificantly related to the size of municipality. As it is presented on Figure 5.7, thenumber of candidates was much larger in big cities than in small communities. Theaverage ratio differed from below 3 candidates in local governments below 10,000 toalmost 9 in cities over 100,000. The correlation coefficient between number of candidatesand the size of governments was very high (+0.63). It also remained significant for therural and urban governments analyzed separately, although it was much higher inthe cities (+0.09 in rural areas and +0.64 in urban governments). We can concludethat this prediction of the reform theory has been proved in Poland—there is more
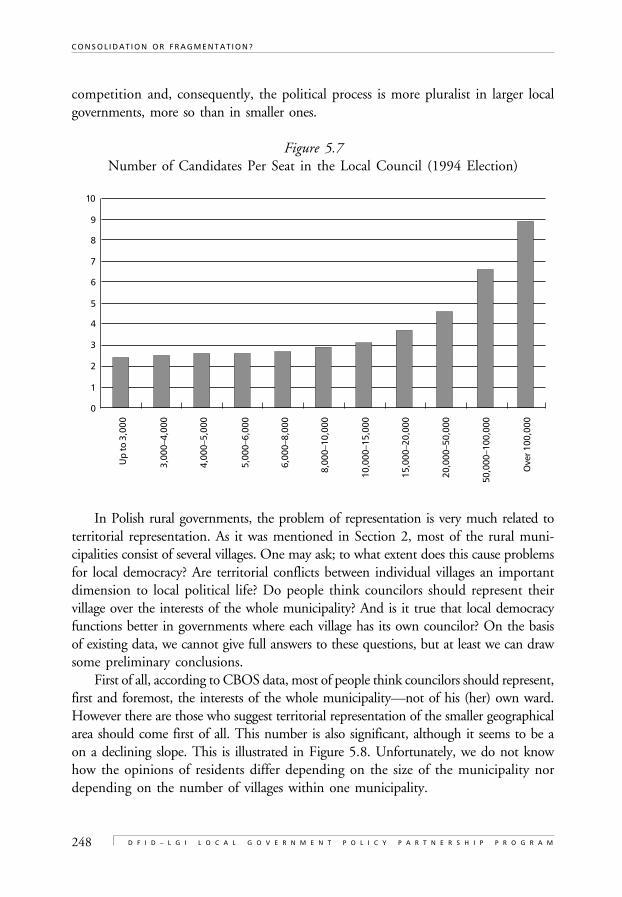
248
C O N S O L I D A T I O N O R F R A G M E N T A T I O N ?
D F I D – L G I L O C A L G O V E R N M E N T P O L I C Y P A R T N E R S H I P P R O G R A M
competition and, consequently, the political process is more pluralist in larger localgovernments, more so than in smaller ones.
Figure 5.7Number of Candidates Per Seat in the Local Council (1994 Election)
In Polish rural governments, the problem of representation is very much related toterritorial representation. As it was mentioned in Section 2, most of the rural muni-cipalities consist of several villages. One may ask; to what extent does this cause problemsfor local democracy? Are territorial conflicts between individual villages an importantdimension to local political life? Do people think councilors should represent theirvillage over the interests of the whole municipality? And is it true that local democracyfunctions better in governments where each village has its own councilor? On the basisof existing data, we cannot give full answers to these questions, but at least we can drawsome preliminary conclusions.
First of all, according to CBOS data, most of people think councilors should represent,first and foremost, the interests of the whole municipality—not of his (her) own ward.However there are those who suggest territorial representation of the smaller geographicalarea should come first of all. This number is also significant, although it seems to be aon a declining slope. This is illustrated in Figure 5.8. Unfortunately, we do not knowhow the opinions of residents differ depending on the size of the municipality nordepending on the number of villages within one municipality.
10
8
6
4
2
0
9
7
5
3
1
Up
to 3
,000
3,00
0–4,
000
4,00
0–5,
000
5,00
0–6,
000
6,00
0–8,
000
8,00
0–10
,000
10,0
00–1
5,00
0
15,0
00–2
0,00
0
20,0
00–5
0,00
0
50,0
00–1
00,0
00
Ove
r 100
,000
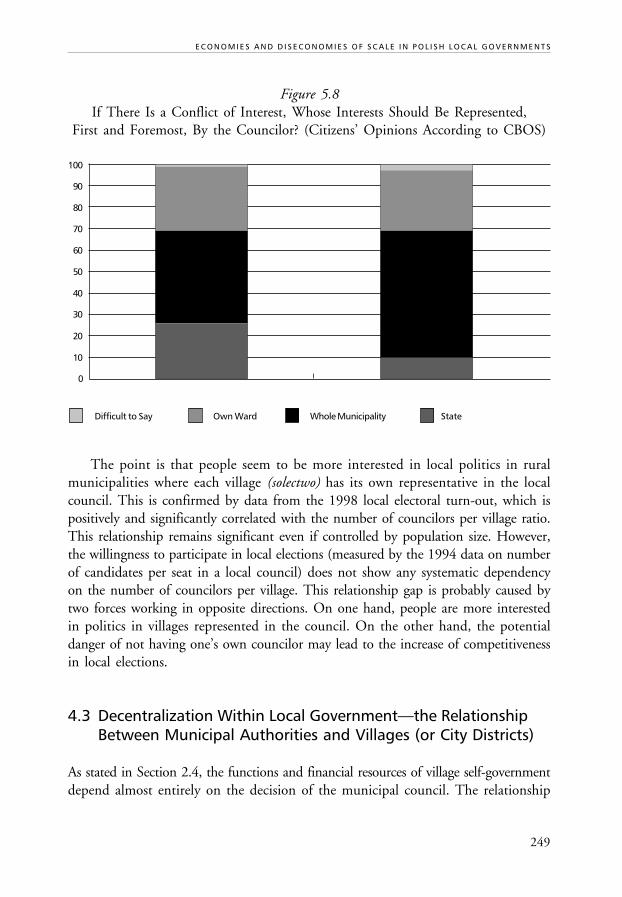
249
E C O N O M I E S A N D D I S E C O N O M I E S O F S C A L E I N P O L I S H L O C A L G O V E R N M E N T S
Figure 5.8If There Is a Conflict of Interest, Whose Interests Should Be Represented,
First and Foremost, By the Councilor? (Citizens' Opinions According to CBOS)
The point is that people seem to be more interested in local politics in ruralmunicipalities where each village (solectwo) has its own representative in the localcouncil. This is confirmed by data from the 1998 local electoral turn-out, which ispositively and significantly correlated with the number of councilors per village ratio.This relationship remains significant even if controlled by population size. However,the willingness to participate in local elections (measured by the 1994 data on numberof candidates per seat in a local council) does not show any systematic dependencyon the number of councilors per village. This relationship gap is probably caused bytwo forces working in opposite directions. On one hand, people are more interestedin politics in villages represented in the council. On the other hand, the potentialdanger of not having one’s own councilor may lead to the increase of competitivenessin local elections.
4.3 Decentralization Within Local Government—the RelationshipBetween Municipal Authorities and Villages (or City Districts)
As stated in Section 2.4, the functions and financial resources of village self-governmentdepend almost entirely on the decision of the municipal council. The relationship
100
80
60
40
20
0
90
70
50
30
10
Difficult to Say Own Ward Whole Municipality State
250
C O N S O L I D A T I O N O R F R A G M E N T A T I O N ?
D F I D – L G I L O C A L G O V E R N M E N T P O L I C Y P A R T N E R S H I P P R O G R A M
between the municipality and villages (or districts in urban governments) is not alwayssmooth and straightforward.
The large size of Polish municipalities, especially considering that rural communitiesconsist of several villages, brings forth the question of territorial representation. Is there areal danger that the largest settlement unit may dominate the decision making, leadingto financial and economic development policies biased in favor of the central town orvillage? In regards to this question, we have no systematic observations. Availableinformation suggests this is very unlikely to happen. As it is argued later in this section,village leaders do not see territorial conflicts as important dimension of local politics.The electoral system in the vast majority of multi-settlement municipalities is based onone-councilor wards. So, each part of the municipality has its own councilor. Such asystem prevents the danger of domination by the largest town/village in the council.Available data also suggests that, in most municipalities, allocation of resources amonggeographical parts of the municipality is usually more or less proportional to need andthe populations living in these parts. Let’s briefly analyze the case of Goldap municipality,a typical example of a mixed urban-rural municipality. It consists of the town of Goldap(inhabited by about 70% of the whole municipality) and several small villages nearby(with remaining 30% of population). In 2001, about 75% of capital spending wasrelated to investments implemented in the town and about 25% of spending went toprojects in the surrounding villages [Miros, 2002]. This means, the proportion percapita spending in the town was not substantially different from the percentage oftown population to the total population of local government.
This does not mean that operation of multi-settlement local governments is idealand problem free. Research conducted on the small urban-rural local government ofDukla shows that citizens, as well as local leaders in individual villages, concentratemostly on the problems in their village, and very rarely do they have common interestsand issues concerning the whole local government unit [Mielczarek, Domanska, 1999].Local political life and discussions among councilors are very often organized aroundbargain sessions as to which village should get the next investment funds and themeaning of the individual projects, relating to the overall local government strategy, isvery often overlooked. All the same, the final result of this process is usually a relativelybalanced allocation of resources between geographical sections of the local government,not a domination of one town or village.
However, according to village leaders9 surveyed in December 2001,10 territorialconflicts between individual villages are not seen as frequent occurrences. Only 19%of respondents said these conflicts are important, while much more often thesignificance of other types of conflicts that was indicated. The most common conflict,according to village leaders, is the conflict between “us” and “them”, i.e. betweengroups of citizens and local bureaucrats (41% indicate this as important). This wasfollowed by conflicts between occupational groups (for example, farmers and the non-
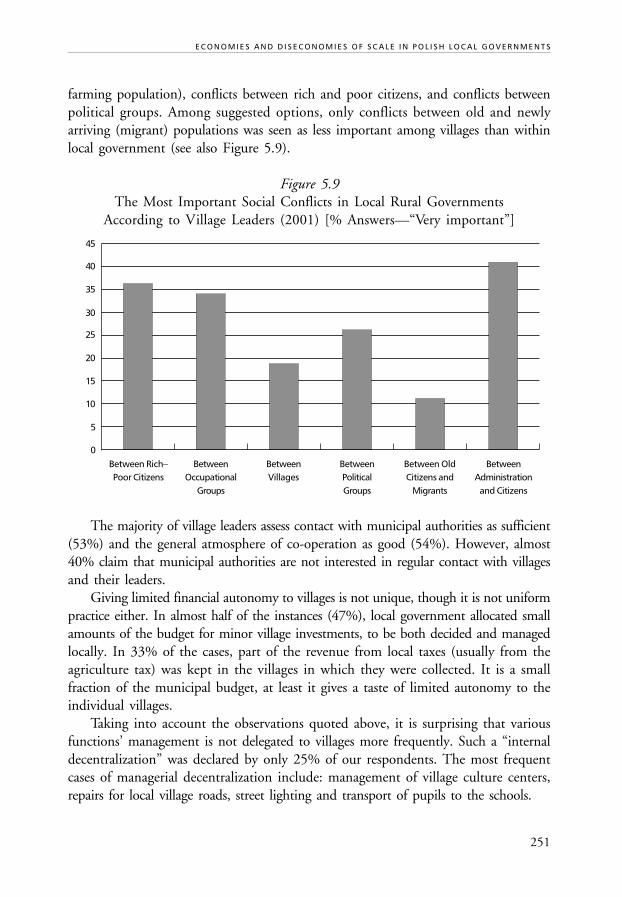
251
E C O N O M I E S A N D D I S E C O N O M I E S O F S C A L E I N P O L I S H L O C A L G O V E R N M E N T S
farming population), conflicts between rich and poor citizens, and conflicts betweenpolitical groups. Among suggested options, only conflicts between old and newlyarriving (migrant) populations was seen as less important among villages than withinlocal government (see also Figure 5.9).
Figure 5.9The Most Important Social Conflicts in Local Rural Governments
According to Village Leaders (2001) [% Answers—“Very important”]
The majority of village leaders assess contact with municipal authorities as sufficient(53%) and the general atmosphere of co-operation as good (54%). However, almost40% claim that municipal authorities are not interested in regular contact with villagesand their leaders.
Giving limited financial autonomy to villages is not unique, though it is not uniformpractice either. In almost half of the instances (47%), local government allocated smallamounts of the budget for minor village investments, to be both decided and managedlocally. In 33% of the cases, part of the revenue from local taxes (usually from theagriculture tax) was kept in the villages in which they were collected. It is a smallfraction of the municipal budget, at least it gives a taste of limited autonomy to theindividual villages.
Taking into account the observations quoted above, it is surprising that variousfunctions’ management is not delegated to villages more frequently. Such a “internaldecentralization” was declared by only 25% of our respondents. The most frequentcases of managerial decentralization include: management of village culture centers,repairs for local village roads, street lighting and transport of pupils to the schools.
45
35
20
10
0
40
30
15
5
25
Between Rich–Poor Citizens
BetweenOccupational
Groups
BetweenVillages
BetweenPoliticalGroups
Between OldCitizens and
Migrants
BetweenAdministrationand Citizens
252
C O N S O L I D A T I O N O R F R A G M E N T A T I O N ?
D F I D – L G I L O C A L G O V E R N M E N T P O L I C Y P A R T N E R S H I P P R O G R A M
We can also provide some innovative examples of more radical decentralizationwithin local government. In one rural municipality [Zell, 2001b], each village receivesa portion of revenues from the property tax and agriculture tax collected within itsterritory. They can also keep the revenue from rental of village municipal property.Villages in that gmina are responsible for the maintenance of sport-grounds, of some oflocal roads and bus stops. They also support local kindergartens and primary schools.
A very good example of far-reaching decentralization in rural areas is the ruralgmina of Brzeg in the Opole region. It has decided to transfer part of its communalproperty to individual villages [Zell, 2001a]. Villages in this gmina are allowed to keepa part of local budget revenues (plus, 100% of the agriculture tax), and are responsiblefor some services such as transport of their children to the local schools, local streetlighting and maintenance of local roads. They have also their own (although verylimited) investment budget, which is spent according to the agreed village priorities.
Our survey sought to verify the hypothesis that larger municipalities, and muni-cipalities with the most villages, facilitate more intense territorial conflicts and thecontact between municipal authorities and individual village leaders is much worse.
However, this hypothesis has not been confirmed by the empirical data from oursurvey. The first analysis has even suggested the opposite to this casual relationship.The correlation between population, size of local government, and intensity of contactsis positive (+0.151**)11 and even stronger (+0.180***) concerning the atmosphere ofthis co-operation. Bigger municipalities are also more willing to leave some resourcesfor village investment (correlation +0.213***) and leave revenues from some local taxes(+0.188***). The number of villages in a municipality proved to be statistically in-significant. However, this result is biased by the presence of mixed urban-rural localgovernments in our sample. They are usually larger (in terms of population) and moreaware of the necessity to decentralize and maintain good contact with village leaders.
The picture changes if we separate the sub-group of “pure” rural local governments.In larger local governments, the intensity of conflicts is larger. Perhaps this is becausethey are more internally diversified. Interestingly enough, it affects rich vs. poor andpolitical groups’ conflicts much more than territorial conflicts between villages. Inlarger rural governments (both in terms of number of villages and total populationsize), contact with village leaders is much more frequent–perhaps they are seen as moreimportant within larger municipalities. On the other hand, bigger rural governmentsare less willing to decentralize their finances (correlation of receiving resources for villageinvestments with population number is –0.191** and with the number of villages—0.153**).
There is another variable that helps to reduce the intensity of conflicts and improvethe atmosphere of co-operation between municipal authorities and village leaders. Thisis financial affluence. In general, local authorities with more money (in per capitaterms) are more often able to construct successful co-operation and function without
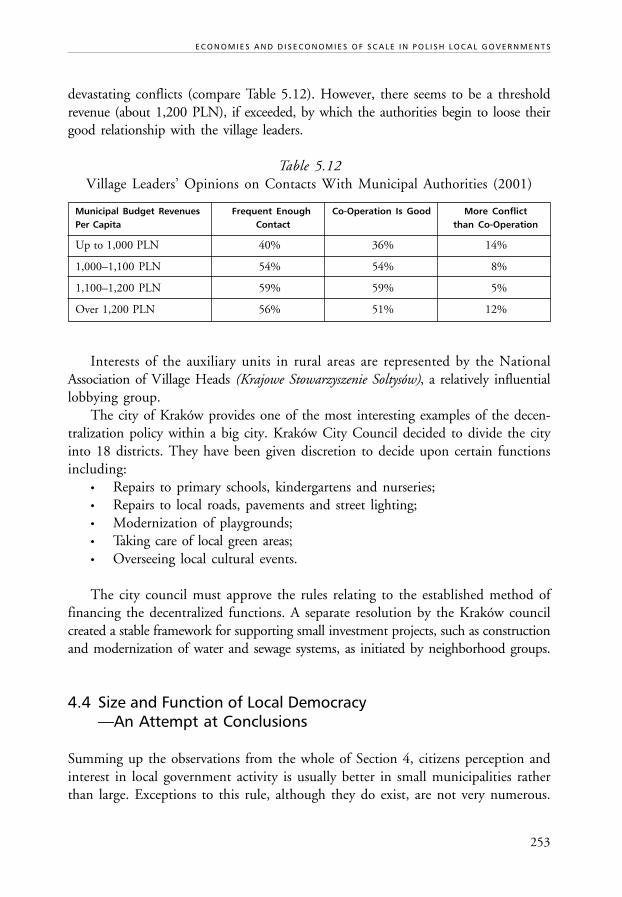
253
E C O N O M I E S A N D D I S E C O N O M I E S O F S C A L E I N P O L I S H L O C A L G O V E R N M E N T S
devastating conflicts (compare Table 5.12). However, there seems to be a thresholdrevenue (about 1,200 PLN), if exceeded, by which the authorities begin to loose theirgood relationship with the village leaders.
Table 5.12Village Leaders’ Opinions on Contacts With Municipal Authorities (2001)
Municipal Budget Revenues Frequent Enough Co-Operation Is Good More ConflictPer Capita Contact than Co-Operation
Up to 1,000 PLN 40% 36% 14%
1,000–1,100 PLN 54% 54% 8%
1,100–1,200 PLN 59% 59% 5%
Over 1,200 PLN 56% 51% 12%
Interests of the auxiliary units in rural areas are represented by the NationalAssociation of Village Heads (Krajowe Stowarzyszenie Soltysów), a relatively influentiallobbying group.
The city of Kraków provides one of the most interesting examples of the decen-tralization policy within a big city. Kraków City Council decided to divide the cityinto 18 districts. They have been given discretion to decide upon certain functionsincluding:
• Repairs to primary schools, kindergartens and nurseries;• Repairs to local roads, pavements and street lighting;• Modernization of playgrounds;• Taking care of local green areas;• Overseeing local cultural events.
The city council must approve the rules relating to the established method offinancing the decentralized functions. A separate resolution by the Kraków councilcreated a stable framework for supporting small investment projects, such as constructionand modernization of water and sewage systems, as initiated by neighborhood groups.
4.4 Size and Function of Local Democracy—An Attempt at Conclusions
Summing up the observations from the whole of Section 4, citizens perception andinterest in local government activity is usually better in small municipalities ratherthan large. Exceptions to this rule, although they do exist, are not very numerous.
254
C O N S O L I D A T I O N O R F R A G M E N T A T I O N ?
D F I D – L G I L O C A L G O V E R N M E N T P O L I C Y P A R T N E R S H I P P R O G R A M
Citizens in small municipalities are more interested in local policy issues, and bettercommunicate with local authorities. They also trust their authorities more and aremore satisfied with local service delivery. They also feel better represented by localcouncilors than residents in big cities. The nature of the sociological data available issuch that we can usually only make conclusions about the differences between ruraland urban areas and between small and big cities. Therefore, we cannot be sure to whatextent a discovered relationship tells us anything about the impact of size itself and towhat extent, about the difference between urban and rural life, and/or about thedifference between life in a small urban town and big city. Yet, the rare cases where wewere able to analyze the impact of size directly (for example, through analysis of voterturn-out, mayoral opinions about citizens interest in local politics, mayoral turn-over,education and age structure for councilors) suggest that size does matter–not only arethere statistically significant differences between rural and urban settlements, but alsobetween small and big rural municipalities.
Nevertheless, drawing the conclusion that, by dividing a municipality, one mayincrease the levels of trust, satisfaction with local government activity or willingness tobe active in local public affairs would be a simplification. The story of 23 mixed urban-rural communes that split in 1991 is very telling [see Jalowiecki, 1995]. As mentionedin Section 4.1, available analysis suggests that, the number of citizens satisfied by asplit, years after the event, outscores the number of those who think it was betterbefore the split. Even so, the number of those indifferent is much larger still. Also theperceived negative consequences are as numerous as the positive feedback on theorganizational change.
The pressure to split was more frequent in municipalities with less than averageaffluence–one may speculate that lack of satisfaction of needs, stimulates mutualcomplaints and tensions between the city and rural villages. But did the split lead topolicies which would better reflect local preferences? It seems that, in the case of taxpolicies and allocation of sector spending, this has been true to large extent. Taxpolicies in new municipalities have been significantly different. For newly created citygovernments, tax policies usually have concentrated on stimulation of economic activity(average tax rates quite high, but with tax incentives for preferred economic activities)while in new rural municipalities, they have been closer to the populist model withreduced tax rates for the majority of voters but high rates for local enterprises. Also,resource allocation between sectors was considerably different in newly created urbanand rural governments. It is very difficult to reach a final conclusion about the impactof splitting to local democracy. Then again, most of residents had ambivalent feelingsfor a few years after the split. They also thought the change was initiated and workedto the favor of local politicians and their ambitions and it is very hard to find anyevidence of increased of activity within the local community. Yet again, the number ofsatisfied citizens was larger than the number of clearly disappointed citizens and
255
E C O N O M I E S A N D D I S E C O N O M I E S O F S C A L E I N P O L I S H L O C A L G O V E R N M E N T S
observation of local policy changes suggest they began to reflect the variation in localpreferences more closely.
5. SIZE OF LOCAL GOVERNMENT AND ALLOCATIONOF FUNCTIONS BETWEEN TIERS OF GOVERNMENT
It is frequently argued that large local governments can be responsible for a wider scopeof functions. On an empirical basis, such a thesis has been supported by Page andGoldsmith (1987) in their comparative study of the European local government system,quoted already in Chapter 1. Consequently, larger local government units allow formore radical decentralization. This claim seems to be confirmed by Polish data; bycitizen and leader perception as well as by the actual behavior of small local governments,which are more afraid of new functions.
As it has been reported in the “Public Perception of Local Governments” study[Swianiewicz, 2001], several proofs indicate that general support for transferring morefunctions to local governments in Poland has been greater in big cities than in smalltowns or rural communities. These variations by community size probably have twoparallel explanations. The first is rooted in the empirical observation that small localgovernments are not prepared to deliver a wide range of functions. They usually do nothave enough qualified staff, the majority of users of some services recruit from morethan one local government, and the delivery of many functions by small territorialunits would lead to diseconomies of scale. These are all arguments discussed elsewherein this chapter and sociological surveys seem to confirm that many people are aware ofthese difficulties. This is so, despite citizens of small towns and villages being of a verygood opinion about their local governments’ present activities.
The second reason might be of a political nature. Since at least 1993, the PSL(Peasant’s Party) has been strongly opposed to many decentralization reforms, includingany transferring of responsibility for primary schools to municipal governments. ThePSL influence is strongest in small, rural communities. This means that respondents’skepticism may partially reflect the opinions of their political leaders. However, onemay argue that it is exactly the political base of PSL, in small and relatively weak localgovernments, which makes this party oppose some decentralization reforms.
The same pattern of variation has been reflected in the actual decisions made bylocal governments. Before 1996, when accepting responsibility for schools was voluntary,“brave decisions” were much more frequent in larger units. This correlation wasespecially visible at the beginning of decentralization reform (1991–1992), whenresponsibility for schools was accepted by less than 10% of rural communities but byover 33% of cities over 100,000 residents. Also, in 1994, a total of 21% rural municipal
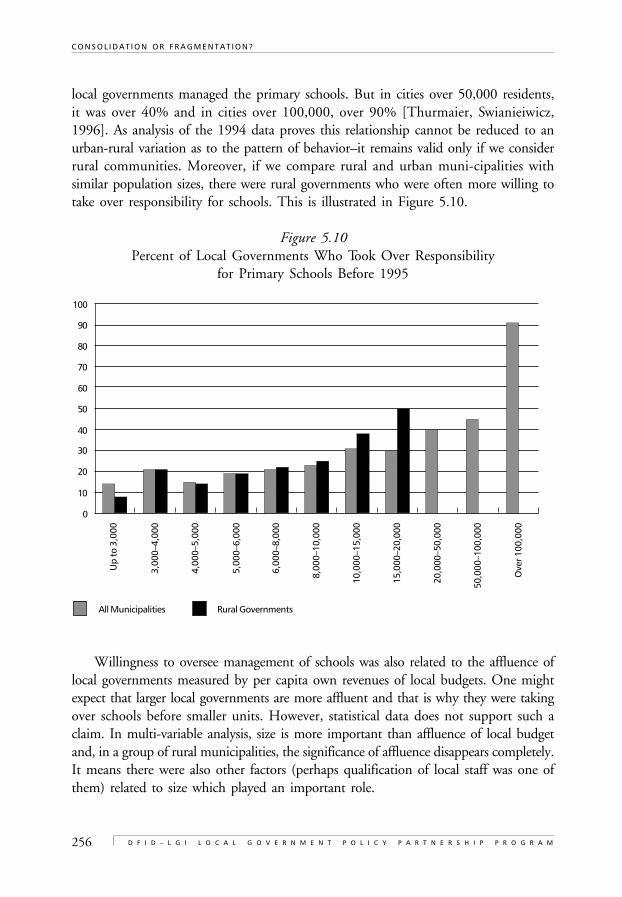
256
C O N S O L I D A T I O N O R F R A G M E N T A T I O N ?
D F I D – L G I L O C A L G O V E R N M E N T P O L I C Y P A R T N E R S H I P P R O G R A M
local governments managed the primary schools. But in cities over 50,000 residents,it was over 40% and in cities over 100,000, over 90% [Thurmaier, Swianieiwicz,1996]. As analysis of the 1994 data proves this relationship cannot be reduced to anurban-rural variation as to the pattern of behavior–it remains valid only if we considerrural communities. Moreover, if we compare rural and urban muni-cipalities withsimilar population sizes, there were rural governments who were often more willing totake over responsibility for schools. This is illustrated in Figure 5.10.
Figure 5.10Percent of Local Governments Who Took Over Responsibility
for Primary Schools Before 1995
Willingness to oversee management of schools was also related to the affluence oflocal governments measured by per capita own revenues of local budgets. One mightexpect that larger local governments are more affluent and that is why they were takingover schools before smaller units. However, statistical data does not support such aclaim. In multi-variable analysis, size is more important than affluence of local budgetand, in a group of rural municipalities, the significance of affluence disappears completely.It means there were also other factors (perhaps qualification of local staff was one ofthem) related to size which played an important role.
Up
to 3
,000
3,00
0–4,
000
4,00
0–5,
000
5,00
0–6,
000
6,00
0–8,
000
8,00
0–10
,000
10,0
00–1
5,00
0
15,0
00–2
0,00
0
20,0
00–5
0,00
0
50,0
00–1
00,0
00
Ove
r 100
,000
100
80
60
40
20
0
90
70
50
30
10
All Municipalities Rural Governments
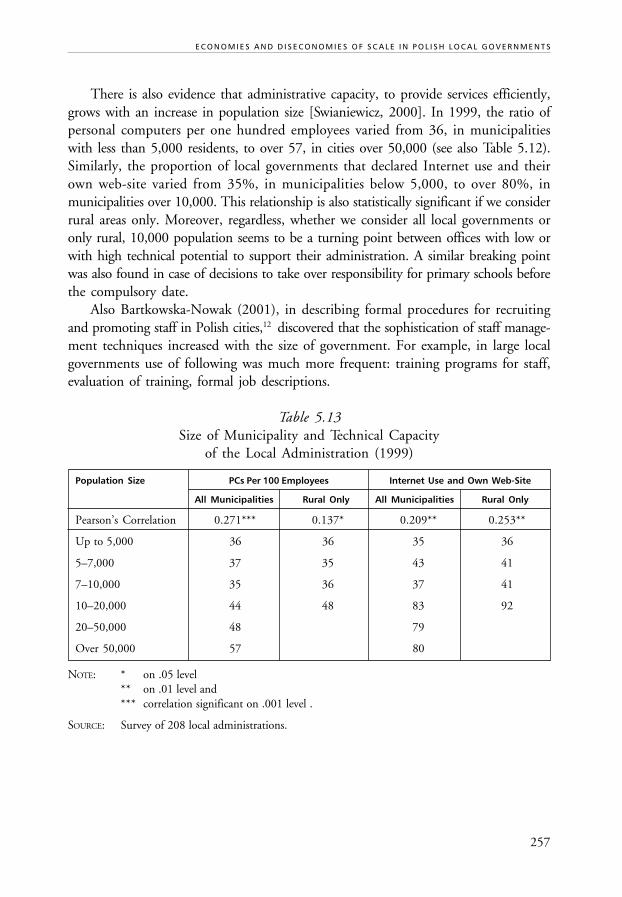
257
E C O N O M I E S A N D D I S E C O N O M I E S O F S C A L E I N P O L I S H L O C A L G O V E R N M E N T S
There is also evidence that administrative capacity, to provide services efficiently,grows with an increase in population size [Swianiewicz, 2000]. In 1999, the ratio ofpersonal computers per one hundred employees varied from 36, in municipalitieswith less than 5,000 residents, to over 57, in cities over 50,000 (see also Table 5.12).Similarly, the proportion of local governments that declared Internet use and theirown web-site varied from 35%, in municipalities below 5,000, to over 80%, inmunicipalities over 10,000. This relationship is also statistically significant if we considerrural areas only. Moreover, regardless, whether we consider all local governments oronly rural, 10,000 population seems to be a turning point between offices with low orwith high technical potential to support their administration. A similar breaking pointwas also found in case of decisions to take over responsibility for primary schools beforethe compulsory date.
Also Bartkowska-Nowak (2001), in describing formal procedures for recruitingand promoting staff in Polish cities,12 discovered that the sophistication of staff manage-ment techniques increased with the size of government. For example, in large localgovernments use of following was much more frequent: training programs for staff,evaluation of training, formal job descriptions.
Table 5.13Size of Municipality and Technical Capacity
of the Local Administration (1999)
Population Size PCs Per 100 Employees Internet Use and Own Web-Site
All Municipalities Rural Only All Municipalities Rural Only
Pearson’s Correlation 0.271*** 0.137* 0.209** 0.253**
Up to 5,000 36 36 35 36
5–7,000 37 35 43 41
7–10,000 35 36 37 41
10–20,000 44 48 83 92
20–50,000 48 79
Over 50,000 57 80
NOTE: * on .05 level** on .01 level and*** correlation significant on .001 level .
SOURCE: Survey of 208 local administrations.
258
C O N S O L I D A T I O N O R F R A G M E N T A T I O N ?
D F I D – L G I L O C A L G O V E R N M E N T P O L I C Y P A R T N E R S H I P P R O G R A M
6. SIZE OF LOCAL GOVERNMENTAND ECONOMIC DEVELOPMENT POLICIES
Capacity of the local government to influence economic development depends on severalfactors. In this section, we examine some of them. One of the most powerful instrumentsis provision of infrastructure, which increases investment attractiveness and makes existingfirms more competitive. In Poland, there are municipal governments which are respons-ible for most the infrastructure and that is why we limit our analysis to this tier ofgovernment. To compare only governments with similar functions, we exclude citieswith county status.
The capacity to undertake investment projects depends on fiscal revenues and burdenof operational spending. Total revenues per capita grow with the size of a localgovernment, however, this relationship is not very strong (compare Tables 5.13 and5.14).13 But even this relationship is mostly a difference between urban and ruralmunicipalities. If we analyze rural gminas only, the relationship is even the opposite–larger means financially weaker. The picture changes a little bit if we consider onlyrevenues from own and shared taxes. The dependence on revenues on the size ofmunicipality becomes stronger, but it completely disappears if we limit our analysis torural communities. The difference results from smaller municipalities’ higher dependencyon state transfers (mainly in form general and specific grants from the state budget)and higher burdens for operational spending. One may draw a very clear conclusion–small local governments are more costly for the public finance system; they requirehigher transfers, mostly due to higher per capita current spending. This relationship isvalid both for analysis of all Polish municipalities as well as for rural communes only. Inthe latter case, there is a clear difference between municipalities smaller and larger thanpopulation 10,000. One may expect that the fragmentation of relatively large ruralgovernments in Poland would result in an increased demand on the state budget toprovide the grants necessary to cope with the burden of increased operational spending.
Investment spending per capita is also higher in larger municipalities. Again, thiscorrelation seems to result from the difference between urban and rural areas as well asfrom the difference between small and big cities. The difference between small andlarge rural governments is very weak. One may speculate that only some of localgovernment investment, those related to infrastructure projects, has a direct impact oneconomic development. However, the relationship with the size looks similar regardlessof which group of investments we consider. The only exception to this rule is thehigher burden of investment related to social welfare function in big cities and higherinvestments in education facilities (mostly schools buildings) in small municipalities.
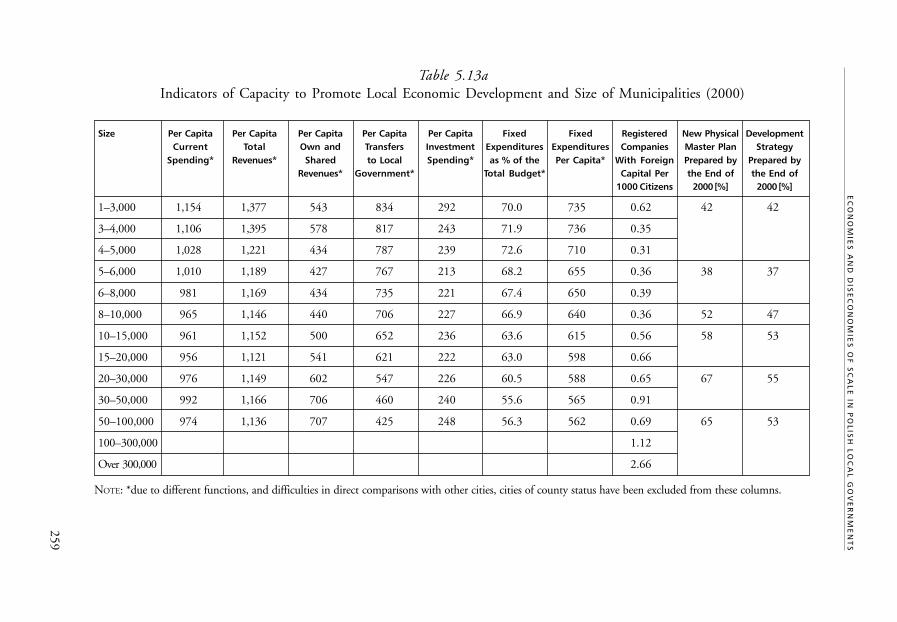
259
EC
ON
OM
IES
AN
D D
ISE
CO
NO
MIE
S O
F S
CA
LE
IN P
OL
ISH
LO
CA
L G
OV
ER
NM
EN
TS
Table 5.13aIndicators of Capacity to Promote Local Economic Development and Size of Municipalities (2000)
Size Per Capita Per Capita Per Capita Per Capita Per Capita Fixed Fixed Registered New Physical DevelopmentCurrent Total Own and Transfers Investment Expenditures Expenditures Companies Master Plan Strategy
Spending* Revenues* Shared to Local Spending* as % of the Per Capita* With Foreign Prepared by Prepared byRevenues* Government* Total Budget* Capital Per the End of the End of
1000 Citizens 2000 [%] 2000 [%]
1–3,000 1,154 1,377 543 834 292 70.0 735 0.62 42 42
3–4,000 1,106 1,395 578 817 243 71.9 736 0.35
4–5,000 1,028 1,221 434 787 239 72.6 710 0.31
5–6,000 1,010 1,189 427 767 213 68.2 655 0.36 38 37
6–8,000 981 1,169 434 735 221 67.4 650 0.39
8–10,000 965 1,146 440 706 227 66.9 640 0.36 52 47
10–15,000 961 1,152 500 652 236 63.6 615 0.56 58 53
15–20,000 956 1,121 541 621 222 63.0 598 0.66
20–30,000 976 1,149 602 547 226 60.5 588 0.65 67 55
30–50,000 992 1,166 706 460 240 55.6 565 0.91
50–100,000 974 1,136 707 425 248 56.3 562 0.69 65 53
100–300,000 1.12
Over 300,000 2.66
NOTE: *due to different functions, and difficulties in direct comparisons with other cities, cities of county status have been excluded from these columns.
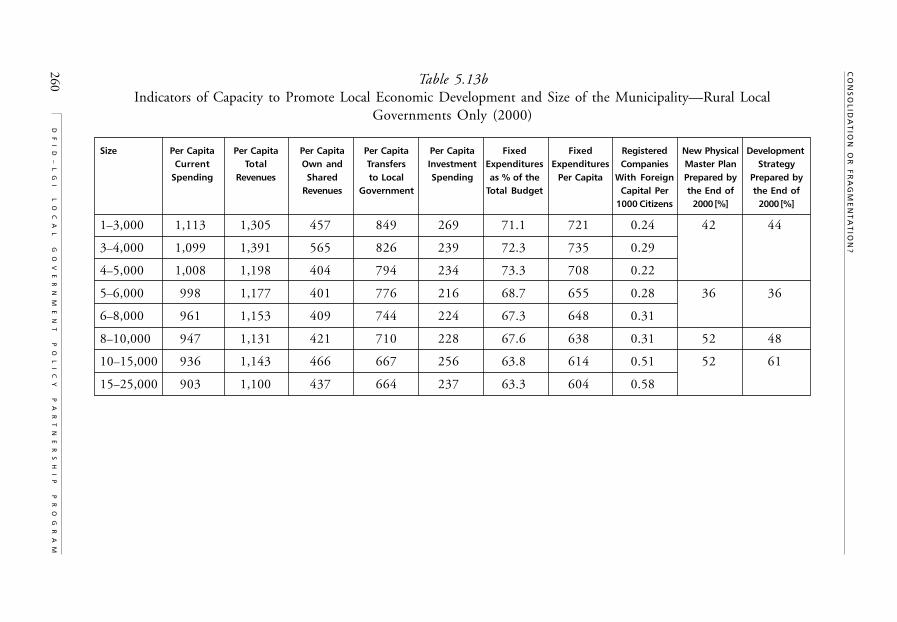
260
CO
NS
OL
IDA
TIO
N O
R F
RA
GM
EN
TA
TIO
N?
DF
ID
–L
GI
L
OC
AL
G
OV
ER
NM
EN
T
PO
LI
CY
P
AR
TN
ER
SH
IP
P
RO
GR
AM
Size Per Capita Per Capita Per Capita Per Capita Per Capita Fixed Fixed Registered New Physical DevelopmentCurrent Total Own and Transfers Investment Expenditures Expenditures Companies Master Plan Strategy
Spending Revenues Shared to Local Spending as % of the Per Capita With Foreign Prepared by Prepared byRevenues Government Total Budget Capital Per the End of the End of
1000 Citizens 2000 [%] 2000 [%]
1–3,000 1,113 1,305 457 849 269 71.1 721 0.24 42 44
3–4,000 1,099 1,391 565 826 239 72.3 735 0.29
4–5,000 1,008 1,198 404 794 234 73.3 708 0.22
5–6,000 998 1,177 401 776 216 68.7 655 0.28 36 36
6–8,000 961 1,153 409 744 224 67.3 648 0.31
8–10,000 947 1,131 421 710 228 67.6 638 0.31 52 48
10–15,000 936 1,143 466 667 256 63.8 614 0.51 52 61
15–25,000 903 1,100 437 664 237 63.3 604 0.58
Table 5.13bIndicators of Capacity to Promote Local Economic Development and Size of the Municipality—Rural Local
Governments Only (2000)
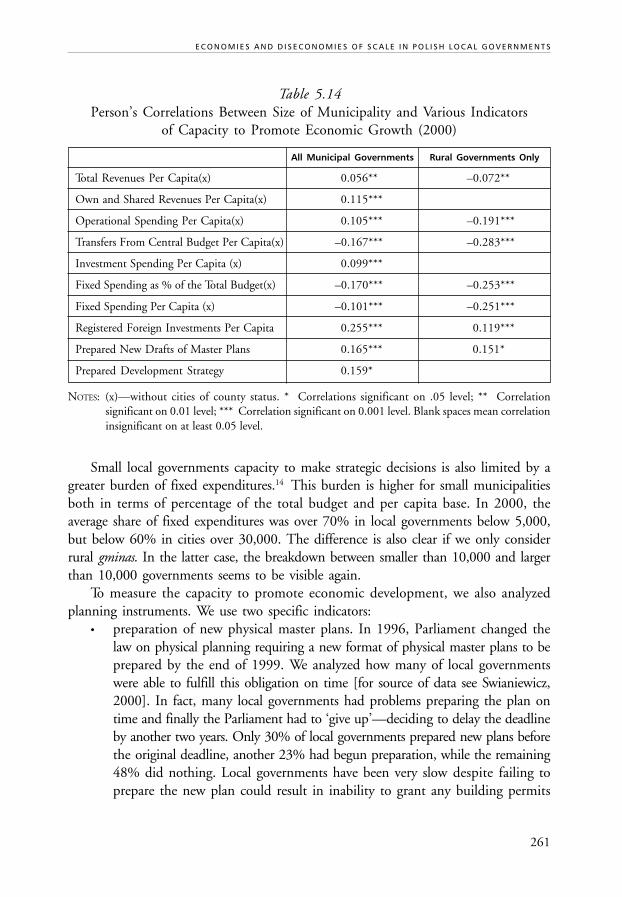
261
E C O N O M I E S A N D D I S E C O N O M I E S O F S C A L E I N P O L I S H L O C A L G O V E R N M E N T S
Table 5.14Person’s Correlations Between Size of Municipality and Various Indicators
of Capacity to Promote Economic Growth (2000)
All Municipal Governments Rural Governments Only
Total Revenues Per Capita(x) 0.056** –0.072**
Own and Shared Revenues Per Capita(x) 0.115***
Operational Spending Per Capita(x) 0.105*** –0.191***
Transfers From Central Budget Per Capita(x) –0.167*** –0.283***
Investment Spending Per Capita (x) 0.099***
Fixed Spending as % of the Total Budget(x) –0.170*** –0.253***
Fixed Spending Per Capita (x) –0.101*** –0.251***
Registered Foreign Investments Per Capita 0.255*** 0.119***
Prepared New Drafts of Master Plans 0.165*** 0.151*
Prepared Development Strategy 0.159*
NOTES: (x)—without cities of county status. * Correlations significant on .05 level; ** Correlationsignificant on 0.01 level; *** Correlation significant on 0.001 level. Blank spaces mean correlationinsignificant on at least 0.05 level.
Small local governments capacity to make strategic decisions is also limited by agreater burden of fixed expenditures.14 This burden is higher for small municipalitiesboth in terms of percentage of the total budget and per capita base. In 2000, theaverage share of fixed expenditures was over 70% in local governments below 5,000,but below 60% in cities over 30,000. The difference is also clear if we only considerrural gminas. In the latter case, the breakdown between smaller than 10,000 and largerthan 10,000 governments seems to be visible again.
To measure the capacity to promote economic development, we also analyzedplanning instruments. We use two specific indicators:
• preparation of new physical master plans. In 1996, Parliament changed thelaw on physical planning requiring a new format of physical master plans to beprepared by the end of 1999. We analyzed how many of local governmentswere able to fulfill this obligation on time [for source of data see Swianiewicz,2000]. In fact, many local governments had problems preparing the plan ontime and finally the Parliament had to ‘give up’—deciding to delay the deadlineby another two years. Only 30% of local governments prepared new plans beforethe original deadline, another 23% had begun preparation, while the remaining48% did nothing. Local governments have been very slow despite failing toprepare the new plan could result in inability to grant any building permits
262
C O N S O L I D A T I O N O R F R A G M E N T A T I O N ?
D F I D – L G I L O C A L G O V E R N M E N T P O L I C Y P A R T N E R S H I P P R O G R A M
after 1 January 2000 (not delaying the deadline would then nearly freeze anyhousing or commercial investments in almost half of the country).
• number of local governments who have prepared strategies for local development.
In both of cases, larger local governments performed considerably better than smallmunicipalities. In case of physical master plans this correlation is stronger (than in caseof preparation of development strategic programs) and remains valid (although is muchweaker) when we limit our analysis to rural governments only. It can probably beexplained by the lower administrative capacity of small municipalities. Very smallorganizations are less able to cope with complicated, new tasks.
7. UNIT COST, CATCHMENT AREA, QUALITY OF MUNICIPALSERVICES AND THE SIZE OF ADMINISTRATIVE UNITS
For most local services, comparison of unit costs and the quality of delivered product isextremely difficult. It is so both because of methodological traps and frequent lack ofrelevant, reliable data. In the following subsections we try to analyze issues of unitcosts, catchment area and service quality in three, relatively simple and well-documentedcases. However, in these cases we can also not avoid some abridgements.
In regards to unit costs, all three cases document economy of scale, i.e. decreasingstandard unit costs along with the increase of service area. Proving the economy of scalephenomena would be more difficult for other services Polish local governments areresponsible for. But in contrast, we do not know any empirical analysis which wouldshow (for any of the local services in Poland) the opposite case—i.e. the increase of coststogether with the increase size of local government unit.
In general, small municipal governments spend more (on per capita base) on currentoperation, despite (as it has been noted in Section 4) their own and shared revenues arelower. In 2000, the average municipality under population 4,000 was spending morethan 1,100 zloty per capita on current operation, while municipalities with over 6,000inhabitants were spending less than 1,000 zloty per capita. Comparing smaller sizecohorts, one may notice that current expenditures per capita gradually decrease up tothe size of about 6–8,000, then remain relatively flat for larger local governments.
7.1 Basic Administrative Services
Current spending on local administration is relatively simple to analyze. Moreover,following the Sharpe (1995) distinction, analyzing the administrative overhead, wecan really focus on the differences between small and big government, not on the
263
E C O N O M I E S A N D D I S E C O N O M I E S O F S C A L E I N P O L I S H L O C A L G O V E R N M E N T S
variation between urban and rural. The same statistical relations remain valid regardlessof whether we take into account all local governments, only rural or only urban units.
The negative correlation between the size of local government and per capitaspending on local administration has been already described for Poland in the 1994and 1996 data [Swianiewicz 1996; Swianiewicz, Amos, 1998]. It has also been supportedby the 2000 data presented in Table 5.15. We took into consideration only localgovernments with comparable scopes of administrative tasks. That is why we excludedthe Warsaw city boroughs from municipal governments (due to specific division offunctions between tiers of government in Warsaw) and cities of a county status (whichare responsible for more functions than other municipalities). The correlation coefficientbetween the size and per capita spending on administration is –0.339 (significant on0.001 level) and between size and percent of budget spent on administration –0.434(also significant on 0.001 level). The average per capita spending on administration ina local government with a population under 3,000 is more than twice of the amountspent per citizen in a city over 50,000. But differences are also very visible within thegroup of small (for Polish standards) governments. The average Polish rural governmenthas population of about 7,000. Such governments spend 40% less on administrationthan smaller gmina (having under 3,000 inhabitants) and 20% more than big ruralgmina (with populations over 15,000). Parallel, with increasing size, administrationspending becomes a decreasing burden from the total current budget (from 22% inthe smallest local governments to below 15% in units with populations over 15,000,and below 13% in cities over 50,000).
The same negative correlation has also been established (although it is not as strongin the case of municipalities) for county level government. Average per capita spendingon administration in the smallest group (below 50,000) is over 50% higher than inthe largest counties.
But one should take notice of Table 5.21, there is an even higher variation ofadministration costs within individual size groups. It means, though size is a goodpredictor of spending, it is not the only one. The affluence of local government is aneven more powerful explanatory variable. The correlation coefficient between per capitaspending on administration and total revenues per capita is +0.572. It is also very highwithin individual size groups (varying from +0.398 for cities over 50,000 to +0.891for governments between 3 and 4,000–all coefficients significant on 0.001 level).
The conclusions below may be additionally strengthened by an observationconcerning the split of 23 mixed urban-rural governments in 1991. After the split, percapita administrative overhead increased by 20% [Swianiewicz, 1996].
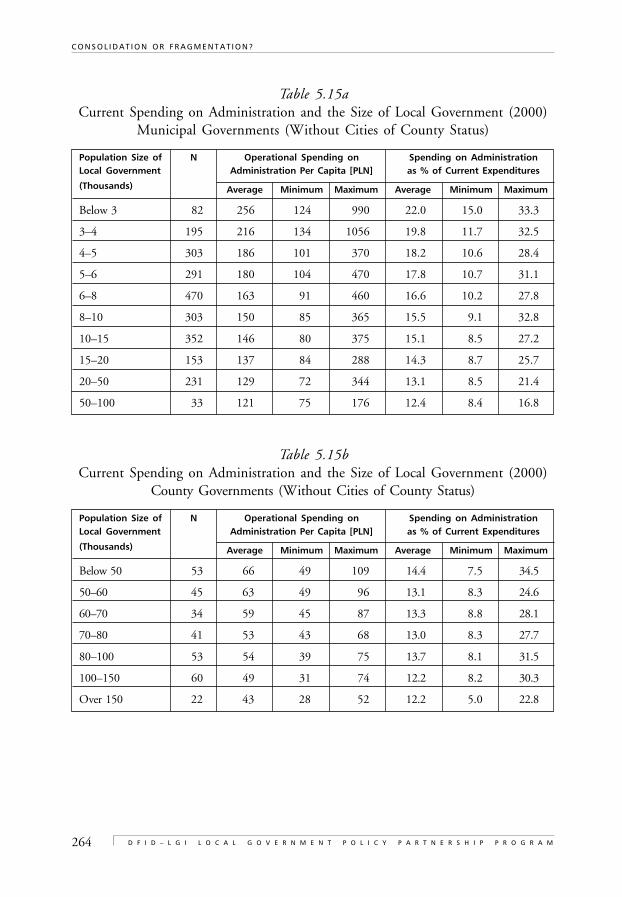
264
C O N S O L I D A T I O N O R F R A G M E N T A T I O N ?
D F I D – L G I L O C A L G O V E R N M E N T P O L I C Y P A R T N E R S H I P P R O G R A M
Table 5.15aCurrent Spending on Administration and the Size of Local Government (2000)
Municipal Governments (Without Cities of County Status)
Population Size of N Operational Spending on Spending on AdministrationLocal Government Administration Per Capita [PLN] as % of Current Expenditures
(Thousands) Average Minimum Maximum Average Minimum Maximum
Below 3 82 256 124 990 22.0 15.0 33.3
3–4 195 216 134 1056 19.8 11.7 32.5
4–5 303 186 101 370 18.2 10.6 28.4
5–6 291 180 104 470 17.8 10.7 31.1
6–8 470 163 91 460 16.6 10.2 27.8
8–10 303 150 85 365 15.5 9.1 32.8
10–15 352 146 80 375 15.1 8.5 27.2
15–20 153 137 84 288 14.3 8.7 25.7
20–50 231 129 72 344 13.1 8.5 21.4
50–100 33 121 75 176 12.4 8.4 16.8
Table 5.15bCurrent Spending on Administration and the Size of Local Government (2000)
County Governments (Without Cities of County Status)
Population Size of N Operational Spending on Spending on AdministrationLocal Government Administration Per Capita [PLN] as % of Current Expenditures
(Thousands) Average Minimum Maximum Average Minimum Maximum
Below 50 53 66 49 109 14.4 7.5 34.5
50–60 45 63 49 96 13.1 8.3 24.6
60–70 34 59 45 87 13.3 8.8 28.1
70–80 41 53 43 68 13.0 8.3 27.7
80–100 53 54 39 75 13.7 8.1 31.5
100–150 60 49 31 74 12.2 8.2 30.3
Over 150 22 43 28 52 12.2 5.0 22.8

265
E C O N O M I E S A N D D I S E C O N O M I E S O F S C A L E I N P O L I S H L O C A L G O V E R N M E N T S
7.2 Primary and Secondary Education
The management of kindergartens, as well as primary and secondary schools, is currentlyone of the most important and certainly the most expensive tasks undertaken by Polishlocal government. Since 1990, municipalities have been responsible for maintenanceand development of pre-school education. In 1996, they took on the primary schools(including hiring teachers) and, in 1999, counties have managed most types of secondaryschools as well as some non-mandatory educational units. To fully understand the roleof education in the Polish model of territorial self-government, it is important to realizethat, in some municipalities (especially small ones), the share of education expendituresoften exceeds half of the total annual budget.
Pre-school education is financed through own revenues of the municipalities.Therefore, the attendance rate for children, 3–5 years old, depends on the culturalvariation and also the development of the kindergarten network as well as on the financialcapacity of the gmina consequently.
Primary and secondary education are supposed to be financed by part of a generalpurpose grant received by the local authorities from the central government. This partof the grant is called an education subvention and is aimed at covering the currentcosts of school system in municipalities and counties.15 The education grant is calculatedon the basis of the weighted number of students in the municipality/county schools.The a-priori set standard subvention is granted to the local government for each“weighted student”.
In 2000, municipalities’ current expenditures on education (even excludingspending on kindergartens) exceeded the received subvention by 20%. However, itmust be emphasized that the years 1999 and 2000 were exceptional in terms of localgovernments’ financial efforts because of the substantial reforms of Polish educationsystem in process at the time .16 There is no point, at least in this paper, in comparingeducation expenditure figures for the different years, since both the method of calculatingthe school subvention and the scope of local government responsibilities have changeddramatically.
Table 5.16Current Expenditures Over the Amount of Received Grants
in Three Types Polish Municipalities (2000)
Total All Rural Municipalities All Mixed Municipalities All Urban Municipalities
20.0% 21.0% 24.3% 17.8%
Considering both primary and secondary education, there seems to be two kinds ofunits where the deficit of current expenditures on education is the highest. The first
266
C O N S O L I D A T I O N O R F R A G M E N T A T I O N ?
D F I D – L G I L O C A L G O V E R N M E N T P O L I C Y P A R T N E R S H I P P R O G R A M
type can be characterized as a small rural municipality with an ineffective network oflow-quality small primary schools. The “per student” costs in such municipalities arehigher because the small size of schools and classes increase the share of fixed costs intotal expenditures. This may lead to a low quality of education, since municipalityspends all the resources on current needs and is unable to provide better equipment/faculties/teachers.
The other extreme example of high education cost occurs in the big city, whereteachers’ salaries are high,17 school programs include more faculties, and the schoolequipment is better than average. The ministerial subvention does not cover the totalcurrent expenditures, but the city spends it’s own resources in order to attract students,teachers, investors, etc.
It seems that, for the further discussion on the relationship between size and effective-ness of municipalities, only the first case of high cost education (small units withinappropriate school network) is relevant.
Secondary education in Poland is highly concentrated in urban areas. Only 7% ofstudents attend secondary schools located in rural areas. Moreover, many studentschoose schools located outside their home county. In theory, this should not cause anydisturbance to the financial system. Since the ministerial subvention is calculated perstudent enrolled in the county’s schools, a migrating student simply brings money tothe county where he or she arrives to study. In reality, however, some counties investtheir own resources towards the school system in addition to those received in the formof education grants. Therefore, students migrating to such counties act as “free riders”—benefiting from the local taxpayers’ effort. This is especially the case for the 65 citieswith county status having dual status as a municipality and a county. These citiesexperience a significant migration of secondary school students. The problem can bedefined in terms of the size of administrative unit, since the administrative boundariesobviously do not fit to the scope of the market for services provided by the county.
The three issues briefly discussed above are analyzed in the following sub-sections.We now focus on the cost efficiency of public education as a measure of local govern-ments’ performance. This approach makes educational activities of different muni-cipalities comparable, but omits the quality of the education services, hardly measurablein the Polish education system. Until 2002, all examinations in Polish schools wereconducted and evaluated by local teachers. Therefore, the examination results do notreflect the differences in school quality. Other indicators, such as pupil/teacher orpupil/class ratios, are strongly correlated to the unit cost of education and are notworth discussing separately.
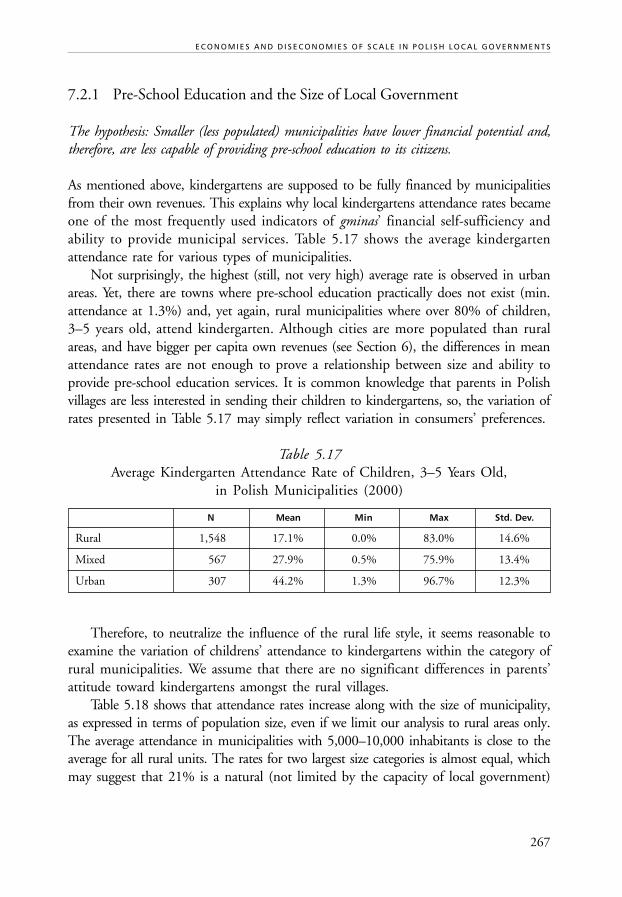
267
E C O N O M I E S A N D D I S E C O N O M I E S O F S C A L E I N P O L I S H L O C A L G O V E R N M E N T S
7.2.1 Pre-School Education and the Size of Local Government
The hypothesis: Smaller (less populated) municipalities have lower financial potential and,therefore, are less capable of providing pre-school education to its citizens.
As mentioned above, kindergartens are supposed to be fully financed by municipalitiesfrom their own revenues. This explains why local kindergartens attendance rates becameone of the most frequently used indicators of gminas’ financial self-sufficiency andability to provide municipal services. Table 5.17 shows the average kindergartenattendance rate for various types of municipalities.
Not surprisingly, the highest (still, not very high) average rate is observed in urbanareas. Yet, there are towns where pre-school education practically does not exist (min.attendance at 1.3%) and, yet again, rural municipalities where over 80% of children,3–5 years old, attend kindergarten. Although cities are more populated than ruralareas, and have bigger per capita own revenues (see Section 6), the differences in meanattendance rates are not enough to prove a relationship between size and ability toprovide pre-school education services. It is common knowledge that parents in Polishvillages are less interested in sending their children to kindergartens, so, the variation ofrates presented in Table 5.17 may simply reflect variation in consumers’ preferences.
Table 5.17Average Kindergarten Attendance Rate of Children, 3–5 Years Old,
in Polish Municipalities (2000)
N Mean Min Max Std. Dev.
Rural 1,548 17.1% 0.0% 83.0% 14.6%
Mixed 567 27.9% 0.5% 75.9% 13.4%
Urban 307 44.2% 1.3% 96.7% 12.3%
Therefore, to neutralize the influence of the rural life style, it seems reasonable toexamine the variation of childrens’ attendance to kindergartens within the category ofrural municipalities. We assume that there are no significant differences in parents’attitude toward kindergartens amongst the rural villages.
Table 5.18 shows that attendance rates increase along with the size of municipality,as expressed in terms of population size, even if we limit our analysis to rural areas only.The average attendance in municipalities with 5,000–10,000 inhabitants is close to theaverage for all rural units. The rates for two largest size categories is almost equal, whichmay suggest that 21% is a natural (not limited by the capacity of local government)
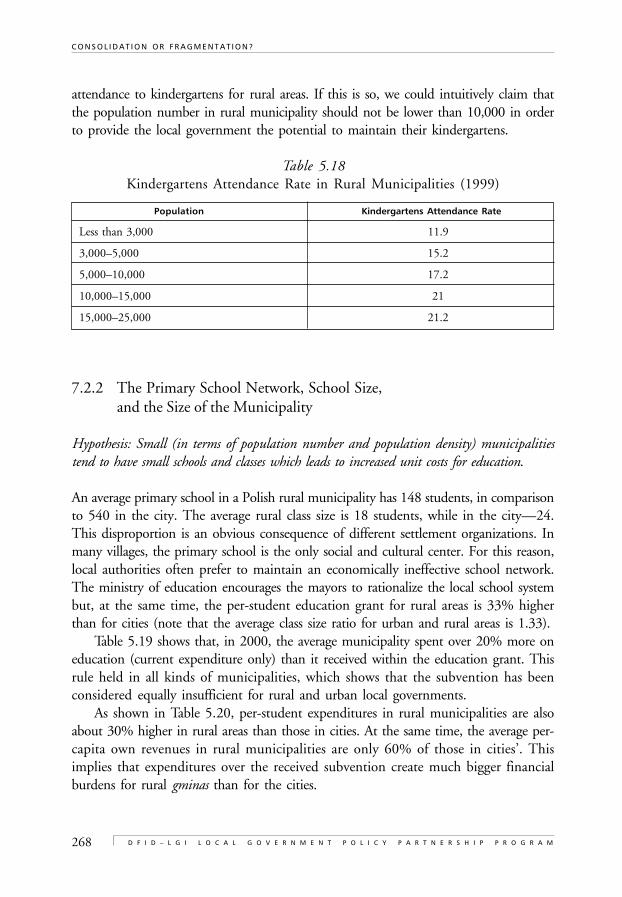
268
C O N S O L I D A T I O N O R F R A G M E N T A T I O N ?
D F I D – L G I L O C A L G O V E R N M E N T P O L I C Y P A R T N E R S H I P P R O G R A M
attendance to kindergartens for rural areas. If this is so, we could intuitively claim thatthe population number in rural municipality should not be lower than 10,000 in orderto provide the local government the potential to maintain their kindergartens.
Table 5.18Kindergartens Attendance Rate in Rural Municipalities (1999)
Population Kindergartens Attendance Rate
Less than 3,000 11.9
3,000–5,000 15.2
5,000–10,000 17.2
10,000–15,000 21
15,000–25,000 21.2
7.2.2 The Primary School Network, School Size,and the Size of the Municipality
Hypothesis: Small (in terms of population number and population density) municipalitiestend to have small schools and classes which leads to increased unit costs for education.
An average primary school in a Polish rural municipality has 148 students, in comparisonto 540 in the city. The average rural class size is 18 students, while in the city—24.This disproportion is an obvious consequence of different settlement organizations. Inmany villages, the primary school is the only social and cultural center. For this reason,local authorities often prefer to maintain an economically ineffective school network.The ministry of education encourages the mayors to rationalize the local school systembut, at the same time, the per-student education grant for rural areas is 33% higherthan for cities (note that the average class size ratio for urban and rural areas is 1.33).
Table 5.19 shows that, in 2000, the average municipality spent over 20% more oneducation (current expenditure only) than it received within the education grant. Thisrule held in all kinds of municipalities, which shows that the subvention has beenconsidered equally insufficient for rural and urban local governments.
As shown in Table 5.20, per-student expenditures in rural municipalities are alsoabout 30% higher in rural areas than those in cities. At the same time, the average per-capita own revenues in rural municipalities are only 60% of those in cities’. Thisimplies that expenditures over the received subvention create much bigger financialburdens for rural gminas than for the cities.
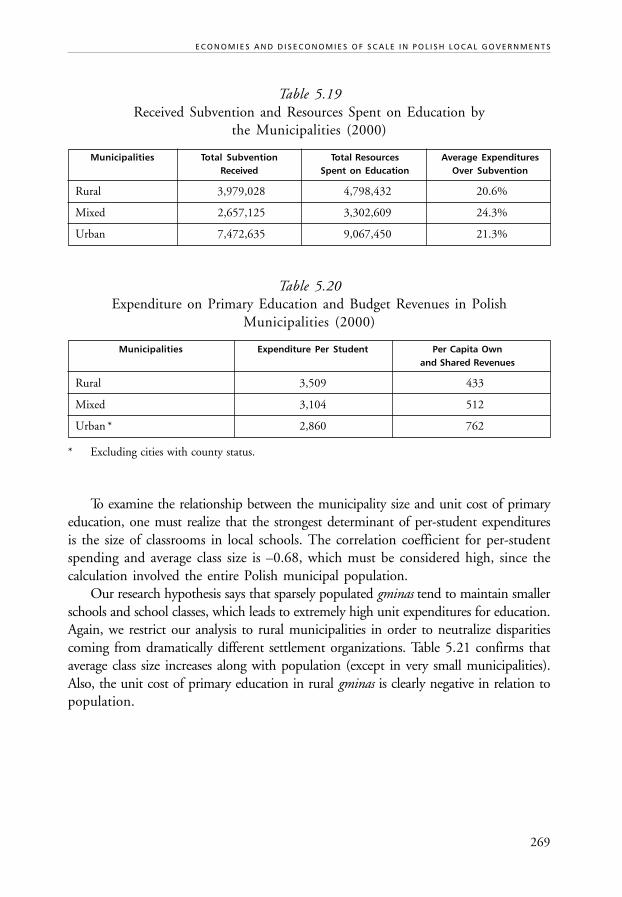
269
E C O N O M I E S A N D D I S E C O N O M I E S O F S C A L E I N P O L I S H L O C A L G O V E R N M E N T S
Table 5.19Received Subvention and Resources Spent on Education by
the Municipalities (2000)
Municipalities Total Subvention Total Resources Average ExpendituresReceived Spent on Education Over Subvention
Rural 3,979,028 4,798,432 20.6%
Mixed 2,657,125 3,302,609 24.3%
Urban 7,472,635 9,067,450 21.3%
Table 5.20Expenditure on Primary Education and Budget Revenues in Polish
Municipalities (2000)
Municipalities Expenditure Per Student Per Capita Ownand Shared Revenues
Rural 3,509 433
Mixed 3,104 512
Urban* 2,860 762
* Excluding cities with county status.
To examine the relationship between the municipality size and unit cost of primaryeducation, one must realize that the strongest determinant of per-student expendituresis the size of classrooms in local schools. The correlation coefficient for per-studentspending and average class size is –0.68, which must be considered high, since thecalculation involved the entire Polish municipal population.
Our research hypothesis says that sparsely populated gminas tend to maintain smallerschools and school classes, which leads to extremely high unit expenditures for education.Again, we restrict our analysis to rural municipalities in order to neutralize disparitiescoming from dramatically different settlement organizations. Table 5.21 confirms thataverage class size increases along with population (except in very small municipalities).Also, the unit cost of primary education in rural gminas is clearly negative in relation topopulation.
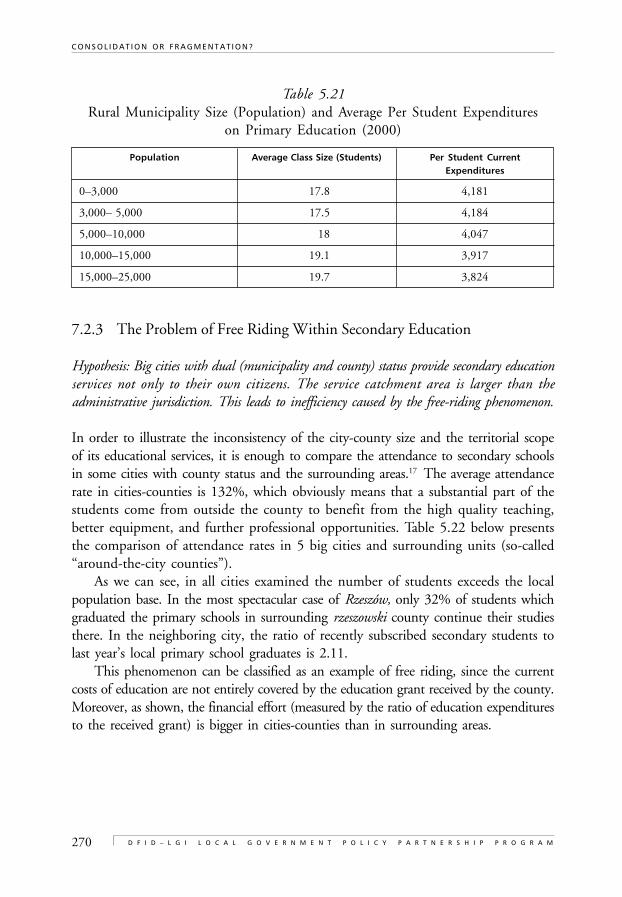
270
C O N S O L I D A T I O N O R F R A G M E N T A T I O N ?
D F I D – L G I L O C A L G O V E R N M E N T P O L I C Y P A R T N E R S H I P P R O G R A M
Table 5.21Rural Municipality Size (Population) and Average Per Student Expenditures
on Primary Education (2000)
Population Average Class Size (Students) Per Student CurrentExpenditures
0–3,000 17.8 4,181
3,000– 5,000 17.5 4,184
5,000–10,000 18 4,047
10,000–15,000 19.1 3,917
15,000–25,000 19.7 3,824
7.2.3 The Problem of Free Riding Within Secondary Education
Hypothesis: Big cities with dual (municipality and county) status provide secondary educationservices not only to their own citizens. The service catchment area is larger than theadministrative jurisdiction. This leads to inefficiency caused by the free-riding phenomenon.
In order to illustrate the inconsistency of the city-county size and the territorial scopeof its educational services, it is enough to compare the attendance to secondary schoolsin some cities with county status and the surrounding areas.17 The average attendancerate in cities-counties is 132%, which obviously means that a substantial part of thestudents come from outside the county to benefit from the high quality teaching,better equipment, and further professional opportunities. Table 5.22 below presentsthe comparison of attendance rates in 5 big cities and surrounding units (so-called“around-the-city counties”).
As we can see, in all cities examined the number of students exceeds the localpopulation base. In the most spectacular case of Rzeszów, only 32% of students whichgraduated the primary schools in surrounding rzeszowski county continue their studiesthere. In the neighboring city, the ratio of recently subscribed secondary students tolast year’s local primary school graduates is 2.11.
This phenomenon can be classified as an example of free riding, since the currentcosts of education are not entirely covered by the education grant received by the county.Moreover, as shown, the financial effort (measured by the ratio of education expendituresto the received grant) is bigger in cities-counties than in surrounding areas.
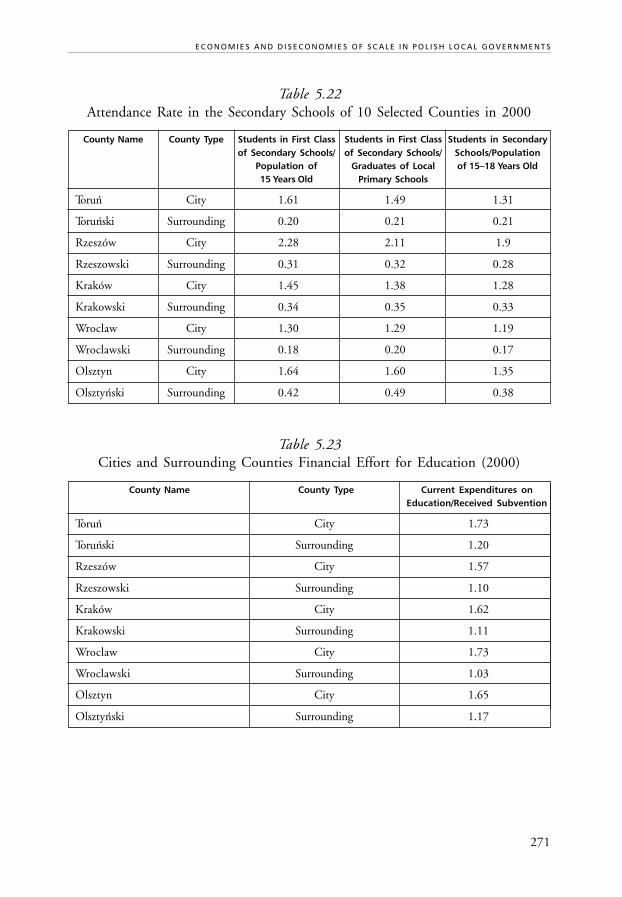
271
E C O N O M I E S A N D D I S E C O N O M I E S O F S C A L E I N P O L I S H L O C A L G O V E R N M E N T S
Table 5.22Attendance Rate in the Secondary Schools of 10 Selected Counties in 2000
County Name County Type Students in First Class Students in First Class Students in Secondaryof Secondary Schools/ of Secondary Schools/ Schools/Population
Population of Graduates of Local of 15–18 Years Old15 Years Old Primary Schools
Torun City 1.61 1.49 1.31
Torunski Surrounding 0.20 0.21 0.21
Rzeszów City 2.28 2.11 1.9
Rzeszowski Surrounding 0.31 0.32 0.28
Kraków City 1.45 1.38 1.28
Krakowski Surrounding 0.34 0.35 0.33
Wroclaw City 1.30 1.29 1.19
Wroclawski Surrounding 0.18 0.20 0.17
Olsztyn City 1.64 1.60 1.35
Olsztynski Surrounding 0.42 0.49 0.38
Table 5.23Cities and Surrounding Counties Financial Effort for Education (2000)
County Name County Type Current Expenditures onEducation/Received Subvention
Torun City 1.73
Torunski Surrounding 1.20
Rzeszów City 1.57
Rzeszowski Surrounding 1.10
Kraków City 1.62
Krakowski Surrounding 1.11
Wroclaw City 1.73
Wroclawski Surrounding 1.03
Olsztyn City 1.65
Olsztynski Surrounding 1.17
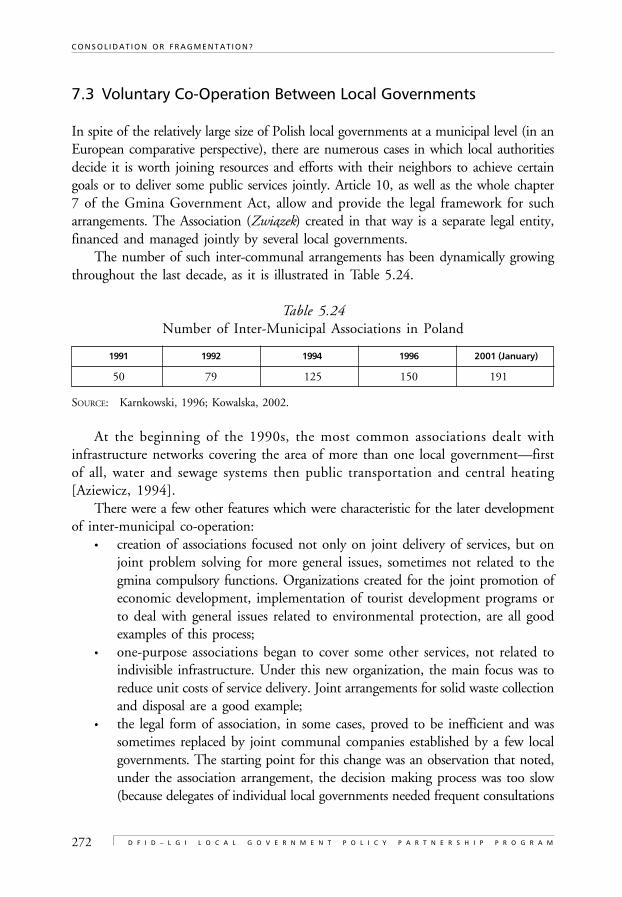
272
C O N S O L I D A T I O N O R F R A G M E N T A T I O N ?
D F I D – L G I L O C A L G O V E R N M E N T P O L I C Y P A R T N E R S H I P P R O G R A M
7.3 Voluntary Co-Operation Between Local Governments
In spite of the relatively large size of Polish local governments at a municipal level (in anEuropean comparative perspective), there are numerous cases in which local authoritiesdecide it is worth joining resources and efforts with their neighbors to achieve certaingoals or to deliver some public services jointly. Article 10, as well as the whole chapter7 of the Gmina Government Act, allow and provide the legal framework for sucharrangements. The Association (Zwiazek) created in that way is a separate legal entity,financed and managed jointly by several local governments.
The number of such inter-communal arrangements has been dynamically growingthroughout the last decade, as it is illustrated in Table 5.24.
Table 5.24Number of Inter-Municipal Associations in Poland
1991 1992 1994 1996 2001 (January)
50 79 125 150 191
SOURCE: Karnkowski, 1996; Kowalska, 2002.
At the beginning of the 1990s, the most common associations dealt withinfrastructure networks covering the area of more than one local government—firstof all, water and sewage systems then public transportation and central heating[Aziewicz, 1994].
There were a few other features which were characteristic for the later developmentof inter-municipal co-operation:
• creation of associations focused not only on joint delivery of services, but onjoint problem solving for more general issues, sometimes not related to thegmina compulsory functions. Organizations created for the joint promotion ofeconomic development, implementation of tourist development programs orto deal with general issues related to environmental protection, are all goodexamples of this process;
• one-purpose associations began to cover some other services, not related toindivisible infrastructure. Under this new organization, the main focus was toreduce unit costs of service delivery. Joint arrangements for solid waste collectionand disposal are a good example;
• the legal form of association, in some cases, proved to be inefficient and wassometimes replaced by joint communal companies established by a few localgovernments. The starting point for this change was an observation that noted,under the association arrangement, the decision making process was too slow(because delegates of individual local governments needed frequent consultations
˛
273
E C O N O M I E S A N D D I S E C O N O M I E S O F S C A L E I N P O L I S H L O C A L G O V E R N M E N T S
with their local councils) and that the position of executive boards was tooweak. A company form is less vulnerable to such negative phenomena.
Obviously, the function of both associations and joint companies is not a remedyfor all the problems related to high unit-costs or difference between geographical bordersand the catchment area of services. There are many examples where the initial attemptto establish the co-operation failed because local governments involved could not agreeon some principles of co-operation. Aziewicz (1998) gives also some examples of thedevastating conflicts in existing associations. Definitely not all the 191 can be treatedas successful cases. But in many cases, they did all help in more efficient implementationof developmental policies or in better management of some services.
An interesting example of the successful single purpose association is an Associationof Municipalities in Jura Region, which involves 36 gminas working together on thedevelopment of the tourist industry in the region. Over two thirds of the Association’sbudget comes from the members’ contributions. This contribution is relatively small(about 10 cents per annum from every citizen in small local governments), so, it is nota heavy burden on local budgets. But co-operation of several local governments allowedfor preparation of promotional materials and participation in international touristfairs, which would be impossible for any single municipality. Preparation of a highquality video, filmed with the use of a hired helicopter, is just a one example. Successesin the join promotion of the region prove that, no doubt, the co-operation has beencost-effective.
7.3.1 Case Study–Solid Waste Management
Waste management is another example of a municipal task which is strongly related tothe size of municipality and often goes beyond the capacity of a single gmina. One mayask why this function has not been transferred to county government, when the uppertier of local government was created in 1999. This is especially surprising when takinginto account the fact that central government decided to leave this function with thegmina but, at the same time, was trying to encourage gminas within one county to co-operate on provision of the service. Probably, the only explanation is the promise madeby central government that the 1998/99 reforms would not result in any limitation ofgmina powers and function. One of the major arguments raised by opponents of thereform was that new tiers would dominate municipalities and central governmentmade a promise in order to secure the support of municipal politicians.
Regardless of the reason for present allocation of this function, efficient wastemanagement tends to exceed single gmina borders. There seem to be two reasons forthis: management of solid waste is expensive and it is socially difficult. Some analysis
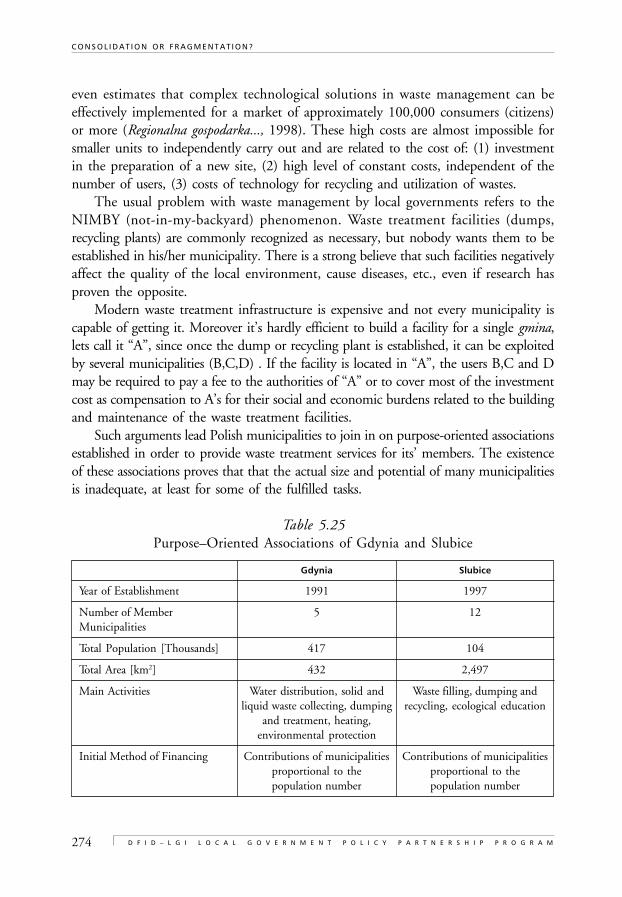
274
C O N S O L I D A T I O N O R F R A G M E N T A T I O N ?
D F I D – L G I L O C A L G O V E R N M E N T P O L I C Y P A R T N E R S H I P P R O G R A M
even estimates that complex technological solutions in waste management can beeffectively implemented for a market of approximately 100,000 consumers (citizens)or more (Regionalna gospodarka..., 1998). These high costs are almost impossible forsmaller units to independently carry out and are related to the cost of: (1) investmentin the preparation of a new site, (2) high level of constant costs, independent of thenumber of users, (3) costs of technology for recycling and utilization of wastes.
The usual problem with waste management by local governments refers to theNIMBY (not-in-my-backyard) phenomenon. Waste treatment facilities (dumps,recycling plants) are commonly recognized as necessary, but nobody wants them to beestablished in his/her municipality. There is a strong believe that such facilities negativelyaffect the quality of the local environment, cause diseases, etc., even if research hasproven the opposite.
Modern waste treatment infrastructure is expensive and not every municipality iscapable of getting it. Moreover it’s hardly efficient to build a facility for a single gmina,lets call it “A”, since once the dump or recycling plant is established, it can be exploitedby several municipalities (B,C,D) . If the facility is located in “A”, the users B,C and Dmay be required to pay a fee to the authorities of “A” or to cover most of the investmentcost as compensation to A’s for their social and economic burdens related to the buildingand maintenance of the waste treatment facilities.
Such arguments lead Polish municipalities to join in on purpose-oriented associationsestablished in order to provide waste treatment services for its’ members. The existenceof these associations proves that that the actual size and potential of many municipalitiesis inadequate, at least for some of the fulfilled tasks.
Table 5.25Purpose–Oriented Associations of Gdynia and Slubice
Gdynia Slubice
Year of Establishment 1991 1997
Number of Member 5 12Municipalities
Total Population [Thousands] 417 104
Total Area [km2] 432 2,497
Main Activities Water distribution, solid and Waste filling, dumping andliquid waste collecting, dumping recycling, ecological education
and treatment, heating,environmental protection
Initial Method of Financing Contributions of municipalities Contributions of municipalitiesproportional to the proportional to thepopulation number population number
275
E C O N O M I E S A N D D I S E C O N O M I E S O F S C A L E I N P O L I S H L O C A L G O V E R N M E N T S
The two examples of the function of one–purpose-associations, presented in theTable 5.25, take place in different regions of Poland. The association located in Gdynia(northern Poland) groups six member municipalities, two of which are big neighboringcities with a joint population close to 300,000. The other association consists of 12,relatively small, municipalities located near the western border of Poland, surroundingthe town of Slubice.
Both associations do not limit their activities to waste disposal, but manage also avariety of issues from water distribution and heating (Gdynia), to ecological education(Slubice). Table 5.25 shows the comparison of size, scope of activities and other detailsconcerning the two associations.
One well-known and successful example of co-operation in waste management isthe company Beskid, established in 1993 by 18 municipalities surrounding the townof Z
·ywiec [Starypan, 1999]. In order to improve management mechanisms and speed-
up the decision making process, local governments decided on a company instead ofthe traditional form of inter-municipal co-operation. The idea behind the Z
·ywiec region
joint waste management program was born in 1992 when the old waste disposal plantcapacity had exhausted. There were five new locations available for the dump-site, butall of them met with the protests of local residents. Eventually, the only acceptable newlocation was within the Z
·ywiec city limits. City government had an obvious choice:
either it builds a plant for itself or it co-operates with the surrounding, mostly rural,municipalities. There were two arguments for co-operation: (i) exploitation of the plantby the city only would be much more expensive in terms of unit cots; (ii) due toconsiderable externalities, only a joint waste management system would provide theopportunity for a radical improvement in local environmental protection. Currently,the company operates one of the most modern facilities in Poland and runs a successfulprogram of waste segregation and recycling. It is quite clear that the positive results ofthe program would have been impossible for a single gmina to achieve.
8. CONCLUSIONS
Following the Keating (1995) concept, quoted in the introductory chapter, the qualityof local government functions can be evaluated as a sum of three factors:
• capacity for economic development;• ability to provide high quality cheap services;• functioning of local democracy.
Theoretical expectations concerning the impact of size on these broad categoriesoften go in opposite directions. For instance, with capacity for economic development
276
C O N S O L I D A T I O N O R F R A G M E N T A T I O N ?
D F I D – L G I L O C A L G O V E R N M E N T P O L I C Y P A R T N E R S H I P P R O G R A M
growth with the size of local government according to reform theory, the ability tomobilize larger resources for massive infrastructure projects seems to be a decisive factor.But according to some public choice arguments, big bureaucracy problems can bemore visible in large administrations and small units competing for investments shouldbe more effective. Moreover, some neo-liberal concepts suggest that the ability to planstrategically does not matter, since only the market can provide an optimal allocationand any planning can have harmful effects by sending false signals to the market.
As far as the ability to provide services is concerned, reform theory argues for largegovernments. This is both due to lower unit costs and the ability to provide moreservices. But some public choice proponents suggest that size does not matter, sinceservices can be contracted-out to private providers.
Last, but not least, most of arguments for local democracy opts for small unitswhere contact between citizens and authorities is closer, bureaucracy is smaller, andpolicies may better reflect local preferences. However, reform theory suggests that biggovernments, having more functions, attract more citizens attention and that—followingDahl’s (1961) classic concept—larger communities provide space for more interestgroups competing for influence, which leads to more pluralist political models.
How do these conflicting competing theories correspond with Polish reality? Thesummary of findings is presented in Table 5.26. Capacity for economic development isdefinitely larger in large local governments. Public choice counter-arguments onbureaucratic difficulties in big organizations do not seem to be decisive. Ability toprovide more services, and to provide them cheaper, works again in favor of largerterritorial units. Once again, we could not find any evidence confirming public choiceexpectations. It is important to stress that these findings do not reflect simply differencesbetween rural (small) and urban (big) governments, but have been confirmed by analysisof the variation between small and large rural communities as well.
However, in the case of local democracy indicators, the picture is almost opposite.Level of interest, trust and satisfaction with local government is much larger in smallterritorial units, rather than in large ones. This time, public choice expectations areconfirmed and reform theory arguments, that larger capacity results in larger citizensinterest, seem to be on a false track. However, there is one exception to this rule—asreform theorists suggested, larger local government seem to have a more pluralist modelof politics. The findings on a variation in social structure of councilors are difficult toclassify. The proportion of educated councilors grows with the size of the localgovernment. On one hand, this means that “human capital” in the council increases.On the other hand, one may argue, since the structure of a council becomes moredistant from the structure of the whole local society, it may cause representation problems.

277
E C O N O M I E S A N D D I S E C O N O M I E S O F S C A L E I N P O L I S H L O C A L G O V E R N M E N T S
Table 5.26Size and Local Government Functioning—Summary of Polish Findings
Issue Category Variables (Indicators) Theoretical Expectations EmpiricalAccording to: Evidence
in Poland
Reform Public ChoiceTheory or Localism
(Economies Theoryof Scale)
Capacity for Financial Total revenues, per capita + + 0Economic potential investment spendingDevelopment
Share of own revenues, per + +capita own revenues, lowdependency on state transfers
Burden of Low share of fixed current + +inflexible costs (salaries, energy) inspending total budget
Ability to Preparation of first plan of + — +/0strategic strategic development andplanning physical master plan
Ability to Share of total grants and + — ?gather non-state aid in investmentresources spending, attracted foreignfrom support investmentsprograms andattract foreigninvestors
Ability Capacity to Low per capita spending + — +to provide provide cheap on administrationservices services
Low unit costs of primary + +education
Reduced free loading and + +other problems withcatchment area
Capacity to Willingness to take + — +provide more responsibility for primaryservices schools before compulsory
deadline
Citizens willingness to + — +decentralize more functions
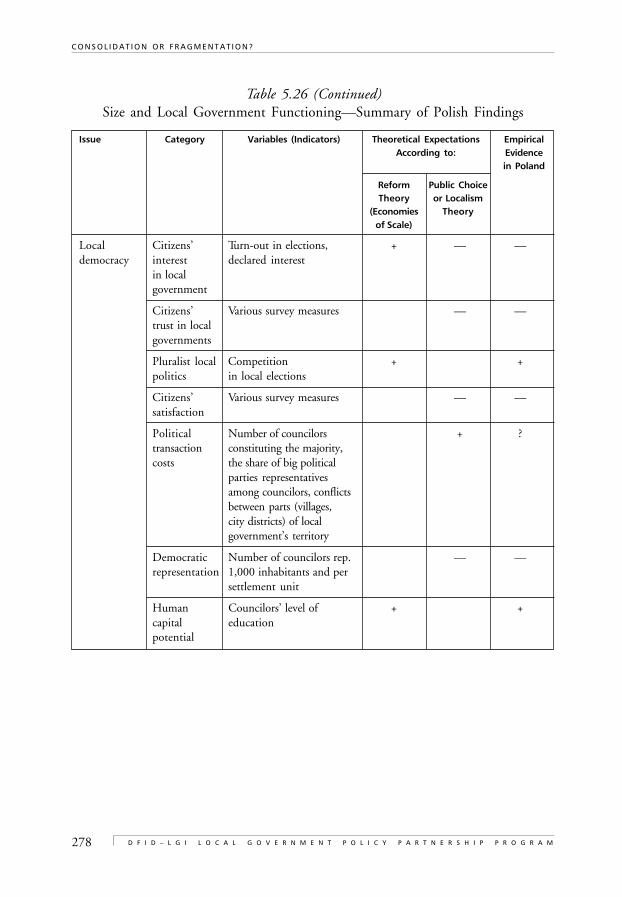
278
C O N S O L I D A T I O N O R F R A G M E N T A T I O N ?
D F I D – L G I L O C A L G O V E R N M E N T P O L I C Y P A R T N E R S H I P P R O G R A M
Table 5.26 (Continued)Size and Local Government Functioning—Summary of Polish Findings
Issue Category Variables (Indicators) Theoretical Expectations EmpiricalAccording to: Evidence
in Poland
Reform Public ChoiceTheory or Localism
(Economies Theoryof Scale)
Local Citizens’ Turn-out in elections, + — —democracy interest declared interest
in localgovernment
Citizens’ Various survey measures — —trust in localgovernments
Pluralist local Competition + +politics in local elections
Citizens’ Various survey measures — —satisfaction
Political Number of councilors + ?transaction constituting the majority,costs the share of big political
parties representativesamong councilors, conflictsbetween parts (villages,city districts) of localgovernment’s territory
Democratic Number of councilors rep. — —representation 1,000 inhabitants and per
settlement unit
Human Councilors’ level of + +capital educationpotential
279
E C O N O M I E S A N D D I S E C O N O M I E S O F S C A L E I N P O L I S H L O C A L G O V E R N M E N T S
8.1 Efficient Function of the Municipality—Attemptsat Building a Composite Index and Relationship With Size
The goal of this attempt to build a composite index of local government efficiency is tosummarize the findings described in the previous sections as well as to confirm somegeneral, theoretical relationships between the size and efficiency in economic developmentand public management.
The construction of an index will consist of three steps:• STEP 1—Defining the efficiency (performance) in terms of the factors described
in previous section.• STEP 2—Matching variables for the factors and developing the final formula
describing efficiency of the municipality.• STEP 3—Verifying the relationship between size and efficiency.
8.1.1 Defining the Efficiency (Performance)
Let us consider the overall performance (P) of the municipality as the difference betweenits economic potential (E) and the sum of costs related to provision of communalservices (S) and function of local democracy (D). The formula denoting municipality’sperformance is:
(1) P = a1 x E – (a
2 x S + a
3 x D)
where a1, a
2, a
3 are weights coefficients reflecting the contribution of factors to
overall performance of local government.
Thus, we assume the linear relationship between the measure of efficiency (P) andeach of the factors E,S,D. However, we do not impose any particular form of therelationship between overall performance (P) and size of the municipality. Indeed, themunicipality’s size (measured by population) is introduced to the analysis indirectly,via the factors E,S,D. What our indicator says is that the impact of size on the efficiencyof local governments is an aggregate of the three relationships:
• between size and economic potential;• between size and efficiency in service provision;• between size and quality of local democracy.
The crucial element of the index refers to values of weights a1, a
2, a
3, attributed
respectively to the factors E, S, D. The decision to pay more attention to one factor
280
C O N S O L I D A T I O N O R F R A G M E N T A T I O N ?
D F I D – L G I L O C A L G O V E R N M E N T P O L I C Y P A R T N E R S H I P P R O G R A M
depends on the values we believe in, rather than on scientific considerations. Startingwith the democratic theory, we may treat functioning of democratic system as themost important. In a more economic-pragmatic approach, we may focus on provisionability and costs of services. But, for example, starting from Peterson’s “city limits”theory (1981), we may assume that capacity to promote economic development isabsolutely crucial and, in fact, determines the ability of local government to performany other social functions.
The values of weights a1, a
2, a
3 clearly depend on some general assumptions made
by the researcher or, under another approach, on the importance attributed to differentissues of municipality’s public life by local society. Therefore, the goal of developingthe indicator should not be considered in terms of finding “the optimal size” of themunicipality or defining the precise function explaining the influence of populationnumber on the local quality of life. Instead, the indicator should show how therelationship between size and efficiency changes in reaction to the shifts in the relativeimportance given to the three elements constituting the local development.
8.1.2 Matching Variables, Developing the Final Formula forthe Efficiency (Performance)
The empirical application of the equation (1) is conducted with a sample of about1,900 (out of 2,489) Polish municipalities. We have decided to exclude cases in whichimpact of size may be significantly distorted by various factors:
• 65 cities with county status–due to different (wider) scope of tasks;• boroughs of Warsaw, which have different functions than other municipalities;• a few extremely affluent municipalities, in which the 2000 revenue per capita
exceeded the national mean, plus 10 standard deviations;• municipalities located within metropolitan areas, whose functions and affluence
are heavily dependent on their role within metropolitan areas.
Each factor of the indicator is represented by the unweighted average of the stan-dardized indicators. Variables included are presented in Table 5.27.
Therefore the equation (1) takes form:
(2)
where i, j, k show the number of the variable within the three factors (E,S, D).
P = a1 x Σe
i/4 – (a
2 x Σs
j/3 + a
3 x Σd
k/3)
i = 1
4
j = 1
3
k =1
3
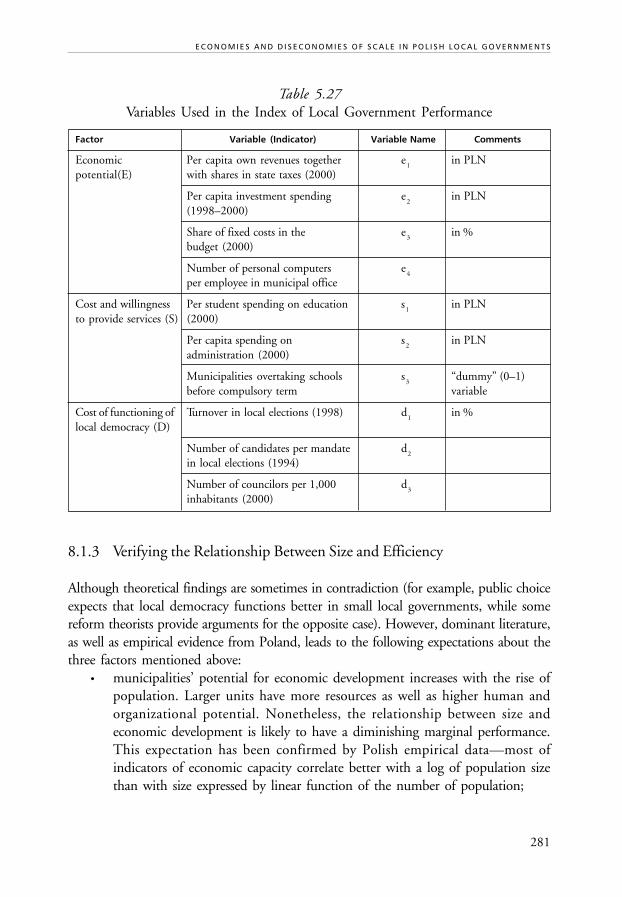
281
E C O N O M I E S A N D D I S E C O N O M I E S O F S C A L E I N P O L I S H L O C A L G O V E R N M E N T S
Table 5.27Variables Used in the Index of Local Government Performance
Factor Variable (Indicator) Variable Name Comments
Economic Per capita own revenues together e1
in PLNpotential(E) with shares in state taxes (2000)
Per capita investment spending e2
in PLN(1998–2000)
Share of fixed costs in the e3
in %budget (2000)
Number of personal computers e4
per employee in municipal office
Cost and willingness Per student spending on education s1
in PLNto provide services (S) (2000)
Per capita spending on s2
in PLNadministration (2000)
Municipalities overtaking schools s3
“dummy” (0–1)before compulsory term variable
Cost of functioning of Turnover in local elections (1998) d1
in %local democracy (D)
Number of candidates per mandate d2
in local elections (1994)
Number of councilors per 1,000 d3
inhabitants (2000)
8.1.3 Verifying the Relationship Between Size and Efficiency
Although theoretical findings are sometimes in contradiction (for example, public choiceexpects that local democracy functions better in small local governments, while somereform theorists provide arguments for the opposite case). However, dominant literature,as well as empirical evidence from Poland, leads to the following expectations about thethree factors mentioned above:
• municipalities’ potential for economic development increases with the rise ofpopulation. Larger units have more resources as well as higher human andorganizational potential. Nonetheless, the relationship between size andeconomic development is likely to have a diminishing marginal performance.This expectation has been confirmed by Polish empirical data—most ofindicators of economic capacity correlate better with a log of population sizethan with size expressed by linear function of the number of population;
282
C O N S O L I D A T I O N O R F R A G M E N T A T I O N ?
D F I D – L G I L O C A L G O V E R N M E N T P O L I C Y P A R T N E R S H I P P R O G R A M
• the “unit cost of services’” factor is likely to work in favor of big municipalities,as the unit cost of provided services falls with the increase of population. Also,large governments are better equipped to provide larger number of services.However, one may expect a threshold size, above which the service factor valueis negatively related to the size. Big cities providing services to its’ citizens, facenot only the economies of scale but also diseconomies related to the problemsof co-ordination in large organizations as well as additional infrastructure costs.We should add, however, that the latter phenomenon has not been observed sofar in Polish empirical data;
• most of the results in Polish empirical analysis suggest that idea of local democracyworks better in small units, where relationship between authorities and citizensis closer and more direct. An exception to this rule is the higher pluralism oflocal politics identified in large municipalities.
The data available for our empirical research does not always allow us to identifythe “optimal size” of the municipality. Not by applying analyses focused on particularissues of local development, nor by using more “holistic” model approaches. Also,many sociological surveys which we quoted use very broad size categories which lowersthe precision of the approximations. Nonetheless, whenever we could speak of ‘efficientsize’, it has been somewhere between 10 and 50 thousand residents. For example,local governments below and above 50,000 clearly differ from the point of view offollowing measures:
• turn-out in local elections;• education structure of councilors;• number of candidates per seat in local election.
Those in the 10,000 size seem to be a breaking point for an even larger number ofindicators such as:
• citizens’ opinion that local powers are too narrow (somewhere around size 10–20,000);
• mayors’ opinion that councilors often loose touch with ordinary people;• ratio of councilors per inhabitants (somewhere around 30,000);• size of local government spending on administrative (per capita);• use of internet and computers in local administration;• size of local government investments per capita;• local government budget dependency on state grants;• attendance rate in kindergartens;• average class size in primary schools and, as a consequence, per pupil cost for
primary education.
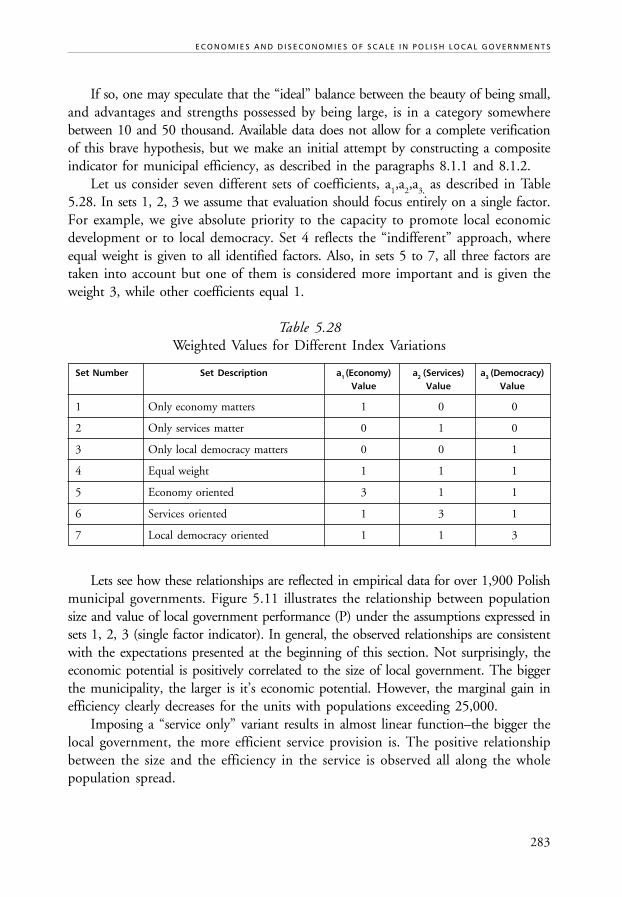
283
E C O N O M I E S A N D D I S E C O N O M I E S O F S C A L E I N P O L I S H L O C A L G O V E R N M E N T S
If so, one may speculate that the “ideal” balance between the beauty of being small,and advantages and strengths possessed by being large, is in a category somewherebetween 10 and 50 thousand. Available data does not allow for a complete verificationof this brave hypothesis, but we make an initial attempt by constructing a compositeindicator for municipal efficiency, as described in the paragraphs 8.1.1 and 8.1.2.
Let us consider seven different sets of coefficients, a1,a
2,a
3, as described in Table
5.28. In sets 1, 2, 3 we assume that evaluation should focus entirely on a single factor.For example, we give absolute priority to the capacity to promote local economicdevelopment or to local democracy. Set 4 reflects the “indifferent” approach, whereequal weight is given to all identified factors. Also, in sets 5 to 7, all three factors aretaken into account but one of them is considered more important and is given theweight 3, while other coefficients equal 1.
Table 5.28Weighted Values for Different Index Variations
Set Number Set Description a1 (Economy) a2 (Services) a3 (Democracy)Value Value Value
1 Only economy matters 1 0 0
2 Only services matter 0 1 0
3 Only local democracy matters 0 0 1
4 Equal weight 1 1 1
5 Economy oriented 3 1 1
6 Services oriented 1 3 1
7 Local democracy oriented 1 1 3
Lets see how these relationships are reflected in empirical data for over 1,900 Polishmunicipal governments. Figure 5.11 illustrates the relationship between populationsize and value of local government performance (P) under the assumptions expressed insets 1, 2, 3 (single factor indicator). In general, the observed relationships are consistentwith the expectations presented at the beginning of this section. Not surprisingly, theeconomic potential is positively correlated to the size of local government. The biggerthe municipality, the larger is it’s economic potential. However, the marginal gain inefficiency clearly decreases for the units with populations exceeding 25,000.
Imposing a “service only” variant results in almost linear function–the bigger thelocal government, the more efficient service provision is. The positive relationshipbetween the size and the efficiency in the service is observed all along the wholepopulation spread.
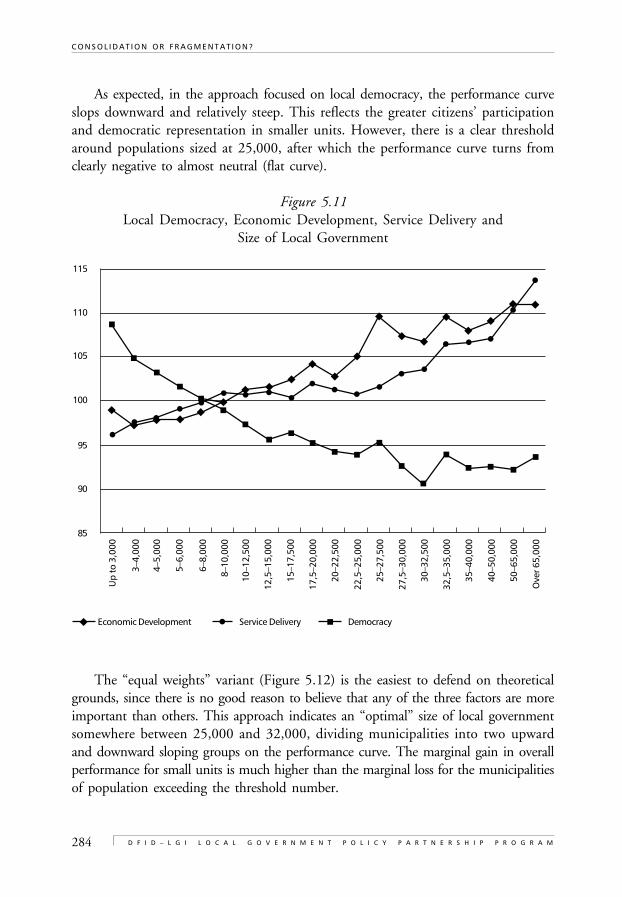
284
C O N S O L I D A T I O N O R F R A G M E N T A T I O N ?
D F I D – L G I L O C A L G O V E R N M E N T P O L I C Y P A R T N E R S H I P P R O G R A M
As expected, in the approach focused on local democracy, the performance curveslops downward and relatively steep. This reflects the greater citizens’ participationand democratic representation in smaller units. However, there is a clear thresholdaround populations sized at 25,000, after which the performance curve turns fromclearly negative to almost neutral (flat curve).
Figure 5.11Local Democracy, Economic Development, Service Delivery and
Size of Local Government
The “equal weights” variant (Figure 5.12) is the easiest to defend on theoreticalgrounds, since there is no good reason to believe that any of the three factors are moreimportant than others. This approach indicates an “optimal” size of local governmentsomewhere between 25,000 and 32,000, dividing municipalities into two upwardand downward sloping groups on the performance curve. The marginal gain in overallperformance for small units is much higher than the marginal loss for the municipalitiesof population exceeding the threshold number.
Up
to 3
,000
3–4,
000
4–5,
000
5–6,
000
6–8,
000
8–10
,000
10–1
2,50
0
15–1
7,50
0
17,5
–20,
000
20–2
2,50
0
22,5
–25,
000
115
110
105
100
95
85
90
Economic Development Service Delivery
12,5
–15,
000
25–2
7,50
0
27,5
–30,
000
30–3
2,50
0
32,5
–35,
000
35–4
0,00
0
40–5
0,00
0
50–6
5,00
0
Ove
r 65,
000
Democracy
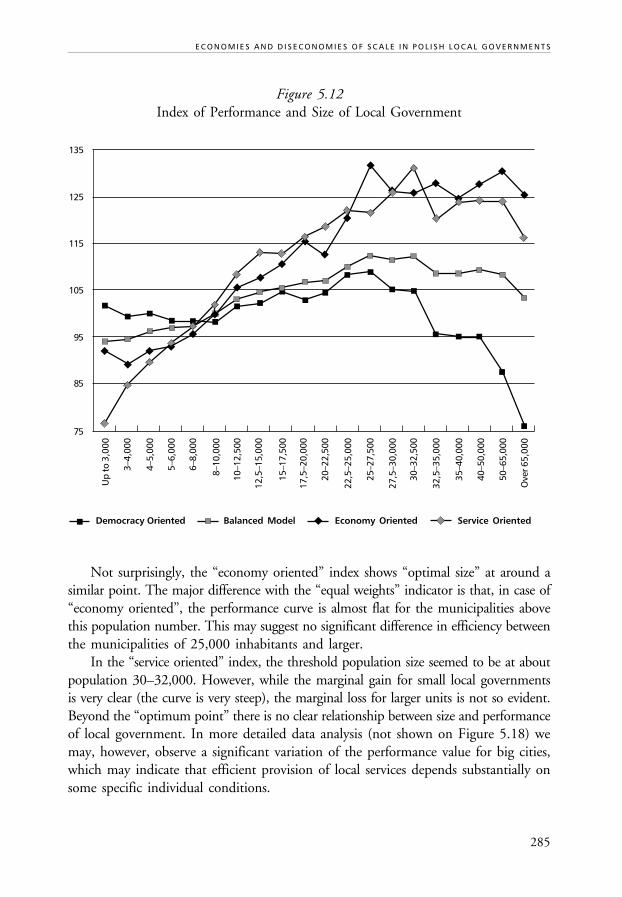
285
E C O N O M I E S A N D D I S E C O N O M I E S O F S C A L E I N P O L I S H L O C A L G O V E R N M E N T S
Figure 5.12Index of Performance and Size of Local Government
Not surprisingly, the “economy oriented” index shows “optimal size” at around asimilar point. The major difference with the “equal weights” indicator is that, in case of“economy oriented”, the performance curve is almost flat for the municipalities abovethis population number. This may suggest no significant difference in efficiency betweenthe municipalities of 25,000 inhabitants and larger.
In the “service oriented” index, the threshold population size seemed to be at aboutpopulation 30–32,000. However, while the marginal gain for small local governmentsis very clear (the curve is very steep), the marginal loss for larger units is not so evident.Beyond the “optimum point” there is no clear relationship between size and performanceof local government. In more detailed data analysis (not shown on Figure 5.18) wemay, however, observe a significant variation of the performance value for big cities,which may indicate that efficient provision of local services depends substantially onsome specific individual conditions.
Up
to 3
,000
3–4,
000
4–5,
000
5–6,
000
6–8,
000
8–10
,000
10–1
2,50
0
15–1
7,50
0
17,5
–20,
000
20–2
2,50
0
22,5
–25,
000
135
125
115
105
95
75
85
12,5
–15,
000
25–2
7,50
0
27,5
–30,
000
30–3
2,50
0
32,5
–35,
000
35–4
0,00
0
40–5
0,00
0
50–6
5,00
0
Ove
r 65,
000
Democracy Oriented Balanced Model Economy Oriented Service Oriented
286
C O N S O L I D A T I O N O R F R A G M E N T A T I O N ?
D F I D – L G I L O C A L G O V E R N M E N T P O L I C Y P A R T N E R S H I P P R O G R A M
Finally, the “local democracy oriented” variant clearly “worsens” the performanceof big cities, moves the “pick performance” point down to about 22–27,000 andmakes the performance curve slop sharply downward for high population numbers.
In all 4 variants the “optimal” point is somewhere between a population of 22 and32 thousand. Interestingly, this result is not very different from Plato’s theoreticalconsiderations (see the quotation in Chapter 1 of this book).
8.2 Practical Recommendations
Do the findings described in this chapter bring us to any practical recommendations forthe territorial organization of local governments? In Poland, the discussion over the sizeof local government is not a very hot issue. However, it is occasionally the focus of socialattention. It is not so often the case on a municipal level, although in some cases pro-fragmentation tendencies dominate the local political scene. More commonly, there hasbeen recent discussion on the size of county tier governments and one can expect thatthe pressure for further changes will continue. The creation of 7 new counties at thebeginning of 2002 is a good illustration of this phenomenon. Unfortunately, a lot of theevidence analyzed in this chapter is rooted in the municipal level. Though some examplesfrom counties (spending on administration, free-riding phenomenon in secondaryeducation) have been discussed as well. Therefore, some of our observations could betreated as useful practical recommendations for policy makers, both on a local andcentral level. Perhaps more important still, Polish experiences may be interesting materialfor other countries in the Central-East European region which are now undergoing avery lively discussion of the “size issue” (Czech Republic, Hungary, Slovakia, Ukraine).
How can these practical recommendations can be summarized? Below, we presenta list of issue recommendations which are, of course, selected and formulated subjectively,but are based on objective empirical evidences:
• Do not allow more fragmentation on a county level. This would lead to strengthen-ing the free-riding effect, would increase the unit costs of some services (mostcertainly with administrative overhead). Polish counties have very limited poten-tial for undertaking infrastructure projects and further fragmentation wouldreduce this potential even more. On the other hand, at this size level, theexpected positive change in local democracy function is rather an illusion.So, for reasons enumerated just above, the suggested development should beconsolidation, rather than fragmentation.
• Make sure the consequences of a municipality’s split are recognized by and clear forthe local population. Sometimes the level of conflicts within a municipality makes“divorce” difficult to avoid. There are also positive consequences of such a splitwhich should not be neglected, even though, as we have shown in this chapter,
287
E C O N O M I E S A N D D I S E C O N O M I E S O F S C A L E I N P O L I S H L O C A L G O V E R N M E N T S
these positive results are frequently over-estimated. Quite often, the localpopulation is not aware of the negative consequences of fragmentation such asincrease of costs and reduced capacity to provide services. This message shouldbe always very clearly communicated to citizens before they have to expresstheir opinion in public consultation (by referendum or any other method ofconsultation which is applied).
• Remember that a fragmented territorial system is more costly to the state budget.Small local governments have larger operational spending (expressed on a percapita basis), they cannot cover these with their own revenues and requiregreater assistance in the form of transfers from the state budget.
• In case of amalgamation, protect a form of the village autonomy. This is a Polishexperience, but also recognized in other countries with multi-village ruralgovernments (parishes in United Kingdom, and in Scandinavia). The villagelevel of government, even with very limited and mostly symbolic powers, isvery important to the protection of village pride and identity. The Polish soltysis an important local leader and his presence, together with a formal recognitionof the “village meeting” institution, clearly contributes to the strength of localdemocracy in rural areas.
• Encourage co-operation between municipal governments. Regardless of the territo-rial organization model type, there are always functions which can be performedmore effectively when a few local governments co-operate with each other. InPoland, where municipal governments are rather large, this is clearly this casewith solid waste management, tourist development, or environmentalprotection. The process of co-operation should not be left only to spontaneousdevelopment. This is more valuable if co-operation is voluntary, but it mightstimulate co-operation if there are policies which provide incentives (possiblyincluding financial incentives). In Poland, lack of such incentives is a mainreason why most local governments try to cope (often ineffectively) with wastemanagement alone. At the same time, availability of EU funds for local infra-structure investments caused some municipalities to co-operate on joint projectsin order to meet formal requirements which were difficult to meet alone.
• Better representation and closer links between authorities and citizens are real valuesin small governments and should be protected. Therefore, the recently declaredtendency to reduce the number of councilors in Polish local governments shouldbe stopped, at least in rural areas. Such a change would increase the number ofvillages not represented in the council and may be harmful to local democracyin small communities. Yet again, the change in a number of councilors in largelocal governments is probably not so very important from a democratic principlespoint of view. While the reduction may bring some cut costs and betterorganization in the decision-making process, it could mean the relationship
288
C O N S O L I D A T I O N O R F R A G M E N T A T I O N ?
D F I D – L G I L O C A L G O V E R N M E N T P O L I C Y P A R T N E R S H I P P R O G R A M
between size of local government and size of a council could be more flat thanit is nowadays.
• The majority system and single-ward system is worthy of consideration for all ruraland mixed urban-rural governments, regardless their population size. Such a solutionshould support balanced representation of settlement units in the council. Theproportional system (currently in all municipalities over 20,000 citizens) maylead to a situation in which the largest settlement unit is greatly over-represented,leaving smaller villages under- or not-represented at all in the council.
• Available evidence suggests that a population size of 10,000 provides sufficient capacityfor effective provision of many services. This factor should be taken into considerationwhen any concrete decisions on fragmentation or amalgamation are to be made.
REFERENCES
Aziewicz, T. (1994). Prywatyzacja uslug komunalnych w Polsce. Gdansk: The GdanskInstitute for Market Economics.
Aziewicz, T. (1998). Gospodarka rynkowa w uslugach komunalnych. Gdansk: The GdanskInstitute for Market Economics.
Bartkowska-Nowak, D. (2001). “Czy urzedy samorzadowe potrzebuja procedurkadrowych?” Samorzad Terytorialny, No. 7–8.
Clark, T.N. (1971). “Power and Community Structure: Who Governs, Where andWhen?” In Bonjean, C.M., Clark, T.N., and Lineberry, R.L. (Eds.) CommunityPolitics: A Behavioral Approach. New York: The Free Press.
Cwikla, M. (2001). Finansowanie oswiaty samorzadowej w Polsce. MA thesis, Instituteof Economics, Catholic University of Lublin.
Emilewicz, J., and Wolek, A. (2000). Reformatorzy i politycy. Warszawa: FRDL.
Grochowski, M. (1991). “Praktyki spoleczne wladz lokalnych”. In Jalowiecki, B., andSwianiewicz, P. (Ed.) Miedzy nadzieja i rozczarowaniem: samorzad terytorialny rokpo wyborach. EUROREG, University of Warsaw.
Jalowiecki, B. (Ed.) (1995). Funkcjonowanie gmin podzielonych i zespolonych. Reportprepared for the OMEGA-PHARE Programme, EUROREG, University of Warsaw.
Jalowiecki, B. (1999). “Ruchy regionalne czy bunt elit? Obserwacja protestówspolecznych”. In Gorzelak, G. (Ed.) Decentralizacja terytorialnej organizacji kraju:zaloz·enia, przygotowanie, ustawodawstwo. Warszawa: CASE.
Karnkowski, P. (1996). “Zwiazki komunalne i ich rozmieszczenie w ukladzie woje-wódzkim”. Finanse Komunalne, No. 6.
˛ ˛ ˛˛
˛
˛ ˛
˛
289
E C O N O M I E S A N D D I S E C O N O M I E S O F S C A L E I N P O L I S H L O C A L G O V E R N M E N T S
Keating, M. (1995). “Size, Efficiency and Democracy: Consolidation, Fragmentationand Public Choice”. In Judge, D., Stoker, G., and Wolman, H. (Eds.). Theories ofUrban Politics. London–Thousand Oaks–New Delhi: Sage.
King, D.S. (1984). Fiscal Tiers: Economics of Multi-level Government. London: Allen &Unwin.
Kowalska, R. (2002). Zwiazki miedzygminne jako forma wykonywania zadan publicznychw gminie. MA Thesis, University of Warsaw.
Malewska-Szalygin, A. (2001). “Komu potrzeba jest demokracja? Wyobraz•enia o wladzylokalnej w mazurskiej gminie lat 90-tych”. Kultura i Spoleczenstwo, No. 1/2.
Mielczarek, A., and Domanska, A. (1999). “Funkcjonowanie gminy Dukla w aspekciekomunikacji z mieszkancami”. Report prepared by Partners Foundation for USAIDLocal Government Partnership Program, Warszawa.
Miros, M. (2002). “Sprawozdanie z wykonania budzetu za rok 2001 oraz informacjao stanie zaawansowania poszczególnych elementów Strategii Rozwoju gminyGoldap”. Goldap: Urzad Miasta.
Mouritzen, P.E. (1989): “City Size and Citizens’ Satisfaction: Two Competing TheoriesRevisited”. European Journal of Political Research, Vol. 17.
Peterson, P. (1981). City Limits. University of Chicago Press.
Regionalna gospodarka odpadami, 1998. (Warszawa: Co-operation Fund).
Sharpe, L.J. (1995). “Local Government: Size, Efficiency and Citizen Participation”.In “The Size of Municipalities, Efficiency and Citizen Participation”. Local andRegional Authorities in Europe, No. 56. Strasbourg: Council of Europe.
Starypan, J. (1999). “Regionalna gospodarka odpadami na Z·ywiecczyz· nie”. In Efektywna
gospodarka odpadami komunalnymi: jak to zrobic?, (Kraków: LEM Projekt).
Swianiewicz, P., and Bukowski, J. (1992). “Krytyczna analiza dzialalnosci wladzlokalnych”. Wspólnota, No. 13.
Swianiewicz, P. (1996). Zróz•nicowanie polityk finansowych wladz lokalnych. Gdansk:The Gdansk Institute for Market Economics.
Swianiewicz, P., and Amos, F.J.C. (1998). “Wskazniki porównawcze potrzeb i wydatkówsamorzadowych; doswiadczenia brytyjskie i rzeczywistosc polska”. In Swianiewicz,P. (Ed.) System Analiz Samorza²dowych: jak oceniac i mierzyc zakres i jakosc uslugsamorzadowych. Warszawa: British Know How Fund, Local Government AssistanceProgramme.
Swianiewicz, P. (2000). “Institutional Performance of Local Government Administrationin Poland”. In Jabes, J. (Ed.) Ten Years of Transition: Prospects and Challenges for the
˛ ˛
˛
˛
290
C O N S O L I D A T I O N O R F R A G M E N T A T I O N ?
D F I D – L G I L O C A L G O V E R N M E N T P O L I C Y P A R T N E R S H I P P R O G R A M
Future of Public Administration. Proceedings from the 10th NISPAcee Annual Con-ference, Budapest 13–15 April 2000.
Swianiewicz, P. (Ed.) (2001). Public Perception of Local Governments in East-CentralEurope. Budapest: OSI/LGI.
Thurmaier, K., and Swianiewicz, P. (1996). “Primary School Decentralisation in Poland:Nurturing the Roots of Democracy”. In Depth, Vol. 5, No. 2.
Weber, M. (2002). “Plonne nadzieje”. Wspólnota, No. 15.
Zell, Z. (2001a). “Solecka pierwsza klasa”. Wspólnota, No. 3.
Zell, Z. (2001b). “Finansowanie potrzeb solectwa”. Wspólnota, No. 47.
NOTES
1 Pawel Swianiewicz is a professor and Mikolaj Herbst a research assistant at theEuropean Institute for Regional and Local Development, University of Warsaw.
2 Similar observations on a wider European level were made by Page and Goldsmith(1987) who noticed that territorial organisation is very much related to the allocationof functions. Small (fragmented) local governments are usually unable to takeresponsibility for many services, which need to be delivered by upper tiers ofgovernments.
3 A mixed municipality consists of a (usually small) town and several surroundingrural villages.
4 Some of these are called “around-the-city-counties” consisting of municipalitiessurrounding metropolitan counties
5 It is very difficult to find the proper English terms, but in this chapter we usethe term “village” for larger settlement units (solectwo) and the term “settlementunit” for any, even the smallest, unit.
6 LDI–Local Democracy and Innovation Project sponsored by the Norwegiangovernment. The survey quoted here was conducted in 1997 with a sample ofover 1,000 mayors from the Czech Republic, Poland and Slovakia.
7 Several arguments on the relationship between size of municipality and localdemocracy have been already presented in the LGPP study on “Public Perceptionof Local Governments” [Swianiewicz, 2001]. In this book, we do not repeat thisdata. We present only general conclusions and focus on the aspects which werenot analyzed in the public perception study.
291
E C O N O M I E S A N D D I S E C O N O M I E S O F S C A L E I N P O L I S H L O C A L G O V E R N M E N T S
8 Unfortunately we do not have data from the, more recent, local election of 19989 A village leader (soltys) plays a very important as a local leader at a village level.
Often times, a village leader plays a crucial role as a channel of communicationbetween the local government executive board and citizens within individualvillages [Mielczarek and Domanska, 1999].
1 0 Survey organized December 2001 as a part of the LGPP “size” project with thesupport of the National Association of Village Leaders. A total of 395 respondents,from 87 local governments located in 4 regions, were interviewed.
1 1 As elsewhere in this paper *** marks the correlation coefficient significant on0.001 level, ** on 0.01 level and * on a 0.05 level.
1 2 Her research concentrated on urban municipalities with a population size under50,000. Bartkowska-Nowak distinguished between small, average and large localadministrations on a base of the total number employed at city hall (in herclassification, small administration had less than 33 clerks and large over 52clerks). However, the number of local administrative employees is stronglycorrelated with population size, so we can draw conclusions on differencesbetween small and large local governments as well.
1 3 Correlation coefficients in Table 5.14 are the most telling. Comparing groupmeans in the Table 5.20 is sometimes misleading, because of small groups invery small governments, which for a variety of reasons have extremely high revenuesper capita. These very limited number of very affluent municipalities are reflectedin the group mean and in a very high standard deviation for the group.
1 4 A full description of the complicated methodology to determine which of cityexpenditures should be treated as fixed, as applied in this paper, would be toolong to fit within limited space available. However, to give some example, wetreat expenditures related to standard salaries of local government staff, or heatingof municipal premises, as fixed.
1 5 The subvention is formally a non-targeted grant, which means it may be spenton any purpose, not necessarily related to education. However, in the vastmajority of municipalities, actual current spending on education is higher thanthe received grants.
1 6 Among other issues, the 1999 reforms involved transforming the former 8-yearprimary school into two-tier system of primary (6-year) and middle level school(3-year). Municipalities covered most of the cost related to these changes. Also,in 1999, the controversial law on teacher’s rights (Teacher’s Chart) was approvedby Parliament. This raised the teachers’ remuneration without sufficiently in-creasing the education grant for the municipalities. For this, and other reasons,
292
C O N S O L I D A T I O N O R F R A G M E N T A T I O N ?
D F I D – L G I L O C A L G O V E R N M E N T P O L I C Y P A R T N E R S H I P P R O G R A M
the share of municipalities’ own resources in current education spending increasedfrom 8% in 1998 to 20% in 2000. Also, the proportion of municipalities who“subsidized the education grant” from their own revenue sources increased from83% in 1994 to 96 in 1999 [Cwikla, 2001] and then to over 99% in 2000.
1 7 Average teachers’ salaries are set by law, but local governments are free to pay anadditional remuneration. Frequently, they pay more to offset the higher cost ofliving in the cities and to attract foreign languages teachers, etc.
1 8 By “attendance rate”, we mean the ratio of students attending local schools vs.the number of 15–18 years old inhabitants, or the graduates of local primaryschools.
Is There a Third WayBetween Small yet Ineffectiveand Big yet Less Democratic?
Comparative Conclusionsand Lessons Learned
Pawel Swianiewicz
C H A P T E R 6

294
C O N S O L I D A T I O N O R F R A G M E N T A T I O N ?
D F I D – L G I L O C A L G O V E R N M E N T P O L I C Y P A R T N E R S H I P P R O G R A M
295
C O M PA R AT I V E C O N C LU S I O N S A N D L E S S O N S L E A R N E D
Table of Contents
1. How Has Territorial Organization Changed Since 1990? ......................... 297
2. Territorially Fragmented versus Territorially Consolidated Systems—Definition ................................................................................................ 300
3. National Debates on the Size of Local Governments ................................. 301
4. Size and Allocation of Functions ................................................................ 3024.1 More Functional Decentralization
in Countries with Bigger Municipalities? .......................................... 3024.2 Illusion of the Same Function for Every Local Government ............. 304
5. Cost of Service Delivery—the Case for Economy of Scale ......................... 305
6. Big is Stronger—Size and Capacity for Economic Development .............. 308
7. Small is Liked—the Case for Local Democracy .......................................... 310
8. Voluntary Co-operation of Municipal Governments ................................. 312
9. Relationship Between “Municipal Capital”and “Municipal Periphery” ......................................................................... 315
10. Conclusions and Recommendations ........................................................... 317
References ............................................................................................................. 323
Notes .................................................................................................................... 324

296
C O N S O L I D A T I O N O R F R A G M E N T A T I O N ?
D F I D – L G I L O C A L G O V E R N M E N T P O L I C Y P A R T N E R S H I P P R O G R A M
297
C O M PA R AT I V E C O N C LU S I O N S A N D L E S S O N S L E A R N E D
Is There a Third Way Between Smallyet Ineffective and Big yet Less Democratic?Comparative Conclusionsand Lessons Learned
Pawel Swianiewicz
After the presentation of theoretical expectations in the first chapter (which are eitherinconclusive or, depending on the stress on particular values, lead in the oppositedirection) and after presenting the empirical findings of individual countries, wemay ask; do these observations allow for more general conclusions? And are thereany practical recommendations stemming from them? These are the main questionsdiscussed in the present chapter. However, before turning to empirical evidence onlocal government function in relationship to its size, we need to focus briefly on aninstitutional setting which is very different in each of countries considered.
1. HOW HAS TERRITORIAL ORGANIZATION CHANGED SINCE 1990?
As it was mentioned in chapter 1, the 1989/1990 political transformations broughtsignificant changes in the territorial organization of the municipal level in some countries(Czech Republic, Slovakia, Hungary). While in some others (Poland, Bulgaria) thelevel of fragmentation/consolidation remained mostly unchanged. Contrary to the eventsin several West European countries during the 1960s and 1970s (see chapter 1), thechange led rather to a more fragmented, not to a territorially amalgamated, system.As a result, among the countries which are analyzed in this book, there are two verydistinct models of territorial organization on the municipal level: those that are territoriallyfragmented, as in the Czech Republic, Hungary, Slovakia, and those which are territoriallyconsolidated as in Bulgaria and Poland. It seems inevitable that allocation of functions,relationship between municipalities, other tiers of administration, as well as the everydayfunctioning of local governments, must differ in such distinct institutional settings.
In the discussion of underlying reasons for these variations, one might put severalexplanatory factors, such as:
298
C O N S O L I D A T I O N O R F R A G M E N T A T I O N ?
D F I D – L G I L O C A L G O V E R N M E N T P O L I C Y P A R T N E R S H I P P R O G R A M
• the perception of the main values of local democracy. There is some evidencethat in the Czech and Slovak Republics the communitarian approach, seeingfirst and foremost the representational role of local government, has beendominant. While in Poland, the more liberal attitude, placing more emphasizeon efficiency in local service delivery, has been more visible [for more detailsee the discussion in Swianiewicz, 2001]. The former approach led to the“freedom of fragmentation” while the latter demanded maintenance of thelarger local government units. A quite similar line of argumentation for West-European countries has been presented by Goldsmith (1995);
• various levels of public sector control over the rural communist economy. InPoland, a large part of the rural economy was organized around private farmswhile, in other countries in the region, the kolkhoz structures (often identicalwith the territorial administrative units) very much dominated every day life.Therefore, territorial organization was “more visible” for average citizens andthe oppression of the “central village” in the municipality was much morepainful. It led to the demand for village autonomy as soon as the democratiza-tion process would allow for such a change;
• depth of democratization and decentralization reforms. At the beginning of1990s, decentralization reform in Bulgaria was much more modest than inother countries discussed in this book. The limited reform did not produceenough space (or incentives) for a bottom-up demand for fragmentation.
But whichever of these underlying reasons we treat as the most convincing, thereare some immediate differences between the ways various countries make decisions onterritorial division at the lowest level. These are differences between legal regulations.They are perhaps the most rigid in Poland where the law says vaguely about “consul-tations” with local community and yet the central level is free to make a decision onthe splitting or merging of municipal governments even against the opinion expressedin these consultations. In Bulgaria, the role of local public opinion is slightly greater.A decision on establishment or liquidation of municipality requires, not an undefinedtype of consultation but, namely a referendum. It is impossible to change the territorialdivision if the local community votes in opposition to it. However, if the referendumproves there is public support for a change in the territorial organization, the centralgovernment may, but does not have to, proceed based on this opinion. There areseveral conditions in order for a new municipality to be formed: it should have aminimal population of 6,000 people, it should have central settlement unit, minimalfinancial capacity and—furthermore—the maximum distance between villageslocated within the municipality should not exceed 40 kilometers.
Similarly in the Czech Republic, Hungary, and Slovakia, no change can beintroduced without the agreement of the local population. Since the beginning of
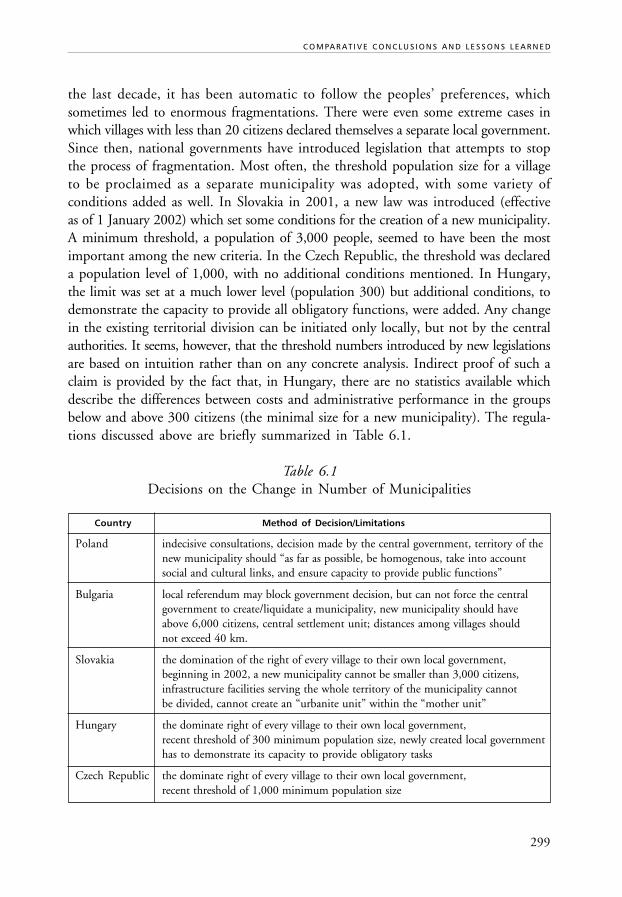
299
C O M PA R AT I V E C O N C LU S I O N S A N D L E S S O N S L E A R N E D
the last decade, it has been automatic to follow the peoples’ preferences, whichsometimes led to enormous fragmentations. There were even some extreme cases inwhich villages with less than 20 citizens declared themselves a separate local government.Since then, national governments have introduced legislation that attempts to stopthe process of fragmentation. Most often, the threshold population size for a villageto be proclaimed as a separate municipality was adopted, with some variety ofconditions added as well. In Slovakia in 2001, a new law was introduced (effectiveas of 1 January 2002) which set some conditions for the creation of a new municipality.A minimum threshold, a population of 3,000 people, seemed to have been the mostimportant among the new criteria. In the Czech Republic, the threshold was declareda population level of 1,000, with no additional conditions mentioned. In Hungary,the limit was set at a much lower level (population 300) but additional conditions, todemonstrate the capacity to provide all obligatory functions, were added. Any changein the existing territorial division can be initiated only locally, but not by the centralauthorities. It seems, however, that the threshold numbers introduced by new legislationsare based on intuition rather than on any concrete analysis. Indirect proof of such aclaim is provided by the fact that, in Hungary, there are no statistics available whichdescribe the differences between costs and administrative performance in the groupsbelow and above 300 citizens (the minimal size for a new municipality). The regula-tions discussed above are briefly summarized in Table 6.1.
Table 6.1Decisions on the Change in Number of Municipalities
Country Method of Decision/Limitations
Poland indecisive consultations, decision made by the central government, territory of thenew municipality should “as far as possible, be homogenous, take into accountsocial and cultural links, and ensure capacity to provide public functions”
Bulgaria local referendum may block government decision, but can not force the centralgovernment to create/liquidate a municipality, new municipality should haveabove 6,000 citizens, central settlement unit; distances among villages shouldnot exceed 40 km.
Slovakia the domination of the right of every village to their own local government,beginning in 2002, a new municipality cannot be smaller than 3,000 citizens,infrastructure facilities serving the whole territory of the municipality cannotbe divided, cannot create an “urbanite unit” within the “mother unit”
Hungary the dominate right of every village to their own local government,recent threshold of 300 minimum population size, newly created local governmenthas to demonstrate its capacity to provide obligatory tasks
Czech Republic the dominate right of every village to their own local government,recent threshold of 1,000 minimum population size
300
C O N S O L I D A T I O N O R F R A G M E N T A T I O N ?
D F I D – L G I L O C A L G O V E R N M E N T P O L I C Y P A R T N E R S H I P P R O G R A M
Another dimension of territorial changes after 1989 relates to new divisions andthe creation of elected self-governments on the regional level. During the last fiveyears, re-organization concerning this has been implemented in the Czech Republic,Slovakia and Poland. In Hungary, the upper (county) tier of self-government hasexisted throughout the whole of the 1990s, but it has been relatively weak through-out. In Bulgaria, there is still only one level of self-government. Yet, introduction ofregional self-government seems quite unlikely in the near future even though sucha recommendation has been formulated by several experts (including authors of thereport in this book). Interestingly enough, amongst the analyzed countries, Poland isthe only one in which the elected regional governments cover territory identical withNUTS 2 units, which play an important role in the implementation of EuropeanUnion regional policies [Z
•
ebrowska–Cielek, 2001]. The issue of regional governmentis a fascinating and very important field of analysis, however, in this book we focus,first and foremost, on the basic level of local governments and the regional dimensionwill not be discussed further in this chapter.
2. TERRITORIALLY FRAGMENTED VERSUSTERRITORIALLY CONSOLIDATED SYSTEMS—DEFINITION
Several times in this chapter we use the term “small” or “big” local government. Buthow can we define which municipal government we can call “small” and consequently,which local government system we will call “fragmented” and which “territoriallyconsolidated”? As mentioned in Chapter 1, some analysis made in Western Europeancountries suggests that several functions cannot be performed locally in communitiesof less than 1,000 citizens and that the unit costs of several functions growsignificantly below 5,000 dwellers threshold [“The Size of Municipalities...”, 1995].The Polish chapter of this book indicates that, for various functions, the visiblethreshold is somewhere about 5–10,000 citizens.
For the analysis presented in this book, let us agree to call “fragmented” systemsthose in which a considerable proportion (over 25%) of local governments is smallerthan 1,000 citizens, while a vast majority (over 66%) is smaller than 5,000. As ithas been shown in Figure 1.3 in Chapter 1 of this book, in the countries analyzed,the proportion of “below 1,000” municipalities varies from none in Bulgaria andPoland, to 54% in Hungary, 68% in Slovakia and 80% in the Czech Republic.The pro-portion of “big” (over 5,000 citizens) varies from about 5% in the CzechRepublic and Slovakia, to almost 10% in Hungary, 72% in Bulgaria and 76% inPoland. The split between fragmented systems in the Czech Republic, Hungaryand Slovakia, on one hand, and consolidated systems of Poland and Bulgaria, onthe other, is very clear and sharp.
301
C O M PA R AT I V E C O N C LU S I O N S A N D L E S S O N S L E A R N E D
3. NATIONAL DEBATES ON THE SIZE OF LOCAL GOVERNMENTS
In regards to the discussions on territorial organization, we could perhaps distinguishbetween small, local debates on merging/splitting individual local governments, whichhappens in every country, and larger, national debates on the general shape of territorialdivision. The latter type is a hot topic in some of the countries analyzed. The size ofmunicipal governments has not recently been debated much in countries with terri-torially consolidated systems. Bulgarian discussions related to size are not at the centerof the political agenda and are mostly focused at a regional level.
In Poland, most of the discussions relating to the size issue concentrate on theupper tiers—regions and counties. Should twelve, sixteen or seventeen regions, over300 or below 200, counties be created? These were very hot issues not very long ago,and some attempts at county governmental consolidation are still under discussion.But the size of (relatively big) municipal governments is usually taken for granted andnot disputed. What is interesting, however, is that if there are any suggestions onsystematic changes of the basic territorial organization level, they point in the directionof even further consolidation, not fragmentation. A recent example is provided bythe Ministry of Finance’s proposals for the revisions of the Law on Local GovernmentRevenues, which were presented at the beginning of 2002 [Weber, 2002]. Theproposal has suggested an incentive, of an additional 1% share in PIT revenues for5 years, for those local governments who decide to merge. This suggestion is targeted,first of all, at county governments but it is also addressed to municipalities as well.
In the fragmented systems of Hungary, Slovakia or Czech Republic the issue of sizeis the subject of very hot debates. General amalgamation is usually rejected as unrealisticand undemocratic, but individual countries concentrate on other solutions which arediscussed in detail within national reports and will be briefly summarized later in theconcluding chapter. For example, in Hungary there are suggestions to make notaryoffices (which serve administration of several local governments) obligatory for villagesbelow 1,000 or even populations below 1,500. It is suggested that there should bebetween 3 and 7 villages (local governments) served by one notary office. Interestinglyenough, in Poland the average number of villages in the one rural local governmentis almost 20. Still one should remember that an average Polish village is smallerthan a Hungarian one. The stimulation of voluntary inter-municipal co-operationis another direction which will be also discussed later in this chapter. It should beadded that, according to national reports, Slovakia is the only country in which theobligatory amalgamation of the smallest villages is among the considered options.
Also in the Czech Republic, the appreciation of the low level of effectiveness ofvery small municipalities (especially of the 547 local governments with less than 100citizens) is very common. But the discussion goes mostly in the direction of categorizationof municipalities and increasing number of functions delivered by the larger ones.
302
C O N S O L I D A T I O N O R F R A G M E N T A T I O N ?
D F I D – L G I L O C A L G O V E R N M E N T P O L I C Y P A R T N E R S H I P P R O G R A M
4. SIZE AND ALLOCATION OF FUNCTIONS
4.1 More Functional Decentralizationin Countries with Bigger Municipalities?
In the introductory chapter, we referred both to theoretical arguments as well as toempirical observations from Western European countries suggesting that larger sizelocal government units allow for more radical decentralization of functions. We mayask whether this observation can be confirmed by data from Eastern and Central Europe.
A very simple indicator we may use is the role of municipal budgets in publicspending within countries with more (territorially) fragmented and consolidated systems.The best measure would be the share of the municipality in total public spending.However, this measure creates several methodological and data problems because ofthe existence of various extra-budgetary public funds in several countries. Therefore,we concentrate on the, less perfect but more clear, indicator—namely the share ofmunicipal spending in GDP.
As it is clear from Table 6.21 there is some relationship between the average size(or between fragmentation measured by the proportion of municipalities below1,000 population) and the overall size of municipal budgets. Still, it is not as strongor clear as one might expect. There are countries which support our hypothesis—smallsize corresponds to the low share of municipal spending in GDP (Slovakia) or big sizeis connected to a relatively high share in GDP (Poland, Bulgaria). But as the Hungariancase shows, there might also be small local governments spending a lot of money.
The correlation with the dominant trend in municipal spending over the lastdecade is a little bit stronger. As Table 6.3 shows, municipalities in all of the countrieswith fragmented territorial systems have been on a descending slope in the share ofmunicipal spending in GDP. However, in some of these countries (Hungary, Slovakia)the trend is not very clear (and they have been marked by question marks in Table 6.3).It is much less clear still, on the other extreme, with territorial organization. Amongcountries with consolidated systems, Poland has been the only case with a clearincrease of municipal budgets. In Bulgaria or Lithuania, the share in GDP has beendecreasing—not very different from the fragmented systems.
In Central and Eastern Europe, it is quite clear that the level of territorial consolida-tion has had some importance on a municipal level yet has not been a decisive factorfor functional decentralization. Several other factors, quite out of the scope of theanalysis of this book, such as political determination for the decentralization agenda,have played much more important roles.
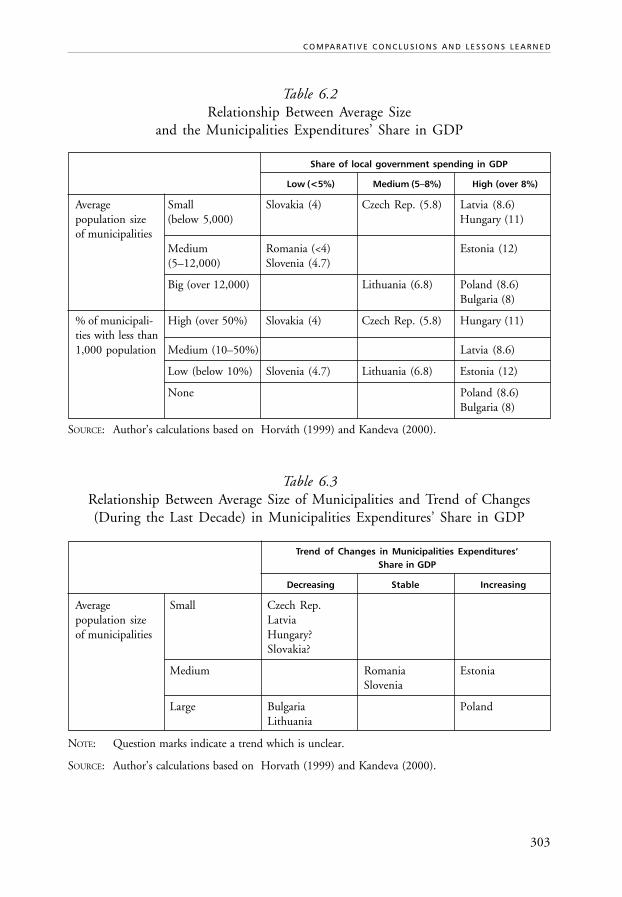
303
C O M PA R AT I V E C O N C LU S I O N S A N D L E S S O N S L E A R N E D
Table 6.2Relationship Between Average Size
and the Municipalities Expenditures’ Share in GDP
Share of local government spending in GDP
Low (<5%) Medium (5–8%) High (over 8%)
Average Small Slovakia (4) Czech Rep. (5.8) Latvia (8.6)population size (below 5,000) Hungary (11)of municipalities
Medium Romania (<4) Estonia (12)(5–12,000) Slovenia (4.7)
Big (over 12,000) Lithuania (6.8) Poland (8.6)Bulgaria (8)
% of municipali- High (over 50%) Slovakia (4) Czech Rep. (5.8) Hungary (11)ties with less than1,000 population Medium (10–50%) Latvia (8.6)
Low (below 10%) Slovenia (4.7) Lithuania (6.8) Estonia (12)
None Poland (8.6)Bulgaria (8)
SOURCE: Author’s calculations based on Horváth (1999) and Kandeva (2000).
Table 6.3Relationship Between Average Size of Municipalities and Trend of Changes(During the Last Decade) in Municipalities Expenditures’ Share in GDP
Trend of Changes in Municipalities Expenditures’Share in GDP
Decreasing Stable Increasing
Average Small Czech Rep.population size Latviaof municipalities Hungary?
Slovakia?
Medium Romania EstoniaSlovenia
Large Bulgaria PolandLithuania
NOTE: Question marks indicate a trend which is unclear.
SOURCE: Author’s calculations based on Horvath (1999) and Kandeva (2000).
304
C O N S O L I D A T I O N O R F R A G M E N T A T I O N ?
D F I D – L G I L O C A L G O V E R N M E N T P O L I C Y P A R T N E R S H I P P R O G R A M
4.2 Illusion of the Same Function for Every Local Government
In all of the countries analyzed, the legal regulations stipulate that all basic tiers of localgovernments (regardless their size) are equal and have the same powers. Obviously,it is an illusion to expect small villages will be able to provide a similar number offunctions as bigger territorial units do. In fact, the real scope of activity dependsstrongly on the size of municipality.
In Bulgaria, the national report states that the capital, Sofia, provides 48 variousfunctions. In smaller units, the number of activities gradually decreases and in caseof municipalities with a population below 10,000 the average number of providedfunctions is a mere 13. Health care provides a good example of this process—thenumber of functions related to the health care gradually decreases with the decreasingsize of local government.
In Poland, the law defines the 65 big cities which are responsible not only formunicipal but also for the county functions, such as secondary education, fire service,consumer protection, etc. But there are differences in service provision among therest of municipal governments, although these differences can be hardly traced bythe law. Local public transportation is a good example—it is provided by about200 (usually the biggest) municipalities, but not by the remaining 2,200+.
A Hungarian report mentions few thresholds related to population number(2,000, 10,000, 20,000, 30,000) above which the number of obligatory functionsincreases. Similarly, it is difficult to expect that almost 9% of Czech municipalitieswith less than 100 citizens, or their equally small counterparts in Slovakia, are able totake responsibility for most of the typical local functions, such as infrastructure services,waste collection and disposal, etc. In some cases, these functions are delivered jointlyby some of the neighboring local governments. Sometimes, local government remainsresponsible for them or contracts them out to private or public sector companies. Inseveral cases, especially in the Czech Republic, these functions are simply providedby the neighboring town, without any formal agreement nor financial compensationfrom the surrounding rural governments.
As it has been shown in the study on public perception of decentralization reforms(Swianiewicz 2001), citizens of large municipalities also think local governmentsshould be responsible for a wider scope of functions. In the Czech Republic, citizensof small villages (below 500) usually think that present duties of local governments aresufficient, while respondents from the largest cities express their wishes for further progressin decentralization. A similar relationship has been found in Poland as well.
The typical argument, heart-breaking and frequently raised, against territorialconsolidation within territorially fragmented countries is the case of an old lady whoneeds to travel several kilometers to get something done at the municipal administra-
305
C O M PA R AT I V E C O N C LU S I O N S A N D L E S S O N S L E A R N E D
tion office. Then there is the question (which is discussed in more detail later inthis chapter) whether it is really necessary for her to go to the central town/villageor whether a municipal administration might be available locally (as it is sometimesin Bulgaria) even if the capital of the municipality is several miles away. More im-portantly, we can re-formulate the dilemma: she may have a municipal office verynearby but, it may only deal with a very narrow scope of issues (so, for more complicatedmatters, she will need to travel anyhow), or the municipal office might be slightlymore distant but it may provide much more complex services.
Summing up, we failed to find convincing evidence that the territorial consolidationversus fragmentation of the municipal government system is related to the extent offinancial decentralization of countries in the Central and Eastern Europe. Neverthe-less, it is quite clear that the variation of functions allocation can be observed withinindividual countries. Larger municipalities are responsible for a wider scope of functions,while, in numerous cases, the autonomy of the smallest local governments is mostly symbolic,since in practice they are unable to take responsibility for any significant public services.Instead, these services are provided to the local population either by the state admi-nistration or by another municipality.
5. COST OF SERVICE DELIVERY—THE CASE FOR ECONOMY OF SCALE
In most of the countries analyzed, it has been discovered that the economy of scaleis important for several of the services local governments are responsible for. Straightforward comparisons are very difficult because small and bigger municipalities oftenperform different functions, even within the same sector. Moreover, some of nationalchapters report that lower spending per unit is very often due to lower quality andperformance level, which in turn is due to insufficient financial capacity of the smallergovernments. For example, this has been noted in Bulgaria in case of waste collection,kindergartens, and some other social services. Similar observations have been made alsoin the Hungarian chapter concerning pre-school and school education. The specifi-cally Bulgarian explanation of (sometimes) unexpectedly high relative spending perunit in the biggest municipalities concentrate on a lack of arrears in payments inbig cities, whereas, such unpaid bills are quite common in smaller municipalities.We can make note all of these explanations, but it is extremely difficult to measurethe impact of such differences and formulate convincing descriptive evidence, eitherof the existence or the lack of effect of economy of scale. Still, we can make severalgeneral observations based on cases discussed in the national reports presented inthis book.
306
C O N S O L I D A T I O N O R F R A G M E N T A T I O N ?
D F I D – L G I L O C A L G O V E R N M E N T P O L I C Y P A R T N E R S H I P P R O G R A M
As it was noted above, in Bulgaria, the number of services provided is much lowerin small municipalities. Yet, the curve illustrating the relationship between per capitaspending on several services and the size of local government is U-shaped. We mayinterpret this as indirect evidence of higher unit costs in the small local governmentsgroup. However, we should remember that even the smallest Bulgarian local govern-ments might be considered big in several other countries with more fragmentedterritorial systems. They consist of several settlement units and have population wellover 1,000. It seems that their higher unit costs are mostly related to lower populationsdensity and spatial dilution of service users rather than the size factor itself. InBulgaria, changing the administrative division, towards the direction of furtheramalgamation, would probably not change the general picture described above.
In Poland, the clear illustration of the economy of scale phenomenon is providedby the costs per pupil in primary education which increases with the decreasingsize of local government. The relationship remains valid when we limit our analysisto the group of rural local governments only, where the impact of population densityis not correlated with the size. This means that size itself is an important explanatoryvariable of the unit cost. Similarly, it has been noted that the costs of solid waste collectionand disposal are significantly lower in those cases of inter-municipal co-operation.
Also, in Hungary, the education costs per pupil in rural areas provides an exampleof economy of scale. The Hungarian report suggests that size of local governmentmakes a big difference to social services. It also suggests that in the case of publicutilities, it is not so important because they are provided by utility companies whichusually cover areas larger than one local government unit. We recognize this opinion,however, this observation does not seem to be valid for the whole region. It is oftenthe case that catchment’s areas of public utility services are identical with the areaof municipality and that the fragmentation of local governments leads to the parallelfragmentation of the service provision.
In the case of current expenditures per local administration, the analysis of theimpact of size on per unit spending is relatively simpler. The summary of findingsfor four countries (Bulgaria, Poland, Slovakia and Hungary) is presented on Figures6.1a and 6.1b2 . The evidence of economy of scale is most visible in the Polish andBulgarian instances. Per capita spending in the largest group is about two timeslower than amongst the smallest municipalities. In Bulgaria, per capita spending inrelatively small municipalities is much higher than in larger local governments, inspite of their much narrower scope of functions. However, in the two remainingcountries, the descending slope for the administrative costs of bigger local governmentsis also quite convincing. There are two complicating factors, however, which causethe relationship to be not quite linear: (i) the extended functions of larger localgovernments influence also raises spending on administration (that is why cities
307
C O M PA R AT I V E C O N C LU S I O N S A N D L E S S O N S L E A R N E D
with a county status have been excluded from the Polish analysis, this same factorprobably explains the relatively good score for the smallest—below 200 citizens—Hungarian villages), (ii) big cities pay higher salaries to their employees. These factorshave been reported directly within the Hungarian chapter. Figure 6.1b3 also illustratesthat small local government’s budgets are dominated much more by administrativespending—in some extreme cases, not much is left over for any other purpose. Thisis most visible in Hungary where the smallest local governments spend over 40% oftheir budgets on administration. Further, in Slovakia, a very great burden of adminis-trative spending within local budgets is very visible. In villages below 500, citizensbureaucracy consumed almost 49% of total local budget during 2000, this is downfrom 52% in 1999.
In addition to the evidence provided by Figure 6.1, we should mention thatHungarian analysis reported an over 50% difference in administrative spendingbetween local governments that joined and did not join the notary office. It is quiteevident that, in the provision of administrative services, joint efforts with othermunicipalities leads to considerable savings.
Figure 6.1aSpending per Capita on Municipal Administration
as % of National Average
–100
,000
60
–200
Population Size
80
100
120
140
160
180
200
220
240
–500
–1,0
0
–2,0
00
–3,0
00
–4,0
00
–5,0
00
–6,0
00
–8,0
00
–10,
000
–15,
000
–20,
000
–30,
000
–50,
000
–75,
000
–300
,000
Bulgaria
Slovakia
Poland
Hungary
308
C O N S O L I D A T I O N O R F R A G M E N T A T I O N ?
D F I D – L G I L O C A L G O V E R N M E N T P O L I C Y P A R T N E R S H I P P R O G R A M
Figure 6.1bSpending on Administration
as % of Total Operating Expenditures
6. BIG IS STRONGER—SIZE AND CAPACITYFOR ECONOMIC DEVELOPMENT
In the countries analyzed, the direct influence of local governments on the local economyis relatively limited. However, they can support local enterprises and attract investmentsthrough planning instruments, implementation of promotional strategies, use of localtax incentives, etc. At least with some of these instruments, big local governmentshave a greater chance to make an impact. They can mobilize (and concentrate) largeramounts of resources and—for example—are capable to undertake wider promotion/marketing activities.
Perhaps indirect influence on local economy is even more important and also moredependent on the size factor. Local competitive advantage, to a large extent, dependson the infrastructure facilities which municipal governments are responsible for inmost of the countries analyzed. There are several indicators suggesting that big localgovernments may be more effective in infrastructure development policies:
1) they are less dependent on the transfer of state grants, which makes themmore flexible in making policy choices. This has been clearly reported in
5
–200
10
15
20
25
30
35
40
45
50
–500
–1,0
0
–2,0
00
–3,0
00
–4,0
00
–5,0
00
–6,0
00
–8,0
00
–10,
000
–15,
000
–20,
000
–30,
000
–50,
000
–75,
000
–100
,000
–300
,000
Bulgaria
Slovakia
Poland
Hungary
Population Size
309
C O M PA R AT I V E C O N C LU S I O N S A N D L E S S O N S L E A R N E D
Bulgarian, Polish and Slovak reports. In Bulgaria, the relationship betweensize of local government and investment spending is not very clear (it is thehighest in Sofia, on one hand, and also in the smallest municipalities, onthe other). Yet detail data clearly suggests that a relatively good “score” forsmall municipalities is fully dependent on capital grants received from thestate budget.
2) They usually have a stronger economic base combined with lower per unitoperational costs, this results in a larger part of their revenue base whichmay be allocated to financing developmental projects (either directly orthrough re-payment of debt made in order to finance capital projects). Again,data from Bulgaria, Poland and Slovakia clearly support this claim.
3) Big municipalities can more easily concentrate resources on a small numberof big projects, which are crucial from the point of view of developmentalperspectives.
4) Their capacity to use credit resources in order to finance investment projectsis greater. This is due both to the fact that they are treated as “better clients”by commercial banks and other investors (for example, those who are interestingin buying municipal bonds) as well as due to the more advanced technicalskills of their administrative staff. As included in the Slovak chapter, informa-tion on the high level of debt of the largest municipalities is, on the onehand, sometimes scary. On the other hand, it confirms their high credibilityfor banks. Polish data indicates both more frequent using of credit instrumentsby bigger municipalities and their frequent long-term, coherent investmentstrategies.
5) Their current level of technical infrastructure facilities grows alongside the growingsize of the local government unit (partially as a result of the factors enumeratedabove). The most complete evidence of this thesis is included in the Hungarianand Bulgarian chapters, but it is also true in the other analyzed countries.As a result of better infrastructure facilities, the competitive advantage of largerlocal governments is bigger.
The second very important indirect influence of local governments on economicdevelopment is the spatial (land use) planning instruments. Because of their betterqualified staff and sometimes also because of larger financial resources, bigger govern-ments are much better prepared to cope with this task effectively. This has been reportedin Poland where several small municipalities have had considerable difficultiespreparing new master plans before the national legislation’s set deadline. The Slovakreport informs that several small villages have been unable to modify the spatialplans prepared long ago during the communist period.
310
C O N S O L I D A T I O N O R F R A G M E N T A T I O N ?
D F I D – L G I L O C A L G O V E R N M E N T P O L I C Y P A R T N E R S H I P P R O G R A M
7. SMALL IS LIKED—THE CASE FOR LOCAL DEMOCRACY
There is no doubt that—as public choice or localism theories suggest—the smallersize of local governments helps build of healthy and vital relationships betweencitizens and local authorities. This has been already noted in the study of publicperception of local governments [Swianiewicz, 2001, pp.34–35]:
[citizens from small municipalities] feel better informed and they more oftenknow local councilors. In all the countries analyzed, the turn-out for local electionsis negatively correlated with the size (i.e. citizens of small towns and villages aremore interested and more involved in local public affairs). Also, in the larger cities,there is higher mayoral turn-over after elections, which may be interpreted aslower voters’ satisfaction with local governmental performance in big cities....Although in most cases, overall positive opinion is clearly related to the small sizeof the local constituency, the picture is not quite one-dimensional. The level ofdeclared satisfaction with local governments’ activity is usually negatively correlatedwith size, but there are some exceptions to this rule.In the Czech Republic, the opinions of citizens from villages below 500 inhabitantsare less positive than those from the 500–2000 population cohort. Although thedifference is not statistically significant, at least the trend stops at around populationsize 500. In Hungary, there was a visible (negative) correlation between size andsatisfaction in 1990–91, but data for 2000 is not as clear. In the smallest groups(below 1,000) average opinion is negative, while the most positive feedback isfrom administrative units between 2 and 5 thousand citizens...For many services, the highest rate of satisfaction is found in the 2,000–10,000cohort, while satisfaction in the smallest units is slightly lower. In the case of schools,the level of satisfaction is very low in villages below 1,000 citizens. Regardingculture, the relationship with size is positive (i.e. higher levels of satisfaction arefound in larger territorial units). In the Czech Republic, declared interest inparticipation in local politics is the highest, not in the smallest group, but intowns between 3 and 20 thousand.
It is hard to formulate very definite conclusions on the basis of data collected bythe “Public perception...” LGPP project, but it seems that citizens from smalleradministrative units, while enjoying many positive features of their local governments,are at least partially aware that far reaching decentralization of functions would beunrealistic and/or lead to inefficiency of service provision for much smaller authorities.This is confirmed both by less support for decentralization of more functions in thesmallest local governments and by some level of disappointment with local services’quality in the smallest municipalities (Hungary, Czech Republic).
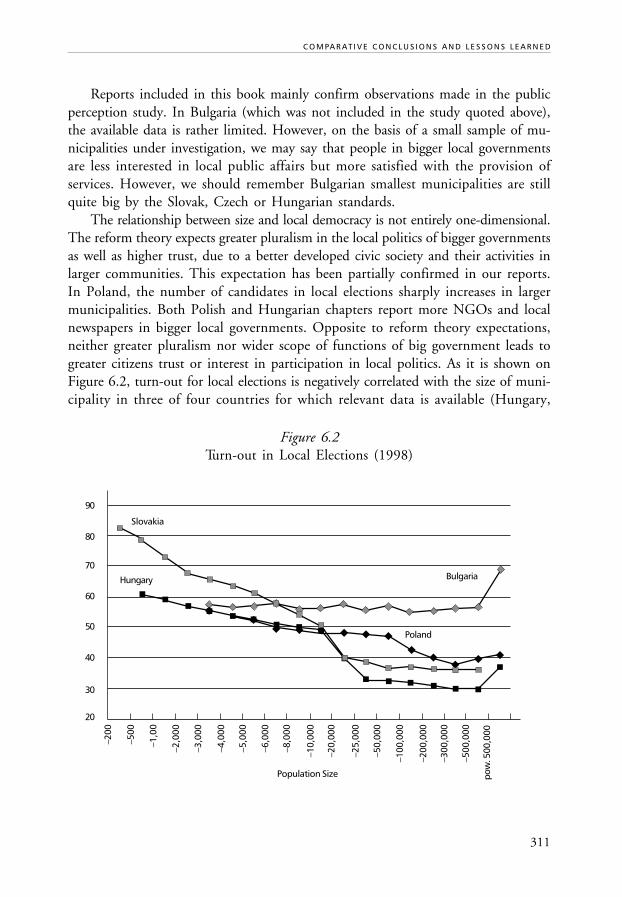
311
C O M PA R AT I V E C O N C LU S I O N S A N D L E S S O N S L E A R N E D
Reports included in this book mainly confirm observations made in the publicperception study. In Bulgaria (which was not included in the study quoted above),the available data is rather limited. However, on the basis of a small sample of mu-nicipalities under investigation, we may say that people in bigger local governmentsare less interested in local public affairs but more satisfied with the provision ofservices. However, we should remember Bulgarian smallest municipalities are stillquite big by the Slovak, Czech or Hungarian standards.
The relationship between size and local democracy is not entirely one-dimensional.The reform theory expects greater pluralism in the local politics of bigger governmentsas well as higher trust, due to a better developed civic society and their activities inlarger communities. This expectation has been partially confirmed in our reports.In Poland, the number of candidates in local elections sharply increases in largermunicipalities. Both Polish and Hungarian chapters report more NGOs and localnewspapers in bigger local governments. Opposite to reform theory expectations,neither greater pluralism nor wider scope of functions of big government leads togreater citizens trust or interest in participation in local politics. As it is shown onFigure 6.2, turn-out for local elections is negatively correlated with the size of muni-cipality in three of four countries for which relevant data is available (Hungary,
Figure 6.2Turn-out in Local Elections (1998)
20
–200
30
40
50
60
70
80
90
–500
–1,0
0
–2,0
00
–3,0
00
–4,0
00
–5,0
00
–6,0
00
–8,0
00
–10,
000
–20,
000
–25,
000
–50,
000
–100
,000
–200
,000
–300
,000
pow
. 500
,000
Bulgaria
Slovakia
Poland
Hungary
–500
,000
Population Size
312
C O N S O L I D A T I O N O R F R A G M E N T A T I O N ?
D F I D – L G I L O C A L G O V E R N M E N T P O L I C Y P A R T N E R S H I P P R O G R A M
Poland, Slovakia4 ). Interestingly enough, in most countries, we also observe considerableincrease in voter turn-out in the largest local governments group (with slightsimplification we can dub this phenomenon the “capital city effect”). Still, it doesnot change the general picture. The rule of higher turn-out in small municipalities doesnot apply in the case of Bulgaria, a full explanation of this would require an additionaldetailed investigation. One may speculate that the proportional electoral system inBulgaria, which does not support representation of small villages in municipal councilsmay discourage voters from voting in these settlements. It must once again be notedthat there are no really small local governments in Bulgaria, so the factors of closenessand openness of small communities are not really able to be examined.
8. VOLUNTARY CO-OPERATION OF MUNICIPAL GOVERNMENTS
In situations in which individual local governments are too small to provide somefunctions effectively, voluntary co-operation with neighboring municipalities mightbe seen as the solution. This is quite often seen as an alternative to the creation oflarge local government units through the amalgamation process. Indeed, examplesof co-operation have been described in all national chapters of this book. Interestinglyenough, it is seen as an important way to improve the performance of local administ-ration, not only in countries with numerous tiny municipalities, but also in stateswith large local governments. In Western Europe, such examples are drawn fromBritain, where joint authorities provide services such as fire protection, public transportand waste disposal. In Finland, local authorities form joint boards for health care,social services and vocational training [Davey, 2002]. Similar examples may be foundin Central Europe, in countries in which basic tier authorities are generally larger—i.e. in Bulgaria or Poland. In both Poland and Bulgaria, the one service the centralgovernment has most encouraged inter-municipal co-operation for is solid wastedisposal.
According to some Polish studies, the economy of scale for this service is notachieved if the market serves less than approximately 100 thousand residents. There-fore, the waste disposal site’s optimal catchment area is closer to a Polish county thana municipal government. In some services (waste disposal, water provision and wastewater treatment), it has been determined that inter-municipal commercial companiesare more flexible and enable easier management options than the “traditional” localgovernment associations. There are also several examples of co-operation in promotionof local economic development and environment protection. At the end of 2000,there were almost 200 municipal associations registered in Poland which focusedon delivery of services or joint promotion of local development.
313
C O M PA R AT I V E C O N C LU S I O N S A N D L E S S O N S L E A R N E D
In other countries analyzed in this book, as recommended (by the central govern-ment), co-operation concerns a broader scope of services with a special stress onbasic administrative services. The strongest suggestion for co-operation is found inHungary, where it is recommended that all local governments with populationslower than 1,000 should form joint notary offices. These offices should then providebasic administrative services for a group of villages. However, in practice only 2/3 ofsmall municipalities enter into these kinds of co-operations, moreover, the number ofnotary offices has been stagnating and even decreasing in the last few years. In1997, in order to strengthen joint offices and to provide additional incentive forlocal governments, a special subsidy system was created. In 2000, this subsidy hasbeen offered on a normative basis. Consequently, the trend of the decreasing numberof joint offices (which had been noted in the first half of the last decade) has beenreversed. The typical joint office usually serves between 1,000 and 2,000 citizens,not 5,000 as is recommended by official central government policies. In Hungary,examples of the joint provision of services may be found also in other sectors, suchas kindergartens or primary schools. In 1999, as many as 7% of children and studentshave been attending jointly managed kindergartens and schools. There is a totalnumber of over 1,400 associations, most of them focusing on one function, oftenled by “compulsion”, i.e. the old, indivisible infrastructure which cannot be managedby a single village. Another typical aim of the small local government association ispromotion of economic development (or some sectors of the local economy, such atourism) in the micro-region.
In Slovakia, typical areas of inter-municipal co-operation cover: solid wastedisposal, sewage treatment, environmental protection, economic development (includingtourism), joint development of infrastructure projects, education, as well as socialwelfare projects. In the instance of technical infrastructure, as with Poland, organizationof inter-municipal commercial companies has recently become quite a popular option.Similar to Hungary, the Slovak system provides an opportunity for joint administrativeoffices, but this option has not been widely used. Very limited enthusiasm for theco-operation is seen also in the results of surveys conducted in municipalities withless than 5,000 citizens. Local mayors were asked about their plans regarding deliveryof education services after responsibility is transferred to local governments. Only17% expressed willingness to establish inter-municipal co-operation. Even in villageswith less than 200 citizens, more than 1/3 wanted to manage schools and kinder-gartens independently and in villages between 200 and 500 citizens, the proportionrose to over 2/3.
In the Czech Republic, very often instead of co-operation between a few neighboringlocal governments, the service is delivered by the local center (town) not only for itscitizens, but also for residents of the surrounding villages. Village governments do
314
C O N S O L I D A T I O N O R F R A G M E N T A T I O N ?
D F I D – L G I L O C A L G O V E R N M E N T P O L I C Y P A R T N E R S H I P P R O G R A M
not contribute to financing these services. But such an arrangement also means thatthe local rural population does not have an opportunity to influence (through democraticmechanisms) the way service is managed either.
Why are examples of voluntary inter-municipal co-operation not amply frequentand why don’t they always bring satisfactory results? One should remember thatthere are several potential problems to overcome before co-operation becomes fruitfuland operational. It requires compromises on the particular interests of the individualvillages involved. Local leaders need to agree on co-operation which will sometimesaffect their personal political ambitions. The joint provision of functions, althoughfrequently bringing financial savings, requires transaction costs, which may be identifiedwith a complicated organizational-managerial setting. Therefore, it is difficult toexpect that the expected benefits will provide sufficient stimulation and that voluntaryco-operation may solve all problems related to the lack of economy of scale in smalllocal government units. The development of co-operation needs to be stimulated by incentivesprovided by the central government. The Slovak authors, in their chapter of this book,even recommend some forms of mandatory (imposed by the law) cooperation betweenmunicipalities. In some of the countries analyzed, the only incentives have been ofa “moral” nature, which are definitely not sufficient. A specific illustration of aninsufficient central government interest in promoting inter-municipal co-operationis provided by Hungary, where there is still no precise information available aboutthe intensity and structure of associations.
It is interesting that there seems to be no relationship between the average sizeof local governments in the country and no central government policies that encouragejoint provision of services. It is hard to find examples of the financial incentives bothfor Poland (in which local governments are usually relatively big) and for Slovakia(which has one of the most territorially fragmented systems). Conversely, in anothercountry with big local governments—Bulgaria—the government has been offeringspecial grants for the joint development of waste landfills, grants that cover most ofcapital investment costs. The most complex system of co-operation support hasbeen sited in Hungary. Villages of less than 500 citizens may get grants only if theybelong to the office notary and if they deliver some functions through associations.Quite recently, there was a special grant scheme for the purchase of school buses.This would enable the liquidation of small and costly schools in very small villagesand develop a decent transportation system to ship pupils daily to more distant schools.There is also extra support available for municipal associations. However, the Hungarianauthors claim that the system is not really coherent. Support for associations competeswith special grants for the smallest local governments. Grants for school-buses havenot been followed by the support for every-day operation of a pupils’ transportationsystem5 . It seems that the system of incentives for co-operation might easily bebuilt-up or developed in any of the countries analyzed.
315
C O M PA R AT I V E C O N C LU S I O N S A N D L E S S O N S L E A R N E D
9. RELATIONSHIP BETWEEN “MUNICIPAL CAPITAL”AND “MUNICIPAL PERIPHERY”
In two of the countries analyzed (Bulgaria and Poland), there are several villagesthat do not have their own local government but are part of a larger municipalitywith the “capital” in another town or larger village. It is exactly this situation thatmany local politicians in the Czech Republic, Hungary, and Slovakia are afraid of.They argue that such an arrangement violates the right to local autonomy, destroyingvillage identity, and may lead to disregarding the needs of small local communities.The Bulgarian and Polish examples give us an opportunity to consider whethersuch fears are well grounded, under what circumstances, and how negative consequencesof multi-settlement unit local governments may be reduced.
First of all, we should stress that in none of the “consolidated systems” does thevillage in question disappear as an entity with a certain amount of autonomy. InBulgaria, within municipal structures, there are almost 1,700 kmetstva, and in Polandover 40 thousand solectwa, that enjoy the power to deliver limited functions andhave their own elected representatives. The existence of sub-municipal units dependson the decision made by the municipal council, but there are no signs of attemptsat liquidating them. Village leaders are invited for municipal council meetings andthey may make the interests of their small motherlands known, but they have novoting rights in the local government council. The position of sub-municipalgovernment is briefly summarized in Table 6.4.
However, it should be added that, in both countries, decentralization withinthe municipality can go further. Moreover, the chapter on Bulgaria reports there hasbeen decreasing enthusiasm for the delegation of more functions in recent years.Also in Poland, in a survey of village leaders, many respondents complained thattheir relationship with municipal mayors has not been straightforward and delegationof functions has often included only very limited powers. There is no doubt thatthere is space for more radical decentralization and the passing of more discretionarypowers to individual villages. This claim is supported by the examples of Westerndemocracies with territorially consolidated systems [compare for ex. Hambleton,Hogget, 1990]. Some extreme arguments are provided by Norwegian cities [Klausen,2002] in which over half of the municipal budgets are administered by sub-municipalunits. In Poland, usually no more than 2–3% of the budget is transferred to thevillages or districts of the city. A similar figure is provided in the Bulgarian report.
The survey of village leaders in Poland still does not support those who suggestsmall villages would feel oppressed by the “capital” in large local governments andthe struggle for resources between sections of the municipality might become adominant dimension of local conflicts. According to the survey, territorial conflictsare among the least visible and the least important problems amongst Polish local
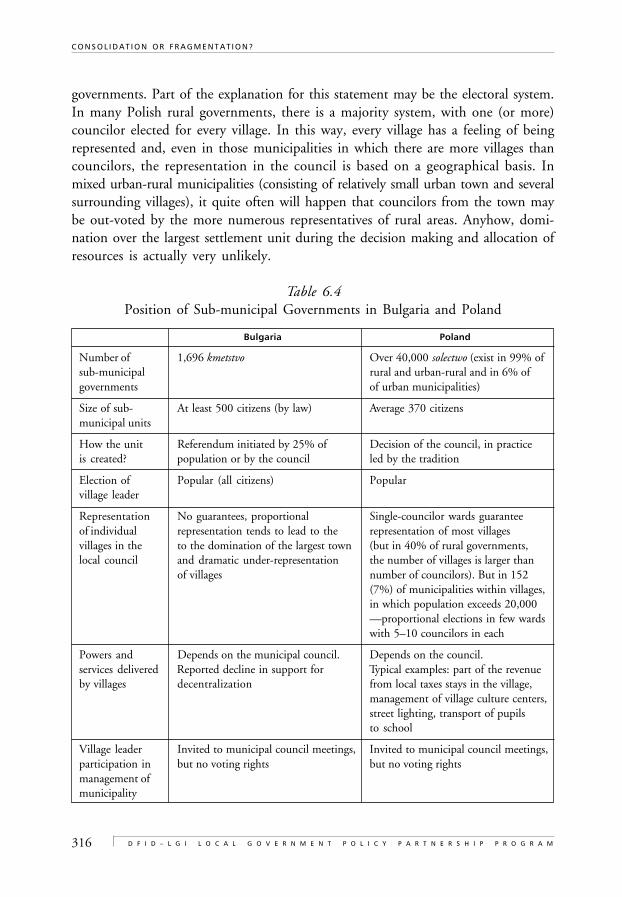
316
C O N S O L I D A T I O N O R F R A G M E N T A T I O N ?
D F I D – L G I L O C A L G O V E R N M E N T P O L I C Y P A R T N E R S H I P P R O G R A M
governments. Part of the explanation for this statement may be the electoral system.In many Polish rural governments, there is a majority system, with one (or more)councilor elected for every village. In this way, every village has a feeling of beingrepresented and, even in those municipalities in which there are more villages thancouncilors, the representation in the council is based on a geographical basis. Inmixed urban-rural municipalities (consisting of relatively small urban town and severalsurrounding villages), it quite often will happen that councilors from the town maybe out-voted by the more numerous representatives of rural areas. Anyhow, domi-nation over the largest settlement unit during the decision making and allocation ofresources is actually very unlikely.
Table 6.4Position of Sub-municipal Governments in Bulgaria and Poland
Bulgaria Poland
Number of 1,696 kmetstvo Over 40,000 solectwo (exist in 99% ofsub-municipal rural and urban-rural and in 6% ofgovernments of urban municipalities)
Size of sub- At least 500 citizens (by law) Average 370 citizensmunicipal units
How the unit Referendum initiated by 25% of Decision of the council, in practiceis created? population or by the council led by the tradition
Election of Popular (all citizens) Popularvillage leader
Representation No guarantees, proportional Single-councilor wards guaranteeof individual representation tends to lead to the representation of most villagesvillages in the to the domination of the largest town (but in 40% of rural governments,local council and dramatic under-representation the number of villages is larger than
of villages number of councilors). But in 152(7%) of municipalities within villages,in which population exceeds 20,000—proportional elections in few wardswith 5–10 councilors in each
Powers and Depends on the municipal council. Depends on the council.services delivered Reported decline in support for Typical examples: part of the revenueby villages decentralization from local taxes stays in the village,
management of village culture centers,street lighting, transport of pupilsto school
Village leader Invited to municipal council meetings, Invited to municipal council meetings,participation in but no voting rights but no voting rightsmanagement ofmunicipality
317
C O M PA R AT I V E C O N C LU S I O N S A N D L E S S O N S L E A R N E D
The situation in Bulgarian local governments is significantly different, due to adifferent electoral system. Proportional representation, with all citizens voting forthe same lists, often leads to a situation in which over 90% of councilors come fromthe largest town. Also, in the allocation of resources, the needs of small rural villagesare more likely to be overlooked.
10. CONCLUSIONS AND RECOMMENDATIONS
Both empirical observations and theoretical considerations suggest there are severaloptions for arranging the territorial organization of local governments. These optionshave been summarized in Table 6.5.
Each of these options has positive and negative aspects. In practice, the mostcommon model is a mixture of various approaches, but we may find examples whichare the closest to each of these solutions in their most ideal form. Until recently,Slovakia had been a good example of the first solution (fragmentation, most offunctions kept by the state), but recent reforms have started to change this pictureand Slovakia is looking for an arrangement better tailored to wider decentralization.One of the considered options is amalgamation of the smallest municipalities—theSlovak chapter in this book suggests it should be mandatory for villages below 200inhabitants. The present situation in the Ukraine (especially in rural areas) is alsonot very different from option one. The Czech Republic is perhaps closest to thesecond model, in which, despite formally even distribution of functions between allmunicipalities, larger towns frequently serve citizens from smaller local governments.Obviously, such situations happen in every country regardless of territorial organizationand local government system. Still, it seems unusually common and is generally(although silently) accepted in the Czech Republic. In Hungary, the central governmenttries to promote voluntary (and semi-voluntary) co-operation among small localgovernments, although many observers of this policy say they are not always implementedand, consequently, their successes are limited. In the Hungarian report there is alsoreflection on the discussion about wider implementation of the “buying in” option.
Poland has followed the model of territorial consolidation, although the opinionhas been voiced that further amalgamation, both on the municipal and on a countylevel, are necessary. The road of amalgamation has been also chosen by several Westerndemocracies—including all the Nordic countries, United Kingdom, Netherlands and,to some extent, Germany and Austria. But, as we mentioned in Chapter 1, Westernexperiences are also not uniform—France provides an example of an extremelyfragmented municipal tier with a mixture of upper tier (department) responsibilityfor several functions and very wide-spread co-operation among tiny communes. Thereare over 19,000 inter-municipal associations in France. These take various organizational
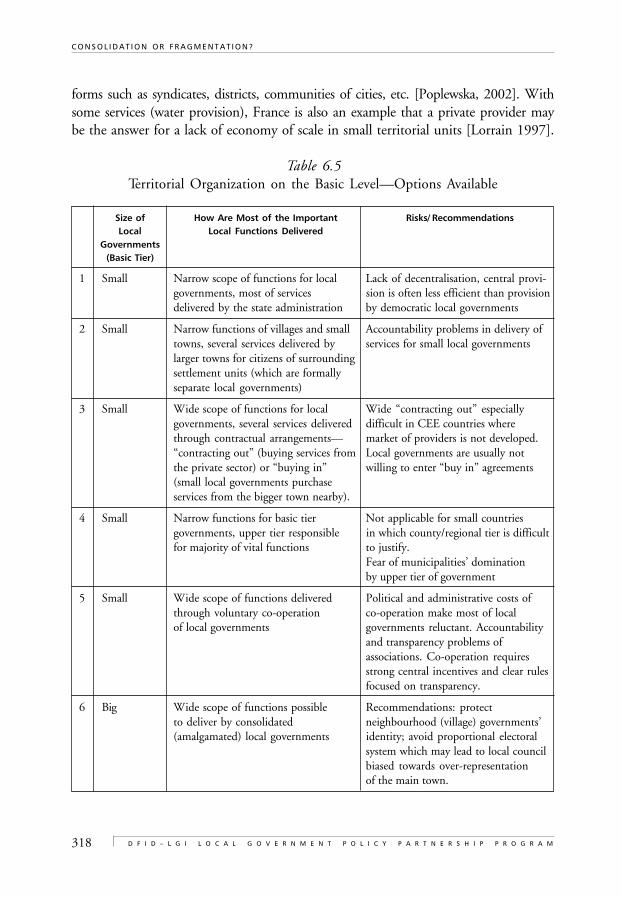
318
C O N S O L I D A T I O N O R F R A G M E N T A T I O N ?
D F I D – L G I L O C A L G O V E R N M E N T P O L I C Y P A R T N E R S H I P P R O G R A M
forms such as syndicates, districts, communities of cities, etc. [Poplewska, 2002]. Withsome services (water provision), France is also an example that a private provider maybe the answer for a lack of economy of scale in small territorial units [Lorrain 1997].
Table 6.5Territorial Organization on the Basic Level—Options Available
Size of How Are Most of the Important Risks/ RecommendationsLocal Local Functions Delivered
Governments(Basic Tier)
1 Small Narrow scope of functions for local Lack of decentralisation, central provi-governments, most of services sion is often less efficient than provisiondelivered by the state administration by democratic local governments
2 Small Narrow functions of villages and small Accountability problems in delivery oftowns, several services delivered by services for small local governmentslarger towns for citizens of surroundingsettlement units (which are formallyseparate local governments)
3 Small Wide scope of functions for local Wide “contracting out” especiallygovernments, several services delivered difficult in CEE countries wherethrough contractual arrangements— market of providers is not developed.“contracting out” (buying services from Local governments are usually notthe private sector) or “buying in” willing to enter “buy in” agreements(small local governments purchaseservices from the bigger town nearby).
4 Small Narrow functions for basic tier Not applicable for small countriesgovernments, upper tier responsible in which county/regional tier is difficultfor majority of vital functions to justify.
Fear of municipalities’ dominationby upper tier of government
5 Small Wide scope of functions delivered Political and administrative costs ofthrough voluntary co-operation co-operation make most of localof local governments governments reluctant. Accountability
and transparency problems ofassociations. Co-operation requiresstrong central incentives and clear rulesfocused on transparency.
6 Big Wide scope of functions possible Recommendations: protectto deliver by consolidated neighbourhood (village) governments’(amalgamated) local governments identity; avoid proportional electoral
system which may lead to local councilbiased towards over-representationof the main town.
319
C O M PA R AT I V E C O N C LU S I O N S A N D L E S S O N S L E A R N E D
Empirical evidence, presented in this book, suggests that some amount of territorialamalgamation would have a positive impact on the economic performance of local government.Models presented in the Polish chapter suggest that, for local governments withpopulations below 20,000, the increase in population size results in the marginal lossin democratic efficiency which is lower than marginal gain in economic performance.So, from the cost/benefit analysis point of view, there is a lot of space for amalgamationin most of countries in the region. However, in several cases, amalgamation is a solutionwhich is not politically accepted. Small village autonomy is seen as a very important value,even if, in practice, this autonomy is more symbolic than real. The fragmented systemdefinitely helps to build a local democracy. In Central and Eastern Europe, wheredemocratic values still need careful cultivation, this argument is difficult to reject. Therefore,we are not able to say whether the fragmented or amalgamated system is always better forevery country. The decision toward territorial organization has to be made locally and needsto take into account what is politically acceptable.
Does it mean that the evidence and analysis collected in this book does not allowfor any definite conclusions and recommendations? We are not able to give a “best”answer which would be valid for each set of local circumstances, but we are able todiscuss advantages and disadvantages of the most typical solutions and to indicatethe traps that should be avoided, as well as recommend steps which may help assistwithin a chosen option.
Small Local Governments (Options 1–5)
One may decide that the local democracy arguments presented above are the mostimportant and forced amalgamation is out of the question. But local communities donot only have a right to autonomy, they should also have a right to information. It is highlyrecommended that complex information, on the implications of maintaining thefragmented system, is provided to local population in an easily comprehensible form.In such cases, we can assume that, if a local government refuses to merge with anotherlocal government, it is the result of a conscious decision and not just lack of information.
But even if we decide in favor of a territorially fragmented system (a system whichmay be characterized by a large number of municipalities), there are still a variety ofarrangements (described in Table 6.5, above, as options (1)–(5)) for local governmentsystems available.
Option (1) (many small elected governments, but most functions are in the hands ofthe state administration) is hard to accept for those who believe that local democracy anddecentralization both bring important values to social and economic life. Apart from otherreasons; why bother with the function of several hundreds (if not thousands) of localgovernments if they have very little, or nothing, to do with your everyday life? Function
320
C O N S O L I D A T I O N O R F R A G M E N T A T I O N ?
D F I D – L G I L O C A L G O V E R N M E N T P O L I C Y P A R T N E R S H I P P R O G R A M
of local councils and even residual local administration is always costly. So, it onlymakes sense when they have an essential role to play. Symbolic representation of villagesand practical lessons of local democracy are important, but not sufficient if they haveminimal influence on the crucial services delivered to local population.
Option (2) (citizens in a small local government are served by a nearby town) has onefundamental disadvantage. If “by definition” the catchment area of several crucialservices is different from the geographical boundaries of the administrative unit responsiblefor their delivery, democratic accountability is seriously damaged. Citizens from smallvillages are proud of having their own local government, which they can influence buttheir local authorities have a minimal impact on the most important services. At thesame time, they do not elect the representatives (councilors, mayor, etc.) of the nearbytown (which, in fact, provides them with many important services). So, they haveno democratic influence on the way crucial services are managed. There is also no directlink between (local) taxes paid by dwellers of small villages and delivery of many services.The town finances these services either from its own resources (under the assumptionthat its local tax base is rich enough) or gets support directly from the central budget.Such a situation also undermines the rules for a healthy local democracy.
Option (3) (contractual arrangements through the “contracting-out” or “buying in”of services by small local governments) sounds attractive, but most likely it is unrealisticin contemporary Central and Eastern Europe. Most typically, the market for localservices (especially in the peripheral, small, local governments) is not well developedenough to expect contracting-out to the private sector as a realistic solution. Certainly,these options would require complex legislative changes, potentially similar to Com-pulsory Competitive Tendering in Britain [see, for example, Walsh, 1994]. It doesnot mean that there are no positive examples of contracting-out in Central andEastern Europe. In Poland, for instance, several cities contracted-out waste collectionand disposal. The city of Gdansk had already contracted-out its water provision by1992. Yet these examples are not very numerous, moreover, they are more likely tobe found in relatively big cities than in small, rural governments. Experience fromCentral and Eastern Europe suggests that local governments are not very willing toenter inter-municipal contractual arrangements to buy services from another municipa-lity. Most often, negotiations fail and citizens end up using the services of neighboringauthorities as “free riders”. This is quite frequent in the Ukraine, where—for example—citizens of one local government use the hospital services of the larger neighboringtown while their own local authorities are unwilling to contribute to financing operationof the hospital [Swianiewicz, Tymkovych, 2002]. Similarly in Poland, most of thenegotiations between core metropolitan cities and surrounding towns, on co-financingmetropolitan public transportation system, failed as well. Further examples are relativelyeasily found in other countries in the region too. However, in the Hungarian report,this solution has been mentioned as a possible recommendation.
321
C O M PA R AT I V E C O N C LU S I O N S A N D L E S S O N S L E A R N E D
So, in fact, the only two acceptable versions for “small governments” decisionare (4) and (5). The typical trouble with option (4) (small governments with limitedfunctions and an upper tier of elected government providing more functions) is the unpleasantmemory of the relationship between the municipal and upper tiers of governmentunder the previous political system. During the communist period, the higher tierof local government used to directly supervise local communities and had been seenas one of the main barriers to local autonomy. It is not surprising that in several countriescontemporary suggestions for a strong, elected county self-government with no hierarchicaldependencies and a clear distinction of functions between tiers of government, isoften met with distrust. Otherwise, option (4) is worth considering—as it is certainlyeasier to manage than relying on the voluntary co-operation of municipalities.
Voluntary co-operation of municipalities (option 5) seems to be the most commonlyaccepted. We have already mentioned numerous examples of inter-municipal co-operation in France. There are also thousands of voluntary agreements in metropolitanareas in the U.S.. Joint purchasing agreements provide a very good example of anattempt at utilizing economy of scale effect (Lindstrom 1998). Clark (2000) stressesthat, in such agreements, each local government can voluntarily withdraw from theconsortium at nearly any time. This forces the consortium to act responsibly and keepslocal power within the smallest local governments, rather than transferring major powerto a metro area unit that could generate deleterious effects for democracy. However, thispositive image is not always the reality. The co-operation is complicated, has organi-zational and political costs, and the experiences of most of European countries suggestit almost never happens automatically or spontaneously. Wherever we find goodand plentiful examples of co-operation, they have been supported (stimulated) by centralpolicies. It has been so in France and often times in Hungary. Some experts suggestthat, in many cases, co-operation should be compulsory rather than voluntary. Insuch an instance, one may ask, what is the difference between the existence of smallmunicipalities, with compulsory co-operation in delivery of some services, andcreation of an upper tier of local government? But even if we do not leap so far aheadin our conclusions and we are strict in keeping with the principle of locally madedecisions, there are some obvious recommendations to follow. First of all, there has tobe a favorable legal framework allowing for different forms of joint-ventures betweenlocal governments. In some countries (not presented in this book however; in theUkraine for example), establishing single-purpose local governmental associationsis very difficult, or even illegal. Another serious problem related to voluntary co-operationis an issue of transparency. Transparency and democratic accountability in the associations’decision making process is more difficult to achieve than in singular local governmentalunits. Therefore, legal regulations should be especially sensitive to these issues. Clearrules on reporting and public access to information concerning local governmentalassociations’ finance, structures, and other activities may help to reduce the problem.
322
C O N S O L I D A T I O N O R F R A G M E N T A T I O N ?
D F I D – L G I L O C A L G O V E R N M E N T P O L I C Y P A R T N E R S H I P P R O G R A M
Last, but not least, in each of the national reports in this book (including the Hungarianone) we identify either that there are no real incentives, or that the system of incentivesis not coherent neither consequent. The Western European experience has beenthat if no specific, strong incentives are provided by the central level authorities,small municipalities are usually not very willing to co-operate with their neighborson the up keep of basic services, regardless of the technical merits of such arrangement[Davey, 2002]. Without violating the local autonomy, central government shouldbuild a clear set of support for co-operating local governments, as well as disincentives forsmall local governments who are not willing to enter joint agreements. Otherwise, itwould be naive to expect the majority of local governments to break down all theirorganizational and psychological difficulties and enter into mass co-operation.
Territorial Amalgamation (Option 6)
As it was mentioned above, there are strong empirical arguments for the creation oflarge local governmental units. But, if there is a political will of territorial consolidationthrough amalgamation of small local governments, there are also some practicalrecommendations also worthy of consideration:
• protecting the identity of amalgamated villages. Amalgamation reforms havebeen introduced to strengthen local governments and enable them to delivera wide scope of functions efficiently. But citizens’ identification with smallerterritorial communities is also a value worthy of protection. In most countrieswhich have undergone the amalgamation reform, smaller villages’ governmentsdid not disappear completely, becoming subjects of territorial governments.There is usually a symbolic political representation at the village level. Bothin Poland and Bulgaria, the legal system even keeps traditional names (solectwoand kmetstvo) and village leaders are popularly elected and recognized asimportant symbols of their local communities;
• responsibility for some functions in amalgamated municipalities can be decentralizedand handed down to villages. In the United Kingdom, parish councils, althoughnot very powerful, play important role in local life. In Scandinavian countries,experiments with management of some functions by small communitieswithin larger local governments have well advanced. In some local governmentsin Poland, individual villages keep a portion of local taxes and provide somesimple functions. Both Bulgarian and Polish chapters agree that, in practice,there is still much more progress to be made in the passing of more functionsdown to villages. One may claim that a difference between the amalgamatedsystem (with symbolic political representation on a village level and provisionof some limited functions of the lowest possible level) and two-tier system
323
C O M PA R AT I V E C O N C LU S I O N S A N D L E S S O N S L E A R N E D
(with formally independent, small villages and more powerful upper tier ofelected self-government) is not very intense.
• electoral system that prevents domination of one town and secures balanced re-presentation of geographical interests. The typical fear of amalgamation is relatedto the potential domination of the largest settlement unit and disregardtowards the needs of small villages. Bulgarian examples suggest such a fear isnot merely theoretical. As the Polish case suggests, one may reduce such adanger through the electoral system, in which the municipality is dividedinto as many wards as the number of councilors elected. Such a system ensuresthat no part of municipality will be without representation and that none ofthe settlement units can dominate within the council or during local decision-making. The issue may be even more controversial when the mayor is directlyelected by all the citizenry (as it is in Slovakia, Hungary or Ukraine and as itwill be in Poland after the 2002 local elections). In such an instance, thelocal council (which has more or less a balanced geographical representation)should play an important role in crucial budget allocation decisions.
• accessibility of local administration. As it was mentioned above, the frequentargument against amalgamation stresses that it might be troublesome forpeople to travel relatively far away in order to visit the local town-hall. Thereare several solutions to reduce the effects of this problem. Municipal administ-rations may have local branches in individual villages. They do not need tobe open on a daily basis but should be accessible enough to serve local citizensneeds. This solution is technically easier nowadays due to the wide-spreadavailability of the Internet and other computer technologies. But it is stillpossible, even in those peripheral regions of the Central and Eastern Europeancountries in which such advanced technological tools are still unavailable.
REFERENCES
Clark, T.N. (2000). “Old and New Paradigms for Urban Research”. Urban AffairsReview, Vol. 36, No. 1.
Davey, K. (2002). “Territorial Administration in the Ukraine: Reform Options Relatedto European Experiences”. Unpublished paper prepared for the LARGIS project.
Goldsmith, M. (1995). “Autonomy and City Limits”. In Judge, D., Stoker, G., andWolman, H. (Eds.) Theories of Urban Politics. London–Thousand Oaks–NewDelhi: Sage.
Hambleton, R., and Hoggett, P. (1990). Beyond Excellence: Quality Local Governmentin the 1990’s. Working Paper 85, School for Advanced Urban Studies, Universityof Bristol.
324
C O N S O L I D A T I O N O R F R A G M E N T A T I O N ?
D F I D – L G I L O C A L G O V E R N M E N T P O L I C Y P A R T N E R S H I P P R O G R A M
Horváth, T. (Ed.) (1999). Decentralisation: Experiments and Reforms. Budapest: OpenSociety Institute, Local Government and Public Service Reform Initiative Initiative.
Kandeva, E. (Ed.) (2000). Stabilisation of Local Governments. Budapest: Open SocietyInstitute, Local Government and Public Service Reform Initiative.
Klausen, J.E. (2002). “Governance and Sustainable Urban Development in Two Nor-wegian Cities”. Paper presented at the EURA conference in Turin 18–20 April.
Lindstrom, B. (1998). “Regional Co-operation and Sustainable Growth”. Journalof Urban Affairs, Vol. 20, No. 3.
Lorrain, D. (1997). “France: Silent Change”. In Lorrain, D., and Stoker, G. (Eds.)The Privatisation of Urban Services in Europe, (London: Pinter).
Poplewska, A. (2002). “Wspólpraca miedzygminna we Francji.”. Samorzad Terytorialny,No. 6.
“The Size of Municipalities, Efficiency and Citizen Participation” (1995). Localand Regional Authorities in Europe, No. 56. Strasbourg: Council of Europe.
Swianiewicz, P. (Ed.) (2001). Public Perception of Local Governments. Budapest:Open Society Institute, Local Government and Public Service Reform Initiative.
Swianiewicz, P., and Tymkovych, B. (2002). “Health Care Financing in the KupianskRayon Under the New Budget Code”. Unpublished report prepared for LARGISproject.
Walsh, K. (1994). “Competition and Public Service Delivery”. In Stewart, J., andStoker, G. (Eds.) Local Government in the 1990s, (London: Macmillan).
Weber, M. (2002). “Plonne nadzieje”. Wspólnota, No. 15.
Z•
ebrowska-Cielek, J. (2001). NUTS—Nomenklatura jednostek terytorialnych do celówstatystycznych, PARR. Warszawa.
NOTES
1 Tables 6.2 and 6.3 are based on 1998/1999 data. The situation may have changedsince then in some of the countries analysed, but for the sake of a clear comparativebase more recent data has not been considered
2 However, even in this relatively simple case, there have been considerable method-ological problems which resulted in some approximations on the graph. Firstly,individual national reports used various size-cohorts. In several cases, Figure 6.1includes estimations based on interpolation of data for original size groups.
˛ ˛
325
C O M PA R AT I V E C O N C LU S I O N S A N D L E S S O N S L E A R N E D
Secondly, the Hungarian report used the combination of size and administrativestatus (village, town, town being a county capital) criteria. Sometimes a big villageis larger than small town. Also, the county capital designation does not imply anyparticular size, however, the graphic illustration is based on the assumption thatmost county capitals are bigger then the other towns, and that the majority ofthem are larger than a population of 50,000.
3 In Slovakia, data from Figure 6.1b refers to the share of administrative expendi-tures to total expenditures (current + capital).
4 In Slovakia, data on the size of local government in Figure 6.3 refers to thenumber of eligible voters, not to total number of citizens in the local governmentunit.
5 However, one might argue that if operation of the joint school is really cheaper,no additional incentive is necessary. After the initial stimulus in forming supportfor the capital purchase of the bus, the maintenance of the bus service could befinanced by savings made by lower school operational costs.
327
INDEXA
Index
Bolded entries—references in titles.Italicized entries—references in Tabletitles.
accountability 8, 89, 110, 147, 148, 320, 321
administration 5, 15, 16, 24, 25, 38, 39, 40, 43,45, 46, 47, 48, 51, 52, 53, 66, 67, 68, 69, 70, 71,72, 74, 75, 76, 82, 85, 86, 87, 88, 89, 92, 93, 105,106, 107, 108, 109, 110, 111, 115, 121, 125,129, 133, 137, 138, 141, 142, 145, 148, 149,150, 151, 154, 155, 157, 158, 159, 160, 161,177, 180, 186, 187, 188, 193, 197, 198, 200,201, 208, 209, 214, 223, 224, 228, 231, 232,239, 242, 244, 257, 262, 263, 264, 276, 282,286, 297, 301, 305, 306, 307, 308, 319, 320, 323
administrative capacity 161, 257, 262,
allocation of functions 8, 16, 25, 187, 225, 226,240, 255, 297, 302
amalgamation 6, 15, 21, 22, 51, 67, 68, 84, 85,117, 120, 121, 131, 157, 161, 227, 236, 237,238, 239, 240, 287, 288, 301, 306, 312, 317,319, 322, 323
association xv, 25, 38, 39, 40, 45, 47, 57, 59, 60,63, 64, 66, 68, 70, 72, 73, 74, 75, 76, 77, 78, 79,80, 81, 82, 83, 86, 87, 88, 89, 93, 94, 121, 140,141, 142, 143, 144, 145, 146, 147, 148, 149,150, 161, 205, 206, 213, 231, 253, 272, 273,274, 275, 312, 313, 314, 317, 321
autonomy 22, 37, 64, 65, 70, 85, 86, 92, 123,147, 150, 229, 231, 238, 251, 287, 298, 305,315, 319, 321, 322
catchment area 20, 25, 117, 121, 194, 214, 262,270, 273, 312, 320
competition xv, 11, 41, 248
consolidation 6, 8, 9, 17, 19, 22, 25, 230, 286,297, 301, 304, 305, 317, 322
contracting out 318, 320
co-operation 25, 38, 40, 45, 59, 66, 68, 70, 72,74, 75, 81, 82, 85, 89, 94, 120, 121, 136, 139,140, 141, 142, 143, 144, 145, 146, 147, 148,149, 150, 151, 158, 159, 160, 161, 195, 231,242, 251, 252, 272, 273, 275, 287, 301, 306,312, 313, 314, 317, 321, 322
decentralization xv, 18, 20, 24, 25, 68, 106, 121,149, 160, 210, 212, 214, 223, 236, 237, 249,251, 252, 255, 298, 302, 304, 305, 310, 315,317, 319
democracy xv, 5, 8, 14, 16, 22, 35, 57, 59, 92,151, 155, 171, 172, 191, 234, 240, 245, 248,253, 254, 275, 276, 279, 281, 282, 283, 284,286, 287, 298, 310, 311, 319, 320, 321
economic development (economic growth) 8, 10,16, 18, 24, 25, 60, 64, 88, 130, 139, 140, 158,161, 184, 185, 199, 202, 211, 224, 242, 244,250, 258, 259, 260, 261, 272, 275, 276, 279,280, 281, 283, 284, 308, 309, 312, 313
economies of scale 223, 255, 282
electoral system, elections 14, 15, 42, 58, 61, 92,106, 109, 110, 111, 131, 151, 152, 186, 213,223, 224, 232, 240, 249, 250, 282, 310, 311,312, 316, 317, 323
economic potential 279, 283
fiscal capacity 13
fragmentation 5, 6, 10, 11, 17, 18, 21, 22, 23, 24,25, 38, 45, 46, 67, 84, 93, 113, 117, 118, 121,138, 149, 151, 157, 160, 161, 171, 199, 205,206, 207, 209, 210, 211, 212, 227, 228, 230,236, 241, 258, 286, 287, 288, 297, 298, 299,301, 302, 305, 306, 317,
free-rider 8
grant 9, 13, 40, 41, 48, 65, 82, 137, 139, 226,258, 265, 266, 268, 270, 282, 291, 308, 309, 314
identity 45, 62, 81, 84, 85, 93, 147, 151, 161,287, 315, 322
infrastructure 5, 10, 18, 19, 40, 61, 63, 64, 66,69, 70, 93, 113, 127, 131, 139, 142, 156, 158,159, 180, 193, 200, 204, 212, 238, 258, 272,274, 276, 282, 286, 304, 308, 309, 313
328
C O N S O L I D A T I O N O R F R A G M E N T A T I O N ?
D F I D – L G I L O C A L G O V E R N M E N T P O L I C Y P A R T N E R S H I P P R O G R A M
investment 10, 40, 41, 64, 65, 66, 69, 80, 82,117, 120, 125, 126, 127, 131, 139, 141, 175, 197,200, 202, 203, 204, 205, 211, 214, 250, 251,252, 253, 258, 262, 274, 276, 282, 287, 308,309, 314
joint notary office 313
joint office 24, 45, 46, 47, 48, 72, 83, 85, 87, 92,93, 120, 140, 313
merge 37, 67, 69, 117, 118, 148, 161, 181, 230,238, 301, 319
NGO 210, 234, 311
participation 9, 10, 14, 15, 20, 58, 60, 118, 151,152, 155, 156, 159, 171, 175, 187, 191, 208,234, 284, 310, 311
periphery 115, 197, 199, 211, 315
public perception xv, 24, 240, 241, 255, 304, 310
recommendation 6, 24, 157, 159, 172, 210, 213,243, 286, 297, 300, 317, 319, 320, 321, 322
referendum 49, 84, 120, 151, 181, 182, 236, 287,298
representation 9, 20, 24, 25, 68, 171, 185, 186,197, 206, 211, 213, 232, 234, 235, 244, 245,248, 250, 276, 284, 287, 288, 298, 312, 316,317, 322, 323
revenues 9, 20, 41, 111, 112, 113, 122, 123, 124,125, 126, 127, 128, 129, 132, 135, 139, 157, 158,173, 174, 180, 181, 189, 190, 191, 192, 195, 199,203, 204, 211, 212, 213, 214, 216, 224, 226,230, 236, 252, 256, 258, 262, 263, 265, 267,268, 269, 287, 291, 301
schools 5, 8, 19, 40, 50, 52, 54, 55, 56, 57, 64, 69,75, 82, 89, 125, 149, 156, 188, 189, 193, 242,244, 251, 252, 253, 255, 256, 257, 258, 265,266, 268, 269, 270, 271, 282, 310, 313, 314
services xv, 5, 8, 9, 10, 11, 12, 13, 14, 16, 18, 19,20, 21, 22, 25, 39, 40, 43, 48, 49, 50, 51, 55, 57,60, 61, 65, 68, 69, 73, 75, 82, 85, 86, 87, 89, 92,93, 94, 108, 109, 112, 121, 127, 129, 130, 133,134, 138, 139, 140, 141, 142, 145, 146, 147,148, 149, 150, 151, 156, 157, 158, 159, 160,161, 171, 173, 187, 188, 189, 191, 192, 193,194, 195, 196, 197, 200, 201, 202, 205, 211,212, 213, 214, 225, 231, 239, 240, 241, 242,243, 244, 252, 255, 257, 262, 266, 267, 270,272, 273, 274, 275, 276, 279, 280, 282, 285,
286, 287, 288, 304, 305, 306, 307, 310, 311,312, 313, 314, 318, 320, 321, 322
spending 65, 137, 201, 202, 250, 254, 258, 262,263, 264, 265, 269, 282, 286, 287, 291, 302,305, 306, 307, 308, 309
spillover 8, 9, 13, 18, 20, 239
split 19, 35, 37, 38, 73, 84, 85, 105, 120, 177,179, 181, 184, 227, 228, 230, 236, 237, 238,239, 240, 243, 244, 254, 263, 286, 298, 300, 301
social welfare 108, 109, 134, 145, 146, 156, 225,258, 313
solid waste 51, 194, 195, 197, 202, 212, 272,273, 287, 306, 312, 313
tax base 13, 173, 320
threshold 16, 83, 113, 121, 161, 253, 282, 284,285, 299, 300, 304
transfer 49, 56, 61, 89, 106, 109, 112, 113, 126,127, 137, 141, 142, 150, 157, 158, 159, 172,173, 174, 189, 195, 211, 213, 214, 226, 237,240, 252, 255, 258, 273, 287, 308, 313, 315, 321
transparency 318, 321
transport 8, 19, 51, 69, 73, 85, 89, 108, 109, 118,127, 133, 149, 156, 158, 160, 191, 202, 251,252, 272, 304, 312, 314, 320
unit costs 12, 13, 14, 25, 51, 52, 53, 54, 55, 56,57, 191, 200, 201, 262, 268, 272, 273, 276, 286,300, 306
village 16, 17, 19, 20, 22, 24, 25, 35, 38, 39, 40,41, 42, 43, 44, 45, 47, 51, 52, 53, 54, 55, 56, 57,58, 60, 61, 63, 64, 69, 70, 72, 74, 75, 76, 77, 85,87, 89, 94, 107, 113, 115, 117, 118, 120, 121,125, 134, 135, 140, 141, 155, 157, 181, 197,212, 213, 227, 229, 230, 232, 233, 236, 237,248, 249, 250, 251, 252, 253, 254, 255, 267,287, 288, 298, 299, 301, 304, 307, 309, 310,312, 313, 314, 315, 316, 317, 319, 320, 322, 323
water (provision) 19, 40, 48, 51, 63, 65, 85, 89,108, 109, 113, 120, 134, 139, 142, 143, 144,147, 159, 194, 202, 203, 242, 253, 272, 275,312, 318, 320
329
INDEXA
Local Governmentand Public Service Reform Initiative
Local Government and Public Service Reform Initiative (LGI), as one of the programsof the Open Society Institute (OSI), is an international development and grant-giving organization dedicated to the support of good governance in the countries ofCentral and Eastern Europe (CEE) and Newly Independent States (NIS). LGIseeks to fulfill its mission through the initiation of research and support ofdevelopment and operational activities in the fields of decentralization, public policyformation and the reform of public administration.
With projects running in countries covering the region between the CzechRepublic and Mongolia, LGI seeks to achieve its objectives through
• Development of sustainable regional networks of institutions and professionalsengaged in policy analysis, reform oriented training, and advocacy;
• Support and dissemination of in-depth comparative and regionally applicablepolicy studies tackling local government issues;
• Support of country specific projects and delivery of technical assistance tothe implementation agencies;
• Assistance to Soros foundations with the development of local government, publicadministration and/or public policy programs in their countries of the region;
• Publishing of books, studies and discussion papers dealing with the issues ofdecentralization, public administration, good governance, public policy,and lessons learnt from the process of transition in these areas;
• Development of curricula and organization of training programs dealingwith specific local government issues;
• Support of policy centers and think-tanks in the region.Apart from its own projects, LGI works closely with a number of other
international organizations (Council of Europe, Department for InternationalDevelopment, USAID, UNDP, and World Bank) and co-funds larger regionalinitiatives aimed at the support of reforms on sub-national level. Local GovernmentInformation Network (LOGIN) and Fiscal Decentralization Initiatives (FDI) aretwo main examples of this cooperation.
For additional information or specific publications, please contact:
LOCAL GOVERNMENT AND PUBLIC SERVICE REFORM INITIATIVE
P.O. Box 519, H–1397 Budapest, HungaryPhone: (36-1) 327-3104; Fax: (36-1) 327-3105E-mail: [email protected]; Web Site: http://lgi.osi.hu
Related Documents