2 Samsung Electronics Co., Ltd. and its subsidiaries CONSOLIDATED STATEMENTS OF FINANCIAL POSITION (In millions of Korean won, in thousands of U.S. dollars (Note 2.27 )) Notes December December December December 2011 2010 2011 2010 KRW KRW USD USD Assets Current Assets Cash and cash equivalents 4, 6 14,691,761 9,791,419 12,738,889 8,489,915 Short-term financial instruments 5, 6 11,529,905 11,529,392 9,997,316 9,996,872 Available-for-sale financial assets 6, 7 655,969 1,159,152 568,776 1,005,074 Trade and other receivables 6, 8 24,153,028 21,308,834 20,942,537 18,476,402 Advances 1,436,288 1,302,428 1,245,372 1,129,305 Prepaid expenses 2,329,463 2,200,739 2,019,824 1,908,210 Inventories 9 15,716,715 13,364,524 13,627,603 11,588,072 Other current assets 988,934 746,101 857,483 646,928 Total current assets 71,502,063 61,402,589 61,997,800 53,240,778 Non-current assets Available-for-sale financial assets 6, 7 3,223,598 3,040,206 2,795,108 2,636,093 Associates and joint ventures 10 9,204,169 8,335,290 7,980,724 7,227,339 Property, plant and equipment 11 62,043,951 52,964,594 53,796,888 45,924,386 Intangible assets 12 3,355,236 2,779,439 2,909,248 2,409,988 Deposits 6 791,863 655,662 686,606 568,509 Long-term prepaid expenses 3,454,205 3,544,572 2,995,062 3,073,417 Deferred income tax assets 27 1,614,077 1,124,009 1,399,529 974,602 Other non-current assets 442,092 442,383 383,329 383,580 Total assets 155,631,254 134,288,744 134,944,294 116,438,692

Welcome message from author
This document is posted to help you gain knowledge. Please leave a comment to let me know what you think about it! Share it to your friends and learn new things together.
Transcript

2
Samsung Electronics Co., Ltd. and its subsidiaries
CONSOLIDATED STATEMENTS OF FINANCIAL POSITION
(In millions of Korean won, in thousands of U.S. dollars (Note 2.27 ))
Notes December December December December2011 2010 2011 2010KRW KRW USD USD
AssetsCurrent AssetsCash and cash equivalents 4, 6 14,691,761 9,791,419 12,738,889 8,489,915Short-term financial instruments 5, 6 11,529,905 11,529,392 9,997,316 9,996,872Available-for-sale financial assets 6, 7 655,969 1,159,152 568,776 1,005,074Trade and other receivables 6, 8 24,153,028 21,308,834 20,942,537 18,476,402Advances 1,436,288 1,302,428 1,245,372 1,129,305Prepaid expenses 2,329,463 2,200,739 2,019,824 1,908,210Inventories 9 15,716,715 13,364,524 13,627,603 11,588,072Other current assets 988,934 746,101 857,483 646,928
Total current assets 71,502,063 61,402,589 61,997,800 53,240,778
Non-current assetsAvailable-for-sale financial assets 6, 7 3,223,598 3,040,206 2,795,108 2,636,093Associates and joint ventures 10 9,204,169 8,335,290 7,980,724 7,227,339Property, plant and equipment 11 62,043,951 52,964,594 53,796,888 45,924,386Intangible assets 12 3,355,236 2,779,439 2,909,248 2,409,988Deposits 6 791,863 655,662 686,606 568,509Long-term prepaid expenses 3,454,205 3,544,572 2,995,062 3,073,417Deferred income tax assets 27 1,614,077 1,124,009 1,399,529 974,602Other non-current assets 442,092 442,383 383,329 383,580
Total assets 155,631,254 134,288,744 134,944,294 116,438,692
3
Samsung Electronics Co., Ltd. and its subsidiaries
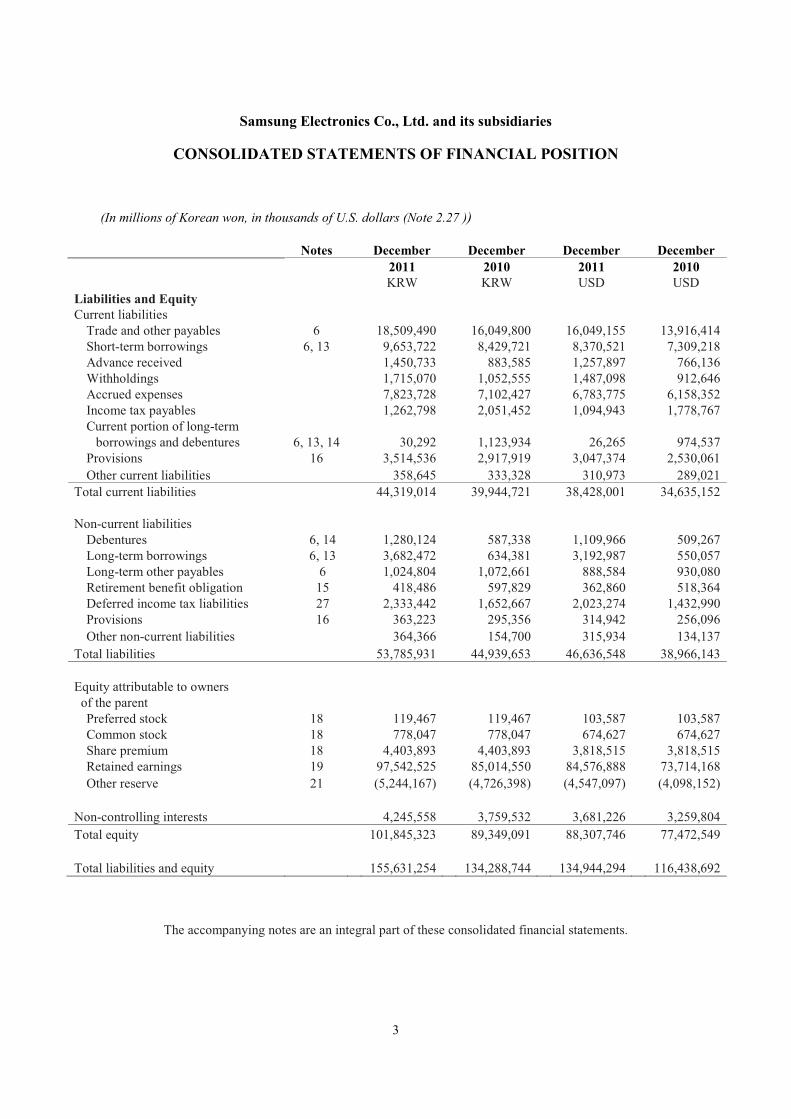
CONSOLIDATED STATEMENTS OF FINANCIAL POSITION
(In millions of Korean won, in thousands of U.S. dollars (Note 2.27 ))
Notes December December December December2011 2010 2011 2010KRW KRW USD USD
Liabilities and EquityCurrent liabilitiesTrade and other payables 6 18,509,490 16,049,800 16,049,155 13,916,414Short-term borrowings 6, 13 9,653,722 8,429,721 8,370,521 7,309,218Advance received 1,450,733 883,585 1,257,897 766,136Withholdings 1,715,070 1,052,555 1,487,098 912,646Accrued expenses 7,823,728 7,102,427 6,783,775 6,158,352Income tax payables 1,262,798 2,051,452 1,094,943 1,778,767Current portion of long-termborrowings and debentures 6, 13, 14 30,292 1,123,934 26,265 974,537Provisions 16 3,514,536 2,917,919 3,047,374 2,530,061Other current liabilities 358,645 333,328 310,973 289,021
Total current liabilities 44,319,014 39,944,721 38,428,001 34,635,152
Non-current liabilitiesDebentures 6, 14 1,280,124 587,338 1,109,966 509,267Long-term borrowings 6, 13 3,682,472 634,381 3,192,987 550,057Long-term other payables 6 1,024,804 1,072,661 888,584 930,080Retirement benefit obligation 15 418,486 597,829 362,860 518,364Deferred income tax liabilities 27 2,333,442 1,652,667 2,023,274 1,432,990Provisions 16 363,223 295,356 314,942 256,096Other non-current liabilities 364,366 154,700 315,934 134,137
Total liabilities 53,785,931 44,939,653 46,636,548 38,966,143
Equity attributable to ownersof the parentPreferred stock 18 119,467 119,467 103,587 103,587Common stock 18 778,047 778,047 674,627 674,627Share premium 18 4,403,893 4,403,893 3,818,515 3,818,515Retained earnings 19 97,542,525 85,014,550 84,576,888 73,714,168Other reserve 21 (5,244,167) (4,726,398) (4,547,097) (4,098,152)
Non-controlling interests 4,245,558 3,759,532 3,681,226 3,259,804Total equity 101,845,323 89,349,091 88,307,746 77,472,549
Total liabilities and equity 155,631,254 134,288,744 134,944,294 116,438,692
The accompanying notes are an integral part of these consolidated financial statements.
4
Samsung Electronics Co., Ltd. and its subsidiaries
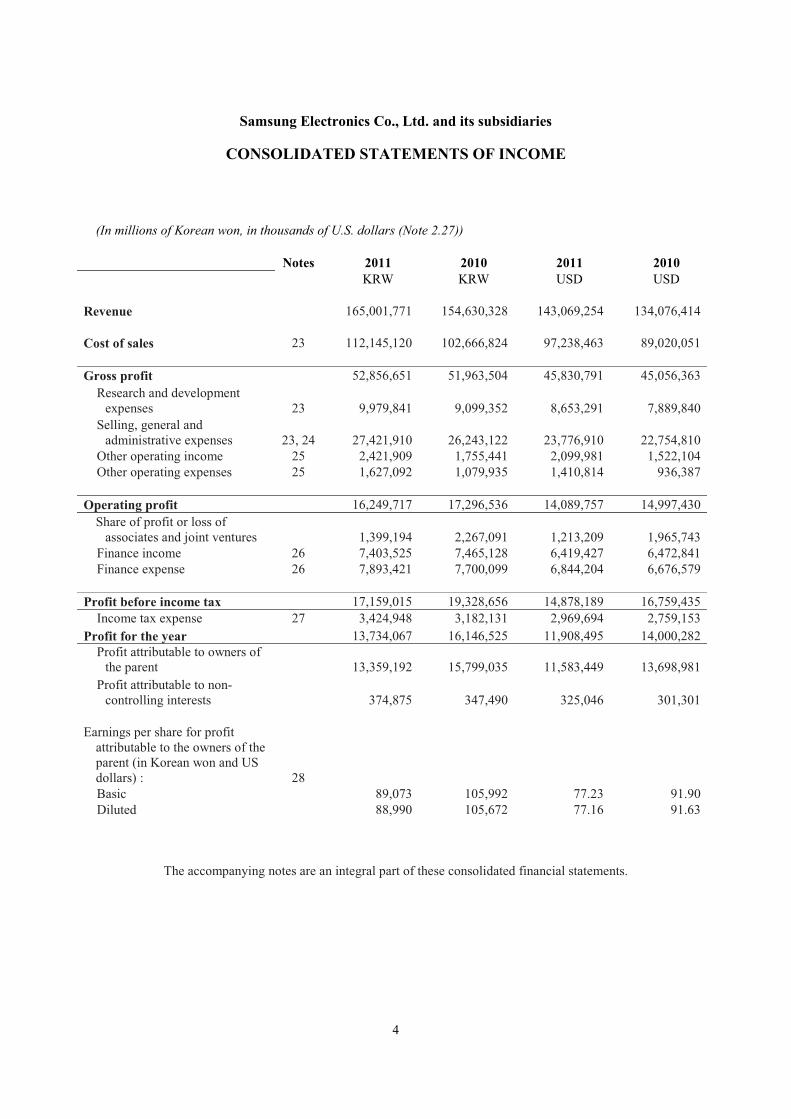
CONSOLIDATED STATEMENTS OF INCOME
(In millions of Korean won, in thousands of U.S. dollars (Note 2.27))
Notes 2011 2010 2011 2010KRW KRW USD USD
Revenue 165,001,771 154,630,328 143,069,254 134,076,414
Cost of sales 23 112,145,120 102,666,824 97,238,463 89,020,051
Gross profit 52,856,651 51,963,504 45,830,791 45,056,363Research and developmentexpenses 23 9,979,841 9,099,352 8,653,291 7,889,840Selling, general andadministrative expenses 23, 24 27,421,910 26,243,122 23,776,910 22,754,810Other operating income 25 2,421,909 1,755,441 2,099,981 1,522,104Other operating expenses 25 1,627,092 1,079,935 1,410,814 936,387
Operating profit 16,249,717 17,296,536 14,089,757 14,997,430Share of profit or loss ofassociates and joint ventures 1,399,194 2,267,091 1,213,209 1,965,743Finance income 26 7,403,525 7,465,128 6,419,427 6,472,841Finance expense 26 7,893,421 7,700,099 6,844,204 6,676,579
Profit before income tax 17,159,015 19,328,656 14,878,189 16,759,435Income tax expense 27 3,424,948 3,182,131 2,969,694 2,759,153
Profit for the year 13,734,067 16,146,525 11,908,495 14,000,282Profit attributable to owners ofthe parent 13,359,192 15,799,035 11,583,449 13,698,981Profit attributable to non-controlling interests 374,875 347,490 325,046 301,301
Earnings per share for profitattributable to the owners of theparent (in Korean won and USdollars) : 28Basic 89,073 105,992 77.23 91.90Diluted 88,990 105,672 77.16 91.63
The accompanying notes are an integral part of these consolidated financial statements.

5
Samsung Electronics Co., Ltd. and its subsidiaries
CONSOLIDATED STATEMENTS OF COMPREHENSIVE INCOME
(In millions of Korean won, in thousands of U.S. dollars (Note 2.27))
2011 2010 2011 2010KRW KRW USD USD
Profit for the year 13,734,067 16,146,525 11,908,495 14,000,282Available-for-sale financial assets,net of tax (572,028) 932,384 (495,992) 808,449
Share of other comprehensive incomeof associates and joint ventures, netof tax (113,898) 387,457 (98,758) 335,955
Foreign currency translation,net of tax 183,655 (178,357) 159,243 (154,649)
Total consolidated comprehensiveincome 13,231,796 17,288,009 11,472,988 14,990,037
Consolidated comprehensive incomeattributable to :Owners of the parent 12,801,542 16,901,117 11,099,924 14,654,571Non-controlling interests 430,254 386,892 373,064 335,466
The accompanying notes are an integral part of these consolidated financial statements.

10
Samsung Electronics Co., Ltd. and its subsidiaries
CONSOLIDATED STATEMENTS OF CASH FLOWS
(In millions of Korean won, in thousands of U.S. dollars (Note 2.27))
For the years ended December 31,Notes 2011 2010 2011 2010
KRW KRW USD USDCash flows from operatingactivities
Profit for the year 13,734,067 16,146,525 11,908,495 14,000,282Adjustments 29 16,475,605 14,088,323 14,285,620 12,215,662Changes in operating assets andliabilities 29 (4,057,345) (5,668,035) (3,518,031) (4,914,623)
Cash flows from operating activities 26,152,327 24,566,813 22,676,084 21,301,321Interest received 755,859 457,508 655,388 396,695Interest paid (641,462) (582,292) (556,197) (504,892)Dividend received 628,585 1,520,037 545,032 1,317,989Income tax paid (3,977,408) (2,135,287) (3,448,719) (1,851,458)Net cash generated fromOperating activities 22,917,901 23,826,779 19,871,588 20,659,655
Cash flows from investingactivities
Net decrease(increase) in short-termfinancial instruments 75,666 (2,991,820) 65,608 (2,594,139)
Net decrease in short-termavailable-for-sale financial assets 518,479 981,599 449,561 851,122
Proceeds from disposal of long-termavailable-for-sale financial assets 415,096 9,207 359,920 7,983
Acquisition of long-term available-for-sale financial assets (419,678) (414,978) (363,893) (359,818)
Proceeds from disposal ofassociates and joint ventures 306,804 277,907 266,023 240,967
Acquisition of associates and jointventures (403,538) (243) (349,899) (211)
Disposal of property and equipment 379,878 1,228,007 329,384 1,064,777Purchases of property and equipment (21,965,678) (21,619,244) (19,045,936) (18,745,551)Disposal of intangible assets 9,703 16,620 8,413 14,411Purchases of intangible assets (663,678) (1,259,895) (575,460) (1,092,426)Proceeds from deposits 461,454 366,304 400,116 317,614Payment for deposits (594,067) (420,986) (515,102) (365,027)Cash inflows(outflows) frombusiness combination (522,740) 47,549 (453,256) 41,229
Cash inflows from disposal ofbusiness 925,454 179,437 802,440 155,586
Others 364,281 (384,341) 315,860 (333,253)Net cash used in investingactivities (21,112,564) (23,984,877) (18,306,221) (20,796,736)

11
Samsung Electronics Co., Ltd. and its subsidiaries
CONSOLIDATED STATEMENTS OF CASH FLOWS
(In millions of Korean won, in thousands of U.S. dollars (Note 2.27))
For the years ended December 31,Notes 2011 2010 2011 2010
KRW KRW USD USDCash flows from financingactivities
Net proceeds from short-termborrowings 977,315 868,156 847,407 752,758
Disposal of treasury stock 160,827 184,291 139,449 159,795Proceeds from debentures andlong-term borrowings 3,925,406 1,137,646 3,403,630 986,427
Repayment of debentures andlong-term borrowings (1,145,167) (304,074) (992,948) (263,656)
Payment of dividends (874,608) (1,917,637) (758,353) (1,662,739)Others 65,956 (120,677) 57,189 (104,636)Net cash provided by(used in) financingactivities 3,109,729 (152,295) 2,696,374 (132,051)
Effect of exchange ratechanges on cash and cashequivalents (14,724) (48,118) (12,767) (41,722)Net increase (decrease) incash and cash equivalents 4,900,342 (358,511) 4,248,974 (310,854)
Cash and cash equivalentsBeginning of the year 9,791,419 10,149,930 8,489,915 8,800,769End of the year 14,691,761 9,791,419 12,738,889 8,489,915
The accompanying notes are an integral part of these consolidated financial statements.

6
Samsung Electronics Co., Ltd. and its subsidiaries
CONSOLIDATED STATEMENTS OF CHANGES IN EQUITY
(In millions of Korean won)
2010 KRWPreferredstock
Commonstock
Sharepremium
Retainedearnings
Otherreserves
Equityattributableto owners ofthe parent
Non-controllinginterests Total
Balance at January 1, 2010 119,467 778,047 4,403,893 71,065,247 (6,801,601) 69,565,053 3,480,149 73,045,202Profit for the year - - - 15,799,035 - 15,799,035 347,490 16,146,525Available-for-sale financialassets, net of tax - - - - 926,428 926,428 5,956 932,384
Share of other comprehensiveincome of associates andjoint ventures, net of tax - - - - 387,457 387,457 - 387,457
Foreign currency translation,net of tax - - - - (211,802) (211,802) 33,445 (178,357)
Total comprehensive income - - - 15,799,035 1,102,083 16,901,118 386,891 17,288,009Dividends - - - (1,858,994) - (1,858,994) (71,869) (1,930,863)Paid-in-capital increase - - - - - - (49,294) (49,294)Effect of business combination - - - - - - 17,647 17,647Disposal of treasury stock - - - - 1,060,990 1,060,990 - 1,060,990Stock option activities - - - - (84,762) (84,762) - (84,762)Others - - - 9,262 (3,108) 6,154 (3,992) 2,162Total transactions with owners - - - (1,849,732) 973,120 (876,612) (107,508) (984,120)Balance at December 31, 2010 119,467 778,047 4,403,893 85,014,550 (4,726,398) 85,589,559 3,759,532 89,349,091
7
Samsung Electronics Co., Ltd. and its subsidiaries
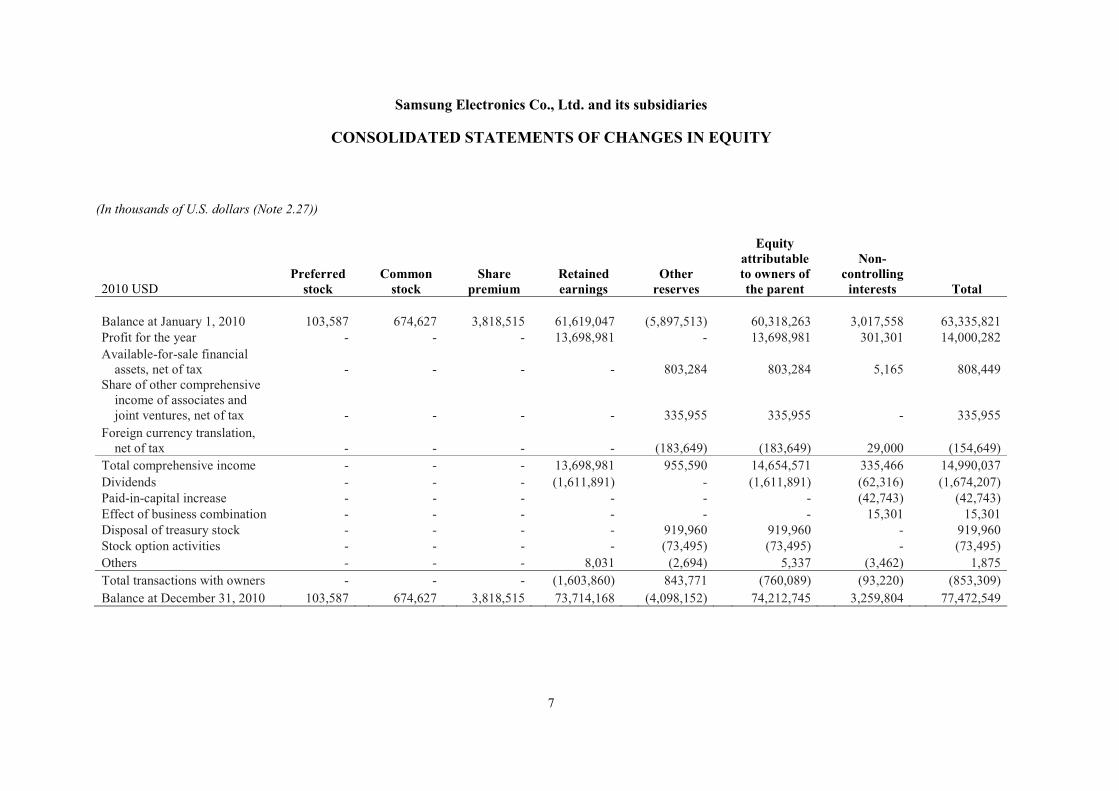
CONSOLIDATED STATEMENTS OF CHANGES IN EQUITY
(In thousands of U.S. dollars (Note 2.27))
2010 USDPreferredstock
Commonstock
Sharepremium
Retainedearnings
Otherreserves
Equityattributableto owners ofthe parent
Non-controllinginterests Total
Balance at January 1, 2010 103,587 674,627 3,818,515 61,619,047 (5,897,513) 60,318,263 3,017,558 63,335,821Profit for the year - - - 13,698,981 - 13,698,981 301,301 14,000,282Available-for-sale financialassets, net of tax - - - - 803,284 803,284 5,165 808,449
Share of other comprehensiveincome of associates andjoint ventures, net of tax - - - - 335,955 335,955 - 335,955
Foreign currency translation,net of tax - - - - (183,649) (183,649) 29,000 (154,649)
Total comprehensive income - - - 13,698,981 955,590 14,654,571 335,466 14,990,037Dividends - - - (1,611,891) - (1,611,891) (62,316) (1,674,207)Paid-in-capital increase - - - - - - (42,743) (42,743)Effect of business combination - - - - - - 15,301 15,301Disposal of treasury stock - - - - 919,960 919,960 - 919,960Stock option activities - - - - (73,495) (73,495) - (73,495)Others - - - 8,031 (2,694) 5,337 (3,462) 1,875Total transactions with owners - - - (1,603,860) 843,771 (760,089) (93,220) (853,309)Balance at December 31, 2010 103,587 674,627 3,818,515 73,714,168 (4,098,152) 74,212,745 3,259,804 77,472,549

8
Samsung Electronics Co., Ltd. and its subsidiaries
CONSOLIDATED STATEMENTS OF CHANGES IN EQUITY
(In millions of Korean won)
2011 KRWPreferredstock
Commonstock
Sharepremium
Retainedearnings
Otherreserves
Equityattributableto owners ofthe parent
Non-controllinginterests Total
Balance at January 1, 2011 119,467 778,047 4,403,893 85,014,550 (4,726,398) 85,589,559 3,759,532 89,349,091Profit for the year - - - 13,359,192 - 13,359,192 374,875 13,734,067Available-for-sale financialassets, net of tax - - - - (567,186) (567,186) (4,842) (572,028)
Share of other comprehensiveincome of associates andjoint ventures, net of tax - - - - (113,898) (113,898) - (113,898)
Foreign currency translation,net of tax - - - - 123,434 123,434 60,221 183,655
Total comprehensive income - - - 13,359,192 (557,650) 12,801,542 430,254 13,231,796Dividends - - - (824,478) - (824,478) (156,388) (980,866)Paid-in-capital increase - - - - (109,882) (109,882) 79,196 (30,686)Effect of business combination - - - - - - 131,564 131,564Disposal of treasury stock - - - - 288,773 288,773 - 288,773Stock option activities - - - - (73,008) (73,008) - (73,008)Others - - - (6,739) (66,002) (72,741) 1,400 (71,341)Total transactions with owners - - - (831,217) 39,881 (791,336) 55,772 (735,564)Balance at December 31, 2011 119,467 778,047 4,403,893 97,542,525 (5,244,167) 97,599,765 4,245,558 101,845,323

9
Samsung Electronics Co., Ltd. and its subsidiaries
CONSOLIDATED STATEMENTS OF CHANGES IN EQUITY
(In thousands of U.S. dollars (Note 2.27))
2011 USDPreferredstock
Commonstock
Sharepremium
Retainedearnings
Otherreserves
Equityattributableto owners ofthe parent
Non-controllinginterests Total
Balance at January 1, 2011 103,587 674,627 3,818,515 73,714,168 (4,098,152) 74,212,745 3,259,804 77,472,549Profit for the year - - - 11,583,449 - 11,583,449 325,046 11,908,495Available-for-sale financialassets, net of tax - - - - (491,794) (491,794) (4,198) (495,992)
Share of other comprehensiveincome of associates and jointventures, net of tax - - - - (98,758) (98,758) - (98,758)
Foreign currency translation,net of tax - - - - 107,027 107,027 52,216 159,243
Total comprehensive income - - - 11,583,449 (483,525) 11,099,924 373,064 11,472,988Dividends - - - (714,886) - (714,886) (135,600) (850,486)Paid-in-capital increase - - - - (95,276) (95,276) 68,669 (26,607)Effect of business combination - - - - - - 114,076 114,076Disposal of treasury stock - - - - 250,388 250,388 - 250,388Stock option activities - - - - (63,304) (63,304) - (63,304)Others - - - (5,843) (57,228) (63,071) 1,213 (61,858)Total Transactions with owners - - - (720,729) 34,580 (686,149) 48,358 (637,791)Balance at December 31, 2011 103,587 674,627 3,818,515 84,576,888 (4,547,097) 84,626,520 3,681,226 88,307,746
The accompanying notes are an integral part of these consolidated financial statements.
Samsung Electronics Co., Ltd. and Subsidiaries
NOTES TO THE CONSOLIDATED FINANCIAL STATEMENTS
12
1. General Information
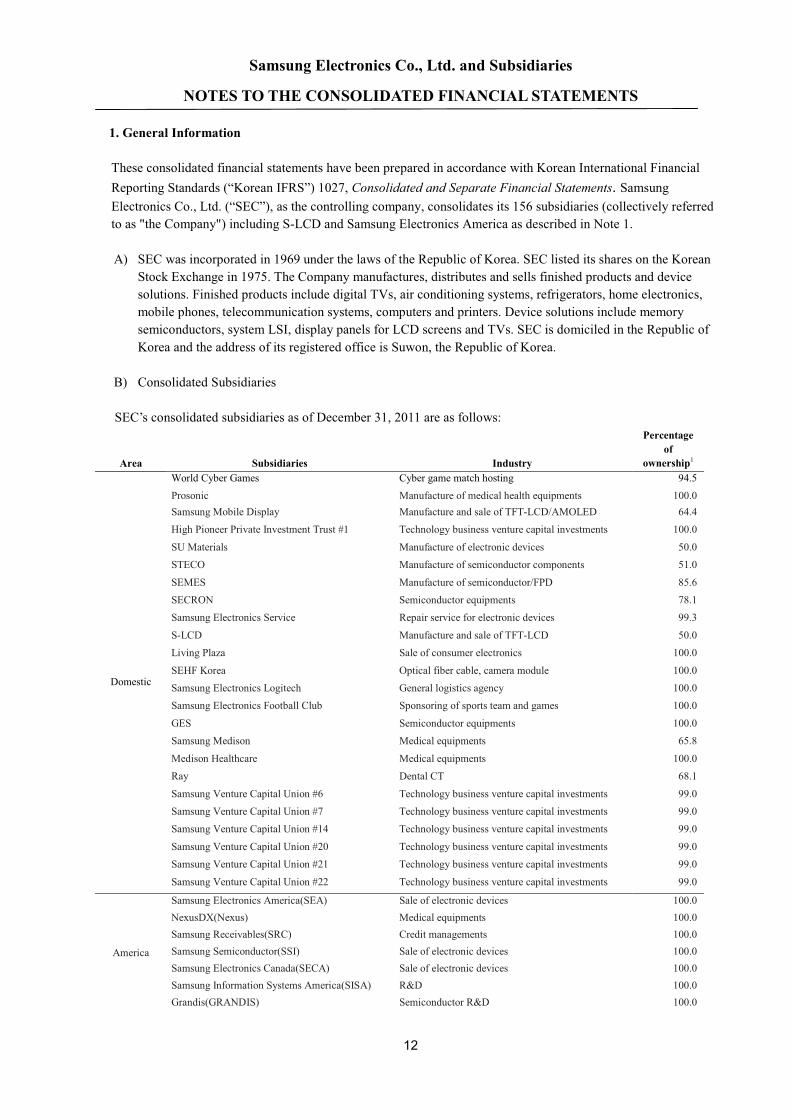
These consolidated financial statements have been prepared in accordance with Korean International FinancialReporting Standards (“Korean IFRS”) 1027, Consolidated and Separate Financial Statements. SamsungElectronics Co., Ltd. (“SEC”), as the controlling company, consolidates its 156 subsidiaries (collectively referredto as "the Company") including S-LCD and Samsung Electronics America as described in Note 1.
A) SEC was incorporated in 1969 under the laws of the Republic of Korea. SEC listed its shares on the KoreanStock Exchange in 1975. The Company manufactures, distributes and sells finished products and devicesolutions. Finished products include digital TVs, air conditioning systems, refrigerators, home electronics,mobile phones, telecommunication systems, computers and printers. Device solutions include memorysemiconductors, system LSI, display panels for LCD screens and TVs. SEC is domiciled in the Republic ofKorea and the address of its registered office is Suwon, the Republic of Korea.
B) Consolidated Subsidiaries
SEC’s consolidated subsidiaries as of December 31, 2011 are as follows:
Area Subsidiaries Industry
Percentageof
ownership1
Domestic
World Cyber Games Cyber game match hosting 94.5
Prosonic Manufacture of medical health equipments 100.0Samsung Mobile Display Manufacture and sale of TFT-LCD/AMOLED 64.4
High Pioneer Private Investment Trust #1 Technology business venture capital investments 100.0
SU Materials Manufacture of electronic devices 50.0
STECO Manufacture of semiconductor components 51.0
SEMES Manufacture of semiconductor/FPD 85.6
SECRON Semiconductor equipments 78.1
Samsung Electronics Service Repair service for electronic devices 99.3
S-LCD Manufacture and sale of TFT-LCD 50.0
Living Plaza Sale of consumer electronics 100.0
SEHF Korea Optical fiber cable, camera module 100.0
Samsung Electronics Logitech General logistics agency 100.0
Samsung Electronics Football Club Sponsoring of sports team and games 100.0
GES Semiconductor equipments 100.0
Samsung Medison Medical equipments 65.8
Medison Healthcare Medical equipments 100.0
Ray Dental CT 68.1
Samsung Venture Capital Union #6 Technology business venture capital investments 99.0
Samsung Venture Capital Union #7 Technology business venture capital investments 99.0
Samsung Venture Capital Union #14 Technology business venture capital investments 99.0
Samsung Venture Capital Union #20 Technology business venture capital investments 99.0
Samsung Venture Capital Union #21 Technology business venture capital investments 99.0
Samsung Venture Capital Union #22 Technology business venture capital investments 99.0
America
Samsung Electronics America(SEA) Sale of electronic devices 100.0NexusDX(Nexus) Medical equipments 100.0Samsung Receivables(SRC) Credit managements 100.0Samsung Semiconductor(SSI) Sale of electronic devices 100.0Samsung Electronics Canada(SECA) Sale of electronic devices 100.0Samsung Information Systems America(SISA) R&D 100.0Grandis(GRANDIS) Semiconductor R&D 100.0
Samsung Electronics Co., Ltd. and Subsidiaries
NOTES TO THE CONSOLIDATED FINANCIAL STATEMENTS
13
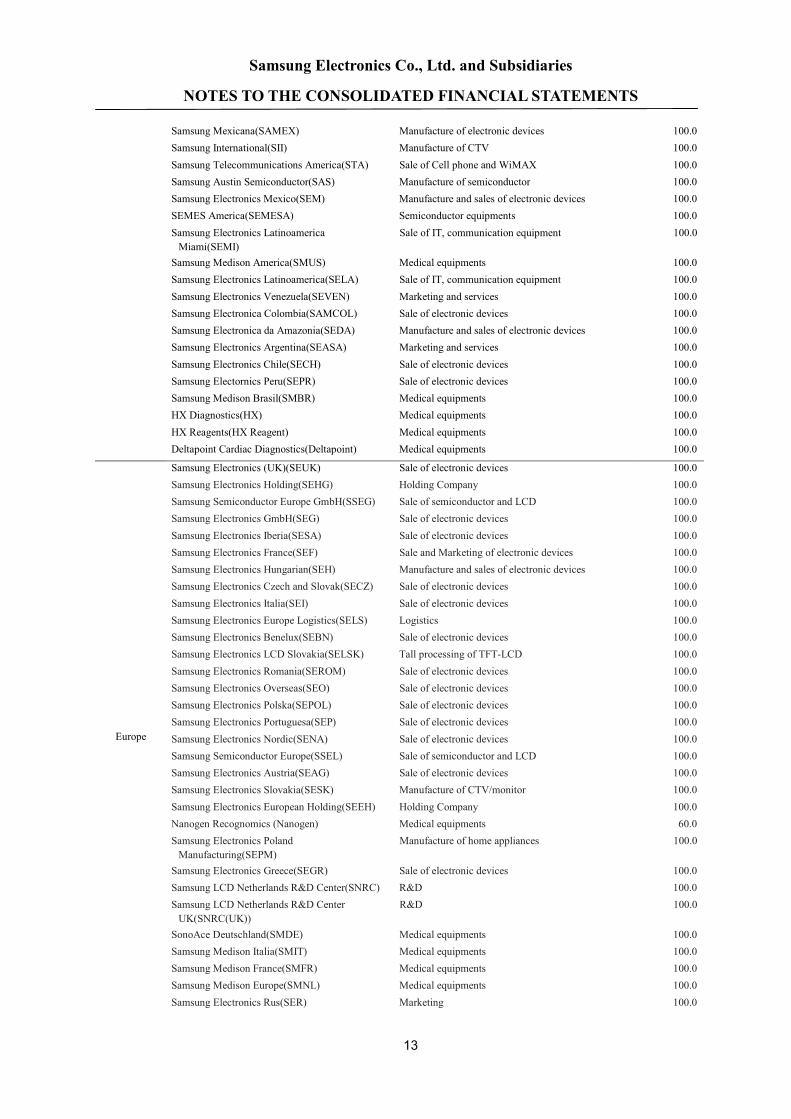
Samsung Mexicana(SAMEX) Manufacture of electronic devices 100.0Samsung International(SII) Manufacture of CTV 100.0Samsung Telecommunications America(STA) Sale of Cell phone and WiMAX 100.0Samsung Austin Semiconductor(SAS) Manufacture of semiconductor 100.0Samsung Electronics Mexico(SEM) Manufacture and sales of electronic devices 100.0SEMES America(SEMESA) Semiconductor equipments 100.0Samsung Electronics LatinoamericaMiami(SEMI)
Sale of IT, communication equipment 100.0
Samsung Medison America(SMUS) Medical equipments 100.0Samsung Electronics Latinoamerica(SELA) Sale of IT, communication equipment 100.0Samsung Electronics Venezuela(SEVEN) Marketing and services 100.0Samsung Electronica Colombia(SAMCOL) Sale of electronic devices 100.0Samsung Electronica da Amazonia(SEDA) Manufacture and sales of electronic devices 100.0Samsung Electronics Argentina(SEASA) Marketing and services 100.0Samsung Electronics Chile(SECH) Sale of electronic devices 100.0Samsung Electornics Peru(SEPR) Sale of electronic devices 100.0Samsung Medison Brasil(SMBR) Medical equipments 100.0HX Diagnostics(HX) Medical equipments 100.0HX Reagents(HX Reagent) Medical equipments 100.0Deltapoint Cardiac Diagnostics(Deltapoint) Medical equipments 100.0
Europe
Samsung Electronics (UK)(SEUK) Sale of electronic devices 100.0Samsung Electronics Holding(SEHG) Holding Company 100.0Samsung Semiconductor Europe GmbH(SSEG) Sale of semiconductor and LCD 100.0Samsung Electronics GmbH(SEG) Sale of electronic devices 100.0Samsung Electronics Iberia(SESA) Sale of electronic devices 100.0Samsung Electronics France(SEF) Sale and Marketing of electronic devices 100.0Samsung Electronics Hungarian(SEH) Manufacture and sales of electronic devices 100.0Samsung Electronics Czech and Slovak(SECZ) Sale of electronic devices 100.0Samsung Electronics Italia(SEI) Sale of electronic devices 100.0Samsung Electronics Europe Logistics(SELS) Logistics 100.0Samsung Electronics Benelux(SEBN) Sale of electronic devices 100.0Samsung Electronics LCD Slovakia(SELSK) Tall processing of TFT-LCD 100.0Samsung Electronics Romania(SEROM) Sale of electronic devices 100.0Samsung Electronics Overseas(SEO) Sale of electronic devices 100.0Samsung Electronics Polska(SEPOL) Sale of electronic devices 100.0Samsung Electronics Portuguesa(SEP) Sale of electronic devices 100.0Samsung Electronics Nordic(SENA) Sale of electronic devices 100.0Samsung Semiconductor Europe(SSEL) Sale of semiconductor and LCD 100.0Samsung Electronics Austria(SEAG) Sale of electronic devices 100.0Samsung Electronics Slovakia(SESK) Manufacture of CTV/monitor 100.0Samsung Electronics European Holding(SEEH) Holding Company 100.0Nanogen Recognomics (Nanogen) Medical equipments 60.0Samsung Electronics PolandManufacturing(SEPM)
Manufacture of home appliances 100.0
Samsung Electronics Greece(SEGR) Sale of electronic devices 100.0Samsung LCD Netherlands R&D Center(SNRC) R&D 100.0Samsung LCD Netherlands R&D CenterUK(SNRC(UK))
R&D 100.0
SonoAce Deutschland(SMDE) Medical equipments 100.0Samsung Medison Italia(SMIT) Medical equipments 100.0Samsung Medison France(SMFR) Medical equipments 100.0Samsung Medison Europe(SMNL) Medical equipments 100.0Samsung Electronics Rus(SER) Marketing 100.0

Samsung Electronics Co., Ltd. and Subsidiaries
NOTES TO THE CONSOLIDATED FINANCIAL STATEMENTS
14
Samsung Electronics Rus Company(SERC) Sale of electronic devices 100.0Samsung Electronics Ukraine(SEU) Marketing 100.0Samsung Electronics Baltics(SEB) Sale of electronic devices 100.0Samsung Electronics Ukraine Company(SEUC) Sale of electronic devices 100.0Samsung Moscow Research Centre(SMRC) R&D 100.0Samsung Electronics Kazakhstan(SEK) Marketing 100.0Samsung Eletronics KZ and Central Asia(SEKZ) Sale of electronic devices 100.0Samsung Electronics Rus Kaluga(SERK) Manufacture of CTV 100.0Samsung Russia Service Center(SRSC) Services 100.0Samsung Opto-Electronics GmbH(SOG) Sale of electronic devices 100.0Samsung Electronics Limited(SEL) Others 100.0Samsung Telecoms (UK)(STUK) Sale of electronic devices 100.0
Middle Eastand Africa
Samsung Electronics West Africa(SEWA) Marketing 100.0
Samsung Electronics East Africa(SEEA) Marketing 100.0Samsung Gulf Electronics(SGE) Sale of electronic devices 100.0Samsung Electronics South Africa(SSA) Sale of electronic devices 100.0Samsung Electronics Turkey(SETK) Sale and Marketing of electronic devices 100.0Samsung Semiconductor Israel R&DCenter(SIRC)
R&D 100.0
Samsung Electronics Levant(SELV) Sale of electronic devices 100.0Samsung Electronics Morocco(SEMRC) Sale of electronic devices 100.0
China
Dongguan Samsung Mobile Display(DSMD) Manufacture of TFT-LCD 100.0Tianjin Samsung Mobile Display(TSMD) Manufacture of TFT-LCD 95.0Samsung Electronics Hong Kong(SEHK) Sale of electronic devices 100.0Suzhou Samsung Electronics(SSEC) Manufacture of home appliances 88.3Samsung Suzhou Electronics Export(SSEC-E) Manufacture of home appliances 100.0Samsung (China) Investment(SCIC) Sale of electronic devices 100.0Samsung Guangzhou Mobile R&DCenter(SGMC)
R&D 100.0
Samsung Tianjin Mobile R&D(STMC) R&D 100.0Samsung Electronics SuzhouSemiconductor(SESS)
Tall processing of semiconductor 100.0
Samsung Electronics (Shandong) DigitalPrinting(SSDP)
Manufacture of printer 100.0
Samsung Electronics Huizhou(SEHZ) Manufacture of electronic devices 99.8Tianjin Samsung Electronics(TSEC) Manufacture of electronic devices 91.3Samsung Electronics Taiwan(SET) Sale of electronic devices 100.0Beijing Samsung Telecom R&D Center(BST) R&D 100.0Tianjin Samsung Telecom Technology(TSTC) Manufacture of handsets 90.0Shanghai Samsung Semiconductor(SSS) Sale of semiconductor and LCD 100.0Samsung Electronics Suzhou Computer(SESC) Manufacture and sales of Note PC 100.0Samsung Electronics Suzhou LCD(SESL) Tall processing of TFT-LCD 100.0Samsung Suzhou LCD(SSL) Tall processing of TFT-LCD 60.0Shenzhen Samsung Kejian MobileTelecommunication Technology(SSKMT)
Manufacture of handsets 60.0
Samsung Electronics ShanghaiTelecommunication(SSTC)
Sale of mobile communication and networkequipment
100.0
Samsung LCD Netherlands R&D CenterHK(SNRC(HK))
R&D 100.0
Samsung Semiconductor (China) R&D(SSCR) R&D 100.0Samsung Electronics China R&D Center(SCRC) R&D 100.0Samsung Electronics Hainan Fiberoptics(SEHF) Manufacture of optical fiber, cable 100.0Samsung Electronics (Beijing) Service(SBSC) Services 100.0
Samsung Electronics Co., Ltd. and Subsidiaries
NOTES TO THE CONSOLIDATED FINANCIAL STATEMENTS
15
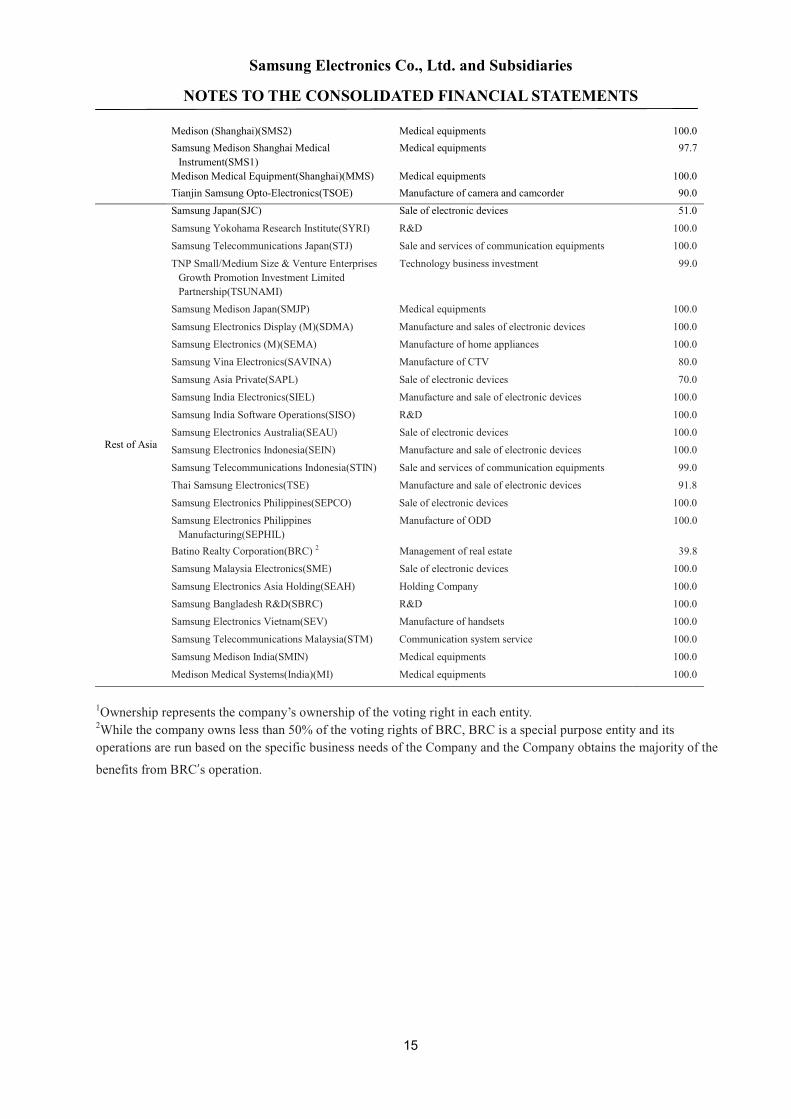
Medison (Shanghai)(SMS2) Medical equipments 100.0Samsung Medison Shanghai MedicalInstrument(SMS1)
Medical equipments 97.7
Medison Medical Equipment(Shanghai)(MMS) Medical equipments 100.0Tianjin Samsung Opto-Electronics(TSOE) Manufacture of camera and camcorder 90.0
Rest of Asia
Samsung Japan(SJC) Sale of electronic devices 51.0
Samsung Yokohama Research Institute(SYRI) R&D 100.0
Samsung Telecommunications Japan(STJ) Sale and services of communication equipments 100.0
TNP Small/Medium Size & Venture EnterprisesGrowth Promotion Investment LimitedPartnership(TSUNAMI)
Technology business investment 99.0
Samsung Medison Japan(SMJP) Medical equipments 100.0
Samsung Electronics Display (M)(SDMA) Manufacture and sales of electronic devices 100.0
Samsung Electronics (M)(SEMA) Manufacture of home appliances 100.0
Samsung Vina Electronics(SAVINA) Manufacture of CTV 80.0
Samsung Asia Private(SAPL) Sale of electronic devices 70.0
Samsung India Electronics(SIEL) Manufacture and sale of electronic devices 100.0
Samsung India Software Operations(SISO) R&D 100.0
Samsung Electronics Australia(SEAU) Sale of electronic devices 100.0
Samsung Electronics Indonesia(SEIN) Manufacture and sale of electronic devices 100.0
Samsung Telecommunications Indonesia(STIN) Sale and services of communication equipments 99.0
Thai Samsung Electronics(TSE) Manufacture and sale of electronic devices 91.8
Samsung Electronics Philippines(SEPCO) Sale of electronic devices 100.0
Samsung Electronics PhilippinesManufacturing(SEPHIL)
Manufacture of ODD 100.0
Batino Realty Corporation(BRC) 2 Management of real estate 39.8
Samsung Malaysia Electronics(SME) Sale of electronic devices 100.0
Samsung Electronics Asia Holding(SEAH) Holding Company 100.0
Samsung Bangladesh R&D(SBRC) R&D 100.0
Samsung Electronics Vietnam(SEV) Manufacture of handsets 100.0
Samsung Telecommunications Malaysia(STM) Communication system service 100.0
Samsung Medison India(SMIN) Medical equipments 100.0
Medison Medical Systems(India)(MI) Medical equipments 100.0
1Ownership represents the company’s ownership of the voting right in each entity.2While the company owns less than 50% of the voting rights of BRC, BRC is a special purpose entity and itsoperations are run based on the specific business needs of the Company and the Company obtains the majority of the
benefits from BRC s operation.

Samsung Electronics Co., Ltd. and Subsidiaries
NOTES TO THE CONSOLIDATED FINANCIAL STATEMENTS
16
C) A summary of financial data of major consolidated subsidiaries in December 31, 2011 and 2010 is as follows:
(1) 2011
(In millions of Korean Won)2011
Assets Liabilities Sales Net Income
Samsung Mobile Display 9,590,909 4,898,011 6,586,460 874,368
Samsung Electronics America(SEA) 9,816,571 4,913,504 10,873,623 (1,825)
Samsung Austin Semiconductor(SAS) 6,952,894 3,731,834 2,521,060 19,796
Samsung Semiconductor(SSI) 5,974,863 2,490,812 16,762,084 47,593
S-LCD 4,940,886 1,411,031 9,278,421 (179,759)Samsung Electronics EuropeanHolding(SEEH) 3,796,937 3,592,183 - 5,227
Samsung (China) Investment(SCIC) 3,323,358 2,652,717 9,117,657 124,892
Samsung Electronics Huizhou(SEHZ) 2,984,592 1,816,087 8,380,968 398,015
Samsung Japan(SJC) 2,856,471 2,197,847 7,840,230 36,929
Samsung Electronica da Amazonia(SEDA) 2,434,259 1,482,344 5,448,043 (43,406)
Samsung Electronics Slovakia(SESK) 2,361,719 1,174,527 4,893,947 255,032
Samsung Telecommunications America(STA) 2,235,101 1,818,412 10,059,797 46,184
Samsung Electronics Vietnam(SEV) 2,217,392 1,043,133 6,810,279 905,239
Shanghai Samsung Semiconductor(SSS) 2,024,403 1,901,188 10,919,636 48,248
Samsung Electronics Taiwan(SET) 1,794,858 1,582,616 5,394,509 18,497
Tianjin Samsung Telecom Technology(TSTC) 1,664,989 907,083 7,022,353 327,649
Samsung Electronics Rus Company(SERC) 1,509,256 1,189,211 5,725,681 33,313
Samsung Electronics Suzhou Computer(SESC) 1,411,349 1,018,670 6,092,471 156,469
Samsung Electronics Europe Logistics(SELS) 1,368,673 1,285,617 10,759,828 12,118Samsung Semiconductor EuropeGmbH(SSEG) 1,338,671 1,325,034 5,198,900 483
Samsung Electronics Hungarian(SEH) 1,318,553 592,167 4,322,195 191,329
Thai Samsung Electronics(TSE) 1,169,778 443,187 3,543,691 189,320
Samsung Electronics Hong Kong(SEHK) 1,155,606 998,115 1,522,892 23,104
Samsung Electronics Rus Kaluga(SERK) 1,125,145 470,867 2,177,423 291,158
Samsung Electronics Mexico(SEM) 1,094,270 925,327 2,444,660 5,125
Others 29,492,485 16,760,352 82,699,516 1,221,518
Total 105,953,988 62,621,876 246,396,324 5,006,616
Samsung Electronics Co., Ltd. and Subsidiaries
NOTES TO THE CONSOLIDATED FINANCIAL STATEMENTS
17
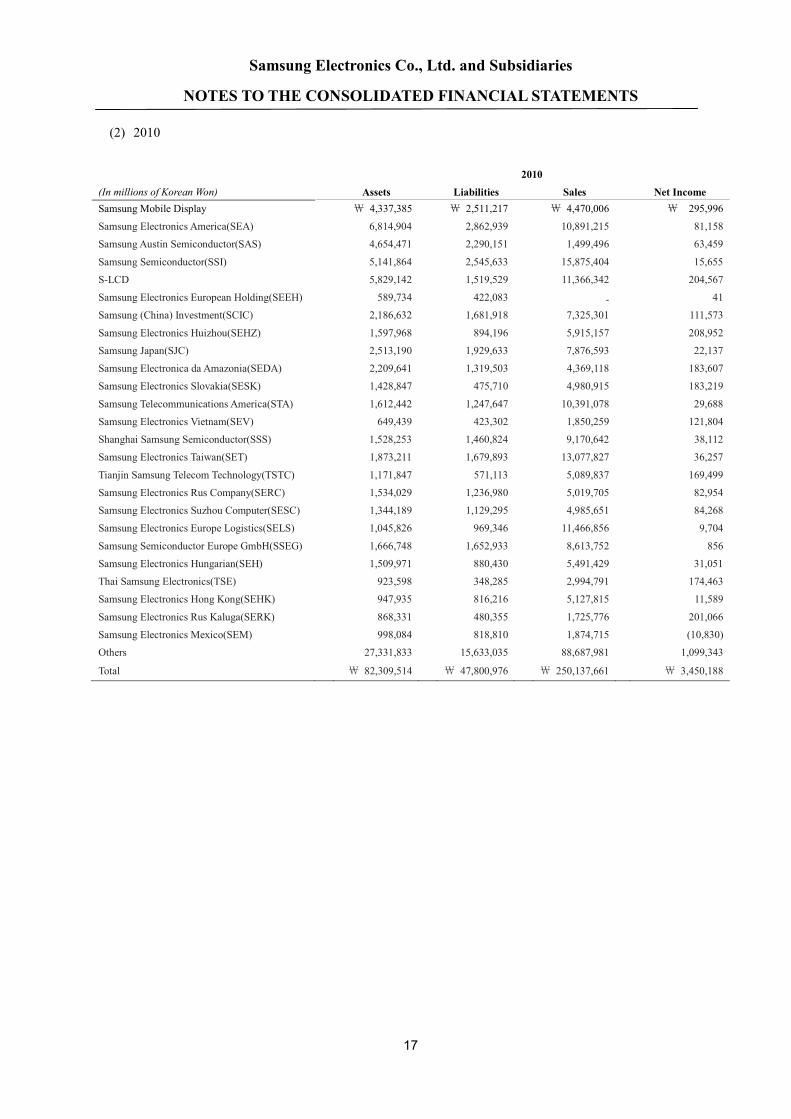
(2) 2010
(In millions of Korean Won)2010
Assets Liabilities Sales Net IncomeSamsung Mobile Display 4,337,385 2,511,217 4,470,006 295,996
Samsung Electronics America(SEA) 6,814,904 2,862,939 10,891,215 81,158
Samsung Austin Semiconductor(SAS) 4,654,471 2,290,151 1,499,496 63,459
Samsung Semiconductor(SSI) 5,141,864 2,545,633 15,875,404 15,655
S-LCD 5,829,142 1,519,529 11,366,342 204,567
Samsung Electronics European Holding(SEEH) 589,734 422,083 - 41
Samsung (China) Investment(SCIC) 2,186,632 1,681,918 7,325,301 111,573
Samsung Electronics Huizhou(SEHZ) 1,597,968 894,196 5,915,157 208,952
Samsung Japan(SJC) 2,513,190 1,929,633 7,876,593 22,137
Samsung Electronica da Amazonia(SEDA) 2,209,641 1,319,503 4,369,118 183,607
Samsung Electronics Slovakia(SESK) 1,428,847 475,710 4,980,915 183,219
Samsung Telecommunications America(STA) 1,612,442 1,247,647 10,391,078 29,688
Samsung Electronics Vietnam(SEV) 649,439 423,302 1,850,259 121,804
Shanghai Samsung Semiconductor(SSS) 1,528,253 1,460,824 9,170,642 38,112
Samsung Electronics Taiwan(SET) 1,873,211 1,679,893 13,077,827 36,257
Tianjin Samsung Telecom Technology(TSTC) 1,171,847 571,113 5,089,837 169,499
Samsung Electronics Rus Company(SERC) 1,534,029 1,236,980 5,019,705 82,954
Samsung Electronics Suzhou Computer(SESC) 1,344,189 1,129,295 4,985,651 84,268
Samsung Electronics Europe Logistics(SELS) 1,045,826 969,346 11,466,856 9,704
Samsung Semiconductor Europe GmbH(SSEG) 1,666,748 1,652,933 8,613,752 856
Samsung Electronics Hungarian(SEH) 1,509,971 880,430 5,491,429 31,051
Thai Samsung Electronics(TSE) 923,598 348,285 2,994,791 174,463
Samsung Electronics Hong Kong(SEHK) 947,935 816,216 5,127,815 11,589
Samsung Electronics Rus Kaluga(SERK) 868,331 480,355 1,725,776 201,066
Samsung Electronics Mexico(SEM) 998,084 818,810 1,874,715 (10,830)
Others 27,331,833 15,633,035 88,687,981 1,099,343
Total 82,309,514 47,800,976 250,137,661 3,450,188
Samsung Electronics Co., Ltd. and Subsidiaries
NOTES TO THE CONSOLIDATED FINANCIAL STATEMENTS
18
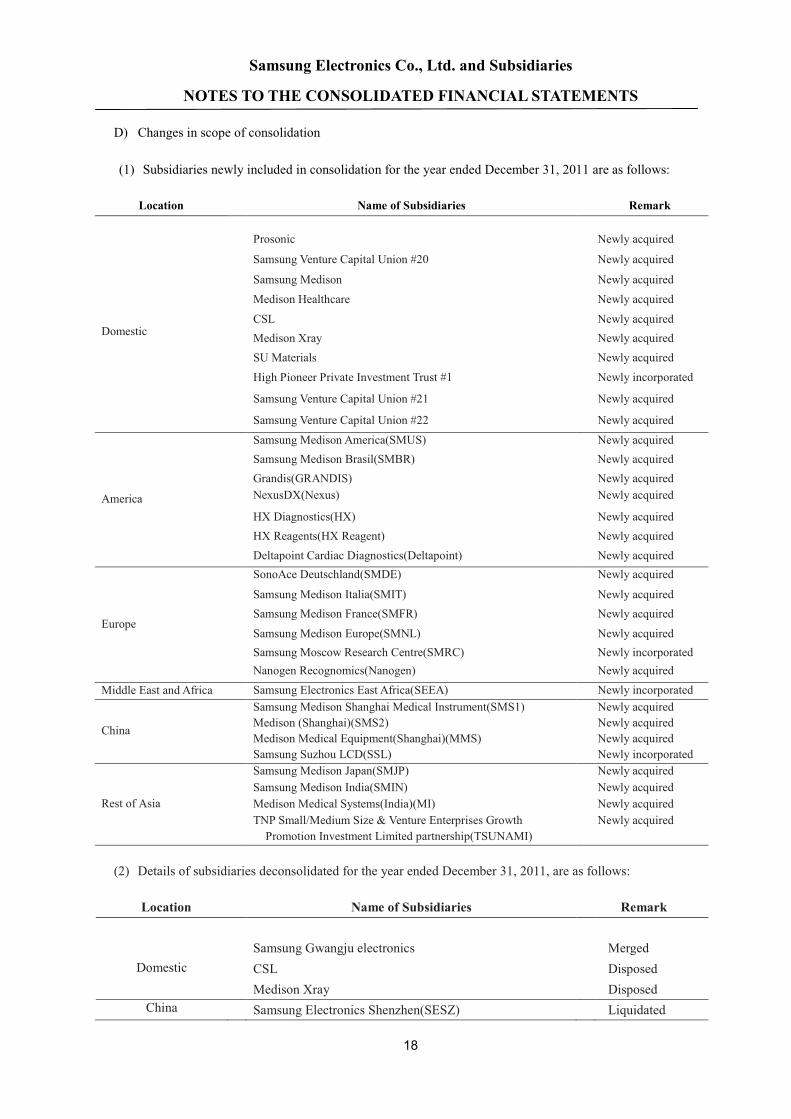
D) Changes in scope of consolidation
(1) Subsidiaries newly included in consolidation for the year ended December 31, 2011 are as follows:
Location Name of Subsidiaries Remark
Domestic
Prosonic Newly acquired
Samsung Venture Capital Union #20 Newly acquired
Samsung Medison Newly acquiredMedison Healthcare Newly acquired
CSL Newly acquiredMedison Xray Newly acquiredSU Materials Newly acquiredHigh Pioneer Private Investment Trust #1 Newly incorporated
Samsung Venture Capital Union #21 Newly acquired
Samsung Venture Capital Union #22 Newly acquired
America
Samsung Medison America(SMUS) Newly acquiredSamsung Medison Brasil(SMBR) Newly acquiredGrandis(GRANDIS) Newly acquiredNexusDX(Nexus) Newly acquired
HX Diagnostics(HX) Newly acquiredHX Reagents(HX Reagent) Newly acquiredDeltapoint Cardiac Diagnostics(Deltapoint) Newly acquired
Europe
SonoAce Deutschland(SMDE) Newly acquired
Samsung Medison Italia(SMIT) Newly acquiredSamsung Medison France(SMFR) Newly acquired
Samsung Medison Europe(SMNL) Newly acquiredSamsung Moscow Research Centre(SMRC) Newly incorporatedNanogen Recognomics(Nanogen) Newly acquired
Middle East and Africa Samsung Electronics East Africa(SEEA) Newly incorporated
China
Samsung Medison Shanghai Medical Instrument(SMS1) Newly acquiredMedison (Shanghai)(SMS2) Newly acquiredMedison Medical Equipment(Shanghai)(MMS) Newly acquiredSamsung Suzhou LCD(SSL) Newly incorporated
Rest of Asia
Samsung Medison Japan(SMJP) Newly acquiredSamsung Medison India(SMIN) Newly acquiredMedison Medical Systems(India)(MI) Newly acquiredTNP Small/Medium Size & Venture Enterprises GrowthPromotion Investment Limited partnership(TSUNAMI)
Newly acquired
(2) Details of subsidiaries deconsolidated for the year ended December 31, 2011, are as follows:
Location Name of Subsidiaries Remark
DomesticSamsung Gwangju electronics MergedCSL DisposedMedison Xray Disposed
China Samsung Electronics Shenzhen(SESZ) Liquidated
Samsung Electronics Co., Ltd. and Subsidiaries
NOTES TO THE CONSOLIDATED FINANCIAL STATEMENTS
19
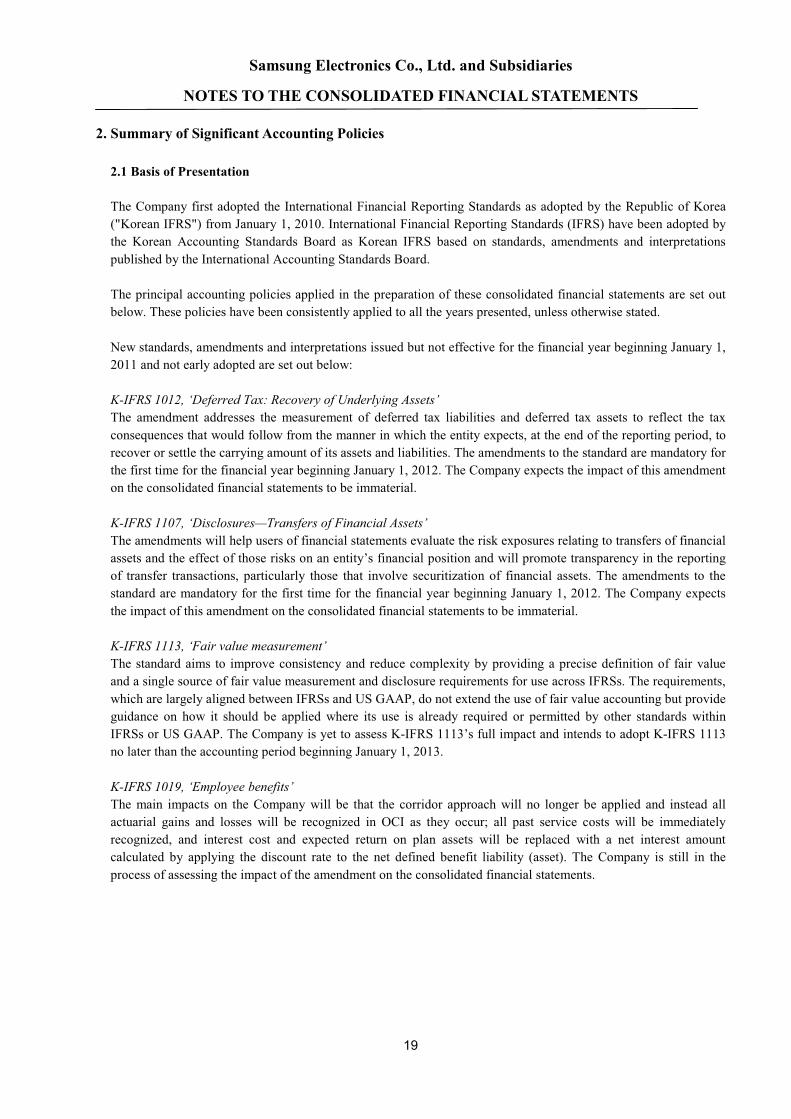
2. Summary of Significant Accounting Policies
2.1 Basis of Presentation
The Company first adopted the International Financial Reporting Standards as adopted by the Republic of Korea("Korean IFRS") from January 1, 2010. International Financial Reporting Standards (IFRS) have been adopted bythe Korean Accounting Standards Board as Korean IFRS based on standards, amendments and interpretationspublished by the International Accounting Standards Board.
The principal accounting policies applied in the preparation of these consolidated financial statements are set outbelow. These policies have been consistently applied to all the years presented, unless otherwise stated.
New standards, amendments and interpretations issued but not effective for the financial year beginning January 1,2011 and not early adopted are set out below:
K-IFRS 1012, ‘Deferred Tax: Recovery of Underlying Assets’The amendment addresses the measurement of deferred tax liabilities and deferred tax assets to reflect the taxconsequences that would follow from the manner in which the entity expects, at the end of the reporting period, torecover or settle the carrying amount of its assets and liabilities. The amendments to the standard are mandatory forthe first time for the financial year beginning January 1, 2012. The Company expects the impact of this amendmenton the consolidated financial statements to be immaterial.
K-IFRS 1107, ‘Disclosures—Transfers of Financial Assets’The amendments will help users of financial statements evaluate the risk exposures relating to transfers of financialassets and the effect of those risks on an entity’s financial position and will promote transparency in the reportingof transfer transactions, particularly those that involve securitization of financial assets. The amendments to thestandard are mandatory for the first time for the financial year beginning January 1, 2012. The Company expectsthe impact of this amendment on the consolidated financial statements to be immaterial.
K-IFRS 1113, ‘Fair value measurement’The standard aims to improve consistency and reduce complexity by providing a precise definition of fair valueand a single source of fair value measurement and disclosure requirements for use across IFRSs. The requirements,which are largely aligned between IFRSs and US GAAP, do not extend the use of fair value accounting but provideguidance on how it should be applied where its use is already required or permitted by other standards withinIFRSs or US GAAP. The Company is yet to assess K-IFRS 1113’s full impact and intends to adopt K-IFRS 1113no later than the accounting period beginning January 1, 2013.
K-IFRS 1019, ‘Employee benefits’The main impacts on the Company will be that the corridor approach will no longer be applied and instead allactuarial gains and losses will be recognized in OCI as they occur; all past service costs will be immediatelyrecognized, and interest cost and expected return on plan assets will be replaced with a net interest amountcalculated by applying the discount rate to the net defined benefit liability (asset). The Company is still in theprocess of assessing the impact of the amendment on the consolidated financial statements.
Samsung Electronics Co., Ltd. and Subsidiaries
NOTES TO THE CONSOLIDATED FINANCIAL STATEMENTS
20
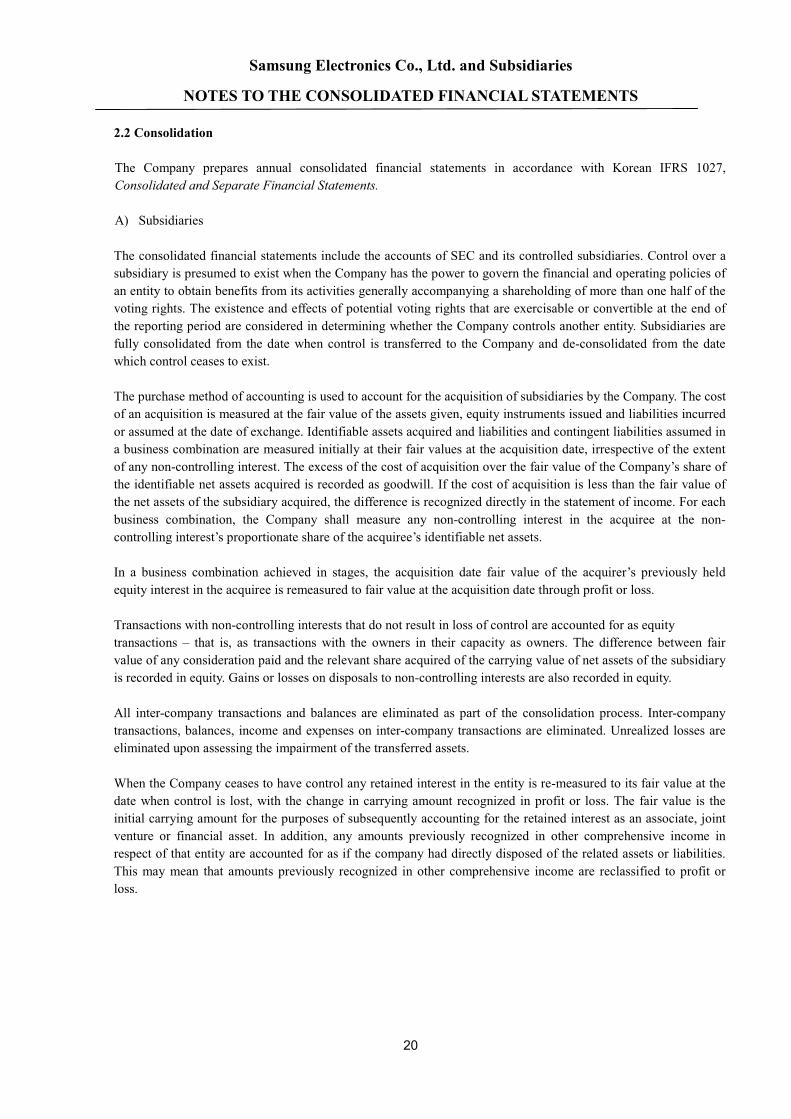
2.2 Consolidation
The Company prepares annual consolidated financial statements in accordance with Korean IFRS 1027,Consolidated and Separate Financial Statements.
A) Subsidiaries
The consolidated financial statements include the accounts of SEC and its controlled subsidiaries. Control over asubsidiary is presumed to exist when the Company has the power to govern the financial and operating policies ofan entity to obtain benefits from its activities generally accompanying a shareholding of more than one half of thevoting rights. The existence and effects of potential voting rights that are exercisable or convertible at the end ofthe reporting period are considered in determining whether the Company controls another entity. Subsidiaries arefully consolidated from the date when control is transferred to the Company and de-consolidated from the datewhich control ceases to exist.
The purchase method of accounting is used to account for the acquisition of subsidiaries by the Company. The costof an acquisition is measured at the fair value of the assets given, equity instruments issued and liabilities incurredor assumed at the date of exchange. Identifiable assets acquired and liabilities and contingent liabilities assumed ina business combination are measured initially at their fair values at the acquisition date, irrespective of the extentof any non-controlling interest. The excess of the cost of acquisition over the fair value of the Company’s share ofthe identifiable net assets acquired is recorded as goodwill. If the cost of acquisition is less than the fair value ofthe net assets of the subsidiary acquired, the difference is recognized directly in the statement of income. For eachbusiness combination, the Company shall measure any non-controlling interest in the acquiree at the non-controlling interest’s proportionate share of the acquiree’s identifiable net assets.
In a business combination achieved in stages, the acquisition date fair value of the acquirer’s previously heldequity interest in the acquiree is remeasured to fair value at the acquisition date through profit or loss.
Transactions with non-controlling interests that do not result in loss of control are accounted for as equitytransactions – that is, as transactions with the owners in their capacity as owners. The difference between fairvalue of any consideration paid and the relevant share acquired of the carrying value of net assets of the subsidiaryis recorded in equity. Gains or losses on disposals to non-controlling interests are also recorded in equity.
All inter-company transactions and balances are eliminated as part of the consolidation process. Inter-companytransactions, balances, income and expenses on inter-company transactions are eliminated. Unrealized losses areeliminated upon assessing the impairment of the transferred assets.
When the Company ceases to have control any retained interest in the entity is re-measured to its fair value at thedate when control is lost, with the change in carrying amount recognized in profit or loss. The fair value is theinitial carrying amount for the purposes of subsequently accounting for the retained interest as an associate, jointventure or financial asset. In addition, any amounts previously recognized in other comprehensive income inrespect of that entity are accounted for as if the company had directly disposed of the related assets or liabilities.This may mean that amounts previously recognized in other comprehensive income are reclassified to profit orloss.
Samsung Electronics Co., Ltd. and Subsidiaries
NOTES TO THE CONSOLIDATED FINANCIAL STATEMENTS
21
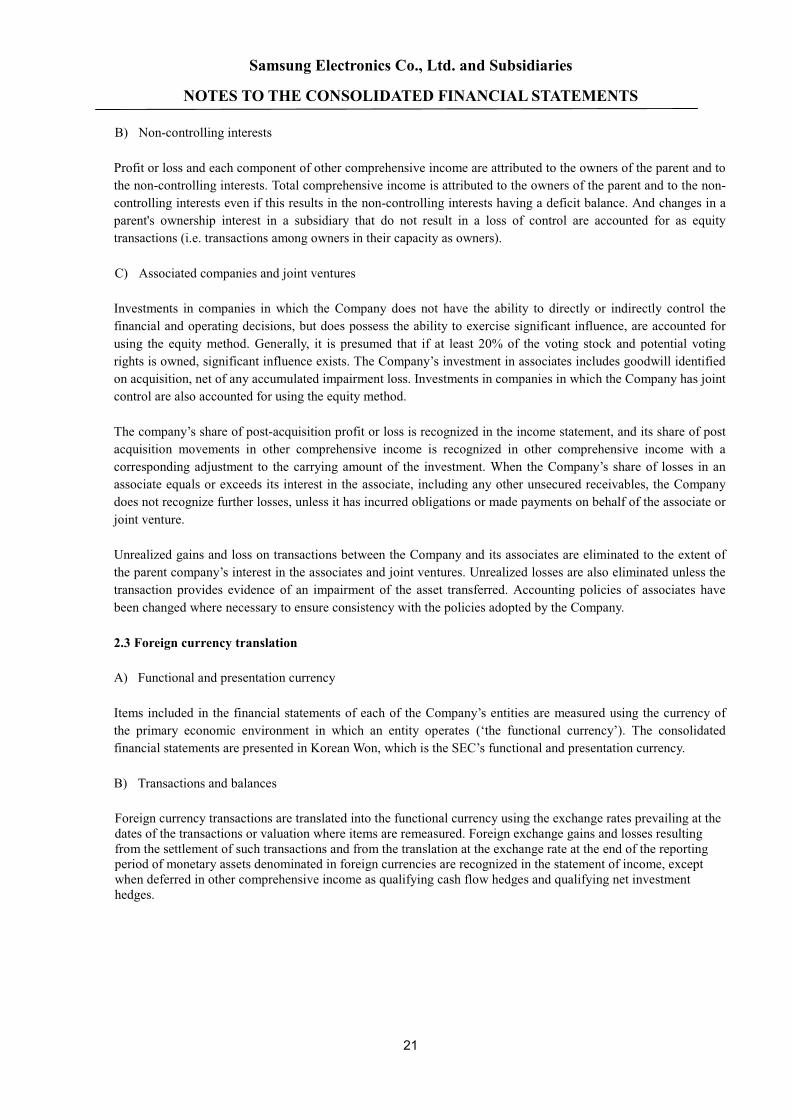
B) Non-controlling interests
Profit or loss and each component of other comprehensive income are attributed to the owners of the parent and tothe non-controlling interests. Total comprehensive income is attributed to the owners of the parent and to the non-controlling interests even if this results in the non-controlling interests having a deficit balance. And changes in aparent's ownership interest in a subsidiary that do not result in a loss of control are accounted for as equitytransactions (i.e. transactions among owners in their capacity as owners).
C) Associated companies and joint ventures
Investments in companies in which the Company does not have the ability to directly or indirectly control thefinancial and operating decisions, but does possess the ability to exercise significant influence, are accounted forusing the equity method. Generally, it is presumed that if at least 20% of the voting stock and potential votingrights is owned, significant influence exists. The Company’s investment in associates includes goodwill identifiedon acquisition, net of any accumulated impairment loss. Investments in companies in which the Company has jointcontrol are also accounted for using the equity method.
The company’s share of post-acquisition profit or loss is recognized in the income statement, and its share of postacquisition movements in other comprehensive income is recognized in other comprehensive income with acorresponding adjustment to the carrying amount of the investment. When the Company’s share of losses in anassociate equals or exceeds its interest in the associate, including any other unsecured receivables, the Companydoes not recognize further losses, unless it has incurred obligations or made payments on behalf of the associate orjoint venture.
Unrealized gains and loss on transactions between the Company and its associates are eliminated to the extent ofthe parent company’s interest in the associates and joint ventures. Unrealized losses are also eliminated unless thetransaction provides evidence of an impairment of the asset transferred. Accounting policies of associates havebeen changed where necessary to ensure consistency with the policies adopted by the Company.
2.3 Foreign currency translation
A) Functional and presentation currency
Items included in the financial statements of each of the Company’s entities are measured using the currency ofthe primary economic environment in which an entity operates (‘the functional currency’). The consolidatedfinancial statements are presented in Korean Won, which is the SEC’s functional and presentation currency.
B) Transactions and balances
Foreign currency transactions are translated into the functional currency using the exchange rates prevailing at thedates of the transactions or valuation where items are remeasured. Foreign exchange gains and losses resultingfrom the settlement of such transactions and from the translation at the exchange rate at the end of the reportingperiod of monetary assets denominated in foreign currencies are recognized in the statement of income, exceptwhen deferred in other comprehensive income as qualifying cash flow hedges and qualifying net investmenthedges.

Samsung Electronics Co., Ltd. and Subsidiaries
NOTES TO THE CONSOLIDATED FINANCIAL STATEMENTS
22
Changes in the fair value of monetary securities denominated in foreign currency classified as available-for-salefinancial assets are analyzed between translation differences resulting from changes in the amortized cost of thesecurity and other changes in the carrying amount of the security. Translation differences related to changes inamortized cost are recognized in profit or loss, and other changes in carrying amount are recognized in othercomprehensive income.
Translation differences on non-monetary financial assets such as equities held at fair value through profit or lossare recognized in profit or loss as part of the fair value gain or loss. Translation differences on non-monetaryfinancial assets such as equities classified as available-for-sale are included in other comprehensive income.
C) Translation of financial statements of foreign subsidiaries
The results and financial position of all the foreign entities that have a functional currency different from thepresentation currency of the Company are translated into the presentation currency as follows:
Assets and liabilities for each statement of financial position presented are translated at the closing rate at the endof the reporting date.
Income and expenses for each statement of income are translated at average exchange rates, unless this average isnot a reasonable approximation of the cumulative effect of the rates prevailing on the transaction dates, in whichcase income and expenses are translated at the rate on the dates of the transactions; and all resulting exchangedifferences are recognized in other comprehensive income.
On consolidation, exchange differences arising from the translation of the net investment in foreign operations arerecognized in other comprehensive income. When a foreign operation is partially disposed of or sold, theexchange differences that were recorded in equity are reclassified in the statement of income during the periodwhen the gain or loss is recognized in profit or loss.
2.4 Cash flow statements
Cash flow statements are prepared using the indirect method. Foreign currency cash flows have been translatedinto Korean Won using the average rates of exchange for the period under consideration.
2.5 Cash and cash equivalents
The Company considers all highly liquid investments with less than three months maturity from the date ofacquisition to be cash equivalents. Bank overdrafts are considered as short-term borrowings in the statement offinancial position and treated as financing activities in the cash flow statements, unless the overdraft is repayableon demand and used for cash management purposes only, in which case the overdraft is treated as cash and cashequivalents in the cash flow statement.
Samsung Electronics Co., Ltd. and Subsidiaries
NOTES TO THE CONSOLIDATED FINANCIAL STATEMENTS
23
2.6 Financial assets
A) Classification
The Company classifies its financial assets in the following categories: at fair value through profit or loss, loansand receivables, available-for-sale, and held-to-maturity investments. The classification depends on the terms ofthe instruments and purpose for which the financial assets were acquired. Management determines theclassification of its financial assets at initial recognition.
(1) Financial assets at fair value through profit or loss
Financial assets at fair value through profit or loss are financial assets held for trading. A financial asset isclassified in this category if acquired principally for the purpose of selling in the short-term. Derivatives are alsocategorised as held for trading unless they are designated as hedges. Assets in this category are classified ascurrent assets.
(2) Loans and receivables
Loans and receivables are non-derivative financial assets with fixed or determinable payments that are not quotedin an active market. They are included in current assets, except for those with maturities greater than 12 monthsafter the end of the reporting period; such loans and receivables are classified as non-current assets.
(3) Available-for-sale financial assets
Available-for-sale financial assets are non derivatives that are either designated in this category or not classified inany of the other categories. They are included in non-current assets unless an investment matures or managementintends to dispose of it within 12 months of the end of the reporting period.
(4) Held-to-maturity investments
Held-to-maturity investments are non-derivative financial assets with fixed or determinable payments and fixedmaturity that an entity has the positive intention and ability to hold to maturity. Held-to-maturity financial assetsare included in non-current assets, except for those with maturities less than 12 months from the end of thereporting period, which are classified as current assets.
B) Recognition and measurement
Regular purchases and sales of financial assets are recognized on the trade date – the date on which the Companycommits to purchase or sell the asset. Investments are initially recognized at fair value plus transaction costs for allfinancial assets not carried at fair value through profit or loss. Financial assets carried at fair value through profitor loss are initially recognized at fair value, and transaction costs are expensed in the statement of income.Financial assets are derecognized when the rights to receive cash flows from the investments have expired or havebeen transferred and the Company has transferred substantially all risks and rewards of ownership. Available-for-sale financial assets and financial assets at fair value through profit or loss are subsequently carried at fair value.Loans and receivables and held-to-maturity investments are subsequently carried at amortized cost using theeffective interest method.
Samsung Electronics Co., Ltd. and Subsidiaries
NOTES TO THE CONSOLIDATED FINANCIAL STATEMENTS
24
Gains or losses arising from changes in the fair value of the financial assets at fair value through profit or losscategory are presented in the statement of income in the period in which they arise. Dividend income fromfinancial assets at fair value through profit or loss is recognized in the statement of income when the Company’sright to receive payments is established.
Equity instruments of which the fair value cannot be measured reliably are recognized as cost. Changes in the fairvalue of monetary securities denominated in a foreign currency and classified as available-for-sale are analyzedbetween translation differences resulting from changes in amortized cost of the security and other changes in thecarrying amount of the security. The translation differences on monetary securities are recognized in profit or loss;translation differences on non-monetary securities are recognized in other comprehensive income. Changes in thefair value of monetary and non-monetary securities classified as available-for-sale are recognized in othercomprehensive income.
When securities classified as available-for-sale are sold or impaired, the accumulated fair value adjustmentspreviously recognized in equity are transferred to the statement of income. Interest on available-for-sale financialassets calculated using the effective interest method is recognized in the statement of income as part of financeincome. Dividends on available-for sale equity instruments are recognized in the statement of income as part ofother operating income when the Company’s right to receive payments is established.
C) Offsetting financial instruments
Financial assets and liabilities are offset and the net amount reported in the statement of financial position whenthere is a legally enforceable right to offset the recognized amounts and there is an intention to settle on a net basis,or realize the asset and settle the liability simultaneously.
D) Impairment of financial assets
(1) Assets carried at amortized cost
The Company assesses at the end of each reporting period whether there is objective evidence that a financial assetor group of financial assets is impaired. A financial asset or a group of financial assets is impaired and impairmentloss is incurred only if there is objective evidence of impairment as a result of one or more events that occurredafter the initial recognition of the asset (a ‘loss event’) and that loss event (or events) has an impact on theestimated future cash flows of the financial asset or group of financial assets that can be reliably estimated.
The amount of the loss is measured as the difference between the asset’s carrying amount and the present value ofestimated future cash flows (excluding future credit losses that have not been incurred) discounted at the financialasset’s original effective interest rate. The carrying amount of the asset is reduced and the amount of the loss isrecognized in the consolidated statement of income. As a practical expedient, the Company may measureimpairment on the basis of an instrument’s fair value using an observable market price.
If, in a subsequent period, the amount of the impairment loss decreases and the decrease can be related objectivelyto an event occurring after the impairment was recognized (such as an improvement in the debtor’s credit rating),the reversal of the previously recognized impairment loss is recognized in the consolidated statement of income.
Samsung Electronics Co., Ltd. and Subsidiaries
NOTES TO THE CONSOLIDATED FINANCIAL STATEMENTS
25
(2) Assets classified as available-for-sale
The Company assesses at the end of each reporting period whether there is objective evidence that a financial assetor a group of financial assets is impaired. In the case of equity investments classified as available-for-sale, asignificant or prolonged decline in the fair value of the security below its cost is also evidence that the assets areimpaired. If any such evidence exists for available-for-sale financial assets, the cumulative loss – measured as thedifference between the acquisition cost and the current fair value, less any impairment loss on that financial assetpreviously recognized in profit or loss – is removed from equity and recognized in the consolidated statement ofincome. Impairment losses on equity instruments recognized in the consolidated statement of income are notreversed through the consolidated statement of income. If, in a subsequent period, the fair value of a debtinstrument classified as available-for-sale increases and the increase can be objectively related to an eventoccurring after the impairment loss was recognized in profit or loss, the impairment loss is reversed through theconsolidated statement of income.
E) Derecognition of financial assets
Financial assets are derecognised when the rights to receive cash flows from the investments have expired or havebeen transferred and the company has transferred substantially all risks and rewards of ownership. (if substantiallynot all risks and rewards of ownership have not been transferred, the Company should assess its control to ensurewhether the derecognition criteria have not been met due to its continuing involvement with the investments)
Since the Company retains substantially all risks and rewards associated with the receivables in factoringarrangements with recourse. Financial liabilities that arise when a transfer of such receivables does not qualify forderecognition. Such liabilities are classified as mortgage payables in the consolidated balance sheet.
2.7 Trade receivables
Trade receivables are amounts due from customers for merchandise sold or services performed in the ordinarycourse of business. If collection is expected in one year or less (or in the normal operating cycle of the Company iflonger), they are classified as current assets. If not, they are presented as noncurrent assets. Non-current tradereceivables are recognized initially at fair value and subsequently measured at amortized cost using the effectiveinterest method, less provision for impairment.
2.8 Inventories
Inventories are stated at the lower of cost and net realizable value. Cost is determined using the average costmethod, except for materials-in-transit. The cost of finished goods and work in progress comprises design costs,raw materials, direct labor, other direct costs and related production overheads (based on normal operatingcapacity). It excludes costs of idle plant, and abnormal waste. Net realizable value is the estimated selling price inthe ordinary course of business, less applicable variable selling expenses.
Inventories are reduced for the estimated losses arising from excess, obsolescence, and the decline in value. Thisreduction is determined by estimating market value based on future customer demand. The losses on inventoryobsolescence are recorded as a part of cost of sales.
Samsung Electronics Co., Ltd. and Subsidiaries
NOTES TO THE CONSOLIDATED FINANCIAL STATEMENTS
26
2.9 Disposal groups classified as held for sale
When the carrying amount of certain assets and liabilities are expected to be recovered through sale and the sale ofa disposable group is highly probable, such assets and liabilities are classified as held for sale and measured at thelower of its carrying amount and fair value.
2.10 Property, plant and equipment
Property, plant and equipment are stated at cost less accumulated depreciation and accumulated impairment losses.Historical cost includes expenditure that is directly attributable to the acquisition of the items. Subsequent costsare included in the asset’s carrying amount or recognized as a separate asset, as appropriate, only when it isprobable that future economic benefits associated with the item will flow to the Company and the cost of the itemcan be measured reliably.
Capitalized interest is added to the cost of the underlying assets. The acquisition cost of property, plant andequipment acquired under a finance lease is determined at the lower of the present value of the minimum leasepayments and the fair market value of the leased asset at the inception of the lease. Property, plant and equipmentacquired under a finance lease, leasehold improvements are depreciated over the shorter of the lease term or usefullife.
Land is not depreciated. Depreciation on other assets is calculated using the straight-line method to allocate theircost to their residual values over their estimated useful lives, as follows:
Estimated useful livesBuildings and auxiliary facilities 15, 30 yearsStructures 15 yearsMachinery and equipment 5 yearsTools and fixtures 5 yearsVehicles 5 years
The assets’ residual values and useful lives are reviewed, and adjusted if appropriate, at the end of each reportingperiod. An asset’s carrying amount is written down immediately to its recoverable amount if the asset’s carryingamount is greater than its estimated recoverable amount. Gains and losses on disposals are determined bycomparing the proceeds with the carrying amount and are recognized within the statement of income.
2.11 Intangible assets
A) Goodwill
Goodwill represents the excess of the cost of an acquisition over the fair value of the group’s share of the netidentifiable assets of the acquired subsidiary at the date of acquisition. Goodwill on acquisitions of subsidiaries isincluded in intangible assets. Gains and losses on the disposal of an entity include the carrying amount of goodwillrelating to the entity sold.

Samsung Electronics Co., Ltd. and Subsidiaries
NOTES TO THE CONSOLIDATED FINANCIAL STATEMENTS
27
Goodwill is not amortized as the carrying amount of accumulated goodwill amortization presented shall beadjusted against the original cost of goodwill. Goodwill is tested annually for impairment and carried at cost lessaccumulated impairment losses. Goodwill is tested for impairment annually or more frequently if there is anyindication that it may be impaired. Goodwill is tested for impairment by comparing the carrying amount of thecash-generating unit with the recoverable amount, which is the higher of its fair value less costs to sell and itsvalue in use. An impairment loss is immediately recognized and is not subsequently reversed.
B) Capitalized development costs
The Company capitalizes certain development costs when outcome of development plan is for practicalenhancement, probability of technical and commercial achievement for the development plans are high, and thenecessary cost is reliably estimable. Capitalized costs, comprising direct labor and related overhead, are amortizedby straight-line method over their useful lives. In presentation, accumulated amortization amount and accumulatedimpairment amount are deducted from capitalized costs associated with development activities.
C) Other intangible assets
Certain membership dues is regarded as having an indefinite useful life because there is no foreseeable limit to theperiod over which the asset is expected to generate net cash inflows for the entity; such assets are not amortized.
Trademarks and licenses, which are separately acquired, are presented at historical cost. Trademarks and licenseswhich are acquired in business combinations are recorded at the fair value at the acquisition date. They havedefinite useful lives and are measured at cost less any accumulated amortization and amortized on a straight-linebasis over their 5 or 10 year estimated useful lives.
The contractual customer relationships were acquired in a business combination, and are recognized at fair valueat the acquisition date. The contractual relationships have a definite useful life and are recorded at cost less anyaccumulated amortization and amortized on a straight-line basis over the estimated period of the customerrelationship.
Software is capitalized and amortized using the straight-line method over their useful lives, generally 5 to 10years. Where an indication of impairment exists, the carrying amount of any intangible asset is assessed andwritten down its recoverable amount.
2.12 Impairment of non-financial assets
Assets that have an indefinite useful life, for example goodwill, are not subject to amortization and are testedannually for impairment. Assets that are subject to amortization are reviewed for impairment whenever events orchanges in circumstances indicate that the carrying amount may not be recoverable. An impairment loss isrecognized for the amount by which the asset’s carrying amount exceeds its recoverable amount. The recoverableamount is the higher of an asset’s fair value less costs to sell and value in use. For the purposes of assessingimpairment, assets are grouped at the lowest levels for which there are separately identifiable cash flows (cash-generating units). Non-financial assets other than goodwill that suffered impairment are reviewed for possiblereversal of the impairment at each reporting date.
Samsung Electronics Co., Ltd. and Subsidiaries
NOTES TO THE CONSOLIDATED FINANCIAL STATEMENTS
28
2.13 Financial liabilities
A) Financial liabilities at fair value through profit or loss
Financial liabilities are acquired or incurred principally for the purpose of selling or repurchasing in the near term.Financial liabilities at fair value through profit or loss of the Company consist of financial instruments whichcontain non-derivative financial assets or embedded derivatives.
B) Financial liabilities measured at amortized cost
Unless financial liabilities arise when transfer of financial assets or financial liabilities at fair value through profitor loss do not qualify for derecognition, all non-derivative financial liabilities are classified as financial liabilitiesmeasured at amortized cost. If a transfer does not result in derecognition, the Company continues to recognize thetransferred asset and recognize a financial liabilities for the consideration received. Financial liabilities measuredat amortized cost, due within twelve months after the balance sheet date, are classified as current liabilities.Otherwise, they are classified as long-term liabilities.
2.14 Borrowings
Borrowings are recognized initially at fair value, net of transaction costs. Borrowings are subsequently measuredat amortized cost; any difference between cost and the redemption value is recognized in the statement of incomeover the period of the borrowings using the effective interest method. If the Company has an indefinite right todefer payment for a period longer than 12 months after the end of the reporting date, such liabilities are recordedas non-current liabilities. Otherwise, they are recorded as current liabilities.
2.15 Employee benefits
The Company has either defined benefit or defined contribution plans at respective company level. A definedcontribution plan is a pension plan under which the Company pays fixed contributions into a separate entity. TheCompany has no legal or constructive obligations to pay further contributions if the fund does not hold sufficientassets to pay all employees the benefits relating to employee service in the current and prior periods. A definedbenefit plan is a pension plan that is not a defined contribution plan. Typically defined benefit plans define anamount of pension benefit that an employee will receive on retirement, usually dependent on one or more factorssuch as age, years of service and compensation.
The liabilities recognized in the statement financial position in respect of defined benefit pension plans is thepresent value of the defined benefit obligation at the end of the reporting period less the fair value of plan assets,together with adjustments for unrecognized past-service costs. The defined benefit obligation is calculatedannually by independent actuaries using the projected unit credit method. The present value of the defined benefitobligation is determined by discounting the estimated future cash outflows using interest rates of high-qualitycorporate bonds that are denominated in the currency in which the benefits will be paid, and that have terms tomaturity approximating to the terms of the related pension liability.
Actuarial gains and losses are recognized using the corridor approach. The company recognizes actuarial gainsand losses in excess of a de minimis over the remaining working lives of employees. The de minimis amount,which is also referred to as the ‘corridor limit’, is the greater of ten per cent of the present value of the definedbenefit obligation at the end of the previous reporting period (before deducting plan assets) and ten per cent of thefair value of any plan assets at that date.
Samsung Electronics Co., Ltd. and Subsidiaries
NOTES TO THE CONSOLIDATED FINANCIAL STATEMENTS
29
For defined contribution plans, the Company pays contributions on a mandatory, contractual or voluntary basis.The Company has no further payment obligations once the contributions have been paid. The contributions arerecognized as employee benefit expense when they are due. Prepaid contributions are recognized as an asset to theextent that a cash refund or a reduction in the future payments is available.
2.16 Financial guarantee contract
Financial guarantee contracts are contracts that require the issuer to make specified payments to reimburse theholder for a loss it incurs because a specified debtor fails to make payments when due, Financial guarantees areinitially recognized in the financial statements at fair value on the date the guarantee was given. If the amountmeasured in subsequent periods exceeds the unamortized balance of the amount initially recognized, the excessshould be classified as other financial liability.
2.17 Provisions
Where there are a number of similar obligations, the likelihood that an outflow will be required in settlement isdetermined by considering the class of obligations as a whole. A provision is recognized even if the likelihood ofan outflow with respect to any one item included in the same class of obligations may be small.
Provisions are measured at the present value of the expenditures expected to be required to settle the obligationusing a pre-tax rate that reflects current market assessments of the time value of money and the risks specific tothe obligation. The increase in the provision due to passage of time is recognized as interest expense.
When there is a probability that an outflow of economic benefits will occur due to a present obligation resultingfrom a past event, and whose amount is reasonably estimable, a corresponding amount of provision is recognizedin the financial statements. However, when such outflow is dependent upon a future event, is not certain to occur,or cannot be reliably estimated, a disclosure regarding the contingent liability is made in the notes to the financialstatements.
2.18 Leases
The Company leases certain property, plant and equipment. Lease of property, plant and equipment where theCompany has substantially all the risks and rewards of ownership are classified as finance leases. Finance leasesare capitalized at the lease’s commencement at the lower of the fair value of the leased property and the presentvalue of the minimum lease payments. Each lease payment is allocated between the liability and finance chargesso as to achieve a constant rate on the outstanding balance. The corresponding rental obligations, net of financecharges, are included in other long-term payables. The interest element of the finance cost is charged to thestatement of income over the lease period so as to produce a constant periodic rate of interest on the remainingbalance of the liability for each period. The property, plant and equipment acquired under finance leases isdepreciated over the shorter of the useful life of the asset and the lease term.
Leases in which a significant portion of the risks and rewards of ownership are retained by the lessor are classifiedas operating leases. Payments made under operating leases (net of any incentives received from the lessor) arecharged to the statement of income on a straight-line basis over the period of the lease.

Samsung Electronics Co., Ltd. and Subsidiaries
NOTES TO THE CONSOLIDATED FINANCIAL STATEMENTS
30
2.19 Derivative instruments
All derivative instruments are accounted for at fair value with the resulting valuation gain or loss recorded as anasset or liability. If the derivative instrument is not designated as a hedging instrument, the gain or loss isrecognized in the statement of income in the period of change.
Fair value hedge accounting is applied to a derivative instrument with the purpose of hedging the exposure tochanges in the fair value of an asset or a liability or a firm commitment (hedged item) that is attributable to aparticular risk. Hedge accounting is applied when the derivative instrument is designated as a hedging instrumentand the hedge accounting criteria have been met. The gain or loss, both on the hedging derivative instrument andon the hedged item attributable to the hedged risk, is reflected in the statement of income.
2.20 Dividend distribution
Dividend distribution to SEC’s shareholders is recognized as a liability in the Company’s financial statements inthe period in which the dividends are declared and approved.
2.21 Share-based compensation
The Company uses the fair-value method in determining compensation costs of stock options granted to itsemployees and directors. The compensation cost is estimated using the Black-Scholes option-pricing model and isaccrued and charged to expense over the vesting period, with a corresponding increase in a separate component ofequity.
2.22 Revenue recognition
Revenue comprises the fair value of the consideration received or receivable for the sale of goods and services inthe ordinary course of the Company’s activities. Revenue is shown net of value-added tax, returns, rebates anddiscounts and after eliminating sales within the Company.
The Company recognizes revenue when specific recognition criteria have been met for each of the Company’sactivities as described below. The Company bases its estimates on historical results, taking into consideration thetype of customer, the type of transaction and the specifics of each arrangement.
Where multiple-element arrangements exist, the fair values of each element are determined based on the currentmarket price of each of the elements when sold separately. When the fair values of each element areindeterminable, the fair values of deliverables which have already been provided are calculated in such way thatthe fair values of elements, which are yet to be provided, are subtracted from total contract value of thearrangement.
A) Sales of goods
Sales of products and merchandise are recognized upon delivery when the significant risks and rewards ofownership of goods have transferred to the buyer, continuing managerial involvement usually associated withownership and effective control have ceased, the amount of revenue can be measured reliably, it is probable thatthe economic benefits associated with the transaction will flow to the Company and the costs incurred or to beincurred in respect of the transaction can be measured reliably. The Company records reductions to revenue forspecial pricing arrangements, price protection and other volume based discounts. If product sales are subject tocustomer acceptance, revenue is not recognized until customer acceptance occurs.
B) Sales of services
Samsung Electronics Co., Ltd. and Subsidiaries
NOTES TO THE CONSOLIDATED FINANCIAL STATEMENTS
31
Revenues from rendering services are generally recognized using the percentage-of-completion method, based onthe percentage of costs to date compared to the total estimated costs, contractual milestones or performance.
C) Other sources of revenue
Interest income is recognized using the effective interest method. When a loan and receivable is impaired, theCompany reduces the carrying amount to its recoverable amount, being the estimated future cash flow discountedat the original effective interest rate of the instrument, and continues unwinding the discount as interest income.Royalty income is recognized on an accruals basis in accordance with the substance of the relevant agreements.Dividend income is recognized when the right to receive payment is established.
2.23 Government grants
Grants from the government are recognized at their fair value where there is a reasonable assurance that the grantwill be received and the Company will comply with the conditions attached. Government grants relating to incomeare deferred and recognized in the statement of income over the period necessary to match them with the incomethat they are intended to compensate. Government grants relating to property, plant and equipment are included innon-current liabilities as deferred government grants and are credited to the statement of income on a straight-linebasis over the expected lives of the related assets.
2.24 Income tax expense and deferred taxes
The tax expense for the period comprises current and deferred tax. Tax is recognized in the statement of income,except to the extent that it relates to items recognized in other comprehensive income or directly in equity. In thiscase the tax is also recognized in other comprehensive income or directly in equity, respectively.
The current income tax charge is calculated on the basis of the tax laws enacted or substantively enacted at thebalance sheet date in the countries where the company’s subsidiaries and associates operate and generate taxableincome.
Deferred income tax is recognized, using the liability method, on temporary differences arising between the taxbases of assets and liabilities and their carrying amounts in the consolidated financial statements. However, thedeferred income tax is not accounted for if it arises from initial recognition of an asset or liability in a transactionother than a business combination that at the time of the transaction affects neither accounting nor taxable profit orloss. Deferred income tax is determined using tax rates (and laws) that have been enacted or substantively enactedby the balance sheet date and are expected to apply when the related deferred income tax asset is realized or thedeferred income tax liability is settled.
Deferred income tax assets are recognized only to the extent that it is probable that future taxable profit will beavailable against which the temporary differences can be utilized.
Deferred income tax assets and liabilities are offset when there is a legally enforceable right to offset current taxassets against current tax liabilities and when the deferred income taxes assets and liabilities relate to income taxeslevied by the same taxation authority on either the taxable entity or different taxable entities where there is anintention to settle the balances on a net basis.
Samsung Electronics Co., Ltd. and Subsidiaries
NOTES TO THE CONSOLIDATED FINANCIAL STATEMENTS
32
2.25 Earnings per share
Basic earnings per share is calculated by dividing net profit for the period available to common shareholders bythe weighted-average number of common shares outstanding during the year. Diluted earnings per share iscalculated using the weighted-average number of common shares outstanding adjusted to include the potentiallydilutive effect of common equivalent shares outstanding.
2.26 Segment reporting
Operating segments are reported in a manner consistent with the internal reporting provided to the chief operatingdecision-maker. The chief operating decision-maker is responsible for making strategic decisions on resourceallocation and performance assessment of the operating segments.
2.27 Convenience translation into United States Dollar Amounts
The Company operates primarily in Korean Won and its official accounting records are maintained in KoreanWon. The U.S. dollar amounts provided in the financial statements represent supplementary information solely for
the convenience of the reader. All Won amounts are expressed in U.S. dollars at the rate of 1,153.30 to US $1,the exchange rate in effect on December 31, 2011. Such presentation is not in accordance with generally acceptedaccounting principles, and should not be construed as a representation that the Won amounts shown could bereadily converted, realized or settled in U.S. dollars at this or at any other rate.
2.28 These consolidated financial statements were approved by the Board of Directors on January 27, 2012.
3. Critical estimates and judgments
The preparation of consolidated financial statements requires management to exercise significant judgment andassumptions based on historical experience and other factors, including expectations of future events that arebelieved to be reasonable under the circumstances.
The Company makes estimates and assumptions concerning the future. The resulting accounting estimates will, bydefinition, seldom equal the related actual results. The estimates and assumptions that have a significant risk ofcausing a material adjustment to the carrying amounts of assets and liabilities within the next financial year areaddressed below.
A) Revenue recognition
The Company uses the percentage-of-completion method in accounting for its fixed-price contracts to deliverinstallation services. Use of the percentage-of-completion method requires the company to estimate the servicesperformed to date as a proportion of the total services to be performed. Revenues and earnings are subject tosignificant change, effected by early steps in a long-term projects, change in scope of a project, cost, period, andplans of the customers.
Samsung Electronics Co., Ltd. and Subsidiaries
NOTES TO THE CONSOLIDATED FINANCIAL STATEMENTS
33
B) Provision for warranty
The Company recognizes provision for warranty at the point of recording related revenue. The company accruesprovision for warranty based on the best estimate of amounts necessary to settle future and existing claims onproducts sold as of each balance sheet date. Continuous release of products, that are more technologicallycomplex and changes in local regulations and customs could result in additional allowances being required infuture periods.
C) Fair value of derivatives and other financial instruments
The fair value of financial instruments that are not traded in an active market is determined by using valuationtechniques. The Company uses its judgement to select a variety of methods and make assumptions that are mainlybased on market conditions existing at the end of each reporting period.
D) Pension benefits
The present value of the pension obligations depends on a number of factors that are determined on an actuarialbasis using a number of assumptions. The assumptions used in determining the net cost (income) for pensionsinclude the discount rate. Any changes in these assumptions will impact the carrying amount of pensionobligations. The Company determines the appropriate discount rate at the end of each year. This is the interest ratethat should be used to determine the present value of estimated future cash outflows expected to be required tosettle the pension obligations. In determining the appropriate discount rate, the Company considers the interestrates of high-quality corporate bonds that are denominated in the currency in which the benefits will be paid andthat have terms to maturity approximating the terms of the related pension obligation.
E) Estimated impairment of goodwill
The Company tests at the end of each reporting period whether goodwill has suffered any impairment inaccordance with the accounting policy described in Note 2.11. The recoverable amounts of cash generating unitshave been determined based on value-in-use calculations. These calculations require the use of estimates.
F) Legal contingencies
Legal proceedings covering a wide range of matters are pending or threatened in various jurisdictions against theCompany. Provisions are recorded for pending litigation when it is determined that an unfavorable outcome isprobable and the amount of loss can be reasonably estimated. Due to the inherent uncertain nature of litigation, theultimate outcome or actual cost of settlement may materially vary from estimates.

Samsung Electronics Co., Ltd. and Subsidiaries
NOTES TO THE CONSOLIDATED FINANCIAL STATEMENTS
34
4. Cash and Cash Equivalents
Cash and cash equivalents include cash on hand, deposits held at call with banks, and other short-term highlyliquid investments (MMDA and etc.) with original maturities of less than three months.
Cash and cash equivalents as of December 31, 2011 and 2010, consist of the following:
(In millions of Korean Won) 2011 2010
Cash on hand 16,042 5,897Bank deposits, etc. 14,675,719 9,785,522Total 14,691,761 9,791,419
5. Financial assets subject to withdrawal restrictions
Financial instruments subject to withdrawal restrictions as of December 31, 2011 and 2010, consist of the following:
(In millions of Korean Won) 2011 2010
Short-term financial instruments 39,770 46,371Other non-current assets- long-term financial instruments 16 26
6. Financial instruments by category
A) Financial instruments by category as of December 31, 2011 and 2010, consist of the following:
(1) Assets
2011(In millions ofKorean Won)
Assets at fairvalue throughthe profit and
lossLoans
and receivables
Available-for-sale financial
assets Total
Cash and cashequivalents - 14,691,761 - 14,691,761Short -termfinancialinstruments - 11,529,905 - 11,529,905Long and short-term available-for-sale financialassets - - 3,879,567 3,879,567Trade and otherreceivables - 24,153,028 - 24,153,028Deposits - 791,863 - 791,863Other financialassets 130,057 1,289,447 - 1,419,504Total 130,057 52,456,004 3,879,567 56,465,628
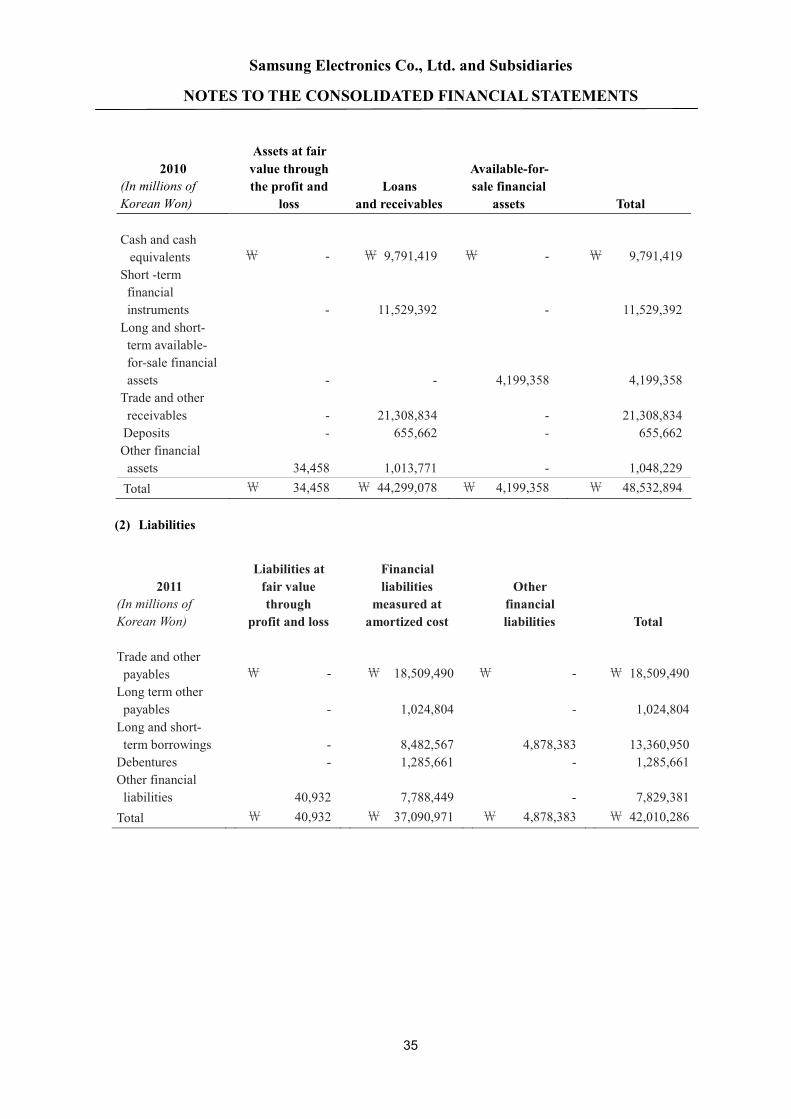
Samsung Electronics Co., Ltd. and Subsidiaries
NOTES TO THE CONSOLIDATED FINANCIAL STATEMENTS
35
(2) Liabilities
2010(In millions ofKorean Won)
Assets at fairvalue throughthe profit and
lossLoans
and receivables
Available-for-sale financial
assets Total
Cash and cashequivalents - 9,791,419 - 9,791,419Short -termfinancialinstruments - 11,529,392 - 11,529,392Long and short-term available-for-sale financialassets - - 4,199,358 4,199,358Trade and otherreceivables - 21,308,834 - 21,308,834Deposits - 655,662 - 655,662Other financialassets 34,458 1,013,771 - 1,048,229Total 34,458 44,299,078 4,199,358 48,532,894
2011(In millions ofKorean Won)
Liabilities atfair valuethrough
profit and loss
Financialliabilitiesmeasured atamortized cost
Otherfinancialliabilities Total
Trade and otherpayables - 18,509,490 - 18,509,490Long term otherpayables - 1,024,804 - 1,024,804Long and short-term borrowings - 8,482,567 4,878,383 13,360,950Debentures - 1,285,661 - 1,285,661Other financialliabilities 40,932 7,788,449 - 7,829,381Total 40,932 37,090,971 4,878,383 42,010,286
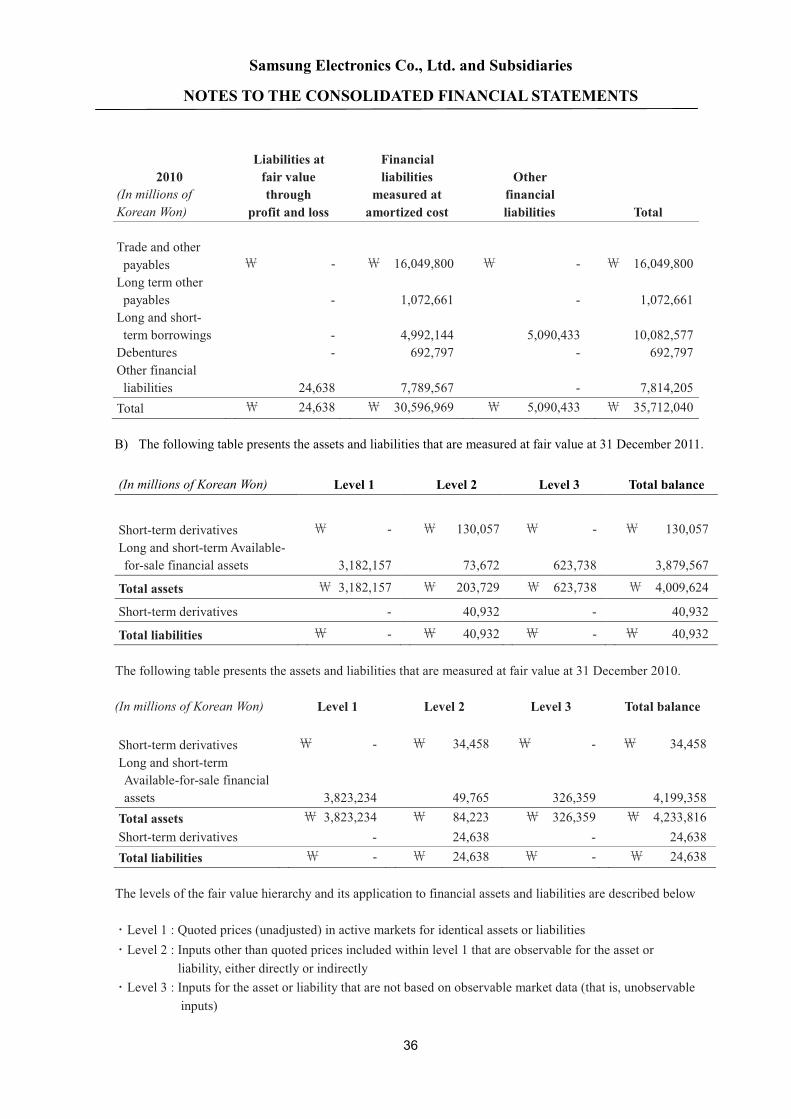
Samsung Electronics Co., Ltd. and Subsidiaries
NOTES TO THE CONSOLIDATED FINANCIAL STATEMENTS
36
B) The following table presents the assets and liabilities that are measured at fair value at 31 December 2011.
(In millions of Korean Won) Level 1 Level 2 Level 3 Total balance
Short-term derivatives - 130,057 - 130,057Long and short-termAvailable-for-sale financial assets 3,182,157 73,672 623,738 3,879,567
Total assets 3,182,157 203,729 623,738 4,009,624
Short-term derivatives - 40,932 - 40,932
Total liabilities - 40,932 - 40,932
The following table presents the assets and liabilities that are measured at fair value at 31 December 2010.
(In millions of Korean Won) Level 1 Level 2 Level 3 Total balance
Short-term derivatives - 34,458 - 34,458Long and short-termAvailable-for-sale financialassets 3,823,234 49,765 326,359 4,199,358Total assets 3,823,234 84,223 326,359 4,233,816Short-term derivatives - 24,638 - 24,638Total liabilities - 24,638 - 24,638
The levels of the fair value hierarchy and its application to financial assets and liabilities are described below
Level 1 : Quoted prices (unadjusted) in active markets for identical assets or liabilitiesLevel 2 : Inputs other than quoted prices included within level 1 that are observable for the asset or
liability, either directly or indirectlyLevel 3 : Inputs for the asset or liability that are not based on observable market data (that is, unobservable
inputs)
2010(In millions ofKorean Won)
Liabilities atfair valuethrough
profit and loss
Financialliabilitiesmeasured atamortized cost
Otherfinancialliabilities Total
Trade and otherpayables - 16,049,800 - 16,049,800Long term otherpayables - 1,072,661 - 1,072,661Long and short-term borrowings - 4,992,144 5,090,433 10,082,577Debentures - 692,797 - 692,797Other financialliabilities 24,638 7,789,567 - 7,814,205Total 24,638 30,596,969 5,090,433 35,712,040

Samsung Electronics Co., Ltd. and Subsidiaries
NOTES TO THE CONSOLIDATED FINANCIAL STATEMENTS
37
The fair value of financial instruments traded in active markets is based on quoted market prices at the balancesheet date. A market is regarded as active if quoted prices are readily and regularly available from an exchange,dealer, broker, industry group, pricing service, or regulatory agency, and those prices represent actual and regularlyoccurring market transactions on an arm’s length basis. The quoted market price used for financial assets held bythe group is the current bid price. These instruments are included in level 1. Instruments included in level 1comprise primarily listed equity investments classified as trading securities or available-for-sale.
The fair value of financial instruments that are not traded in an active market (for example, over-the-counterderivatives) is determined by using valuation techniques. These valuation techniques maximize the use ofobservable market data where it is available and rely as little as possible on entity specific estimates. If allsignificant inputs required to fair value an instrument are observable, the instrument is included in level 2.
If one or more of the significant inputs is not based on observable market data, the instrument is included in level3.
Specific valuation techniques used to value financial instruments include:
Quoted market prices or dealer quotes for similar instruments.The fair value of forward foreign exchange contracts is determined using forward exchange rates at the balance
sheet date, with the resulting value discounted back to present value.Other techniques, such as discounted cash flow analysis, are used to determine fair value for the remaining
financial instruments. As for trade and other receivables, the book value approximates a reasonable estimate of fairvalue.
C) The changes of the financial instruments on level 3, December31, 2011 and 2010, are as follows:
(In millions of Korean Won) 2011 2010Balance at January 1 326,359 228,973Purchase 397,865 136,216Disposal (97,390) (23,714)Comprehensive income /expense 69,004 86,683Others1 (72,100) (101,799)Balance at December 31 623,738 326,359
1 Others consist of the effects from changes in currency exchange rate, acquisitions from business combinationand etc.
D) Income and loss of financial instruments by category for the years ended December 31, 2011 and 2010, are asfollows:

Samsung Electronics Co., Ltd. and Subsidiaries
NOTES TO THE CONSOLIDATED FINANCIAL STATEMENTS
38
(In millions of Korean Won)2011
Financial Assets
Assets at fair valuethrough the profit
and lossLoans
and receivablesAvailable-for-salefinancial assets Total
Loss on valuation(Other comprehensiveloss)
- - (559,831) (559,831)
Loss onvaluation/disposal 113,401 - 102,351 215,752
Gain on disposal(Reclassification) - - 134,202 134,202
Interest income - 702,198 3,455 705,653Gain on foreigncurrency translation - 27,768 - 27,768
Loss on foreigncurrency transaction - (483,980) (2,924) (486,904)
Dividend income - - 34,423 34,423
Impairment/Reversal - - (39) (39)
(In millions of Korean Won)2011
Financial Liabilities
Liabilities at fairvalue through theprofit and loss
Financial liabilitiesmeasured atamortized cost
Other FinancialLiabilities Total
Loss onvaluation/disposal(Profit or loss) (1,865) - - (1,865)
Interest expense - 555,581 85,073 640,654Gain(Loss) on foreigncurrency translation - (69,049) 26,559 (42,490)
Loss on foreigncurrency transaction - (163,191) - (163,191)
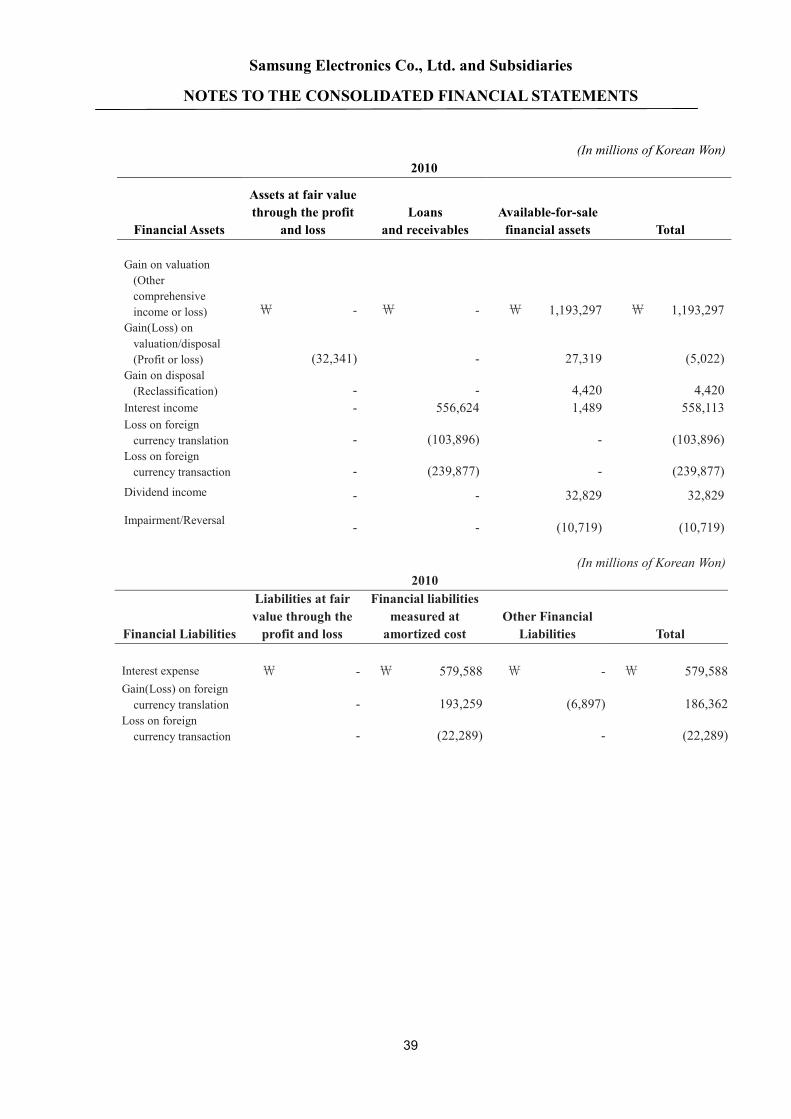
Samsung Electronics Co., Ltd. and Subsidiaries
NOTES TO THE CONSOLIDATED FINANCIAL STATEMENTS
39
(In millions of Korean Won)2010
Financial Assets
Assets at fair valuethrough the profit
and lossLoans
and receivablesAvailable-for-salefinancial assets Total
Gain on valuation(Othercomprehensiveincome or loss) - - 1,193,297 1,193,297Gain(Loss) onvaluation/disposal(Profit or loss) (32,341) - 27,319 (5,022)Gain on disposal(Reclassification) - - 4,420 4,420Interest income - 556,624 1,489 558,113Loss on foreigncurrency translation - (103,896) - (103,896)Loss on foreigncurrency transaction - (239,877) - (239,877)Dividend income - - 32,829 32,829
Impairment/Reversal - - (10,719) (10,719)
(In millions of Korean Won)2010
Financial Liabilities
Liabilities at fairvalue through theprofit and loss
Financial liabilitiesmeasured atamortized cost
Other FinancialLiabilities Total
Interest expense - 579,588 - 579,588Gain(Loss) on foreigncurrency translation - 193,259 (6,897) 186,362
Loss on foreigncurrency transaction - (22,289) - (22,289)
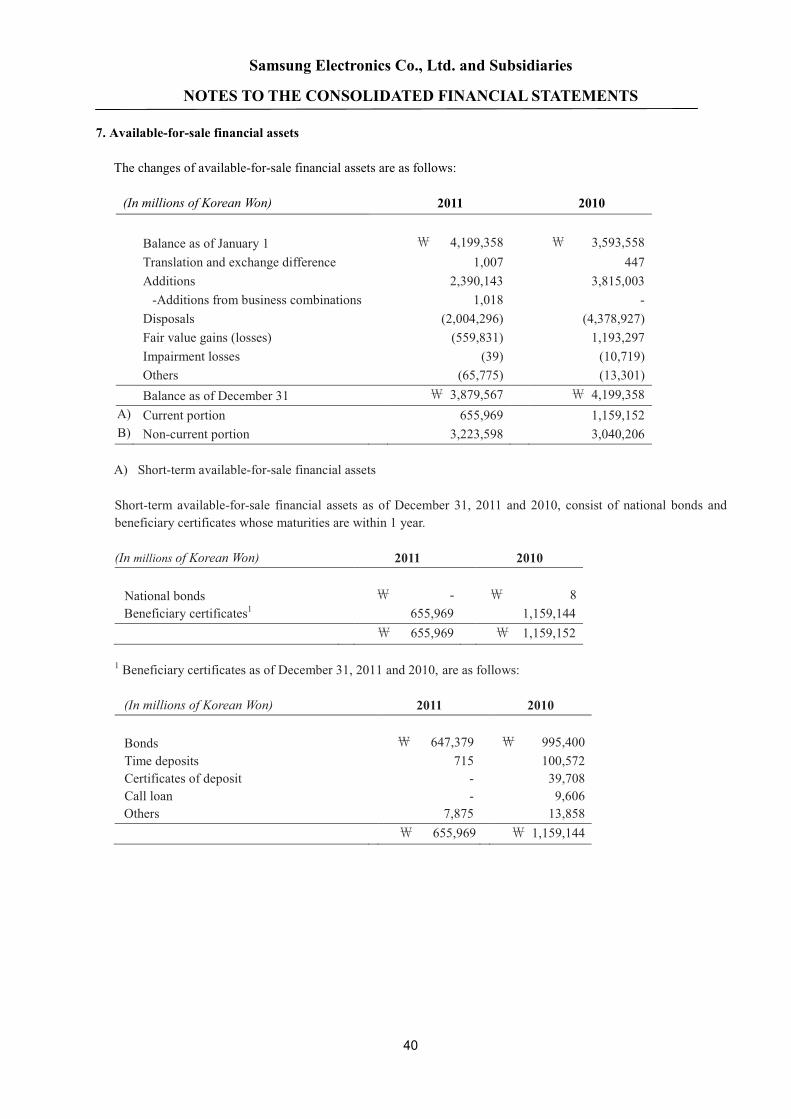
Samsung Electronics Co., Ltd. and Subsidiaries
NOTES TO THE CONSOLIDATED FINANCIAL STATEMENTS
40
7. Available-for-sale financial assets
The changes of available-for-sale financial assets are as follows:
(In millions of Korean Won) 2011 2010
Balance as of January 1 4,199,358 3,593,558Translation and exchange difference 1,007 447Additions 2,390,143 3,815,003-Additions from business combinations 1,018 -Disposals (2,004,296) (4,378,927)Fair value gains (losses) (559,831) 1,193,297Impairment losses (39) (10,719)Others (65,775) (13,301)Balance as of December 31 3,879,567 4,199,358
A) Current portion 655,969 1,159,152B) Non-current portion 3,223,598 3,040,206
A) Short-term available-for-sale financial assets
Short-term available-for-sale financial assets as of December 31, 2011 and 2010, consist of national bonds andbeneficiary certificates whose maturities are within 1 year.
(In millions of Korean Won) 2011 2010
National bonds - 8Beneficiary certificates1 655,969 1,159,144
655,969 1,159,152
1 Beneficiary certificates as of December 31, 2011 and 2010, are as follows:
(In millions of Korean Won) 2011 2010
Bonds 647,379 995,400Time deposits 715 100,572Certificates of deposit - 39,708Call loan - 9,606Others 7,875 13,858
655,969 1,159,144

Samsung Electronics Co., Ltd. and Subsidiaries
NOTES TO THE CONSOLIDATED FINANCIAL STATEMENTS
41
For the years ended December 31, 2011 and 2010, changes in valuation gain (loss) on short-term available-for-sale financial assets are as follows:
(In millions of Korean Won) 2011 2010
Balance at January 1 9,144 4,420Fair value gains 5,969 9,144Net gains transfer from equity (9,144) (4,420)Balance at December 31 5,969 9,144Deferred income tax and minority interest (1,444) (2,213)
4,525 6,931
B) Long-term available-for-sale financial assets
Long-term available-for-sale financial assets as of December 31, 2011 and 2010 are as follows:
Detail 2011 2010Equity securities-Listed (1) 2,526,187 2,664,082Equity securities-Unlisted (2) 623,739 326,359Debt securities 73,672 49,765
3,223,598 3,040,206
(1) Equity securities-Listed
Listed equity securities as of December 31, 2011 and 2010, are as follows:
(In millions of Korean Won, except for the number of shares and percentage)2011 2010
Number ofShares Owned
Percentageof
Ownership(%)AcquisitionCost
Recorded BookValue
RecordedBook Value
Samsung HeavyIndustries 40,675,641 17.6 258,299 1,134,850 1,675,836Samsung FineChemicals 2,164,970 8.4 45,678 132,063 179,476Samsung Life Insurance - - - - 134,878Hotel Shilla 2,004,717 5.0 13,957 77,182 55,631Cheil Worldwide 2,998,725 2.6 2,920 56,826 41,532iMarket Korea 647,320 1.8 324 10,487 103,360A-Tech Solution 1,592,000 15.9 26,348 17,830 33,432SFA 1,822,000 10.2 38,262 111,142 89,278SNU Precision 1,075,446 5.3 14,204 11,400 18,874KT Skylife1 240,000 0.5 3,000 6,576 -Rambus 4,788,125 4.4 92,682 41,692 223,363Seagate Technology 45,239,490 9.7 788,454 855,665 -Others - - 17,464 70,474 108,422
1,301,592 2,526,187 2,664,082
1 KT Skylife was listed at the Korea Exchange stock market of republic of Korea during the current year.
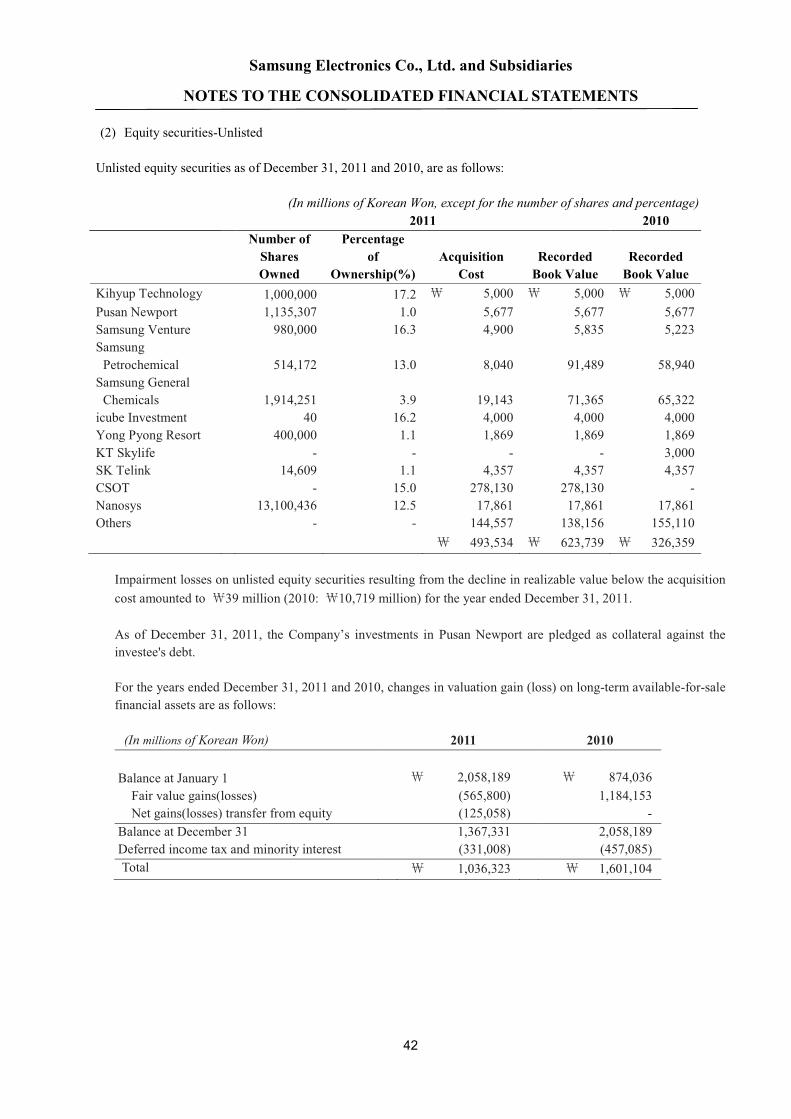
Samsung Electronics Co., Ltd. and Subsidiaries
NOTES TO THE CONSOLIDATED FINANCIAL STATEMENTS
42
(2) Equity securities-Unlisted
Unlisted equity securities as of December 31, 2011 and 2010, are as follows:
(In millions of Korean Won, except for the number of shares and percentage)2011 2010
Number ofSharesOwned
Percentageof
Ownership(%)AcquisitionCost
RecordedBook Value
RecordedBook Value
Kihyup Technology 1,000,000 17.2 5,000 5,000 5,000Pusan Newport 1,135,307 1.0 5,677 5,677 5,677Samsung Venture 980,000 16.3 4,900 5,835 5,223SamsungPetrochemical 514,172 13.0 8,040 91,489 58,940Samsung GeneralChemicals 1,914,251 3.9 19,143 71,365 65,322icube Investment 40 16.2 4,000 4,000 4,000Yong Pyong Resort 400,000 1.1 1,869 1,869 1,869KT Skylife - - - - 3,000SK Telink 14,609 1.1 4,357 4,357 4,357CSOT - 15.0 278,130 278,130 -Nanosys 13,100,436 12.5 17,861 17,861 17,861Others - - 144,557 138,156 155,110
493,534 623,739 326,359
Impairment losses on unlisted equity securities resulting from the decline in realizable value below the acquisitioncost amounted to 39 million (2010: 10,719 million) for the year ended December 31, 2011.
As of December 31, 2011, the Company’s investments in Pusan Newport are pledged as collateral against theinvestee's debt.
For the years ended December 31, 2011 and 2010, changes in valuation gain (loss) on long-term available-for-salefinancial assets are as follows:
(In millions of Korean Won) 2011 2010
Balance at January 1 2,058,189 874,036Fair value gains(losses) (565,800) 1,184,153Net gains(losses) transfer from equity (125,058) -
Balance at December 31 1,367,331 2,058,189Deferred income tax and minority interest (331,008) (457,085)Total 1,036,323 1,601,104

Samsung Electronics Co., Ltd. and Subsidiaries
NOTES TO THE CONSOLIDATED FINANCIAL STATEMENTS
43
8. Trade and other receivables
Substantially all current trade and other receivables are due within 1 year from the end of the reporting period. Thecarrying amount is a reasonable approximation of fair value for current trade and other receivables, with effect ofdiscount being insignificant.
A) Trade and other receivables of December 31, 2011 and 2010, are as follows:
2011 2010(In millions of Korean Won) Trade Non-Trade Trade Non-Trade
Receivables from externalcustomers 22,026,734 2,215,002 19,277,300 2,171,115
Receivables from relatedparties 107,007 96,994 61,587 8,638
Less: Allowances forimpairment (214,597) (37,833) (185,758) (19,585)
Trade receivables, net 21,919,144 2,274,163 19,153,129 2,160,168Less: Non-current portion (37,017) (3,262) (15) (4,448)Current portion 21,882,127 2,270,901 19,153,114 2,155,720
The Company transferred receivable balances to financial institutions in exchange for cash. The outstandingbalance of transferred receivable balances amounting to 4,878,383 million and 5,090,433 million has beenaccounted for as borrowings as of December 31, 2011 and 2010 (Note 13).
B) Movements on the provision for impairment of trade receivables are as follows:
2011 2010(In millions of Korean Won) Trade Non-Trade Trade Non-Trade
Balance on January 1 (185,758) (19,585) (129,078) (26,510)Provision for receivablesimpairment (78,202) (11,478) (100,912) (10,561)
Receivables written offduring the year asuncollectible 7,345 224 10,909 10,668
Unused amounts reversed 56,539 11,561 32,062 7,776Others (14,521) (18,555) 1,261 (958)Balance on December 31 (214,597) (37,833) (185,758) (19,585)
C) An aging analysis of trade and other receivables as of December 31, 2011 and 2010, is as follows:
(In millions of Korean Won) December 31, 2011 December 31, 2010Receivables not past due 22,467,108 19,807,731Receivables past due, not impaired¹ :Less than 31 days overdue 1,351,566 1,158,929
Bad debts² :31 days to 90 days overdue 339,107 298,50390 days overdue or more 287,956 253,477

Samsung Electronics Co., Ltd. and Subsidiaries
NOTES TO THE CONSOLIDATED FINANCIAL STATEMENTS
44
24,445,737 21,518,640¹ The company does not consider receivables that are overdue for less than or equal to 31 days as impaired.² The balance of allowance for doubtful debts as of December 31, 2011 amounts to 252,430 million (2010:205,343 million).
D) The maximum exposure to credit risk at the reporting date is the carrying value of each class of receivablementioned above. As of December 31, 2011, the Company has credit insurance with Korea Trade Insuranceand overseas insurance companies against its export accounts receivables from approved foreign customers.
9. Inventories
Inventories as of December 31, 2011 and 2010, are as follows:
(In millions ofKorean Won)
2011 2010GrossAmount
ValuationAllowance Book Value
GrossAmount
ValuationAllowance Book Value
Finished goods 6,105,312 (199,432) 5,905,880 4,643,155 (131,764) 4,511,391Work in Process 3,454,823 (383,461) 3,071,362 2,903,944 (284,231) 2,619,713Raw materialsand supplies 4,673,143 (186,523) 4,486,620 4,268,697 (108,855) 4,159,842
Materials-in-transit 2,252,853 - 2,252,853 2,073,578 - 2,073,578
16,486,131 (769,416) 15,716,715 13,889,374 (524,850) 13,364,524
The cost of inventories recognized as expense and included in ‘cost of sales’ amounted to 110,802,871 million(2010: 101,151,971 million) in which inventory valuation loss of 575,332 million (2010: 527,123 million)is included.
10. Associates and Joint Ventures
A) Changes in investments in associates and joint ventures for the years ended December 31, 2011 and 2010, are asfollows:
(In millions of Korean Won) 2011 2010
Balance at January 1 8,335,290 7,334,705Acquisition of Associates and Joint Ventures 403,538 243Disposal of Associates and Joint Ventures (298,375) (216,733)Share of profit 1,399,194 2,267,091Others 1 (635,478) (1,050,016)Balance at December 31 9,204,169 8,335,290
1 Others consist of dividends and effect of change in foreign exchange rates. For the year ended December 31,2010, it also includes effect from business combinations of Samsung SDS and Samsung Networks amounted to125,152 million which represents the difference between the fair value of received shares and the book value of
disposed shares.
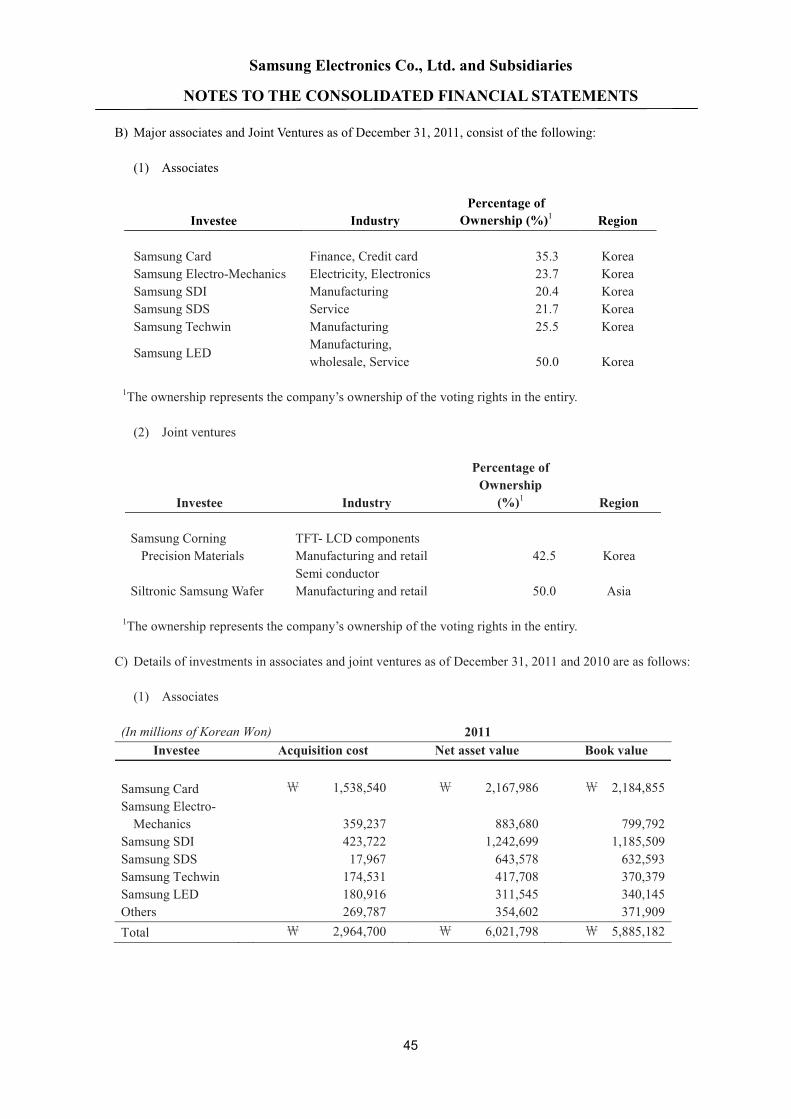
Samsung Electronics Co., Ltd. and Subsidiaries
NOTES TO THE CONSOLIDATED FINANCIAL STATEMENTS
45
B) Major associates and Joint Ventures as of December 31, 2011, consist of the following:
(1) Associates
Investee IndustryPercentage ofOwnership (%)1 Region
Samsung Card Finance, Credit card 35.3 KoreaSamsung Electro-Mechanics Electricity, Electronics 23.7 KoreaSamsung SDI Manufacturing 20.4 KoreaSamsung SDS Service 21.7 KoreaSamsung Techwin Manufacturing 25.5 Korea
Samsung LEDManufacturing,wholesale, Service 50.0 Korea
1The ownership represents the company’s ownership of the voting rights in the entiry.
(2) Joint ventures
Investee Industry
Percentage ofOwnership(%)1 Region
Samsung CorningPrecision Materials
TFT- LCD componentsManufacturing and retail 42.5 Korea
Siltronic Samsung WaferSemi conductorManufacturing and retail 50.0 Asia
1The ownership represents the company’s ownership of the voting rights in the entiry.
C) Details of investments in associates and joint ventures as of December 31, 2011 and 2010 are as follows:
(1) Associates
(In millions of Korean Won) 2011Investee Acquisition cost Net asset value Book value
Samsung Card 1,538,540 2,167,986 2,184,855Samsung Electro-Mechanics 359,237 883,680 799,792
Samsung SDI 423,722 1,242,699 1,185,509Samsung SDS 17,967 643,578 632,593Samsung Techwin 174,531 417,708 370,379Samsung LED 180,916 311,545 340,145Others 269,787 354,602 371,909Total 2,964,700 6,021,798 5,885,182

Samsung Electronics Co., Ltd. and Subsidiaries
NOTES TO THE CONSOLIDATED FINANCIAL STATEMENTS
46
(In millions of Korean Won) 2010Investee Acquisition cost Net asset value Book value
Samsung Card 1,538,540 2,132,986 2,201,154Samsung Electro-Mechanics 359,237 867,047 793,932
Samsung SDI 423,722 1,226,234 1,172,130Samsung SDS 17,967 572,135 569,678Samsung Techwin 174,531 323,503 269,360Samsung LED 180,916 275,682 306,005Others 88,974 191,838 192,243Total 2,783,887 5,589,425 5,504,502
(2) Joint ventures
(In millions of Korean Won) 2011Investee Acquisition cost Net asset value Book value
Samsung CorningPrecision Materials 297,165 3,191,077 3,089,298
Siltronic SamsungWafer 266,949 66,843 154,272
Others 152,512 79,027 75,417Total 716,626 3,336,947 3,318,987
(In millions of Korean Won) 2010Investee Acquisition cost Net asset value Book value
Samsung CorningPrecision Materials 297,165 2,431,248 2,599,010
Siltronic SamsungWafer 266,949 105,069 192,500
Others 152,512 43,026 39,278Total 716,626 2,579,343 2,830,788

Samsung Electronics Co., Ltd. and Subsidiaries
NOTES TO THE CONSOLIDATED FINANCIAL STATEMENTS
47
D) Gain/loss on valuation of equity
(1) 2011
Gain/loss onvaluation
Other comprehensivegains Others1
Balance onDecember 31
Samsung Card 2,201,154 132,331 (80,800) (67,830) 2,184,855Samsung Electro-Mechanics 793,932 78,179 (50,307) (22,012) 799,792
Samsung SDI 1,172,130 63,242 (11,274) (38,589) 1,185,509
Samsung SDS 569,678 74,382 (2,939) (8,528) 632,593
Samsung Techwin 269,360 65,684 42,245 (6,910) 370,379
Samsung LED 306,005 30,669 3,471 - 340,145Samsung CorningPrecision Materials 2,599,010 975,221 (7,588) (477,345) 3,089,298
Siltronic Samsung Wafer 192,500 (37,680) (2,220) 1,672 154,272
Others 231,521 17,166 (4,486) 203,125 447,326
Total 8,335,290 1,399,194 (113,898) (416,417) 9,204,169
1 Others include acquisitions, disposals, dividends and changes in currency exchange rates.
(2) 2010
Gain/loss onvaluation
Othercomprehensive gains Others1
Balance onDecember 31
Samsung Card 1,715,055 421,792 112,336 (48,029) 2,201,154Samsung Electro-Mechanics 589,981 125,877 90,768 (12,694) 793,932
Samsung SDI 960,245 71,035 140,536 314 1,172,130Samsung SDS 276,996 79,350 4,842 208,490 569,678Samsung Techwin 265,979 68,549 (14,526) (50,642) 269,360Samsung LED 202,814 102,933 258 - 306,005Samsung CorningPrecision Materials 2,598,434 1,386,603 16,161 (1,402,188) 2,599,010
Siltronic SamsungWafer 141,057 (36,497) 78,605 9,335 192,500
Others 584,144 40,857 (41,523) (351,957) 231,521
Total 7,334,705 2,260,499 387,457 (1,647,371) 8,335,290
1 Others include acquisitions, disposals, dividends and changes in currency exchange rates.
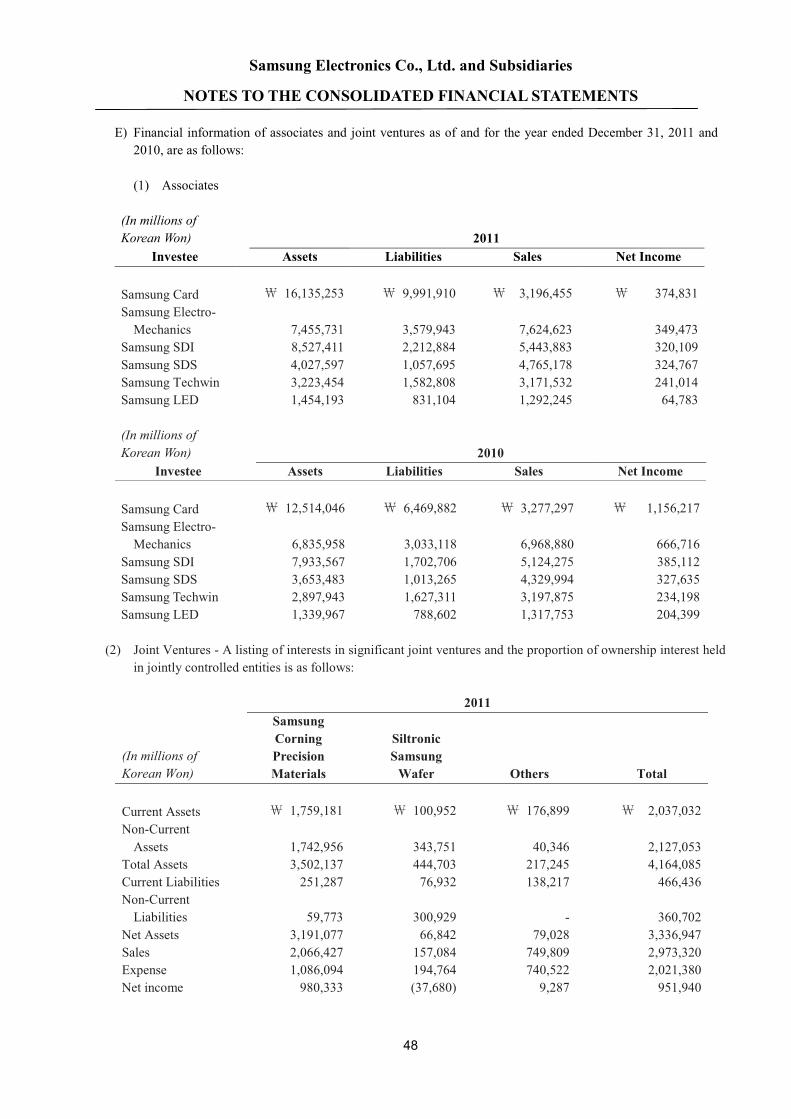
Samsung Electronics Co., Ltd. and Subsidiaries
NOTES TO THE CONSOLIDATED FINANCIAL STATEMENTS
48
E) Financial information of associates and joint ventures as of and for the year ended December 31, 2011 and2010, are as follows:
(1) Associates
(In millions ofKorean Won) 2011
Investee Assets Liabilities Sales Net Income
Samsung Card 16,135,253 9,991,910 3,196,455 374,831Samsung Electro-Mechanics 7,455,731 3,579,943 7,624,623 349,473
Samsung SDI 8,527,411 2,212,884 5,443,883 320,109Samsung SDS 4,027,597 1,057,695 4,765,178 324,767Samsung Techwin 3,223,454 1,582,808 3,171,532 241,014Samsung LED 1,454,193 831,104 1,292,245 64,783
(In millions ofKorean Won) 2010
Investee Assets Liabilities Sales Net Income
Samsung Card 12,514,046 6,469,882 3,277,297 1,156,217Samsung Electro-Mechanics 6,835,958 3,033,118 6,968,880 666,716
Samsung SDI 7,933,567 1,702,706 5,124,275 385,112Samsung SDS 3,653,483 1,013,265 4,329,994 327,635Samsung Techwin 2,897,943 1,627,311 3,197,875 234,198Samsung LED 1,339,967 788,602 1,317,753 204,399
(2) Joint Ventures - A listing of interests in significant joint ventures and the proportion of ownership interest heldin jointly controlled entities is as follows:
(In millions ofKorean Won)
2011SamsungCorningPrecisionMaterials
SiltronicSamsungWafer Others Total
Current Assets 1,759,181 100,952 176,899 2,037,032Non-CurrentAssets 1,742,956 343,751 40,346 2,127,053
Total Assets 3,502,137 444,703 217,245 4,164,085Current Liabilities 251,287 76,932 138,217 466,436Non-CurrentLiabilities 59,773 300,929 - 360,702
Net Assets 3,191,077 66,842 79,028 3,336,947Sales 2,066,427 157,084 749,809 2,973,320Expense 1,086,094 194,764 740,522 2,021,380Net income 980,333 (37,680) 9,287 951,940

Samsung Electronics Co., Ltd. and Subsidiaries
NOTES TO THE CONSOLIDATED FINANCIAL STATEMENTS
49
(In millions ofKorean Won)
2010SamsungCorningPrecisionMaterials
SiltronicSamsungWafer Others Total
Current Assets 1,498,347 76,031 199,360 1,773,738Non-CurrentAssets 1,295,109 380,371 10,887 1,686,367
Total Assets 2,793,456 456,402 210,247 3,460,105Current Liabilities 352,724 62,016 167,221 581,961Non-CurrentLiabilities 9,484 289,317 - 298,801
Net Assets 2,431,248 105,069 43,026 2,579,343Total Sales 2,486,564 149,340 931,262 3,567,166Total Expense 1,085,202 185,837 907,307 2,178,346Net income 1,401,362 (36,497) 23,955 1,388,820
F) Fair value of marketable shares held by associates as of December 31, 2011, is as follows:
(In millions of Korean Won) Number of shares held Market valueSamsung SDI 9,282,753 1,239,248Samsung Electro-Mechanics 17,693,084 1,374,753Samsung Card 43,393,170 1,687,994Samsung Techwin 13,526,935 719,633
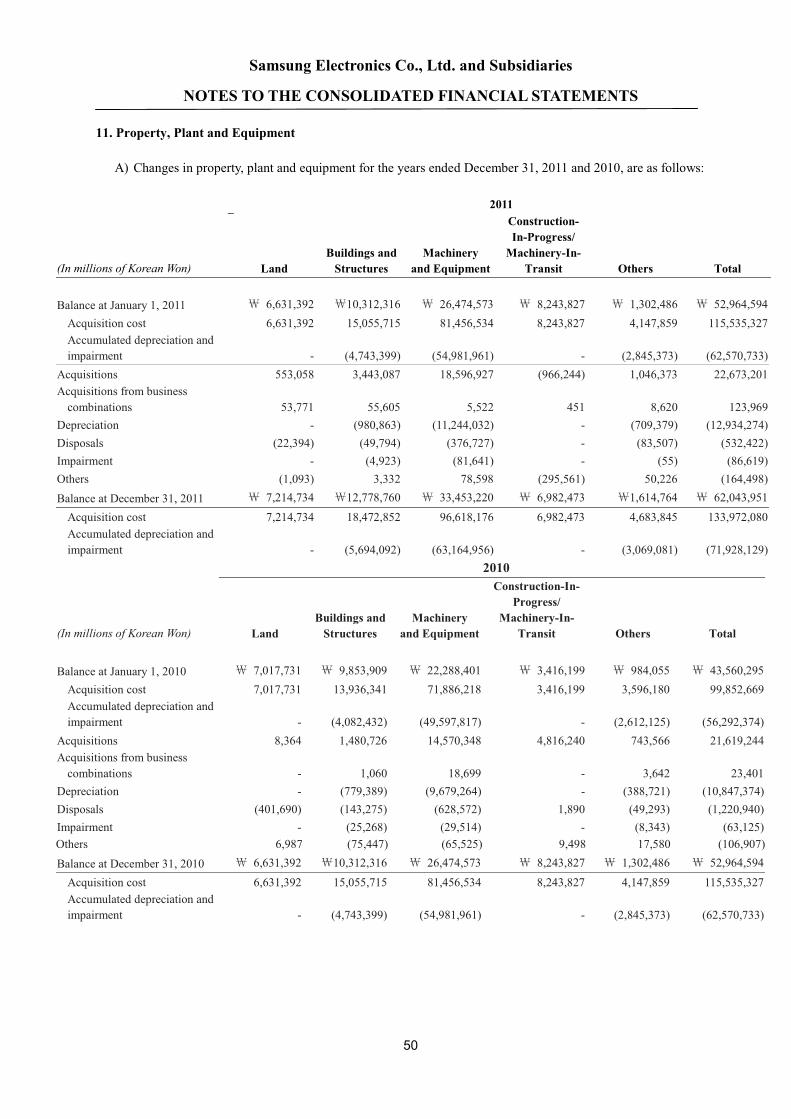
Samsung Electronics Co., Ltd. and Subsidiaries
NOTES TO THE CONSOLIDATED FINANCIAL STATEMENTS
50
11. Property, Plant and Equipment
A) Changes in property, plant and equipment for the years ended December 31, 2011 and 2010, are as follows:
2011
(In millions of Korean Won) LandBuildings andStructures
Machineryand Equipment
Construction-In-Progress/Machinery-In-
Transit Others Total
Balance at January 1, 2011 6,631,392 10,312,316 26,474,573 8,243,827 1,302,486 52,964,594Acquisition cost 6,631,392 15,055,715 81,456,534 8,243,827 4,147,859 115,535,327Accumulated depreciation andimpairment - (4,743,399) (54,981,961) - (2,845,373) (62,570,733)
Acquisitions 553,058 3,443,087 18,596,927 (966,244) 1,046,373 22,673,201Acquisitions from businesscombinations 53,771 55,605 5,522 451 8,620 123,969
Depreciation - (980,863) (11,244,032) - (709,379) (12,934,274)Disposals (22,394) (49,794) (376,727) - (83,507) (532,422)Impairment - (4,923) (81,641) - (55) (86,619)Others (1,093) 3,332 78,598 (295,561) 50,226 (164,498)Balance at December 31, 2011 7,214,734 12,778,760 33,453,220 6,982,473 1,614,764 62,043,951Acquisition cost 7,214,734 18,472,852 96,618,176 6,982,473 4,683,845 133,972,080Accumulated depreciation andimpairment - (5,694,092) (63,164,956) - (3,069,081) (71,928,129)
2010
(In millions of Korean Won) LandBuildings andStructures
Machineryand Equipment
Construction-In-Progress/
Machinery-In-Transit Others Total
Balance at January 1, 2010 7,017,731 9,853,909 22,288,401 3,416,199 984,055 43,560,295Acquisition cost 7,017,731 13,936,341 71,886,218 3,416,199 3,596,180 99,852,669Accumulated depreciation andimpairment - (4,082,432) (49,597,817) - (2,612,125) (56,292,374)
Acquisitions 8,364 1,480,726 14,570,348 4,816,240 743,566 21,619,244Acquisitions from businesscombinations - 1,060 18,699 - 3,642 23,401
Depreciation - (779,389) (9,679,264) - (388,721) (10,847,374)Disposals (401,690) (143,275) (628,572) 1,890 (49,293) (1,220,940)Impairment - (25,268) (29,514) - (8,343) (63,125)Others 6,987 (75,447) (65,525) 9,498 17,580 (106,907)Balance at December 31, 2010 6,631,392 10,312,316 26,474,573 8,243,827 1,302,486 52,964,594Acquisition cost 6,631,392 15,055,715 81,456,534 8,243,827 4,147,859 115,535,327Accumulated depreciation andimpairment - (4,743,399) (54,981,961) - (2,845,373) (62,570,733)

Samsung Electronics Co., Ltd. and Subsidiaries
NOTES TO THE CONSOLIDATED FINANCIAL STATEMENTS
51
B) Details of property, plant and equipment’s depreciations by line item as of December 31, 2011 and 2010, are asfollows:
2011 2010Cost of sales 11,945,495 9,895,079Selling, general and administrative expenses 368,123 351,085Research and development expenses 620,656 601,210
12,934,274 10,847,374
12. Intangible Assets
A) Changes in intangible assets for the years ended December 31, 2011 and 2010, are as follows:
1 The amount includes intangible assets and goodwill arising from the business combination with Samsung Medison, Prosonic,Grandis and others
1 The amount includes intangible assets and goodwill arising from the business combination with Samsung Digital Imaging.
(In millions of KoreanWon)
2011Intellectualpropertyrights
Developmentexpense Membership Goodwill Others Total
At January 1, 2011 601,882 334,617 191,431 571,412 1,080,097 2,779,439Internally generated(development costs) - 331,576 - - - 331,576External acquisition 260,399 - 3,494 - 68,209 332,102Acquisition from BusinessCombinations1 234,644 - - 135,118 181,455 551,217Amortization (125,636) (193,169) - - (338,985) (657,790)Disposal (18,927) - (93) - (5,109) (24,129)Impairment (85) - - (183,145) (236) (183,466)Others 31,525 - 3,125 24 191,613 226,287Balance at December 31,2011 983,802 473,024 197,957 523,409 1,177,044 3,355,236
2010
(In millions of Korean Won)
Intellectualpropertyrights
Developmentexpense Membership Goodwill Others Total
At January 1, 2010 453,548 214,451 183,623 83,462 320,924 1,256,008Internally generated(development costs) - 311,510 - - - 311,510
External acquisition 144,037 - 8,715 - 795,633 948,385Acquisition from BusinessCombinations1 119,805 - - 624,284 242,688 986,777Amortization (76,182) (191,344) - - (278,996) (546,522)Disposal (21,150) - (852) (177) 5,371 (16,808)Impairment - - - (153,940) (6,045) (159,985)Others (18,176) - (55) 17,783 522 74Balance at December 31,2010 601,882 334,617 191,431 571,412 1,080,097 2,779,439

Samsung Electronics Co., Ltd. and Subsidiaries
NOTES TO THE CONSOLIDATED FINANCIAL STATEMENTS
52
B) Goodwill
Goodwill is allocated to Cash-Generating Units at the end of the reporting period, and consists of the following:
2011 2010
Samsung Digital Imaging 287,199 470,344Samsung Mobile Display 80,299 80,299Samsung Medison 74,347 -Grandis 39,883 -Others 41,681 20,769Total 523,409 571,412
Goodwill impairment reviews are undertaken annually. Impairment test suggests that, except for Samsung DigitalImaging, the carrying value of cash generating units does not exceed the recoverable amount. The recoverableamounts of cash-generating units have been determined based on value-in-use calculations. These calculations usepre-tax cash flow projections based on financial budgets approved by management covering a five-year period.Cash flows beyond the five-year period are extrapolated using the estimated growth rates stated below. Thegrowth rate does not exceed the long-term average growth rate for the business in which Samsung Digital Imagingoperates. In addition, a constant growth rate assumption is used for perpetual cash flow calculation. The keyassumptions used for value-in-use calculations in 2011 and 2010, are as follows:
Samsung Digital Imaging2011 2010
Growth rate1 2.1 2.5Pre-tax discount rate2 13.6 15.2
1 Growth rate is consistent with the projected growth rate over five years in the industry reports.2 Pre-tax discount rate applied to the cash flow projections
The carrying value of Samsung Digital Imaging exceeded the value in use by 183,145 million in 2011 and153,940 million in 2010 and the amount exceeded carrying value is recognized as the other gains/losses- net in
the consolidated income statements.
C) Details of amortization of intangible assets as of December 31, 2011 and 2010, consist of the following:
(In millions of Korean Won)Account 2011 2010
Production costs 266,101 236,275Selling general and administrative expenses 300,497 227,195Research and development expenses 91,192 83,052Total 657,790 546,522
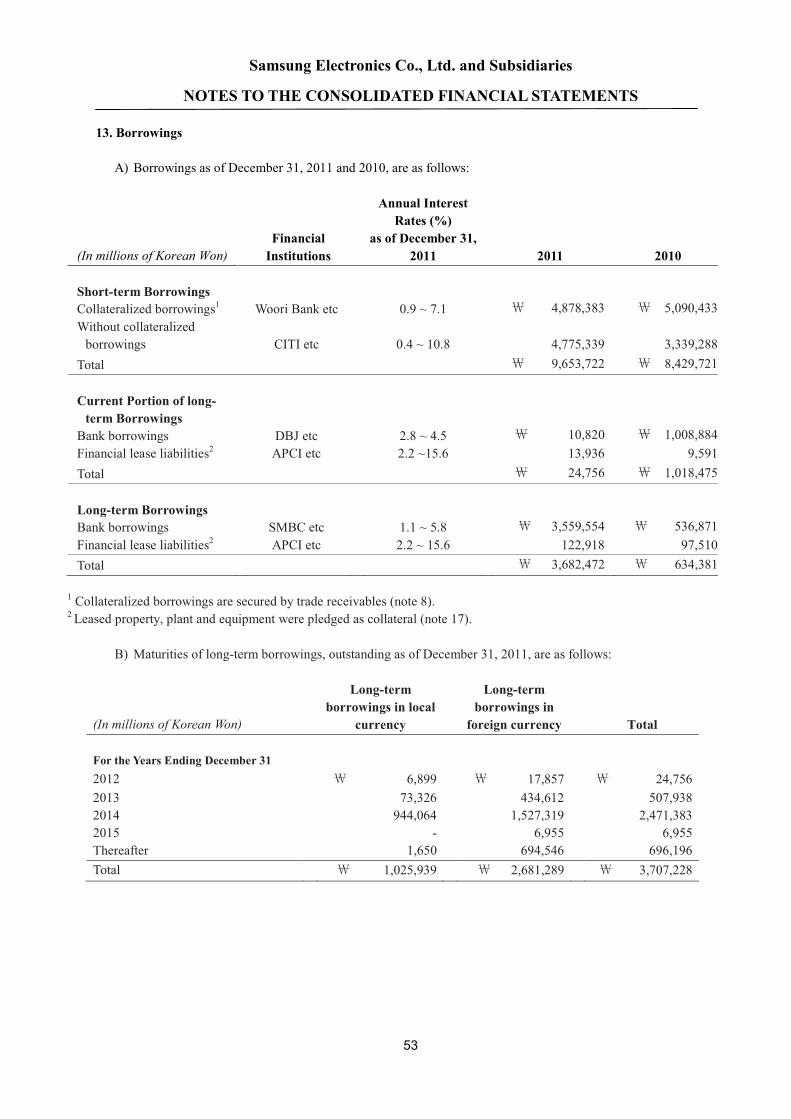
Samsung Electronics Co., Ltd. and Subsidiaries
NOTES TO THE CONSOLIDATED FINANCIAL STATEMENTS
53
13. Borrowings
A) Borrowings as of December 31, 2011 and 2010, are as follows:
(In millions of Korean Won)FinancialInstitutions
Annual InterestRates (%)
as of December 31,2011 2011 2010
Short-term BorrowingsCollateralized borrowings1 Woori Bank etc 0.9 ~ 7.1 4,878,383 5,090,433Without collateralizedborrowings CITI etc 0.4 ~ 10.8 4,775,339 3,339,288Total 9,653,722 8,429,721
Current Portion of long-term BorrowingsBank borrowings DBJ etc 2.8 ~ 4.5 10,820 1,008,884Financial lease liabilities2 APCI etc 2.2 ~15.6 13,936 9,591Total 24,756 1,018,475
Long-term BorrowingsBank borrowings SMBC etc 1.1 ~ 5.8 3,559,554 536,871Financial lease liabilities2 APCI etc 2.2 ~ 15.6 122,918 97,510Total 3,682,472 634,381
1 Collateralized borrowings are secured by trade receivables (note 8).2 Leased property, plant and equipment were pledged as collateral (note 17).
B) Maturities of long-term borrowings, outstanding as of December 31, 2011, are as follows:
(In millions of Korean Won)
Long-termborrowings in local
currency
Long-termborrowings inforeign currency Total
For the Years Ending December 312012 6,899 17,857 24,7562013 73,326 434,612 507,9382014 944,064 1,527,319 2,471,3832015 - 6,955 6,955Thereafter 1,650 694,546 696,196Total 1,025,939 2,681,289 3,707,228
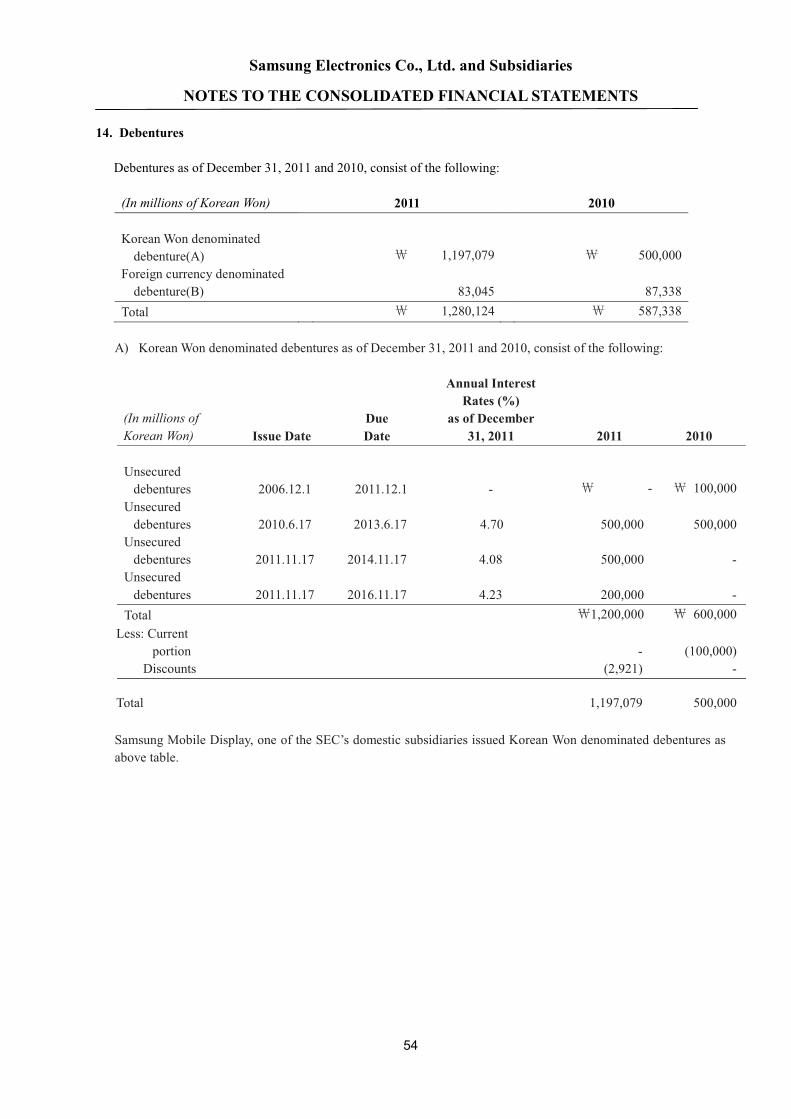
Samsung Electronics Co., Ltd. and Subsidiaries
NOTES TO THE CONSOLIDATED FINANCIAL STATEMENTS
54
14. Debentures
Debentures as of December 31, 2011 and 2010, consist of the following:
(In millions of Korean Won) 2011 2010
Korean Won denominateddebenture(A) 1,197,079 500,000
Foreign currency denominateddebenture(B) 83,045 87,338
Total 1,280,124 587,338
A) Korean Won denominated debentures as of December 31, 2011 and 2010, consist of the following:
(In millions ofKorean Won) Issue Date
DueDate
Annual InterestRates (%)
as of December31, 2011 2011 2010
Unsecureddebentures 2006.12.1 2011.12.1 - - 100,000Unsecureddebentures 2010.6.17 2013.6.17 4.70 500,000 500,000Unsecureddebentures 2011.11.17 2014.11.17 4.08 500,000 -Unsecureddebentures 2011.11.17 2016.11.17 4.23 200,000 -Total 1,200,000 600,000Less: Current
portion - (100,000)Discounts (2,921) -
Total 1,197,079 500,000
Samsung Mobile Display, one of the SEC’s domestic subsidiaries issued Korean Won denominated debentures asabove table.

Samsung Electronics Co., Ltd. and Subsidiaries
NOTES TO THE CONSOLIDATED FINANCIAL STATEMENTS
55
B) Debentures denominated in foreign currencies as of December 31, 2011 and 2010, consist of thefollowing:
(In millions ofKorean Won) Issue Date
DueDate
Annual InterestRates (%)
as of December31, 2011 2011 2010
US dollardenominatedstraight bonds 1997.10.2 2027.10.1 7.70
92,264(US$ 80M)
96,807(US$ 85M)
92,264 96,807Less: Current
portion (5,536) (5,459)Discounts (3,683) (4,010)
Total 83,045 87,338
US dollar straight bonds will be repaid annually for twenty years after a ten-year grace period from the date ofissuance. Interests will be paid semi-annually.
C) Maturities of debentures outstanding as of December 31, 2011 are as follows:
(In millions of Korean Won) DebenturesFor the Years Ending December 312012 5,7672013 505,7672014 505,7672015 5,767Thereafter 269,196Total 1,292,264
15. Retirement benefit obligation
A) Defined benefit liability recognized on the statements of finance position as of December 31, 2011 and 2010,is as follows:
(In millions of Korean Won) 2011 2010
Present value of funded defined benefitobligation 3,271,629 2,293,468
Present value of unfunded defined benefit 258,711 355,164Subtotal 3,530,340 2,648,632Unrecognized actuarial gains or losses (688,702) (253,097)Fair value of plan assets (2,423,152) (1,797,706)
418,486 597,829
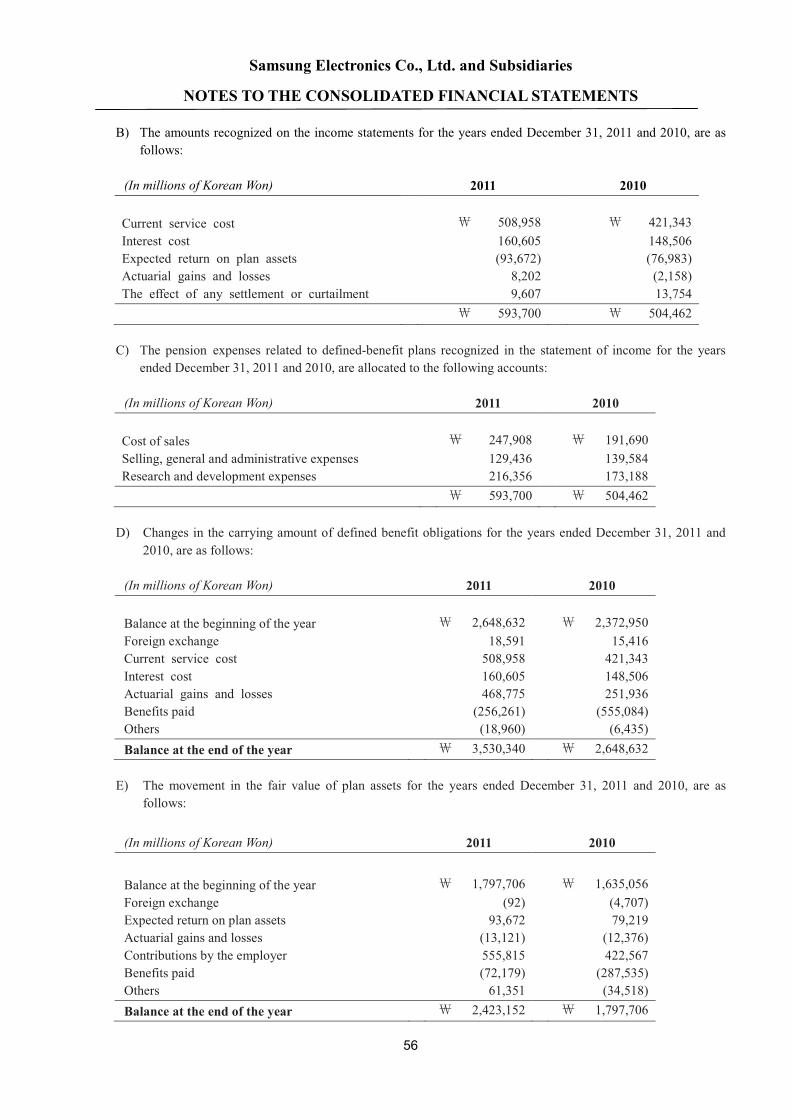
Samsung Electronics Co., Ltd. and Subsidiaries
NOTES TO THE CONSOLIDATED FINANCIAL STATEMENTS
56
B) The amounts recognized on the income statements for the years ended December 31, 2011 and 2010, are asfollows:
(In millions of Korean Won) 2011 2010
Current service cost 508,958 421,343Interest cost 160,605 148,506Expected return on plan assets (93,672) (76,983)Actuarial gains and losses 8,202 (2,158)The effect of any settlement or curtailment 9,607 13,754
593,700 504,462
C) The pension expenses related to defined-benefit plans recognized in the statement of income for the yearsended December 31, 2011 and 2010, are allocated to the following accounts:
(In millions of Korean Won) 2011 2010
Cost of sales 247,908 191,690Selling, general and administrative expenses 129,436 139,584Research and development expenses 216,356 173,188
593,700 504,462
D) Changes in the carrying amount of defined benefit obligations for the years ended December 31, 2011 and2010, are as follows:
(In millions of Korean Won) 2011 2010
Balance at the beginning of the year 2,648,632 2,372,950Foreign exchange 18,591 15,416Current service cost 508,958 421,343Interest cost 160,605 148,506Actuarial gains and losses 468,775 251,936Benefits paid (256,261) (555,084)Others (18,960) (6,435)Balance at the end of the year 3,530,340 2,648,632
E) The movement in the fair value of plan assets for the years ended December 31, 2011 and 2010, are asfollows:
(In millions of Korean Won) 2011 2010
Balance at the beginning of the year 1,797,706 1,635,056Foreign exchange (92) (4,707)Expected return on plan assets 93,672 79,219Actuarial gains and losses (13,121) (12,376)Contributions by the employer 555,815 422,567Benefits paid (72,179) (287,535)Others 61,351 (34,518)Balance at the end of the year 2,423,152 1,797,706
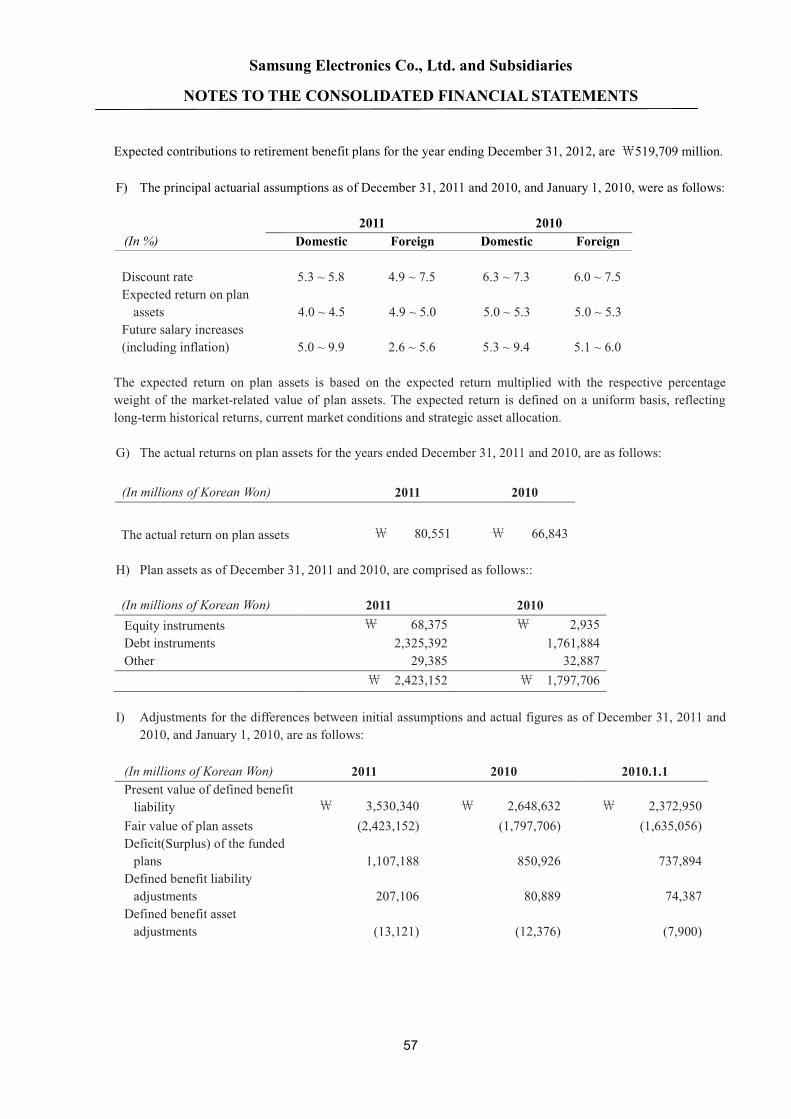
Samsung Electronics Co., Ltd. and Subsidiaries
NOTES TO THE CONSOLIDATED FINANCIAL STATEMENTS
57
Expected contributions to retirement benefit plans for the year ending December 31, 2012, are 519,709 million.
F) The principal actuarial assumptions as of December 31, 2011 and 2010, and January 1, 2010, were as follows:
2011 2010(In %) Domestic Foreign Domestic Foreign
Discount rate 5.3 ~ 5.8 4.9 ~ 7.5 6.3 ~ 7.3 6.0 ~ 7.5Expected return on planassets 4.0 ~ 4.5 4.9 ~ 5.0 5.0 ~ 5.3 5.0 ~ 5.3
Future salary increases(including inflation) 5.0 ~ 9.9 2.6 ~ 5.6 5.3 ~ 9.4 5.1 ~ 6.0
The expected return on plan assets is based on the expected return multiplied with the respective percentageweight of the market-related value of plan assets. The expected return is defined on a uniform basis, reflectinglong-term historical returns, current market conditions and strategic asset allocation.
G) The actual returns on plan assets for the years ended December 31, 2011 and 2010, are as follows:
(In millions of Korean Won) 2011 2010
The actual return on plan assets 80,551 66,843
H) Plan assets as of December 31, 2011 and 2010, are comprised as follows::
(In millions of Korean Won) 2011 2010Equity instruments 68,375 2,935Debt instruments 2,325,392 1,761,884Other 29,385 32,887
2,423,152 1,797,706
I) Adjustments for the differences between initial assumptions and actual figures as of December 31, 2011 and2010, and January 1, 2010, are as follows:
(In millions of Korean Won) 2011 2010 2010.1.1Present value of defined benefitliability 3,530,340 2,648,632 2,372,950Fair value of plan assets (2,423,152) (1,797,706) (1,635,056)Deficit(Surplus) of the fundedplans 1,107,188 850,926 737,894Defined benefit liabilityadjustments 207,106 80,889 74,387Defined benefit assetadjustments (13,121) (12,376) (7,900)

Samsung Electronics Co., Ltd. and Subsidiaries
NOTES TO THE CONSOLIDATED FINANCIAL STATEMENTS
58
16. Provisions
The changes in the main liability provisions during the 12 month period ended December 31, 2011, are as follows:
(In millions ofKorean Won) Warranty(A)
Royaltyexpenses(B)
Long-termincentives(C) Others(D) Total
January 1, 2011 1,633,506 989,057 590,712 - 3,213,275Increase 1,690,156 1,144,448 175,716 96,245 3,106,565Decrease (1,609,786) (535,484) (255,527) - (2,400,797)Other1 (33,342) (7,942) - - (41,284)December 31, 2011 1,680,534 1,590,079 510,901 96,245 3,877,759
1Others include amounts from changes in foreign currency exchange rates.
A) The Company accrues warranty reserves for estimated costs of future service, repairs and recalls, based onhistorical experience and terms of warranty programs (which have terms from 1 to 4 years).
B) The Company makes provisions for estimated royalty expenses related to technical assistance agreements thathave not been settled. The timing of payment depends on the settlement of agreement.
C) The Company has a long-term incentive plans for its executives based on a three-year managementperformance criteria and has made a provision for the estimated incentive cost for the accrued period.
D) The Company makes provisions for estimated litigation expenses related to lawsuits and legal disputes. Thetiming of payment depends on the progress of the lawsuits and legal disputes.
17. Commitments and Contingencies
A) Guarantees
(In millions of Korean Won) 2011 2010
Guarantees of debt for housing rental1 153,989 171,674
1 The guarantees of debt for housing rental relate to guarantees provided by the Company to landlords for housingfor expatriate employees.
B) Lease
As of December 31, 2011, details of lease contracts held by the Company are as follows:
Finance leasesThe Company leases certain property, plant and equipment under various finance lease arrangements. Assetsrecorded under finance lease agreements are included in property, plant and equipment with a net book value of141,875million(2010: 109,838million). Depreciation expense for the finance lease assets amounted to16,430million (2010: 6,817million) for the year ended December 31, 2011.

Samsung Electronics Co., Ltd. and Subsidiaries
NOTES TO THE CONSOLIDATED FINANCIAL STATEMENTS
59
The minimum lease payments under finance lease agreements and their present value as of December 31, 2011and 2010, are as follows:
(In millions of KoreanWon)
2011 2010
MinimumLease payments Present values
MinimumLease
paymentsPresentvalues
Within one year 25,968 13,936 19,679 9,591From one year to fiveyears 81,970 49,486 73,862 40,356More than five years 131,263 73,432 118,567 57,154Total 239,201 136,854 212,108 107,101Present valueadjustment (102,347) (105,007)Finance lease payables 136,854 107,101
C) Litigation
(1) Civil class actions with respect to fixed pricing on the sales of TFT-LCD were filed against the Companyand its subsidiaries in the United States. As of balance sheet date, the outcome of the investigation and civilactions cannot be reasonably determined.
(2)Based on the agreement entered on August 24, 1999 with respect to Samsung Motor Inc.’s (“SMI”)bankruptcy proceedings, Samsung Motor Inc.’s creditors (“the Creditors”) filed a civil action against Mr.Kun Hee Lee, former chairman of the Company, and 28 Samsung Group affiliates including the Companyunder joint and several liability for failing to comply with such agreement. Under the suit, the Creditorshave sought 2,450 billion (approximately $1.95 billion) for loss of principal on loans extended to SMI, aseparate amount for breach of the agreement, and an amount for default interest.
SLI completed its Initial Public Offering (“IPO”) on May 7, 2010. After disposing 2,277,787 shares andpaying the principal balance owed to the Creditors, 878 billion (approximately $ 0.80 billion) wasdeposited in to an escrow account. That remaining balance was to be used to pay the Creditors interest dueto the delay in the SLI IPO. On January 11, 2011, the Seoul High Court ordered Samsung Group affiliatesto pay 600 billion (approximately $ 0.53 billion) to the Creditors and pay 5% annual interest for theperiod between May 8, 2010 and January 11, 2011, and pay 20% annual interest for the period after January11, 2011 until the amounts owed to the Creditors are paid. In accordance with the Seoul High Court order,620.4 billion (which includes penalties and interest owed) was paid to the Creditors from the funds held in
escrow during January 2011. On February 7, 2011, the Samsung Group affiliates and the Creditors appealedthe Seoul High Court’ ruling to the Korean Supreme Court and the appeal is currently in progress. Theamount of loss related to this matter cannot be reasonably determined. Accordingly, the Company hasconcluded that no provision for loss should be reflected in the Company’s consolidated financial statementsat December 31, 2011.
(3)As of December 31, 2011, in addition to the cases mentioned above, the Company’s domestic and foreignsubsidiaries have been involved in various claims and proceedings with Apple and other companies duringthe normal course of business, the amount and timing of these matters cannot be reasonably determined. TheCompany's management believes that, although the amount and timing of these matters cannot be reasonablydetermined, the conclusion of these matters will not have a material adverse effect on the financial positionof the Company.
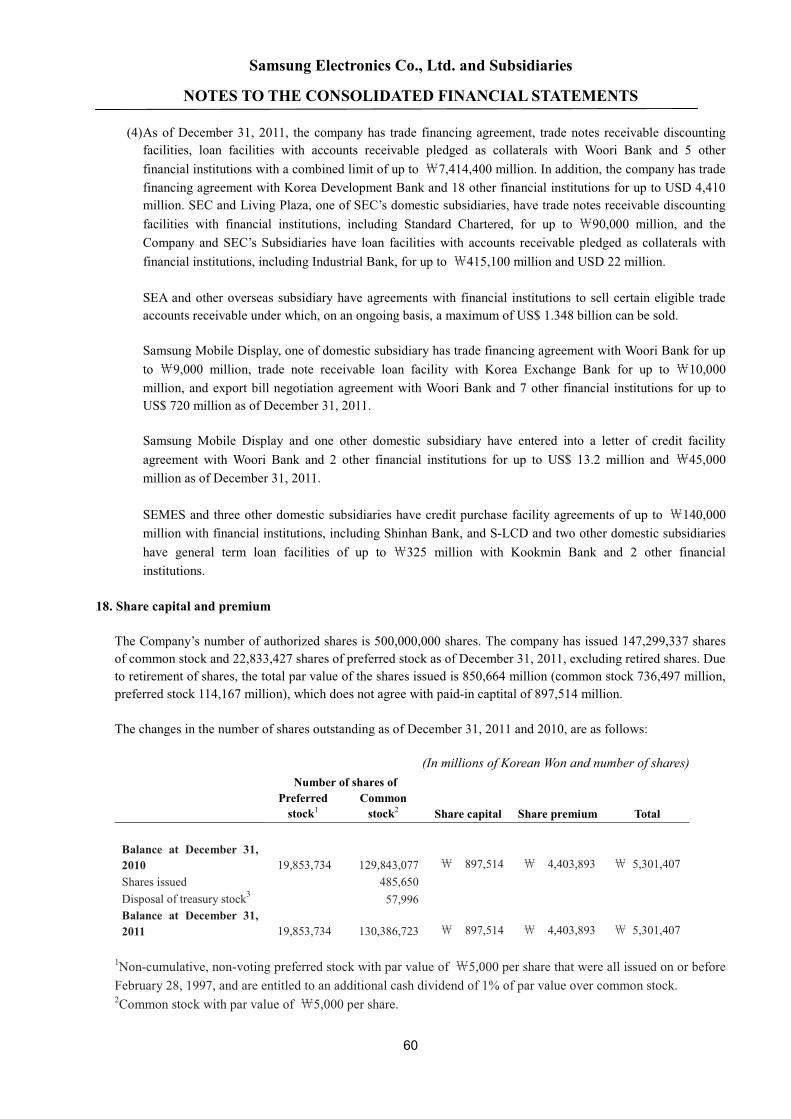
Samsung Electronics Co., Ltd. and Subsidiaries
NOTES TO THE CONSOLIDATED FINANCIAL STATEMENTS
60
(4)As of December 31, 2011, the company has trade financing agreement, trade notes receivable discountingfacilities, loan facilities with accounts receivable pledged as collaterals with Woori Bank and 5 otherfinancial institutions with a combined limit of up to 7,414,400 million. In addition, the company has tradefinancing agreement with Korea Development Bank and 18 other financial institutions for up to USD 4,410million. SEC and Living Plaza, one of SEC’s domestic subsidiaries, have trade notes receivable discountingfacilities with financial institutions, including Standard Chartered, for up to 90,000 million, and theCompany and SEC’s Subsidiaries have loan facilities with accounts receivable pledged as collaterals withfinancial institutions, including Industrial Bank, for up to 415,100 million and USD 22 million.
SEA and other overseas subsidiary have agreements with financial institutions to sell certain eligible tradeaccounts receivable under which, on an ongoing basis, a maximum of US$ 1.348 billion can be sold.
Samsung Mobile Display, one of domestic subsidiary has trade financing agreement with Woori Bank for upto 9,000 million, trade note receivable loan facility with Korea Exchange Bank for up to 10,000million, and export bill negotiation agreement with Woori Bank and 7 other financial institutions for up toUS$ 720 million as of December 31, 2011.
Samsung Mobile Display and one other domestic subsidiary have entered into a letter of credit facilityagreement with Woori Bank and 2 other financial institutions for up to US$ 13.2 million and 45,000million as of December 31, 2011.
SEMES and three other domestic subsidiaries have credit purchase facility agreements of up to 140,000million with financial institutions, including Shinhan Bank, and S-LCD and two other domestic subsidiarieshave general term loan facilities of up to 325 million with Kookmin Bank and 2 other financialinstitutions.
18. Share capital and premium
The Company’s number of authorized shares is 500,000,000 shares. The company has issued 147,299,337 sharesof common stock and 22,833,427 shares of preferred stock as of December 31, 2011, excluding retired shares. Dueto retirement of shares, the total par value of the shares issued is 850,664 million (common stock 736,497 million,preferred stock 114,167 million), which does not agree with paid-in captital of 897,514 million.
The changes in the number of shares outstanding as of December 31, 2011 and 2010, are as follows:
(In millions of Korean Won and number of shares)Number of shares of
Preferredstock1
Commonstock2 Share capital Share premium Total
Balance at December 31,2010 19,853,734 129,843,077 897,514 4,403,893 5,301,407Shares issued 485,650Disposal of treasury stock3 57,996Balance at December 31,2011 19,853,734 130,386,723 897,514 4,403,893 5,301,407
1Non-cumulative, non-voting preferred stock with par value of 5,000 per share that were all issued on or beforeFebruary 28, 1997, and are entitled to an additional cash dividend of 1% of par value over common stock.2Common stock with par value of 5,000 per share.
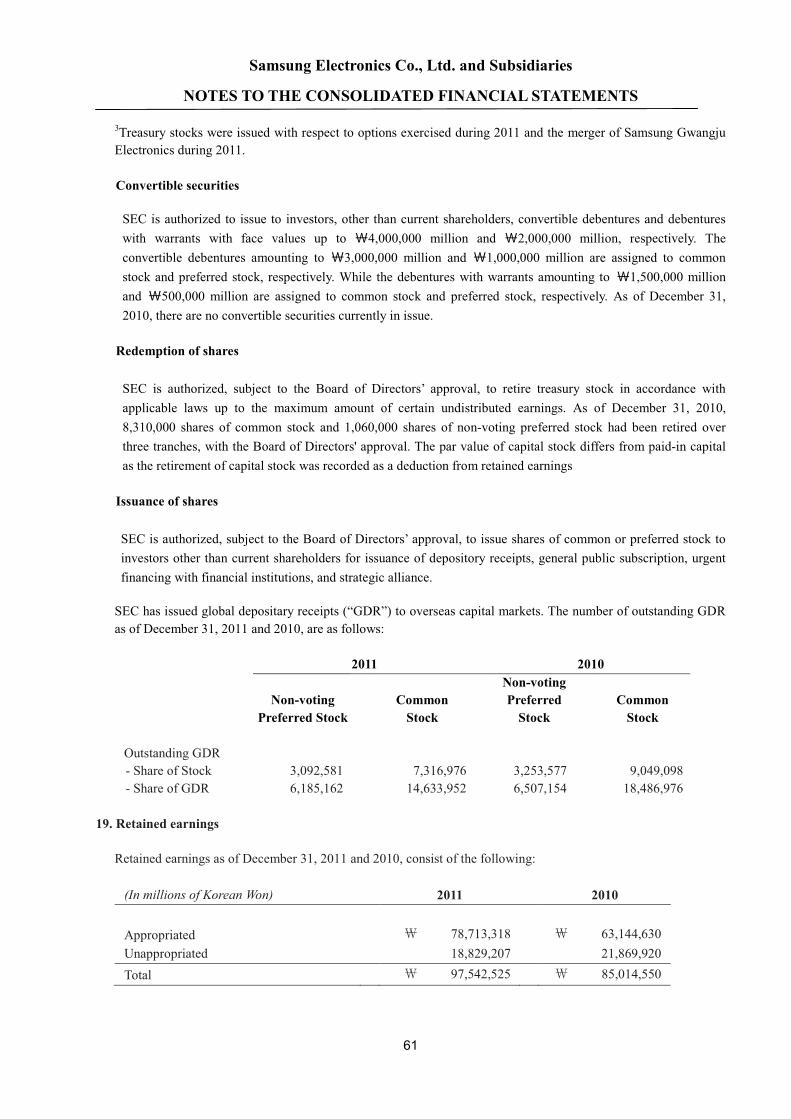
Samsung Electronics Co., Ltd. and Subsidiaries
NOTES TO THE CONSOLIDATED FINANCIAL STATEMENTS
61
3Treasury stocks were issued with respect to options exercised during 2011 and the merger of Samsung GwangjuElectronics during 2011.
Convertible securities
SEC is authorized to issue to investors, other than current shareholders, convertible debentures and debentureswith warrants with face values up to 4,000,000 million and 2,000,000 million, respectively. Theconvertible debentures amounting to 3,000,000 million and 1,000,000 million are assigned to commonstock and preferred stock, respectively. While the debentures with warrants amounting to 1,500,000 millionand 500,000 million are assigned to common stock and preferred stock, respectively. As of December 31,2010, there are no convertible securities currently in issue.
Redemption of shares
SEC is authorized, subject to the Board of Directors’ approval, to retire treasury stock in accordance withapplicable laws up to the maximum amount of certain undistributed earnings. As of December 31, 2010,8,310,000 shares of common stock and 1,060,000 shares of non-voting preferred stock had been retired overthree tranches, with the Board of Directors' approval. The par value of capital stock differs from paid-in capitalas the retirement of capital stock was recorded as a deduction from retained earnings
Issuance of shares
SEC is authorized, subject to the Board of Directors’ approval, to issue shares of common or preferred stock toinvestors other than current shareholders for issuance of depository receipts, general public subscription, urgentfinancing with financial institutions, and strategic alliance.
SEC has issued global depositary receipts (“GDR”) to overseas capital markets. The number of outstanding GDRas of December 31, 2011 and 2010, are as follows:
2011 2010
Non-votingPreferred Stock
CommonStock
Non-votingPreferredStock
CommonStock
Outstanding GDR- Share of Stock 3,092,581 7,316,976 3,253,577 9,049,098- Share of GDR 6,185,162 14,633,952 6,507,154 18,486,976
19. Retained earnings
Retained earnings as of December 31, 2011 and 2010, consist of the following:
(In millions of Korean Won) 2011 2010
Appropriated 78,713,318 63,144,630Unappropriated 18,829,207 21,869,920Total 97,542,525 85,014,550

Samsung Electronics Co., Ltd. and Subsidiaries
NOTES TO THE CONSOLIDATED FINANCIAL STATEMENTS
62
20. Dividends
SEC declared cash dividends to shareholders of common stock and preferred stock as interim dividends for thesix-month periods ended June 30, 2011 and 2010 and as year-end dividends for the years ended December 31,2011 and 2010.
Details of interim dividends and year-end dividends are as follows:
A) Interim Dividends
(In millions of Korean Won and numberof shares) 2011 2010
Number of shares eligible for dividends Common stock 130,148,288 shares 129,558,812 sharesPreferred stock 19,853,734 shares 19,853,734 shares
Dividend rate 10% 100%Dividend amount Common stock 65,074 647,794
Preferred stock 9,927 99,269Total 75,001 747,063
B) Year-end Dividends
(In millions of Korean Won and numberof shares) 2011 2010
Number of shares eligible for dividends Common stock 130,386,723 shares 129,843,077 sharesPreferred stock 19,853,734 shares 19,853,734 shares
Dividend rate Common stock 100% 100%Dividend amount Preferred stock 101% 101%Number of shares eligible for dividends Common stock 651,934 649,216
Preferred stock 100,261 100,261Total 752,195 749,477
C) Dividend Payout Ratio
2011 2010
Dividend payout ratio 6.19% 9.47%
D) Dividend Yield Ratio
2011 2010Common Stock Preferred Stock Common Stock Preferred Stock
Dividend yield ratio1 0.52% 0.85% 1.07% 1.57%
1 The average closing price for a week before 2 trading days prior to closing date of shareholders' list.
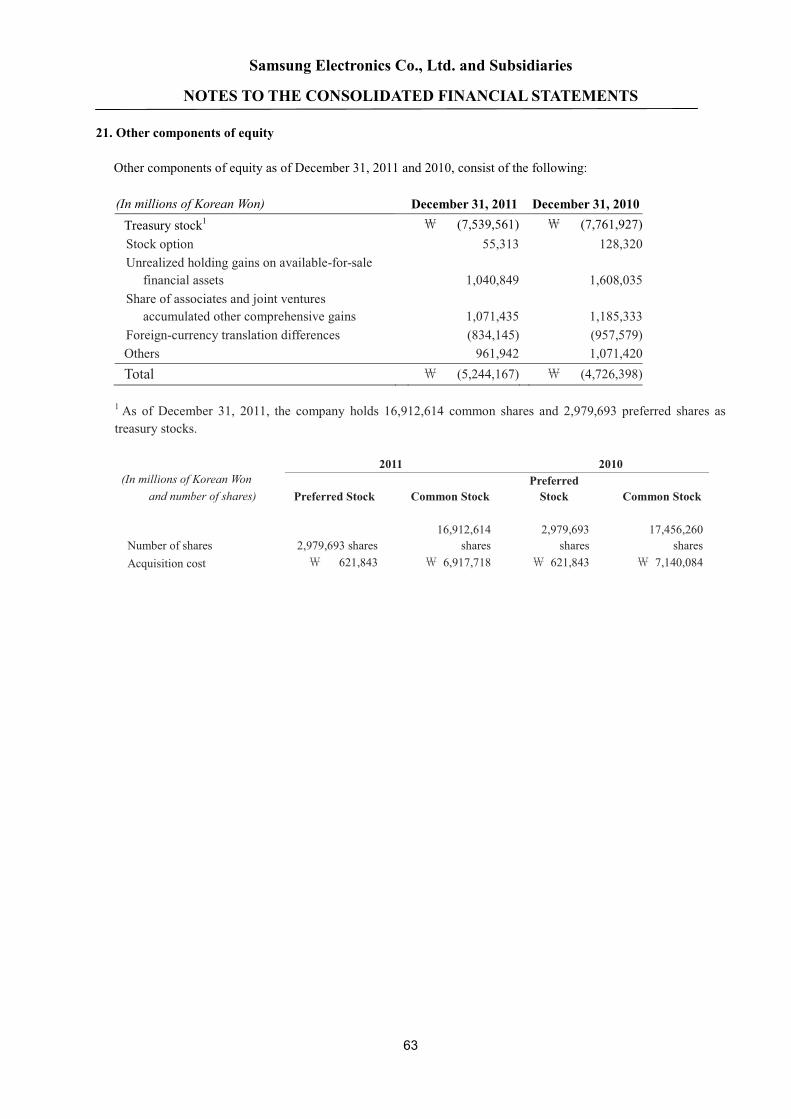
Samsung Electronics Co., Ltd. and Subsidiaries
NOTES TO THE CONSOLIDATED FINANCIAL STATEMENTS
63
21. Other components of equity
Other components of equity as of December 31, 2011 and 2010, consist of the following:
(In millions of Korean Won) December 31, 2011 December 31, 2010Treasury stock1 (7,539,561) (7,761,927)Stock option 55,313 128,320Unrealized holding gains on available-for-salefinancial assets 1,040,849 1,608,035
Share of associates and joint venturesaccumulated other comprehensive gains 1,071,435 1,185,333
Foreign-currency translation differences (834,145) (957,579)Others 961,942 1,071,420Total (5,244,167) (4,726,398)
1 As of December 31, 2011, the company holds 16,912,614 common shares and 2,979,693 preferred shares astreasury stocks.
2011 2010(In millions of Korean Won
and number of shares) Preferred Stock Common StockPreferredStock Common Stock
Number of shares 2,979,693 shares16,912,614
shares2,979,693shares
17,456,260shares
Acquisition cost 621,843 6,917,718 621,843 7,140,084

Samsung Electronics Co., Ltd. and Subsidiaries
NOTES TO THE CONSOLIDATED FINANCIAL STATEMENTS
64
22. Share Based Compensation
The Company has a stock option plan that provides for the granting of stock purchase options to employees ordirectors who have contributed or are expected to contribute to the management and technological innovation ofthe Company. No Share based compensation has been granted since December 20, 2005. All options currently inissue are fully vested.
A summary of the terms and the number of outstanding stock options as of December 31, 2011 is as follows:
Date of the GrantMarch 16,2000
March 9,2001
February 28,2002
March 25,2002
March 7,2003
April16,2004
December 20,2005
At January 1, 2010 54,507 449,409 275,504 32,854 108,835 463,902 10,000Exercisedduring 2010 54,507 273,337 115,283 1,879 33,960 119,334 -At December 31,2010 - 176,072 160,221 30,975 74,875 344,568 -
Exercised During 2011 - 176,072 112,626 28,046 25,624 143,282 -
At December 31,2011 - - 47,595 2,929 49,251 201,286 10,000
Exercise price 272,700 197,100 329,200 342,800 288,800 580,300 606,700Weighted averageshare price at the dateof exercise during2010 779,377 853,456 845,473 840,201 852,484 863,578 -Weighted averageshare price at the dateof exercise during2011 - 943,994 949,456 931,977 935,942 998,175 -Exercise period fromthe date of the grant 3-10years 3-10years 2-10years 2-10years 2-10years 2-10years 2-10years
23. Expenses by Nature
Expenses by nature for the years ended December 31, 2011 and 2010, consist of the following:
(In millions of Korean Won) 2011 2010
Raw materials and goods 75,329,188 70,345,743Wages and salaries 11,906,674 11,380,257Pension expenses 616,999 563,408Depreciation expenses 12,934,274 10,847,374Amortization expenses 657,790 546,522Welfare expenses 1,998,559 1,618,992Commission and service charges 5,936,770 6,769,346Other expenses 40,166,617 35,937,656
149,546,871 138,009,298
1 Expenses above equals to the sum of cost of sales, research and development expenses and selling, general andadministrative expenses in the Statements of Income.

Samsung Electronics Co., Ltd. and Subsidiaries
NOTES TO THE CONSOLIDATED FINANCIAL STATEMENTS
65
24. Selling and administrative expenses
Selling and administrative expenses for the years ended December 31, 2011 and 2010, are as follows:
(In millions of Korean Won) 2011 2010
Wages and salaries 3,551,588 3,373,365Pension expenses 148,812 155,894Commission and service charges 5,936,770 6,769,346Depreciation expenses 368,123 351,085Amortization expenses 300,497 227,195Advertising expenses 2,982,270 3,282,798Sales promotion expenses 4,649,293 3,271,993Transportation expenses 3,789,476 4,108,830Warranty 2,805,696 2,454,601Public relation expenses 523,149 494,599Others 2,366,236 1,753,416
27,421,910 26,243,122
25. Other operating income and expense
Other operating income for the years ended December 31, 2011 and 2010, consists of the following:
(In millions of Korean Won) 2011 2010
Dividend income 34,423 32,829Commission income 26,313 21,652Rental income 92,155 96,562Gain on disposal of investments 223,535 412,715Gain on disposal of property, plant and equipment 113,690 282,941Gain on transfer of business1 1,062,793 179,418Other 869,000 729,324
2,421,909 1,755,441
1 Gain on transfer of business of 2011 consists of gain on transfer of the Solar battery business and the HDDbusiness.
Other operating expense for the years ended December 31, 2011 and 2010, consists of the following:
(In millions of Korean Won) 2011 2010
Other bad debts expense 14,402 15,254Loss from disposal of property, plant and equipment 109,338 276,080Donations 272,275 218,863Impairment losses on intangible assets 186,759 160,173Impairment losses on property, plant and equipment 97,517 62,919Loss from disposal of investments 5,937 132Other 940,864 346,514
1,627,092 1,079,935

Samsung Electronics Co., Ltd. and Subsidiaries
NOTES TO THE CONSOLIDATED FINANCIAL STATEMENTS
66
26. Financial income and costs
Financial income and costs for the years ended December 31, 2011 and 2010 are as follows:
(In millions of Korean Won) 2011 2010
Finance incomeInterest income 705,653 558,113Interest income from loans and receivables 702,198 556,624Interest income from available-for-sale financial assets 3,455 1,489
Realized foreign exchange gains 5,582,146 6,012,626Unrealized foreign exchange gains 538,602 496,543Gains on valuation of derivatives 80,103 74,357Gains on derivatives transaction 497,021 323,489
7,403,525 7,465,128
(In millions of Korean Won) 2011 2010
Finance expenseInterest expense: 644,133 581,091Interest expense from financial liabilities measuredat amortized cost 644,133 581,091
Realized foreign exchange losses 6,232,241 6,274,744Unrealized foreign exchange losses 553,324 414,077Losses on valuation of derivatives 59,697 49,728Losses on derivatives transaction 404,026 380,459
7,893,421 7,700,099
The company recognizes the profits and losses regarding translation differences as financial income and expenses.
27. Income tax
A) Income tax expense for the years ended December 31, 2011 and 2010, consists of the following:
(In millions of Korean Won) 2011 2010
Current taxes :Current tax on profits for the year 3,051,406 3,330,420Adjustments in respect of prior years 95,670 (163,739)
3,147,076 3,166,681Deferred taxes :Deferred income taxes - tax credit (75,311) (363,802)Deferred income taxes - temporary difference 373,788 341,137Deferred income taxes - accumulated operating loss (22,599) 41,036
Items charged directly to equity 1,994 (2,921)Income tax expense 3,424,948 3,182,131
B) The tax on the company’s profit before tax differs from the theoretical amount that would arise using theweighted average tax rate applicable to profits of the consolidated entities as follows:
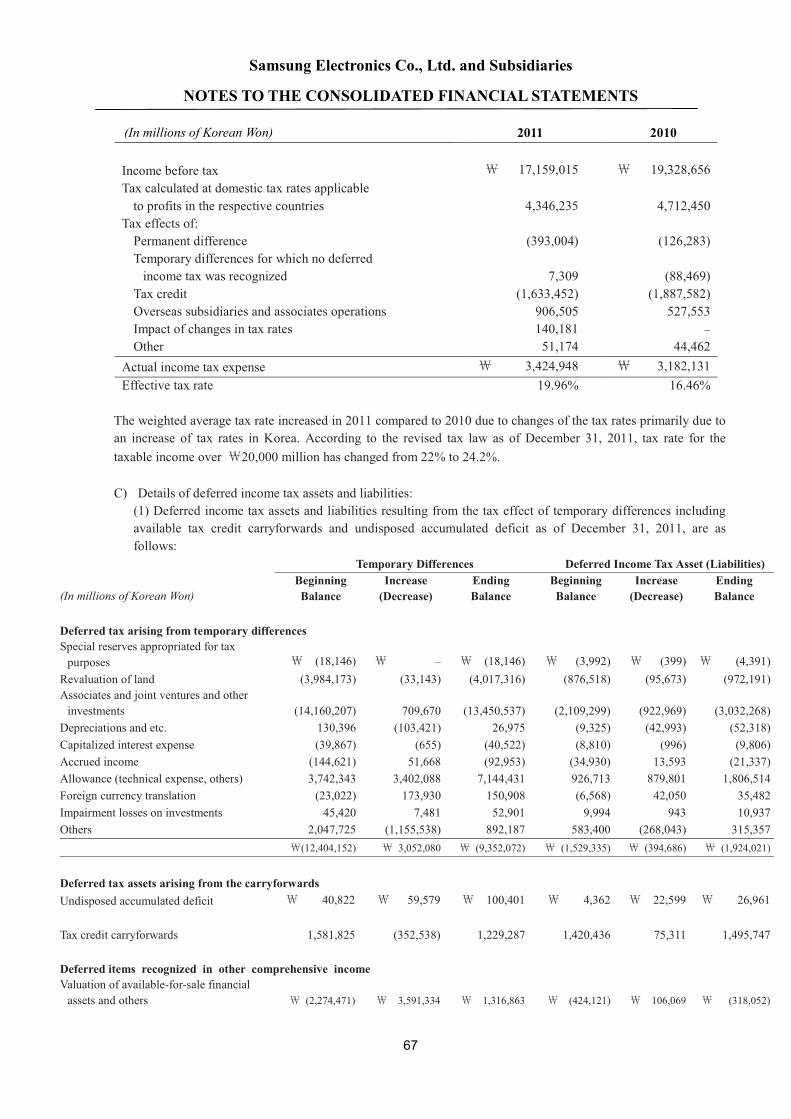
Samsung Electronics Co., Ltd. and Subsidiaries
NOTES TO THE CONSOLIDATED FINANCIAL STATEMENTS
67
(In millions of Korean Won) 2011 2010
Income before tax 17,159,015 19,328,656Tax calculated at domestic tax rates applicableto profits in the respective countries 4,346,235 4,712,450
Tax effects of:Permanent difference (393,004) (126,283)Temporary differences for which no deferredincome tax was recognized 7,309 (88,469)Tax credit (1,633,452) (1,887,582)Overseas subsidiaries and associates operations 906,505 527,553Impact of changes in tax rates 140,181 –Other 51,174 44,462
Actual income tax expense 3,424,948 3,182,131Effective tax rate 19.96% 16.46%
The weighted average tax rate increased in 2011 compared to 2010 due to changes of the tax rates primarily due toan increase of tax rates in Korea. According to the revised tax law as of December 31, 2011, tax rate for thetaxable income over 20,000 million has changed from 22% to 24.2%.
C) Details of deferred income tax assets and liabilities:(1) Deferred income tax assets and liabilities resulting from the tax effect of temporary differences includingavailable tax credit carryforwards and undisposed accumulated deficit as of December 31, 2011, are asfollows:
Temporary Differences Deferred Income Tax Asset (Liabilities)
(In millions of Korean Won)BeginningBalance
Increase(Decrease)
EndingBalance
BeginningBalance
Increase(Decrease)
EndingBalance
Deferred tax arising from temporary differencesSpecial reserves appropriated for taxpurposes (18,146) – (18,146) (3,992) (399) (4,391)Revaluation of land (3,984,173) (33,143) (4,017,316) (876,518) (95,673) (972,191)Associates and joint ventures and otherinvestments (14,160,207) 709,670 (13,450,537) (2,109,299) (922,969) (3,032,268)Depreciations and etc. 130,396 (103,421) 26,975 (9,325) (42,993) (52,318)Capitalized interest expense (39,867) (655) (40,522) (8,810) (996) (9,806)Accrued income (144,621) 51,668 (92,953) (34,930) 13,593 (21,337)Allowance (technical expense, others) 3,742,343 3,402,088 7,144,431 926,713 879,801 1,806,514Foreign currency translation (23,022) 173,930 150,908 (6,568) 42,050 35,482Impairment losses on investments 45,420 7,481 52,901 9,994 943 10,937Others 2,047,725 (1,155,538) 892,187 583,400 (268,043) 315,357
(12,404,152) 3,052,080 (9,352,072) (1,529,335) (394,686) (1,924,021)
Deferred tax assets arising from the carryforwardsUndisposed accumulated deficit 40,822 59,579 100,401 4,362 22,599 26,961
Tax credit carryforwards 1,581,825 (352,538) 1,229,287 1,420,436 75,311 1,495,747
Deferred items recognized in other comprehensive incomeValuation of available-for-sale financialassets and others (2,274,471) 3,591,334 1,316,863 (424,121) 106,069 (318,052)
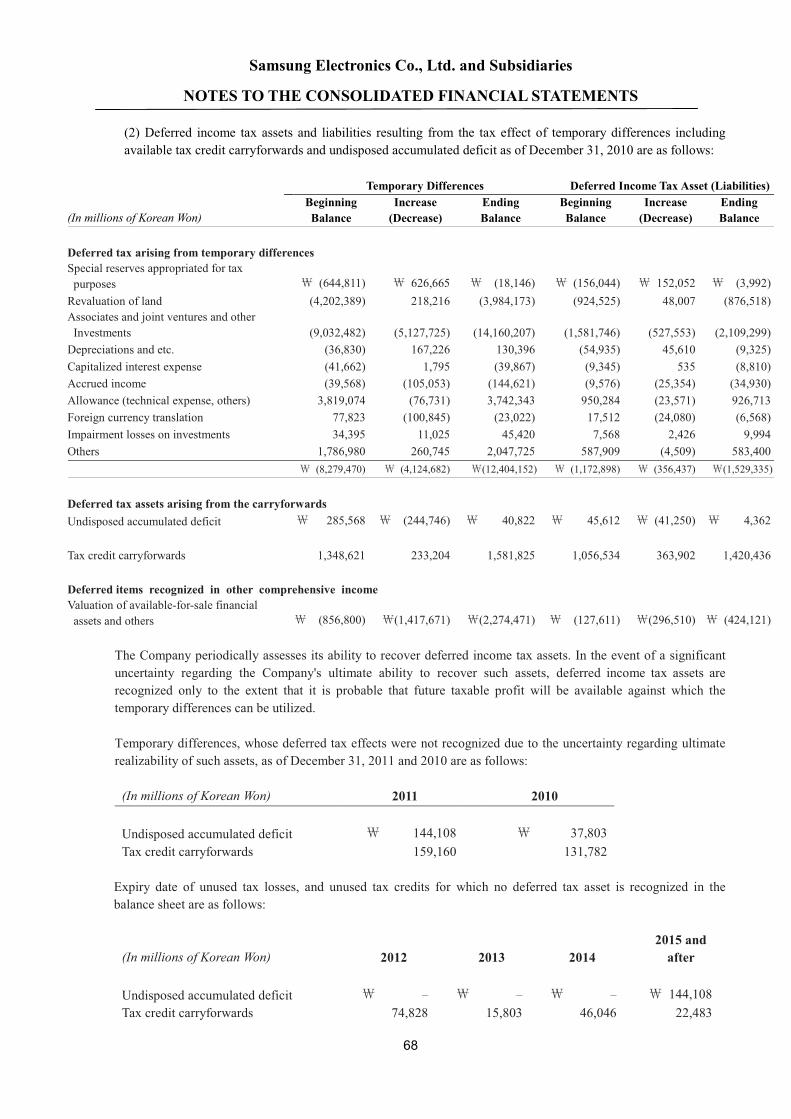
Samsung Electronics Co., Ltd. and Subsidiaries
NOTES TO THE CONSOLIDATED FINANCIAL STATEMENTS
68
(2) Deferred income tax assets and liabilities resulting from the tax effect of temporary differences includingavailable tax credit carryforwards and undisposed accumulated deficit as of December 31, 2010 are as follows:
Temporary Differences Deferred Income Tax Asset (Liabilities)
(In millions of Korean Won)BeginningBalance
Increase(Decrease)
EndingBalance
BeginningBalance
Increase(Decrease)
EndingBalance
Deferred tax arising from temporary differencesSpecial reserves appropriated for taxpurposes (644,811) 626,665 (18,146) (156,044) 152,052 (3,992)Revaluation of land (4,202,389) 218,216 (3,984,173) (924,525) 48,007 (876,518)Associates and joint ventures and otherInvestments (9,032,482) (5,127,725) (14,160,207) (1,581,746) (527,553) (2,109,299)Depreciations and etc. (36,830) 167,226 130,396 (54,935) 45,610 (9,325)Capitalized interest expense (41,662) 1,795 (39,867) (9,345) 535 (8,810)Accrued income (39,568) (105,053) (144,621) (9,576) (25,354) (34,930)Allowance (technical expense, others) 3,819,074 (76,731) 3,742,343 950,284 (23,571) 926,713Foreign currency translation 77,823 (100,845) (23,022) 17,512 (24,080) (6,568)Impairment losses on investments 34,395 11,025 45,420 7,568 2,426 9,994Others 1,786,980 260,745 2,047,725 587,909 (4,509) 583,400
(8,279,470) (4,124,682) (12,404,152) (1,172,898) (356,437) (1,529,335)
Deferred tax assets arising from the carryforwardsUndisposed accumulated deficit 285,568 (244,746) 40,822 45,612 (41,250) 4,362
Tax credit carryforwards 1,348,621 233,204 1,581,825 1,056,534 363,902 1,420,436
Deferred items recognized in other comprehensive incomeValuation of available-for-sale financialassets and others (856,800) (1,417,671) (2,274,471) (127,611) (296,510) (424,121)
The Company periodically assesses its ability to recover deferred income tax assets. In the event of a significantuncertainty regarding the Company's ultimate ability to recover such assets, deferred income tax assets arerecognized only to the extent that it is probable that future taxable profit will be available against which thetemporary differences can be utilized.
Temporary differences, whose deferred tax effects were not recognized due to the uncertainty regarding ultimaterealizability of such assets, as of December 31, 2011 and 2010 are as follows:
(In millions of Korean Won) 2011 2010
Undisposed accumulated deficit 144,108 37,803Tax credit carryforwards 159,160 131,782
Expiry date of unused tax losses, and unused tax credits for which no deferred tax asset is recognized in thebalance sheet are as follows:
(In millions of Korean Won) 2012 2013 20142015 andafter
Undisposed accumulated deficit – – – 144,108Tax credit carryforwards 74,828 15,803 46,046 22,483

Samsung Electronics Co., Ltd. and Subsidiaries
NOTES TO THE CONSOLIDATED FINANCIAL STATEMENTS
69
D) The amount of income tax relating to each component of other comprehensive income is as follows:
(In millions of Korean Won) 2011 2010
Gain and loss on valuation of available-for-sale financial assets (340,760) (449,408)Foreign currency translation adjustment, 22,708 25,287Total (318,052) (424,121)
E) The analysis of deferred tax assets and deferred tax liabilities is as follows:
(In millions of Korean Won) 2011 2010
Current 2,869,404 2,786,728Non-current (3,588,769) (3,315,386)Total (719,365) (528,658)
28. Earnings per share
Basic earnings per share for the years ended December 31, 2011 and 2010, are calculated as follows:
(In millions of Korean Won) 2011 2010
Net income as reported on the statements of income 13,359,192 15,799,035Net income available for common stock 11,592,946 13,702,618Weighted-average number of common shares outstanding (inthousands) 130,152 129,280
Basic earnings per share (in Korean Won) 89,073 105,992
(In millions of Korean Won) 2011 2010
Net income as reported on the statements of income 13,359,192 15,799,035Net income available for preferred stock 1,766,246 2,096,417Weighted-average number of preferred shares outstanding(in thousands) 19,854 19,854
Basic earnings per preferred share (in Korean Won) 88,963 105,592
Diluted earnings per share is calculated by adjusting the weighted average number of ordinary sharesoutstanding to assume conversion of all dilutive potential ordinary shares. The company has one category ofdilutive potential ordinary shares: Stock options. A calculation is done to determine the number of shares thatcould have been acquired at fair value (determined as the average annual market share price of the company’sshares) based on the monetary value of the subscription rights attached to outstanding share options. The numberof shares calculated as above is compared with the number of shares that would have been issued assuming theexercise of the share options.
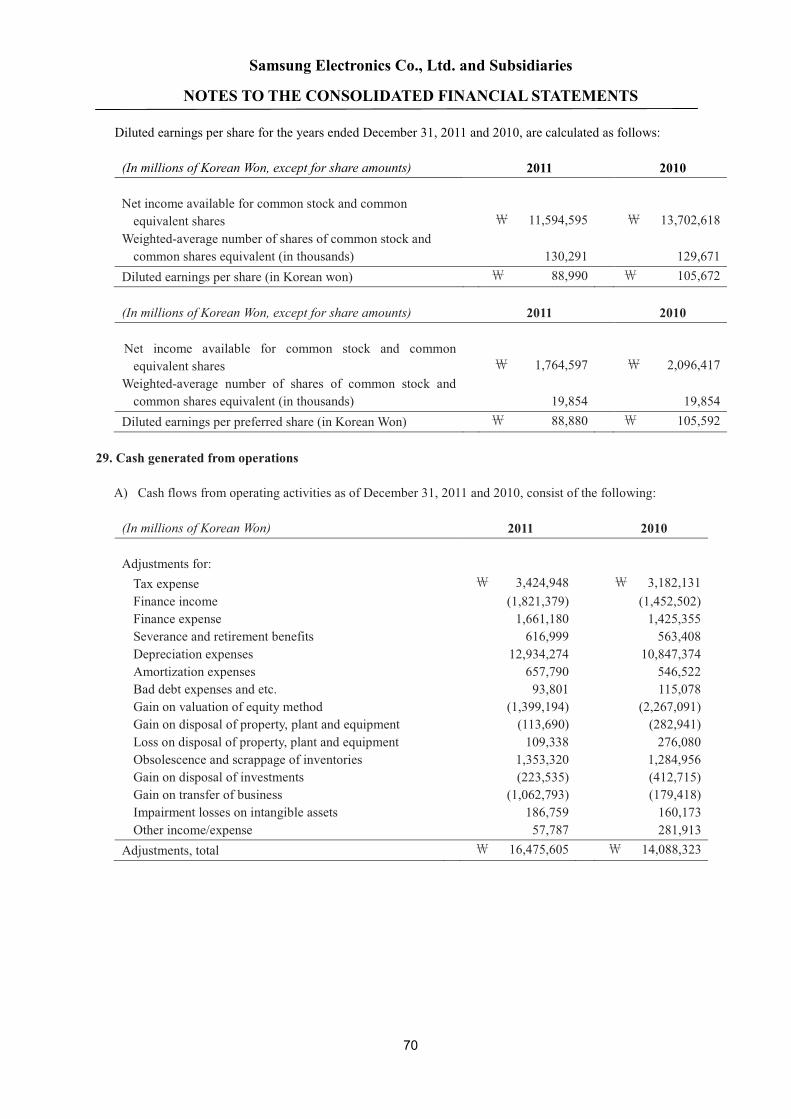
Samsung Electronics Co., Ltd. and Subsidiaries
NOTES TO THE CONSOLIDATED FINANCIAL STATEMENTS
70
Diluted earnings per share for the years ended December 31, 2011 and 2010, are calculated as follows:
(In millions of Korean Won, except for share amounts) 2011 2010
Net income available for common stock and commonequivalent shares 11,594,595 13,702,618
Weighted-average number of shares of common stock andcommon shares equivalent (in thousands) 130,291 129,671
Diluted earnings per share (in Korean won) 88,990 105,672
(In millions of Korean Won, except for share amounts) 2011 2010
Net income available for common stock and commonequivalent shares 1,764,597 2,096,417
Weighted-average number of shares of common stock andcommon shares equivalent (in thousands) 19,854 19,854
Diluted earnings per preferred share (in Korean Won) 88,880 105,592
29. Cash generated from operations
A) Cash flows from operating activities as of December 31, 2011 and 2010, consist of the following:
(In millions of Korean Won) 2011 2010
Adjustments for:Tax expense 3,424,948 3,182,131Finance income (1,821,379) (1,452,502)Finance expense 1,661,180 1,425,355Severance and retirement benefits 616,999 563,408Depreciation expenses 12,934,274 10,847,374Amortization expenses 657,790 546,522Bad debt expenses and etc. 93,801 115,078Gain on valuation of equity method (1,399,194) (2,267,091)Gain on disposal of property, plant and equipment (113,690) (282,941)Loss on disposal of property, plant and equipment 109,338 276,080Obsolescence and scrappage of inventories 1,353,320 1,284,956Gain on disposal of investments (223,535) (412,715)Gain on transfer of business (1,062,793) (179,418)Impairment losses on intangible assets 186,759 160,173Other income/expense 57,787 281,913
Adjustments, total 16,475,605 14,088,323

Samsung Electronics Co., Ltd. and Subsidiaries
NOTES TO THE CONSOLIDATED FINANCIAL STATEMENTS
71
(In millions of Korean Won) 2011 2010
Changes in assets and liabilities:Increase in trade receivables (2,015,177) (1,798,135)Increase in other receivables (181,613) (137,460)Decrease/(Increase) in advances (147,387) 242,472Increase in prepaid expenses (27,432) (1,841,462)Increase in inventories (3,919,683) (4,812,756)Increase in trade payables 750,048 1,134,781Increase in other payables 375,478 1,280,376(Decrease)/Increase in advance received 548,416 (386,029)Increase in withholdings 556,563 192,849Increase in accrued expenses 508,657 1,136,351Utilization of provisions 722,421 (201,550)Payment of severance benefits (256,261) (555,084)Increase in severance benefit deposit (531,743) (135,684)Others (439,632) 213,296
Changes in net working capital, total (4,057,345) (5,668,035)
B) Significant transactions not affecting cash flows for the years ended, 2011 and 2010, are as follows:
(In millions of Korean Won) 2011 2010
Valuation of available-for-sale financial assets (559,831) 1,193,297Reclassification of construction-in-progress andmachinery-in-transit to other property, plant andequipment accounts 22,530,787 14,351,744Increase in share of associates and joint venturesaccumulated other comprehensive income (113,898) 387,457Net assets acquired from business combination – 1,043,554Net assets acquired in transfer of business 788,454 –
C) The company reported on a net basis cash receipts and payments arising from transactions occurringfrequently and short-term financial instruments, loans, borrowings.
D) Among the net cash used in investing activities, cash outflows from transfer of business are aroused by salesof assets and liabilities of Solar battery business and the HDD business.

Samsung Electronics Co., Ltd. and Subsidiaries
NOTES TO THE CONSOLIDATED FINANCIAL STATEMENTS
72
30. Financial risk management
Financial risk factors
The Company is exposed to credit risk, liquidity risk and market risk. Market risk arises from currency risk,interest rate risk and fair value risk associated with investments. The Company has a risk management program inplace to monitor and actively manage such risks.
Also, financial risk management officers are dispatched to the regional head quarters of each area includingUnited States of America, England, Singapore, China, Japan, and Brazil to run and operate a local financial centerfor global financial risk management.
The Company’s financial assets that are under financial risk management are composed of cash and cashequivalents, short-term financial instruments, available-for-sale financial assets, trade and other receivables andother financial assets. The Company’s financial liabilities under financial risk management are composed of tradeand other payables, borrowings and debentures and other financial liabilities.
A) Market risk
(1) Foreign exchange risk
The Company is exposed to foreign exchange risk arising from various currency exposures, primarily withrespect to the United States of America, European Union, Japan, other Asian countries and South America.Revenues and expenses arise from foreign currency transactions and exchange positions, and the most widelyused currencies are the US Dollar, EU’s EURO, Japanese Yen and Chinese Yuan. Foreign exchange riskmanagement of the Company is carried out by both SEC and its subsidiaries. To minimize foreign exchange riskarising from operating activities, the Company’s foreign exchange management policy requires all normalbusiness transactions to be in local currency, or cash- in currency be matched up with cash-out currency. TheCompany’s foreign risk management policy also defines foreign exchange risk, measuring period, controllingresponsibilities, management procedures, hedging period and hedge ratio very specifically.
The Company limits all speculative foreign exchange transactions and operates a system to manage receivablesand payables denominated in foreign currency. It evaluates, manages and reports foreign currency exposures toreceivables and payables.
A summary of foreign assets and liabilities of the Company as of December 31, 2011 and 2010 is as follows:
(In millions ofKorean Won)
2011 2010USD EUR JPY Other USD EUR JPY Other
Financial Asset 12,310,076 660,482 568,204 1,288,309 10,963,970 825,356 221,197 906,328FinancialLiabilities 11,092,528 524,075 1,064,553 197,362 10,073,117 768,638 395,491 200,641
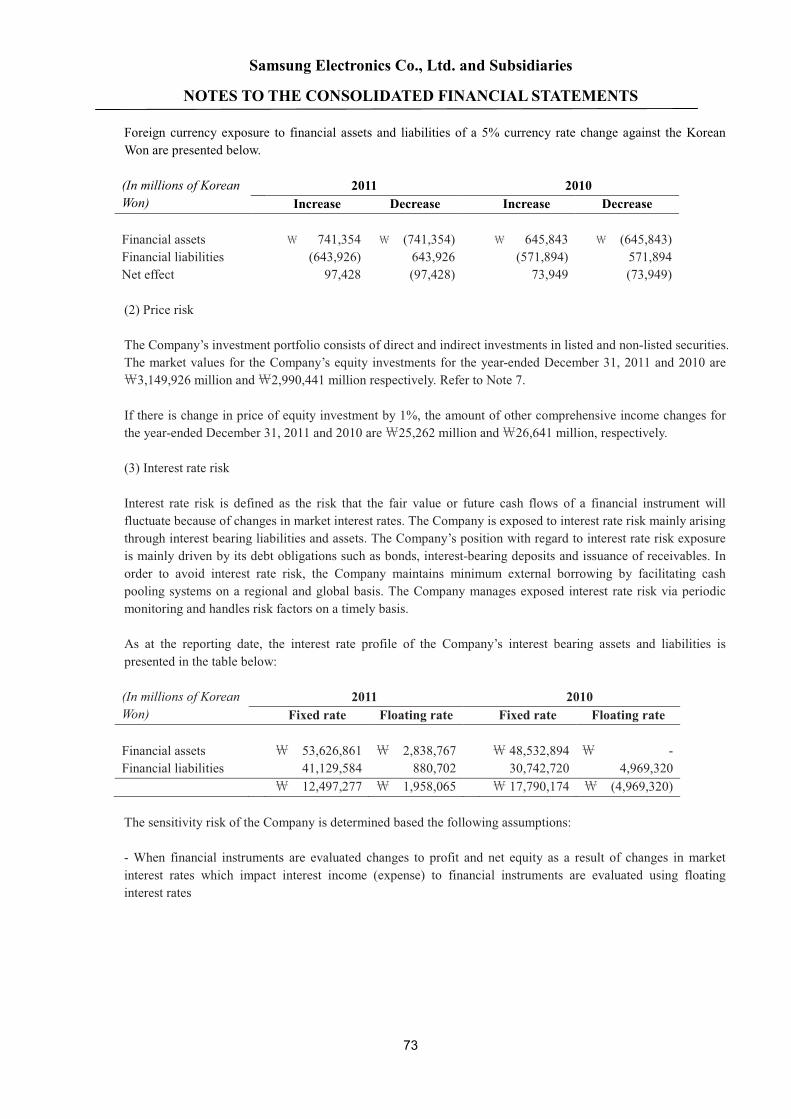
Samsung Electronics Co., Ltd. and Subsidiaries
NOTES TO THE CONSOLIDATED FINANCIAL STATEMENTS
73
Foreign currency exposure to financial assets and liabilities of a 5% currency rate change against the KoreanWon are presented below.
(In millions of KoreanWon)
2011 2010Increase Decrease Increase Decrease
Financial assets 741,354 (741,354) 645,843 (645,843)Financial liabilities (643,926) 643,926 (571,894) 571,894Net effect 97,428 (97,428) 73,949 (73,949)
(2) Price risk
The Company’s investment portfolio consists of direct and indirect investments in listed and non-listed securities.The market values for the Company’s equity investments for the year-ended December 31, 2011 and 2010 are3,149,926 million and 2,990,441 million respectively. Refer to Note 7.
If there is change in price of equity investment by 1%, the amount of other comprehensive income changes forthe year-ended December 31, 2011 and 2010 are 25,262 million and 26,641 million, respectively.
(3) Interest rate risk
Interest rate risk is defined as the risk that the fair value or future cash flows of a financial instrument willfluctuate because of changes in market interest rates. The Company is exposed to interest rate risk mainly arisingthrough interest bearing liabilities and assets. The Company’s position with regard to interest rate risk exposureis mainly driven by its debt obligations such as bonds, interest-bearing deposits and issuance of receivables. Inorder to avoid interest rate risk, the Company maintains minimum external borrowing by facilitating cashpooling systems on a regional and global basis. The Company manages exposed interest rate risk via periodicmonitoring and handles risk factors on a timely basis.
As at the reporting date, the interest rate profile of the Company’s interest bearing assets and liabilities ispresented in the table below:
(In millions of KoreanWon)
2011 2010Fixed rate Floating rate Fixed rate Floating rate
Financial assets 53,626,861 2,838,767 48,532,894 -Financial liabilities 41,129,584 880,702 30,742,720 4,969,320
12,497,277 1,958,065 17,790,174 (4,969,320)
The sensitivity risk of the Company is determined based the following assumptions:
- When financial instruments are evaluated changes to profit and net equity as a result of changes in marketinterest rates which impact interest income (expense) to financial instruments are evaluated using floatinginterest rates
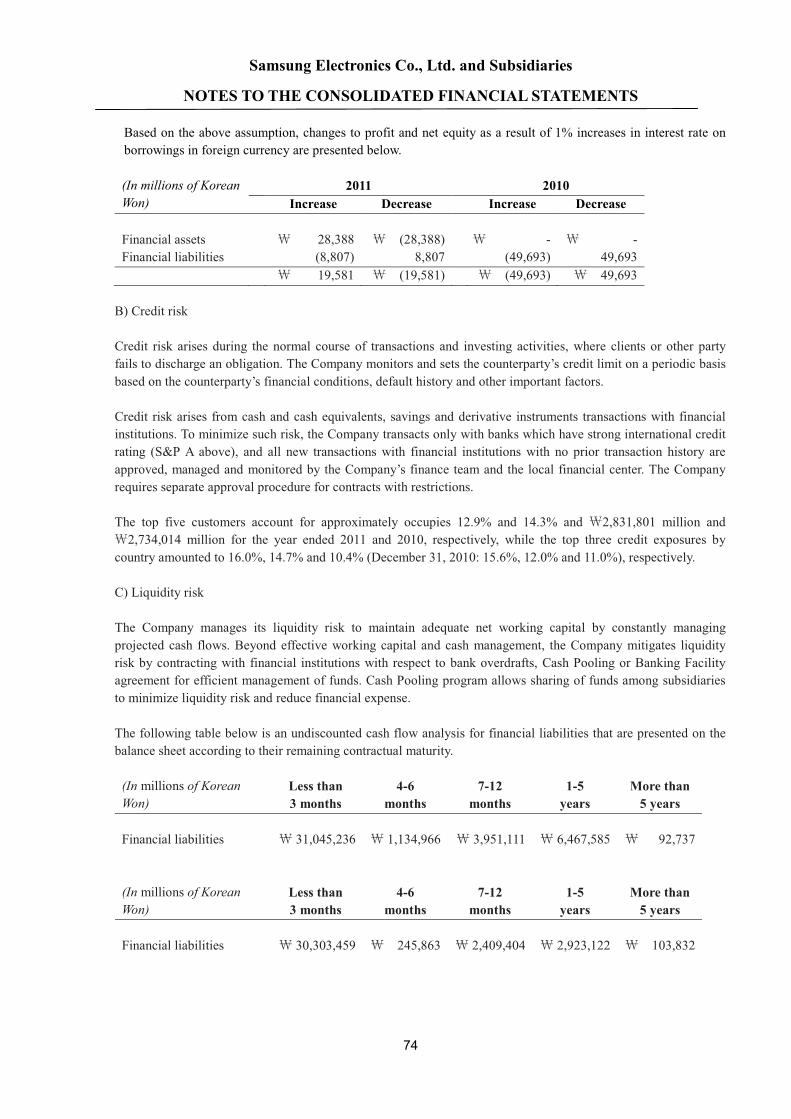
Samsung Electronics Co., Ltd. and Subsidiaries
NOTES TO THE CONSOLIDATED FINANCIAL STATEMENTS
74
Based on the above assumption, changes to profit and net equity as a result of 1% increases in interest rate onborrowings in foreign currency are presented below.
(In millions of KoreanWon)
2011 2010Increase Decrease Increase Decrease
Financial assets 28,388 (28,388) - -Financial liabilities (8,807) 8,807 (49,693) 49,693
19,581 (19,581) (49,693) 49,693
B) Credit risk
Credit risk arises during the normal course of transactions and investing activities, where clients or other partyfails to discharge an obligation. The Company monitors and sets the counterparty’s credit limit on a periodic basisbased on the counterparty’s financial conditions, default history and other important factors.
Credit risk arises from cash and cash equivalents, savings and derivative instruments transactions with financialinstitutions. To minimize such risk, the Company transacts only with banks which have strong international creditrating (S&P A above), and all new transactions with financial institutions with no prior transaction history areapproved, managed and monitored by the Company’s finance team and the local financial center. The Companyrequires separate approval procedure for contracts with restrictions.
The top five customers account for approximately occupies 12.9% and 14.3% and 2,831,801 million and2,734,014 million for the year ended 2011 and 2010, respectively, while the top three credit exposures by
country amounted to 16.0%, 14.7% and 10.4% (December 31, 2010: 15.6%, 12.0% and 11.0%), respectively.
C) Liquidity risk
The Company manages its liquidity risk to maintain adequate net working capital by constantly managingprojected cash flows. Beyond effective working capital and cash management, the Company mitigates liquidityrisk by contracting with financial institutions with respect to bank overdrafts, Cash Pooling or Banking Facilityagreement for efficient management of funds. Cash Pooling program allows sharing of funds among subsidiariesto minimize liquidity risk and reduce financial expense.
The following table below is an undiscounted cash flow analysis for financial liabilities that are presented on thebalance sheet according to their remaining contractual maturity.
(In millions of KoreanWon)
Less than3 months
4-6months
7-12months
1-5years
More than5 years
Financial liabilities 31,045,236 1,134,966 3,951,111 6,467,585 92,737
(In millions of KoreanWon)
Less than3 months
4-6months
7-12months
1-5years
More than5 years
Financial liabilities 30,303,459 245,863 2,409,404 2,923,122 103,832

Samsung Electronics Co., Ltd. and Subsidiaries
NOTES TO THE CONSOLIDATED FINANCIAL STATEMENTS
75
D) Capital risk management
The object of capital management is to maintain sound capital structure. Consistent with others in the industry, theCompany monitors capital on the basis of the debt to equity ratio. This ratio is calculated as total liabilities dividedby equity based on the consolidated financial statements.
During 2011, the Company’s strategy was to maintain a reliable credit rating. The Company has maintained an Acredit rating for long term debt from S&P and A1from Moody’s, respectively throughout the period. The gearingratios at 31 December 2011 and 2010 were as follows:
(In millions of Korean Won) 2011 2010
Total liabilities 53,785,931 44,939,653Total equity 101,845,323 89,349,091Gearing ratio 52.8% 50.3%
31. Segment Information
The chief operating decision maker has been identified as the Management Committee. The ManagementCommittee is responsible for making strategic decisions based on review of the group’s internal reporting. Themanagement committee has determined the operating segments based on these reports.
The Management Committee reviews operating profit of each operating segment in order to assess performanceand make decisions about resources to be allocated to the segment.
The operating segments are product based and include Digital media, Telecommunication, Semiconductor, LCDand others.
The segment information provided to the Management committee for the reportable segments for the year ended31 December 2011 and 2010, is as follows:
2011 SET Device
Total1 EliminationConsoli-dated
(In millions ofKorean Won) Total1 Digital Media
Tele-Communication Total1
Semiconductor LCD
Total segmentRevenue 246,168,779 132,067,414 113,263,888 131,926,525 71,305,465 61,648,667 378,693,504 (213,691,733) 165,001,771
Inter-segmentRevenue (131,313,977) (73,145,237) (57,729,846) (66,373,586) (34,315,914) (32,405,595) (213,691,733) 213,691,733 -
Revenue fromexternalcustomers 114,854,802 58,922,177 55,534,042 65,552,939 36,989,551 29,243,072 165,001,771 - 165,001,771
Depreciation (1,138,951) (644,759) (296,138) (11,715,044) (7,678,022) (4,027,032) (12,934,274) - (12,934,274)Amortization (192,114) (18,862) (149,325) (204,109) (143,810) (61,943) (657,790) - (657,790)Operatingprofit(loss) 9,706,360 1,412,949 8,269,798 6,588,438 7,339,206 (749,339) 16,249,717 - 16,249,717
1 The total amount includes others not composing operating segments.
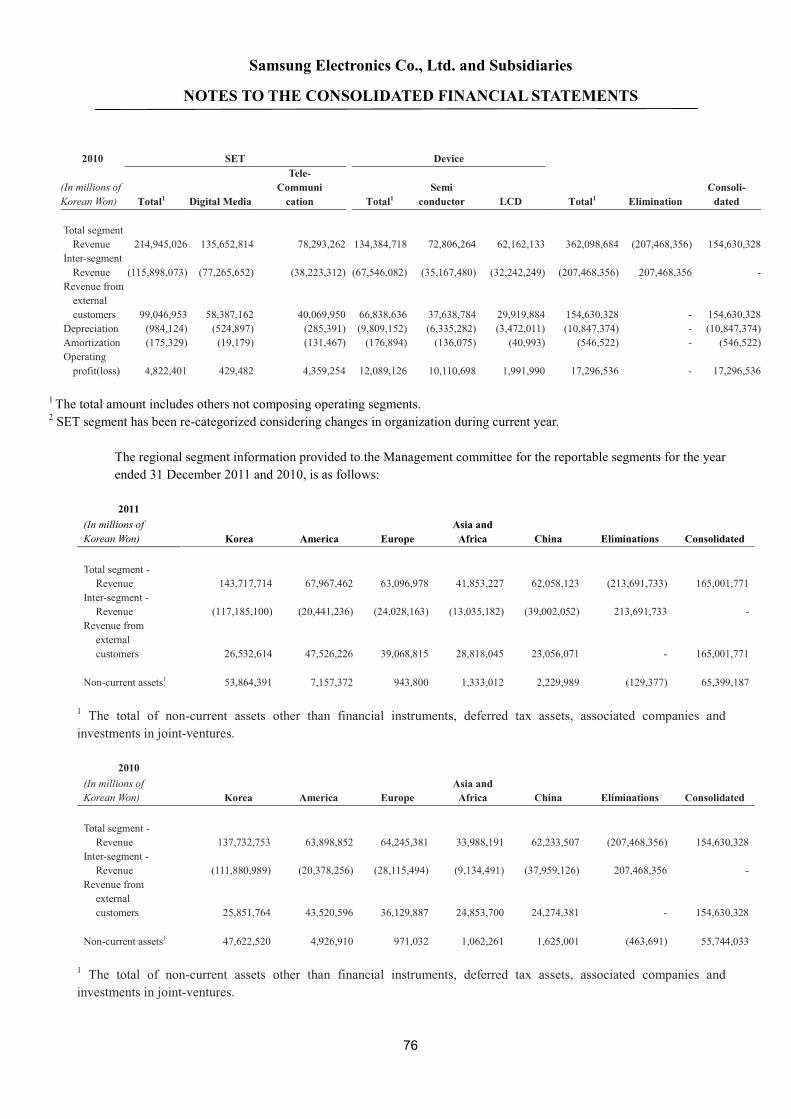
Samsung Electronics Co., Ltd. and Subsidiaries
NOTES TO THE CONSOLIDATED FINANCIAL STATEMENTS
76
1 The total amount includes others not composing operating segments.2 SET segment has been re-categorized considering changes in organization during current year.
The regional segment information provided to the Management committee for the reportable segments for the yearended 31 December 2011 and 2010, is as follows:
2011
Korea America EuropeAsia andAfrica China Eliminations Consolidated
(In millions ofKorean Won)
Total segment -Revenue 143,717,714 67,967,462 63,096,978 41,853,227 62,058,123 (213,691,733) 165,001,771
Inter-segment -Revenue (117,185,100) (20,441,236) (24,028,163) (13,035,182) (39,002,052) 213,691,733 -
Revenue fromexternalcustomers 26,532,614 47,526,226 39,068,815 28,818,045 23,056,071 - 165,001,771
Non-current assets1 53,864,391 7,157,372 943,800 1,333,012 2,229,989 (129,377) 65,399,187
1 The total of non-current assets other than financial instruments, deferred tax assets, associated companies andinvestments in joint-ventures.
2010
Korea America EuropeAsia andAfrica China Eliminations Consolidated
(In millions ofKorean Won)
Total segment -Revenue 137,732,753 63,898,852 64,245,381 33,988,191 62,233,507 (207,468,356) 154,630,328
Inter-segment -Revenue (111,880,989) (20,378,256) (28,115,494) (9,134,491) (37,959,126) 207,468,356 -
Revenue fromexternalcustomers 25,851,764 43,520,596 36,129,887 24,853,700 24,274,381 - 154,630,328
Non-current assets1 47,622,520 4,926,910 971,032 1,062,261 1,625,001 (463,691) 55,744,033
1 The total of non-current assets other than financial instruments, deferred tax assets, associated companies andinvestments in joint-ventures.
2010 SET Device
Total1 EliminationConsoli-dated
(In millions ofKorean Won) Total1 Digital Media
Tele-Communication Total1
Semiconductor LCD
Total segmentRevenue 214,945,026 135,652,814 78,293,262 134,384,718 72,806,264 62,162,133 362,098,684 (207,468,356) 154,630,328
Inter-segmentRevenue (115,898,073) (77,265,652) (38,223,312) (67,546,082) (35,167,480) (32,242,249) (207,468,356) 207,468,356 -
Revenue fromexternalcustomers 99,046,953 58,387,162 40,069,950 66,838,636 37,638,784 29,919,884 154,630,328 - 154,630,328
Depreciation (984,124) (524,897) (285,391) (9,809,152) (6,335,282) (3,472,011) (10,847,374) - (10,847,374)Amortization (175,329) (19,179) (131,467) (176,894) (136,075) (40,993) (546,522) - (546,522)Operatingprofit(loss) 4,822,401 429,482 4,359,254 12,089,126 10,110,698 1,991,990 17,296,536 - 17,296,536

Samsung Electronics Co., Ltd. and Subsidiaries
NOTES TO THE CONSOLIDATED FINANCIAL STATEMENTS
77
32. Related parties
A) Associates
The principal associate companies are Samsung SDI, Samsung Electro-mechanics, Samsung SDS, SamsungTechwin and Samsung Card.
Transactions with associates for the years ended December 31, 2011 and 2010, and the related receivables andpayables as of December 31, 2011 and 2010, are as follows:
(In millions of Korean Won) 2011 2010
TransactionsSales 1,695,298 1,503,642Purchases 8,634,597 7,262,621
Receivables and PayablesReceivables 225,076 183,812Payables 1,168,952 816,473
B) Joint ventures
The principal joint venture companies are Samsung Corning Precision Materials, and Samsung Siltronic Wafer.
Transactions with joint venture partners for the years ended December 31, 2011 and 2010, and the relatedreceivables and payables as of December 31, 2011 and 2010, are as follows:
(In millions of Korean Won) 2011 2010
TransactionsSales 7,195 12,690Purchases 3,210,831 3,212,732
Receivables and PayablesReceivables 6,379 131Payables 379,944 126,906
C) Other related parties
Samsung Everland and Samsung Petrochemical, etc. are defined as related parties for the company.
Transactions with other related parties for the years ended December 31, 2011 and 2010, and the relatedreceivables and payables as of December 31, 2011 and 2010, are as follows:
(In millions of Korean Won) 2011 2010
TransactionsSales 85,907 598,795Purchases 655,062 478,122
Receivables and PayablesReceivables 244,411 233,649Payables 172,872 109,875
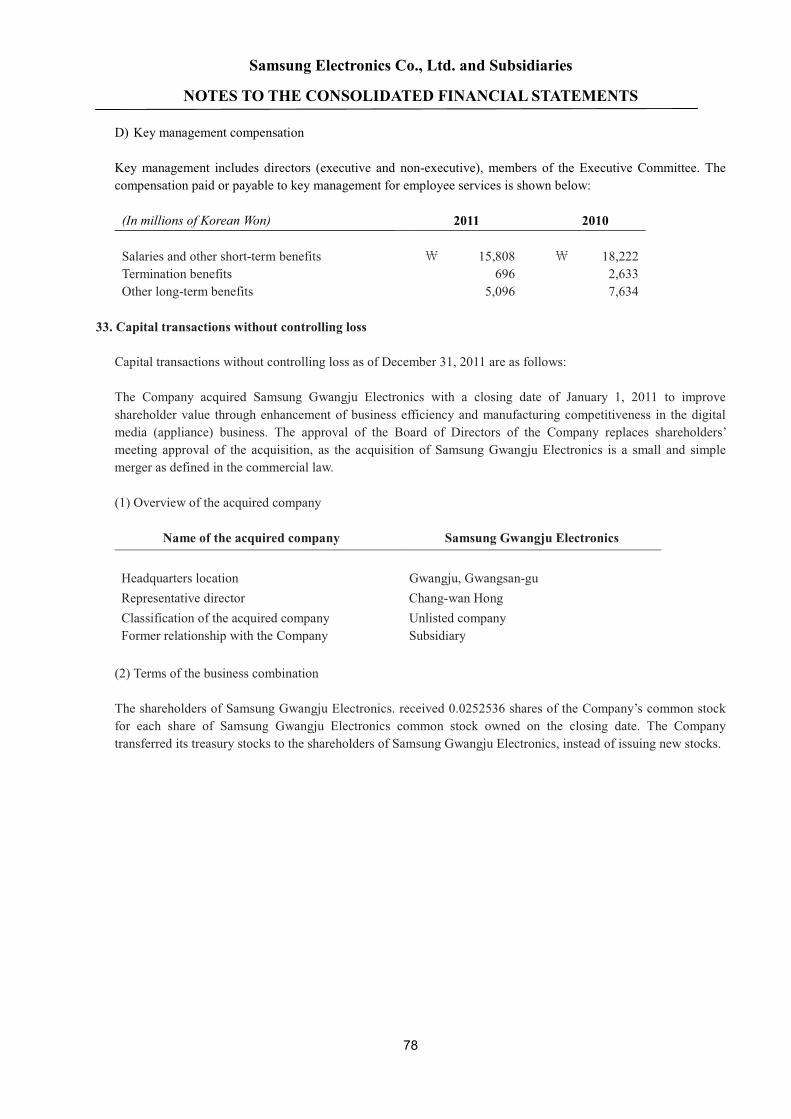
Samsung Electronics Co., Ltd. and Subsidiaries
NOTES TO THE CONSOLIDATED FINANCIAL STATEMENTS
78
D) Key management compensation
Key management includes directors (executive and non-executive), members of the Executive Committee. Thecompensation paid or payable to key management for employee services is shown below:
(In millions of Korean Won) 2011 2010
Salaries and other short-term benefits 15,808 18,222Termination benefits 696 2,633Other long-term benefits 5,096 7,634
33. Capital transactions without controlling loss
Capital transactions without controlling loss as of December 31, 2011 are as follows:
The Company acquired Samsung Gwangju Electronics with a closing date of January 1, 2011 to improveshareholder value through enhancement of business efficiency and manufacturing competitiveness in the digitalmedia (appliance) business. The approval of the Board of Directors of the Company replaces shareholders’meeting approval of the acquisition, as the acquisition of Samsung Gwangju Electronics is a small and simplemerger as defined in the commercial law.
(1) Overview of the acquired company
Name of the acquired company Samsung Gwangju Electronics
Headquarters location Gwangju, Gwangsan-guRepresentative director Chang-wan HongClassification of the acquired company Unlisted companyFormer relationship with the Company Subsidiary
(2) Terms of the business combination
The shareholders of Samsung Gwangju Electronics. received 0.0252536 shares of the Company’s common stockfor each share of Samsung Gwangju Electronics common stock owned on the closing date. The Companytransferred its treasury stocks to the shareholders of Samsung Gwangju Electronics, instead of issuing new stocks.

Samsung Electronics Co., Ltd. and Subsidiaries
NOTES TO THE CONSOLIDATED FINANCIAL STATEMENTS
79
34. Business Combination
Business combinations as of December 31, 2011 are as follows:
A) Acquisition of Samsung Medison
The Company acquired 43.5% shares of Samsung Medison Co.,Ltd. with a closing date of February 16, 2011, andadditionally acquired 22.3% shares of Samsung Medison Co.,Ltd. with closing date of April 29, 2011.
(1) Overview of the acquired company
Name of the acquired company Samsung Medison
Headquarters location Gangwon-do, Hongchen-gunRepresentative director Sang-won BangClassification of the acquired company Unlisted companyAfter acquision relationship with the Company Subsidiary
(2) Purchase price allocation
ClassificationAmount
(In millions of Korean Won)
I. Considerations transferred 436,965II. Identifiable assets and liabilitiesCash and cash equivalents 42,287Trade and other receivables 66,471Inventories 57,880Property, plant, and equipment 112,102Intangible assets 331,433Other assets 42,708Trade and other payables (39,161)Borrowings and loans (88,236)Retirement benefit obligation (3,306)Provisions (8,506)Deferred income tax liabilities (71,157)Other liabilities (22,450)
Total 420,065III. Non-controlling interests (57,447)IV. Goodwill 74,347
Had Samsung Medison been consolidated from January 1, 2011, the consolidated for the one-year periodwould show revenue of 57,023 million and loss of 12,219 million, additionally.
The revenue included in the financial statement of income statement since the date of acquisition contributedby Samsung Medison was 83,304 million and profit of 1,491 million over the period.

Samsung Electronics Co., Ltd. and Subsidiaries
NOTES TO THE CONSOLIDATED FINANCIAL STATEMENTS
80
B) Acquisition of Grandis
Samsung Information Systems America acquired Grandis with a closing date of July 22, 2011.
(1) Overview of the acquired company
Name of the acquired company Grandis
Headquarters location Milpitas, CARepresentative director Farhad TabriziClassification of the acquired company Unlisted company
(2) Purchase price allocation
ClassificationAmount
(In millions of Korean Won)
I. Considerations transferred 81,050II. Identifiable assets and liabilitiesCash and cash equivalents 269Trade and other receivables 367Property, plant, and equipment 2,129Intangible assets 57,682Other assets 83Trade and other payables (527)Deferred income tax liabilities (18,836)
Total 41,167III. Goodwill 39,883
Had Grandis been consolidated from January 1, 2011, the consolidated for the one-year period would showloss of 1,600 million, additionally.
The revenue included in the financial statement of income statement since the date of acquisition contributedby Grandis was 2,668 million and profit of 600 million over the period.

Samsung Electronics Co., Ltd. and Subsidiaries
NOTES TO THE CONSOLIDATED FINANCIAL STATEMENTS
81
35. Events After the Reporting Period
A) Merger of Samsung LED
The merger of Samsung LED with SEC was approved by the Board of Directors on December 26, 2011. Theapproval of the Board of Directors of the Company replaces shareholders’ meeting approval of the acquisition, asthe acquisition of Samsung LED is a small and simple merger as defined in the commercial law.
The shareholders of Samsung LED will receive 0.0134934 shares of the Company’s common stock for each shareof Samsung LED common stock owned on the closing date. The Company transferred its treasury stocks to theshareholders of Samsung LED.
B) Acquisition of S-LCD
The Company entered into contracts to acquire remaining issued shares of S-LCD from Sony on December 26,2011.
The Company acquired shares of S-LCD with a closing date of January 19, 2011.
Name of the acquired company S-LCD
(In millions of Korean Won)Purchase price 1,067,082Shares 329,999,999 sharesPercentage of shareholding after acquisition 100 %
C) Spin-Off of LCD division
The Company’s Board of Directors approved the spin-off of the Company’s LCD division on February 20, 2012.The shareholders will approve the spin-off on March 16, 2012, during the shareholders’ meeting.
Category DetailsCompanies subject to stock split Samsung Display Corporation1
Business LCD
1 The name of the newly established company is subject to change according to decision of shareholder’s meeting.
150,000,000 shares will be newly issued with par value of 5,000 per shares and be assigned to SEC.
Related Documents