Unipol Gruppo Finanziario Consolidated Interim Financial Report at 3o September 2016

Welcome message from author
This document is posted to help you gain knowledge. Please leave a comment to let me know what you think about it! Share it to your friends and learn new things together.
Transcript

Unipol Gruppo FinanziarioConsolidated InterimFinancial Reportat 3o September 2016


Unipol Gruppo Finanziario Consolidated Interim Financial Report at 30 September 2016


Company bodies 4
Interim Financial Report 5
Preamble 6 Group highlights 7 Operating performance 8
Insurance Sector 8 Banking Sector 11 Real estate Sector 12 Holding and Other Businesses Sector 12
Asset and financial management 13 Shareholders’ equity 15 Technical provisions and financial liabilities 15 Business outlook 16
Consolidated Financial Statements 17
Statement of Financial Position 19 Income Statement 21 Condensed Consolidated operating Income Statement broken down by business segment 22 Statement of financial position by business segment 24
Statement of the Manager in charge of financial reporting (pursuant to Art. 154-bis of Legislative Decree 58/1998) 27
Contents
4
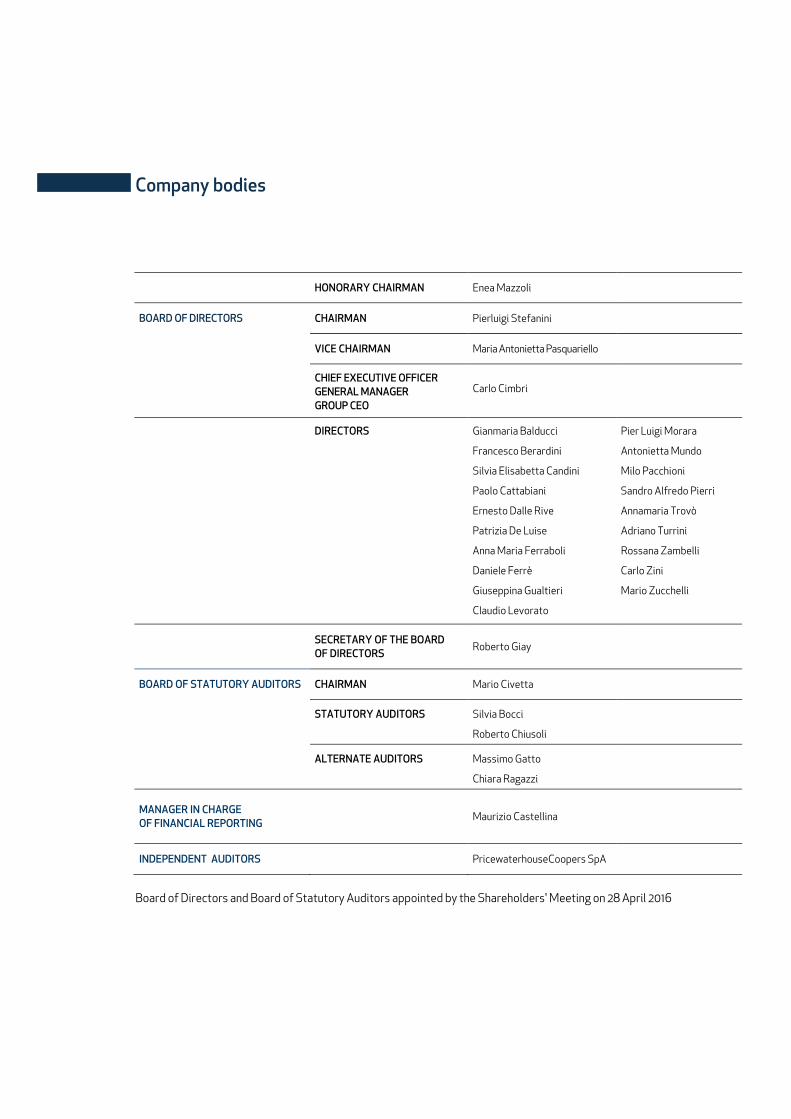
Company bodies
HONORARY CHAIRMAN Enea Mazzoli
BOARD OF DIRECTORS CHAIRMAN Pierluigi Stefanini
VICE CHAIRMAN Maria Antonietta Pasquariello
CHIEF EXECUTIVE OFFICER GENERAL MANAGER GROUP CEO
Carlo Cimbri
DIRECTORS Gianmaria Balducci Pier Luigi Morara
Francesco Berardini Antonietta Mundo
Silvia Elisabetta Candini Milo Pacchioni
Paolo Cattabiani Sandro Alfredo Pierri
Ernesto Dalle Rive Annamaria Trovò
Patrizia De Luise Adriano Turrini
Anna Maria Ferraboli Rossana Zambelli
Daniele Ferrè Carlo Zini
Giuseppina Gualtieri Mario Zucchelli
Claudio Levorato
SECRETARY OF THE BOARD OF DIRECTORS
Roberto Giay
BOARD OF STATUTORY AUDITORS CHAIRMAN Mario Civetta
STATUTORY AUDITORS Silvia Bocci
Roberto Chiusoli
ALTERNATE AUDITORS Massimo Gatto
Chiara Ragazzi
MANAGER IN CHARGE OF FINANCIAL REPORTING Maurizio Castellina
INDEPENDENT AUDITORS
PricewaterhouseCoopers SpA
Board of Directors and Board of Statutory Auditors appointed by the Shareholders' Meeting on 28 April 2016

2016
Interim Financial Report

Interim Financial Report
6
Preamble Legislative Decree 25 of 15 February 2016, in force since 18 March 2016, incorporated the new Directive 2013/50/EU (the new Transparency Directive, hereinafter also the “Directive”) by eliminating the obligation to publish the Interim Financial Report envisaged by Art. 154-ter of Legislative Decree 58/1998. However, the decree gave CONSOB the right to issue a regulation requiring the publication of additional periodic financial information after the publication of a dedicated impact analysis examining the fulfilment of the conditions laid out by the Directive. On 14 April 2016, CONSOB launched a preliminary consultation to obtain useful information to check for the fulfilment of the conditions imposed by the legislature for the purpose of exercising the delegation and, therefore, in preparation for a complete impact analysis. After that consultation, on 5 August 2016 CONSOB published a new consultation document containing the impact analysis conducted by the Commission, as well as its proposal to amend CONSOB Regulation no. 11971 prepared by the Commission with a view not to introducing additional periodic disclosure obligations, but rather to defining application principles and criteria for issuers that intend to publish information on a voluntary basis. Following this last consultation completed in September, by resolution no. 19770 dated 26 October 2016 CONSOB made the resulting amendments to the Issuer's Regulation, in particular introducing the new Article 82-ter. Based on this standard, listed companies have the right to choose whether to publish additional periodic financial information. If they do choose to publish it on a voluntary basis, they must disclose this decision to the market, specifying the information that they intend to provide, so as to ensure that the decisions adopted are clear and stable over time. Any decision to suspend publication must be justified and made public and will become effective starting from the following financial year. The regulatory amendments introduced by CONSOB Resolution no. 19770 apply starting on 2 January 2017. As a result, the UnipolSai Group decided to continue to publish a periodic quarterly disclosure on a voluntary basis temporarily for this year, 2016, merely for reasons of continuity with the past, the form and content of which are the same as disclosures of previous years. In line with the amendments made in the reference regulatory framework, starting next year the UnipolSai Group will make its quarterly financial disclosure briefer and more focused on its business. The disclosure will be provided in the form of a dedicated press release, the content of which will be amended with respect to the quarterly periodic press release published until 2016. However, the Group's interim financial report will no longer be published, and as a result the statement of financial position and income statement which are currently an integral part of the press release will not be included. Therefore, starting in 2017 the content of the voluntary quarterly financial disclosure will regard at least the main quantitative performance indicators, such as:
− Non-Life and Life premium trends; − Combined ratio; − Profit (loss) for the period; − Shareholders' equity; − Solvency II ratio.
The press release, which will also contain qualitative information regarding trends in the Group's main businesses, will be approved by the Board of Directors and published on the Group's website based on the timing set forth in the regulations previously in force.

Unipol Group - Interim Financial Report at 30 September 2016
7
Group highlights
Amounts in €m 30/9/2016 30/9/2015 31/12/2015
Non-Life direct insurance premiums 5,590 5,671 7,883
% variation (1.4) (12.5) (12.1)
Life direct insurance premiums 5,552 6,411 8,593
% variation (13.4) (6.8) (3.6)
of which Life investment products 606 693 951
% variation (12.4) 547.0 573.1
Direct insurance premiums 11,142 12,082 16,476
% variation (7.8) (9.5) (7.9)
Banking business - direct customer deposits 9,983 10,315 10,015% variation (0.3) 0.5 (2.4)
Consolidated profit (loss) 439 594 579
% variation (26.1) 37.8 14.6
Investments and cash and cash equivalents 84,451 81,377 81,840% variation 3.2 1.7 2.3
Technical provisions 64,807 62,405 63,150
% variation 2.6 0.8 2.0
Financial liabilities 16,101 15,620 15,571% variation 3.4 1.0 0.7
Shareholders' Equity attributable to the owners of the Parent 5,635 5,493 5,524% variation 2.0 (3.5) (2.9)
Solvency II ratio 137% n.a. 150%
The percentage changes in the income statement figures refer to the comparison with the ones of the corresponding period of the previous year. The percentage changes in the balance sheet refer to the comparison with figures at 31/12 of the previous year.
Alternative performance indicators1 classes 30/09/2016 30/09/2015 31/12/2015
Loss ratio - direct business (including OTI ratio) non-life 67.4% 67.6% 65.6%
Expense ratio (calculated on written premiums) - direct business non-life 28.0% 27.5% 27.9%
Combined ratio - direct business non-life 95.3% 95.0% 93.5%
Loss ratio - net of reinsurance (including OTI ratio) non-life 68.5% 69.2% 66.6%
Expense ratio (calculated on premiums earned) - net of reinsurance non-life 26.5% 25.9% 27.3%
Combined ratio - net of reinsurance (*) non-life 95.0% 95.1% 93.9%
Group pro-rata APE (amounts in €m) life 351 342 473
(*) with expense ratio calculated on premiums earned
1 These indicators are not defined by accounting rules; rather, they are calculated based on economic-financial procedures used in the sector. Loss ratio: primary indicator of the cost-effectiveness of operations of an insurance company in the Non-Life sector. This is the ratio of the cost of claims for the period to premiums for the period. OTI (Other Technical Items) ratio: ratio of the sum of the balance of other technical charges/income and the change in other technical provisions to net premiums for the period. Expense ratio: percentage indicator of the ratio of total operating expenses to premiums written as far as direct business is concerned, and the premiums as far as retained business, net of reassurance, is concerned Combined ratio: indicator that measures the balance of Non-Life technical management, represented by the sum of the loss ratio and the expense ratio. APE – Annual Premium Equivalent: the new Life business expressed in APE is a measurement of the volume of business relating to new policies and corresponds to the sum of periodic premiums of new products and one tenth of single premiums. This indicator is used to assess the business along with the in force value and the Life new business value of the Group.
Interim Financial Report
8
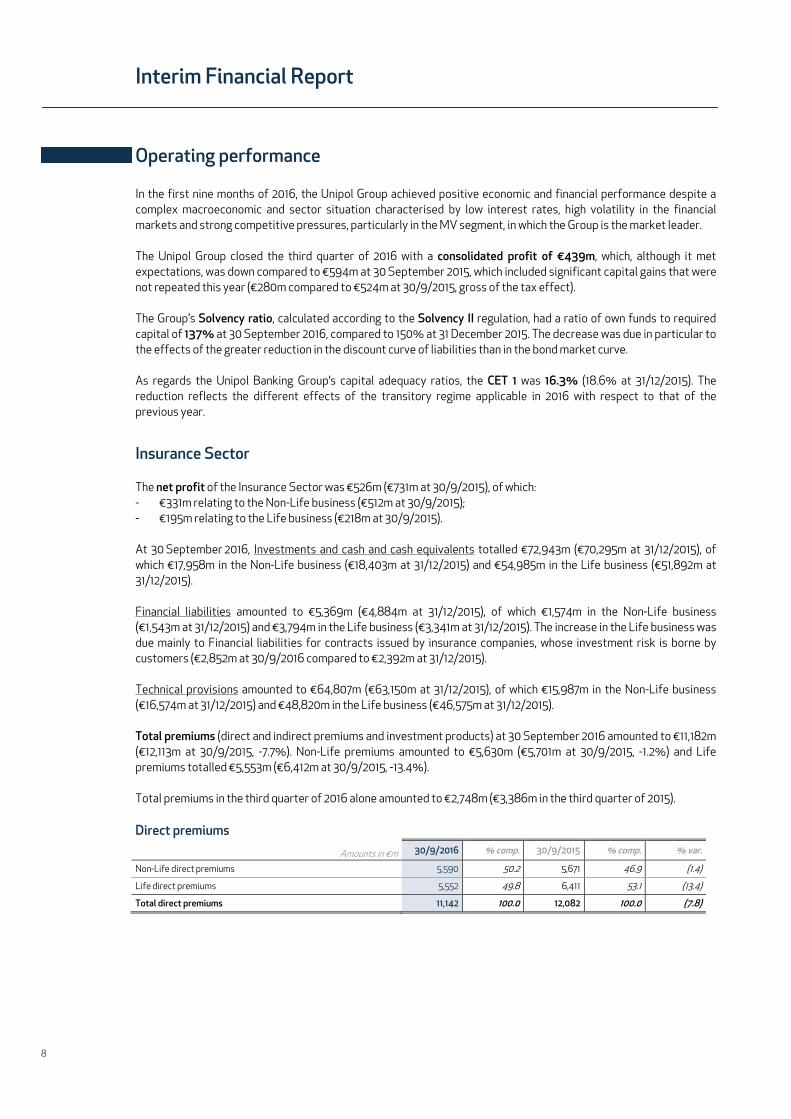
Operating performance In the first nine months of 2016, the Unipol Group achieved positive economic and financial performance despite a complex macroeconomic and sector situation characterised by low interest rates, high volatility in the financial markets and strong competitive pressures, particularly in the MV segment, in which the Group is the market leader. The Unipol Group closed the third quarter of 2016 with a consolidated profit of €439m, which, although it met expectations, was down compared to €594m at 30 September 2015, which included significant capital gains that were not repeated this year (€280m compared to €524m at 30/9/2015, gross of the tax effect). The Group’s Solvency ratio, calculated according to the Solvency II regulation, had a ratio of own funds to required capital of 137% at 30 September 2016, compared to 150% at 31 December 2015. The decrease was due in particular to the effects of the greater reduction in the discount curve of liabilities than in the bond market curve. As regards the Unipol Banking Group’s capital adequacy ratios, the CET 1 was 16.3% (18.6% at 31/12/2015). The reduction reflects the different effects of the transitory regime applicable in 2016 with respect to that of the previous year.
Insurance Sector The net profit of the Insurance Sector was €526m (€731m at 30/9/2015), of which: - €331m relating to the Non-Life business (€512m at 30/9/2015); - €195m relating to the Life business (€218m at 30/9/2015). At 30 September 2016, Investments and cash and cash equivalents totalled €72,943m (€70,295m at 31/12/2015), of which €17,958m in the Non-Life business (€18,403m at 31/12/2015) and €54,985m in the Life business (€51,892m at 31/12/2015). Financial liabilities amounted to €5,369m (€4,884m at 31/12/2015), of which €1,574m in the Non-Life business (€1,543m at 31/12/2015) and €3,794m in the Life business (€3,341m at 31/12/2015). The increase in the Life business was due mainly to Financial liabilities for contracts issued by insurance companies, whose investment risk is borne by customers (€2,852m at 30/9/2016 compared to €2,392m at 31/12/2015). Technical provisions amounted to €64,807m (€63,150m at 31/12/2015), of which €15,987m in the Non-Life business (€16,574m at 31/12/2015) and €48,820m in the Life business (€46,575m at 31/12/2015). Total premiums (direct and indirect premiums and investment products) at 30 September 2016 amounted to €11,182m (€12,113m at 30/9/2015, -7.7%). Non-Life premiums amounted to €5,630m (€5,701m at 30/9/2015, -1.2%) and Life premiums totalled €5,553m (€6,412m at 30/9/2015, -13.4%). Total premiums in the third quarter of 2016 alone amounted to €2,748m (€3,386m in the third quarter of 2015). Direct premiums
Amounts in €m 30/9/2016 % comp. 30/9/2015 % comp. % var.
Non-Life direct premiums 5,590 50.2 5,671 46.9 (1.4)
Life direct premiums 5,552 49.8 6,411 53.1 (13.4)
Total direct premiums 11,142 100.0 12,082 100.0 (7.8)

Unipol Group - Interim Financial Report at 30 September 2016
9
Indirect Premiums
Amounts in €m 30/9/2016 % comp. 30/9/2015 % comp. % var.
Non-Life premiums 39 98.9 30 96.8 32.0
Life premiums 0 1.1 1 3.2 (55.2)
Total indirect premiums 40 100.0 31 100.0 29.2
Non Life business In the Non-Life sector, actions meant to reinvigorate the product lines supported a recovery in premiums in the Non-MV segment and significant growth in the MV TPL contract portfolio, although continuous competitive pressure on rates sparked a decline in premiums for the sector, which was also reflected in total premiums. Non-Life direct premiums amounted to €5,590m at 30 September 2016 (€5,671m at 30/9/2015, -1.4%), with the following breakdown relating to the main classes:
Non-Life business direct premiums
Amounts in €m 30/9/2016 % comp. 30/9/2015 % comp. % var.
Motor vehicles - TPL and sea, lake and river (classes 10 and 12) 2,687 2,848 (5.6)
Land Vehicle Hulls (class 3) 460 450 2.2
Total premiums - Motor Vehicles 3,147 56.3 3,298 58.2 (4.6)
Accident and Health (classes 1 and 2) 908 850 6.8
Fire and Other damage to property (classes 8 and 9) 723 711 1.7
General TPL (class 13) 449 453 (0.8)
Other classes 363 359 1.2
Total premiums - Non-Motor Vehicles 2,443 43.7 2,373 41.8 3.0
Total Non-Life direct premiums 5,590 100.0 5,671 100.0 (1.4)
MV TPL premiums stood at €2,687m, down 5.6% compared to the first nine months of 2015. A slight recovery was reported in the Land Vehicle Hulls class, with premiums equal to €460m (+2.2%), while the Non-MV segment recorded premiums of €2,443m, a rise of 3%. As regards Non-Life claims, positive trends continue in the Non-MV classes, which were not significantly impacted by the serious earthquake events that took place in Central Italy in August. The MV TPL business suffered from the sharp, continuous decline in the average MV TPL premium as a result of the market situation. At 30 September 2016, the loss ratio for direct business (including the balance of other technical items) was 67.4% against 67.6% at 30 September 2015. The expense ratio of direct business was up slightly compared to the same period of the previous year (28.0% against 27.5%), reflecting the decline in premiums and the increase in commissions paid following the standardisation of pay and incentive schemes for the various agency networks that are part of UnipolSai. Overall, the Group’s combined ratio (direct business) was 95.3%, substantially in line with the ratio of 95.0% recorded at 30 September 2015.

Interim Financial Report
10
Non-Life premiums of the main Group insurance companies The Non-Life direct premiums of the UnipolSai Group totalled €5,141m (€5,252m at 30/9/2015, -2.1%). In particular, direct premiums relating to UnipolSai alone, the Group's main company, totalled €4,951m (-2.1% considering in the data at 30/9/2015 the premiums of Liguria Assicurazioni and the companies Systema and Europa Tutela Giudiziaria, incorporated on 31/1/2016 the first and on 31/12/2015 the others), of which €2,992m in the MV business (-4.3%) and €1,959m in the Non-MV business (+1.4%). The company SIAT, focusing on the Sea Vehicles segment, achieved direct premiums amounting to €87m (+16.5%). Unisalute continues to successfully expand its business model with premiums amounting to €265m, up 13.4%. The Group’s other companies, operating mostly in the MV segment, such as Linear and Arca Assicurazioni, have been impacted by competitive trends within the MV business, which are reflected in the general decline in the average premium of contracts in the portfolio. Arca Assicurazioni achieved direct premiums of €76m (+1.3%, of which -9.7% in MV and +8.3% in other classes), while Linear recorded direct premiums of €109m (€123m at 30/9/2015, including the premiums of Dialogo Assicurazioni, whose insurance company was acquired on 31/12/2015, -11.3%).
Life business In the Life business, the slowdown already seen in the second quarter of 2016 became more pronounced after the acceleration in the first quarter of the year, especially in the bancassurance sector. Within a market environment still characterised by interest rates which are extremely low or even negative in the short/medium-term, we are seeking to orient the commercial offering towards Unit and Multisegment products to improve the risk profile. Life business direct premiums amounted to a total of €5,552m (€6,411m at 30/9/2015, -13.4%), broken down as follows: Life business direct premiums
Amounts in €m 30/9/2016 % comp. 30/9/2015 % comp. % var.
Total premiums:
I - Whole and term Life insurance 4,100 73.8 3,963 61.8 3.4
III - Unit-linked/index-linked policies 781 14.1 1,654 25.8 (52.8)
IV - Health 1 0.0 1 0.0 25.2
V - Capitalisation insurance 287 5.2 448 7.0 (35.8)
VI - Pension funds 383 6.9 346 5.4 10.8
Total Life business direct premiums 5,552 100.0 6,411 100.0 (13.4)
of which Premiums (IFRS 4): I - Whole and term Life insurance 4,100 82.9 3,963 69.3 3.4
III - Unit-linked/index-linked policies 197 4.0 993 17.4 (80.1)
IV - Health 1 0.0 1 0.0 25.2
V - Capitalisation insurance 287 5.8 448 7.8 (35.8)
VI - Pension funds 360 7.3 314 5.5 14.5
Total Life business premiums 4,946 100.0 5,719 100.0 (13.5)
of which Investment products (IAS 39):
III - Unit-linked/index-linked policies 583 96.2 661 95.5 (11.8)
VI - Pension funds 23 3.8 31 4.5 (26.3)
Total Life investment products 606 100.0 693 100.0 (12.4)
New business in terms of APE, net of non-controlling interests, amounted to €351m at 30 September 2016 (€342m at 30/9/2015, +2.7%), of which €177m contributed by bancassurance companies and €174m by traditional companies.
Unipol Group - Interim Financial Report at 30 September 2016
11
Life premiums of the main Group insurance companies Performance was uneven across the Group’s main companies. In particular, the bancassurance channel, consisting of the companies of the Arca Vita Group and the Popolare Vita Group, achieved direct premiums of €3,264m against €3,902m at 30 September 2015 (-16.4%), with premiums of the Arca Group, totalling €1,653m, up 10.4% and those of the Popolare Vita Group, totalling €1,611m, down 33%. UnipolSai achieved direct premiums of €2,210m (-7.1% considering the premiums of Liguria Vita in the data at 30/9/2015). Total Life business direct premiums of the UnipolSai Group totalled €3,899m (€4,911m at 30/9/2015, -20.6%).
Banking Sector The current interest rate situation is penalising the profitability of the banking sector of the Group, which maintains a selective lending policy primarily oriented towards retail and SME customers. The margin from services component was up. The stock of gross impaired loans was down further compared to the levels seen in December 2015, due to the reduction of inflows and the management and closure of non-performing positions. On the whole, the Banking sector made a positive economic contribution to the Group result in the first nine months of the year. At 30 September 2016, the net profit of the Banking sector was €2m (€6m at 30/9/2015). At 30 September 2016, Investments and cash and cash equivalents totalled €11,228m (€11,100m at 31/12/2015), of which €9,208m in Loans to customers (€9,315m at 31/12/2015). Financial liabilities amounted to €10,428m (€10,459m at 31/12/2015), of which €9,983m in Direct premiums (€10,015m at 31/12/2015). Operating performance of Unipol Banca The direct deposits of Unipol Banca at 30 September 2016, which totalled €10bn, were down compared to 31 December 2015 (-0.3%) due to the decline in volumes associated with Unipol Group companies (-0.7%), while those from ordinary customers remained stable (+0.2%). Current accounts amounted to €7,018m, up €514m compared to 31 December 2015 (+7.9%), while the medium/long-term component, which came to €2,717m, declined by €323m (-10.6%). Indirect deposits at 30 September 2016 were equal to €50.8bn, down 0.9% compared to the end of 2015. Also in this case, the volumes associated with Unipol Group companies (-1.7%) were down, while those of ordinary customers rose by 7.7%, with growth in assets under management as well as funds under custody. At 30 September 2016, receivables from customers, gross of value adjustments, amounted to €10.3bn, down 1.6% compared to 31 December 2015 (€9.1bn net of valuation reserves, -1.2%). Gross impaired loans decreased by 3.2% and amounted to €3.8bn (€3.9bn at 31/12/2015). With regard to the indemnity agreement with Unipol, at 30 September 2016 the value of the covered portfolio was €829m (€832m at 31/12/2015). At 30 September 2016, the coverage rate of total impaired loans (excluding endorsement loans), inclusive of the provisions made by the parent Unipol, was equal to 45.29% (44.46% at 31/12/2015). The net profit of Unipol Banca at 30 September 2016 was €3m (€8m at 30/9/2015).

Interim Financial Report
12
Real estate Sector As regards the Real estate sector, operations continued to focus on the renovation of some of the portfolio's more important properties, particularly in Milan, in order to seek out opportunities to increase value or generate income. The net loss of the real estate sector at 30 September 2016, which includes only the real estate companies and their investees, was -€14m (-€66m at 30/9/2015, of which -€42m related to the former UnipolSai Real Estate, incorporated on 31/12/2015 into UnipolSai - Non-Life business, with accounting and tax effects from 1/1/2015). Investments and cash and cash equivalents of the Real Estate sector (including instrumental properties for own use) totalled €897m at 30 September 2016 (€920m at 31/12/2015) and consisted mainly of Investment property amounting to €458m (€474m at 31/12/2015) and Properties for own use totalling €347m (€348m at 31/12/2015). Financial liabilities amounted to €204m at 30 September 2016, substantially unchanged compared to 31/12/2015.
Holding and Other Businesses Sector The net loss at 30 September 2016 came to -€76m (-€77m at 30/9/2015). At 30 September 2016, Investments and cash and cash equivalents (including properties for own use of €179m) totalled €1,683m (€1,801m at 31/12/2015). The decrease of €200m was due to the purchase of shares of the subsidiary UnipolSai in the first half of 2016 by the subsidiaries Unipol Finance and Unipol Investment (formerly Linear Life). Financial liabilities amounted to €1,904m (€1,907m at 31/12/2015). With regard to the other sectors in which the Group operates, it is worth mentioning the profit of the hotel business and the liquidation of Centro Oncologico Fiorentino, given the impossibility to make the company’s operations economically sustainable. The holding company Unipol closed the period with a net profit of €230m, down compared to €306m at 30 September 2015 due in particular to lower dividends received from Group companies (-€79m).

Unipol Group - Interim Financial Report at 30 September 2016
13
Asset and financial management As regards the management of financial investments, again in the third quarter of 2016 there was no lack of tension in the financial markets, particularly the equity markets, due to fears regarding the stability of the credit systems in European countries and the possible impacts of any future relaxation of the expansive monetary policies adopted to date by the main central banks. In 2016, in accordance with the strategic guidelines set in the Business Plan, the policy to gradually reduce the share of government bonds continued to be implemented, with a view to gradual diversification towards a selective increase of corporate securities and other financial assets. During the period in question, while the financial portfolio recorded good returns (equal to 3.6%), they were considerably lower than those recorded in the first half of 2015 (4.9%), which were significantly influenced by capital gains, partly resulting from the forward sale of several securities. The bond segment continued to be the main focus of operations, involving government bonds and non-government bonds, with a medium/long-term investment approach. In the first nine months of 2016, exposure to government bonds decreased by more than €780m, due to the net increase in the Life sector of €1,088m, against a net negative balance for the Non-Life sector of approximately €1,750m. The exposure of the holding company decreased by €120m. Purchases in the Life portfolio involved mainly fixed-rate securities and were used to meet the ALM requirements of the Segregated Funds. Sales in the Non-Life sector involved mostly short-term or floating rate securities, while repurchases mainly focused on securities index-linked to inflation. In the Non-Life portfolio, positions in derivatives were increased marginally to mitigate the risk of a rise in interest rates. The non-government bonds component saw an increase in exposure of around €2.5bn during the period. This increase affected both the Life sector (€1,220m) and the Non-Life sector (€1,290m); the exposure of the holding company decreased by approximately €10m. Transactions involved primarily financial and industrial securities, both senior and subordinated. There was a €254m reduction in exposure to Level 2 and 3 structured bonds. The share exposure rose by just over €200m in the first nine months of 2016. The put options on the Eurostoxx50 index, meant to mitigate volatility and preserve the value of the portfolio, remain active in the equity portfolio and were revalued during the period. Transactions were broken down based on individual shares and ETFs (Exchange Traded Funds) representing share indexes. Almost all equity instruments belong to the main European share indexes. Exposure to alternative funds (private equity, hedge funds and investments in real assets) amounted to €632m, recording a net increase of €233m at 30 September 2016, also following the investments made in the Atlante fund in the first half of the year. The overall duration was 5.58 years for the Group, a modest increase with respect to 5.42 years at the end of 2015. The Non-Life duration in the Group insurance portfolio was 3.36 years (3.40 years at the end of 2015); the Life duration was 6.47 years (6.3 years at the end of 2015). The Holding duration was 0.48 years, down compared to the end of last year (0.96 years) due to the liquidity appropriately held in the portfolio. At 30 September 2016, Group Investments and Cash and cash equivalents totalled €84,441m (€81,840m at 31/12/2015), with the following breakdown by business segment: Investments and cash and cash equivalents - Breakdown by business segment
Amounts in €m 30/09/2016 % comp. 31/12/2015 % comp. % var.
Insurance 72,943 86.4 70,295 85.9 3.8
Banking 11,228 13.3 11,100 13.6 1.1
Holding and Other Businesses 1,683 2.0 1,801 2.2 (6.5)
Real Estate 897 1.1 920 1.1 (2.5)
Inter-segment eliminations (2,300) (2.7) (2,276) (2.8) 1.0
Total Investments and cash and cash equivalents (*) 84,451 100.0 81,840 100.0 3.2
(*) Including properties for own use

Interim Financial Report
14
The breakdown by investment category is as follows:
Amounts in €m 30/9/2016 % comp. 31/12/2015 % comp. % var.
Property (*) 3,865 4.6 3,969 4.8 (2.6)
Investments in subsidiaries, associates and interests in joint ventures 76 0.1 90 0.1 (15.3)
Held-to-maturity investments 1,303 1.5 1,528 1.9 (14.8)
Loans and receivables 14,471 17.1 14,549 17.8 (0.5)
Debt securities 4,455 5.3 4,530 5.5 (1.7)
Loans and receivables from bank customers 8,589 10.2 8,322 10.2 3.2
Interbank loans and receivables 693 0.8 594 0.7 16.6
Deposits with ceding companies 22 0.0 24 0.0 (6.5)
Other loans and receivables 712 0.8 1,079 1.3 (34.0)
Available-for-sale financial assets 54,342 64.3 50,916 62.2 6.7
Financial assets at fair value through profit or loss 9,821 11.6 9,913 12.1 (0.9)
of which held for trading 302 0.4 407 0.5 (25.8)
of which at fair value through profit or loss 9,519 11.3 9,506 11.6 0.1
Cash and cash equivalents 573 0.7 874 1.1 (34.5)
Total investments and cash and cash equivalents 84,451 100.0 81,840 100.0 3.2
(*) Including properties for own use.
Net financial income (excluding net income from financial assets and liabilities, whose investment risk is borne by customers) amounted to €1,438m at 30 September 2016, compared to €1,802m at 30 September 2015 (-20.2%). This decrease was caused by lower net gains on trading.

Unipol Group - Interim Financial Report at 30 September 2016
15
Shareholders’ equity At 30 September 2016, Shareholders' equity amounted to €8,271m (€8,445m at 31/12/2015), of which: - Shareholders’ equity attributable to the owners of the Parent amounted to €5,635m (€5,524m at 31/12/2015); - Shareholders’ equity attributable to non-controlling interests was €2,636m (€2,921m at 31/12/2015), down due
above all to the reduction in non-controlling interests in the UnipolSai Group following the acquisition of 111 million shares by the subsidiaries Unipol Finance and Unipol Investment during the period, for a total of €200m.
Technical provisions and financial liabilities At 30 September 2016, Technical provisions amounted to €64,807m (€63,150m at 31/12/2015) and Financial liabilities totalled €16,101m (€15,571m at 31/12/2015).
Technical provisions and financial liabilities
Amounts in €m
Amounts in €m 30/9/2016 31/12/2015 % var.
Non-Life technical provisions 15,987 16,574 (3.5)
Life technical provisions 48,820 46,575 4.8
Total technical provisions 64,807 63,150 2.6
Financial liabilities at fair value 3,163 2,658 19.0
Investment contracts - insurance companies 2,839 2,380 19.3
Other 324 278 16.6
Other financial liabilities 12,938 12,914 0.2
Investment contracts - insurance companies 0 0 (28.8)
Subordinated liabilities 2,508 2,565 (2.2)
Payables to bank customers 5,878 5,506 6.8
Interbank payables 441 436 1.1
Other 4,110 4,407 (6.7)
Total financial liabilities 16,101 15,571 3.4
Total 80,908 78,721 2.8

Interim Financial Report
16
Business outlook Serious volatility continued in the financial markets in the period immediately following 30 September 2016 due to multiple factors such as the banking crisis, especially the events surrounding Deutsche Bank and the capitalisation issues of Italian banks, tensions provoked by the elections in the US and the referendum in Italy, the effects of a possible reversal of Central Bank monetary policies, trends arising after the UK referendum on 23 June, etc. In October, investors took on a more favourable attitude, favouring a recovery in share prices. In this complex macroeconomic environment, the objective of financial operations continues to be to achieve consistency between assets and liabilities and to maintain a high standard of portfolio quality through issuer diversification criteria, with a particular focus on their strength and liquidity. As far as the performance of the Group’s businesses is concerned, in late October an earthquake again struck Central Italy, causing significant damage to real estate assets. Claims connected to the insurance coverage provided by Group companies are currently being surveyed. The numerous actions for diversifying the commercial offering in the Life sector towards new products and for supporting a recovery in the Non-Life sector continue, albeit in a highly competitive environment. In light of the above, unless exceptional, currently unforeseeable events take place, it is likely that a profit will be achieved at the end of the year under way. Bologna, 10 November 2016
The Board of Directors
Consolidated Financial Statements - Statement of financial position - Income statement - Condensed operating income statement by business segment - Statement of financial position by business segment

U

Unipol Group - Interim Financial Report at 30 September 2016
19
Statement of Financial Position
Assets Amounts in €m 30/9/2016 31/12/2015
1 INTANGIBLE ASSETS 2,034 2,071
1.1 Goodwill 1,582 1,582
1.2 Other intangible assets 452 489
2 PROPERTY, PLANT AND EQUIPMENT 1,747 1,757
2.1 Property 1,570 1,619
2.2 Other tangible assets 177 138
3 TECHNICAL PROVISIONS - REINSURERS' SHARE 895 897
4 INVESTMENTS 82,308 79,347
4.1 Investment property 2,295 2,350
4.2 Investments in subsidiaries, associates and interests in joint ventures 76 90
4.3 Held-to-maturity investments 1,303 1,528
4.4 Loans and receivables 14,471 14,549
4.5 Available-for-sale financial assets 54,342 50,916
4.6 Financial assets at fair value through profit or loss 9,821 9,913
5 SUNDRY RECEIVABLES 2,699 3,215
5.1 Receivables relating to direct insurance business 982 1,593
5.2 Receivables relating to reinsurance business 70 81
5.3 Other receivables 1,646 1,540
6 OTHER ASSETS 1,824 1,612
6.1 Non-current assets or assets of a disposal group held for sale 41 17
6.2 Deferred acquisition costs 88 87
6.3 Deferred tax assets 959 919
6.4 Current tax assets 33 54
6.5 Other assets 703 536
7 CASH AND CASH EQUIVALENTS 573 874
TOTAL ASSETS 92,079 89,773

Interim Financial Report
20
Statement of Financial Position
Shareholders’ equity and liabilities Amounts in €m 30/9/2016 31/12/2015
1 SHAREHOLDERS' EQUITY 8,271 8,445
1.1 attributable to the owners of the Parent 5,635 5,524
1.1.1 Share capital 3,365 3,365
1.1.2 Other equity instruments
1.1.3 Capital reserves 1,725 1,725
1.1.4 Income-related and other equity reserves (289) (426)
1.1.5 (Treasury shares) (28) (35)
1.1.6 Reserve for foreign currency translation differences 2 2
1.1.7 Gains or losses on available-for-sale financial assets 576 589
1.1.8 Other gains or losses recognised directly in equity 22 31
1.1.9 Profit (loss) for the year attributable to the owners of the Parent 261 272
1.2 attributable to non-controlling interests 2,636 2,921
1.2.1 Share capital and reserves attributable to non-controlling interests 2,115 2,206
1.2.2 Gains or losses recognised directly in equity 342 408
1.2.3 Profit (loss) for the year attributable to non-controlling interests 178 307
2 PROVISIONS 533 550
3 TECHNICAL PROVISIONS 64,807 63,150
4 FINANCIAL LIABILITIES 16,101 15,571
4.1 Financial liabilities at fair value through profit or loss 3,163 2,658
4.2 Other financial liabilities 12,938 12,914
5 PAYABLES 1,070 918
5.1 Payables arising from direct insurance business 114 147
5.2 Payables arising from reinsurance business 93 88
5.3 Other payables 863 683
6 OTHER LIABILITIES 1,297 1,140
6.1 Liabilities associated with disposal groups 2
6.2 Deferred tax liabilities 63 49
6.3 Current tax liabilities 37 42
6.4 Other liabilities 1,196 1,048
TOTAL SHAREHOLDERS’ EQUITY AND LIABILITIES 92,079 89,773

Unipol Group - Interim Financial Report at 30 September 2016
21
Income Statement
Amounts in €m 30/9/2016 30/9/2015
1.1 Net premiums 10,518 11,393
1.1.1 Gross premiums earned 10,807 11,712
1.1.2 Earned premiums ceded to reinsurers (288) (319)
1.2 Commission income 107 90
1.3 Gains and losses on financial instruments at fair value through profit or loss (109) 215
1.4 Gains on investments in subsidiaries, associates and interests in joint ventures 4 8
1.5 Gains on other financial instruments and investment property 2,066 2,324
1.5.1 Interest income 1,484 1,486
1.5.2 Other income 132 141
1.5.3 Realised gains 368 612
1.5.4 Unrealised gains 81 85
1.6 Other revenue 352 395
1 TOTAL REVENUE AND INCOME 12,938 14,425
2.1 Net charges relating to claims (9,214) (10,228)
2.1.1 Amounts paid and changes in technical provisions (9,329) (10,347)
2.1.2 Reinsurers' share 115 120
2.2 Commission expense (29) (23)
2.3 Losses on investments in subsidiaries, associates and interests in joint ventures (2) (7)
2.4 Losses on other financial instruments and investment property (460) (717)
2.4.1 Interest expense (174) (202)
2.4.2 Other charges (37) (40)
2.4.3 Realised losses (98) (205)
2.4.4 Unrealised losses (151) (270)
2.5 Operating expenses (1,985) (2,054)
2.5.1 Commissions and other acquisition costs (1,261) (1,324)
2.5.2 Investment management expenses (71) (57)
2.5.3 Other administrative expenses (653) (673)
2.6 Other costs (607) (529)
2 TOTAL COSTS AND EXPENSES (12,298) (13,559)
PRE-TAX PROFIT (LOSS) FOR THE YEAR 640 866
3 Income tax (201) (272)
PROFIT (LOSS) FOR THE YEAR AFTER TAXES 439 594
4 PROFIT (LOSS) FROM DISCONTINUED OPERATIONS
CONSOLIDATED PROFIT (LOSS) 439 594
of which attributable to the owners of the Parent 261 335
of which attributable to non-controlling interests 178 259
Interim Financial Report
22
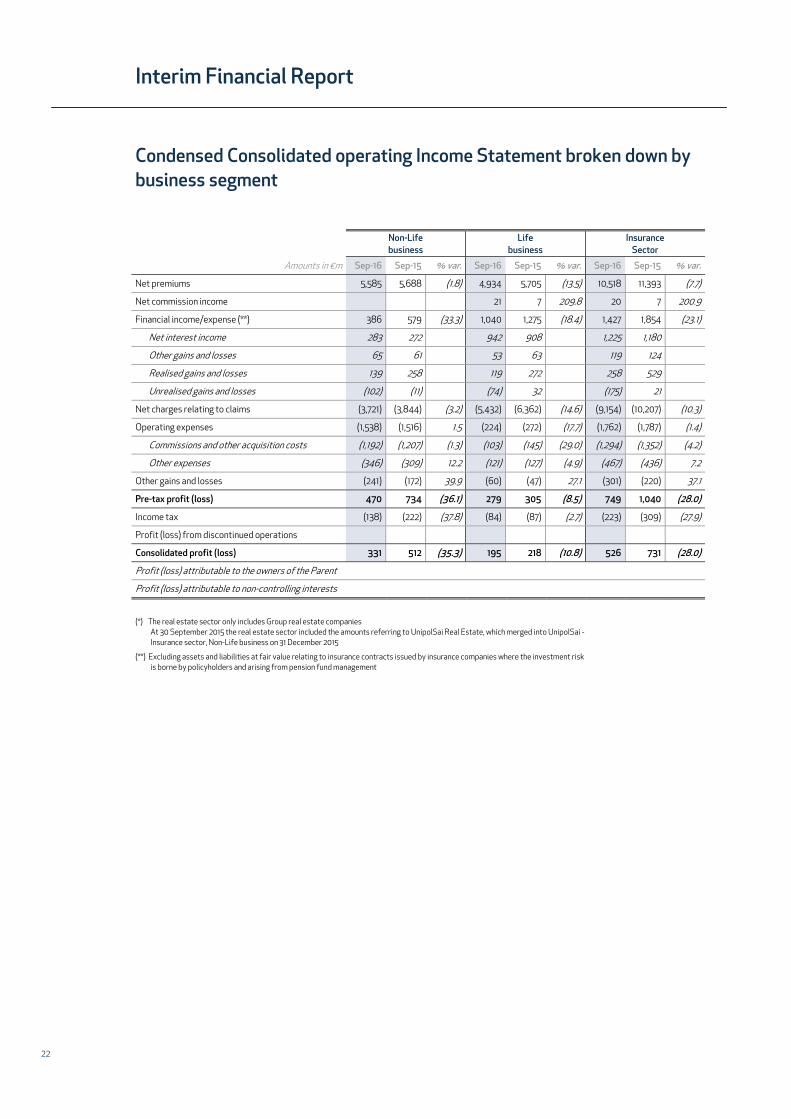
Condensed Consolidated operating Income Statement broken down by business segment
Non-Life business
Life business
Insurance Sector
Amounts in €m Sep-16 Sep-15 % var. Sep-16 Sep-15 % var. Sep-16 Sep-15 % var.
Net premiums 5,585 5,688 (1.8) 4,934 5,705 (13.5) 10,518 11,393 (7.7)
Net commission income (825.7) 21 7 209.8 20 7 200.9
Financial income/expense (**) 386 579 (33.3) 1,040 1,275 (18.4) 1,427 1,854 (23.1)
Net interest income 283 272 4.2 942 908 3.7 1,225 1,180 3.8
Other gains and losses 65 61 7.1 53 63 (15.9) 119 124 (4.6)
Realised gains and losses 139 258 (46.0) 119 272 (56.1) 258 529 (51.2)
Unrealised gains and losses (102) (11) 802.1 (74) 32 (329.7) (175) 21 (941.7)
Net charges relating to claims (3,721) (3,844) (3.2) (5,432) (6,362) (14.6) (9,154) (10,207) (10.3)
Operating expenses (1,538) (1,516) 1.5 (224) (272) (17.7) (1,762) (1,787) (1.4)
Commissions and other acquisition costs (1,192) (1,207) (1.3) (103) (145) (29.0) (1,294) (1,352) (4.2)
Other expenses (346) (309) 12.2 (121) (127) (4.9) (467) (436) 7.2
Other gains and losses (241) (172) 39.9 (60) (47) 27.1 (301) (220) 37.1
Pre-tax profit (loss) 470 734 (36.1) 279 305 (8.5) 749 1,040 (28.0)
Income tax (138) (222) (37.8) (84) (87) (2.7) (223) (309) (27.9)
Profit (loss) from discontinued operations
Consolidated profit (loss) 331 512 (35.3) 195 218 (10.8) 526 731 (28.0)
Profit (loss) attributable to the owners of the Parent 325 117 120 340 445
Profit (loss) attributable to non-controlling interests 187 78 99 186 286
(*) The real estate sector only includes Group real estate companies
At 30 September 2015 the real estate sector included the amounts referring to UnipolSai Real Estate, which merged into UnipolSai - Insurance sector, Non-Life business on 31 December 2015
(**) Excluding assets and liabilities at fair value relating to insurance contracts issued by insurance companies where the investment risk is borne by policyholders and arising from pension fund management

Unipol Group - Interim Financial Report at 30 September 2016
23
Banking Sector
Holding and Other businesses Sector
Real Estate (*) Sector
Inter-segment elimination
Total Consolidated
Sep-16 Sep-15 % var. Sep-16 Sep-15 % var. Sep-16 Sep-15 % var. Sep-16 Sep-15 Sep-16 Sep-15 % var.
10,518 11,393 (7.7)
74 73 2.3 19 20 (4.2) 78.8 (36) (33) 78 66 17.1
148 125 18.3 (52) (52) 0.4 (45) (100.2) (85) (81) 1,438 1,802 (20.2)
162 179 (9.7) (43) (38) 14.4 (1) (1) 12.3 (31) (30) 1,310 1,290 1.6
2 1092.3 (5) (16) (67.9) 12 30 (60.4) (24) (31) 104 107 (3.1)
20 (7) (397.1) 3 3 (2.6) (1) (1) 2.3 280 524 (46.6)
(36) (48) (23.6) (6) 4472.9 (9) (72) (87.8) (30) (20) (256) (119) 115.5
(9,154) (10,207) (10.3)
(233) (220) 5.6 (77) (121) (36.0) (9) (23) (61.3) 95 98 (1,985) (2,054) (3.3)
33 28 (1,261) (1,324) (4.7)
(233) (220) 5.6 (77) (121) (36.0) (9) (23) (61.3) 62 70 (724) (730) (0.8)
14 31 (54.9) 13 60 (78.7) (7) (22) (69.5) 26 16 (255) (134) 89.7
3 8 (60.3) (97) (92) (5.3) (16) (90) 82.7 640 866 (26.1)
(1) (2) (42.5) 21 15 40.8 2 24 (91.9) (201) (272) (26.2)
2 6 (65.4) (76) (77) (1.7) (14) (66) (79.4) 439 594 (26.1)
2 5 (73) (75) (8) (40) 261 335 (22.2)
1 (3) (2) (5) (26) 178 259 (31.1)
Interim Financial Report
24
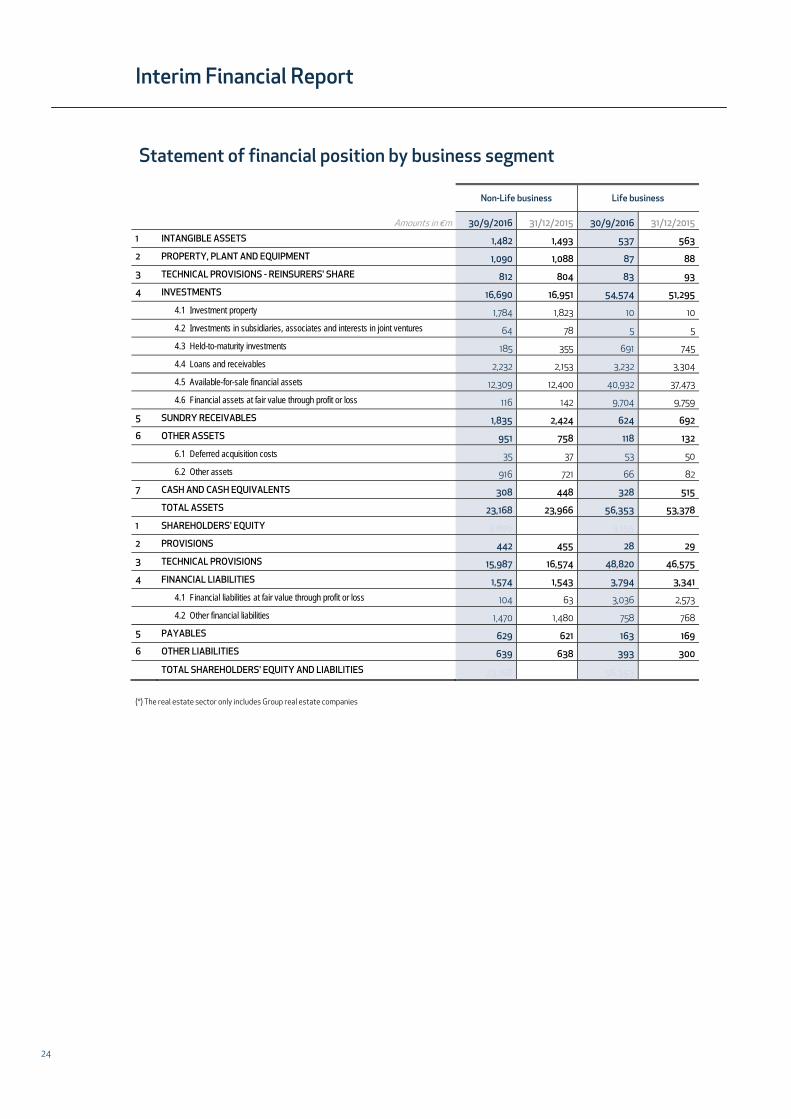
Statement of financial position by business segment
Non-Life business Life business
Amounts in €m 30/9/2016 31/12/2015 30/9/2016 31/12/2015
1 INTANGIBLE ASSETS 1,482 1,493 537 563
2 PROPERTY, PLANT AND EQUIPMENT 1,090 1,088 87 88
3 TECHNICAL PROVISIONS - REINSURERS' SHARE 812 804 83 93
4 INVESTMENTS 16,690 16,951 54,574 51,295
4.1 Investment property 1,784 1,823 10 10
4.2 Investments in subsidiaries, associates and interests in joint ventures 64 78 5 5
4.3 Held-to-maturity investments 185 355 691 745
4.4 Loans and receivables 2,232 2,153 3,232 3,304
4.5 Available-for-sale financial assets 12,309 12,400 40,932 37,473
4.6 Financial assets at fair value through profit or loss 116 142 9,704 9,759
5 SUNDRY RECEIVABLES 1,835 2,424 624 692
6 OTHER ASSETS 951 758 118 132
6.1 Deferred acquisition costs 35 37 53 50
6.2 Other assets 916 721 66 82
7 CASH AND CASH EQUIVALENTS 308 448 328 515
TOTAL ASSETS 23,168 23,966 56,353 53,378
1 SHAREHOLDERS' EQUITY 3,896 4,134 3,155 2,965
2 PROVISIONS 442 455 28 29
3 TECHNICAL PROVISIONS 15,987 16,574 48,820 46,575
4 FINANCIAL LIABILITIES 1,574 1,543 3,794 3,341
4.1 Financial liabilities at fair value through profit or loss 104 63 3,036 2,573
4.2 Other financial liabilities 1,470 1,480 758 768
5 PAYABLES 629 621 163 169
6 OTHER LIABILITIES 639 638 393 300
TOTAL SHAREHOLDERS' EQUITY AND LIABILITIES 23,168 23,966 56,353 53,378
(*) The real estate sector only includes Group real estate companies

Unipol Group - Interim Financial Report at 30 September 2016
25
Banks Holding and Other businesses Real Estate Inter-segment
eliminations Total
30/9/2016 31/12/2015 30/9/2016 31/12/2015 30/9/2016 31/12/2015 30/9/2016 31/12/2015 30/9/2016 31/12/2015
8 8 7 9 (1) (1) 2,034 2,071
15 14 202 210 353 355 1 1 1,747 1,757
895 897
11,140 10,998 425 673 474 497 (994) (1,067) 82,308 79,347
1 1 42 42 458 474 2,295 2,350
7 7 76 90
427 428 1,303 1,528
9,906 9,914 89 239 (988) (1,061) 14,471 14,549
799 647 293 380 16 22 (7) (7) 54,342 50,916
1 12 9,821 9,913
88 92 329 223 28 29 (204) (245) 2,699 3,215
408 412 527 515 36 25 (216) (230) 1,824 1,612
88 87
408 412 527 515 36 25 (216) (230) 1,736 1,525
87 101 1,079 945 76 75 (1,306) (1,210) 573 874
11,744 11,624 2,568 2,576 967 982 (2,721) (2,753) 92,079 89,773
747 738 (242) (120) 714 727 8,271 8,445
28 23 622 590 6 16 (593) (563) 533 550
64,807 63,150
10,428 10,459 1,904 1,907 204 203 (1,804) (1,881) 16,101 15,571
4 8 18 13 1 2 3,163 2,658
10,424 10,452 1,886 1,894 203 202 (1,804) (1,881) 12,938 12,914
167 74 262 180 29 23 (180) (148) 1,070 918
374 330 22 20 14 12 (145) (160) 1,297 1,140
11,744 11,624 2,568 2,576 967 982 (2,721) (2,753) 92,079 89,773


Statement of the Manager in charge of financial reporting (pursuant to Art. 154-bis of Legislative Decree 58/1998)

28

Unipol Group - Interim Financial Report at 30 September 2016
29
Statement of the Manager in charge of financial reporting
STATEMENT OF THE MANAGER IN CHARGE OF FINANCIAL REPORTING
RE: Interim Financial Report of Unipol Gruppo Finanziario S.p.A. as at 30 September 2016 The undersigned, Maurizio Castellina, Manager in charge of financial reporting of Unipol Gruppo Finanziario S.p.A.
HEREBY DECLARES,
pursuant to Article 154-bis, paragraph 2 of the Consolidated Act on Financial Intermediation, that the Interim Financial Report as at 30 September 2016 is consistent with the accounting records, ledgers and documents. Bologna, 10 November 2016 The Manager in charge of financial reporting Maurizio Castellina (signed on the original)

Unipol Gruppo Finanziario S.p.A.
Registered officeVia Stalingrado, 45
40128 Bologna (Italy)[email protected].: +39 051 5076111
Fax: +39 051 5076666
Share capital€3,365,292,408.03 fully paid-upBologna Register of Companies
Tax and VAT No. 00284160371R.E.A. No. 160304
Parent of the Unipol Insurance GroupEntered in the Register of Insurance Groups – No. 046
Parent of the Unipol Banking GroupEntered in the Register of Banking Groups
www.unipol.it

www.unipol.it
Unipol Gruppo Finanziario S.p.A.Registered officeVia Stalingrado, 4540128 Bologna (Italy)
Related Documents