MFMA 2011-12 Consolidated general report on the LOCAL GOVERNMENT audit outcomes FINDINGS ARISING FROM THE AUDIT OF COMPLIANCE WITH LEGISLATION

Welcome message from author
This document is posted to help you gain knowledge. Please leave a comment to let me know what you think about it! Share it to your friends and learn new things together.
Transcript
MFMA 2011-12
Consolidated general report on the loCAl governMent audit outcomesFindings arising From the audit oF compliance with legislation

The Auditor-General has a constitutional mandate and, as the Supreme Audit Institution (SAI) of South Africa, it exists to strengthen our country’s democracy
by enabling oversight, accountability and governance in the public sector through auditing, thereby building public confidence.
Our reputation promise

foreword

Consolidated general report on the audit outcomes of local government | 2011-12
...TO ENSURE IMPROVED RESULTS...
THE KEY ROLE PLAYERS NEED TO...
...TAKE SOME VITAL ACTIONS...
...IN SIX KEY AREAS...
KEY ROLE PLAYERS NOT PROVIDING ASSURANCE
MANAGEMENT/LEADERSHIP(Senior management,
accounting officer/authority and mayor)
INTERNAL INDEPENDENT ASSURANCE AND OVERSIGHT(Internal audit unit, audit committee, treasury,
cooperative governance department and premier’s office)
EXTERNAL INDEPENDENT ASSURANCE AND OVERSIGHT(Municipal council, municipal public accounts
ccommittee, legislature/NCOP and portfolio committeeon local government)
Provides assurance Provides some assurance Not establishedProvides limited/no assurance
REGRESSION IN AUDIT OUTCOMES
50%
45%
5%
2009-10
48%
47%
5%
2010-11
52%
43%
5%
2011-12
Unqualified with no findings
Unqualified with findings
Qualified/adverse/disclaimed with findings
Human resource
management
Information technology
controls
Financialhealth
Supply chain management
Quality of performance
reports
Quality of submitted financial
statements
KEY RISK AREAS NOT RECEIVING REQUIRED ATTENTION
DRIVERS OF KEY CONTROLS NOT IMPROVING
Leadership
42%
34%
24%
37%
34%
29%
Financial andperformance management
49%
32%
19%
45%
32%
23%
Governance
35%
36%
29%
37%
32%
31%
ROOT CAUSES NOT BEING ADDRESSED
Good Concerning Intervention required
Concerning Intervention required
Unchanged Regressed
Key positions vacant or key officials lacking appropriate competencies
A root cause at of auditees (2010-11: 72%)73%
Lack of consequences for poor performance and transgressions
A root cause at of auditees (2010-11: 73%)71%
Unchanged Regressed
Slow response by political leadership in addressing the root causes of poor audit outcomes
A root cause at of auditees (2010-11: 57%)76%
2011-12 2010-11 2011-12 2010-11 2011-12 2010-11
37%
44%
19%
5%
31%
42%
22%
5%
41%
41%
13%
1
2
3
4
Consolidated general report on the audit outcomes of local government | 2011-12
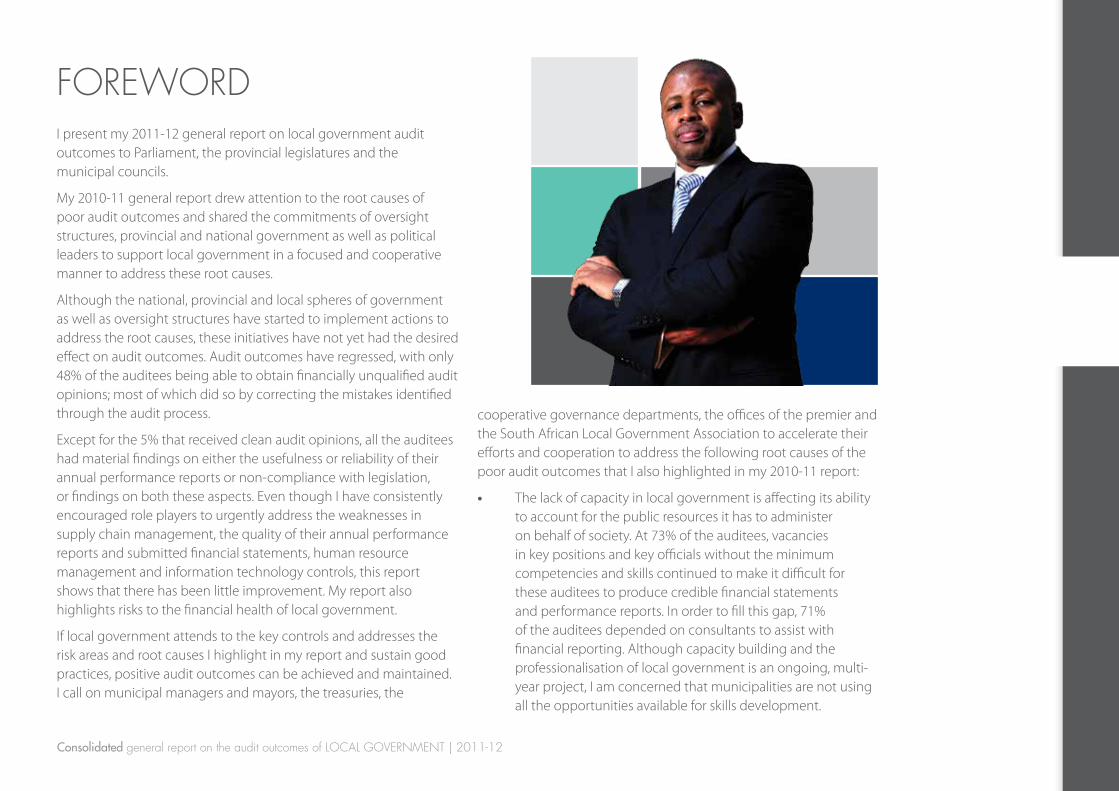
I present my 2011-12 general report on local government audit outcomes to Parliament, the provincial legislatures and the municipal councils.
My 2010-11 general report drew attention to the root causes of poor audit outcomes and shared the commitments of oversight structures, provincial and national government as well as political leaders to support local government in a focused and cooperative manner to address these root causes.
Although the national, provincial and local spheres of government as well as oversight structures have started to implement actions to address the root causes, these initiatives have not yet had the desired effect on audit outcomes. Audit outcomes have regressed, with only 48% of the auditees being able to obtain financially unqualified audit opinions; most of which did so by correcting the mistakes identified through the audit process.
Except for the 5% that received clean audit opinions, all the auditees had material findings on either the usefulness or reliability of their annual performance reports or non-compliance with legislation, or findings on both these aspects. Even though I have consistently encouraged role players to urgently address the weaknesses in supply chain management, the quality of their annual performance reports and submitted financial statements, human resource management and information technology controls, this report shows that there has been little improvement. My report also highlights risks to the financial health of local government.
If local government attends to the key controls and addresses the risk areas and root causes I highlight in my report and sustain good practices, positive audit outcomes can be achieved and maintained. I call on municipal managers and mayors, the treasuries, the
cooperative governance departments, the offices of the premier and the South African Local Government Association to accelerate their efforts and cooperation to address the following root causes of the poor audit outcomes that I also highlighted in my 2010-11 report:
•• The lack of capacity in local government is affecting its ability to account for the public resources it has to administer on behalf of society. At 73% of the auditees, vacancies in key positions and key officials without the minimum competencies and skills continued to make it difficult for these auditees to produce credible financial statements and performance reports. In order to fill this gap, 71% of the auditees depended on consultants to assist with financial reporting. Although capacity building and the professionalisation of local government is an ongoing, multi-year project, I am concerned that municipalities are not using all the opportunities available for skills development.
foreword
Consolidated general report on the audit outcomes of local government | 2011-12
•• Political leaders and municipal officials that deliberately or negligently ignore their duties and disobey legislation should be decisively dealt with through a formal performance management process that is complemented by the legislated consequences for transgressions. At just over 70% of the auditees, the lack of consequences for poor performance and transgressions slowed down the improvements in local government audit outcomes. Role players in local government often say that they do not know what remedies to apply to deal with transgressions. To help them, we have compiled a separate booklet on the legislation they can use, as a starting point for responsible leaders to set the correct tone.
I also call on the councillors of 76% of the auditees where I have encountered slow responses to addressing the poor audit outcomes to focus on the following:
•• Prioritise their pursuit of the knowledge and skills they need to perform their oversight duties and insist on support from national and provincial government for their continuous development. If councillors do not feel equipped and enabled to effectively oversee municipal administration, they will not be able to hold municipal management to account and enforce consequences for poor performance and transgressions.
•• Effectively and ethically apply the leadership skills that earned them the trust of their communities and strengthen their resolve to oversee and steer their municipalities towards achieving developmental objectives, adhering to legislation and accounting for actions in a credible and transparent manner.
•• Further strengthen the municipal public accounts committees and support the important role they play.
•• Insist, through their speakers, on sharing and reviewing regular and credible information on the status of the finances, service delivery and compliance activities of their municipalities.
The provincial legislatures’ commitments to improve their oversight over local government in a cooperative manner have not been realised yet, but there is a renewed resolve to overcome the obstacles. I again invite legislatures to regularly cooperate with my office on local government matters.
National and provincial support and oversight for local government by treasuries and cooperative governance departments should be strengthened to improve municipalities’ administrative and financial abilities. There needs to be a shift towards enabling municipalities in a practical and sustainable manner by providing operational guidelines and access to training and specialised skills. In this regard, district municipalities can play a larger part in fulfilling this role for municipalities struggling to find their own expertise. The legislation and initiatives recently announced by the ministers of public service administration and of cooperative governance should have a significant impact in strengthening local government, if supported at a municipal level and implemented in a coordinated and sustainable manner.
Although progress towards clean audits is slow, I am encouraged by examples across the country where the commitment of leaders and officials has resulted in examples of improved audit outcomes. I am confident that similar results can be achieved by the smallest local municipality to the biggest metro.
Together, we will continue to contribute towards strengthening our country’s democracy.
auditor-general pretoria July 2013

7
Findings arising From the audit oF compliance with
legislation

8
Consolidated general report on the audit outcomes of local government | 2011-12
2.4 Findings arising From the audit oF compliance with legislation
2.4.1 Overall outcomes from the audit of compliance with legislation
Figure 14movement in, and nature of, findings on non-compliance with legislation
Movement in number of auditees with findings on non-compliance
2011-12: 299 (94%) 2010-11: 311 (94%)
Areas of findings on non-compliance
Unchanged with no findings
8 and 3 new auditees (3%)
Improved 7 (2%)
Unchanged with findings286 (90%)
Regressed 12 and 1
new auditee (5%)
65%
46%
40%
33%
41%
39%
66%
70%
74%
72%
44%
48%
48%
53%
65%
73%
73%
86% 273
152
167
207
230
231
153
246
109
136
133
128
218
232
228 214
140 151
Other areas of non-compliance
Budgets
Audit committees
Asset management
Expenditure management
Annual financial statements and annual report
Unauthorised, irregular as well as fruitless and wasteful expenditure
Supply chain management
Material misstatements or limitations in the submitted annual financial statements
With no findings With findings Stagnant or little progress Regressed 2012 2011

9
Consolidated general report on the audit outcomes of local government | 2011-12
Figure 15
provincial analysis of findings
eastern cape Free state gauteng KwaZulu-natal limpopo mpumalanga northern cape north west western cape
100%
4%
96%
5%
95%
8%
92%
3%
97%
16%
84% 100% 100%
18%
82%
With no findings With findings
The Public Audit Act requires us to annually audit compliance with legislation applicable to financial matters, financial management and other related matters. We focused on the following areas in our compliance audit: n material misstatements in submitted annual financial statements n asset and liability management n audit committees n budget management n expenditure management n unauthorised, irregular as well as fruitless and wasteful expenditure
n financial misconduct n internal audit n revenue management n strategic planning and performance management n transfer of funds and conditional grants n procurement and contract management (SCM) n HR management and compensation.
Annexure 1 lists all auditees where material non-compliance was reported in one or more of our compliance focus areas.

10
Consolidated general report on the audit outcomes of local government | 2011-12
The following table details key findings from the audits.
table 13
Key findings from the audit of compliance with legislation
Key findings Good Concerning Poor
Number of auditees with
non-compliance findings
remained high
•• Material findings on non-compliance with legislation were reported at 299 auditees (94%) (2010-11: 311 [94%]).
•• All auditees (100%) in three provinces (Eastern Cape, Northern Cape and North West) had non-compliance findings, while only the Western Cape and Mpumalanga had non-compliance findings at less than 90% of their auditees.
•• All eight metropolitan municipalities again had non-compliance findings, as did 91% of the district municipalities.
Increase in the number of findings
reported
•• The number of non-compliance findings reported at the 299 auditees increased by 8% from 1 975 to 2 125 individual findings.
Regression in three provinces
•• The number of auditees with non-compliance findings increased in the Eastern Cape (one auditee), Gauteng (three auditees) and KwaZulu-Natal (four auditees).
Key findings Good Concerning Poor
Improvement in four provinces
•• The number of auditees with non-compliance findings decreased in the Free State (from 27 to 25), Mpumalanga (from 17 to 16), the Northern Cape (from 31 to 22) and the Western Cape (from 30 to 23).
Some reduction in the number of focus areas with findings
•• In total, 83 auditees (26%) reduced the number of compliance focus areas with findings and, although they still had findings, 12 auditees (2%) had findings in only one focus area.
•• These 83 auditees consist of one metropolitan municipality, 11 district municipalities, 53 local municipalities and 18 municipal entities.
•• The 83 auditees were spread around the country in the Eastern Cape (19), the Free State (three), Gauteng (nine), KwaZulu-Natal (15), Limpopo (five), Mpumalanga (four), the Northern Cape (eight), the North West (seven) and the Western Cape (13).

11
Consolidated general report on the audit outcomes of local government | 2011-12
2.4.2 Findings on non-compliance with legislation
Figure 16
movement in common areas of findings on non-compliance with legislation (299 auditees with non-compliance findings)
79% 64% 64%
13%
14% 13%
4% 14% 9%
Material misstatements or limitations in the submitted annual
financial statements
Supply chain management
and contracts
Prevention and follow-up
of unauthorised irregular and/or
fruitless and wasteful expenditure
273 230
36% 36% 32% 30% 29%
33% 20%
19% 21% 18%
7%
9% 12% 6% 21%
Preparation ofannual financialstatements and
annual report
Control of expenditureand payment
within 30 days
Establishment,operation and
effectiveness ofaudit committees
Management of assets
Budget preparation
and management
207 153 152 167
140
Findings in top three areas of non-compliance Findings in other areas of non-compliance
231
Repeat non-compliance findings New non-compliance findings Prior year non-compliance findings addressed
Figure 16 shows a lack of progress by auditees in addressing prior year non-compliance findings in the different focus areas.
A total of 244 auditees (95%) had findings in one or more of the top three areas of non-compliance – an increase from the previous year’s 93%. Had there been no material findings in these areas, the overall level of non-compliance in local government would have been 86%.
Section 2.2.1 analyses the extent and impact of material misstatements or limitations in the annual financial statements submitted for audit purposes, while section 2.4.4 looks at the extent and nature of unauthorised, irregular as well as fruitless and wasteful expenditure.

12
Consolidated general report on the audit outcomes of local government | 2011-12
The table below details the nature of the most widespread findings in the remaining areas of non-compliance, per type of auditee.
table 14
summarised non-compliance findings
Preparation of annual financial statements and annual report: 207 auditees (65%)
Control of expenditure and payment within 30 days: 167 auditees (53%)
39%
76%
52%
50%
36%
59%
43%
63%
•• The annual performance report did not contain the measures taken to improve performance (104 auditees [33%])
•• The annual performance report was not prepared based on the integrated development plan (88 auditees [28%])
•• Actual performance was not reported for all PDOs, indicators and targets (71 auditees [22%])
•• Creditors were not paid within 30 days from receipt of an invoice (149 auditees [47%])
•• The system of internal control over expenditure was ineffective (68 auditees [21%])
•• There was no, or an inadequate, management, accounting and information system for expenditure management (63 auditees [20%])
Management of assets: 153 auditees (48%) Establishment, operation and effectiveness of audit committees: 152 auditees (48%)
15%
61%
32%
50%
25%
56%
39%
50%
•• There was no, or an inadequate, management, accounting and information system for asset management (118 auditees [37%])
•• The system of internal control over assets was ineffective (103 auditees [32%])
•• The audit committee did not review the adequacy, reliability and accuracy of financial reporting and information (63 auditees [20%])
•• The audit committee did not review compliance with legislation (48 auditees [15%])
•• The performance audit committee did not submit reports regarding the performance management system at least twice during the year (47 auditees [15%])
Metropolitan municipalities District municipalities Local municipalities Municipal entities

13
Consolidated general report on the audit outcomes of local government | 2011-12
Budget preparation and management: 140 auditees (44%) Supply chain management and contracts: 231 auditees (73%)
25%
51%
39%
38%
54%
78%
68%
100%
•• Expenditure was not in accordance with the approved budget (86 auditees [27%])
•• Monthly budget statements were not submitted to the mayor and provincial treasury (49 auditees [15%])
•• Quarterly reports on the implementation of the budget and financial state of affairs were not submitted to the council (42 auditees [13%])
•• Three written quotations were not obtained from prospective providers in all instances (131 auditees [41%])
•• Competitive bids were not always invited from providers and the deviations were not approved by a properly delegated official (86 auditees [27%])
•• Contracts were awarded to persons in the service of other state institutions or to entities owned or managed by them (84 auditees [26%])
•• Section 2.4.3 provides further information on the status of SCM in local government.
Metropolitan municipalities District municipalities Local municipalities Municipal entities
Auditees also had many non-compliance findings in the following focus areas (the most common finding is listed next to the focus area):
Revenue management: No, or an inadequate, management, accounting and information system for revenue management (69 auditees [22%])
Strategic planning and performance management: No mechanisms to monitor and review the performance management system (48 auditees [15%])
Internal audit: Performance measurements not audited on a continuous basis (61 auditees [19%])

14
Consolidated general report on the audit outcomes of local government | 2011-12
2.4.3 Findings arising from the audit of supply chain management
Figure 17
movement in, and nature of, findings on supply chain management
Movement in number of auditees with findings on SCM
2011-12: 266 (84%) 2010-11: 256 (77%)
Summary of findings on SCM
Unchanged with no findings
25 and 3 new auditees
(9%)
Improved 23 (7%)
Unchanged withfindings
233 (74%)
Regressed32 and 1
new auditee (10%)
43%
20%
61%
5%
18%
25%
56%
25%
75%
22%
19%
30%
Internal controldeficiencies
Inadequate contractmanagement
Uncompetitive or unfairprocurement processes
Awards to close familymembers of employees
and councillors
Awards to employees andcouncillors or other
state officials
Limitation on plannedscope of audit of awards
94
60
239
61
79
179
82
203
67
142
70 15
With no findings With findings Stagnant or little progress Regressed 2012 2011

15
Consolidated general report on the audit outcomes of local government | 2011-12
Figure 18
provincial analysis of findings
eastern cape Free state gauteng KwaZulu-natal limpopo mpumalanga northern cape north west western cape
7%
93%
12%
88%
32%
68%
34%
66%
3%
97%
5%
95% 100%
4%
96%
18%
82%
With no findings With findings
Our audits included an assessment of procurement processes, contract management and related controls. To ensure a fair, equitable, transparent, competitive and cost-effective SCM system, the processes and controls need to comply with legislation and must minimise the likelihood of fraud, corruption, favouritism as well as unfair and irregular practices. We report all the findings from the audit to management in the management report of the auditee, while only the material non-compliance findings are reported in the audit report.
This section summarises the key findings that were reported to management.
Figures 17 and 18 show the movement in the number of auditees with SCM findings, the prevalence of SCM findings across all auditees with a comparison to the 2010-11 financial year, and a provincial view of auditees with SCM findings.

16
Consolidated general report on the audit outcomes of local government | 2011-12
The following table provides key findings, followed by a further analysis of the SCM findings.
table 15
Key findings from the audit of supply chain management
Key findings Good Concerning Poor
Number of findings increased
•• Findings arising from the audits were reported in the management reports of 275 (87%) of the auditees (2010-11: 256 [77%]). In 231 (73%) of these cases (2010-11: 232 ([70%]), the findings were material enough to be reported in the audit report.
•• At an overall level, there was an increase in the number of auditees with SCM findings.
•• Gauteng and KwaZulu-Natal were the only provinces with findings at less than 80% of their auditees.
Limitations on planned
audits could conceal further
findings
•• Contracts awarded and price quotations accepted by auditees (referred to as awards in the rest of this report) to the value of R2 025 million (2010-11: R2 650 million) that were selected for audit purposes could not be audited, due to the required information or documentation not being made available by 94 auditees (2010-11: 82).
•• These limitations could have a further impact on the extent of actual contraventions and SCM weaknesses.
Lack of progress
in all SCM areas
•• Auditees have not made progress in any of the SCM areas audited. Findings on uncompetitive or unfair procurement processes remained the most common and the number of auditees with these findings continued to increase.
Limitations on planned scope of audit of awards
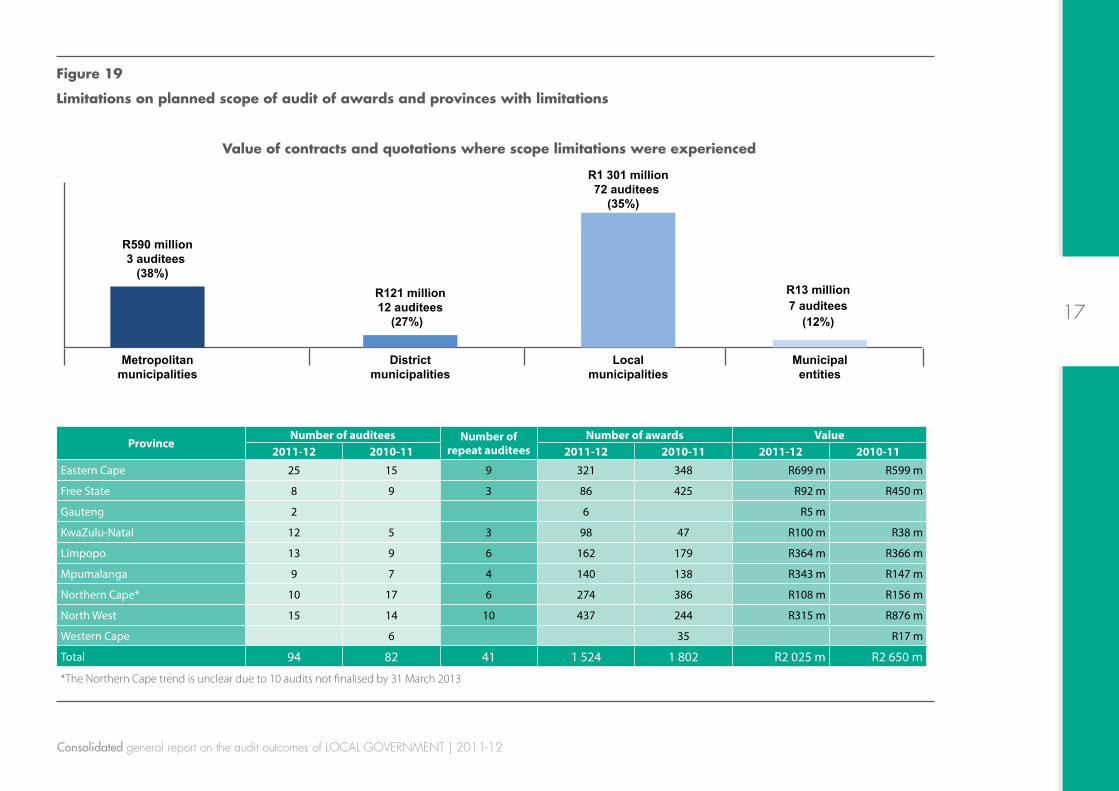
In total, 94 auditees (30%) (2010-11: 82 [25%]) did not provide sufficient, appropriate audit evidence that awards had been made in accordance with the requirements of SCM legislation. We could not perform any alternative audit procedures to obtain reasonable assurance that the expenditure incurred in respect of these awards was not irregular. The main reason for the limitations was that supporting documentation for the award process was not made available for auditing, because the documentation either did not exist or could not be retrieved as a result of poor document management.
The following figure shows the number of auditees where limitations were experienced, per type of auditee, and the provinces where limitations were experienced.
17
Consolidated general report on the audit outcomes of local government | 2011-12
Figure 19
limitations on planned scope of audit of awards and provinces with limitations
Metropolitanmunicipalities
Districtmunicipalities
Localmunicipalities
Municipalentities
Value of contracts and quotations where scope limitations were experienced
R590 million3 auditees
(38%) R121 million12 auditees
(27%)
R1 301 million72 auditees
(35%)
R13 million 7 auditees
(12%)
ProvinceNumber of auditees Number of
repeat auditeesNumber of awards Value
2011-12 2010-11 2011-12 2010-11 2011-12 2010-11
Eastern Cape 25 15 9 321 348 R699 m R599 m
Free State 8 9 3 86 425 R92 m R450 m
Gauteng 2 6 R5 m
KwaZulu-Natal 12 5 3 98 47 R100 m R38 m
Limpopo 13 9 6 162 179 R364 m R366 m
Mpumalanga 9 7 4 140 138 R343 m R147 m
Northern Cape* 10 17 6 274 386 R108 m R156 m
North West 15 14 10 437 244 R315 m R876 m
Western Cape 6 35 R17 m
Total 94 82 41 1 524 1 802 R2 025 m R2 650 m
*The Northern Cape trend is unclear due to 10 audits not finalised by 31 March 2013

18
Consolidated general report on the audit outcomes of local government | 2011-12
There was a lack of evidence to support the regularity of the procurement processes in all provinces, except in the Western Cape and to a lesser degree in Gauteng. The impact of this was the following:
•• The procurement processes could not be audited by us, the internal auditors or investigators.
•• There was no evidence that auditees had followed a fair, transparent and competitive process for all awards. Should unsuccessful bidders request information on the process, also for possible litigation purposes, it will not be available.
•• The true extent of irregular expenditure cannot be determined (also refer to section 2.4.4). As these awards cannot be proven to be irregular, the councils will not be able to investigate the irregularities through a legislated process. There will be no consequences for the irregular expenditure, except if the municipal manager ensures that these cases are determined to be SCM misconduct and possible financial misconduct.
•• Our general reports, audit reports and management reports do not reflect the true extent of SCM non-compliance, irregularities and possible fraud.
•• Poor record management creates an environment in which it is easy to commit fraud and corruption.
Awards to employees and councillors or other state officials
SCM Regulation 44 prohibits awards to persons (namely employees and councillors), or entities owned or managed by them, if they are in the service of the auditee or if they are in the service of any other state institution. Such expenditure is also considered irregular. During our audits, we identified such prohibited awards and also tested whether the legislated requirements with regard to declarations of interest were adhered to.
The following table shows the extent and nature of these awards and whether any non-compliance with legislation was identified, with an indication of the positions of the officials involved. We also identified prohibited awards in the previous year at auditees in all of the provinces.

19
Consolidated general report on the audit outcomes of local government | 2011-12
table 16
prohibited awards to employees and councillors or other state officials
Province
Awards made to employees and councillorsAwards made to
officials of other state institutions
Supplier did not submit declaration of
interest
Supplier did not declare interest in the
declarationExtent and positions of persons involvedEmployee or
councillor did not declare interest
Num
ber o
f in
stan
ces
Num
ber o
f au
dite
es
Num
ber
of re
peat
au
dite
es
Am
ount
Positions
Num
ber o
f in
stan
ces
Num
ber o
f au
dite
es
Am
ount
Num
ber o
f in
stan
ces
Num
ber o
f au
dite
es
Am
ount
Num
ber o
f in
stan
ces
Num
ber o
f au
dite
es
Am
ount
Num
ber o
f in
stan
ces
Num
ber o
f au
dite
es
Am
ount
Eastern Cape 115 16 9 R8 m Councillor, employee, accounting officer 50 9 R4 m 449 33 R111 m 44 3 R1 m 412 29 R105 m
Free State 4 3 1 R335 k Employee 4 3 R335 k 301 14 R20 m 262 7 R14 m 25 6 R4 m
Gauteng 285 4 2 R78 m Employee, senior manager 284 3 R78 m 2 197 17 R199 m 2 049 3 R105 m 98 4 R49 m
KwaZulu-Natal 103 13 10 R19 m Employee, senior
manager 91 6 R18 m 756 40 R119 m 465 11 R66 m 236 22 R43 m
Limpopo 28 3 2 R1 m Employee, senior manager 28 5 R1 m 229 19 R464 m 29 4 R1 m 42 6 R3 m
Mpumalanga 27 8 7 R3 m Councillor, employee 14 4 R1 m 369 15 R36 m 59 4 R9 m 75 3 R10 m
Northern Cape 4 3 1 R21 k Councillor, employee 38 11 R6 m 17 1 R3 m 12 7 R2 m
North West 44 7 1 R9 m Councillor, employee 11 2 R438 k 382 15 R23 m 12 2 R4 m 131 9 R13 m
Western Cape 5 3 3 R200 k
Councillor, employee, SCM official, senior
manager3 2 R184 k 85 16 R39 m 43 8 R25 m 3 2 R130 k
Total 615 60 36 R118 m 485 34 R104 m 4 806 180 R1 016 m 2 980 43 R229 m 1 034 88 R229 m

20
Consolidated general report on the audit outcomes of local government | 2011-12
We are very concerned about the awards to employees and councillors, as these could have been prevented or detected by implementing basic controls, such as employees, councillors and suppliers submitting declarations of interest. The lack of such controls could indicate that auditees do not take this requirement seriously. The possibility of undue influence can also not be disregarded, especially if the persons can influence the procurement processes of these awards, such as councillors, municipal managers and SCM officials, which could create opportunities for irregularities.
Auditees did not have access to information on persons employed in other state institutions, which means that they could only rely on the declarations provided by suppliers. At most of the auditees where prohibited awards were identified, the auditees did not ensure that the declaration was submitted, or the supplier did not declare the interest. We also identified this lapse in internal controls as one of the most widespread findings relating to procurement processes and the most common control weakness, which attributed to the high number of prohibited awards identified. Failure by suppliers to declare their interest constitutes a corrupt and fraudulent act and should be investigated and dealt with in accordance with legislation.
Limited action has been taken in response to similar findings in the previous year. Auditees have thus not taken the opportunity to show that they will not tolerate these irregular actions by persons in the service of the auditee or its suppliers and that such actions have consequences.
Awards to close family members of employees and councillors
Awards to persons, or entities owned or managed by persons, who are close family members of persons in the service of the state, whether at the auditee or at any other state institution, are not prohibited. However, such awards of more than R2 000 must be disclosed in the financial statements of the auditee for the sake of transparency and as required by SCM Regulation 45. A close family member is a spouse, child or parent of a person in the service of the state.
During our audits, we identified awards to close family members and also tested whether the financial statement disclosure was made and whether the legislated requirements with regard to declarations of interest were adhered to.
The following table depicts the audit findings raised at auditees where awards to close family members of officials of the auditee were identified, with an indication of the positions of the officials involved.

21
Consolidated general report on the audit outcomes of local government | 2011-12
table 17
awards to close family members
Province
Awards made to close family members of employees and councillors Employee or councillor did not
declare interest
Supplier did not submit declaration of
interest
Supplier did not declare interest in the
declarationExtent and positions of persons involved No disclosure in financial statements
Num
ber o
f in
stan
ces
Num
ber o
f au
dite
es
Num
ber
of re
peat
au
dite
es
Am
ount
Positions
Num
ber o
f in
stan
ces
Num
ber o
f au
dite
es
Am
ount
Num
ber o
f in
stan
ces
Num
ber o
f au
dite
es
Am
ount
Num
ber o
f in
stan
ces
Num
ber o
f au
dite
es
Am
ount
Num
ber o
f in
stan
ces
Num
ber o
f au
dite
es
Am
ount
Eastern Cape 100 24 3 R26 m Employee, senior manager 6 4 R301 k 60 12 R13 m 29 5 R9 m 11 5 R1 m
Free State 7 3 1 R4 m Employee 2 1 R90 k 2 1 R90 k 2 1 R4 m
Gauteng 561 3 R8 m Employee, senior manager 560 2 R7 m 560 2 R7 m
KwaZulu-Natal 15 7 R5 m Employee, senior
manager 5 2 R3 m 1 1 R45 k 11 5 R4 m
Limpopo 14 4 R2 mEmployee, SCM official, senior
manager1 1 R105 k 14 7 R2 m 2 2 R222 k
Mpumalanga 17 6 1 R3 m Employee 3 2 R67 k 4 2 R315 k
Northern Cape 29 4 R1 m
Councillor, employee, senior
manager5 1 R279 k 3 1 R1 m 6 2 R293 k
North West 28 9 1 R6 m Councillor, mayor, employee 3 2 R148 k 23 6 R6 m 2 1 R115 k
Western Cape 132 10 1 R37 m
Councillor, employee, SCM official, senior
manager
4 2 R1 m 43 4 R35 m 42 3 R35 m
Total 903 70 7 R93 m 19 10 R1 m 713 37 R67 m 592 9 R16 m 80 21 R45 m

22
Consolidated general report on the audit outcomes of local government | 2011-12
Although awards to close family members are not prohibited, the non-disclosure of such awards in the financial statements and the failure of officials or suppliers to declare their interest could indicate that the relationships are being concealed. The possibility of undue influence cannot be ignored and all instances should be investigated.
The preceding two tables show an upward trend in the number of auditees doing business with their own employees and councillors, their close family members and other officials employed by the state. Weak controls over the declaration and monitoring of interests in contracts encourage this inappropriate behaviour.
Uncompetitive or unfair procurement processes
The principles of supplying and receiving goods and services in a manner that is fair, equitable, transparent, competitive and cost-effective come from our Constitution. Legislation, most notably the MFMA and SCM Regulations, prescribes the processes and rules that auditees must follow to consistently and correctly apply the constitutional principles and to safeguard the process against abuse. The preferential procurement framework further gives effect to the constitutional principle of affording preference to the previously disadvantaged in the allocation of work by the public sector.
Our audits also focused on whether the procurement processes followed were fair and competitive in that they provided all suppliers equal opportunity to compete for public sector contracts and that the process did not favour some suppliers above others.
The prescribed processes must be followed to ensure that the selected supplier meets the requirements and has the capacity and ability to deliver the goods and services, and that those goods and services are procured at competitive and economical prices.
We tested the procurement processes of 5 525 contracts (with a value of R32,9 billion) and 16 192 quotations (with a value of R1,3 billion). We did not test all awards made by auditees, but only those selected based on risk and a statistical sampling method. The following figure presents the most common findings on non-compliance with SCM legislation that resulted in uncompetitive or unfair procurement processes per province, followed by a table that details the findings.

23
Consolidated general report on the audit outcomes of local government | 2011-12
Figure 20
most common findings on uncompetitive or unfair procurement processes per province
0 80 120 160 200 240
Number of auditees with findings
39
20
9
23
18
9
19
21
8
30
17
11
20
14
11
15
3
11
18
14
14
13
11
5
13
12
4
25
12
7
8
12
3
10
9
2
20
8
3
11
11
6
11
10
3
38
16
8
18
21
8
15
14
8
Eastern Cape
Free State
Gauteng
KwaZulu-Natal
Limpopo
Mpumalanga
Northern Cape
North West
Western Cape
Three written quotations
not invited*
Other Preference pointsystem not
applied
Procurement fromsuppliers without
SARS tax clearance
Competitive bidsnot invited –no deviation
approved
No declaration ofinterest submitted
by provider
*No deviation approved, or approved deviation not reasonable or justified
24
Consolidated general report on the audit outcomes of local government | 2011-12
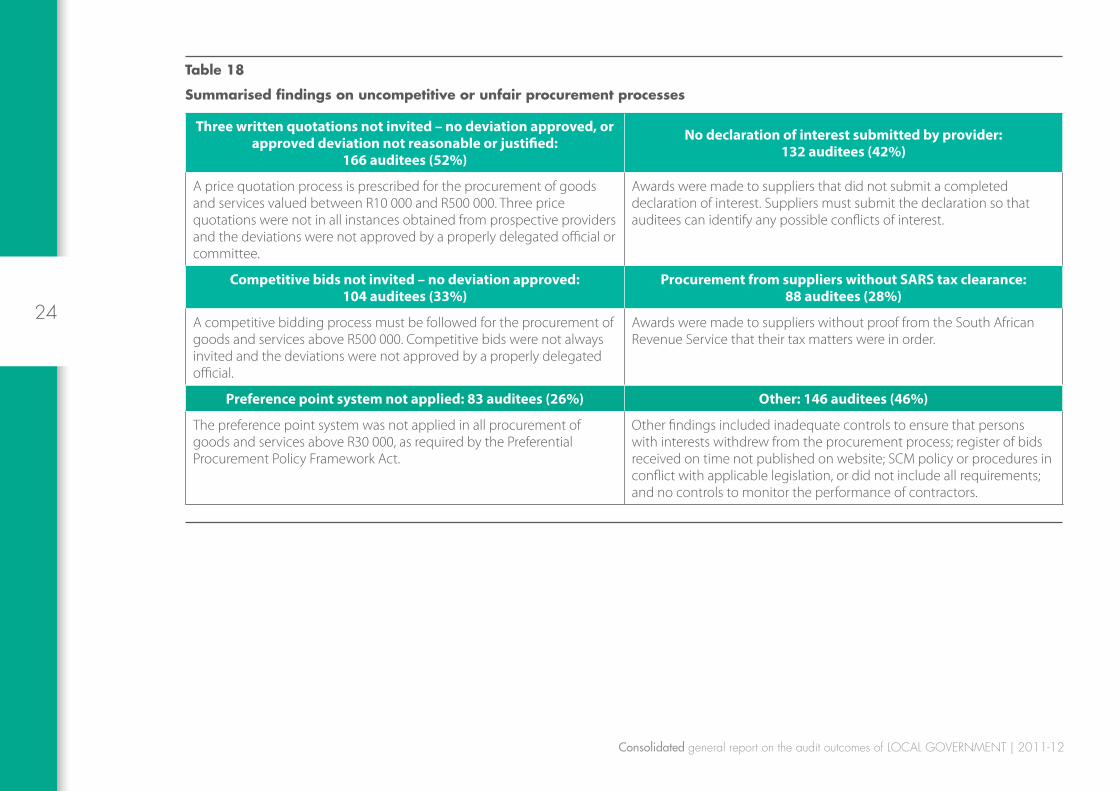
table 18
summarised findings on uncompetitive or unfair procurement processes
Three written quotations not invited – no deviation approved, or approved deviation not reasonable or justified:
166 auditees (52%)
No declaration of interest submitted by provider: 132 auditees (42%)
A price quotation process is prescribed for the procurement of goods and services valued between R10 000 and R500 000. Three price quotations were not in all instances obtained from prospective providers and the deviations were not approved by a properly delegated official or committee.
Awards were made to suppliers that did not submit a completed declaration of interest. Suppliers must submit the declaration so that auditees can identify any possible conflicts of interest.
Competitive bids not invited – no deviation approved: 104 auditees (33%)
Procurement from suppliers without SARS tax clearance: 88 auditees (28%)
A competitive bidding process must be followed for the procurement of goods and services above R500 000. Competitive bids were not always invited and the deviations were not approved by a properly delegated official.
Awards were made to suppliers without proof from the South African Revenue Service that their tax matters were in order.
Preference point system not applied: 83 auditees (26%) Other: 146 auditees (46%)
The preference point system was not applied in all procurement of goods and services above R30 000, as required by the Preferential Procurement Policy Framework Act.
Other findings included inadequate controls to ensure that persons with interests withdrew from the procurement process; register of bids received on time not published on website; SCM policy or procedures in conflict with applicable legislation, or did not include all requirements; and no controls to monitor the performance of contractors.

25
Consolidated general report on the audit outcomes of local government | 2011-12
Inadequate contract management
Shortcomings in the manner in which contracts are managed result in delays, wastage as well as fruitless and wasteful expenditure, which – in turn – have a direct impact on service delivery. Inadequate contract management remained at the same level (2011-12: 25% [2010-11: 20%]). The table below summarises the most common findings on inadequate contract management.
table 19
inadequate contract management
Key findings Auditees %
Performance of contractors not monitored on a monthly basis
45 14%
Inadequate contract performance measures and monitoring
34 11%
Contracts amended or extended without tabling the reasons in the council
23 7%
Contracts amended or extended without approval by a delegated official
19 6%
Goods and services received from, and payments made to, suppliers without a written, signed contract
10 3%
Other findings included payments in excess of the approved contract price (with further approved extensions); and total payments in quotations exceeding the original quoted amount
10 3%
Inadequate supply chain management controls
Internal control deficiencies in the SCM environment regressed (2011-12: 56% [2010-11: 43%]). The table below summarises the most common deficiencies in SCM controls.
table 20
inadequate internal controls
Key findings Auditees %
Poor record keeping, resulting in supporting documentation for award processes and contracts not being available
63 20%
Inadequate controls to ensure that interests were declared, resulting in the many findings on suppliers, employees and councillors not declaring their interests
57 18%
Risk assessments did not address SCM and, where they did, no action was taken to address the SCM risks identified
53 17%
No plans for addressing SCM findings, or adherence to the plans not monitored regularly
39 12%
Some officials who had to implement the SCM policy were not adequately trained to perform their duties
23 7%
Other findings included internal audit units not evaluating SCM controls, processes and compliance; no controls to monitor the performance of contractors; SCM officials not being aware of SCM policies or not understanding their roles and responsibilities; and SCM policies and procedures being in conflict with applicable legislation or not including all requirements
106 33%
26
Consolidated general report on the audit outcomes of local government | 2011-12
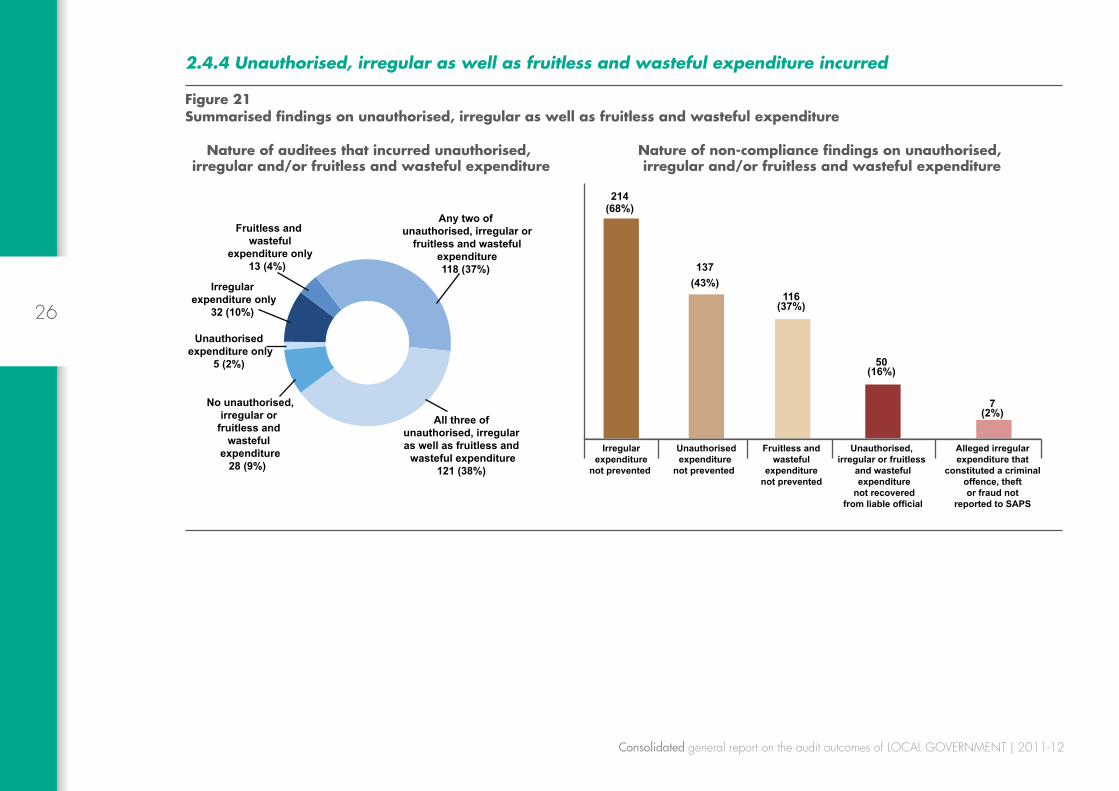
2.4.4 Unauthorised, irregular as well as fruitless and wasteful expenditure incurred
Figure 21summarised findings on unauthorised, irregular as well as fruitless and wasteful expenditure
Nature of auditees that incurred unauthorised, irregular and/or fruitless and wasteful expenditure
Nature of non-compliance findings on unauthorised, irregular and/or fruitless and wasteful expenditure
Unauthorised expenditure only
5 (2%)
Irregular expenditure only
32 (10%)
Fruitless and wasteful
expenditure only13 (4%)
Any two of unauthorised, irregular or
fruitless and wasteful expenditure118 (37%)
All three of unauthorised, irregular as well as fruitless and
wasteful expenditure121 (38%)
No unauthorised,irregular or
fruitless and wasteful
expenditure28 (9%)
214 (68%)
Irregularexpenditure
not prevented
137 (43%)
Unauthorisedexpenditure
not prevented
116 (37%)
Fruitless and wasteful
expenditure not prevented
50 (16%)
Unauthorised, irregular or fruitless
and wasteful expenditure
not recovered from liable official
7 (2%)
Alleged irregular expenditure that
constituted a criminal offence, theft or fraud not
reported to SAPS

27
Consolidated general report on the audit outcomes of local government | 2011-12
Figure 22
provincial analysis
eastern cape Free state gauteng KwaZulu-natal limpopo mpumalanga northern cape north west western cape
7%
93%
8%
92%
16%
84%
11%
100% 100%89%
11%
89%
11%
89%
11%
89%
Auditees with no unauthorised, irregular as well as fruitless and wasteful expenditure Auditees with unauthorised, irregular as well as fruitless and wasteful expenditure
The MFMA requires accounting officers and authorities to take effective and appropriate steps to ensure that unauthorised, irregular as well as fruitless and wasteful expenditure is prevented. Although it is expected that no such expenditure should be incurred, it is not always possible for an accounting officer to prevent it – even if all reasonable steps had been taken. In instances where it does occur, the MFMA makes it compulsory for auditees to disclose such expenditure in their annual financial statements. The MFMA further requires that all instances of unauthorised, irregular as well as fruitless and wasteful expenditure should be investigated. If the investigation determines that an official is liable for the expense, disciplinary steps should be taken and the expenditure should be recovered.
The extent of unauthorised, irregular as well as fruitless and wasteful expenditure and the pervasiveness of the related non-compliance with legislation applicable to such expenditure, as shown in figure 21, indicate a breakdown in auditees’ internal control environment. Table 21 summarises the key findings.

28
Consolidated general report on the audit outcomes of local government | 2011-12
table 21
Key findings on unauthorised, irregular as well as fruitless and wasteful expenditure
Key findings Good Concerning Poor
Overall increase in number of
auditees incurring unauthorised,
irregular as well as fruitless
and wasteful expenditure
•• In total, 289 auditees (91%) (2010-11: 265 [84%]) incurred one or more of these types of expenditure. All the auditees in Limpopo and the Northern Cape incurred one or more of these types of expenditure, while more than 80% of all auditees in the remaining provinces did so.
•• The eight metropolitan municipalities all incurred one or more of these types of expenditure.
Some auditees incurred no
unauthorised, irregular or fruitless
and wasteful expenditure
•• Across all provinces, 28 auditees did not incur unauthorised, irregular or fruitless and wasteful expenditure, namely four district municipalities, seven local municipalities and 17 municipal entities.
All provinces had increases in number
of auditees with unauthorised,
irregular as well as fruitless
and wasteful expenditure
•• The number of auditees that incurred unauthorised, irregular as well as fruitless and wasteful expenditure increased across all provinces, with the highest increases in Gauteng (23%), Limpopo (19%) and Mpumalanga (31%).
Key findings Good Concerning Poor
Non-compliance findings related
to unauthorised, irregular as
well as fruitless and wasteful expenditure
remained high
•• Overall, 230 auditees (73%) had non-compliance findings related to unauthorised, irregular as well as fruitless and wasteful expenditure, which is a further regression from the 218 (66%) in the previous year.
•• The most common findings remained auditees not preventing irregular expenditure (67%), unauthorised expenditure (43%), and fruitless and wasteful expenditure (37%).
High number of findings relating to
all types of auditees in all provinces not preventing unauthorised,
irregular as well as fruitless
and wasteful expenditure
•• All categories of auditees struggled to prevent unauthorised, irregular as well as fruitless and wasteful expenditure, with metropolitan municipalities (88%) having the most findings, followed by district municipalities (75%), local municipalities (73%) and municipal entities (41%).
•• These findings were common across all provinces, namely the Eastern Cape (91%), the Free State (85%), the North West (85%), Limpopo (81%), the Northern Cape (73%), Mpumalanga (58%), KwaZulu-Natal (54%), Gauteng (50%) and the Western Cape (36%).

29
Consolidated general report on the audit outcomes of local government | 2011-12
Section 3.3.1 provides further detail on the lack of consequences for transgressions, such as incurring unauthorised, irregular as well as fruitless and wasteful expenditure.
The remainder of this section analyses the nature, extent and overall trends relating to unauthorised, irregular as well as fruitless and wasteful expenditure incurred or identified in the financial year under review.
Nature of, and overall trends in, unauthorised expenditure
Unauthorised expenditure is expenditure that was not spent in accordance with the budget approved by the council or the conditions of a grant. Unauthorised expenditure invariably means that money was not used for its intended purpose, which makes it difficult to achieve the service delivery objectives set for the year.
The following figure reflects the three-year trend in unauthorised expenditure and the extent to which it was identified during the audit (and not by the auditees’ internal control systems).
Figure 23
three-year trend in unauthorised expenditure
Unauthorised expenditure: Amount
Unauthorised expenditure (UE):Number of municipalities [2011-12: 57% (2010-11: 46%)]
R4 717 million R2 628
million R2 995 million
million R5 071
R2 223 million
R3 010 million
2011-12 2010-11 2009-10
R9 788 million
R4 851 million R6 005 million
74 64 43
107 89
81
2011-12 2010-11 2009-10
181
153
124
Identified by municipalities Identified during audit All of UE identified by municipalities All or part of UE identified during audit
30
Consolidated general report on the audit outcomes of local government | 2011-12
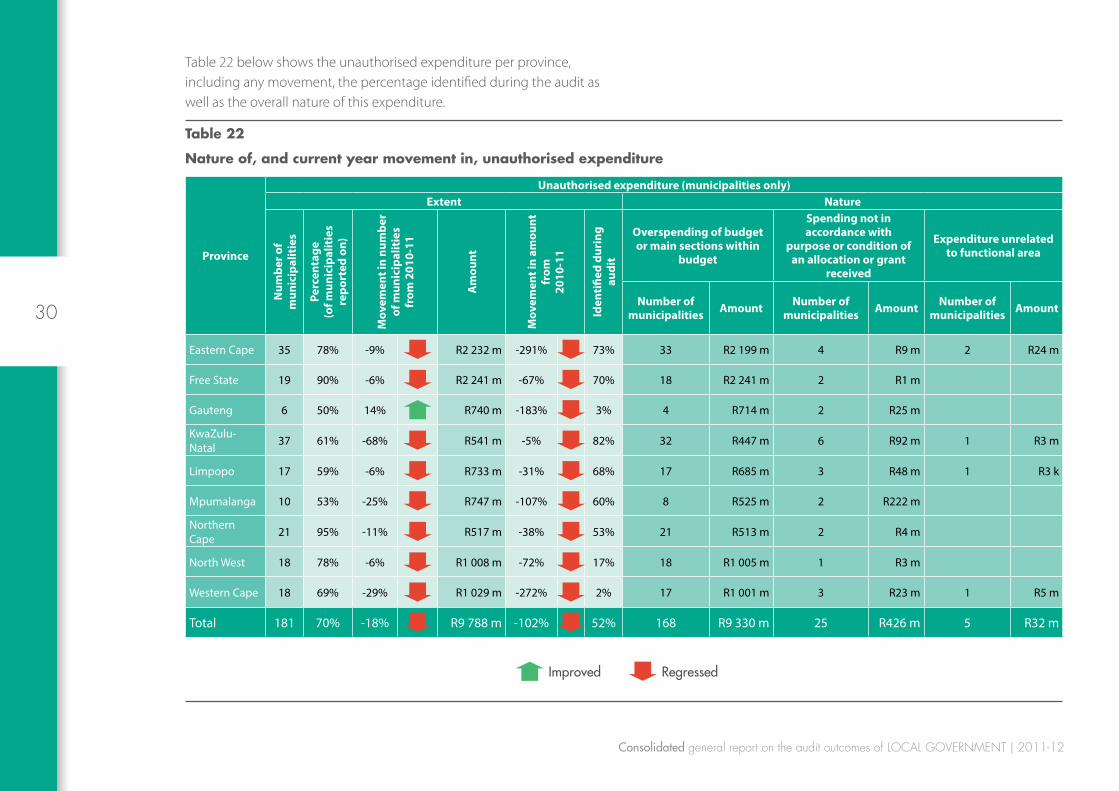
Table 22 below shows the unauthorised expenditure per province, including any movement, the percentage identified during the audit as well as the overall nature of this expenditure.
table 22
nature of, and current year movement in, unauthorised expenditure
Province
Unauthorised expenditure (municipalities only)Extent Nature
Num
ber o
f m
unic
ipal
itie
s
Perc
enta
ge
(of m
unic
ipal
itie
s re
port
ed o
n)
Mov
emen
t in
num
ber
of m
unic
ipal
itie
s
from
201
0-11
Am
ount
Mov
emen
t in
amou
nt
from
20
10-1
1
Iden
tifie
d du
ring
au
dit
Overspending of budget or main sections within
budget
Spending not in accordance with
purpose or condition of an allocation or grant
received
Expenditure unrelated to functional area
Number of municipalities Amount Number of
municipalities Amount Number of municipalities Amount
Eastern Cape 35 78% -9% R2 232 m -291% 73% 33 R2 199 m 4 R9 m 2 R24 m
Free State 19 90% -6% R2 241 m -67% 70% 18 R2 241 m 2 R1 m
Gauteng 6 50% 14% R740 m -183% 3% 4 R714 m 2 R25 m
KwaZulu-Natal 37 61% -68% R541 m -5% 82% 32 R447 m 6 R92 m 1 R3 m
Limpopo 17 59% -6% R733 m -31% 68% 17 R685 m 3 R48 m 1 R3 k
Mpumalanga 10 53% -25% R747 m -107% 60% 8 R525 m 2 R222 m
Northern Cape 21 95% -11% R517 m -38% 53% 21 R513 m 2 R4 m
North West 18 78% -6% R1 008 m -72% 17% 18 R1 005 m 1 R3 m
Western Cape 18 69% -29% R1 029 m -272% 2% 17 R1 001 m 3 R23 m 1 R5 m
Total 181 70% -18% R9 788 m -102% 52% 168 R9 330 m 25 R426 m 5 R32 m
Improved Regressed
31
Consolidated general report on the audit outcomes of local government | 2011-12
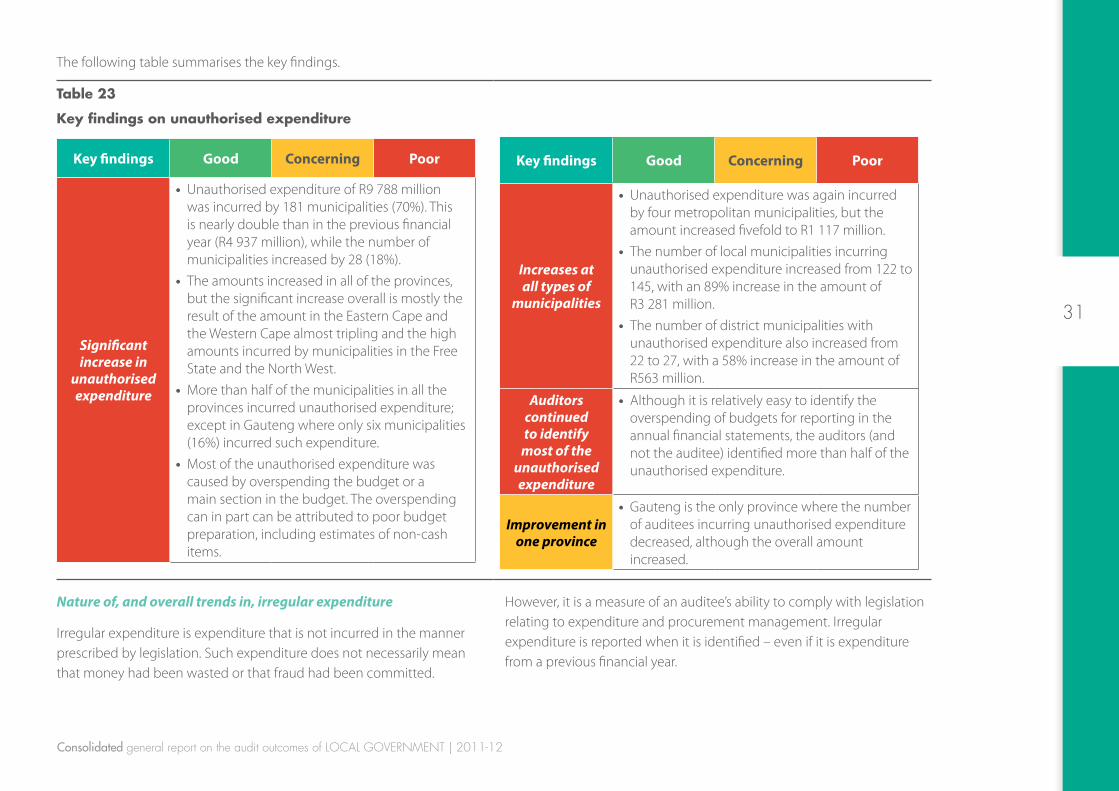
The following table summarises the key findings.
table 23
Key findings on unauthorised expenditure
Key findings Good Concerning Poor
Significant increase in
unauthorised expenditure
•• Unauthorised expenditure of R9 788 million was incurred by 181 municipalities (70%). This is nearly double than in the previous financial year (R4 937 million), while the number of municipalities increased by 28 (18%).
•• The amounts increased in all of the provinces, but the significant increase overall is mostly the result of the amount in the Eastern Cape and the Western Cape almost tripling and the high amounts incurred by municipalities in the Free State and the North West.
•• More than half of the municipalities in all the provinces incurred unauthorised expenditure; except in Gauteng where only six municipalities (16%) incurred such expenditure.
•• Most of the unauthorised expenditure was caused by overspending the budget or a main section in the budget. The overspending can in part can be attributed to poor budget preparation, including estimates of non-cash items.
Key findings Good Concerning Poor
Increases at all types of
municipalities
•• Unauthorised expenditure was again incurred by four metropolitan municipalities, but the amount increased fivefold to R1 117 million.
•• The number of local municipalities incurring unauthorised expenditure increased from 122 to 145, with an 89% increase in the amount of R3 281 million.
•• The number of district municipalities with unauthorised expenditure also increased from 22 to 27, with a 58% increase in the amount of R563 million.
Auditors continued to identify
most of the unauthorised expenditure
•• Although it is relatively easy to identify the overspending of budgets for reporting in the annual financial statements, the auditors (and not the auditee) identified more than half of the unauthorised expenditure.
Improvement in one province
•• Gauteng is the only province where the number of auditees incurring unauthorised expenditure decreased, although the overall amount increased.
Nature of, and overall trends in, irregular expenditure
Irregular expenditure is expenditure that is not incurred in the manner prescribed by legislation. Such expenditure does not necessarily mean that money had been wasted or that fraud had been committed.
However, it is a measure of an auditee’s ability to comply with legislation relating to expenditure and procurement management. Irregular expenditure is reported when it is identified – even if it is expenditure from a previous financial year.
32
Consolidated general report on the audit outcomes of local government | 2011-12
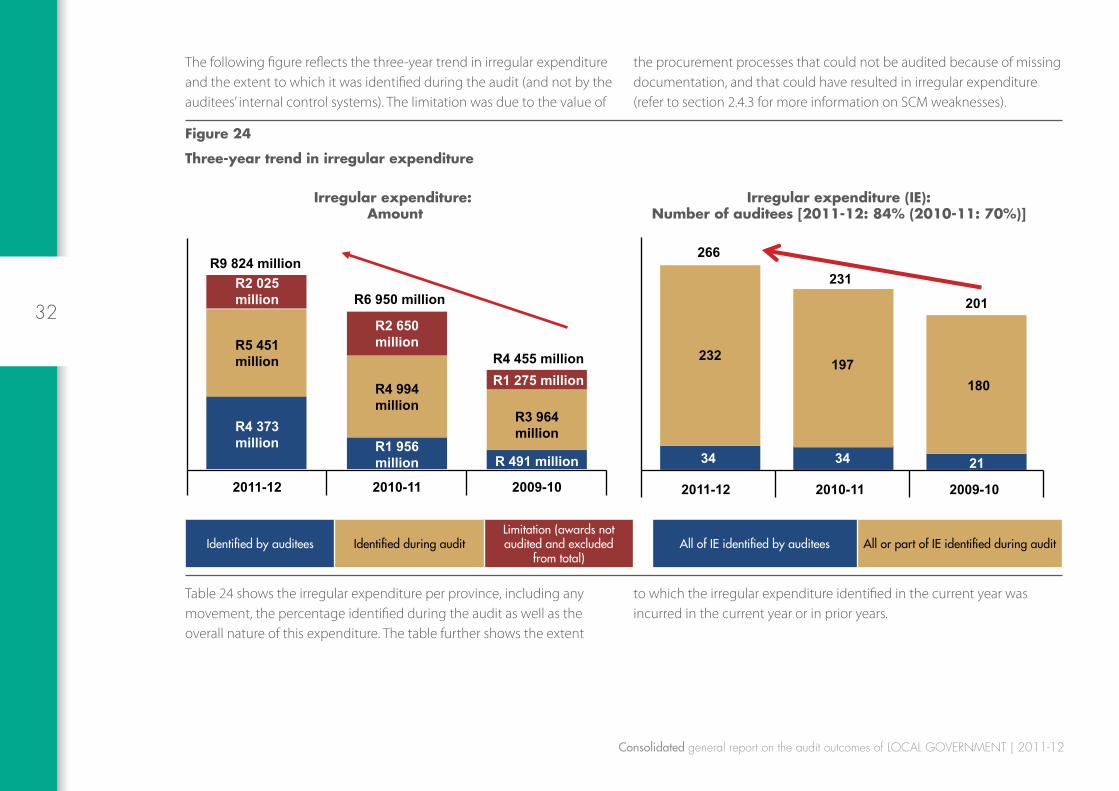
The following figure reflects the three-year trend in irregular expenditure and the extent to which it was identified during the audit (and not by the auditees’ internal control systems). The limitation was due to the value of
the procurement processes that could not be audited because of missing documentation, and that could have resulted in irregular expenditure (refer to section 2.4.3 for more information on SCM weaknesses).
Figure 24
three-year trend in irregular expenditure
Irregular expenditure: Amount
Irregular expenditure (IE):Number of auditees [2011-12: 84% (2010-11: 70%)]
R4 373 million R1 956
million R 491 million
R5 451 million
R4 994 million
R3 964 million
R2 025 million
R2 650 million
R1 275 million
2011-12 2010-11 2009-10
R9 824 million
R6 950 million
R4 455 million
34 34 21
232 197 180
2011-12 2010-11 2009-10
231
266
201
Identified by auditees Identified during auditLimitation (awards not audited and excluded
from total)All of IE identified by auditees All or part of IE identified during audit
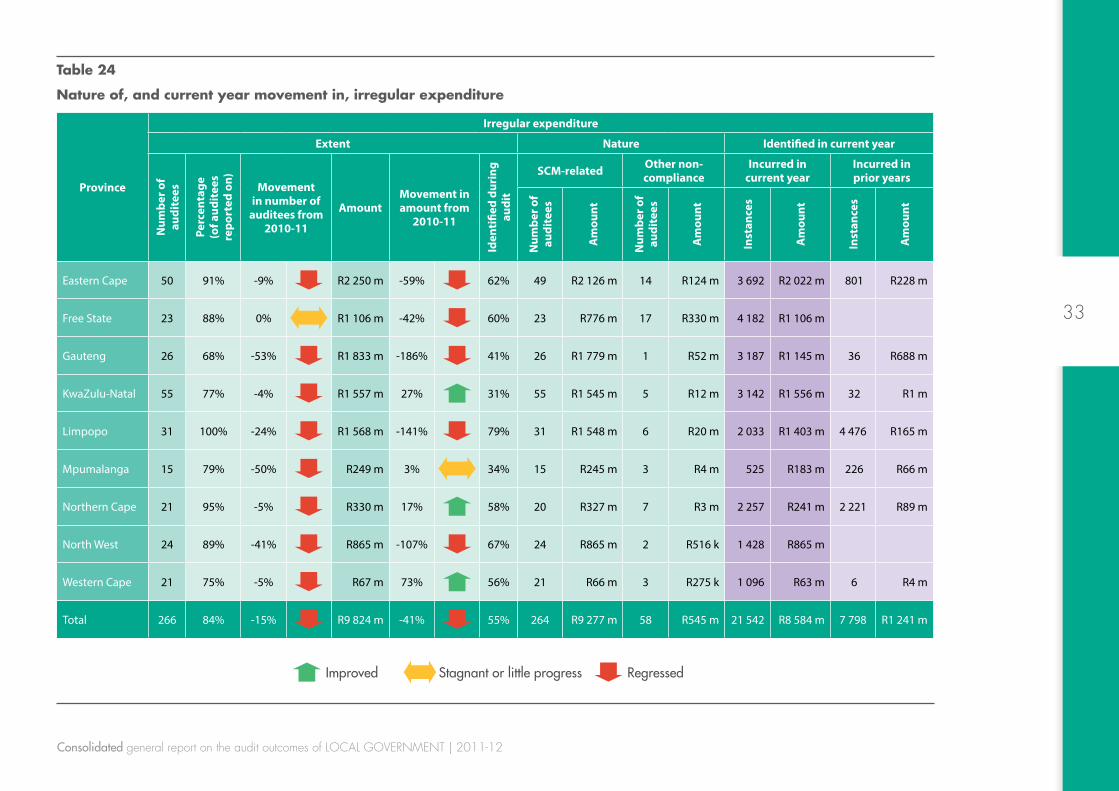
Table 24 shows the irregular expenditure per province, including any movement, the percentage identified during the audit as well as the overall nature of this expenditure. The table further shows the extent
to which the irregular expenditure identified in the current year was incurred in the current year or in prior years.
33
Consolidated general report on the audit outcomes of local government | 2011-12
table 24
nature of, and current year movement in, irregular expenditure
Province
Irregular expenditure
Extent Nature Identified in current yearN
umbe
r of
audi
tees
Perc
enta
ge
(of a
udit
ees
repo
rted
on) Movement
in number of auditees from
2010-11
AmountMovement in amount from
2010-11
Iden
tifie
d du
ring
au
dit
SCM-related Other non-compliance
Incurred in current year
Incurred in prior years
Num
ber o
f au
dite
es
Am
ount
Num
ber o
f au
dite
es
Am
ount
Inst
ance
s
Am
ount
Inst
ance
s
Am
ount
Eastern Cape 50 91% -9% R2 250 m -59% 62% 49 R2 126 m 14 R124 m 3 692 R2 022 m 801 R228 m
Free State 23 88% 0% R1 106 m -42% 60% 23 R776 m 17 R330 m 4 182 R1 106 m
Gauteng 26 68% -53% R1 833 m -186% 41% 26 R1 779 m 1 R52 m 3 187 R1 145 m 36 R688 m
KwaZulu-Natal 55 77% -4% R1 557 m 27% 31% 55 R1 545 m 5 R12 m 3 142 R1 556 m 32 R1 m
Limpopo 31 100% -24% R1 568 m -141% 79% 31 R1 548 m 6 R20 m 2 033 R1 403 m 4 476 R165 m
Mpumalanga 15 79% -50% R249 m 3% 34% 15 R245 m 3 R4 m 525 R183 m 226 R66 m
Northern Cape 21 95% -5% R330 m 17% 58% 20 R327 m 7 R3 m 2 257 R241 m 2 221 R89 m
North West 24 89% -41% R865 m -107% 67% 24 R865 m 2 R516 k 1 428 R865 m
Western Cape 21 75% -5% R67 m 73% 56% 21 R66 m 3 R275 k 1 096 R63 m 6 R4 m
Total 266 84% -15% R9 824 m -41% 55% 264 R9 277 m 58 R545 m 21 542 R8 584 m 7 798 R1 241 m
Improved Stagnant or little progress Regressed

34
Consolidated general report on the audit outcomes of local government | 2011-12
Table 25 summarises the key findings.
table 25
Key findings on irregular expenditure
Key findings Good Concerning Poor
Significant increase in
irregular expenditure
•• Irregular expenditure of R9 824 million was incurred by 266 auditees (84%). This amount increased by R2 874 million (41%) from the previous year, while the number of auditees increased by 34 (15%).
•• The high increases in the amounts in the Eastern Cape, the Free State, Gauteng, Limpopo and the North West exceeded the decreases in the other provinces.
•• Gauteng is the only province where less than three-quarters of the auditees incurred irregular expenditure.
•• Most of the irregular expenditure was incurred as a result of non-compliance with SCM legislation.
Key findings Good Concerning Poor
Increases at all types of
auditees
•• The highest increase in irregular expenditure of R1 342 million (48%) was incurred by local municipalities, with the number of auditees increasing from 177 to 187.
•• Municipal entities incurred irregular expenditure of R1 202 million, which was five times more than the R224 million in the previous year.
•• District municipalities incurred R402 million (29%) more than in the previous year, while metropolitan municipalities incurred R152 million (6%) more.
Auditors continued to identify significant portion of irregular
expenditure
•• The auditors (and not the auditee) identified more than half (55%) of the irregular expenditure. Of the 266 auditees that had incurred irregular expenditure, only 13% were able to identify all their irregular expenditure without the audit process.
Improvement in two provinces
•• Auditees in KwaZulu-Natal incurred R590 million less irregular expenditure, while those in the Western Cape reduced their irregular expenditure by R176 million.
Nature of, and overall trends in, fruitless and wasteful expenditure
Fruitless and wasteful expenditure is expenditure that was made in vain and that would have been avoided had reasonable care been taken. Such expenditure is also sometimes incurred to prevent further wastage or even irregular expenditure; for example, when contracts of non-performing suppliers are cancelled. Fruitless and wasteful expenditure
is reported when it is identified – even if it was incurred in a previous financial year.
The following figure reflects the three-year trend in fruitless and wasteful expenditure and the extent to which it was identified during the audit (and not by the auditees’ internal control systems).

35
Consolidated general report on the audit outcomes of local government | 2011-12
Figure 25
three-year trend in fruitless and wasteful expenditure
Fruitless and wasteful expenditure: Amount
Fruitless and wasteful expenditure (FWE):Number of auditees [2011-12: 64% (2010-11: 46%)]
R316 million
R155 million
R126 million
R252 million
R93 million R83 million
2011-12 2010-11 2009-10
R568 million
R248 million R209 million
108 62 53
94
91 80
2011-12 2010-11 2009-10
202
153 133
Identified by auditees Identified during audit All of FWE identified by auditees All or part of FWE identified during audit
Table 26 shows the fruitless and wasteful expenditure per province, including any movement, the percentage identified during the audit as well as the overall nature of this expenditure.
The table further shows the extent to which the fruitless and wasteful expenditure identified in the current year was incurred in the current year or in prior years.

36
Consolidated general report on the audit outcomes of local government | 2011-12
table 26
nature of, and current year movement in, fruitless and wasteful expenditure
Province
Fruitless and wasteful expenditure
Extent Nature Identified in current year
Num
ber o
f aud
itee
s
Perc
enta
ge
(of a
udit
ees
repo
rted
on)
Movement in number of
auditees from 2010-11 A
mou
nt Movement in amount
from 2010-11
Iden
tifie
d du
ring
aud
it
Incurred to prevent irregular
expenditure, losses or further
fruitless and wasteful
expenditure
Actual fruitless and wasteful expenditure
Incurred in
current year
Incurred in
prior years
Num
ber o
f au
dite
es
Am
ount
Num
ber o
f au
dite
es
Am
ount
Inst
ance
s
Am
ount
Inst
ance
s
Am
ount
Eastern Cape 39 71% 0% R130 m -251% 76% 22 R26 m 20 R104 m 418 R34 m 181 R96 m
Free State 24 92% -14% R151 m -37% 18% 4 R24 m 24 R127 m 524 R151 m 1 R14 k
Gauteng 19 50% -19% R142 m -2 763% 49% 1 R113 m 18 R29 m 143 R91 m 10 R51 m
KwaZulu-Natal 41 58% -52% R17 m -40% 48% 19 R6 m 23 R11 m 331 R14 m 17 R3 m
Limpopo 26 84% -63% R33 m 18% 10% 8 R2 m 19 R31 m 197 R23 m 36 R10 m
Mpumalanga 11 58% -1 000% R27 m -626% 48% 3 R8 m 8 R19 m 54 R27 m
Northern Cape 14 64% -40% R4 m -117% 38% 9 R2 m 6 R2 m 224 R4 m 29 R1 m
North West 19 70% -19% R56 m -77% 47% 1 R86 k 18 R56 m 136 R56 m
Western Cape 9 32% -29% R8 m -24% 32% 1 R341 k 8 R7 m 40 R8 m
Total 202 64% -32% R568 m -129% 44% 68 R181 m 144 R386 m 2 067 R408 m 274 R160 m
Improved Stagnant or little progress Regressed

37
Consolidated general report on the audit outcomes of local government | 2011-12
Table 27 summarises the key findings.
table 27
Key findings on fruitless and wasteful expenditure
Key findings Good Concerning Poor
Significant increase in
fruitless and wasteful
expenditure
•• Fruitless and wasteful expenditure of R568 million was incurred by 202 auditees (64%). This expenditure more than doubled (R320 million) from the previous year, while the number of auditees increased by 49 (32%).
•• The amounts increased in most provinces, with significant increases in the Eastern Cape (R93 million), Gauteng (R137 million) and the Free State (R41 million).
•• Some fruitless and wasteful expenditure (32%) was incurred to prevent losses, irregularities or further wastage.
Increases at all types of
auditees
•• Fruitless and wasteful expenditure increased at all types of auditees. The highest increase of R199 million was incurred at metropolitan municipalities.
•• The number of local municipalities incurring fruitless and wasteful expenditure increased from 105 to 146.
Auditors continued to identify significant portion of
fruitless and wasteful
expenditure
•• The portion of fruitless and wasteful expenditure identified by the auditors more than doubled from R93 million in the previous year to R252 million in the current year.
Annexure 1 lists all auditees and the unauthorised, irregular as well as fruitless and wasteful expenditure incurred by them. The provincial general reports provide more detail on the nature of the expenditure and trends in each province.

38
Consolidated general report on the audit outcomes of local government | 2011-12

overvIew of fUll rePort

page 9Material non-compliance with legislation by 94% of auditees
Section 2.4Page 56
Regression in audit outcomes overall and in most provinces
Section 2.1
Page 24
Uncompetitive and unfair procurement processes, inadequate contract management
and missing tender documentationSection 2.4.3
Page 62
Annual performance reports not useful and/or reliable
Section 2.3Page 51
25% of auditees received disclaimed or adverse opinions and 21% qualified opinions
Section 2.1.1Page 24
message from the auditor-general
Qualified opinions avoided by correcting material misstatements identified
during audit process Section 2.2Page 46
Contracts to the value of at least R118 million
awarded to municipal officials and
councillorsSection 2.4.3
Page 62

Increase in already high levels of unauthorised, irregular as well
as fruitless and wasteful expenditureSection 2.4.4
Page 74
confidentiality, integrity and availability of information at risk
section 3.4page 119
Key role players did not provide assurance to improve controls and address risk areas and root causes
section 4.1page 138
Implementation and impact of commitments and initiatives of role players
Section 4.4Page 151
Root causes of the poor audit outcomes
Sections 3.1 – 3.3Page 88
Financial statement analyses show significant risks that
affect financial health of local governmentSection 5Page 170
continued reliance on consultants and ineffective management
of this resourcesection 3.3.5
page 114

rp198/2013 isBn: 978-0-621-42002-9
visit our website
www.agsa.co.za
to view the complete
consolidated general report on the 2011-12 local goVernment audit outcomes
Related Documents